

Page 1
Protected Terminals | 181
Aprisa XE User Manual
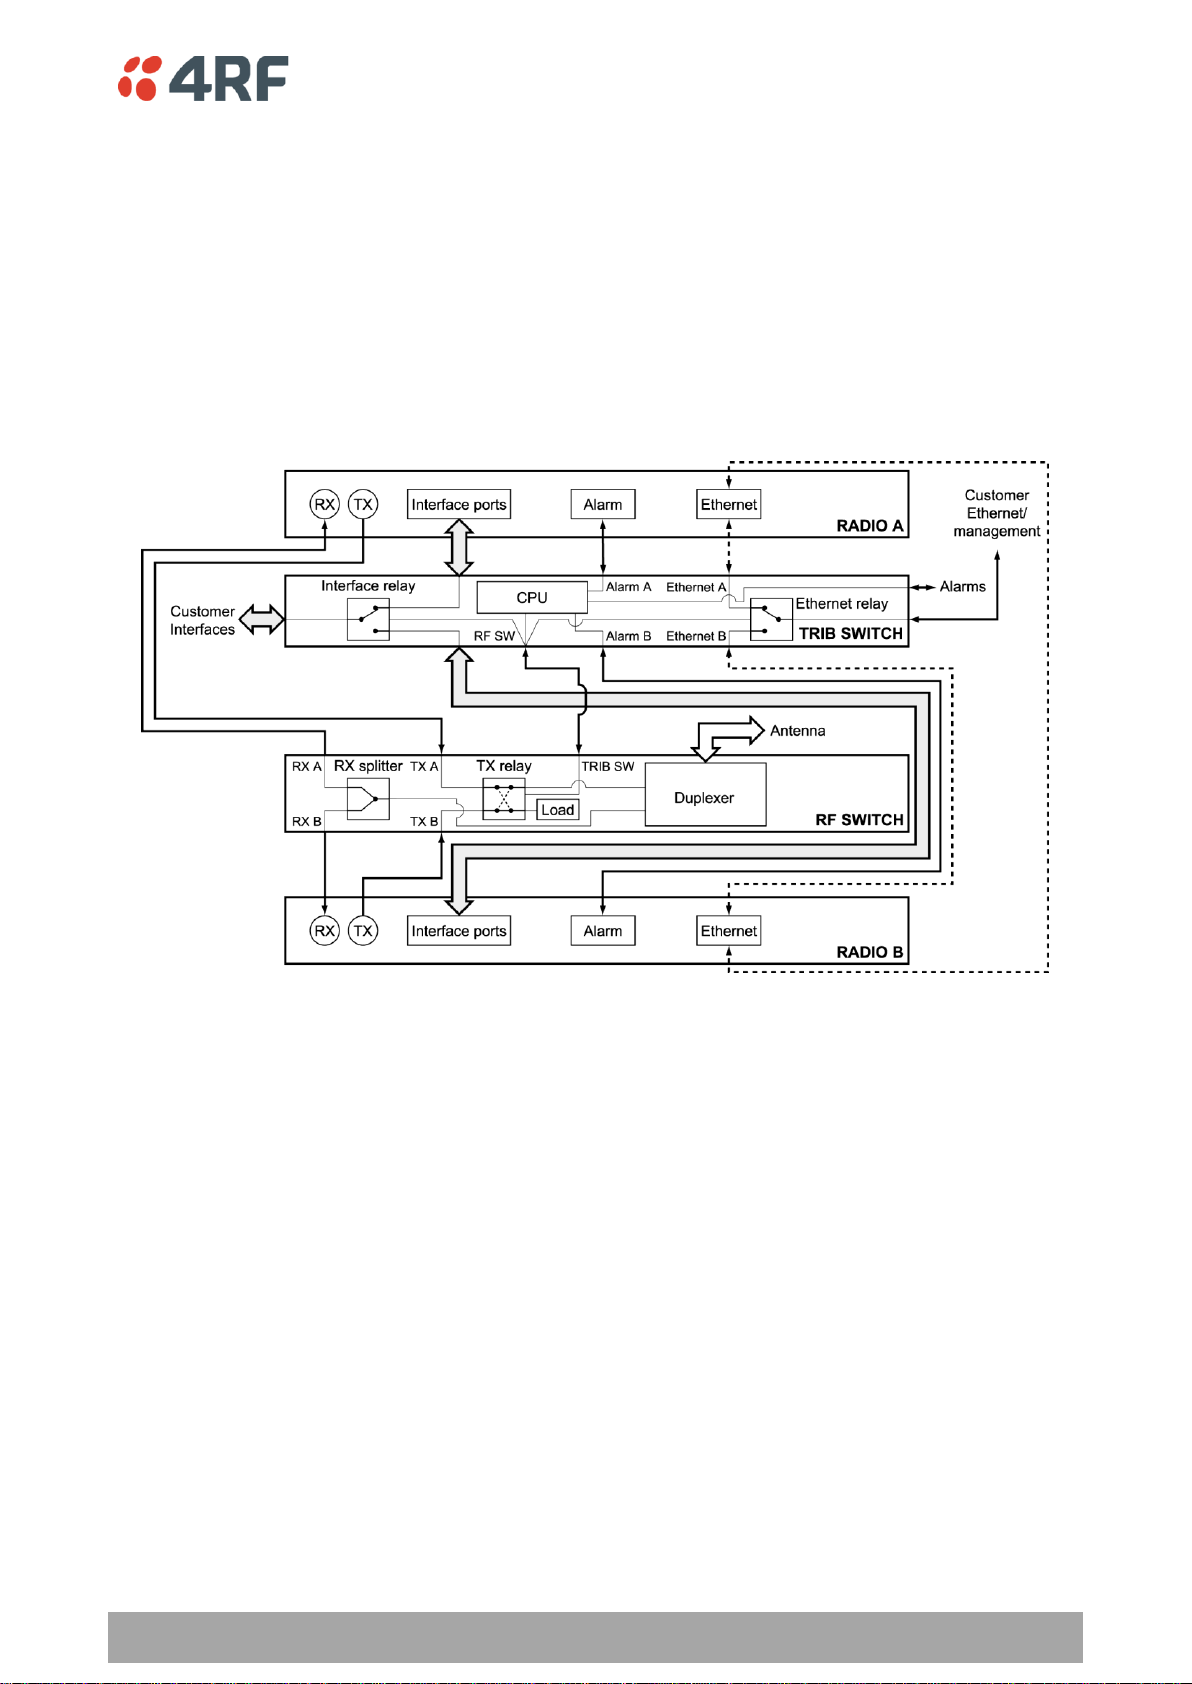
11. Protected Terminals
Monitored Hot Stand By (MHSB)
This section describes configuring the protected terminal in MHSB mode.
A protected terminal in MHSB mode comprises two radios interconnected using a MHSB switch. This MHSB
switch comprises one RF switch and up to four tributary switches depending on the number of tributaries
requiring switching:
The MHSB switch protect terminals against any single failure in one radio. It also monitors the alarm
output of each radio and switches between radios if major radio link alarms occur. The MHSB switch will
not allow a switch to a faulty radio.
The MHSB switch uses a CPU to monitor the alarm status received from both the connected radios' alarm
ports. When a relevant major radio link alarm is detected on the active radio (that is, transmitter,
receiver, power supply or modem), the CPU switches a bank of relays that switches all the interfaces and
the transmit port from the main radio to a functioning stand-by radio. The stand-by radio now becomes
the active radio.
The MHSB switch has a hysteresis of 30 seconds to prevent switching on short alarm transients.
The tributary switch and the RF switch are both a 19-inch rack-mount 1U high chassis. The MHSB switch
option is available for all Aprisa XE frequency bands.
Page 2

182 | Protected Terminals
Aprisa XE User Manual
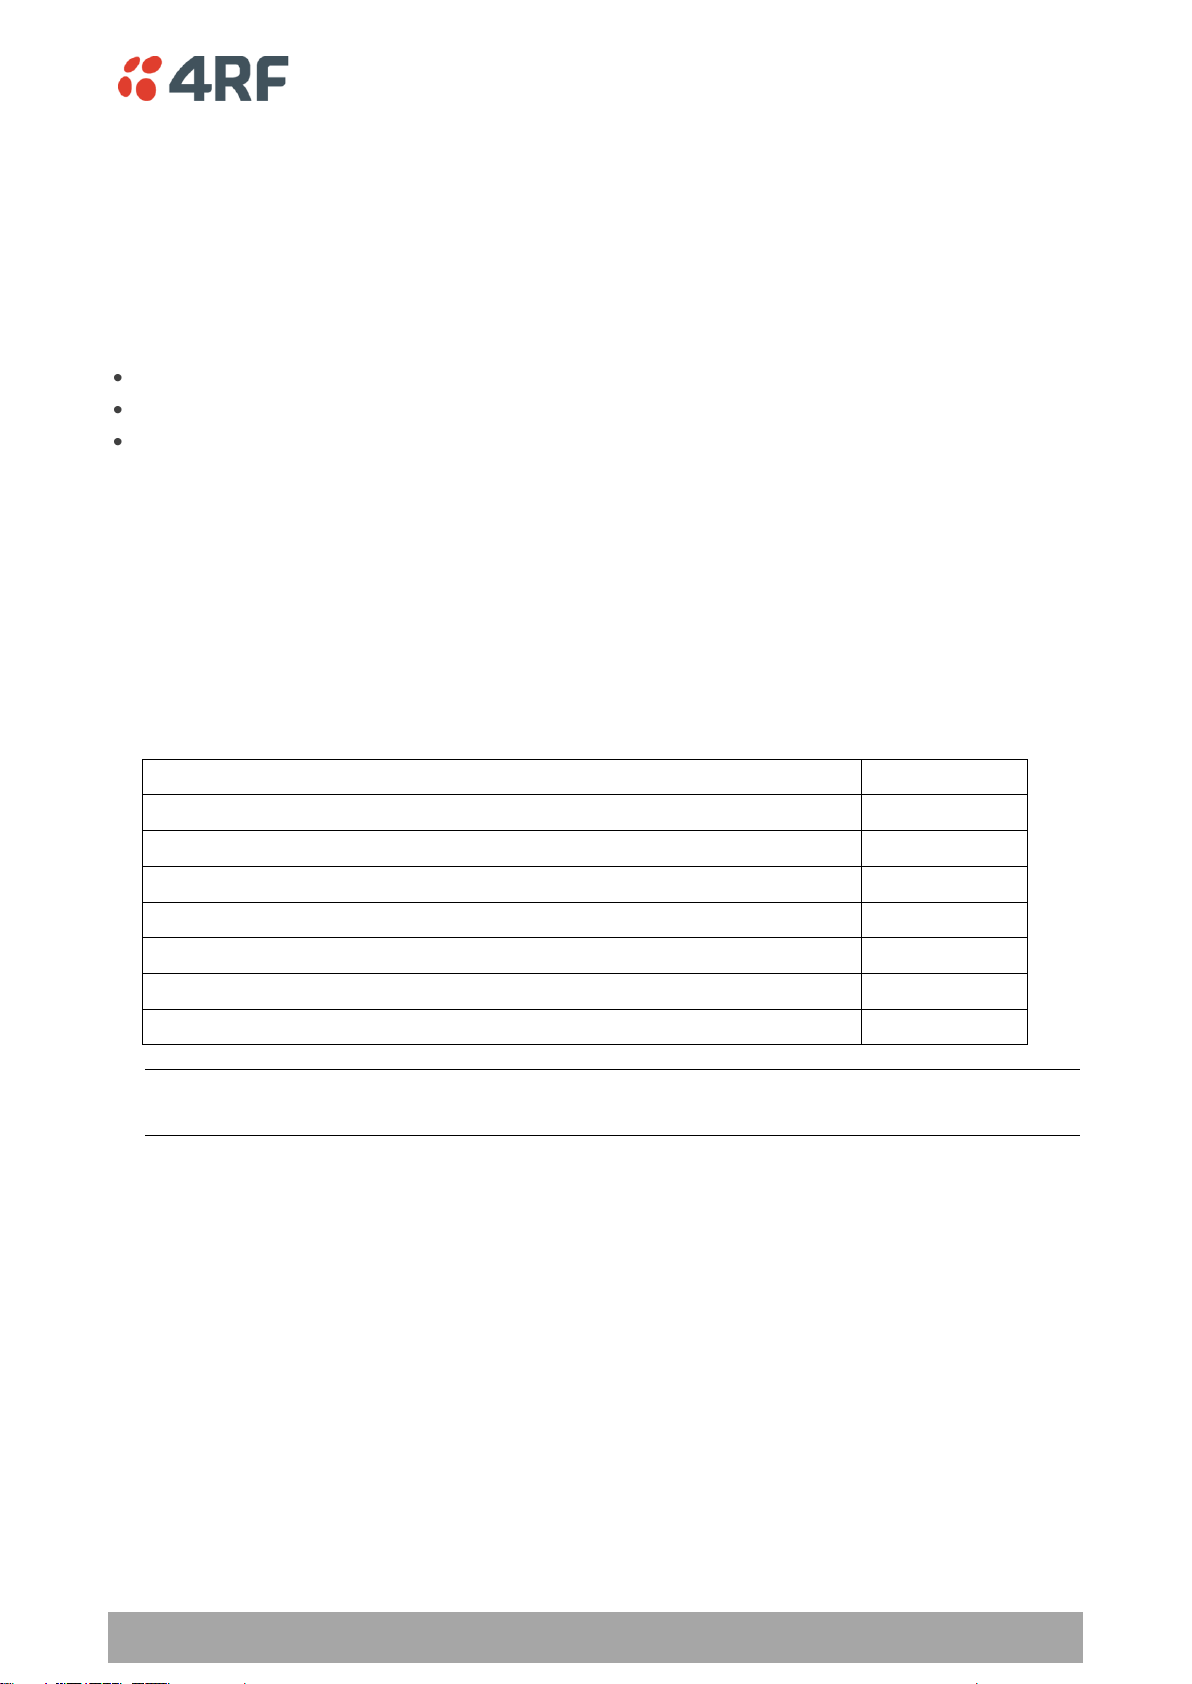
No.
Description
Explanation
1
Power supply input
Input for DC power or AC power
2
Protective earth
M5 terminal intended for connection to an external protective
conductor for protection against electric shock in case of a fault
3
Interface ports
Port for connecting to customer interface equipment
4
Radio A interfaces
These connect to the interface ports on radio A
5
Radio B interfaces
These connect to the interface ports on radio B
6
Console
For factory use only
7
Ethernet
Port for connecting to customer Ethernet network. This port is
also used to set up and manage the radios remotely over an IP
network
8
Radio A Ethernet
Connects to an Ethernet port on radio A
9
Radio B Ethernet
Connects to an Ethernet port on radio B
10
Alarms
Alarm input/output connections for customer equipment
11
Radio A alarms
Connects to the alarm port on radio A
12
Radio B alarms
Connects to the alarm port on radio B
13
RF SW
Provides power and signalling to the RF switch
14
Mode switch
Three-position locking toggle switch to set the MHSB switch into
automatic mode or radio A / radio B test mode
15
LEDs
Mode and status LEDs
Tributary Switch Front Panel
Page 3

Protected Terminals | 183
Aprisa XE User Manual
LED
Colour
Appearance
Explanation
A
Green
Solid
The radio is active and is OK
Green
Flashing
The radio is in standby mode and is OK
Red
Solid
The radio is active and there is a fault
No colour (off)
-
The tributary switch is in 'slave' mode and the
switching is controlled by the master tributary
switch
Red
Flashing
The radio is in standby mode, and there is a fault
B
Green
Solid
The radio is active and is OK
Green
Flashing
The radio is in standby mode and is OK
Red
Solid
The radio is active and there is a fault
No colour (off)
-
The tributary switch is in 'slave' mode and the
switching is controlled by the master tributary
switch
Red
Flashing
The radio is in standby mode, and there is a fault
~
Green
Solid
The tributary protection switch is in 'auto' mode
Green
Flashing
The tributary protection switch is in 'slave' mode
Red
Solid
The tributary protection switch is in 'manual'
mode (A or B)
On
Blue
Solid
Indicates that there is power to the tributary
protection switch
No.
Description
Explanation
1
Radio QMA
QMA connectors for connecting the protected radios
2
Protective earth
M5 terminal intended for connection to an external protective
conductor for protection against electric shock in case of a fault
3
Antenna port
N-type female connector for connection to the antenna feeder
cable. This view shows an internally mounted duplexer. If an
external duplexer is fitted, the antenna port will be on the
external duplexer
4
Slave tributary
switch outputs
Connects to secondary tributary switch for control of additional
interfaces
5
Tributary switch
Connects the RF switch to the tributary switch (the master if
more than one tributary switch is required)
6
LEDs
Status LEDs
Tributary Protection Switch LEDs
RF Switch Front Panel
Page 4

184 | Protected Terminals
Aprisa XE User Manual
LED
Colour
Appearance
Explanation
Tx A
Green
Solid
RF is being received from radio A
Tx B
Green
Solid
RF is being received from radio B
On
Blue
Solid
Indicates that there is power to the RF protection switch
RF Protection Switch LEDs
Slave Tributary Switches
Each tributary switch protects up to eight ports. Up to three slave tributary switches may be added to a
MHSB terminal to protect up to 32 ports. Each slave tributary switch is interconnected by means of the
slave tributary switch ports on the RF switch, as shown below.
Note: A tributary switch that is operating as a slave (rather than a master) has a RJ-45 V.24 loopback
connector plugged into the console port. If the connector is missing, contact Customer Support.
Alternatively, you can make this connector. Follow the standard pinouts for a V.24 RJ-45 connection (see
‘QV24 Interface connections’ on page 273).
Page 5

Protected Terminals | 185
Aprisa XE User Manual
MHSB Cabling
The two radios are interconnected as follows:
CAUTION: Do not connect Transmit to Receive or Receive to Transmit as this may damage the radio or the
MHSB switch.
Cables supplied with MHSB
The following cables are supplied with a MHSB terminal:
Ethernet interface: RJ-45 ports standard TIA-568A patch cables .
Alarm interface: RJ-45 ports standard TIA-568A patch cables.
RF ports: two QMA male patch cables are supplied.
MHSB Power Supply
See ‘DC Power Supply’ on page 37 and ‘AC Power Supply’ on page 40.
Page 6

186 | Protected Terminals
Aprisa XE User Manual
Configuring the Radios for Protected Mode
The MHSB switch does not require any special software. However, the radios connected to the MHSB
switch must be configured to work with the MHSB switch. This sets the alarm outputs and inputs to
function in MHSB mode.
You must configure the interfaces of both radios connected to the MHSB switch identically. To perform
this, you can either connect directly to the radio or use the test mode of the MHSB switch.
MHSB Terminal IP Addresses
Before configuring the link, you must ensure that the two independent links have correctly configured IP
address details.
All four radios in the protected link must be on the same subnet.
Example of MHSB IP addressing
Page 7

Protected Terminals | 187
Aprisa XE User Manual
Mounting the MHSB Radios and Switches
Once the IP addresses are correctly configured, it is important to connect the A and B radios' Ethernet and
Alarm ports correctly. In general, mount radio A above the MHSB switch and radio B below the MHSB
switch:
There is an Ethernet connection between any of the four Ethernet ports on each radio and the Ethernet
port on the Tributary switch. There is also a connection between radio A and radio B, which ensures
Ethernet traffic is maintained if a radio loses power.
The Ethernet port on the protection switch can be connected to an Ethernet hub or switch to allow
multiple connections.
Important: The management Ethernet capacity on each of the four radios in the protected terminal must
be identical for remote communications to work and there should only be one IP connection to the
management network (via the tributary switch Ethernet port).
Page 8
188 | Protected Terminals
Aprisa XE User Manual
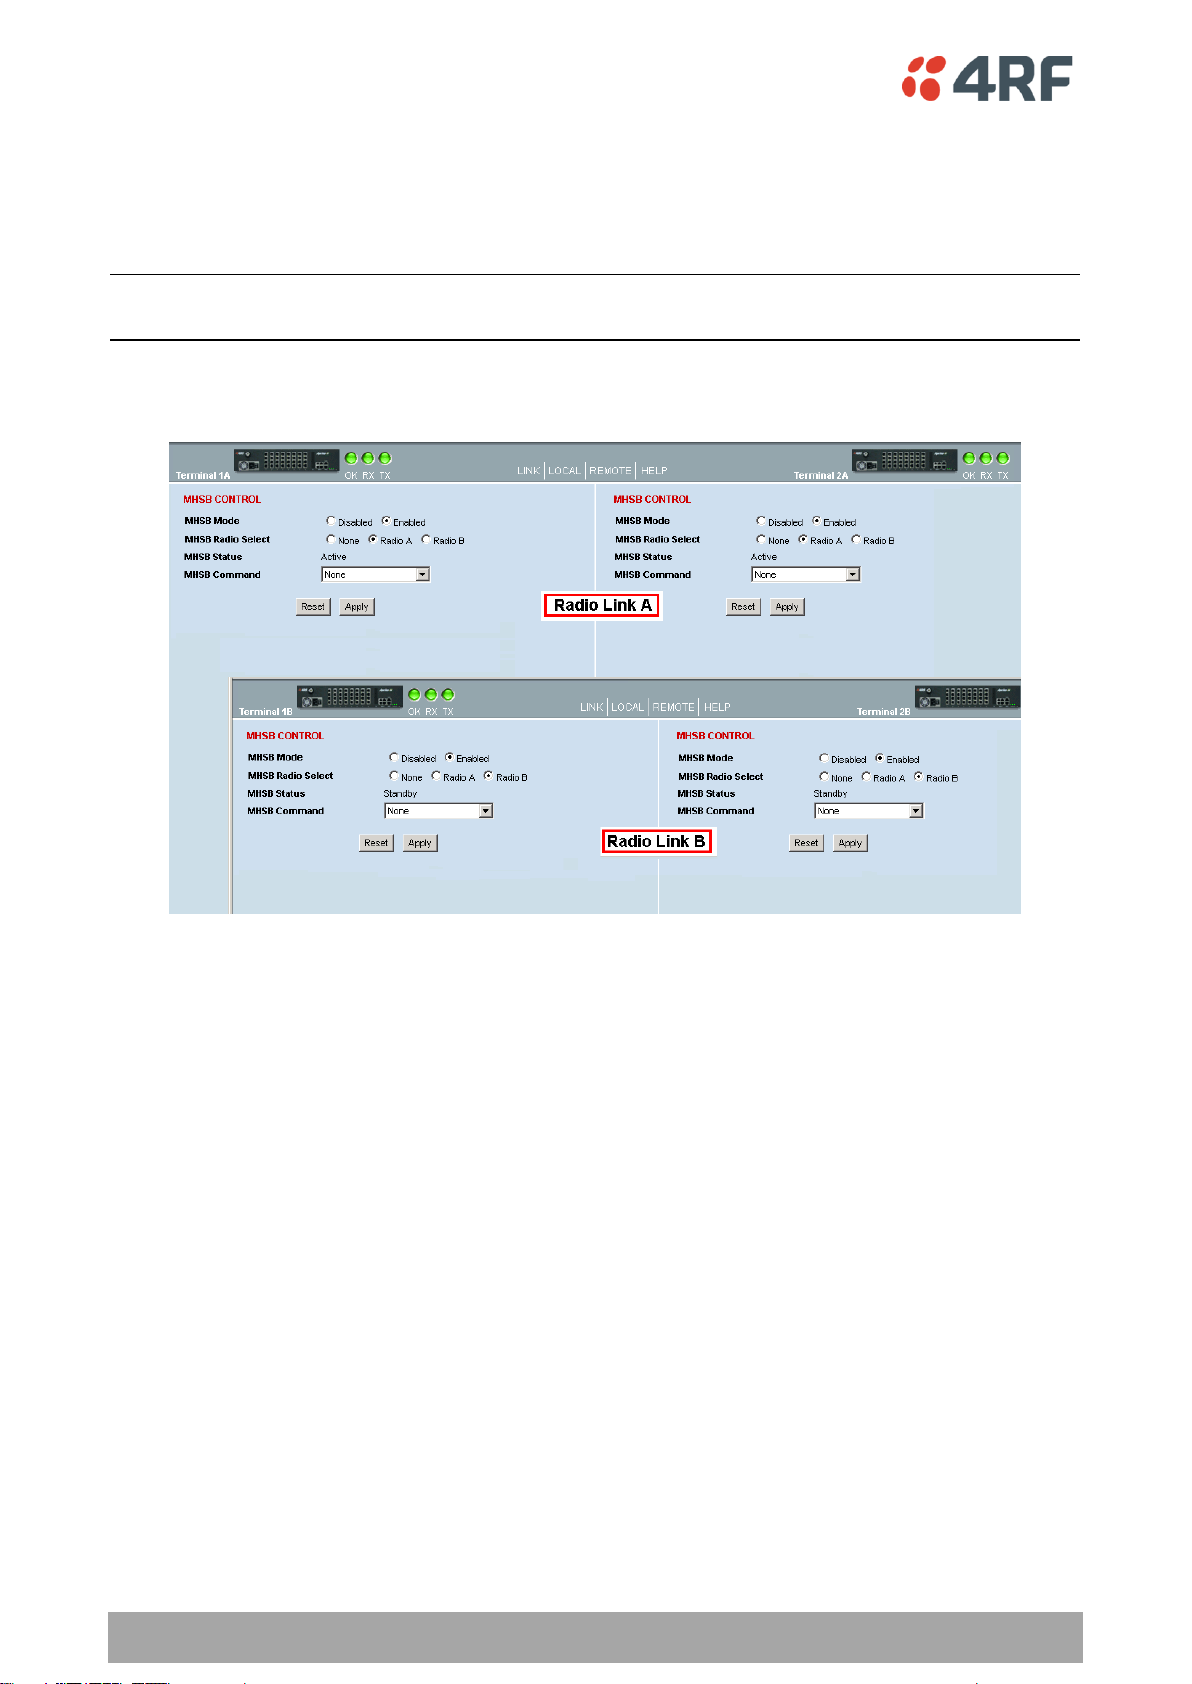
Configuring the Terminals for MHSB
It is recommended that you configure the local and remote A side first, then the local and remote B side.
Both the local A and B radios must be configured identically, and both the remote A and B radios must be
configured identically.
Tip: As illustrated below, you may find it helpful to have two browser sessions running simultaneously.
You can then easily see both the A and B sides of the protected link.
To configure MHSB operation:
1. Select Link > Maintenance > MHSB.
2. Enable MHSB mode.
3. Select whether the radio is A or B.
Ensure that the radio connected to the A side of the protection switch (normally above the MHSB
switch) is set to Radio A and the radio connected to the B side of the protection switch (normally
below the MHSB switch) is set to Radio B.
In the event of a power outage, the radios will switch over to the A side of the protection switch when
the power is restored. The A side is also the default active side.
4. When you have made your changes, click Apply to apply changes or Reset to restore the previous
configuration.
5. Repeat steps 2 to 4 for the other side of the protected link.
Page 9
Protected Terminals | 189
Aprisa XE User Manual
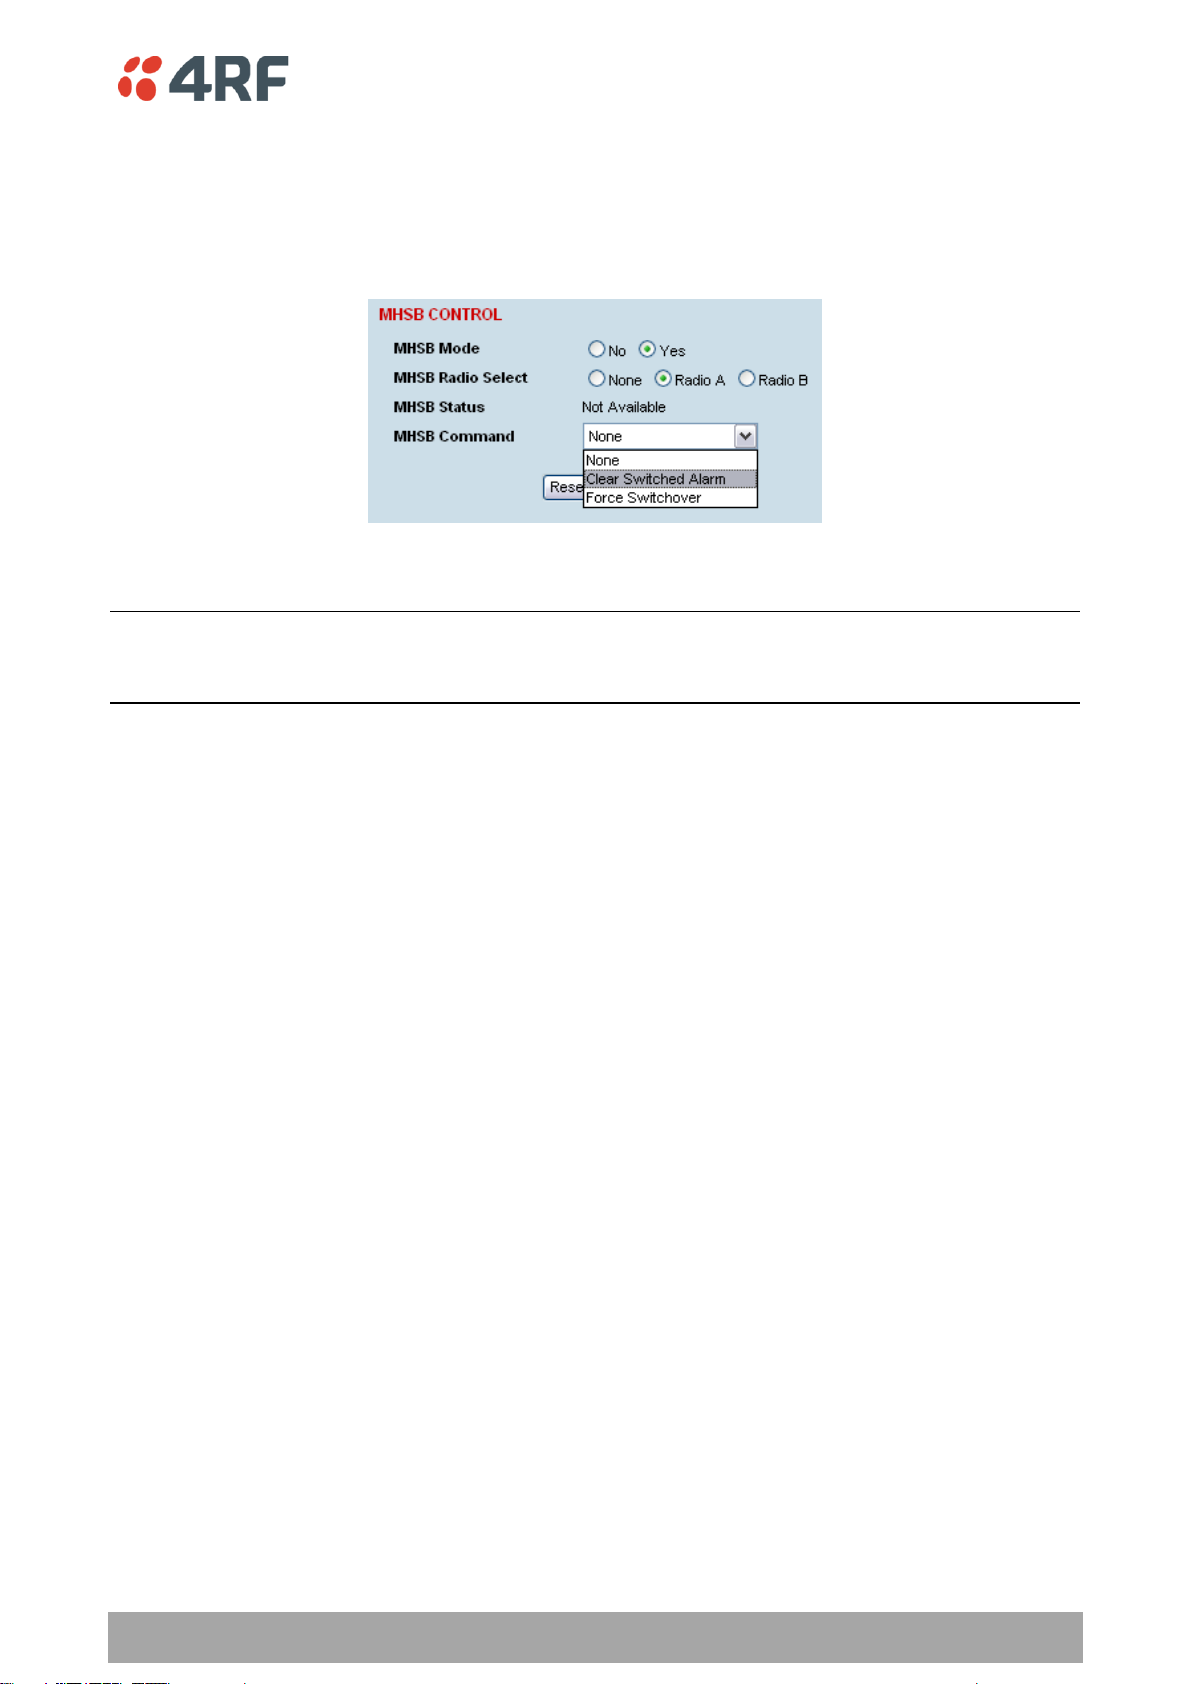
Clearing MHSB Alarms
If a switchover event occurs, the OK LED on the front panel and on the Terminal status and menu bar in
SuperVisor changes to amber.
1. Select Clear Switched Alarm from the MHSB Command drop-down list.
2. Click Apply to apply changes or Reset to reset the page.
Note: When MHSB mode is enabled, external alarm input 2 is used by the protection system to carry
alarms from the protection switch to the radio. In MHSB mode, therefore, only external alarm input 1 is
available for user alarms.
Page 10
190 | Protected Terminals
Aprisa XE User Manual
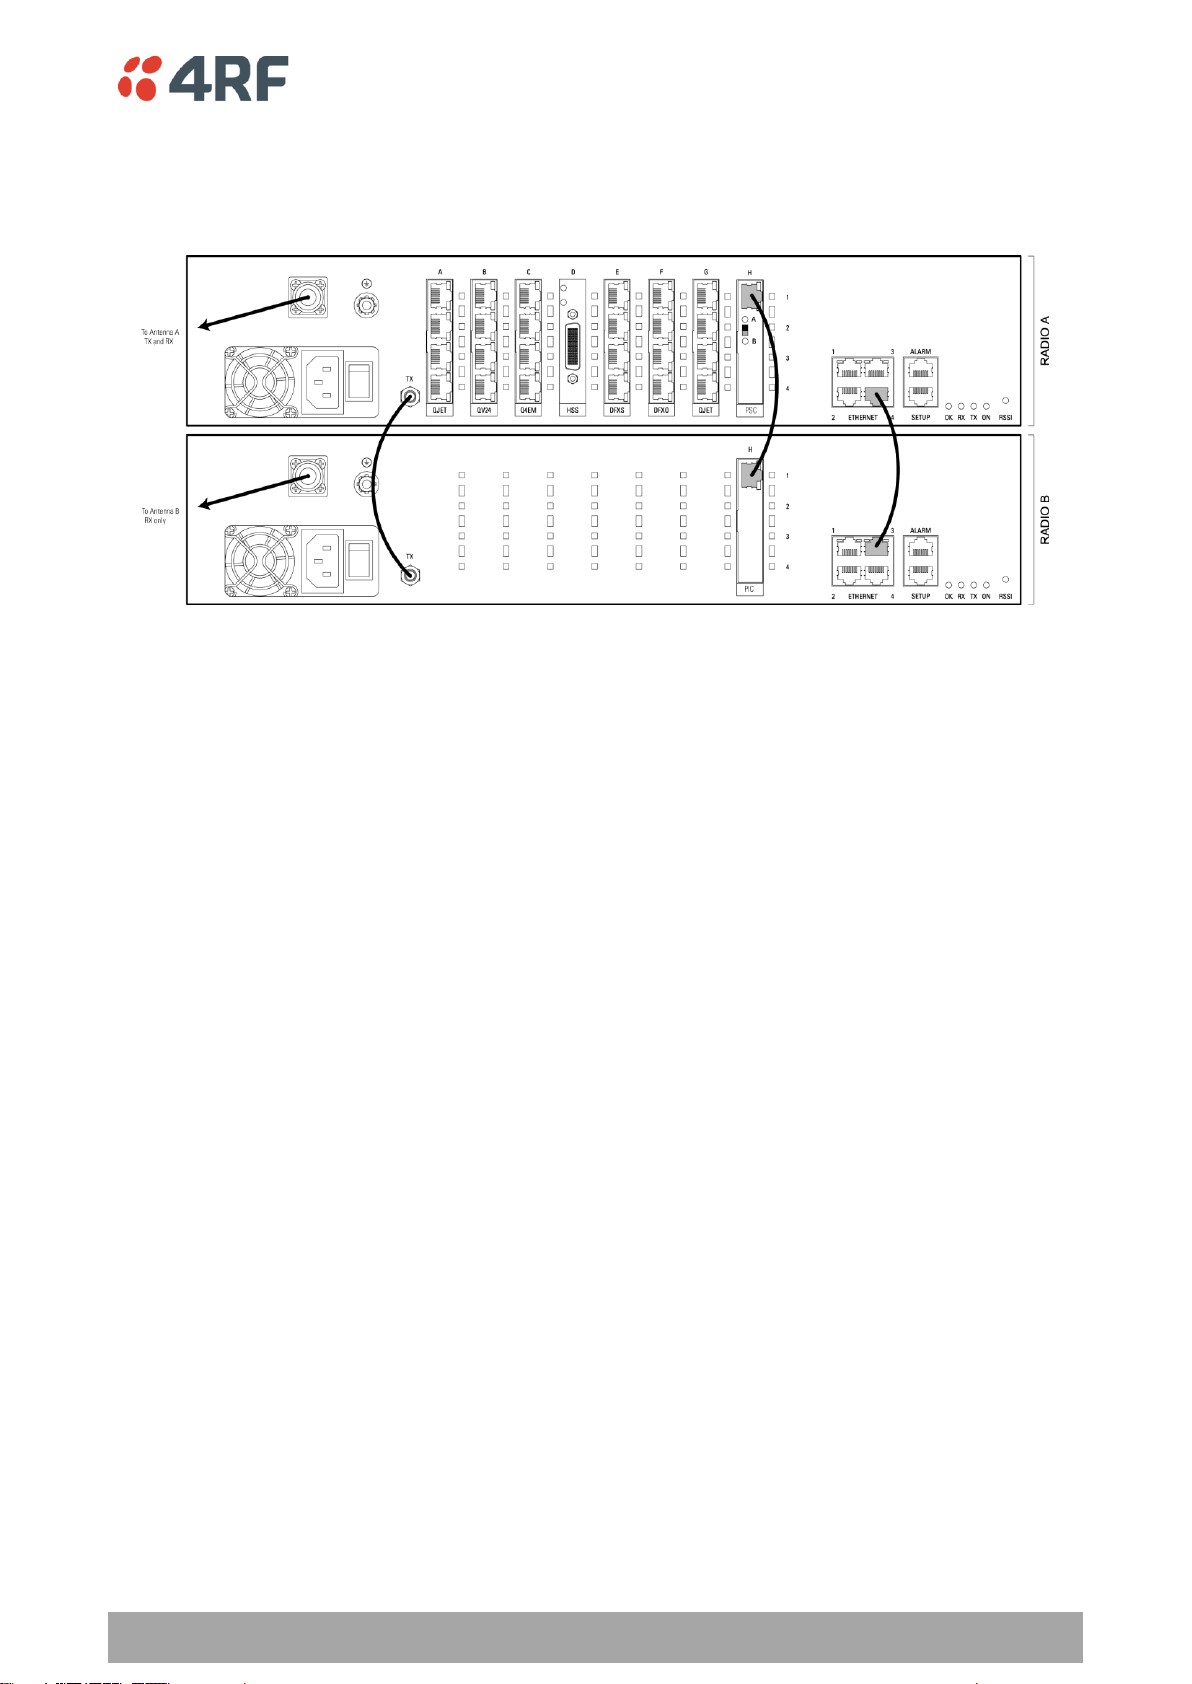
Hitless Space Diversity (HSD)
HSD provides hitless RF receive path protection and hot standby transmitter redundancy. It is typically
deployed for paths where high path availability is required.
An Aprisa XE hitless space diversity terminal comprises two radio terminals, radio A and radio B.
Radio A is the primary radio which is fitted with the interface cards and connects to antenna A.
Antenna A always carries the transmitted signal and the received signal for Radio A.
Radio B is the secondary radio the receiver of which connects to antenna B. The transmitter in this radio is
the standby transmitter.
In the event of a radio A active transmitter failure, radio B transmitter becomes active.
Antenna B only carries the received signal for Radio B. This antenna is physically separated on the tower
by a pre-determined distance from Antenna A.
As both radios have a receive path, traffic from the path with the best received bit error rate is routed to
the customer interfaces in radio A.
In an HSD terminal, a HSD Protection Switch Card (PSC) is always fitted in slot H in Radio A and a HSD
Protection Interface Card (PIC) is always fitted in slot H in Radio B. The PSC card has a card front switch
which controls the hardware setting of the HSD system Active Radio (Auto Select, Radio A or Radio B).
Customer interfaces are provided on radio A only in interface slots A to G. Interface connections to
Ethernet and the external alarm inputs and outputs are also provided on radio A only.
Page 11
Protected Terminals | 191
Aprisa XE User Manual
HSD Terminal Cabling
The two HSD radios are interconnected as follows:
Cables Supplied with HSD Terminal
The following cables are supplied with a HSD terminal:
RF cable
A 110 mm QMA female to QMA female low loss RF cable is required to interconnect between the TX ports
of both radio A and radio B. This cable carries the radio B transmitter output to the radio A transmitter
switch.
Ethernet Cable
A 200 mm RJ45 to RJ45 Ethernet cable between the Ethernet ports of radio A and radio B. This cable
carries management IP traffic between radio A and radio B.
Traffic Cable
A 200 mm RJ45 to RJ45 Ethernet cable between the PSC and PIC. This cable carries all user traffic
between Radio A and Radio B.
Page 12

192 | Protected Terminals
Aprisa XE User Manual
HSD Terminal IP Addresses
Each radio in the HSD link is assigned a unique IP address. All four radios in the HSD link must be on the
same subnet.
The IP address of the four terminals can only be changed by logging into the relevant radio A or radio B.
When the IP addresses have been setup, an ethernet connection to any of the four radios can access all
four radios in the HSD link. The usual ethernet connection is to the near end Radio A (see ‘IP Addressing of
Terminals’ on page 53).
Example of IP addressing
Page 13
Protected Terminals | 193
Aprisa XE User Manual
Configuring HSD Terminals
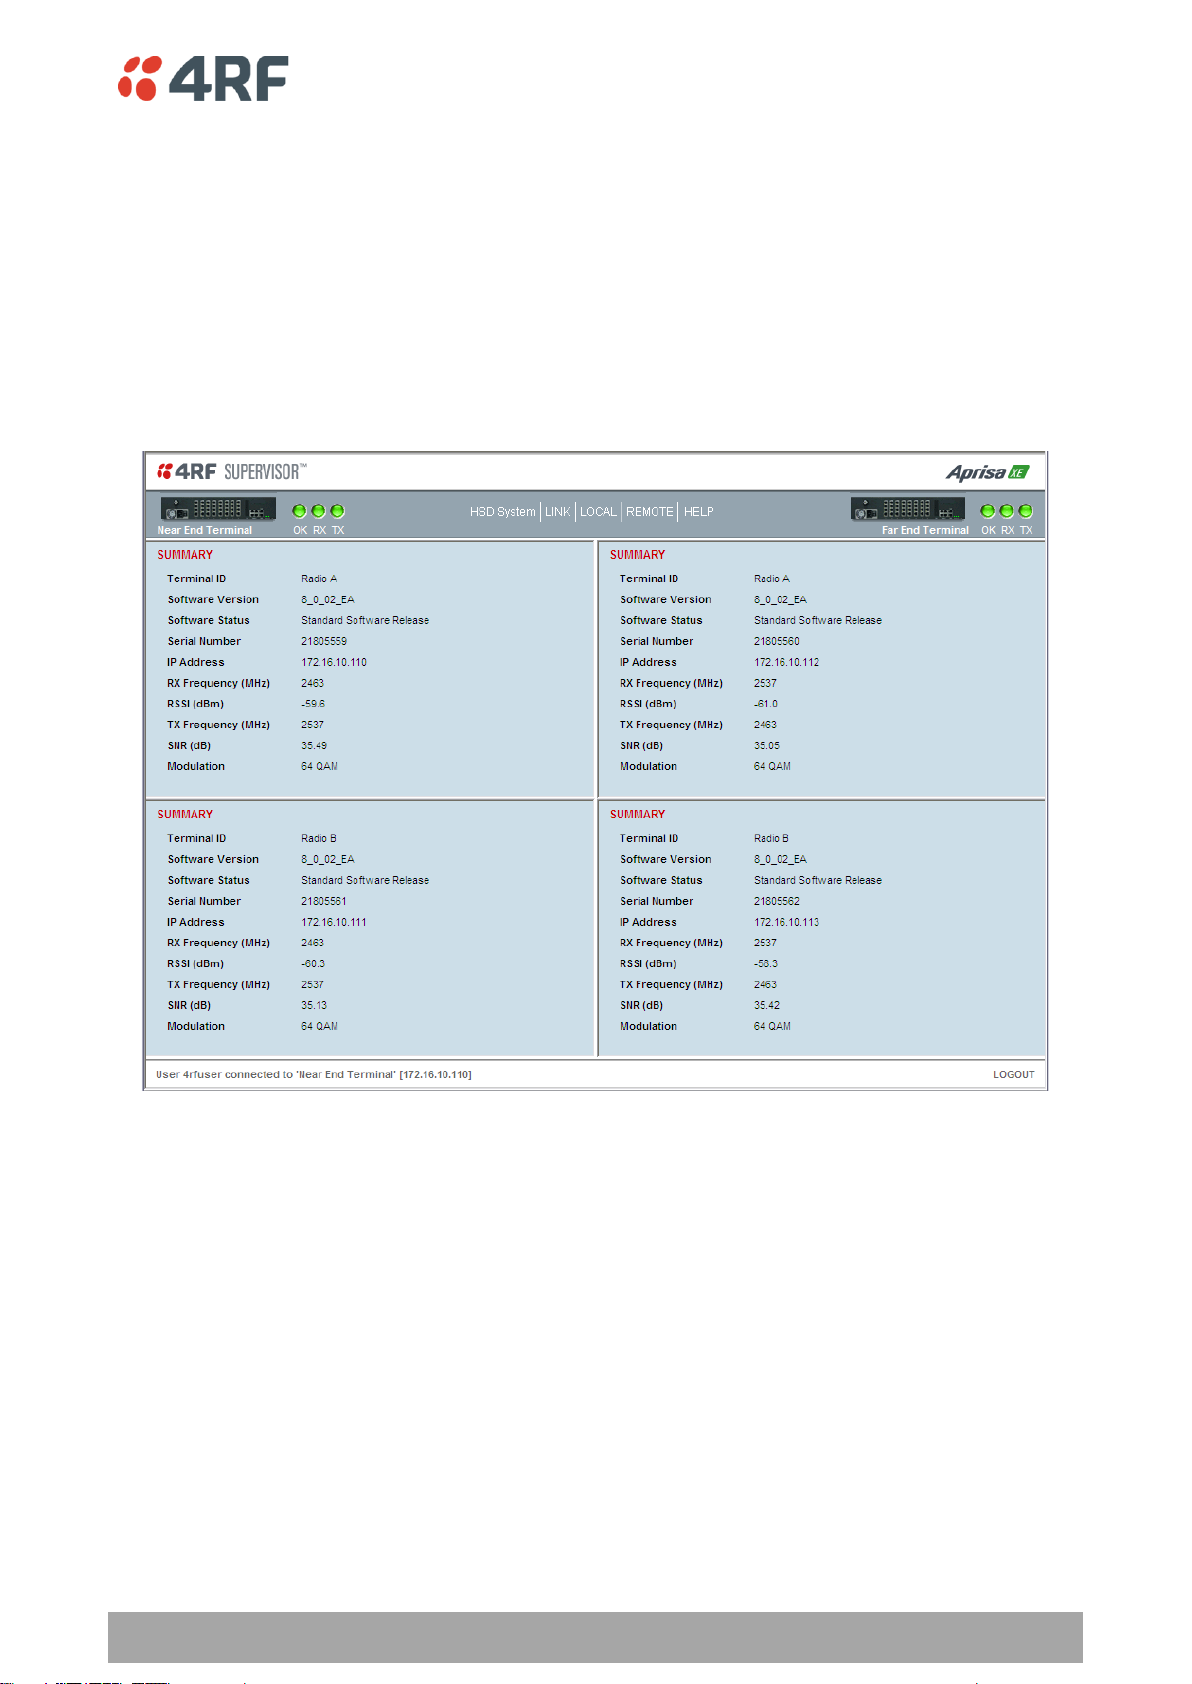
To simplify the management and configuration of the HSD terminals, SuperVisor provides four windows
which display the parameters for all four radios, the local and remote, radios A and B. The HSD System
menu item displays the four windows.
When a parameter is changed in the four window mode, the relevant parameter is automatically changed
to the same setting on the corresponding radio e.g. if a radio A modulation type is changed, the radio B
modulation type is also changed to the same setting.
The Local and Remote menus continue to display the parameters for the local and remote radios for the
near end terminal logged into.
The majority of SuperVisor HSD System pages contain the same parameters and controls as the standard
1+0 XE terminal. The main exceptions are the HSD Control page and the HSD Performance Summary page.
Page 14

194 | Protected Terminals
Aprisa XE User Manual
PSC Mode
Switch
Hardware Control Change
Software Control Change
LED A
LED B
LED A
LED B
Radio A
Solid Amber
Off
Flashing Amber
Off
Auto Select
Solid Green
Solid Green
Flashing Amber
Flashing Amber
Radio B
Off
Solid Amber
Off
Flashing Amber
Active Radio
Mode of Operation
Auto Select
(default)
Automatic mode:
The hitless receive will select traffic from the receive path of best
performance
The HSD system will switch to the standby transmitter if the active
transmitter fails (TX failure alarm)
Radio A Only
Manual selection of radio path A only for both the transmitter and
receiver i.e. no automatic switching
Radio B Only
Manual selection of radio path B only for both the transmitter and
receiver i.e. no automatic switching
HSD Active Radio Control
The HSD system ‘Active Radio’ control determines if the selection of Radio A or Radio B is automatic or
manual. This controls both the radio transmitters and receivers.
The Active Radio can be set with the hardware switch on the PSC card front or with the SuperVisor
software control. The last change of hardware / software control determines the state of the HSD system.
The SuperVisor software control will always reflect the state of the HSD system.
After terminal startup or reboot, the state of the PSC mode switch determines the setting used by the
system and the SuperVisor software control is set to reflect the state of the HSD system.
The PSC card has two card front LEDs which indicate the status of the HSD system:
To set the HSD controls:
1. Select HSD System > Maintenance > Control.
2. Set the Active Radio parameter.
Note: There is no timeout for a manual selection of the Active Radio setting (Radio A only or Radio B only)
but a ‘Mode Switch Software Override’ alarm will warn if the software has overwritten the PSC Mode
Switch.
Page 15

Protected Terminals | 195
Aprisa XE User Manual
Parameter Compare Checking
Option
On
(default)
Any mismatch in parameters shown in Terminal Settings
between Radio A and Radio B will generate a Parameter
Mismatch alarm.
Off
No Parameter Mismatch alarm will be generated.
Field
Explanation
Terminal UCEs
The total number of HSD terminal uncorrectable blocks since the last
reset
Terminal Errored
seconds
The total number of HSD terminal operational seconds with errored
traffic since the last reset
Terminal Error free
seconds
The total number of HSD terminal error free operational seconds since
the last reset
Terminal BER
The system will report an estimated HSD terminal Bit Error Rate up to a
maximum of 1 in 1021
Active Transmitter
Dislays the current active transmitter (TxA or TxB)
3. Set the Parameter Compare Checking.
To view the HSD System Performance Summary:
1. Select HSD System > Performance > Summary.
Click Reset Counters to reset the error counters to zero.
Page 16

Page 17

In-Service Commissioning | 197
Aprisa XE User Manual
12. In-Service Commissioning
Before You Start
When you have finished installing the hardware, RF and the traffic interface cabling, the system is ready
to be commissioned. Commissioning the terminal is a simple process and consists of:
1. Powering up the terminals
2. Configuring both the local and remote terminals using SuperVisor
3. Aligning the antennas
4. Synchronizing the terminals
5. Testing the link is operating correctly. As a minimum, conduct the suggested tests to ensure correct
operation. More extensive testing may be required to satisfy the end client or regulatory body
requirements.
6. Connecting up the client or user interfaces
What You Will Need
Appropriately qualified commissioning staff at both ends of the link.
Safety equipment appropriate for the antenna location at both ends of the link.
Communication equipment, that is, mobile phones or two-way radios.
SuperVisor software running on an appropriate laptop, computer, or workstation at one end of the
link.
Tools to facilitate loosening and re-tightening the antenna pan and tilt adjusters.
Predicted receiver input levels and fade margin figures from the radio link budget (You can use
Surveyor (see ‘Path planning’ on page 23) to calculate the RSSI, fade margin, and availability).
Page 18

198 | In-Service Commissioning
Aprisa XE User Manual
WARNING:
Before applying power to a terminal, ensure you have connected the safety
earth and antenna cable.
Red
the antennas are may be significantly mis-aligned with no signal being
received
Amber
the antennas may be roughly aligned with some signal being received
Green
the antennas are well-aligned and adequate signal is being received to create
a reliable path
Red
the transmitter is faulty
Amber
there is a fault in the antenna connection or feeder cable
Green
the transmitter is working normally
Applying Power to the Terminals
Apply power to the terminals at each end of the link.
When power is first applied, all the front panel LEDs will illuminate red for several seconds as the system
initializes.
After the system is initialized, the OK LED on the front panel should illuminate green and if the terminals
are correctly configured, the TX and RX LED should also be illuminated green.
If the RX LED is:
If the TX LED is:
Review the Link Configurations Using SuperVisor
1. Connect a PC, with SuperVisor installed, to both terminals in the link.
2. Log into the link.
3. Select Link > Summary and confirm the following basic information:
Terminal IP address(es)
Terminal TX and RX frequencies
RSSI (dBm)
TX power (dBm)
SNR (dBm)
Note: If the terminals have not already been configured, refer to ‘Configuring the terminal’ on page 69,
‘Configuring the traffic interfaces’ on page 91, and ‘Configuring the traffic cross connections’ on page
145.
Page 19
In-Service Commissioning | 199
Aprisa XE User Manual
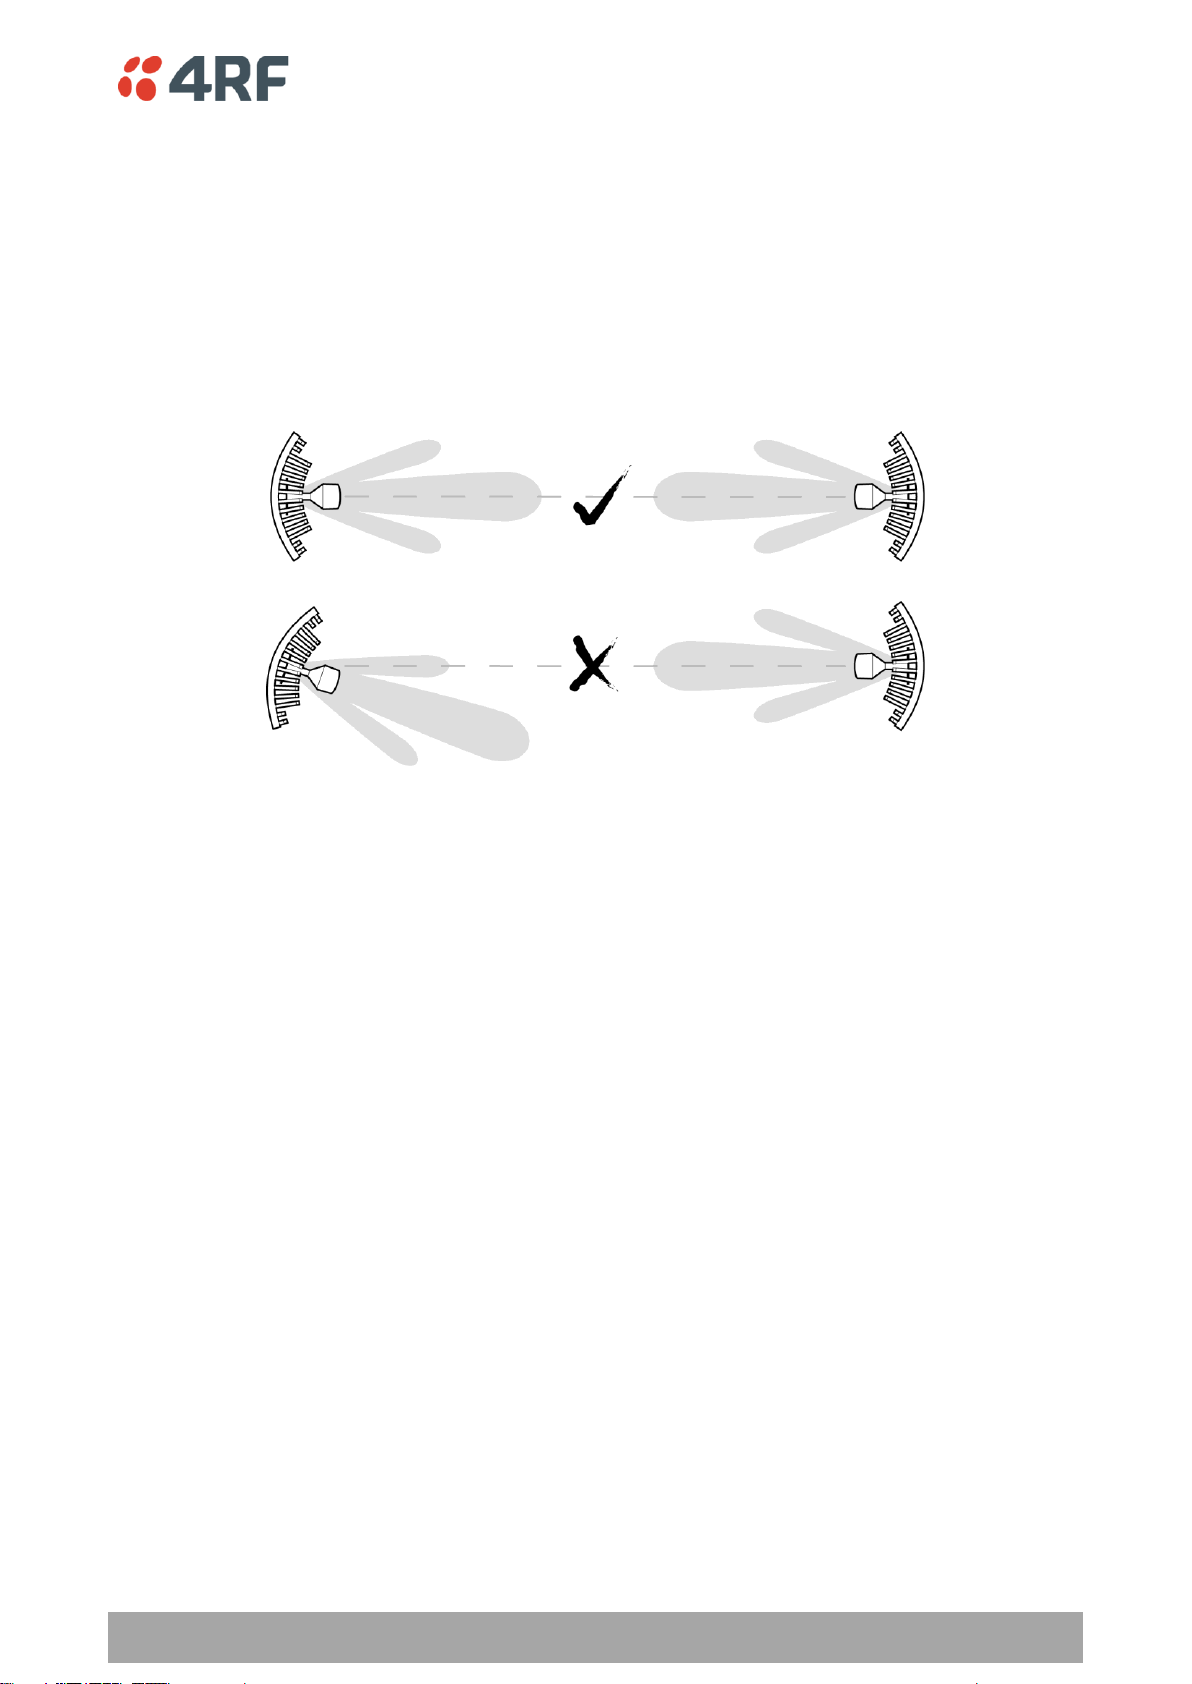
Antenna Alignment
For any point-to-point link, it is important to correctly align the antennas to maximize the signal strength
at both ends of the link. Each antenna must be pointing directly at the corresponding antenna at the
remote site, and they must both be on the same polarization. The antennas are aligned visually, and then
small adjustments are made while the link is operating to maximize the received signal.
Directional antennas have a radiation pattern that is most sensitive in front of the antenna, in line with
the main lobe of the radiation pattern. There are several other lobes (side lobes) that are not as sensitive
as the main lobe in front of the antenna.
For the link to operate reliably, it is important that the main lobes of both antennas are aligned. If any of
the side lobes are aligned to the opposite antenna, the received signal strength of both terminals will be
lower, which could result in fading. If in doubt, check the radiation patterns of the antennas you are
using.
Checking the Antenna Polarization
Check that the polarization of the antennas at each end of the link is the same.
Antenna polarization of grid antennas are normally indicated by an arrow or with ‘H’ and ‘V’ markers
(indicating horizontal and vertical).
On Yagi antennas, ensure the orientation of the elements are the same at each end of the link.
Transmit frequency and power, and antenna polarization would normally be defined by a regulatory body,
and typically licensed to a particular user. Refer to your license details when setting the antenna
polarization.
Page 20

200 | In-Service Commissioning
Aprisa XE User Manual
Visually Aligning Antennas
1. Stand behind the antenna, and move it from side to side until it is pointing directly at the antenna at
the remote site. The remote antenna may be made more visible by using a mirror, strobe light, or
flag.
If the remote end of the link is not visible (due to smoke, haze, or local clutter, etc), align the
antenna by using a magnetic compass. Calculate the bearing using a scale map of the link path.
When setting the antenna on the desired bearing ensure that you use the appropriate true-north to
magnetic-north offset. Also ensure that the compass reading is not affected by standing too close to
metallic objects.
2. Once the antenna is pointing at the remote antenna, tighten the nuts on the U-bolt or antenna clamp
just enough to hold it in position. Leave the nuts loose enough so that small adjustments can still be
made. Check that the antenna is still pointing in the correct direction.
3. Move the antenna up or down until it is pointing directly at the remote site.
4. Tighten the elevation and azimuth adjustment clamps.
5. Mark the position of the antenna clamps so that the antenna can be returned to this rough aim point
easily when accurately aligning the antennas.
6. Repeat steps 1-5 at the opposite site.
Note: Low gain antennas need less adjustment in elevation as they are simply aimed at the horizon. They
should always be panned horizontally to find the peak signal.
Page 21

In-Service Commissioning | 201
Aprisa XE User Manual
Accurately Aligning the Antennas
Once the antennas are visually aligned, accurately align both antennas by carefully making small
adjustments while monitoring the RSSI. This will give the best possible link performance.
Note: Remember that it is important to align the main radiation lobes of the two antennas to each other,
not any side lobes. It may be easier to perform this procedure if you can communicate with someone at
the remote site by telephone, mobile, or two-way radio.
1. Connect a laptop PC running SuperVisor software and power up the terminals at both ends of the link.
Select Link > Performance > Summary so that you can see the RSSI indication for the local terminal.
Alternatively, use the RSSI test point on the front panel together with a multimeter (see ‘Measuring
the RSSI’ on page 202).
2. Move the antenna through a complete sweep horizontally (known as a 'pan') either side of the point
established in the visual alignment process above. Note down the RSSI reading for all the peaks in RSSI
that you discover in the pan.
3. Move the antenna to the position corresponding to the maximum RSSI value obtained during the pan.
Move the antenna horizontally slightly to each side of this maximum to find the two points where the
RSSI drops slightly.
4. Move the antenna halfway between these two points and tighten the clamp.
5. If the antenna has an elevation adjustment, move the antenna through a complete sweep (known as a
'tilt') vertically either side of the point established in the visual alignment process above. Note down
the RSSI reading for all the peaks in RSSI that you discover in the tilt.
6. Move the antenna to the position corresponding to the maximum RSSI value obtained during the tilt.
Move the antenna slightly up and then down from the maximum to find the two points where the RSSI
drops slightly.
7. Move the antenna halfway between these two points and tighten the clamp.
8. Recheck the pan (steps 2-4) and tighten all the clamps firmly.
9. Perform steps 1-8 at the remote site.
Page 22
202 | In-Service Commissioning
Aprisa XE User Manual
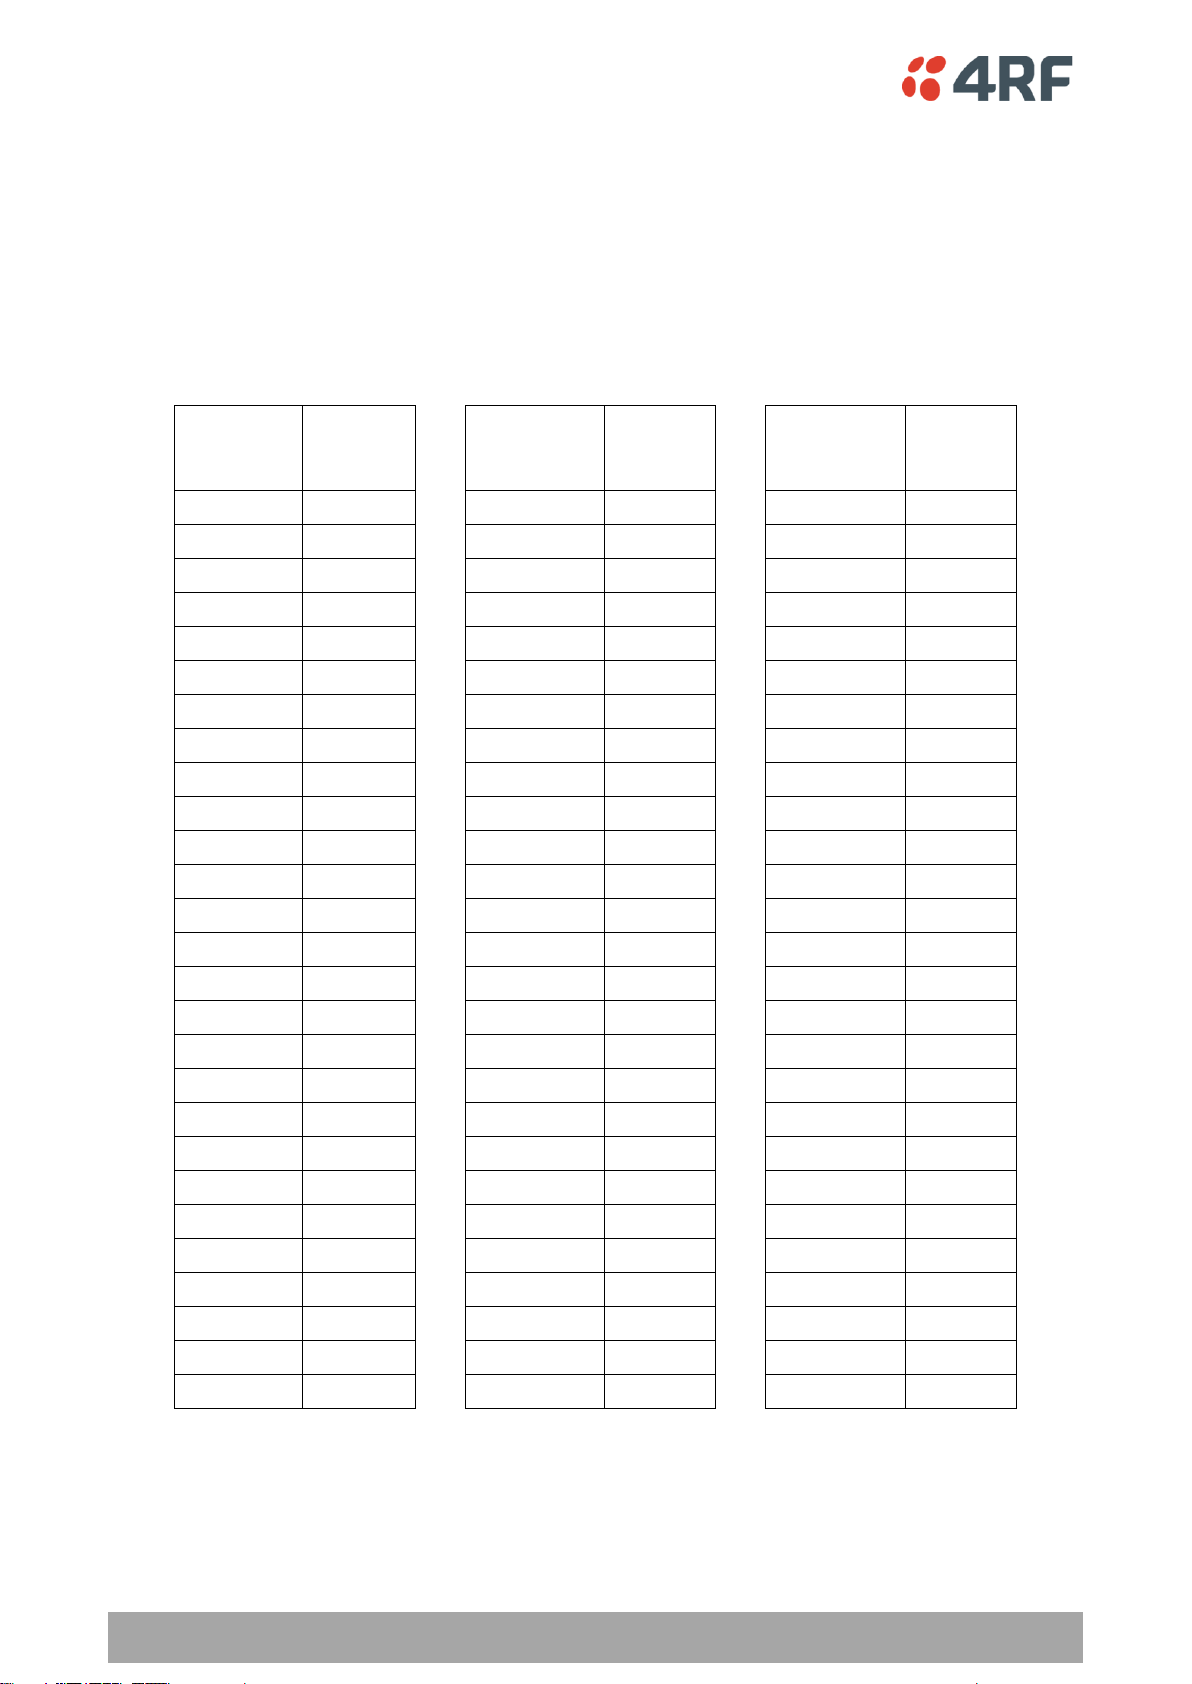
RSSI test
port value
(VDC)
RSSI
reading
(dBm)
RSSI test
port value
(VDC)
RSSI
reading
(dBm)
RSSI test
port value
(VDC)
RSSI
reading
(dBm)
0.000
- 100
0.675
- 73
1.350
- 46
0.025
- 99
0.700
- 72
1.375
- 45
0.050
- 98
0.725
- 71
1.400
- 44
0.075
- 97
0.750
- 70
1.425
- 43
0.100
- 96
0.775
- 69
1.450
- 42
0.125
- 95
0.800
- 68
1.475
- 41
0.150
- 94
0.825
- 67
1.500
- 40
0.175
- 93
0.850
- 66
1.525
- 39
0.200
- 92
0.875
- 65
1.550
- 38
0.225
- 91
0.900
- 64
1.575
- 37
0.250
- 90
0.925
- 63
1.600
- 36
0.275
- 89
0.950
- 62
1.625
- 35
0.300
- 88
0.975
- 61
1.650
- 34
0.325
- 87
1.000
- 60
1.675
- 33
0.350
- 86
1.025
- 59
1.700
- 32
0.375
- 85
1.050
- 58
1.725
- 31
0.400
- 84
1.075
- 57
1.750
- 30
0.425
- 83
1.100
- 56
1.775
- 29
0.450
- 82
1.125
- 55
1.800
- 28
0.475
- 81
1.150
- 54
1.825
- 27
0.500
- 80
1.175
- 53
1.850
- 26
0.525
- 79
1.200
- 52
1.875
- 25
0.550
- 78
1.225
- 51
1.900
- 24
0.575
- 77
1.250
- 50
1.925
- 23
0.600
- 76
1.275
- 49
1.950
- 22
0.625
- 75
1.300
- 48
1.975
- 21
0.650
- 74
1.325
- 47
2.000
- 20
Measuring the RSSI
Measure the RSSI value with a multimeter connected to the RSSI test port on the front of the terminal (see
‘Front panel connections and indicators’ on page 31).
1. Insert the positive probe of the multimeter into the RSSI test port, and clip the negative probe to the
chassis of the terminal (earth).
2. Pan and tilt the antenna until you get the highest VDC reading. The values shown in the table below
relate the measured VDC to the actual received signal level in dBm regardless of bandwidth and
frequency.
Page 23
In-Service Commissioning | 203
Aprisa XE User Manual
Possible cause
Terminal(s)
Is the terminal operating on the correct frequency?
Local & remote
Is the remote terminal transmit power correct?
Remote
Are all the coaxial connectors tight?
Local & remote
Is the antenna the correct type, that is, gain and frequency of operation?
Local & remote
Is the antenna polarized?
Local & remote
Is the antenna aligned?
Local & remote
Is the path between the terminals obstructed?
Checking Performance
The amount of testing performed on the completed installation will depend on circumstances. Some
customers may need to prove to a local licensing regulatory body that the link complies with the license
provisions. This may require special telecommunications test equipment to complete these tests. Most
customers simply want to confirm that their data traffic is successfully passing over the link, or that the
customer interfaces comply with known quality standard.
However, the most important performance verification checks are:
Receive input level
Fade margin
Long-term BER
Checking the Receive Input Level
The received signal strength at the local terminal is affected by many components in the system and has a
direct relationship with the resulting performance of the link. A link operating with a lower than expected
signal strength is more likely to suffer from degraded performance during fading conditions. The receive
input level of a link is normally symmetrical (that is, similar at both ends).
1. Compare the final RSSI figure obtained after antenna alignment with that calculated for the link.
2. If the RSSI figure is in excess of 3 dB down on the predicted level, recheck and correct problems using
the table below and then recheck the RSSI. Alternatively, recheck the link budget calculations.
Note: If following the above steps does not resolve the situation, contact Customer Support for
assistance.
3. Record the RSSI figure on the commissioning form.
4. Repeat steps 1 to 2 for the other end of the link.
Page 24

204 | In-Service Commissioning
Aprisa XE User Manual
Problem
Terminal
Low receive signal strength (see above table)
Local and Remote
Interfering signals on the same, or very close to, the frequency of the
local terminal receiver.
Local
Intermodulation products that land on the same or very close to the
frequency of the local terminal receiver.
Local or Remote
Operating near the local receiver noise floor
Local
Checking the Fade Margin
The fade margin is affected by many components in the system and is closely related to the received
signal strength. A link operating with a lower than expected fade margin is more likely to suffer from
degraded performance during fading conditions. A reduced fade margin can be due to operating the link
too close to the noise floor, or the presence of external interference. The fade margin of a link can be
asymmetrical (that is, different at each end).
Possible causes of low fade margin are as follows:
To check the fade margin:
1. Confirm (and correct if necessary) the receive input level (see the previous test).
Note: If the receive input level is lower than expected, the fade margin may also be low.
2. Select Link > Performance > Summary and check the current BER of the link in its normal condition is
better than 10-6 (If necessary, clear out any extraneous errors by clicking Reset Counters).
3. Check the signal to noise (S/N) indication on the Link > Performance > Summary page. This shows the
quality of the signal as it is being processed in the modem. It should typically be better than 30 dB. If
it is less than 25 dB, it means that either the RSSI is very low or in-band interference is degrading the
S/N performance.
4. Temporarily reduce the remote site's transmit power using either an external attenuator or SuperVisor
(Remote > Terminal > Basic).
Note: Ideally, the transmit power of the remote site should be reduced by up to 20 dB, which will
require the use of an external 50 ohm coaxial attenuator capable of handling the transmit power
involved. In the absence of an attenuator, reduce the transmit power using SuperVisor.
5. Check and note the current BER of the link in its now faded condition (Again, if necessary, clear out
any extraneous errors (introduced by the power reduction step above) by clicking Reset Counters).
6. Compare the unfaded and faded BER performance of the link (steps 2 and 4). Continue to reduce the
remote transmit power until either the BER drops to 10-6 or the remote transmitter power has been
reduced by 20 dB.
Note: The fade margin of the link is expressed as a number (of dB) that the link can be faded
(transmitter power reduced) without reducing the BER below operating specifications (1 * 10-6 BER). A
20 dB fade margin is adequate for most links.
Page 25

In-Service Commissioning | 205
Aprisa XE User Manual
7. Record the fade margin and SNR results on the commissioning form.
Note: If the transmit power is reduced using SuperVisor rather than an external attenuator, the fade
margin should be recorded as ‘Greater than x dB’ (where x = the power reduction).
8. Restore the remote terminal transmit power to normal.
9. Repeat steps 1 to 7 for the other end of the link.
Note: If following all the guidelines above does not resolve the situation, contact Customer Support
for assistance.
Checking the Long-Term BER
The BER test is a measure of the stability of the complete link. The BER results of a link can be
asymmetrical (that is, different at each end).
1. Select Link > Performance > Summary and check the current BER and error counters of the link. If
necessary, clear out any extraneous errors by selecting Reset Counters.
2. Wait 15 minutes, and check the BER display and error counters again. If there are a small number of
errors and the BER is still better than 1 x 10⁻⁹, continue the test for 24 hours. If there are a significant
number of errors, rectify the cause before completing the 24 hour test.
Note: It is normal to conduct the BER test in both directions at the same time, and it is important that
no further work be carried out on the equipment (including the antenna) during this period.
3. The BER after the 24 hour test should typically be better than 1 x 10
-8
.
4. Record the BER results on the commissioning form.
Bit Error Rate Tests
A Bit Error Rate (BER) test can be conducted on the bench, (see ‘Bench Setup’ on page 43).
Attach the BER tester to the interface port(s) of one terminal, and either another BER tester or a loopback
plug to the corresponding interface port of the other terminal.
This BER test can be carried out over the Ethernet, E1 / T1, V.24 or HSS interfaces. It will test the link
quality with regard to user payload data.
CAUTION: Do not apply signals greater than -20 dBm to the antenna as they can damage the receiver. In a
bench setup, there must be 60 - 80 dB at up to 2 GHz of 50 ohm coaxial attenuation (capable of handling
the transmit power) between the terminals’ antenna connectors.
Page 26
206 | In-Service Commissioning
Aprisa XE User Manual
Test
Test equipment required
TX power output measurements (at TX and
duplexer outputs)
Power meter
TX spectrum bandwidth
Spectrum analyzer
TX spectral purity or harmonic outputs
Spectrum analyzer
TX center frequency
Frequency counter or spectrum analyzer
Bulk capacity BER test
BER tester
LAN throughput or errors
LAN tester
G.703 / HDB3 waveforms
Digital oscilloscope
Serial interface BER
BER tester
Audio quality
PCM4 or SINAD test set
Additional Tests
Depending on license requirements or your particular needs, you may need to carry out additional tests,
such as those listed below.
Refer to the relevant test equipment manuals for test details.
Page 27
In-Service Commissioning | 207
Aprisa XE User Manual
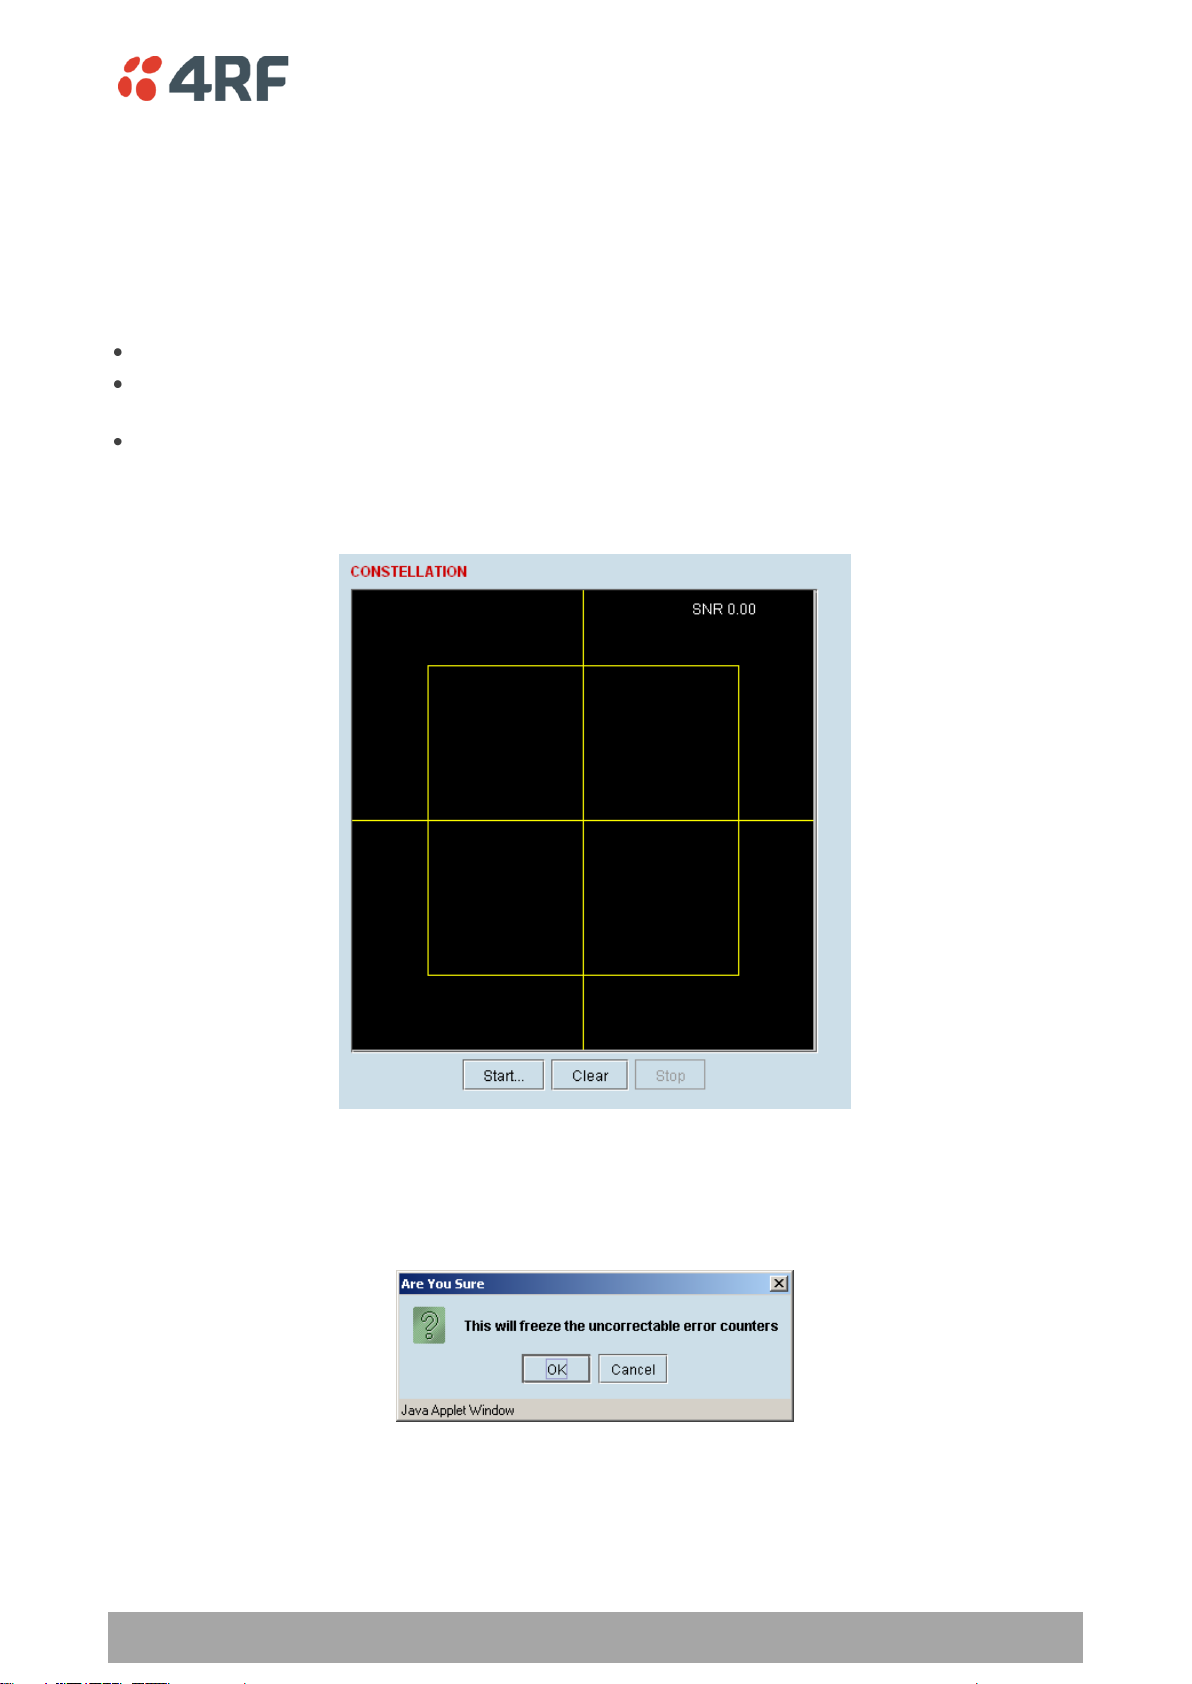
Checking the Link Performance
For a graphical indication of the link performance, you can use the constellation analyzer.
The 'dots' are a graphical indication of the quality of the demodulated signal. Small dots that are close
together indicate a good signal. If the dots become spaced further apart, this indicates that the signal
quality is degrading. This signal quality degradation can be caused by low Rx signal level due to, for
example:
external interference
failure of any of the following: modem, receiver, far end transmitter, an antenna (either end), a
feeder or connector (for example, due to water damage)
path issues such as multipath fading or obstructions
To check the performance of the link using the constellation analyzer:
1. Select Link or Local or Remote > Performance > Constellation.
2. Click Start to start the constellation analyzer.
While the constellation analyzer is running, the terminal will temporarily stop collecting error
performance statistics. If you want to run the constellation analyzer anyway, click OK when you see
this warning message:
3. Click Stop to stop the constellation analyzer.
The terminal automatically resumes collecting error performance statistics.
Page 28

208 | In-Service Commissioning
Aprisa XE User Manual
Field
Explanation
Link Performance
Correctable errors
The total number of correctable blocks since the last reset
Uncorrectable errors
The total number of uncorrectable blocks since the last reset
SNR (dB)
The Signal to Noise Ratio of the link in dB
RSSI (dBm)
The Received Signal Strength Indication at the Rx input in dBm
Errored seconds
The total number of operational seconds with errored traffic since the
last reset
Error free seconds
The total number of error free operational seconds since the last reset
BER
The system will report an estimated Bit Error Rate up to a maximum of
1 in 1021
TX temperature
The measured temperature in the transmitter module in °C
RX temperature
The measured temperature in the receiver module in °C
Ethernet performance
Transmitted packets
The total number of transmitted Ethernet packets
Received packets
The total number of received Ethernet packets
Received packet errors
The total number of packets received with errors
Viewing a Summary of the Link Performance
To view the performance summary for a terminal:
Select Link or Local or Remote > Performance > Summary.
Click Reset Counters to reset the error counters to zero.
Page 29
In-Service Commissioning | 209
Aprisa XE User Manual
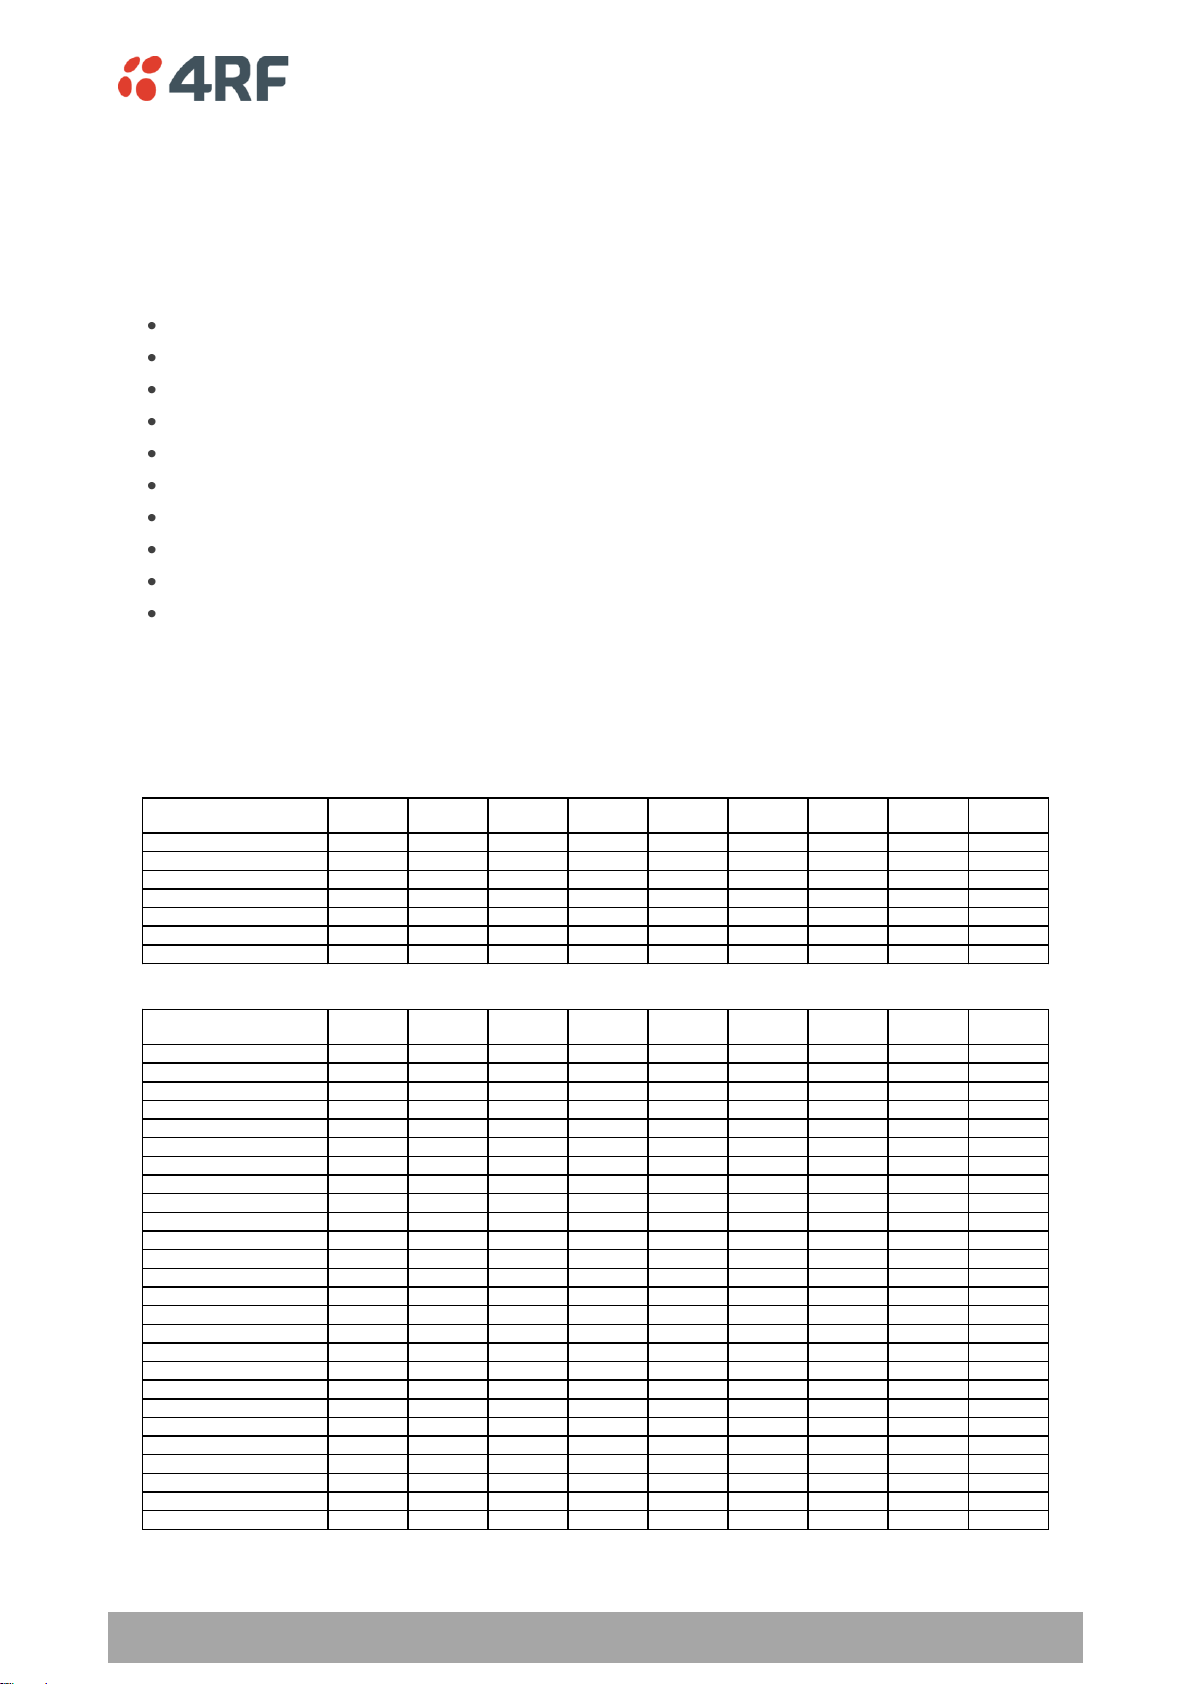
PREVIOUS WEEK
TIME
SNR min
(dB)
SNR avg
(dB)
SNR max
(dB)
RSSI min
(dBm)
RSSI avg
(dBm)
RSSI max
(dBm)
BER UCEs
Tx Temp
(deg C)
Mon Apr 6 09:44:50 2009 35.14 35.26 35.39 -54.00 -54.00 -54.00 3.40E-12 144 50
Mon Apr 6 10:44:50 2009 35.14 35.26 35.40 -54.00 -53.90 -53.90 3.39E-12 144 50
Mon Apr 6 11:44:50 2009 35.14 35.26 35.40 -54.00 -53.90 -53.90 3.38E-12 144 50
Mon Apr 6 12:44:51 2009 15.31 25.77 58.54 -114.00 -77.00 -54.00 1.58E-05 1045 50
Mon Apr 6 13:44:51 2009 22.52 22.75 22.89 -84.10 -83.70 -83.60 6.92E-06 9912 51
Mon Apr 6 14:44:51 2009 16.20 26.05 54.61 -87.10 -77.40 -60.20 9.67E-05 72125 52
…
PREVIOUS HOUR
TIME
SNR min
(dB)
SNR avg
(dB)
SNR max
(dB)
RSSI min
(dBm)
RSSI avg
(dBm)
RSSI max
(dBm)
BER UCEs
Tx Temp
(deg C)
Mon Apr 6 14:11:51 2009 22.52 28.38 22.75 -84.10 -78.19 -83.80 5.89E-06 22821 52
Mon Apr 6 14:12:51 2009 22.55 25.67 22.75 -84.10 -80.89 -83.80 5.86E-06 23369 52
Mon Apr 6 14:13:51 2009 22.50 23.52 22.75 -84.10 -83.07 -83.70 5.84E-06 23847 52
Mon Apr 6 14:14:51 2009 22.50 24.35 22.78 -84.10 -82.23 -83.70 5.81E-06 24338 52
Mon Apr 6 14:15:51 2009 22.54 22.73 22.77 -84.10 -83.86 -83.80 5.78E-06 24855 52
Mon Apr 6 14:16:51 2009 22.52 26.67 22.75 -84.10 -79.90 -83.80 5.75E-06 25374 52
Mon Apr 6 14:17:51 2009 22.48 30.19 22.79 -84.10 -76.38 -83.70 5.73E-06 25918 52
Mon Apr 6 14:18:51 2009 22.49 28.87 22.74 -84.10 -77.68 -83.80 5.71E-06 26473 52
Mon Apr 6 14:19:51 2009 22.48 30.65 22.74 -84.10 -75.94 -83.80 5.68E-06 27007 52
Mon Apr 6 14:20:51 2009 22.50 29.99 22.75 -84.00 -76.59 -83.80 5.66E-06 27561 52
Mon Apr 6 14:21:51 2009 22.61 29.78 22.76 -84.00 -76.82 -83.80 5.64E-06 28167 52
Mon Apr 6 14:22:51 2009 22.46 25.70 22.74 -84.10 -80.86 -83.90 5.62E-06 28717 52
Mon Apr 6 14:23:51 2009 22.46 26.96 22.75 -84.10 -79.61 -83.80 5.59E-06 29237 52
Mon Apr 6 14:24:51 2009 22.47 24.71 22.75 -84.10 -81.86 -83.80 5.57E-06 29776 52
Mon Apr 6 14:25:51 2009 22.48 30.19 22.73 -84.10 -76.36 -83.80 5.55E-06 30368 52
Mon Apr 6 14:26:51 2009 22.49 25.97 22.75 -84.20 -80.61 -83.80 5.53E-06 30942 52
Mon Apr 6 14:27:51 2009 16.20 22.94 54.61 -87.10 -83.76 -83.90 7.30E-06 71751 52
Mon Apr 6 14:28:51 2009 16.23 26.84 49.90 -87.00 -73.31 -60.30 6.67E-03 72125 52
Mon Apr 6 14:29:51 2009 35.10 40.60 35.24 -60.50 -54.96 -60.30 1.70E-03 72125 52
Mon Apr 6 14:30:51 2009 35.08 39.17 35.28 -60.50 -56.40 -60.30 9.13E-04 72125 52
Mon Apr 6 14:31:51 2009 35.07 36.63 35.26 -60.50 -58.95 -60.20 6.11E-04 72125 52
Mon Apr 6 14:32:51 2009 35.06 36.68 35.24 -60.60 -58.90 -60.30 4.52E-04 72125 52
Mon Apr 6 14:33:51 2009 35.06 35.34 35.25 -60.60 -60.24 -60.30 3.56E-04 72125 52
Mon Apr 6 14:34:51 2009 35.09 36.28 35.24 -60.50 -59.28 -60.30 2.92E-04 72125 52
Mon Apr 6 14:35:51 2009 35.07 42.56 35.28 -60.60 -53.03 -60.30 2.46E-04 72125 52
…
Saving the History of the Link Performance
Link performance history data is stored in a rolling buffer which can be saved as a *.cvs file (default
filename is savedPerformanceHistory.csv). The maximum history data buffer is 1 week of 1 hour records
and the last hour is displayed in minute records.
The parameters saved are:
Date / Time
SNR (minimum over period)
SNR (average over period)
SNR (maximum over period)
RSSI (minimum over period)
RSSI (average over period)
RSSI (maximum over period)
BER (value at end of period)
UCEs count (value at end of period)
Transmitter temperature (value at end of period)
To save the history of the link performance for a terminal:
Select Local > Performance > Save History.
Example of file (simulated fade data):
Page 30

210 | In-Service Commissioning
Aprisa XE User Manual
To save the alarm history from the Remote terminal, login to the Remote terminal and Select Local >
Alarms > Save History.
Page 31

In-Service Commissioning | 211
Aprisa XE User Manual
0.00
5.00
10.00
15.00
20.00
25.00
30.00
35.00
40.00
45.00
SNR avg (dB)
Aprisa XE Link Performance
-70.00
-60.00
-50.00
-40.00
-30.00
-20.00
-10.00
0.00
Mon Apr 6 14:11:51 2009
Mon Apr 6 14:12:51 2009
Mon Apr 6 14:13:51 2009
Mon Apr 6 14:14:51 2009
Mon Apr 6 14:15:51 2009
Mon Apr 6 14:16:51 2009
Mon Apr 6 14:17:51 2009
Mon Apr 6 14:18:51 2009
Mon Apr 6 14:19:51 2009
Mon Apr 6 14:20:51 2009
Mon Apr 6 14:21:51 2009
Mon Apr 6 14:22:51 2009
Mon Apr 6 14:23:51 2009
Mon Apr 6 14:24:51 2009
Mon Apr 6 14:25:51 2009
Mon Apr 6 14:26:51 2009
Mon Apr 6 14:27:51 2009
Mon Apr 6 14:28:51 2009
Mon Apr 6 14:29:51 2009
Mon Apr 6 14:30:51 2009
Mon Apr 6 14:31:51 2009
Mon Apr 6 14:32:51 2009
Mon Apr 6 14:33:51 2009
Mon Apr 6 14:34:51 2009
Mon Apr 6 14:35:51 2009
RSSI avg (dBm)
Aprisa XE Link Performance
To create an Excel chart of the link performance for a terminal:
1. Open the *.csv file with Excel.
2. Select the ‘Time’ column and the column you wish to graph e.g. ‘SNR avg (dB)’ or ‘RSSI avg (dBm)’
3. Select ‘Insert Chart’ from the Excel menu.
Graph of Date / Time vs the average SNR
Graph of Date / Time vs the average RSSI
To clear the history of the link performance for a terminal:
Select Link or Local or Remote > Performance > Clear History.
Page 32

Page 33

Maintenance | 213
Aprisa XE User Manual
Item
What to check or look for
Equipment shelter environment
Water leaks
Room temperature
Excessive vibration
Vermin damage
Terminal mounting
Firmly mounted
Antenna cable connections
Tight and dry
Antenna cable and its supports
Not loose or suffering from ultra-violet degradation
Antenna and its mounting hardware
Not loose, rusty or damaged
Safety earth
Connections tight
Cabling intact
DC system
Connections tight
Voltage in normal limits
Batteries (if installed)
Connections tight
Electrolyte levels normal
13. Maintenance
There are no user-serviceable components within the terminal.
All hardware maintenance must be completed by 4RF or an authorized service centre.
Do not attempt to carry out repairs to any boards or parts.
Return all faulty terminals to 4RF or an authorized service centre.
For more information on maintenance and training, please contact Customer Services.
CAUTION: Electro Static Discharge (ESD) can damage or destroy the sensitive electrical components in the
terminal.
Routine Maintenance
Every six or twelve months, for both ends of the link, you should record the RSSI and SNR levels as well as
checking the following:
Page 34

214 | Maintenance
Aprisa XE User Manual
Software status
Function
Standard Software
Release
The software status indicates ‘Standard Software Release’ if the
following system software files have not been changed since the last
TFTP Upgrade.
Kernel image file
Software image file
Firmware image files
Configuration files
Modified Software
Release
The software status indicates ‘Modified Software Release’ if the system
software files have been changed since the last TFTP Upgrade.
This could be caused by:
an image file which has been uploaded to the terminal since the
last TFTP upgrade which is not part of that upgrade.
an image file which was part of the last TFTP upgrade but was
subsequently deleted.
Terminal Upgrades
You can upgrade all software for both terminals remotely (through a management network), which
eliminates the need to physically visit either end of the link.
A terminal is upgraded by accessing a running TFTP server (see ‘TFTP Upgrade Process’ on page 221). All
the required files are uploaded from the TFTP server into the terminal and then activated following a
terminal reboot.
System files can be manually uploaded (see ‘Uploading System Files’ on page 226‘).
Inventory File
Software release 8.2.10 and all future software releases, contains an inventory file (similar to a manifest
file) which is used to validate the software files in the terminal.
To view the Software Status of the terminal:
Select Link, Local or Remote > Summary
Upgrade Prerequisites
To minimize disruption of link traffic and prevent your terminals from being rendered inoperative, please
follow the procedures described in this section together with any additional information or instructions
supplied with the upgrade package.
Before upgrading the terminal, ensure that you have saved the configuration file (see ‘Saving the
terminal's configuration’ on page 89) as well as the cross connection configuration (see ‘Saving cross
connection configurations’ on page 155).
The Remote terminal upgrade process will be faster if the bandwidth allocated to the management
ethernet capacity is maximized.
The terminal software must be identical at both ends of the link.
At the end of the terminal upgrade process, the versions of image files (kernel software, and firmware)
that were in use before the upgrade are still in the terminal. You can restore them, if required, by editing
the image tables and reactivating the old files (see ‘Changing the Status of an Image ’ on page 232).
IMPORTANT NOTE: Ensure you are logged into the Near end terminal as Admin before you start an
upgrade.
Page 35

Maintenance | 215
Aprisa XE User Manual
Software Upgrade Process
Unzip and save the following folders to your hard drive:
8.6.77 Software
tftpd32.exe
The following steps are required for the software upgrade process:
1. Identify the correct TFTP upgrade type (see ‘Identifying the Correct TFTP Upgrade Type’ on page
217).
2. If the terminals are operating software prior to 8.3.40:
Upload the Root File System (see ‘Uploading the Root File System’ on page 216)
Upload the Motherboard Images (see ‘Uploading the Motherboard Images’ on page 216).
Reboot the terminal.
3. Go through the steps of the TFTP upgrade process (see ‘TFTP Upgrade Process’ on page 221).
4. Upgrade for new FXO/FXS and modem images
5. Reboot the terminal.
6. Clear the Java and web browser caches (see ‘Step 7: Clear the Java and web browser caches’ on
page 223).
If the TFTP upload process fails, an ‘Upload Fail’ alarm is raised. If the TFTP upload process fails due to a
power failure, the alarm is raised upon power recovery.
Page 36

216 | Maintenance
Aprisa XE User Manual
Motherboard Type
Image Files Required
Rev C
C-fpga_E1-0-7-0.img (Motherboard 1
C-fpga_E2-0-5-3.img (Motherboard 2)
Rev D
C-fpga_E1-1-7-3.img (Motherboard 1
C-fpga_E2-1-5-4.img (Motherboard 2)
Uploading the Root File System
Note: Uploading of image files can only be performed to the local terminal i.e. not via the link to the
remote terminal.
1. Logon to the local terminal as admin.
2. Go to SuperVisor > Local > Maintenance > Upload > Software.
3. Browse to the 8.6.77 Software folder and select ‘C-CC-R-8_6_7.img’.
4. Click Upload and wait for the upload status to display Succeeded.
5. Activate the ‘C-CC-R-8_6_7.img’ with SuperVisor Local > Maintenance > Image Table (see ‘Changing
the Status of an Image File’ on page 232).
Uploading the Motherboard Images
The E1 and E2 motherboard images do not update as part of the TFTP upgrade.
Check if the correct motherboard images are loaded with SuperVisor Local > Maintenance > Image Table.
Example: Radio on V8.4.60 with a Rev C motherboard.
The Motherboard Firmware images for this software version are:
If the motherboard image files are not correct, upload the relevant image files.
Note: Uploading of image files can only be performed to the local terminal i.e. not via the link to the
remote terminal.
1. Logon to the local terminal as admin
2. Go to SuperVisor > Local > Maintenance > Upload > Firmware.
3. Browse to the 8.6.77 Software folder and select ‘C-fpga_Ex-x-x-x.img’.
4. Click Upload and wait for the upload status to display Succeeded.
5. Activate the ‘C-fpga_Ex-x-x-x.img’ with SuperVisor Local > Maintenance > Image Table (see ‘Changing
the Status of an Image File’ on page 232).
Page 37

Maintenance | 217
Aprisa XE User Manual
Identifying the Correct TFTP Upgrade Type
The correct TFTP upgrade type will depend on both the Bootloader Version and the Software Version
Type.
Aprisa XE terminals running the older bootloader software (bootloader version 0) have a limitation on the
number of software images that can be loaded simultaneously into a terminal.
Identifying the Bootloader Version
Determine which bootloader version your terminal is running by using the SuperVisor menu item
Maintenance > Support Summary and look for the ‘Bootloader Version’ number:
(1) If your terminal is running bootloader version 1 or greater, use the TFTP full upgrade process.
(2) If your terminal is running bootloader version 0 and running a software version prior to 7.0.6,
use the TFTP partial upgrade process.
(3) If your terminal is running bootloader version 0 and running a software version 7.0.6 or later,
use the TFTP standard upgrade process.
(4) HSD terminals cannot run with bootloader version 0.
Page 38

218 | Maintenance
Aprisa XE User Manual
8_6_77_E0
The E0 variant supports ETSI (Type 1) 1+0 and MHSB terminals with the same
variants as Aprisa XE software version 8.4.40.
8_6_77_E1
The E1 variant supports ETSI (Type 2) 1+0 and MHSB terminals with the same
variants as Aprisa XE software version 8.4.40 except for the 400 MHz 25 kHz
and 50 kHz which has been replaced with 900 MHz 25 kHz and 50 kHz.
8_6_77_E0h
The E0h variant supports ETSI (Type 1) Hitless Space Diversity (HSD)
terminals with the same variants as Aprisa XE software version 8.4.40.
8_6_77_E1h
The E1 variant supports ETSI (Type 2) Hitless Space Diversity (HSD) terminals
with the same variants as Aprisa XE software version 8.4.40 except for the
400 MHz 25 kHz and 50 kHz which has been replaced with 900 MHz 25 kHz
and 50 kHz.
8_6_77_F0
The F0 variant supports FCC part 90 1+0 and MHSB terminals.
8_6_77_F0h
The F0h variant supports FCC part 90 Hitless Space Diversity (HSD)
terminals.
8_6_77_F1
The F1 variant supports FCC part 101 1+0 and MHSB terminals.
8_6_77_F1h
The F1h variant supports FCC part 101 Hitless Space Diversity (HSD)
terminals.
Identifying the Software Version Type
There are six different software version types; ETSI type 1, ETSI type 1 HSD, ETSI type 2, ETSI type 2 HSD,
FCC Part 101 and FCC Part 90.
To determine which Software Version Type is currently installed on the terminal, take note of the
‘Software Version’ on SuperVisor Summary page. The last three characters indicate the Software Version
Type.
ETSI Compliance Body
FCC Compliance Body
Page 39

Maintenance | 219
Aprisa XE User Manual
Upgrade Version File
Upgrade Type
Software Version Type
8_6_77_E0a
Full TFTP upgrade
ETSI TYPE 1
8_6_77_E0
Standard TFTP upgrade
ETSI TYPE 1
8_6_77_E0h
Standard TFTP upgrade
ETSI TYPE 1 HSD
8_6_77_E0p
Partial TFTP upgrade
ETSI TYPE 1
8_6_77_E1a
Full TFTP upgrade
ETSI TYPE 2
8_6_77_E1
Standard TFTP upgrade
ETSI TYPE 2
8_6_77_E1h
Standard TFTP upgrade
ETSI TYPE 2 HSD
8_6_77_E1p
Partial TFTP upgrade
ETSI TYPE 2
8_6_77_F0a
Full TFTP upgrade
FCC Part 90
8_6_77_F0
Standard TFTP upgrade
FCC Part 90
8_6_77_F1a
Full TFTP upgrade
FCC Part 101
8_6_77_F1
Standard TFTP upgrade
FCC Part 101
Frequency Band
Synthesizer File(to be installed)
Comments
300, 400 MHz
XE_300_400_type_1_synth.cfg
BB synthesizer
300, 400 MHz
XE_300_400_type_2_synth.cfg
E3 synthesizer
300, 400 MHz
XE_300_400_type_3_synth.cfg
5 kHz sythesizer step
600, 700, 800, 900 MHz
XE_600_700_800_900_synth.cfg
1400 MHz
XE_1400_synth.cfg
1400 MHz
XE_1400TCVR_synth.cfg
New transceiver (introduced
April 2012)
1800 MHz
XE_1800_synth.cfg
2000, 2500 MHz
XE_2000_2500_synth.cfg
Upgrade Version Files
The following table defines the purpose of the upgrade version files:
Installing RF Synthesizer Configuration Files
If you are upgrading from a software version prior to 7_1_x, you will need to install new RF synthesizer
files, refer to ‘Configuration Files’ on page 226.
You can then upgrade the terminal using TFTP (see page 221).
Page 40

220 | Maintenance
Aprisa XE User Manual
TFTP Upgrade Process Types
TFTP partial upgrade process
Run the TFTP upgrade process by typing 8_6_77_E0p in the Upgrade Version field.
This will perform a partial upgrade which will delete unnecessary image files that might be taking up
space in the Image Table (which could prevent a standard upgrade succeeding).
Reboot the terminal.
Run a TFTP standard upgrade process on the terminal.
Reboot the terminal again.
TFTP standard upgrade process
This TFTP standard upgrade process excludes FPGA images for the newly introduced revisions of the
Modem, DFXO and DFXS cards.
Run the TFTP upgrade process by typing ‘8_6_77_E0’ in the Upgrade Version field.
If the standard upgrade fails, it may be necessary to make space for the new images by manually deleting
‘Inactive’ firmware image files.
To delete a firmware image file, select the SuperVisor menu item Maintenance > Image Table, select the
firmware image and click on Edit. Set the IMAGE DETAILS Command to ‘Delete’ and click ‘Apply’.
Reboot the terminal.
Additional TFTP upgrade options have been provided to load the new images separately. Run the TFTP
upgrade process using the file:
‘F1_8_6_7’ to load images for the newest DFXO and DFXS cards (rev D).
‘F2_8_6_7’ to load images for all revisions of DFXO and DFXS cards.
‘F3_8_6_7’ to load images for the newest Modem card (rev D).
Reboot the terminal again.
TFTP full upgrade process
Run the TFTP upgrade process for 1+0 and MHSB terminals by typing ‘8_6_77_E0a’ in the Upgrade Version
field.
Run the TFTP upgrade process for HSD terminals by typing ‘8_6_77_E0h’ in the Upgrade Version field.
Reboot the terminal.
Page 41

Maintenance | 221
Aprisa XE User Manual
TFTP Upgrade Process
To upgrade a terminal using the TFTP:
1. Run the TFTP server.
2. Login to the Near end terminal / local terminal (see ‘IP Addressing of Terminals’ on page 53).
3. Run the TFTP upgrade process on the Remote terminal.
4. Reboot the Remote terminal.
5. Run the TFTP upgrade process on the Local terminal.
6. Reboot the Local terminal.
7. Clear the Java and web browser caches.
Step 1: Run the TFTP server
1. Double-click tftpd32.exe (located in the TFTPD directory) from the Aprisa CD supplied with the
product. Leave the TFTPD32 application running until the end of the upgrade process.
2. Click Settings and make sure that both SNTP server and DHCP server are not selected (no tick), and
click OK.
3. Click Browse and navigate to the root directory on the Aprisa CD (for example, D:\) supplied with the
product, then click OK.
4. Note down the IP address of the TFTP server (shown in the Server Interfaces drop-down list in the
TFTPD32 window) as you will need it later.
Page 42

222 | Maintenance
Aprisa XE User Manual
Step 2: Log into the Local terminal
Use SuperVisor to log into the Near end terminal (now the Local terminal) (see ‘IP Addressing of
Terminals’ on page 53) with either 'modify' or 'admin' privileges.
Step 3: Run the TFTP upgrade process on the Remote terminal
1. Select Remote > Maintenance > Upload > TFTP Upgrade.
2. Enter the IP address of the TFTP server.
3. Enter the version number of the software that you are upgrading to as a three digit number separated
by underscores, for example, 8_6_77_E0 for ETSI variants.
4. Click Apply and check the TFTP server for download activity.
The Upgrade Result changes from 'Executing' to either 'Succeeded' or 'Failed'.
Note: This may take several minutes when upgrading the remote terminal.
If the upgrade has failed:
The TFTP server IP address may be set incorrectly
The 'Current Directory' on the TFTP server was not pointing to the location of the upload config file
e.g. 'Rel_8_6_77_E0.cfg' .
There may not be enough free space in the image table to write the file. Inactive images can be
deleted (and the terminal rebooted) to free up space for the new image (see ‘Changing the Status
of an Image File’ on page 232).
Step 4: Reboot the Remote terminal
Reboot the remote terminal before proceeding with the next step of the upgrade process (see ‘Rebooting
the Terminal’ on page 233).
1. Select Remote > Maintenance > Reboot and select [Hard Reboot]
Communications to SuperVisor remote page will fail until the remote terminal reboot has completed.
Page 43

Maintenance | 223
Aprisa XE User Manual
2. Select Java
Step 5: Run the TFTP upgrade process on the Local terminal.
1. Select Local > Maintenance > Upload > TFTP Upgrade.
2. Enter the IP address of the TFTP server (that you noted earlier)
3. Enter the version number of the software (that you are upgrading to) for example, 8_6_77_E0.
4. Click Apply and check the TFTP server for download activity.
The Upgrade Result changes from 'Executing' to either 'Succeeded' or 'Failed'.
Note: This may take several minutes when upgrading the remote terminal.
Step 6: Reboot the Local terminal
Reboot the local terminal before proceeding with the next step of the upgrade process (see ‘Rebooting
the Terminal’ on page 233).
1. Select Local > Maintenance > Reboot and select [Hard Reboot]
2. Log back into the Local terminal when the reboot has completed.
Step 7: Clear the Java and web browser caches
After upgrading the terminal you should clear the Java and web browser caches. The files stored in them
may cause the SuperVisor and Cross Connections applications to display incorrectly.
To clear the Java cache (Windows XP, Java 1.6):
1. Select Start > Control Panel.
3. Click the General tab.
4. In the ‘Temporary Internet Files’, click Settings
5. Click on ‘Delete Files’ (‘Applications and Applets’ and ‘Trace and Log Files’ both ticked) and OK to
confirm.
Page 44

224 | Maintenance
Aprisa XE User Manual
To clear your web browser cache (Mozilla Firefox 1.x and above):
1. Select Tools > Options.
2. Select Privacy and then click Cache.
3. Click Clear to clear the cache, and then click OK to confirm.
Page 45

Maintenance | 225
Aprisa XE User Manual
To clear your web browser cache (Internet Explorer 7.0 and above):
1. Select Tools > Internet Options.
2. On the General tab
3. In Browsing history, click Delete
4. In the ‘Temporary Internet Files’, click Delete Files and Yes to confirm.
Page 46

226 | Maintenance
Aprisa XE User Manual
XE_(frequency bands)_synth.cfg
e.g. XE_300_400_synth.cfg
modem_(version number).cfg
e.g. modem_8_3_1.cfg (ETSI variants)
C-crossconnect_(version number).cfg
e.g. C-crossconnect_8_6_7.cfg
Uploading System Files
System files e.g. configuration files, kernel image files, software image files and firmware image files can
be uploaded manually.
Note: You should only upgrade components that need changing. It is not always necessary, for instance, to
replace kernel or software files when upgrading a single firmware file. If interdependency exists between
file types, this will be made clear in the documentation that accompanied the update package.
Configuration Files
Configuration files (.cfg) are compressed archives containing a script to instruct the terminal on how to
handle the other files in the archive.
Uploading of configuration files can only be performed to the Local Terminal (not via the link to the
Remote Terminal).
RF synthesizer configuration files
The RF synthesizer configuration archive contains files that provide values for the transmitter and receiver
synthesizers to operate across the supported frequency bands.
Synthesizer configuration filenames have the following format:
Modem configuration files
The Modem configuration archive contains files that provide values for the Modem to operate at the
various supported channel sizes and modulation types.
Modem configuration filenames have the following format:
Cross-connect configuration files
The Cross-connect configuration archive contains the Cross Connections application program that can be
launched from within SuperVisor.
Cross-connect configuration filenames have the following format:
Page 47

Maintenance | 227
Aprisa XE User Manual
To upload a configuration file:
1. Select Local > Maintenance > Config Files > Upload Configuration
2. Browse to the location of the file required to be uploaded into the terminal *.cfg.
3. Click on Upload.
The normal response is Succeeded if the file has been loaded correctly.
A response of ‘Failed’ could be caused by:
Not enough temporary space in the filesystem to uncompress the archive and execute the script
A file or directory expected by the script not being present on the filesystem
4. Reboot the terminal using a ‘Hard Reboot’ (see ‘Rebooting the Terminal’ on page 233).
Page 48

228 | Maintenance
Aprisa XE User Manual
Image Files
Image files (.img) are loaded into the terminal and either contains code that is executed by the system
processor, or contain instructions to configure the various programmable logic elements. The image file
types that can be uploaded are:
Kernel image files
Software image files
Firmware image files
Note: The Bootloader image file C-CC-B-(version number).srec and Flash File System image file C-CC-F(version number).img can only be changed in the factory.
Uploading of image files can only be performed to the local terminal (not via the link to the remote
terminal).
To upload and activate an image file:
1. Upload the required image file.
If the Upload Status page show ‘executing’, then ‘writing to flash’, then ‘Succeeded’, then the file has
been written into the image table correctly.
If the Upload Status is ‘Failed’, there may not be enough free space in the image table to write the
file. Inactive images can be deleted (and the terminal rebooted) to free up space for the new image
(see ‘Changing the Status of an Image File’ on page 232).
2. Set the status of the image to ‘activate’ (see ‘Changing the Status of an Image ’ on page 232).
This actually sets the status to ‘Selected’ until after a terminal reboot.
3. Reboot the terminal using a ‘Hard Reboot’ (see ‘Rebooting the Terminal’ on page 233).
This activates the selected image. The image table status will now show ‘Active’.
The previous image file status will now show as ‘Inactive’.
Page 49

Maintenance | 229
Aprisa XE User Manual
C-CC-K-(version number).img
e.g. C-CC-K-6_0_0.img
C-CC-R-(version number).img
e.g. C-CC-R-8_6_7.img
Kernel image files
Kernel image files contain code that forms the basis of the microprocessor’s operating system. There can
only ever be two kernel image files in the image table, the active and the inactive.
Kernel filenames have the following format:
To upload a kernel image file;
1. Select Local > Maintenance > Upload > Kernel
2. Browse to the location of the file required to be uploaded into the terminal *.img.
3. Click on Upload.
4. Activate the image (see ‘Changing the Status of an Image File’ on page 232).
5. Reboot the terminal using a ‘Hard Reboot’ (see ‘Rebooting the Terminal’ on page 233).
Software image files
Software image files contain code that forms the basis of the terminal’s application and management
software (including the Web-based GUI). There can only ever be two software image files in the image
table, the active and the inactive.
Software image filenames have the following format:
To upload a software image file;
1. Select Local > Maintenance > Upload > Software
2. Browse to the location of the file required to be uploaded into the terminal *.img.
3. Click on Upload.
Software image files may take one or two minutes to upload as they can be quite large (≈ 2 Mbytes). The
size of this file has caused some Microsoft Internet Explorer proxy server setups to abort during the
software update process. To avoid this problem, either set the proxy file size limit to 'unlimited' or avoid
the use of the proxy altogether.
4. Activate the image (see ‘Changing the Status of an Image File’ on page 232).
5. Reboot the terminal using a ‘Hard Reboot’ (see ‘Rebooting the Terminal’ on page 233).
Page 50

230 | Maintenance
Aprisa XE User Manual
C-fpga_ff-x-y-z.img
e.g. C-fpga_E5-0-7-3.img
Function Number
Function
E1
Motherboard 1
E2
Motherboard 2
E5
QJET Interface Card
E7
Q4EM Interface Card
E8
DFXO Interface Card
E9
DFXS Interface Card
EA
Modem
EB
QV24 Interface Card
EC
HSS Interface Card
ED
PSC (component of HSD system)
EE
PIC (component of HSD system)
FA
HSD modem
FB
QV24 Sync Interface Card
Firmware image files
Firmware image files contain instructions to configure the various programmable logic elements in the
terminal. There can only ever be two firmware image files for the same HSC version in the image table,
the active and the inactive.
Firmware image filenames have the following format:
where ff indicates the function (motherboard, interface card, etc).
where x indicates the HSC (hardware software compatibility) version.
where y indicates the firmware major revision number
where z indicates the firmware minor revision number
To upload a firmware image file;
1. Select Local > Maintenance > Upload > Firmware
2. Browse to the location of the file required to be uploaded into the terminal *.img.
3. Click on Upload.
4. Activate the image (see ‘Changing the Status of an Image File’ on page 232).
5. Reboot the terminal using a ‘Hard Reboot’ (see ‘Rebooting the Terminal’ on page 233).
Page 51

Maintenance | 231
Aprisa XE User Manual
Heading
Function
Index
A reference number for the image file
Type
The image type ‘Kernel’, ‘Software’ or ‘Firmware’.
Status
The status of the image; 'Active', 'Inactive', ‘Selected’, ‘Current (de-
selected)’
Image Size
The image file size in bytes
Version
The image file name and version details
Viewing the Image Table
To view the image table:
1. Select Link or Local or Remote > Maintenance > Image Table.
The image table shows the following information:
Note: Configuration file details do not appear in the image table.
Page 52

232 | Maintenance
Aprisa XE User Manual
Status
Function
Active
The image is currently being used by the system.
Inactive
The image is not currently being used by the system and could be
deleted.
Selected
The image is not currently being used by the system but has been
activated and will become active following a terminal reboot.
Current (deselected)
The image is currently being used by the system but as another image
has been selected, it will become inactive following a terminal reboot.
Changing the Status of an Image File
To change the status of an image:
1. Select Link or Local or Remote > Maintenance > Image Table.
2. Select the image you wish to change and click Edit.
3. On the Image Details, select the status from the Command drop-down list and click Apply.
Page 53

Maintenance | 233
Aprisa XE User Manual
Reboot Type
Function
None
Does nothing.
Soft Reboot
Reboots the software but does not affect customer traffic.
Hard Reboot
Reboots the entire terminal and affects customer traffic.
This reboot is similar cycling the power off and on.
Reboot Command
Function
None
Does nothing
Reboot Now
Execute the selected reboot now
Timed Reboot
Set the Reboot Time field to execute the selected reboot at a later date
and time.
This feature can be used to schedule the resulting traffic outage for a
time that has least customer impact.
Cancel Reboot
Cancel a timed reboot.
Rebooting the Terminal
The local or remote terminals can be rebooted by SuperVisor.
You can specify a ‘Soft Reboot’ which reboots the terminal without affecting traffic or a ‘Hard Reboot’
which reboots the terminal (similar to power cycling the terminal).
You can specify an immediate reboot or setup a reboot to occur at a predetermined time.
To reboot the terminal:
1. Select Link or Local or Remote > Maintenance > Reboot.
2. Select the Reboot Type field:
3. Select the Reboot Command field:
4. Click Apply to execute the reboot or Reset to restore the previous configuration.
Page 54

234 | Maintenance
Aprisa XE User Manual
Support Summary
The support summary page lists key information about the terminal, for example, serial numbers,
software version, frequencies and so on.
To view the support summary:
Select Link or Local or Remote > Maintenance > Support Summary.
Page 55

Maintenance | 235
Aprisa XE User Manual
Installing Interface Cards
CAUTION: You must power down the terminal before removing or installing interface cards.
Interface cards are initially installed in the factory to the customers’ requirements however, during the
life of the product, additional interface cards may need to be installed.
Unless the terminals are protected (see ‘Protected terminals’ on page 197), installing new interface cards
involves a substantial interruption of traffic across the link. Staff performing this task must have the
appropriate level of education and experience; it should not be attempted by inexperienced personnel.
To install an interface card:
1. Switch off the power to the terminal.
2. Prepare the terminal for new interface cards (see ‘Preparing the Terminal for New Interface Cards’ on
page 236).
3. Install the interface card (see ‘Installing an Interface Card’ on page 238).
4. Power up the terminal.
5. Configure the slot (see ‘Configuring a Slot’ on page 240).
A slot can be configured before installing a new interface card, or after the interface card is installed
and the terminal power cycled.
6. Configure the cross connections. (see ‘Configuring the traffic cross connections’ on page 158)
Page 56

236 | Maintenance
Aprisa XE User Manual
Preparing the Terminal for New Interface Cards
To prepare the terminal for a new interface card:
1. Remove the terminal from service by first switching off the terminal power. For an AC powered
terminal, remove the AC power connector. For a DC powered terminal, switch off the DC circuit
breaker or supply fuse.
2. Remove all other cables from the terminal, marking their locations first, if necessary, to aid later
restoration. The safety earth connection must be the last cable removed.
3. Ensure you have unobstructed access to the top and front of the terminal. Remove the terminal from
the equipment rack, if required.
4. Remove the top cover of the terminal by removing two socket screws from the rear.
Note: The top cover slides back towards the rear of the chassis.
5. Remove the front fascia by removing the four front panel socket screws.
Note: The front fascia first hinges out to clear the antenna connector and earth stud, and is then
removed by unclipping from the chassis and sliding downwards. See illustration below.
Page 57

Maintenance | 237
Aprisa XE User Manual
6. Remove the card securing screw from the required interface slot.
7. There are two types of interface slot blanking plates, the seven tab break off and the single slot type
(newer type).
If the blanking plate is the seven tab break off, remove the slot blanking tab by folding the tab to and
fro until it breaks off.
If the blanking plate is the single slot type, unclip the blanking plate from behind the slot (assuming
that the card securing screw has already been removed).
Page 58

238 | Maintenance
Aprisa XE User Manual
Installing an Interface Card
To install an interface card:
1. Remove the interface card from its packaging and static-safe bag.
CAUTION: To avoid static damage to the terminal or the interface card being installed, use a static
discharge wristband or similar antistatic device.
2. Offer the interface card into the chassis at an angle until the front panel of the card engages in the
chassis.
3. Rotate the card in the chassis until it is level, and both parts of the card interface bus connector
engage with the socket. Push down evenly on the interface card to seat it into the socket.
Page 59

Maintenance | 239
Aprisa XE User Manual
4. Replace the card securing screw.
Note: Some interface cards may not have the bracket to accept the card securing screw.
5. Replace the fascia and top covers, restore all cables, and power up the terminal.
Page 60

240 | Maintenance
Aprisa XE User Manual
Configuring a Slot
1. Select Link or Local or Remote > Interface > Slot Summary.
2. Select the required slot and click Configure Slot.
'Slot' shows the slot the interface card is plugged into in the terminal (A – H).
Details of the interface card currently installed in the slot are:
'HSC’ (hardware software compatibility) A number used by the system software to determine
which FPGA ‘firmware image file’ to use in the interface card installed.
'H/W Rev’ (hardware revision).
‘Installed’ field shows the actual interface card installed in the slot. If there is no interface card
installed in the slot, this field will show ‘none’.
‘Expected’ shows interface card type that had been previously installed. Interface cards can be setup
before they are installed in the terminal or after they are installed in the terminal.
3. To setup a new interface card in a slot, select the interface card type you want to fit (or has been
fitted) from the ‘Expected’ drop-down menu.
Note: The transmitter, receiver and modem are configured in other sections (see ‘Configuring the
terminal’ on page 69).
4. Click Apply to apply changes or Reset to restore the previous configuration.
Page 61

Troubleshooting | 241
Aprisa XE User Manual
14. Troubleshooting
Loopbacks
Loopbacks are used as a tool for testing or as part of the commissioning process and will affect customer
traffic across the link.
The terminal supports three types of loopbacks:
RF radio loopback
Interface loopbacks, set at the interface ports
Timeslot loopbacks
RF Radio Loopback
The RF radio loopback provides a loopback connection between the radio TX and radio RX. Each terminal
is looped back independently.
All traffic entering the transmit stage of the transceiver is transmitted on the RF link but is also looped
back to the receiver section of the transceiver. This loopback will affect all traffic through the terminal.
When the RF loopback is activated, both the radio RX and TX LEDs will flash.
An RF loopback will automatically deactivate after the period set (in seconds) in the RF Loopback Timeout
field. The default entry is 3600 seconds (60 minutes).
When an RF loopback is activated, the ethernet path is disabled to prevent ethernet loopbacks.
An RF loopback is deactivated if the terminal is rebooted.
To activate or deactivate the RF loopback:
Select Link or Local or Remote > Maintenance > Loopbacks.
To activate the RF loopback, tick the RF Loopback checkbox. Untick the checkbox to deactivate it.
Click Apply to apply changes or Reset to restore the previous configuration.
Page 62

242 | Troubleshooting
Aprisa XE User Manual
Loopback type
Description
QJET
(whole tributary)
The QJET interface port has both Line Facing and Radio Facing loopbacks (see
‘QJET Port Settings’ on page 102).
The interface card green LED flashes while the loopback is active.
QJET
(individual timeslot)
The Cross Connections application can loopback framed E1 / T1 timeslots (see
‘Timeslot Loopbacks’ on page 243).
Q4EM port
The Q4EM interface port has both Line Facing and Radio Facing loopbacks (see
‘Q4EM Port Settings’ on page 104).
The interface card yellow LED flashes while the loopback is active.
DFXO port
The DFXO interface Line Facing loopback loops back the port data to the
customer. This loopback is performed on the digital path of the codec.
The interface card yellow LED flashes while the loopback is active.
DFXS port
The DFXS interface Line Facing loopback loops back the port data to the
customer. This loopback is performed on the digital path of the codec.
The interface card yellow LED flashes while the loopback is active.
HSS port
The HSS interface Line Facing loopback loops back the port data to the
customer.
The interface card top green LED flashes while the loopback is active.
QV24 port
The QV24 interface Line Facing loopback will loop back the port data to the
customer.
Ethernet
No loopback possible.
Interface Loopbacks
The interface loopback provides a loopback connection for the customer-connected equipment.
These loopbacks are applied on a port-by-port basis and can only be enabled on active ports i.e. the port
has to be activated by assigning traffic to it by the Cross Connections application.
These are two types of interface loopbacks:
Line Facing – port traffic from the customer is transmitted over the RF link but is also looped back to the
customer
Radio Facing – traffic received from the RF link is passed to the customer port but is also looped back to
be transmitted over the RF link.
Page 63

Troubleshooting | 243
Aprisa XE User Manual
Timeslot Loopbacks
You can loopback framed E1 / T1 timeslots in the Cross Connections application.
1. Open the Cross Connections application.
2. Right-click the timeslot you want to loop back.
3. Select Timeslot Loopback - the looped timeslot will display in black:
Page 64

244 | Troubleshooting
Aprisa XE User Manual
Alarms
The LEDs (OK, RX, and TX) on the front panel illuminate either amber or red when there is a fault
condition:
Amber indicates a minor alarm that should not affect traffic across the link.
Red indicates a major alarm condition that could affect traffic across the link.
A major or minor alarm can be mapped to the external alarm outputs (see ‘Configuring the External Alarm
Outputs’ on page 83).
Diagnosing Alarms
To view the Alarm Summary and their current states:
Select Link or Local or Remote > Alarms > Summary.
Page 65

Troubleshooting | 245
Aprisa XE User Manual
Alarm
Explanation
Synthesizer Status
The selected transmit frequency is outside the tuning range of the
transmitter synthesizer
Modem Lock
The terminal modem is not synchronized with the modem at the other end
of the link
TX Temp Shutdown
The transmitter power amplifier temperature is greater than 75°C. The
transmitter has shut down to prevent damage.
TX Temp Warning
The transmitter power amplifier temperature is greater than 70°C. The
transmitter will continue to operate in this condition, but if the power
amplifier temperature increases above 75°C, a major alarm condition is
set and the transmitter will shut down to prevent further damage.
TX AGC Voltage
The transmitter power amplifier automatic gain control is out of limits for
normal operation
TX Reverse Power
There is excessive reflected power at the transmitter port of the terminal,
indicating a low return loss in the path between transmitter port and the
antenna.
TX Return Loss
Status
Indicates the difference between the transmitted power and the amount
of power being reflected back into the terminal. The alarm will trigger
when there is too much reflected power from the antenna that will
degrade link performance.
RX RSSI
The RX RSSI alarm threshold is determined by the RSSI Thresholds for each
of the modulation types (see ‘Setting the RSSI Alarm Threshold’ on page
80)
Fan 1
The internal cooling fan 1 is not operating
Fan 2
The internal cooling fan 2 is not operating
External Input 1 -2
Indicates an active alarm state on the the external alarm input
Alarm Output 1 - 4
Indicates an active alarm state on the the external alarm output
MHSB Switch
Indicates that the MHSB has switched over. The MHSB alarm is only shown
if MHSB mode is enabled (see ‘Configuring the Terminals for MHSB’ on
page 188).
To view detailed alarm information:
Select Link or Local or Remote > Alarms > Alarm Table
The Alarm Table shows the source of the alarm and the type, the slot (and port, if applicable) where the
alarm originated, the severity and the date and time the alarm occurred.
To further diagnose the cause of the alarm (see ‘Identifying Causes of Alarms’ on page 250, and ‘Alarm
Types’ on page 275).
Page 66

246 | Troubleshooting
Aprisa XE User Manual
Field
Explanation
Source
The component within the terminal that generated the alarm
Type
The type of alarm (see ‘Alarm types and sources’ on page 275)
Slot
The slot where the alarm originated, if applicable
Port
The port where the alarm originated, if applicable
Severity
Whether the alarm was a major or minor alarm
Status
Whether the alarm is active or cleared
Time
The date and time when the alarm occurred
Viewing the Alarm History
The alarm history page shows the historical alarm activity for up to 50 alarms. This page refreshes every
30 seconds.
The alarm history for up to 100 alarms can be seen using SNMP (see ‘Configuring SNMP’ on page 85).
To view the alarm history:
Select Link or Local or Remote > Alarms > Alarm History.
To clear the alarm history:
Select Local or Remote > Alarms > Clear History
This function clears all the alarm history including the 600 alarm rolling buffer (see ‘Saving the Alarm
History’ on page 247).
Page 67

Troubleshooting | 247
Aprisa XE User Manual
Source Type Slot Port Severity Status Time
SNR
(dB)
RSSI
(dBm)
Modem mdLOS Aux - Major Active Tue Jan 22 12:45:54 2008 0 0
Modem mdTdmAlignmentLost Aux - Major Active Tue Jan 22 12:45:54 2008 0 0
Modem mdDemodAlignmentLost Aux - Major Active Tue Jan 22 12:45:54 2008 0 0
QV24 v24CtrlLineLoss G 1 Major Active Tue Jan 22 12:45:55 2008 0 0
QV24 v24CtrlLineLoss G 2 Major Active Tue Jan 22 12:45:55 2008 0 0
QV24 v24CtrlLineLoss G 3 Major Active Tue Jan 22 12:45:55 2008 0 0
System mdClkSyncFail ---- - Major Active Tue Jan 22 12:45:57 2008 0 0
Modem mdLOS Aux - Major Cleared Tue Jan 22 12:45:57 2008 0 0
Modem mdTdmAlignmentLost Aux - Major Cleared Tue Jan 22 12:45:57 2008 0 0
Modem mdDemodAlignmentLost Aux - Major Cleared Tue Jan 22 12:45:57 2008 0 0
Transmitter txADCChZeroLo Transmitter - Minor Active Tue Jan 22 12:45:57 2008 0 0
Transmitter txADCChZeroLo Transmitter - Minor Cleared Tue Jan 22 12:45:58 2008 0 0
System mdClkSyncFail ---- - Major Cleared Tue Jan 22 12:45:58 2008 0 0
QV24 v24CtrlLineLoss G 1 Major Cleared Tue Jan 22 12:45:59 2008 35.28 0
QV24 v24CtrlLineLoss G 2 Major Cleared Tue Jan 22 12:45:59 2008 35.29 0
QV24 v24CtrlLineLoss G 3 Major Cleared Tue Jan 22 12:45:59 2008 35.26 0
HSS hssLoss H 1 Minor Active Tue Jan 22 13:51:17 2008 35.28 -52.8
HSS hssLoss H 1 Minor Cleared Tue Jan 22 13:51:17 2008 35.27 -52.8
QJET LOS D 1 Minor Active Tue Jan 22 13:51:35 2008 35.29 -52.8
Saving the Alarm History
The last 1500 alarms are stored in a rolling buffer which can be saved as a *.csv file.
To save the alarm history:
Select Local > Alarms > Save History
A File Download dialog box opens.
Click on Save to save the *.csv file to a folder or click on Open to open the file in the SuperVisor page.
Example of file:
Note: Windows security settings can prevent the download of files. In this case, click on the windows
security message and select the SuperVisor menu option again (Alarms > Save History).
To save the alarm history from the Remote terminal, login to the Remote terminal and Select Local >
Alarms > Save History.
Page 68

248 | Troubleshooting
Aprisa XE User Manual
Viewing Interface Alarms
To view the alarms for a particular interface:
1. Select Link or Local or Remote > Interface > Interface Summary.
2. Select the desired interface card slot from the Interface Summary and click Alarms.
This opens a page as shown below with a summary of the alarms on the interface card:
The following fields are displayed:
Source: The type of interface card that generated the alarm
Type: The type of interface alarm
Slot: The slot of the interface card that generated the interface alarm
Port: The port that generated the interface alarm
Severity: Whether the interface alarm was major or minor
3. Return to the Interface Summary page by either selecting Options > Interface Summary or clicking
Back in the browser window.
Page 69

Troubleshooting | 249
Aprisa XE User Manual
Clearing Alarms
Select Link or Local or Remote > Alarms > Clear Alarms
MHSB Command
If a MHSB switchover event occurs, the OK LED on the front panel changes to amber.
To clear the MHSB switchover alarm:
Select ‘Clear Switched Alarm’ from the MHSB Command drop-down list and click on Apply.
Image Table Alarm
An image table alarm occurs if a problem occurred during the boot process which may have left the image
table in an inconsistent state.
To clear the image table alarm:
The default image table alarm: this indicates that the image table has been rebuilt from defaults. This
can indicate that an incorrect build of software is running on the terminal.
Select ‘Clear the Default Image Table used alarm’ from the Image Table drop-down list and click on Apply.
In addition to clearing the image table alarm, you should verify that the active images in the image table
are correct for the software release.
Upload Alarm
An Upload Alarm occurs if the TFTP Upgrade process fails. This can indicate that the upgrade process
cannot find the TFTP server or cannot find the software version number entered.
To clear the upload alarm alarm:
Select ‘Clear the Upload Failure Alarm’ from the Upload Alarm drop-down list and click on Apply.
Page 70

250 | Troubleshooting
Aprisa XE User Manual
LED
Colour
Possible causes
OK
Amber
A minor system alarm is set
Red
A major system alarm is set
RX
Amber
Low RSSI or AGC limits have been exceeded
Red
Receiver power supply or synthesizer failure
TX
Amber
AGC, transmitter temperature, forward power or reverse power limits
have been exceeded
Red
Transmit power supply or synthesizer failure
OK LED
Colour
Alarm condition
Suggested action
Amber
Fan failure
Check that the fans are not blocked and can spin freely.
Amber
Interface card
mismatch
Using SuperVisor, check that the expected interface card and the
fitted interface card are the same.
Red
Modem lock
A modem lock alarm is generally seen when other conditions such
as low RSSI are present. If there are no other alarms indicated,
check the following:
The terminal clocking is set up correctly.
Both terminals are using the same modulation.
Both terminals are using the same version of software.
External RF Interference from equipment operating in adjacent
channels.
Check the constellation pattern for evidence of disturbances in
the RF path.
Compare RSSI with the expected values from the original path
engineering calculation. Investigate any large differences.
If the fault persists, contact your local representative.
Red
Interface alarms
Check that the E1 or Ethernet interface cables are fitted
correctly and the equipment they are connected to is functioning
correctly.
Identifying Causes of Alarms
The following are possible causes of an alarm.
Page 71

Troubleshooting | 251
Aprisa XE User Manual
RX LED
Colour
Alarm condition
Suggested action
Amber
Low RSSI
Check that all antenna and feeder cables are firmly connected
and not damaged or kinked
Check there is no damage to the antenna
Check the TX power and alarm status of the remote terminal
Amber
Receiver AGC
Contact your local 4RF representative
Red
Receiver power
supply
Contact your local 4RF representative
TX LED
Colour
Alarm condition
Suggested action
Amber
Reverse power
Check that all antenna and feeder cables are firmly connected
and not damaged or kinked
Check there is no damage to the antenna
Check that the Receiver and Transmitter ports are correctly
connected to the High and Low ports of the duplexer
Red
Transmitter
temperature
Check operation of cooling fan or fans
Ensure the air grills on the sides of the terminal are clear
Ensure the ambient air temperature around the equipment is
less than 50˚C
Page 72

252 | Troubleshooting
Aprisa XE User Manual
E1 / T1 Alarm Conditions
The QJET interface yellow LED indicates:
Loss of signal (LOS)
A loss of signal alarm occurs when there is no valid G.703 signal at the E1 / T1 interface RX input from
the downstream system.
This alarm masks the LOF and AIS received alarms.
Loss Of Frame alignment (LOF)
A loss of frame alignment alarm occurs when the E1 / T1 interface RX input receives a valid G.703
signal (code and frequency) but does not receive a valid G.704 signal i.e. no frame alignment word,
from the downstream system (in framed E1 / T1 modes only) (red alarm in framed T1 modes).
This alarm masks the AIS received alarm.
Alarm Indication Signal (AIS)
An AIS received alarm occurs when AIS is received from the downstream system.
An E1 / T1 interface will output AIS to the downstream system if the normal upstream traffic signal is
not available e.g. loss of modem synchronization, loss of RF signal across the link (blue alarm in
framed T1 modes).
Remote Alarm Indicator (RAI)
A remote alarm indicator occurs when RAI is received from the downstream system when it has an
active LOS or LOF alarm (TS0 NFAS bit 3 in framed E1 modes and yellow alarm in framed T1 modes).
TS16 Loss of signal (TS16LOS)
A TS16 loss of signal alarm occurs when there is no valid TS16 signal at the E1 interface RX input from
the downstream system (in E1 PCM 30 modes only).
TS16 Remote Multi-frame Alarm Indicator (RMAI)
A remote multiframe alarm indicator occurs when RMAI is received from the downstream system when
it has an active TS16LOS alarm (TS16 F0 bit 6 in E1 PCM 30 modes only).
TS16 Alarm Indication Signal (TS16AIS)
A TS16 Alarm Indication Signal alarm occurs when AIS is received from the downstream system in TS16.
An E1 interface will output the TS16 AIS signal to the downstream system if the normal TS16 multiframe signal is not available (in E1 PCM 30 modes only).
The QJET interface green LED indicates:
The QJET interface green LED flashes when the E1 / T1 port loopback is active.
Page 73

Troubleshooting | 253
Aprisa XE User Manual
System Log
SuperVisor automatically keeps a log, known as 'syslog', which captures all alarms, errors and events for
each terminal.
You can specify that the ‘syslog’ is saved to a particular file (see ‘Setting up for Remote Logging’ on page
255). You can then email this file to customer service, if requested, to enable them to fault-find more
accurately.
Checking the Syslog
To view the Syslog:
1. Select Local > Performance > Logging > Syslog.
This opens a new window:
Page 74

254 | Troubleshooting
Aprisa XE User Manual
2. The system log is quite hard to decipher in Internet Explorer. If you're using Internet Explorer, select
View > Source, which opens the file in a more legible layout in Notepad. Save or print this file, as
required.
3. If you want to save the system log, you can save it from within Notepad (or Internet Explorer). Select
File > Save As. Navigate to where you want to save the file. Enter a meaningful filename and select
'Text File' from the Save As Type drop-down list. Click Save.
You can specify that this file is automatically saved to a computer (see ‘Setting up for Remote Logging’ on
page 255).
Page 75

Troubleshooting | 255
Aprisa XE User Manual
Setting up for Remote Logging
Note: When setting up to save the system log to a specific computer, be aware that the file is constantly
updated and may get quite large quite quickly.
To set up a terminal for remote logging:
1. Copy the TFTP server application (tftpd32.exe, which is located in the TFTPD directory) from the
terminal product CD into a suitable directory on the PC (for example, C:\Program Files\TFTP Server).
2. Create another directory where you want the system logs to be saved for example;
C:\Aprisa XE Syslog
3. Double-click tftpd32.exe.
4. Click Settings and make sure that both ‘Syslog Server’ and ‘Save syslog message’ boxes are ticked.
5. Click Browse and select a directory where you want the Syslog file to be saved (created in step 2).
6. Click OK to close the Settings dialog box.
Page 76

256 | Troubleshooting
Aprisa XE User Manual
7. In SuperVisor, select Link or Link or Local or Remote > Terminal > Advanced.
8. In the Remote Syslog Address field, enter the IP address of the PC on which the Syslog server is
running.
9. In the Remote Syslog Port field, enter 514.
10. Reboot the terminal (Link or Local or Remote > Maintenance > Reboot).
11. Open the directory where the system logs are being saved to. You should see a file called syslog.txt.
Page 77

Interface Connections | 257
Aprisa XE User Manual
15. Interface Connections
RJ-45 Connector Pin Assignments
RJ-45 pin numbering
Interface Traffic Direction
All interface traffic directions and labels used in this manual refer to the direction relative to the
terminal. Refer to the diagram below.
The traffic direction describes the transmit / receive paths and the direction of handshaking and clocking
signals, depending on the interface.
Page 78

258 | Interface Connections
Aprisa XE User Manual
Pin
number
Pin function
Direction
TIA-568A wire colour
1
Transmit
Output
Green/white
2
Transmit
Output
Green
3
Not used
Orange/white
4
Receive
Input
Blue
5
Receive
Input
Blue/white
6
Not used
Orange
7
Not used
Brown/white
8
Not used
Brown
RJ-45 connector LED indicators
LED
Status
Explanation
Green
On
Normal operation
Yellow
On
Loss of signal (LOS) or
Alarm Indication Signal (AIS) or
Loss Of Frame alignment (LOF) in Framed
modes
Green
Flashing
Port in loopback
QJET Interface Connections
The standard QJET interface is 120 ohm balanced.
External Balun transformers can be used to provide a 75 ohm unbalanced interface.
Page 79

Interface Connections | 259
Aprisa XE User Manual
Pin
number
Pin function
Direction
TIA-568A wire
colour
1
Transmit
Output
Green/white
2
Transmit
Output
Green
3
Receive
Input
Orange/white
4
Not used
Blue
5
Not used
Blue/white
6
Receive
Input
Orange
7
Not used
Brown/white
8
Not used
Brown
RJ-45 connector LED indicators
LED
Status
Explanation
Green
On
Ethernet signal received
Green
Flashing
Indicates data traffic present on the interface
Ethernet Interface Connections
Note: Do not connect Power over Ethernet (PoE) connections to the Aprisa XE Ethernet ports as this will
damage the port.
Page 80

260 | Interface Connections
Aprisa XE User Manual
Pin
number
Pin function
Direction
TIA-568A wire
colour
1 M Input
Green/white
2
M1
Input
Green
3
Receive (Ra/R)
Input
Orange/white
4
Transmit (Tb/R1)
Output
Blue
5
Transmit (Ta/T1)
Output
Blue/white
6
Receive (Rb/T)
Input
Orange
7 E Output
Brown/white
8
E1
Output
Brown
RJ-45 connector LED indicators
LED
Status
Explanation
Green
Off
No external source applied to M wire (no M
wire current flowing)
Green
On
External source applied to M wire (M wire
current flowing)
Green
Flashing
The interface loopback is active
Yellow
Off
E wire relay contact open (no current in
external device)
Yellow
On
E wire relay contact closed (current flowing
in external device)
Q4EM Interface Connections
Page 81

Interface Connections | 261
Aprisa XE User Manual
E&M Signalling Types
The Q4EM E&M signalling leads are optically isolated, bi-directional lines which can be externally
referenced to meet any of the EIA-464 connection types I, II,IV or V (as shown below).
The M1 lead associated with the M wire detector can be externally referenced to earth or battery as
required.
The E1 lead associated with the E wire output can be externally referenced to earth or battery as
required.
Page 82

262 | Interface Connections
Aprisa XE User Manual
Page 83

Interface Connections | 263
Aprisa XE User Manual
The subscriber interface connects the terminal to the customer's 2 wire
telephone via a 2 wire line.
Each 2 wire channel has two access points: one connects to a customer; the
other is a local test port.
CAUTION:
If there is a power failure at either terminal, any telephone
connected at the DFXS will not operate.
Please ensure that a separate telephone that is not
dependent on local power is available for use in an
emergency.
RJ-45
Pin number
Pin function
Direction
TIA-568A wire
colour
1
Not used
Green/white
2
Not used
Green
3
Not used
Orange/white
4
Ring
Bi-directional
Blue
5
Tip
Bi-directional
Blue/white
6
Not used
Orange
7
Not used
Brown/white
8
Not used
Brown
RJ-45 connector LED indicators
LED
Status
Explanation
Green
Off
Interface operational but not in service
Green
On
Normal operation
Green
Flashing
Cadenced ringing on line
Yellow
Off
No interface alarm
Yellow
On
Interface alarm
Yellow
Flashing
The interface loopback is active
Both LEDs
Flashing
Loss of CAS signals
DFXS Interface Connections
Page 84

264 | Interface Connections
Aprisa XE User Manual
The DFXO interface connects the terminal to the telephone network via a 2
wire line.
Each DFXO channel has two access points: one connects to a customer; the
other is a local test port.
RJ-45
Pin number
Pin function
Direction
TIA-568A wire
colour
1
Not used
Green/white
2
Not used
Green
3
Not used
Orange/white
4
Ring
Bi-directional
Blue
5
Tip
Bi-directional
Blue/white
6
Not used
Orange
7
Not used
Brown/white
8
Not used
Brown
RJ-45 connector LED indicators
LED
Status
Explanation
Green
Off
Interface operational but not in service
Green
On
Normal operation
Green
Flashing
Cadenced ringing on line
Yellow
Off
No interface alarm
Yellow
On
Interface alarm
Yellow
Flashing
The interface loopback is active
Both LEDs
Flashing
Loss of CAS signals
DFXO Interface Connections
Page 85

Interface Connections | 265
Aprisa XE User Manual
The connector on the high-speed synchronous serial interface is a high density
LFH-60 (as used on standard Cisco WAN port serial interface cables and
equivalents).
The interface specification (X.21 / V.35 etc) is automatically changed by simply
changing the type of interface cable connected to the HSS.
LED indicators
LED
Status
Explanation
Top green LED
On
Normal operation
Top green LED
Flashing
Loopback in place
Lower green LED
On
Normal operation
HSS Interface Connections
Page 86

266 | Interface Connections
Aprisa XE User Manual
Pin number
Pin function
Direction
1
Shield Ground
- 4 22
SD+
SD-
Input
Input
5
23
ST+
ST-
Output
Output
6
24
RD+
RD-
Output
Output
7
25
RS+
RS-
Input
Input
8
26
RT+
RT-
Output
Output
9
27
CS+
CS-
Output
Output
10
37
LL
SC
Input
_
11
29
DM+
DM-
Output
Output
12
30
TR+
TR-
Input
Input
13
31
RR+
RR-
Output
Output
17
35
TT+
TT-
Input
Input
19
20
SG
RC - -
Synchronous cable assemblies
RS-449 Serial Cable Assembly for DCE (Part number: Cab Sync 449FC)
Page 87

Interface Connections | 267
Aprisa XE User Manual
Pin number
Pin function
Direction
1
Shield Ground
_
4
22
SD+
SD-
Output
Output
5
23
ST+
ST-
Input
Input
6
24
RD+
RD-
Input
Input
7
25
RS+
RS-
Output
Output
8
26
RT+
RT-
Input
Input
9
27
CS+
CS-
Input
Input
10
37
LL
SC
Output
_
11
29
DM+
DM-
Input
Input
12
30
TR+
TR-
Output
Output
13
31
RR+
RR-
Input
Input
17
35
TT+
TT-
Output
Output
19
20
SG
RC - -
RS-449 Serial Cable Assembly for DTE (Part number: Cab Sync 449MT)
Page 88

268 | Interface Connections
Aprisa XE User Manual
Pin number
Pin function
Direction
A
Frame Ground
B
Circuit Ground
C
RTS
Input
D
CTS
Output
E
DSR
Output
F
RLSD
Output
H
DTR
Input
K
LT
Input
P S SD+
SD-
Input
Input
R T RD+
RD-
Output
Output
U W SCTE+
SCTE-
Input
Input
V X SCR+
SCR-
Output
Output
Y
AA
SCT+
SCT-
Output
Output
Pin number
Pin function
Direction
A
Frame Ground
B
Circuit Ground
C
RTS
Output
D
CTS
Input
E
DSR
Input
F
RLSD
Input
H
DTR
Output
K
LT
Output
P S SD+
SD-
Output
Output
R T RD+
RD-
Input
Input
U W SCTE+
SCTE-
Output
Output
V X SCR+
SCR-
Input
Input
Y
AA
SCT+
SCT-
Input
Input
V.35 Serial Cable Assembly for DCE (Part number: Cab Sync V35FC)
V.35 Serial Cable Assembly for DTE (Part number: Cab Sync V35MT)
Page 89

Interface Connections | 269
Aprisa XE User Manual
Pin number
Pin function
Direction
1
Shield Ground
-
2 9 Transmit+
Transmit-
Input
Input
3
10
Control+
Control-
Input
Input
4
11
Receive+
Receive-
Output
Output
5
12
Indication+
Indication-
Output
Output
6
13
Timing+
Timing-
Output
Output
8
Circuit Ground
Pin number
Pin function
Direction
1
Shield Ground
- 2 9
Transmit+
Transmit-
Output
Output
3
10
Control+
Control-
Output
Output
4
11
Receive+
Receive-
Input
Input
5
12
Indication+
Indication-
Input
Input
6
13
Timing+
Timing-
Input
Input
8
Circuit Ground
X.21 Serial Cable Assembly for DCE (Part number: Cab Sync X21FC)
X.21 Serial Cable Assembly for DTE (Part number: Cab Sync X21MT)
Page 90

270 | Interface Connections
Aprisa XE User Manual
Pin number
Pin function
Direction
2
14
BA(A), TXD+
BA(B), TXD-
Input
Input
3
16
BB(A), RXD+
BB(B), RXD-
Output
Output
4
19
CA(A), RTS+
CA(B), RTS-
Input
Input
5
13
CB(A), CTS+
CB(B), CTS-
Output
Output
6
22
CC(A), DSR+
CC(B), DSR-
Output
Output
1 - Shield
-
8
10
CF(A), DCD+
CF(B), DCD-
Output
Output
15
12
DB(A), TXC+
DB(B), TXC-
Output
Output
17 9 DD(A), RXC+
DD(B), RXC-
Output
Output
18 7 LL
Circuit Ground
Input
-
20
23
CD(A), DTR+
CD(B), DTR-
Input
Input
24
11
DA(A), TXCE+
DA(B), TXCE-
Input
Input
25
TM, not used
Output
RS-530 Serial Cable Assembly for DCE (Part number: Cab Sync 530FC)
Page 91

Interface Connections | 271
Aprisa XE User Manual
Pin number
Pin function
Direction
2
14
BA(A), TXD+
BA(B), TXD-
Output
Output
3
16
BB(A), RXD+
BB(B), RXD-
Input
Input
4
19
CA(A), RTS+
CA(B), RTS-
Output
Output
5
13
CB(A), CTS+
CB(B), CTS-
Input
Input
6
22
CC(A), DSR+
CC(B), DSR-
Input
Input
1 - Shield
-
8
10
CF(A), DCD+
CF(B), DCD-
Input
Input
15
12
DB(A), TXC+
DB(B), TXC-
Input
Input
17 9 DD(A), RXC+
DD(B), RXC-
Input
Input
18 7 LL
Circuit Ground
Output
-
20
23
CD(A), DTR+
CD(B), DTR-
Output
Output
24
11
DA(A), TXCE+
DA(B), TXCE-
Output
Output
25
TM, not used
Output
RS-530 Serial Cable Assembly for DTE (Part number: Cab Sync 530MT)
Page 92

272 | Interface Connections
Aprisa XE User Manual
Cisco LFH-60
cable name
WAN connector
Connector gender
Label on WAN end
449FC
DB-37
female
'to DTE'
449MT
DB-37
male
'to DCE'
V35FC
M34
female
'to DTE'
V35MT
M34
male
'to DCE'
X21FC
DB-15
female
'to DTE'
X21MT
DB-15
male
'to DCE'
530FC
DB-25
female
'to DTE'
530MT
DB-25
male
'to DCE'
Cable WAN Connectors
Page 93

Interface Connections | 273
Aprisa XE User Manual
RJ45
Pin number
Pin function
Direction
TIA-568A wire
colour
1
RTS
Input
Green / white
2
DTR
Input
Green
3
TXD
Input
Orange / white
4
Ground
Blue
5
Ground
Blue / white
6
RXD
Output
Orange
7
DSR
Output
Brown / white
8
CTS
Output
Brown
RJ-45 connector LED indicators
LED
Status
Explanation
Green
On / flashing
Transmit data
Yellow
On / flashing
Receive data
RJ45
Pin number
Pin function
Direction
TIA-568A wire
colour
1
RTS
Input
Green / white
2
XTXC
Input
Green
3
TXD
Input
Orange / white
4
Ground
Blue
5
Ground
Blue / white
6
RXD
Output
Orange
7
RXC
Output
Brown / white
8
CTS
Output
Brown
RJ-45 connector LED indicators
LED
Status
Explanation
Green
On / flashing
Transmit data
Yellow
On / flashing
Receive data
QV24 Interface connections
The QV24 is always configured as a DCE:
QV24S Interface connections
The QV24S is always configured as a DCE:
Page 94

Page 95

Alarm Types and Sources | 275
Aprisa XE User Manual
Type
Explanation
tx11VFail
The transmitter 11 VDC power supply has failed
tx28VFail
The transmitter 28 VDC power supply has failed
tx5VFail
The transmitter 5 VDC power supply has failed
txAmplifierBalance
One side of the transmitter amplifier has failed
txEEFail
The transmitter on-board memory has failed
txMibFail
The transmitter MIB is corrupt in EEPROM
txReturnLoss
The transmitter return loss is high
txSynthLD
The transmitter synthesizer frequency is not set
txTSensorFail
The transmitter temperature sensor has failed
txADCChZeroLo
The transmitter AGC voltage is low
txADCChZeroHi
The transmitter AGC voltage is high
txADCChOneLo
The transmitter Forward Power Monitor reading is low
txADCChOneHi
The transmitter Forward Power Monitor reading is high
txADCChTwoLo
The transmitter Reverse Power Monitor reading is low
txADCChTwoHi
The transmitter Reverse Power Monitor reading is high
txADCChThreeHi
The transmitter temperature is greater than 75°C and the
transmitter has shut down
txADCChFourLo
The transmitter synthesizer tuning voltage is low
txADCChFourHi
The transmitter synthesizer tuning voltage is high
txADCChFiveLo
The transmitter 28 VDC power supply voltage is low
txADCChFiveHi
The transmitter 28 VDC power supply voltage is high
txADCChSixLo
The transmitter 11 VDC power supply voltage is low
txADCChSixHi
The transmitter 11 VDC power supply voltage is high
txADCChSevenLo
The transmitter digital 5 VDC power supply voltage is low
txADCChSevenHi
The transmitter digital 5 VDC power supply voltage is high
txADCChEightLo
The transmitter reference 7 VDC power supply voltage is low
txADCChEightHi
The transmitter reference 7 VDC power supply voltage is high
txADCChNineLo
The transmitter VCO voltage is low
txADCChNineHi
The transmitter VCO voltage is high
txADCChElevenHi
The transmitter temperature is greater than 70°C.
16. Alarm Types and Sources
Alarm Types
Transmitter Alarms
Transmitter Alarms for all Frequency Bands
Transmitter Alarms for 300, 400, 600, 700, 800, 900, 1400 MHz Frequency Bands
Page 96

276 | Alarm Types and Sources
Aprisa XE User Manual
txADCChZeroLo
The transmitter AGC voltage is low
txADCChZeroHi
The transmitter AGC voltage is high
txADCChOneLo
The transmitter Forward Power Monitor reading is low
txADCChOneHi
The transmitter Forward Power Monitor reading is high
txADCChTwoLo
The transmitter Reverse Power Monitor reading is low
txADCChTwoHi
The transmitter Reverse Power Monitor reading is high
txADCChThreeHi
The transmitter temperature is greater than 75°C and the
transmitter has shut down
txADCChFourLo
The transmitter synthesizer tuning voltage is low
txADCChFourHi
The transmitter synthesizer tuning voltage is high
txADCChFiveLo
The transmitter 28 VDC power supply voltage is low
txADCChFiveHi
The transmitter 28 VDC power supply voltage is high
txADCChSixLo
The transmitter 9 VDC power supply voltage is low
txADCChSixHi
The transmitter 9 VDC power supply voltage is high
txADCChSevenLo
The transmitter digital 5 VDC power supply voltage is low
txADCChSevenHi
The transmitter digital 5 VDC power supply voltage is high
txADCChEightLo
The transmitter reference -5 VDC power supply voltage is low
txADCChEightHi
The transmitter reference -5 VDC power supply voltage is high
txADCChNineLo
The transmitter VCO voltage is low
txADCChNineHi
The transmitter VCO voltage is high
txADCChElevenHi
The transmitter temperature is greater than 70°C.
Transmitter Alarms for 2000, 2500 MHz Frequency Bands
Page 97

Alarm Types and Sources | 277
Aprisa XE User Manual
Type
Explanation
rx12VFail
The receiver 12 VDC power supply has failed
rxEEFail
The on-board memory has failed
rxMibFail
The receiver MIB is corrupt in EEPROM
rxOff
The receiver is off
rxRSSIHi
The receiver maximum input level has been exceeded
rxRSSILo
The RSSI is below the alarm threshold setting (see page 80)
rxSynthLD
The synthesizer frequency is not set
rxADCChZeroLo
The receiver 3.3 VDC power supply voltage is low
rxADCChZeroHi
The receiver 3.3 VDC power supply voltage is high
rxADCChOneLo
The receiver synthesizer tuning voltage is low
rxADCChOneHi
The receiver synthesizer tuning voltage is high
rxADCChTwoLo
The receiver +12 VDC power supply is low
rxADCChTwoHi
The receiver +12 VDC power supply is high
rxADCChThreeLo
The receiver +5 VDC power supply is low
rxADCChThreeHi
The receiver +5 VDC power supply is high
rxADCChFourLo
The receiver +12 VDC power supply is low (same alarm as TwoLo)
rxADCChFourHi
The receiver +12 VDC power supply is high (same alarm as TwoHi)
rxADCChFiveLo
The receiver VCO voltage is low
rxADCChFiveHi
The receiver VCO voltage is high
rxADCChSevenLo
The receiver RSSI is lower than the normal operating lower limit
rxADCChSevenHi
The receiver RSSI is higher than the normal operating upper limit
rxADCChEightLo
The receiver temperature is greater than 70°C (below spec)
rxADCChEightHi
The receiver temperature is less than -10°C (below spec)
Receiver Alarms
Receiver Alarms for all Frequency Bands
Receiver Alarms for 300, 400, 600, 700, 800, 900 MHz Frequency Bands
Page 98

278 | Alarm Types and Sources
Aprisa XE User Manual
rxADCChZeroLo
The receiver 3.3 VDC power supply voltage is low
rxADCChZeroHi
The receiver 3.3 VDC power supply voltage is high
rxADCChOneLo
The receiver synthesizer tuning voltage is low
rxADCChOneHi
The receiver synthesizer tuning voltage is high
rxADCChTwoLo
The receiver -1.5 VDC power supply is low
rxADCChTwoHi
The receiver -1.5 VDC power supply is high
rxADCChThreeLo
The receiver +5 VDC power supply is low
rxADCChThreeHi
The receiver +5 VDC power supply is high
rxADCChFourLo
The receiver +9 VDC power supply is low
rxADCChFourHi
The receiver +9 VDC power supply is high
rxADCChFiveLo
The receiver VCO voltage is low
rxADCChFiveHi
The receiver VCO voltage is high
rxADCChSevenLo
The receiver RSSI is lower than the normal operating lower limit
rxADCChSevenHi
The receiver RSSI is higher than the normal operating upper limit
rxADCChEightLo
The receiver temperature is greater than 70°C (below spec)
rxADCChEightHi
The receiver temperature is less than -10°C (below spec)
Receiver Alarms for 1400 MHz Frequency Band
Page 99

Alarm Types and Sources | 279
Aprisa XE User Manual
rxADCChZeroLo
The receiver 3.3 VDC power supply voltage is low
rxADCChZeroHi
The receiver 3.3 VDC power supply voltage is high
rxADCChOneLo
The receiver synthesizer tuning voltage is low
rxADCChOneHi
The receiver synthesizer tuning voltage is high
rxADCChTwoLo
The receiver +12 VDC power supply is low
rxADCChTwoHi
The receiver +12 VDC power supply is high
rxADCChThreeLo
The receiver +5 VDC power supply is low
rxADCChThreeHi
The receiver +5 VDC power supply is high
rxADCChFourLo
The receiver +9 VDC power supply is low
rxADCChFourHi
The receiver +9 VDC power supply is high
rxADCChFiveLo
The receiver VCO voltage is low
rxADCChFiveHi
The receiver VCO voltage is high
rxADCChSevenLo
The receiver RSSI is lower than the normal operating lower limit
rxADCChSevenHi
The receiver RSSI is higher than the normal operating upper limit
rxADCChEightLo
The receiver temperature is greater than 70°C (below spec)
rxADCChEightHi
The receiver temperature is less than -10°C (below spec)
Receiver Alarms for 2000, 2500 MHz Frequency Bands
Page 100

280 | Alarm Types and Sources
Aprisa XE User Manual
Type
Explanation
muxInit
A MUX card failed to program
muxMibEEFail
The MIB EEROM is corrupt
muxCharEEFail
The character data is corrupt
Type
Explanation
mdLOS
The modem has loss of synchronization with the far end
mdDemodAlignmentLost
The modem is unable to synchronize to the payload framing
mdTdmAlignmentLost
The modem is unable to synchronize to the system bus timing
mdRefAFail
The modem reference clock A has failed
mdRefBFail
The modem reference clock B has failed
mdClkSyncFail
The modem is unable to synchronize to the system clock
mdEEFail
The modem EEPROM is corrupt
mdUCEPresent
The modem has uncorrectable errors
Type
Explanation
mbFan1Fail
Fan 1 failure
mbFan2Fail
Fan 2 failure
mbCardMismatch
The expected interface card is different to the card that is fitted
mbHwHsc
A MUX card has an unsupported HSC number
MUX Alarms
Modem Alarms
Motherboard Alarms
 Loading...