

Page 1

User ’s
Manual
AQ7280
OTDR
IM AQ7280-01EN
5th Edition
Page 2

Thank you for purchasing the AQ7280 OTDR (Optical Time Domain Reflectometer).
This user’s manual explains the features, operating procedures, and handling precautions of the
AQ7280. To ensure correct use, please read this manual thoroughly before beginning operation. Keep
this manual in a safe place for quick reference in the event that a question arises.
The AQ7280 comes with the following manuals. Please read all manuals.
List of Manuals
Manual Title Manual No. Description
AQ7280 OTDR
User’s Manual (included in CD)
AQ7280 OTDR Getting Started Guide IM AQ7280-02EN This guide focuses on the handling precautions, basic
AQ7280 OTDR Communication Interface
User’s Manual (included in CD)
Model 739883
Battery Pack Handling Precautions
AQ7280 OTDR User’s Manual IM AQ7280-92Z1 A document for China.
The “EN” and “Z1” in the manual numbers are the language codes.
Contact information of Yokogawa offices worldwide is provided on the following sheet.
Document No. Description
PIM 113-01Z2 List of worldwide contacts
IM AQ7280-01EN This manual. The manual explains all the AQ7280
features other than the communication command
features.
operations, and specifications of the AQ7280.
IM AQ7280-17EN This manual explains the feature for controlling the
AQ7280 using communication commands.
IM 739883-01EN This document explains the handling precautions of
the battery pack.
Notes
• The contents of this manual are subject to change without prior notice as a result of continuing
improvements to the software’s performance and functionality. The figures given in this manual may
differ from those that actually appear on your screen.
• Every effort has been made in the preparation of this manual to ensure the accuracy of its
contents. However, should you have any questions or find any errors, please contact your nearest
YOKOGAWA dealer.
• Copying or reproducing all or any part of the contents of this manual without the permission of
YOKOGAWA is strictly prohibited.
Trademarks
• Microsoft, Windows, and MS-DOS are registered trademarks or trademarks of Microsoft Corporation
in the United States and/or other countries.
• Adobe and Acrobat are either registered trademarks or trademarks of Adobe Systems Incorporated.
• Compact - VJE is a trademark of Yahoo! Inc.
• In this manual, the ® and TM symbols do not accompany their respective registered trademark or
trademark names.
• FlashAir is a trademark of TOSHIBA CORPORATION.
• Other company and product names are trademarks or registered trademarks of their respective
companies.
Revisions
October 2014 1st Edition
March 2015 2nd Edition
July 2015 3rd Edition
January 2016 4th Edition
July 2016 5th Edition
5th Edition: July 2016 (YMI)
All Rights Reserved, Copyright © 2014, Yokogawa Meters & Instruments Corporation
IM AQ7280-01EN
i
Page 3

Conventions Used in This Manual
Notes
The notes and cautions in this manual are categorized using the following symbols.
Improper handling or use can lead to injury to the user or damage to the
instrument. This symbol appears on the instrument to indicate that the user must
refer to the user's manual for special instructions. The same symbol appears in
the corresponding place in the user's manual to identify those instructions. In the
user's manual, the symbol is used in conjunction with the word “WARNING” or
“CAUTION.”
WARNING
CAUTION
Calls attention to actions or conditions that could cause serious or fatal injury to
the user, and precautions that can be taken to prevent such occurrences.
Calls attention to actions or conditions that could cause light injury to the user
or cause damage to the instrument or user’s data, and precautions that can be
taken to prevent such occurrences.
French
AVERTISSEMENT
ATTENTION
Calls attention to information that is important for the proper operation of the
Note
Attire l’attention sur des gestes ou des conditions susceptibles de
Attire l’attention sur des gestes ou des conditions susceptibles
de provoquer des blessures graves (voire mortelles), et sur les
précautions de sécurité pouvant prévenir de tels accidents.
provoquer des blessures légères ou d’endommager l’instrument ou les
données de l’utilisateur, et sur les précautions de sécurité susceptibles
de prévenir de tels accidents.
instrument.
Symbols and Conventions Used in Procedural Explanations
The contents of the procedural explanations are indicated using the following symbols.
Procedure
Carry out the procedure according to the step numbers. All procedures are
written under the assumption that you are starting operation at the beginning
of the procedure, so you may not need to carry out all the steps in a procedure
when you are changing the settings.
Explanation
This section describes the setup items and the limitations regarding the
procedures. It may not give a detailed explanation of the feature. For a detailed
explanation of the feature, see chapter 2.
Character Notations
Panel Key Names and Soft Key Names in Bold Characters
Indicate panel keys that are used in the procedure and soft keys and menu items that appear on the screen.
Unit
k Denotes 1000. Example: 400 km
K Denotes 1024. Example: 400KB (file size)
ii
IM AQ7280-01EN
Page 4

Contents
List of Manuals ...................................................................................................................................i
Conventions Used in This Manual ....................................................................................................ii
Chapter 1 Features
1.1 Overview .......................................................................................................................... 1-1
1.2 Optical Pulse Measurement ............................................................................................. 1-5
1.3 Optical Pulse Waveform Display ...................................................................................... 1-8
1.4 Optical Pulse Analysis .................................................................................................... 1-10
1.5 Light Source and Optical Power Meter ........................................................................... 1-15
1.6 File Operation and Printing ............................................................................................. 1-16
1.7 System Features ............................................................................................................ 1-18
1
2
3
4
Chapter 2 Optical Pulse Measurement (OTDR)
2.1 Setting the Measurement and Analysis Conditions .......................................................... 2-1
2.2 Performing Averaged Measurements ............................................................................. 2-15
2.3 Performing Averaged Measurement and Displaying the Results with Icons
(/SMP option).................................................................................................................. 2-17
2.4 Performing Averaged Measurement and Measuring the Distances to Breaks ............... 2-23
2.5 Performing Real-time Measurement .............................................................................. 2-27
2.6 Performing High Resolution Measurement .................................................................... 2-30
2.7 Displaying Reference Trace Waveforms ........................................................................ 2-33
2.8 Performing Multi-Core Fiber Measurement .................................................................... 2-34
2.9 Monitoring Optical Fiber Cables (/MNT option) .............................................................. 2-46
2.10 Using Convenient Touch Operation Features................................................................. 2-53
Chapter 3 Optical Pulse Waveform Display
3.1 Waveform Display Screen ................................................................................................ 3-1
3.2 Configuring the Waveform Display ................................................................................... 3-2
3.3 Zooming and Moving Displayed Waveforms .................................................................. 3-10
Chapter 4 Optical Pulse Analysis
4.1 Analyzing Waveforms ....................................................................................................... 4-1
4.2 Analyzing Events ............................................................................................................ 4-17
5
6
7
8
Index
Chapter 5 Optical Output and Optical Power Measurement
5.1 Outputting Light (/SLS option, VLS) ................................................................................. 5-1
5.2 Measuring Optical Power (OPM, /PC option) ................................................................... 5-3
Chapter 6 File Operation and Printing
6.1
6.2 Connecting an SD Card ................................................................................................... 6-2
6.3 Saving and Loading Data ................................................................................................. 6-3
6.4 Copying and Deleting Files .............................................................................................6-11
6.5 Renaming Files .............................................................................................................. 6-13
6.6 Creating Folders ............................................................................................................. 6-15
6.7 Copying and Deleting Folders ........................................................................................ 6-17
6.8
6.9 Setting the Items to Display in File Lists ......................................................................... 6-25
IM AQ7280-01EN
Connecting USB Storage Media to the USB Ports ................................................................. 6-1
Creating Reports of Waveform Data as PDF Data ............................................................. 6-19
iii
Page 5

Contents
6.10 Printing the Current Displayed Waveform ...................................................................... 6-27
6.11 Printing Saved Waveforms ............................................................................................. 6-29
Chapter 7 System Configuration
7.1 Setting the Power Save Mode .......................................................................................... 7-1
7.2 Initializing the AQ7280 to Its Factory Default Condition ................................................... 7-2
7.3 Setting Operation Restrictions .......................................................................................... 7-3
7.4 Configuring Network Settings (/LAN option) ..................................................................... 7-5
7.5 Web Server Feature ......................................................................................................... 7-8
7.6 Other Features ................................................................................................................7-11
Chapter 8 Troubleshooting, Maintenance, and Inspection
8.1 If a Problem Occurs .......................................................................................................... 8-1
8.2 Error Messages ................................................................................................................ 8-2
8.3 Viewing the Product Information....................................................................................... 8-6
8.4 Executing a Self-Test ........................................................................................................ 8-7
8.5 Updating the Firmware ..................................................................................................... 8-8
8.6 Checking the Optical Fiber End Face for Stains .............................................................. 8-9
8.7 Mechanical Inspection and Operation Check ................................................................. 8-13
8.8 Replacing the Optical Adapter ........................................................................................ 8-14
8.9 Routine Maintenance ..................................................................................................... 8-16
8.10 Storage Precautions ....................................................................................................... 8-18
8.11 Recommended Part Replacement ................................................................................. 8-19
8.12 Calibration ...................................................................................................................... 8-20
Index
iv
IM AQ7280-01EN
Page 6
Mainframe
Visible light (with the visible light source
Chapter 1 Features
1.1 Overview
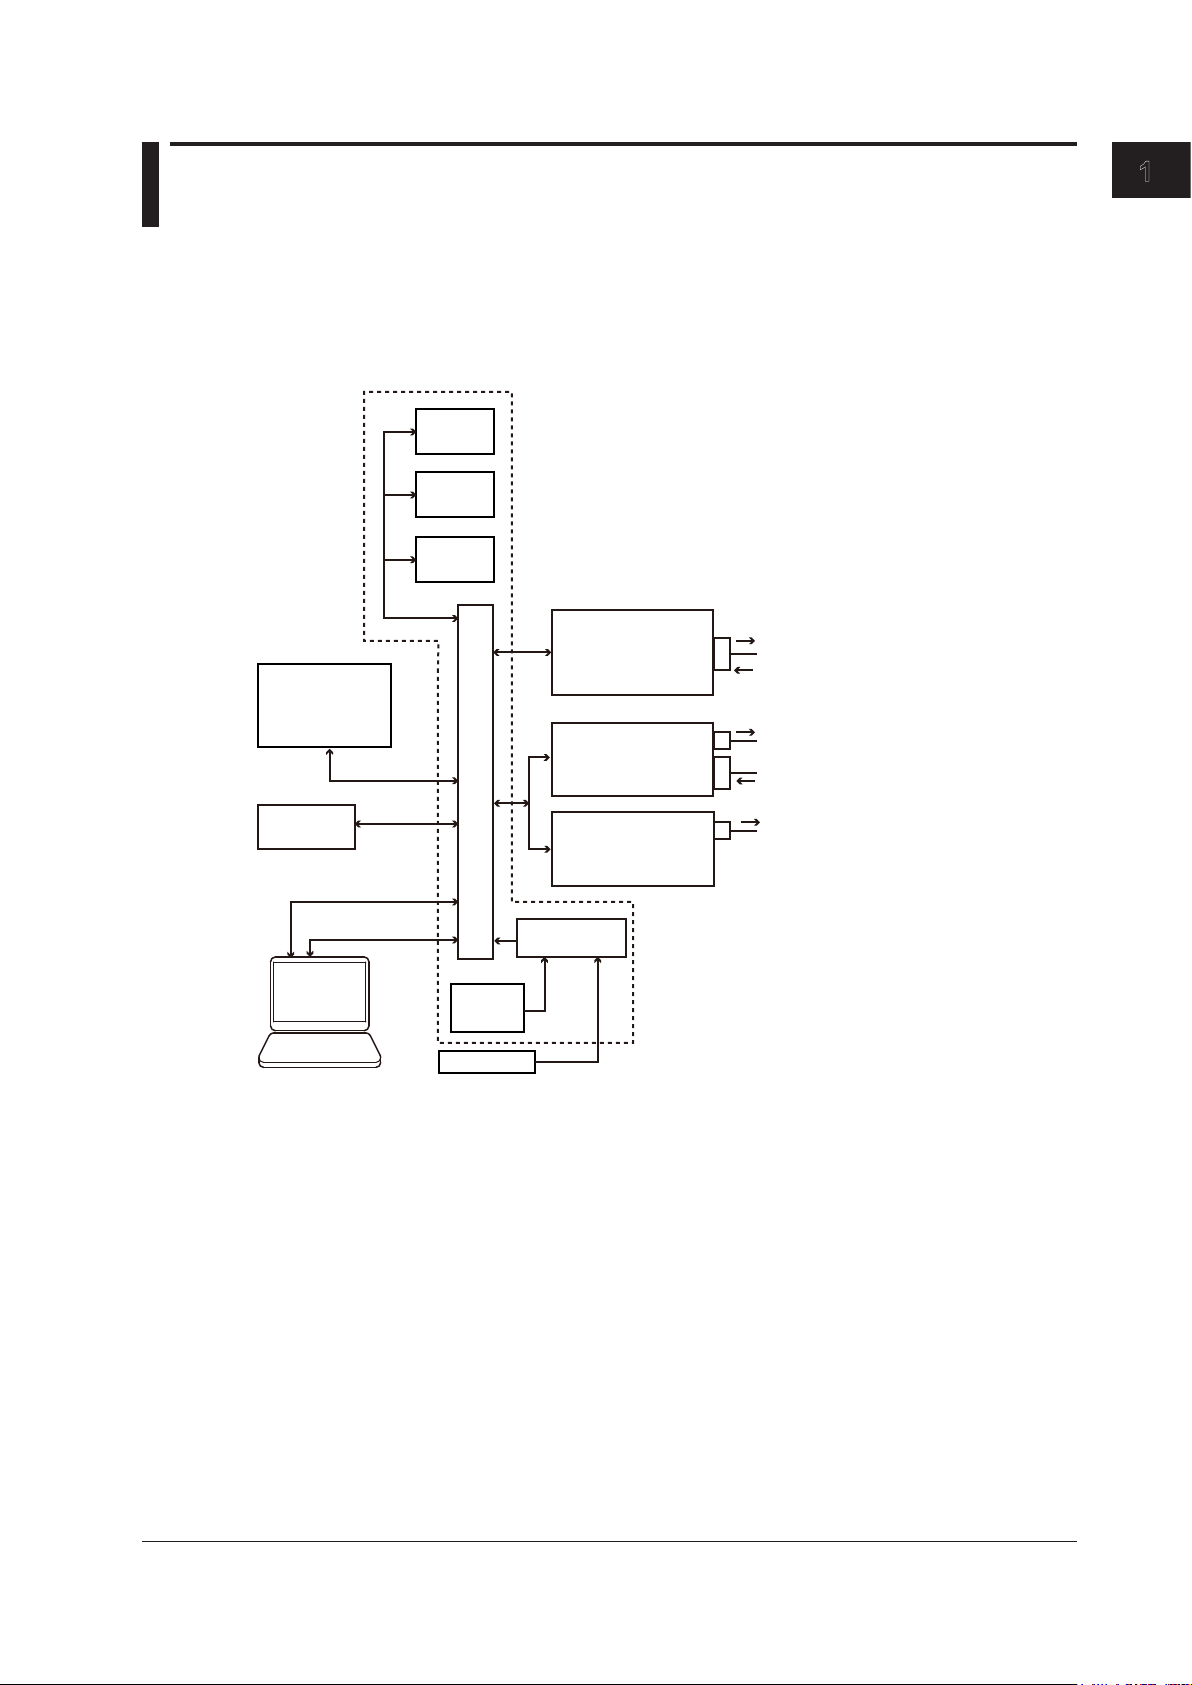
System Configuration
The AQ7280 consists of a mainframe and OTDR unit. If necessary, an OPM module can be installed
into the mainframe to measure loss in optical fiber cables and view the power of communication light.
An VLS module can be installed to visually check the fault location.
USB memory,
fiber inspection
probe, printer
TypeA x2
Display
block
Control
block
Internal
memory
OTDR unit
OPM module
1
Features
Optical pulse: OTDR
Measurement light: Light source (/SLS)
Power checker (/PC)
feature; CW, CHOP)
Measurement light (CW, CHOP)
PC
SD slot
Visible light (CW, CHOP)
VLS module
Control and computation block
Power
supply block
Battery
pack
AC adapter
SD card
ETHERNET
(/LAN option)
USB (TypeB_mini)
Mainframe
The AQ7280OTDR mainframe. In combination with an OTDR unit, the mainframe can test for
breaks, connections, losses, and the like. In addition, by installing an option module, you can use
the mainframe as an optical power meter or visible light source.
The main processes performed on the mainframe are as follows:
• Key and touch panel operations
• Set measurement conditions
• 8.4 inch large LCD
• Multi touch support
• Battery driven
• System that enables both units and modules to be controlled
• Remote control through external interfaces (USB, Ethernet (/LAN option))
The mainframe runs on an AC adapter (sold separately) or internal battery. The AC adapter (sold
separately) is required to charge the internal battery.
IM AQ7280-01EN
1-1
Page 7

1.1 Overview
OTDR Unit
Install the OTDR unit into the mainframe to use the AQ7280 as an OTDR. There are several types
of OTDR units available for different wavelengths, dynamic ranges, and the like. You can choose
the one that suits your application.
Based on user input through the mainframe, the light emitter (LD; laser diode) is driven, and
the generated optical pulse is emitted from the OTDR port into the optical fiber cable under
measurement.
The backscatter and reflected light that occur in the optical fiber cable under measurement returns
to the OTDR port. The returned measurement light is received by the light detector (APD: Avalanche
photodiode), read as a digital signal by the A/D section, subjected to averaging and other waveform
processing, and output to the mainframe where the OTDR waveform is displayed.
With the light source option (/SLS), based on user input through the mainframe, the light emitter (LD;
laser diode) is driven, and CW or CHOP measurement light is emitted.
With the optical power checker option (/PC), the communication light (fiber in use) present in
the optical fiber cable under measurement is detected at the OTDR port, and its power level is
measured.
OPM Module
Install the OPM module into the mainframe to use the AQ7280 as an optical power meter (OPM).
The measurement light applied to the optical port is received by the light detector (PD: photodiode),
read as a digital signal by the A/D section, and output as measured values to the mainframe where
they are displayed.
Modules with the visible light source function (AQ2780V, AQ2781V) can emit visible light like the
VLS module. The wavelength of the visible light source is 650 nm.
VLS Module
The VLS (visible light source) module is designed to test for breaks, connections, losses, and the
like in optical fiber networks. It can be used as a visible light source by installing it as an option to
the AQ7280 OTDR mainframe. The wavelength of the visible light source is 650 nm.
OTDR Features
OTDR stands for optical time domain reflectometer. The AQ7280 displays waveforms that you can use
to detect fault locations in optical fiber cables and monitor fault conditions (transmission loss, splice
loss, etc.). It is mainly used in the following optical fiber cable installation and maintenance situations.
• Access network connecting telecom carriers and subscribers, including service providers (SM
optical fiber cable)
• Core network between telecom carriers (multi-core SM optical fiber cable)
• Local area network in buildings (MM
1 SM: Single mode
2 MM: Multi mode
2
optical fiber cable)
Optical Pulse Measurement
• Averaged Measurement
A measurement in which measurements are taken several times and the measured values are
averaged to display the result.
• Icon Display of Results after Averaged Measurement (/SMP option)
After averaged measurement is performed, the OTDR waveform is automatically analyzed, and
the results are displayed using icons for each event type. To use this feature, start OTDR Smart
Mapper from the top menu.
• Display of the Distances to Breaks after Averaged Measurement
After averaged measurement is performed, the OTDR waveform is automatically analyzed,
breaks (faults) are detected, and the distances to the breaks are displayed. To use this feature,
start Fault Locator from the top menu.
1
1-2
IM AQ7280-01EN
Page 8

1.1 Overview
• Real-time Measurement
While optical pulse measurement is in progress, measured values are updated and displayed in
real time.
• Multi-core Optical Fiber Cable Measurement
Multi-core fiber measurement takes time and effort. This feature makes it possible to efficiently
measure multi-core optical fiber cables through a dedicated menu. To use several measurement
functions such as power meter and connector end face testing in addition to OTDR (optical pulse
measurement), start Multi Fiber Project from the top menu.
• Optical Fiber Cable Monitoring (/MNT option)
This feature performs optical pulse measurement at regular intervals so that you can monitor for
errors in the optical fiber cable. To use this feature, start Schedule Measurement from the top
menu.
Optical Pulse Waveform Display
This feature zooms in and out of displayed waveforms and moves waveforms.
Optical Pulse Analysis
• Waveform Analysis
The following events can be analyzed using cursors and markers.
• Distance
• Splice loss
• Return loss
Analysis is performed over the entire waveform or a section of the waveform using the following
features.
• Multi trace analysis
Up to four waveforms can be displayed simultaneously for comparison.
• 2 way trace analysis
The waveform measured from one end of the optical fiber cable and that measured from the
other end are combined to verify events that could not be detected because of dead zones.
• Differential trace
The difference between two waveforms is displayed to analyze the differences between event
values.
• Section analysis
Return loss between markers can be analyzed.
• Event Analysis
Events are automatically detected. In addition, you can edit events and event lists. Adjustments
can be made when certain events cannot be detected or when noise is detected as events.
1
Features
IM AQ7280-01EN
1-3
Page 9

1.1 Overview
Light Source Feature
• Stabilized Light Source (/SLS option)
This is used as a light source for measuring optical loss or as a light source for optical fiber
identification. The measurement light (CW, CHOP) is emitted from the OTDR port of the OTDR
*
unit.
The wavelength of the measurement light is the same as that of the optical pulse of the
relevant OTDR unit.
* AQ7282M is supported on firmware version 2.01 and later.
• Visible Light Source (VLS module, OPM module with a VLS function)
This is used to view the fault locations or check the cores of multi-core optical fiber cables. A 650
nm visible light (CW, CHOP (2 Hz)) is emitted from the optical output port of the VLS module or
that of the OPM module with a visible light source.
Optical Power Meter Feature
• Optical Power Meter (OPM module)
This is used as an optical power meter for measuring optical loss or for measuring the power of
communication light. It measures the power of the light entering the optical input port of the OPM
module. By logging and graphing the fluctuation in the optical power value, you can view the
fluctuation in the optical power and loss.
• Power Checker (/PC option)
The OTDR port
feature (/PC option) that enables you to check the presence of communication light (fiber in use)
within the optical fiber cable under measurement and view its power value.
* Not applicable to the port 2 of AQ7283E and AQ7283F.
*
of the OTDR unit (except AQ7282M) is equipped with an optical power checker
USB Feature
• USB Storage Medium Connection (Type A)
USB storage media complying with USB1.0/1.1/2.0 can be used. Up to two media can be
connected.
You can save waveform data and measurement conditions to them.
• Fiber Inspection Probe Connection (Type A)
A fiber inspection probe specified by Yokogawa can be used to view stains on the optical fiber
cable end face on the AQ7280 screen. To use this feature, start Fiber Inspection Probe from the
top menu. The fiber inspection probe is not included with the AQ7280. Please purchase your own
fiber inspection probe. For information about compatible fiber inspection probes, contact your
nearest YOKOGAWA dealer.
• PC Connection (Type B mini)
You can connect a PC to the AQ7280 and control it using communication commands. For details,
see the communication interface user’s manual, IM AQ7280-17EN.
ETHERNET Feature (/LAN option)
You can connect a PC to the AQ7280 and control it using communication commands. For details, see
the communication interface user’s manual, IM AQ7280-17EN.
SD Card
You can use SD cards. Only one SD card can be inserted at any given time. You can save waveform
data and measurement conditions to them. SD cards are not included with the AQ7280. Please use
your own SD cards. For information about compatible SD cards, contact your nearest YOKOGAWA
dealer.
1-4
IM AQ7280-01EN
Page 10
1.2 Optical Pulse Measurement
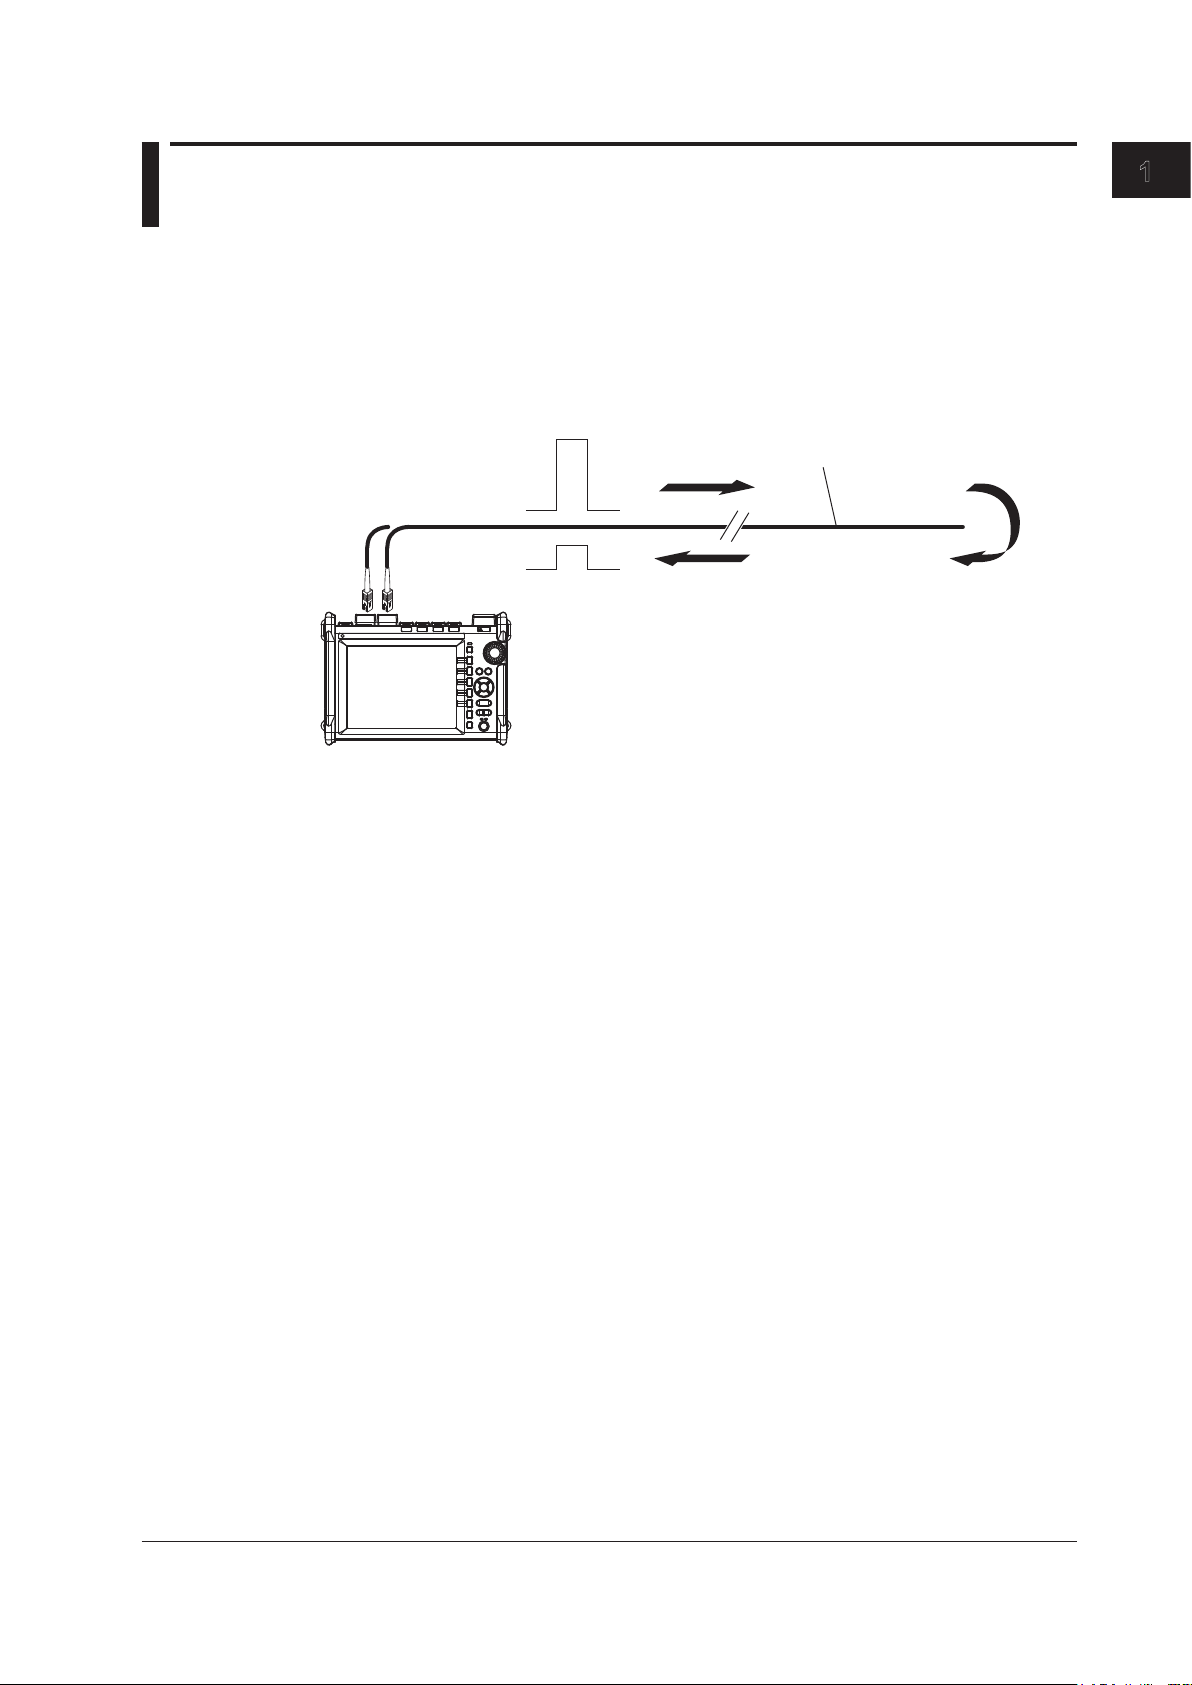
Optical fiber cable being measured
Optical pulse output
The AQ7280 applies an incident optical pulse to the connected optical fiber cable and measures
the power level of the reflected light from the different sections of the optical fiber cable such as its
connections, bent sections, and the open end of the fiber. The AQ7280 uses the measured power
level to determine the distance to the different points (splices, breaks, etc.) of the optical fiber cable
and the loss and other phenomena that occur at those points. For details on how to view optical pulse
waveforms, see section 1.3.
OTDR/Light source port
(optical port 1)
or
OTDR port (optical port 2)
1
Features
Reflection point
AQ7280
Reflected light
Do not bend the optical fiber cable.
Mode
• Simple Mode
In optical pulse measurement, there are measurement conditions related to measurement
resolution—such distance range and pulse width—and analysis conditions related to the
optical fiber cable—such as index of refraction and backscatter. These conditions must be set
according to the item being measured or analyzed. The AQ7280 can perform an optical pulse
measurement immediately before the actual measurement, calculate the distance, splice loss,
and the like beforehand, determine the suitable range from these values, and perform the actual
measurement.
• Detail Mode
If the distance to the measurement target or the optical fiber cable characteristics are known or
if you want to measure or analyze a specific event in detail, you can set the values individually
as necessary. If you set the measurement conditions—such as the distance range and pulse
width—to Auto, the AQ7280 will determine the suitable range and perform the measurement like
in Simple Mode, described above.
• PON Mode
If the optical fiber cables to be measured are connected to a PON (passive optical network)
system, optical splitters that divide the optical fiber cables into the PON system is installed. The
measurement and analysis conditions will vary depending on the installation conditions of the
optical splitters. In PON mode, the AQ7280 determines the suitable measurement and analysis
conditions based on the number of optical splitter stages, route information, and distance range
to set the optimal values. These values can be changed if necessary.
IM AQ7280-01EN
Averaged Measurement
Averaged measurement is effective when you want to detect reflections, splice loss, and other faint
events that are generated from connections or splice points but are buried in noise. The AQ7280
derives the measured data by averaging the specified number of optical pulse measurements or by
averaging optical pulse measurements over the specified duration. During averaged measurement,
you cannot change the measurement conditions. You can stop an averaged measurement before it
completes.
1-5
Page 11
1.2 Optical Pulse Measurement
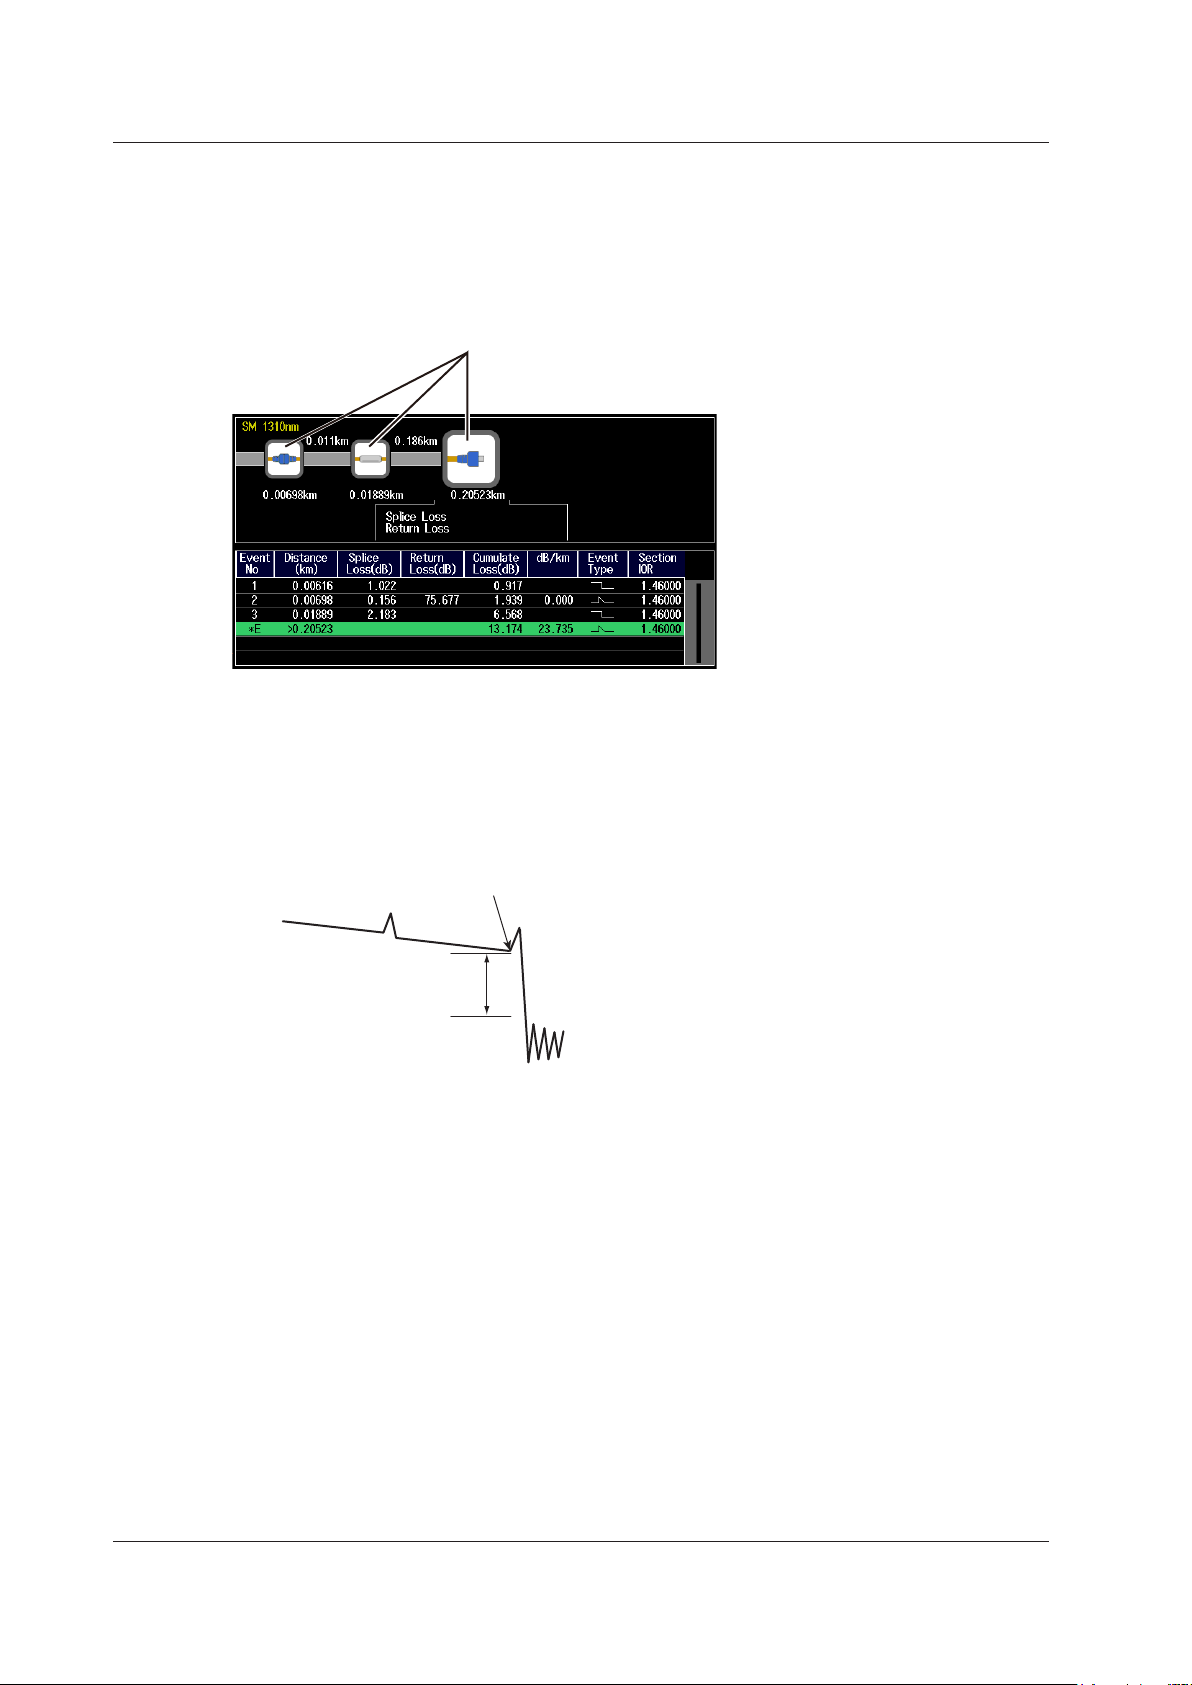
Icon Display of Results after Averaged Measurement (/SMP
option)
The AQ7280 can perform an averaged measurement and then automatically display the measured
result events as icons on the screen. Detailed event analysis results are displayed along with the
displayed icons. In addition, if pass/fail judgment specified, icons are displayed in different colors
depending on the results.
Displays events as icons
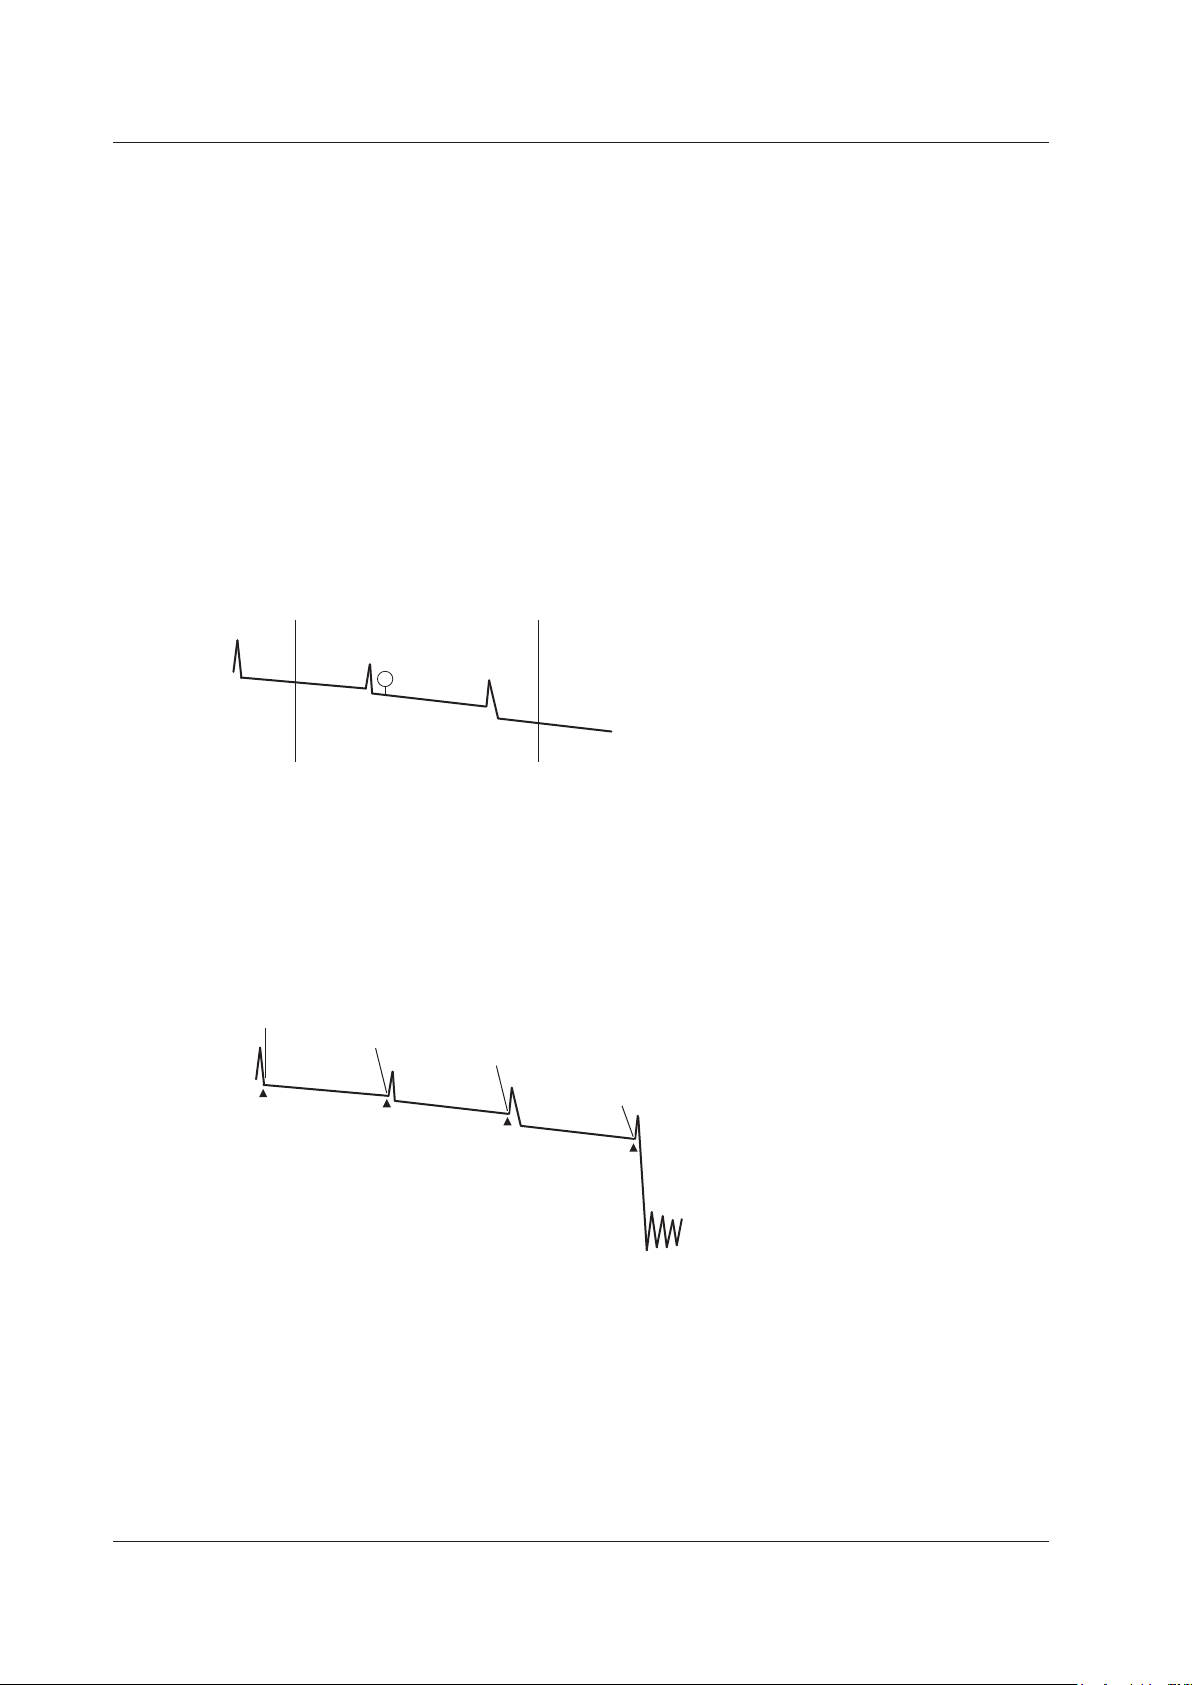
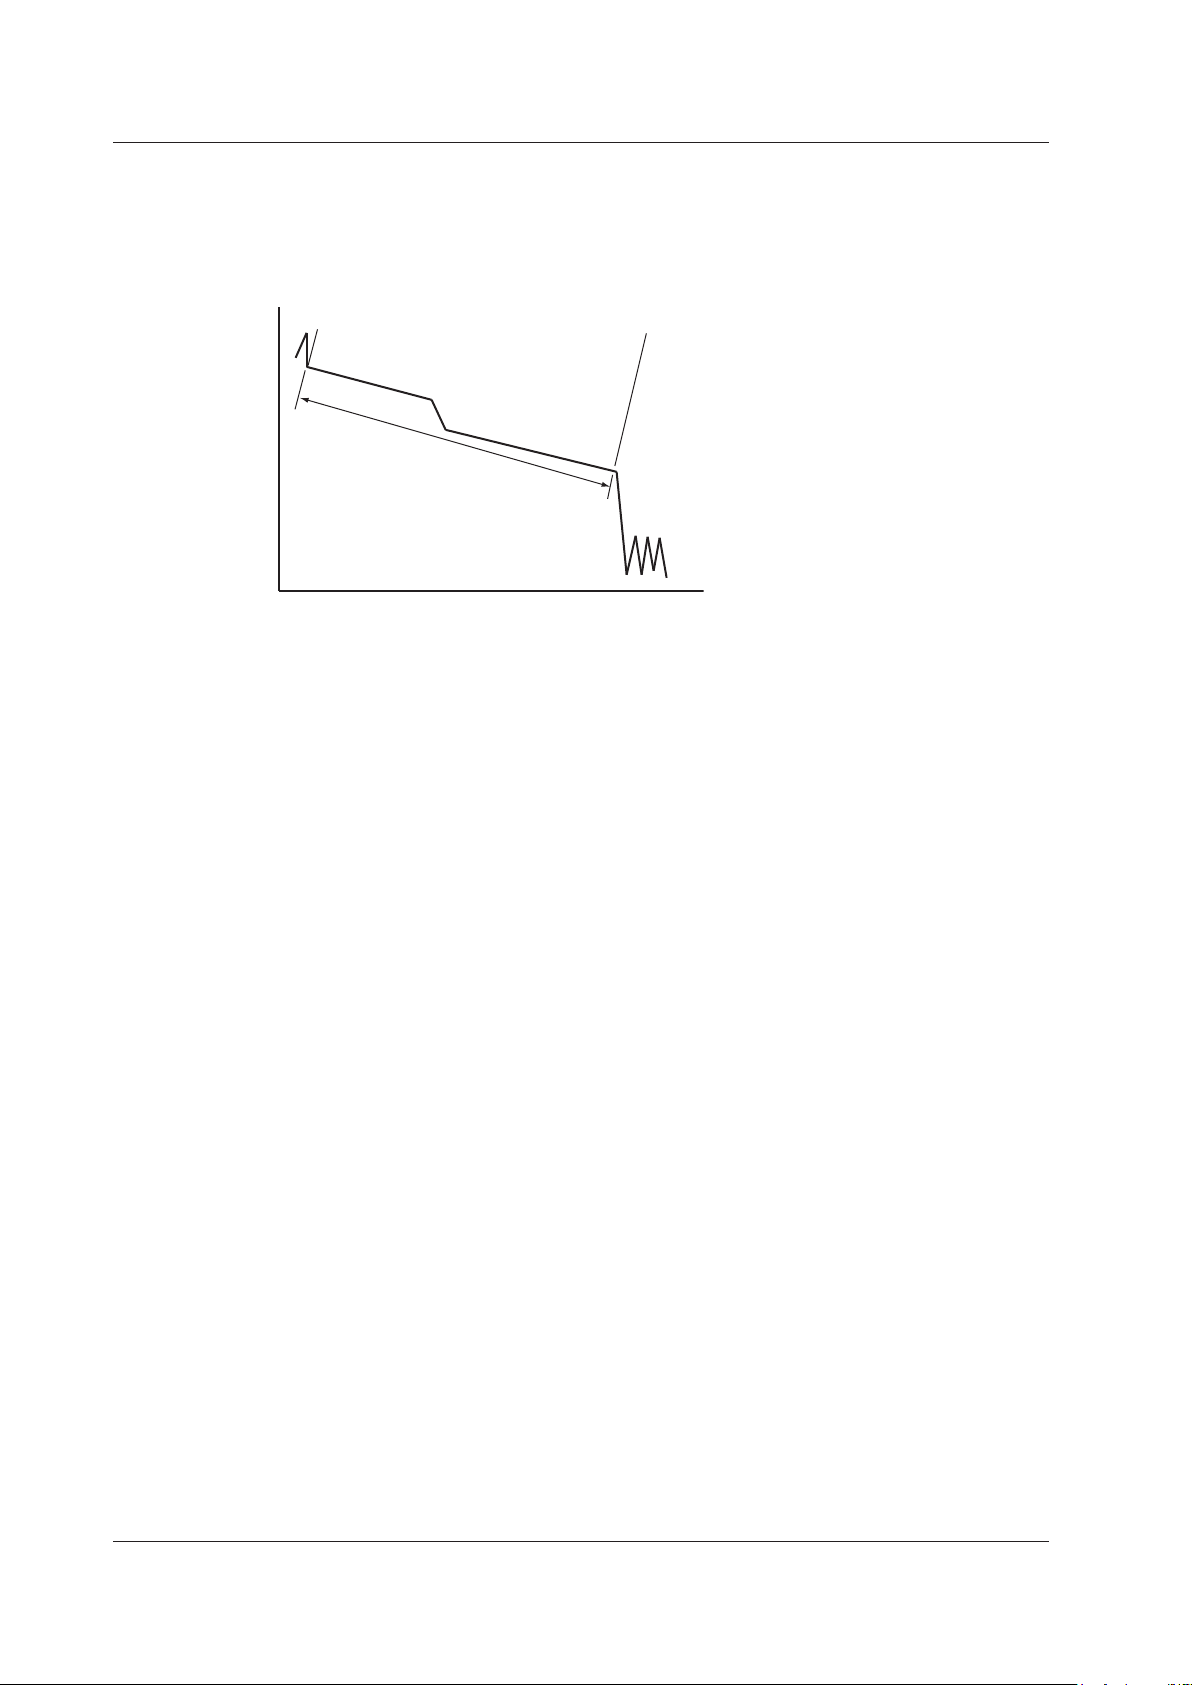
Display of the Distances to Breaks after Averaged Measurement
The AQ7280 can perform an averaged measurement and then automatically search for breaks (faults)
in the optical fiber cable or optical line and display the distances to the breaks on the screen. If there
are no faults in the middle of the optical fiber cable, the end of the cable is detected as a fault. You can
specify the search wavelength or the loss level that is used to determine the end of the optical fiber
cable. You can also zoom the display scale of the measured waveform and move the display position.
Break (fault)
Loss level for determining
whether this is the end of fiber
Real-time Measurement
Real-time measurement is a feature that measures optical pulses while updating and displaying the
measured values. You can monitor in real time events, such as splice loss and return loss, while
installing optical fiber cables. You can also view the changes in the waveform as you change the
measurement conditions,* such as the wavelength, distance range, and pulse width.
* The measurement conditions that you can change vary depending on the measurement mode. For details on
the measurement conditions, see the procedural explanations in chapter 3.
1-6
IM AQ7280-01EN
Page 12

1.2 Optical Pulse Measurement
Optical Pulse Measurement of Multi-core Optical Fiber Cables
Multi-core fiber measurement takes time and effort. This feature makes it possible to efficiently
measure multi-core optical fiber cables through a dedicated menu.
Projects
Items required to make multi-core optical fiber cable measurements such as measurement
conditions, analysis conditions, and core information are managed as projects.
By creating a project before a measurement, you can measure cores under the same conditions.
You can save projects to files. You can load a previously saved project and make measurements
under the same conditions.
List
Cores are listed. You can easily distinguish between cores that have been measured, cores
that have not been measured, and cores that do not to be measured. This list prevents you
from forgetting measurements and from making unnecessary measurements. (You can make
measurements efficiently.)
Saving Measured Results
Measurement results of each core are automatically saved to a folder that is automatically created
in the folder that the project file is saved in. The folder will have the same name as the project file.
Optical Fiber Cable Monitoring (/MNT option)
This feature performs optical pulse measurement at regular intervals so that you can monitor for errors
in the optical fiber cable. Results measured at regular intervals are saved to memory in CSV or SOR
format (waveform data). Data and folders saved in memory are automatically assigned names with
timestamps. During monitoring (while schedule measurement is in progress), measurement items,
such as the loss between two points, of the logged optical pulses are shown on the AQ7280 screen.
Because the changes in the measurement items, such as the loss between two points, can be seen
on the time axis, if an interruption occurs in the optical pulse input, you can determine when the optical
power level fell on the AQ7280 screen. After determining the time, you can view the measured results
in the file with the corresponding timestamp. Up to four measurement items can be monitored.
1
Features
IM AQ7280-01EN
1-7
Page 13
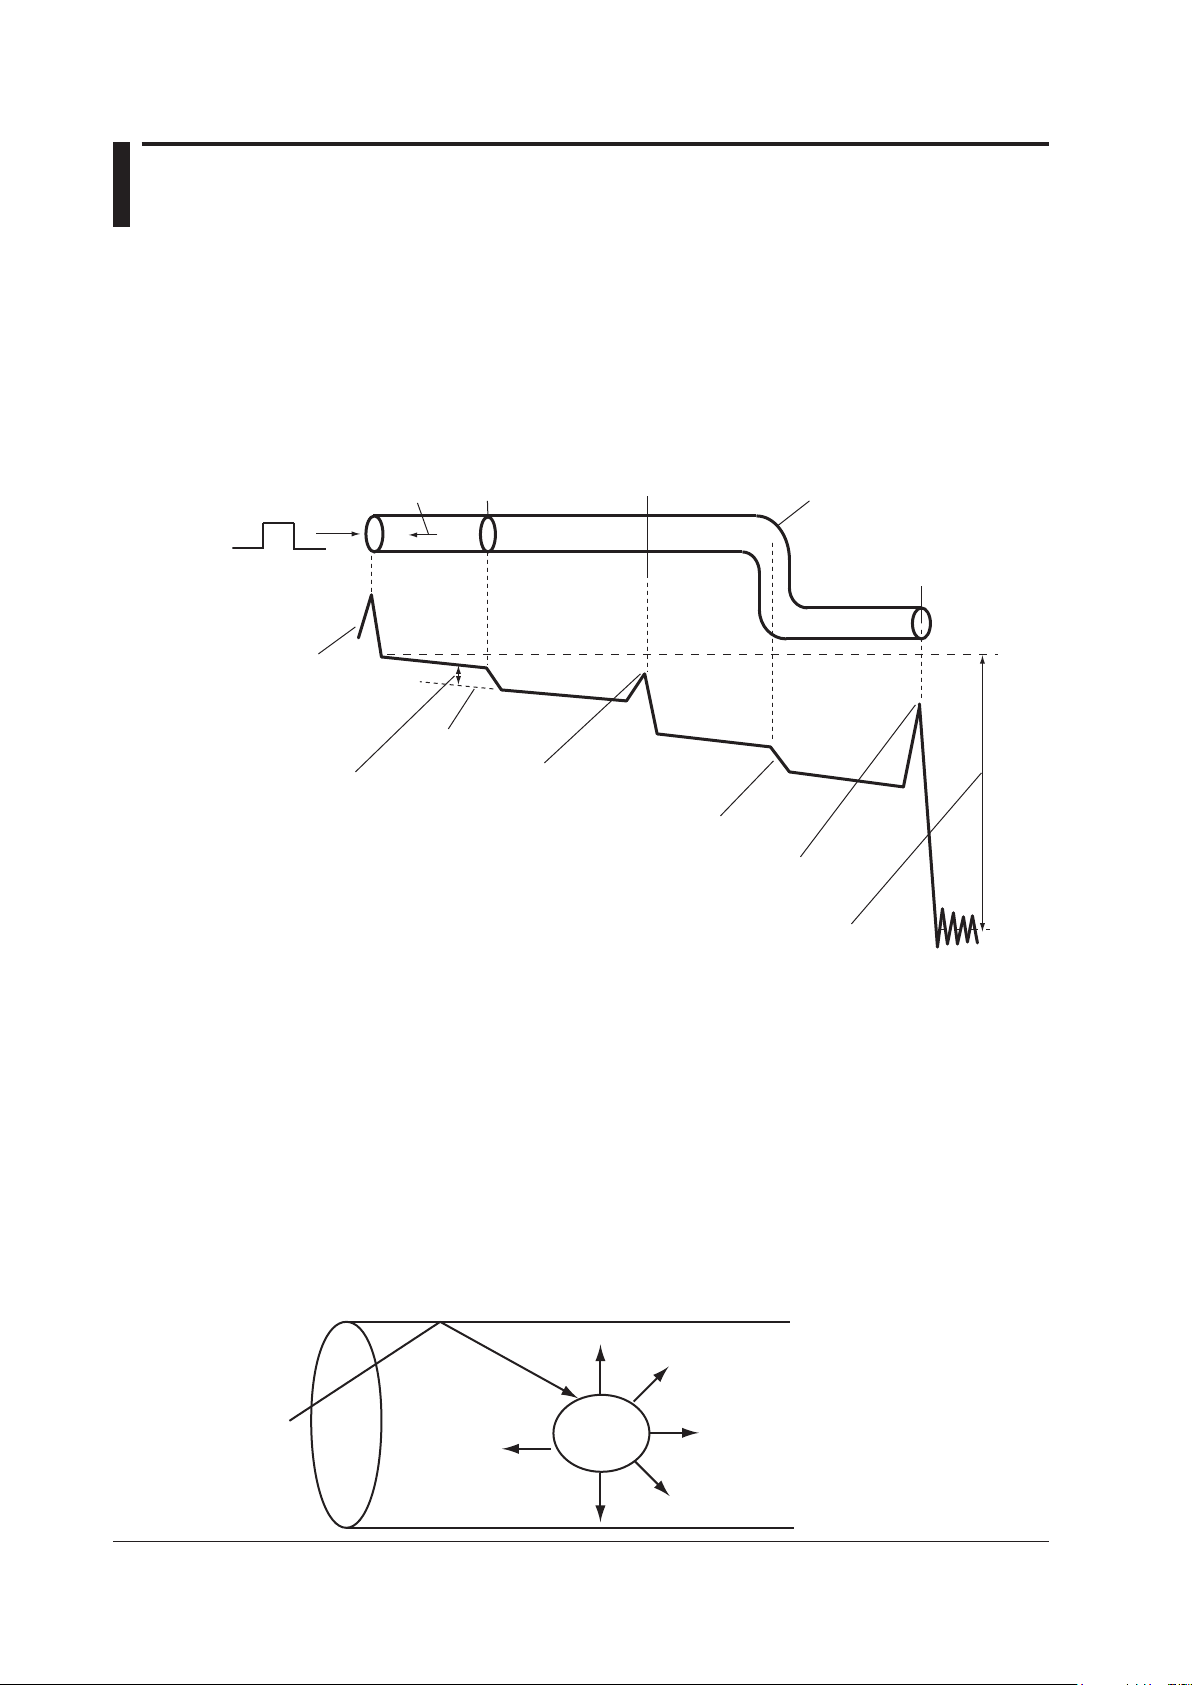
1.3 Optical Pulse Waveform Display
Incident ray Backscatter Splice
Connector Bend
Dynamic range (SNR = 1)
Incident
ray
Optical fiber cable
You can display the measured result as a waveform on the screen. You can zoom the displayed
waveform and move the position that is displayed.
How to View Optical Pulse Waveforms
The optical pulse applied to the optical fiber cable is reflected at different points of the optical fiber such
as its connections, bent sections, and the open end of the fiber. These sections generate loss. The
measured result is displayed as a waveform that has distance represented in the horizontal direction
and loss level represented in the vertical direction. On the waveform, detected losses or reflections are
known as events.
Optical fiber cable
Near-end reflection
Approximated line
Splice loss
Reflection caused by a connector
Loss caused by bending
Reflection at the open end (Fresnel reflection)
Open end
Near-end Reflection
This is the reflection that occurs at the point where the AQ7280 and the optical fiber cable are
connected. This also includes the AQ7280’s internal reflection. In the section where this near-end
reflection is detected, even if there are other connections, the loss and reflections that occur at these
points cannot be detected. This section is the near-end dead zone.
When you are measuring a short distance, connect a launch fiber cable to reduce the effect of the
near-end reflection.
Backscatter
1-8
When light travels through an optical fiber cable, Rayleigh scattering caused by changes in the density
of materials that are smaller than the light’s wavelength and inconsistencies in the fiber's composition
generates loss in the optical fiber itself. The portion of the scattered light that travels in the direction
opposite to the direction of propagation is known as backscatter.
Backscatter
Small
material
IM AQ7280-01EN
Page 14
Incident ray (100%)
RMS level of noise
1.3 Optical Pulse Waveform Display
Splice Loss
Because spliced sections of optical fiber cables have a great number of changes in the material’s
density and inconsistencies in the cable’s composition, loss due to Rayleigh scattering becomes large,
and splice loss occurs in these sections.
1
Features
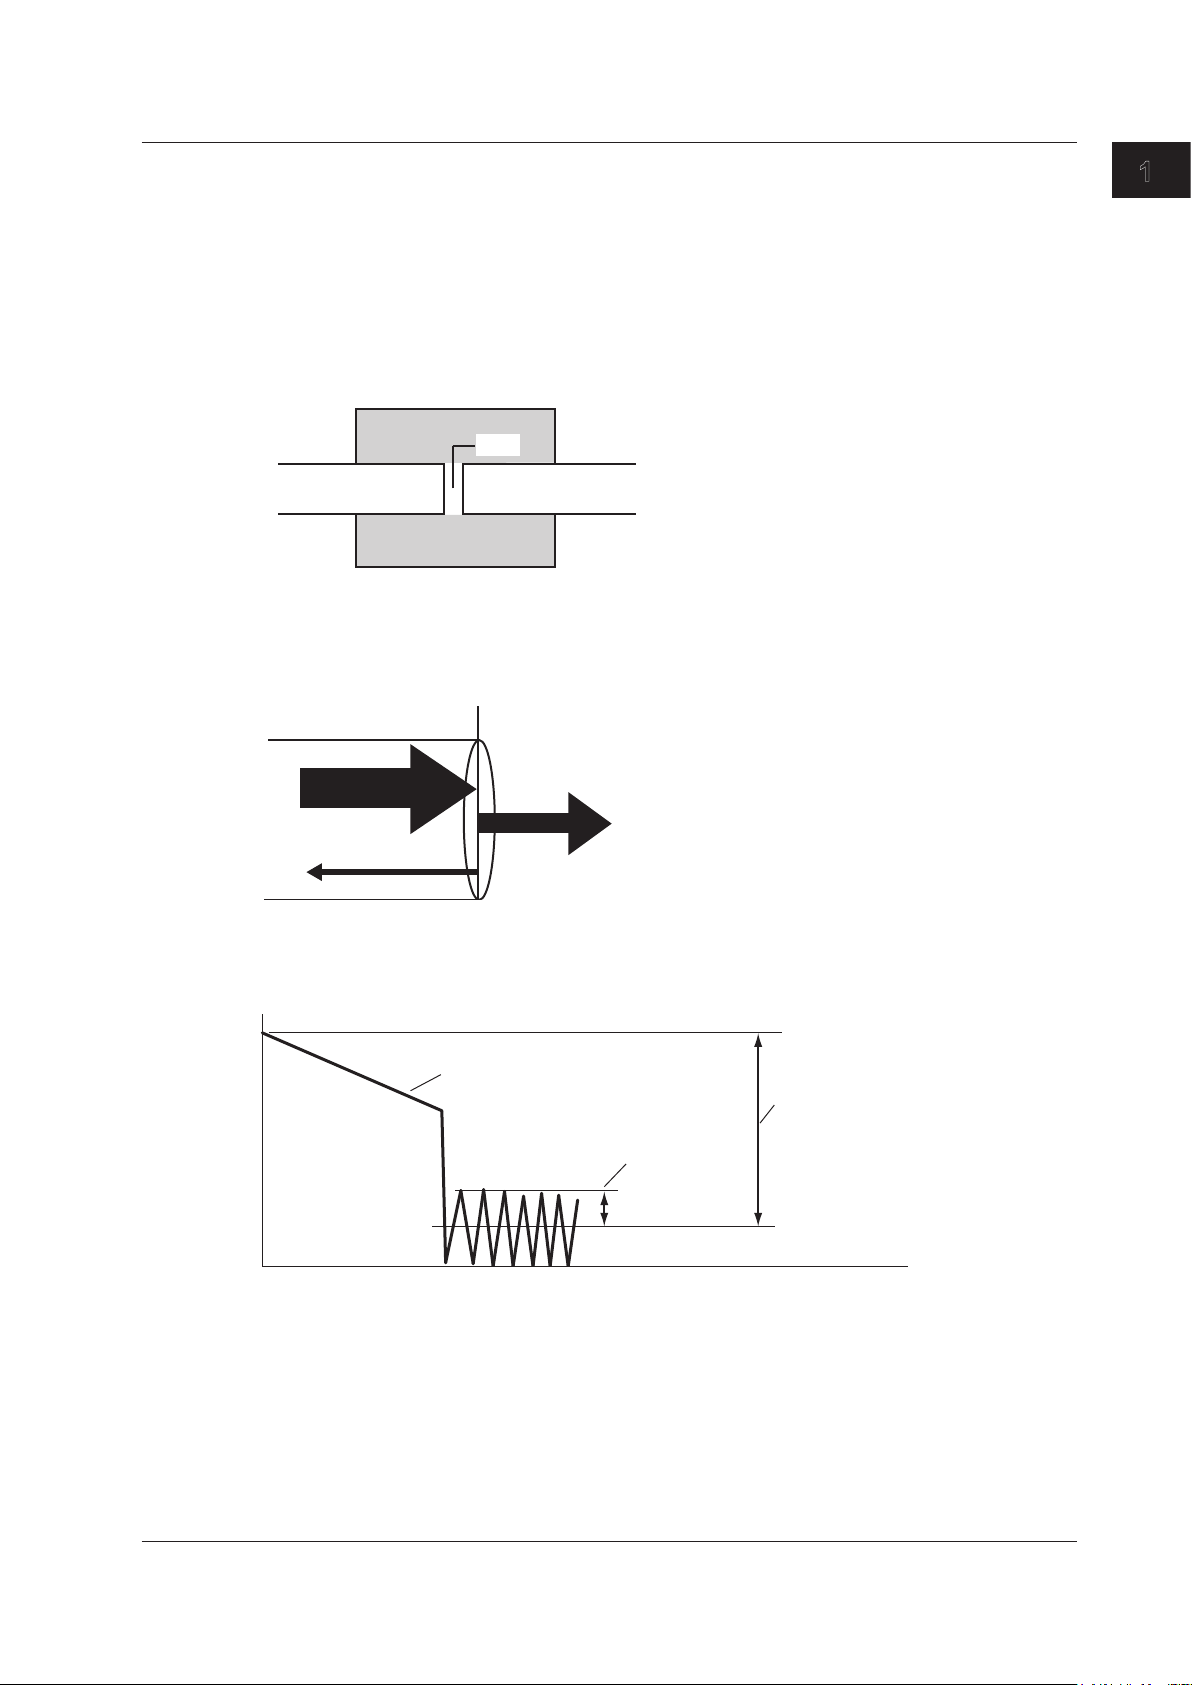
Reflection at the Connection Point of Connectors
Using a connector to connect two optical fibers is different from splicing them together in that a small
gap remains between the two fibers. Because this gap has a different index of refraction, reflection
occurs.
Connector
Gap
Optical fiber cable Optical fiber cable
Fresnel Reflection at the Open End of the Fiber
This is the reflection that occurs at locations where the index of refraction changes (glass to air) such
as where there are tears in the optical fiber cable or at the end of it. When the optical fiber cable end
face is vertical, approximately 3% of the incident optical power (–14.7 dB) is reflected.
Glass Air
Light
Reflected light (3%)
(97%)
Dynamic Range
Dynamic range refers to the range of optical power levels that can be measured. The larger the
dynamic range, the greater the distance that optical pulses can be measured over.
Measurement waveform
Noise peak
2.6 dB
Dynamic range
(SNR=1)
Zooming the Waveform Display Scale
You can zoom the displayed waveform in the direction of the optical power level (vertically) or in the
direction of the distance (horizontally). A rectangular frame that shows the zoom position is displayed
on the overview screen that appears in the bottom right of the screen.
IM AQ7280-01EN
Moving the Waveform Display Position
You can move the displayed waveform in the direction of the optical power level (vertically) or in the
direction of the distance (horizontally). A rectangular frame that shows the display position is displayed
on the overview screen that appears in the bottom right of the screen. This is the same rectangular
frame that shows the zoom position.
1-9
Page 15

1.4 Optical Pulse Analysis
Waveform Analysis
You can use cursors and markers to measure values such as the distance, splice loss, and return loss
between two points.
Measuring Distance
The AQ 7280 measures the time that it takes for an incident optical pulse to be reflected and return to
the device. It uses this information and the following equation to calculate the distance (L).
L=C×T/(2N) [m]
C : The speed of light in a vacuum 2.99792×10
T : The time measured from when the incident optical pulse was generated to when the
reflected light was received [s]
N : Index of refraction
In the above equation, the division by two accounts for the fact that the measured time represents the
total time taken by the optical pulse to reach the reflection point and to return from it.
If the correct index of refraction is not specified, there will be errors in the distance measurement.
Setting the Index of Refraction
The AQ7280 has preset indices of refraction that correspond to each wavelength. For details on the
settings, see section 4.1. Contact the optical fiber manufacturer for the optical fiber cable’s correct
index of refraction.
8
[m/s]
Distance Range
You must select a distance range that is longer than the cable length of the optical fiber cable that
you want to measure. As the distance becomes greater, the measurement time also increases. For
details on the setting range, see section 2.1.
Pulse Width
The following features are available depending on the length of the pulse width. The pulse width
that you can select varies depending on the distance range that you have specified. For details on
the settings, see section 2.1.
• Short Pulse Width
You can separate and measure adjacent events (reflection points and losses). However, you
cannot measure long distances.
• Long Pulse Width
You can measure long distances. However, multiple adjacent events may be seen as one single
event.
Pulse width
1-10
IM AQ7280-01EN
Page 16
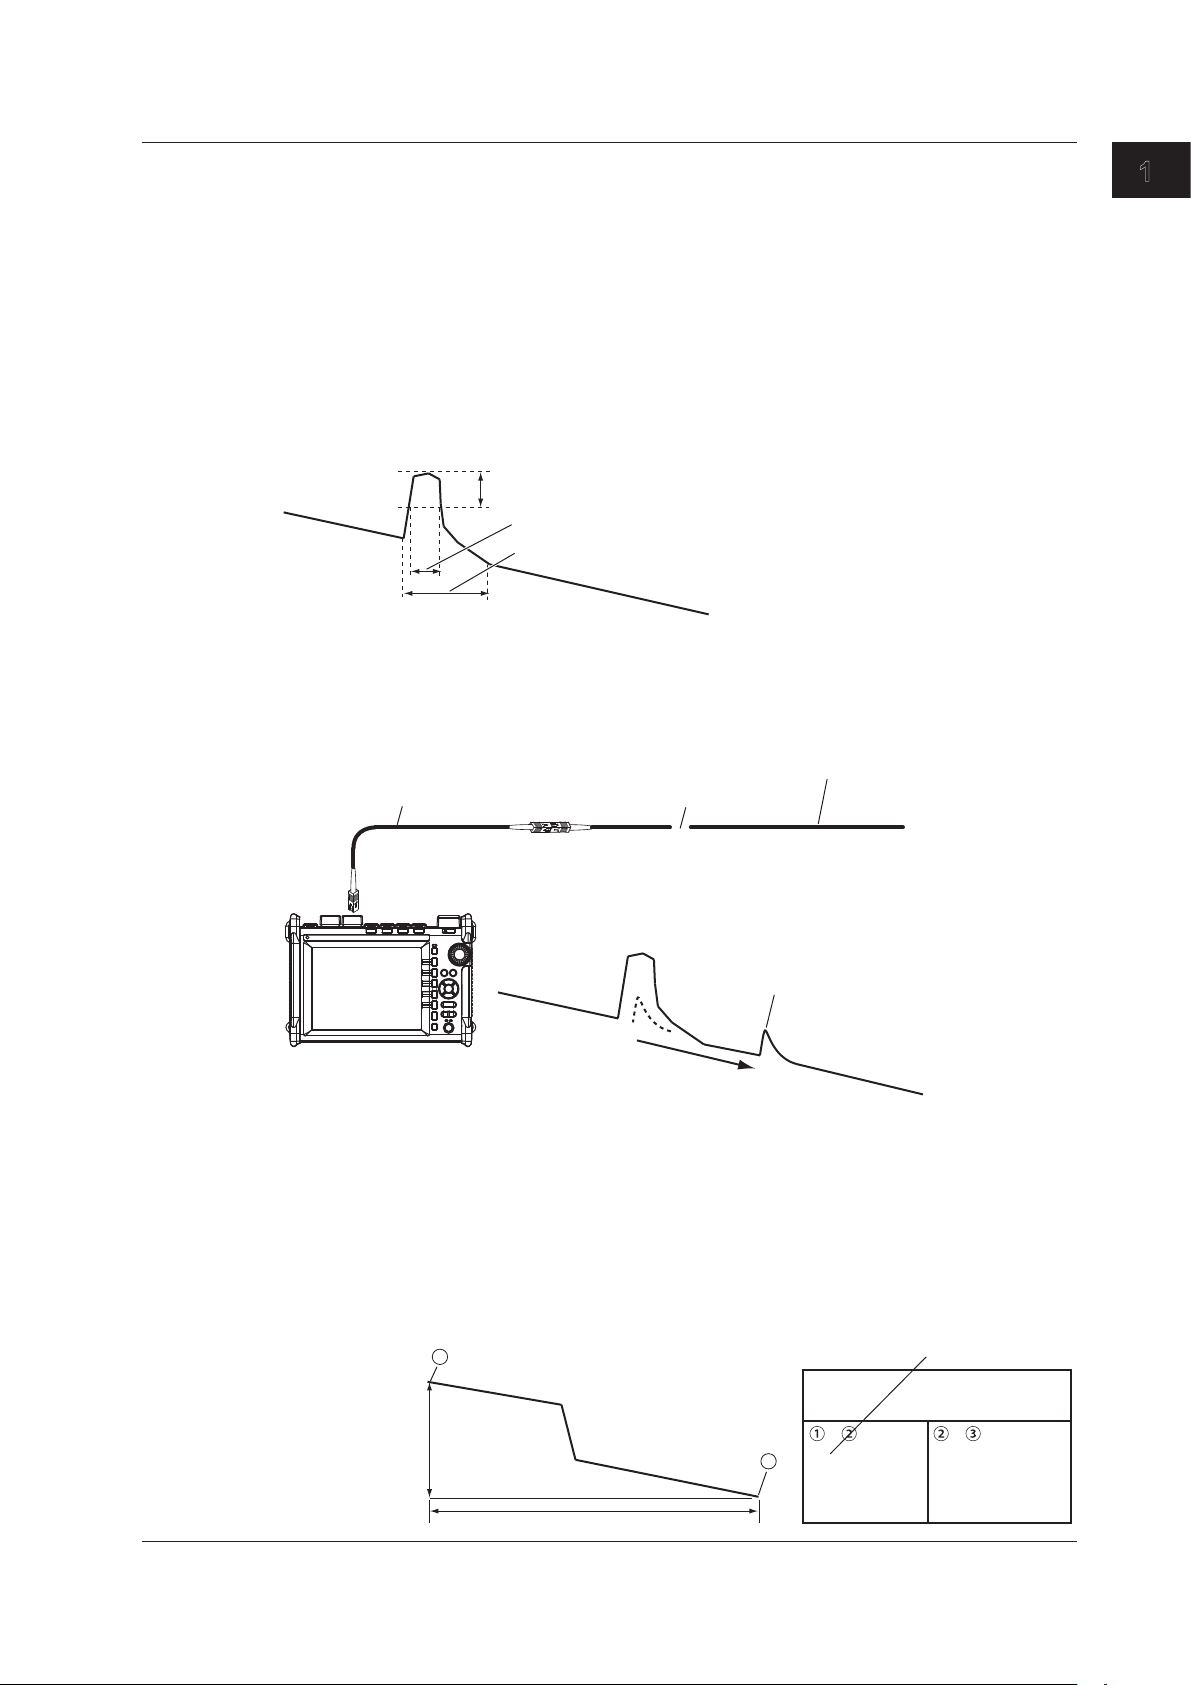
1.4 Optical Pulse Analysis
Dead Zone
An area where the influence of a large event such as a connector’s connection point makes it
impossible to recognize other events that exist in that area is a dead zone. There are the following
types of dead zones.
• Event Dead Zone
An area where adjacent reflections cannot be separated. This is the area represented by the
pulse width between the two points on the waveform at the level that is 1.5 dB below the peak
value.
• Attenuation Dead Zone
An area where, because there is a large reflection, the surrounding splice losses cannot be
measured.
Near-end Dead Zone Prevention
In sections where near-end reflection is detected, loss and reflections that occur at connections
cannot be detected. If you are measuring a short distance, connect a launch fiber cable to move
events that are hidden in the near-end reflection the distance of the launch fiber cable.
1
Features
1.5 dB
Event dead zone
Attenuation dead zone
AQ7280
Splice Loss
The AQ7280 measures the distance and the loss between the specified points.
2-point Method
The AQ7280 measures the distance and the loss between two points. If reflection is detected
between the two points, the return loss is also measured. The splice loss value changes depending
on the approximation method that you have specified. This can be used when Marker Mode is set
to Marker or Line.
Launch fiber cable
Do not bend the optical fiber cable.
Optical fiber cable being measured
Event generation point
Small reflection that was hidden
within a large reflection
IM AQ7280-01EN
Splice loss a (dB)
(Total loss)
1
(n when Marker Mode is set to Line)
(E when Marker Mode
is set to Line)
d (km)
Splice loss :
Return loss :
2
– –
20
20
1
dB
km
dB/km
Splice loss
1-11
Page 17
1
3
3
2
1
2
3
1.4 Optical Pulse Analysis
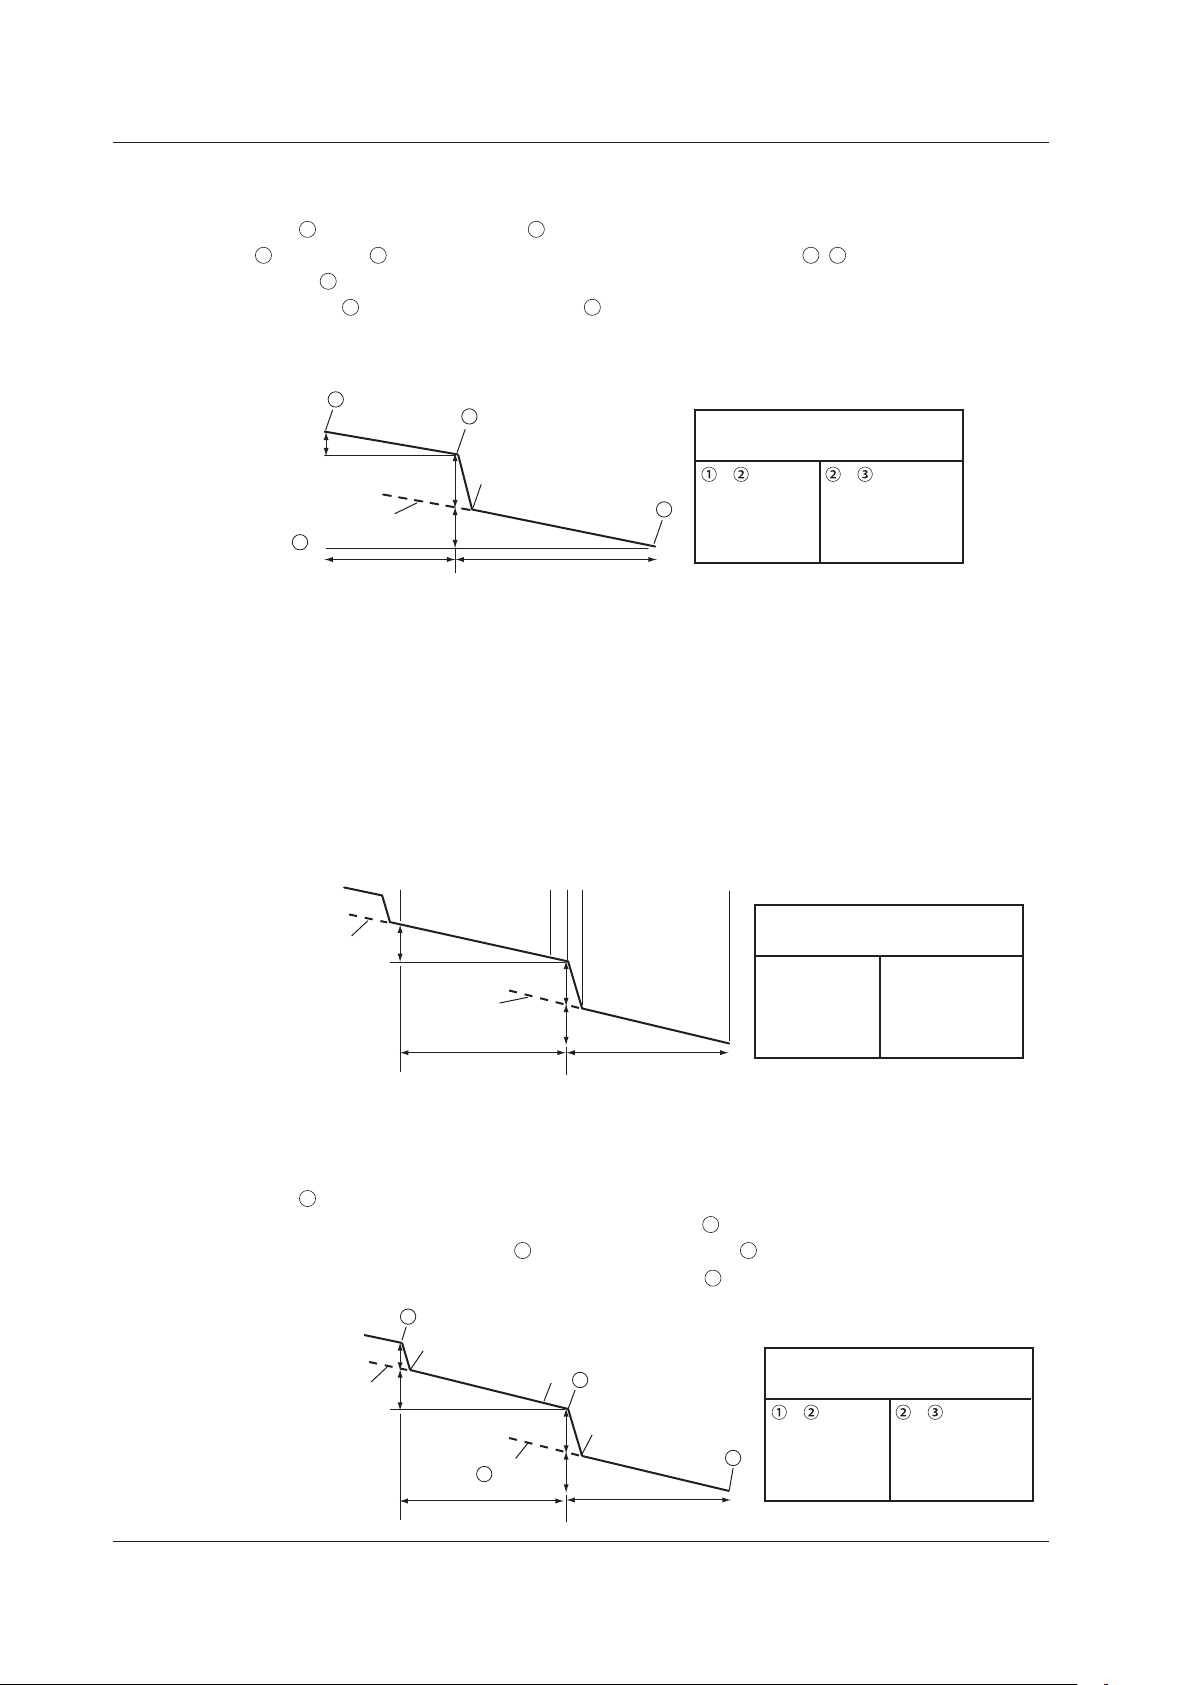
4-point Method
The AQ7280 uses the following four points to perform the measurement: the measurement start
point
, the splice loss start point 2, the splice loss end point Y2, and the measurement end point
. At position 2, the level difference between the approximated line 2–1 and the approximated
line Y2–
position of
approximation method that you have specified. This can only be used when Marker Mode is set to
Marker.
is calculated as the splice loss. The splice loss changes greatly depending on the
. Set the correct position for 2. The splice loss value changes depending on the
b (dB)
Approximated line
3
Y2 -
5-point Method
The AQ7280 uses the following five points to perform the measurement: the near-end point (n), a
point (N) that is used to calculate the near-end side's approximated line, a point (E) where splice
loss is detected, a point (F) that is used to calculate the far-end side's approximated line, and the
far-end point (f). At position E, the level difference between the approximated line n–N and the
approximated line F–f is calculated as the splice loss. The splice loss changes greatly depending
on the position of E. Set the correct position for E. The splice loss value changes depending on the
approximation method that you have specified. This can only be used when Marker Mode is set to
Line.
Approximated
line n - N
1
c (km) f (km)
n
b (dB)
Approximated
line F - f
a (dB)
e (dB)
2
Y2
c (km)
N f F
a (dB)
e (dB)
dB
km
dB/km
a dB
–
e
f
e/f
dB
km
dB
km
dB/km
a dB
e
f
e/f
dB
km
dB/km
Splice loss :
Return loss :
–
b
3
c
b/c
E
f (km)
dB/km
Splice loss :
Return loss :
n-E E-f
b
c
b/c
6-point Method
The AQ7280 measures using the 6-point method when there are two adjacent splice loss events.
The AQ7280 uses the following six points to perform the measurement: the first splice loss start
point
, start point Y1 used to calculate the approximated line, end point Y3 used to calculate
the approximated line, the second splice loss start point
and the measurement end point
. At the position of marker 2, the level difference between the
approximated line Y1–Y3 and the approximated line Y2–
1
Y1
Y3
a (dB)
e (dB)
2
Y2
f (km)
Approximated
line Y1 - Y3
b (dB)
Approximated
line Y1 -
3
c (km)
1-12
, the second splice loss end point Y2,
3
is calculated as the splice loss.
dB
km
a dB
–
e
f
dB/km
e/f
IM AQ7280-01EN
Splice loss :
Return loss :
b
3
c
b/c
–
dB/km
dB
km
Page 18
End A
End B
End A End B
End A End B
1.4 Optical Pulse Analysis
Return Loss
Return loss RL is the ratio, in dB, of the reflected optical power level Pr to the incident optical power
level Pi. It is calculated using the following equation. The larger the return loss, the smaller the
reflected optical power. This implies that the performance of the measured optical line is good.
RL = –10log(Pr/Pi) [dB]
Multi Trace Analysis
You can load up to four waveforms that have been measured on the AQ7280 and display them
simultaneously for comparison. You can adjust the vertical display position of each loaded waveform.
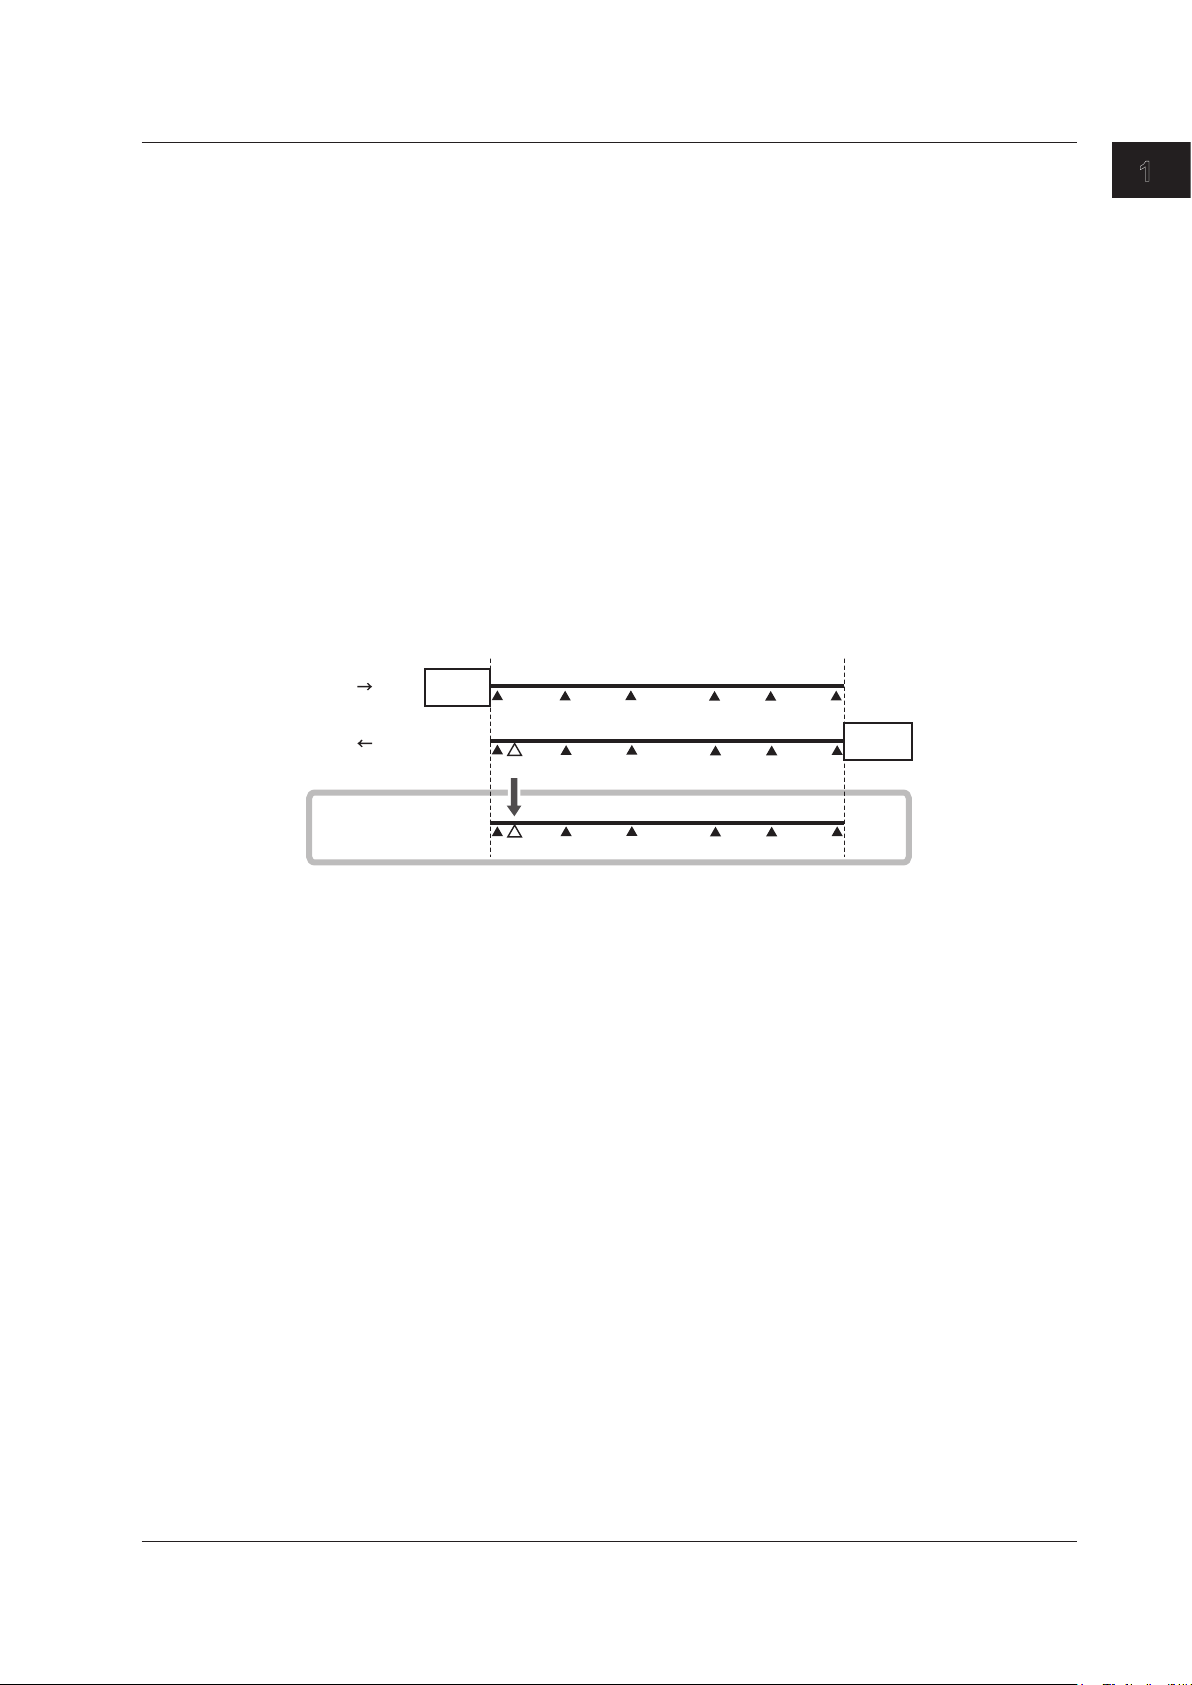
2 Way Trace Analysis
Waveform events that have been measured from optical fiber cable end A to end B and those
measured from end B to end A can be combined. This combination enables displaying of events that
could not otherwise be measured because of dead zones.
In the figure below, the event that is in the near-end dead zone (point S) when measured from end A
is detected as event number 5 when measured from end B. In the 2 way trace analysis display, it is
displayed as event number 1.
AQ7280
S 1 2 3 4 E
5
1
Features
AQ7280
S1234E
2 way trace analysis
S
2 3 4 E5
1
An event of the other waveform that exists within 6% of the position of an event of the current trace will
be considered part of the current trace event.
If multiple events of the other waveform that exists within 6% of the position of an event of the current
trace, the closest event will be considered part of the current trace event.
Waveforms that meet the following conditions can be combined.
• Both have the same wavelength.
• Both have the same pulse width.
• Their end position offset is within 6%.
• Both have event lists.
IM AQ7280-01EN
1-13
Page 19
S E
Measurement
1.4 Optical Pulse Analysis
Differential Trace
You can load two waveforms that have been measured on the AQ7280 and display their difference as
a waveform.
The screen can display the loaded waveforms and the differential trace simultaneously.
The differential trace is the result of subtracting the values of the current trace from those of the other
trace.
You can use markers to read the following values of the differential trace.
• Loss between markers (dB)
• Distance between markers (km)
• Loss per unit distance between markers (dB/km)
• Distance to each marker
Section Analysis
You can set two markers, start point S and end point E, to measure the return loss and total loss in the
section that you have specified. By setting reference point B, you can calculate the return loss using
the backscatter level you specify.
Event Analysis
You can search for events in the optical pulse measurement waveform and measure the splice loss
and the return loss.
Editing Events
You can insert and delete events on the event screen. When you edit an event marker, the splice loss
and the return loss can be recalculated.
reference point
S
B
Event number 1
1
Event number 2
2
Event E detected
as the end of fiber
E
E E E
1-14
Editing Event Lists
You can set indices of refraction for each event period on the event list. Setting the indices of refraction
in accordance with the connected optical fiber cable makes accurate distance measurements possible.
These indices only affect event analysis. The do not affect the waveform display.
You can also change event distances. However, the events shown on the screen will not change.
IM AQ7280-01EN
Page 20

1.5 Light Source and Optical Power Meter
Loss-Measurement Light Source
The loss-measurement light source feature can be applied to the /SLS option of the OTDR unit.
The following measurement light wavelengths can be generated.
Model Measurement Light Wavelength Model Measurement Light Wavelength
AQ7282A
AQ7283A AQ7283H
AQ7284A AQ7284H
AQ7285A AQ7283J
AQ7283E 1310 nm, 1550 nm, 1625 nm AQ7283K 1310 nm, 1490 nm, 1550 nm, 1625 nm
AQ7283F 1310 nm, 1550 nm, 1650 nm AQ7282M 850 nm, 1330 nm
* Not applicable for 1383 nm for AQ7283J.
1310 nm, 1550 nm
You can produce continuous light or light that has been modulated at the selected frequency (modulation
mode).
Visible Light Source
The visible light source feature can be applied to OPM modules with a visible light source and to VLS
modules.
Visible light can be used for the following purposes.
• Determine visually breaks in the optical fiber cable under test
• Check the cores of multi-core optical fiber cables
Model Measurement Light Wavelength
AQ2780V
650 nmAQ2781V
AQ4780
AQ7282G 1310 nm, 1490 nm, 1550 nm
1310 nm, 1550 nm, 1625 nm
*
1310 nm, 1550 nm, 1625 nm
1
Features
Optical Power Meter
The optical power meter feature can be applied to OPM modules.
OPM modules are used as optical power meters for measuring loss and the power of the
communication light.
The following measurement lights can be measured.
Model Measurement Wavelength
AQ2780
AQ2780V
AQ2781
AQ2781V
800 nm to 1700 nm (in 1 nm steps)
Logging
The logging feature can be applied to OPM modules. This feature measures short-term optical
power stability. The optical power value during logging can be displayed on a graph, and you can
calculate the maximum, minimum, and average. In addition, you can use cursors to calculate the
optical power at a specified location or the maximum, minimum, and average within a specified
area. The logging results can be saved to memory in CSV format.
Power Checker (/PC option)
The /PC option of OTDR units is used as a power checker.
The following measurement lights can be measured.
Model Measurement Wavelength Model Measurement Wavelength
AQ7282A
AQ7283A AQ7283H
AQ7284A AQ7284H
AQ7285A AQ7283J
AQ7283E
AQ7283F
* Not applicable to the port 2 of AQ7283E and AQ7283F.
1310 nm, 1490 nm, 1550 nm, 1625 nm,
1650 nm
*
*
AQ7282G
1310 nm, 1490 nm, 1550 nm, 1625 nm,
1650 nm
AQ7283K
IM AQ7280-01EN
1-15
Page 21

1.6 File Operation and Printing
File Operation
Measured results (waveform data, screen images, etc.), measurement and analysis conditions, system
settings, and the like can be saved as files to internal memory or external memory (USB memory
and SD card). You can efficiently configure multiple AQ7280s to the same conditions by loading a
file containing measurement and analysis conditions, system settings, and the like. In addition, the
AQ7280 can save measured waveform data as PDF data in report format.
Saving and Loading Files
The following types of files can be saved.
• .SOR
A file for saving optical pulse measurement results. Measurement and analysis conditions,
waveform data, event list data (when event analysis is executed) are stored in this file. When an
SOR file is loaded, the measurement and analysis data is loaded into the AQ7280, the waveform
data is displayed on the AQ7280 screen, and the event analysis results are displayed if event
list data is stored in the file. This file is useful when you want to save an SOR file at a site where
optical fiber cables are being installed and load the file into another AQ7280 at a different site.
• .SET
A file for saving the optical pulse measurement and analysis conditions. This file does not
include waveform data or event list data. Loading this file into the AQ7280 causes the saved
measurement and analysis conditions to be applied to it. This file is useful when you want to set
several AQ7280s to the same measurement and analysis conditions.
• .BMP, .JPG
A file for saving a screen image of the AQ7280. This file is useful when you want to view the
screen content on the PC screen. BMP and JPG files cannot be loaded into the AQ7280.
• .CFG
A file for saving the AQ7280 system settings (device, connection, etc.). This file is useful when
you want to apply the same system settings to several AQ7280s.
• .CSV
A file for saving the results of optical pulse measurement or optical power meter measurement in
ASCII format.
Measurement and analysis conditions are stored at the front of the file, and then data is stored in
a comma-separated format.
This file is useful when you want to analyze the data using a spreadsheet application on the PC.
• .PDF
A file for saving the current waveform displayed on the AQ7280 screen or waveform data of an
already saved file in a PDF report format.
1-16
The following types of files can be loaded depending on the feature that you are using.
• Top screen (.CFG)
• OTDR feature (.SOR, .SET)
• Optical power meter feature (.CSV)
• Schedule measurement feature (.CSV)
• Multi-core fiber measurement feature (.MPJ)
• OTDR Smart Mapper (.SMP)
SOR files saved with the AQ7275 series or AQ1200 series can also be loaded.
IM AQ7280-01EN
Page 22

1.6 File Operation and Printing
Copying and Deleting Files
You can copy or delete all the files and folders in the internal memory or external memory. You can
also copy or delete selected files or folders.
Renaming Files
You can rename existing files and folders.
Creating Folders
You can create a folder with a name of your choice in which optical pulse measurement results
are saved automatically. You can automatically save measured results to the specified folder by
setting the destination folder mode to UserDefine and selecting a folder that you created in the
measurement condition settings in section 2.1.
Creating Reports
You can save the current optical pulse measurement and analysis conditions, waveforms, and
events as a report on a single sheet in a PDF file. You can choose which items to include in the
report.
File Reporting
You can specify several saved SOR files and save the content of the files one at a time as a report
on a single sheet in a PDF file. You can choose which items to include in the report.
1
Features
Selecting Drives
You can set the save destination to the following internal and external memories.
• Internal Memory
The memory inside the AQ7280. The size is 480 MB. It cannot be removed.
• USB Memory 1, USB Memory 2
USB storage media. Up to two media can be connected.
• SD Card
SD cards are not included with the AQ7280. Please use your own SD cards.
Printing
You can print the screen image of measured results to a printer.
The following printers can be used.
• Seiko Instruments printers (thermosensitive, black and white printing)
• HP printers (color/black and white printing)
• Epson printers (color/black and white printing)
Printing
Screen images of waveform data and analysis condition screen can be printed. In addition, the time
of measurement and event list can be added to screen images (when a Seiko Instruments printer is
connected). Note file list screens cannot be printed.
IM AQ7280-01EN
File Printing
You can specify several saved SOR files and print screen images one at a time.
1-17
Page 23

1.7 System Features
Power-Save Mode
To suppress battery consumption, you can set the screen brightness and a screen saver. You can
set different screen brightness levels for battery operation and AC adapter operation.
LCD Brightness
You can select from four brightness levels (including OFF). You can choose the appropriate level
depending on the ambient light during outdoor use. In addition, when using the optical fiber cable
monitoring (/MNT option) feature, the optical power meter’s logging feature, or the like, you can turn
off the display except when viewing the measured data to suppress battery consumption.
Auto Power Off
When battery operated, the AQ7280 can be automatically shut down if no key operation, touch
operation, communication command input, or the like is detected for a certain period of time when
measurement is not in progress.
Screen Saver
When battery operated, the backlight can be automatically turned off if no key operation, touch
operation, communication command input, or the like is detected for a certain period of time when
measurement is not in progress.
Factory Default Settings
• Setup
The following setup conditions are reset to their factory defaults. Note that files in the internal
memory are not deleted.
• Mode
• Measurement settings
• Analysis settings
• OTDR settings
• Optical power meter settings
• Visible light source settings
• System settings (except the date and time)
• All
All the above setup conditions are reset to their factory defaults. All the files in the internal
memory are deleted.
Operation Restrictions
You can set a PIN to restrict the following operations. This feature prevents settings from being
changed or laser light to be emitted by mistake.
• Mode
Changing from Simple Mode to another mode
• Laser light output
When an operation to emit the following laser light is performed
• Optical pulse
• Measurement light
• Visible light
1-18
IM AQ7280-01EN
Page 24

1.7 System Features
Network Settings (/LAN option)
You can use the Ethernet port to send communication commands from a PC to the AQ7280 or
download measured results in the AQ7280 internal memory to a PC.
• User Name and Password
Set user names and passwords for authenticating connections from PCs to the AQ7280.
• Timeout Period
If a communication command is not sent from a PC or measured results are not downloaded
within the timeout period, the AQ7280 releases the network connection.
• TCP/IP
Set network address information.
• Enabling and Disabling Network Connection
Remote control can be disabled. When disabled, a PC cannot connect to the AQ7280.
Other Features
• Language Selection
If you are using an AQ7280 with a language suffix code that supports multiple languages, you
can change the language used on the screen. For details on suffix codes, see the Getting
Started Guide, IM AQ7280-02EN.
• Start Menu
You can start the AQ7280 with the screen of a feature that you were using previously.
• Top Menu
The top menu is displayed after startup.
• Start Menu to Last Function
The menu of the feature that you were using immediately before you turned off the AQ7280
the last time is displayed after startup.
The waveform data that was displayed then is not displayed.
• Display Color
You can set the screen color (color or black and white).
• Touch Control
You can turn the touch panel control on and off.
• Alarm
The AQ7280 can generate sound when the rotary knob is turned or when an operation error
message is displayed.
• UTIL Key Selection
You can assign one of the following features to the UTIL key. You can execute a feature that you
use often with a single button.
• Save (see section 6.3)
• Print (see section 6.10)
• Report (see section 6.8)
• Utility menu screen (see section 2.10)
• Power meter (see section 5.2)
• Power checker (see section 5.2)
• Light source (see section 5.1)
• Visible light source (see section 5.1)
• Fiber inspection probe (see section 8.6)
• File name assignment (see section 6.5)
• File List Setting
You can select how file lists are displayed.
Detail, file name only, user defined
1
Features
IM AQ7280-01EN
1-19
Page 25

1.7 System Features
• USB (TypeB_mini)
You can use USB port type B to send communication commands from a PC to the AQ7280 or
• Version Update
You can update the firmware by storing a new firmware in a USB memory device and connecting
• Self-Test
Degradation of the AQ7280 touch panel, internal memory status, and so on can be diagnosed.
download measured results from the AQ7280 internal memory or SD card to a PC.
it to USB port type A.
Optical performance cannot be diagnosed.
1-20
IM AQ7280-01EN
Page 26
1
Chapter 2 Optical Pulse Measurement (OTDR)
2.1 Setting the Measurement and Analysis Conditions
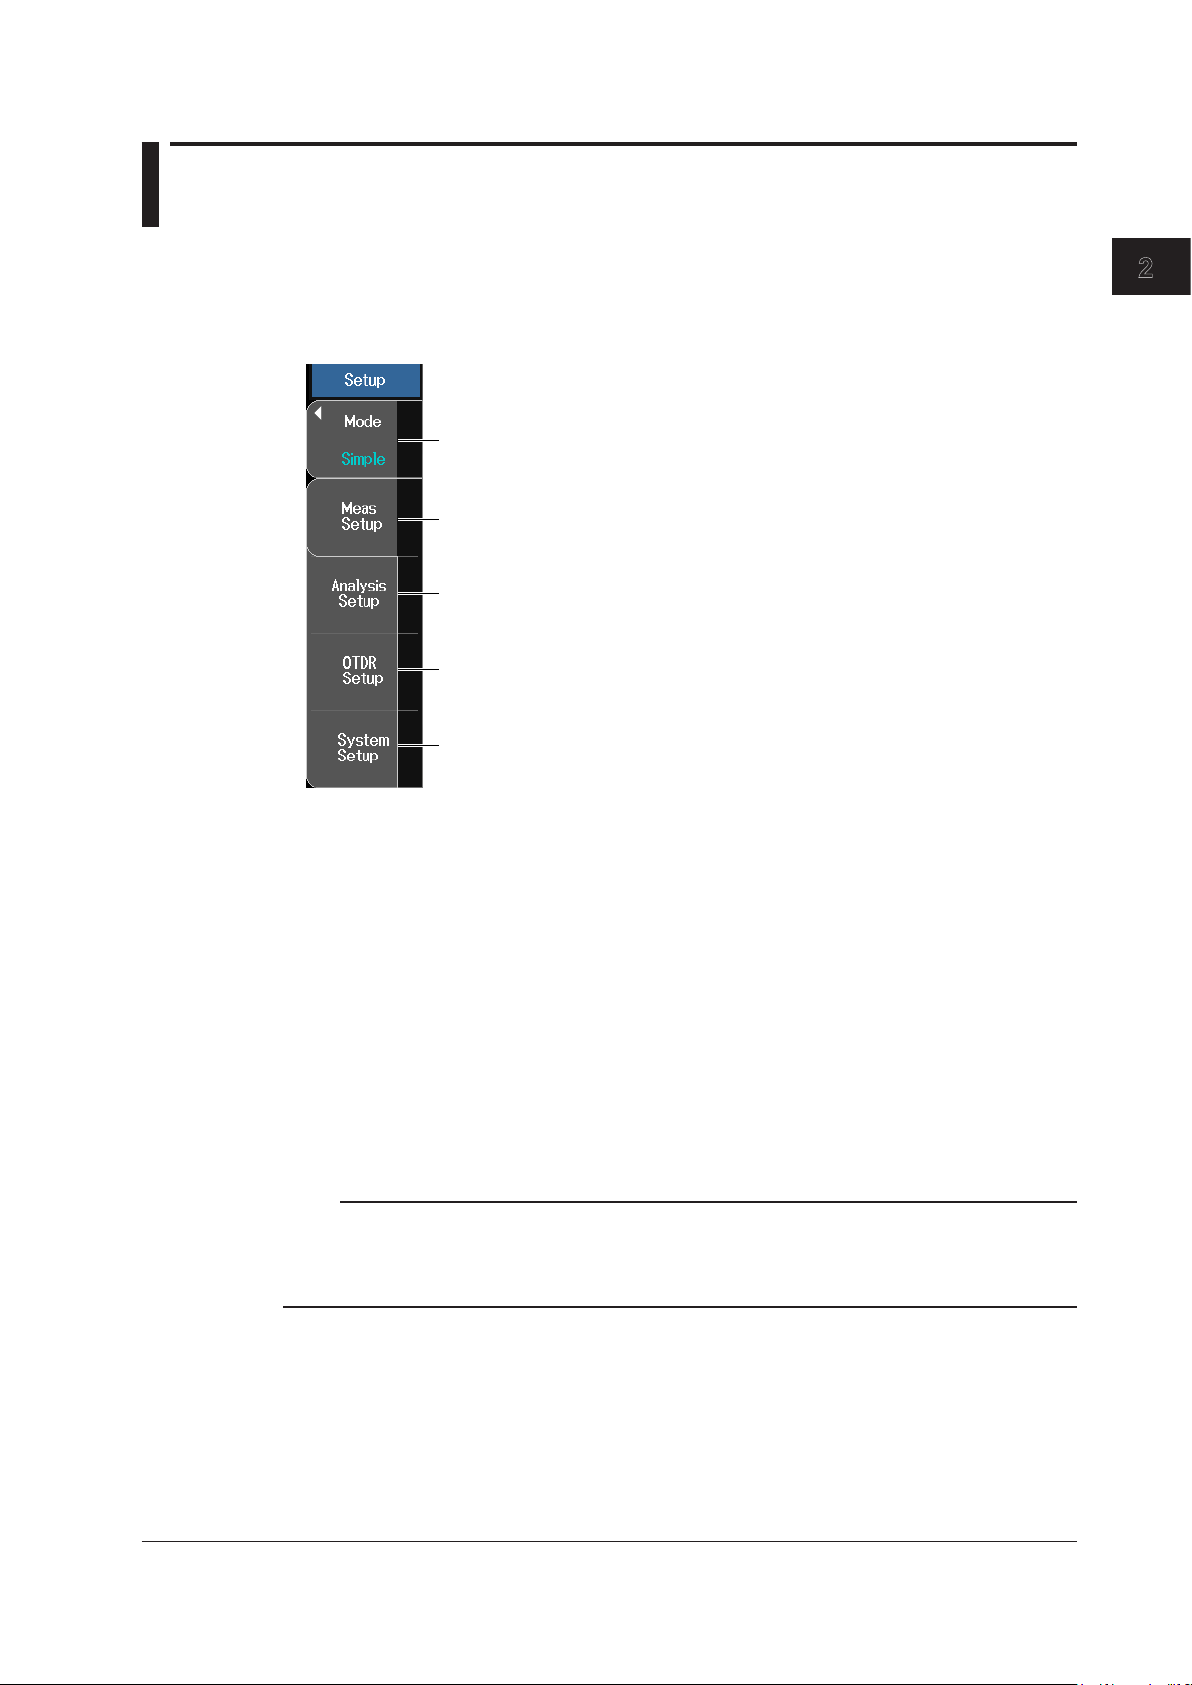
Setup Menu
1.
2.
Setting the Measurement Mode
Simple: In Simple mode, you set only a portion of the measurement and analysis conditions
Detail: In Detail mode, you set the measurement and analysis conditions individually. If you set
PON: In PON mode, the AQ7280 determines the suitable measurement and analysis conditions
From the top menu, select OTDR.
Press SETUP to display the Setup menu.
Set the measurement mode (Simple, Detail, PON).
Set the measurement conditions.
Set the analysis conditions.
Configure the waveform display.
See section 3.2.
Configure the system.
See chapter 7.
(wavelength, approximation method, etc.), and the AQ7280 automatically detects and sets the
rest of the measurement conditions related to measurement resolution—such distance range
and pulse width—and analysis conditions related to the optical fiber cable—such as index of
refraction and backscatter.
the measurement conditions—such as the distance range and pulse width—to Auto, the
AQ7280 will determine the suitable range and perform the measurement like in Simple Mode,
described above.
based on the number of optical splitter stages, route information, and distance range to set
the optimal values. These values can be changed if necessary.
2
Optical Pulse Measurement (OTDR)
Note
When you change from Simple mode to Detail or PON mode, you may be asked to enter a password. This
means that there are restrictions placed on operating the AQ7280. To change the measurement mode,
you need to verify with the AQ7280 administrator. For details on operation restrictions, see “Operation
Restrictions” in section 7.6.
IM AQ7280-01EN
2-1
Page 27
Wavelength of the optical
2.1 Setting the Measurement and Analysis Conditions
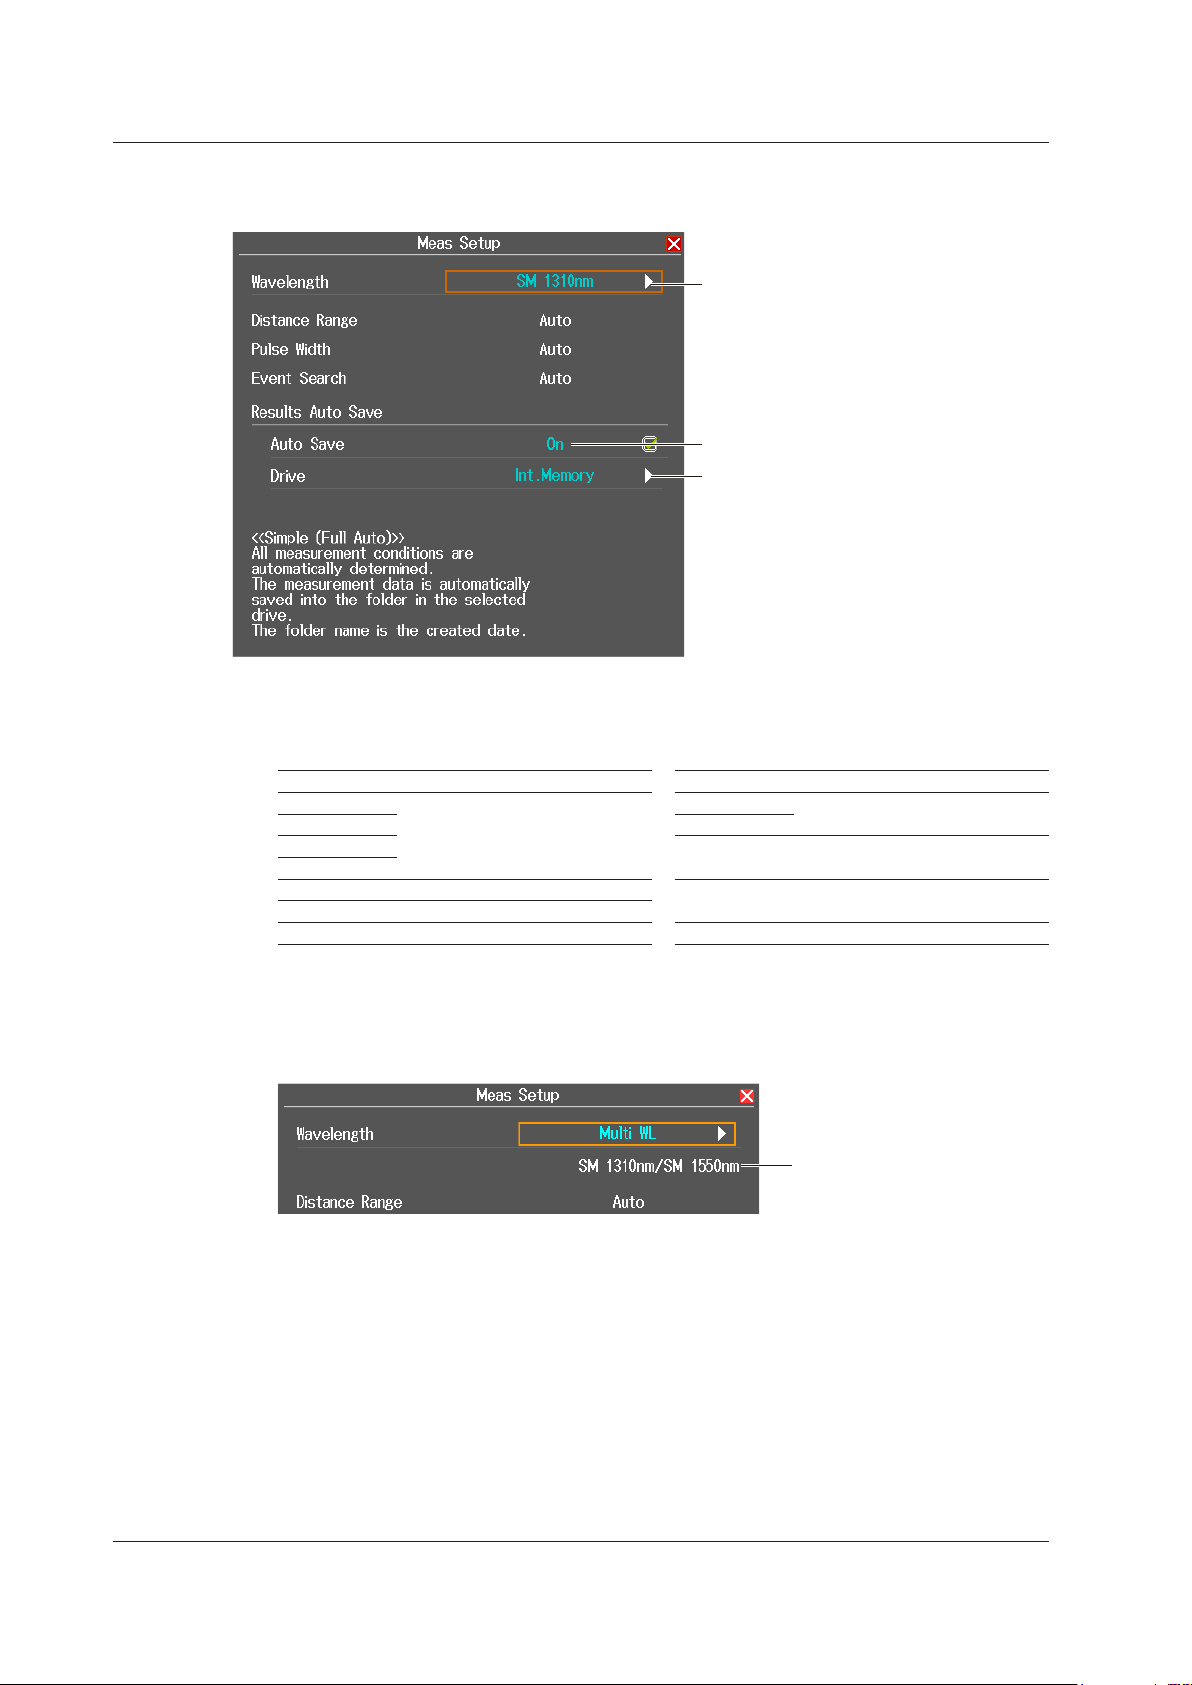
Setting Measurement Conditions in Simple Mode
Press the Meas Setup soft key to display the following screen.
Set the wavelength (850nm, 1300nm,
1310nm, 1383nm, 1490nm, 1550nm,
1625nm, 1650nm,
multi wavelength measurement).
The available options vary depending on
the OTDR unit.
Set auto save (OFF, ON).
Select a drive (Int. Memory, SD card,
USB memory 1, USB memory 2).
Selectable when auto save is ON.
Wavelength
• 850 nm, 1300 nm, 1310 nm, 1383 nm, 1490 nm, 1550 nm, 1625 nm, 1650 nm
Depending on the OTDR unit, you can set the following wavelengths.
Model Optical Pulse Wavelength Model Optical Pulse Wavelength
AQ7282A
AQ7283A AQ7284H
AQ7284A AQ7283J 1310 nm, 1383 nm, 1550 nm,
AQ7285A
AQ7283E 1310 nm, 1550 nm, 1625 nm AQ7283K 1310 nm, 1490 nm, 1550 nm,
AQ7283F 1310 nm, 1550 nm, 1650 nm
AQ7282G 1310 nm, 1490 nm, 1650 nm AQ7282M 850 nm, 1300 nm
1310 nm, 1550 nm
• Multi Wavelength Measurement
In a single measurement, multiple supported wavelengths are measured one at a time.
If multi wavelength measurement is selected, the wavelength of optical pulse being measured is
displayed on the screen.
AQ7283H
1310 nm, 1550 nm, 1625 nm
1625 nm
1625 nm
2-2
pulse being measured
Auto Save
After an optical pulse measurement is complete, the measurement waveform is automatically
saved. The AQ7280 creates a folder using the current date for its name in the root folder of the drive
and saves the file.
Drive
Folders are automatically created. File names are automatically assigned. For details on file names,
see section 6.3.
IM AQ7280-01EN
Page 28
1
2.1 Setting the Measurement and Analysis Conditions
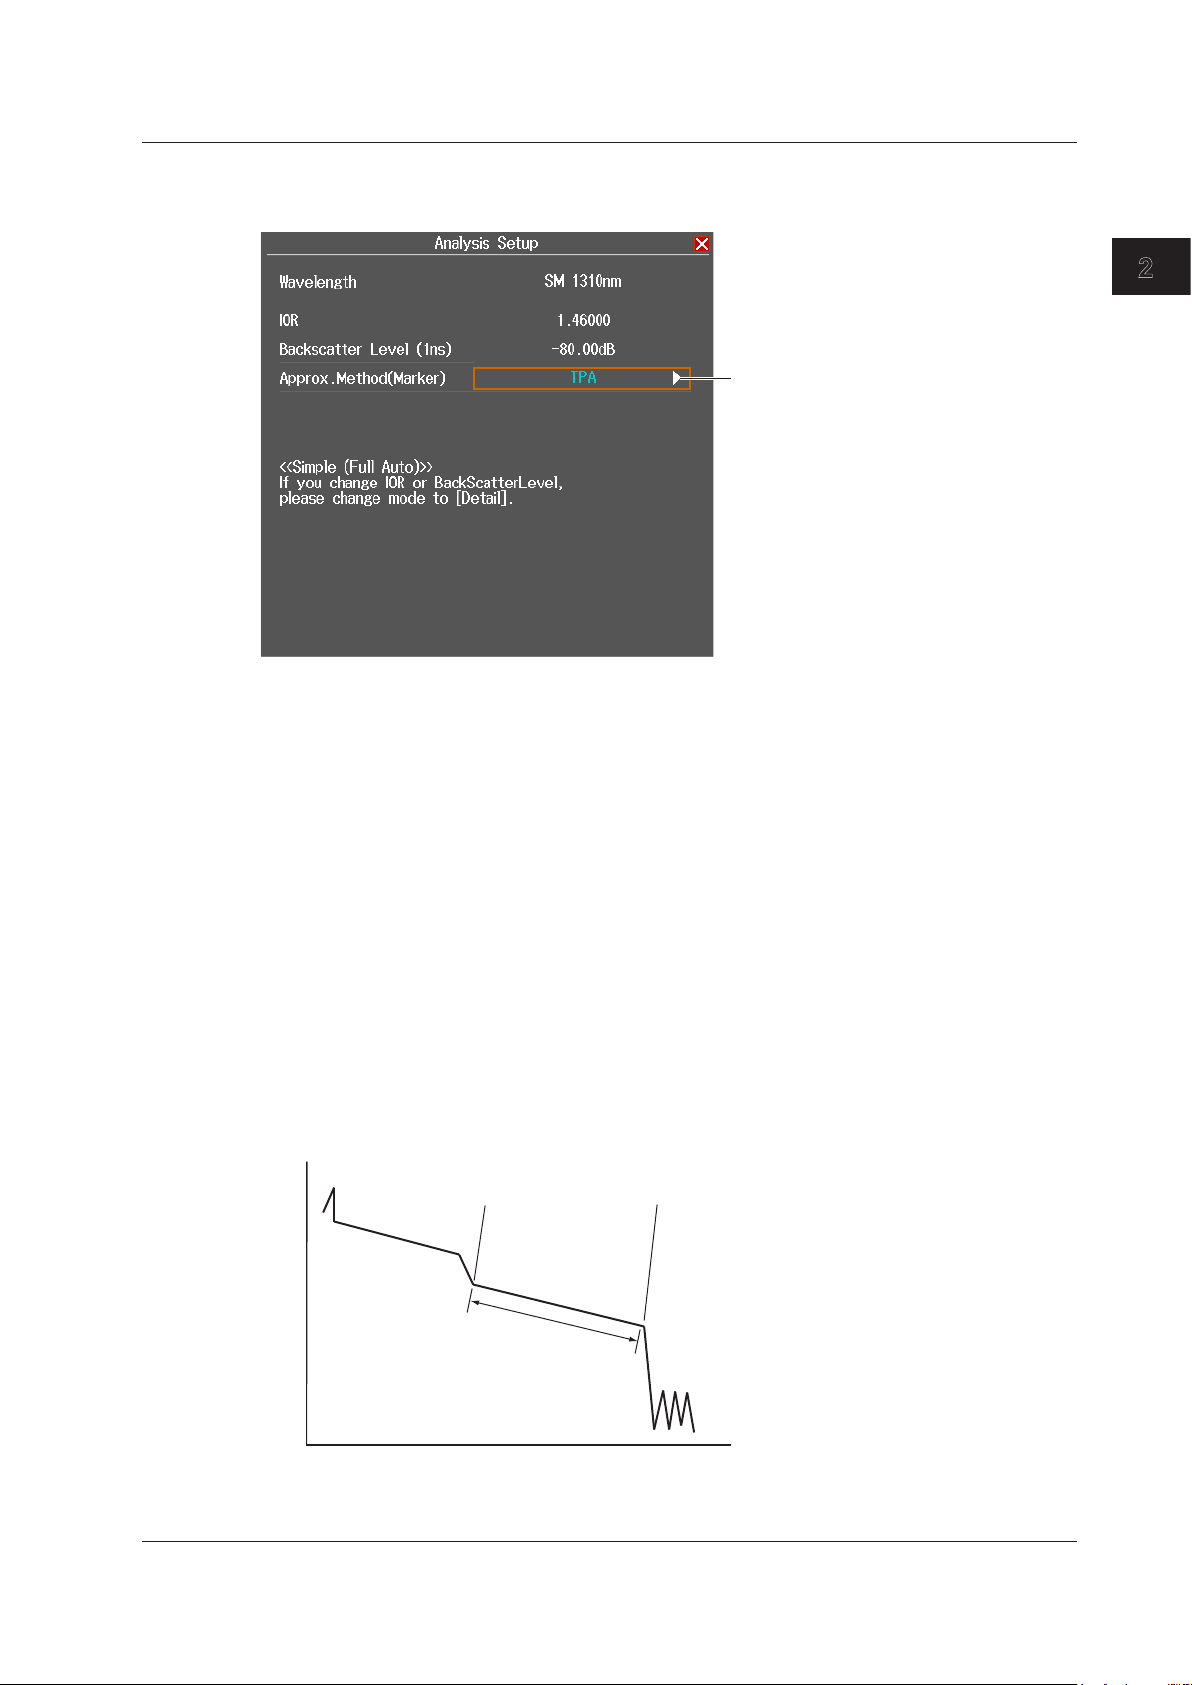
Setting Analysis Conditions in Simple Mode
Press the Analysis Setup soft key to display the following screen.
2
Optical Pulse Measurement (OTDR)
Set the approximation
method (LSA, TPA).
Approximation Method
When the AQ7280 calculates splice loss, it extrapolates straight lines. These straight lines are
known as approximated lines.
There are the following two kinds of approximated lines.
• Least squares approximation (LSA)
• Two point approximation (TPA)
• LSA
The AQ7280 calculates the loss between two points by using the least squares method on all the
This method has the following characteristics.
Merits: Because all the data between the two points is used, errors in the calculated value
Demerit: If a large reflection or splice loss is present in the section whose loss is being
If no events such as reflections and splice losses are present in the section being calculated, the
data between the two points (between 1 and 2).
are small. Fluctuations in the calculated values are reduced, and highly reproducible
values can be obtained.
calculated, those values are also included in the calculation, so large errors result.
LSA provides a value that has a smaller degree of error than the TPA.
1 2
Approximated line
calculation range
IM AQ7280-01EN
2-3
Page 29
2.1 Setting the Measurement and Analysis Conditions
• TPA
The AQ7280 uses the difference between the levels of the two specified points to calculate
the loss. The level of fluctuation and reproducibility in the calculated value may vary greatly. If
events such as reflections and splice losses are present in the section being calculated, the TPA
provides a value that has a smaller degree of error than the LSA.
1
Approximated line calculation points
2
2-4
IM AQ7280-01EN
Page 30
1
Set the average duration (Auto, 5sec, 10sec, 20sec,
1 The available options vary depending on the OTDR unit.
2.1 Setting the Measurement and Analysis Conditions
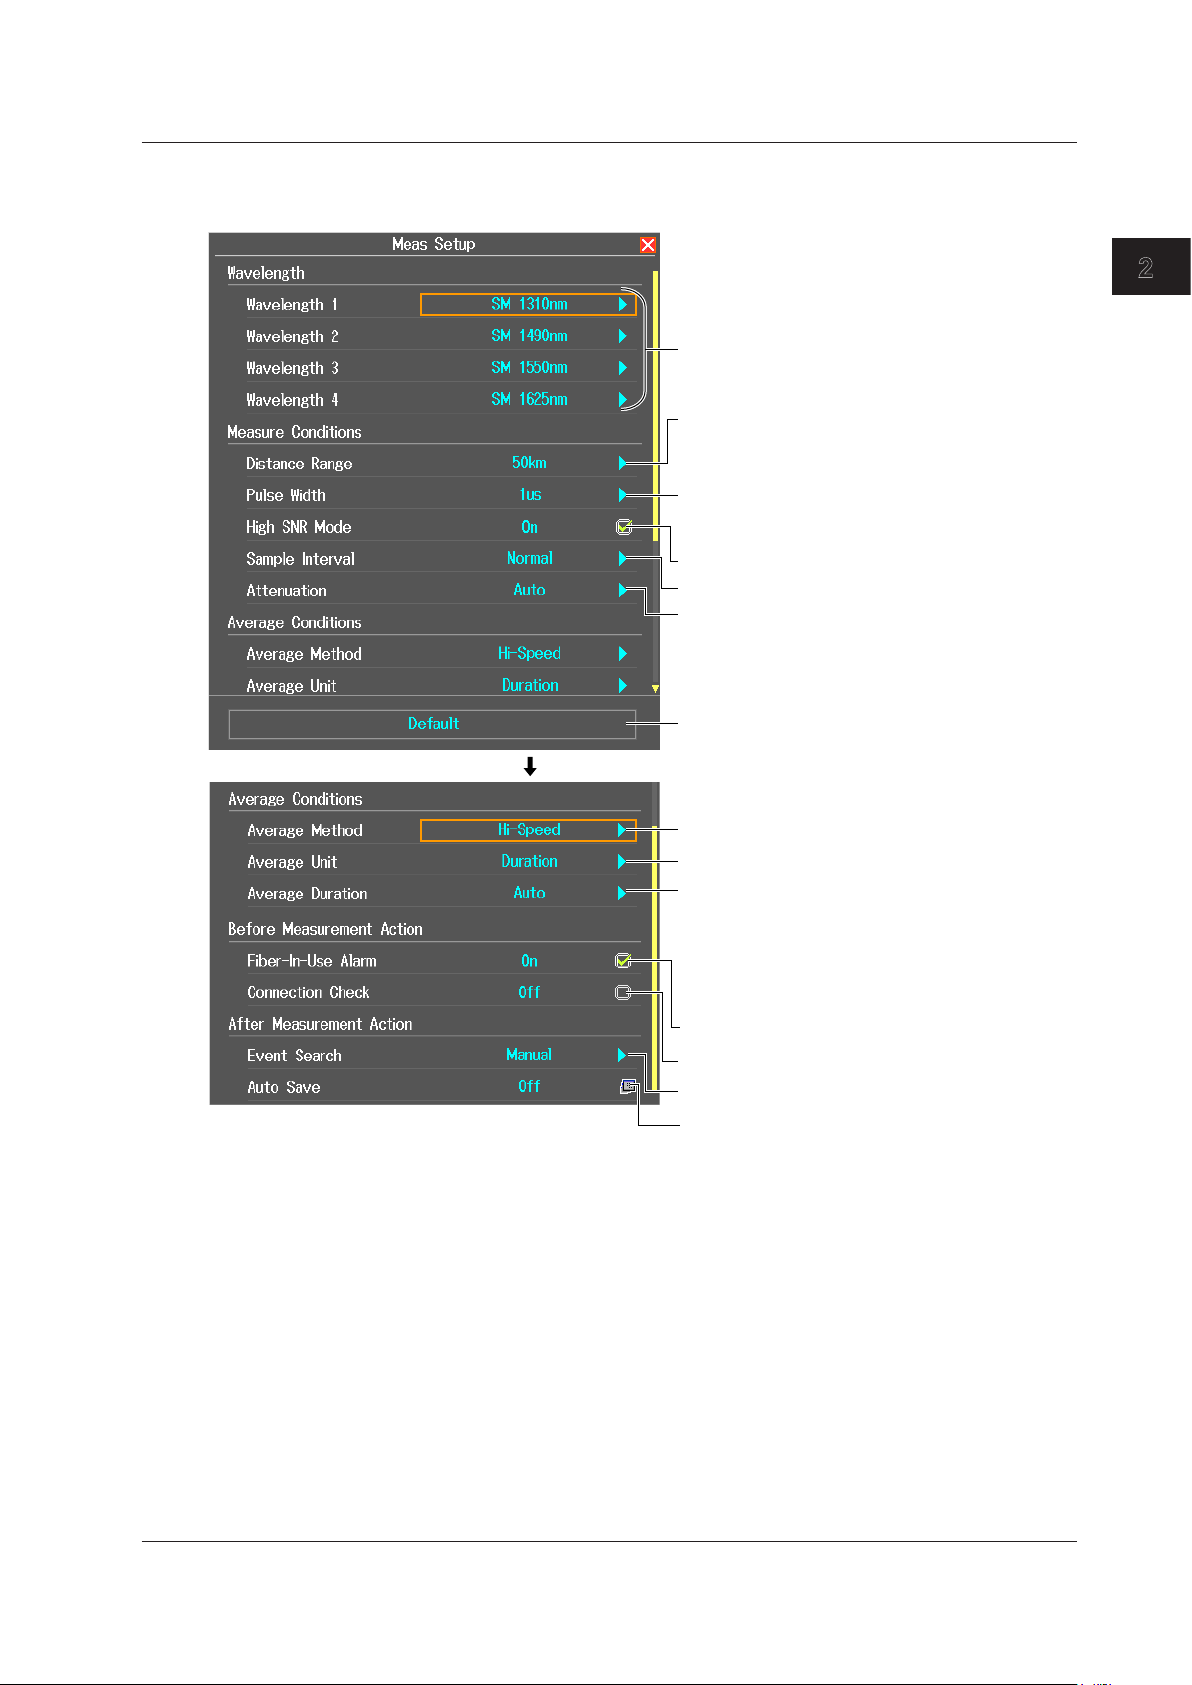
Setting Measurement Conditions in Detail Mode
Press the Meas Setup soft key to display the following screen.
Set the wavelength1 (850nm, 1300nm, 1310nm,
1383nm, 1490nm, 1550nm, 1625nm, 1650nm).
Set the distance range1 (Auto, 200m, 500m,
1km, 2km, 5km, 10km, 20km, 30km, 50km,
100km, 200km, 300km, 400km, 512km).
Set the pulse width1 (Auto, 3ns, 10ns, 20ns,
30ns, 50ns, 100ns, 200ns, 300ns, 500ns,
1μs, 2μs, 5μs, 10μs, 20μs).
Set the high SNR mode (OFF, ON).
Set the sample interval (Normal, High Resolution).
Set the attenuation1 (Auto, 0.00dB, 2.50dB,
5.00dB, 7.50dB, 10.00dB, 12.50dB, 15.00dB,
17.50dB, 20.00dB, 22.50dB, 25.00dB, 27.50dB,
30.00dB).
Executes initialization
Press to reset the measurement settings to
their factory defaults.
When the screen is scrolled
2
Optical Pulse Measurement (OTDR)
Set the average method (Hi-Speed, Hi-Reflection).
Set the average unit (Duration, Times).
When the average unit is set to Duration:
30sec, 1min, 3min, 5min, 10min, 20min, 30min).
When the average unit is set to Times:
Set the average count (Auto, 2^10, 2^11, 2^12,
2^13, 2^14, 2^15, 2^16, 2^17, 2^18, 2^19, 2^20).
Set the fiber-in-use alarm (OFF, ON).
Set the connection check (OFF, ON).
Set the event search (Auto, Manual).
Set auto save (OFF, ON).
Wavelength
The wavelengths set in Wavelength 1 to Wavelength 4 are measured one at a time (multi
wavelength measurement). You can set only the wavelengths of the same OTDR port.
For the wavelengths that you can set, see page 2-2.
IM AQ7280-01EN
2-5
Page 31

2.1 Setting the Measurement and Analysis Conditions
Distance Range
Set the distance range according to the length of the optical fiber cable. The distance range that you
can select varies depending on the wavelength. Specify a distance range value that is greater than
the length of the optical fiber cable that you will measure. If you specify a shorter value, the AQ7280
will not be able to perform measurements properly. The longer the distance that you specify, the
more time measurements will take. When you specify the distance range, the optimum pulse width
and attenuation values are set automatically.
Cable Length Distance Range Notes
Unknown Auto
0 m to 160 m 200 m
160 m to 400 m 500 m
400 m to 800 m 1 km
800 m to 1.6 km 2 km
1.6 km to 4 km 5 km
4 km to 8 km 10 km
8 km to 16 km 20 km
16 km to 24 km 30 km
24 km to 40 km 50 km
40 km to 80 km 100 km
80 km to 160 km 200 km
160 km to 240 km 300 km
240 km to 320 km 400 km Cannot be specified for wavelengths 850 nm or 1300 nm
320 km to 400 km 512 km Cannot be specified for wavelengths 850 nm or 1300 nm
Pulse Width
The pulse width has the following characteristics.
• A short pulse width enables you to measure with a high resolution, but you cannot measure long
distances.
• A long pulse width enables you to measure long distances, but you cannot measure with a high
resolution. Also, dead zones are larger with long pulse widths.
The pulse widths that you can select vary depending on the distance range, as shown in the
following table.
Distance Range Selectable Pulse Widths
200 m 3 ns, 10 ns, 20 ns, 30 ns, 50 ns, 100 ns, 200 ns, 300 ns, 500 ns
500 m 3 ns, 10 ns, 20 ns, 30 ns, 50 ns, 100 ns, 200 ns, 300 ns, 500 ns
1 km 3 ns, 10 ns, 20 ns, 30 ns, 50 ns, 100 ns, 200 ns, 300 ns, 500 ns, 1 µs
2 km 3 ns, 10 ns, 20 ns, 30 ns, 50 ns, 100 ns, 200 ns, 300 ns, 500 ns, 1 µs
5 km 3 ns, 10 ns, 20 ns, 30 ns, 50 ns, 100 ns, 200 ns, 300 ns, 500 ns, 1 µs
10 km 3 ns, 10 ns, 20 ns, 30 ns, 50 ns, 100 ns, 200 ns, 300 ns, 500 ns, 1 µs
20 km, 30 km 10 ns, 20 ns, 30 ns, 50 ns, 100 ns, 200 ns, 300 ns, 500 ns, 1 µs, 2 µs
50 km, 100 km 20 ns, 30 ns, 50 ns, 100 ns, 200 ns, 300 ns, 500 ns, 1 µs, 2 µs, 5 µs, 10 µs, 20 µs
200 km 30 ns, 50 ns, 100 ns, 200 ns, 300 ns, 500 ns, 1 µs, 2 µs, 5 µs, 10 µs, 20 µs
300 km or more 50 ns, 100 ns, 200 ns, 300 ns, 500 ns, 1 µs, 2 µs, 5 µs, 10 µs, 20 µs
High SNR Mode
If the optical fiber cable to be measured is connected to a passive optical network (PON) system,
because an optical splitter for splitting the optical fiber cable is installed in the system, you will not
be able to measure optical pulses that are reflected from a position further away than the optical
splitter using normal measurement. This feature enables you to correctly measure optical pulses
that are reflected from positions such as this.
OFF: Optical pulses excluding those from PON systems can be measured.
ON: PON system optical pulses can be measured.
2-6
Note
• High SNR mode can be turned on when the pulse width is set in the range of 50 nm to 1 μm.
• This cannot be used when the wavelength is 850 nm or 1300 nm.
IM AQ7280-01EN
Page 32

1
If reflections are large, the waveform may be saturated.
2.1 Setting the Measurement and Analysis Conditions
Sample Interval
The maximum number of sample data points is 256000. The shortest sample interval is determined
by the distance range.
Normal: The AQ7280 uses the optimum sample interval for the measurement method to
perform measurements.
High Resolution: The AQ7280 uses a sample interval that would result in the greatest number of
data points.
If you use a short sample interval, you can measure for finer changes. However, the data size of the
measured result becomes large.
Attenuation
If large reflections are caused by connectors or by breaks in the optical fiber cable, the waveform
may be saturated. Specify attenuation to prevent the waveform from being saturated.
The attenuations that you can select vary depending on the pulse width, as shown in the following
table.
Pulse Width (Example) Selectable Attenuations
3 ns to 20 ns 0 dB, 2.50 dB, 5.00 dB, 7.50 dB, 10.00 dB, 12.50 dB, 15.00 dB, 17.50 dB
30 ns to 50ns 0 dB, 2.50 dB, 5.00 dB, 7.50 dB, 10.00 dB, 12.50 dB, 15.00 dB, 17.50 dB, 20.00 dB,
22.50 dB
100 ns to 5 µs 0 dB, 2.50 dB, 5.00 dB, 7.50 dB, 10.00 dB, 12.50 dB, 15.00 dB, 17.50 dB, 20.00 dB,
22.25dB, 25.00 dB
10 µs to 20 µs 0 dB, 2.50 dB, 5.00 dB, 7.50 dB, 10.00 dB, 12.50 dB, 15.00 dB, 17.50 dB, 20.00 dB,
22.25dB, 25.00 dB, 27.50 dB, 30.00 dB
2
Optical Pulse Measurement (OTDR)
Note
• If the distance range or pulse width is set to Auto or if the average method is set to High Resolution, you
cannot select the attenuation.
• If the waveform is saturated, you cannot perform measurements with high sensitivity, so specify a large
value.
• The pulse widths that you can set vary depending on the OTDR unit.
Average Method
• Hi-Speed
In Hi-Speed mode, all sections are measured according to the specified attenuation. If the
specified attenuation value is not appropriate and a large reflection occurs, the waveform for that
section may be saturated.
• Hi-Reflection
In Hi-Reflection mode, the AQ7280 can perform measurements correctly even if large reflections
(excluding extremely large reflections caused by sections of the fiber such as the open end of the
fiber) occur. In Hi-Reflection mode, the AQ7280 sets the optimum attenuation according to the
backscatter level for each section, and performs the measurement. Therefore, the measurement
time is longer than in Hi-Speed mode.
The partitioning of the optical fiber into sections and the specifying of the optimum attenuation
are done automatically.
IM AQ7280-01EN
2-7
Page 33

2.1 Setting the Measurement and Analysis Conditions
Note
Except when the optical fiber cable is short and there are no reflections, we recommend that you measure
with the average method be set to Hi-Reflection.
Average Unit
Duration: Measurements are performed only over the specified duration. If you specify a short
duration, depending on the measurement conditions, measurements may not have
finished when the specified time elapses.
Times: Measurements are performed only the specified number of times.
Average Count and Average Duration
You can select the following values.
Duration: 5 sec, 10 sec, 20 sec, 30 sec, 1 min, 3 min, 5 min, 10 min, 20 min, 30 min
Sec is seconds, and min is minutes.
Times: 2^10 (1024 times), 2^11 (2048 times), 2^12 (4096 times), 2^13 (8192 times), 2^14
(16384 times), 2^15 (32768 times), 2^16 (65536 times), 2^17 (131072 times), 2^18
(262144 times), 2^19 (524288 times), 2^20 (1048576 times)
2^10 is 2 to the power of 10 (1024 times).
• The maximum average count is 2^20. If you specify a duration to average over that causes this
number of times to be exceeded, the measurement will finish before the duration to average over
elapses.
• Due to the influence of other measurement conditions, a measurement may take less time than
the duration you have specified or it may not complete when the specified duration elapses.
• If you specify a large value for the number of times or the duration, you can perform highly
precise measurements, but the measurement time becomes longer. Keep the AQ7280’s dynamic
range and the loss of the optical fiber cable under measurement in mind when you specify these
values.
• The display of the duration or the number of times is determined by the specified average unit.
• If Auto is selected, one of the options above is used.
2-8
Fiber-In-Use Alarm
The AQ7280 uses the same wavelength that is used in real communication to measure optical
pulses. If communication light is present in the optical fiber cable that you want to measure, the
communication will be affected. When this communication light is present, we say that the fiber is in
use. The fiber-in-use alarm is a feature that checks if communication light is being transmitted along
the optical fiber cable that you are trying to measure. If the fiber is in use, a warning message is
displayed asking whether you want to continue the measurement.
Connection Check
The connection check is a feature that checks the state of the connection between the AQ7280 and
an optical fiber cable. When this feature is set to on, you can prevent light from being transmitted
from the AQ7280 OTDR port or light source port if an optical fiber cable is not connected to the
AQ7280 or if the cable is not connected correctly.
OFF: Connections are not checked.
ON: Connections are checked.
Event Search
Event search is a feature that automatically searches for losses and reflections in the data that is
acquired during averaged measurements. Losses and reflections detected in waveform data are
known as events. For details on analyzing detected events, see section 4.2.
Auto: After averaged measurements complete, events are automatically searched for and
listed, and the event screen and event analysis menu are displayed.
Manual: After averaged measurements complete, the waveform is displayed, but events are
not searched for.
IM AQ7280-01EN
Page 34

1
See section 6.5.
2.1 Setting the Measurement and Analysis Conditions
Auto Save
Using the rotary knob and ENTER, set Auto Save to OFF or ON. The following screen appears.
• Mode
Select how to specify the save destination folder.
Date: In this mode, folders that are named with dates are automatically created in the
UserDefine: In this mode, specify the save destination folder.
• Destination Folder
Create a folder of your choice in advance in the selected drive, and select this folder as the save
destination folder.
selected drive.
Set auto save (OFF, ON).
Select a drive (Int. Memory, SD card,
USB1, USB2).
Selectable when auto save is ON.
Set the mode (Date, UserDefine).
Selectable when auto save is ON.
Select the save destination folder.
A file list appears. For more information on file
list operations, see section 6.3.
Selectable when mode is set to UserDefine.
Set the file name.
2
Optical Pulse Measurement (OTDR)
IM AQ7280-01EN
2-9
Page 35

Set the approximation method (marker).
See page 2-3.
2.1 Setting the Measurement and Analysis Conditions
Setting Analysis Conditions in Detail Mode
Press the Analysis Setup soft key to display the following screen.
Set the index of refraction
(1.30000 to 1.7999).
Set the backscatter level
For a pulse width of 1 μs:
–10.00 dB to –64.99 dB
For a pulse width of 1 ns:
–40.00 dB to –94.99 dB
Set the splice loss (0.01dB to 9.99dB).
Set the return loss (20dB to 70dB).
Set the end of fiber (3dB to 65dB).
Executes initialization
Press to reset the analysis settings to
their factory defaults.
When the screen is scrolled
Set the splitter search (OFF, ON).
Set the splitter loss (1dB to 20dB).
Set the launch fiber cable
(Setup[OFF], Setup[ON]).
Set the pass/fail judgment
(Setup[OFF], Setup[ON]).
Set macro bending
(Setup[OFF], Setup[ON]).
See page 2-3.
Set the approximation method (event).
Index of Refraction (IOR)
The AQ7280 uses the index of refraction to calculate the distance. If you do not set the index of
refraction correctly, the distance measurement will be incorrect. The index of refraction varies
depending on the connected optical fiber cable. Enter the value recommended by the manufacture
of the cable.
The AQ7280 has the following preset indices of refraction that correspond to each wavelength.
Wavelength Index of Refraction Wavelength Index of Refraction
850 nm 1.46000 1490 nm 1.46000
1300 nm 1.46000 1550 nm 1.46000
1383 nm 1.46000 1625 nm 1.46000
1310 nm 1.46000 1650 nm 1.46000
You can specify a value from 1.30000 to 1.79999.
2-10
Backscatter Level
Light that travels through an optical fiber cable displays a phenomenon known as Rayleigh
scattering. Due to this phenomenon, light is sent backwards, in the direction opposite to the
direction of propagation. This phenomenon is known as backscattering. The backscatter level
setting is used when the AQ7280 calculates the return loss and total return loss.
IM AQ7280-01EN
Page 36

1
2.1 Setting the Measurement and Analysis Conditions
If you do not set the correct backscatter level, the return loss and total return loss measurements will
be incorrect.
On the AQ7280, you can select the reference pulse width for the backscatter level (see section 3.2).
The selectable range of backscatter levels vary depending on the reference pulse width.
1 µs: The range is –10.00 to ‒64.99.
1 ns: The range is ‒40.00 to ‒94.99.
The AQ7280 has the following preset backscatter levels that correspond to each wavelength.
Wavelength 1 μs Pulse Width 1 ns Pulse Width
850 nm –37 dB –67 dB
1300 nm –44 dB –74 dB
1310 nm ‒50 dB ‒80 dB
1383 nm ‒51 dB ‒81dB
1490 nm ‒52 dB ‒82 dB
1550 nm ‒52 dB ‒82 dB
1625 nm ‒53 dB ‒83 dB
1650 nm ‒53 dB ‒83 dB
Event Search Conditions
• Splice Loss
If a splice loss that exceeds the specified threshold occurs, it is detected as an event.
The range is 0.01 dB to 9.99 dB.
• Return Loss
If a return loss that is less than or equal to the specified threshold occurs, it is detected as an
event. The larger the reflection, the smaller the return loss, so events (reflections) are detected
when the return loss is less than or equal to the threshold.
The range is 20 dB to 70 dB.
2
Optical Pulse Measurement (OTDR)
• End of Fiber
If a reflection that exceeds the specified threshold occurs, it is detected as the end of the optical
The range is 3 dB to 65 dB.
• Splitter Search
ON: Losses (reflections) that exceed optical splitter loss are displayed as optical splitters.
OFF: Losses (reflections) that exceed splitter loss are displayed as normal events.
• Splitter Loss
Events whose loss exceeds this value are assumed to be optical splitters.
The range is 1 dB to 20 dB.
• Launch Fiber Setting
Using the rotary knob and ENTER, set Launch Fiber Setting to Setup[OFF] or Setup[ON]. The
fiber cable (Fresnel reflection).
The threshold at the end of the fiber is automatically set to its maximum value.
following screen appears.
Set the start event (None, 1, 2).
Set the end event (None, 1, 2).
When you connect a launch fiber cable to avoid near-end dead zones, you can set the launch
fiber cable events (start point and end point) so that the event information in the launch fiber
section is excluded from the analysis conditions.
IM AQ7280-01EN
2-11
Page 37

Turns the pass fail judgment on
2.1 Setting the Measurement and Analysis Conditions
Advanced Analysis
• Pass Fail Judgement
Using the rotary knob and ENTER, set Pass Fail Judgement to Setup[OFF] or Setup[ON]. The
following screen appears.
or off.
Set the judgment (Hide, Display).
Set the connector loss
threshold (0.01dB to 9.99dB).
Set the splice loss threshold
(0.01dB to 9.99dB).
Set the return loss threshold
(20dB to 70dB).
Set the splitter loss threshold
(1.0dB to 20.0dB).
Set the dB/km loss threshold
(0.01dB to 9.99dB).
Set the total loss
threshold (1dB to 65dB).
Pass Fail Judgement
A judgment is performed on the events detected in the target waveform, and those that exceed
ON: Events that have exceeded their thresholds are displayed with an asterisk attached to
OFF: Events that have exceeded their thresholds are not displayed with an asterisk attached
Judgment
The judgment information is displayed in the lower left of the AQ7280 screen.
Display: The number of fault events, total loss, and total return loss are displayed.
Hide: The judgment information is not displayed.
Set the preset (UserDefine,
Preset 1, Preset 2, Preset 3).
the specified threshold are displayed as fault events.
them.
to them.
Judgment display
2-12
Events judged as Fail
IM AQ7280-01EN
Page 38

1
2.1 Setting the Measurement and Analysis Conditions
Splice Loss, Return Loss, Splitter Loss, dB/km, Total Loss
Set the threshold values that are used to display fail judgment events.
Connector loss: Values greater than the threshold value are judged as fail. The range is 0.01 dB to 9.99 dB.
Splice loss: Values greater than the threshold value are judged as fail. The range is 0.01 dB to 9.99 dB.
Return loss: Values less than the threshold value are judged as fail. The range is 20 dB to 70 dB.
Splitter loss: Values greater than the threshold value are judged as fail. The range is 1.0 dB to 20.0 dB.
dB/km: Values greater than the threshold value are judged as fail. The range is 0.01 dB to 9.99 dB.
Total loss: Values greater than the threshold value are judged as fail. The range is 1 dB to 65 dB.
Because the end of fibers is handled as either a splice loss or a reflection, there is no fault event
just for the end of fibers.
Preset
Select the pass/fail judgment reference. Three splice loss threshold examples are defined.
Select the reference according to the optical connector’s insertion loss and splice loss included
in the optical fiber cable under measurement.
• Macro Bending (Bending Loss)
Using the rotary knob and ENTER, set Macro Bending to Setup[OFF] or Setup[ON]. The
following screen appears.
2
Optical Pulse Measurement (OTDR)
When an optical pulse measurement is performed in multi wavelength measurement, you can
Display
This function displays the detected bending losses in the event list on the event screen when
OFF: The bending losses are not displayed in the event list.
ON: The bending losses are displayed in the event list.
Threshold
This is the threshold of the difference between the splice losses of each wavelength when optical
When the difference between the splice losses of each wavelength for the same event is larger
Turns the display on and off
Set the threshold (0.001dB to 99.999dB).
compare the splice losses at each wavelength and display on the screen bending loss events
that are caused by bends in the optical fiber cable.
optical pulses are measured.
pulses are measured.
than this value, the event is detected as a bending loss.
IM AQ7280-01EN
2-13
Page 39

Set the number of splitter stages (1, 2).
Set the route (ONU OLT, OLT ONU).
2.1 Setting the Measurement and Analysis Conditions
Setting Measurement Conditions in PON Mode
Press the Meas Setup soft key to display the following screen.
Set the wavelength.
See pages 2-2 and 2-5.
Set the number of splitter splits
(2, 4, 8, 16, 32, 64, 128).
Opens the detail screen
Set measurement items.
The settings change to values that are suitable for the measurement of the specified
number of stages and splits. You can also change the settings according to your
measurement conditions. For details on measurement items, see pages 2-6 to 2-9.
Note
The total number of splits when the number of splitter stages is set to 2 is up to 128.
Setting Analysis Conditions in PON Mode
Press the Analysis Setup soft key to display the following screen.
Set the splitter and wavelength.
See “Setting Measurement
Conditions in PON Mode.”
For details on analysis items,
see pages 2-10 to 2-13.
2-14
IM AQ7280-01EN
Page 40

1
2.2 Performing Averaged Measurements
Laser on indication
Average duration or progress
Character Strings” in the
WARNING
• During measurement, light is transmitted from the light source ports. Do not disconnect the
connected optical fiber cables. Visual impairment may occur if the light enters the eye.
• Close the covers of any light source ports that do not have optical fiber cables connected
to them. Visual impairment may occur if light that is mistakenly emitted from these ports
enters the eye.
French
AVERTISSEMENT
• Lorsque l’AQ7280 génère de la lumière, la lumière est émise à travers les ports de source
lumineuse. Ne pas débrancher les câbles de fibre optique connectés. Des lésions oculaires
peuvent être causées si le faisceau lumineux pénètre l’œil.
• Couvrir les caches des ports de source lumineuse libres. Sur les modèles dotés de deux
ports de source lumineuse ou plus, protéger les yeux contre l’émission accidentelle de
lumière depuis le mauvais port.
2
Optical Pulse Measurement (OTDR)
In averaged measurements, the data that is acquired from each pulse is averaged and displayed. By
performing averaged measurements, you can improve the signal-to-noise (S/N) ratio.
This is effective when you want to detect faint events that are buried in noise.
Procedure
Starting and Stopping Measurements
From the top menu, select OTDR.
1.
Press AVG . The measurement begins, and the measurement waveform is displayed on the
2.
screen.
The Average menu appears. The average duration or progress is displayed in the top area of the screen.
Also, during measurement, a mark appears at the top of the display to indicate that the laser light is on.
Set markers.
See section 4.1.
Set a comment
(up to 30 characters).
Enter a comment by
following the procedure
provided in “Entering
Getting Started Guide,
IMAQ7280-02EN.
Waveform display screen
(See section 3.1.)
IM AQ7280-01EN
Create a label.
(See section 6.3.)
2-15
Page 41

Progress bar at 73%
Average duration
2.2 Performing Averaged Measurements
When the averaged measurement completes in accordance with the specified conditions, the
measurement stops automatically, and the screen switches to the OTDR menu.
During multi wavelength measurement, when the averaged measurement of all waveforms
completes, the measurement stops automatically. To stop the averaged measurement in
progress, press AVG.
Explanation
Averaged Measurement
A progress bar is displayed during averaged measurement. When the measurement finishes, the
progress bar stops automatically. If you set Avg Duration to Auto, the duration to average over is
displayed in the top area of the screen. If you specify a setting other than Auto, a value that indicates
the progress is displayed. When the measurement completes correctly, 100% is displayed. The time
it takes to complete a measurement varies depending on settings such as the distance range and the
average count.
If you are using markers to measure distance, loss, and the like during an averaged measurement,
when the measurement completes correctly (100%), the AQ7280 automatically closes the marker
measurement screen. If Event Search is set to Auto, the event screen appears when the measurement
is completed correctly.
2-16
IM AQ7280-01EN
Page 42

1
2.3 Performing Averaged Measurement and Displaying the Results with Icons (/SMP option)
WARNING
• During measurement, light is transmitted from the light source ports. Do not disconnect the
connected optical fiber cables. Visual impairment may occur if the light enters the eye.
• Close the covers of any light source ports that do not have optical fiber cables connected
to them. Visual impairment may occur if light that is mistakenly emitted from these ports
enters the eye.
French
AVERTISSEMENT
• Lorsque l’AQ7280 génère de la lumière, la lumière est émise à travers les ports de source
lumineuse. Ne pas débrancher les câbles de fibre optique connectés. Des lésions oculaires
peuvent être causées si le faisceau lumineux pénètre l’œil.
• Couvrir les caches des ports de source lumineuse libres. Sur les modèles dotés de deux
ports de source lumineuse ou plus, protéger les yeux contre l’émission accidentelle de
lumière depuis le mauvais port.
2
Optical Pulse Measurement (OTDR)
The AQ7280 is equipped with a feature that detects various events along the optical fiber cable route
and displays them as icons. This feature works by performing an OTDR averaged measurement and
then automatically performing an OTDR event analysis after the measurement is complete.
Detailed event analysis results are displayed along with the icon of each event.
Procedure
Setup Menu
1.
2.
From the top menu, select OTDR Smart Mapper.
Press SETUP to display the Setup menu.
Set the measurement conditions.
Set the analysis conditions.
Configure the waveform display.
See section 3.2.
Configure the system.
See chapter 7.
IM AQ7280-01EN
2-17
Page 43

Set the number of splitter stages (None, 1, 2).
Set the route (ONU OLT, OLT ONU).
For details on measurement items, see pages 2-6 to 2-9.
2.3 Performing Averaged Measurement and Displaying the Results with Icons (/SMP option)
Setting the Measurement Conditions
Press the Meas Setup soft key to display the following screen.
Set the wavelength.
See pages 2-2 and 2-5.
Set the number of splitter splits
(2, 4, 8, 16, 32, 64, 128).
Event Search
This is fixed to Auto.
Adapt Trace
This feature uses three different pulse widths to measure the same wavelength and then
combines the three measurement waveforms. Based on the specified distance range, the AQ7280
automatically sets a pulse width best suited to short range measurement, that best suited to midrange measurement, and that best suited to long range measurement and performs measurements.
After the measurements, you can use waveform editing to combine the best data of each
measurement to create the waveform data.
ON: Adapt Trace is enabled. Waveform data is saved in SMP format. SOR waveform data cannot
be loaded. Multi wavelength measurement is not possible.
OFF: Adapt Trace is disabled. Waveform data is saved in SOR format. SOR waveform data can be
loaded. Multi wavelength measurement is possible.
Adapt Trace
(OFF, ON)
Opens the detail screen
Set measurement items.
2-18
IM AQ7280-01EN
Page 44

1
Selects the display screen
The event positions displayed on the screen is enclosed in a frame.
2.3 Performing Averaged Measurement and Displaying the Results with Icons (/SMP option)
Setting Analysis Conditions
Press the Analysis Setup soft key to display the following screen.
Set the splitter and wavelength.
See “Setting Measurement
Conditions” on the previous page.
For details on analysis items, see
pages 2-10 to 2-13.
Starting and Stopping Measurements
Press AVG . Averaged measurement begins, and a screen indicating that the measurement is
3.
in progress appears. When the averaged measurement finishes, icons and analysis results of
events are automatically displayed.
Using the rotary knob and ENTER, select the icon of the event you want to display the details
4.
of. The icon of the selected event appears in the center of the screen.
The total value of each event (the value of each
waveform in multi wavelength measurement)
Optical Pulse Measurement (OTDR)
2
Event screen
See section 4.2.
Event icon display
The event selected on the event screen appears in the center, and the splice
loss and return loss are displayed. Drag the icon screen to move it horizontally.
Tap the icon screen to change the event type.
Note
• To stop the averaged measurement in progress, press AVG. The averaged measurement will stop, and
the screen that was showing before the measurement will reappear.
• During averaged measurement, you cannot set the measurement conditions.
• You can start averaged measurement by pressing AVG even while the measurement setting screen is
showing.
• In OTDR Smart Mapper, real-time measurement is not possible.
(Map, List)
The example shown here is
Map.
Check the waveform.
The screen will change
from Map/List display to
measurement waveform
display.
IM AQ7280-01EN
2-19
Page 45

Pulse width of the measured Adapt Trace waveform
Line1 of the target section Line2 of the target section
2.3 Performing Averaged Measurement and Displaying the Results with Icons (/SMP option)
Checking and Editing Waveforms
Press the Open Trace soft key to display the following screen.
Edit the waveform.
You can edit the Adapt
Trace waveform.
Edit or fix events.
See section 4.2.
You cannot edit event
markers.
Waveform display screen
Editing Waveforms
Press the Waveform Edit soft key to display the following screen.
Waveform display
Short range
section
(Trace1)
Mid-range section
(Trace2)
Long range section
(Trace3)
Returns to the previous screen
Select the target
(Line1, Line2).
Moves the target to the right
Moves the target to the left
Resets the line positions of
the target section
Waveform display outside
the target section (OFF, ON)
You can change the distance sections by moving the lines between the sections.
You can also move the line by touching the screen.
2-20
IM AQ7280-01EN
Page 46

1
Explanation
Icon border
Fail judgment
Pass judgment
Event Icon Display
The following events are displayed using icons. The icon border is usually gray.
2.3 Performing Averaged Measurement and Displaying the Results with Icons (/SMP option)
Start point
Bending loss (macro bending)
2
Optical Pulse Measurement (OTDR)
Pass Fail Judgement
Icon Display
If Pass Fail Judgement is set to ON, the judgment result is displayed using the icon border color.
Pass: Green
Fail: Red
Splice point
Positive splice loss, negative
splice loss
Optical splitter
Connector (return loss)
End point
Fault Events
If Pass Fail Judgement is set to ON, fail judgment events are displayed as fault events on the event
screen.
For details, see “Pass Fail Judgement” in section 2.1.
• Judgment
If the judgment display of Pass Fail Judgement is set to Show, the judgment result is displayed in
the row displaying the total values of each event. The judgment will be Fail if there is even only a
single fault event.
Judgment result display
Pass: Check mark (green)
Fail:
IM AQ7280-01EN
Number of fault events
2-21
Page 47

Increased waveform resolution
2.3 Performing Averaged Measurement and Displaying the Results with Icons (/SMP option)
Adapt Trace (Waveform editing)
In an optical fiber cable measurement, reducing the pulse width of optical pulse measurement
increases the measurement resolution of the waveform in the near-end section but causes the optical
pulse to attenuate in the far-end section, preventing correct measurement. Conversely, increasing
the pulse width of optical pulse measurement allows correct measurement in the far-end section but
decreases the measurement resolution of the waveform in the near-end section. The Adapt Trace
feature compensates for these measurement accuracy degradations by performing optical pulse
measurement using three different pulse widths for the same wavelength and combining the three
waveforms on the screen. The AQ7280 automatically determines the pulse widths depending on the
specified distance range and wavelength.
Measurement
waveform using a
narrow pulse width
(Trace1)
Measurement
waveform using a
wide pulse width
(Trace3)
Measurement waveform
using an intermediate
pulse width
(Trace2)
Adapt Trace
Pulse width
(narrow)
Decreased waveform resolution
Events in mid-range
can be measured.
Pulse width
(intermediate)
You can change the effective range of Trace1 to
Trace3 by moving the lines marking the sections.
When the distance is long,
measurement is not possible.
Events far away
can be measured.
Pulse width (wide)
Note
Adapt Trace turns on and off automatically depending on the loaded waveform data.
• When waveform data in SMP format is loaded, Adapt Trace is turned on.
• When waveform data in SOR format is loaded, Adapt Trace is turned off.
2-22
IM AQ7280-01EN
Page 48

1
2.4 Performing Averaged Measurement and Measuring the Distances to Breaks
WARNING
• During measurement, light is transmitted from the light source ports. Do not disconnect the
connected optical fiber cables. Visual impairment may occur if the light enters the eye.
• Close the covers of any light source ports that do not have optical fiber cables connected
to them. Visual impairment may occur if light that is mistakenly emitted from these ports
enters the eye.
French
AVERTISSEMENT
• Lorsque l’AQ7280 génère de la lumière, la lumière est émise à travers les ports de source
lumineuse. Ne pas débrancher les câbles de fibre optique connectés. Des lésions oculaires
peuvent être causées si le faisceau lumineux pénètre l’œil.
• Couvrir les caches des ports de source lumineuse libres. Sur les modèles dotés de deux
ports de source lumineuse ou plus, protéger les yeux contre l’émission accidentelle de
lumière depuis le mauvais port.
2
Optical Pulse Measurement (OTDR)
The AQ7280 is equipped with a feature that you can use to locate and display faults in optical fiber
cables. This feature works by performing an OTDR averaged measurement and then automatically
performing an OTDR event analysis after the measurement is complete.
Use the OTDR feature to analyze waveforms.
Procedure
Selecting the Route
1.
From the top menu, select Fault Locator. A soft key menu for selecting the route appears.
Normal
Searches for fault points in the optical fiber cable
connecting OLT
OLT->Splitter
Searches the route from the OLT to the optical splitter
OLT->Splitter->ONU
Searches the routes from the OLT through the optical splitter
to each ONU
ONU->Splitter
Searches the route from an ONU to the optical splitter.
1
and ONU
2
ONU->Splitter->OLT
Search the route from an ONU through the optical splitter to each OLT.
1 OLT (Optical Line Termination): Optical line termination on the station side
2 ONU (Optical Network Unit): Optical line termination on the subscriber side
IM AQ7280-01EN
2-23
Page 49

menu. You cannot return to
Cursor position from the distance reference
2.4 Performing Averaged Measurement and Measuring the Distances to Breaks
Using the rotary knob and ENTER, select the route to be measured. The Select Route screen
2.
closes.
Fault Locator Screen
Press AVG . The measurement begins, and the measurement waveform is displayed on the
3.
screen. When the averaged measurement completes, the distance to a break is automatically
displayed.
See section 4.1.
Distance to a break
Selected route
Set the wavelength.
See page 2-2.
Set the distance
reference.
See section 4.1.
OTDR function
Switches to the screen that
Waveform display screen
See section 3.1.
appears when OTDR is
selected from the top
the original screen.
Note
You can save measured data, but saved waveform data cannot be loaded on the AQ7280. For details on
saving measured data, see section 6.3.
Changing Settings
Press SETUP to display the following screen.
Set the end of fiber.
See page 2-11.
2-24
Change the selected route.
The Select Route menu will appear. See step 2.
IM AQ7280-01EN
Page 50

1
Explanation
Normal
Measures between the OLT and ONU.
This route does not have an optical
splitter.
OLT->Splitter->ONU
Measures from the OLT side to the ONU
side. This route has an optical splitter.
ONU->Splitter->OLT
Measures from the ONU side to the OLT
side. This route has an optical splitter.
Selecting the Route
Before starting the fault locator feature, you can select the route in which to search for breaks. After
confirming the route, press ENTER. The optimal measurement conditions for the selected route will
automatically be selected.
2.4 Performing Averaged Measurement and Measuring the Distances to Breaks
2
Optical Pulse Measurement (OTDR)
OLT->Splitter
Measures between the OLT and optical
splitter.
Fault Location Display
The fault locator uses averaged measurements to detect faults. The cursor position is automatically
set to a fault location on the waveform, and the distance from the measurement reference point to the
fault is displayed.
Faults are not detected during real-time measurement. During a fault locator’s real-time measurement,
you can perform cursor operations or select the wavelength during measurements. If you cancel
measurements prematurely, faults will not be detected.
ONU->Splitter
Measures between an ONU and optical
splitter.
IM AQ7280-01EN
2-25
Page 51

Optical splitter
OLT
2.4 Performing Averaged Measurement and Measuring the Distances to Breaks
How to View Fault Points of Multi Split Routes (OLT->Splitter>ONU)
If the route is set to OLT->Splitter->ONU, the number of connected ONUs will be equal to the number
of splits. As such, to determine which route each fault point belongs to, you need to check the events
on the displayed waveform.
ONU1
ONU2
ONU1 event ONU2 event
Fault point
ONU3
Event caused by the fault point
ONU4
ONU3 event
ONU4 event
In the example shown above, reflections from ONU3 are not detected due to a fault point on the ONU3
route. The event of the fault point is detected instead. When an event is detected closer than the actual
ONU3 position, we can assume that there is a fault point on the ONU3 route.
Note
If the route is set to OLT->Splitter->ONU, even if there are breaks, they are not detected because other split
routes are overlapped. The position of the end of the cable will be considered to be the position of the break,
and the distance to that position will be displayed.
In such a case, verify the event position on the displayed waveform with the distance to the installed ONU.
2-26
IM AQ7280-01EN
Page 52

1
2.5 Performing Real-time Measurement
Laser on indication
WARNING
• During measurement, light is transmitted from the light source ports. Do not disconnect the
connected optical fiber cables. Visual impairment may occur if the light enters the eye.
• Close the covers of any light source ports that do not have optical fiber cables connected
to them. Visual impairment may occur if light that is mistakenly emitted from these ports
enters the eye.
French
AVERTISSEMENT
• Lorsque l’AQ7280 génère de la lumière, la lumière est émise à travers les ports de source
lumineuse. Ne pas débrancher les câbles de fibre optique connectés. Des lésions oculaires
peuvent être causées si le faisceau lumineux pénètre l’œil.
• Couvrir les caches des ports de source lumineuse libres. Sur les modèles dotés de deux
ports de source lumineuse ou plus, protéger les yeux contre l’émission accidentelle de
lumière depuis le mauvais port.
2
Optical Pulse Measurement (OTDR)
In real-time measurement, you can view the waveform changes in real time. You can change the
conditions during measurement.
Procedure
Starting and Stopping Measurements
1.
2.
3.
From the top menu, select OTDR.
Press REAL TIME to start a measurement. The screen shows the measurement waveform,
and the RealTime menu appears. A mark appears in the top area of the screen to indicate that
the laser light is on.
During measurement, press REAL TIME to stop the measurement. The OTDR menu appears.
The mark that indicates that the laser light is on disappears.
Set the wavelength.
See page 2-2.
Set the distance range.
See page 2-6.
Set the pulse width.
See page 2-6.
Set markers.
See section 4.1.
Waveform display screen
(See section 3.1.)
IM AQ7280-01EN
Displays the menu
on the next page
2-27
Page 53

When the work completion notice is set to ON,
You can perform measurements efficiently by moving the cursor to a position
slightly after the installation point (depending on how fast the optical fiber cable will
be installed). This is because the AQ7280 notifies you of the work completion, which
is your sign to measure the connection loss at that point (splice, connection, etc.).
2.5 Performing Real-time Measurement
Cable Installation Completion Notification
On the OTDR menu, press the Advanced Measurement soft key and then the Work
1.
Completion Notice soft key. The following screen appears.
Set Notification to ON.
2.
Set Message to ON.
3.
Press REAL TIMEto start a measurement. The screen shows the measurement waveform, and
4.
the RealTime menu appears. The words “Check Point” appears at the cursor on the screen.
Press the Next soft key and then the Completion Check soft key to select ON.
5.
When the measurement to the Check Point distance is complete, a completion message is displayed.
Turns the completion notification
on or off
Turns the message display on or off
Turns the alarm on or off
Set the confirmation (No Check,
Check only once, Check everytime).
End of fiber
“CheckPoint” appears at the cursor.
Set the work completion
confirmation (ON, OFF).
Move the cursor to a
position that is slightly
after the installation
point.
2-28
IM AQ7280-01EN
Page 54

1
Explanation
Distance
Level
Extension work point
Work completion notification
50 km 100 km
Real-time Measurement
Measurement conditions are set before the actual measurement takes place, but during real-time
measurement you can change the measurement conditions and adjust markers and the cursor. When
you stop a measurement, the AQ7280 returns to the previous screen.
• In Simple mode, you can only change the wavelength.
• You cannot change the attenuation if the average method is set to High Resolution. For details, see
Cable Installation Completion Notification
Before you check whether the work is complete, move the cursor slightly after the extension work
point or before the work completion point on the optical fiber cable, and turn on the work completion
notification. When the fiber end detection position (the event) during real-time measurement is the
same as the cursor position (CheckPoint), the AQ7280 gives a notification (message indication and
alarm sound) that the cable installation is complete.
page 2-7.
Construction start
position
(splice, connection, etc.)
Completion notification
cursor position during
optical fiber cable
extension
CheckPoint CheckPoint
(Event)
2.5 Performing Real-time Measurement
2
Optical Pulse Measurement (OTDR)
cursor position
Work completion point
IM AQ7280-01EN
2-29
Page 55

2.6 Performing High Resolution Measurement
WARNING
• During measurement, light is transmitted from the light source ports. Do not disconnect the
connected optical fiber cables. Visual impairment may occur if the light enters the eye.
• Close the covers of any light source ports that do not have optical fiber cables connected
to them. Visual impairment may occur if light that is mistakenly emitted from these ports
enters the eye.
French
AVERTISSEMENT
• Lorsque l’AQ7280 génère de la lumière, la lumière est émise à travers les ports de source
lumineuse. Ne pas débrancher les câbles de fibre optique connectés. Des lésions oculaires
peuvent être causées si le faisceau lumineux pénètre l’œil.
• Couvrir les caches des ports de source lumineuse libres. Sur les modèles dotés de deux
ports de source lumineuse ou plus, protéger les yeux contre l’émission accidentelle de
lumière depuis le mauvais port.
When analyzing waveforms in real-time measurement, you can limit the range to be analyzed and
measure at high resolution to obtain detailed measurements.
Procedure
Executing a Measurement
Specifying a Range
From the top menu, select OTDR.
1.
Press REAL TIME to start a measurement. The screen shows the measurement waveform,
2.
and the RealTime menu appears. A mark appears in the top area of the screen to indicate that
the laser light is on.
Press the Next soft key and then the Meas.Range Change soft key.
3.
Turn the rotary knob to move the cursor to the center of the range you want to analyze.
4.
2-30
IM AQ7280-01EN
Page 56

1
2.6 Performing High Resolution Measurement
Setting the Sampling Interval
Press the Sampling Interval soft key to set the sampling interval.
5.
The waveform measured at the specified sampling interval is displayed.
2
Set the sampling interval
(Normal, High Reso., 2cm,
5cm, 10cm, 20cm, 50cm,
1m, 2m, 4m, 8m, 16m, 32m).
Moves the current
measurement
scope to the right
Moves the current
measurement
scope to the left
Display screen example
Distance range: 30 km
Sampling interval: 2 cm
Zoom the scale (see section 3.3).
Overview screen
Shows the range displayed on the screen relative to the entire distance range.
White frame: Shows the range that can be displayed at the specified sampling interval
Blue frame: Shows the display range of the zoomed waveform display
Note
The amount of measurement scope movement varies depending on the amount of cursor movement (see
section 3.3).
Optical Pulse Measurement (OTDR)
Averaged Measurement with High Resolution Setting
If the high resolution measurement conditions are specified in real-time measurement, averaged
measurement can be performed with those conditions.
Press AVG to perform averaged measurement while maintaining the high-resolution conditions.
6.
IM AQ7280-01EN
2-31
Page 57

Coarse when expanded
Example: 20 km, 10000 (sampling interval of 8 m)
4 km, 200000 samples
4 km, 200000 samples
Sampling interval
2.6 Performing High Resolution Measurement
Explanation
In normal measurement, the sampling interval is set so that data can be sampled at all distances
according to the specified distance range. The maximum number of data samples on the AQ7280 is
256000 (when the distance range is 512 km).
Therefore, if the distance range is large (e.g., 400km), the sampling interval becomes long, and events
occurring between samples cannot be analyzed in detail. Waveform zooming explained in section 3.3
simply expands the measured results at the sampling resolution set for each distance range; it does
not increase the resolution.
400 km, 50000 (sampling interval of 8 m)
In high resolution measurement, you move the cursor to the location where you want to analyze in
detail and set the sampling resolution. The sampling resolution that you can select here is all intervals
regardless of the distance range. The measurement scope is determined by the selected sampling
resolution with the cursor at the center. If there is no cursor, the left edge of the present measurement
scope becomes the reference.
Sample at fine resolution from the beginning
Example: 4 km, 200000 samples
of 2 cm
2-32
IM AQ7280-01EN
Page 58

1
2.7 Displaying Reference Trace Waveforms
trace waveform down
You can measure waveforms while retaining the previous waveform on the screen (a reference trace).
The AQ7280 displays the measurement waveform and the reference trace waveform at the same time.
Procedure
Reference Trace Screen
From the top menu, select OTDR.
1.
Display the waveform on the screen. Press the Reference Trace soft key and then the Set
2.
Reference Trace soft key. The reference trace waveform is displayed in white.
Move the reference
trace waveform.
Turns the trace
waveform display
on or off
Creates a reference trace
Reference trace waveform
Clears the reference
trace waveform
2
Optical Pulse Measurement (OTDR)
Moving the Reference Trace Waveform
On the Reference Trace menu, press the Trace Shift soft key and then the Trace Shift Up ↑ or Trace
Shift Down ↓ soft key. The reference trace waveform will move.
Explanation
Reference Trace
You can also create a reference trace from waveforms that you load from files. By creating a reference
trace before work, you will be able to check the work progress. For details on loading waveforms, see
section 6.3.
Moves the reference
trace waveform up
Moves the reference
Example when the reference trace
waveform has been moved up
Comparing Traces
The AQ7280 displays the differential trace of the current waveform and reference trace waveform.
IM AQ7280-01EN
2-33
Page 59

2.8 Performing Multi-Core Fiber Measurement
WARNING
• During measurement, light is transmitted from the light source ports. Do not disconnect the
connected optical fiber cables. Visual impairment may occur if the light enters the eye.
• Close the covers of any light source ports that do not have optical fiber cables connected
to them. Visual impairment may occur if light that is mistakenly emitted from these ports
enters the eye.
French
AVERTISSEMENT
• Lorsque l’AQ7280 génère de la lumière, la lumière est émise à travers les ports de source
lumineuse. Ne pas débrancher les câbles de fibre optique connectés. Des lésions oculaires
peuvent être causées si le faisceau lumineux pénètre l’œil.
• Couvrir les caches des ports de source lumineuse libres. Sur les modèles dotés de deux
ports de source lumineuse ou plus, protéger les yeux contre l’émission accidentelle de
lumière depuis le mauvais port.
Setup Menu
1.
2.
From the top menu, select Multi Fiber Project.
Press SETUP to display the Setup menu.
Set the measurement core information.
Set the measurement conditions.
See page 2-5.
Set the analysis conditions.
See page 2-10.
Configure the waveform display.
See section 3.2.
Configure the system.
See chapter 7.
2-34
IM AQ7280-01EN
Page 60

1
Set the project name.
Folder for saving measurement result files
The newly created project file
2.8 Performing Multi-Core Fiber Measurement
Entering Measurement Core Information
Press the Project Setup soft key to display the following screen.
A character input dialog box will open.
Select a drive (Int. Memory, SD card,
USB memory 1, USB memory 2).
Selectable when auto save is ON.
Set the starting core number (1 to 9900).
Set the number of cores or tapes (1 to 2000).
Set the label.
The same label can be entered for all cores.
See section 6.3.
Not selected: The selectable range of number
Selected: The selectable range of number
Set the tape number
(OFF, a-b(2), a-c(3), a-d(4), a-e(5), a-f(6),
a-g(7), a-h(8)).
This is available when the setting for creating
a project with 100 or more cores is set to OFF
(check box unselected).
Set the number of cores in each
division (8 cores, 10 cores).
You can set this when the tape number is
set to OFF.
Set the file name type
(WL + No., No. + WL, Project Name + WL +
No., No. + Project Name + WL, WL + Project
Name + No.).
of cores is 1 to 100.
of cores is 100 to 2000.
Note
When you change the measurement core information, all the previous core measurements are discarded.
2
Optical Pulse Measurement (OTDR)
Setting the Project Name
Projects are group of items for measuring multi-core fibers. The default project name is “NewProject.”
In the AQ7280 internal memory, core information, measurement conditions, analysis conditions,
measured results, and the like are linked with the project name and saved. You can set up to 15
characters for the project name. For the types of strings and characters that you can use, see
section 6.3.
Note
• When you set a different project name, a new project file (.MPJ extension) and a new folder for saving
• The project file name and the folder name for saving measurement results files will both be set to the
measurement result files (.SOR extension) are created. At this point, a message will appear asking you
whether you want to inherit the core information, measurement conditions, and analysis conditions from
the current project or reset them to their default values. Select whichever is appropriate..
• Initialize setting
All the project settings will be initialized.
• Takeover current setting
A project with the same settings as the current project will be created.
project name that you entered.
When the number of cores is 100 or less
Internal Memory
DATA
MPJ
ABCDE
ABCDE.MPJ
1310 nm_0001.SOR
1310 nm_0002.SOR
Measurement result files (.SOR extension)
are automatically named and saved.
(For the file name type setting, see the next
page.)
IM AQ7280-01EN
2-35
Page 61

(number of cores 101 to 200)
Folder for saving measurement result files
(number of cores 1 to 100)
ABCDE.MPJ_1_100
The newly created project file
(number of cores 101 to 200)
2.8 Performing Multi-Core Fiber Measurement
When the number of cores exceeds 100
The start and end core numbers in the project are appended to the project name. Numbers are rounded
1310 nm_0001.SOR
1310 nm_0002.SOR
Internal Memory
DATA
MPJ
ABCDE_1_100
ABCDE_101_200
ABCDE.MPJ_1_100
to the nearest hundred and appended.
Example when the number of cores is 150:
If the start number is 1, ABCDE_1_100.MPJ, ABCDE_101_200.MPJ (151 to 200 are skipped)
If the start number is 121, ABCDE_101_200.MPJ (101 to 120 are skipped), ABCDE_201_300.MPJ
(171 to 200 are skipped)
Since numbers are rounded to the nearest hundred, the end number is 200 even when there are only
150 cores.
If the “Enable to create over 100 fibers” check box is selected, a message confirming whether a project
with 100 or more cores is to be created appears when you press ESC to close the project setup
screen.
• If you select OK and press ENTER, a project with 100 or more cores is created.
• If you select Cancel and press ENTER, a message confirming whether the project setup screen is
to be closed without creating a project appears.
• If you select OK and press ENTER, the project setup screen is closed, and the main view screen
returns.
• If you select Cancel and press ENTER, the original project setup screen returns.
Folder for saving measurement result files
1310 nm_0101.SOR
1310 nm_0102.SOR
The newly created project file
Measurement result files (.SOR extension)
are automatically named and saved.
(For the file name type setting, see the next
page.)
Measurement result files (.SOR extension)
are automatically named and saved.
(number of cores 1 to 100)
Number of Cores or Tapes
Set the number of cores or tapes in the following range.
Tape No Number of Cores or Tapes
OFF Number of cores: 10 to 100 (10 cores) 8 to 96 (8 cores)
a-b(2) Number of tapes: 10 to 50 1 to 50
a-c(3) Number of tapes: 10 to 33 1 to 33
a-d(4) Number of tapes: 10 to 25 1 to 25
a-e(5) Number of tapes: 10 to 20 1 to 20
a-f(6) Number of tapes: 10 to 16 1 to 16
a-g(7) Number of tapes: 10 to 14 1 to 14
a-h(8) Number of tapes: 10 to 12 1 to 12
You can set the number of cores in steps of 8 when the number of cores in each division is set to “8
cores” and in steps of 10 when the number of cores in each division is set to “10 cores.”
Example: When the number of cores in each division is set to “8 cores,” even if you set the number
of cores to 12, it will be set to 16.
2-36
IM AQ7280-01EN
Page 62

1
Number of Cores in Each Division
8 cores 10 cores
8 columns 10 columns
When Tape No is set to OFF, you can set the number of columns shown on the main view screen.
If you will set the number of cores to 97 or higher, first set Num of Units to 10 cores.
File Name Type
Set the file name type for measurement result files (.SOR extension) to one of the following options.
• WL + No. Example: 1310 nm_0001.SOR
• No. + WL
• Project Name + WL + No.
• No. + Project Name + WL
• WL + Project Name + No.
2.8 Performing Multi-Core Fiber Measurement
2
Optical Pulse Measurement (OTDR)
Measurement Conditions
After a project setup is complete and multi-core fiber measurement is started, if measured data is
already saved, changing the following measurement conditions will cause a confirmation screen for
deleting the measured data to appear. If you confirm, all measured data is deleted.
• Wavelength
• Distance Range
• Pulse Width
• Attenuation
• Sample Interval
• Average Method
• Average Unit
• Average count and average duration
• Initialization
For details on measurement conditions, see page 2-5 and subsequent pages.
Analysis Conditions
After a project setup is complete and multi-core fiber measurement is started, if measured data
is already saved and event analysis has already been executed, changing the following analysis
conditions will cause a confirmation screen for re-executing the entire event search to appear. If you
confirm, event search will be executed. If the fault event display is turned on, pass/fail judgment will be
re-executed. The measured data up to that point will be retained.
If you change the fault event condition, pass/fail judgment will be re-executed on all waveforms.
• Index of refraction (IOR)
• Backscatter level
• Event search conditions
For details on analysis conditions, see page 2-10 and subsequent pages.
IM AQ7280-01EN
Note
• When you change measurement core information, measurement conditions, or analysis conditions, the
project file (.MPJ extension) is automatically overwritten.
• If the number of cores exceeds 100, measurement conditions and analysis conditions cannot be changed.
2-37
Page 63

Preview area
Information about the core
number at the cursor location
The cell of the core number of the
The cell of the core number of the previous project (96 core/100 core)
Realtime
Observe the fiber end face. See section 8.6.
2.8 Performing Multi-Core Fiber Measurement
Main View Screen
From the top menu, select Multi Fiber Project to display the following screen.
1.
Saved result indication
Blue: Measured data saved
Green: Measured data saved, pass judgment
Red: Measured data saved, pass judgment
The drive/folder name/project name of the current project
Core numbers set to Skip are not displayed.
Observation data of the fiber end face already saved
Measured data of optical power already saved
The number of cores whose measurement results have been saved
Using the arrow keys or the rotary knob, move the
cursor to the cell of a core number you want to measure.
Core number
next project (96 core/100 core)
Create a new project.
Project information
Displays project information
Set the wavelength.
You can select one of the
wavelengths that have been
set in the measurement
conditions or "All."
Switches between file name and label display
Tap the icon to switch between displaying the waveform file
name and label information of the measured core.
Specifies skip
You can skip cores you do not want to measure. You can select this soft key
when the cell at the cursor location does not have a result indication. To cancel
skipping, press this soft key again.
Using the arrow keys or the rotary knob, move the cursor to the cell of a core number you
2.
want to measure.
Note
To measure the optical power and observe the fiber end face, tap a core No.
Performs real-time measurement. Operates in the same manner as the REALTIME key.
Optical power measurement
(see section 5.2)
Clear the check mark.
Clears the result indication
in the cell at the cursor
location and deletes the
saved data.
Confirm the waveform.
You can confirm the
measurement waveform.
You can change the marker
and event positions.
2-38
Average
Performs averaged measurement. Operates in the same manner as the AVG key.
Fiber inspection probe
IM AQ7280-01EN
Page 64

1
2.8 Performing Multi-Core Fiber Measurement
Averaged Measurement
Press AVE to start an averaged measurement.
3.
The screen shows the measurement waveform, and the Open Trace menu appears. During measurement,
a mark appears at the top of the display to indicate that the laser light is on.
Set markers.
See section 4.1.
Cannot be selected
during measurement.
Create labels.
You can enter a label for each
core. Enter the label characters
by following the procedure
provided in “Entering Character
Strings” in the IM AQ7280-02EN.
Cannot be selected
during measurement.
2
Optical Pulse Measurement (OTDR)
Note
• If Wavelength on the main view screen is set to “All,” measurement is executed using multiple
wavelengths for each core.
• If you enter the label characters in the label setting of the project setup screen, the same label characters
can be entered at once for all cores.
When Auto Save is Set to ON in the Project Measurement Conditions
When measurement is complete, the measured results are automatically saved. The main view
screen appears, and pass/fail judgment indications appear in the core number cells whose
measurement results have been saved.
When Auto Save is Set to OFF in the Project Measurement Conditions
When measurement is complete, the measured results are not automatically saved. All the items on
the Open Trace menu become available. When returning to the main view screen, a message for
confirming the saving of the measured results appears. If necessary, you can save the measured
results.
IM AQ7280-01EN
2-39
Page 65

2.8 Performing Multi-Core Fiber Measurement
Event analysis
See section 4.2.
• If Event Search is set to Auto, after measurement is complete, the event screen and event analysis
menu appear.
Section analysis
See section 4.2.
Set the wavelength.
You can select one of the wavelengths that
have been set in the measurement conditions.
Returns to the main view screen
2-40
IM AQ7280-01EN
Page 66

1
core. * Enter the label characters
2.8 Performing Multi-Core Fiber Measurement
Real-time Measurement
Press REAL TIME to start the measurement of “Wavelength 1.”
3.
The screen shows the measurement waveform, and the Open Trace menu appears. During measurement,
a mark appears at the top of the display to indicate that the laser light is on.
Set markers.
See section 4.1.
Cannot be selected
during measurement.
Create labels.
You can enter a label for each
by following the procedure
provided in “Entering Character
Strings” in the IM AQ7280-02EN.
Cannot be selected
during measurement.
2
Optical Pulse Measurement (OTDR)
During measurement, press REAL TIME to stop the measurement.
4.
All the items on the Open Trace menu become available (see the Open Trace menu for the averaged
measurement on the previous page). When returning to the main view screen, a message for confirming
the saving of the measured results appears. If necessary, you can save the measured results.
Note
• In real-time measurement, measured results are not automatically saved.
• If Wavelength on the main view screen is set to “All,” measurement of “Waveform 1” is executed. To
measure “Wavelength 2” and later, save the measured results of “Waveform 1,” and then press the
Wavelength soft key in the Open Trace menu to switch the wavelength.
• If you enter the label characters in the label setting of the project setup screen, the same label
characters can be entered for all cores.
IM AQ7280-01EN
2-41
Page 67

Returns to the
2.8 Performing Multi-Core Fiber Measurement
Optical Power Measurement
Tap a core number to display a measurement item menu.
3.
Tap Power Meter to display the following screen.
4.
For details on how to operate the optical power meter, see section 5.2.
main view
screen
5.
Observing the Fiber End Face
3.
4.
Measured results that
have been saved
Press the Save soft key. Up to three sets of measured data will be saved.
Tap a core number to display a measurement item menu.
Tap FiberInspec. Probe to display the following screen.
For details on how to use the fiber inspection probe, see section 8.6.
Core number being
measured
2-42
Returns to the main view screen
IM AQ7280-01EN
Page 68

1
Previewing Measured Results
Check marks
Judgment result marks
Judgment result display
Count values
Preview imageOptical power values
Using the arrow keys or the rotary knob, move the cursor to a core number cell with a pass/fail
judgment result indication on the main view screen. The preview area at the bottom of the screen
displays the measurement conditions, measurement date, and the measurement result waveform of
the selected core number. For details on pass/fail judgment, see page 2-12.
Optical Pulse Measurement Results
• When Pass Fail Judgement Is Set to OFF
Check marks appear next to the wavelengths for which measured data is saved.
• When Pass Fail Judgement Is Set to ON
Judgment result marks appear next to the wavelengths for which measured data is saved.
2.8 Performing Multi-Core Fiber Measurement
2
Optical Pulse Measurement (OTDR)
Preview waveform
Note
Optical Power Measurement Results and Fiber End Face Observation Results
The optical power of the measured wavelength is displayed. An image data is displayed for the
observation result the fiber end face.
Preview waveform
NoJudge display
If an MPJ file of an older version is loaded, the file may contain core information whose event analysis has
not been executed even when the fault event display is turned on. If this occurs, you can turn off the fault
event setting once and then turn it back on so that pass/fail judgment is executed again on the measured
data and pass or fail is indicated.
Judgment result mark description
IM AQ7280-01EN
2-43
Page 69

USB Memory 1, USB Memory 2, SD Card).
2.8 Performing Multi-Core Fiber Measurement
Creating a New Project
Press the New Project soft key. A character input dialog box will open. Enter a project name by
following the procedure provided in “Entering Character Strings” in the Getting Started Guide,
IMAQ7280-02EN. Tap Enter on the character input dialog box to display the following screen.
Tap Initialize setting or Takeover current setting. A new project will be created, and the main view
screen will appear. To change the project settings, see “Entering Measurement Core Information” on
page 2-35.
Initialize setting
Initializes the settings of the current project and
creates a new project
Takeover current setting
Duplicates the settings of the current project to
create a new project
Cancel
Cancels the creation of a new project.
Set the project save destination (Int.Memory,
Viewing the Project Information
Press the Project Info soft key to display the following screen. You can check the settings.
Saves a screen image
Saving the Project
The project file and measurement result files of each core can be compressed in MPZ format and
saved.
For the procedure to save files, see section 6.3.
2-44
Note
Decompressing MPZ Files
On the File menu of the AQ7932 OTDR Emulation Software (version 5.01 or later), click Batch Conversion
and then MPZ. Select the source file (MPZ file) and the conversion destination. An MPJ file and SOR files will
be extracted.
AQ7932 (sold separately) is a PC software application for analyzing and creating reports of waveform data
measured by the AQ7280.
IM AQ7280-01EN
Page 70

1
2.8 Performing Multi-Core Fiber Measurement
Loading a Project
An MPJ file created using the “multi-core fiber project editor” feature included in the AQ7932 OTDR
Emulation Software can be loaded in to the AQ7280.
Note
• On the AQ7280, you can only create projects whose measurement conditions of all cores are the
same. The “multi-core fiber project editor” can be used to create projects whose measurement
conditions are different for each core.
• To load a past project into the AQ7280, you need an MPJ file and an SOR file (data saved with the
project).
2
Optical Pulse Measurement (OTDR)
IM AQ7280-01EN
2-45
Page 71

2.9 Monitoring Optical Fiber Cables (/MNT option)
WARNING
• During measurement, light is transmitted from the light source ports. Do not disconnect the
connected optical fiber cables. Visual impairment may occur if the light enters the eye.
• Close the covers of any light source ports that do not have optical fiber cables connected
to them. Visual impairment may occur if light that is mistakenly emitted from these ports
enters the eye.
French
AVERTISSEMENT
• Lorsque l’AQ7280 génère de la lumière, la lumière est émise à travers les ports de source
lumineuse. Ne pas débrancher les câbles de fibre optique connectés. Des lésions oculaires
peuvent être causées si le faisceau lumineux pénètre l’œil.
• Couvrir les caches des ports de source lumineuse libres. Sur les modèles dotés de deux
ports de source lumineuse ou plus, protéger les yeux contre l’émission accidentelle de
lumière depuis le mauvais port.
Setup Menu
From the top menu, select Schedule Measurement.
1.
Press SETUP to display the Setup menu.
2.
Set the schedule.
Set the measurement
conditions.
See page 2-5.
Set the analysis
conditions.
See page 2-10.
Configure the
waveform display.
See section 3.2.
Configure the system.
See chapter 7.
2-46
IM AQ7280-01EN
Page 72

1
factory default values.
Select a drive (Int. Memory, SD Card,
2.9 Monitoring Optical Fiber Cables (/MNT option)
Setting the Schedule
Press the Schedule Measurement soft key to display the following screen.
Set the measurement interval (min)
(1 to 60).
Set the duration (days) (1 to 120).
USB Memory1, USB Memory2).
Set the start time (OFF, ON).
Set the start date.
Set the start time.
Executes initialization
Initializes the schedule settings to
2
Optical Pulse Measurement (OTDR)
Interval (min)
Set the interval to measure optical pulses.
The range is 1 to 60 minutes (in 1 minute steps).
Duration (days)
Set the duration to measure optical pulses.
The range is 1 to 120 days (in 1 day steps).
Setting Possible
The number of days is automatically calculated from the measurement interval and the size of
the memory in which measured data will be saved. The result is displayed here. Select the drive
according to the required duration. Note that even if a number greater than 120 is displayed, the
maximum duration (days) that you can set is 120.
Start Time Set
Measurement can be started from the specified time.
OFF: Measurement starts immediately.
ON: Measurement starts at the specified date and time.
Note
• When a schedule measurement is being performed, you cannot change the schedule.
• When a schedule measurement is being performed, you cannot perform marker analysis or event
analysis. When a schedule measurement is stopped, you can perform marker analysis or event analysis
on the measurement waveform data. But, you cannot save the analysis results.
IM AQ7280-01EN
2-47
Page 73

information (Logging, Trace).
Name of the file currently being saved to
2.9 Monitoring Optical Fiber Cables (/MNT option)
Main View Screen
From the top menu, select Schedule Measurement to display the following screen.
1.
Schedule-measurement-in-progress indication
Scale value
Date and time at the cursor
position and measurement
item value
Time remaining until the next optical pulse measurement
Select the displayed
Switch the trace on
which to place the
cursor (Trace1 to 4).
Set the auxiliary function.
Set the display items.
Starts or stops schedule
Measurement
end time
measurement
Displayed Information
• Logging
The measured optical pulse power values are logged on the time axis. You can view the places
where the optical power is changing. Also, you can view the date and time and the power value
at the cursor position.
• Trace
You can display the waveform data at the cursor position. While waveform data is being
displayed, the menu changes.
Overview display
When the displayed information is logging, the waveform at the cursor position
is displayed. When the displayed information is trace, logging data is displayed.
Marker
See section 4.1.
Event analysis
See section 4.2.
2-48
Select the displayed waveform.
Switches to the waveform display of each wavelength.
Starts or stops schedule
measurement
IM AQ7280-01EN
Page 74

1
2.9 Monitoring Optical Fiber Cables (/MNT option)
Note
The following operations cannot be performed when optical pulse measurement is in progress.
• Moving the cursors
• Switching the display (between waveform and logging)
• Auxiliary function
2
Switching the Display Item
Switches the logging data to display on the screen. If display item is set to OFF, Trace is not
displayed.
Auxiliary Function
Press the Auxiliary Function soft key to display the following menu.
Setting the Display Items
Press the Display Item Setup soft key. A message screen appears (set the markers need for
2.
item displaying in advance).
Select OK, and press ENTER. A display item setup menu appears.
3.
Optical Pulse Measurement (OTDR)
Auto zoom
Automatically zooms the logging data scale
Zoom initialization
Initializes the scale
Marker
See section 4.1.
Set display items.
IM AQ7280-01EN
Set point monitoring.
Returns to the main view
screen
2-49
Page 75

2.9 Monitoring Optical Fiber Cables (/MNT option)
Setting Points
Press a point setting soft key to dislay a point setup menu.
4.
Setting Display Items
5.
Sets point
Sets point at the cursor position.
Sets point
Sets point at the cursor position.
Sets point
Sets point at the cursor position.
Sets point
Sets point at the cursor position.
A
A
B
B
C
C
D
D
Clears the point display
Press the Display Item soft key to display the following screen.
Set the wavelength.
Select the monitor item (Splice Loss, Return Loss,
Loss ( - ), dB/km ( - ), Loss ( - ),
1 2 2 3
dB/km ( - ), Point , Point , Point ,
Point )
2 3
D
1 2
A B C
Note
• If markers are not set, after the first measurement, a 1 marker is set automatically to the near end of the
waveform data and a 2 marker to the far end.
• When a schedule measurement is being performed, you cannot set the display items.
• When a schedule measurement is being performed, you cannot perform marker or event analysis even if
you switch to waveform display.
2-50
IM AQ7280-01EN
Page 76

1
1
A
A B C D
Root folder
Measured data file
2.9 Monitoring Optical Fiber Cables (/MNT option)
• Monitoring Measured Values between Markers (Splice loss, return loss, loss( 1 – 2 ), dB/
km(
– 2 ), loss( 2 – 3 ), dB/km( 2 – 3 ))
To display monitor items, you need to set markers. Averaged measurement and real-time
measurement can be performed even when the schedule measurement screen is displayed.
Connect the optical fiber cable to be monitored and execute an optical pulse measurement.
Then set the markers necessary for item display (events). For details on how to set markers, see
section 4.1. For details on the items, see “Splice Loss” in section 1.4.
2
Optical Pulse Measurement (OTDR)
• Monitoring Measured Values at Fixed Points (Point
Monitors the variation in the measured values at the specified points. You can set up to four
Starting a Schedule Measurement
5. Press the Start Schedule Measurement soft key. Measurement will start according to the start
Save Destination File Name
Schedule measurement data is saved to the following path.
, Point B, Point C, Point D)
points.
time setting.
To stop an ongoing schedule measurement, press the Stop Schedule Measurement soft key.
SCHEDULE
In the above example, the save destination of a file saved at 9:00 on October 20, 2014 is shown.
The file name is
wavelength_min.SOR.
The name of the file for 1310 nm and 9:20 is
IM AQ7280-01EN
1310_20.SOR
2014 (year)
10 (month)
20 (day)
09 (hour)
2-51
Page 77

2.9 Monitoring Optical Fiber Cables (/MNT option)
Schedule Data (Logging graph data)
When a schedule measurement finishes, logging graph data in CSV format is automatically saved
in root folder/SCHEDULE. The time when a scheduled measurement begins is used for the file
name.
Example: If a measurement started at 13:01 on October 23, 2014, the file name is 201410231301.
CSV.
Loading Schedule Data
If the CSV file and SOR waveform data during the scheduled period are saved in a similar file and
folder configuration as described above, you will be able to analyze the graph and waveform again
when the CSV file is loaded into the AQ7280.
Note
• Set the average duration in the measurement conditions to a value other than Auto.
• Set the average duration to a value shorter than the measurement interval (min).
2-52
IM AQ7280-01EN
Page 78

1
2.10 Using Convenient Touch Operation Features
Tap to use additional functions such as light source
and optical power meter.
Expands or reduces the waveform amplitude span (vertical scale)
The AQ7280 screen is a touch panel. On the screen, there are several setup menus and measurement
functions that you can access through the touch panel. You can start a different function while a
measurement function is running or view the waveform by zooming in.
Screen (OTDR)
and distance (horizontal scale).
Drag to display the setup menu. This is the same operation
as when you press the SETUP key.
Tap to clear the menu and
expand the waveform
display area.
Tap to set the sample interval.
Tap to select the marker
approximation method.
Drag to reduce the display
area for measurement
conditions and measured
values and expand the
waveform display area.
2
Optical Pulse Measurement (OTDR)
Tap to set individual measurement conditions.
Zooming the Screen
You can reduce the menu display area and expand the waveform display area.
Tap to display the setup
menu.
IM AQ7280-01EN
2-53
Page 79

Example in which the optical power meter is displayed
Arrange over the entire screen
The setup menu for the light source and
optical power meter can be used.
Arrange at the bottom of the screen
2.10 Using Convenient Touch Operation Features
Starting the Light Source or Optical Power Meter (Utility menu)
When an optical pulse measurement is in progress, you can use the OPM module or VLS module that
is installed in the AQ7280.
Tap a function name to start the operation screen for the optical power meter, light source, and so on.
Optical power meter
Power checker
Light source
Visible light source
Fiber end face inspection probe
Arrange the operation screen
for the light source, optical
power meter, and so on
Tap to move the operation
screen arrangement.
on the optical pulse measurement screen
• Arranging the Operation Screen for the Light Source, Optical Power Meter, and So On
You can switch the arrangement of the operation screens as follows.
When arranged at the bottom of the screen, the operation screens are arranged in order from the
bottom left. The light source, optical power meter, and other operation screens have an order of
precedence. If you close an operation screen with a higher order of precedence, the other operation
screens will shift to the left fill in the space. If an operation screen with a higher order of precedence is
opened, it will be inserted on the left side.
Order of precedence: 1: Fiber end face inspection probe
Tap to hide the setup menu.
: Arranges over the entire screen
: Arranges at the bottom of the screen
The operation screens are arranged at the bottom.
You can use the light source and optical power
meter while measuring OTDR waveforms.
2: Optical power meter, power checker
3: Visible light source
4: Light source
2-54
IM AQ7280-01EN
Page 80

1
Switch the menu display.
Scrollable form Tabular form
2.10 Using Convenient Touch Operation Features
For details on how to operate the OPM module and VLS module, see the following sections.
• Optical power meter: Section 5.2
• Power checker: Section 5.2
• Light source, visible light source: Section 5.1
• Fiber end face inspection probe: Section 8.6
2
Changing the Scale
You can set the waveform amplitude span and the distance axis.
Tap to switch the menu display.
Set the display range.
Flick to scroll the menu.
Optical Pulse Measurement (OTDR)
• Switching the Menu Display
You can switch the menu display as follows.
: The menu is displayed in a tabular form.
: The menu is displayed in a scrollable form.
IM AQ7280-01EN
2-55
Page 81

2.10 Using Convenient Touch Operation Features
Other Convenient Features
Cursor Movement
Tap a waveform display area to move the cursor to that position. You can also drag the cursor to
move it.
Marker Assignment
Moving a cursor by dragging or tapping shows a marker shortcut icon (4 Point Markers). Performing
the same operation on the event analysis screen shows a shortcut icon for adding and deleting
events. You can assign markers directly without using the marker soft key menu.
Zooming In and Out
Double-tap a waveform display area to zoom the waveform display relative to that position. When
you double-tap, the vertical and horizontal scales are zoomed with the same magnification. Pinch
out on the waveform display area to zoom in vertically or horizontally depending on the direction of
your finger movement. Pinch in on the waveform display area to zoom out vertically or horizontally
depending on the direction of your finger movement.
Shortcut Execution
You can perform functions such as starting and stopping measurement and saving files by tapping
the shortcut icons without displaying the soft key menu for those functions. For details on the
shortcut icon display, see section 3.1.
2-56
IM AQ7280-01EN
Page 82

1
2
Date and time
Progress during averaged measurements (AVG)
The progress bar behind the characters indicates progress.
Measurement conditions
Chapter 3 Optical Pulse Waveform Display
3.1 Waveform Display Screen
Display Screen
See the Started Guide, IM AQ7280-02EN.
Value per division on the vertical axis
The OTDR port emitting light
Measurement mode
See section 2.1.
Marker section measured values
The attenuation, distance, and attenuation
per km between the markers are displayed.
Distance per division on the horizontal axis
Position of the left edge of the screen
When the distance reference is set, the position of
the distance reference is 0, and this displays the
distance from the distance reference to the position
of the left edge of the screen as a negative value.
See section 2.1.
See section 2.2.
Cursor movement resolution
See section 3.3.
Battery level/AC
See the Started Guide, IM AQ7280-02EN.
Full screen display of the waveform display
area
The section that is displayed in the waveform
display area is represented by a box (overview).
See section 3.3.
Shortcut display
Shortcut feature for starting measurement, saving
data, and so on.
3
Optical Pulse Waveform Display
File name
The name of the measurement
data file that is currently displayed
For details on file names, see
section 6.5.
Waveform display area
Sample interval
See page 2-6.
Marker approximation method
See pages 2-3 to 2-4.
Position of the right edge of the
screen
When the distance reference is
set, this displays the distance
from the distance reference to the
position of the right edge of the
screen.
Distance from the horizontal axis’
measurement reference point to
the cursor position
See section 4.1.
IM AQ7280-01EN
Shortcut Display
Tapping a shortcut icon performs one of the following functions.
Icon Function
Preset marker A is applied to the waveform. (see section 4.1).
Preset marker B is applied to the waveform. (see section 4.1).
*
*
* These are invalid in multi-core fiber measurement.
Starts or stops real-time measurement (see section 2.5). The icon toggles every time you tap.
Starts or stops averaged measurement (see section 2.2). The icon toggles every time you tap.
Initializes the scale (see section 3.3).
Makes a reference trace (see section 2.7).
Displays a file list (see section 6.3).
Converts waveform data into a PDF file (see section 6.8).
Saves waveform data (see section 6.3).
3-1
Page 83

3.2 Configuring the Waveform Display
Setup Menu
From the top menu, select OTDR.
1.
Press SETUP to display the Setup menu.
2.
Set the measurement mode.
See section 2.1.
Set the measurement conditions.
See section 2.1.
Set the analysis conditions.
See section 2.1.
Configure the waveform display.
Configure the system.
See chapter 7.
3-2
IM AQ7280-01EN
Page 84

1
2
loss (Include END, Exclude END).
3.2 Configuring the Waveform Display
Configuring the Waveform Display
Press the OTDR Setup soft key to display the following screen.
Wavelength area expanded display (OFF, ON).
Ghost cursor display (OFF, ON)
Approximated line display (OFF, ON)
Cursor dB value display (OFF, ON)
Cursor display (CROSS(+), LINE( ¦ ))
Marker information display (OFF, ON)
Scale display (OFF, ON)
Event auto zoom display (OFF, ON)
dB decimal places (**.*, **.**, **.***)
Distance decimal places (**.*, **.**, **.***)
Label display (OFF, ON)
Set the file list (File Name, File Name + Label).
Set the distance unit (km, mi(mile), kf(kfeet)).
3
Optical Pulse Waveform Display
When the screen is scrolled
Marker display (Marker, Line)
Set the event fix mode.
See section 4.2.
Set the backscatter level base (1µs, 1ns).
Set the calculation method for total loss
(Cumul-loss, Loss between S and E).
Set the calculation method for total return
Waveform Expand Mode
You can reduce the measurement condition display area and the display area for measured values
of the marker section and expand the waveform display area.
OFF: The waveform display area is not expanded.
ON: The waveform display area is expanded.
IM AQ7280-01EN
3-3
Page 85

Optical fiber cable connection
3.2 Configuring the Waveform Display
Ghost Cursor
The ghost cursor is used to check for secondary reflections. A secondary reflection is a reflection
that is detected in a location where no event actually occurs.
OFF: The ghost cursor is not displayed.
ON: The ghost cursor is displayed.
Ghost cursor
Turn the rotary knob to move to the next
secondary reflection detection point.
• How Secondary Reflections Are Generated
The optical pulse that is generated from position I in the following figure propagates in the
direction of II.
↓
Light ray A that is reflected at connection II in the figure is reflected again at connection I and
propagates in the direction of II as light ray B. At this point, the AQ7280 detects A as an event.
↓
B is again reflected by connection II, and this generates reflected light ray C. At this point, the
AQ7280 detects C as an event.
Because the AQ7280 measures all the reflected light rays, A, C, and D, C is also detected as an
event in the same manner that an actually generated reflection is. Therefore, while there is no
actual event in this location, it appears as if an event has in fact occurred.
I II III
A
B
C
A
Distance L
D
Secondary
reflection
C
Secondary reflection
D
3-4
Distance 2L
IM AQ7280-01EN
Page 86

1
2
Approximated Lines
Approximated lines
dB value at the cursor position
Crosshair display
In the 4 Point or 5 Point marker modes, you can display the approximated lines that are used to
calculate splice loss or return loss.
OFF: Approximated lines are not displayed.
ON: Approximated lines are displayed.
Cursor dB Value
You can display not only the distance at the cursor position, but also the dB value.
OFF: Only the distance at the cursor position is displayed.
ON: he distance and the dB value at the cursor position are displayed.
3.2 Configuring the Waveform Display
3
Optical Pulse Waveform Display
Cursor Display Format
You can select the cursor display format from the following.
CROSS(+) The position on the waveform is displayed with vertical and
LINE( ¦ ) The position on the waveform is displayed with a vertical cursor.
horizontal cursors that intersect.
Line display
IM AQ7280-01EN
3-5
Page 87

Vertical scale value
3.2 Configuring the Waveform Display
Marker Info.
You can display the distance from the measurement reference point to each marker on the
waveform display area.
OFF: Marker information is not displayed.
ON: Marker information is displayed.
Scale Display
You can display the scale values on the vertical and horizontal axes.
OFF: Scale values are not displayed.
ON: Scale values are displayed.
Marker information
Event Auto Zoom
When events have been detected, you can zoom in on the event at the cursor position or the
selected event. Each time that you select a different event, the zoom ratio of the vertical and
horizontal axes is adjusted automatically. For details about event editing, see section 4.2.
dB Decimal
You can select the number of decimal places of the dB display.
**.*: 1 decimal place
**.**: 2 decimal places
**.***: 3 decimal places
Distance Decimal
You can select the number of decimal places of the distance display.
**.***: 3 decimal places
**.****: 4 decimal places
**.*****: 5 decimal places
Horizontal scale value
3-6
IM AQ7280-01EN
Page 88

1
2
Label Display
Label display
You can display labels at the top of the screen. For details on creating labels, see section 6.3.
OFF: Labels are not displayed.
ON: Labels are displayed.
Setting the File List
Select the file information you want to display on the screen.
File Name: FileName, Size, and Date are displayed on the file list screen.
File Name + Label:
FileName, Label, Size, and Date are displayed on the file list screen.
3.2 Configuring the Waveform Display
3
Optical Pulse Waveform Display
IM AQ7280-01EN
3-7
Page 89

Marker mode
Line mode
3.2 Configuring the Waveform Display
Marker Mode
• Marker
Move the cursor to the location that you want to measure, and set a marker. When you are
measuring return loss and splice loss, they are calculated automatically when you set all the
markers that are necessary for the measurement method that you are using.
• Line
After you select the line marker that you want to operate from a set of multiple line markers,
move the selected line marker directly. The value of the line marker’s section is calculated, and
the return loss and splice loss are measured. Each value is calculated in real time as you move
the line marker.
Note
Line is often used outside of Japan. Marker is often used within Japan. It is used on existing YOKOGAWA
models.
Backscatter Level Base
Select the reference pulse width for detecting backscatter. The selectable range of backscatter
levels in the analysis conditions vary depending on the reference value. For details on backscatter,
see page 2-11.
1µs: The range is ‒64.99 to ‒10.00.
1 ns: The range is –94.99 to ‒40.00.
3-8
IM AQ7280-01EN
Page 90

1
2
Calculation Method for Total Loss
Measurement reference point
END point
• Cumul-Loss (Cumulate Loss)
The integrated value of the splice losses at each event from the measurement reference point (S)
• Loss between S and E
The loss (TPA approximation method) between the measurement reference point (S) and the
3.2 Configuring the Waveform Display
is displayed. This is the conventional calculation method (firmware version 1.02 and earlier).
3
Optical Pulse Waveform Display
Splice loss of each event
end of fiber (E) is displayed.
Measurement reference point (S)
Note
Calculation Method for Total Return Loss
Select whether to include the return loss value at the end of fiber (E) in the total return loss.
Include END: The value is included in the total return loss.
Exclude END: The value is not included in the total return loss.
Splice loss
between
two points
If Loss between S and E is selected, markers 1 and 2 are placed automatically at the measurement
reference point (S) and the END point (E) when event analysis is executed.
Event number 1
▲
S
▲
1
Event number 2
▲
2
▲
E
EEE
IM AQ7280-01EN
3-9
Page 91

3.3 Zooming and Moving Displayed Waveforms
Procedure
Scale Menu
From the top menu, select OTDR.
1.
Press SCALE to display the Scale menu.
2.
Zoom in or out
Pressing this soft key enables you to zoom in and out using the arrow keys.
Move vertically or horizontally
Pressing this soft key enables you to move using the arrow keys.
Set the cursor movement resolution (Fine, Coarse).
Set whether to move the cursor in fine steps or coarse steps.
Auto zoom
Automatically zooms in on the waveform at the cursor position.
Initializes the display scale and position
Overview screen
This indicates where in the entire waveform display area the currently
displayed waveform area is.
Zooming the Displayed Waveform
Press the Zoom soft key.
3.
Press the arrow keys to zoom the displayed waveform in or out.
4.
Moving the Displayed Waveform
Press the Shift soft key.
3.
Press the arrow keys to move the displayed waveform.
4.
Note
You can zoom and shift the waveform regardless of whether measurement is in progress.
3-10
IM AQ7280-01EN
Page 92

1
2
Explanation
Zooming In and Out
You can press the arrow keys to zoom the displayed waveform in or out.
When the cursor is displayed, the waveform is zoomed at the cursor position.
When the cursor is not displayed, the waveform is zoomed at the left edge of the display.
Down arrow key: Zoom in vertically on the waveform.
Up arrow key: Zoom out vertically of the waveform.
Left arrow key: Zoom in horizontally on the waveform.
Right arrow key: Zoom out horizontally of the waveform.
3.3 Zooming and Moving Displayed Waveforms
3
Optical Pulse Waveform Display
Cursor position
Press the left arrow key to
zoom the displayed waveform
horizontally.
Press the down arrow key to
zoom the displayed waveform
vertically.
Auto Zoom
The auto zoom feature contains the following two types of zoomed displays.
• Zoom the waveform at the cursor position
The cursor on the waveform display screen is shown in the center of the zoomed display.
• Zoom the waveform at event positions
When the AQ7280 has detected events during event analysis, the selected event is zoomed and
displayed.
IM AQ7280-01EN
3-11
Page 93

3.3 Zooming and Moving Displayed Waveforms
Shifting the Horizontal and Vertical Axes
You can move the screen by pressing the arrow keys.
Down arrow key: The screen moves down.
Up arrow key: The screen moves up.
Left arrow key: The screen moves left.
Right arrow key: The screen moves right.
Overview Display
The overview display is linked to the zoomed waveform display. The blue box indicates where in the
entire waveform display area the zoomed waveform display is showing.
When the entire waveform is being displayed
Everything within the box is displayed.
When the display is zoomed horizontally
The area shown within the box is zoomed and
displayed in the waveform display area.
When the display is then zoomed vertically
The area shown within the box is zoomed and
displayed in the waveform display area.
When vertical or horizontal shift is selected
“Shift” appears on the screen. The frame color turns green.
3-12
When you move the screen, the box that represents
the display area also moves.
IM AQ7280-01EN
Page 94

1
2
3
Cursor (crosshair cursor example)
Chapter 4 Optical Pulse Analysis
4.1 Analyzing Waveforms
Switching the Waveform to Be Analyzed
When data measured under multi wavelength conditions is loaded into the AQ7280, a soft key for
switching the waveform with the wavelength to be analyzed appears on the OTDR menu.
From the top menu, select OTDR.
1.
Press the Current Trace soft key to switch the waveform with the wavelength to be analyzed.
2.
4
Optical Pulse Analysis
How to Use Cursors
From the top menu, select OTDR.
1.
Turn the rotary knob to display the cursor.
2.
Switches the current trace
Switches the trace displayed on the screen
Note
• The direction that the cursor moves differs depending on the direction that you rotate the rotary knob.
IM AQ7280-01EN
Clockwise: The cursor moves to the right.
Counterclockwise: The cursor moves to the left.
• If you turn the rotary knob counterclockwise to the point where the cursor reaches the left side of the
screen, the cursor will disappear. If you reach the measurement end point, the cursor will not move
forward even if you turn the rotary knob clockwise.
• For details on the cursor display format, see section 3.2.
• You can change the cursor movement resolution (fine or coarse). For the procedure, see section 3.3.
4-1
Page 95

1
Marker
4.1 Analyzing Waveforms
How to Use Markers
You can use markers to measure values such as the distance, splice loss, or return loss between two
points.
Marker Menu (Marker Mode: Marker)
From the top menu, select OTDR.
1.
Press the Marker soft key to display the marker menu.
2.
Switches to the screen that is used to measure 2 Point markers.
For the measurement principle, see section 1.4.
Switches to the screen that is used to measure 4 Point markers.
For the measurement principle, see section 1.4.
Switches to the screen that is used to
measure 6 Point markers.
For the measurement principle, see
section 1.4.
Preset markers.
Register markers that you set in advance,
and apply them on waveforms during
measurement when necessary.
Sets or clears the distance
reference.
Sets the distance reference
(marker R) at the cursor position.
Clears the markers and cursors.
2 Point Markers
Press the 2 Point Markers soft key to display the following screen.
2
Marker
Sets marker .
Marker is set at the cursor
position.
Sets marker .
Marker is set at the cursor
position.
Turns the cursor link on or off
Marker information
1
1
2
2
Note
• When you set the marker positions, set them so that the 1 marker is the measurement start point (the
distance reference).
• The measured loss value differs depending on the specified approximation method.
4-2
IM AQ7280-01EN
Page 96

1
2
3
Distance reference
Marker Y2
this becomes the ALL soft key.
4.1 Analyzing Waveforms
• Distance Reference
Normally, the location where the AQ7280 and the optical fiber cable are connected is the
measurement reference point. This reference point is the distance reference. It is used to
calculate the distance to the cursor and markers. If you are using a launch fiber to perform
measurements, move the distance reference the length of the launch fiber before performing
measurements.
• Cursor Link (Moving all markers together)
You can move all markers while maintaining the distance between them.
4 Point Markers
Press the 4 Point Markers soft key to display the following screen.
3
Marker
2
Marker
1
Marker
Marker information
Sets marker .
Marker is set at the cursor
position.
Sets marker .
Marker is set at the cursor
position.
Set marker Y2.
Marker Y2 is set at the cursor
position.
Sets marker .
Marker is set at the cursor
position.
When no cursors are set,
1
1
2
2
3
3
Press to set all
markers together.
4
Optical Pulse Analysis
IM AQ7280-01EN
Cursor link
See 2 Point markers.
Note
• Set the markers in the order shown above, starting with the measurement start point (the distance
reference).
• The measured loss value differs depending on the specified approximation method.
• Set the correct position for
2
. The splice loss changes greatly depending on the position of 2.
4-3
Page 97

2
Marker
4.1 Analyzing Waveforms
6 Point Markers
Press the 6 Point Markers soft key to display the following screen.
1
Marker
Marker Y3
Marker Y1
Marker information
Marker Y2
Marker
3
Sets marker .
Marker is set at the cursor
1
1
position.
Sets marker .
Marker is set at the cursor
2
2
position.
Set marker Y2.
Marker Y2 is set at the cursor
position.
Sets marker .
Marker is set at the cursor
3
3
position.
Set marker Y1.
Marker Y1 is set at
the cursor position.
Set marker Y3.
Marker Y3 is set at
the cursor position.
Cursor link
See 2 Point markers.
Note
• Set the markers in the order shown above, starting with the measurement start point (the distance
reference).
• The measured loss value differs depending on the specified approximation method.
• Set the correct position for
2
. The splice loss changes greatly depending on the position of 2.
4-4
IM AQ7280-01EN
Page 98

1
2
3
Marker Menu (Marker Mode: Line)
Marker n
Set the approximation method.
From the top menu, select OTDR.
1.
Press the Marker soft key to display the marker menu.
2.
Switches to the screen that is used to measure 2 Point markers.
For the measurement principle, see section 1.4.
Switches to the screen that is used to measure 5 Point markers.
For the measurement principle, see section 1.4.
Preset markers.
Register markers that you set in advance,
and apply them on waveforms during
measurement when necessary.
4.1 Analyzing Waveforms
4
Optical Pulse Analysis
Sets or clears the distance
reference.
Sets the distance reference
(marker R) at the cursor position
See page 4-3.
Clears the markers and cursors.
2 Point Markers
Press the 2 Point Markers soft key to display the following screen.
Marker E
Move the cursor.
Moves the cursor to set
markers.
Set marker n.
Marker n is set at the cursor
position.
Set marker E.
Marker E is set at the cursor
position.
See page 2-3.
Turns the cursor link on or off
Marker information
Note
• When you set the marker positions, set them so that the n marker is the measurement start point (the
distance reference).
• The measured loss value differs depending on the specified approximation method.
IM AQ7280-01EN
4-5
Page 99

Press this soft key to select
Marker N
Preset information
display screen
4.1 Analyzing Waveforms
5 Point Markers
Press the 5 Point Markers soft key to display the following screen.
Marker n
Marker information
Note
• Set the markers in the order shown above, starting with the measurement start point (the distance
reference).
• The measured loss value differs depending on the specified approximation method.
• Set the correct position for marker E. The splice loss changes greatly depending on the position of E.
Marker E
Marker F
Marker f
Cursor (C)
Press to set all markers
together.
Sets marker.
the marker that you are
operating.
Presetting Markers
This function can be used to register markers that you set from the marker menu (2 Point Markers,
4 Point Markers, 5 Point Markers, 6 Point Markers) in advance and apply them on waveforms with a
single touch operation. Up to two sets of markers can be registered. This function is convenient when
measuring the same event repeatedly for each core such as in a multi-core fiber measurement.
From the top menu, select OTDR.
1.
Press the Marker soft key to display the marker menu.
2.
Press the Preset soft key to display the preset menu.
3.
Selects the preset action
(Register, Delete, SetMarker)
Preset A marker
Preset B marker
4-6
IM AQ7280-01EN
Page 100

1
2
3
• Registering a Preset Marker
4.
5.
• Applying a Preset Marker
6.
7.
Note
4.1 Analyzing Waveforms
Press the Action soft key to select Register.
Press the A or B soft key. The marker applied on the waveform is registered, and the marker
information is displayed on the preset information display screen.
Display measured waveform data on the screen.
Tap the A or B icon. The A or B preset marker is applied to the waveform.
4
Optical Pulse Analysis
Icon A, Icon B
Preset markers exceeding the distance range of the waveform display cannot be applied.
Preset markers can also be applied from the preset menu.
6. Display measured waveform data on the screen.
7. Press the Action soft key to select SetMarker.
8. Press the A or B soft key. The preset marker is applied to the waveform.
• Deleting a Preset Marker
Press the Action soft key to select Delete.
4.
Press the A or B soft key. Marker information on the preset information display screen is
5.
cleared.
Note
A marker applied to the waveform is not cleared. To clear a marker applied to the waveform, press the Delete
Cursor/Marker soft key explained on page 4-2 or 4-5.
IM AQ7280-01EN
4-7
 Loading...