

Page 1

User ’s
Manual
AQ6370D
Optical Spectrum Analyzer
IM AQ6370D-01EN
5th Edition
Page 2

Product Registration
Thank you for purchasing YOKOGAWA products.
YOKOGAWA provides registered users with a variety of information and services.
Please allow us to serve you best by completing the product registration form
accessible from our website.
http://tmi.yokogawa.com/
PIM 103-04E
Page 3

List of Manuals
Thank you for purchasing the AQ6370D Optical Spectrum Analyzer. This instrument
enables high speed measurement of the optical properties of LD and LED light sources,
optical amps, and other devices. To improve ease of use, it includes mouse-based user
operation and a brand-new zoom function.
This user’s manual describes the instrument’s functions, operating procedures, and
handling precautions, and provides other important information for use of the instrument.
For correct operation, please read this manual thoroughly before use. After reading this
manual, keep it in a convenient location for quick reference in the event a question arises
during operation.
The following manuals, including this one, are provided as manuals for the AQ6370D.
Please read all manuals.
Manual Title Manual No. Description
AQ6370D
Optical Spectrum Analyzer
User’s Manual
AQ6370C/AQ6370D/AQ6373/
AQ6373B/AQ6375/AQ6375B
Optical Spectrum Analyzer
Remote Control User’s Manual
AQ6370D
Optical Spectrum Analyzer
Getting Started Guide
Model AQ6370D-01
AQ6370D Optical Spectrum
Analyzer Limited model
IM AQ6370D-01EN The manual is located on the CD included
in your package (pdf format). Explains
all functions and operating procedures of
the AQ6370D except remote control and
program functions.
IM AQ6370C-17EN The manual is located on the CD included
in your package (pdf format).Explains
functions for controlling the instrument with
communication commands and program
functions.
IM AQ6370D-02EN This manual. Explains the handling
precautions, installation procedure,
component names, and specifications of
the AQ6370D.
IM AQ6370D-51EN Explains the specifications of the limited
model of the AQ6370D.
The “EN” in the manual number is the language code.
Notes
Trademarks
Contact information of Yokogawa offices worldwide is provided on the following sheet.
Document Description Description
PIM 113-01Z2 List of worldwide contacts
• The contents of this manual are subject to change without prior notice as a result
of improvements in the instrument’s performance and functions. Display contents
illustrated in this manual may differ slightly from what actually appears on your screen.
• Every effort has been made in the preparation of this manual to ensure the accuracy
of its contents. However, should you have any questions or find any errors, please
contact your nearest YOKOGAWA dealer.
• Copying or reproducing all or any part of the contents of this manual without the
permission of YOKOGAWA is strictly prohibited.
• Microsoft and Windows are registered trademarks or trademarks of Microsoft
Corporation in the United States and/or other countries.
• Adobe and Acrobat are registered trademarks or trademarks of Adobe Systems
incorporated.
• In this manual, the ® and TM symbols do not accompany their respective registered
trademark or trademark names.
• Other company and product names are registered trademarks or trademarks of their
respective companies.
5th Edition: October 2017 (YMI)
All Rights Reserved, Copyright © 2014 Yokogawa Test & Measurement Corporation
IM AQ6370D-01EN
i
Page 4

Revisions
• 1st Edition: April 2014
• 2nd Edition: July 2014
• 3rd Edition: July 2015
• 4th Edition: May 2017
• 5th Edition: October 2017
ii
IM AQ6370D-01EN
Page 5
Conventions Used in This Manual
Safety Markings
The following markings are used in this manual.
Improper handling or use can lead to injury to the user or damage
to the instrument. This symbol appears on the instrument to indicate
that the user must refer to the userʼs manual for special instructions.
The same symbol appears in the corresponding place in the user's
manual to identify those instructions. In the manual, the symbol is
used in conjunction with the word “WARNING” or “CAUTION.”
WARNING
CAUTION
Note
Calls attention to actions or conditions that could cause serious or
fatal injury to the user, and precautions that can be taken to prevent
such occurrences.
Calls attentions to actions or conditions that could cause light injury to
the user or damage to the instrument or user’s data, and precautions
that can be taken to prevent such occurrences.
Calls attention to information that is important for proper operation of
the instrument.
Notations Used on Pages Describing Operating Procedures
On pages that describe the operating procedures in Chapter 3 through 11, the following
notations are used to distinguish the procedures from their explanations.
Procedure
Explanation
This subsection contains the operating procedure used to carry out
the function described in the current chapter. The procedures are
written with inexperienced users in mind; experienced users may not
need to carry out all the steps.
This subsection describes the setup parameters and the limitations on
the procedures. It may not give a detailed explanation of the function.
For a detailed explanation of the function, see chapter 2.
Unit
IM AQ6370D-01EN
Notations Used in the Procedures
Panel Keys and Soft keys
Bold characters used in the procedural explanations indicate characters that are marked on the
panel keys or the characters of the soft keys displayed on the screen menu.
k: Denotes “1000.” Example: 100 kS/s
K: Denotes “1024.” Example: 459 KB (file data size)
iii
Page 6
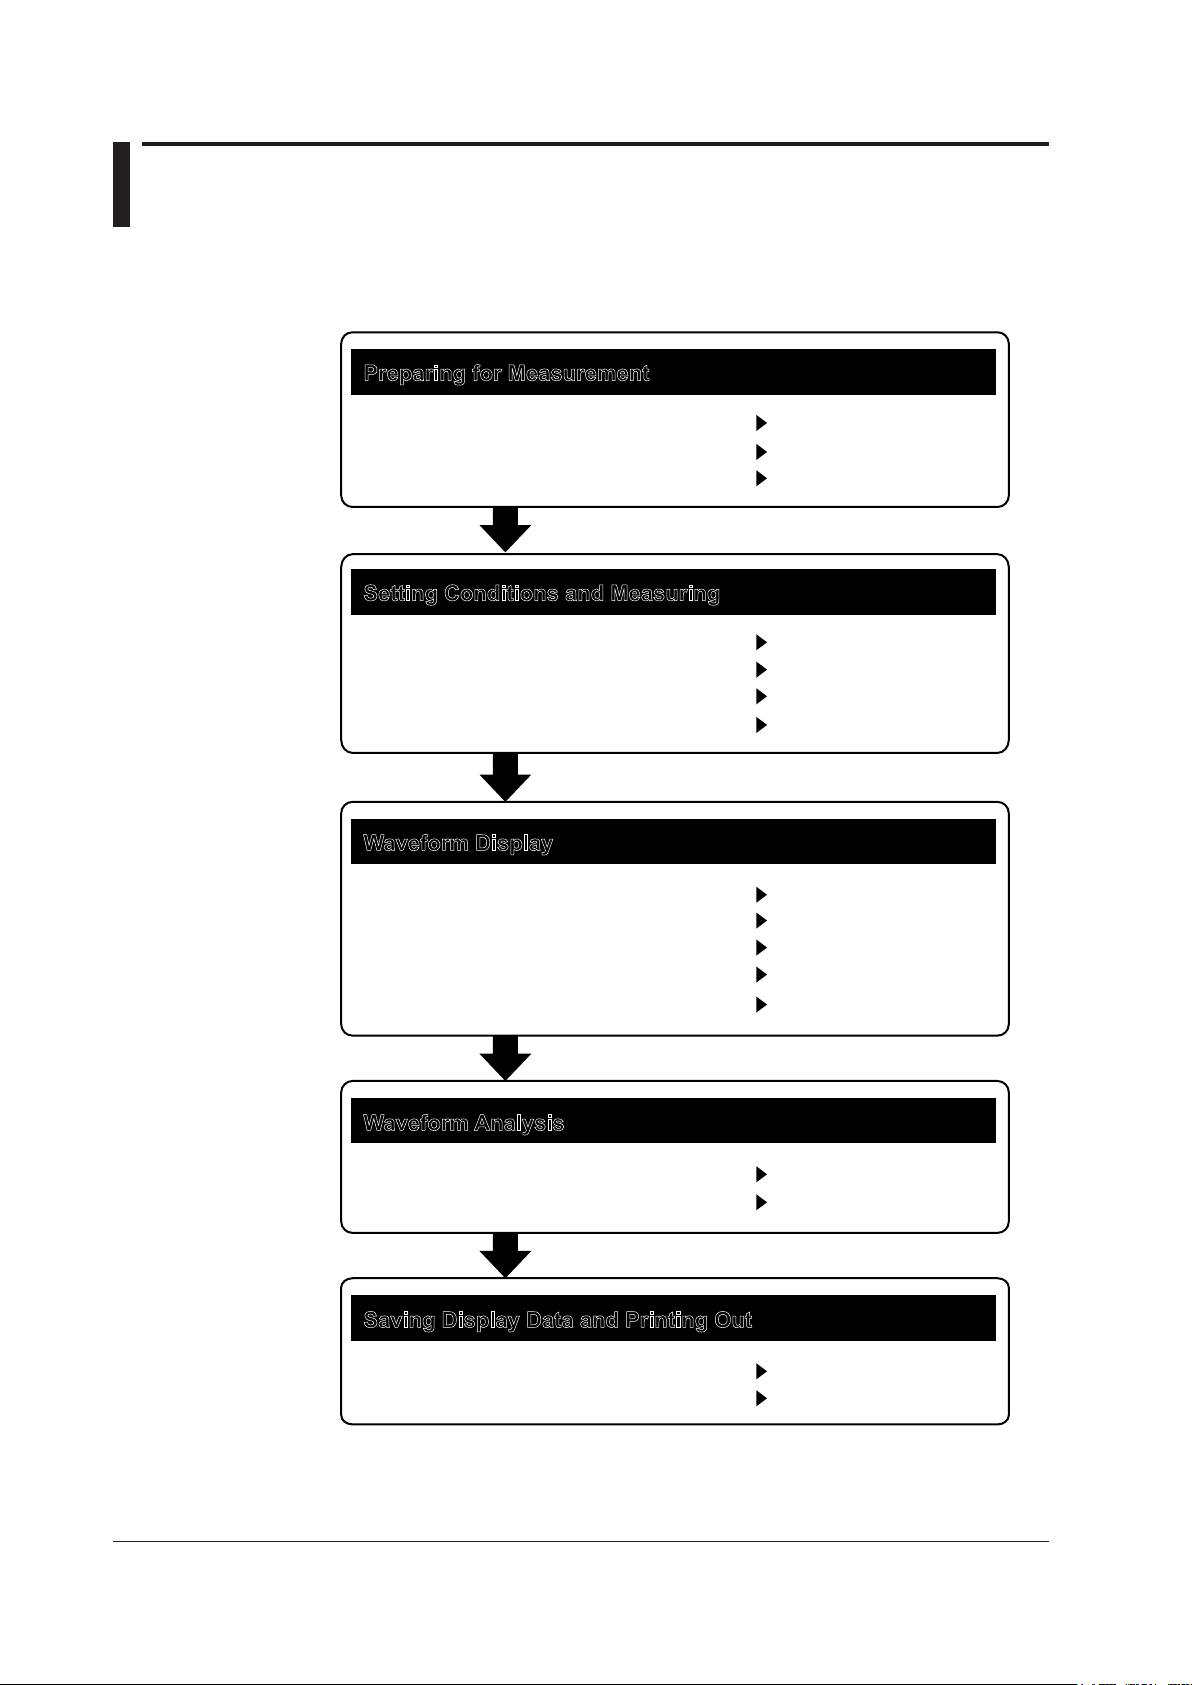
Flow of Operation
The figure below is provided to familarize the first-time user with the general flow of this
instrument operation. For a description of each item, see the relevant section or chapter.
Preparing for Measurement
Installing the Instrument
Turning the Power ON/OFF
Wavelength Calibration
Setting Conditions and Measuring
Auto Sweep Setting and Measurement
Other Settings
Measurement Start (Sweep)
External Trigger Measurement
Waveform Display
Waveform Display
Displaying Calculated Waveforms
Displaying Power Density
Marker Display
Searching
Section 3.1
Section 3.4
Section 3.7
Section 5.1
Sections 5.2 to 5.12
Section 5.13
Section 5.16
Sections 6.1 to 6.4
Section 6.5
Section 6.8
Section 6.9
Sections 6.13 and 6.14
Waveform Analysis
Waveform Analysis
GO/NO-GO Judgment
Sections 7.1 to 7.9
Section 7.12
Saving Display Data and Printing Out
Storage Media
Saving Data
iv
Section 8.1
Sections 8.2 to 8.10
IM AQ6370D-01EN
Page 7
Contents
List of Manuals ...................................................................................................................................i
Conventions Used in This Manual ................................................................................................... iii
Flow of Operation.............................................................................................................................iv
1
2
Chapter 1 Part Names and Functions
1.1 Front Panel ....................................................................................................................... 1-1
1.2 Rear Panel ....................................................................................................................... 1-2
1.3 Panel Keys and Knobs ..................................................................................................... 1-3
1.4 LCD Screen ...................................................................................................................... 1-6
Chapter 2 Functions
2.1 System Structure .............................................................................................................. 2-1
2.2 Measurement ................................................................................................................... 2-2
2.3 Waveform Display ........................................................................................................... 2-7
2.4 Analysis .......................................................................................................................... 2-12
2.5 Other .............................................................................................................................. 2-14
Chapter 3 Preparing for Measurement
3.1 Installing the Instrument ................................................................................................... 3-1
3.2 Attaching the Connector Adapter ..................................................................................... 3-3
3.3 Connecting the Device ..................................................................................................... 3-5
3.4 Turning the Power ON/OFF .............................................................................................. 3-7
3.5 Connecting the DUT ....................................................................................................... 3-12
3.6 Alignment Adjustment ..................................................................................................... 3-14
3.7 Wavelength Calibration .................................................................................................. 3-18
3.8 Resolution Calibration .................................................................................................... 3-23
3.9 Important Points During Measurement ........................................................................... 3-27
3
4
5
6
7
8
9
Chapter 4 Common Operations
4.1 Description of Soft Keys ................................................................................................... 4-1
4.2 Using the Mouse and External Keyboard ......................................................................... 4-3
4.3 Entering Numerical Values and Strings ............................................................................ 4-5
4.4 Screen Display ................................................................................................................. 4-7
4.5 Setting the Date and Time ................................................................................................ 4-8
Chapter 5 Measurement
5.1 Auto Measurement ........................................................................................................... 5-1
5.2 Horizontal/Vertical Axis Settings ....................................................................................... 5-2
5.3 Sub Scale ......................................................................................................................... 5-7
5.4 Setting the Reference Level ............................................................................................5-11
5.5 Center Wavelength (Center Frequency) Setting ............................................................ 5-15
5.6 Sweep Width Settings .................................................................................................... 5-20
5.7 Wavelength (Frequency) Resolution Settings ................................................................ 5-24
5.8 Sampling Point/Interval Settings .................................................................................... 5-27
5.9 Sensitivity Settings ......................................................................................................... 5-29
5.10 Sweep Speed Settings ................................................................................................... 5-31
5.11 Averaging Times Setting................................................................................................. 5-32
5.12 Trace Settings ................................................................................................................ 5-33
5.13 Measurement Start (Sweep) .......................................................................................... 5-35
IM AQ6370C-01EN
10
11
App
Index
v
Page 8

Contents
5.14 Specifying a Sweep Range ............................................................................................ 5-37
5.15 Pulse Light Measurement ............................................................................................... 5-38
5.16 External Trigger Measurement ....................................................................................... 5-44
5.17 Trigger Output ................................................................................................................ 5-48
5.18 Smoothing ...................................................................................................................... 5-49
5.19 Analog Out ..................................................................................................................... 5-50
Chapter 6 Waveform Display
6.1 Zooming In/Out on Waveforms ......................................................................................... 6-1
6.2 Wavelength Updating/Fixing ............................................................................................. 6-8
6.3 MAX/MIN HOLD Display ................................................................................................ 6-10
6.4 Sweep Average ...............................................................................................................6-11
6.5 Displaying Calculated Waveforms .................................................................................. 6-13
6.6 Normalized Display ....................................................................................................... 6-19
6.7 Curve Fitting .................................................................................................................. 6-20
6.8 Power Density Trace ..................................................................................................... 6-26
6.9 Marker Display ............................................................................................................... 6-27
6.10 Displaying a Split Screen ............................................................................................... 6-43
6.11 Noise Mask ..................................................................................................................... 6-45
6.12 Copying and Clearing Traces ......................................................................................... 6-47
6.13 Single Search ................................................................................................................. 6-49
6.14 Multi Search ................................................................................................................... 6-53
Chapter 7 Analysis
7.1 Spectrum Width Measurement ......................................................................................... 7-1
7.2 Notch Width Measurement ............................................................................................... 7-4
7.3 SMSR Measurement ........................................................................................................ 7-6
7.4 POWER Measurement ..................................................................................................... 7-8
7.5 DFB-LD, FP-LD, and LED Measurement ......................................................................... 7-9
7.6 PMD Measurement ........................................................................................................ 7-10
7.7 WDM Transmission Signal Analysis ............................................................................... 7-12
7.8 Optical Amp Gain and NF Measurement ........................................................................ 7-19
7.9 Optical Filter Characteristics Measurement ................................................................... 7-26
7.10 Editing the Grid Table ..................................................................................................... 7-35
7.11 Measurement of Level Fluctuations in Single-Wavelength Light (0 nm Sweeping) ........ 7-39
7.12 Go/No-Go Judgment (Template) .................................................................................... 7-42
7.13 Specifying an Analysis Range ........................................................................................ 7-54
7.14 Correcting Displayed Values .......................................................................................... 7-57
7.15 Analysis Data Logging .................................................................................................... 7-60
Chapter 8 Saving/Loading Data
8.1 USB Storage Media .......................................................................................................... 8-1
8.2 Temporarily Saving and Redisplaying Traces to and from Internal Memory .................... 8-2
8.3 Saving/Loading Displayed Data ....................................................................................... 8-6
8.4 Saving/Loading Displayed Data(All Trace) ..................................................................... 8-22
8.5 Saving/Loading Setting Data .......................................................................................... 8-28
8.6 Saving/Loading Analysis Results Data ........................................................................... 8-33
8.7 Saving/Loading Program Data ....................................................................................... 8-40
8.8 Saving Screen Image Data ............................................................................................ 8-46
8.9 Saving/Loading Template Data....................................................................................... 8-50
8.10 Saving and Loading Logging Data ................................................................................. 8-56
8.11 Creating Files ................................................................................................................. 8-62
vi
IM AQ6370C-01EN
Page 9

Contents
Chapter 9 Other Operations
9.1 Registering Soft keys ....................................................................................................... 9-1
9.2 Data Initialization .............................................................................................................. 9-2
9.3 Help ................................................................................................................................ 9-16
9.4 Registering and Loading Character Strings ................................................................... 9-17
9.5 Locking Keys .................................................................................................................. 9-18
9.6 Other Settings ................................................................................................................ 9-20
9.7 Displaying System Information ....................................................................................... 9-25
Chapter 10 Maintenance
10.1 Updating the Firmware ................................................................................................... 10-1
10.2 Mechanical Inspection .................................................................................................... 10-4
10.3 Operational Inspection ................................................................................................... 10-5
10.4 Inspection of Wavelength Accuracy ................................................................................ 10-6
10.5 Inspection of Level Accuracy .......................................................................................... 10-7
10.6 Replacing Fuses ............................................................................................................. 10-8
10.7 Daily Maintenance .......................................................................................................... 10-9
10.8 Care during Storage ......................................................................................................10-11
10.9 Recommended Replacement Parts ............................................................................. 10-12
10.10 Warning Display Function ............................................................................................. 10-13
Chapter 11 Specications
11.1 Specications ..................................................................................................................11-1
11.2 External Dimensions .......................................................................................................11-4
1
2
3
4
5
6
7
Appendix
Index
Appendix 1 GRID Table for WDM Wevelength ....................................................................... App-1
Appendix 2 Data Calculation Algorithms for Spectrum Widths ............................................... App-2
Appendix 3 Details of Each Analytical Functions ................................................................. App-11
Appendix 4 Detailed Explanations of WDM Analysis Function ............................................. App-19
Appendix 5 Details of Optical Amplifier Analysis Function ...................................................App-30
Appendix 6 Details of Optical Filter Analysis Function ......................................................... App-33
Appendix 7 Soft Key Tree Diagram ...................................................................................... App-50
Appendix 8 END USER LICENSE AGREEMENT ................................................................ App-69
8
9
10
11
App
Index
IM AQ6370C-01EN
vii
Page 10
3 4
9 10
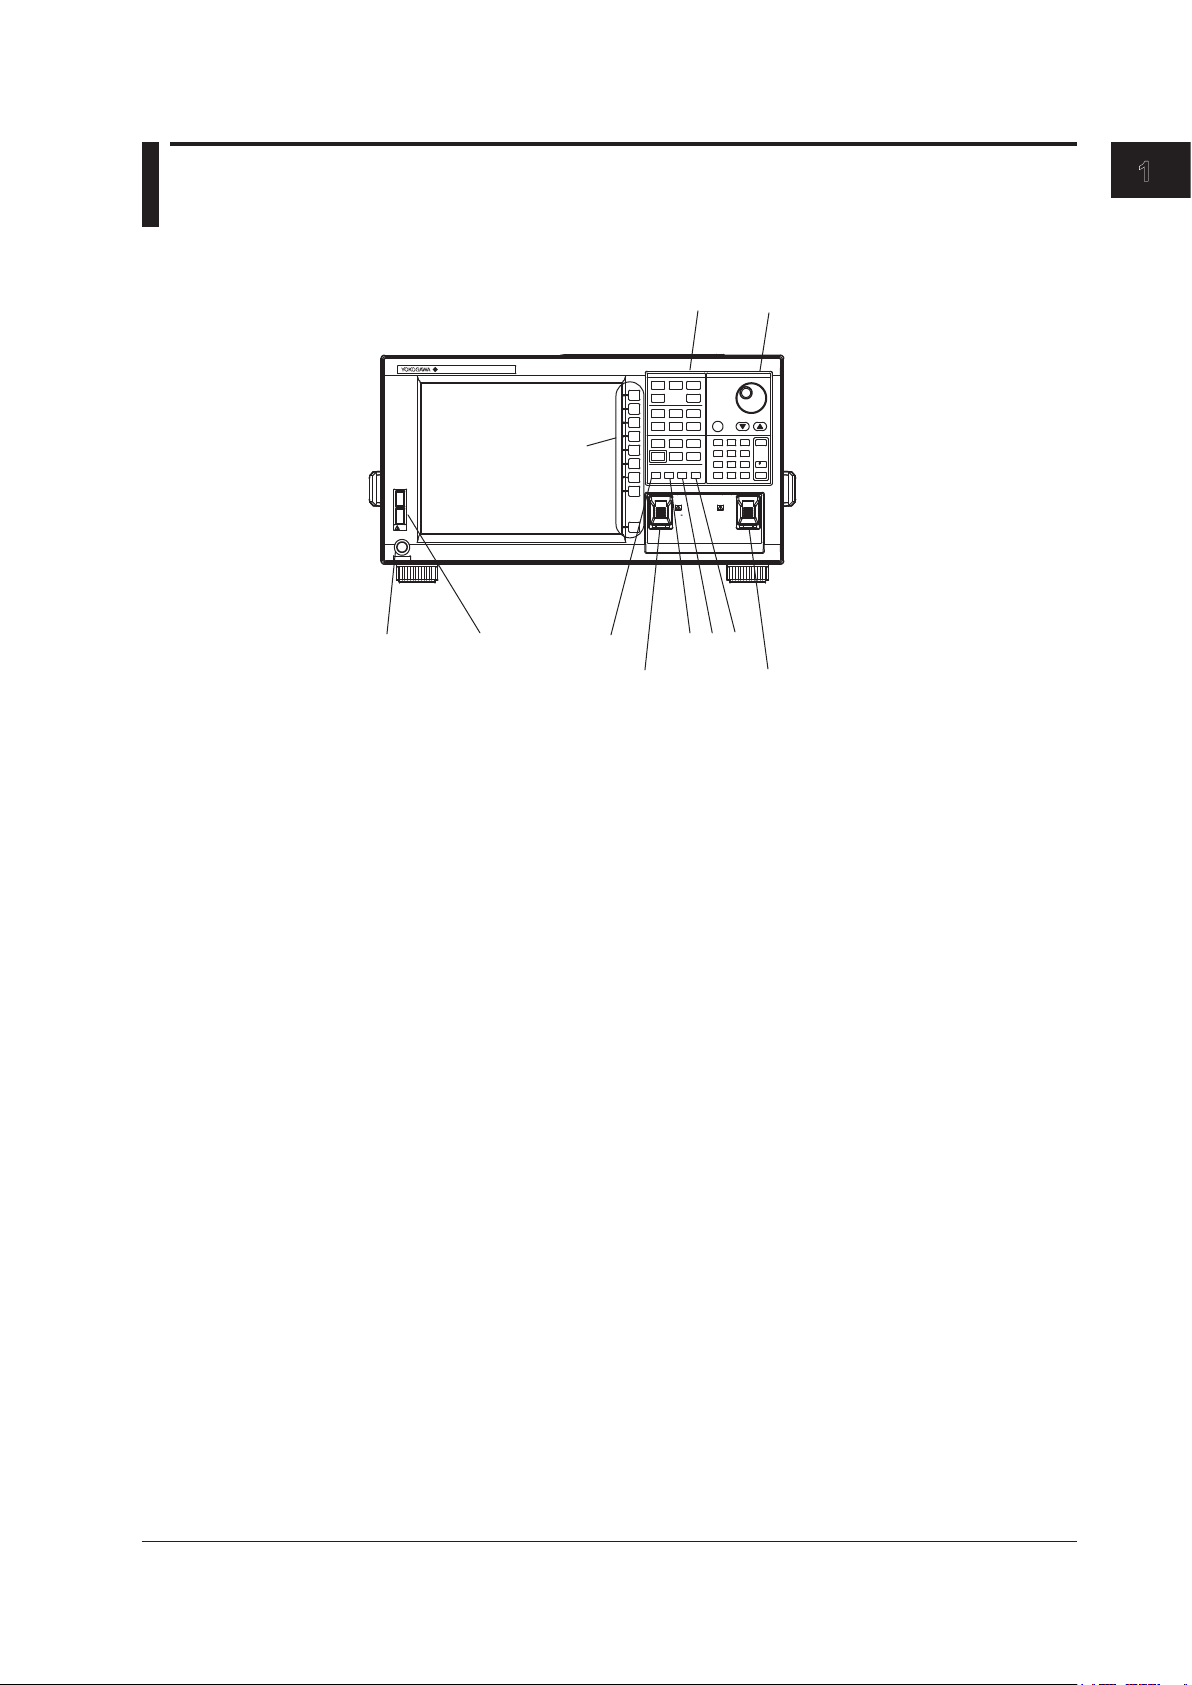
Chapter 1 Part Names and Functions
1.1 Front Panel
Front Panel
USB
POWER
5 6 7 8
No. Name Function
1 LCD display Displays measured waveform, measurement conditions,
2 Soft key section Used to execute the functions assigned to the soft keys on
3 FUNCTION section Used to enter settings pertaining to all measurements
4 DATA ENTRY section Used for measurement condition parameter input, label
5 POWER Used to start and shut down the instrument.
6 USB interface Used to connect USB storage media
7 UNDO/LOCAL See the following table(1.3 Panel keys and Knobs)
8 HELP Used to check the contents of the soft key menu displayed
9 OPTICAL INPUT Optical input connector
10 CALIBRATION OUTPUT Reference light source optical output connector used for
11 COPY Save the screen as an image file.
12 PRESET Clears all internal settings of the AQ6370D except for the
AQ6370D
OPTICAL SPECTRUM ANALYZER
1 2
DATA ENTRY
FUNCTION
SPAN
LEVEL
CENTER
SWEEP
ZOOM
DISPLAY
SETUP
TRACE
PEAK
COARSE
ANALYSIS
MARKER
SEARCH
USER
FILE
MEMORY
ADVANCE
PROGRAM
SYSTEM
OREMOTE
UNDO/
PRESET
HELP
COPY
LOCAL
OPTICAL INPUT
(
)
600 1700nm
7
8
5
4
1 2 3
.
0
CALIBRATION
OUTPUT
BACK
9
SPASE
6
m/
ENTER
nm/
-
ENTER
11 12
measurement values, etc.
the right side of the LCD display
(sweep, measurement conditions, data analysis, and
various functions)
input, etc.
on the screen.
alignment adjustments and wavelength calibration (when
the built-in light source specification is -L1)
remote interface (ETHERNET, GP-IB, and RS232) settings.
1
Part Names and Functions
IM AQ6370D-01EN
1-1
Page 11
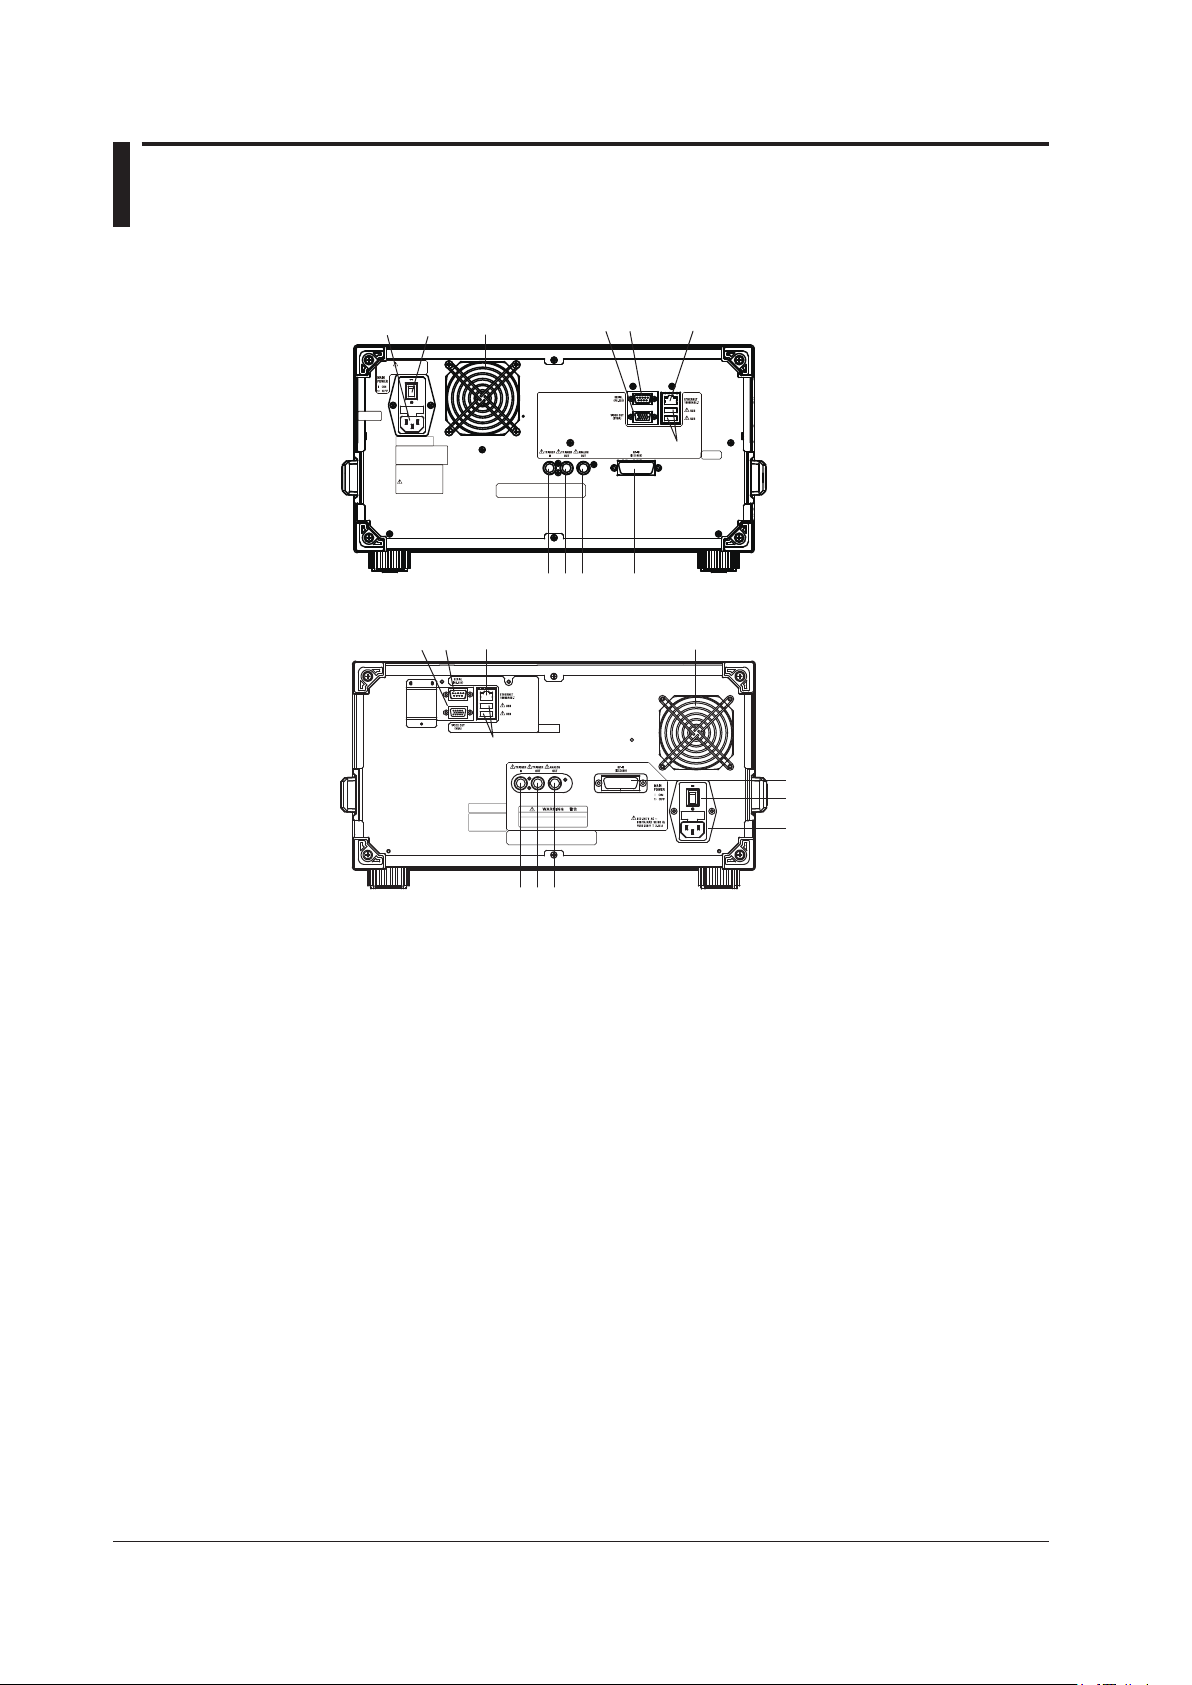
1.2 Rear Panel
2
3
4
5
6
AQ6370D-02, A6370D-12, A6370D-22
Rear Panel
11
56
7 8
3 4
2
1
AQ6370D-01, A6370D-10, A6370D-20
7
8 9
10
9
10
11
1
No. Name Function
1 GP-IB GP-IB port for controlling this unit through an external
computer
2 TRIGGER IN Input connector for synchronous signals for the
synchronous measurement function with the Tunable Laser
Source
3 TRIGGER OUT Output connector for synchronous signals for the
synchronous measurement function with the Tunable Laser
Source
4 ANALOG OUT Analog output
5 MAIN POWER Used to turn the main power ON/OFF
6 Power cord connector Connect the power cord to this connector
7 VIDEO OUT (SVGA) Analog RGB video signal (SVGA-compliant) interface
8 SERIAL RS-232 interface
9 ETHERNET Ethernet Interface (10/100BASE-TX)
10 USB interface Used to connect USB storage media or USB mouse
11 Exhaust holes
1-2
IM AQ6370D-01EN
Page 12
1.3 Panel Keys and Knobs
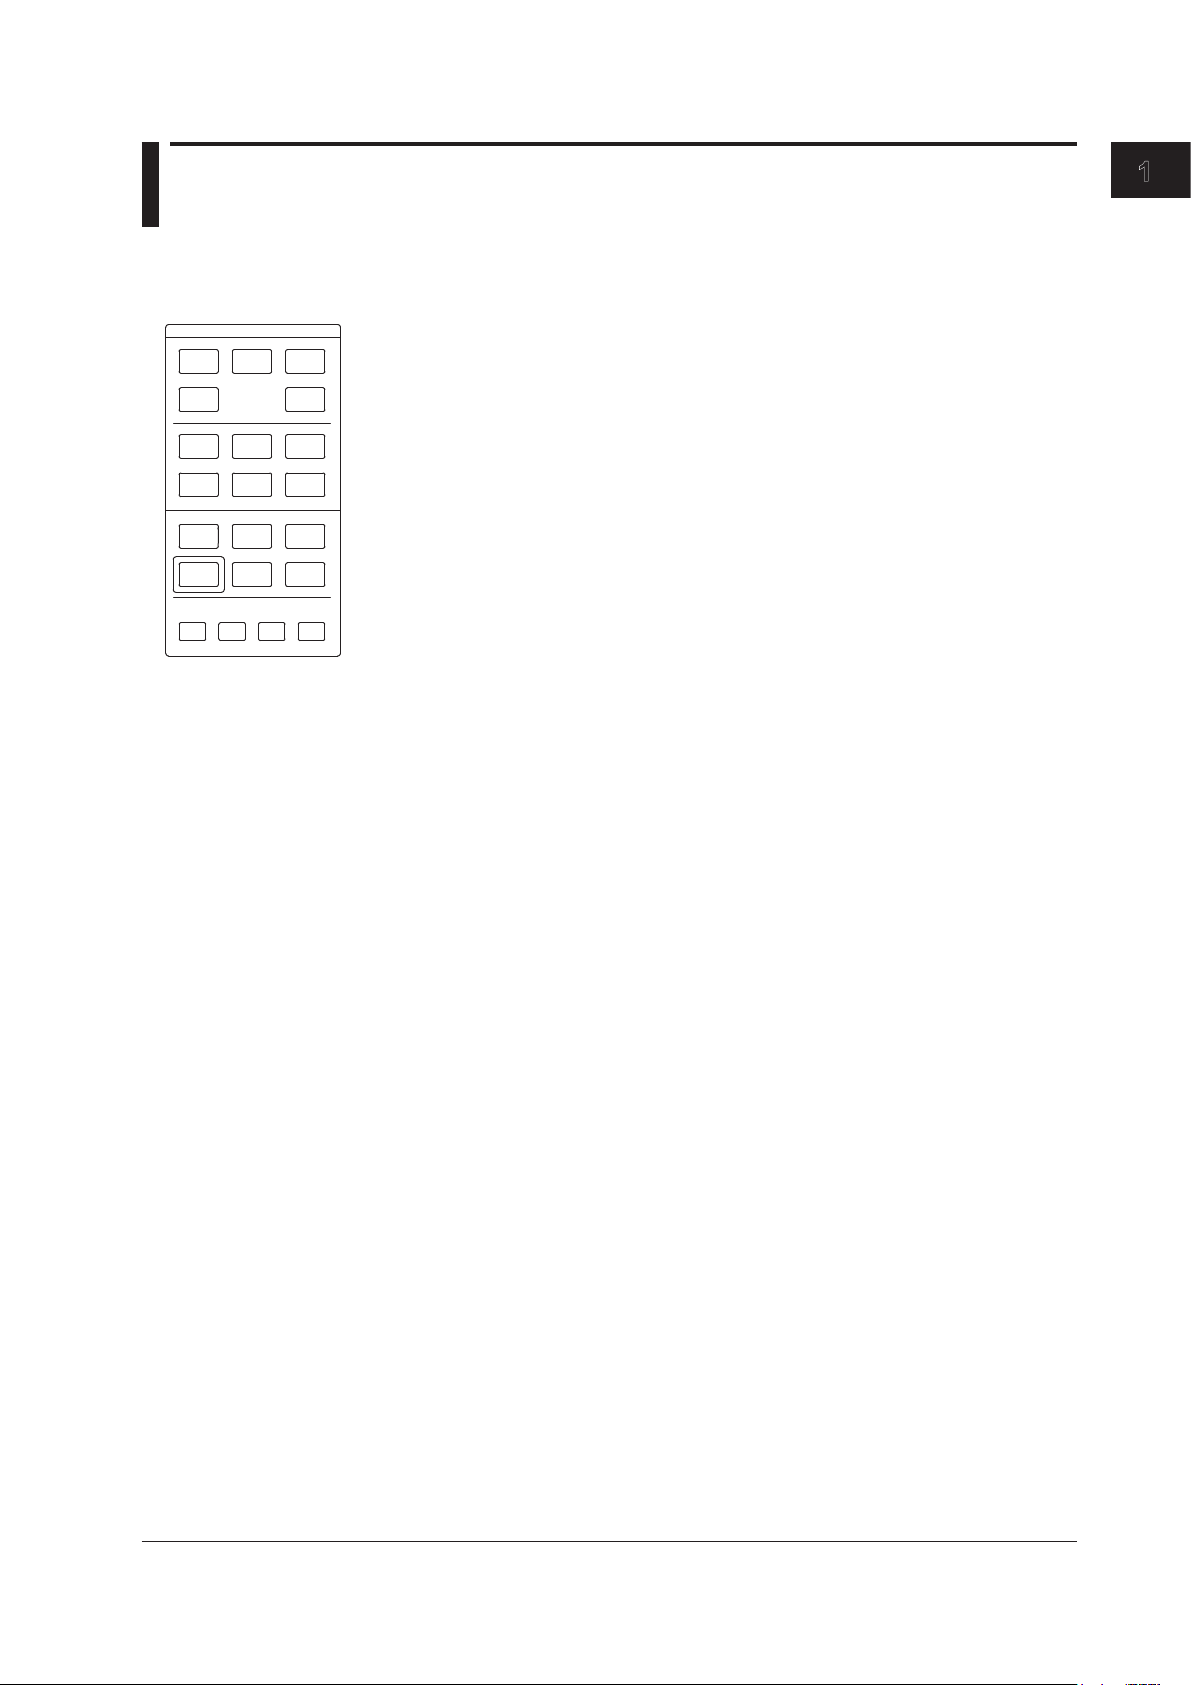
FUNCTION
FUNCTION Section
The FUNCTION section contains 17 function keys and 4 auxiliary keys. When you press
a function key, information about the function is displayed on the soft key menu located
CENTER
SWEEP
SETUP
MARKER
USER
PROGRAM
OREMOTE
UNDO/
LOCAL
SPAN
DISPLAY
PEAK
SEARCH
MEMORY
ADVANCE
HELP
COPY
LEVEL
ZOOM
TRACE
ANALYSIS
FILE
SYSTEM
PRESET
on the right side of the LCD display.
SWEEP
The SWEEP key contains functions related to sweeping. When you press the SWEEP
key, the soft key menu for sweeping appears.
CENTER
The CENTER key contains functions related to setting the center wavelength and center
frequency for measurements. The soft key functions change depending on whether the
screen display mode is wavelength display mode or frequency display mode.
SPAN
The SPAN key contains functions pertaining to settings for the wavelength span or
frequency span being measured. The soft key functions change according to whether the
screen display mode is wavelength display mode or frequency display mode.
1
Part Names and Functions
LEVEL
The LEVEL key contains functions related to level axis settings.When you press the
LEVEL key, the soft key menu for setting reference level appears.
SETUP
The SETUP key contains functions related to measurement condition settings.
ZOOM
The ZOOM key contains the zoom function, which allows the user to freely enlarge or
reduce a measured waveform in order to check a small area of the measured waveform,
or to check the overall waveform.
This key is used to set the waveform enlarged/reduced display conditions.
DISPLAY
The DISPLAY key contains functions related to screen display.This key is used to set the
screen to upper/lower 2-split display mode (split mode).
TRACE
The TRACE key contains functions related to trace mode settings.
MARKER
The MARKER key contains functions related to markers.
IM AQ6370D-01EN
PEAK SEARCH
The PEAK SEARCH key contains functions for searching for peaks and bottoms in
measured waveforms.
ANALYSIS
The ANALYSIS key contains functions related to measured waveform analysis.
1-3
Page 13

1.3 Panel keys and Knobs
MEMORY
The MEMORY key contains functions for writing the contents of the active trace to the
unit’s internal memory. When you press the MEMORY key, the traces and memory list
screen (soft key menu) are displayed. A memory number may be entered in the DATA
ENTRY section, or selected using the rotary knob or arrow keys.
FILE
The FILE key contains functions for saving and loading waveform data, program data,
and the like to and from USB storage media (USB memory/HDD).
PROGRAM
The PROGRAM key contains the soft keys related to program functions for controlling
measurements through a program.
SYSTEM
The SYSTEM key contains system-related functions such as monochromator adjusting
optical alignment, wavelength adjustment, hardware setup, and setting initialization.
ADVANCE
The ADVANCE key contains functions for setting reference data used to make
comparison judgments on measured data and for logging analysis data.
USER
Frequently used soft keys can be registered on the soft key menu in the USER key.
Registering frequently used soft keys in the USER key allows you to execute frequently
used functions in a small number of steps.
COPY
The COPY key is used to output the measurement screen to the internal printer or a file.
When you press the COPY key, the measured waveforms and lists displayed on the
screen are output to the internal printer or a file.
PRESET
The PRESET key clears all internal settings of the AQ6370D except for the remote
interface (ETHERNET, GP-IB, and RS232) settings.
UNDO/LOCAL
The key’s function changes depending on the status of the instrument when the UNDO/
LOCAL key is pressed. The following table shows the key’s functions.
Status of Instrument Function
UNDO action is allowed If the UNDO key is pressed after changing parameter settings,
changing or deleting data, etc., the previous action (change,
deletion, etc.) is canceled and the state preceding that action
is restored.
During user key registration If the UNDO key is pressed during user key registration,
registration mode is canceled and the soft key menu which
appeared when the SYSTEM key was pressed is displayed
again.
During remote control by external
PC (Remote light is on)
Changes the state from the remote state back to the local
state. The remote light turns off.
HELP
When you press the HELP key, a soft key menu of the currently displayed screen is
displayed explanations.
Soft keys for selecting the “MORE INFO” which indicate additional information are
displayed by some soft keys in HELP screen.
1-4
IM AQ6370D-01EN
Page 14
1.3 Panel keys and Knobs
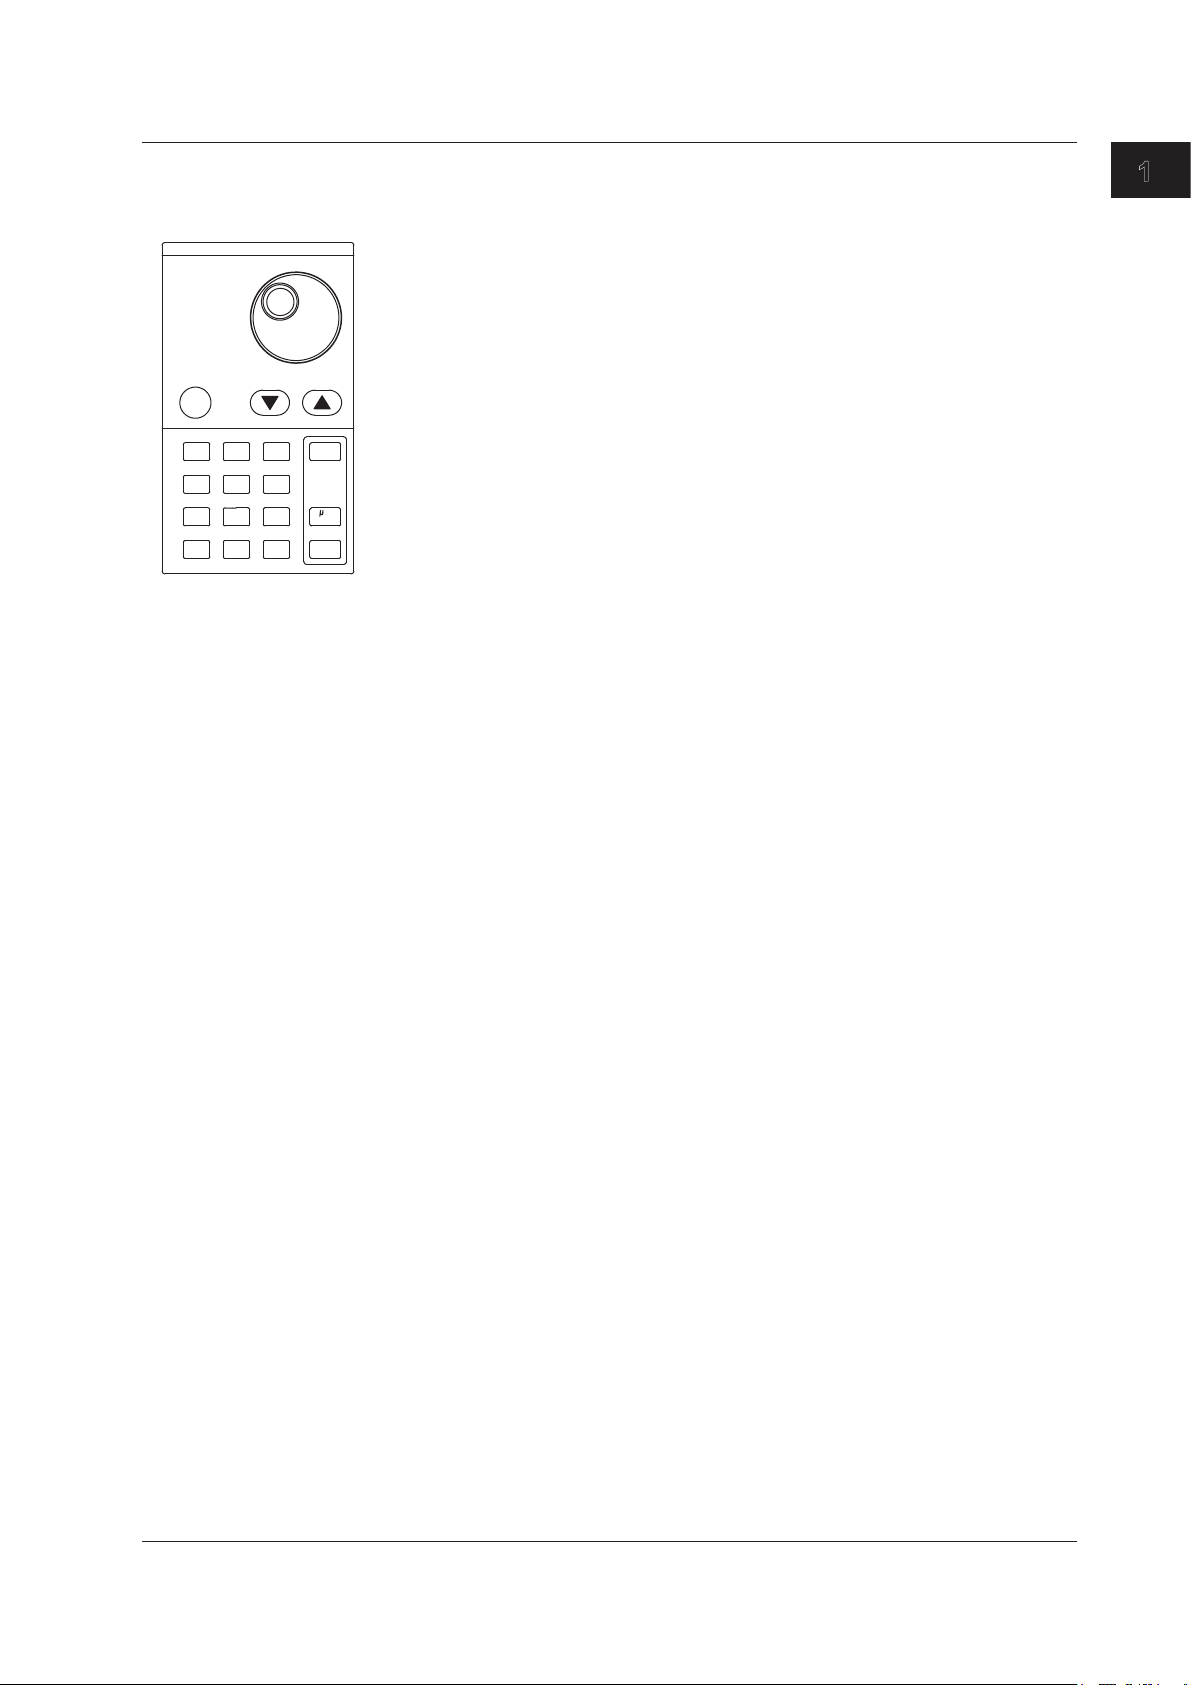
DATA ENTRY
DATA ENTRY Section
This unit allows you to enter measurement conditions and various other parameters
through the DATA ENTRY section. Three different entry methods can be used in the
DATA ENTRY section, the rotary knob, the arrow keys, and the numeric keypad.
Rotary knob
When you press a soft key which has a parameter, the current setting is displayed in
the parameter entry window. Turning the rotary knob raises or lowers the numeric value
COARSE
7
4
1
0
9
8
5
6
3
2
.
-
shown in the parameter entry window (turn clockwise to increase and counterclockwise
to decrease), and the internal setting changes at the same time.
Note that if the COARSE key is on (lamp on), the numeric value increase/decrease step
BACK
SPASE
will be larger.
m/
ENTER
Arrow keys (▲, ▼)
nm/
ENTER
Pressing the ▲ key has the same effect as turning the rotary knob clockwise. Likewise,
pressing the ▼ key has the same effect as turning the rotary knob counterclockwise.
Holding an arrow key down for 0.5 second or longer activates auto-repeat.
If the multi-marker function has been selected, the arrow keys can be used to scroll the
marker value display in the data area.
COARSE Key
You can raise the digit of settings being entered or the increase/decrease step for
numerical values.
Each time you press this key the setting toggles between ON and OFF. When ON, the
lamp lights.
1
Part Names and Functions
Numeric keypad
You can enter numerical values directly into the parameter input window by pressing
keys of the numeric keypad.
After you have pressed a parameter soft key to display the current setting in the
parameter display area, you can press a numeric keypad key to display the numeric
keypad input area including the entered numeric value.
If the value entered with the numeric keypad is not in the allowed value range, the
nearest allowed value will be set.
μm/ENTER Key and nm/ENTER Key
Enters values input using the numeric keypad or the parameter input window.
Use one or the other key if entering a parameter value with a particular unit.
If a parameter does not have a unit associated with it, you can use either the μm/ENTER
key or the nm/ENTER key.
BACK SPACE Key
Use this key if you make an error when inputting values with the numeric keypad. The
last entered (right-most) character is removed, allowing entry of the correct character.
By holding the BACK SPACE key down, you can erase the entire entry in the numeric
keypad input area and make the numeric keypad input area disappear, returning it to the
condition preceding numeric keypad input.
IM AQ6370D-01EN
1-5
Page 15
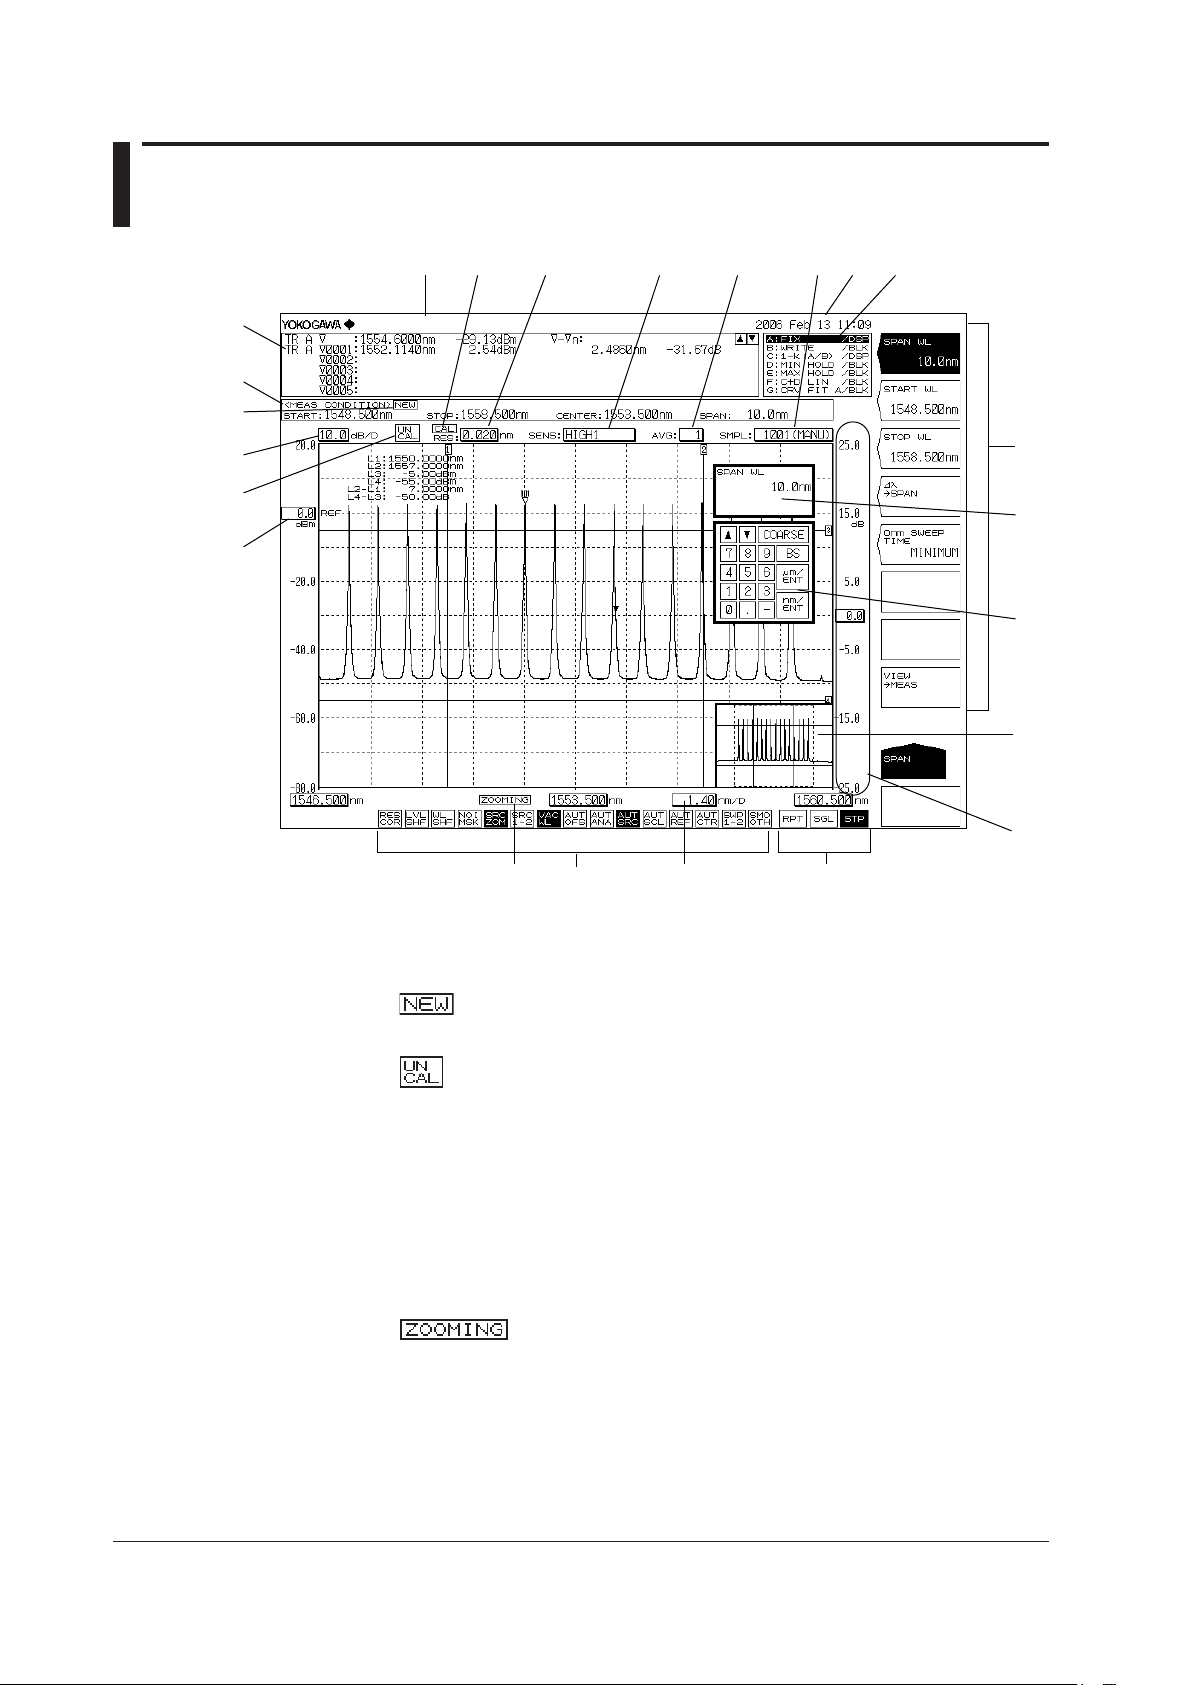
1.4 LCD Screen
1
2
3
4
5
6
7 8 9 10
11 12
13
14 15
16
17
19
20
23
18
21
22
No. Function
1 Data area
2 Measurement conditions area
3
4 Displays level axis scale per DIV
5
6 Displays reference level
7 Label area (56 characters)
8 Displays wavelength resolution
9 Displays measurement sensitivity
10 Displays averaging times
11 Displays the number of measurement samples
12 Displays date and time
13 Displays each trace status
14
15 Displays the statuses of main settings
16 Displays wavelength axis scale per DIV
17 Displays sweep status
(Displayed when any of the measurement conditions are changed.)
(Displayed when measurement is not correctly carried out.)
(Only displayed when ZOOM function is used)
(When a setting is ON, its display is depressed, or is displayed with white on black
background if the display colors are black and white.)
(RPT=Repeat; SGL=Single; STP=Stop)
1-6
IM AQ6370D-01EN
Page 16

1.4 LCD Screen
No. Function
18 Displays soft key menu
(Displays markers and data analysis results.)
19 Parameter display area
20 Parameter input area
21 OVERVIEW display screen
(Only displayed when ZOOM function is used.)
22 Displays sub-scale
23 This appears when a resolution calibration has been performed.
1
Part Names and Functions
IM AQ6370D-01EN
1-7
Page 17
1
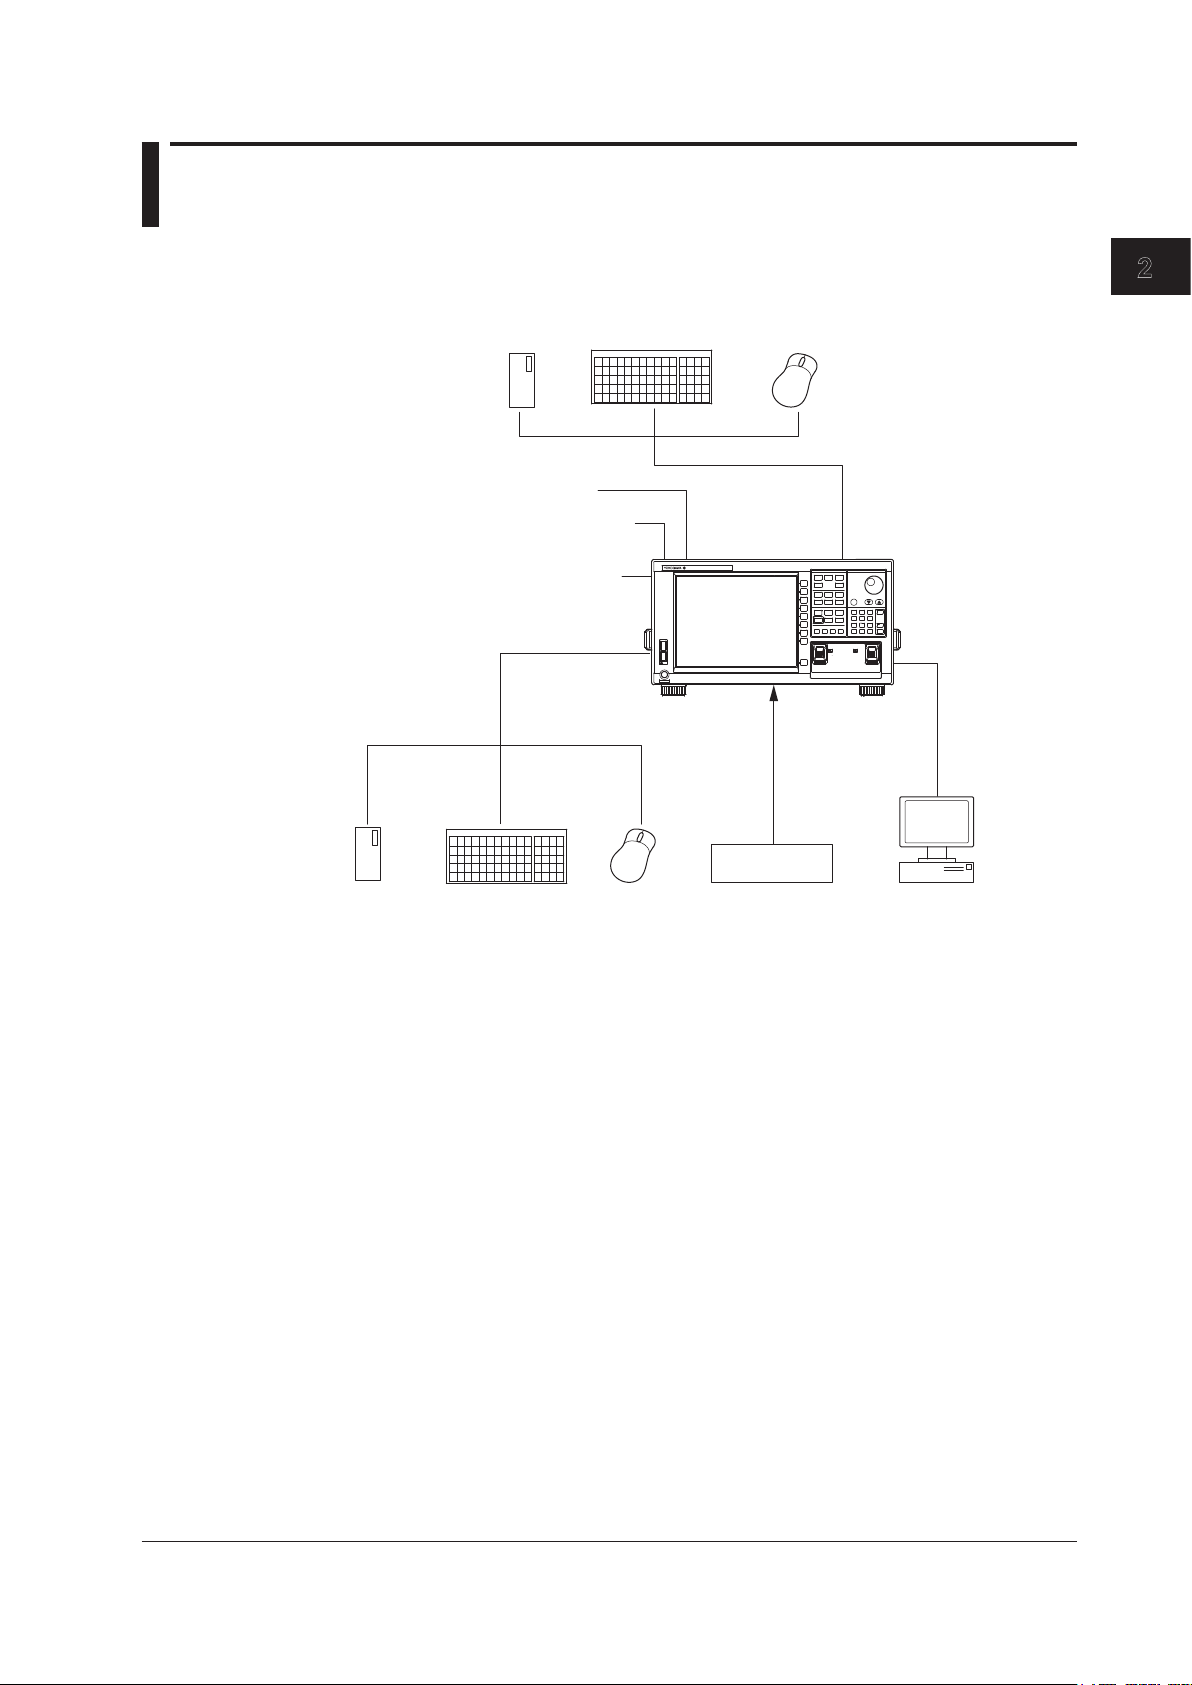
Chapter 2 Functions
Ethernet interface
USB storage
medium
USB storage
2.1 System Structure
System Structure
medium
USB keyboard
Analog output
External trigger input
Video signal output
trigger output
2
Functions
USB mouse
OPTICAL SPECTRUM ANALYZER
AQ6370
USB
POWER
DATA ENTRY
FUNCTION
SPAN
LEVEL
CENTER
SWEEP
ZOOM
DISPLAY
SETUP
TRACE
PEAK
COARSE
ANALYSIS
MARKER
SEARCH
BACK
9
7
8
USER
FILE
SPASE
MEMORY
5
4
6
ADVANCE
PROGRAM
SYSTEM
m/
1 2 3
OREMOTE
UNDO/
LOCAL
ENTER
nm/
.
FEED
-
HELP
0
COPY
ENTER
OPTICAL INPUT
CALIBRATION
(
)
600 1700nm
OUTPUT
GP-IB interface
RS-232 interface
USB 101 keyboard
USB mouse
Control target
PC
IM AQ6370D-01EN
2-1
Page 18

2.2 Measurement
Alignment Adjustment <<See section 3.6 for the operating procedure>>
This function allows adjustment of the optical axis of the instrument’s built-in
monochromator (spectroscope).
The instrument’s optical performance is not guaranteed until the alignment adjustment
function has been executed. Failure to perform this adjustment can result in distortion
of measured waveforms. After alignment adjustment has been executed, wavelength
calibration is also subsequently performed automatically. If you are using the instrument
for the first time or using it after it has been severely shaken while being moved, perform
the alignment adjustment procedure after warm-up ends.
Wavelength Calibration <<See section 3.7 for the operating procedure>>
Wavelength calibration can be performed using the internal reference light source (when
the built-in light source specification is -L1) or an external light source.
Resolution Calibration <<See section 3.8 for the operating procedure>>
Typically the filter response of an optical spectrum analyzer is not rectangular, and
thus the resolution bandwidth differs slightly from the equivalent noise bandwidth. This
difference becomes prominent especially when the wavelength resolution is high (e.g.,
0.05 nm or less). The resolution calibration function measures the equivalent noise
bandwidth at each resolution setting and internally sets the resolution bandwidth to the
result. The resolution bandwidth appears in parentheses in each of the resolution soft
keys on the resolution screen. The resolution bandwidth accuracy affects the results of
noise measurements and the results of optical power measurements of wideband light
sources. In detail, the resolution bandwidth is used when the following analysis and
computation functions are executed. For details, see pages 3-25 and 3-26.
• WDM analysis
• EDFA-NF (optical amp gain, NF measurement)
• Power analysis
• OSNR and total power of DFB-LD analysis
• Total power of FP-LD analysis
• Total power of LED analysis
• Power density markers, Integrated power markers
Auto Measurement <<See section 5.1 for the operating procedure>>
This function automatically sets the optimal measuring conditions for the input light and
displays the spectrum waveform. This function is useful when the characteristics of the
input light are not well known.
The wavelength range of input light that can be auto-measured is 1200–1670 nm.
The measurement conditions that are set automatically are as follows.
1. Span (SPAN)
2. Center wavelength (CENTER)
3. Reference level (REF LEVEL)
4. Resolution (RESOLUTION)
Other measuring conditions (sensitivity, averaging times, number of sampling points,
and interval settings) are set to their defaults. The horizontal and vertical axes of the
displayed spectrum waveform are zoomed to an appropriate degree.
Single Sweep <<See section 5.13 for the operating procedure>>
This function executes a single sweep or forcibly stops a sweep operation.
2-2
IM AQ6370D-01EN
Page 19

1
Repeat Sweep <<See section 5.13 for the operating procedure>>
This function performs repeat sweeping or forcibly stops a sweep operation. It enables
repeated, real-time measurement of waveforms.
2.2 Measurement
Sweeping between Markers << See section 5.14 for the operating procedure >>
This function enables sweeping between two specified waveform line markers. You can
sweep any desired area on screen.
Segment Measurement <<See section 5.13 for the operating procedure>>
This function allows you to divide up items to be measured in units of previously specified
segments.
Allows measurement delimited by segments (portions).
Smoothing << See section 5.18 for the operating procedure >>
This function attenuates the noise in the measured waveform. By using the Smoothing
function, areas on the waveform with a large amount of noise can be “smoothed out”
when measured.
One-Action Keys <<See sections 5.4 to 5.6 for the operating procedure>>
This is the general name for a key that uses data from the active trace waveform (the
currently displayed waveform) to set measurement conditions.
Setting conditions requires that a waveform is displayed for the active trace.
One-Action Key Name Description
PEAK → REF LEVEL Sets the peak level of the measured waveform of the active trace as
the reference level.
MARKER→ REF LEVEL Sets the moving marker level as the reference level.
PEAK→CENTER Sets the peak wavelength or the peak frequency of the active trace
measurement waveform to center wavelength or center frequency.
MEAN WL→CENTER Sets THRESH 3 dB center wavelength or center frequency of the
active trace measured waveform to center wavelength or center
frequency.
VIEW→MEAS Sets the currently displayed ZOOM scale as the measurement scale
(CENTER, START, STOP, SPAN) for the next sweep.
MARKER →CENTER Sets the wavelength of the moving marker to center wavelength or
center frequency.
Δλ→SPAN Sets the sweep width as six times the RMS 20 dB width of the
active trace measurement waveform.
MKR L1-L2 →SPAN Sets spacing between line markers 1 and 2 for sweep width.
PEAK→ZOOM CTR Sets the peak wavelength of the active trace measurement
waveform to center wavelength or center frequency of zoom display.
MARKER →ZOOM CTR Sets the wavelength of the moving marker to center wavelength or
center frequency of zoom display.
MKR L1-L2 →ZOOM SPAN Sets spacing between line markers 1 and 2 for sweep width of zoom
display.
2
Functions
IM AQ6370D-01EN
2-3
Page 20

2.2 Measurement
Switching between Vacuum Wavelength and Air Wavelength
<<See section 5.2 for the operating procedure>>
This function switches the measured wavelength to either a vacuum wavelength or an air
wavelength.
Measurement can be performed in either air or vacuum wavelength mode.
Switching between Wavelength and Frequency
<<See section 5.2 for the operating procedure>>
This function switches the horizontal axis display to wavelength or frequency.
You can display either the wavelengths or frequencies of marker values and analysis
results.
Averaging <<See section 5.11 for the operating procedure>>
This function performs multiple measurements and displays the average values.
The function is used in cases such as: when the light source’s level is fluctuating; when
measuring a modulated signal of several kHz or less; when the waveform is disrupted
and difficult to measure; when it is necessary to obtain even higher measurement
sensitivity.
Power Density Display <<See section 7.4 for the operating procedure>>
The power per 1 nm is called the power density.
The level axis of the AQ6370D indicates the absolute power per wavelength resolution.
For example, if the resolution is set to 0.1 nm, the power per 0.1 nm will be displayed.
Since the optical spectrum of such devices as a gas laser or a laser diode is narrower
than the wavelength resolution of the instrument, the entire power is accommodated
within the band of a resolution. Therefore, the measured power (peak level) is equal
to the total power of the light source. This instrument has been calibrated to display
accurate power under such conditions.
On the other hand, natural light or lights such as fluorescent lamps or LEDs, have,
in many cases, optical spectrums wider than the wavelength resolution set for the
instrument. Therefore, if the instrument measures these lights, measured power will vary,
depending on the resolution setting.
In order to deal with this issue, the instrument is equipped with the dBm dBm/nm soft key
to allow the level axis displays to switch from the absolute power (dBm, mW, μW, nW,
pW) per resolution to power density (dBm/nm, mW/nm, μW/nm, nW/nm, pW/nm).
In the case of power density displays, a measured value is converted to power per 1 nm.
Therefore, whatever resolution is used for measurement, certain measured values will
always be available.
For information on the use of dBm and dBm/nm, see “Power Density Display” in section
5.2, “Horizontal/Vertical Axis Settings.”
The trace computation function can be used to display the power density in the specified
bandwidth within the range of 0.1 nm to 10 nm (see section 6.8).
Note
Specifications such as level accuracy, measurement level range, and level linearity of the
instrument are provided for the absolute power display.
2-4
IM AQ6370D-01EN
Page 21

1
2.2 Measurement
External Trigger Measurement <<See section 5.16 for the operating procedure>>
This function performs measurement in synchronization with an external trigger signal.
The SMPL TRG IN terminal is an input terminal on the TTL level and in positive/
negative logic (which can be set by the <EXT TRIGGER SETTING> key). The SMPL
TRG IN terminal is an input terminal for TTL level, positive/negative logic signals. The
measurement points (wavelength/frequency) are incremented each time edges of input
external trigger signals are detected. Thus, sweeping stops when a number of external
trigger signals equaling the specified number of sampling points is input. (However,
when the REPEAT sweep is performed, the sweep will be repeated until the STOP key is
pressed or until trigger signals are no longer input.)
The delay time (from the time when a trigger signal is detected until the time when the
sampling is performed) specific to the instrument is about 20 µs. Supply the trigger
signal at a timing appropriate for the measurement sensitivity. An optional delay time can
be set to this specific delay time. With the DELAY key of the EXT TRIGGER SETTING
key, the 0.0 µs to 1000.0 µs range can be set in units of 0.1 µs.
Note that after the measurement points are set, input trigger signals during the
movement to the next measurement point are ignored. The time varies depending on the
measurement wavelength band and the number of sampling points (sampling intervals).
Since the SMPL TRG IN terminal is pulled up internally, it can be set to the HIGH level
while it is in the open state and to the LOW level while it is in the GND short state.
2
Functions
Sweep Trigger <<See section 5.16 for the operating procedure>>
This function performs a single sweep measurement based on an externally input trigger
signal.
The instrument starts a single sweep measurement by allowing sweep trigger signals on
the TTL level and in negative logic to enter the TRGGER IN terminal at the back of the
instrument.
The signal logic of the sweep trigger input signals is fixed to negative logic, which cannot
be changed.
The pulse width of sweep trigger signals must be 5 ms or more.
The action when entering a sweep trigger is the same as that for the SWEEP key or
SINGLE key.
The sweep trigger function detects sweep trigger signals by polling in certain cycles.
Thus, the time after a sweep trigger signal is input until the sweep starts will fluctuate in
the range of 5 ms.
Trigger Output <<See section 5.17 for the operating procedure>>
This function outputs trigger signals from the trigger output terminal on the rear panel of
the instrument (only during sweeping).
IM AQ6370D-01EN
2-5
Page 22

2.2 Measurement
Analog Out <<See section 5.19 for the operating procedure>>
An analog voltage is output from the ANALOG OUT terminal on the rear panel of the
main unit according to the input light.
The temporal changes in the input light can be measured by an oscilloscope.
However, to enable this output, the sensitivity setting must be NORM/HOLD.
When set to NORM/HOLD, the RANGE is switched relative to the REF LEVEL without
implementing the AUTORANGE function. Therefore, if the level of the input light is high,
the output voltage level is saturated.
The saturation level and noise level varies depending on the REF level.
The table below shows the relationship between the REF level and the saturation level.
REF LEVEL(dBm or dBm/nm) Saturation Level * (dBm)
REF > 0 23 dBm or more
0 < = REF > -10 13 dBm or more
-10 < = REF > -20 3 dBm or more
-20 < = REF > -30 -7 dBm or more
-30 < = REF -17 dBm or more
* At wavelength 1450 to 1620 nm
ANALOG OUT Output Specifications
Output saturation voltage +6 V or more, +8 V or less
Bandwidth 10 kHz or more
Load 1 kΩ or more
Correcting the Wavelength Resolution
<<See section 5.7 for the operating procedure>>
Since the wavelength resolution function is set according to the monochromator slit
width, the setting resolution and actual resolution may not match. If the resolution is set
to 0.1 nm, the actual resolution will be 0.09 nm for a 1450 nm wavelength, and 0.07 nm
for a 1550 nm wavelength.
If the Resolution Correction function is turned ON, measured data is processed by the
software so that it matches the set resolution.
In the following cases, the resolution correction function has no effect even when turned
ON.
• When the set resolution is 0.02 nm
• When the measured wavelength is 1400 nm or less
Turn OFF the resolution correction function when performing measurement for which the
level accuracy is guaranteed.
2-6
IM AQ6370D-01EN
Page 23

1
2.3 Waveform Display
Zoom <<See section 6.1 for the operating procedure>>
This function allows you to zoom freely in and out on measured waveforms.
You can easily zoom an area simply by selecting it with the mouse. Drag the mouse over
an area of the displayed waveform to zoom in on the area. ZOOMING is displayed at the
bottom of the screen to indicate that the screen is displaying a zoomed area. You can
also zoom in and out with key operations.
Overview <<See section 6.1 for the operating procedure>>
This function displays an overview window at the very bottom of the waveform display
area. The overview window is displayed when the waveform display is enlarged or
reduced using the zoom function. (Only displayed when a zoom is performed.)
You can easily check which part of the measured waveform is zoomed. The overview
window can be shown or hidden, and you can change its position and size.
Trace <<See section 5.12 for the operating procedure>>
A trace shows a waveform and measurement conditions. The instrument has a total of
seven independent traces (A through G). Multiple traces can be displayed at the same
time on the waveform screen. In addition, display ON/OFF and mode settings can be set
separately for each trace.
Traces can be set to the following modes.
• WRITE mode Section 6.2
• FIX mode Section 6.2
• MAX/MIN HOLD mode Section 6.3
• ROLL AVG mode Section 6.4
• CALCULATE mode Section 6.5 to Section 6.9
The following explains each of the modes.
2
Functions
IM AQ6370D-01EN
WRITE Mode
Waveform data are written during sweeping.
When a trace is set to WRITE mode, waveform data are written during measurement,
and the data are updated. Traces used in measurements are normally set to WRITE
mode. The trace display at the side of the data area changes to “WRITE.”
FIX Mode
Fixes the data; does not write waveform data.
When a trace is set to FIX mode, its waveform data are not overwritten even when
measurement is performed. Therefore, the waveform on the screen is not overwritten. If
you want to fix the waveform data of a trace, set the trace to FIX mode. The trace display
at the side of the data area changes to “FIX.”
2-7
Page 24

2.3 Waveform Display
MAX/MIN HOLD Mode (Maximum/Minimum Value Detection Mode)
ROLL AVG Mode (Rolling Average Mode)
CALCULATE Mode (Calculation Results Display)
Writes the maximum/minimum values of the waveform data for each sweep.
When a trace is set to MAX/MIN HOLD mode, each time a sweep is performed, the data
at the individual measurement points are compared with prior measurements, and the
measurement with the higher level (MAX HOLD) or lower level (MIN HOLD) is written.
If you want to measure the maximum or minimum value of a waveform which changes
each time a sweep is performed, set the trace you want to measure to MAX/MIN HOLD
mode and perform REPEAT sweeping.
The trace display at the side of the data area appears as “MAX HOLD” or “MIN HOLD”.
Note that the NOISE MASK soft key setting applies when a waveform is displayed, and
is not affected when a maximum or minimum value is detected.
Writes the rolling average values of the waveform data during each sweep.
When a trace is set to ROLL AVG mode, each time measurement is performed the rolling
average of the current measurement and past measurements is calculated, and the
measurement data are updated. The number of averagings is set in the range of 2 to
100. The trace display at the side of the data area changes to “ROLL AVG”.
Writes the results of calculations performed between data from different traces.
When a trace is set to CALCULATE mode, subtraction between data from different
traces, normalized display, power display per specified bandwidth, or curve-fit display
is performed according to the set CALCULATE mode. Note that CALCULATE mode
can only be set for traces C, F, and G. Also, the available calculations vary from trace to
trace. For more information, see chapter 6.
Normalized Display Function <<See section 6.6 for the operating procedure>>
This function is one of the trace CALCULATE modes. It normalizes and displays the
trace data.
With normalized display, normalization is performed and the waveform is displayed with
the waveform peak set to 1 if the sub-scale is linear, or set to 0 dB if the sub-scale is
LOG. One trace can be normalized, either trace A, B, or C. If both traces selected for
calculation are set to “BLANK”, then the sub-scale is displayed on the left side of the
screen. Otherwise it is displayed on the right side. The calculation results are displayed
in the sub-scale. The trace display at the side of the data area changes to “NORM @”.
Curve Fit <<See section 6.7 for the operating procedure>>
Makes an approximation of the specified trace waveform. The result is written to TRACE G.
Calculations are applied to data from the peak to the threshold value. The threshold
value is set in the range of 0 to 99 dB (steps of 1). The trace display at the side of the
data area changes to “CRV FIT @.”
Peak Curve Fit <<See section 6.7 for the operating procedure>>
Makes an approximation of the specified trace waveform. The result is written to TRACE G.
Calculations are applied to mode peaks at or above the threshold value. The threshold
value is set in the range of 0 to 99 dB (steps of 1). The trace display at the side of the
data area changes to “PKCVFIT @”.
2-8
IM AQ6370D-01EN
Page 25

1
2.3 Waveform Display
Power Density Trace <<See section 6.8 for the operating procedure>>
Computes the power density in the specified bandwidth and writes the results in Trace F.
The target trace is a single trace selected from Traces A to E.
You can set the bandwidth in the range from 0.1 nm to 10 nm in 0.1 nm steps. The trace
display at the side of the data area shows "PWR/NBW @".
Marker Functions <<See section 6.9 for the operating procedure>>
Marker functions can be used to easily measure wavelength differences and level
differences, and to search for peak wavelengths, peak levels, and spectrum widths.
There are markers, line markers, and advanced markers.
Markers
A total of 1025 markers (one moving marker and 1024 fixed markers) are provided.
Moving markers can be moved to an arbitrary wavelength using the rotary knob, arrow
keys, or numeric key pad. You can also drag the markers with the mouse. Moving
markers can be moved over a waveform to display the marker values (wavelength
and level value) in the data area. If a moving marker is fixed in an arbitrary position, it
changes to a fixed marker.
Fixed markers are markers fixed to a number on which the moving marker was set. Fixed
markers are assigned marker numbers in order starting from 001. You can enter an
arbitrary number using the rotary knob, arrow keys, or numeric key pad. A number up to
1024 can be set. When multiple fixed markers are set, it is possible to display wavelength
differences and level differences between a given marker and adjacent markers.
2
Functions
Line Markers
There are four line markers––two wavelength line markers and two level line markers.
Wavelength line markers show wavelength and wavelength difference, and level line
markers show level values and level difference. Also, you can use line markers to specify
a sweep or analysis range.
Advanced Markers
There are four advanced markers.
There are three types of advanced markers: moving marker, power density marker, and
integrated power marker. Advanced markers can be placed on any of the waveforms
from trace A to G.
Each marker can be moved to an arbitrary wavelength using the rotary knob, arrow keys,
or numeric keypad.
You can also drag the markers with the mouse.
Moreover, you can use the search function to move the marker to the peak of the target
waveform.
Advanced markers measure the following values.
• Moving markers
Moving markers move along the waveform and show marker values (wavelength and
level) in the data area.
They are the same as the moving markers described above, except they do not have
the fixed marker function.
IM AQ6370D-01EN
• Power density markers
Power density markers move along the waveform and show marker values (power
values per normalization bandwidth) in the data area.
• Integrated power markers
Integrated power markers move along the waveform and show marker values
(integrated power value over the specified wavelength range) in the data area.
2-9
Page 26

2.3 Waveform Display
Single Search
• PEAK SEARCH
A peak search (a search for the maximum value) is performed on the marker trace
waveform.
An advanced marker is displayed at the peak point, and the marker value is displayed
in the data area.
If the peak level is off the screen, its marker is displayed at the top or bottom edge of
the screen. Even in this situation, the correct marker value is displayed.
After the measurement has been completed, you can use the rotary knob to move
the moving marker.
You can use the arrow keys to scroll through the data area.
• BOTTOM SEARCH
A bottom search (a search for the minimum value) is performed on the marker trace
waveform.
An advanced marker is displayed at the bottom point, and the marker value is
displayed in the data area.
If the bottom is off the screen, its marker is displayed at the top or bottom edge of the
screen. Even in this situation, the correct marker value is displayed.
After the measurement has been completed, you can use the rotary knob to move the
moving marker. You can use the arrow keys to scroll through the data area.
• NEXT LEVEL SEARCH
On the marker trace waveform, the advanced marker at the peak or bottom is set to
the next peak (local maximum value) or bottom (local minimum value).
If such peak or bottom is not found, a warning appears.
WARNING 103: No data in active trace
• NEXT SEARCH RIGHT
On the marker trace waveform, the advanced marker at the peak or bottom is set to
the peak (local maximum value) or bottom (local minimum value) on its right.
If such peak or bottom is not found, a warning appears.
WARNING 103: No data in active trace
• NEXT SEARCH LEFT
On the marker trace waveform, the advanced marker at the peak or bottom is set to
the peak (local maximum value) or bottom (local minimum value) on its left.
If such peak or bottom is not found, a warning appears.
WARNING 103: No data in active trace
Displaying Wavelength Difference and Level Difference
This function places a fixed marker and measures the wavelength difference and level
difference compared to a moving marker.
Note
For details, see the explanation in section 6.9, “Displaying Markers.”
Displaying Line Markers
When line markers are displayed, the marker values are shown in the upper left part of
the waveform area.
When both wavelength line markers 1 and 2 are displayed, or both level line markers
3 and 4 are displayed, the wavelength difference (L2-L1) or level difference (L4-L3) is
shown below the marker values.
2-10
Note
For details, see the explanation in section 6.9, “Displaying Markers.”
IM AQ6370D-01EN
Page 27

1
2.3 Waveform Display
Split Display <<See section 6.10 for the operating procedure>>
You can split the screen into an upper and lower display (SPLIT mode).
You can assign trace waveforms to either the upper or lower split.
TRACE A UP/LOW
This function is used to set whether to put trace A on top or on bottom during upper/lower
split display. If you select UP, it is assigned to the top. (Default) If you select LOW, it is
assigned to the bottom.
Noise Mask <<See section 6.11 for the operating procedure>>
This key is used to display a waveform so that parts of the waveform at or below the
set value are masked. In addition, when a noise mask value is set, the waveform is
overwritten in real time.
When you press the NOISE MASK soft key, the current noise mask value is displayed in
the noise mask value setting screen. The allowed settings for the noise mask setting are
OFF (-210 dBm), and the range from -100 to 0 dBm (fine: in steps of 1; coarse: in steps
of 10).
Peak/Bottom Search <<See sections 6.13 and 6.14 for the operating procedure>>
The peak/bottom search function has two search modes: single, in which a single peak
or a single bottom of the measured waveform’s level are detected, and multi, in which
multiple peaks and bottoms are detected in a single search. Markers are displayed at the
peak and bottom points. You can also detect the next level peak or bottom.
There is also an auto search function that automatically performs peak/bottom searches
during each sweep. This is useful when you want to observe the changes to the peak
and bottom levels during repeat sweeping.
2
Functions
IM AQ6370D-01EN
2-11
Page 28

2.4 Analysis
Spectrum Width Analysis <<See section 7.1 for the operating procedure>>
You can display the spectrum width and center wavelength using the following four types
of calculation.
• THRESH method
• ENVELOPE method
• RMS method
• PEAK RMS method
<See appendix 2, “Spectrum Width Data Calculation Algorithms” for a description of the
spectrum width analysis algorithms and parameters.>
Notch Width Measurement <<See section 7.2 for the operating procedure>>
With notch width measurement, it is possible to measure pass band width / notch
width from the measured waveform of a filter with V-character type or U-character type
wavelength characteristics.
<For a description of the notch width analysis algorithm and parameters, see appendix 2,
“Data Calculation Algorithms for Spectrum Widths.”>
Device Analysis <<See sections 7.3 and 7.4 for the operating procedure>>
Light source parameters can be analyzed from the measured waveform of each light
source (DFB-LD, FP-LD, LED).
DFB-LD SMSR Measurement
The side-mode suppression ratio (SMSR) can be measured from the DFB-LD measured
waveform.
FP-LD and LED TOTAL POWER Measurement
Optical power can be measured by integrating the measured waveform level
measurements.
PMD Measurement <<See section 7.6 for the operating procedure>>
It is possible to measure the polarization mode dispersion (PMD) of a DUT (such as
an optical fiber) by using the instrument in combination with an analyzer, polarization
controller, polarizer, and an amplified spontaneous emission (ASE) light source, highoutput LED light source, or other wideband light source.
WDM Analysis <<See section 7.7 for the operating procedure>>
You can analyze WDM transmission signals. You can also measure OSNR of a DWDM
transmission system with 50 GHz spacing. Measurements of WDM signal wavelength,
level, wavelength interval, and OSNR can be made collectively on up to 1024 channels,
and the analysis results can be displayed in a data table.
Optical Amp Analysis <<See section 7.8 for the operating procedure>>
Measurement can be performed of the optical amp gain and noise figure from measured
waveform of the signal light going into the optical amp, as well as the measured
waveform of the output light leaving the optical amp.
2-12
IM AQ6370D-01EN
Page 29

1
Optical Filter Characteristics Measurement
<<See section 7.9 for the operating procedure>>
Optical filter characteristics can be measured from the measured waveform of the light
input to the optical filter from the light source, as well as from the measured waveform
light output from the optical filter.
Analysis can be performed not only on optical filters with only one mode, but also multimode WDM filters.
Measurement of Level Fluctuations in Single-Wavelength Light
<<See section 7.11 for the operating procedure>>
This function is used to measure changes over time in the level of a specific wavelength
level. The sweep width is set to 0 nm, and measurement of the single-wavelength light is
taken. The horizontal axis is the time axes. It is useful for purposes such as optical axis
alignment when a light source is input to an optical fiber.
Template <<See section 7.12 for the operating procedure>>
The template function compares preset reference data (template data) with a measured
waveform. In addition, if a function for displaying the target spectrum (target line) on the
measurement screen is used, the target spectrum can be referenced while adjusting the
optical axis of an optical device.
2.4 Analysis
2
Functions
The following three templates are provided.
• Upper limit line
• Lower limit line
• Target line
Go/No Go Judgment <<See section 7.12 for the operating procedure>>
The Go/No Go test function compares the active trace waveform against reference data
(template data) preset by the user, and performs a test on the measured waveform (Go/
No Go test).
The template function can be used effectively in situations such as pass/fail tests on
production lines.
Analysis between Line Markers
<<See section 7.13 for the operating procedure>>
You can specify an analysis range with line markers. Analysis is performed in the range
outlined by the two line markers.
Analysis in the Zoom Area <<See section 7.13 for the operating procedure>>
You can specify the zoomed area as the analysis range.
For example, there is a zoom area power measurement function. This function calculates
totalized power between display scales. It is effective for purposes such as ASE
evaluation on optical amplifiers.
Analysis Data Logging <<See section 7.15 for the operating procedure>>
The analysis data logging function measures and records WDM analysis, DFB-LD
analysis, and peak data at regular intervals. The recorded data can be shown on the
screen in tables or graphs. In addition, the contents in tables can be saved to a file in
CSV format.
The following types of data are recorded for WDM analysis and peaks.
• WDM analysis: Wavelength, level, SNR (signal-to-noise ratio)
• Peak: Wavelength, level
IM AQ6370D-01EN
2-13
Page 30

2.5 Other
Using the USB Mouse <<See section 4.2 for the operating procedure>>
With a connected USB mouse you can perform the same operations as with the
instrument’s panel keys. Also, if you move the mouse pointer over the item in the menu
screen that you wish to select and click it, the instrument responds exactly as if you had
pressed the corresponding soft key.
The USB mouse is connected to the connector on the front panel of the instrument.
Registering Soft Keys <<See section 9.1 for the operating procedure>>
Frequently used soft keys can be registered in the soft key menu.
Registering soft keys reduces the steps needed to execute their functions. Twenty-four
soft keys can be registered. By default, all keys are unregistered.
Data Initialization <<See section 9.2 for the operating procedure>>
You can restore all settings to their factory defaults.
The parameter setting values and data of each function are initialized.
Help <<See section 9.3 for the operating procedure>>
Displays an explanation of the soft key menus.
Certain soft keys have additional help text (“MORE INFO”). MORE INFO contains
detailed explanations of the corresponding soft keys.
Locking Keys <<See section 9.5 for the operating procedure>>
This function locks key input temporarily to prevent users from operating the AQ6370D
through the keys. Even when the keys are locked, soft keys registered as USER keys
can be used for operation.
Remote (Separate Manual)
An external device can be connected to the instrument through the GP-IB port or another
port to remotely control the instrument. This function requires a special connector cable
for connecting with the external device. For details, see the separate user’s manual,
“Remote/Program Function.”
Program (Separate Manual)
The program function allows you to control an external instrument without using a PC.
The function uses Ethernet, RS-232, or GP-IB. For details, see the separate user’s
manual, “Remote/Program Function.”
2-14
IM AQ6370D-01EN
Page 31

1
2
Chapter 3 Preparing for Measurement
3.1 Installing the Instrument
WARNING
• This instrument is designed to be used indoors. Do not install or use it outdoors.
• Install the instrument so that you can immediately remove the power cord if an
abnormal or dangerous condition occurs.
• The instrument has a built-in reference light source for wavelength calibration,
and infrared light is always being output from the optical output connector. Never
look into the optical output connector. Infrared light entering the eyes can cause
severe injury and loss of vision.
CAUTION
Do Not Apply Shock to the Instrument
Non-horizontal orientation, and do not drop the instrument from a height of 2 cm
or more. This can adversely affect the accuracy of the internal monochromator
and inhibit performance. Take great care when transporting the instrument, and
use packaging with a shock absorbing capacity that is greater than or equal to the
packaging used upon shipment from the factory.
Never use inferior packaging materials that are unable to sufficiently absorb
vibrations and shocks occurring during transport. This can adversely affect the
accuracy of the internal monochromator and inhibit performance.
3
Preparing for Measurement
When unpacking
When the instrument is packaged in a box and moved, prevent condensation by
allowing sufficient time for the instrument to acclimatize before removing it from the
box.
Installation Conditions
Install the instrument so that the following conditions are met.
Flat Horizontal Location
Place the instrument in a stable location that is flat in all directions. If the instrument is
used in an unstable or angled surface, the accuracy of the internal monochromator can
be compromised.
Location without Vibration
Do not install the instrument in a location subject to vibration. Use in a location that
experiences large vibrations can lead to instability of operation, measurement stopping
before completion, or notable decreases in accuracy of the wavelength and level axes.
Well Ventilated Location
Ventilation holes are present at the sides and rear of the instrument. To keep the
internal temperature from rising, always maintain a gap of 200 mm or more between the
ventilation holes and the installation surfaces.
IM AQ6370D-01EN
3-1
Page 32

Inlet holes (also on the bottom panel)
3.1 Installing the Instrument
Also be sure to maintain sufficient clearance for connecting measurement cables.
20 cm or more
20 cm or
more
20 cm or
more
Ambient Temperature and Humidity
Ambient temperature: 5 to 35°C
Ambient humidity: 80% RH or lower (no condensation present)
Note
Condensation may occur if the instrument is moved to another place where the ambient
temperature is higher, or if the temperature changes rapidly. In such cases, allow sufficient time
for the instrument to adjust to the ambient temperature before use.
When the instrument is packaged in a box and moved, prevent condensation by allowing
sufficient time for the instrument to acclimatize before removing it from the box.
Do Not Install the Instrument in the Following Places
• Outdoors.
• Dangerous locations where flammable or explosive gasses, vapors, or dust is present,
or where the possibility of explosions or fires exists.
• In direct sunlight or near heat sources.
• Where an excessive amount of soot, steam, dust, or corrosive gas is present.
• Location where mechanical vibration is high.
• In an unstable place.
• Where the instrument is exposed to water or other liquids.
20 cm or
more
General Handling Precautions
• Do Not Place Anything on Top of the Instrument
Never stack instruments or place any other objects on top of the instrument, especially
those containing water. Doing so can lead to malfunction.
• Take Proper Care When Carrying the Instrument
The instrument should always be carried by two people. Hold the instrument by the
handles on the sides of the case. The instrument weighs approximately 19 kg. Take
precautions against injuries when carrying it.
remove the power cable, and confirm that no other cables are connected before
carrying the instrument.
• Clean the Instrument Properly
When removing dirt from the case or operation panel, disconnect the power to the
circuits under test and the instrument, remove the instrument’s power cord from the
power outlet, then wipe gently with a clean, dry cloth. Do not use volatile chemicals
since this might cause discoloring and deformation.
3-2
Also, always turn the power switch OFF,
IM AQ6370D-01EN
Page 33

1
2
3.2 Attaching the Connector Adapter
Attach the optional connector adapter before using the instrument.
WARNING
Always turn the power OFF before replacing the connector adapter. The instrument
has a built-in reference light source for wavelength calibration (when the built-in
light source specification is -L1), and infrared light is always being output from the
optical output connector. Never look into the optical output connector. Infrared light
entering the eyes can cause severe injury and loss of vision.
CAUTION
• As there may be dust adhering to calibration output, be sure to clean it before
attaching the connector adapter.
• Do not exhale or blow compressed air into the monochromator from the optical
input. Doing so may allow dust or other materials to enter the monochromator,
adversely affecting its optical performance. Also, if debris is adhering to the
optical components inside the monochromator when a strong light source is
input, the monochromator may be damaged.
• When attaching or removing the connector adapter, carefully insert it
perpendicularly to the ferrule so as not to damage the ferrule end.
• Moving the connector adapter to the right or left or inserting it forcefully can
damage the ferrule or the connector adapter.
3
Preparing for Measurement
A connector adapter is required for connecting the optical connector to the AQ6370D.
On products with the /FC, /SC, /RFC, or /RSC option, connector adapters come attached
to the optical input and calibration light source output on the AQ6370D front panel.
On products without these options, attach a connector adapter appropriate for the optical
connector.
Note
Attachment Procedure
1.
2.
3.
4.
5.
A different connector adapter is used for OPTICAL INPUT and CALIBRATION OUTPUT. Make
sure not to use the wrong connector adapter.
Confirm that the power is OFF.
Open the optical connector cover at the front of the instrument.
Clean the ferrule edge of the optical I/O section using a swab soaked with a small
amount of pure alcohol.
Insert the connector adapter all the way in.
Push the connector adapter’s lock lever down.
The adapter has been attached correctly if the groove in the lock lever interlocks with the
latch pin of the optical input/output section.
IM AQ6370D-01EN
3-3
Page 34

Panel
Latch pin
Optical input
Connector
SC type
SC type
FC type
3.2 Attaching the Connector Adapter
Removal Procedure
Confirm that the power is OFF.
1.
Turn the connector adapter’s lock lever up. The lock lever’s lock is released.
2.
Pull the connector adapter all the way out.
3.
Close the optical connector cover at the front of the instrument.
4.
Explanation
Types of Connector Adapter
The connector adapter for internal reference light output (AQ9441) comes in the following
two types.
FC type
The optical input connector adapter (AQ9447) comes in the following two types.
section
Ferrule
adapter
Lock lever
Attached
3-4
Optical Connectors Types
The instrument can use FC or SC type optical connectors.
Cap
FC type optical
connector
Cap
SC type optical
connector
IM AQ6370D-01EN
Page 35

1
2
3.3 Connecting the Device
Connecting the Mouse
You can use a USB or PS/2 mouse.
Supported USB Mouse
The instrument can support a USB HID Class Ver. 1.1 compliant mouse (with wheel).
Connections
Connect a USB mouse to one of the USB interfaces on the front or rear panel of the
instrument.
Confirm that MAIN POWER switch on the rear panel is OFF.
1.
Orient the mouse connector so that it matches the orientation of the interface,
2.
Note
• There are 2 USB interfaces each on front and rear panels, but do not connect more than
• In addition to a USB mouse, the USB interfaces can be used to connect USB storage and
For information on operations using the mouse, see section 4.2.
Connecting a Keyboard
You can connect a keyboard for entering file names, comments, and other items. Also,
the functions and settings of the instrument are assigned to keyboard keys, allowing you
to manipulate them with a keyboard just as you would by using the instrument’s panel
keys.
3
Preparing for Measurement
then insert the connector.
one mouse at a time.
keyboards.
IM AQ6370D-01EN
Supported Keyboards
The instrument supports any 101 English USB keyboard.
Connecting
Connect a USB keyboard to one of the USB interfaces on the front or rear panel of the
instrument.
Confirm that the MAIN POWER switch on the rear panel is OFF.
1.
Orient the mouse connector so that it matches the orientation of the interface,
2.
then insert the connector.
Note
• There are 2 USB interfaces each on front and rear panels, but do not connect more than
one keyboard at a time.
• In addition to a USB keyboard, the USB interfaces can be used to connect USB storage and
a USB mouse.
For information on operations using the keyboard, see section 4.2.
3-5
Page 36

USB connector
3.3 Connecting the Device
Connecting a USB Storage Device
Supported USB Storage Devices
The instrument supports USB memory (USB card adapters).
You cannot use a USB storage device not recognized by the instrument. If the USB
storage device’s drive is partitioned, only the primary partition (F:) is recognized. If there
are two or more USB storage devices, only the first connected device is recognized.
If you restart the instrument, it the USB storage devices that were connected will still be
recognized.
Connections
Connect the USB storage device to the USB connector on the front panel of the
instrument.
Removing
See section 8.1. (Using the REMOVE USB STORAGE soft key.)
CAUTION
Do not remove the USB storage device or turn the power OFF while the USB
storage device access indicator is blinking. This can damage the data on the device
or the device itself.
Connecting with Other Devices
You can use the GP-IB, RS-232C, or Ethernet interface to connect other external
instruments to the AQ. For details, see the Remote Control User’s Manual, IM AQ6370C17EN.
Note
When connecting a GP-IB instrument such as an external computer, or a CRT or other display
to the instrument, always turn OFF the power to the instrument and the instruments to be
connected first. Leaving the power ON while making connections can damage the equipment.
USB
POWER
3-6
IM AQ6370D-01EN
Page 37

1
2
3.4 Turning the Power ON/OFF
Before Connecting the Power
Take the following precautions before turning on the power supply. Failure to do so can
result in electric shock or damage to instruments.
WARNING
• Before connecting the power cord, ensure that the power supply source voltage
matches the rated supply voltage of the instrument and that it is within the
maximum rated voltage of the provided power cord.
• Check that the instrument’s power switch is OFF before connecting the power
cord.
• To prevent the possibility of electric shock or fire, always be sure to use the
power cord supplied for the instrument by YOKOGAWA.
• Make sure to implement protective earth grounding to prevent electric shock.
Connect the instrument’s power cord into a three-prong electrical outlet with a
protective grounding terminal. The AC outlet must be of a three-prong type with
a protective earth ground terminal.
• Do not use an extension cord without protective earth ground. Otherwise, the
protection function will be compromised.
• Use an outlet that is compatible with the accessory power cord, and be sure to
connect protective grounding. Do not use the instrument if the power outlet does
not provide appropriate protective grounding.
3
Preparing for Measurement
Preparing to Turn ON the Power
The AQ6370D has a MAIN POWER switch for turning the main power ON/OFF, and a
POWER switch for starting and shutting down the instrument. The POWER switch is a
push-button switch; press once to turn it ON and press again to turn it OFF.
• Confirm that the MAIN POWER switch on the rear panel of the instrument is OFF.
• Connect the power cord plug to the power connector on the rear panel.
• Connect the other end of the cord to an outlet that meets the following conditions. Use
a grounded three-prong outlet.
Item
Rated supply voltage* 100 VAC to 240 VAC
Permitted supply voltage range 90 VAC to 264 VAC
Rated power supply frequency 50/60 Hz
Permitted supply frequency range 48 Hz to 63 Hz
Maximum power consumption Approx. 100 VA
* This instrument can use a 100 V or a 200 V power supply. The maximum rated voltage differs
according to the type of power cord. Before you use the instrument, check that the voltage
supplied to it is less than or equal to the maximum rated voltage of the power cord provided
with it (see page iii of the Getting Started Guide, IM AQ6370D-02EN, for the maximum voltage
rating).
IM AQ6370D-01EN
3-7
Page 38

Three-prong outlet
AQ6370D-02, -12, -22
AQ6370D-01, -10, -20
AQ6370D-02, -12, -22
AQ6370D-01, -10, -20
3.4 Turning the Power ON/OFF
CAUTION
Do not input a strong light source to the instrument when turning the power ON. If a
strong light source is input, the optical section can be damaged.
Power On and Screen Display
1.
Connect the power cord to the power cord connector on the back side of the
instrument.
Power cord
(accessory)
Turn ON the MAIN POWER switch on the rear panel of the instrument. The
2.
Press the POWER switch on the front panel of the instrument. The color of
3.
POWER switch on the front panel of the instrument lights orange.
100
-
150VA
240V
FUSE
the switch turns from orange to green. The operating system starts up, and
initialization of the instrument begins.
The instrument will not start for a few seconds immediately after step 2 even if you press the
POWER switch.
USB
POWER
3-8
The initialization screen appears, and the internal initialization process starts. STEP
1/9 through STEP 9/9 are displayed in the lower right part of the screen to indicate the
progress of initialization.
IM AQ6370D-01EN
Page 39

1
2
3.4 Turning the Power ON/OFF
CAUTION
Do not press the POWER or MAIN POWER switches while initialization is in
progress. Doing so can cause malfunction.
Operations Performed When the power is Turned On
If initialization finishes successfully, a message appears prompting you to execute
wavelength calibration and alignment adjustment.
The contents of the message are as follows.
For this instrument to meet its specification, a Wavelength Calibration and an Optical
Alignment Adjustment must be performed. Please perform these operations according
to the guidelines below.
Wavelength Calibration
Perform wavelength calibration before starting measurement (a warm-up of one
3
Preparing for Measurement
hour is also required prior to measurement). Unless the Wavelength Calibration is
carried out, the wavelength accuracy of the instrument cannot be guaranteed.
IM AQ6370D-01EN
Alignment Adjustment
Always perform alignment adjustment the first time you use the instrument, if the
instrument was vibrated when being moved, or if the temperature in the operating
environment has changed. Perform the alignment adjustment after a one-hour
warm-up.
See section 3.6 for details on the alignment adjustment operation, and 3.7 for wavelength
calibration.
When the Power-on Operation Does Not Finish Normally
Turn off the power switch, and check that :
• The instrument is installed properly. See section 3.1, "installing the instrument."
• The power cord is connected properly. See the previous page.
If the instrument still does not work properly, contact your nearest YOKOGAWA dealer for
repairs.
If an error occurs in the memory or some other part of the instrument during initialization,
the AQ6370D will stop running with "STEP @ / 9" showing on the screen (where @ is a
number between I and 9).
If this occurs, repairs are necessary. Contact your nearest YOKOGAWA dealer
immediately.
3-9
Page 40

3.4 Turning the Power ON/OFF
Note
Turning the Power OFF
CAUTION
Do not cut the power to the instrument with the MAIN POWER switch on the rear
panel when an operation is in progress. The operating system configuration file will
not be backed up, possibly resulting in malfunctions upon start up the next time the
instrument is turned ON. Always use the above procedure to shut down.
1.
2.
3.
The instrument “remembers” measurement conditions, selected soft keys, waveforms being
displayed, and other information. When the power is turned ON, the state of the instrument
prior to the last shut down is restored. When the power is turned ON for the first time, the
instrument starts up in the factory default state.
Press the POWER switch on the front panel of the instrument. A shut down
confirmation message is displayed along with the YES and NO soft keys.
Press the YES soft key. The message, “AQ6370D is shutting down. Please wait...”
appears, and shut-down begins. If you do not wish to shut down, press the NO
soft key. The screen returns to the original soft key menu.
After the POWER switch changes from green to orange, turn OFF the MAIN
POWER switch on the rear panel of the instrument.
You can also shut down the instrument using panel keys and soft keys.
Press SYSTEM.
1.
Press the MORE soft key repeatedly until the MORE 4/4 menu is displayed.
2.
Press the SHUT DOWN soft key.
3.
Press the YES soft key. Shut down begins.
4.
After the POWER switch changes from green to orange, turn OFF the MAIN
5.
POWER switch on the rear panel of the instrument.
3-10
Note
If for some reason the instrument fails to shut down normally, hold down the
for approximately four seconds or longer to force standby mode. Note that the operating system
configuration file will not be backed up, possibly resulting in malfunctions upon start up the next
time the instrument is turned on.
POWER
switch
IM AQ6370D-01EN
Page 41

1
2
Explanation
Screen when the instrument was not shut down
If the shutdown procedure was not performed after the previous session, the following
message appears after start up.
Failure to properly shut down the instrument can result in damage to the monochromator.
When turning OFF the power, always perform the shut down procedure.
Press any key to clear this message.
3.4 Turning the Power ON/OFF
3
Preparing for Measurement
IM AQ6370D-01EN
3-11
Page 42

3.5 Connecting the DUT
WARNING
Do not look at the optical fiber laser light that you are measuring or point the laser
at another person’s eye. Doing so may cause eye damage or impair one’s health.
CAUTION
• Before connecting an optical fiber to the instrument, make sure that the start-up
initialization process has finished. If a strong light source is input during start-up,
the optical section can be damaged.
• Be sure to clean the tip of the optical fiber’s optical connector before connecting.
• Do not try to forcefully attach the optical fiber’s optical connector with the plug
inserted at a slanted angle. Doing so may damage the instrument’s optical
connector’s components or the connector itself.
• Before connecting the input light, make sure that it does not exceed the
AQ6370D’s maximum rated level. If input light exceeding the maximum rated
level is introduced, the optical section may be damaged.
• Press the optical connector hard against the cleaning surface of the special
cleaner to clean it. If it is not pressed hard against the cleaning surface, it may
not be possible to properly clean the optical connector.
Cleaning the Optical Fiber End Face
Firmly press the connector end face of the optical fiber against the cleaning
1.
While pressing the end face against the cleaner, turn it once.
2.
While pressing the end face against the cleaner, move it.
3.
Repeat steps 1 to 3.
4.
Note
• If you do not firmly press the connector end face of the optical fiber against the cleaner, the
• You can purchase an optical fiber connector cleaner from NTT-AT Corporation.
surface of the cleaner.
end face may not be cleaned completely.
3-12
IM AQ6370D-01EN
Page 43

1
2
Connecting Optical Fibers
AQ6370D
Optical fiber
Open the instrument’s optical input connector cover.
5.
Connect the optical fiber’s optical connector to the optical input connector on the
6.
instrument.
Setting the optical fiber connector
Press SETUP. The soft key menu is displayed.
7.
Press the MORE 1/2 soft key.
8.
Press the FIBER CONNECTOR soft key. Pressing the key repeatedly toggles
9.
between NORM and ANGLED. Set ANGLED if the optical fiber under test is APC
(angle lap PC). Otherwise, set NORMAL.
Note
• If you set FIBER CONNECTOR to ANGLED, is displayed in the
measurement conditions area.
• The instrument's measurement accuracy specification is for when FIBER CONNECTOR is
set to NORM
Connecting the DUT (Light Source)
Clean the top of the optical connector on the other end of the optical fiber with a
10.
fiber cleaner.
Connect the optical connector on the other end of the optical fiber to the optical
11.
connector on the DUT.
3.5 Connecting the DUT
3
Preparing for Measurement
Measuring System
Light source
IM AQ6370D-01EN
3-13
Page 44

3.6 Alignment Adjustment
M optical fiber
AQ6370D
WARNING
The instrument has a built-in reference light source for wavelength calibration, and
infrared light is always being output from the optical output connector. Never look
into the optical output connector. Infrared light entering the eyes can cause severe
injury and loss of vision.
Procedure
Adjusting Alignment Using the Built-in Reference Light Source (when the built-
in light source specification is -L1)
Turn the power to the instrument ON. Turn ON the MAIN POWER switch and
1.
press the POWER switch. For instructions on turning the power ON and OFF, see
section 3.4.
Use a 9.5/125 µm SM optical fiber to connect the instrument’s optical input
2.
connector with the optical output connector.
S
(9.5/125 µm)
Press SYSTEM. The soft key menu is displayed.
3.
Press the OPTICAL ALIGNMENT soft key.
4.
Press the EXECUTE soft key. Alignment adjustment is automatically executed.
5.
Adjustment finishes a few minutes thereafter, and you are returned to the original
screen.
Press the CANCEL soft key to cancel alignment adjustment partway through the
6.
process.
3-14
IM AQ6370D-01EN
Page 45

1
2
Optical fiber
AQ6370D
3.6 Alignment Adjustment
Note
• After alignment has been executed, wavelength calibration is also performed automatically
inside the instrument.
• The alignment adjustment has no effect if the process is stopped. The instrument remains in
the state prior to execution of the alignment adjustment.
Adjusting Alignment Using an External Light Source (when the built-in light
source specification is -L0)
Alignment adjustment can be performed on the AQ6370D using a light source that you
provide.
The external light source must meet the following conditions.
Wavelength range: 1520 to 1560 nm, -20 dBm or higher
Level stability: 0.1 dBp-p or less
Wavelength stability: ±0.01 nm or less
A stable single-wavelength light source such as a DFB-LD
Connecting the External Light Source
Turn on the AQ6370D.
1.
Turn on the MAIN POWER switch and then press the POWER switch.
For instructions on how to turn on and off the power, see section 3.4.
Connect the external light source’s optical output connector to the AQ6370D’s
2.
optical input connector using a 9.5/125 μm SM (single mode) optical fiber.
Light source
3
Preparing for Measurement
IM AQ6370D-01EN
Alignment Adjustment
Press SYSTEM. The soft key menu is displayed.
1.
Press the OPTICAL ALIGNMENT soft key.
2.
• When a Light Source Other Than the AQ6370B/AQ6370C Reference Light Source
Is Connected
Press the EXTERNAL LASER soft key.
3.
Press the EXECUTE soft key. Alignment adjustment is executed. When the
4.
alignment adjustment finishes, the previous screen returns.
• When the AQ6370B/AQ6370C Reference Light Source Is Connected
Press the BUILT-IN SOURCE (AQ6370C/D) soft key.
3.
Press the EXECUTE soft key. Alignment adjustment is executed. It will take
4.
approximately 2 minutes for the alignment adjustment to complete. When the
alignment adjustment finishes, the previous screen returns.
3-15
Page 46

3.6 Alignment Adjustment
If you press the CANCEL soft key while the alignment adjustment is in progress,
5.
it will be canceled.
Note
• It will take approximately 2 minutes for the alignment adjustment to complete.
• After alignment is executed, the AQ6370D does not automatically perform internal
wavelength calibration. Perform wavelength calibration according to the instructions in
“Wavelength Calibration Using an External Light Source” in section 3.7, “Wavelength
Calibration.”
• If you cancel alignment adjustment, it will be invalid. The AQ6370D will be in the same
condition as it was before alignment adjustment was executed.
Explanation
Types of Optical Fibers
The instrument can use single mode optical fibers with core diameters of 5 to 9.5 μm,
and multimode (GI) optical fibers with core diameters of 50 and 62.5 μm. Functions may
be limited or restricted depending on which type of optical fiber is used. The table below
shows which of the typical types of fiber may be used and the limitations on their use.
Limitations on Wavelength Resolution
The maximum wavelength resolution for the instrument is 0.020 nm, which is only
obtainable when using a single-mode optical fiber with a core diameter of 9.5 μm or less.
As shown in Table, the maximum wavelength resolution decreases when optical fibers
with thicker core diameters are used.
Setting a resolution value finer than those shown in the table below will simply result in
an inaccurate measurement level without improving resolution.
Optical fibers with a thick core diameter are especially useful for inputting spatial light for
measurement, but they have poor resolution.
Choose the best type of optical fiber for your particular application.
Note that the instrument is designed for input through optical fiber only. It will not work
with inputs that do not pass through optical fiber, such as direct input of a gas laser
beam to the optical input connector, or bonding an LED to the optical input connector. It
is important to note that optical spectrum measurements taken through such inputs are
completely unreliable.
For spatial light measurements, input the spatial light to the optical fiber and from the
optical fiber to the instrument. A variety of adapters are available for this purpose.
3-16
IM AQ6370D-01EN
Page 47

1
2
3.6 Alignment Adjustment
Summary of usable optical fiber types and usage limitations
Optical Fiber Type Obtained Wavelength Absolute Level
Resolution (in nm) Accuracy
Type Core Diameter
SM 5 0.020 NG
SM 9.5 0.020 OK
GI 50 0.050 NG
GI 62.5 0.050 NG
SI 50 0.050 NG
SI 80 0.100 NG
SI 100 0.200 NG
SI 200 0.500 NG
SI 400 1.000 NG
SI 800 2.000 NG
Level Accuracy below the Cutoff Wavelength (Short Wavelength) of a
Connected Optical Fiber
With wavelengths at or below the cutoff level of the connected fiber, light propagates
through the optical fiber in multiple modes. When high-coherent light from a light source
such as a gas laser or DFB-LD light source propagates in multiple modes, speckle noise
contained in the optical fiber output light may become unstable by the optical fiber’s form,
resulting in an inaccurate measurement level.
In such cases, improving the coupling between the light source and the optical fiber will
lessen the level inaccuracy.
3
Preparing for Measurement
IM AQ6370D-01EN
3-17
Page 48
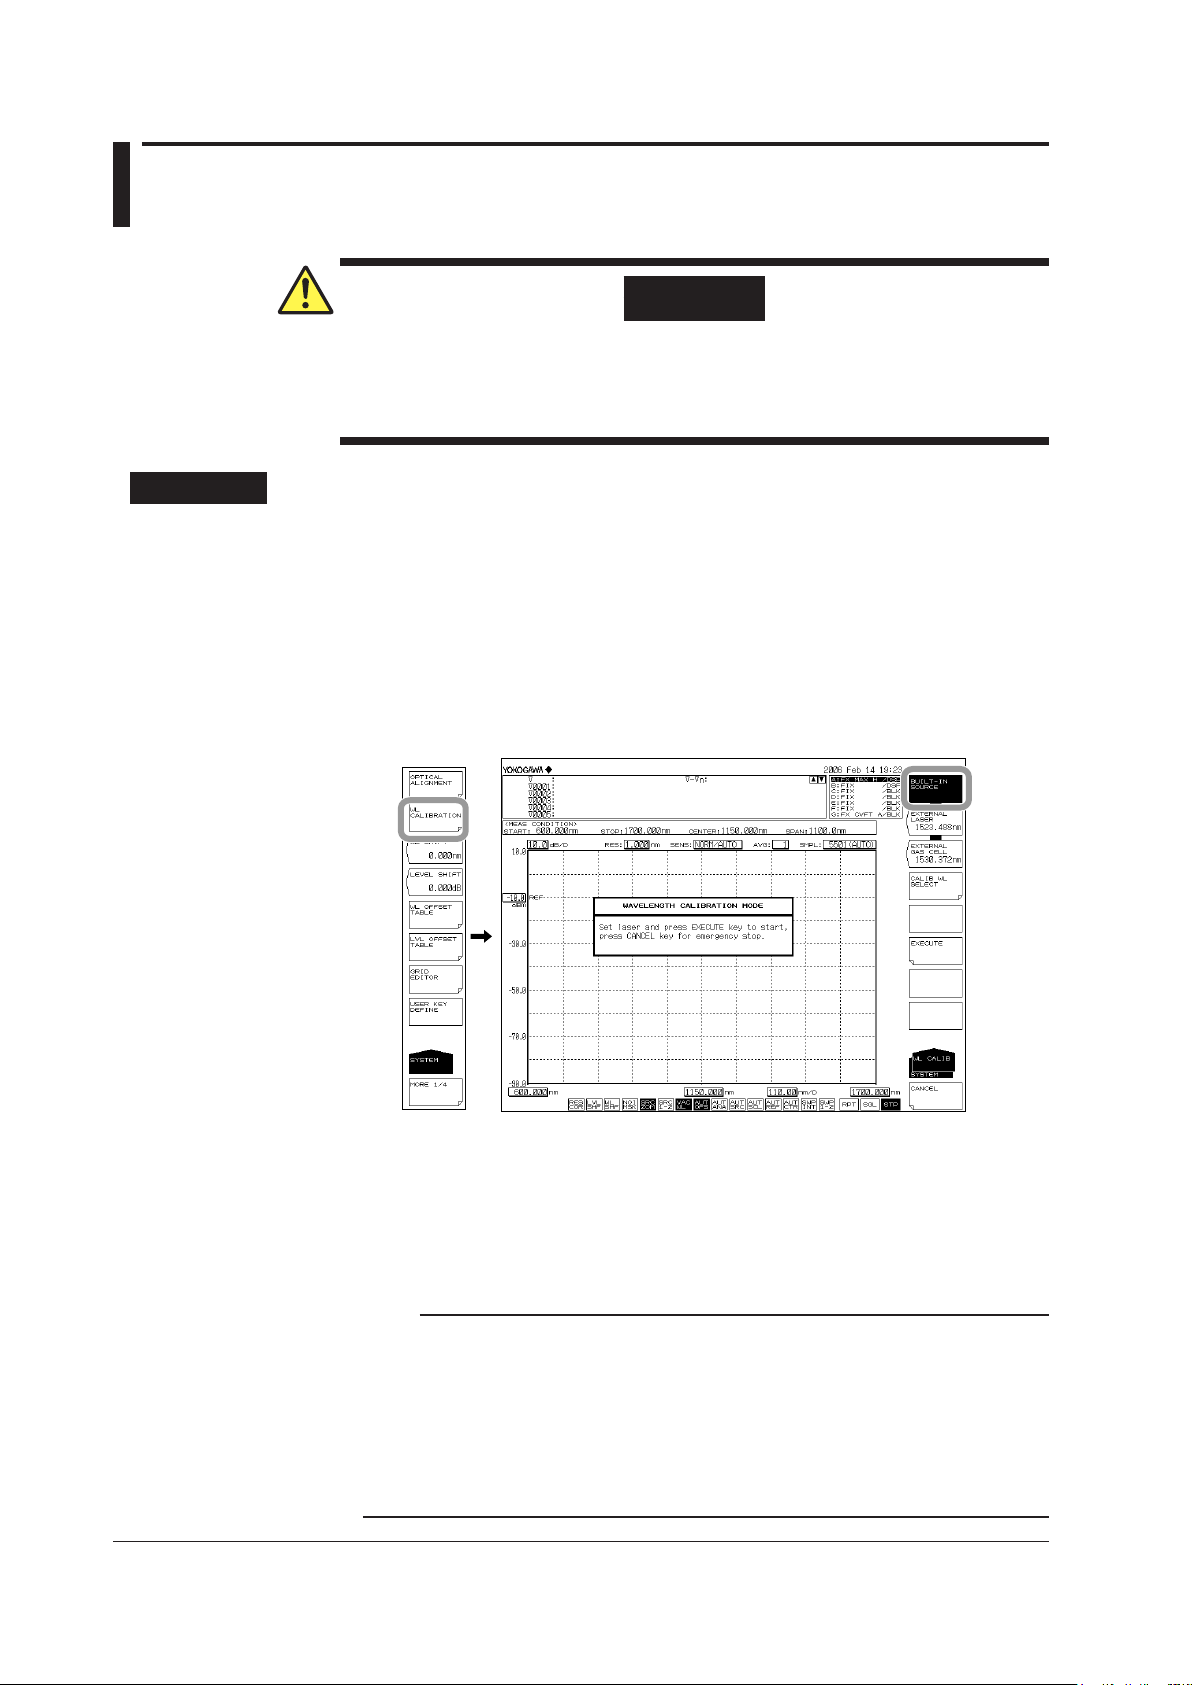
3.7 Wavelength Calibration
WARNING
The instrument has a built-in reference light source for wavelength calibration (when
the built-in light source specification is -L1), and infrared light is always being output
from the optical output connector. Never look into the optical output connector.
Infrared light entering the eyes can cause severe injury and loss of vision.
Procedure
Wavelength Calibration Using the Internal Reference Light Source
Turn the power to the instrument ON.
1.
Turn ON the MAIN POWER
For instructions on turning the power ON and OFF, see section 3.4.
Use a 9.5/125 µm SM optical fiber to connect the instrument’s optical input
2.
connector with the optical output connector.
Press the SYSTEM key. The soft key menu is displayed.
3.
Press the WL CALIBRATION soft key.
4.
switch and press the POWER switch.
Press the BUILT-IN SOURCE soft key.
5.
Press the EXECUTE soft key. Wavelength calibration is executed. The previous
6.
Press the CANCEL soft key during wavelength calibration to cancel the
7.
Note
• Always perform wavelength calibration after turning ON the power to the instrument and
• If you are using this instrument for the first time or using it after it has been severely shaken
• If the wavelength error of the instrument is outside of ±5 nm, you cannot perform wavelength
(Readjustment required. Contact your nearest Yokogawa representative.)
screen is displayed again after the calibration process ends.
wavelength calibration process.
allowing the warm-up to finish.
while being moved, you must perform the alignment adjustment procedure after warm-up
ends.
calibration with the internal reference light source.
3-18
IM AQ6370D-01EN
Page 49

1
2
Wavelength Calibration Using an External Light Source
Optical fiber
AQ6370D
Instead of using the internal reference light source, it is also possible to calibrate the
instrument using an external light source. However, the following light sources cannot be
used for wavelength calibration.
• If the set wavelength is not the same as that of the calibration light source.
• If the wavelength error of the instrument is outside of ±0.5 nm.
(Readjustment required. Please contact your nearest Yokogawa representative.)
• If you are using a reference light source with multiple absorption lines, and the
instrument’s wavelength shift is greater than the wavelength interval of the absorption
lines (with the result that an adjacent absorption line is used as the reference
wavelength).
Connecting the External Light Source
Turn the power to the instrument ON.
1.
Press the MAIN POWER
For instructions on turning the power ON and OFF, see section 3.4.
Use a 9.5/125 µm SM optical fiber to connect the external light source’s optical
2.
output connector with the optical input connector.
Light source
switch and press the POWER switch.
3.7 Wavelength Calibration
3
Preparing for Measurement
Setting the Type of External Light Source and Calibration Wavelength Value
Press SYSTEM. The soft key menu is displayed.
3.
Press the WL CALIBRATION soft key.
4.
Select the type of external light source (laser-type external light source or gas cell
absorption line type external light source) and set the calibration wavelength value.
There are three different ways to set the wavelength value.
IM AQ6370D-01EN
3-19
Page 50

3.7 Wavelength Calibration
For Laser Type Light Sources
Press the EXECUTE LASER soft key. A screen for specifying the wavelength of
5.
the external light source is displayed.
Select the laser wavelength value using the rotary knob or the arrow keys. The
6.
allowed wavelength range is 600 to 1700 nm.
Press nm/ENTER. The wavelength value is set.
7.
Press the EXECUTE soft key. Wavelength calibration is executed. The previous
8.
screen is displayed again after the calibration process ends.
Press the CANCEL soft key during wavelength calibration to cancel the
9.
wavelength calibration process.
For Gas Cell Absorption Line Type Light Sources
Press the EXECUTE GAS CELL soft key. A screen for specifying the wavelength
5.
Select the gas cell absorption line wavelength value using the rotary knob or the
6.
Press nm/ENTER. The wavelength value is set.
7.
Press the EXECUTE soft key. Wavelength calibration is executed. The previous
8.
Press the CANCEL soft key during wavelength calibration to cancel the
9.
of the external light source is displayed.
arrow keys. The allowed wavelength range is 600 to 1700 nm.
screen is displayed again after the calibration process ends.
wavelength calibration process.
3-20
IM AQ6370D-01EN
Page 51

1
2
Using the Instrument’s Internal Calibration Wavelength Value
Press the CALIB WL SELECT soft key. The soft key menu changes to show
6.
Press the soft key corresponding to the appropriate wavelength value.
7.
Press the EXECUTE soft key. Wavelength calibration is executed. The previous
8.
Press the CANCEL soft key during wavelength calibration to cancel the
9.
3.7 Wavelength Calibration
wavelength values.
screen is displayed again after the calibration process ends.
wavelength calibration process.
3
Preparing for Measurement
Note
It is not necessary to perform calibration on multiple wavelengths. If calibration is performed on
multiple wavelengths, only the results from the final calibration are applied.
IM AQ6370D-01EN
3-21
Page 52

3.7 Wavelength Calibration
Calibration Table
Editing the User Calibration table. (Wavelength)
Editing the User Calibration table. (Level)
Press SYSTEM.
1.
Press the WL OFFSET TABLE soft key. The wavelength calibration table appears
2.
along with a soft key menu for editing calibration values.
Press arrow soft keys to move the cursor to the wavelength to be edited, then
3.
press the WL EDIT soft key. A screen for entering numerical values is displayed.
Enter a value using the rotary knob, arrow keys, or numeric keypad.
4.
Press ENTER.
5.
Note
Normally, it is not necessary to use this function.
Press SYSTEM.
1.
Press the LVL OFFSET TABLE soft key. The level calibration table appears along
2.
with a soft key menu for editing calibration values.
Press arrow soft keys to move the cursor to the wavelength to be edited, then
3.
press the LEVEL EDIT soft key. A screen for entering numerical values is
displayed.
Enter a value using the rotary knob, arrow keys, or numeric keypad.
4.
Press ENTER.
5.
Note
Normally, it is not necessary to use this function.
3-22
IM AQ6370D-01EN
Page 53

1
2
3.8 Resolution Calibration
Optical fiber
AQ6370D
Procedure
The resolution of the AQ6370D can be calibrated using a light source that you provide.
Connecting the External Light Source
Turn on the AQ6370D.
1.
Turn on the MAIN POWER switch and then press the POWER switch.
For instructions on how to turn on and off the power, see section 3.4.
Connect the external light source’s optical output connector to the AQ6370D’s
2.
optical input connector using a 9.5/125 μm SM (single mode) optical fiber.
Light source
Note
For the light source, use a stabilized single-mode laser light.
Set the optical output power to –20 dBm or higher.
Use a light source with a level stability of 0.1 dBp-p or less.
Use a light source with a line width of 5 MHz or less.
3
Preparing for Measurement
IM AQ6370D-01EN
Press SYSTEM. The soft key menu is displayed.
3.
Press the MORE soft key repeatedly until the MORE 4/4 menu is displayed.
4.
Press the RES BW CALIBRATION soft key. A resolution calibration soft key menu
5.
and a message explaining how to perform resolution calibration appear.
The message also contains the wavelength value of the previous resolution
calibration.
3-23
Page 54

Wavelength value of the previous resolution calibration
If calibration has not been performed or has been cleared, “No User Cal” will appear.
3.8 Resolution Calibration
Setting the Calibration Wavelength Value
Press the LASER WAVELENGTH soft key. A screen for setting the external light
6.
source wavelength appears.
Using the rotary knob or arrow keys, set the laser wavelength value.
7.
The selectable wavelength range is 1400 nm to 1620 nm.
Press nm/ENTER. The wavelength value is set.
8.
Press the EXECUTE soft key. Resolution calibration is executed. After the
9.
calibration finishes, the original screen returns.
If you press the CANCEL soft key while the resolution calibration is in progress, it
10.
will be canceled.
CAL appears when a resolution calibration has been performed.
Clicking CAL displays a resolution calibration soft key menu
(shortcut feature).
3-24
IM AQ6370D-01EN
Page 55

1
2
Clearing the Resolution Calibration Value
Press the INITIALIZE soft key. The calibration value will be cleared.
6.
Explanation
Typically the filter response of an optical spectrum analyzer is not rectangular, and
thus the resolution bandwidth differs slightly from the equivalent noise bandwidth. This
difference becomes prominent especially when the wavelength resolution is high (e.g.,
0.05 nm or less). The resolution calibration function measures the equivalent noise
bandwidth at each resolution setting and internally sets the resolution bandwidth to the
result. The resolution bandwidth appears in parentheses in each of the resolution soft
keys on the resolution screen.
The resolution bandwidth accuracy affects the results of noise measurements and the
results of optical power measurements of wideband light sources. In detail, the resolution
bandwidth is used when the following analysis and computation functions are executed.
• WDM analysis
• EDFA-NF (optical amp gain, NF measurement)
• Power analysis
• OSNR and total power of DFB-LD analysis
• Total power of FP-LD analysis
• Total power of LED analysis
• Power density markers, Integrated power markers
3.8 Resolution Calibration
3
Preparing for Measurement
IM AQ6370D-01EN
3-25
Page 56

Before resolution calibration
After resolution calibration
Equivalent noise bandwidth = Resolution bandwidth
Measurement resolution used in the analysis algorithm (e.g. EDFA-NF)
3.8 Resolution Calibration
Peak value
3dB
3 dB bandwidth = Resolution bandwidth
The number displayed on the soft key
Filter response of the optical
spectrum analyzer
The equivalent noise bandwidth is the width of the
equivalent rectangle formed by keeping the spectrum
area constant.
Filter response of the optical
spectrum analyzer
For details on the RES BW parameters, see “NF computation related parameters”
in the explanation of section 7.8.
If the RES BW parameter is set to
“MEASURED,” the resolution
bandwidth is determined from the
TRACE B waveform.
If the RES BW parameter is set to “CAL
DATA,” the resolution bandwidth stored
in the AQ6370D is used.
Resolution Calibration
Not executed or cleared
Resolution calibration executed
TRACE B waveform
3 dB
MEASURED
Value stored in the AQ6370D
Peak value
3 dB
width
Equivalent
noise
bandwidth
Calibration table (CAL DATA)
Factory default resolution
bandwidth
Calibration table (CAL DATA)
Resolution bandwidth after executing
resolution calibration
3-26
The analysis algorithm other than EDFA-NF uses the value stored in the AQ6370D.
Clearing the Resolution Calibration Value
The calibration table of equivalent noise bandwidth is cleared. After clearing, the 3 dB
width resolution bandwidth is used in the analysis algorithm calculations.
Use this function when you need to align with existing analysis data.
IM AQ6370D-01EN
Page 57

1
2
3.9 Important Points During Measurement
Types of Optical Fibers
The instrument can use single mode optical fibers with core diameters of 5 to 9.5 μm,
and multimode (GI) optical fibers with core diameters of 50 and 62.5 μm. Functions may
be limited or restricted depending on which type of optical fiber is used. The table below
shows which of the typical types of fiber may be used and the limitations on their use.
Limitations on Wavelength Resolution
The maximum wavelength resolution for the instrument is 0.020 nm, which is only
obtainable when using a single-mode optical fiber with a core diameter of 9.5 μm or less.
As shown in Table, the maximum wavelength resolution decreases when optical fibers
with thicker core diameters are used.
Setting a resolution value finer than those shown in the table below will simply result in
an inaccurate measurement level without improving resolution.
Optical fibers with a thick core diameter are especially useful for inputting spatial light for
measurement, but they have poor resolution.
Choose the best type of optical fiber for your particular application.
Note that the instrument is designed for input through optical fiber only. It will not work
with inputs that do not pass through optical fiber, such as direct input of a gas laser
beam to the optical input connector, or bonding an LED to the optical input connector. It
is important to note that optical spectrum measurements taken through such inputs are
completely unreliable.
For spatial light measurements, input the spatial light to the optical fiber and from the
optical fiber to the instrument. A variety of adapters are available for this purpose.
3
Preparing for Measurement
Summary of usable optical fiber types and usage limitations
Optical Fiber Type Obtained Wavelength Absolute Level
Resolution (in nm) Accuracy
Type Core Diameter
SM 5 0.020 NG
SM 9.5 0.020 OK
GI 50 0.050 NG
GI 62.5 0.050 NG
SI 50 0.050 NG
SI 80 0.100 NG
SI 100 0.200 NG
SI 200 0.500 NG
SI 400 1.000 NG
SI 800 2.000 NG
IM AQ6370D-01EN
3-27
Page 58

3.9 Important Points During Measurement
Input Optical Fiber Numerical Aperture (NA) and Level Measurement Values
The level measurement error of the instrument changes as shown in the figure below,
according to the numerical aperture (NA) of the optical fiber connected to the input
connector. The instrument’s absolute level is calibrated using a 9.5/125 μm single-mode
optical fiber (SSMA type in JIS C6835, with PC polishing, 9.5 μm mode field diameter,
and 0.104 to 0.107 NA). Even if a single-mode optical fiber is used, the level accuracy
will be outside the specifications if the NA is not in the range shown above.
Input optical fiber numerical aperture and level error (typical characteristics)
0.50
0.40
0.30
0.20
0.10
0.00
-0.10
-0.20
Level error (dB)
-0.30
-0.40
-0.50
0.101 0.102 0.103 0.104 0.105 0.106 0.107 0.108 0.109 0.110
Numerical Aperture
Absolute Level Accuracy
The instrument’s absolute level is calibrated with a 9.5 μm single-mode optical fiber.
In terms of actual capability, even single-mode optical fibers that do not have a core
diameter of 9.5 μm provide nearly the same level of accuracy.
Multimode (GI) fiber provides a relatively accurate spectrum if the light source is lowcoherent light such as white light, natural light, or an LED. If the light source has high
coherency as in the case of a laser beam, interference will occur inside the optical fiber,
and the intensity distribution of light radiating from the fiber tip will vary according to the
fiber form. As a result, the spectrum (measurement level) may fluctuate if the fiber is
moved.
When an optical fiber with a large core diameter or large NA value is used, a low fraction
of the light emitted from the optical fiber is received. Therefore, the measurement level is
lower than the true value, but the optical spectrum is accurate in relative terms.
Level Accuracy below the Cutoff Wavelength (Short Wavelength) of a
Connected Optical Fiber
With wavelengths at or below the cutoff level of the connected fiber, light propagates
through the optical fiber in multiple modes. When high-coherent light from a light source
such as a gas laser or DFB-LD light source propagates in multiple modes, speckle noise
contained in the optical fiber output light may become unstable by the optical fiber’s form,
resulting in an inaccurate measurement level.
In such cases, improving the coupling between the light source and the optical fiber will
lessen the level inaccuracy.
3-28
IM AQ6370D-01EN
Page 59

1
2
Waveform with CHOP MODE OFF CHOP MODE set to SWITCH
3.9 Important Points During Measurement
Measurement Sensitivity and Vertical Axis Effective Range
When the measurement sensitivity is set to NORMAL HOLD, the internal amplifier has
a fixed gain. Five different gains are set automatically according to the reference (REF)
level setting. However, the effective range of measurement data is limited to the following
range, using the reference (REF) level (dBm) as a reference.
REF-20 dBm < (effective range) < REF+10 dBm
If the level scale is set to 10 dB/DIV, the display would exceed the effective range, so the
areas at 10 dB from the screen stop and 20 dB from the bottom are inaccurate.
When measurement sensitivity is set to NORMAL HOLD, we recommend setting the
level scale to 5 dB/DIV or less.
Under the measurement sensitivity settings NORMAL AUTO, MID, and HIGH 1 to 3,
an automatic gain is used, permitting measurements over a wide level range through a
single sweep. Select the appropriate sensitivity level based on the light reception level
required for the particular measurement application.
Stray Light from the Monochromator
The instrument has a newly designed, high-performance monochromator. Depending
on the measurement conditions, stray light at a level 30 to 50 dB below the original
spectrum, as well as other stray light specific to the monochromator may occur in
wavelength areas 100 to 200 nm from the peak wavelength. If this stray light is likely to
have a severe impact on measurements, the sensitivity can be set to HIGH 1 to 3 and
CHOP MODE can be set to CHOP or SWITCH in order to reduce the effects of the stray
light.
3
Preparing for Measurement
CHOP MODE Function List
CHOP
MODE
OFF
SWITCH
Measurement according to the
stray light.
Stray light suppression ratio:
40 dB or more
Two sweeps per measurement
are performed. The first sweep
measures the stray light
component, and high dynamic
measurement is possible
through subtraction.
Stray light suppression ratio:
60 dB or more
Function Merit Defect
Measurement time is rapid
even for high sensitivity
measurements.
Short-duration
measurement can be taken
with stray light removed.
Since the stray light is
also measured, the low
level component is not
accurate if the light source
is of high power.
If the measurement
duration is long, it is
influenced by temporal
changes in the measured
light.
IM AQ6370D-01EN
3-29
Page 60

3.9 Important Points During Measurement
Ripples in the 1350 to 1450 nm Area
Water (OH-) ions present in the monochromator absorb light in the 1350 to 1450 nm
area, resulting in ripples in the measurement waveform. Either set a coarser resolution or
use the monochromator in a lower-humidity environment to reduce the amount of ripples.
Waveforms with Resolutions of 0.020 nm
When the resolution is set to 0.020 nm for measurements of a light source such as a
DFB laser in which with the spectral width is narrower than the instrument’s resolution,
very small spikes may occur at the skirts of the waveform. This type of spike occurs due
to characteristics of the optical block and is not an indication of any problem. Even if such
spikes occur, satisfactory performance in terms of resolution, dynamic range, and the like
can be ensured. These spikes will disappear if the resolution is set to a coarser value.
Brightness of the installation location
The instrument’s shielding specifications indicate use in common office or factory
environments (with illumination of 300 to 1000 Ix). Therefore, depending on the
illumination in the installation location, the instrument may receive some ambient light
which can affect measurements of light with small level measurement values. In such
cases, turn lights around the instrument OFF to reduce inaccuracies.
3-30
IM AQ6370D-01EN
Page 61

1
2
Second-Order Diffracted Light
1800
0
Wavelength displayed on screen (nm)
ex. 633 nm
The ghost spectrum of the second-order
3.9 Important Points During Measurement
The monochromator in this instrument uses a diffraction grating, and when light in a
certain wavelength range is input, a “grating ghost” of second-order diffracted light
appears.
Therefore, it is important to understand this distinctive characteristic in order to correctly
analyze the measured results from the instrument.
The graph below shows the correlation between the wavelength displayed on screen and
the actual wavelength.
The displayed wavelength is on the horizontal axis, with the true wavelength on the
vertical axis. The solid lines in the graph indicate correspondences between displayed
and actual wavelengths. The thick solid line is the correlation with the correct light
spectrum (of course, the displayed wavelength and actual wavelength match), and
the thin solid line shows the correlation with the ghost spectrum of the second-order
diffracted light.
For example, if 633 nm light is input, a horizontal line is drawn at 633 nm on the vertical
axis, and the point of intersection on the graph of the line is the displayed wavelength.
From this, you can see that besides 633 nm, a grating ghost appears at 1266 nm.
Relationship between the Wavelength Displayed on Screen and the Actual Wavelength
1700
1600
1500
1400
1300
1200
1100
Actual wavelength (nm)
1000
900
800
700
600
500
500 600 700 800 900 1000 1100 1200 1300 1400 1500 1600 1700 180
Second-order diffracted light
1266 nm
3
Preparing for Measurement
Example of measurement in which second-order diffracted light appears at 1266 nm
IM AQ6370D-01EN
diffracted light
3-31
Page 62

1
2
3
Indicates that there is a submenu of additional items related to
Press to display a separate window in the screen for entry of
Press to move to the submenu and display a separate window.
Chapter 4 Common Operations
4.1 Description of Soft Keys
When you press a function key, the soft key menu (inside the screen) located on the right
side of the screen changes.
The soft key menus are designed to provide a certain level intuitiveness, with the
individual soft keys having particular forms which make them easy to understand.
Forms and Behavior
This is a normal soft key.
Press to execute its function immediately.
Contains a submenu.
the current item.
Press to display the submenu.
A separate window will be displayed.
numerical parameters.
A submenu and separate window will be displayed.
4
Common Operations
This softkey returns to the previous menu.
Press to display the previous soft key menu.
This is a selection soft key.
Select one of the soft keys connected with the black band.
When selected, the soft key is displayed in reverse video.
Several soft keys can be connected.
IM AQ6370D-01EN
4-1
Page 63

The LEVEL soft key menu is split into two parts.
This key switches between the menus.
In addition, in some cases this may change
to a function that closes the window. For example,
when the MORE 1/2 soft key is pressed, the
menu changes to the LEVEL 2/2 soft key menu,
and the key display changes to MORE 2/2.
In this example, the soft key menu is within
4.1 Description of Soft Keys
Display Examples
LEVEL 1/2 LEVEL 2/2
REF LEVEL
***.*dBm
LOG SCALE
SUB LIN
**.*dB/D
LIN SCALE
SUB SCALE
**.*dB/km
LIN
BASE LEVEL
SUB SCALE
**.*mW
PEAK
→ REF LEVEL
AUTO
REF LEVEL
OFF / ON
LEVEL UNIT
dBm dBm/nm
Y SCALE
SETTING
Y SCALE
DIVISION
8 / 10 / 12
REF LEVEL
POSITION
**DIV
SCALE MIN
LENGTH
AUTO
SUB SCALE
OFF / ON
SUB REF LVL
POSITION
**.*dB/D
*.***/D
**.*%/D
* *.* %
**.***km
**DIV
LE VEL
MORE 1 / 2
Y SCALE
SETTING
LEVEL
RETURN
LEVEL
MORE 2 / 2
Shows the submenu of the soft key menu.
the Y SCALE SETTING submenu
(for display only, no keys are available).
4-2
IM AQ6370D-01EN
Page 64

1
2
3
4.2 Using the Mouse and External Keyboard
Using the Mouse
With a connected mouse you can perform the same operations as with the instrument's
panel keys. Also, if you move the mouse pointer over the item in the menu screen that
you wish to select and click it, the instrument responds exactly as if you had pressed the
corresponding soft key. The USB mouse is connected to the USB interface on the front
panel of the instrument.
For instructions on connecting the mouse, see section 3.3.
Operations the Same as the Panel Keys
Displaying the Top Menu
Right-click the mouse in the screen. The names of the front panel keys in the instrument's
FUNCTION section are displayed.
CENTER
SPAN
LEVEL
SWEEP
ZOOM
SETUP
TRACE
DISPLAY
MARKER
PEAK SEARCH
ANALYSIS
USER
MEMORY
FILE
PROGRAM
ADVANCE
SYSTEM
UNDO/LOCAL
COPY
PRESET
HELP
4
Common Operations
IM AQ6370D-01EN
Selecting Items
Move the pointer to the item you wish to select and click. A setting menu for the selected
item appears. The list of front panel key names disappears.
Clearing the List of Front Panel Keys
Move the pointer away from the list of front panel keys and click.
Operations the Same as the Soft Keys
Selecting Functions from the Soft Key Menu
Move the pointer to the soft key you wish to select and click. A screen corresponding to
the action of the soft key appears.
4-3
Page 65

4.2 Using the Mouse and External Keyboard
Using the External Keyboard
The functions of each of the front panel keys of the instrument are assigned to keyboard
keys, allowing you to manipulate them with a keyboard just as you would by using the
instrument's panel keys.
The panel key correspondence table below shows the correspondences between the
panel keys and the keys on the keyboard. Also, you can directly enter labels, file names,
and numbers.
Panel Key Correspondence Table
Type Function
Sweep SWEEP [SHIFT]+[F1] Executes/sets sweep
CENTER [SHIFT]+[F2] Sets measurement center wavelength
SPAN [SHIFT]+[F3] Sets measurement span
LEVEL [SHIFT]+[F4] Sets level axis
SETUP [SHIFT]+[F5] Sets resolution, sensitivity, etc.
TRACE [SHIFT]+[F6] Sets trace
ZOOM [SHIFT]+[F7] Sets display scale
DISPLAY [SHIFT]+[F8] Sets screen display
MARKER [SHIFT]+[F9] Sets marker
SEARCH [SHIFT]+[F10] PEAK/BOTTOM search function
ANALYSIS [SHIFT]+[F11] Sets analysis function
USER [ALT]+[F1] User settings menu
MEMORY [ALT]+[F2] Memory
FILE [ALT]+[F3] Saves/opens files, file actions
PROGRAM [ALT]+[F4] Program Functions
ADVANCE [ALT]+[F5] Advanced functions
SYSTEM [ALT]+[F6] System settings
F1 to F9 F1 to F9 Depends on FUNCTION menu
UNDO/LOCAL [ALT]+[F9]
COPY [ALT]+[F10] Screen copy
PRESET [ALT]+[F11]
HELP [ALT]+[F12]
Numeric keypad 0123456789.- Numeric value input
BACK SPACE Back Space
um/ENTER None Confirms entry
nm/ENTER ENTER Confirms entry
Rotary knob [→], [←] Changes numeric values/items
Arrow keys ([UP]
[DOWN])
COARSE [ALT]+[N]
FUNCTION
Soft keys
Auxiliary keys
DATA ENTRY
Meas.
settings
Display
settings
Analysis
functions
Other
External
Keyboard
[↑], [↓]
Description
Local: UNDO function
Remote: Returns to the local state.
Clears settings except remote
settings
Displays Help (use UNDO/LOCAL
to exit Help)
Deletes one character from input
value
Numeric value one-step change,
item change, table scrolling
Switches between fine and coarse
encoder
4-4
IM AQ6370D-01EN
Page 66

1
2
3
4.3 Entering Numerical Values and Strings
DATA ENTRY
Numeric keypad
Entering Numerical Values
You can use the numeric keypad, rotary knob, or arrow keys in the DATA ENTRY section.
Press the soft key of a parameter. The currently set value is shown in the
1.
parameter input window.
Direct Entry Using the Numeric Keypad
Press a numeric keypad key. The numeric keypad input area appears, and the
2.
number of the pressed key is displayed.
After entering a numerical value, press the μm/ENTER or nm/ENTER key
3.
depending on the unit of the input parameter. The value in the numeric keypad
input area appears in the parameter input window, and is set internally. If a
parameter does not have a unit associated with it, you can use either the μm/
ENTER or nm/ENTER key.
If you make an error when inputting values with the numeric keypad:
Press BACK SPACE. The last (right-most) entered character in the numeric
4.
keypad input area is removed, allowing entry of the correct character.
4
Common Operations
Note
• If the value entered with the numeric keypad is not in the allowed value range, the nearest
• By holding the BACK SPACE key down, you can erase the entire entry in the numeric
Entry Using the Rotary Knob and Arrow Keys
Continuing on from step 1, turn the rotary knob, or press an arrow key. The
2.
When you press the COARSE key the digit of the setting to be changed rises,
3.
allowed value will be set.
keypad input area and make the numeric keypad input area disappear, returning to the
condition preceding numeric keypad input.
currently set value is changed.
or the numeric value increase/decrease step increases. Press the COARSE key
again to restore the previous digit/step.
When COARSE is selected, the COARSE key lights.
Rotary knob
COARSE
Arrow keys
IM AQ6370D-01EN
BACK
7
4
1
0
9
8
5
2
.
SPASE
6
m/
3
ENTER
nm/
-
ENTER
4-5
Page 67

Manipulate preset word
4.3 Entering Numerical Values and Strings
Entering Strings
Character strings can be entered from the character selection area displayed on screen
using the rotary knob and soft keys.
Entry Procedure
The following is an example of entering a label.
Press DISPLAY. The soft key menu for the screen display appears.
1.
Press the LABEL soft key. The text selection area and label entry area are
2.
displayed.
Move cursor to right
Move cursor to left
Insert character
Delete character
Delete all characters
Enter characters
Finalize entry
Discard changes
Move the cursor to the character in the character selection area that you wish
3.
to enter. Use the rotary knob or arrow keys to move the cursor in the character
selection area.
Press the ENTER soft key. The character selected at the cursor position in the
4.
label input area is displayed.
To move the cursor, or insert or delete a character in the label input area, press
5.
the corresponding soft key.
When the character string is entered, press the DONE soft key. The input
6.
character string is entered.
Note
• In addition to when pressing DISPLAY, the character input screen appears whenever a
string must be entered on the instrument, such as when entering a file name for saving a
file.
• Numerical input can be performed directly from the numeric key pad.
4-6
IM AQ6370D-01EN
Page 68

1
2
3
4.4 Screen Display
Procedure
Press SYSTEM. The soft key menu is displayed.
1.
Press the MORE soft key repeatedly until the MORE 3/4 menu is displayed.
2.
Setting the Number of Displayed Digits for Level Data
Press the LEVEL DISP DIGIT soft key. The digit setting menu is displayed.
3.
Press the soft key corresponding to the desired number of digits.
4.
1DIGIT Sets the number of level data display digits (below the decimal point)
to 1 digits.
2DIGIT Sets the number of level data display digits (below the decimal point)
to 2 digits.
3DIGIT Sets the number of level data display digits (below the decimal point)
to 3 digits.
Transparent
Display
4
Common Operations
Transparent Display
Continuing on from step 2, press the WINDOW TRANSPARENT OFF ON soft
3.
key. Transparent display turns ON or OFF. When ON, the parameter input window
and overview display window are displayed transparently.
Changing the Display Colors
Continuing on from step 2, press the COLOR SELECT soft key. The display color
3.
setting menu is displayed.
Press the soft key corresponding to the desired display color.
4.
COLOR1
COLOR2
COLOR3
COLOR4
COLOR5
B&W
Changing the
Display Colors
Sets the screen display color to “COLOR 1”.
Sets the screen display color to “COLOR 2”.
Sets the screen display color to “COLOR 3”.
Sets the screen display color to “COLOR 4”.
Sets the screen display color to “COLOR 5”.
Sets the screen display color to black-and-white.
IM AQ6370D-01EN
4-7
Page 69

4.5 Setting the Date and Time
The AQ6370D displays the date and time in the upper right corner of the screen. This
information is used for a time stamp when recording data.
Displaying the Date and Time Dialog Box
Press SYSTEM. The soft key menu is displayed.
1.
Press the MORE soft key repeatedly until the MORE 3/4 menu is displayed.
2.
Press the SET CLOCK soft key. The internal clock setting screen is displayed.
3.
Entering the Date and Time
Press the CURSOR -> soft key, then move the cursor to the item you wish to
4.
input. The cursor moves each time you press the soft key.
Press a numeric key button to enter a number.
5.
Press ENTER. The input number is entered.
6.
Changing the Display Format
Press the MO-DY-YR soft key.
7.
The date is displayed in the order Month, Day, Year.
Press the DY-MO-YR soft key.
The date is displayed in the order Day, Month, Year.
Press the YR-MO-DY soft key.
The date is displayed in the order Year, Month, Day.
Concluding the Settings
Press the RETURN soft key. The settings are concluded, and the screen returns
8.
to the previous stage.
4-8
IM AQ6370D-01EN
Page 70

1
2
3
4
Screen after auto sweep start value
Chapter 5 Measurement
5.1 Auto Measurement
Procedure
This key automatically sets the optimal measurement conditions for the light source
being measured, and performs measurement.
Press SWEEP. The soft key menu regarding sweeping appears.
1.
Press the AUTO soft key. The soft key display reverses, and auto measurement
2.
executes.
5
Measurement
Waveform display example
Screen after auto sweep stop
Explanation
The wavelength range of input light that can be auto-measured is 840 to 1670 nm.
The following four items are set automatically, after which measurement is performed.
• Center wavelength (CENTER)
• Sweep width (SPAN)
• Reference level (REF LEVEL)
• Resolution (RESOLUTION)
After performing one auto sweep and setting optimal measurement conditions, a repeat
sweep is made for measurement.
During the automatic setting, only the following keys are enabled: REPEAT, SINGLE,
STOP, and UNDO/LOCAL (when under remote control).
IM AQ6370D-01EN
5-1
Page 71

5.2 Horizontal/Vertical Axis Settings
Procedure
Setting Up the Horizontal Axis
The units of the horizontal axis can be set to wavelength or frequency.
Press SETUP. The soft key menu for sweep condition settings appears.
1.
Press the MORE 1/2 soft key.
2.
Press the HORIZON SCAL nm/THz soft key. The units for the horizontal axis
3.
switch from THz to nm, or viceversa.
Note
Pressing the HORIZON SCALE nm/THz soft key repeatedly toggles between nm and THz.
Setting the Measured Wavelength to Air Wavelength or Vacuum Wavelength
Press SETUP. The soft key menu for sweep condition settings appears.
1.
Press the MEAS WL AIR VACUUM soft key. The measured wavelength is
2.
changed to either a vacuum wavelength or an air wavelength.
Note
• This function only applies to measurements taken after the setting is selected. Previously
measured waveforms are not affected.
• If vacuum wavelength is set, is displayed at the very bottom of the screen in inverse
video.
5-2
IM AQ6370D-01EN
Page 72

1
2
3
4
Setting Up the Vertical Axis
Setting to Log Scale Display
Press LEVEL. The soft key menu for vertical axis settings appears along with the
1.
reference level setting screen.
Press the LOG SCALE soft key. The vertical axis is displayed with the currently
2.
specified log scale values. At the same time, the log scale value setting screen is
displayed.
Enter a log scale value using the rotary knob, arrow keys, or numeric key pad.
3.
Press ENTER.
4.
5.2 Horizontal/Vertical Axis Settings
5
Measurement
Setting to Linear Scale Display
Press LEVEL. The soft key menu for vertical axis settings appears along with the
1.
reference level setting screen.
Press the LIN SCALE soft key. The vertical axis is displayed with the currently
2.
specified linear scale values.
Press the LIN BASE LEVEL soft key. A screen for setting the lower-end value of
3.
the level scale is displayed.
Enter a value using the rotary knob, arrow keys, or numeric key pad.
4.
Press ENTER.
5.
IM AQ6370D-01EN
5-3
Page 73

5.2 Horizontal/Vertical Axis Settings
Setting Units for the Vertical Axis
Press LEVEL.
1.
Press the LEVEL UNIT soft key. When the vertical axis is log scale, the
2.
instruments toggle between dBm and dBm/nm each time you press the key. With
a linear scale, it scrolls through nW, μW, mW, or pW, and nW/nm, μW/nm, mW/nm
or pW/nm.
Setting the Number of Vertical Axis Divisions (for LOG SCALE)
Press LEVEL.
1.
Press the LOG SCALE soft key.
2.
Press the Y SCALE SETTING soft key. The level scale setting menu is displayed.
3.
Press the Y SCALE DIVISION soft key. The soft key menu for selecting a number
4.
of divisions is displayed.
Press a soft key corresponding to 8, 10, or 12 divisions. The level axis is
5.
displayed with divisions as selected.
Note
• This is only available when the main scale is a log scale.
• When it is a linear scale, the number of divisions is fixed at 10.
Reference Level Screen Position Setting (for LOG SCALE)
Continuing on from step 3, press the REF LEVEL POSITION soft key. A screen
4.
for setting the screen position of the reference level (REF position) is displayed.
Enter a value starting from the bottom of the screen using the rotary knob, arrow
5.
keys, or numeric key pad. The setting range is 0 to 12. The setting resolution is
steps of 1, or steps of 1-2-5 when COARSE is pressed.
Press ENTER.
6.
Note
• This is only available when the main scale is a log scale.
• If the REF position value is larger than the number of divisions, it is forcibly reduced to the
number of divisions.
• When using linear scale, the REF position is at the top (fixed to 10 divisions).
5-4
IM AQ6370D-01EN
Page 74

1
2
3
4
Explanation
5.2 Horizontal/Vertical Axis Settings
Wavelength Display Mode
• Displays the measured waveform with the wavelength on the X axis.
• The measurement scale and display scale are set based on the wavelength.
• The X axis unit for marker values and analysis function results is wavelength.
Frequency Display Mode
• Displays the measured waveform with the frequency on the X axis.
• The measurement scale and display scale are set based on the frequency.
• The X axis unit for marker values and analysis function results is frequency.
Display Units of the X-Axis and Marker Values
The display unit for the marker value (wavelength or frequency) can be set independently
of the waveform display’s horizontal axis units (wavelength or frequency) that were
specified using the HORIZON SCALE nm/THz soft key under SETUP. (Default: nm)
(This key can be used to enter settings such as frequency display mode on the X axis
and wavelength display mode for the marker value.)
Also, the MARKER UNIT nm THz soft key’s setting changes in conjunction with the
setting of the HORIZON SCALE soft key. However, changing the MARKER UNIT nm THz
soft key’s setting does not change the setting for the HORIZON SCALE nm/THz soft key.
5
Measurement
Note
The MARKER UNIT nm THz soft key’s setting changes in conjunction with the setting of the
HORZN SCALE soft key. However, changing the MARKER UNIT nm THz soft key’s setting
does not change the setting for the HORIZON SCALE nm/THz soft key.
LOG SCALE **.*dB/D
This key switches the vertical axis to LOG display and sets the level scale.
The setting range is 0.1 to 10.0 dB/DIV. Settings can be adjusted in steps of 0.1 dB.
If you press the COARSE key you can change the numerical value in 1-2-5 steps, for
example: 1dB/DIV -> 2dB/DIV -> 5dB/DIV.
When the setting is changed, the displayed waveform is redrawn according to the
changed scale.
If the value is set to a scale larger than 5 dB/DIV in range fixing mode (SENS:NORMAL/
HOLD) or pulse light measurement mode, the waveform will not be correctly measured in
the vertical direction so a warning is displayed.
Measurement Sensitivity and Vertical Axis Effective Range
When the measurement sensitivity is set to NORMAL HOLD, the internal amplifier has
a fixed gain. Five different gains are set automatically according to the reference (REF)
level setting. However, the effective range of measurement data is limited to the following
range, using the reference (REF) level (dBm) as a reference.
REF-20 dBm < (effective range) < REF+10 dBm
IM AQ6370D-01EN
If the level scale is set to 10 dB/DIV, the display would exceed the effective range, so the
areas at 10 dB from the screen stop and 20 dB from the bottom are inaccurate.
When measurement sensitivity is set to NORMAL HOLD, we recommend setting the
level scale to 5 dB/DIV or less.
Under the measurement sensitivity settings NORMAL AUTO, MID, and HIGH 1 to 3,
an automatic gain is used, permitting measurements over a wide level range through a
single sweep. Select the appropriate sensitivity level based on the light reception level
required for the particular measurement application.
5-5
Page 75

5.2 Horizontal/Vertical Axis Settings
LIN SCALE
This key is used to set the main scale to linear scale.
Settings per 1 DIV are set in the reference level.
LIN BASE LEVEL **.*mW
Value when the vertical axis is linear scale, you can set the level scale low-end. This is
not available when using a log scale.
The setting range is 0.0 to REF level x 0.9. Settings can be adjusted in steps of 0.1. The
value changes in steps of 1 if you press the COARSE key. Values can only be set in the
instrument set for the REF level.
When the setting is changed, the displayed waveform is redrawn according to the
changed scale.
The scale display in the upper left part of the waveform is 1/10 the value (*W/D) of the
reference (REF) level minus the low-end (BASE) level.
For information on the REF level setting, see section 5.4, "Setting the Reference Level."
LEVEL UNIT dBm dBm/nm
When the vertical axis is log scale, the display toggles between dBm and dBm/nm.
dBm: Power per resolution (absolute power)
dBm/nm: Power per 1 nm (power density)
For information on the use of dBm and dBm/nm, see “Power Density Display” in section
2.2, “Measurement.”
If you set a calculated waveform to power density, the level unit is automatically set to
dBm.
If power density is assigned as the calculated waveform to Trace F and the unit is set to
dBm/nm, Trace F enters FIX mode, and the waveform is no longer updated.
LEVEL UNIT mW mW/nm
When the level axis uses a linear scale, the display switches between nW, μW, mW, or
pW (absolute power), and nW/nm, μW/nm, mW/nm or pW/nm (power density).
5-6
IM AQ6370D-01EN
Page 76

1
2
3
4
5.3 Sub Scale
Procedure
The level scale is displayed based on relative values when a differential waveform (based
on LOG values) or normalized waveform is displayed. A level scale based on relative
values is called a sub scale.
Displaying the Sub Scale
Following section 6.5, “Displaying MATH Waveforms” or section 6.6, “Normalized
Display,” you can select a display waveform of differential or normalized.
5
Measurement
Automatic Scaling of the Sub Scale
Press LEVEL. The soft key menu for vertical axis settings appears.
1.
Press the MORE 1/2 soft key. The soft key menu for the sub scale appears.
2.
Press the AUTO SUB SCALE OFF ON soft key to select ON.
3.
Setting the Sub Scale REF Position
Press LEVEL.
1.
Press the MORE 1/2 soft key.
2.
Press the SUB REF LVL POSITION soft key. The REF position setting screen is
3.
displayed.
Enter a value using the rotary knob, arrow keys, or numeric key pad.
4.
Note
The sub scale is displayed when a differential waveform (based on LOG values) and
normalized waveform are displayed. When these waveforms are displayed over a waveform
based on absolute values, the absolute value scale is shown on the left and the relative value
scale is shown simultaneously on the right. If the left scale (main scale) is changed to LOG (8
DIV) or linear (10 DIV), the sub scale is displayed to correspond to the DIV count on the main
scale.
IM AQ6370D-01EN
5-7
Page 77

5.3 Sub Scale
Log Display of the Sub Scale
Press LEVEL. The soft key menu for vertical axis settings appears.
1.
Press the MORE 1/2 soft key. The soft key menu for the sub scale appears.
2.
Press the SUB LOG soft key. The sub scale is displayed with the currently
3.
specified log scale values. At the same time, the log scale value setting screen is
displayed.
Enter a value using the rotary knob, arrow keys, or numeric key pad.
4.
Press ENTER.
5.
Setting the Sub Scale Units to dB/km
Press LEVEL.
1.
Press the MORE 1/2 soft key.
2.
Press the SUB SCALE **.*dB/km soft key. The instruments of the sub scale
3.
change to dB/km. At the same time, the log scale value setting screen is
displayed.
Enter a value using the rotary knob, arrow keys, or numeric key pad.
4.
Press ENTER.
5.
When displaying the loss characteristics of the optical fiber per unit of length (km)
Continuing on from step 5, press the LENGTH soft key. The optical fiber length
6.
entry screen appears.
Enter a value using the rotary knob, arrow keys, or numeric key pad.
7.
Press ENTER.
8.
Setting the Sub Scale Offset Value
Press LEVEL.
1.
Press the MORE 1/2 soft key.
2.
Press the OFFSET LEVEL soft key. The offset value (sub scale REF value)
3.
setting screen is displayed.
Enter a value using the rotary knob, arrow keys, or numeric key pad.
4.
Press ENTER.
5.
5-8
IM AQ6370D-01EN
Page 78

1
2
3
4
Setting the Sub Scale to Linear Display
Press LEVEL. The soft key menu for vertical axis settings appears.
1.
Press the MORE 1/2 soft key. The soft key menu for the sub scale appears.
2.
Press the SUB LIN soft key. The sub scale is displayed with the currently
3.
specified linear scale values. At the same time, the linear scale value setting
screen is displayed.
Enter a value using the rotary knob, arrow keys, or numeric key pad.
4.
Press ENTER.
5.
Setting the Sub Scale Units to %/D
Press LEVEL.
1.
Press the MORE 1/2 soft key.
2.
Press the SUB SCALE **.*%/D soft key. The instruments of the sub scale display
3.
change to %. At the same time, the log scale value setting screen is displayed.
Enter a value using the rotary knob, arrow keys, or numeric key pad.
4.
Press ENTER.
5.
Setting the Sub Scale Lower-End Value
Press LEVEL.
1.
Press the MORE 1/2 soft key.
2.
Press the SCALE MIN soft key. The sub scale lower end value setting screen is
3.
displayed.
Enter a value using the rotary knob, arrow keys, or numeric key pad.
4.
Press ENTER.
5.
5.3 Sub Scale
5
Measurement
IM AQ6370D-01EN
5-9
Page 79

5.3 Sub Scale
Explanation
SUB SCALE **.*dB/km
(Setting the sub scale to dB/km)
The setting range is 0.1 to 10.0 dB/km. Settings can be adjusted in steps of 0.1. If you
press the COARSE key you can change the numerical value in 1-2-5 steps, for example:
1dB/DIV -> 2cB/DIV -> 5dB/DIV.
When the setting is changed, the displayed waveform is redrawn according to the
changed scale.
SUB SCALE ***.*%/D
(Sets the sub scale to %.)
The setting range is 0.5 to 125 %/D. Settings can be adjusted in steps of 0.1. The value
changes in steps of 1-2-5 if you press the COARSE key.
When the setting is changed, the displayed waveform is redrawn according to the
changed scale.
OFFSET LEVEL
(Sets the offset value. This is enabled when the sub scale is dB/D or dB/km.
The range that can be set is as follows.)
For dB/D: 0 to ±99.9 dB. Settings can be adjusted in steps of 0.1. The value changes in
steps of 1 if you press the COARSE key.
For dB/km: 0 to ± 99.9 dB/km in steps of 0.1.
SCALE MIN
(Sets the scale lower-end value. This is available when the sub scale is LIN or %.
The range that can be set is as follows.)
For LIN: 0 to the sub scale value (***.*/D) x 10
For %: 0 to the sub scale value (***.*%/D) x 10
LENGTH **.***km
(Sets the length of the optical fiber. This is available when the sub scale is dB/km.)
The setting range is 0.001 to 99.999 km. Settings can be adjusted in steps of 0.001. The
value changes in steps of 1-2-5 if you press the COARSE key.
AUTO SUB SCALE OFF/ON
(Turns OFF/ON the function for automatically scaling the sub scale following calculation.)
When set to ON, during trace C display, SUB LOG or SUB LIN and OFFSET LEVEL
change automatically. When these are changed, the displayed waveform is redrawn
according to the changed scale.
When set to ON,
is displayed at the bottom of the screen in inverse video.
SUB REF LVL POSITION **DIV
(Sets the sub scale REF position.)
The REF position is set at DIV number **, counting from the bottom of the screen.
The setting range is 0 to 12. Settings can be adjusted in steps of 1. The value changes in
steps of 1-2-5 if you press the COARSE key.
5-10
IM AQ6370D-01EN
Page 80

1
2
3
4
5.4 Setting the Reference Level
Procedure
There are two ways of setting the reference level.
• Press the REF LEVEL soft key.
• Use the one-action key.
The following explains these procedures.
Settings by Pressing the REF LEVEL Soft Key (Log Scale)
Press LEVEL. The soft key menu for vertical axis settings appears along with the
1.
reference level setting screen.
When the vertical axis is not using a log scale, press the LOG SCALE soft key. If
2.
a log scale is displayed, continue to step 4.
Press the REF LEVEL soft key. The reference level setting screen is displayed.
3.
Enter a reference value using the rotary knob, arrow keys, or numeric key pad.
4.
Press ENTER.
5.
5
Measurement
Note
The vertical axis setting is applied in real time on the waveform display.
IM AQ6370D-01EN
5-11
Page 81

5.4 Setting the Reference Level
Setting by Pressing the REF LEVEL Soft Key (Linear Scale)
1.
2.
3.
4.
5.
Press LEVEL. The soft key menu for vertical axis settings appears along with the
reference level setting screen.
When the vertical axis is not using a linear scale, press the LIN SCALE soft key.
If a linear scale is displayed, continue to step 4.
Press the REF LEVEL soft key. The reference level setting screen is displayed.
Enter a reference value using the rotary knob, arrow keys, or numeric key pad.
When a value is input a soft key menu for selecting the instrument appears.
Press the soft key corresponding to the desired units. The reference level is set.
Note
When entered with the rotary knob or arrow keys, the reference level is set using the current
units.
5-12
IM AQ6370D-01EN
Page 82

1
2
3
4
Setting by Using the One-Action Key
Sets the peak level of the waveform as the reference level.
Press LEVEL.
1.
Press the PEAK -> REF LEVEL soft key. The specified reference level is
2.
5.4 Setting the Reference Level
displayed, and the displayed waveform is redrawn according to the changed
reference level.
5
Measurement
Automatically sets the peak level of the waveform measured every sweep
as the reference level.
Continuing on from step 1, press the AUTO REF LEVEL OFF/ON soft key to
3.
select ON.
Note
• Sets the peak level of the measured waveform of the active trace as the reference level.
• This does not operate if the active trace is not set to WRITE (i.e., if it is set to MAX HOLD,
MIN HOLD, CALCULATE, or ROLL AVG).
• When set to ON, is displayed at the bottom of the screen in inverse video.
Sets the moving marker level as the reference level.
Press MARKER.
1.
With the moving marker displayed, press the MARKER-> REF LEVEL soft key.
2.
The specified reference level is displayed, and the displayed waveform is redrawn
according to the changed reference level.
For details on displaying moving markers, see the explanation in section 6.8.
IM AQ6370D-01EN
5-13
Page 83

5.4 Setting the Reference Level
Explanation
Log Scale (REF LEVEL)
The setting range for the log scale reference level is -90.0 to 30.0 dBm. Settings can be
adjusted in steps of 0.1. The value changes in steps of 1 if you press the COARSE key.
Linear Scale (REF LEVEL)
The setting range for the linear scale reference level is 1.00 pW to 1000 mW.
When 1.00 to 9.99 (pW, nW, μW, mW), can be set in steps of 0.01.
When 10.0 to 99.9 (pW, nW, μW, mW), can be set in steps of 0.1.
When 100 to 999 (pW, nW, μW, mW), can be set in steps of 1.
If you press the COARSE key you can change the setting in 1-2-5 steps,
for example: 1pW -> 2pW -> 5pW -> 10pW -> 20pW.
If you make a change such as changing 999 to 1.00 or 1.00 to 999, the instrument will be
changed.
(Example: Changing pW to nW or changing nW to pW)
One-Action Keys
This is the general name for a key that uses data from the active trace waveform (the
currently displayed waveform) to set measurement conditions.
Setting conditions requires that a waveform is displayed for the active trace.
PEAK → REF LEVEL
Sets the peak level of the waveform of the active trace to the reference level.
Displays the specified reference level (peak level value) and waveform in the reference
level setting screen. The reference level setting can be changed after being set initially.
The setting can be changed within the range of -90.0 to +30.0 dBm for LOG scale, or
1.00 pW to 1000 mW for linear scale. If the peak level value exceeds the allowed range,
it is set to the nearest value in the range and a warning is displayed.
MARKER → REF LEVEL
This key is used to set the moving marker level as the reference level.
Displays the specified reference level and waveform in the reference level setting screen.
The reference level setting can be changed after being set initially. The setting can be
changed within the range of -90.0 to +30.0 dBm for LOG scale, or 1.00 pW to 1000 mW
for linear scale.
If the moving marker value exceeds the allowed range, it is set to the nearest value in the
range and a warning is displayed. In the following states, the MARKER → REF LEVEL
key is disabled.
• When the moving marker is OFF
• When both split screens are on HOLD
5-14
IM AQ6370D-01EN
Page 84

1
2
3
4
5.5 Center Wavelength (Center Frequency) Setting
Procedure
The following are three ways of setting the center wavelength (center frequency).
• Press the CENTER WL or CENTER FREQ soft key.
• Press the START WL/STOP WL or START FREQ/STOP FREQ soft key.
• Use the one-action key (soft key).
The following explains these procedures.
Setting by Pressing the CENTER WL or CENTER FREQ Soft Key
Press CENTER. The soft key menu for center wavelength or center frequency
1.
appears along with the center wavelength or center frequency setting screen.
Press the CENTER WL soft key for center wavelength or the CENTER FREQ soft
2.
key for center frequency.
Enter a center wavelength or center frequency using the rotary knob, arrow keys,
3.
or numeric key pad.
Press nm/ENTER.
4.
5
Measurement
Note
• It is not necessary to press nm/ENTER when using the rotary knob or arrow keys.
• The set value is applied to the measurement conditions area.
• When a setting is changed,
• If a value outside the setting range is entered, the nearest permitted value is set.
For instructions on switching the wavelength and frequency displays, see section 5.2.
appears in the measurement conditions area.
IM AQ6370D-01EN
5-15
Page 85

5.5 Center Wavelength (Center Frequency) Setting
Setting with the START WL/STOP WL or START FREQ/STOP FREQ Soft Key
Press CENTER. The soft key menu for center wavelength or center frequency
1.
settings appears.
Setting the Start Wavelength or Start Frequency
Press the START WL soft key for start wavelength or the START FREQ soft
2.
key for start frequency. The start wavelength or start frequency setting screen is
displayed.
Enter a start wavelength or start frequency using the rotary knob, arrow keys, or
3.
numeric key pad.
Press nm/ENTER.
4.
Setting the Stop Wavelength or Stop Frequency
Press the STOP WL soft key for stop wavelength or the STOP FREQ soft key
5.
for stop frequency. The stop wavelength or stop frequency setting screen is
displayed.
Enter a stop wavelength or stop frequency using the rotary knob, arrow keys, or
6.
numeric key pad.
Press nm/ENTER.
7.
Note
• It is not necessary to press nm/ENTER when using the rotary knob or arrow keys.
• The set value is applied to the measurement conditions area.
• When a setting is changed,
• If a value outside the setting range is entered, the nearest permitted value is set.
For instructions on switching the wavelength and frequency displays, see section 5.2.
appears in the measurement conditions area.
5-16
IM AQ6370D-01EN
Page 86

1
2
3
4
Setting by Using the One-Action Key
Setting THRESH 3dB center to center
You can set the center wavelength or center frequency by pressing the one-action key
one time in the soft key menu that appears when you press CENTER.
Press CENTER.
1.
For the center wavelength setting, when using peak wavelength or peak
2.
frequency, press the PEAK→CENTER soft key. For THRESH 3dB center
wavelength or center frequency, press the MEAN WL→CENTER soft key. When
using the currently displayed ZOOM scale, press the VIEW→MEAS soft key. The
specified center wavelength or center frequency is displayed, and the displayed
waveform is redrawn according to the changed center wavelength.
The peak wavelength or peak frequency of the waveform measured every sweep
can be set automatically to the center wavelength or center frequency.
Continuing on from step 1, press the AUTO CENTER OFF/ON soft key to select
3.
ON.
Setting peak to center
5.5 Center Wavelength (Center Frequency) Setting
5
Measurement
Also, you can set the wavelength of the moving marker placed on the measured
waveform as the center wavelength or center frequency.
Press MARKER.
1.
With the moving marker displayed, press the MARKER→CENTER soft key. The
2.
Automatic setting
Using zoom scale
specified center wavelength or center frequency is displayed, and the displayed
waveform is redrawn according to the changed center wavelength or center
frequency.
For details on displaying moving markers, see the explanation in section 6.8.
IM AQ6370D-01EN
5-17
Page 87

5.5 Center Wavelength (Center Frequency) Setting
Explanation
Center Wavelength
The setting range is 600.000 to 1700.000 nm.
If you press the COARSE key you can use the rotary knob or arrow keys to change the
numerical value in 1 nm steps. The value changes in 0.1 nm steps if you do not press the
COARSE key.
Start Wavelength
The setting range is 50,000 to 1700.000 nm.
Stop Wavelength
The setting range is 600.000 to 2250.000 nm.
Note
• When the start or stop wavelength is set, one wavelength becomes fixed, and this changes
the value of the sweep width. In addition, the center wavelength value is also changed at the
same time.
• Changing the center wavelength does not change the sweep width.
AUTO CENTER OFF/ON
This key sets whether the PEAK→CENTER soft key functions for each sweep.
When this key is set to ON, the peak is searched in the active trace waveform and set
as the center wavelength automatically for each sweep. The active trace must be set to
WRITE. When ON is selected,
video.
at the bottom of the screen is displayed in reverse
One-Action Keys
This is the general name for a key that uses data from the active trace waveform (the
currently displayed waveform) to set measurement conditions.
Setting conditions requires that a waveform is displayed for the active trace.
PEAK →CENTER
Sets the wavelength of the peak value to the center wavelength.
After execution, the center wavelength set in the center wavelength setting screen is
displayed. The center frequency can be changed after the setting is made initially.
MEAN WL→CENTER
Sets the average of two wavelengths falling below the threshold value (3 dB) from the
waveform peak of the active trace to the center wavelength. The center wavelength can
be changed after the setting is made initially.
VIEW→MEAS
This key is used to set the currently set ZOOM scale (ZOOM CENTER, ZOOM SPAN,
ZOOM START, ZOOM STOP) as the measurement scale (CENTER, START, STOP,
SPAN).
When you press this key, the current waveform display scale is set as the measurement
scale for the next sweep.
5-18
IM AQ6370D-01EN
Page 88

1
2
3
4
Center Frequency
The setting range is 176.5000 to 500.0000 THz.
If you press the COARSE key you can use the rotary knob or arrow keys to change the
numerical value in 0.1 THz steps. The value changes in 0.01 THz steps if you do not
press the COARSE key.
Start Frequency
The setting range is 11.5000 to 500.0000 THz.
Stop Frequency
The setting range is 176.5000 to 665.0000 THz.
Note
• When the start or stop frequency is set, one frequency becomes fixed, and this changes
the value of the sweep width. In addition, the center frequency value is also changed at the
same time.
• Changing the center frequency does not change the sweep width.
AUTO CENTER OFF/ON
This key sets whether the PEAK→CENTER soft key functions for each sweep.
When this key is set to ON, the peak is searched in the active trace waveform and set
as the center frequency automatically for each sweep.The active trace must be set to
WRITE. When ON is selected,
video.
5.5 Center Wavelength (Center Frequency) Setting
5
Measurement
at the bottom of the screen is displayed in reverse
One-Action Keys
You can set the center frequency with the one-action key in the same manner as for the
wavelength.
PEAK →CENTER
Sets the frequency of the waveform peak value of the active trace to the center
frequency. After execution, the center frequency set in the center frequency setting
screen is displayed. The center frequency can be changed after the setting is made
initially.
MEAN WL→CENTER
Sets the average of two frequencies falling below the threshold value (3 dB) from the
waveform peak of the active trace to the center frequency. The center frequency can be
changed after the setting is made initially.
VIEW→MEAS
This key is used to set the currently set ZOOM scale (ZOOM CENTER, ZOOM SPAN,
ZOOM START, ZOOM STOP) as the measurement scale (CENTER, START, STOP,
SPAN). When you press this key, the current waveform display scale is set as the
measurement scale for the next sweep.
IM AQ6370D-01EN
5-19
Page 89

5.6 Sweep Width Settings
Procedure
The following are three ways of setting the sweep width.
• Press the SPAN WL or SPAN FREQ soft key.
• Press the START WL/STOP WL or START FREQ/STOP FREQ soft key.
• Use the one-action key (soft key).
The following explains these procedures.
Setting by Pressing the SPAN WL or SPAN FREQ Soft Key
Press SPAN. The soft key menu for sweep width settings appears along with the
1.
sweep width setting screen.
Press SPAN WL for wavelength measurement or SPAN FREQ for frequency
2.
measurement.
Enter a sweep width using the rotary knob, arrow keys, or numeric key pad.
3.
Press nm/ENTER.
4.
Note
• It is not necessary to press nm/ENTER when using the rotary knob or arrow keys.
• The set value is applied to the measurement conditions area.
• When a setting is changed,
• If a value outside the setting range is entered, the nearest permitted value is set.
For instructions on switching the wavelength and frequency displays, see section 5.2.
appears in the measurement conditions area.
5-20
IM AQ6370D-01EN
Page 90

1
2
3
4
Setting with the START WL/STOP WL or START FREQ/STOP FREQ Soft Key
Press SPAN. The soft key menu for sweep width settings appears.
1.
Setting the Start Wavelength or Start Frequency
Press the START WL soft key for start wavelength or the START FREQ soft
2.
Enter a start wavelength or start frequency using the rotary knob, arrow keys, or
3.
Press nm/ENTER.
4.
5.6 Sweep Width Settings
key for start frequency. The start wavelength or start frequency setting screen is
displayed.
numeric key pad.
5
Measurement
Setting the Stop Wavelength or Stop Frequency
Press the STOP WL soft key for stop wavelength or the STOP FREQ soft key
5.
for stop frequency. The stop wavelength or stop frequency setting screen is
displayed.
Enter a stop wavelength or stop frequency using the rotary knob, arrow keys, or
6.
numeric key pad.
Press nm/ENTER.
7.
Note
• It is not necessary to press nm/ENTER when using the rotary knob or arrow keys.
• The set value is applied to the measurement conditions area.
• When a setting is changed,
• If a value outside the setting range is entered, the nearest permitted value is set.
For instructions on switching the wavelength and frequency displays, see section 5.2.
appears in the measurement conditions area.
IM AQ6370D-01EN
5-21
Page 91

5.6 Sweep Width Settings
Setting by Using the One-Action Key
Setting the Sweep Width from the Measured Waveform
Sets spacing between line markers 1 and 2 for sweep width.
Press SPAN.
1.
Press the Δλ→ SPAN soft key. Sets the span as six times the RMS 20 dB width
2.
of the active trace measurement waveform.
Press MARKER.
1.
Press the MORE 1/3 soft key.
2.
With the line markers 1 and 2 displayed, press the MK L1-L2→SPAN soft key.
3.
Sets spacing between line markers 1 and 2 for sweep width.
For details on displaying line markers, see the explanation in section 6.8.
5-22
Note
• If only one of the line markers is displayed, for L1, the wavelength on the right edge of the
screen is set to the measurement stop wavelength. For L2, the wavelength on the left edge
of the screen is set to the measurement start wavelength.
• The MKR L1-L2 ->SPAN soft key cannot be used under the following conditions.
• When both L1 and L2 are OFF.
• When both SPLIT screens are on HOLD.
• When the span of the active trace is 0 nm.
IM AQ6370D-01EN
Page 92

1
2
3
4
Explanation
Wavelength Sweep Width
Start Wavelength
Stop Wavelength
5.6 Sweep Width Settings
The available setting range is 0, and 0.1 to 1100.0 nm. If you press the COARSE key you
can use the rotary knob or arrow keys to change the numerical value in 1-2-5 steps. The
value changes in 1 nm steps if you do not press the COARSE key.
The setting range is 50,000 to 1700.000 nm. The value changes in 1 nm steps if you
press the COARSE key. If you do not press it, the value changes in 0.1 nm steps.
The setting range is 600.000 to 2250.000 nm. The value changes in 1 nm steps if you
press the COARSE key. If you do not press it, the value changes in 0.1 nm steps.
Note
• Setting the sweep width changes the start wavelength and stop wavelength. The center
wavelength/frequency does not change.
• Changing the center wavelength changes the start wavelength and stop wavelength. The
sweep width does not change. When the start or stop wavelength is set, one wavelength
becomes fixed, and this changes the value of the sweep width. In addition, the center
wavelength value is also changed at the same time.
One-Action Keys
This is the general name for a key that uses data from the active trace waveform (the
currently displayed waveform) to set measurement conditions.
Setting conditions requires that a waveform is displayed for the active trace.
Δλ→SPAN
Sets the sweep width as six times the spectrum width (threshold 20 dB ) of the active
trace measurement waveform with the RMS method.
MKR L1-L2 →SPAN
Sets spacing between line markers 1 and 2 for sweep width.
The setting range is 0.1 to 1100 nm (in 0.1 nm steps).
Frequency Sweep Width
The allowed settings are 0 and the range of 0.01 to 330.000 THz.
If you press the COARSE key you can use the rotary knob or arrow keys to change the
numerical value in 1-2-5 steps. The value changes in 0.1 THz steps if you do not press
the COARSE key.
5
Measurement
IM AQ6370D-01EN
Start Frequency
The setting range is 11.5000 to 500,000 THz.
The value changes in 0.1 THz steps if you press the COARSE key. If you do not press it,
the value changes in 0.01 THz steps.
Stop Frequency
The setting range is 176.5000 to 665.0000 THz.
The value changes in 0.1 THz steps if you press the COARSE key. If you do not press it,
the value changes in 0.01 THz steps.
5-23
Page 93

5.7 Wavelength (Frequency) Resolution Settings
Procedure
Press SETUP. The soft key menu for sweep condition settings appears.
1.
Press the RESOLUTION soft key. The resolutions that can be set appear in the
2.
soft key menu.
Press the soft key corresponding to the desired resolution. The screen returns
3.
to the previous stage, and the value specified by the RESOLUTION soft key is
displayed.
Note
• When entering an arbitrary value using the rotary knob, arrow keys, or numeric key pad in
the resolution screen that appears when you press the RESOLUTION soft key, the soft key
value that is closest to the entered value is set.
• The instrument displays if the settings for span, the number of sampling points, and
Corrective Action When “UNCAL” Is Displayed
Perform the following steps.
• Decrease the span.
• Increase the number of samples.
• Lower the resolution (increase the value).
• Select AUTO with the SAMPLING POINT soft key under SETUP.
The “UNCAL” display disappears if the span, number of samples, and the resolution
settings are appropriate.
5-24
IM AQ6370D-01EN
Page 94

1
2
3
4
Correcting the Resolution
Press SETUP. The soft key menu for sweep condition settings appears.
1.
Press the MORE 1/2 soft key.
2.
Press the RESOLN CORRECT OFF ON soft key. Each time you press the soft
3.
Note
• Since the wavelength resolution function is set according to the monochromator slit width,
• If the resolution correction function is turned ON, measured data is processed by the
• Turn OFF the resolution correction function when performing measurement for which the
5.7 Wavelength (Frequency) Resolution Settings
key the setting toggles between ON and OFF.
5
Measurement
the setting resolution and actual resolution may not match. For this instrument, if the
resolution is set to 0.1 nm, the actual resolution will be 0.09 nm for a 1450 nm wavelength,
and 0.07 nm for a 1550 nm wavelength.
software so that it matches the set resolution.
In the following cases, the resolution correction function has no effect even when turned ON.
• When the set resolution is 0.02 nm
• When the measured wavelength is 1400 nm or less
level accuracy is guaranteed.
When the resolution correction function is turned ON, set the correction mode (in R02.01
or later versions).
IM AQ6370D-01EN
Press SYSTEM. The soft key menu regarding the system appears.
1.
Press the MORE soft key repeatedly until the MORE 4/4 menu is displayed.
2.
Press the RES CORRECT MODE1/2 soft key. Each time you press the soft key
3.
the setting toggles between MODE1 and MODE2.
5-25
Page 95

Setting resolution
Span
1
Setting resolution
Span
1
5.7 Wavelength (Frequency) Resolution Settings
Explanation
Conditions under Which “UNCAL” Is Displayed
“UNCAL” is displayed when a single or repeat sweep is started based on the following
relationship between span, setting resolution, and set number of samples:
When the resolution correction function is turned OFF
When the resolution correction function is turned ON
Waveforms with Resolutions of 0.020 nm
When the resolution is set to 0.020 nm for measurements of a light source such as a
DFB laser in which with the spectral width is narrower than the instrument’s resolution,
very small spikes may occur at the skirts of the waveform. This type of spike occurs due
to characteristics of the optical block and is not an indication of any problem. Even if such
spikes occur, satisfactory performance in terms of resolution, dynamic range, and the like
can be ensured. These spikes will disappear if the resolution is set to a coarser value.
x 5 > Set number of samples –
x 10 > Set number of samples –
5-26
Ripples in the 1350 to 1450 nm Area
Water (OH-) ions present in the monochromator absorb light in the 1350 to 1450 nm
area, resulting in ripples in the measurement waveform. Either set a coarser resolution or
use the monochromator in a lower-humidity environment to reduce the amount of ripples.
Correction Mode (in R02.01 or Later Firmware Versions)
There are two correction modes: MODE1 and MODE2.
MODE1: It is the resolution correction function in firmware versions earlier than
R02.01.
MODE2: It provides the improved close dynamic range over MODE1. It is effective
when the resolution is 0.1 nm or wider.
IM AQ6370D-01EN
Page 96

1
2
3
4
5.8 Sampling Point/Interval Settings
Sets sampling interval
Procedure
The following are three ways in which the number of samples can be entered.
• Setting the number of samples directly
• Setting by the sampling interval
• Automatically setting the optimum number of samples or the sampling interval
according to the sweep width (span) and resolution setting
Press SETUP. The soft key menu for sweep condition settings appears.
1.
Press the SAMPLING POINT or SAMPLING INTERVAL soft key to set the
2.
sampling point or sampling interval, respectively. To automatically set the sampling
points and interval according to the span and wavelength (frequency) resolution
settings, press SAMPLING POINT AUTO. The sampling points or interval setting
screen is displayed.
If you pressed SAMPLING POINT AUTO, the sampling points and interval are set
automatically.
Enter a number of samples or interval using the rotary knob, arrow keys, or
3.
numeric key pad.
Press ENTER. The sampling points or interval are set.
4.
5
Measurement
Automatic setting
Sets sampling points
Note
• The instrument displays if the settings for span, the number of sampling points, and
the resolution are inappropriate.
• See section 5.7 for the corrective actions when
is displayed.
IM AQ6370D-01EN
5-27
Page 97

Interval
Span
Number of sampling points =
+ 1
5.8 Sampling Point/Interval Settings
Explanation
Sampling points (the number of points measured in a single sweep)
Sampling points are the number of points measured within the range of the specified
span.
The setting range is 101 to 50001.
Relationship between Sampling Points, Interval, and Span
The relationship between the number of samples, the interval, and the span is as follows.
Given the same span, the sampling points are automatically determined when the
interval is known, and viceversa.
For information about the allowed setting for the span, see the explanation in section 5.6,
“Sweep Width Setting.”
Note
• Increasing the number of sampling points or decreasing the sampling interval reduces the
sweeping speed.
• Settings that would cause the number of samples in the sweep range to be extremely few
cannot be entered.
• If the setting for the number of samples is changed, the sampling interval value also
changes accordingly.
Relationship with Wavelength (Frequency) Resolution
If settings are entered such that the sampling interval determined by the settings for the
span and number of samples is extremely long relative to the wavelength (frequency)
resolution, data may be lost. Enter settings that are appropriate for the resolution.
5-28
IM AQ6370D-01EN
Page 98

1
2
3
4
5.9 Sensitivity Settings
Procedure
Press SETUP. The soft key menu for sweep condition settings appears.
1.
Press the SENS/MODE soft key. Seven sensitivity choices appear in the soft key
2.
menu.
Press the soft key corresponding to the desired choice. The screen returns to the
3.
previous stage, and the value specified by the SENS/MODE soft key is displayed.
5
Measurement
CHOP MODE Settings
Press the SENS/MODE soft key.
2.
Press the CHOP MODE soft key.
3.
Press the SWITCH soft key.
4.
To turn CHOP MODE OFF, press the OFF soft key.
5.
Note
If you set the CHOP MODE to SWITCH, the corresponding sensitivity soft key display will
change to MID/SW or HIGH1/SW to HIGH3/SW.
IM AQ6370D-01EN
5-29
Page 99

Waveform with CHOP MODE OFF CHOP MODE set to SWITCH
5.9 Sensitivity Settings
Explanation
CHOP MODE
This mode activates the internal chopper of the monochromator.
Stray light specific to the monochromator is reduced by turning the chopper.
When CHOP MODE is set to SWITCH, measurements of better S/N can be made. You
can set the CHOP MODE to SWITCH if the sensitivity setting is HIGH1 to HIGH3 or MID.
CHOP MODE Function List
CHOP
MODE
OFF
SWITCH
Measurement according to
the stray light.
Stray light suppression ratio:
40 dB or more
Two sweeps per
measurement are performed.
The rst sweep measures the
stray light component, and
high dynamic measurement is
possible through subtraction.
Function Merit Defect
Measurement time
is rapid even for
high sensitivity
measurements.
Short-duration
measurement can be
taken with stray light
removed.
Since the stray light
is also measured, the
low level component
is not accurate if the
light source is of high
power.
If the measurement
duration is long, it is
inuenced by temporal
changes in the
measured light.
Stray Light from the Monochromator
Stray light suppression ratio:
60 dB or more
The instrument has a newly designed, high-performance monochromator. Depending
on the measurement conditions, stray light at a level 30 to 50 dB below the original
spectrum, as well as other stray light specific to the monochromator may occur in
wavelength areas 100 to 200 nm from the peak wavelength. If this stray light is likely to
have a severe impact on measurements, the sensitivity can be set to MID or HIGH 1 to 3
and CHOP MODE can be set to SWITCH in order to reduce the effects of the stray light.
5-30
IM AQ6370D-01EN
Page 100

1
2
3
4
5.10 Sweep Speed Settings
Procedure
Press SETUP. The soft key menu for sweep condition settings appears.
1.
Press the SWEEP SPEED soft key. Each time you press the soft key, the setting
2.
toggles between 1x and 2x.
Explanation
SWEEP SPEED
Sets the sweep speed.
1x This is the instrument's standard sweep speed. To meet the instrument's
2x Select this value to set the sweep speed to approximately twice the speed of
Measurements using this value have the following characteristics.
5
Measurement
specifications, set the sweep speed to this value. With the sweep speed set to
this value, the instrument can measure light sources ranging from line spectrum
(such as the DFB-LD) to broadband wavelength (such as LEDs) light sources.
the 1x value. Select this value when you are measuring light sources that have
comparatively gentle spectrum shape level changes, such as LED light sources.
• If you select this value when “UNCAL” is displayed, for waveforms that have
sharp spectrum shape changes, such as those produced by the DFB-LD,
the level and wavelength measurement accuracies may be lower than those
when you select 1x. First check the measurement spectrum, and then select
this value if appropriate.
• The noise level is approximately 2 dB higher than that when you select 1x.
IM AQ6370D-01EN
Note
When you set the sweep speed to 2x, is displayed in the measurement conditions
area.
5-31
 Loading...