

Page 1
[ CARE AND USE MANUAL ]
XBRIDGE XP 2.5 µm COLUMNS
CONTENTS
I. INTRODUCTION
II. GETTING STARTED
a. Column Connection
b. Column Installation
c. Minimizing Band Spread Volume
d. Measuring Band Spread Volume
e. Measuring System Dwell Volume
f. Column Equilibration
g. eCord Installation
h. Initial Column Efficiency Determination
i. VanGuard Pre-Columns
III. COLUMN USE
a. Sample Preparation
b. pH Range
c. Solvents
d. Pressure
e. Temperature
I. INTRODUCTION
Thank you for choosing a Waters XBridge® Ethylene Bridged Hybrid
[BEH] eXtended Performance [XP] 2.5 µm Column. The manufacture
of XBridge XP 2.5 µm Columns begins with ultrapure reagents and
are manufactured in a cGMP, ISO 9001 certified facility to
control the chemical composition and purity of the final product.
Well-controlled manufacturing processes result in industry-leading
batch-to-batch reproducibility. Every column is individually tested.
A Performance Chromatogram and Certificate of Batch Analysis are
provided on the eCord™ Intelligent Chip.
XP 2.5 µm Columns are based on the same base particle technology
and bonded-phase chemistry as 1.7 µm ACQUITY UPLC® Columns as
well as XBridge 3.5, 5 and 10 µm HPLC Columns, thus enabling
seamless transferability between HPLC, UHPLC and UPLC® platforms.
XBridge XP 2.5 µmColumns will exhibit maximum chromatographic
performance when used on a member of the ACQUITY UPLC
System family.
IV. COLUMN CLEANING, REGENERATION AND STORAGE
a. Cleaning and Regeneration
b. Storage after Reversed-Phase Use
c. Storage after HILIC Use
V. eCORD INTELLIGENT CHIP TECHNOLOGY
a. Introduction
b. Installation
c. Manufacturing
d. Column Use
VI. ADDITIONAL INFORMATION
a. Tips for Maximizing XBridge XP 2.5 µm Column Lifetime
b. Troubleshooting Questions
c. Recommended Flow Rates and Anticipated Backpressures for
Reversed-Phase XBridge XP 2.5 µm Columns
d. Getting Started with XBridge HILIC XP 2.5 µm Columns
e. Getting Started with XBridge Amide XP 2.5 µm Columns
XBridge XP 2.5 µm Columns 1
Page 2

[ CARE AND USE MANUAL ]
II. GET TING STARTED
Each XBridge XP 2.5 µm Column comes with a Certificate of
Analysis and a Performance Test Chromatogram embedded within the
eCord intelligent chip. The Certificate of Analysis is specific to each
batch of packing material contained in the XBridge XP 2.5 µm
Column and includes the gel batch number, analysis of unbonded
particles, analysis of bonded particles and chromatographic results
and conditions. The Performance Test Chromatogram is specific to
each individual column and contains such information as: gel batch
number, column serial number, USP plate count, USP tailing factor,
retention factor and chromatographic test conditions. T hese data
should be recorded and stored for future reference or can be accessed
via the ACQUITY UPLC console.
a. Column Connection
XP 2.5 µm Columns are designed to operate on any HPLC, UHPLC or
UPLC System. Due to the absence of an industry standard, please be
aware that the type of fittings and connections on each system will
vary by manufacturer and should be mated specifically to a column
when it is installed.
The chromatographic performance can be negatively impacted, or leak-
ing can occur, if the style of the column endfitting does not properly
match that of the compression screw/ferrule tubing depth setting.
c. Minimizing Band Spread Volume
Band spreading is a measurement of the system dispersion that
impacts the chromatographic performance. Internal tubing diameter
and fluidic connections can significantly impact system band spread-
ing and chromatographic performance. Larger tubing diameters cause
excessive peak broadening and reduced sensitivity (Figure 1).
0.005 inches
0.020 inches
0.040 inches
Diluted/Distorted Sample Band
Figure 1: Impact of tubing diameter on band spread.
d. Measuring Band Spread Volume
Note: This test should be performed on an LC system equipped with a UV detector.
1. Disconnect the column from the system and replace with a zero dead
volume union.
2. Set the flow rate to 1 mL/min.
b. Column Installation
Note: The flow rates given in the procedure below are described for a 2.1 mm ID
column. Scale the flow rate according to the flow rate and pressure guidelines
described in Section VI (Additional Information).
1. Purge the pumping system of any buffer-containing mobile-phases and
connect the inlet of the column.
2. Flush the column with 100% organic mobile-phase (methanol or
acetonitrile) by setting the pump flow rate to 0.1 mL/min and increase
the flow rate to 0.5 mL/min over 5 minutes.
3. When the mobile-phase is flowing freely from the column outlet, stop
the flow and attach the column outlet to the detector. This prevents
air entering the detection system and provides a more rapid baseline
equilibration.
4. Gradually increase the flow rate as described in step 2.
5. Monitor until a steady backpressure and baseline have been achieved.
XBridge XP 2.5 µm Columns 2
3. Use a test mixture (dissolved in the mobile-phase conditions) that
delivers a maximum peak height of 0.5 – 1.0 AU (System Start Up
Test Mixture can be used, Part No. WAT034544).
4. Inject 2 – 5 µL of this solution.
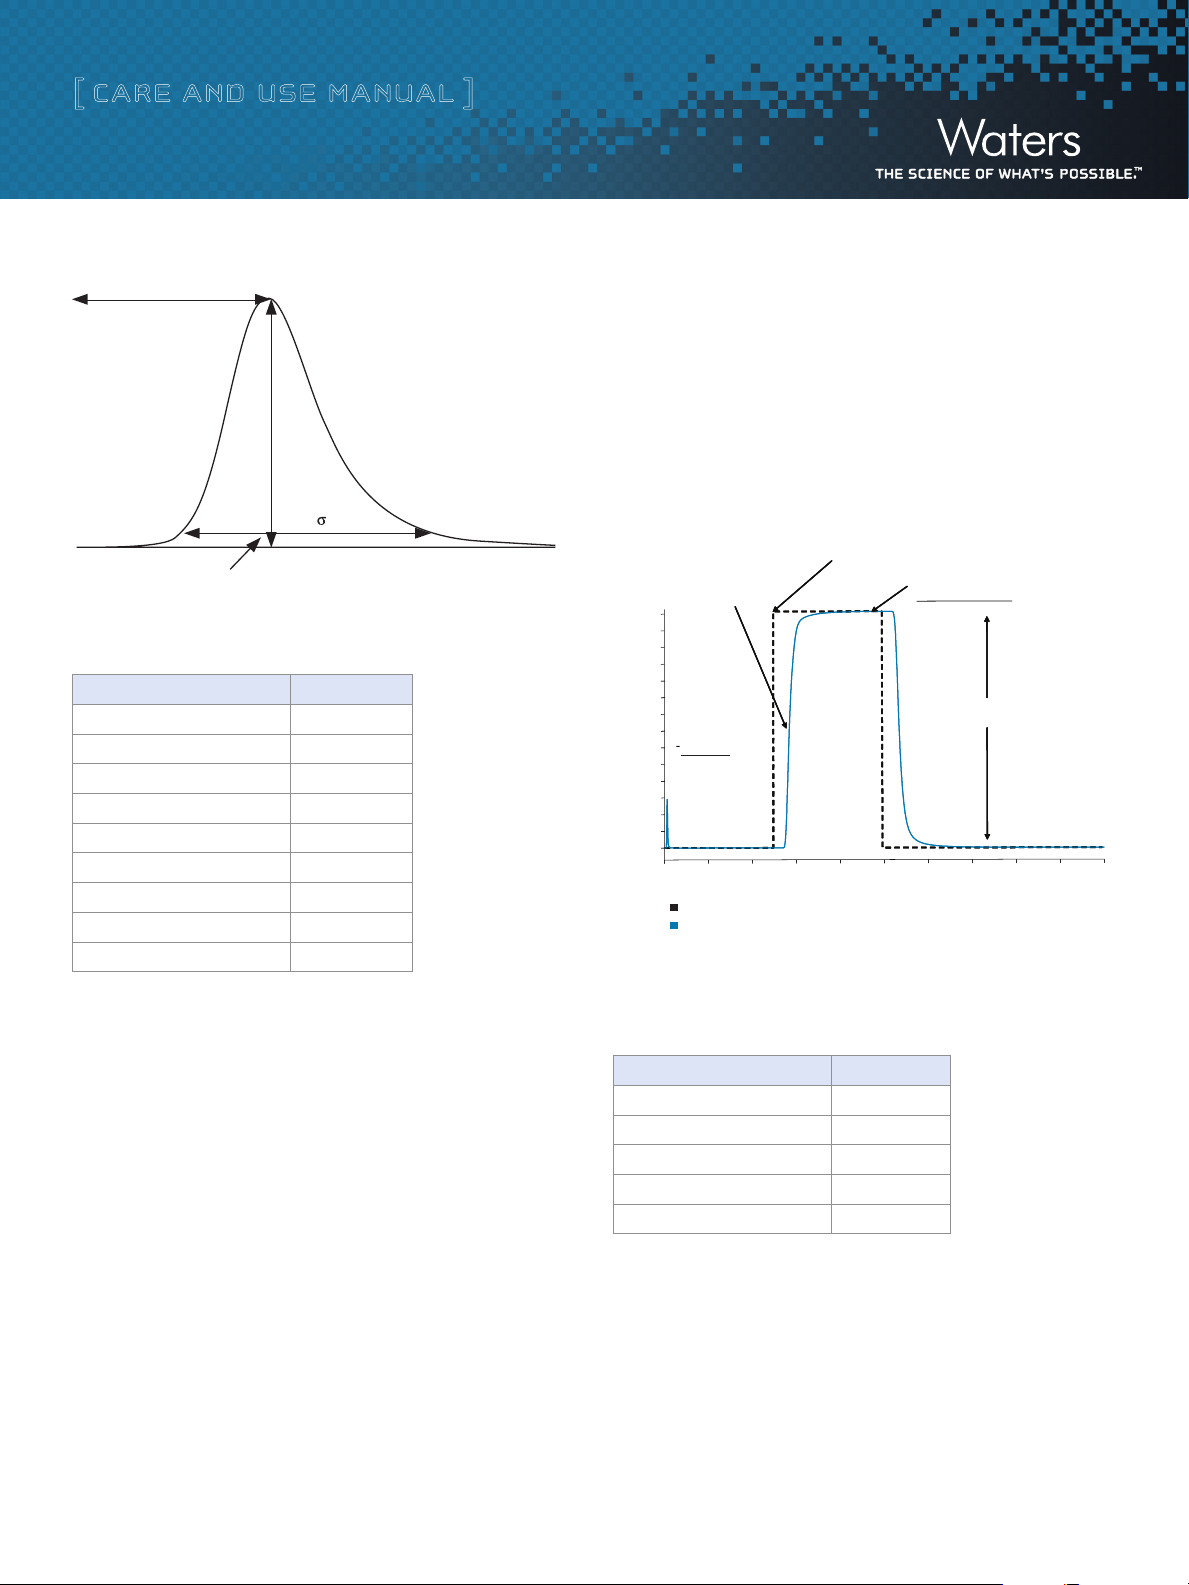
5. Using the 5-Sigma method, measure the peak width at 4.4% of peak
height:
Band Spreading (µL) = Peak Width (min) x Flow Rate (µL /min)
(For example, if peak width = 0.1 min and flow rate = 1000 µL/min,
band spread = 100 µL)
Page 3
[ CARE AND USE MANUAL ]
Programmed time = 5 minutes
System Volume
5
4.4 %h
Figure 2: Determination of system band spread volume using 5-Sigma Method.
Table 1: Expected System Band Spread Volumes
System Band Spread
Alliance 2695 HPLC 29 µL
Vendor A HPLC 41 µL
Vendor B UHPLC (600 bar) 28 µL
Vendor C UHPLC 21 µL
Vendor D UHPLC 17 µL
ACQUITY UPLC 12 µL
ACQUITY UPLC H-Class 9 µL
ACQUITY UPLC I-Class (FTN) 7.5 µL
ACQUITY UPLC I-Class (FL) 5.5 µL
e. Measuring System Dwell Volume
Dwell volume is different than system band spreading. System dwell
volume is a measurement of the volume it takes for the initial gradi-
ent conditions to reach the head of the column. This calculation is
particularly useful when it is necessary to transfer a method between
different LC systems.
1. Disconnect the column from the system and replace with a zero
dead volume union.
6. At 5 minutes, program a step to 100% B, and collect data for an
additional 5 minutes.
7. Measure absorbance difference between 100% A and 100% B.
8. Measure time at 5% of that absorbance difference.
9. Calculate time difference between start of step and 50% point.
10. Multiply time difference by flow rate to calculate system volume.
50% Absorbance = 0.35852 AU
Time = 5.6953 minutes
0.70
0.65
0.60
0.55
0.50
0.45
0.40
5.69
0.35
0.30
5.00
0.25
0.69 min
0.20
0.15
0.10
0.05
0.00
0.00 2.00
= Programmed Gradient
= Actual Gradient
4.00
6.00 8.00
System Volume
0.69 min x 1.5 mL/min = 1.04 mL
Figure 3: Measuring system band spread volume.
Table 2: Expected System Dwell Volumes
100% Asymptotic
Total absorbance = 0.7164 AU
10.00
12.00 14.00
16.00
18.00 20.00
System Dwell Volume
Alliance 2695 HPLC 900 µL
ACQUITY UPLC 120 µL
ACQUITY UPLC H-Class 350 µL
ACQUITY UPLC I-Class (FTN) 100 µL
ACQUITY UPLC I-Class (FL) 95 µL
2. Use acetonitrile as mobile-phase A, and acetonitrile with
0.05 mg/mL uracil as mobile-phase B.
3. Monitor UV at 254 nm.
4. Use the flow rate in the original method and the intended flow
rate on the target instrument.
5. Collect 100% A baseline for 5 minutes.
XBridge XP 2.5 µm Columns 3
f. Column Equilibration
XBridge XP 2.5 µm Columns are shipped in 100% acetonitrile. It is
important to ensure mobile-phase compatibility before changing to a
different mobile-phase system. Equilibrate the column with a minimum
of 10 column volumes of the mobile-phase to be used (refer to Table
3 for a list of column volumes). The column may be considered fully
equilibrated once a constant backpressure is achieved.
Page 4
[ CARE AND USE MANUAL ]
Table 3: Column Volumes (mL)
Column Length
(mm)
30 0.10 0.21 0.50
50 0.17 0.35 0.83
75 0.26 0.53 1.25
100 0.35 0.71 1.66
2.1 mm 3.0 mm 4.6 mm
Internal Diameter
To avoid precipitating mobile-phase buffers within the column or
system, flush the column with five column volumes of a water/organic
solvent mixture using the same, or lower, solvent content as in the
desired buffered mobile-phase (i.e., flush the column and system with
60% methanol in water prior to introducing 60% methanol/ 40%
buffer mobile-phase).
Note: If mobile-phase additives (i.e., ion-pairing reagents) are present in low
concentrations (<0.2% v/v), 100 to -200 column volumes may be required for
complete equilibration. In addition, mobile-phases that contain formate (i.e.,
ammonium formate, formic acid) may require extended equilibration times.
For XBridge HILIC XP 2.5 µm Columns, flush with 50 column volumes
of 50:50 acetonitrile:water with 10 mM final buffer concentration.
For XBridge Amide XP 2.5 µm Columns, flush with 50 column
volumes of 60:40 acetonitrile:water with 10 mM final buffer
concentration. Prior to the first injection, equilibrate with 20 column
volumes of initial mobile-phase conditions (refer to Table 3 for a
list of column volumes). See “Getting Started with XBridge HILIC
Columns” or “Getting Started with XBridge Amide Columns” sections
for additional information.
a. An analyte test mixture that is commonly used in your laboratory.
b. An analyte mixture as found on the “Performance Test
Chromatogram” which can be accessed via the eCord.
Note: If [b] is performed, the isocratic efficiencies measured in your laboratory
may be less than those given on the Waters Performance Test Chromatogram.
This is normal and expected. The Waters isocratic column testing systems have
been modified in order to achieve extremely low system dispersion. This presents
a more challenging test of how well the column was packed. This also guarantees
the highest quality packed column. These special testing systems have been
modified to such an extent that they are not commercially viable and have
limited method flexibility other than isocratic column testing.
2. Determine the number of theoretical plates (N) and use this value for
periodic comparisons.
3. Repeat the test periodically to track column performance over time.
Slight variations may be obtained on different LC systems due to the
quality of the connections, operating environment, system electronics,
reagent quality, column condition and operator technique.
i. VanGuard Pre-Columns
VanGuard™ Pre-Columns are 2.1 mm ID x 5 mm length guard column
devices designed specifically to protect an analytical column while
minimizing the negative dispersion impact of utilizing such a device.
VanGuard Pre-Columns are packed with the same stationary
phases as the XP 2.5 µm column offering. VanGuard Pre-Columns
are designed to be directly attached to the inlet of a eX tended
Performance 2.5 µm Column.
g. eCord Installation
eCord Technology represents a significant advancement in column
usage tracking management which can be realized if the column is
installed on an ACQUITY UPLC System. T he eCord device can be
read by connecting the yellow fob to the reader/writer located on
the right-hand side of the ACQUITY UPLC Column heater module.
Embedded information such as the column manufacturing QC data
and Certificates of Analysis may then be accessed via the ACQUITY
UPLC console.
h. Initial Column Efficiency Determination
1. Perform an efficiency test on the column before using it to track column
performance over time. This test may consist of:
XBridge XP 2.5 µm Columns 4
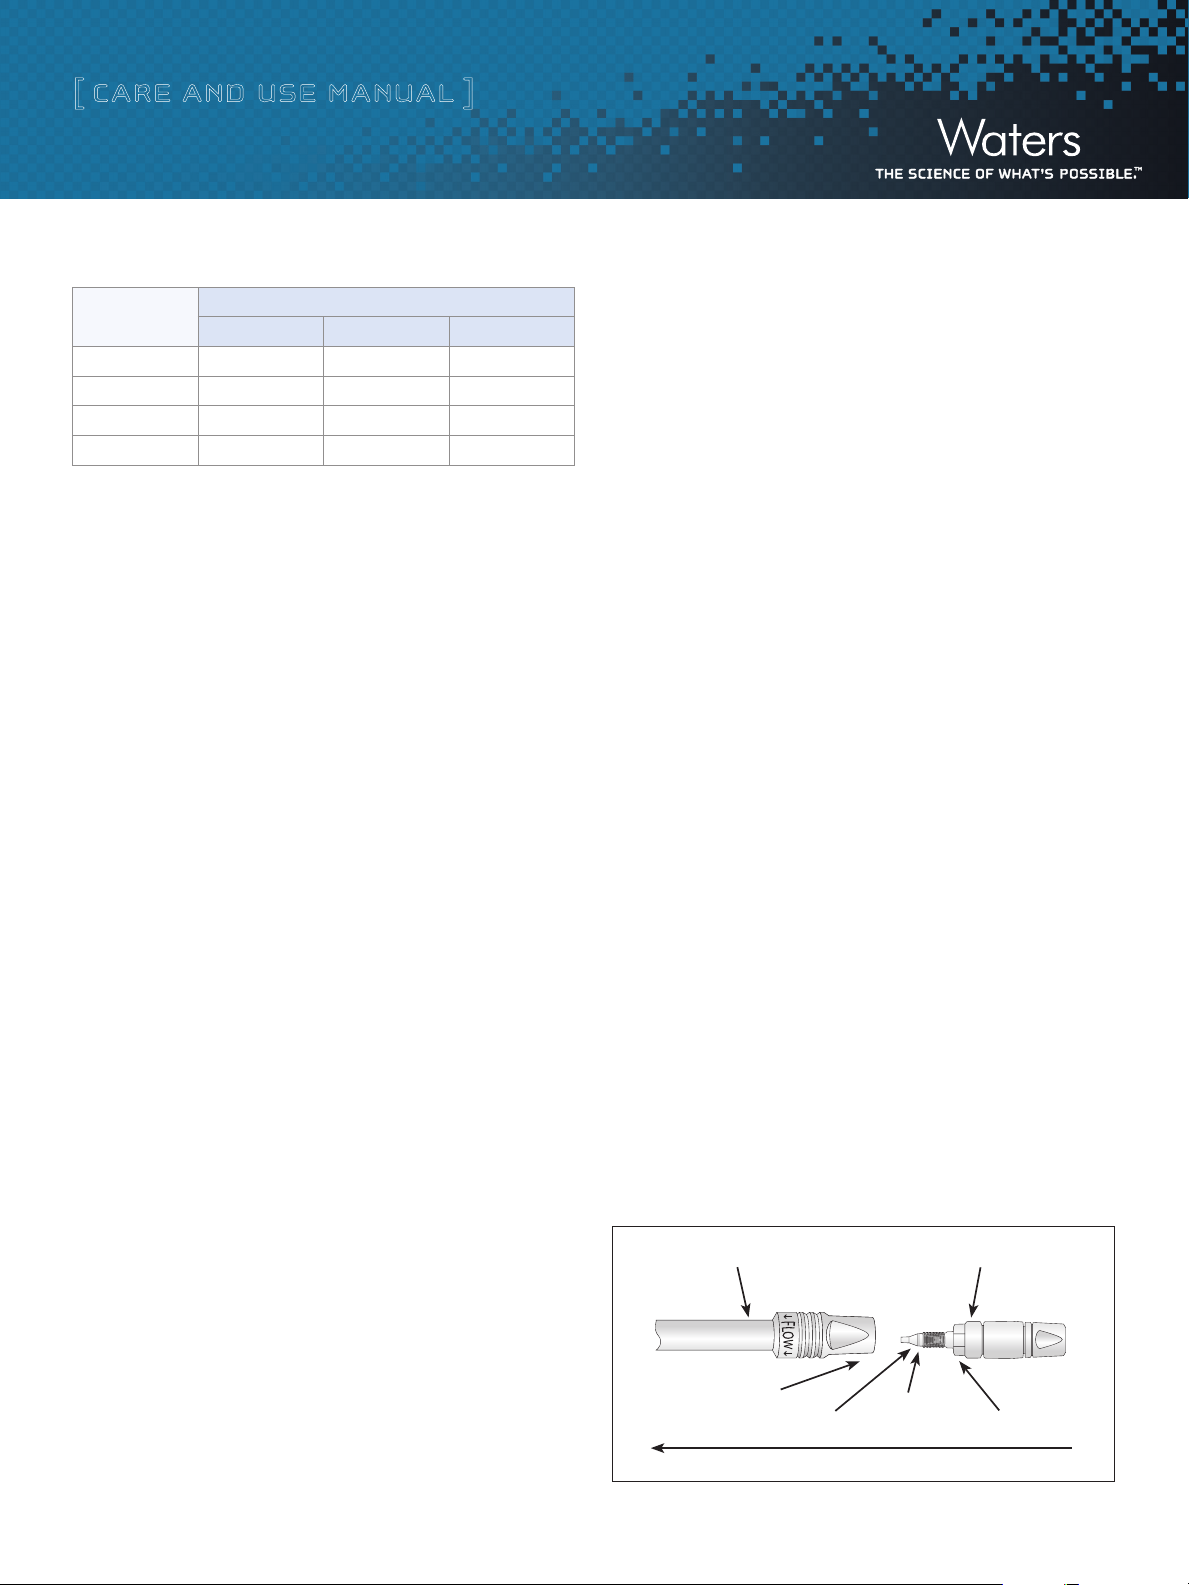
Note: VanGuard Pre-Columns are shipped with a collet and ferrule that are NOT
pre-swaged. This enables the end user to mate the VanGuard Pre-Column to a
specific XP 2.5 µm Column and ensures void-free and leak-free connections.
Care must be taken when removing the O-ring that holds these two pieces on the
pre-column tubing.
XP 2.5 µm Column
Place wrench here
Ferrule
Flow
Figure 4: Installing a VanGuard Pre-Column.
Collet
VanGuard Pre-Column
Place wrench here
Page 5

[ CARE AND USE MANUAL ]
VanGuard Pre-Column Installation Instructions
1. Remove the VanGuard Pre-Column from its box and shipping tube and remove the plastic plug.
2. Orient the pre-column so that the male end is facing up and carefully remove the black O-ring that holds the collet and ferrule in place during shipment
(collet and ferrule are not permanently attached).
3. Orient the XP 2.5 µm Column perpendicular to the work surface so that the column inlet is on the bottom.
4. From below, insert the VanGuard Pre-Column into the column inlet; turn the assembled column and pre-column 180° so that the pre-column is now on top.
5. Tighten with two 5/16” wrenches placed onto the XP 2.5 µm Column flats and VanGuard Pre-Column hex nut (male end) as shown in Figure 4.
6. While keeping pressure on the VanGuard Pre-Column against the XP 2.5 µm Column, tighten turn to set the collet and ferrule.
7. Check that the ferrule is set by loosening the connection and inspecting the ferrule depth.
8. Reattach the pre-column to the XP 2.5 µm Column, apply flow and inspect for leaks.
III. COLUMN USE
To ensure the continued high performance of XBridge XP 2.5 µm Columns, follow these guidelines:
a. Sample Preparation
1. Sample impurities and/or particulates often contribute to column contamination. One option to avoid column contamination is to use Waters Oasis® or
Sep-Pak Solid-Phase Extraction (SPE) devices. To select the appropriate sorbent for a specific sample type, visit www.waters.com/sampleprep
2. It is preferable to prepare the sample in the initial mobile-phase conditions or a weaker solvent for the best peak shape and sensitivity.
3. If the sample is not prepared in the mobile-phase, ensure that the sample, solvent and mobile-phases are miscible in order to avoid sample and/or buffer
precipitation.
4. Filter sample with a 0.2 µm membrane to remove particulates. If the sample is dissolved in a solvent that contains an organic modifier (e.g., acetonitrile,
methanol, etc.) ensure that the membrane/filter material is compatible with the solvents in use. Alternatively, centrifuge the sample for 20 minutes at
8000 rpm, followed by the transfer of the supernatant to an appropriate vial could be considered.
b. pH Range
Table 4: Recommended pH Range
Chemistry pH Range
XBridge BEH C
XBridge BEH C
XBridge BEH Phenyl 1 - 12
XBridge BEH Shield RP18 2 - 11
XBridge BEH HILIC 1 - 9
XBridge BEH Amide 2 - 11
18
8
1 - 12
1 - 12
Column lifetime will vary depending on the combination of temperature, mobile-phase pH and
type of buffer/additive used. Table 5 lists the recommended buffers and additives for XBridge
XP 2.5 µm Columns.
Note: Working in combinations of extreme pH, temperature and pressure may result in reduced
column lifetime.
XBridge XP 2.5 µm Columns 5
Page 6

[ CARE AND USE MANUAL ]
Table 5. Buffer Recommendations for XBridge XP 2.5 µm Columns.
Additive/Buffer pKa Buffer Range
Volatility
(±1 pH unit)
TFA 0.3 - Volatile Yes
Acetic Acid 4.76 - Volatile Yes
Formic Acid 3.75 - Volatile Yes
Acetate (CH
COO-) 4.76 3.76 – 5.76 Volatile Yes
3
Formate (HCOO-) 3.75 2.75 – 4.75 Volatile Yes
Used for
Mass Spec
Comments
Ion pair additive, can suppress MS signal, used in
the 0.02-0.1% range.
Maximum buffering obtained when used with ammonium
acetate salt. Used in 0.1-1.0% range.
Maximum buffering obtained when used with ammonium
formate salt. Used in 0.1-1.0% range.
Used in the 1-10 mM range. Note that sodium or
potassium salts are not volatile.
Used in the 1-10 mM range. Note that sodium or
potassium salts are not volatile.
Phosphate 1 2.15 1.15 – 3.15 Non-volatile No Traditional low-pH buffer, good UV transparency.
Phosphate 2 7.2 6.20 – 8.20 Non-volatile No
Phosphate 3 12.3 11.3 - 13.3 Non-volatile No
Above pH 7, reduce temperature/concentration and use
a guard column to maximize lifetime.
Above pH 7, reduce temperature/concentration and use
a guard column to maximize lifetime.
4-Methylmorpholine ~8.4 7.4 – 9.4 Volatile Yes Generally used at 10 mM or less.
Ammonia (NH
+
) 9.2 8.2 – 10.2 Volatile Yes
4
Keep concentration below 10 mM and
temperatures below 30 ˚C.
Used in the 5-10 mM range (for MS work keep source
>150 ˚C ). Adjust pH with ammonium hydroxide or
acetic acid. Good buffering capacity at pH 10.
Note: use ammonium bicarbonate (NH
ammonium carbonate ((NH
HCO3), not
4
4)2CO3
).
Ammonium Bicarbonate
10.3 (HCO
9.2 (NH
-
)
3
+
)
4
8.2 – 11.3 Volatile Yes
Ammonium (Acetate) 9.2 8.2 – 10.2 Volatile Yes Used in the 1-10 mM range.
Ammonium (Formate) 9.2 8.2 – 10.2 Volatile Yes Used in the 1-10 mM range.
Borate 9.2 8.2 – 10.2 Non-volatile No
CAPSO 9.7 8.7 – 10.7 Non-volatile No
Glycine 2.4, 9.8 8.8 – 10.8 Nton-volatile No
Reduce temperature/concentration and use a guard
column to maximize lifetime.
Zwitterionic buffer, compatible with acetonitrile,
used in the 1-10 mM range. Low odor.
Zwitterionic buffer, can give longer lifetimes
than borate buffer.
1-Methylpiperidine 10.2 9.3 – 11.3 Volatile Yes Used in the 1-10 mM range.
CAPS 10.4 9.5 – 11.5 Non-volatile No
Triethylamine
(as acetate salt)
10.7 9.7 – 11.7 Volatile Yes
Zwitterionic buffer, compatible with acetonitrile,
used in the 1-10 mM range. Low odor.
Used in the 0.1-1.0% range. Volatile only when titrated with
acetic acid (not hydrochloric or phosphoric). Used as ion-pair
for DNA analysis at pH 7-9.
Pyrrolidine 11.3 10.3 – 12.3 Volatile Yes Mild buffer, gives long lifetime.
XBridge XP 2.5 µm Columns 6
Page 7

[ CARE AND USE MANUAL ]
c. Solvents
To maintain maximum column performance, use high quality HPLC
or MS grade solvents. Filter all aqueous buffers prior to use through
a 0.2 µm filter. Solvents containing suspended particulate materials
will generally clog the outside surface of the inlet of the column. This
may result in higher backpressure or distorted peak shape.
d. Pressure
XBridge XP 2.5 µm Columns are compatible with HPLC, UHPLC and
UPLC pressures. Table 6 depicts the maximum operation pressure.
Table 6: Maximum Operation Pressure
Column ID Pressure Range
2.1 mm 18,000 psi [1034 bar]
3.0 mm 18,000 psi [1034 bar]
4.6 mm 9000 psi [620 bar]
e. Temperature
XBridge XP 2.5 µm Columns can be used up at intermediate
temperatures to enhance selectivity, reduce solvent viscosity and
increase mass transfer rates.
Chemistry
XBridge BEH C
XBridge BEH C
XBridge BEH Phenyl
XBridge BEH Shield RP18
XBridge BEH HILIC
XBridge BEH Amide
18
8
Temperature Limit
Low pH
80 °C 60
60 °C 60 °C
80 °C 60 °C
50
°C
45
°C
90 °C 90 °C
Temperature Limit
High pH
°C
45 °C
45 °C
solvent to remove the non-polar contaminant(s), taking care not to
precipitate any buffered mobile-phase components. If this flushing
procedure does not solve the problem, purge the column with the
following cleaning and regeneration procedures.
Use a cleaning routine that matches the properties of the samples,
stationary-phase type (reversed-phase, normal-phase or HILIC) and
will solubilize the suspected contaminate. Flush with 20 column
volumes of solvent at an intermediate temperature of 45°C. Return to
the initial mobile-phase conditions by reversing the sequence.
If using a reversed-phase column, purge the column with a sequence
of progressively more non-polar solvents (i.e., water–tomethanol–
to–tetrahydrofuran–to–methylene chloride).
If using a HILIC column, purge the column with a sequence of progres-
sively more polar-organic solvents (i.e., acetonitrile-to-acetonitrile/
methanol-to-acetonitrile/water-to-water).
If column performance has not improved after regeneration/cleaning pro-
cedures, contact your local Waters representative for additional support.
b. Storage after Reversed-Phase Use
For periods longer than four days, store the XP 2.5 µm Column in
100% acetonitrile. For separations utilizing elevated temperature,
store immediately after use in 100% acetonitrile. Do not store
columns in buffered eluents. If the mobile-phase contained a buffer
salt, flush the column with 10 column volumes of HPLC grade water
(see Table 3 for column volume information) followed by 10 column
volumes of acetonitrile. Failure to perform this intermediate step
could result in precipitation of the buffer salt in the column when
100% acetonitrile is introduced. Completely seal the column to avoid
solvent evaporation and drying out of the chromatographic bed.
Note: Working in combinations of extreme pH, temperature and pressure may
result in reduced column lifetime.
IV. COLUMN CLEANING, REGENERATION AND
STORAGE
a. Cleaning and Regeneration
Changes in peak shape, peak splitting, shouldering peaks, shifts
in retention, change in resolution or increasing backpressure may
indicate contamination of the column. Flush with a neat organic
XBridge XP 2.5 µm Columns 7
Note: If a column has been run with a formate-containing mobile-phase (e.g.,
ammonium formate, formic acid, etc.) and is purged with 100% acetonitrile,
slightly longer equilibration times may be necessary when the column is re-
installed and re-wetted with that same formate-containing mobile-phase.
c. Storage after HILIC Use
For periods longer than four days, store the XP 2.5 µm Column in
95/5 acetonitrile/water. Do not store columns in buffered eluents.
If the mobile-phase contained a buffer salt, flush the column with
10 column volumes of HPLC grade water (see Table 3 for column
volume information) followed by 10 column volumes of 95/5
Page 8
[ CARE AND USE MANUAL ]
acetonitrile/water. Failure to perform this intermediate step could result
in precipitation of the buffer salt in the column when 95% acetonitrile
is introduced. Completely seal the column to avoid solvent evaporation
and drying out of the chromatographic bed.
V. eCORD INTELLIGENT CHIP TECHNOLOGY
a. Introduction
The eCord Intelligent Chip Technology represents a significant
advancement in column usage tracking management which can be
realized if the column is installed on an ACQUITY UPLC System.
The eCord Intelligent Chip provides a paperless tracking history of the
column’s performance and usage throughout its lifetime. The eCord
is permanently attached to the column body via a tether that cannot
be removed. T his ensures that the history of the column is always
accessible to the user of that column.
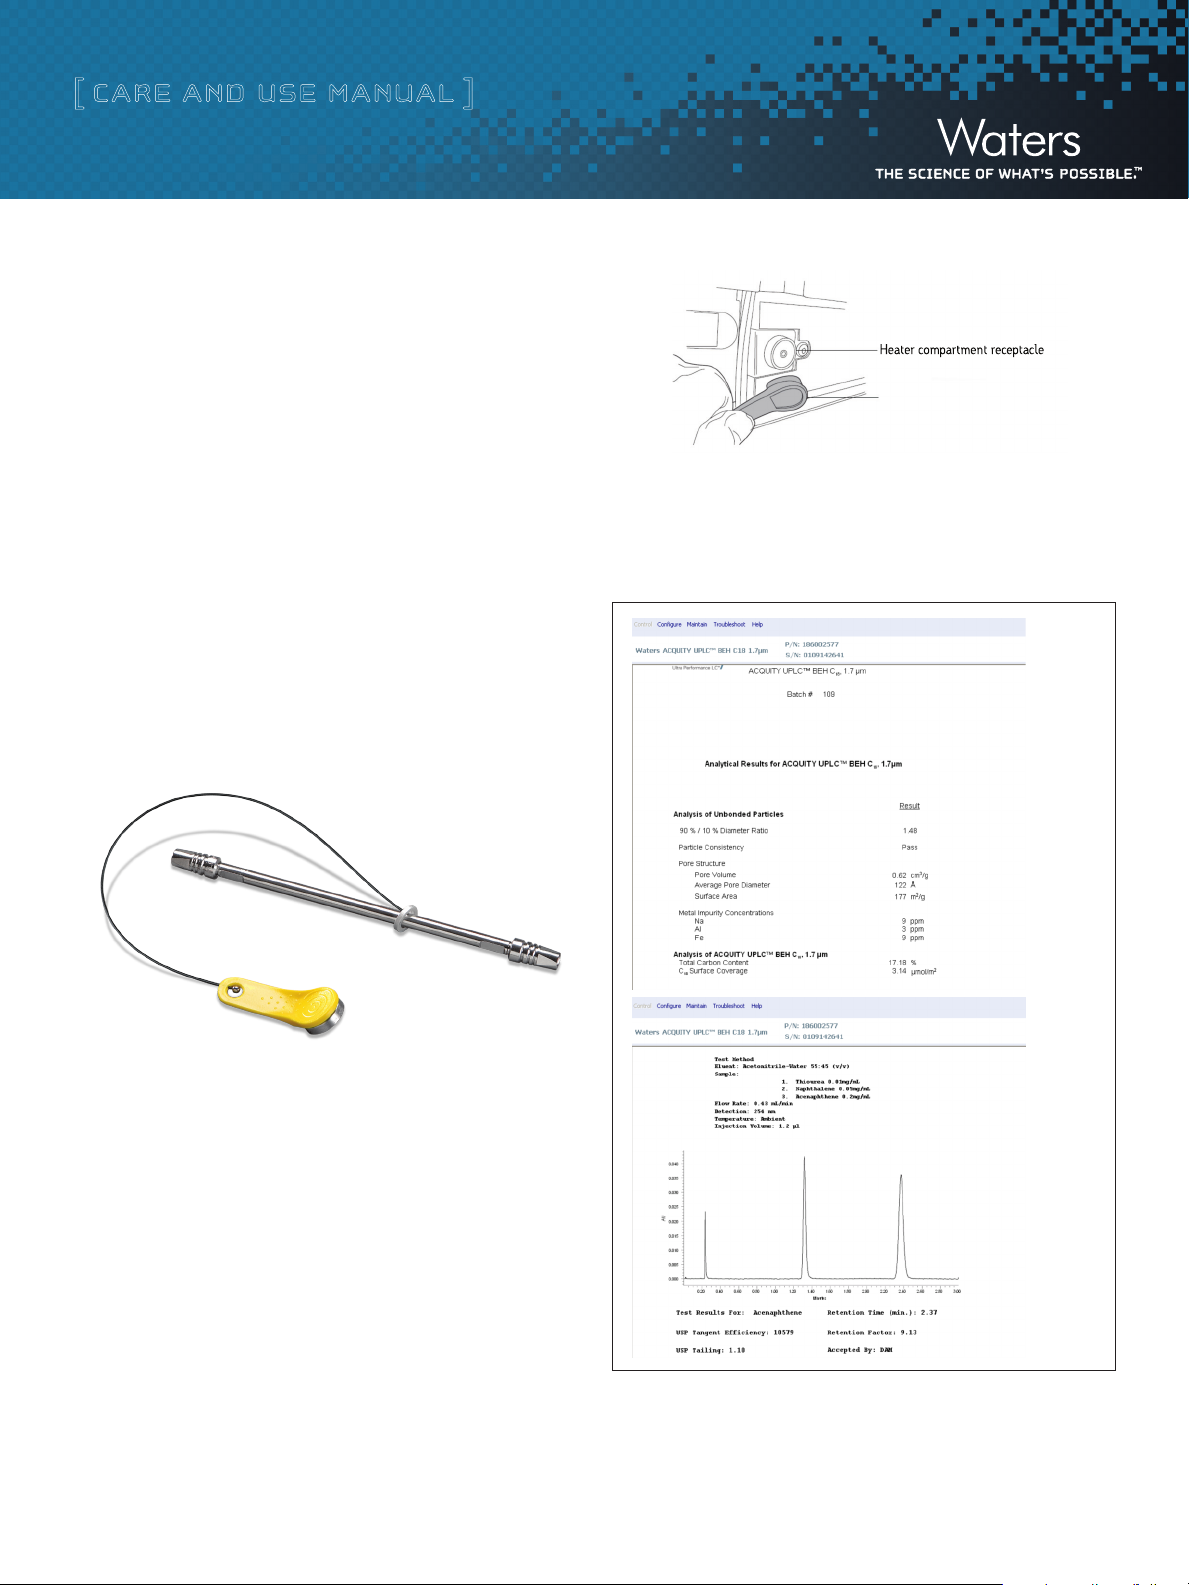
eCord Fob
Figure 6: Installing the eCord Intelligent Chip.
c. Manufacturing
The eCord Chip provides the user with the Batch Certificate of Analysis
and Performance Test Chromatogram.
Figure 5: eCord Intelligent Chip.
At the time of manufacture, information such as the performance test
chromatogram, column manufacturing QC data and Certificates of
Analysis is downloaded onto the eCord. This information may then be
accessed via the ACQUITY UPLC console once the column is installed.
b. Installation
The eCord device can be read by connecting the yellow fob to the
reader/writer located on the right-hand side of the ACQUITY UPLC
Column heater module. Once the eCord is connected to the magnetic
catch on the column heater, column identification and overall
column usage information can be accessed.
XBridge XP 2.5 µm Columns 8
Figure 7: Manufacturing results stored on an eCord.
Page 9

[ CARE AND USE MANUAL ]
d. Column Use
The eCord Intelligent Chip provides the user with specific column
information as well as column use data including: chemistry type,
column dimension, serial number and part number. The overall
column use information includes: total number of samples injected,
total number of injections as well as the maximum pressure and
temperature that the column has been exposed to. Additionally,
detailed column history includes the sample set start date, user name
and system name.
Figure 8: Column use information.
VI. ADDITIONAL INFORMATION
a. Tips for Maximizing XBridge XP 2.5 µm Column Lifetime
1. To maximize XP 2.5 µm Column lifetime, pay close attention to:
Water quality (including water purification systems)
Solvent quality
Mobile-phase preparation, storage and age
Sample, buffer and mobile-phase solubilities
Sample quality and preparation.
Add 5 – 10% organic modifier to aqueous buffer to minimize
bacterial growth (adjust gradient profile as necessary).
Filter aqueous portions of mobile-phase through a 0.2 µm filter.
Routinely maintain your water purification system to ensure it is
functioning properly.
Only use ultra-pure water (18 MegaOhm-cm) and highest quality
solvent possible.
Consider sample preparation (e.g., solid-phase extraction,
filtration, centrifugation, etc.) when possible.
4. Avoid when possible:
100% aqueous mobile-phases
HPLC-grade bottled water
‘Topping off’ your mobile-phases
Using phosphate salt buffer in combination with high acetonitrile
concentrations (e.g., >70%) due to precipitation.
5. Don’t assume the column is to blame:
Investigate cause of column failure
Monitor backpressure
Mobile-phase age, bacterial contamination, mobile-phase
precipitation...etc.
Peak splitting
Sample quality
Injection solvent strength.
6. Do not prepare excessive amounts of mobile-phase:
To reduce the chances of mobile-phase contamination or
degradation, prepare enough mobile-phase to last 3 – 4
days. Alternatively, store excess bulk quantities in a
refrigerated environment.
2. When problems arise, systematically troubleshoot potential causes one
variable at a time in a systematic fashion.
3. Always remember to:
Use an in-line filter unit (Part No. 205000343) or a
VanGuard Pre-Column.
Discourage bacterial growth by minimizing the use of 100%
aqueous mobile-phases where possible.
Discard and re-prepare aqueous mobile-phase every 24-48
hours (if 100% aqueous mobile-phase is required).
XBridge XP 2.5 µm Columns 9
Page 10

[ CARE AND USE MANUAL ]
b. Troubleshooting Questions
1. Are you using 100% aqueous mobile-phases?
2. What is the age of the mobile-phase?
3. Is the mobile-phase filtered through a 0.2 µm membrane?
4. Was the mobile-phase prepared fresh or topped off?
5. Is the water source of adequate quality?
6. When was the last time the water system was serviced or was the bottle of water unopened?
7. Is bacterial growth a possibility (pH 7 phosphate buffer is susceptible to bacterial growth within 24 hours)?
8. If a neat standard is prepared in the initial mobile-phase conditions and injected, are the problems still observed?
9. If the sample is filtered/purified (i.e., SPE, filtration...etc.) is the problem still observed?
10. Has the quality of the samples changed over time?
c. Recommended Flow Rates and Anticipated Backpressures for Reversed-Phase XBridge XP 2.5 µm Columns
XP 2.5 µm, 2.1 mm ID Columns (40 °C)
Linear Velocity 3 mm/sec 4 mm/sec 5 mm/sec 6 mm/sec
Column Dimension
2.1 x 30 mm 0.45 1760 0.6 2350 0.75 2940 0.9 3520
2.1 x 50 mm 0.45 2640 0.6 3520 0.75 4400 0.9 5280
2.1 x 75 mm 0.45 3740 0.6 4980 0.75 6230 0.9 7470
2.1 x 100 mm 0.45 4830 0.6 6440 0.75 8055 0.9 9670
Linear Velocity 3 mm/sec 4 mm/sec 5 mm/sec 6 mm/sec
Column Dimension
3.0 x 30 mm 0.9 2180 1.17 2840 1.53 3710 1.8 4360
3.0 x 50 mm 0.9 3040 1.17 3950 1.53 5170 1.8 6080
3.0 x 75 mm 0.9 4120 1.17 5350 1.53 7000 1.8 8230
3.0 x 100 mm 0.9 5190 1.17 6750 1.53 8825 1.8 10380
Flow Rate
[mL/min]
Flow Rate
[mL/min]
Backpressure
[psi]
Backpressure
[psi]
Flow Rate
[mL/min]
XP 2.5 µm, 3.0 mm ID Columns (40 °C)
Flow Rate
[mL/min]
Backpressure
[psi]
Backpressure
[psi]
Flow Rate
[mL/min]
Flow Rate
[mL/min]
Backpressure
[psi]
Backpressure
[psi]
Flow Rate
[mL/min]
Flow Rate
[mL/min]
Backpressure
[psi]
Backpressure
[psi]
XP 2.5 µm, 4.6 mm ID Columns (40 °C)
Linear Velocity 3 mm/sec 4 mm/sec 5 mm/sec 6 mm/sec
Column Dimension
4.6 x 30 mm 2.1 3360 2.8 4480 3.5 5600 4.2 6720
4.6 x 50 mm 2.1 4210 2.8 5620 3.5 7020 4.2 8430
4.6 x 75 mm 2.1 5280 2.8 7040 3.5 8800 4.2 10560
4.6 x 100 mm 2.1 6350 2.8 8460 3.5 10580 4.2 12700
XBridge XP 2.5 µm Columns 10
Flow Rate
[mL/min]
Backpressure
[psi]
Flow Rate
[mL/min]
Backpressure
[psi]
Flow Rate
[mL/min]
Backpressure
[psi]
Flow Rate
[mL/min]
Backpressure
[psi]
Page 11

[ CARE AND USE MANUAL ]
d. Getting Started with XBridge HILIC XP 2.5 µm Columns
Operating Range
1. Because XBridge HILIC Columns do not posses a bonded phase, the pH
operating range is 1 to 9, and they can be operated at temperatures up
to 45 °C.
2. As with any LC column, operating at the extremes of pH, pressures and
temperatures will result in decreased column lifetime.
Column Equilibration
1. When column is first received, flush in 50% acetonitrile/50% water
with 10 mM final buffer concentration for 50 column volumes.
2. Equilibrate with 20 column volumes of initial mobile-phase conditions
before making first injection.
3. If gradient conditions are used, equilibrate with 8-10 column volumes
between injections.
4. Failure to appropriately equilibrate the column could result in drifting
retention times.
2. A generic injection solvent is 75/25 acetonitrile/methanol. This is a
good compromise between analyte solubility and peak shape.
3. Avoid water and dimethylsulfoxide (DMSO) as injection solvents. These
solvents will produce very poor peak shapes.
4. Exchange water or DMSO with acetonitrile by using reversed-phase
solid-phase extraction (SPE). If this is not possible, dilute the water or
DMSO with organic solvent.
Miscellaneous Tips
1. XBridge HILIC columns are designed to retain very polar bases. Acidic,
neutral and/or non-polar compounds will have limited retention.
2. Optimal flow rates for small (<200 daltons) very polar bases are in
the 0.4 to 0.8 mL/min range with the XBridge HILIC Columns
(2.1 mm ID).
3. As compared to Atlantis® HILIC Silica HPLC Columns, the XBridge HILIC
Columns are approximately 20% less retentive for gradient analysis
and 35 to 65% less retentive for isocratic analysis. This is due to the
lower residual surface silanol concentration of the BEH particle.
Mobile-Phase Considerations
1. Always maintain at least 3% polar solvent in the mobile-phase
or gradient (e.g., 3% aqueous/3% methanol or 2% aqueous/1%
methanol , etc.). This ensures that the XBridge HILIC particle is
always hydrated.
2. Maintain at least 40% organic solvent (e.g., acetonitrile) in your
mobile-phase or gradient.
3. Avoid phosphate salt buffers to avoid precipitation in HILIC mobile-
phases. Phosphoric acid is okay.
4. Buffers such as ammonium formate or ammonium acetate will produce
more reproducible results than additives such as formic acid or acetic
acid. If an additive (e.g., formic acid) must be used instead of a buffer,
use 0.2% (v:v) instead of 0.1%.
5. For best peak shape, maintain a buffer concentration of 10 mM in your
mobile-phase/gradient at all times.
Injection Solvents
1. If possible, injection solvents should match the initial mobile-phase
conditions.. The polar solvent (i.e., water, methanol, isopropanol) should
be minimized to 25% of the total volume.
4. In HILIC, it is important to remember that water is the strongest solvent.
Therefore, it must be eliminated or minimized in the injection solvent.
5. For initial scouting conditions, run a gradient from 95% acetonitrile to
50% acetonitrile. If no retention occurs, run isocratically with 95/3/2
acetonitrile/methanol/aqueous buffer.
6. Alternate polar solvents such as methanol, ethanol or isopropanol can
also be used in place of water to increase retention.
7. If using an ACQUITY UPLC System, the weak needle wash should
closely match the % organic present in the initial mobile-phase
conditions, otherwise, analyte peak shape or retention may suffer.
e. Getting Started with XBridge Amide XP 2.5 µm Columns
Operating Ranges
1. XBridge Amide Columns can be used routinely under HILIC conditions
between pH 2 to 11, and they can be operated at temperatures
up to 90 °C.
2. As with any LC column, operating at the extremes of pH, pressures and
temperatures will result in decreased column lifetime.
XBridge XP 2.5 µm Columns 11
Page 12

[ CARE AND USE MANUAL ]
Column Equilibration
1. When column is first received, flush in 60% acetonitrile/40% aqueous
(or initial starting conditons) for 50 column volumes.
2. Equilibrate with 20 column volumes of initial mobile-phase conditions
before making first injection.
3. If gradient conditions are used, equilibrate with 8-10 column volumes
between injections.
4. Failure to appropriately equilibrate the column could result in drifting
retention times.
Mobile-Phase Considerations
1. Always maintain at least 3% polar solvent in the mobile-phase
or gradient (e.g., 3% aqueous, 3% methanol or 2% aqueous/1%
methanol, etc.).
2. Maintain at least 40% organic solvent (e.g., acetonitrile) in your
mobile-phase or gradient.
3. At aqueous concentrations greater than 60%, lower flow rates should
be used due to high backpressure. This includes all aqueous wash
procedures.
Miscellaneous Tips
1. For initial scouting conditions, run a gradient from 95% acetonitrile to
50% acetonitrile. If no retention occurs, run isocratically with 95/3/2
acetonitrile/methanol/aqueous buffer.
2. Alternate polar solvents such as methanol, acetone or isopropanol can
also be used in place of water to increase retention.
3. If using an ACQUIT Y UPLC System with a fixed loop injector, ensure
that the weak needle wash solvent/purge solvent is your starting
mobile-phase (i.e., high organic), or your peak shapes will suffer.
Typical needle wash conditions: 800 μL strong wash in
20/80 acetonitrile/water, 500 μL weak wash in
75/25 acetonitrile/water.
4. Acetone should not be used as a sample solvent/diluent unless a
Hexane Tetrahydrofuran Compatibility Kit (Part No. 205000464)
has been installed.
Tips for Separating Sugars/Saccharides/Carbohydrates
If separating sugars or sugar-containing compounds that do not include
reducing sugars (see below) follow generic ‘Getting Started with
XBridge Amide Columns’ recommendations described above.
4. Avoid phosphate salt buffers to avoid precipitation in HILIC mobile-
phases. Phosphoric acid is suitable.
Injection Solvents
1. If possible, injection solvents should be as close to the mobile-phase
composition as possible (if isocratic) or the starting gradient
conditions. Acetone should not be used as a sample solvent/
diluent unless a Hexane Tetrahydrofuran Compatibility Kit (Part No.
205000464) has been installed.
2. A generic injection solvent is 75/25 acetonitrile/methanol. This is a
good compromise between analyte solubility and peak shape. W hen
separating saccharides with limited solubility in in organic solvents,
higher concentrations of aqueous solvent in the sample are acceptable.
50/50 acetonitrile/water can provide satisfactory results.
3. The injection solvent’s influence on peak shape should be determined
experimentally. In some cases, injections of water (or highly aqueous
solutions) may not adversely affect peak shape.
If separating reducing sugars, please review the following information.
1. Reducing sugars can undergo mutarotation which produces the unde-
sired separation of the α and β ring forms (anomers).
2. Collapsing anomers into one peak is accomplished through the use of a
combination of elevated temperature and high pH:
a. Use of 35 °C with high pH (0.2% triethylamine (TEA) or 0.1%
ammonium hydroxide (NH4OH)) and/or
b. Use of >80 °C with 0.05% TEA high temperature (>80 °C)
3. When separating reducing sugars (e.g., fructose, glucose, maltose,
lactose, arabinose, glyceraldehyde) please pay attention to the
following suggestions. Failure to do so will result in the appearance
of split peaks (anomer separation) for these analytes:
a. Operate at a slow flow rate (e.g., 0.10 - 0.13 mL/min on
2.1 x 50 mm column) to facilitate anomer collapse.
b. With longer columns, increased flow rates (e.g., up to 0.3 mL/min)
can be used. As with all LC separations, optimal flow rates should
be determined experimentally.
XBridge XP 2.5 µm Columns 12
Page 13

[ CARE AND USE MANUAL ]
c. Add triethylamine (TEA) or ammonium hydroxide
(NH4OH) modifiers to both mobile-phase (e.g., A2,
B2, etc.) reservoirs.
d. For LC/ELSD separations of mono- and/or disaccharides, typical
isocratic conditions include:
i. 75% (acetonitrile) with 0.2% TEA, 35 °C,
0.13 mL/min, 2.1 x 50 mm BEH Amide column;
ii. 77% acetone with 0.05% TEA, 85 °C,
0.15 mL/min, 2.1 x 50 mm BEH Amide column;
iii. 75% acetonitrile with 0.2% TEA, 35 °C,
0.2mL/min, 2.1 x 100 mm BEH Amide column.
e. For LC/ELSD separations of more complex sugar mixtures (e.g.,
polysaccharides), typical gradient conditions include (add TEA
modifier to both mobile-phases A and B):
i. Gradient going from 80% - 50% acetonitrile
with 0.2% TEA in 10 minutes, 35 °C, 0.13 mL/min,
2.1 x 100 mm BEH Amide column;
ii. 80% - 55% acetone with 0.05% TEA in
10 minutes, 85 °C, 0.15 mL/min, 2.1 x 100 mm BEH
Amide column.
6. If acetone is used in one or more mobile-phases, do not use acetone
as a sample diluent or needle wash solvent. Refer to injection solvents
section for sample diluent recommendations and miscellaneous tip
(#3) for needle wash solvent/purge solvent recommendations.
7. Typical sample preparation suggestions for samples that contain
sugars /saccharides /carbohydrates:
a. Liquid Samples
i. Dilute with 50/50 acetonitrile/water
ii. Filter using 0.45 μm or 0.22 μm syringe filter
(if necessary).
b. Solid Samples
i. Weigh out sample (~3 g) into 50 mL centrifuge tube
ii. Add 25 mL of 50/50 acetonitrile/water and
homogenize (mechanically)
iii. Centrifuge at 3200 rpm for 30 minutes
iv. Collect supernatant and filter using 0.45 μm or
0.22 μm syringe filter (if necessary).
c. Depending on sample and/or analyte concentrations, additional
sample dilutions may be necessary.
f. For LC/MS separations of mono- and disaccharides, typical
isocratic conditions include:
i. 75% acetonitrile with 0.1% ammonium
hydroxide, 35 °C, 0.13 mL/min, 2.1 x 50 mm
BEH Amide column.
g. For LC/MS separations of more complex sugar mixtures (e.g.,
polysaccharides), typical gradient conditions include (add NH4OH
modifier to both mobile-phases A and B):
i. Gradient going from 75% - 45% acetonitrile
with 0.1% ammonium hydroxide in 10 minutes,
35 °C, 0.2 mL/min, 2.1 x 100 mm BEH Amide
column.
5. More complex sample mixtures may require the use of gradient
conditions and/or longer column lengths.
XBridge XP 2.5 µm Columns 13
d. More complex samples and/or lower analyte concentrations may
require additional sample preparation steps and/or procedures
such as solid-phase extraction (SPE).
e. Consider VanGuard BEH Amide Pre-Columns for UPLC Column
protection.
Page 14

[ CARE AND USE MANUAL ]
Austria and European Export
(Central South Eastern Europe, CIS
and Middle East) 43 1 877 18 07
Australia 61 2 9933 1777
Belgium 32 2 726 1000
Brazil 55 11 5094-3788
Canada 1 800 252 4752 x2205
China 86 21 6879 5888
CIS/Russia +497 727 4490/290 9737
Czech Republic 420 2 617 1 1384
Denmark 45 46 59 8080
Finland 09 5659 6288
France 33 1 30 48 72 00
Germany 49 6196 400600
Hong Kong 852 2964 1800
The Netherlands 31 76 508 7200
Norway 47 6 384 60 50
Poland 48 22 6393000
Puerto Rico 1 787 747 8445
Singapore 86 21 6879 5888
Spain 34 936 009 300
Sweden 46 8 555 11 500
Switzerland 41 56 676 70 00
Taiwan 886 2 2543 1898
United Kingdom 44 208 238 6100
All other countries:
Waters Corporation U.S.A.
1 508 478 2000
1 800 252 4752
www.waters.com
Hungary 36 1 350 5086
India and India Subcontinent
91 80 2837 1900
Ireland 353 1 448 1500
Italy 39 02 265 0983
Japan 81 3 3471 7191
Korea 82 2 6300 4800
Mexico 52 55 5524 7636
©2012 Waters C orporation. Waters, AC QUIT Y UPLC, UPLC,
Oasis, Sep-Pak, and Atlantis are registered trademarks of
Waters C orporation. XBridge, eCord, VanGuard, and The Science
of What's Possible are trademar ks of Waters C orporation. All
other trademarks are the property of their respective owners.
March 2012 720004162EN Rev B VW-IH-PDF
Waters Corporation
34 Maple Street
Milford, MA 01757 U.S.A.
T: 1 508 478 2000
F: 1 508 872 1990
www.waters.com
XBridge XP 2.5 µm Columns 14
 Loading...