

Page 1
[ CARE AND USE MANUAL ]
XBridge Protein BEH C4, 300Å, 3.5, 5, and 10 µm Columns
CONTENTS
I. INTRODUCTION
II. GETTING STARTED
a. Column Installation
b. Column Equilibration
c. Initial Column Efficiency Determination
d. Useful Functional Tests for Benchmarking
a New Column
III. COLUMN USE
a. Sample Preparation
b. Operating pH Limits
c. Solvents
d. Pressure
c. Temperature
IV. SCALING SEPARATIONS
V. TROUBLESHOOTING
VI. COLUMN CLEANING, REGENERATING,
AND STORAGE
a. Cleaning and Regeneration
b. Storage
I. INTRODUCTION
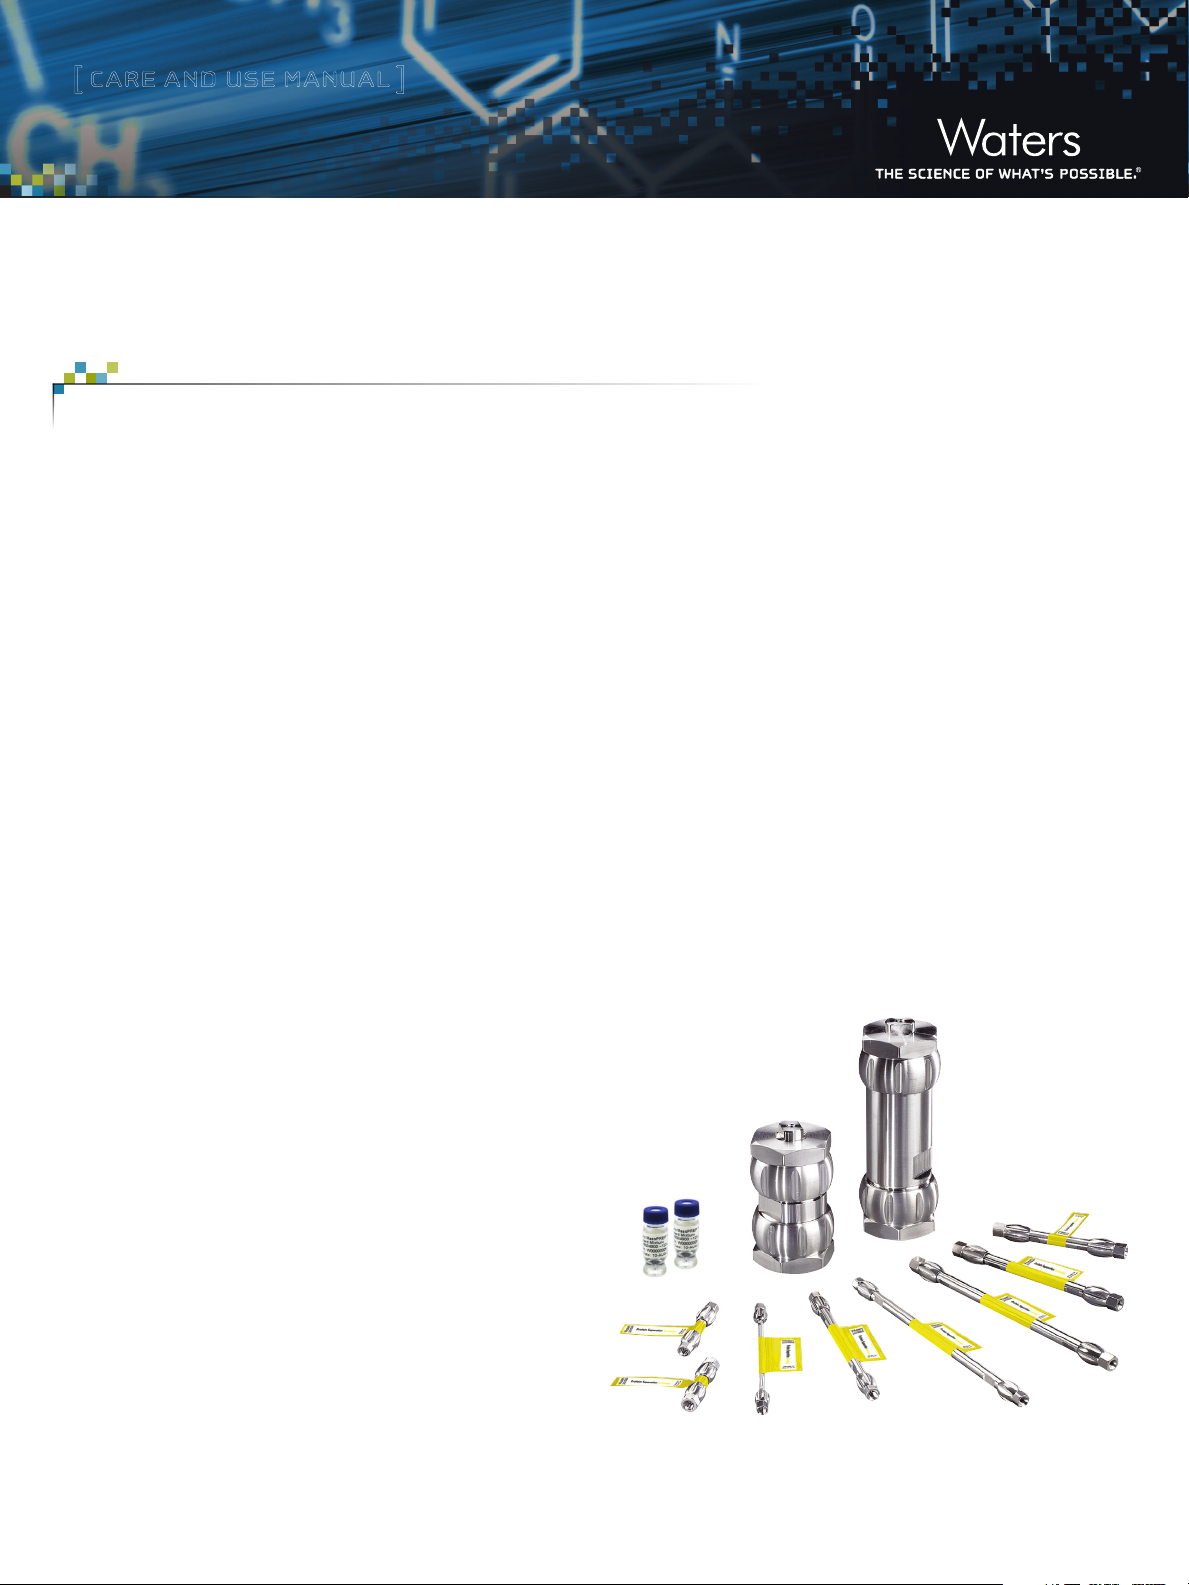
Thank you for choosing a Waters reversed-phase Protein Column.
The XBridge® Protein BEH C4, 300Å packing material was designed
to provide excellent peak shape, high efficiency, and good recovery
for biological macromolecules that are too large or too hydrophobic
for separation on columns with smaller pores or longer chain
bonded phases. The base particle and bonding chemistry are chosen
to provide exceptional stability at both high and low pH as well as
at high temperature. The XBridge Protein BEH C4, 300Å packing
material is manufactured in a cGMP, ISO9002-certified plant
using ultra-pure reagents. Each batch of XBridge Protein BEH C4
reversed-phase column material has been qualified with a protein
test mixture, and the results are held to narrow specification ranges
to ensure reproducible performance. Every column is individually
tested for efficiency, and a Performance Test Chromatogram along
with a Certification of Acceptance is provided with each column.
VII. CONNECTING THE COLUMN TO THE HPLC
a. Column Connectors and System
Tubing Considerations
b. Measuring System Bandspreading Volume
VIII. MEASURING GRADIENT SYSTEM VOLUME
(OR DWELL VOLUME)
Page 2

[ CARE AND USE MANUAL ]
II. GETTING STARTED
Each XBridge Protein BEH C4 Column has a Certificate of
Acceptance and a Performance Test Chromatogram. The Certificate
of Acceptance is specific to each batch of packing material and
includes the batch number, analysis of unbonded particles,
analysis of bonded particles, and chromatographic results and
conditions. The Performance Test Chromatogram is specific to each
individual column and contains the information: batch number,
column serial number, USP plate count, USP tailing factor,
retention factor, and chromatographic conditions. These data
should be stored for future reference.
a. Column Installation
Note: The flow rates given in the procedure below are for a typical 3.5 μm packing
in a 4.6 mm i.d. column. Scale the flow rate up or down accordingly based upon
the column i.d of the column being installed. See “Scaling” section for calculating
flow rates when changing column i.d and/or length. See “Connecting the Column
to the HPLC” for a more detailed discussion on HPLC connections.
1. Purge the solvent delivery system of any buffer-containing
or water-immiscible mobile phases and connect the inlet end
of the column to the injector outlet. An arrow on the column
identification label indicates the correct direction of solvent flow.
2. Flush column with 100% organic mobile phase (acetonitrile)
by setting the pump flow rate to 0.1 mL/min. and increase the
flow rate to 1 mL/min over 5 minutes.
3. When the mobile phase is flowing freely from the column
outlet, stop the flow and attach the column outlet to the
detector. This prevents entry of air into the detection system
and gives more rapid baseline equilibration.
4. Gradually increase the flow rate as described in step 2.
5. Once a stable backpressure and baseline have been achieved,
proceed to the next section.
Table 1: Empty Column Volumes in mL (multiply by 10 for
flush solvent volumes)
Column Internal Diameter
Column
Lengt h (mm)
50 0.17 0.83 3.9 14.2 35.3
75 – – – – 53
100 0.35 1.7 7.9 28.4 70.7
150 0.52 2.5 11. 8 42.5 106
250 0.87 4.2 19.6 70.9 176.7
To avoid precipitating mobile phase buffers on your column or
in your system, flush the column with five column volumes of a
water/organic solvent mixture, using the same or lower solvent
content as in the desired buffered mobile phase. For example,
flush the column and HPLC system with 50% acetonitrile in water
prior to introducing 50% acetonitrile/50% buffer mobile phase.
Column equilibration may be judged initially by stable pressure
and by a stable detector baseline. For a specific application, it is,
however, necessary to test the required duration of equilibration.
The criteria for adequate equilibration include reproducibility of
retention time for major and minor peaks, resolution for critical
pairs, and consistent baseline characteristics.
Note: Low concentration mobile phase additives, particularly those with minimal
buffering capacity may require extended equilibration and re-equilibration
between gradient analyses.
2.1 4.6 10 19 30
c. Initial Column Efficiency Determination
1. Perform an efficiency test on the column before using it in
the desired application. Waters recommends using the solute
mixture and conditions described in the Performance Test
Chromatogram to test the column upon receipt.
b. Column Equilibration
Your XBridge Protein BEH C4, 300Å Column is shipped in 100%
acetonitrile. It is important to ensure mobile phase compatibility
before changing to a different mobile phase system. Equilibrate
the column with a minimum of 10 column volumes of the mobile
phase to be used (refer to Table 1 for column volumes).
2. Measure retention of the test compounds and the number of
theoretical plates (N).
3.
Repeat the test at predetermined intervals to track column
performance over time. Slight variations may be obtained
on two diff erent H P L C sy stems due to t he quality of th e
connections, operating environment, system electronics, reagent
quality, condition of column, and operator technique.
XBridge Protein BEH C4, 300Å, 3.5, 5, 10 �m
2
Page 3
[ CARE AND USE MANUAL ]
d. Useful Functional Tests for Benchmarking a New Column
The Column Efficiency Test described above is a useful measure
of the physical state of the packed bed as well as an indicator
of the c hemical integrity of the b onded phas e. It may also be
useful to benchmark the column performance with a sample that is
more representative of t he intende d ap plic ation. Two tests c an be
suggested as starting points for benchmarking a new column and
for monitoring a column during its use.
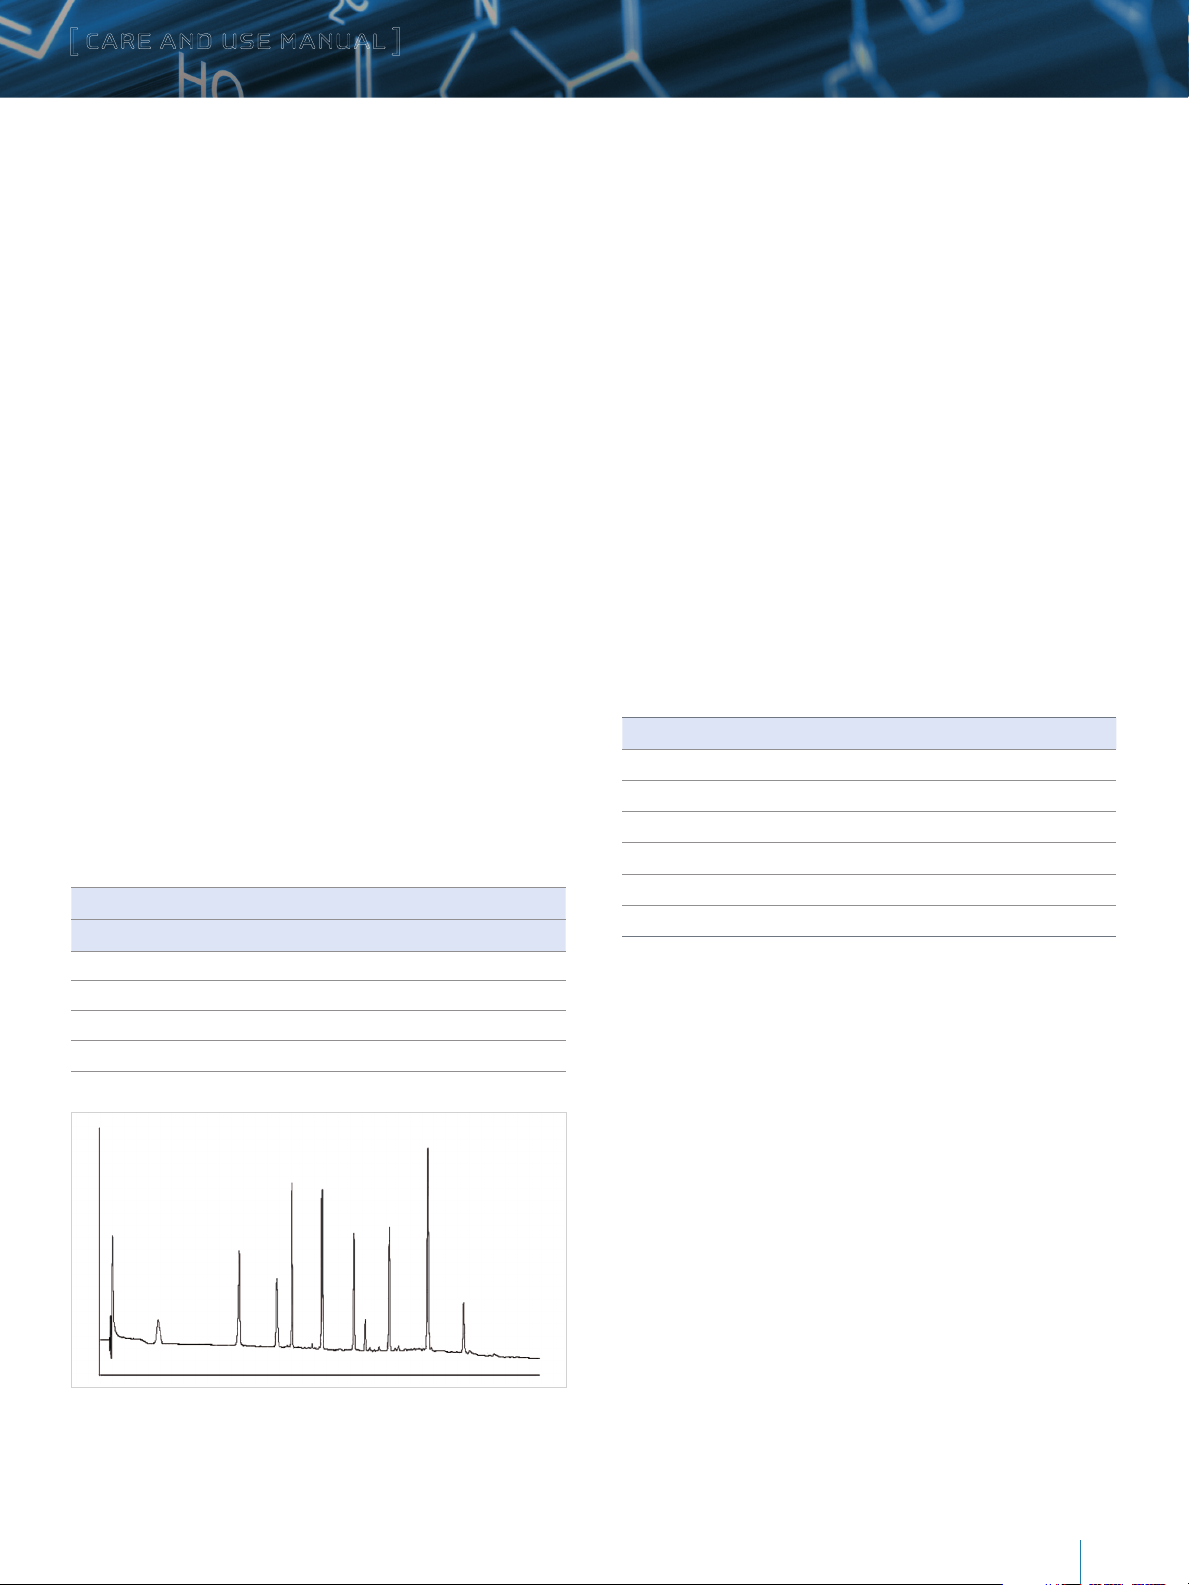
Peptide Mixture Performance Test
Sample: Waters MassPREP™ Peptide Standard Mixture
(P/N 186002337)
Reconstitute 1 vial in 100 μL 0.1% TFA:5%
Acetronitrile: 94.9% Water
Injection Volume: 2.1 mm – 3.3 µL
4.6 mm – 16.0 µL
Column: XBridge Protein BEH C
3.5 µm, 2.1 x 50 mm
Flow Rate: 2.1 mm – 0.2 mL/min
4.6 mm – 0.96 mL/min
Mobile Phase: A: 0.1% TFA in water
B: 0.075% in 71.4% acetonitrile/
28.6% water
Gradient:
, 300Å
4
Gradient Time for Different Column Lengths
50 mm 100 mm 150 mm 250 mm %A %B Curve
Initial Initial Initial Initial 100 0 *
30 60 90 150 30 70 6
32 64 96 160 30 70 1
50 100 150
Temperature: 40 °C
Detection: 220 nm
250 100 0 1
This chromatogram is typical of the results obtained in Waters
laboratories with the method described above, using a XBridge
Protein BEH C4, 300Å, 3.5 µm, 2.1 x 50 mm Column. The
retention times will double, triple, and be five times greater
for the 100 mm, 150 mm and 250 mm columns respectively.
The exact results observed in any laboratory will depend on
the instrument in use. System volume, gradient generation
mechanism, mixing, design of temperature control, detector cell
dimensions, detector optical properties, and detector electronic
properties all have a direct impact on the observed chromatogram.
The pattern should be similar, however, on any well-functioning,
modern HPLC. This test is exceptionally valuable for monitoring
the life of the column and for troubleshooting separation
difficulties that may arise.
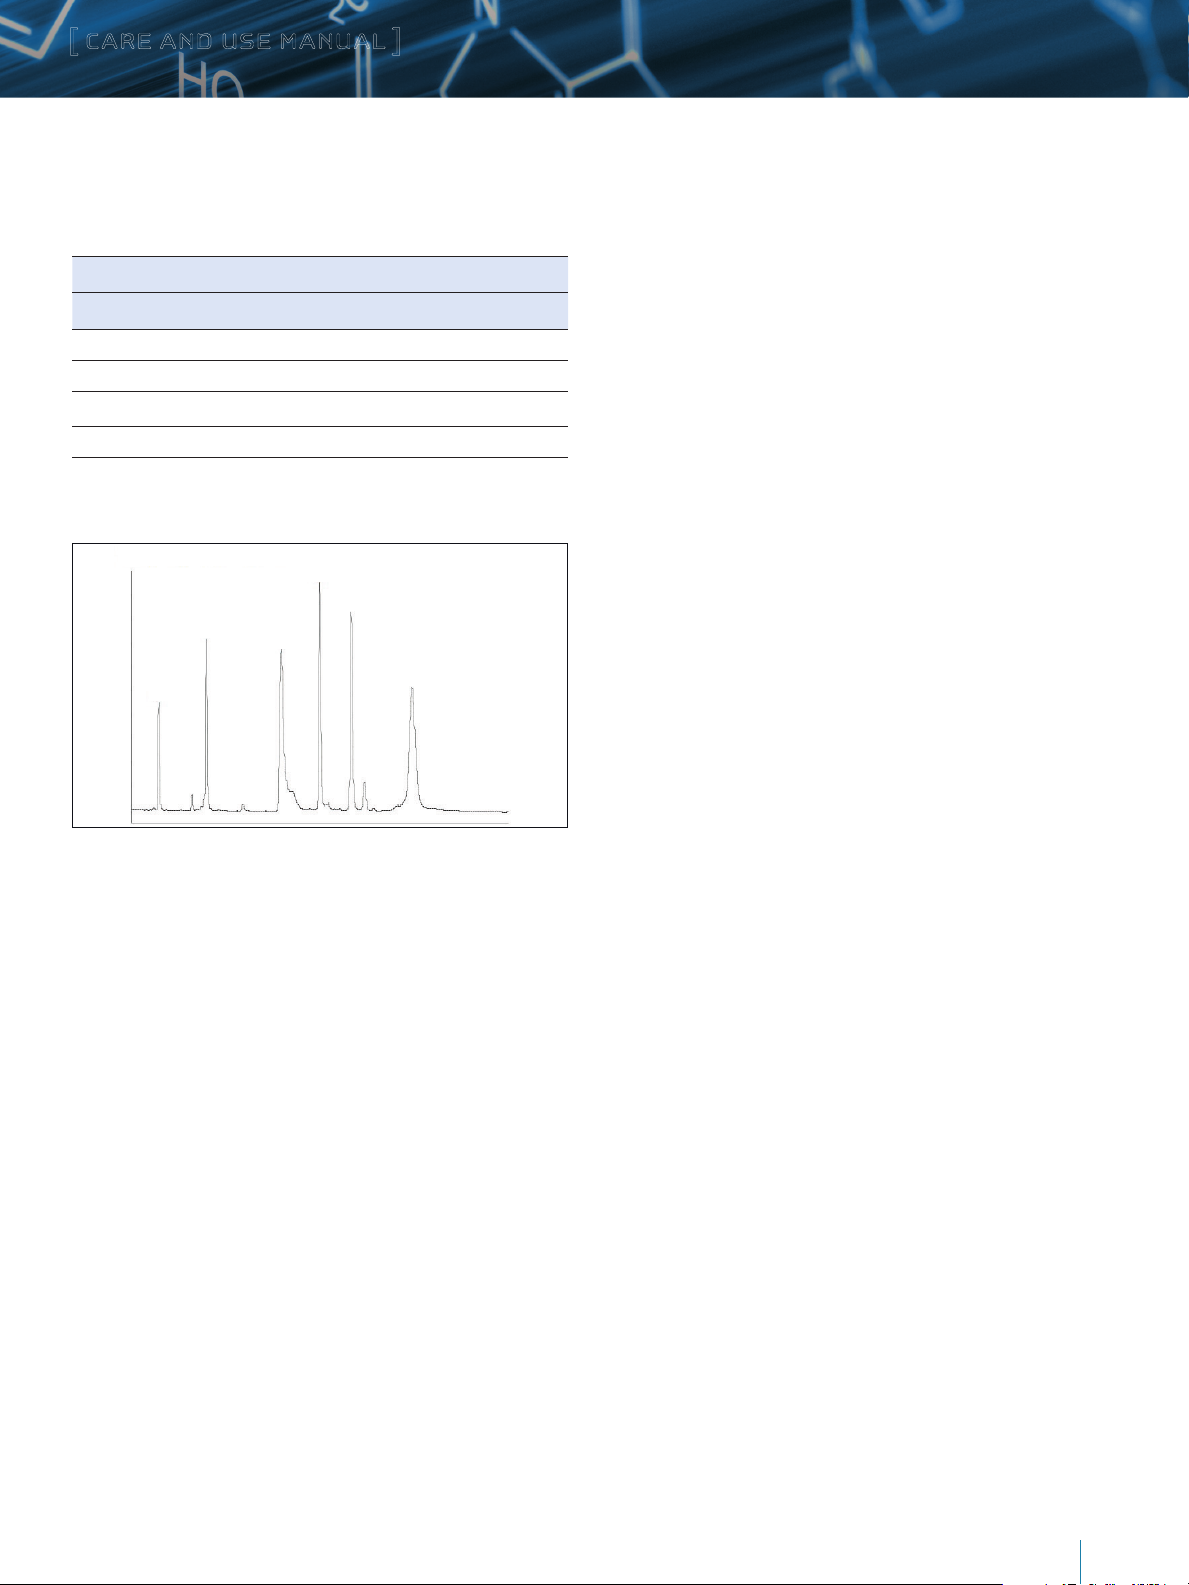
Protein Mixture Performance Test
Sample: MassPREP Protein Standard Mixture (P/N 186004900)
Dissolved in 0.1% TFA:5% acetonitrile:94.9% water
Protein Sigma P/N Conc. mg/mL
Bovine Ribonuclease A R5500 0.04
Horse Cytochrome c C7752 0.06
Bovine Serum Albumin A8022 0.20
Horse Myoglobin M1882 0.13
Yeast Enolase E6126 0.22
Rabbit Phosphorylase b P6635 0.59
Injection Volume: 2.1 mm – 5.0 µL
4.6mm – 25.0 µL
Column:
3.5 µm, 2.1 x 50 mm
Flow Rate: 2.1 mm – 0.2 mL/min
4.6 mm – 0.96 mL/min
XBridge Protein BEH C4, 300Å
,
Figure 1: Typical Peptide Chromatogram Using MassPREP Peptide Standard Mixture
XBridge Protein BEH C4, 300Å, 3.5, 5, 10 �m
3
Page 4
[ CARE AND USE MANUAL ]
Mobile Phase: A: 0.1% TFA in water
B: 0.075% in 71.4% acetonitrile/28.6% water
Gradient:
Time (Column Length)
50 mm 100 mm 150 mm 250 m m %A %B Curve
Initial Initial Initial Initial 72 28 *
25 50 75 125 0 100 6
27 54 81 135 0 100 1
45 90 135 225 72 28 1
Temperature: 40 °C
Detection: 220 nm
6
1 - RNase A
2 - Cyt. C
3 - BSA
4 - Myoglobin
5 - Enolase
6 - Phosphorylase b
4
5
2
1
Figure 2: Typical Protein Test Mixture Chromatogram using MassPREP Protein
Standard Mixture
3
This chromatogram is typical of the results obtained in Waters
laboratories with the method described above, using a XBridge
Protein BEH C4, 300Å, 3.5 µm, 2.1 x 50 mm Column. The
retention times will double, triple, and be five times greater
for the 100 mm, 150 mm, and 250 mm columns respectively.
The exact results observed in any laboratory will depend on
the instrument in use. System volume, gradient generation
mechanism, mixing, design of temperature control, detector cell
dimensions, detector optical properties, and detector electronic
properties all have a direct impact on the observed chromatogram.
The pattern should be similar, however, on any well-functioning,
modern HPLC. This test is exceptionally valuable for monitoring
the life of the column and for troubleshooting separation
difficulties that may arise.
III. COLUMN USE
To ensure the continued high performance of XBridge Protein BEH C4,
300Å, 3.5, 5, and 10 µm Columns, follow these guidelines:
a. Sample Preparation
Sample impurities often contribute to column contamination.
Samples should be free of particles before injection into the system.
It is preferable to prepare the sample in gradient solvent A or in a
mobile phase that is weaker (less organic modifier) than the initial
strength mobile phase. This ensures the best peak shape and.
If the sample is not dissolved in the mobile phase, ensure that the
sample, solvent and mobile phases are miscible in order to avoid
sample and/or buffer precipitation.
Filter sample with 0.2 μm filters to remove particulates. If the
sample is dissolved in a solvent that contains an organic modifier
(e.g., acetonitrile, methanol, etc.) ensure that the filter material
does not dissolve in the solvent. Contact the filter manufacturer
with solvent compatibility questions. Alternatively, centrifugation
for 20 minutes at 12–50,000 g, followed by the t ran sfer of the
supernatant liquid to an appropriate vial, could be considered.
b. Operating pH Limits
The recommended operating pH range for XBridge Protein BEH
C4, 300Å, Columns is 1 to 12. A listing of commonly used buffers
and additives is given in Table 2. Additionally, the column
lifetime will vary depending upon the operating temperature as
well as the type and concentration of buffer used.
XBridge Protein BEH C4, 300Å, 3.5, 5, 10 �m
4
Page 5

[ CARE AND USE MANUAL ]
Table 2: Buffer Recommendations for Using XBridge Protein BEH C4, 300Å Columns from pH 1 to 12
Additive/Buffer pKa Buffer
range (±1
pH unit)
Volatility Used for
Mass
Spec
Comments
TFA 0.3 Volatile Yes Ion pair additive, c an suppress MS signal, used in the 0.02–0.1% range.
Acetic Acid 4.76 Volatile Yes
Formic Acid 3.75 Volatile Yes
Acetate (NH
Formate ( NH
COOH) 4.76 3.76 – 5.76 Volatile Yes
4C2
COOH) 3.75 2.75–4.75 Volatile Yes
4
Maximum buffering obtained when used with ammonium acetate salt.
Used in 0.1–1.0% range.
Maximum buffering obtained when used with ammonium formate salt.
Used in 0.1–1.0% range
Used in the 1–10 mM range. Note that sodium or potassium salts are
not volatile.
Used in the 1–10 mM range. Note that sodium or potassium salts are
not volatile
Phosphate 1 2.15 1.15–3.15 Non-volatile No Traditional low pH buffer, good UV transparency.
Phosphate 2 7.2 6.20 –8.20 Non-volatile No
Phosphate 3 12.3 11.3–13.3 Non-volatile No
Above pH 7, reduce temperature/concentration and use a guard column
to maximize lifetime
Above pH 7, reduce temperature/concentration and use a guard column
to maximize lifetime.
4-Methylmorpholine 8.4 7.4–9.4 Volatile Yes Generally used at 10 mM or less.
Ammonia (NH
Ammonium
Bicarbonate
OH) 9.2 8.2–10.2 Volatile Yes Keep concentration below 10 mM and temperatures below 30 ˚C.
4
10.3
(HCO
9.2 (NH
-
)
8.2–11.3 Volatile Yes
3
+
)
4
Used in the 5– 10 mM range (for MS work keep source >150 ˚C). Adjust
pH with ammonium hydroxide or acetic acid. Good buffering capacity at
pH 10. Note: use ammonium bicarbonate (NH
carbonate ([NH
2
4
CO3).
HCO3), not ammonium
4
Ammonium (Acetate) 9.2 8.2–10.2 Volatile Yes Used in the 1–10 mM range.
Ammonium (Formate) 9.2 8.2–10.2 Volatile Yes Used in the 1–10 mM range.
Borate 9.2 8.2–10.2 Non-Volatile No
CAPSO 9.7 8.7–10.7 Non-Volatile No
Reduce temperature/concentration and use a guard column to maximize
lifetime.
Zwitterionic buffer, compatible with acetonitrile, used in the 1–10 mM
range. Low odor.
Glycine 2.4, 9.8 8.8–10.8 Non-Volatile No Zwitterionic buffer, can give longer lifetimes than borate buffer.
1-Methylpiperidine 10.2 9.3–11.3 Volatile Yes Used in the 1–10 mM range.
CAPS 10.4 9.5–11.5 Non-Volatile No
Triethylamine
(as acetate salt)
10.7 9.7–11.7 Volatile Yes
Zwitterionic buffer, compatible with acetonitrile, used in the 1–10 mM
range. Low odor.
Used in the 0.1–1.0% range. Volatile only when titrated with acetic acid
(not hydrochloric or phosphoric). Used as ion-pair for DNA analysis at
pH 7– 9.
Pyrrolidine 11.3 10.3–12.3 Volatile Yes Mild buffer, gives long lifetime.
XBridge Protein BEH C4, 300Å, 3.5, 5, 10 �m
5
Page 6

[ CARE AND USE MANUAL ]
c. Solvents
To maintain maximum column performance, use high quality
chromatography grade solvents. Filter all aqueous buffers prior to
use. Pall Gelman Laboratory Acrodisc® filters are recommended.
Solvents containing suspended particulate materials can damage
the fluidic components of the HPLC system and will generally clog
the inlet distribution frit of the column. This will result in higher
operating pressure and poor performance.
d. Pressure
XBridge Protein BEH C4, 300Å, 3.5, 5, and 10 µm Columns
can tolerate pressures of up to 6,000 psi (400 bar or 40 Mpa)
although pressures greater than 4,000-5,000 psi should be
avoided in order to maximize column and system lifetimes.
e. Temperature
Temperatures between 20–90 ˚C are recommended for operating
XBridge Protein BEH C4, 300Å Columns in order to enhance
selectivity, lower solvent viscosity and increase mass transfer
rates. However, any temperature above ambient will have a
negative effect on lifetime which will vary depending on the pH
and buffer conditions used.
IV. SCALING SEPARATIONS
Scale-Up Factors
Scale-up factor =
Consider scaling up from a 4.6 x 150 mm column to a
19 x 150 mm column:
Scale-up factor = = 17.1
Applying the scale-up factor, we can predict that approximately
17-135 mg of sample could be applied to the larger column (packed
with the same material as the analytical column). This range is
based on an analytical (4.6 mm I.D.) mass load of 1-8 mg.
Flow Rate
Flow rate (prep) = Flow rate (analytical) x
(Diameter prep)
(Diameter analytical)
(Diameter prep)2 x Length prep
(Diameter analytical)2 x Length analytical
(19)2 x 150
2
x 150
(4.6)
2
Particle Size (analytical)
x
2
Particle Size (prep)
The calculated flow rate may be used for the larger column to ensure
the same linear velocity of mobile phases as used in the analytical
run. However, reasonable flow rates are based on column diameters.
Systems will be limited by increasing backpressure with increasing
column length and decreasing particle size.
Gradient Duration (GD)
GD (prep) =
GD (anal) x Length (prep)
Length (analytical) Diameter (analytical)
Diameter (prep)2 x Flow Rate (analytical)
x
2
Flow Rate (prep)
Mass Loading
Approximate Mass Loading Capacity (mg) for Preparative OBD
Columns (Gradient Mode)
Diameter (mm)
Length (mm) 4.6 10 19 30
50 3 15 45 110
75 – – – 165
100 5 25 90 225
150 8 40 135 335
250 13 60 225 560
Reasonable Flow Rate (mL/min) 1.4 6.6 24 60
Reasonable Injection Volume (µL) 20 100 350 880
The calculated prep gradient duration is entered into the pump’s
gradient separation over the same number of column volumes as
was used in the analytical run.
Reasonable flow rates are based on column diameter. Systems will be
limited by increasing backpressure with increasing column length and
decreasing particle size.
Reasonable injection volumes are based on column diameter at a
length of 50 mm with relatively strong solvents. Increased length
is compatible with larger injection, but not proportionately so.
Weaker solvents significantly increase injection volume.
Mass loading capacities for peptide purifications depend strongly
on the sequence and may be estimated at 5–20% of listed values.
Many factors affect the mass capacity of preparative columns. The
listed capacities represent an ‘average’ estimate.
Capacity is:
§
Higher for strongly retained material
§
Higher for simple mixtures
§
Lower where higher resolution is required
XBridge Protein BEH C4, 300Å, 3.5, 5, 10 �m
6
Page 7

[ CARE AND USE MANUAL ]
AU
AU
AU
AU
§
Very strongly dependent on loading conditions
–
Limited by loading volume
–
Limited by diluent solvent strength
Waters Preparative OBD Columns Calculator
§ Convenient scale-up tool provides:
- Mass load scaling
- Gradient scaling with appropriate flow rate scale-up
Minutes
ACQUITY UPLC Protein BEH C4,
XBridge Protein BEH C
XBridge Protein BEH C
XBridge Protein BEH C
300Å, 1.7 µm
, 300Å, 3.5 µm
4
, 300Å, 5 µm
4
, 300Å, 10 µm
4
and predicting volume consumption
- Calculations for split flow ratios for those using mass
spectrometer driven chromatography
- Focused gradient UPLC to preparative method transfer
0.40
0.30
0.20
0.10
0.00
0.40
0.30
0.20
0.10
0.00
0.40
0.30
0.20
0.10
0.00
0.40
0.30
0.20
0.10
0.00
2.00 4.00 6.00 8.00 10.00 12.00 14.00 16.00 18.00 20.00
Figure 3: Separation of MassPREP Protein Standard Mixture on ACQUITY UPLC
Protein BEH C
Protein BEH C
methods obtaining using Waters Preparative Chromatography OBD Calculator.
, 300Å, 1.7 μm (Top), XBridge Protein BEH C4, 300Å, 3.5μm, XBridge
4
, 300Å, 5 μm, XBridge Protein BEH C4, 300Å, 10 μm using scaling
4
is to ensure that the elevated pressure resides in the column
rather than somewhere else in the system. This is determined
by measuring pressure with and without the column attached
to the instrument. If the system is occluded, the blockage
should be identified and removed. If the pressure increase
resides in the column, it is helpful to know whether the
problem was associated with a single injection or whether
it occurred over a series of injections. If the pressure
gradually built up, it is likely that the column can be cleaned
as described below (Section V). For future stability, it may
be useful to incorporate a stronger regeneration step in the
method. If a single sample caused the pressure increase,
it likely reflects particulates or insoluble components,
such as, lipids. Cleaning is still an option, but using the
more aggressive options. The sudden pressure increase
suggests that the user should consider some sample
preparation, such as filtration or high speed centrifugation.
2. Loss of retention can reflect a change in the column surface
chemistry. Before proceeding with diagnostic or corrective
measures, check that the mobile phases have been correctly
prepared and the correct method has been selected. Then
repeat the efficiency test and the functional peptide or
protein test. If both the small and large molecule test
show loss of retention, it is likely that a significant fraction
of the bonded phase has been lost, and the column will
require replacement. If the changes are small and reflected
only for some proteins, one of the cleaning procedures may
be effective.
3.
Change in peak shape, resolution, or relative retention of
V. TROUBLESHOOTING
peaks. Follow the same steps as for loss of retention (Symptom 2).
4. Carryover and memory effects are defined as the appearance
The first step in systematic troubleshooting is comparison of the
column, in its current state, to the column when it was functioning
properly. The method suggested in Section I for measuring plate
count is an essential first step. This technique detects physical
changes to the packed bed and chemical changes in the bonded
phase surface. The two functional tests with the Peptide Standard
and the Protein Mixture may reveal more subtle changes in surface
chemistry that affect the application.
There are several common symptoms of change in the column.
1. An increase in pressure is often associated with lost
performance in the application. The first step in diagnosis
of the constituents of one sample in the next gradient analysis.
First determine whether the column or the system is the source
of carryover. Define a gradient method that includes an “inter
nal gradient”. That is, the analytical gradient is repeated within
a single method. If the protein peaks appear in both gradients,
at the same time after start, the protein came from the column
in what is often described as a “memory effect”. If the protein
peaks only appear when an injection is made, they likely origi
nate from adsorption to some system component. In that case,
follow the instrument manufacturer’s recommendations. Memory
effects as a source of carryover may be reduced or eliminated
in several ways. First, raising the temperature of the separation
XBridge Protein BEH C4, 300Å, 3.5, 5, 10 �m
7
Page 8

[ CARE AND USE MANUAL ]
reduces the possibility of incomplete elution of the protein from
the column. Second, memory effects may be more pronounced with
steep gradients. Keep the gradient slope at 1% per column volume
or less. Third, memory effects may be exacerbated by high flow
rates. Reduce the flow rate by one half while doubling the gradient
time to maintain a constant slope. Fourth, memory effects may be
reduced by changing the organic solvent to incorporate propanol,
typically 70% pro panol :30% a cetonitril e as strong solvent.
Fifth, ca rry over may be reduc ed in routine assay s with a
regeneration step including a series of fast gradients from 0–100%
acetonitrile. The gradients can be as short as 2 column volumes and
3–5 repetitions may be effective. This “sawtooth” gradient may be
appended to each injection. Finally, apparent memory effects may
actually reflect the solubility of the protein in the mobile phase.
Reducing the amount injected may eliminate the effect.
5. Recovery is often improved by elevating the column
temperature.
Note: Useful general information on column troubleshooting problems may
be found in HPLC Columns Theory, Technology and Practice, U.D. Neue,
(Wiley-VCH, 1997), the Waters HPLC Troubleshooting Guide (Literature code
# 720000181EN) or visit the Waters Corporation website for information on
seminars (www.waters.com).
VI. COLUMN CLEANING, REGENERATION,
AND STORAGE
a. Cleaning and Regeneration
Changes in peak shape, peak splitting, shoulders on the peak,
shifts in retention, change in resolution, carryover, ghost peaks,
or increasing backpressure may indicate contamination of the
column. Choose a cleaning option that may be expected to
dissolve the suspected contaminant.
1. All cleaning procedures will be more effective at higher
temperatures. The BEH300 C
temperatures as high as 90 °C so it is reasonable to conduct
cleaning at 70–90 °C.
can be routinely operated at
4
4. Several different cleaning solutions may be injected to
strip strongly adsorbed material or particulates from the
column. Make the large st injecti on p ossible with the system
configuration. With such strong cleaning solutions, it is best to
disconnect the detector from the column and to direct the flow
to waste.
a. An injection of 1% formic acid.
b. An injection of 10% formic acid.
c. An injection of either 4M urea or 6M guanidine-HCl.
d. If contamination with lipids is suspected, a strong
cleaning option is an injection of tetrahydrofuran.
5. Flow reversal or backflushing is often suggested as part of a
cleaning procedure. This should be reserved as a last resort.
It may further damage the column or provide a short-lived
improvement in performance.
b. Storage
For short-term storage, the column should be stored in the mobile
phase with 20–50% acetonitrile. For periods longer than four
days at room temp erat ure, store t h e c olumn in 100% acetonitrile.
Immediately after use with elevated temperatures and/or at pH
extremes, store in 100% acetonitrile for the best column lifetime.
Do not store columns in highly aqueous (<20% organic) mobile
phases, as this may promote bacterial growth. If the mobile
phase contained a buffer salt, flush the column with 10 column
volumes of HPLC grade water (see Table 1 for common column
volumes) and replace with 100% acetonitrile for storage. Failure
to perform this intermediate step could result in precipitation of
the buffer salt in the column or system when 100% acetonitrile
is introduced. Completely seal column to avoid evaporation and
drying out of the bed.
V. CONNECTING THE COLUMN TO THE HPLC
2. It may be useful to conduct cleaning procedures at one-half
the flow rate typic al u sed with that column. In this way the
possibility of high pressure events is reduced.
3. The first and simplest cleaning procedure is to run a series of
fast gradients from 0–100% acetonitrile. The gradients can
be as short as 2 column volumes and 3–5 repetitions may be
effective. This “sawtooth” gradient may be appended to each
injection to stabilize routine assays.
a. Column Connectors and System Tubing Considerations
Tools needed:
§ 3/8-inch wrench
§ 5/16-inch wrench
Handle the column with care. Do not drop or hit the column on a
hard surface as it may disturb the bed and affect its performance.
XBridge Protein BEH C4, 300Å, 3.5, 5, 10 �m
8
Page 9

[ CARE AND USE MANUAL ]
e
1. Correct connection of 1/16-inch outer diameter stainless
steel tu bing leading to and f rom the column is ess ential for
high-quality chromatographic results.
2. When using standard stainless steel compression screw
fittings, it is important to ensure proper fit of the 1/16-inch
outer diameter stainless steel tubing. When tightening or
loosening the compression screw, place a 5/16-inch wrench on
the compression screw and a 3/8-inch wrench on the hex head
of the column endfitting.
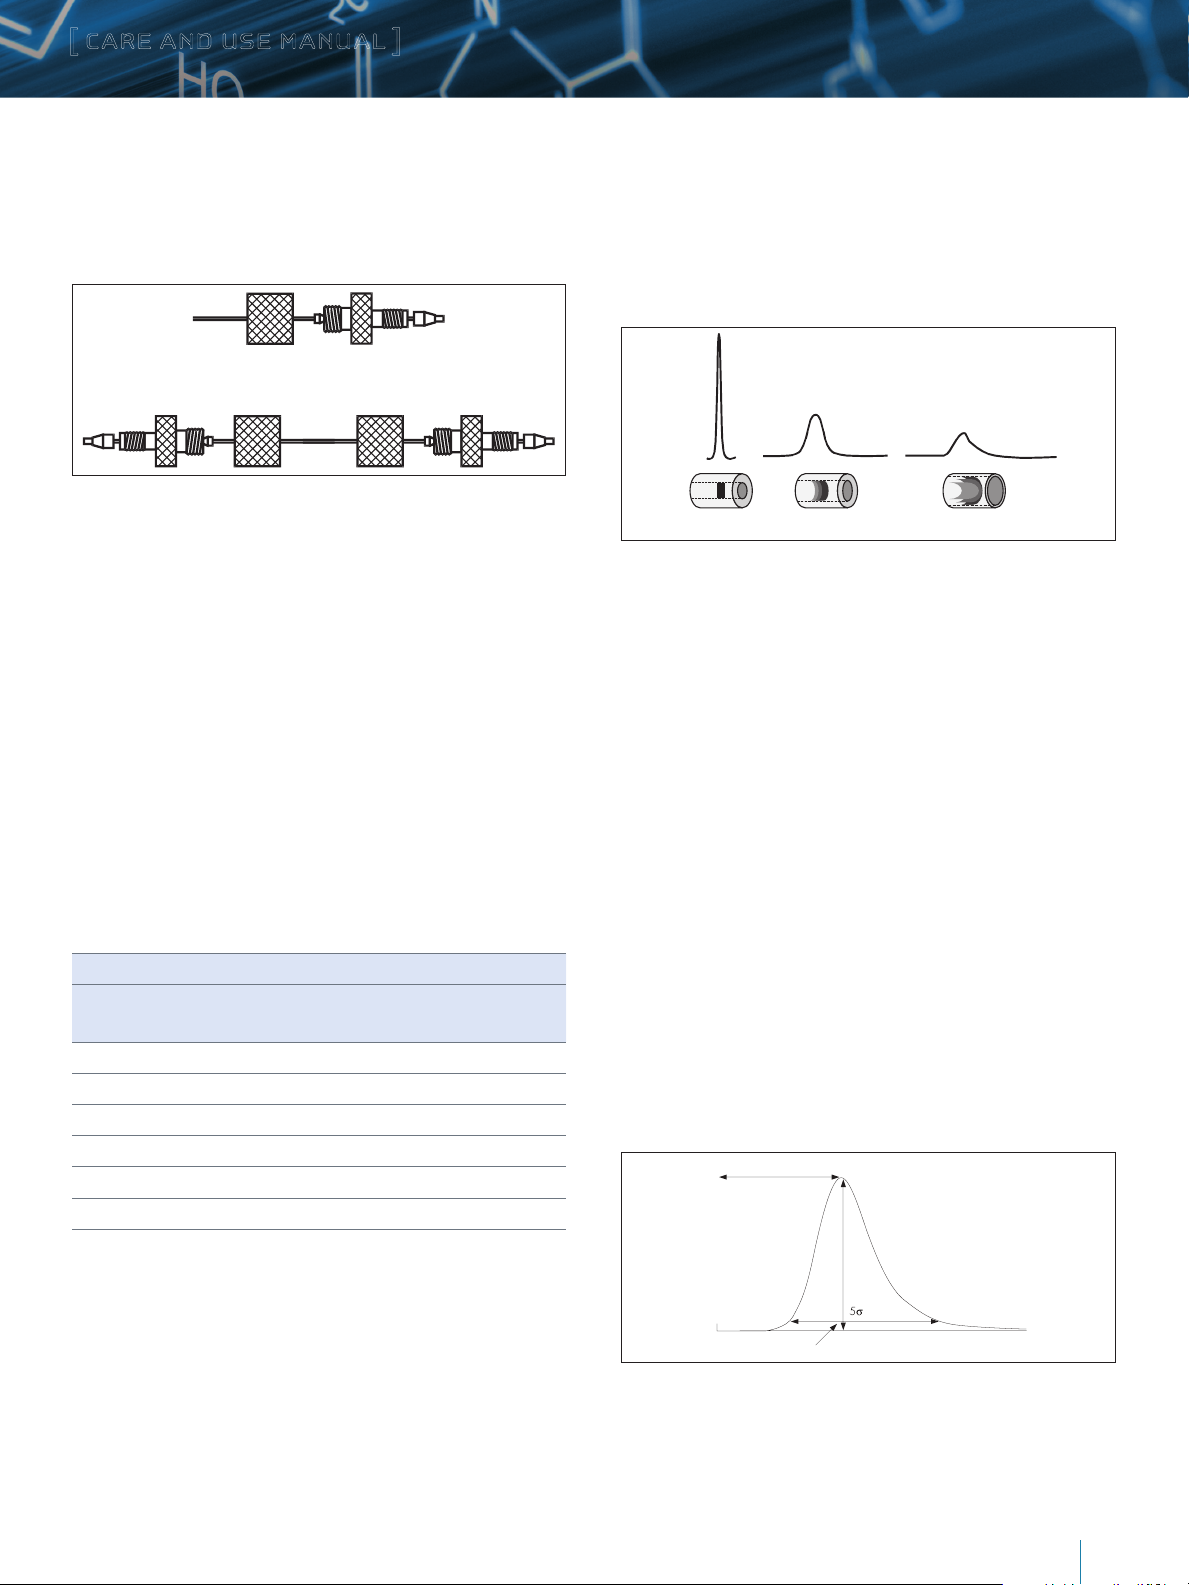
Figure 4: Proper Tubing/Column Connection
The presence of a void in the flow stream reduces column
performance. This can occur if a Parker ferrule is connected to a
Waters style endfitting (Figure 5).
3. If a leak occurs between the stainless steel compression screw
fitting and the column endfitting, a new compression screw
fitting, tubing and ferrule must be assembled.
4. An arrow on the column identification label indicates correct
direction of solvent flow.
Correct connection of 1/16–inch outer diameter stainless steel
tubing leading to and from the column is essential for high-quality
chromatographic results. To obtain a void-free connection, the
tubing must touch the bottom of the column endfitting. It is
important to realize that extra column peak broadening due to
voids can destroy an otherwise successful separation. The choice
of appropriate column connectors and system tubing is discussed
in detail below.
0.130 inch
Figure 3: Waters and Parker Ferrule Types
0.090 inches
Due to the absence of an industry standard, various column
manufacturers have employed different types of chromatographic
column connectors. The chromatographic separation can be
negatively affected if the style of the column endfittings does not
match the existing tubing ferrule settings. This section explains
the differences between Waters style and Parker style ferrules and
endfittings (Figure 3). Each endfitting style varies in the required
length of the tubing protruding from the ferrule. The XBridge Column
is equipped with Waters style endfittings that require a 0.130-inch
ferrule depth. If a non-Waters style column is presently being used, it
is critical that ferrule depth be reset for optimal performance prior to
installing an XBridge Protein BEH C
, 300Å Column.
4
In a proper tubing/column connection (Figure 4), the tubing touches
the bottom of the column endfitting, with no void between them.
Note: A void appears if tubing with a Parker ferrule is connected to a Waters
style column.
0.090 inches
Figure 5: Parker Ferrule in a Waters Style Endfitting
There is only one way to fix this problem: Cut the end of the tubing
with the ferrule, place a new ferrule on the tubing and make a new
connection. Before tightening the screw, make sure that the tubing
bottoms out in the endfitting of the column.
Conversely, if tubing with a Waters ferrule is connected to a
column with Parker style endfitting, the end of the tubing will
bottom out before the ferrule reaches its proper sealing position.
This will leave a gap and create a leak (Figure 6).
Note: The connection leaks if a Waters ferrule is connected to a column with a
Parker style endfitting.
0.130 inches
Figure 6: Waters Ferrule in a Parker Style Endfitting
There are two ways to fix the problem:
1. Tighten the screw a bit more. The ferrule moves forward, and
reaches the sealing surface. Do not overtighten since this may
end in breaking the screw.
2. Cut the tubing, replace the ferrule and make a new connection.
Alternatively, replace the conventional compression screw fitting
with an all-in-one PEEK™ fitting (Waters Part Number PSL613315)
that allows resetting of the ferrule depth. Another approach is to
XBridge Protein BEH C4, 300Å, 3.5, 5, 10 �m
9
Page 10
[ CARE AND USE MANUAL ]
4.4% h
use a Keystone, Inc. SLIPFREE® connector to always ensure the
correct fit. The finger tight SLIPFREE connectors automatically
adjust to fit all compression screw type fittings without the use of
tools (Figure 7).
Figure 7: Single and Double SLIPFREE Connectors
SLIPFREE Connector Features:
§ Tubing pushed into endfitting, thereby guaranteeing a
void-free connection
§ Connector(s) come(s) installed on tubing
§ Various tubing i.d.s and lengths available
§ Fingertight to 10,000 psi – never needs wrenches
§ Readjusts to all column endfittings
§ Compatible with all commercially available endfittings
§ Unique design separates tube-holding function from
sealing function
Table 3: Waters Part Numbers for SLIPFREE Connectors
SLIPFR EE Type Tubing Internal Diameter
Tubing
Length
Single 6 cm PSL 618000 P SL 618006 P SL 618012
Single 10 cm PSL 618002 PSL 618008 PSL 618014
Single 20 cm P SL 618004 P SL 618010 PSL 618016
Double 6 cm PSL 618001 PSL 618007 P SL 618013
Double 10 cm PSL 618003 PSL 618009 P SL 618015
Double 20 cm PSL 618005 PSL 618001 P SL 618017
0.005” 0.010” 0.020”
Minimizing Band Spreading
Figure 8 shows the influence of tubing internal diameter on
system band spreading and peak shape. As can be seen, the
larger tubing diameter causes excessive peak broadening and
lower sensitivity.
0.005 inches
0.020 inches
0.040 inches
Diluted/Distorted Sample Band
Figure 8: Effect of Connecting Tubing on System
b. Measuring System Variance and System Volume
This test should be performed on an HPLC system with a UV detector.
1. Disconnect column from system and replace with a zero dead
volume union.
2. Set flow rate to 1 mL/min.
3. Dilute a test mix in mobile phase to give a detector sensitivity
of 0.5–1.0 AUFS (system start up test mix can be used which
contains uracil, ethyl, and propyl parabens; Waters Part
Number WAT034544).
4. Inject 2 to 5 μL of this solution.
5. Measure the peak width at 4.4% of peak height
(5-sigma method):
5-sigma Bandspreading (μL) = Peak Width (min) x Flow
Rate (mL/min) x (1000 μL/1 mL)
2
System Variance (μL
System Volume
) = (5-sigma bandspreading)2 / 25
Figure 9: Determination of System Bandspreading Volume Using 5-Sigma Method
XBridge Protein BEH C4, 300Å, 3.5, 5, 10 �m
10
Page 11
[ CARE AND USE MANUAL ]
In a typical HPLC system, the Bandspreading Volume should be no
2
greater than 100 μL ± 30 μL (or Variance of 400μL
± 36μL2).
In a microbore (2.1 mm i.d.) system, the bandspreading volume
should be no greater than 20 to 40 μL (or variance no greater
2
than 16μL
to 64μL2).
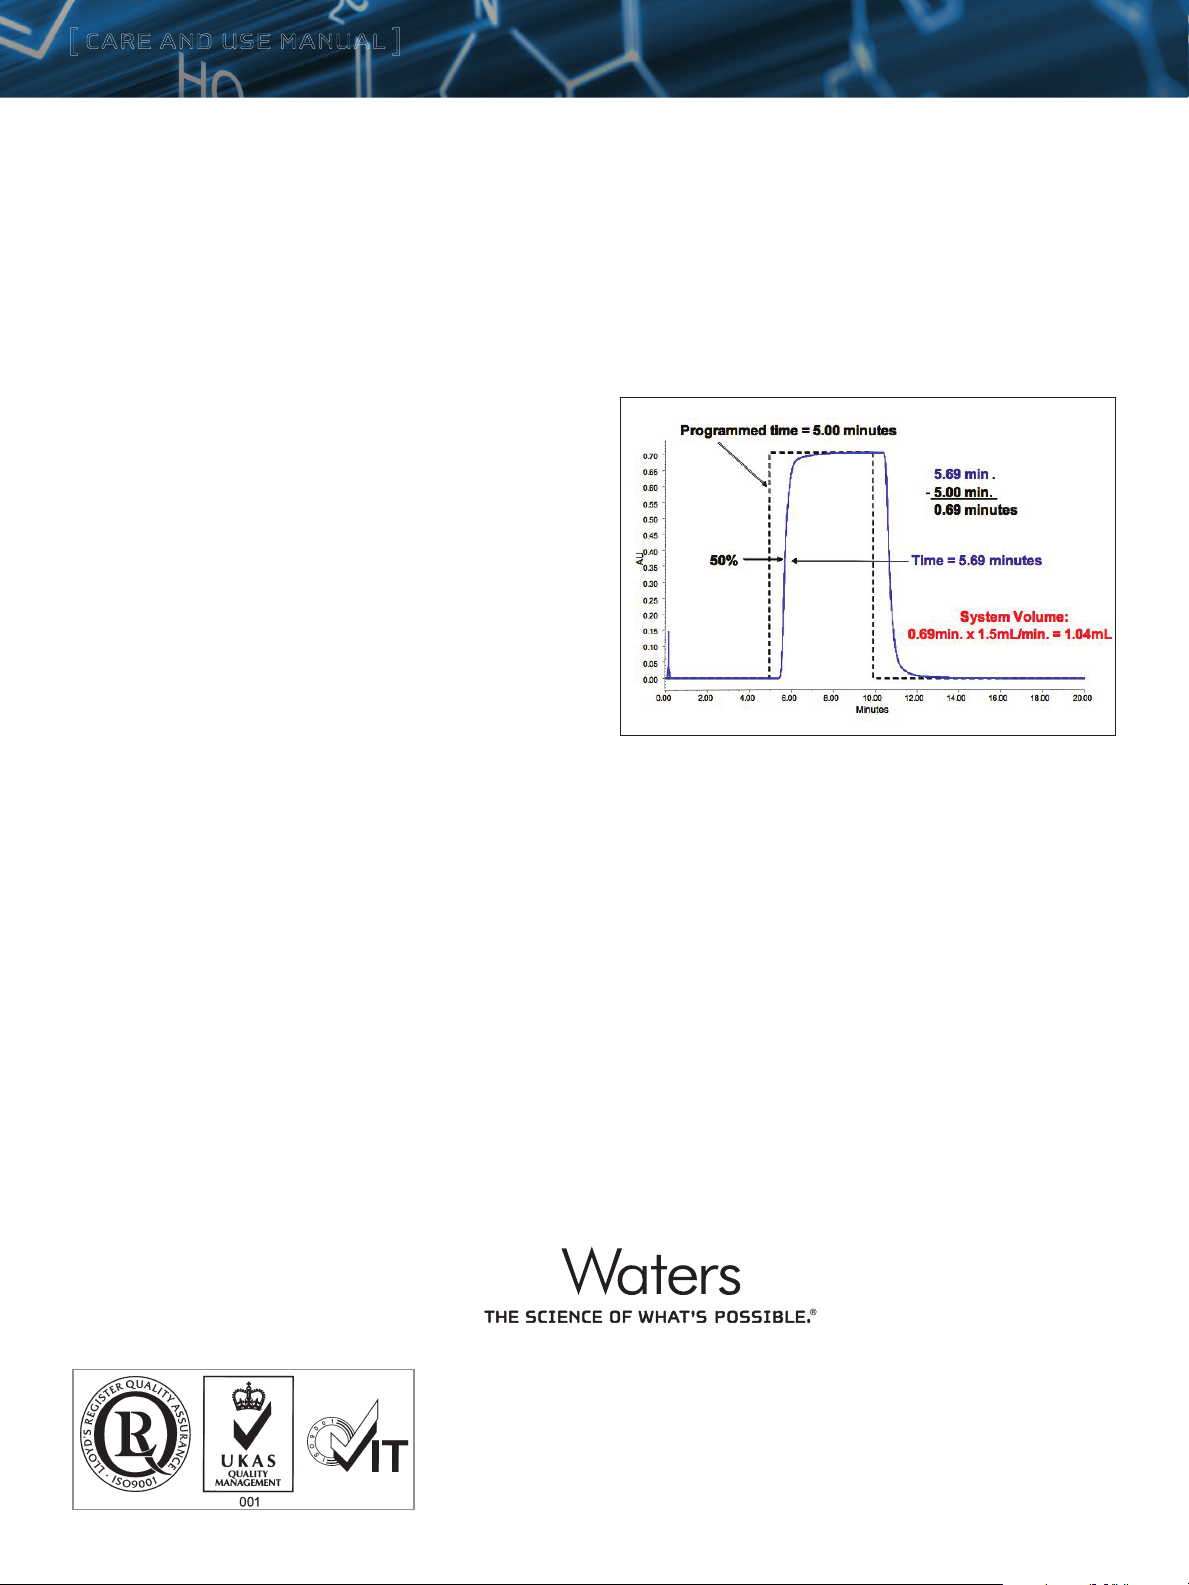
VIII. MEASURING SYSTEM VOLUME
(OR DWELL VOLUME)
1. Remove column.
2 . Use acetonitrile as A, and acetonitrile with 0.05 mg/mL uracil
as B (eliminates non-additive mixing and viscosity problems).
3. Monitor 254 nm.
4. Use the flow rate in the original method and the intended
flow rate on the target instrument.
5. Collect 100% A baseline for 5 min.
6. At 5.00 min, program a step to 100% B, and collect data for
an additional 5 min.
7. Measure absorbance difference between 100% A and 100% B.
8. Measure time at 50% of that absorbance difference.
9. Calculate time difference between start of step and 50% point.
10. Multiply time difference by flow rate.
Figure 10: Determination of System Volume
©2014 Waters Corporation. Waters, T he Science of What’s Possible
and XBridge are registered trademarks of Waters Corporation.
MassPREP is a trademark of Waters Corporation.All other trademarks
are property of their respective owners.
February 2014 WAT715001869 Rev D VW-PDF
Waters Corporation
34 Maple Street
Milford, MA 01757 U.S.A.
T: 1 508 478 2000
F: 1 508 872 1990
www.waters.com
 Loading...