

Page 1

[ Care and Use ManUal ]
styragel column
I. IntroductIon
This manual covers the care and use of the Waters Styragel® HR, HT, and HMW
families of Gel Permeation Chromatography (GPC) columns. Please take a few
moments to read this manual carefully. Follow the recommendations in this
manual to prolong column life and enhance chromatographic reproducibility.
This introduction describes the three families of Waters Styragel columns:
• Styragel HR
• Styragel HT
• Styragel HMW
Waters Styragel columns are packed with high-performance, fully porous, highly
cross-linked styrene-divinylbenzene copolymer particles. Their different charac-
teristics allow you to choose the column optimally suited to your application.
Styragel columns are shipped in three solvents: toluene, tetrahydrofuran (THF),
and dimethylformamide (DMF).
contents
I. IntroductIon
a. Styragel HR
b. Styragel HT
c. Styragel HMW
II. InstallIng the column Bank
a. Preparing the GPC/HPLC System
b. Installing the Columns
c. Repairing Damaged Compression Screw Assemblies
d. Equilibrating the Column Bank
III. PreParIng solvent and samPles
a. Preparing the Solvent
b. Changing Solvents
c. Preparing the Sample
Iv. usIng the column
a. Chromatography Guidelines
b. Calibrating the Column
Styragel Columns 1
v. care and maIntenance
a. Troubleshooting
b. Storing the Column
c. Efficiency Testing
1. Testing Instrument Band Spreading
2. Column Efficiency Test
Page 2

[ Care and Use ManUal ]
a. Waters Styragel HR
Use Waters Styragel HR columns for the high-resolution analysis of low-
molecular weight polymers, oligomers and additives. Packed with 5 µm
particles, Waters Styragel HR columns provide the high plate counts necessary
for this type of analysis.
b. Waters Styragel HT
Use Waters Styragel HT columns for the analysis of polymers with mid-range
molecular-weight distributions. They are the most versatile columns for
molecular-weight analysis. Waters Styragel HT columns are packed with 10 µm
particles to provide dependable performance over a wide range of temperatures
and solvents.
c. Waters Styragel HMW
Waters Styragel HMW columns are designed for the molecular-weight analysis
of ultrahigh-molecular-weight polymers. Their 20 µm particle size together with
the nominally 10 µm HMW frit design prevents the breakdown of ultrahigh
molecularweight polymers due to shear, which can occur with smaller particles.
This manual covers both column sizes 7.8 x 300 mm columns, and the solvent
efficient 4.6 x 300 mm columns. In sections with recommend flow rates or
spare parts, the 4.6 mm column conditions, or spare part follow immediately
after the 7.8 mm recommendations.
3. Flush the system to remove any microparticulates and old solvents.
Flush the injector loop if applicable.
Band spreading
The connection tubing and fittings in any chromatographic system contribute
to extra-column band spreading. Before installing the column, me sure your
system instrument band spreading (see Section on Testing Instrument Band
Spreading). If this test is not possible with your system, refer to your system
operator’s manual.
Narrow-Bore Chromatography for 4.6 mm Solvent Efficient Columns
The peak volume in a narrow-bore system is so small, it is critical to minimize
band spreading. Use the shortest tubing possible for all connections. It is not
necessary to use a microbore flow cell in your detector or to change your
conventional HPLC system in any way. Use 0.009-inch (0.25 mm) i.d. tubing
throughout the system.
b. Installing the Columns
When connecting columns in series, use the 0.009 inch (0.25 mm) i.d.
U-shaped column-joining tube supplied with each column.
Sequence of columns in a column bank
II. InstallIng the column Bank
This chapter describes:
• Preparing the GPC/HPLC system
• Installing the columns
• Repairing damaged compression screw assemblies
• Equilibrating the column
a. Preparing the GPC/HPLC System
Before attaching the columns in the flow path on a GPC/HPLC system, you
must first prepare the system:
1. Directly connect the system injector to the detector by replacing
the old columns with a zero-dead-volume union.
2. Convert the system to the solvent in which the columns have been
stored. For a new column set, this is the shipping solvent.
Generally, the results of an analysis are independent of the sequence in which
a column bank is arranged. However, to improve resolution and column life,
arrange the columns in order of decreasing pore size, with the column with
the largest pore size closest to the injector. This is recommended because:
• The columns with the larger pore sizes are more rugged and are
better able to tolerate the accumulation of extraneous materials.
• The species with the highest molecular-weight in the sample
contributes the most to the viscosity of the sample. If the largest
species is separated first, the viscosity decreases more quickly,
placing less strain on the column bank. In the case of ultrahigh MW
polymers, there is less shear on the sample.
Styragel Columns 2
Page 3
[ Care and Use ManUal ]
Installing columns in a column bank
To install your columns:
1. Remove the end plugs from each column and save them.
2. Connect the first column to the injector outlet tubing. Ensure that
solvent flow is in the direction shown by the arrow on the column
label. Finger-tighten the fittings, then tighten the fittings with a
wrench by another 1/4 turn.
3. Connect the next column to the previous column using the U-tubes
supplied with the columns. Ensure that solvent flow is in the
direction shown by the arrow on the column label. Thread the
inlet and outlet fittings of the U-tube until finger tight, then
tighten the fittings by another turn with a wrench.
4. Repeat step 3, until all columns are connected.
5. Connect the last column to the detector inlet tubing using steps
1 through 4.
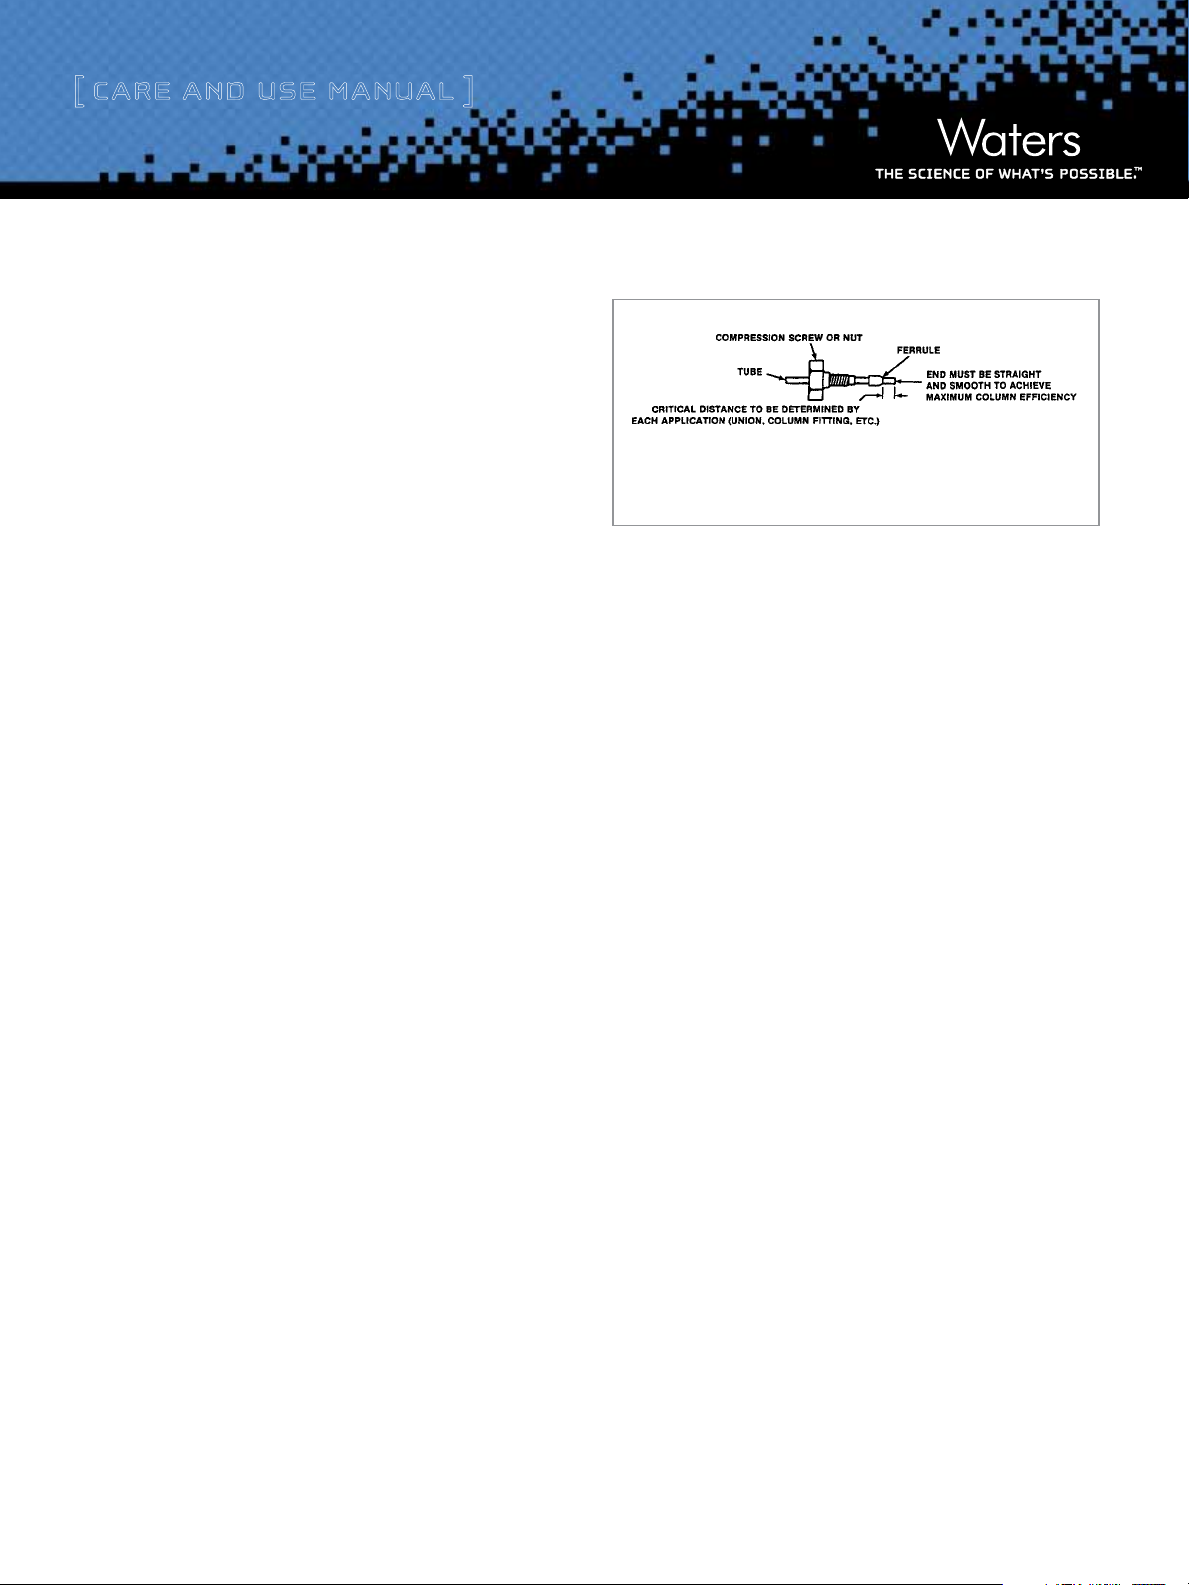
c. Repairing Damaged Compression Screw Assemblies
To remove a damaged compression screw or a worn ferrule assembly:
Figure 1. Ferrule and Compression Screw Assembly
Ferrule 0.009-inch I.D. Tubing (0.25 mm) 0.130-inch gap (3.3 mm)
The distance between the end of the ferrule and the end of the U-tube may
differ for different column types. If you have used columns from another
manufacturer, it may be necessary to reset the ferrules, or make up a new
fitting (see Figure 1). Use 0.009-inch (0.25 mm) i.d. tubing for all lines
between the injector and detector. For Waters columns, the critical distance is
0.130 inch (2.25 mm).
d. Equilibrating the Column Bank
Equilibrate the columns when you install them and when you use them after
they have been stored. To equilibrate your column bank:
1. Set the pump flow rate at 0.0 mL/min, then turn on the pump.
1. Scribe the circumference of the tubing at the desired break point
using a tube cutter or a file with a cutting edge.
2. Grasp the tubing on both sides of the scribe mark with cloth-
covered pliers (to prevent marring the tube surface). Gently
work the tube back and forth until it separates at the scribe mark.
Ensure that the tubing end is straight, open, and free of burrs.
3. Slide the compression screw, followed by the ferrule (large end of
the taper first), over the tube. Properly bottom the tubing in the
fitting seat. If the tubing is not completely seated, the resulting
dead volume can lead to poor chromatographic results.
2. Increase the flow rate by 0.1 mL/min at 15 second intervals until
you reach the final flow rate.
3. Purge the columns with the shipping solvent until you obtain a
stable baseline.
Styragel Columns 3
Page 4
[ Care and Use ManUal ]
Flow rate and backpressure for 4.6 mm
Solvent Efficient Columns
For best resolution and maximum column life, do not allow the flow rate to
exceed 0.3 mL/min or the backpressure to exceed 3.5 MPa (500 psi, 35 atm)
per column.
Please note: The flow rate recorded on the Certificate of Analysis, included
with the column, may be higher than the guidelines provided. For maximum
column life in your lab, please follow the flow and back pressure guidance
we provide.
When using the HR 0.5, HR 1, and HR 2 columns, increase the flow rate in 0.1
mL/min increments at 30-second intervals until you reach 0.3 mL/min.
Defective columns
One or more defective columns in a series may cause the entire set of columns
to appear defective. One defective column can cause peak spreading that
cannot be overcome by any number of good columns. See Table 4, Table 5,
or Table 6 for column efficiency data.
Initial efficiency tests
Test your system and columns before the first analysis. Run a test sample
using the recommended parameters for your system and columns, and record
the results. These results serve as a baseline to compare future performance.
See Section on Efficiency Testing, for the procedures to determine the
efficiency of your system and columns.
a. Preparing the Solvent
Use clean solvent for reproducible results and maintenance-free operation. Use
solvents of LC-grade or better, filtered to remove micro particulate matter larger
than 0.45 µm. Refer to Waters catalog, filtration section for filter choice and
solvent compatibility chart.
b. Changing Solvents
Solvent compatibility
Waters Styragel columns are shipped in the solvent of your choice: toluene,
THF or DMF. Some applications require a different solvent. Changing solvents
works best between compatible solvents. Refer to the table below for solvent
compatibilities.
Note: The use of highly aqueous mobile phases may damage the resin and is
not recommended.
Table 1. Solvent Conversion Table
To convert to:
o-Dichlorobenzene Toluene
Trichlorobenzene Toluene Hexafluoroisopropanol THF
Phenol/TCB Toluene N-Methyl pyrrolidone DMF
y-Butyrolactone THF m-Cresol DMF
Use columns
shipped in:
To convert to:
To use Waters Styragel columns for high-temperature chromatography in
solvents like trichlorobenzene (TCB) or orthodichlorobenzene (ODCB), you
must convert the column to the selected solvent at elevated temperature.
Use columns
shipped in:
Save the chromatograms from these tests. For the column-efficiency test,
record the retention times, system settings, and all experimental conditions
so they may be reproduced exactly for future comparison.
III. PreParIng solvent and samPles
This chapter describes:
• Preparing the solvent
• Changing solvents
• Converting columns to high temperature solvents
• Preparing the sample
Styragel Columns 4
High-temperature conversion procedure
To convert the column bank to high-temperature operation:
1. Convert the system to the column shipping solvent at room
temperature.
2. Purge solvent efficient columns at 0.1 mL/min while gradually
increasing the temperature to 90 ˚C over a minimum of 3 hours.
Solvent Efficient Columns
(Purge solvent efficient columns at 0.1 mL/min while gradually
increasing the temperature to 90 ˚C over a minimum of 3 hours.)
Set the system to 55 ˚C when converting columns from THF to
HFIP or Y _ Butyrolactone.
Page 5

[ Care and Use ManUal ]
3. With the system at 90 ˚C, convert to the high-temperature solvent
at 0.1 mL/min using 12 mL per column. Then purge the system
for a minimum of four column volumes at 0.2 mL/min.
When using a bank of columns, multiply the number of column
volumes specified in the procedure by the number of columns
being used.
4. Convert to the high-temperature solvent using a flow rate of 0.1
mL/min. Use at least 20 mL per column.
5. Increase the temperature to the final conditions over a minimum
of four hours while continuing to purge the column at 0.1 mL/min.
Never exceed 150 ˚C.
Increase the temperature to the final conditions over a minimum
of four hours while continuing to purge the column at 0.1 mL/min.
Never exceed 150 ˚C.
6. Adjust the flow rate to the final operating conditions. T he optimal
flow rate is 0.3 ml/min.
Adjust the flow rate to the final operating conditions. The optimal
flow rate is 0.3 ml/min.
Returning to room temperature
To return the columns to room temperature, reverse the above procedure.
Alternatively, set the flow rate to 0.1 mL/min and reduce the temperature by
10 ˚C every 30 minutes.
Restarting the column
To restart the column, maintain a flow rate of 0.1 mL/min and increase the
temperature to the desired temperature over 10 hours. Then program the
desired operating flow rate.
c. Preparing the Sample
Good sample preparation prolongs column life and ensures reproducible
results. Take into account factors such as the capacity of the column,
sample viscosity, and the type and sensitivity of the detector. Remove
micro particulates with a 0.45 µm filter. Refer to Waters catalog for filter
choice and solvent compatibility chart.
Reactive polymers
Some reactive polymers (such as epoxies) may “condition” the column.
Improve column life and reproducibility by dedicating columns to specific
classes of reactive polymers.
Sample concentration
Sample concentration affects both viscosity and injection volume. While small
sample amounts produce narrower peaks, viscous samples may require larger,
more dilute samples. Table 2 lists the recommended concentration of sample
for optimal results.
High-molecular-weight polymers
High-molecular-weight polymers are especially susceptible to viscosity
problems. When analyzing high-molecular-weight polymers, use the con-
centrations indicated in Table 2. Run narrow-distribution polymers, such as
polystyrene standards, with an injection volume of 50 µL per column (20 µL per
column for solvent efficient columns) at a concentration of 0.02 percent.
Polystyrene standards with molecular weights of approximately four million or
greater become increasingly susceptible to degradation by shearing in solu-
tion. Shearing is indicated by molecular-weight distributions that are broader
than expected. With proper handling, polymers with molecular weights as high
as 20 million can be handled successfully.
For maximum column life, avoid temperature cycling. Maintain operating
temperature but reduce flow rate to 0.1 mL/min when columns are not
in use.
Styragel Columns 5
Page 6

[ Care and Use ManUal ]
Styragel® HR
Molecular Weight
Styragel® HR 0.5
Styragel
®
HR 1
Styragel
®
HR 2
Styragel
®
HR 3
Styragel® HR 4
Styragel
®
HR 5
Styragel
®
HR 6
Styragel
®
HR 4E
Styragel
®
HR 5E
Elution Volume (mL)
Table 2. Recommended Sample Concentrations
Molecular-weight Range Sample Concentration
0 to 25,000 <0.25%
25,000 to 200,000 <0.1 %
200,000 to 2,000,000 <0.05%
Above 2,000,000 <0.02%
Ultrahigh-molecular-weight polymers
Shearing is also a factor to be considered with most ultrahigh-molecular-weight
polymers. The effect of shearing may not be as easily observed as it is with
narrow molecular-weight standards. Ultrahigh-molecular-weight polyolefin frac-
tions are subject to possible shearing and incipient precipitation. Use especially
dilute solutions of these fractions (for example, 0.02 percent) to minimize
precipitation.
Iv. usIng the column
This chapter describes:
• Chromatography guidelines
• Calibrating the column
a. Chromatography Guidelines
Gel permeation chromatography columns have a finite lifetime directly related
to their care and use. Column life is reduced by contamination from samples
and eluents, frequent solvent changeover, improper handling and storage, and
temperature cycling.
Guidelines for column use
When using Waters Styragel columns, observe the following guidelines:
• Protect the column from rapid changes in pressure that can result
from rapidly changing the composition of the solvent.
• When changing to a solvent with a different viscosity, it may be
necessary to adjust the flow rate to stay below the operating
backpressure specification of 3.5 MPa (500 psi, 35 atm) per
column.
• Avoid precipitation by dissolving samples in the mobile phase.
• Always use high-quality HPLC solvents.
• Dedicate columns to specific applications. Frequent switching of
samples and solvents accelerates column deterioration and loss
of resolution.
• Using highly aqueous mobile phases may damage the resin and is
not recommended.
b. Calibrating the Column
Whenever you replace a single column or a complete column bank, generate a
new calibration curve to ensure the reproducibility of your application. Figure
2, Figure 3, and Figure 4 show typical calibration curves by column family. The
calibration curves were obtained with polystyrene standards.
Figure 2. Calibration Curves for Waters Styragel HR Columns
Elution Volume (mL)
Styragel® HR 0.5
Styragel
Styragel
Styragel
Styragel® HR 4
Styragel
Styragel
Styragel
Styragel
®
HR 1
®
HR 2
®
HR 3
®
HR 5
®
HR 6
®
HR 4E
®
HR 5E
• For best resolution and maximum column life, do not exceed a flow
rate of 1.0 mL/min or the backpressure exceed 3.5 MPa (500 psi,
35 atm) per column (corrected for system backpressure).
• For solvent efficient columns, best resolution and maximum
column life, do not let the flow rate exceed 0.3 mL/min or the
backpressure exceed 3.5 MPa (500 psi, 35 atm) per column
(corrected for system backpressure). Normal flow rate for these
columns is 0.3 mL/min.
• Protect the column from vibration and mechanical shock.
• Minimize temperature cycling.
Styragel Columns 6
Page 7

[ Care and Use ManUal ]
Styragel® HT 2
Elution Volume (mL)
Styragel
®
HT 3
Styragel
®
HT 4
Styragel® HT 5
Styragel
®
HT 6
Styragel
®
HT 6E
Styragel® HMW 2
Elution Volume (mL)
Styragel
®
HMW 6E
Styragel
®
HMW 7
Figure 3. Calibration Curves for Waters Styragel HT Columns
Styragel® HT
Elution Volume (mL)
Styragel® HT 2
Styragel
Styragel
Styragel® HT 5
Styragel
Styragel
Molecular Weight
v. care and maIntenance
This chapter describes:
• Troubleshooting
• Storing the column
®
HT 3
®
HT 4
®
HT 6
®
HT 6E
Figure 4. Calibration Curves for Waters Styragel HMW Columns
Styragel® HMW
Elution Volume (mL)
Styragel® HMW 2
Styragel
Styragel
Molecular Weight
®
HMW 6E
®
HMW 7
• Efficiency testing
a. Troubleshooting
Table 3 describes specific problems, causes, and corrective actions.
Table 3. Column Troubleshooting
Problem Cause Corrective Action
Buildup in system operating
pressure
Loss of resolution, broad peaks,
low plate counts
Styragel Columns 7
Inlet filter insert (from the first column only) plugged with par-
ticulates Injector and pump seal shedding
Clogged tubing Replace the tubing
Filter inserts partially blocked
Failing injector Repair the injector
Insufficient equilibrium Continue equilibrium
Column damaged Replace column
Replace the inlet filter insert.
Install a Styragel Guard column.
Fit an in-line filter between the pump and the
first column.
Replace or clean inlet
and/or outlet filter inserts
Page 8

[ Care and Use ManUal ]
Diluted/Distorted Sample Band
b. Storing the Column
If you will be using the column again in less than 24 hours, special storage
procedures are unnecessary. However, be sure that the columns never dry out.
For longer storage periods, return the column to its box with the end plugs
firmly in place for storage. Do not leave a column at elevated temperatures
without solvent flow.
For maximum column life, avoid temperature cycling. Maintain operating
temperature and reduce flow rate to 0.1 mL/min when columns are not in use.
To restart the column, maintain a flow rate of 0.1 mL/min and, if applicable,
increase the temperature gradually over 10 hours. Then set the flow rate to
the desired operating flow.
c. Efficiency Testing
Waters columns are tested for adherence to our specifications. Slight variations
may occur depending on:
• The type and condition of equipment used
• The nature of the sample
1) Testing Instrument Band Spreading
Test procedure
The band spreading of a properly operating system should be less than
150 µL (75 µL for solvent efficient columns). To determine the band spreading
of your system:
1. Remove the column(s) from the system.
2. Connect the inlet and outlet tubing with a zero dead-volume
union.
3. Set the flow rate to 1.0 mL/min.
4. Use a fast chart speed to obtain a peak of easily measurable
width. If you use a data system, set the sampling rate to at least
10 data points per second. You may need to adjust the detector
sensitivity to keep the peak on scale.
Figure 5. Method for Calculating Band Spreading
Add calculation N= 25 (Vr/W)^2
• Instrument settings
Perform your own efficiency tests. To test both your system and each column
in the system, carry out both of these tests:
• Instrument band-spreading test
• Column-efficiency test
When to perform efficiency tests
Perform efficiency tests each time you add columns or otherwise change your
system. Then, as you use the system, conduct efficiency tests on a regular
schedule.
If problems occur during normal operation of the column, repeat the conditions
for the initial efficiency tests and compare the results. Monitor instrument
band spreading by performing a column efficiency test without the column in
line. Resolve excessive band spreading before installing columns.
5. Inject the same sample as for a plate count determination (see
Table 4, 5, or 6).
6. Measure the width of the resulting peak at 4.4% of the peak height
to obtain a value in µL.
Figure 5 illustrates the 5 sigma method, in which the width of the peak (w) is
measured at 4.4% of the peak height (h).
Styragel Columns 8
Page 9

[ Care and Use ManUal ]
2) Column Efficiency Test
The column-efficiency test described below may be used to calculate a theoreti-
cal plate count, which is a measurement of column efficiency within your system.
Solvents
It is not necessary to use the solvent that your column is shipped in to deter-
mine the efficiency of your column. Initial plate counts that are determined
using different solvents will have different values. Test columns individually
using your normal operating solvent.
Test procedure
To perform a column efficiency test:
1. Slowly increase the flow rate to 1.0 mL/min for the HR 0.5,
HR 1, HR 2, and HR 4E columns, or to 2.0 mL/min for all
other columns.
2. Adjust the detector to an attenuation that achieves a peak of 70
percent full scale (noise level <0.5 percent full scale).
3. Set the recorder chart speed to 50 mm/min, or the data system
sampling rate to at least 5 data points per second.
4. Inject up to 20 µL of marker solution. Use a solution of up to 10
percent marker in solvent. Use up to 5 µL for solvent efficient
columns.
Refer to Table 4, Table 5, or Table 6 for the marker to use when performing
the efficiency test.
5. Record the retention time, instrument settings, and column con-
figuration so you can reproduce them exactly for comparison in
the future.
6. Compute the plate count using the tangent method (see
Figure 6). Use these results for comparison throughout the life
of your column.
7. Replace any column that exhibits a plate count more than 30
percent below the original value.
Table 4. Conditions and sample for 7.8 mm for Column Efficiency Test:
HR Columns
Column
Type
HR 0.5 Acetone Propylbenzene Ethyleneglycol 1.0
HR 1 Acetone Propylbenzene Ethyleneglycol 1.0
HR 2 Acetone Propylbenzene Ethyleneglycol 1.0
HR 3 ODCB Acetone Acetone 2.0
HR 4 ODCB Acetone Acetone 2.0
HR 4E Acetone Propylbenzene Ethyleneglycol 1.0
HR 5E DCHP
1
Toluene THF DMF
2
Acetone Acetone 2.0
Flow Rate
mL/min
Dicyclohexylphthalate
Table 5. Conditions and Sample for 4.6 mm Column Efficiency Test:
HR Columns
Column
Type
HR 0.5 ODCB 0.3 Acetone 0.3 Acetone 0.3
HR 1 ODCB 0.3 Acetone 0.3 Acetone 0.3
HR 2 ODCB 0.3 Acetone 0.3 Acetone 0.3
HR 3 ODCB 0.3 Acetone 0.3 Acetone 0.3
HR 4 ODCB 0.3 Acetone 0.3 Acetone 0.3
HR 4E ODCB 0.3 Acetone 0.3 Acetone 0.3
HR 5E
Toluene THF DMF
Marker
DCHP
Flow Rate
(mL/min)
2
0.3 Acetone 0.3 Acetone 0.3
Marker
Flow Rate
(mL/min)
Marker
Flow Rate
(mL/min)
Styragel Columns 9
Page 10

[ Care and Use ManUal ]
Table 6. Conditions and sample for 7.8 mm for Column Efficiency Test:
HT Columns1
Column Type Toluene THF DMF
HT 3 ODCB Acetone Acetone 2.0
HT 4 ODCB Acetone Acetone 2.0
HT 5 ODCB Acetone Acetone 2.0
HT 6 DCHP Acetone Acetone 2.0
HT 6E DCHP Acetone Acetone 2.0
Flow Rate
(mL/min)
Table 7. Conditions and sample for 4.6 mm for Column Efficiency Test:
HT Columns1
Column
Type
HR 3 ODCB 0.3 Acetone 0.3 Acetone 0.3
HR 4 ODCB 0.3 Acetone 0.3 Acetone 0.3
HR 5 ODCB 0.3 Acetone 0.3 Acetone 0.3
HR 6 DCHP 0.3 Acetone 0.3 Acetone 0.3
HR 6E
Toluene THF DMF
Flow Rate
Marker
(mL/min)
DCHP 0.3 Acetone 0.3 Acetone 0.3
Marker
Flow Rate
(mL/min)
Marker
Flow Rate
(mL/min)
Table 8. Test Condition and Sample for Efficiency Test 7.8 mm HMW
Columns
Column Type Toluene THF DMF
HMW 7 DCHP Acetone Acetone 2.0
HMW 6E DCHP Acetone Acetone 2.0
Flow Rate
(mL/min)
Figure 6. Tangent Method for Calculating Column Efficiency
N = 16 (tR/w)2
tR = Elution distance from injection point to the peak
apex on the chart paper.
W= Peak width of marker measured where tangents
drawn on peak intersect baseline (same units as tRj.
Styragel Columns 10
Page 11

[ Care and Use ManUal ]
Sales Offices
Austria and European Export
(Central South Eastern Europe, CIS
and Middle East) 43 1 877 18 07
Australia 61 2 9933 1777
Belgium 32 2 726 1000
Brazil 55 11 5094 3788
Canada 1 800 252 4752
China 86 10 5293 6688
Czech Republic 420 2 617 11384
Denmark 45 46 59 8080
Finland 358 9 5659 6288
France 33 1 30 48 72 00
Germany 49 6196 400 600
Hong Kong 852 2964 1800
Hungary 36 1 350 5086
Norway 47 6 384 6050
Poland 48 22 833 4400
Puerto Rico 1 787 747 8445
Russia/CIS 7 495 727 4490/ 290 9737
Singapore 65 6593 7100
Spain 34 93 600 9300
Sweden 46 8 555 115 00
Switzerland 41 56 676 7000
Taiwan 886 2 2501 9928
United Kingdom 44 208 238 6100
All other countries:
Waters Corporation U.S.A.
1 508 478 2000
1 800 252 4752
www.waters.com
India 91 80 2837 1900
Ireland 353 1 448 1500
Italy 39 02 265 0983
Japan 81 3 3471 7191
Korea 82 2 6300 4800
Mexico 52 55 52 00 1860
The Netherlands 31 76 508 7200
©2011 Waters Corporation. Waters, The Science of W hat’s Possible, and Styragel are trademarks of Waters Corporation.
January 2011 WAT044491 Rev 4 VW-PDF
Waters Corporation
34 Maple Street
Milford, MA 01757 U.S.A.
T: 1 508 478 2000
F: 1 508 872 1990
www.waters.com
Styragel Columns 11
 Loading...