

Page 1

[ CARE AND USE MANUAL ]
Preparative Chromatography Mix Standard
CONTENTS
I. INTRODUCTION
a. The Purpose of a QCRM
b. Determining your QCRM Criteria
c. What Affects your QCRM Result
II. STORAGE & STABILITY
III. USING THE PREPARATIVE CHROMATOGRAPHY MIX
IV. QCRM TESTING
V. TROUBLESHOOTING
VI. ORDERING INFORMATION
I. INTRODUCTION
The Quality Control Reference Material (QCRM) portfolio is a unique
collection of standards and mixtures. These products allow users to
evaluate and benchmark the chromatography system before analysis
of critical material. The products in the portfolio are all precisely
formulated based on the expertise of Waters scientist.
The preparative chromatography mix is 5 mg/mL each of Diclofenac
sodium salt, Diphenhydramine hydrochloride, and Flavone in DMSO.
This standard mix should be used to confirm the benchmark
performance of your Preparative/purification system. This particular
QCRM is a precisely formulated mix that includes a void marker,
neutral, acidic and basic compounds. These compounds were
vigorously tested and evaluated and chosen because they provide
the following advantages:
– Well-separated
– Easily visually identified
– Acceptable for use on a variety of column
Preparative Chromatography Mix
a. The Purpose of a QCRM:
Waters recommends to benchmark your chromatographic system with
a QCRM prior to system usage when there is confidenence your system
is in good working order. It is recommended to run and save the
initial results and continue to compare your QCRM results to the
previous benchmark any critical assay is run, and after any hardware,
column or mobile phase changes.
The QCRM benchmark result will be specific to the performance
of the system it is run on. All chromatographic systems have some
minor level of variability from run to run. Trending the benchmark
results over time will provide an understanding of system typical
variability. Trending of the same QCRM result on multiple systems
will provide the typical variability of those systems. Trending of the
same QCRM result on systems in laboratories in different locations
will provide the typical variability from across locations. Setting
specification for QCRM results of a system, multiple systems or
1
Page 2

[ CARE AND USE MANUAL ]
between laboratories should not be done without sufficient data
trending. Once variability is understood, QCRM results will help
determine the capability of the system to provide reliable results.
Determining your QCRM Criteria:
QCRM criteria should be determined based on specific requirements.
As mentioned above, specifications should not be set until the
variability of the system population is understood. The criteria and
specifications should allow it to be determined if the QCRM results
indicate that the system is functioning as expected or outside of
expectation. Typical criteria might include any of the following:
retention time reproducibility, peak area reproducibility, peak tailing
plate count, peak resolution, mass accuracy range, sensitivity
or response.
b. What affects your QCRM result:
The goal of the QCRM specifications and criteria will be to
indicate that the system is functioning as expected or outside
of expectation.
The system is comprised of many interdependent components
working together to produce results to an expected specification.
An issue with any one component can produce erroneous final
results. All components performing correctly will produce results
within an expected variability. Any changes or technical issues
within any one of the system components (hardware, software, or
chemical) may add variability to the QCRM result. Potential causes
of variability in QCRM results may include the following: mobile
phase preparation, column performance, tubing size, system
component performance (pump, injector, detector), temperature
control, data collection rate, integration.
Differences in any of the components mentioned can result in
system to system variability of results even when each system’s
components are functioning correctly.
II. STORAGE AND STABILITY:
The compounds are stable through the expiration date listed
as provided in 1 mL amber ampule before opening. This product
is for one time usage. The integrity of the standard can not be
guaranteed if stored after first use.
III. USING THE PREPARATIVE CHROMATOGRAPHY MIX
For preparative chromatographic analysis on a 19 x 50 mm column the
Preparative Chromatography Standard mix was injected at 10 µL. The
injected quantity should be scaled for other column diameters.
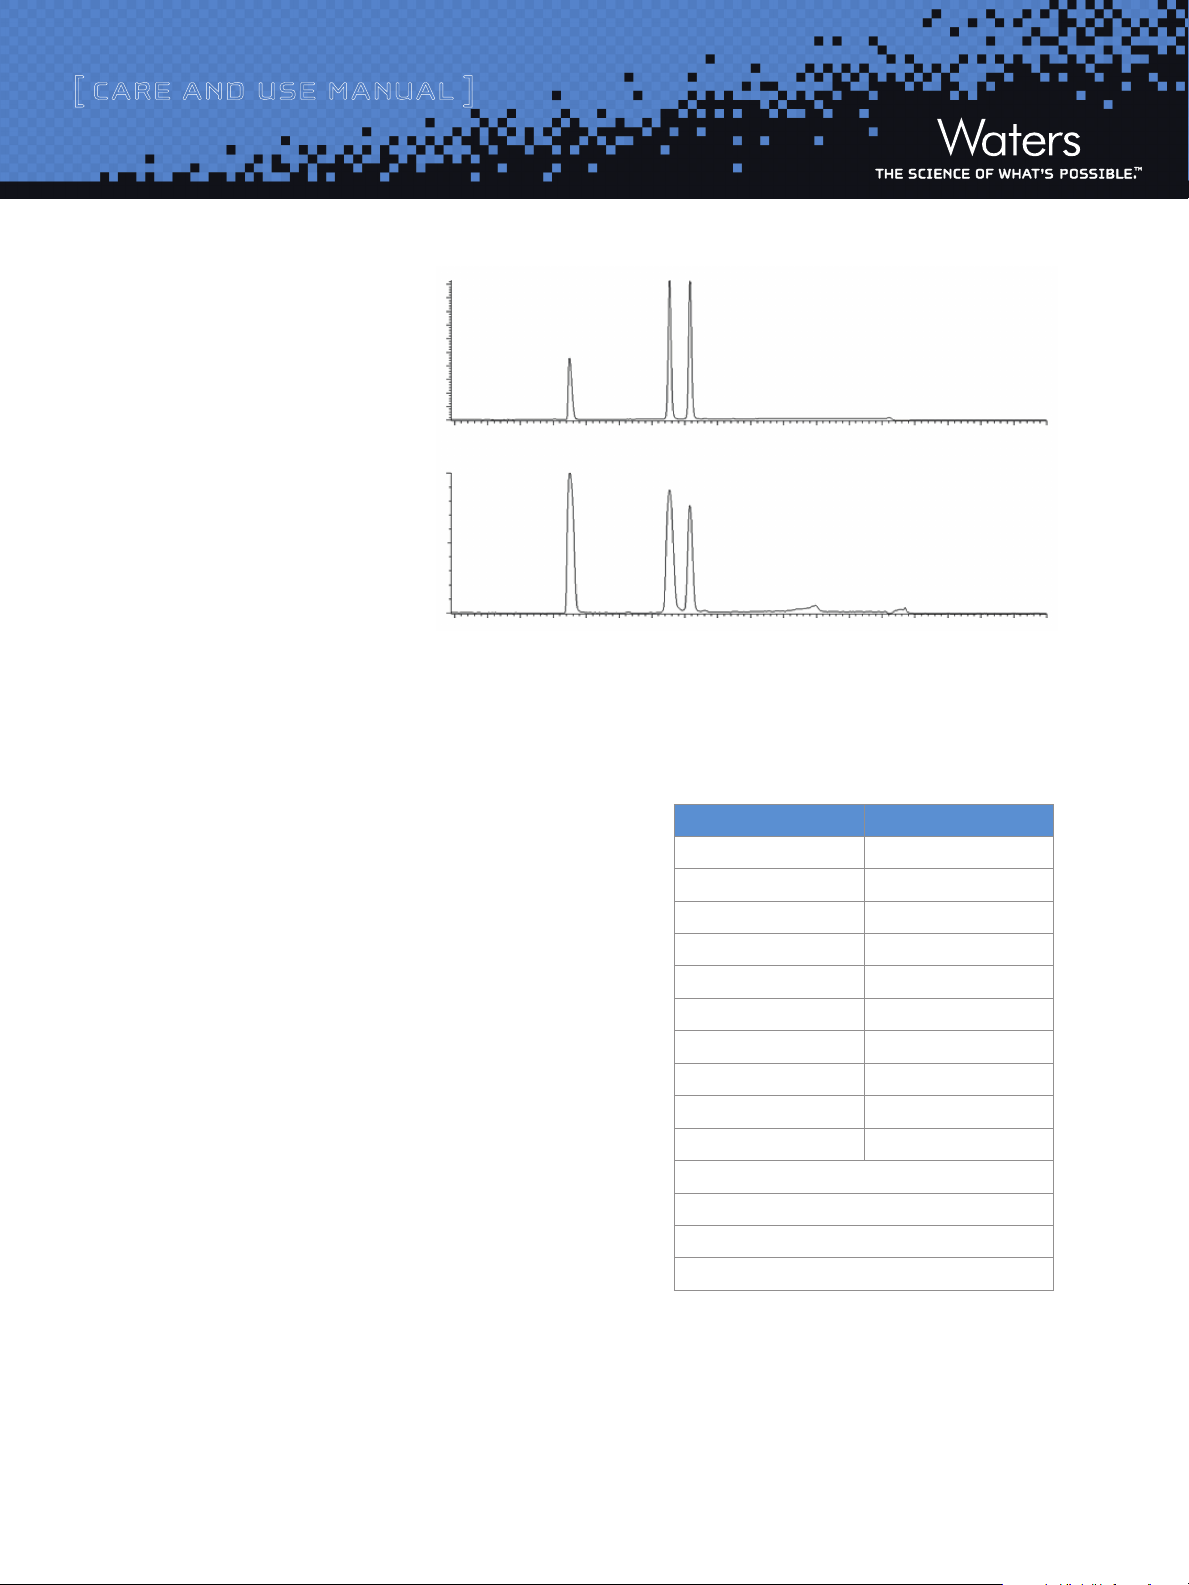
Sample chromatography for the Preparative Chromatography
Standard is shown in Figure 1. Note that the use of different column
stationary phases and/or column dimensions will have a effect on
the separation. On different column chemistries or dimensions, the
method may need to be modified or re-developed to obtain sufficient
resolution. To properly transfer the separation across column
dimensions, use the Prep Calculator. www.waters.com/prepcalculator.
The table below indicated the approximate retention times obtained
for the compounds when using the specified chromatographic method
in Figure 1, as well as the m/z criteria for each compound.
Approximate RT (min)
Compound Type
Diclofenac
sodium salt
Diphenhydramine
hydrochloride
Flavone Neutral 223.07 4.3
Table 1: Preparative Mix UV and MS
Acid 296.02 4.6
Base 256.17 2.8
MS
(M+ H)
(XSelect™ CSH™ C18, 5 µm,
19 x 50 mm)
220 nm
Preparative Chromatography Mix 2
Page 3
[ CARE AND USE MANUAL ]
91
91
Figure 2 shows an example of the
chromatography obtained for the
preparative mix via UV and MS
when the method in Figure 1 is
using an XSelect™ CSH C18, 5 µm,
19 x 50 mm.
8.0e-1
6.0e-1
AU
4.0e-1
2.0e-1
0.0
12345678
99
%
-1
1
2345678
IV. QCRM TESTING
The use of reference standards for QCRM testing should allow the
analyst to track important instrument analytical parameters such as
peak width, peak area, retention time, and peak resolution. Each of
these important parameters can be tracked and evaluated using control
charts. The use of a high quality reference standard allows the analyst
to reliably measure and track these parameters.
QCRM testing should be performed on a regular basis for each
instrument/analyst combination or instrument per test method. The
data should be collected and entered into a control chart allowing
the analyst to evaluate the system performance over time. The use of
performance control charts has been a staple of analytical chemistry
quality control. The most common form of the control charting is to
track the analytical results and statistically analyze the data to a 99%
(3 standard deviations) or 95% confidence interval (2 standard
deviations) confidence interval around the mean of the data to
esta blish upper control limits (UCL) and lower control limits (LCL).
The initial criteria to establish a mean, standard deviation and
control limits involves analyzing a reference material a minimum
of 7 times to establish an initial estimate of precision and bias. This
provides the analyst with sufficient data to be statistically valid. The
analyses should be carried over the course of several days to provide
a more realistic view of the system variability. The frequency
of analyzing system performance will be dependent on the stability
of the analysis and the analytes. QCRM should always be evaluated
after maintenance has been performed, or when changes to the
system or analytical procedure have been made.
2
3
1
1. Diphenhydramine
2. Flavone
3. Diclofenac
220 nm
+
TIC; ES
The example in Table 1 uses retention time monitoring to establish
a set of control limits for the purpose of monitoring on-going
system performance.
Table 1: Reference Standard Retention Time Data Example
Analysis Peak Retention Time (mins)
1 7.10
2 7.11
3 7.12
4 7.09
5 7.08
6 7.10
7 7.11
8 7.13
9 7.10
10 7.11
Mean 7.11
Standard Deviation 0.0136
LCL 7.08
UCL 7.13
The standard reference material was analyzed 10 times yielding
the above retention times. The mean retention time and standard
deviation were calculated and from this the UCL and LCL limits
were determined. The control limits represent a 95% confidence
interval (2 standard deviations) for the data. The control chart
in Figure 2 was then produced to establish that the instrument
retention times are in control.
0 min
0 min
Preparative Chromatography Mix 3
Page 4
[ CARE AND USE MANUAL ]
Figure 2: Retention Time Control Chart
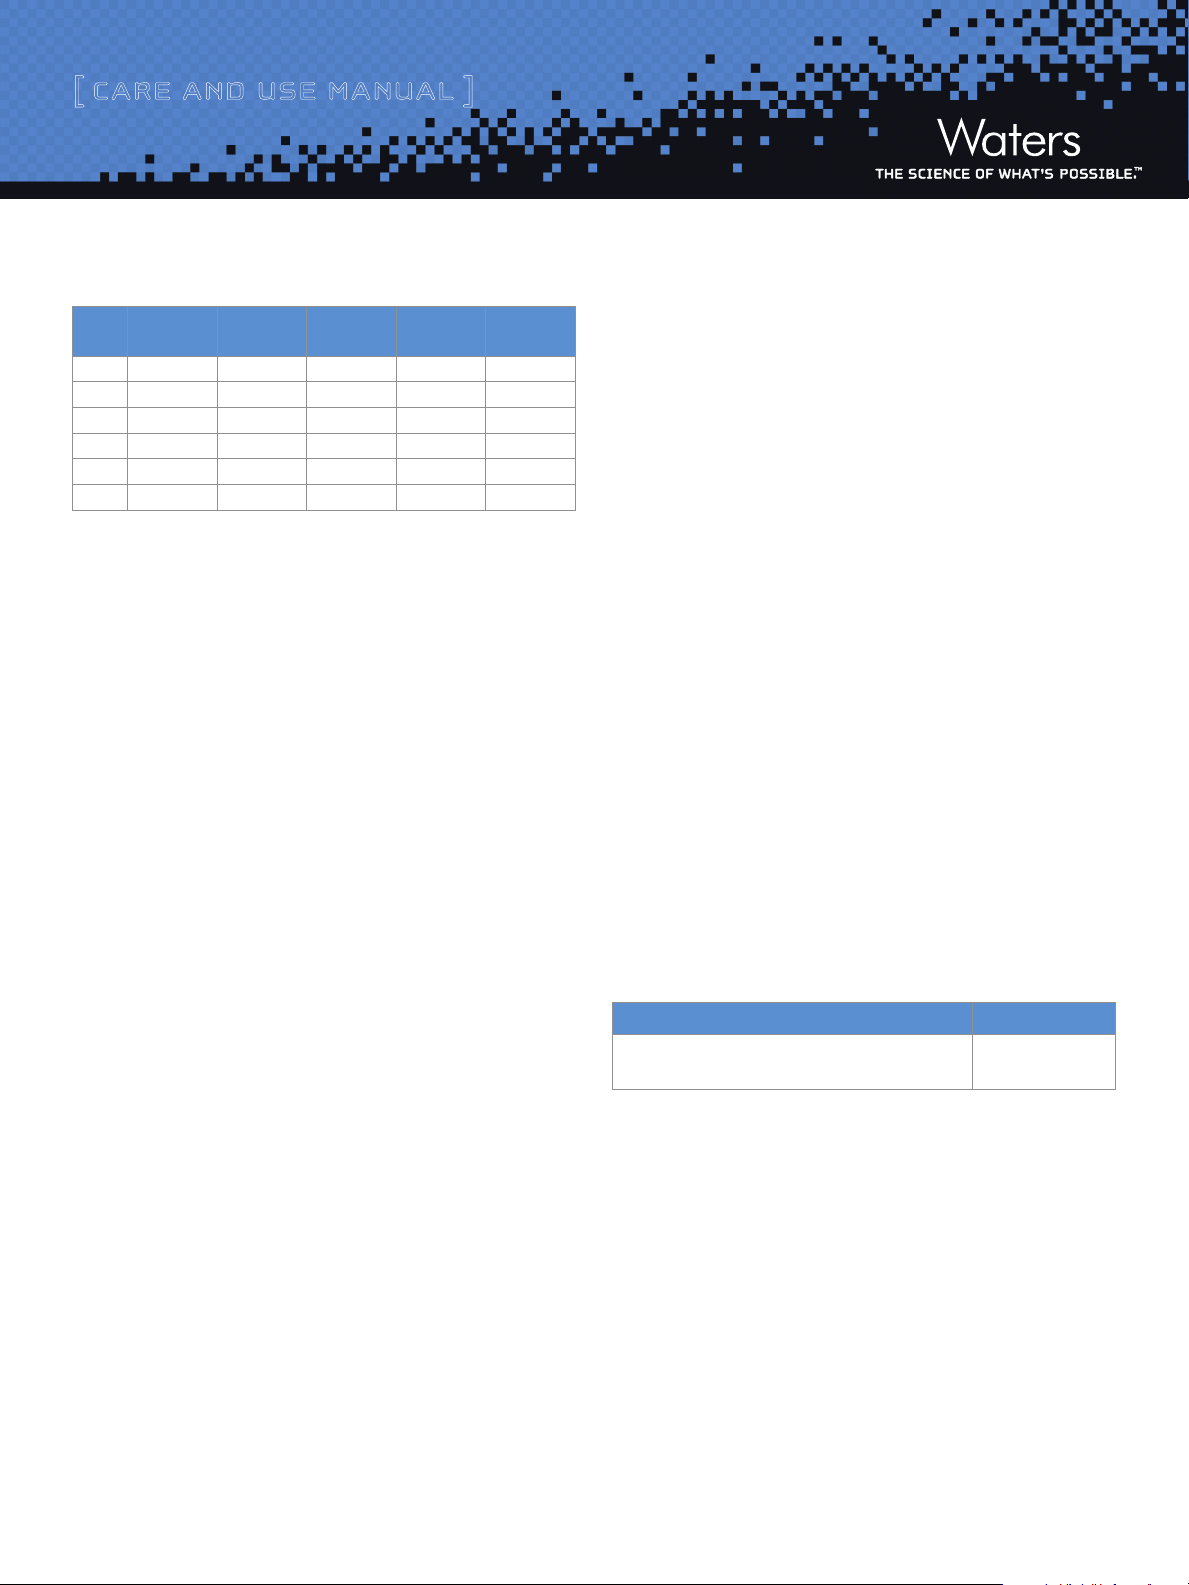
1 Initial 25.00 95.0 5.0 Initial
2 0.10 25.00 95.0 5.0 6
3 6.10 25.00 5.0 95.0 6
4 7.10 25.00 5.0 95.0 6
5 7.20 25.00 95.0 5.0 6
6 10.10 25.00 95.0 5.0 6
Time
(min)
Flow
(mL/min)
A = 0.1% TFA in water
B = 0.1% TFA in acentonitrile
%A %B Curve
The establishment of control limits provides data as to the current
capabilities of the system. Control charting allows the quality
professional to compare instrument performance to the required
method specifications.
The process of continuous quality improvement can also be tracked
using control charts. When improvements are made to a method,
control charts allow you to see that the changes you have made are
effective and having the desired impact. The control chart will also
allow you to track trends over time. By observing the data trending
higher or lower over time, you can take preventative action prior to
having an out of specification result.
V. TROUBLESHOOTING:
The Preparative Chromatography Standard contains an acidic, basic
and neutral compound. Due to the vastly different properties of
stationary phases, not all compounds will behave similarly on each
column. For instance, basic compounds often have poor peak
shape on reversed-phase columns at neutral pH due to increased
interactions between the charged bases and silanols on the surface
of the stationary phase. For this reason, it is very important to
benchmark the performance of the Preparative Chromatography
Standard on a new column and functioning system. This will help
to identify whether poor peak shape issues are due to compound
interactions on the column, or failing column/system performance.
Failure to meet QCRM criteria will result in the need to troubleshoot
the system. Some chromatographic issues may be easily resolved,
for instance, a missing peak may simply be due to co-elution of
two peaks. However, most issues such as poor peaks shape, tailing
peaks, retention time shifts and poor peak response, to name a few,
may be due to a variety of causes that can be difficult to pinpoint.
For a detailed and comprehensive guide to troubleshooting, please
refer to the HPLC Troubleshooting Guide (WA20769) on the
Waters website.
Control charting can be employed for each QCRM criteria; peak
retention time, peak area, peak width, and peak resolution. Control
charts allow quality control professionals to establish statistically
significant criteria to monitor and control their HPLC analyses
thereby avoiding criteria that are too stringent or set arbitrarily.
Summary
The use of high quality reference standards specifically designed for
the system analysis, provide a controlled, consistent, and reliable
measure of system performance. Regular use of reference standards
and control charting the data provides improved monitoring of system
performance and system robustness, while at the same time
providing assurance that any results produced are high quality,
reliable, and reproducible.
References
1) Taylor, J.K., “Quality A ssurance of C hemical Measurements”, Lewis Publishers, 1987
2) Smith, G.M., “Statistic al Process C ontrol and Quality Improvement”, 3rd edition,
Prentice Hall, 1998
3) Ahuja, S. and Dong, M.W., “Handbook of Pharmaceutical Analysis by HP LC”, Elsevier
Inc., 2005
Preparative Chromatography Mix 4
VI. ORDERING INFORMATION
Description Part Number
Preparative/Purification Chromatography
Mix Standard
Thank you for choosing a QCRM from Waters. The standards are
manufactured in our ISO 9001 ISO 17025 facility. Each standard
is manufactured to ensure optimal reproducibility from lot to lot. A
Waters QCRM can be depended on for its’ accuracy. This removes
one variable from your system variability and provides you the most
dependable starting point for your testing.
If the QCRM box shows significant damage, notify the carrier and
your supplier at once and retain evidence of shipping damage so that
a claim can be made.
186006703
Page 5

[ CARE AND USE MANUAL ]
Related Products
XSelect Preparative Columns XBridge Preparative Columns
Description Part Number
XSelect CSH C18 OBD, 5 µm, 19 x 50 mm 186005420
XSelect CSH C18 OBD, 5 µm, OBD 19 x 100 mm 186005421
XSelect CSH C18 OBD, 5 µm, OBD 19 x 150 mm 186005422
XSelect CSH C18 OBD, 5 µm, OBD 19 x 250 mm 186005492
XSelect CSH C18 OBD, 5 µm, OBD 30 x 50 mm 186005423
XSelect CSH C18 OBD, 5 µm, OBD 30 x 75 mm 186005424
XSelect CSH C18 OBD, 5 µm, OBD 30 x 100 mm 186005425
XSelect CSH C18 OBD, 5 µm, OBD 30 x 150 mm 186005426
XSelect CSH C18 OBD, 5 µm, OBD 30 x 250 mm 186005493
XSelect CSH C18 OBD, 5 µm, OBD 50 x 50 mm 186005494
XSelect CSH C18 OBD, 5 µm, OBD 50 x 100 mm 186005495
XSelect CSH C18 OBD, 5 µm, OBD 50 x 150 mm 186005496
XSelect CSH C18 OBD, 5 µm, OBD 50 x 250 mm 186005497
XSelect CSH Fluoro-Phenyl OBD, 5 µm, 19 x 50 mm 186005433
XSelect CSH Fluoro-Phenyl OBD, 5 µm, OBD 19 x 100 mm 186005434
XSelect CSH Fluoro-Phenyl OBD, 5 µm, OBD 19 x 150 mm 186005435
XSelect CSH Fluoro-Phenyl OBD, 5 µm, OBD 19 x 250 mm 186005499
XSelect CSH Fluoro-Phenyl OBD, 5 µm, OBD 30 x 50 mm 186005436
XSelect CSH Fluoro-Phenyl OBD, 5 µm, OBD 30 x 75 mm 186005437
XSelect CSH Fluoro-Phenyl OBD, 5 µm, OBD 30 x 100 mm 186005438
XSelect CSH Fluoro-Phenyl OBD, 5 µm, OBD 30 x 150 mm 186005439
XSelect CSH Fluoro-Phenyl OBD, 5 µm, OBD 30 x 250 mm 186005500
XSelect CSH Fluoro-Phenyl OBD, 5 µm, OBD 50 x 50 mm 186005501
XSelect CSH Fluoro-Phenyl OBD, 5 µm, OBD 50 x 100 mm 186005502
XSelect CSH Fluoro-Phenyl OBD, 5 µm, OBD 50 x 150 mm 186005503
XSelect CSH Fluoro-Phenyl OBD, 5 µm, OBD 50 x 250 mm 186005504
XSelect CSH Phenyl-Hexyl OBD, 5 µm, 19 x 50 mm 186005446
XSelect CSH Phenyl-Hexyl OBD, 5 µm, OBD 19 x 100 mm 186005447
XSelect CSH Phenyl-Hexyl OBD, 5 µm, OBD 19 x 150 mm 186005448
XSelect CSH Phenyl-Hexyl OBD, 5 µm, OBD 19 x 250 mm 186005506
XSelect CSH Phenyl-Hexyl OBD, 5 µm, OBD 30 x 50 mm 186005520
XSelect CSH Phenyl-Hexyl OBD, 5 µm, OBD 30 x 75 mm 186005450
XSelect CSH Phenyl-Hexyl OBD, 5 µm, OBD 30 x 100 mm 186005451
XSelect CSH Phenyl-Hexyl OBD, 5 µm, OBD 30 x 150 mm 186005452
XSelect CSH Phenyl-Hexyl OBD, 5 µm, OBD 30 x 250 mm 186005507
XSelect CSH Phenyl-Hexyl OBD, 5 µm, OBD 50 x 50 mm 186005508
XSelect CSH Phenyl-Hexyl OBD, 5 µm, OBD 50 x 100 mm 186005509
XSelect CSH Phenyl-Hexyl OBD, 5 µm, OBD 50 x 150 mm 186005510
XSelect CSH Phenyl-Hexyl OBD, 5 µm, OBD 50 x 250 mm 186005511
Description Part Number
XBridge BEH C18 OBD, 5 µm, 19 x 50 mm 186002977
XBridge BEH C18 OBD, 5 µm, 19 x 100 mm 186002978
XBridge BEH C18 OBD, 5 µm, 19 x 150 mm 186002979
XBridge BEH C18 OBD, 5 µm,19 x 250 mm 186004021
XBridge BEH C18 OBD, 5 µm, 30 x 50 mm 186002980
XBridge BEH C18 OBD, 5 µm, 30 x 75 mm 186002981
XBridge BEH C18 OBD, 5 µm, 30 x 100 mm 186002982
XBridge BEH C18 OBD, 5 µm, 30 x 150 mm 186003284
XBridge BEH C18 OBD, 5 µm, 30 x 250 mm 186004025
XBridge BEH C18 OBD, 5 µm, 50 x 50 mm 186003933
XBridge BEH C18 OBD, 5 µm, 50 x 100 mm 186003937
XBridge BEH C18 OBD, 5 µm, 50 x 150 mm 186003929
XBridge BEH C18 OBD, 5 µm, 50 x 250 mm 186004107
XBridge BEH C18 OBD, 10 µm, 19 x 50 mm 186003893
XBridge BEH C18 OBD, 10 µm, 19 x 100 mm 186003901
XBridge BEH C18 OBD, 10 µm, 19 x 150 mm 186003894
XBridge BEH C18 OBD, 10 µm, 19 x 250 mm 186003895
XBridge BEH C18 OBD, 10 µm, 30 x 75 mm 186004711
XBridge BEH C18 OBD, 10 µm, 30 x 100 mm 186003930
XBridge BEH C18 OBD, 10 µm, 30 x 150 mm 186003896
XBridge BEH C18 OBD, 10 µm, 30 x 250 mm 186003897
XBridge BEH C18 OBD, 10 µm, 50 x 50 mm 186003898
XBridge BEH C18 OBD, 10 µm, 50 x 100 mm 186003902
XBridge BEH C18 OBD, 10 µm, 50 x 150 mm 186003899
XBridge BEH C18 OBD, 10 µm, 50 x 250 mm 186003900
Preparative Chromatography Mix 5
Page 6

[ CARE AND USE MANUAL ]
SunFire Preparative Columns SunFire Preparative Scouting Columns
Description Part Number
SunFire C18 OBD Prep Column, 100Å, 5 µm, 19 x 50 mm 186002566
SunFire C18 OBD Prep Column, 100Å, 5 µm, 19 x 100 mm 186002567
SunFire C18 OBD Prep Column, 100Å, 5 µm, 19 x 150 mm 186002568
SunFire C18 OBD Prep Column, 100Å, 5 µm, 19 x 250 mm 186004027
SunFire C18 OBD Prep Column, 100Å, 5 µm, 30 x 50 mm 186002570
SunFire C18 OBD Prep Column, 100Å, 5 µm, 30 x 75 mm 186002571
SunFire C18 OBD Prep Column, 100Å, 5 µm, 30 x 100 mm 186002572
SunFire C18 OBD Prep Column, 100Å, 5 µm, 30 x 150 mm 186002797
SunFire C18 OBD Prep Column, 100Å, 5 µm, 30 x 250 mm 186003969
SunFire C18 OBD Prep Column, 100Å, 5 µm, 50 x 50 mm 186002867
SunFire C18 OBD Prep Column, 100Å, 5 µm, 50 x 100 mm 186002869
SunFire C18 OBD Prep Column, 100Å, 5 µm, 50 x 150 mm 186003941
SunFire C18 OBD Prep Column, 100Å, 5 µm, 50 x 250 mm 186003970
SunFire C18 OBD Prep Column, 100Å, 10 µm, 19 x 150 mm 186002668
SunFire C18 OBD Prep Column, 100Å, 10 µm, 19 x 250 mm 186002669
SunFire C18 OBD Prep Column, 100Å, 10 µm, 30 x 50 mm 186003854
SunFire C18 OBD Prep Column, 100Å, 10 µm, 30 x 100 mm 186003971
SunFire C18 OBD Prep Column, 100Å, 10 µm, 30 x 150 mm 186002670
SunFire C18 OBD Prep Column, 100Å, 10 µm, 30 x 250 mm 186002671
SunFire C18 OBD Prep Column, 100Å, 10 µm, 50 x 50 mm 186002871
SunFire C18 OBD Prep Column, 100Å, 10 µm, 50 x 100 mm 186003972
SunFire C18 OBD Prep Column, 100Å, 10 µm, 50 x 150 mm 186002672
SunFire C18 OBD Prep Column, 100Å, 10 µm, 50 x 250 mm 186002673
SunFire C18 OBD Prep Column, 100Å, 10 µm, 100 x 250 mm 186003928
SunFire C18 Prep Column, 100Å, 5 µm, 10 x 50 mm 186002561
SunFire C18 Prep Column, 100Å, 5 µm, 10 x 100 mm 186002562
SunFire C18 Prep Column, 100Å, 5 µm, 10 x 150 mm 186002563
SunFire C18 Prep Column, 100Å, 5 µm, 10 x 250 mm 186002564
SunFire C18 Prep Column, 100Å, 5 µm, 19 x 50 mm 186002566
SunFire C18 Prep Column, 100Å, 5 µm, 19 x 100 mm 186002567
SunFire C18 Prep Column, 100Å, 5 µm, 19 x 150 mm 186002568
SunFire C18 Prep Column, 100Å, 5 µm, 19 x 250 mm 186004027
SunFire C18 Prep Column, 100Å, 5 µm, 30 x 50 mm 186002570
SunFire C18 Prep Column, 100Å, 5 µm, 30 x 75 mm 186002571
SunFire C18 Prep Column, 100Å, 5 µm, 30 x 100 mm 186002572
SunFire C18 Prep Column, 100Å, 5 µm, 30 x 150 mm 186002797
SunFire C18 Prep Column, 100Å, 5 µm, 30 x 250 mm 186003969
SunFire C18 Prep Column, 100Å, 5 µm, 50 x 50 mm 186002867
SunFire C18 Prep Column, 100Å, 5 µm, 50 x 100 mm 186002869
SunFire C18 Prep Column, 100Å, 5 µm, 50 x 150 mm 186003941
SunFire C18 Prep Column, 100Å, 5 µm, 50 x 250 mm 186003970
SunFire C18 Prep Column, 100Å, 10 µm, 10 x 50 mm 186003840
SunFire C18 Prep Column, 100Å, 10 µm, 10 x 150 mm 186002664
SunFire C18 Prep Column, 100Å, 10 µm, 10 x 250 mm 186002665
SunFire C18 Prep Column, 100Å, 10 µm, 19 x 150 mm 186002668
SunFire C18 Prep Column, 100Å, 10 µm, 19 x 250 mm 186002669
SunFire C18 Prep Column, 100Å, 10 µm, 30 x 50 mm 186003854
SunFire C18 Prep Column, 100Å, 10 µm, 30 x 100 mm 186003971
SunFire C18 Prep Column, 100Å, 10 µm, 30 x 150 mm 186002670
SunFire C18 Prep Column, 100Å, 10 µm, 30 x 250 mm 186002671
SunFire C18 Prep Column, 100Å, 10 µm, 50 x 50 mm 186002871
SunFire C18 Prep Column, 100Å, 10 µm, 50 x 100 mm 186003972
SunFire C18 Prep Column, 100Å, 10 µm, 50 x 150 mm 186002672
SunFire C18 Prep Column, 100Å, 10 µm, 50 x 250 mm 186002673
SunFire C18 Prep Column, 100Å, 10 µm, 100 x 250 mm 186003928
Description Part Number
SunFire C18 Column, 100Å, 10 µm, 4.6 x 150 mm 186003390
SunFire C18 Column, 100Å, 10 µm, 4.6 x 250 mm 186003391
SymmetryPrep Columns
Description Part Number
Symmetry C18 Prep Column, 100Å, 5 µm, 7.8 x 50 mm 186000208
Symmetry C18 Prep Column, 100Å, 5 µm, 7.8 x 100 mm 186000209
Symmetry C18 Prep Column, 100Å, 5 µm, 19 x 50 mm 186000210
Symmetry C18 Prep Column, 100Å, 5 µm, 19 x 100 mm 186000211
Symmetry C18 Prep Column, 100Å, 5 µm, 30 x 100 mm 186000236
Symmetry C18 Prep Column, 100Å, 7 µm, 7.8 x 150 mm WAT066288
Symmetry C18 Prep Column, 100Å, 7 µm, 7.8 x 300 mm WAT066235
Symmetry C18 Prep Column, 100Å, 7 µm, 19 x 150 mm WAT066240
Symmetry C18 Prep Column, 100Å, 7 µm, 19 x 300 mm WAT066245
Symmetry300 Columns
Description Part Number
Symmetry C18 Prep Column, 300Å, 5 µm, 19 x 50 mm 186001848
Symmetry C18 Prep Column, 300Å, 5 µm, 19 x 100 mm 186001849
Symmetry C18 Prep Column, 300Å, 5 µm, 19 x 150 mm 186001850
Preparative Chromatography Mix 6
Page 7

[ CARE AND USE MANUAL ]
Austria and European Export
(Central South Eastern Europe, CIS
and Middle East) 43 1 877 18 07
Australia 61 2 9933 1777
Belgium 32 2 726 1000
Brazil 55 11 4134 3788
Canada 1 800 252 4752
China 86 21 6156 2666
Czech Republic 420 2 617 11384
Denmark 45 46 59 8080
Finland 358 9 5659 6288
France 33 1 30 48 72 00
Germany 49 6196 400 600
Hong Kong 852 2964 1800
Hungary 36 1 350 5086
Norway 47 6 384 6050
Poland 48 22 101 5900
Puerto Rico 1 787 747 8445
Russia/CIS 7 495 727 4490/ 290 9737
Singapore 65 6593 7100
Spain 34 93 600 9300
Sweden 46 8 555 115 00
Switzerland 41 56 676 7000
Taiwan 886 2 2501 9928
United Kingdom 44 208 238 6100
All other countries:
Waters Corporation U.S.A.
1 508 478 2000
1 800 252 4752
www.waters.com
India 91 80 2837 1900
Ireland 353 1 448 1500
Italy 39 02 265 0983
Japan 81 3 3471 7191
Korea 82 2 6300 4800
Mexico 52 55 52 00 1860
The Netherlands 31 76 508 7200
©2013. Waters is a registered mark of Waters Corporation.
The Science of What's Possible, Sunfire, XBridge, XSelect
and CSH are trademarks of Waters Corporation. All other
trademarks are the property of their respective owners.
March 2013 720004429EN Rev B IH-PDF
Waters Corporation
34 Maple Street
Milford, MA 01757 U.S.A.
T: 1 508 478 2000
F: 1 508 872 1990
www.waters.com
 Loading...