

Page 1
[ CARE AND USE MANUAL ]
DYE QUALITY CONTROL REFERENCE MATERIAL KIT
CONTENTS
I. INTRODUCTION
a. MS-Directed Purification
b. The Purpose of a QCRM
c. What Affects Your QCRM Results
II. STORAGE AND STABILITY
III. RECOMMENDED USAGE OF THE DYE QCRM
a. Testing System Performance
b. Performing the Delay Timing Test Manually
c. Performing a Chromatography Test
IV. TROUBLESHOOTING
V. ORDERING INFORMATION
I. INTRODUCTION
The Quality Control Reference Materials (QCRM) portfolio is a unique
collection of standards and mixtures. These products allow users
to evaluate and benchmark the chromatography system before
analysis of critical material. The products in the portfolio are all
precisely formulated based on the expertise of Waters scientist.
The AutoPurification™ Dye QCRM contains 3 compounds including
Thionin, Thioflavin T, and Crystal Violet.
This standard mix is used to confirm the benchmark performance
of a Preparative/Purification System through fraction collection.
This particular QCRM is precisely formulated to allow the user to
verify correct fraction collection. This test is highly valuable to
perform upon first use/installation, and any time the system
has not been used or has had any changes. T hese compounds were
vigorously tested and evaluated and chosen because they provide
the following advantages:
• Well-separated
• Easily visually identified
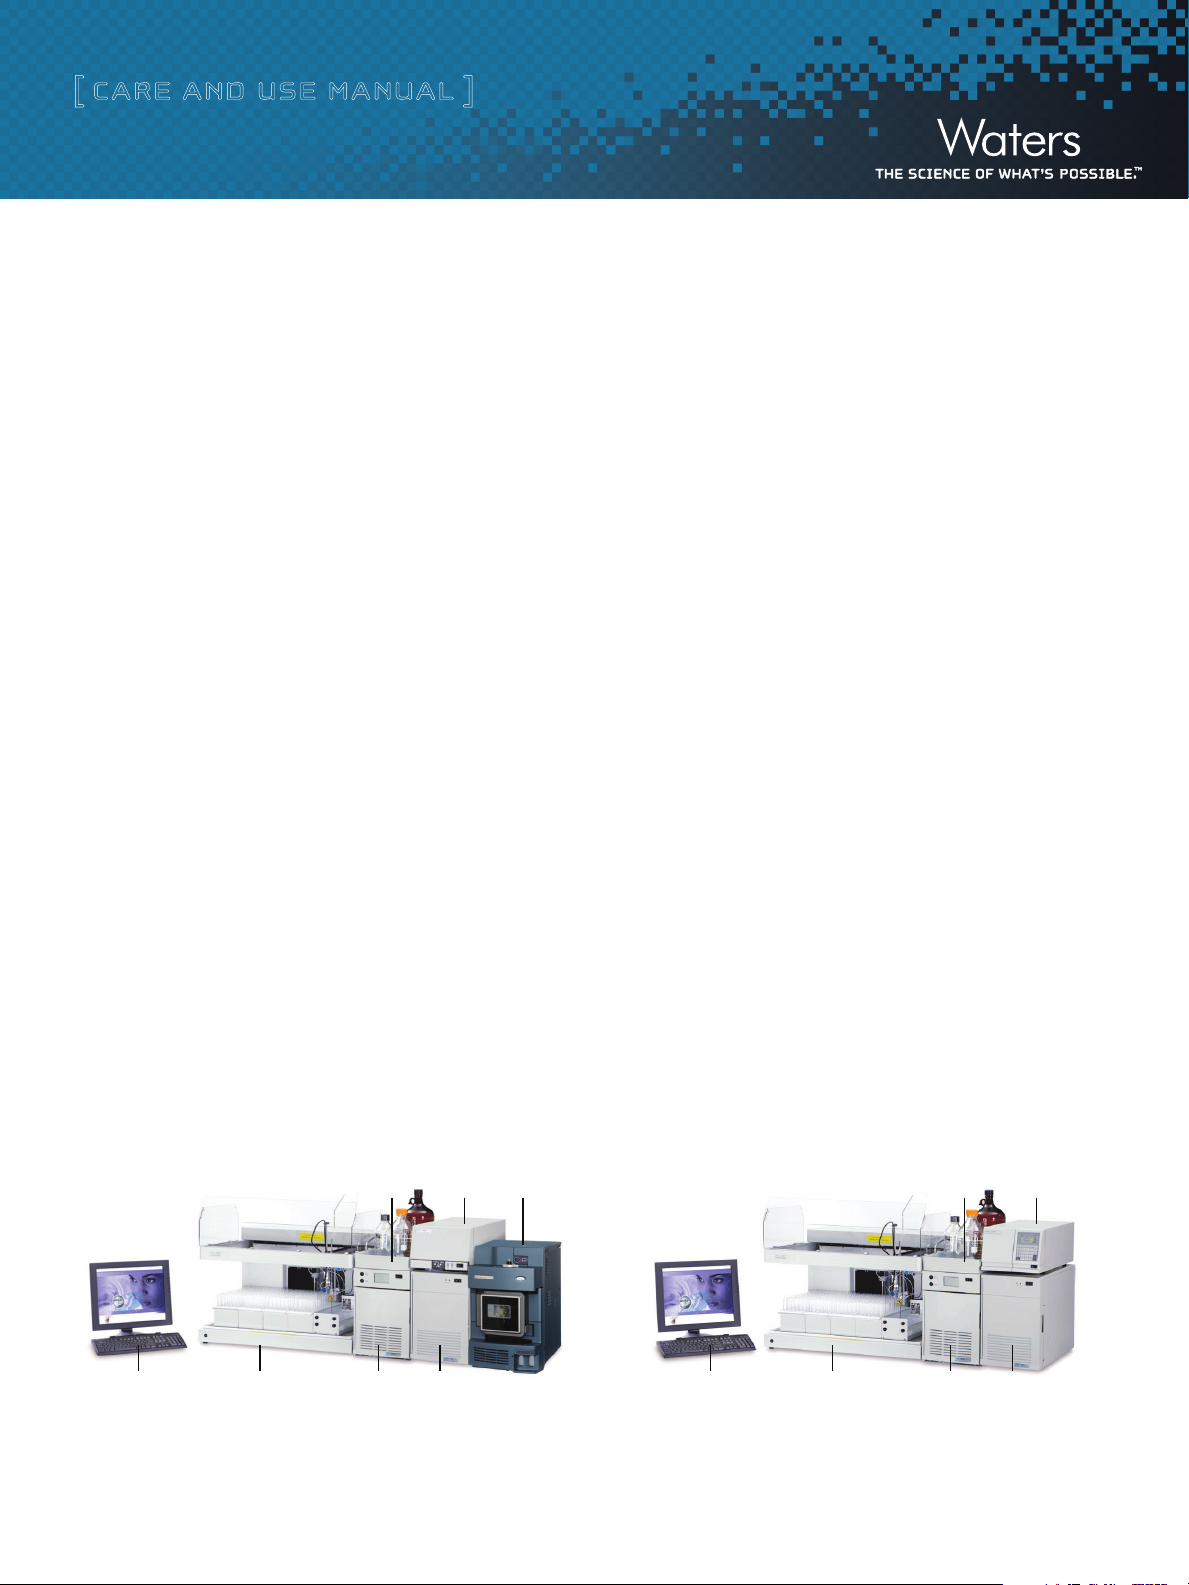
515 makeup pump
(not s hown)
PC with MassLynx and
FractionLynx software
2767 sample
manager
Bottle
tray
2545 binary
gradient module
System fluidics
organizer
2998 PDA
detector
SQD2
detector
Dye Quality Control Reference Material Kit 1
a. MS-Directed Purification
The Waters MS-directed autopurification system uses the Waters
SQD2 Mass Detector as its primary detector.
UV-Directed SystemMS-Directed System
PC with MassLynx and
FractionLynx software
2767 sample
manager
Bottle
tray
2545 binary
gradient module
System fluidics
organizer
2489 UV
detector
Page 2

[ CARE AND USE MANUAL ]
b. The Purpose of a Quality Control Reference Material
Waters recommends to benchmark a purification chromatographic
system with a QCRM prior to system usage when there is confidence
that the system is in good working order. It is recommended to run
and save the initial results and to continue to compare new QCRM
results to the previous benchmark before any critical assay is run,
and after any hardware, column, or mobile phase changes.
The QCRM standard benchmark result will be specific to the
performance of the system it is run on. All chromatographic systems
have some minor level of variability from run-to-run. Trending of
results over time is useful for defining variability on a single system,
multiple systems or on systems in different locations.
Setting specification for QCRM results should not be done without
sufficient data trending. Once variability is understood, QCRM
results will help determine the capability of the system to provide
reliable results.
c. What Affects Your Quality Control Reference
Material Results
The goal of the QCRM specifications and criteria will be to indicate
that the system is functioning as expected. The system is comprised
of many interdependent components working together to produce
results within an expected specification. An issue in any one of
the components can affect your QCRM result. Variability can
be attributed to hardware, software or chemical changes. All
components performing correctly will produce results within an
expected variability.
Sources of the variability that may affect system results include:
• Mobilephasepreparation • Temperaturecontrol
• Columnperformance • Datacollectionrate
• Tubingsize • Integration
• System component performance
(pump, injector, detector)
II. STORAGE AND STABILITY
The AutoPurification™ Dye QCRM contains 3 compounds including
Thionin, Thioflavin T, and Crystal Violet. The compounds are stable
in their original packaging, through the expiration date listed as
provided in 10 mL amber ampule before opening. This is intended
to be a one time use product. T he integrity of the standard can
not be guaranteed if stored after first use.
III. RECOMMENDED USAGE OF THE DYE QCRM
a. Testing System Performance
After installing FractionLynx™, it is recommended to test the system
to confirm that the instruments are functioning correctly, and that the
system produces the expected chromatographic results.
Testing involves using the Dye Kit (part number 716000765) to inject
dyes and subsequently collect them. A passing result for this system-
level test means that the system instruments function properly. If the
test results differ from those in the examples provided, ensure that
collection parameters are set appropriately.
The conditions defined in each of the following tests are designed
to help rapidly determine whether all the components function as a
system. Actual system performance (column load per run) depends
greatly on conditions such as the HPLC solvents or modifiers, and the
dimension of the columns.
For the MS-directed system test and the UV-directed system test,
many FractionLynx method parameters are identical, including the
gradient and UV detector parameters. The chromatogram examples
represent results that can be expected, although they can differ
somewhat from system to system.
b. Performing the Delay Timing Test Manually
Determine the delay time manually by injecting the dye standard
from the dye kit. The following test is conducted using a Waters
19 mm x 50 mm XTerra® column.
Differences in any of the components mentioned can result in system
to system variability of results even when each system’s components
are functioning correctly.
Dye Quality Control Reference Material Kit 2
Page 3
[ CARE AND USE MANUAL ]
Note: When using a different size and type of column than the one
described here, the flow and injection volumes must be adjusted
accordingly. Pressure balancing and flow to the mass spectrometer
need to be performed at the purification flow rate. When using the
column isocratically, the retention time is approximately 90 to
120 seconds, based on the column size and flow rate.
Required materials:
• Stopwatch
• Mobile phases:
– A Water/TFA, 0.1% (v:v)
– B Acetonitrile/TFA, 0.1% (v:v)
• Sample dye kit, part number 716000765
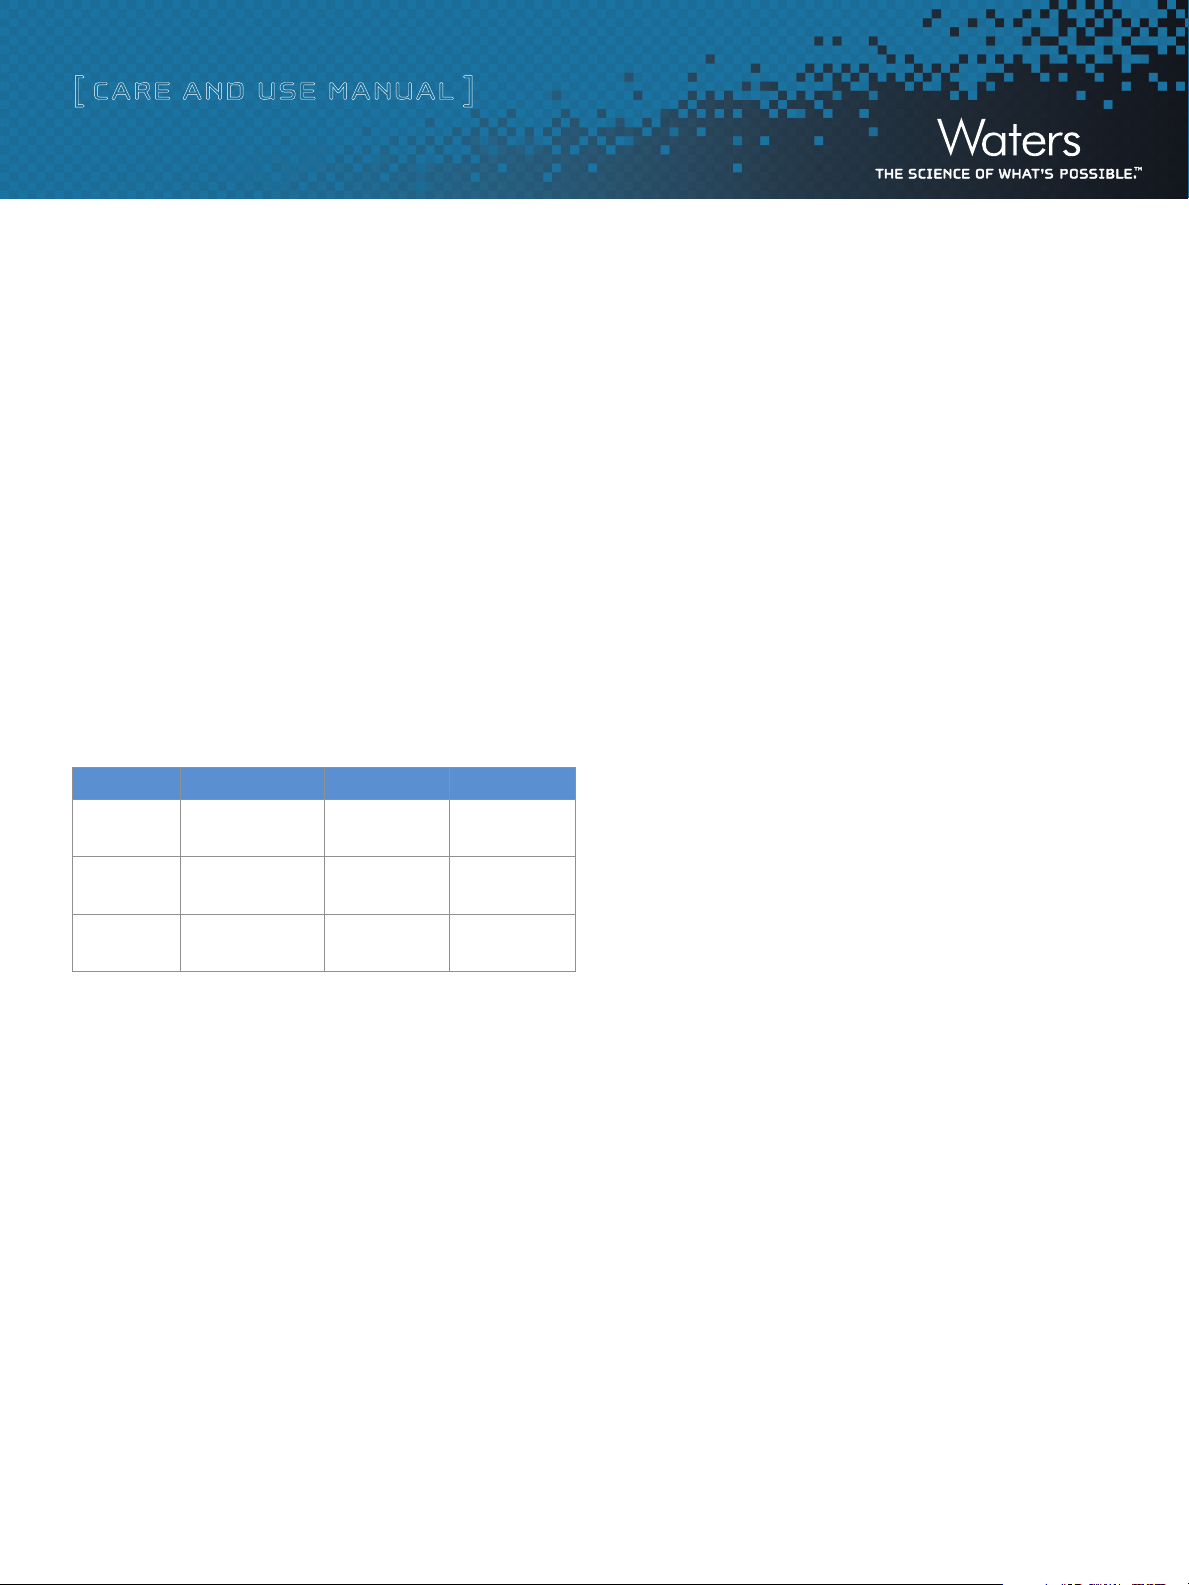
Table 1. Test Dye Compounds Information
Item Thionin Acetate Thioflavin T Crystal Violet
m/z 227.1 282.1 371.2
UV
max
Formula C12H9N3SC2H4O
590 nm 418 nm 590 nm
C17H19CIN2S C25H30CIN
2
3
3. For MS-directed systems, create an MS method for a 3 minute scan
acquisition with electrospray + ve, and specify these parameters:
– Centroid = 150 to 550 amu scan for 0.5 seconds
– Inter-scan delay = 0.1 seconds
– Cone Voltage = 35 V.
To run the delay timing test
1. In the MassLynx sample list, specify these values:
• Specify the Injection Volume as 100 μL.
• Enter these values depending upon the detectors configured
in the system:
– For an MS-directed system, enter 227.1 in the Mass A column,
282.1 in the Mass B column, and 371.2 in the Mass C
column. In the Fraction Trigger 1 column, enter Mass A. In
the Fraction Trigger 2 column, enter Mass B. In the Fraction
Trigger 3 column, enter Mass C.
– For a UV-directed system, enter 418 in the Wavelength
A column and 590 in the Wavelength B Column. In the
Fraction Trigger 1 column, enter Wavelength A for a PDA
detector or UV1 for a UV detector, such as a Waters 2489.
In the Fraction Trigger 2 column, enter Wavelength B for a
PDA detector or UV2 for a UV detector.
To set up the delay timing test:
1. In the FractionLynx method, set the split collector delay to
30 seconds.
2. In MassLynx™, create an inlet method with the following settings:
• Run at the required flow rate for 3 minutes with 10% A
and 90% B.
For UV-directed systems, set the UV detector to the following
parameters, and ensure that the connections on the UV Fraction
Manager correspond to the flow rate used for this test:
– Waters 2998 PDA Detector to scan from 200 to 600 nm
– Waters 2489 UV Detector to monitor 418 nm and 590 nm.
Dye Quality Control Reference Material Kit 3
Tip: UV1 and UV2 correspond to Channel A and Channel B wave-
lengths in the Inlet method. The setting in the Wavelength column is
for reporting purposes only; it does not control the 2489 detector. The
software uses the value set in the Fraction Trigger column, UV 1, UV 2,
against the value set in the Inlet Editor.
2. When the injection occurs, monitor the waste line from the
fraction collector valve. As soon as the dye appears in the
waste line of the fraction collector valve, start the stopwatch.
When you hear the fraction collector valve click to the dispense
position, stop the stopwatch. The dye should have eluted before
the collection valve opened.
4. Calculate the actual Splitter/Collector delay as follows:
The actual delay is equal to original Splitter/Collector delay
specified in the FractionLynx method (e.g., 30 seconds) minus
the time recorded on the stopwatch.
Page 4
[ CARE AND USE MANUAL ]
Example: If the dye is seen in the waste line 15 seconds before
the valve clicks to the collection position, the delay time is
calculated as follows:
Actual splitter collector delay = 30 – 15 = 15 seconds.
5. In the Timing tab of the FractionLynx method, change the Splitter/
Collector delay to the value just calculated, and rerun the
ex periment to ensure that the delay time is correct.
6. Repeat the procedure for all flow rates, such as 10, 15, 20,
or 25 mL/min.
7. For the MS-based system, complete the procedure for APCI and
ESI if you are using both probes.
8. Perform a chromatography test of the entire system, as
described below.
c. Performing a Chromatography Test
To perform the chromatography test, an inlet method using the
parameters provided in this procedure needs to be created. The
XTerra 19 mm x 50 mm column is used to perform the tests in the
manual. Scale the method appropriately for different flow rates and/
or differently-sized columns. Use the flow rate that will be used for
purification.
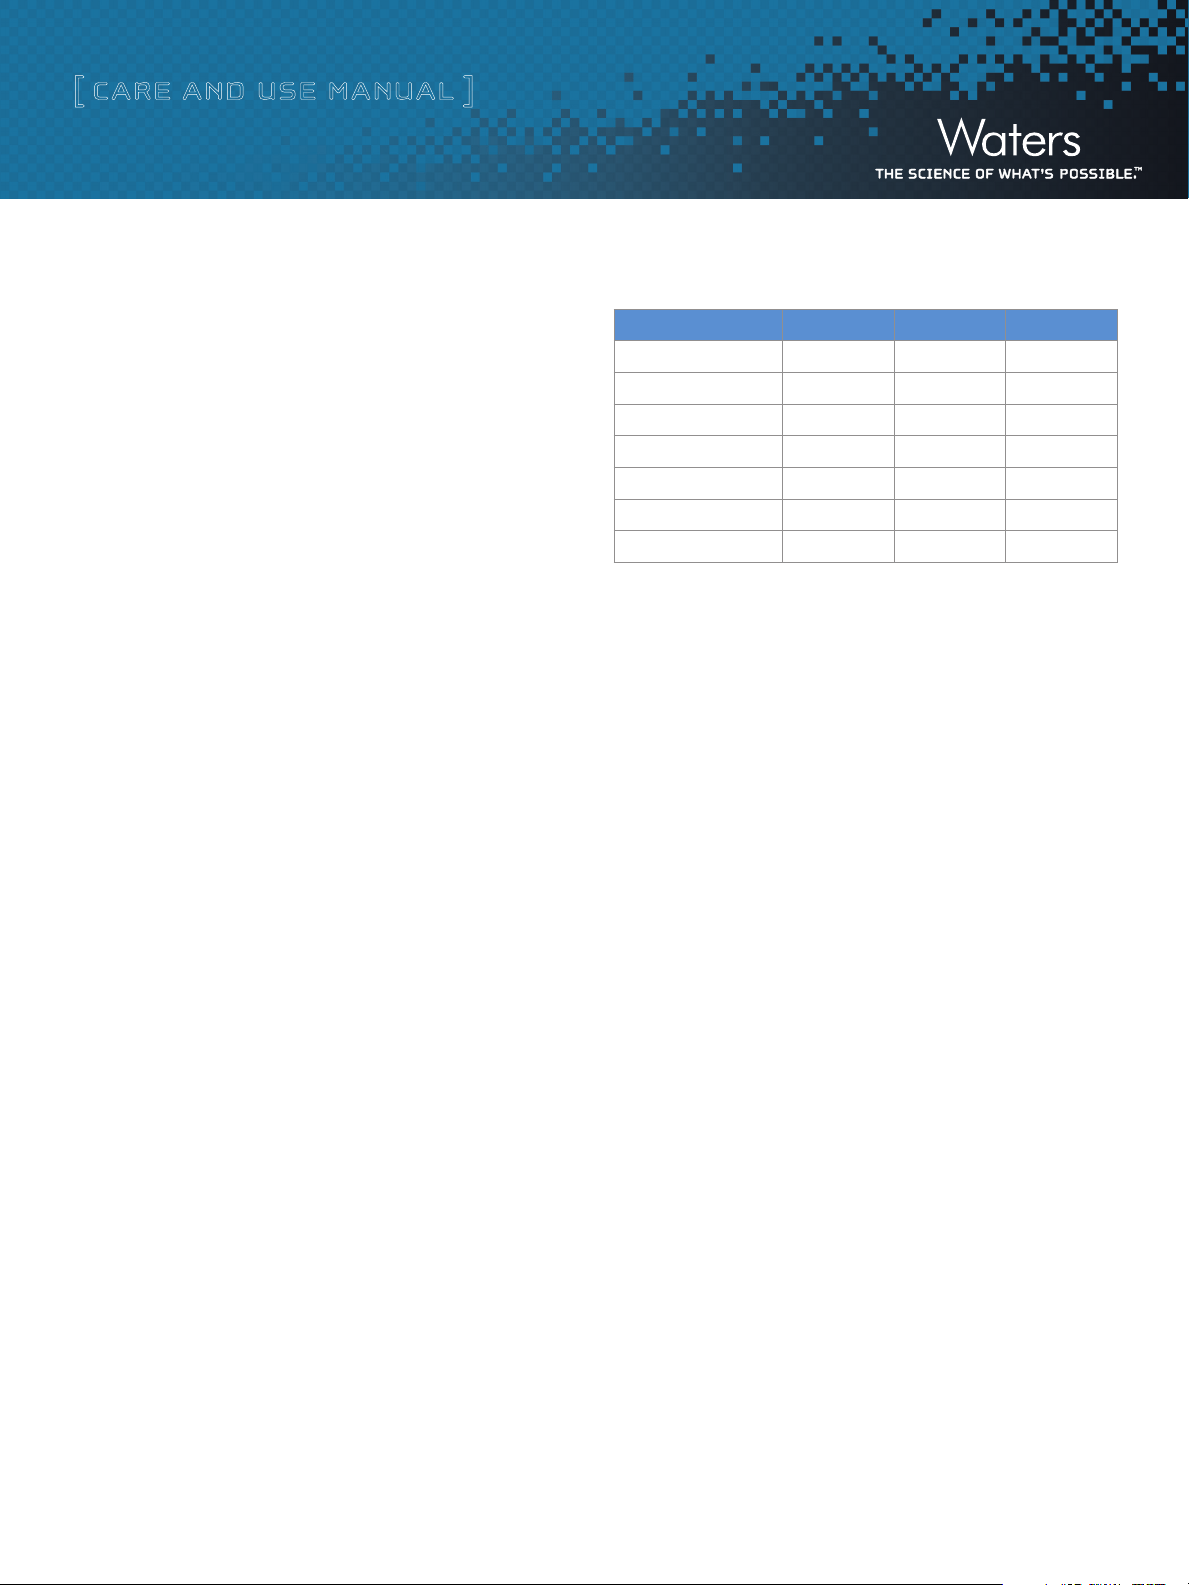
Table 2. Gradient Conditions for the System Test
Time A% B% Curve Number
T = 0 minutes 95 5 6
T = 1 minutes 95 5 6
T = 7 minutes 30 70 6
T = 7.5 minutes 5 95 6
T = 8.5 minutes 5 95 6
T = 9 minutes 95 5 6
T = 10 minutes 95 5 6
3. In the Inlet Editor, set the wavelength range you want to
acquire, based on your detector type:
• For a Waters 2998 PDA Detector, in the Inlet Editor, set the
wavelength range to 210 nm to 650 nm.
• For a Waters 2489 dual wavelength absorbance detector,
in the Inlet Editor, set the single channel wavelength to
418. Set the dual channel wavelength to 590.
4. For an MS-directed system, create a mass spectrometer method
with these parameters, and then set it to run for 10 minutes:
• Set up a Scan Function: 150 to 500 amu
To create an inlet method for the system test:
1. Set up the Inlet Editor to run a 10 minute method labeled “Dye.”
2. Set up the Waters 2545 binary gradient module to use
these parameters:
• Mobile Phase A: Water with 0.1% TFA or 0.2% formic acid
• Mobile Phase B: Acetonitrile with 0.1% TFA or 0.2%
formic acid
• Flow Rate: specify the same rate that you used in the delay
timing test.
• Run Time: 10 minutes
• Gradient conditions as specified in Table 2
Dye Quality Control Reference Material Kit 4
• ES+
• Centroid Data
• 0.5 second scan time with a 0.1 second Inter Scan Delay
• Cone Voltage = 35 V
5. In the MassLynx sample list, perform these tasks:
• Specify an injection volume of 100 μL.
• For an MS-directed system, enter 227.1 in the Mass A col-
umn, 282.1 in the Mass B column, and 371.2 in the Mass C
column. In the Fraction Trigger 1 column, enter Mass A. In
the Fraction Trigger 2 column, enter Mass B. In the Fraction
Trigger 3 column, enter Mass C.
Page 5
[ CARE AND USE MANUAL ]
• For a UV-directed system, enter 418 in the Wavelength A
column and 590 in the Wavelength B column. In the Fraction
Trigger 1 column, enter Wavelength A for a PDA detector
or UV1 for a UV detector, such as the Waters 2489 dual
wavelength absorbance detector. In the Fraction Trigger 2
column, enter Wavelength B for a PDA detector, or UV2 for
an UV detector.
Tip: The Mass and Wavelength columns are for information only,
unless the corresponding fraction information is entered in the
Fraction Trigger column.
6. For systems that include a ZMD mass detector, set the
instrument’s multiplier voltage to 550 V. For systems that
include a ZQ™ mass detector, set the multiplier voltage to
500 V. For systems that include a 3100 or SQD2 mass
detector, retain the default gain setting of 0.1.
7. From the shortcut bar, click FractionLynx > Collection
Control, and verify that your system is activated.
To set the FractionLynx method parameters for a system test
1. In the FractionLynx main window, click Edit FractionLynx method.
2. In the FractionLynx method, click each tab to set the parameters
you want to define for this fraction collection method.
Exception: The FractionLynx method parameters for the UV-based
system test apply to Waters UV detectors. When using the detectors
of other manufacturers, the threshold values can differ slightly. They
might also differ from system to system. Use the values specified in
the Table 3 as guidelines.
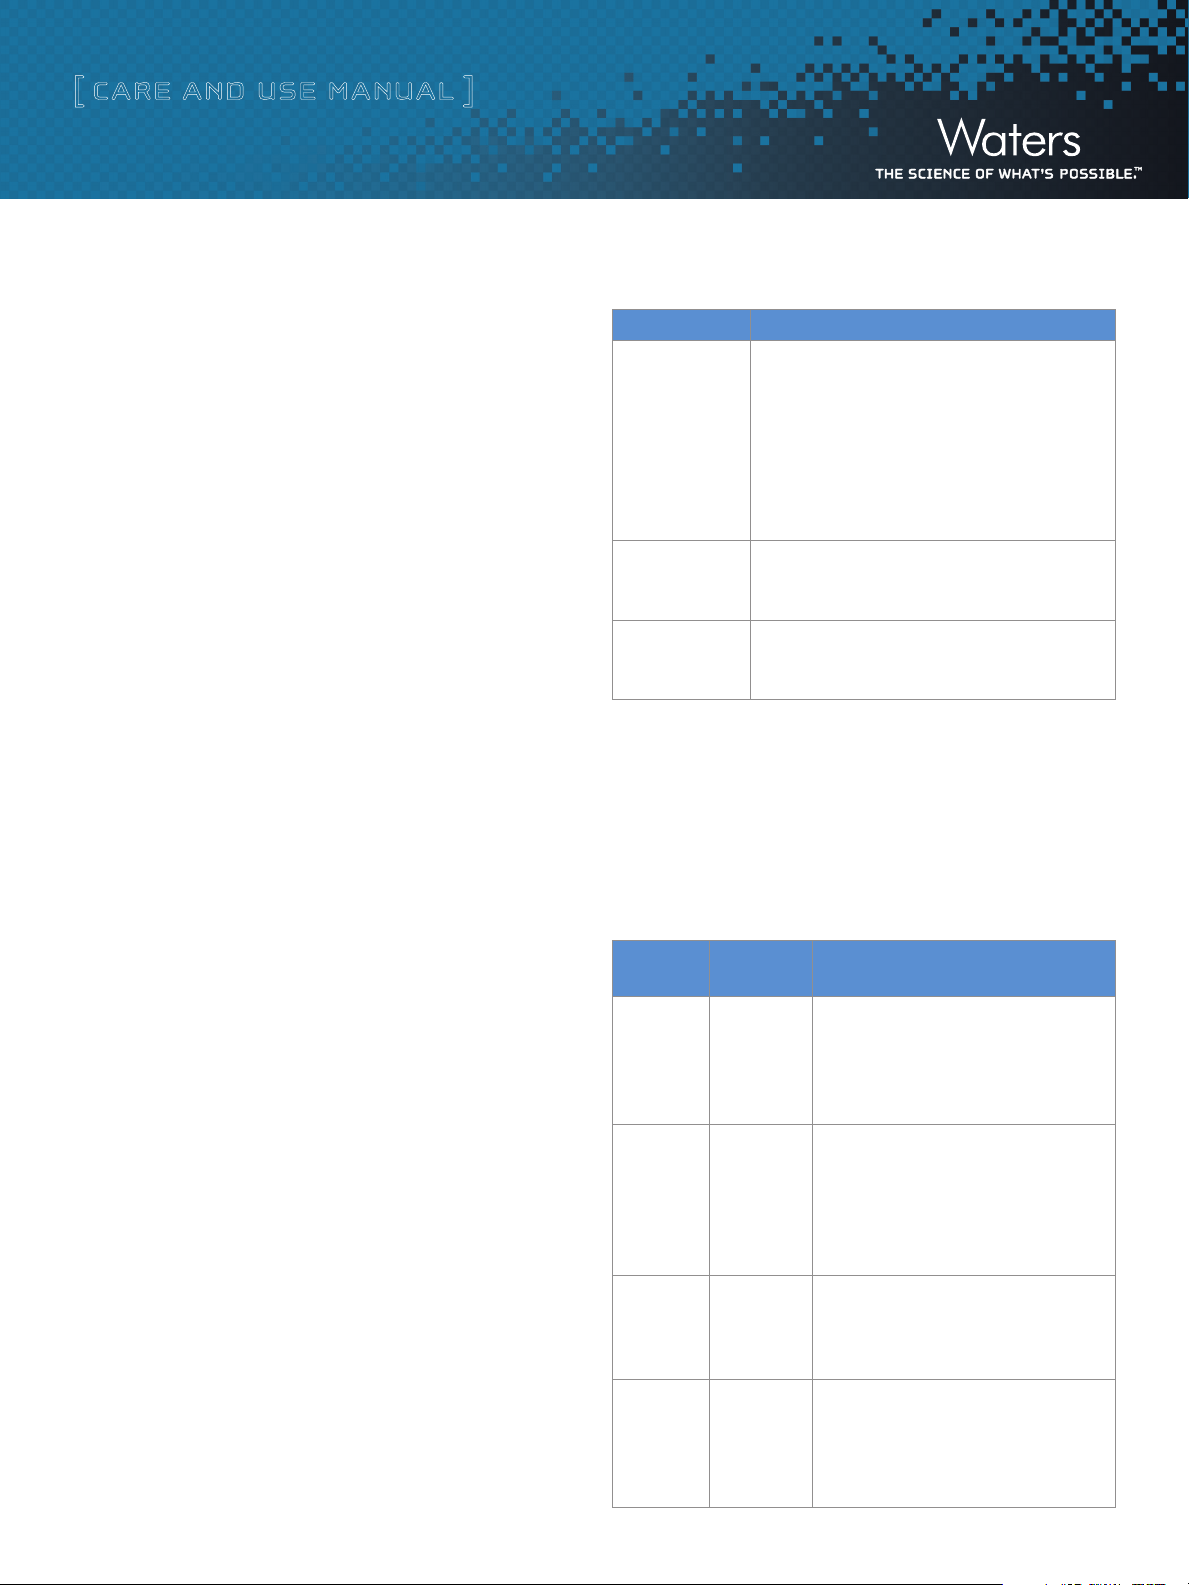
Table 3. FractionLynx Method Settings
Parameter Tab Settings You Can Specify
General • Set Fraction Collection to On and Peak Type to
Preparative
• Select the Max Fractions per injection check box,
and specify a value of 10
• Select the Max Tubes per injection check box, and
specify a value of 10
• Rinse time = 0
• Span = 0.5 amu
Timing • Solvent Front Delay = 0 seconds
• Split/Collector Delay = seconds, where x = the
split collector delay determined earlier
Volume • Minimum Fraction Width = 3 seconds
• Maximum Fraction Width = 120 seconds
• Maximum Tube Fill = 90 percent
3. Based on your detector, enter the values specified in the
table below.
Tip: Where values are not specified in Table 4, retain FractionLynx
method’s defaults.
Table 4. FractionLynx Method Settings Based on Detector Type
Detector
Type
2489 UV • MIT = 1000
PDA PDA • Span = 3 nm
Mass Spec ES+ • ES+ Ion Adducts = 1
Analog Analog • MIT = 5,000
FractionLynx
Method Tab
Settings You Can Specify
• Peak Start = Leading Edge Gradient %
with a value of 30
• Terminate Peak = Below Gradient %
with a value of 60
• MIT = 5,000
• Peak Start = Leading Edge Gradient %
with a value of 30
• Terminate Peak = Below Gradient %
with a value of 60
• MIT = 5,000,000
• Peak Start = Use MIT only
• Terminate Peak = Use MIT only
• Peak Start = Leading Edge Gradient %
with a value of 30
• Terminate Peak = Below Gradient %
with a value of 60
Dye Quality Control Reference Material Kit 5
Page 6
[ CARE AND USE MANUAL ]
1. From the shortcut bar, click FractionLynx > Collection
Control, and verify that your system is activated.
2. From the MassLynx toolbar, click Start.
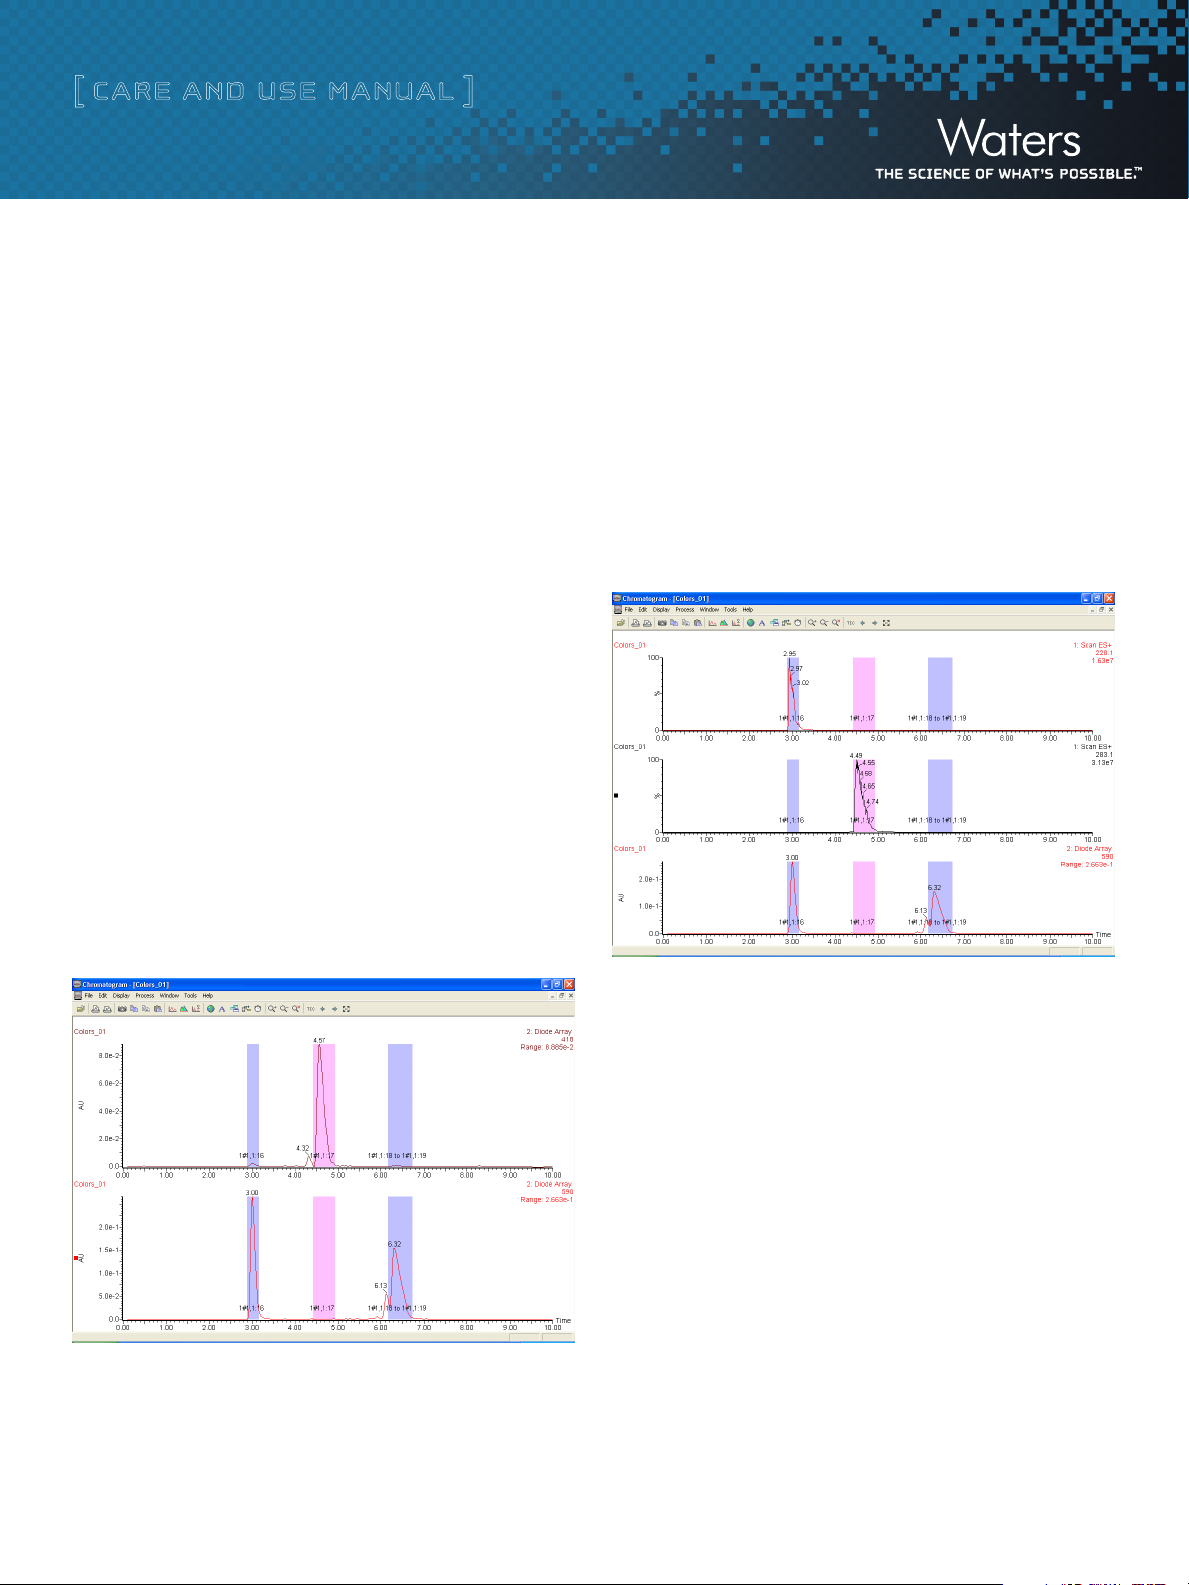
UV Chromatography Dye Test Results
These chromatograms represent typical results of the dye test. The
chromatograms show three separate color samples of blue, yellow,
and violet collected into separate vials labeled 1:16, 1:17, and 1:18
to 1:19.
Requirements: Sample dye kit, which contains three compounds for
testing the ability of the AutoPurification System to perform high-flow-
rate targeting and fractionation of specified masses and wavelengths.
The compounds elute in this order:
•Thioninacetatelosestheacetatesalt(C2H4O2) to give this [M+H] ion:
Thionin ([M+H] = 228.1), lambda max. = 590 nm
••ThioflavinTlosesaCltogivethis[M+H]ion:
Thioflavin T ([M+H] = 283.1), lambda max. = 418 nm
••CrystalvioletlosesHCltogivethis[M+H]ion:
• T he extracted wavelength shows the correct picture of what
was actually collected.
• Click Display > Wavelength to input the wavelengths of
choice, and then click OK to get the extracted wavelengths.
• To extract the spectrum, double-click the peak in the Total
Absorbance Chromatogram (TAC).
Actual results can vary if different column sizes, flow rates, and
injection volumes are used.
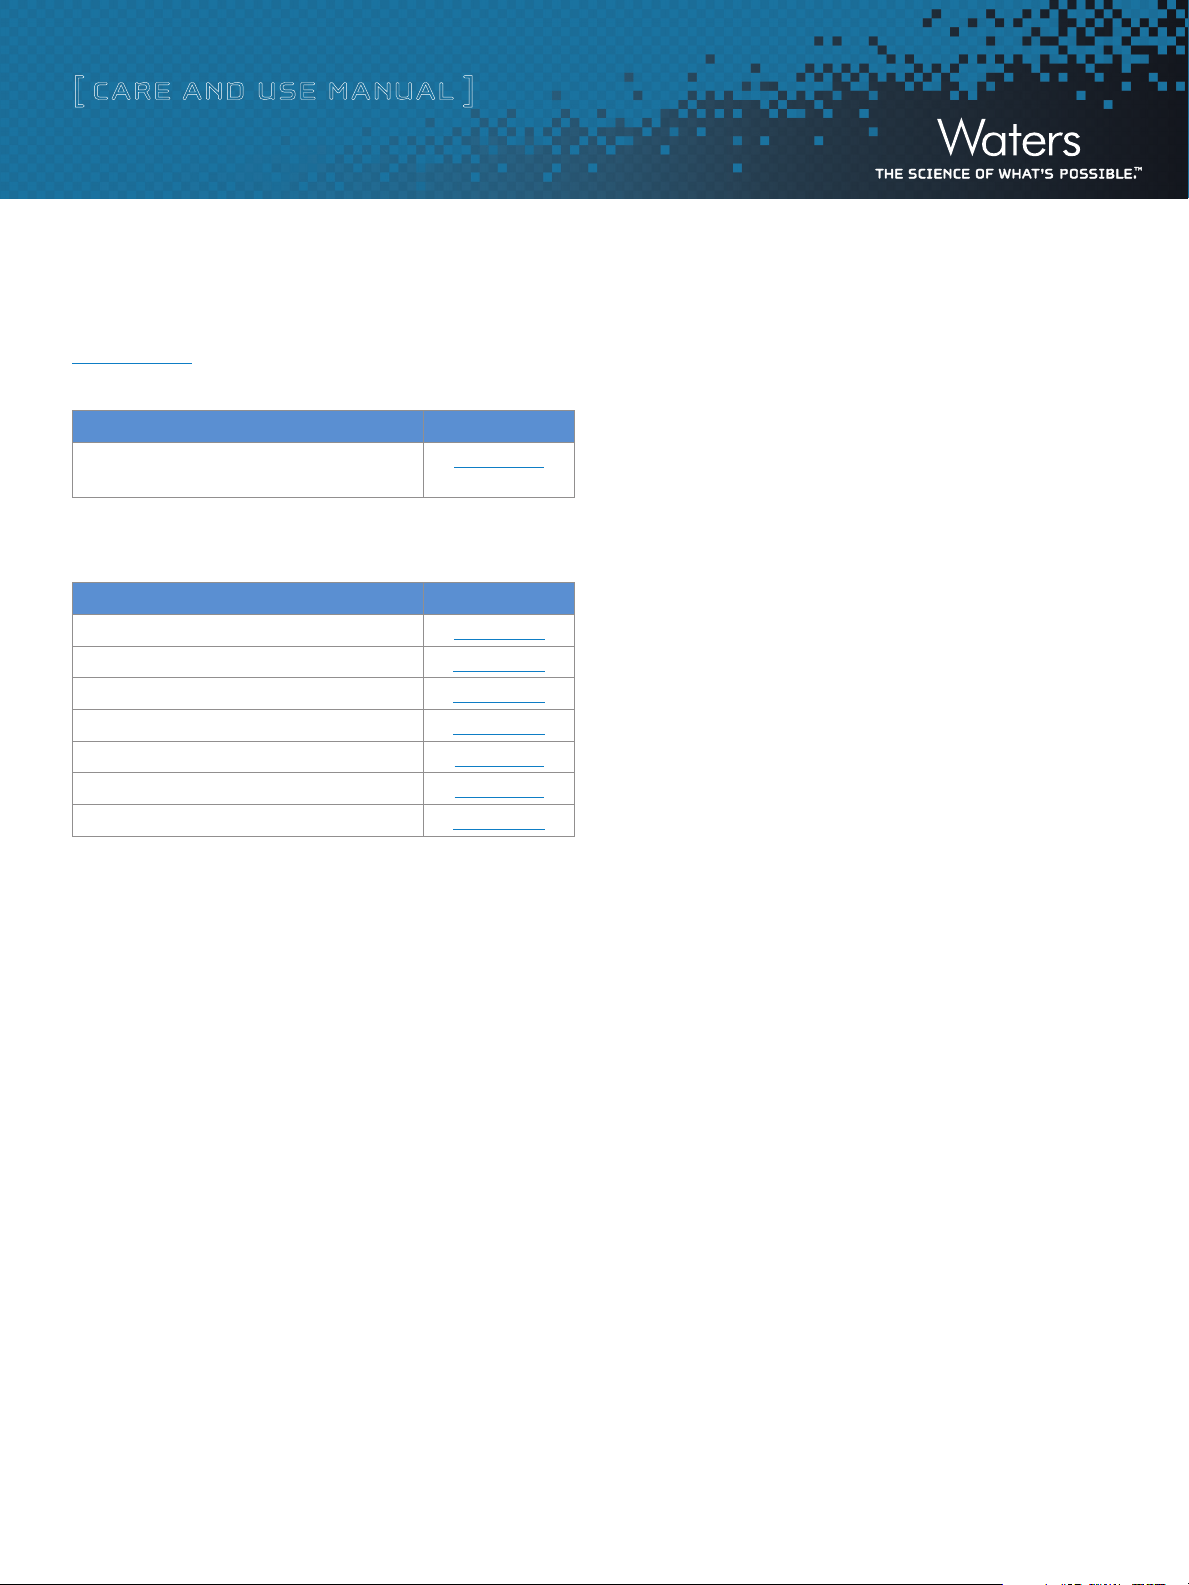
MS Chromatography Dye Test Results
([M+H] = 372.2), lambda max. = 590 nm
Tip: Report masses to one decimal place.
This sample was collected using the Waters 2998 PDA Detector. The wavelength values
were put in the sample list, and the fraction triggers were set to Wavelength A and B.
The chromatograms above represent typical results of the dye test. The three
components of the dye mix have been separated and collected into separate vials
labeled 1:16, 1:17, and 1:18 to 1:19.
The extracted ion shows the correct picture of what was actually
collected into each vial. Double-click the peak in the Total Ion
Chromatogram (TIC) to extract the spectrum, and double-click the
spectrum of the mass of interest to extract the mass chromatograms.
Always consider the extracted ion or wavelength when trouble-
shooting as it will give the correct representation of what was
actually collected.
IV. TROUBLESHOOTING
For specific troubleshooting of the system and settings refer to the
AutoPurification System Guide 71500135202ra.
Dye Quality Control Reference Material Kit 6
Page 7
[ CARE AND USE MANUAL ]
V. ORDERING INFORMATION
To order these products, contact your nearest subsidiary, or visit
www.waters.com and click on Order Center.
Description Part Number
Auto Purification Dye Quality Control
Reference Material Kit
716000765
Related Products
Description Part Number
XBridge™ C18, 5 µm, 19 x 50 mm
XSelect™ CSH C18, 5 µm, 19 x 50 mm
XSelect CSH Phenyl-Hexyl, 5 µm, 19 x 50 mm
XSelect CSH Fluoro-Phenyl, 5 µm, 19 x 50 mm
XTerra MS C18, 5 µm, OBD 19 x 50 mm
Symmetry® C18, 5 µm, OBD 19 x 50 mm
Atlantis® T3 C18, 5 µm, OBD 19 x 50 mm
186 0 02977
186005420
186005446
186005433
186 00193 0
186000210
186 0 03696
Thank you for choosing a Quality Control Reference Material (QCRM)
from Waters. T he standards are manufactured in our ISO 9001,
ISO 17025 facility. Each standard is manufactured to ensure optimal
reproducibility from lot-to-lot. A Waters QCRM can be depended
on for its’ accuracy. This removes one variable from your system
variability and provides you the most dependable starting point for
your testing. If the QCRM box shows significant damage, notify the
carrier and your supplier at once and retain evidence of shipping
damage so that a claim can be made.
Dye Quality Control Reference Material Kit 7
Page 8

[ CARE AND USE MANUAL ]
Austria and European Export
(Central South Eastern Europe, CIS
and Middle East) 43 1 877 18 07
Australia 61 2 9933 1777
Belgium 32 2 726 1000
Brazil 55 11 5094-3788
Canada 1 800 252 4752 x2205
China 86 21 6879 5888
CIS/Russia +497 727 4490/290 9737
Czech Republic 420 2 617 1 1384
Denmark 45 46 59 8080
Finland 09 5659 6288
France 33 1 30 48 72 00
Germany 49 6196 400600
Hong Kong 852 2964 1800
The Netherlands 31 76 508 7200
Norway 47 6 384 60 50
Poland 48 22 6393000
Puerto Rico 1 787 747 8445
Singapore 86 21 6879 5888
Spain 34 936 009 300
Sweden 46 8 555 11 500
Switzerland 41 56 676 70 00
Taiwan 886 2 2543 1898
United Kingdom 44 208 238 6100
All other countries:
Waters Corporation U.S.A.
1 508 478 2000
1 800 252 4752
www.waters.com
Hungary 36 1 350 5086
India and India Subcontinent
91 80 2837 1900
Ireland 353 1 448 1500
Italy 39 02 265 0983
Japan 81 3 3471 7191
Korea 82 2 6300 4800
Mexico 52 55 5524 7636
©2013 Waters Corporation. Waters, The Science of What's
Possible, AutoPurification, MassLynx, FractionLynx, XTerra,
ZQ, XBridge, S unFire, XSelect, Symmetry, and Atlantis are
trademarks of Waters Corporation.
March 2013 720004436EN Rev B IH-PDF
Waters Corporation
34 Maple Street
Milford, MA 01757 U.S.A.
T: 1 508 478 2000
F: 1 508 872 1990
www.waters.com
8
 Loading...