

Page 1

Waters 2489
UV/Visible Detector
Operator’s Guide
71500142102 / Revision A
Copyright © Waters Corporation 2007.
All rights reserved.
Page 2

Copyright notice
© 2007 WATERS CORPORATION. PRINTED IN THE UNITED STATES OF
AMERICA AND IRELAND. ALL RIGHTS RESERVED. THIS DOCUMENT
OR PARTS THEREOF MAY NOT BE REPRODUCED IN ANY FORM
WITHOUT THE WRITTEN PERMISSION OF THE PUBLISHER.
The information in this document is subject to change without notice and
should not be construed as a commitment by Waters Corporation. Waters
Corporation assumes no responsibility for any errors that may appear in this
document. This document is believed to be complete and accurate at the time
of publication. In no event shall Waters Corporation be liable for incidental or
consequential damages in connection with, or arising from, its use.
Trademarks
Waters is a registered trademark of Waters Corporation. Empower, e-SAT/I N,
and MassLynx are trademarks of Waters Corporation.
Other trademarks or registered trademarks are the sole property of their
respective owners.
Customer comments
Waters’ Technical Communications departme nt invites you to tell us of any
errors you encounter in this document or to suggest ide as for otherwise
improving it. Please help us better understand what you expect from our
documentation so that we can continuously improve its accuracy and
usability.
We seriously consider every customer comment we receive. You can reach us
at tech_comm@waters.com.
ii
Page 3

Contacting Waters
Contact Waters® with enhancement requests or techn ical questions regard ing
the use, transportation, removal, or disposal of any Waters prod uct. You can
reach us via the Internet, telephone, or conventional mail.
Waters contact information
Contacting medium Information
Internet The Waters Web site includes phone numbers
for Waters locations worldwi de. Go to
www.waters.com, and click About Waters >
Worldwide Offices.
Telephone In the USA or Canada, phone 508 478-2000.
Conventional mail Waters Corporation
34 Maple Street
Milford, MA 01757
USA
iii
Page 4

Safety considerations
Some reagents and samples used with Waters® instruments ca n po se
chemical, biological, and radiological hazard s. Be sure you are aware of the
potentially hazardous effects of all substances you work with. Always observe
Good Laboratory Practice (GLP) guidelines, published by the U.S. Food and
Drug Administration, and consult your organization’s safety representative
for guidance.
When you develop methods, follow the “Pro tocol for the Ado ption of Analyt ical
Methods in the Clinical Chemistry Laboratory,” Ame rican Journal of Medical
Technology, 44, 1, pages 30–37 (1978). This protocol addresses good operating
procedures and the techniques necessary to validate system and method
performance.
Safety advisories
Consult Appendix A for a comprehensive list of warning and caution
advisories.
Operating this detector
When operating this detector, follow standard quality control procedures and
the guidelines presented in this section.
iv
Page 5

Symbols
P
Symbol Definition
Intended use
The Waters® 2489 UV/Visible detector can be used for in vitro diagnostic
testing to analyze many compounds, including diagnostic indicators and
therapeutically monitored compounds . However, only professionally trained
and qualified laboratory personnel should use the instrument for those
purposes.
E C RE
Authorized representativ e of the
European Community
Confirms that a manufactured
product complies with all applicable
European Community directives
For in vitro diagnostic use
IV D
The Waters 2489 UV/Visible Detector is CE-marked according to
the European Union In Vitro Diagnostic Device Directive
98/79/EC.
Calibrating the detector
To calibrate the detector, follow acceptable calibration methods using at least
five standards to generate a standard curve . The concentration range for
standards should cover the entire range of quali ty-control samples, typical
specimens, and atypical specimens.
v
Page 6

Quality control
Routinely run three quality-control samples that represent subnormal,
normal, and above-normal levels of a compound. Ensure that quality-control
sample results fall within an acceptable range, and evaluate precision from
day to day and run to run. Data col lected when qualit y control samples are ou t
of range might not be valid. Do not r eport the se dat a until you ar e cert ain that
the instrument performs satisfactorily.
When analyzing samples from a com plex matrix such as soil, tissue,
serum/plasma, whole blood, and so on, note that the matrix co mponents can
adversely affect results. To minimize these matrix effec ts, Waters
recommends you adopt the following measures:
• Prior to the instrumental analysis, use appropria te sample
pretreatment such as protein precipitation, liquid/liquid extraction
(LLE), or solid phase extraction (SPE) to remove matrix interferences.
• Whenever possible, verify method accuracy and precision using
matrix-matched calibrators and QC samples.
• Use one or more internal standard compounds, preferably isotopically
labeled analytes.
vi
Page 7

IVD authorized representative
Waters Corp o ra tion (Microm a ss UK Ltd.)
Floats Road
Wythenshawe
Manchester M23 9LZ
United Kingdom
Telephone: +44-161-946-2400
Fax: +44-161-946-2480
Contact: Quality manager
Waters Corporation (Micromass UK
Limited) is registered in the United
Kingdom with the Medicines and
Healthcare Products Regulatory Agency
(MHRA) at Market Towers, 1 Nine Elms
Lane, London, SW8 5NQ. The reference
number is IVD000167.
vii
Page 8

viii
Page 9

Table of Contents
1 Theory and Principles of Operation .................................................. 1-1
Detector description ........................................................................................ 1-2
Features . ................... .................... .................... .................. .................... ..... 1-2
Principles of operation .................................................................................... 1-4
Detector optics.................................................................................................. 1-4
Optics assemb l y light path ................................ ... ............. .. .. .............. .. ..... 1-5
Waters TaperSlit Flow Cell ........................................................................ 1-6
Filtering noise ............................................................................................. 1-7
Wavelength verification and test.................................................................... 1-9
Operational modes .......................................................................................... 1-11
Single wavelen g th mo de...... .. .. .............. .. .. ............. ... .......................... .. ... ..... 1-11
Primary para me t er s . ... ............. .. .. .............. .. .......................... .. .............. .. . 1-11
Secondary parameters .............................................................................. 1-12
Dual wavelength mode .................................................................................. 1-12
Chart Out selec t i on mo de s ............. ............. .. .......................... ... .. ............ 1-1 3
Spectrum scanning ...... ............................. ..................................................... 1-13
Cuvette operations......................................................................................... 1-14
RatioPlot......................................................................................................... 1-15
MaxPlot .......................................................................................................... 1-15
Thermal wander management....................................... .. .. ........................... 1-15
2 Installing the Detector .......................................................................... 2-1
Preparing for installation ............................................................................... 2-2
Site selection and power requirements ....................................................... 2-4
Site selection .................................................................................................... 2-4
Power requirements......................................................................................... 2-5
Unpacking and inspecting............................................................................... 2-5
Unpacking ................................................................................................... 2-6
Inspecting .................................................................................................... 2-6
Table of Contents ix
Page 10

Making fluid line connections ....................................................................... 2-6
Connecting columns .................................................................................... 2-7
Assembling the fittings ............................................................................... 2-8
Making connec ti o n s ............. ... .......................... .. ... ............. .. ....................... 2-9
Making electrical power connections .......................................................... 2-9
Detector rear panel ................................................................................... 2-10
Making signal connections ............................................................................ 2-11
Making I/O sign al co n n e ct i o n s ............................. .. .. ............. .. ................. 2-12
I/O signals .................................................................................................. 2-13
Making Ethernet connections ....................................................................... 2-14
Making Ethern et connectio n s w ith Wa ters data syste ms .............. ... .. ... 2-14
Starting a method ..................................................................................... 2-16
Turning the de t ec t or lamp on or off ............ .. .. ............. ... ............. .. .......... 2-16
Connecting the detector to a separations module ................................... 2-18
Generating Auto Zero ............................................................................... 2-18
Generating Chart Mark on Inject ............................................................ 2-19
Connecting to other devices ......................................................................... 2-20
Required mat eri a l s ....................... ... .......................... .. .. .............. .. ............ 2-21
Connecting the cables ............................................................................... 2-21
Connecting the de te ctor to Empower u si n g a n e-S A T /I N mo d ule ......... .. .. . 2-21
e-SAT/IN modu l e ............. .. ........................... .. .......................... ... ............. . 2-2 1
Connecting the detector to the e-SAT/IN module .................................... 2-23
Connecting the detector to a 745/745B/746 data module............................ 2-25
Connecting the detector to a chart recorder................................................. 2-27
Recorder signal .......................................................................................... 2-27
Chart marks .............................................................................................. 2-28
Connecting the detector to the Waters 600 Series Pump........................ .. .. 2-29
Fluid line connections ............................................................................... 2-29
Lamp on/off connections ........................................................................... 2-29
Auto Zero connections ............................................................................... 2-30
Chart Mark connections ........................................................................... 2-31
Inject Start con n e ctions ............... ... ............. .. .. ............. ... ......................... 2-3 2
Pump and detect o r In je ct Start conne ct i o n s ............ .. .. .............. .. .. .......... 2-33
Connecting the detector to the Waters 717plu s Autos ampler..... ................ 2-33
x Table of Contents
Page 11

Auto Zero connections ............................................................................... 2-34
Inject Start con n e ctions ............... ... ............. .. .. ............. ... ......................... 2-3 5
Connecting the detector to a fraction collector............................................. 2-36
3 Preparing the Detector ......................................................................... 3-1
Initializing the detector .................................................................................. 3-2
Diagnostic test failure ................................................................................. 3-3
Using the operator interface .......................................................................... 3-3
Using the display ............................................................................................. 3-3
Absorbance and message icons ................................................................... 3-4
Using the keypad ............................................................................................. 3-6
Navigating the u se r i n te rface ................... .. ... ............. .. .. ............. ... .............. 3-12
Navigating to and from the absorbance screen ................. .. .................... 3-12
Setting up a run ..................... .. .. ............. ... ............. .. .. ............. ... .............. 3-13
Primary and secondary functions ................................................................. 3-14
Operating the Trace and Scale functions ................................................. 3-20
Operating other detector functions............................................................... 3-22
Configuring the detector ........................................................................... 3-22
Configuri ng ev e n t i n pu t s (contact closu res) .............. .. .............. .. ............ 3-2 3
Setting pulse pe riods ............................. .. .............. .. .. ............. .. ... ............. . 3-24
Setting displa y co n t ra st .. ........................... .. .. ............. .. ........................... . 3-2 5
Displaying system info .............................................................................. 3-25
Using Help ................................................................................................. 3-26
Operating the detector................................................................................... 3-26
Overview of detector operation .. ............. ... .. ............. .. ............. ... .............. 3-26
Operating modes .............................................. .. ........................... .. .......... 3-26
Stand-alone operation ............ ............. .. ............. ... .. ............. .. .............. .. ... 3-27
Remote contro l .......... ... ............. .. .. .............. .. ............. .. ........................... .. . 3-27
Verifying the detector.................................................................................... 3-27
Before you begin ........................................................................................ 3-27
Recording samp l e an d r ef e re n c e b ea m energies .. .. .......................... ... .. ... 3-28
Verifying peak response ............................................................................ 3-29
Wavelength calibration ................................................................................. 3-30
Operating the detector in single wavelength mode ..................................... 3-31
Table of Contents xi
Page 12

Operating the detector in dual wavelength mode........................................ 3-32
Changing from single to dual wavelength mode ............................ .. ....... 3-33
Obtaining a RatioPlot ............................................................................... 3-34
Obtaining a MaxPlot ................................................................................. 3-35
Programming timed events, threshold events, and methods...................... 3-35
Timed events .......... .. ........................... .. ............. ... .. ............. .. ................... 3-36
Threshold events ....................................................................................... 3-39
Storing a method ....................................................................................... 3-40
Retrieving a method .................................................................................. 3-41
Viewing events within a method .............................................................. 3-42
Resetting a method ................................................................................... 3-42
Clearing events ......................................................................................... 3-43
Scanning spectra ............................................................................................. 3-44
Before you begin............................................................................................. 3-44
Scanning new spectra.................................................................................... 3-48
Zero scan .................................................................................................... 3-49
Running the sample scan ................... ....................................................... 3-52
Storing a spectrum......................................................................................... 3-56
Getting information about a stored spectrum.............................................. 3-56
Reviewing a stored spectrum ........................................................................ 3-57
Subtracting a spectrum................................................................................. 3-57
Replaying a spectrum.................................................................................... 3-58
Scanning using the cuvette ........................................................................... 3-59
Before you begin ........................................................................................ 3-60
Cuvette scanning procedure ........................................................ .. ........... 3-60
Scanning using a flow cell and a syringe...................................................... 3-62
Conserving lamp life...................................................................................... 3-62
Shutting down the detector........................................................................... 3-65
Removing buffered mobile phase ............................................................. 3-65
Shutting down the detector ............ .. ............. .. ............. ... .. ............. .. ........ 3-65
xii Table of Contents
Page 13

4 Maintaining the Detector ............................................. ........................ 4-1
Contacting Waters Technical Service .......................................................... 4-2
Maintenance considerations .......................................................................... 4-2
Safety precautions ........................................................................................... 4-2
Spare parts....................................................................................................... 4-2
Proper operating procedures ......................................................................... 4-3
Removing the fr o nt le f t pa n e l co ve r............... .. .. ............. .. ........................... .. . 4-3
Routine maintenance................................ ..................................... .................. 4-4
Maintaining the flow cell ................................................................................ 4-4
Flushing the flow cell....................................................................................... 4-5
Removing and cleaning the flow cell............................................................... 4-6
Disassemblin g a n d re a ssembling th e fl o w ce l l............. .. .. .............. .. .............. 4-6
Before you begin .......................................................................................... 4-6
Tools required .............................................................................................. 4-7
Removing the flow cell assembly ................................................................ 4-7
Disassembling the flow cell ...................................................................... 4-10
Inspecting, cleaning, and replacing damaged flow cell components ...... 4-13
Rebuilding th e fl o w ce l l . ............. .. .............. .. .. ............. .. .............. .. ............ 4-13
Replacing th e fl o w ce l l ............. .. ............. ... ............. .. ............. .. .............. .. . 4-15
Replacing the lamp ......................................................................................... 4-16
Lamp characteristics ................................................................................. 4-16
Lamp energy and performance ................................................................. 4-16
When to replace the lamp ......................................................................... 4-17
Removing the la mp.......... ............. .. ............. ... ............. .. .. ............. ... ............. . 4-18
Installing the new lamp................................................................................. 4-21
Recording the new lamp serial number........................................................ 4-23
Setting the lamp threshold............................................................................ 4-25
Replacing fuses ................................................................................................ 4-26
5 Error Messages, Diagnostic Tests, and Troubleshooting ............. 5-1
Error messages .................................................................................................. 5-2
Startup erro r me ssages ......... .............. .. ............. .. ............. ... ............. .. .. .......... 5-2
Table of Contents xiii
Page 14

Error messages preventing operation............................................................. 5-5
User-selected diagnostic tests ........................................................................ 5-8
Overview........................................................................................................... 5-8
Using the diagnostic tests ............................................................................. 5-11
Contacting Waters Technical Service ...................................................... 5-11
Using the sample and reference energy diagnostic tests ........................ 5-11
Using the Input & Output diagnostic tests ............................................. 5-12
Displaying Auto Zero offsets ..................................................................... 5-13
Setting fixed absorbance value ................................................................. 5-13
Setting fixed vol t age output ................... ... .. ............. .. ........................... .. . 5-14
Using the lamp, display, and keypad diagnostic tests ............................ 5-15
Using the Change Lamp diagnostic test .................................................. 5-15
Using the other detector diagnostic tests ................................................ 5-17
Service diagnostic tests ................................................................................. 5-19
Troubleshooting .............................................................................................. 5-19
When you contact Waters.............................................................................. 5-19
Diagnostic tests.............................................................................................. 5-20
Power surges.................................................................................................. 5-20
Hardware troubleshooting ............................................................................ 5-20
A Safety Advisories ..................... ..... ........................................................ A-1
Warning symbols ............................................................................................... A-2
Task-specific hazard warnings........................................................................ A-2
Warnings that apply to particular instruments, instrument components, and
sample types A-3
Burst warning ............................................................................................. A-3
Mass spectrometer flammable solvents warning ...................................... A-3
Mass spectrometer shock hazard ............................................................... A-4
Biohazard warning ...................................................................................... A-4
Chemical hazard warning ........................................................................... A-5
xiv Table of Contents
Page 15

Caution symbol .................................................................................................. A-5
Warnings that apply to all Waters instruments ......................................... A-5
Electrical and handling symbo l s ............. .. ... .. .. .. .. .............. .. .. .. .. ... .. .. .......... A-13
Electrical symbols.......................................................................................... A-13
Handling symbols .......................................................................................... A-14
B Detector Specifications ....................................................................... B-1
Operational specifications ............................................................................. B-2
Optical specifications ..................................................................................... B-4
Optional Waters TaperSlit Flow Cell specifications ............................... B-5
C Spare Parts ............................................................................................ C-1
D Solvent Considerations ....................................................................... D-1
Introduction ...................................................................................................... D-2
Clean solvents.................................................................................................. D-2
Solvent quality................................................................................................. D-2
Preparation checklist....................................................................................... D-2
Water................................................................................................................ D-2
Using buffers...................... .. .. .............. .. .......................... .. ........................... .. . D-2
Tetrahydrofuran .............................................................................................. D-3
Solvent misc ib ility ....... .. ... .. ............. .. ... .. .. ............. .. ... .. .. .. ............. ... .. .. .. ......... D-3
How to use miscibility numbers...................................................................... D-5
Buffered solvents ............................................................................................. D-6
Head height ....................................................................................................... D-6
Solvent visc os i t y ............. ... .. .. .. .. .............. .. .. .. ... .. ............. .. .. ... .. .. ............. ... .. .. .. D-6
Mobile phase solvent degassing ................................................................... D-6
Gas solubility ........................ .. .. .......................................................... .. .. ......... D-7
Effects of intermolecul ar fo rces ....................... .. .............. .. ............. .. .......... D-7
Effects of temp e ra t u re .... .. .............. .. .. ............. .. ........................... .. ............ D-7
Effects of par tia l pre ssure ........ ............. .. ........................... .. ............. ... .. ..... D-7
Table of Contents xv
Page 16

Solvent degassing methods ............................................................................ D-8
Sparging ........................................................................................................... D-8
Vacuum degassi n g ..................................... .. ... ............. .. ........................... .. .. ... D-8
Solvent degassing considerations ................................................................... D-8
Sparging ... .. .... ..... .... .. ..... .... .. ..... .... ..... .. .... ..... .. .... ..... .... .. ..... .... .. ..... .... ..... .. ... D-8
Vacuum Degassing ...................................................................................... D-9
Wavelength selection ...................................................................................... D-9
UV cutoffs for common solvents...................................................................... D-9
Mixed mobile phases...................................................................................... D-10
Wavelength selection for chromophore detection......................................... D-11
xvi Table of Contents
Page 17

1 Theory and Principles of
Operation
This chapter summarizes the Waters® 2489 UV/Visible Detector features
and describes the theory and principles of operation.
Contents:
Topic Page
Detector description 1-2
Principles of operation 1-4
Operational modes 1-11
See also: Appendix B for system specifications and Appendix D for
information on high-performance liquid chromatograp hy (HPLC)
solvent considerations.
1-1
Page 18
Detector description
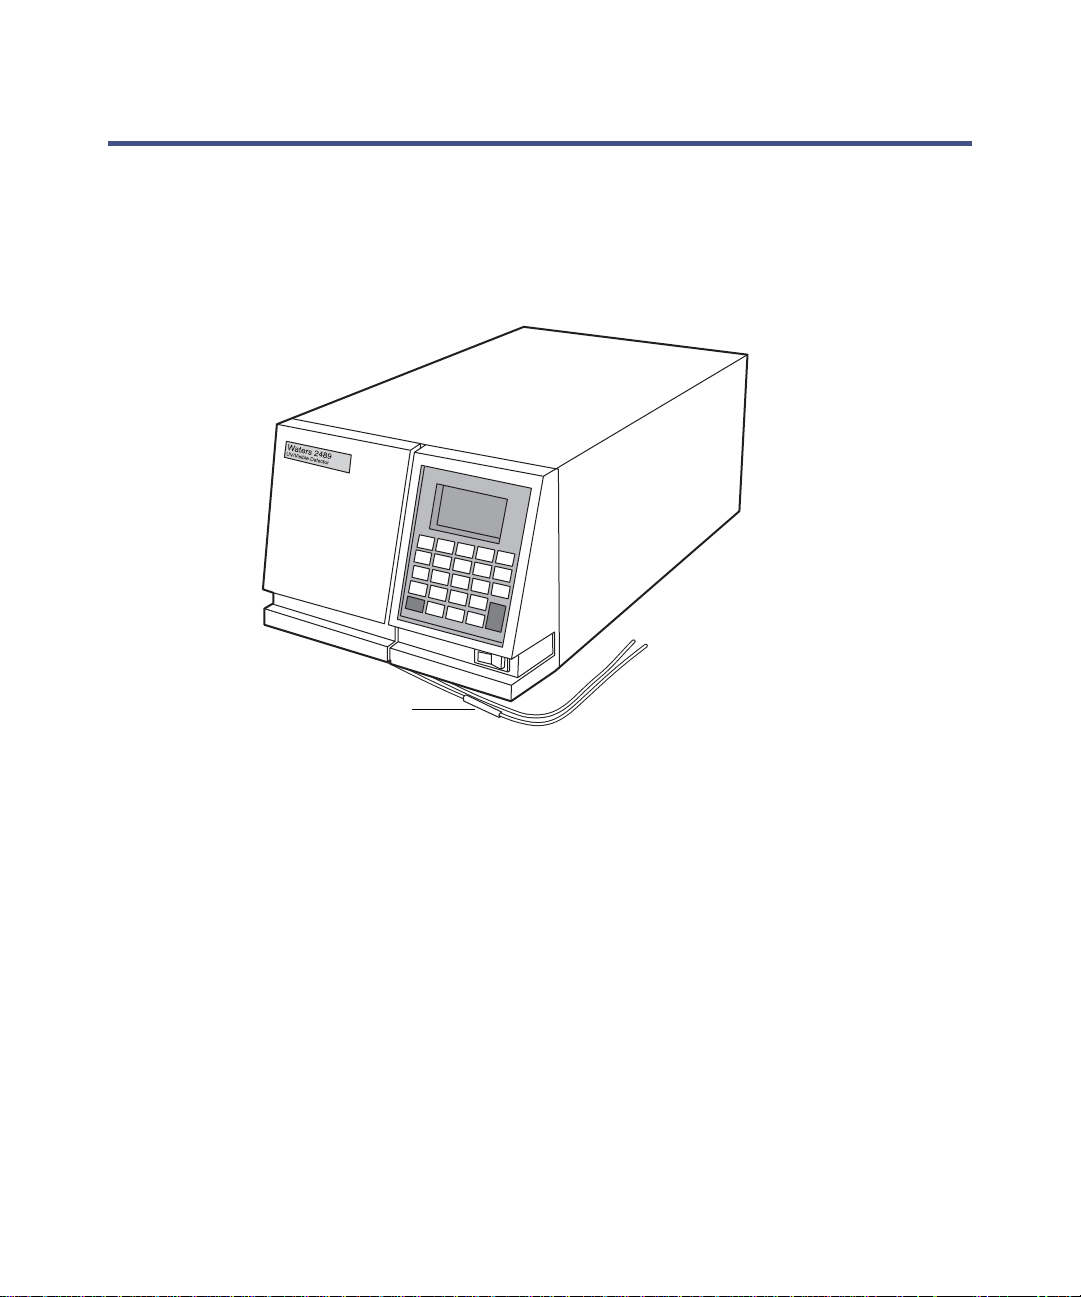
The Waters 2489 UV/Visible Detector is a two-channel ultraviolet/visible
(UV/Vis) detector designed for high-performance liquid chromatography
(HPLC) applications.
Waters 2489 UV/Visible Detector
Inlet
The detector can oper ate ei ther as a s ta nd-alone unit (w ith a char t record er or
integrator) or as an integral part of a Waters chromatography system.
The detector can be configured with Empower™ or MassLynx™ software
systems.
Features
The detector operates from 190 to 700 nm. The detector uses optics with an
enhanced illumination system for improved performance. These design
features increase the optical throughput and sensitivity and reduce
bandwidth for an overall increase in signal-to-noise ratio and improved
linearity.
1-2 Theory and Principles of Operation
Page 19

The detector has the following capabilities:
• Stand-alone programmability – Stores up to five user- def ined programs
(or methods) consisting of up to 50 programmable timed events and two
threshold events each.
• Single or dual wavelength – Monitors absorbance at one or two discrete
wavelengths.
• Wavelength verification reference filter – Ensures wavelength accuracy.
• Automatic second order filter – Automatically engaged for wavelengths
370 nm and greater and removed for wavelengths 369 nm or less.
• Spectrum scan and storage – Supports spectrum scan, display,
subtraction, storage, and playback, in addi tion to standard absorbance
and UV/Vis functionality.
• Cuvette qualification – Facilitates qualification of the detector by
insertion of a standard in a cuvette without breaking any fluid line
connections. Waters qualification kits are available in cuvette form to
support this feature. This feature als o allows you to use the detector as a
benchtop spectrophotometer.
• Cuvette sample analysis – Allows the spectrum of any sample placed in
the cuvette to be recorded.
• Method editing and storage – Supports basic me thod programming,
storage, and retrieval from the front panel.
• Full diagnostic capability – Supports buil t-in diagnostic t ools to optimize
functionality and performance.
• Two contact closure outputs – The detector has two configurable
switches, each of which can accommodate a maximum of +
30 Vdc, 1.2-A
current carry, and 0.5-A current switching. The switches (SW1 and
SW2) can trigger fraction collectors and other external devices, as well
as activate based on time, absorbance threshold, or ratio criteria.
• Improved thermal wander management– To mitigate thermal
instability caused by ambient temperature changes, the detector has
improved insulation (for better air flow acros s the optics bench) and a
variable speed fan that will run at higher or lower speeds as needed.
• Median Baseline Filter (MBF) - A variation of the data mode, t he MBF is
intended to decrease the effects of gradient separations on the
chromatographic baseline. The MBF enhances the UV detector's
baseline stability by decreasing its curvature, making the development
of integration methods easier.
Detector description 1-3
Page 20

Principles of operation
To use the detector effectively, you should be famili ar wit h i ts optical and
electronic design and the theory and principles of its operation.
This section describes the following parts and functions of the detector:
•Optics
• Wavelength verification and test
•Flow cell
• Electronics
Detector optics
The Waters 2489 UV/Visible Detector optics are based on a Fastie-Ebert
monochromator and include the following:
• High brightness deuterium (D
• Two mirrors: one off-axis ellipsoidal mirror and one spherical mirror
• Filter wheel
• Shutter, wavelength calibration filter , and second order filter
• Entrance slit
• Blazed, plane holographic diffraction grating
• Beamsplitter
• Sample and reference photodiodes
• Waters TaperSlit™ Flow Cell (its entrance is the exit slit of the
monochromator)
• Cuvette holder
) lamp
2
1-4 Theory and Principles of Operation
Page 21
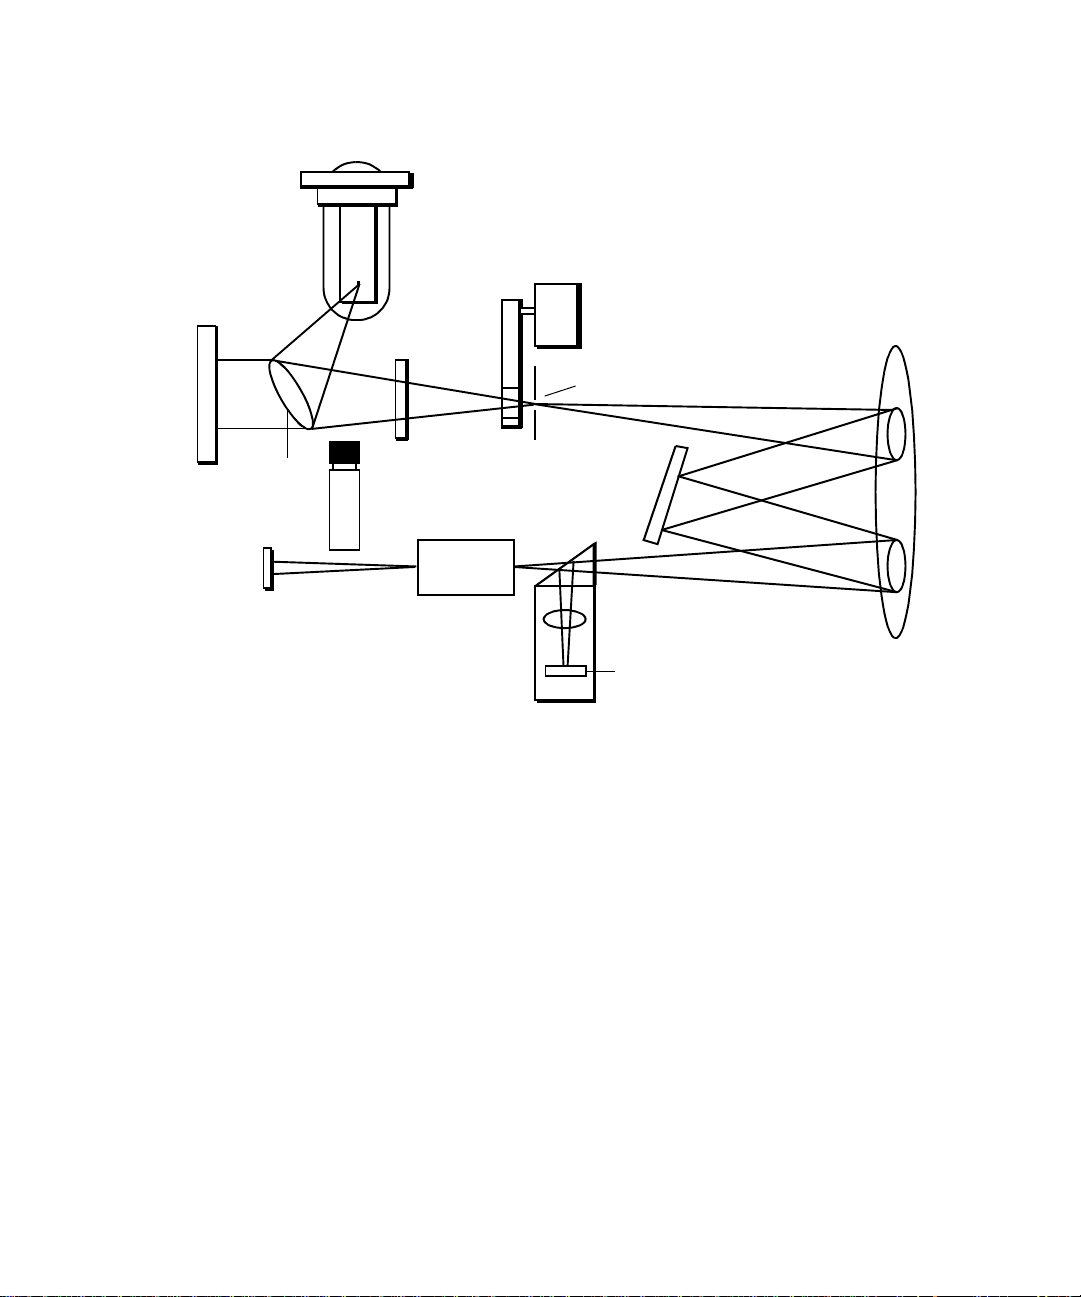
Waters 2489 UV/Visible Detector optics assembly
D2 lamp
Filter
wheel
Slit
Grating
TaperSlit
Flow Cell
Beamsplitter
Reference
photodiode
Ellipsoidal
mirror
Sample
photodiode
Window
Optional
cuvette
Spherical
mirror
Optics assembly light path
The detector provides an extremely effic ient design for exceptionally high
light throughput. It operates as follows:
1. The ellipsoidal mirror collects li ght from the lamp and focuses it through
the filter wheel onto the entrance slit. The spherical mirror directs light
toward the grating. A different portion of the spherical mirror focuses
dispersed light of a particular wavelength band, determined by the
grating angle, onto the entrance of the flow cell. Light exiting the flow
cell passes through the cuvette location to the sample photodiode.
2. The beamsplitter, located just ahead of the flow cell, diverts a portion of
the light to a reference photodiode.
3. When you enter a new wavelength through the det ecto r’s f ront pane l (o r
through Empower™ or MassLynx™ softwar e ), the detector rotates the
grating to the appropriate position.
Principles of operation 1-5
Page 22

4. The preamplifier board integrates and digi tizes the currents from the
photodiodes for processing by the signal processing electronics and
output to a computer, chart recorder, or integrator.
Waters TaperSlit Flow Cell
The Waters TaperSlit Flow Cell used in this detector renders the detector
baseline less sensitive to changes in mobile phase refractive index (RI). RI
changes occur during gradient separations or res ult from temperature or
pump-induced pressure fluctuations.
To achieve RI immunity, a combination of a spherical mirror, a lens at the
entrance of the flow cell, and a taper to the internal bore of the flow cell
prevents light rays from striking the internal walls of the flow cell. An
additional feature of the TaperSlit flow cell and the reason for its name is the
shape of the flow cell entrance, which matches the shape of the entrance slit.
The detector achieves higher light throughput for a given spec tral resolution
via the TaperSlit cell design, compared to a conventional flow cell with a
circular entrance.
As shown in the figure below, in a conventional cell, light bends and hits the
wall of the flow cell. Four beams go in, but only two come out. In the Waters
TaperSlit Analytical Cell, the combination of the lens and Taper Slit bore
geometry prevents light from hitting the cell walls. Four beams go in, and four
beams come out.
1-6 Theory and Principles of Operation
Page 23

Comparison of flow cell characteristics
0
Conventional Cell
UV
Light
Window
Waters TaperSlit™
Analytical Cell
UV
Light
Lens
Window
Window
TP0153
The standard analytical, inert, and LC/ MS cells have a path length of 10 mm.
The semi-prep and microbore cell path length is 3 mm. The autopurification
cell path length is 1.0 mm. A variabl e path length flow c ell (path length 0. 15 to
3 mm) is also available.
Filtering noise
The detector provides a Hamming filter to minimize noise. The Hamming
filter is a digital finite impulse response filter, which creates peak height
degradation and enhances the filtering of high frequency noise.
The behavior of the filter depends on the filter time constant you select. You
can program a filter time to be Fast, Slow, Normal, or Other. If you select
Fast, Slow, or Normal, you do not need to enter a value. The filter constant is
determined by the data rate. If you select Other, you can enter a value.
However, the value you enter will be rounded up or down to a value based on
the data rate.
Principles of operation 1-7
Page 24

The filter time constant adjusts the f ilter response time to achieve an optimal
signal-to-noise ratio. Select ing Other and entering a value of 0.0 disables all
filtering.
Lower time constant settings produce these effects:
• Narrow peaks with minimal peak distortion a nd time delay
• Very small peaks become harder to discriminate from baseline noise
• Less baseline noise is removed
Higher time constant settings produce these effects:
• Greatly decrease baseline noise
• Shorten and broaden peaks
The software includes fast or normal filtering cons tants at each data rate that
are appropriate for high speed or high sensitivity applications respectively.
The following figure shows the relationship between increased filter time
constant and absorbance.
1-8 Theory and Principles of Operation
Page 25

Filter Time Constant comparison
Tip: Although the peak shape shows some distortion and the signal output is
delayed with different time constants, the peak area remains the same.
Wavelength verification and test
The detector deuterium arc lamp and the integral erbium filter exhibit peaks
in the transmission spectrum at known wavelengths.
Upon startup, the detector verifies calibration by comparing the locations of
these peaks with expected wavelengt hs based on cali bration data stored in the
detector’s m e m o r y . If th e results of thi s v e ri fication dif fer from the stor ed
calibration by more than 1.0 nm, the detector displays a Wavelength
Verification Failure message. The detector verif ies rather than r ecalibrates on
startup to avoid errors that may occur because of residual material s left i n the
flow cell and /o r the cuvette.
TP02833
Principles of operation 1-9
Page 26

Requirement: Always ensure that the cuvette is removed and the cuvette
holder and front left panel door are secured during startup verification.
You can initiate a manual wavelength calibration at any time. A manual
calibration replaces the previous calibration data with new data. See
“Wavelength calibration” on pag e 3-30 for the manual wavelength calibration
procedure.
The verification and calibration algorithms are virtually iden tical. However,
the verification algorithm may issue an error message indicatin g that actual
data does not match stored data , wher e the calib ration algor ithm rep lace s the
stored data with the new data.
The detector wavelength verification procedures establish an approximate
Home position using a grating homing sensor. Once Home is established, the
detector locates and references the 656. 1-nm peak in the deuterium lamp
emission spectrum.
The integral erbium filter moves into the common light path ahead of the fl ow
cell entrance slit, enabling the detector to locate three additional spectral
features at these wavelengths:
• 256.7 nm (UV)
• 379.0 nm
• 521.5 nm
The verification tests for the det ect or require 5 minutes of lamp warmup time
so the lamp can stabilize.
If you run the detector continuously, Waters recommend s that you perform
wavelength verification weekly by turning off the detect or, then turning it on
again.
See also: “Wavelength calibration” on page 3-30.
1-10 Theory and Principles of Operation
Page 27

Operational modes
The detector operates in single or dual wavelength mode, allows spectrum
scanning using a flow cell or a cuvett e, and provide s RatioPlot , differe nce plot,
and MaxPlot functions.
Single wavelength mode
Single wavelength is the default mode of operation for the detector. The
detector supports monitoring of a single wavelength from 190 nm to 700 nm,
settable in 1-nm increments on channel A. You can configure the analog
outputs for channel B while the detector is operating in single wavelength
mode, so you can use channel B to obtain additional information about the
wavelength selected on channel A.
In single wavelength mode, the detector automatically engages the second
order filter for wavelengths 370 nm and above and removes it for wavelengths
under 370 nm. The second or der filte r is an op tical filt er that bloc ks unwanted
ultraviolet (UV) light from striking the diff raction grating and interfering
with absorbance detection above 370 nm.
You can configure several additional parameters when using the det ector in
single wavelength mode.
Primary parameters
The following are the major parameters you can use in single wavelength
mode:
• Wavelength in nm – Specifies a wavelength for channel A from 190 to
700 nm settable in 1-nm increments.
• Sensitivity in AUFS – Specifies the scaling factor for the analog output
channels and corresponds to the absorbance unit (AU) value where the
analog outputs saturate at full-scale values. Absorbance units full-scale
(AUFS) vary from 0.0001 to 4.000 AU.
Note: Changing the sensitivity (AUFS) setting affects the 2-V output.
• Chart polarity (+ or –) – Reverses the polarity of the charted
chromatogram. Select + for a normal chromatogram, or – for an inverted
chromatogram. This function changes t he direction o f the plot on the 2 -V
output, similar to reversing the leads to an external chart recorder.
Operational modes 1-11
Page 28

• Filter time constant – Programs a filter time in seconds. Options are
Fast, Slow, Normal, or Other. If yo u sele ct Fast, S low, or Nor mal, you d o
not need to enter a value. The filter constant is determined by the data
rate. If you select Other, you can enter a value, but the value you enter
will be rounded up or down to a value based on the data rate. Selecting
Other and entering a value of 0.0 disables all filtering.
• Analog rate – Specifies a value up to 80 Hz.
Secondary parameters
When on the absorbance (or HOME) screen in single wavelength mode,
pressing Next brings you to several pages of these secondary, or less
frequently specified, parameters:
• Absorbance offset (in mV)
• Auto zero on inject
• Auto zero on λ changes
“Primary and secondary functions” on page 3-14 and the Table titled
“Absorbance and message screen icons” on page 3-4 explain the functions,
ranges, and defaults of these parameter s.
Dual wavelength mode
In dual wavelength mode, the detector can monitor two wavelengths, one on
channel A and one on channel B. The sampling frequency is reduced to 1 or
2 Hz, limiting use of this mode to more standard chromatography where peaks
span at least 20 seconds to enable full characterization of a peak. You can use
dual wavelength mode to obtain additional information about an analyte by
running a RatioPlot or a MaxPlot.
The detector allows you to select any two wavelengths from 190 to 700 nm.
In dual wavelength mode, the following conditions apply:
• If both selected wavelengths are greater than 370 nm, the detector
applies the second order filter to block unwanted UV light.
• If both selected wavelengths are less than or equal to 370 nm, the
detector removes the second order filter.
• If the selected wavelengths bracket the 370 nm threshold, the detector
does not apply the second order filter and issues a warning message that
any data collected for the wavelength above 370 nm may contain
1-12 Theory and Principles of Operation
Page 29

inaccuracies because of possible UV light interference (second order
effects).
Chart Out selection modes
When operating in dual wavelength mode, the d etector off ers these c hoices f or
analog output in addition to the selections off ered in single wavelength mode
and explained in “Single wavelength mode” on page 1-11. The default
selection for dual wavelength mode is Absorbance.
• Absorbance (A and B) – This is the standard LC mode where the curr ent
absorption is scaled and sent directly out the analog output. The scaling
depends on the AUFS setting and the absor bance offset. The abs orbance
value is scaled for the 2-V analog output. If a setting of 1 AU/V is
desired, you can set an AUFS of 2.0000 for either the A or B output
channels that can be controlled independently, even in single
wavelength mode.
• MaxPlot – This mode results in the output of the larger of the two
absorbance values, scaled to the selected AUFS sett ing. This mode is
useful when looking at multiple compounds with absorbancies at two
separate wavelengths with one data channel.
• RatioPlot (A/B) – This mode produces the ratio of absorbance from two
wavelengths. Theoretically, the ratio is constant for a pure
chromatographic peak and variable f or an impure peak. This re sults in a
nonsquared response. Instead of a programmable AUFS, the detector
provides minimum and maximum ratio values that scale the ratio plot
proportionally. In addition, a configurable minimum absorbance
threshold activates ratio output scaling only when it reaches the
absorbance at both wavelengths.
• Difference Plot (A-B) – This mode plots the arithmetic difference in
absorbance for the two monitored wavelengths.
Spectrum scanning
Note: When the detector is operating under the control of the Empower
software, the scanning function is disabled.
You can use the detector as a spectrophot ometer to acquire spectr a from either
the flow cell or the cuvette. You can scan and store up to three sp ectra (three
reference or zero scans, or three sample scans) in memory f or playback or to
compare with other spectra.
Operational modes 1-13
Page 30

The major difference between the detector and a double-beam
spectrophotometer is that the detector employs only one flow cell or cuvette,
rather than a simultaneous sample and a reference pair.
Recommendation: Use a matched pair of cuvettes for the zero and sample
scans.
The detector obtains an absorbance spectrum by perfor ming two types of scan
on the flow cell or using the cuvette:
• Zero scan – Characterizes the baseline abs orbance spe ctrum of a solvent.
• Sample scan – Subtracts the zero scan, so the results displayed or
charted are of the sample only.
To obtain a spectrum of a sample with the detector, you need to run a zero
scan first, followed by a sample scan. Typ icall y, the zero scan i s run wi th pure
solvent and the sample scan is of the analyte dissolved in that solvent.
Spectra can be simultaneously charted on the channel A output, or acquired
and stored in memory for later playback.
See also: “Scanning using the cuvette” on page 3-59 and “Scanning using a
flow cell and a syringe” on page 3-62.
Cuvette operations
The detector cuvette option is used to measure the absorbance spectrum of a
sample in a cuvette.
To generate and store a spectrum:
1. Acquire a zero scan, which measures the absorbance of the contents of
the cuvette and flow cell over the desired wavelength range.
2. Acquire a sample (absorbance) scan, which measures the absorbance of
the analyte dissolved in mobile phase.
The detector subtracts the zero scan from the sample scan to create a sample
spectrum.
Since the cuvette scan is acquired by measuring the absorbance from a light
path that includes both the flow cell and the cuvet te, the so lvent co ndit ions in
the flow cell should be identical for both scans. For a detailed explanation of
cuvette scanning, see “Scanning using the cuvette” on page 3-59.
1-14 Theory and Principles of Operation
Page 31

RatioPlot
The detector allows ratio plotting: comparing the absorbances of a compound
or analyte at two different wavelengths. The RatioPlot divides absorbanc es at
two selected wa v e l en gths and plots th e resulting rati o on a ch a r t re c order or
data system over one output channel (channel A). The RatioPlot is useful in
detecting hidden components present within individual peaks.
The RatioPlot of a spectrally homogeneous peak appears as a rectangular
wave. The RatioPlot of an impure peak appears as a distorted wave. When
obtaining a RatioPlot, you m ust be operating the detector in dual wavelength
mode; the RatioPlot is output on the selected channel.
For an explanation of the RatioPlot procedur e, see the discussio n “Obtaining a
RatioPlot” on page 3-34.
MaxPlot
The MaxPlot function monitors absorbance at two selected wavelengths and
plots the maximum absorbance value for each sample component. To obtain a
MaxPlot, you must operate the detector in dual wavelength mode. The
MaxPlot outputs the greater of the two absorbance values on the selected
channel.
For an explanation of the MaxPlot procedure, see the discussion “Obtaining a
MaxPlot” on page 3-35.
Thermal wander management
To mitigate thermal instability caus ed by ambient temperature changes, the
detector has improved insulation (for better air flow across the optics bench)
and a variable speed fan that will run at higher or lower speeds as needed.
You will hear the fan change speeds in response to the thermal changes. This
is normal operating behavior.
Operational modes 1-15
Page 32

1-16 Theory and Principles of Operation
Page 33

2 Installing the Detector
The Waters® 2489 UV/Visible Detector require s connec tio ns to e lectric al
power and to sample and waste lines to operate in any standard
laboratory environment. This chapter describes how to install the
detector and connect it to the electrical supplies and to other equipment
in an HPLC system.
Contents:
Topic Page
Preparing for installation 2-2
Site selection and power requirements 2-4
Making fluid line connections 2-6
Making electrical power connections 2-9
Connecting to other devices 2-20
2-1
Page 34

Preparing for installation
Major steps in installing the detector
Start installation
procedure
Select appropriate
site
Unpack and
inspect
Install detector
Make fluid line
connections
Make power
connections
Make signal
connections
Make connections
to other devices
Installation
complete
After installing the detector, you should verify its functions and keep the
verified chart output (if applicable) on file. Verification ensures proper
operation of the detector optics and electronics. For proper verification
procedures, see “Verifying the detector” on page 3-27.
2-2 Installing the Detector
Page 35

Detector dimensions
28.4 cm (11.2 inches)
20.8 cm (8.2 inches)
50.3 cm (19.8 inches)
TP02804
Caution: Do not access the instrument through the top cover. Access
the instrument through the front left p anel where the la mp housi ng,
flow cell assembly, and cuv ette holder are located.
Preparing for installati on 2-3
Page 36

Site selection and power requirements
Site selection
Install the detector in an area that meets the requirements listed in the table
below.
Installation site requirements
Parameter Requirement
Operating temperature
range
Storage temperature
range
Relative humidity 20% to <95%, noncondensing
Storage humidity range 0 to <95%, noncondensing
Bench space 12.7 cm (5 inches) clearance at rear
Vibration Negligible
Static electricity Negligible
Power Grounded ac, 100/240 Vac, 50/60 Hz
Requirement: You must mount the detector on a level surface to allow proper
function of the drip management system (drain tube), which you can connect
to a waste reservoir to divert solvent leaks from the flow cell.
4 to 40 °C (39 to 104 °F)
–30 to 60 °C
Power cord type required:
• SVT in the United States
• HAR type (or better) in Europe
For information regarding the type of
cord to use in other countries, contact
your local Waters distributor.
2-4 Installing the Detector
Page 37

Power requirements
Warning: To avoid electric shock,
• use the SVT- ty pe power cord i n th e Un i ted States an d H AR -type
(or better) co r d i n E u r ope.
• power-off and unplug the detector before performing any
maintenance procedures on the instrument.
• connect all HPLC system components to a common ground.
The detector requires
• grounded alternating current (ac) power source.
• minimal power transients and fluctuations.
• a line voltage of 100 to 240 Vac. (Power consumption is 185 volt amps.)
• operation in nominal voltage range of 100 to 240 Vac.
• a 3.15-A 250-V fast-blo fuse
Warning: To avoid electric shock, power-off the detector and unplug
the power cord before you replace the fuse.
Warning: To reduce the risk of fire hazard, always replace the fuse
with the same type and rating.
Unpacking and inspecting
The detector is packed and shipped in one carton that contains the following
items:
• Waters 2489 UV/Visible Detector Startup Kit, which includes this guide
• Power cord
•Release notes
Site selection and power requirements 2-5
Page 38

Unpacking
To unpack the detector
1. Unpack the contents of the shipping carton. As you unpack the carton,
check the contents to make sure you have received all items.
2. Check the contents of the startup kit.
3. Save the shipping carton for future transpo rt or shipment.
Inspecting
If you see any damage or discrepancy when you inspect the contents of the
carton, immediately contact the shipping agent and Waters Technical Service
at 1-800-252-4752, U.S. and Canadian customers only. Other customers, call
your local Waters subsidiary or your local Waters Technical Service
Representative, or call Waters corporat e headquarters for assistance at
1-508-478-2000 (U.S.).
Tip: Make sure the instrument serial number, found on the nameplate on the
rear panel or inside the front left pane l of the detector, corresponds to the
number on the instrument integrity certificate.
For more information about the instrument warranty, see Waters Licenses,
Warranties, and Support Services.
Making fluid line connections
Before initial startup of the detector
1. Complete the fluid line connections described in this section.
2. Complete the electrical connections described in “Making electrical
power connections” on page 2-9.
Caution: Observe Good Laboratory Practices when handli ng
solvents. Refer to the Materi al Safety Data Sheets for the
solvents in use.
2-6 Installing the Detector
Page 39

Requirement: You must make the following fluid line connections on your
detector unit:
• Column connections
• Drip management system connections
Recommendations:
• Before completing the column con n e ctions, perform the veri fi c a ti on
procedures described i n “Verifying the detector” on page 3-27.
• Install a waste reservoir connected to the drain tube, located next to the
rubber foot on the front lower-left section of the detector.
©
• Use Tygon
tubing to connect the drain tube to the waste reservoir.
Caution: The detector, as shipped, ha s a standard analytical fl ow cell
pressure-rated at 1000 psi. To prevent damage, do not connect any
tubing or device that might cause backpressure to excee d the
pressure rating of the tubing or flow cell.
Connecting columns
The fluid line connections to the detector are located in the front right-hand
side of the flow cell assembly (see the figure below).
To make the inlet and outlet tubing connections
1. Attach the stainless s teel compression fitting and ferrule (supplied in
the startup kit).
2. Connect the inlet tubing to the column outlet. Ensure the tubing is
seated firmly, then tighten the compression screw.
3. Connect the Tygon
tubing to the flow cell outlet tubing and route to a
waste container.
Making fluid line connections 2-7
Page 40

Detector fluid line connections
Inlet
(labeled)
Outlet
Assembling the fittings
To assemble each fitting
1. Slide the compression screw over the tubing end, followed by the ferrule.
2. Mount the ferrule with its taper end facing the end of the tubing.
2-8 Installing the Detector
TP02810
Page 41

Ferrule and compression screw assembly
m
Compression screw
Ferrule
Tubing end (straight and
Tube
TP01139
Distance (determined by each
application, such as uni on or col umn fittin g)
smooth to achieve maximu
column efficiency)
Making connections
To make connections at the column outlet and detector inlet, and at the
detector outlet
1. Seat each tubing end in the appropriate fitting.
2. Seat each ferrule by tightening the compression screw 1/2-t urn past
finger-tight.
Requirement: To ensure accu ra t e verificati o n , p o w e r-on the dete ct or before
pumping any mobile phase or solvent through the flow cell.
Recommendation: To prevent reabsor ption of dissolved oxygen (for systems
using vacuum degassers), Waters recommends that you run the solve nt
degasser continuously when operating the detector at wavelengths less than
230 nm.
Making electrical power connections
To connect the detector to the ac power supply:
1. Plug the receptacle end of the power cord into the ac input connector on
the rear panel of the detector (see the figure below).
2. Plug the other end of the power cord into a properly grounded ac power
source.
Making electrical power connections 2-9
Page 42

Detector rear panel
The detector connects to other Waters components through rear panel
electrical connections.
Detector rear panel electrical connections
Inputs and
Outputs
Fan Vent
Power input
Fuse holder
TP02807
Rear panel connections enable the following signals:
• Analog outputs – There are two pairs of attenuated analog channel
outputs with each pair supporting 2-V output to external devices or data
systems. They are labeled I and II. For input/output voltage current
specifications, see the Table titl ed “Operational specifications” on
page B-2.
– The 2-V output for I and II is scaled based on the AUFS (absorbance
units full scale) setting for each channel. The detector does not
provide a traditional “unattenuated” dedicated 1-V/AU output
because of its enhanced working range above 2 AU.
– The detector analog output range specifications are – 0.1 V to 2.1 V.
– You can set the AUFS value individually for the output on each
channel. Volts per AU are calculated as follows:
Volts out = Absorbance × 2V/AUFS
2-10 Installing the Detector
Page 43

Example: An AUFS setting of 2.0000 provides a traditional 1-V/AU
output. An AUFS setting of 4.0000 provides a 0.5-V/AU output,
which supports chromatography above 2 AU.
• Switched outputs – There are two switch contact closures you can
program to turn on, off, toggle, pulse once for a defined duration, or
pulse repetitively for a specified period of time.
• Event inputs – There are four general-purpose TTL contact closures on
the detector A (inputs) terminal that support the following functions:
– Remote or inject start
–Lamp on/off
– Chart mark input
–Auto zero
• Ethernet interface – The Ethernet connection on the rear panel of the
detector allows remote control and direct data acquisition from Waters
Empower and MassLynx workstations.
Making signal connections
The rear panel of the detector (see the fi gure on page 2-10) pro vides two
analog connectors and an Ethernet communications port for operating the
detector with e x te r n a l de vi ces.
Make the signal connections to your detector, considering the following
conditions:
• Operating mode you select for the detector (stand-alone or remote
control)
• Types of instruments that make up your HPLC system
This section describes the input/output (I/O) and digita l signal connections
that you can make from the two rear panel connectors and the Ethernet
connector.
The figure below shows an overview of the steps involved in making signal
connections to the detector.
Making electrical power connections 2-11
Page 44

Overview of making signal connections
Start signal
connection procedure
Connect to Ethernet bus?
No
Connect to other devices?
No
Signal connections
complete
Yes
Yes
Install Ethernet
and inject start cables
Install event and I/O
cable(s)
Making I/O signal connections
The rear panel includes two removable connectors that hold the pins for the
I/O signals, as shown in the figure below. These connectors are keyed so that
you can insert them one way only.
2-12 Installing the Detector
Page 45

I/O signal inputs and outputs
I
II
1
2
3
4
5
6
7
8
9
10
1
2
3
4
5
6
7
8
9
10
TP01494
I/O signals
The table below describes each of the signals available on the I/O connectors.
Refer to Appendix B for details on the electrical specifications for the signals.
I/O signals for the detector
Signal Description
Inject Start
Lamp On/Off
Chart Mark
Auto Zero
Analog 1
a
a
a
a
b
TTL contact closure. Configurable input to initiate
sequencing of time-program med events. Defines the
start of a run (typically an injection) and resets and
starts the run-time clock to 0.00 minutes. Initial
conditions apply immediately.
Configurable input to allow an external device to turn
the deuterium lamp off and on.
Configurable input to add a chart mark (at 10% of full
scale) to either or both analog output channels.
Configurable input to auto zero either or both
channels.
2-V full-scale analog output signal of cha nnel A (sca led
to the current AUFS setting).
Making electrical power connections 2-13
Page 46

I/O signals for the detector
Signal Description
Analog 2
b
2-V full-scale analog output signal of cha nnel B (sca led
to the current AUFS setting).
Switch 1 (2) Used to connect to a fraction collector. Can be
Switch 2 (2)
a. Inject Start, Chart Mark, Auto Zero, and Lamp inputs are configurable from the detector first
Configuration screen by setting the appropriate parameter to High. See “Configuring event
inputs (contact closures)” on page 3-23 for more detail.
b. See the discussion of attenuation in the detector analog outputs in “Making electrical powe r
connections” on page 2-9.
controlled by threshold and timed events.
Making Ethernet connections
The detector rear panel also includes one Ethernet interface connector for
digital signal communications. Use this connector for devices such a s thes e:
• Network ad a pter card in the E m power work st a ti o n
• Solvent manager
• MassLynx version 4.1 or higher
The Ethernet connector m ates with standard Ethernet cable.
Caution: To avoid possible damage to components, power-off all
instruments on the Ethernet connector before you connect an
Ethernet cable to an instrument.
Making Ethernet connections with Waters data systems
When controlling the detector from a Waters data system or controller
(Empower or MassLynx workstation), you can use the Ethernet interface to
send and receive information from the data system.
When connecting via the Ethernet to these Waters data systems , you should
be aware of the following:
• When in dual wavelength mode, you m ust select a data rate of 1 point
per second in the data system method editor. In Empower software, the
data rate para me te rs defaults to 1 point per secon d.
2-14 Installing the Detector
Page 47

• The maximum range of the detector time constant setting depends on
the wavelength mode and data rate selected. See the Table titled
“Primary and secondary function (method) parameters” on page 3-19.
• Empower allows the detector to operate in both single and dual
wavelength modes with a wavelength range of 190 to 700 nm, and up to
4.0 AUFS.
To connect Ethernet cables from the detector to a Waters data system:
1. Connect the single receptacle end of the Ethernet cable to your data
system by attaching the cable to the network adapter (laboratory
acquisition and control environment, or LAC/E).
Note: The Ethernet cable is supplied with the Waters data system.
2. Connect the other end of the cable to the Ethernet connector on the
detector rear panel.
Caution: The maximum total cable length between Ethernet devices
in a system is 20 meters (65 feet). The maximum recommended cable
length between two Ethernet devices is 4 meters (13 feet). Longer
total cable lengths can cause intermittent Ethernet co mmunication
failures.
Ethernet connections to the detector in a Waters Empower System
busLAC/E or LAC/E32 card
Empower
workstation
Ethernet ca ble
Ethernet
connector
2489
Detector
Tip: When connecting the detector to a data system, all detec tor parameters
not configurable by the data system in use defer to local control.
Making electrical power connections 2-15
Page 48

Starting a met hod
To start a method on the detector at the start of an injection from the
separations module, make the c onnections summarized in the t able below and
illustrated in the figure below.
2695 Separations Module
(B Inputs and Outputs)
2489 Detector (II)
Pin 1 Inject Start Pin 1 Inject Start +
Pin 2 Inject Start Pin 2 Inject Start –
2695 separations module connections to the detector for starting a method
Waters 2695
B
Waters 2489
II
Turning the detector lamp on or off
Before you ca n tu rn the detector la mp on or off from th e s ep a rations modu l e ,
you need to configure the lamp on/off signal at the front panel. You must
change the default lamp configuration p arameter f rom Ignore to High or Low.
See the discussion “Configuring event inputs (cont a ct closures)” on page 3-23
for more information.
2-16 Installing the Detector
TP01525
Page 49

After configuring the detector lamp on/off signal, you can turn the lamp on or
off from the separations module by making t he connecti ons shown in the t able
and figure below.
Detector connections to separation module (lamp on or off)
2695 Separations Module
(A Outputs)
2489 Detector (II)
Pin 1 Switch 1 Pin 4 Lamp On/Off +
Pin 2 Switch 1 Pin 5 Lamp On/Off –
Separations module connections to the detector for turning the lamp on or
off
Waters 2695
A
Waters 2489
II
TP01524
Making electrical power connections 2-17
Page 50

Connecting the detector to a separations module
You can connect the detector to the separations module, when it is not under
the control of the Empower software, to perform the following functions:
• Auto Zero
• Chart Mark on Inject
Generating Auto Zero
To generate the Auto Zero function on the detect or at t he start of an injectio n,
make the connections summarized in the table and illustrated in the figure
below.
Detector connections to a separ ation module to generate Auto Zero
2695 Separations Module
(B Inputs and Outputs)
Pin 1 Inject Start Pin 9 Auto Zero +
Pin 2 Inject Start Pin 10 Auto Zero –
Before you can generate an auto zero from the separations module, you need
to configure the auto zero signal at the detector front panel. The de fault auto
zero signal is Low. See the discussion “Configuring event inputs (cont act
closures)” on page 3-23 for more information.
2489 Detector (II)
2-18 Installing the Detector
Page 51

Separations module connections to the det ector for Auto Zero on Inject
Waters 2695
B
Waters 2489
II
TP01527
Generating Chart Mark on Inject
To generate the Chart Mark function on the detector at the start of an
injection, make the connections summari zed in the table and illustrated in the
figure below.
2695 Separations Module
(B Inputs and Outputs)
2489 Detector (II)
Pin 1 Inject Start Pin 6 Chart Mark +
Pin 2 Inject Start Pin 7 Chart Mark –
Before you can generate a chart mark from the separations module, you need
to configure the chart mark signal at the detector front panel. The default
chart mark signal is Low. See the discussion “Configuring event inputs
(contact closures)” on page 3-23 for more information.
Making electrical power connections 2-19
Page 52

Separations module connections to the detector for Chart Mark on Inject
Waters 2695 Separations Module
B
Connecting to other devices
Waters 2489
II
TP01526
You can connect the detector to a wide range of HPLC system devices. This
section describes how to connect the det ector to the following devices:
• e-SAT/IN™ module (instead of Ethernet)
• Waters 745/745B/746 Data Module
• Chart recorder
• Waters 600 Series Pump
• Waters 717plus Autosampler
• Waters fraction collector
For details on connecting to other dat a modules , see the operator’s guide for
the module you are using.
2-20 Installing the Detector
Page 53

Required materials
When connecting cables to the terminals on the rear panel of the detector, you
need the following tools:
• Small flat-b l a de sc re w d r iver
• Electrical insulation stripping tool
Connecting the cables
To connect cables from other HPLC system devices to the I and II terminals
on the rear panel of the detector :
1. Remove terminal I or II (see Figure “I/O signal inputs and outputs” on
page 2-13).
2. Unscrew the connecting pin terminal.
3. Using the stripping tool, strip the wire down about 3 mm (1/ 8 inch ) from
the end.
4. Insert the st ri pped wire into th e ap propriate con n e ct or.
5. Tighten the screw until the wire is held securely in place.
6. Reinsert the terminal.
7. Press firmly to ensure that it is inserted fully.
Connecting the detector to Empower using an e-SAT/IN module
Acquiring da ta and contro l l ing the detect o r wi th Empower so ftware, by usi n g
the e-SAT/IN module instead of the Ethernet bus, requires connections
between the following hardware:
• Laboratory acquisition and control environment (LAC/E) module
(LAC/E
• Ethernet satellite interface (e-SAT/IN) module
e-SAT/IN module
The Waters e-SAT/IN module shown in the figure below translates analog
signals from devices such as the detector into digital form. It then transmits
these digital signals to the busLAC/E or LAC/E
Empower workstation.
32
Acquisition Server or busLAC/E card)
32
Connecting to other devices 2-21
card installed in the
Page 54

e-SAT/IN module (front panel)
Power
switch
LEDs
I/O connector
Analog inputs
To connect the detector to the Empower workstation:
1. Connect the detector to the e-SAT/IN module. (See “Connecting the
detector to th e e- SA T / IN module” on pag e 2-23.)
Caution:
• The e-SAT/IN module does not have a power switch. To prevent
damage to the module, always disconnect the power cord at either
the wall outlet or the power supply before attaching or removing
the power connection to the e-SAT/IN module.
• To ensure proper startup of the e-SA T/IN module, do not turn on
power to the module until you perform all procedures described in
the Waters e-SAT/IN Module Installa ti on Guide. Improper
startup can damage the unit and void the warranty.
TP02834
2-22 Installing the Detector
Page 55

Connecting the detector to the e-SAT/IN module
The e-SAT/ IN module conn e ct s to the detecto r th rough the B (i np u ts and
outputs) terminal on the rear panel of the detect or, as shown in the figure
below.
To connect the detector to the e-SAT/IN module:
1. Using the electrical insulation stripping tool, strip off about 3 mm (1/8
inch) from one end of the e-SAT/IN 9-pin connector, exposing the white
and black wires.
2. Connect the other end of the cable to either the Channel 1 or Channel 2
connectors on the front panel of the e-SAT/I N module.
3. For Channel 1:
a. Connect the white wire to pin 1 on I (Analog 1 +).
b. Connect the black wire to pin 3 on I (Ground).
e-SAT/IN module Channel 1 connection to detector
Waters 2489
(I)
4. For Channel 2:
a. Connect the white wire to pin 4 on I (Analog 2 +).
b. Connect the black wire to pin 8 on I (Ground).
Connecting to other devices 2-23
Page 56

e-SAT/IN module Channel 2 connection to detector
Waters 2489
(I)
5. Configure the serial port for the e-SAT/IN module as described in the
Empower 2 Installation and Configuration Guide.
The table below summarizes the detector connectio ns to the e-S AT/IN module .
Detector connections to a e-SAT/IN module
2489 Detector (I)
Pin 1 Analog 1 + (white)
Pin 3 Ground (black)
Pin 4 Analog 2 + (white)
Pin 8 Ground (black)
2-24 Installing the Detector
e-SAT/IN
Connector
Channel 1 or 2
Channel 1 or 2
Page 57

Connecting the detector to a 745/745B/746 data module
You can connect the detector to a Waters 745/745B/ 746 data module using the
analog output connector on the rear panel of the detector. The analog
connector provides 2-V output that is scaled to the AUFS sensitivity setting
and the voltage offset setting.
Caution: To prevent oversaturation of the signal from the detector to
the integrator, do not exceed the input voltage rating of the
integrator.
To send the analog output signal from the detector to the dat a module, use the
cable provided in the 2489 Detector Startup Kit to make the connections
summarized in the table below and illustrated in the figure below.
Detector connections to a data module
2489 Detector (I)
Pin 1 Analog 1 + (red) +
Pin 3 Ground (black) –
Pin 4 Analog 2 + (red) +
Pin 8 Ground (black) –
To minimize the chance of creating a ground loop that can adversely affect
measurement, connect the shield of the cabl e to the chassi s ground at one end
only.
745/745B/746
Terminal
Connecting to other devices 2-25
Page 58

Data module connections to detector channels A and B
Waters 2489
I
TP01485
Waters 2489
I
2-26 Installing the Detector
TP01486
Page 59

Connecting the detector to a chart recorder
Recorder signal
The A and B terminals on the rear panel of the detector provide 2-V analog
output signals that you can use to connect the detector to a chart recorder.
To send 2-V signals from the detector to a chart recorder, use the cable
provided in the 2489 Detector Startup Kit to make the connections
summarized in the table and illustrated in the figure below.
Detector connections to a chart recorder
2489 Detector
(B Inputs and Outputs)
Pin 1 Analog 1 + +
Pin 3 Ground –
Pin 4 Analog 2 + +
Pin 8 Ground –
To minimize the chance of creating a ground loop that can adversely affect
measurement, connect the shield of the cabl e to the chassi s ground at one end
only. For connection to other data systems, a cable (part number 44000172)
can help remove the incidence of ground loops.
Tip: The detector is optimized for use with the 2-V analog output.
Connect the detector to a chart recorder using the 2-V analog connection as
shown in the following figures.
Chart Recorder
Terminal
Connecting to other devices 2-27
Page 60

Chart recorder 2-V output connections on the detector
Waters 2489
I
TP01487
Waters 2489
I
Chart marks
You can generate a chart mark from the front panel of the detector. A chart
mark signal is generated whenever one of the following occurs:
• You press the Chart Mark key on the detector ke yp ad.
2-28 Installing the Detector
TP01488
Page 61

• You program a timed event to generate a chart mark.
• A signal is received from one of the chart mark inputs on the analog
connector.
Connecting the detector to the Waters 600 Series Pump
To connect the detector to the pump, locate the detector in a position that
satisfies the sit e re q u irements in “Site selection and power requirements” on
page 2-4.
Fluid line connections
Make the fluid line connections described in “Making fluid line connections”
on page 2-6.
Lamp on/off connections
In addition to making the connections described below, you must configure the
lamp on/off signal at the detector front panel. You must change the default
from Ignore to High or Low. See the discussion “Configuring event inputs
(contact closures)” on page 3-23 for more information.
Using signal cable, make the connections between the pump controller and
the detector that are summarized in the table and shown in the figure below.
Pump and detector lamp on/off connections
Waters 2489 Detector
(II)
Pin 4 Lamp On/Off + S1, S2, or S4
Pin 5 Lamp On/Off – GND
Waters 600 Serie s
Pump Terminal
Connecting to other devices 2-29
Page 62

Pump lamp on/off connections
Waters 2489
II
CHART +
PRESSURE +
CHART
PRESSURE
INJECT
STOP
FLOW
_
_
GND
HOLD
GND
SWITCHES
S1
GND
GND
S2
S3
S4
AUX.
+12V
Auto Zero connections
To make Auto Zero connections between the detector and the pump:
TP01489
1. Using a signal cable, make the connections between the detector and the
pump that are summarized in the table and illustrated in the figur e
below.
2. Program the pump to prov ide a pulse output on the applicable switch
(S1, S2, or S4) at the beginning of each run. Refer to the Wate rs 600E
Multisolvent Delivery System User’s Guide, Section 5.1.2, for more
details.
Pump and detector Auto Zero connections
Waters 2489 Detector
(II)
Pin 9 Auto Zero + S1, S2, or S4
Pin 10 Auto Zero – GND (one of four)
2-30 Installing the Detector
Waters 600 Series
Pump Terminal
Page 63

Pump Auto Zero connections
Waters 2489
CHART +
PRESSURE +
CHART
PRESSURE
SWITCHES
S1
S2
S3
AUX.
S4
+12V
INJECT
STOP
FLOW
HOLD
_
_
GND
GND
GND
GND
II
Chart Mark connections
To make Chart Mark connections between the detector and pump:
TP01523
1. Using a signal cable, make the connections between the detector and the
pump that are summarized in the table and illustrated in the figur e
below.
2. Program the pump to provide a pulse output on the select ed switch at
the beginning of each run. R efer to the Waters 600E Multisolvent
Delivery System User’s Guid e for more details.
Pump and 2489 detector Chart Mark connections
Waters 2489 Detector
(II)
Waters 600 Series
Pump Terminal
Pin 6 Chart Mark + S1, S2, or S4
Pin 7 Chart Mark – GND (one of four)
Connecting to other devices 2-31
Page 64

Pump Chart Mark connections
Waters 2489
CHART +
PRESSURE +
CHART
PRESSURE
SWITCHES
S1
S2
S3
AUX.
S4
+12V
INJECT
STOP
FLOW
HOLD
_
_
GND
GND
GND
GND
II
Inject Start connections
Tip: If the detector is connected to an Empower data system, use the Inject
Start connections to initiate the start of data acquisition.
TP01491
T o make Inject St art connections between the pump and the detector to st art
a method:
1. Using a signal cable, make the connections between the detector and the
pump that are summarized in the table and illustrated in the figur e
below.
2. Program the pump to provide a pulse output on the select ed switch at
the beginning of each run. R efer to the Waters 600E Multisolvent
Delivery System User’s Guid e for more details.
2-32 Installing the Detector
Page 65

Pump and detector Inject Start connections
pump and detector Inject Start connections
Waters 2489 Detector
(II)
Pin 1 Inject Start +
Waters 600 Series
Pump Terminal
S1, S2, or S4
a
Pin 2 Inject Start – GND (one of four)
a. You can also connect the pump inject pin to the Pin 1
Inject Start + on the detector, and the inject ground pin to
the Inject Start – on the detector.
Pump Inject Start connections
CHART +
PRESSURE +
INJECT
STOP
FLOW
GND
HOLD
GND
SWITCHES
S1
GND
S2
GND
S3
AUX.
S4
+12V
Waters 2489
II
TP01493
Connecting the detector to the Waters 717plus Autosampler
The Waters 717plus Autosampler signals the start of an injection through a
contact closure signal on its Inject Start terminals. You can use this contact
closure signal to command the detector to perform an auto zero at the start of
an injection.
Connecting to other devices 2-33
Page 66

Auto Zero connections
To auto zero the detector at the start of an injection, make the connections
described in the table and illustrated in the figur e below. Use any available
pair of Inject Start te rminals on the autosampler.
Autosampler and detector Auto Zero connections
2489 Detector
(A Inputs)
717plus
Autosampler
Terminal
Pin 9 Auto Zero + Inject Start + (any
one of three paired
with –)
Pin 10 Auto Zero – Inject Start – (any
one of three paired
with +)
Autosampler Auto Zero connections to the detector
Waters 717plus
Waters 2489
II
123456789101112131415
2-34 Installing the Detector
TP01522
Page 67

Inject Start connections
You can also use the Inject Start connections on the autosampler to connect to
the Inject Start signals on the detector to program the start of the active
method.
To program an inject start, make the connections described in the table and
illustrated in the figure below. Us e any available pair of Inject Start terminals
on the autosampler.
Autosampler and detector Inject Start connections
2489 Detector
(II)
717plus Autosampler
Terminal
Pin 1 Inject Start + Inject Start + (any one of three
paired with + )
Pin 2 Inject Start – Inject Start – (any one of three
paired with – )
Detector Inject Start connections
Waters 717plus
Waters 2489
II
123456789101112131415
TP01522A
Connecting to other devices 2-35
Page 68

Connecting the detector to a fraction collector
The detector can trigger a fraction collector based on
• Timed events (see “Timed events” on page 3-36).
• Threshold levels (see “Threshold events ” on page 3-39).
You can connect the fraction collector to one of the detector’s two
programmable switches (SW1 or SW2) and program the timed event,
threshold, or ratio at the detector front panel.
You can also connect the fraction collector to the detector to trigger a chart
mark event input each time a tube is changed at the fraction collector.
The table below indicates the correct detector-to-fraction collector and
autoinjector-to-fraction co llector connections.
Detector connections to the fraction collector
Waters 2489 Connection Waters Fraction Collector
I Pin 3 Ground Pin 1 Detector In –
II Pin 6 Chart Mark + Pin 10 Event Marker +
II Pin 7 Chart Mark – Pin 9 Event Marker –
I Pin 6 SW1 Pin 7 External Count In +
I Pin 8 Ground Pin 8 External Count In –
Waters 2695 Separations Module/717plus Autoinjector
Inject Start + External Start In +
Inject Start – External Start In –
See also: Refer to the documentation provided with your fract ion coll ector for
complete informati on.
2-36 Installing the Detector
Page 69

3 Preparing the Detector
Contents:
Topic Page
Initializing the detector 3-2
Using the operator interface 3-3
Scanning spectra 3-44
After you install the detector, you are ready to set it up and operate it as a
stand-alone instrument or as part of a data system.
• As a stand-alone instrument − You can use the detector as a stand-al one
detector within a system, or with any fluid-handling unit, injector,
integrator, or data sy stem. You can program the front panel of the
detector for stand-alone operation, except when it is in remote mode.
See also: “Operating the detector” on page 3-26.
• As part of an Empower system − Use the detector configured with an
Empower system to control and collect digital data. To configure the
detector with this s yst em, foll ow the i nst ruct ions i n t he Empower online
Help to specify pa r a m e ters and cont ro l th e de tector.
• As part of a MassLynx system − Use the detec tor configured with a
MassLynx system to control and collect digital data. To configure the
detector with this system, follow the instructions in the MassLynx
online Help to specify parameters and cont rol the detector.
Requirement: To ensure accurate operation, and before pumping any mobile
phase or solvent through the flow cell, be sure to perform the procedures in
“Verifying th e detector” on page 3-27.
3-1
Page 70

Initializing th e detector
Before you power-on the detec tor, be sure the connect or from the det ector re ar
panel to the power source is properly installed.
To power-on th e de te ctor, press th e O n /Off switch lo c at e d o n th e front,
lower-right corner of the unit.
At startup, the detector beeps thr ee times and runs a series of startup
diagnostic tests. If it passes all startup diagnostic tests, the startup
diagnostics OK messages appear.
Detector Startup Diagnostics display
STARTUP DIAGNOSTICS
TPU
OK
SCI
OK
OK
GPIB
OK
QSPI
Following display of the Startup Diagnostics screen, the detector displays the
following series of messages in sequence for about five minutes:
ROM
RAM
LCD
CPU
OK
OK
OK
OK
• Initializing grating
• Initializing system
• Lighting lamp
• Warmup time left: n minutes
• Homing optical filter
• Searching for 656 nm
• Optimizing system performance
• Finding calibration peaks
•Restoring last setup
• Completing initialization
When initialization is complete, the detector displays the absorbance screen
shown in the figure below. The sections “Using the keypad” on page 3-6 and
“Navigating the user i nterface ” on page 3-12 provide more info rmation on t his
and subsequent screens.
3-2 Prepari ng the Detector
Page 71

Tip: For normal use, allow the detector to warm up for at least 30 minutes
before operating.
Diagnostic test failure
If one or more of the internal startup diagnostic tests show a failin g result, the
detector beeps and displays an error message. For serious errors, it displays
the word “Error” in brackets (<Error>) in place of the run-time absorbance on
the absorbance screen.
See also: “Error messages” on page 5-2, for a list of startup diagnostic test
failures, error message s, and recommended recovery actions. See “Hardware
troubleshooting” on page 5-20 for hardware-related causes of startup
diagnostic test failure and corrective actions.
Using the operator interface
Using the display
The detector employs a 128 × 64-bitmap graphic display and a 24-key
membrane keypad for the operator interface. After the startup diagnostic
tests are run successfully, the detector displays the absorbance (or HOME)
screen.
Detector absorbance screen
Absorbance
Channel selector
Wavelength
Sensitivity
Lamp on/off
Next
Shift on/off
Single/Dual wavelength
Keypad lock/unlock
Local (method #)/Remote control
Run time (minutes)
Sticky Diag nos tic test on/ of f
You can recall the absorbance screen at any time by pressing the HOME key.
At the first use of the detector, the absorbance screen shows the factory-set
defaults. After the firs t use, the absorbance screen shows the settings
Using the operator interface 3-3
Page 72

displayed before the detector was last powered-off. The absorbance screen
continues to change as the run continues.
The detector monitors absorbance of one or two wavelengths in real time,
while allowing you to modify all the parameters discussed in the table below.
You can use the A/B key to toggle between absorbance screens for channels A
and B.
Absorbance and message icons
The absorbance screens and message screens in the detector program display
the icons or fields shown in the figure on page 3-3 and described in the table
below. For a list of ranges and defaults for the function icons and fields
described in this table, see the Table titled “Primary and secondary function
(method) parameters” on page 3-19.
Caution: Changing the sensitivity (AUFS) setting affects the 2-V
output. For example, 1 AU gives 0.5 AU/V and 2 AU gives 1 AU/V.
Absorbance and message screen icons
Icon or Field Icon / Field Name Funct ion
Field
requiring
entry
Field
requiring
entry
3-4 Prepari ng the Detector
Sensitivity or
AUFS
Wavelength Selects the wavelength monitored on the
Channel Selector Displays which channel is selected when
Selects the chart sensitivity in
absorbance units full-scale (AUFS) for
the selected channel (Ethernet signal is
not affected).
selected channel. When in single
wavelength mode there is no ind ependent
control of wavelength on channel B.
you press the A/B key. The selected
channel overlaps the other channel.
Displays the ON A or ON B icon for the
channel on which a timed or threshold
event is programmed.
When you press the TRACE key, displays
only the channel being viewed.
Page 73

Absorbance and message screen icons
Icon or Field Icon / Field Name Funct ion
Numerical
field
Absorbance Displays current absorbance for the
selected channel.
Lamp On/Off On = Lamp icon
Off = Lamp icon with an X through it
Shift On/Off Blank = Shift off
▲ = Shift on
Single/Dual
Wavelength
λ = Detector operating in single
wavelength mode
λλ = Detector operating in dual
wavelength mode
Keypad
Lock/Unlock
Sticky Diagnostic
icon
Open lock = Unrestricted keypad entry
Closed lock = Parameter changes not
allowed
When the absorbance screen displays the
wrench icon, a sticky diagnostic test is
active. See “User-selected diagnostic
tests” on page 5-8 for a complete
explanation.
Using the operator interface 3-5
Page 74

Absorbance and message screen icons
Icon or Field Icon / Field Name Funct ion
Numerical
field
Local (Method #)
/Remote Control
Run Time
(Minutes)
Next Indicates that pressing Next brings you
Local control/Method number – If the
detector is n ot controll ed by a data
system or other control device over the
Ethernet bus, it displays a cursive “m”
and the current method number or an
asterisk (*) that indicates current
conditions are not stor ed as a method.
Remote control/Ethernet – If the detector
is controlled by a data system or other
control device over the Ethernet bus, it
displays a remote control icon cont aining
the letter E.
Displays the time elapsed since you
pressed the Run key, or since an Inject
Start signal was received.
to additional screens.
Message screen icons (from left): Error,
Question, Warning, Information, and
Standby.
Using the keypad
The detector keypad (shown below) consists of 24 keys providing
• full numeric entry (10 digits plus a decimal point).
• Enter, Shift, CE (Clear Entry), Next, and Help functions.
• ▲ and ▼ (used for navigation only; pressing ▲ may also move you to the
left, ▼ to the right).
• A/B for channel selection.
• navigation to specific screens (HOME [absorbance], DIAGnostics,
TRACE, CONFIGURE, METHOD, and SCAN).
3-6 Prepari ng the Detector
Page 75

• primary function keys (Chart Mark, Auto Zero, and Run/Stop).
• secondary function keys (Scale, Single or Dual Wavelength, Res et Clock,
Lamp, Lock, Calibrate, System Information, Contrast, Previous, Cancel,
+/–, and Clear Field).
Detector keypad
?
HOME
METHOD Calibrate
A/B
CONFIGURE
DIAG
Scale
TRACE
Shift
SCAN
Chart Mark
Lamp Lock
12
System Info
4
Cancel
0
λ/λλ
Auto Zero Run/Stop
5
87
+/−
.
Reset
3
Contrast
6
9
Clear Field
CE
Previous
Next
Enter
Primary function keys take effect imm ediately, with no further entry
required. Secondary function keys require you to enter information into
parameter fields and to press Enter for the functions to take effect.
Keys that appear in all caps (HOME, DIAG, TRACE, METHOD,
CONFIGURE, and SCAN) take you directly to a function from most screens.
For numerical entries from 1 to 9 on choice lists or menus, enter the number
corresponding to the desired item, then press Enter. For the number 10, select
0, then pres s E n te r. To go to the en d of a choice list, select •. For entries
Using the operator interface 3-7
Page 76

numbered 11 or 12, scroll to the desired item on the choice list, then press
Enter.
The table below explains the functions of the primary and secondary keys on
the detector k e y pa d.
Detector keypad description
Description
Key
Unshifted Shifted
?
HOME
SCAN
Chart Mark
λ/λλ
Auto Zero
Reset
Run/Stop
HOME – Displays the
absorbance screen containing
the icons, and the Wavelength
and AUFS fields.
Chart Mark – Causes a
momentary pulse to the
analog output (A and/or B,
depending upon the current
settings). This key has no
effect if chart mark is disabled
on both channels.
Auto Zero – Sets the
absorbance offset so that the
analog output (A and/or B,
depending on the current
settings), reads 0 AU. You can
enable or disable the auto zero
function from the third
absorbance screen (see the
figure on page 3-18).
Run/Stop – Starts or stops
(freezes) the run clock. (The
elapsed time appears near the
lower-right corner of the
absorbance screen.) Initiates
scans.
? – Displays context-sensitive
help when available.
SCAN – Displays the list of
options for generating and
manipulating spectra.
λ/λλ – When you are on the
absorbance screen, use this
key to toggle between single
and dual wavelength modes.
The current mode is i ndica ted
by an icon on the display.
Reset – Resets the detector
run clock to 0 minutes.
Returns the detector to initial
conditions for the current
method.
3-8 Prepari ng the Detector
Page 77

Detector keypad description
Description
Key
Unshifted Shifted
Arrow keys − On screens with entry fields (edit, check box, or
choice list), the active field has a thick border (highl ight). The
arrow keys can b e used to make a differe nt fi e l d a ct i ve . (U p
moves up or left; Down moves down or right.) On screens with
a scrollable list, these keys move the highlight up (toward the
beginning of the list) or down (toward the end). Other s creens
may have special instructions for the use of the Up and Down
arrow keys (for example, the Display Contrast screen).
Previous
Next
METHOD
A/B
CONFIGURE
DIAG
Scale
TRACE
Next – Displays a screen with
additional options related to
the current screen. Repeated
pressing of this key always
brings you back to where you
started. On most screens
where this key is active, the
NEXT arrow appears in the
lower-right corner of the
display.
A/B – On screens that have
the A/B icon in the upper-left
corner, this key toggles
between channel A and
channel B parameters.
DIAG – Displays the choice
list of diagnostic tests.
TRACE – Displays the
absorbance monitor trace for
channel A or B.
Previous – When the Next key
is available, Previous
navigates through the screens
in the reverse order.
METHOD – Displays the list
of options for creating and
clearing timed and threshold
events, storing, retrieving,
and resetting methods.
CONFIGURE – Displays the
first Configuration screen.
Scale – When the wavelength
trace or spectrum screen is
visible, this function permits
modification of the disp lay
range in the X (time or
wavelength) and Y
(absorbance) dimensions.
Using the operator interface 3-9
Page 78

Detector keypad description
Description
Key
Unshifted Shifted
Shift – Enables the shifted functions (identified by the text at
Shift
the top of most keys). The shifted state is temporary, and is
reset after th e n ext ke y stroke.
0-9
Lamp
1
Lock
2
0-9 – Enters the
corresponding number into
0-9 – See descriptions for
specific shifted numeric k eys.
the current field.
Also positions the cursor at
the corresponding entry in a
list (0 = tenth item). Selects
the corresponding number
from a choice list.
1 – See 0-9 above. Lamp – Displays the lamp use
statistics for the currently
installed lamp and allows you
to turn the lamp on or off. The
current state of the lamp is
indicated by an icon on the
absorbance screen.
2 – See 0-9 above. Lock – When you are on the
absorbance screen, enables or
disables the keypad lock
feature. Use the lock to
prevent inadvertent changes
to detector settings . The
current lock state is indicated
by an icon on the absorbance
screen.
Calibrate
3
3-10 Preparing the Detector
3 – See 0-9 above. Calibrate – Initiates the
wavelength calibration
routine.
Page 79

Detector keypad description
Description
Key
Unshifted Shifted
System Info
4
Contrast
6
Cancel
0
+/–
•
Clear Field
CE
Enter
4 – See 0-9 above. System Info – Displays
system information including
firmware version and
instrumen t se ri a l nu mber.
6 – See 0-9 above. Contrast – Permits
adjustment of contrast
(viewing angle) of the liquid
crystal display.
0 – See 0-9 above. Cancel – In some modes,
Cancel backs out of a prompt
without completing the task .
The word “Cancel” appears as
a cue in the lower-right border
of the message text.
• – Enters a decimal point.
Also positions the cursor at
the last entry in a list.
+/– – Some edit fields accept
negative number entry. Use
this function to invert the sign
of the number in the active
field.
CE – Clears an editing
change, and returns the
contents of a field to its
Clear Field – Clears the
current entry field before you
enter the desired values.
previous value. Sets the value
to a unique word for some
fields. For example, in the
voltage offset diagnostic
display, you can enter e ither a
numeric offset value or press
CE to change it to OFF.
Enter – Completes the entry in an edit field. Also advances the
active field as if the Down arrow had been pressed (except
after editing the wavelength on the absorbance screen). Press
Enter to acknowledge error messages and other prompts. In
these cases, the word “Enter” appears as a cue in the
lower-right border of the message text.
Using the operator interface 3-11
Page 80

Navigating the user interface
To operate the detector:
1. Press the Enter key or the up and down arrow keys to navigate among
editable fields on a display.
Tip: A thick border appears around the active field.
2. Press Enter to advance the active field once you have completed an
entry.
3. When you make an error, press CE (Clear Entry) to undo any changes
and return to the active entry field .
Tip: An active field containing a choice list is indicated by a number to
the right of th e fi e l d w i th i n th e th i ck border.
4. To display a choice list, press Enter. Then do one of the following:
• Press the corresponding num ber key to select an item immediately.
• Use the up and down arrow keys to scroll through the lis t, then
press Enter.
Tip: If you know the number corresponding to the desired choice, you
can press that number without pressing Enter first.
Rule: The up and down arrow keys do not increment or decrement numerical
field entries. Use the numerical keypad.
Navigating to and from the absorbance screen
Pressing HOME from most screens brings you to the absorbance screen. Fr om
the absorbance screen, you can ac cess several secon dary functions . To move to
the secondary function screens of the absorbance screen, press Next. The
secondary functions include:
• Analog output specifications
• Time constant
• Absorbance offset
• Voltage offset
• Chart polarity
• Enable/disable inputs
• Enable/disable external events
3-12 Preparing the Detector
Page 81

Tip: The parameters you enter into the secondary function fields become part
of the current method conditions and are stored when you store the method
(see “Programming timed events, threshold events, and methods” on
page 3-35).
When in single wavelength mode, the detector displays three additional
screens labeled 2 of 4, 3 of 4, and so on. When in dual wavelength m ode, the
detector displays four additional screens, labeled 2 of 5, 3 of 5, and so on (see
page 3-18).
Setting up a run
Once you press HOME to return to the absorbance screen and select a
wavelength mode (λ or λλ), you are ready to set up the detector for a run. In
addition to wavelength mode, you must program the following parameters
before beginning a run:
• Operating wavelength
•Sensitivity
• Time constant
• Analog output sensitivity
Depending on other functions you may want to perform during a run, there
are several other parameters you need to program. The section “Primary and
secondary functions” on page 3-14, and the Table titled “Primary and
secondary function (method) para me ters” on page 3-19 contain the function
descriptions, fields, screen number, type of function, display units, allowable
ranges, and the default settings for the absorban ce screen and the secondary
function screens, for both single and dual wavelength opera tion.
Using the operator interface 3-13
Page 82

Primary and secondary functions
You can access the following functions directly fr om the absorbance screen or
by pressing the Next key on that screen.
Detector functions
Function Description
Wavelength Defines the operating wavelength for the channel.
AUFS (absorbance
units full-scale)
Analog out
(single λ)
Defines the relationship between the absorbance and
the output voltage. The output voltage reaches full
scale (2 V) when the current absorbance attains the
AUFS value.
Caution: Changing the sensitivit y (AUFS) setting
affects the 2-V output.
You can chart out the analog connections for the
following parameters:
• Absorbance - Charts the current a bsorbance of the
selected channel analog output 2-V connector
(scaled to the AUFS setting for that channel) and
adjusted based on the voltage and absorbance
offsets for that channel. For the 2-V output with 0
used for both the voltage and absorbance offsets:
Volts out = Absorbance × 2 V/AUFS
3-14 Preparing the Detector
Page 83

Detector functions
Function Description
Analog out
(dual λ)
In addition to the selections for single l above, you can
chart the same parameters on the other channel at a
different wavelength, and you can cha rt the foll owing
parameters:
• MaxPlot – Charts the absorbance of multiple
compounds with different absorbances at two
different wavelengths on a single data channel.
Scaling for MaxPlot is the same as for Absorbance
above, except that the charted absorb ance is the
larger of the two absorbances measured on the
wavelengths on channel A and channel B. The
detector uses the AUFS, absorbance offset, and
voltage offset of the selected channel regardless of
which absorbance (channel A or channel B) is
larger.
Volts out = Larger absorbance (A or B) × 2 V/AUFS
(of selected channel)
• RatioPlot (A/B) – Charts the ratio of absorbances
at two wavelengths. Theoretically, the ratio is
constant for a pure chromatographic peak and
variable for an impure peak. This mode uses the
three ratio parameters on screen 5 of 5 (see the
figure below).
– Minimum AU: This setting defines the minimum
AU value for either wavelength (A or B) before the
actual ratio is calculated. Both absorbance values
(A and B) must be above this value or 0 V is
charted. If both absorbances are above this value,
the absorbances are divided (A/B) and char ted. The
output voltage is scaled proportionally to the ratio
depending on the selected channel minimum ratio
and maximum ratio settings.
– Minimum ratio: An actual ratio equal to the
minimum ratio value results in 0 V being charted.
Using the operator interface 3-15
Page 84

Detector functions
Function Description
– Maximum ratio: An actual ratio equal to the
maximum ratio results in a full-scale output of 2 V.
Absorbance offset is ignored with this selection.
For a RatioPlot, the actual voltage charted is
Volts out = 0 V if Abs orbance A and B < minimum
AU
Volts out = (Absorbance rat io – minimum ratio ) × 2
V/(maximum ratio – minimum ratio)
To ensure proper operation of the RatioPlot
function, be su r e th e se l e cted time constants for
both channels are set to the same value.
• Difference Plot (A-B) – Charts the difference in
absorbances at two different wavelengths. The
scaling for the difference plot is identical to the
Absorbance selection above, except that the
charted absorbance is the difference (subtracted)
in value of the two abso rbances measured on t he A
and B wavelengths. The detector uses the AUFS,
absorbance offset, and volt age offset of the s elected
channel for scaling.
Volts out = Absorbance difference (A – B) × 2
V/AUFS (of selected channel)
Filter time constant Adjusts the noise filter (time constant) to achieve the
Voltage offset Adjusts the charted analog output signal. Entered in
Chart polarity Inverts the charted chrom atogr am. Enter ing the plus
3-16 Preparing the Detector
optimum signal-to-noise ratio without changing the
sensitivity settin g. S ee th e disc u ssion “Filtering
noise” on page 1-7 in for more information.
millivolts, this function adjusts the 2-V signal by the
entered value. This function is useful for making
minor adjustments and for nulling any offset between
the detector and a connected external data sys tem.
sign (+) produces a normal chromatogram; entering
the minus sign (–) produces an inverted
chromatogram.
Page 85

Detector functions
Function Description
Auto zero on inject Selected by default, this pa rameter res ults in an aut o
zero each time an Inject Start signal is received by
the detector via contact closure, Ethernet, or through
the front panel. You can disable this parameter by
pressing any numerical key to clear t his box for either
or both channels.
Auto zero on λ
changes
This parameter results in an auto zero each time a
wavelength change is requested. If you disable this
function, significant chan ges in measured abs orbance
can occur after each wavel ength change. S electing “ to
zero” sets the signal level to zero. Selecting “t o
baseline” maintains the previous baseline level when
the wavelength change is made. The default is “to
zero.”
Using the operator interface 3-17
Page 86

Secondary functions of the absorbance screen
Absorbance screen (HOME)
Press Next.
Analog rate and filter
tie constant (available
for both λ and λλ)
Absorbance offset, and
auto zero on inject
(available for both λ and λλ)
Press Next.
Voltage offset and
chart polarity
(available for both λ and λλ)
Press Next.
Minimum AU, minimum ratio,
and maximum ratio
(available only for λλ)
Press Next.
3-18 Preparing the Detector
Page 87

Primary and secondary function (method) parameters
Function Screen Type Units Range Default
λ
(Wavelength)1 (Absorbance
Numeric nm I nteger 190 nm to
700 nm
254 nm
screen)
AUFS 1 Numeric AUFS 0.0001 to 4.0000 2.0000
Analog rate 2 (of 4) or
2 (of 5)
Filter time
constant
2 (of 4) or
2 (of 5)
Choice Hz (λ): 10, 20, 40, 80
(λλ): 1 or 2
Numeric Sec Slow
Normal
10
1
Normal
Fast
Other:
(λ): 0.0125 to 5.0
(for Other:)
1.000
(λλ): 0.5 to 5.0
0 to disable
filtering
Data out
(single λ)
Data out (dual λ)3 (of 5) Choice None Absorbance A
3 (of 4) Choice None Absorbance A Absorbance
A
Absorbance
Absorbance B
A
Maxplot A, B
Difference A-B
Ratio A/B
Auto zero on
inject
Auto zero on λ
changes
3 (of 4) or
3 (of 5)
3 (of 4) or
3(of 5)
Check
box
None Selected/
Not selected
Choice None To baseline
To zero
Checked
To zero
Disable
Voltage offset 4 (of 4) or
4 (of 5)
Chart polarity 4 (of 4) or
4 (of 5)
Numeric mV Integer –2000 to
2000
Choice None +
–
0
+
Minimum AU 5 (of 5) Numeric AU 0.0001 to 4.0000 0.1000
Using the operator interface 3-19
Page 88

Primary and secondary function (method) parameters
Function Screen Type Units Range Default
Minimum
ratio
Maximum
ratio
5 (of 5) Numeric None 0.00 to 999.99 0.00
5 (of 5) Numeric None 0.00 to 999.99 2.00
Operating the Trace and Scale functions
The Trace function allows you to display an absorbance trace for the last n
minutes (up to 60) of detector operation.
• When you press the TRACE key, the detector displays the absorbance
acquired over the last 30 minutes by default. It updates the trace once
every 20 seconds.
• When you press the Scale key (Shift TRACE), the detector displays the
scaled trace with T1 (ending time) displayed (–30 for the last 30
minutes) by default.
You can change the ending time parameter to any number from 1 to 60.
You can use the Scale function to “zoom” in on a particular secti on of the
trace.
To display the Scale parameters after you press the Scale key:
1. Press Next to display T2 (starting time). The default is 0.
2. Press Next again to display AU1 (starting or low absorbance). The
default is auto.
3. Press Next again to display AU2 (ending or high absorbance). The
default is auto.
By entering appropriate times and absorbance numbers in the four
scaling parameter boxes, you can zoom in on one section of the current
absorbance trace.
• For AU1 and AU2, press CE to reset to auto.
• T1 represents the left-hand side of the trace, or ending time to be
displayed (default is –30).
• T2 represents the right-hand side of the trace, or starting time
(default is 0).
3-20 Preparing the Detector
Page 89

The figure below shows a 60-minute trace of continuous injections of
caffeine and propyl paraben in 50% methanol/50% water.
Scaled trace of continuous injections with T1 changed to –60
The figure below shows a 5-minute scaled trace (or zoom) of the 60 minutes of
continuous injections shown in the previous figure. T1 is changed to –5. T2 is
changed to 0. AU1 and AU2 remain as “auto.”
Scaled trace for 5 minutes of continuous injections with T1 changed to –5
The figure below shows a 60-minute scaled trace similar to that shown in the
preceding figure titled “Scaled trace of continuous injections with T1 changed
to –60” with the starting absorbance or AU1 changed from auto to 1. T1
remains at 60. T2 remains at 0.
Scaled trace for 60 m inutes of continuous injections with AU1 changed to 1
Using the operator interface 3-21
Page 90

The figure below shows a 60-minute trace on channel B scaled to the last 45
minutes. T1 is changed to –45.
Scaled trace changing T1 to –45
As you modify the output using the Scale function, the Trace function
continues to display the detect or output in real time on either or both
channels.
Operating other detector functions
Configuring the detector
To change default configurations, use the Configuration screens.
Press the CONFIGURE key (Shift DIAG). The first of two Configuration
screens appears (see figure below).
Tip: Other functions, such as specifying event inputs and enabling pulse
periods, are stored within the Configuration screens.
Configuration screens
Configuration screen 1 of 2
Requirement: To prevent acquisition of incorrect data when operating the
detector in dual wavelength m ode under the control of the Empower software
3-22 Preparing the Detector
Configuration screen 2 of 2
Page 91

or a MassLynx system, you must select a data sampling rate of 1 point per
second.
Configuring event inputs (contact closures)
You also use the CONFIGURE key to edit event input settings and specify
switched output settings.
Using the Enter key and the numeric keypad (or the ▲ and ▼ keys) to select
the appropriate entry, you can edit four field s on the second Configuration
screen shown above:
Tip: The default for Inject, Chart Mark, and Auto Zero is Low; the default for
Lamp is Ignore.
•Inject – You can specify the Inject input to signal the start of a run. This
event resets the run-time clock and applies initial method conditions
immediately:
– High – Start run when contact closure changes from off (open) to on
(closed).
–Low – Start run when contact closure changes fro m on (clos ed) to off
(open).
– Ignore – Do not respond to Inject start input.
• Chart mark – You can specify the chart mark input to create a chart
mark on channel A and/or channel B. You determine the resp onse of the
channel using the enable chart mark function explained in the table on
page 3-19 and shown in the figure on page 3-18.
– High – Create chart mark(s) when contact closure changes from off
(open) to on (closed).
– Low – Create chart mark(s) when contact closure changes from on
(closed) to off (open).
– Ignore – Do not respond to chart mark input.
• Auto zero – You can configure the auto zero input to auto zero
absorbance readings on channel A and/or channel B. You determine the
response of the channel using th e enable auto zero function explai ned in
the table on page page 3-19 and shown in the figure on page 3-18.
–High – Auto zero the channel when cont act closure changes f rom off
(open) to on (closed).
Using the operator interface 3-23
Page 92

– Low – Auto zero the channel when contact closure changes from on
(closed) to off (open).
– Ignore – Do not respond to auto zero input.
•Lamp – You can configure the lamp input level to turn the deuterium
lamp on or off from an external device as follows:
– High – Turn lamp off when contact closure is on (closed).
– Low – Turn lamp off when contact closure is off (open).
– Ignore – Do not respond to Lamp input.
Setting pulse periods
You use the second Configuration screen (shown on page 3-22) to set pulse or
signal width or to activate a pulse or rectangular wave on SW1 or SW2.
• Single pulse (in seconds ) – If SW1 or SW2 is programmed to generate a
pulse as a timed or threshold event, then the period of the signal (single
pulse width) is as specified in this field (range is 0.1 to 60 seconds).
• Rectangular wave (in seconds) – If SW1 or SW2 is programmed to
initiate a rectangular w ave as a timed or threshold event, then the
period of the signal (the widt h of one pulse period in a rectangular wave
or pulse train) is as specified in this field (range is 0.2 to 60 seconds).
The figure below shows the difference between a single pulse and a
rectangular wave.
Setting the pulse period or signal width using SW1 or SW2
n Seconds
Single pulse
n Seconds
Rectangular wave
3-24 Preparing the Detector
Page 93

Setting display contrast
The Contrast function allows you to adjust the contrast of the detector dis play
screen. When you press the Contrast key (Shift 6), the Display Contrast
screen appears.
Display Contrast screen
Use the ▲ and ▼ keys to adjust the contrast of the display.
Displaying system info
The System Info key (Shift 4) displays information about the dete ctor,
including the serial num ber and the firmware version number.
Tip: Use the scroll bar to see all of the message. The Firmware Rev and
ChkSm values shown here are examples only. They do not indicate the
released version information.
System info screen example
Start of message
End of message
Using the operator interface 3-25
Page 94

Using Help
The detector has limited context-sens itive help. When you press ? (Shift
HOME) from a point in the program that has a Help screen associated with it,
the appropriate screen appears.
Help screen
Enter the desired wavelength
for detection on channel A.
Range: between 190 and 700.
To exit the Help screen, press Enter. If help is not available for the function
you are working on, pressing ? gets no response.
Operating the detector
Overview of detector operation
Tip: If you are operating the detector under the control of an external system,
you can program any parameters not controlled by the external data system at
the front panel of the detector before the external system takes control.
Recommendation: To prevent reabsorption of dissolved oxygen, run the
solvent degasser continuously when operating the detector at wavelengths
less than 230 nm.
Requirement: To maintain optimum system performance, be sure to replace
the front left panel cover before resuming nor mal operation of the detector.
Operating modes
You can use the detector in either single or dual wavelength mode ov er a
range of 190 to 700 nm. The detector defaults to the mode of operation when
the instrument was la st powered-off.
3-26 Preparing the Detector
Page 95

Stand-alone operation
When using the detector as a stand-alone instrument, you can store up to five
methods containing up to 50 t imed and 2 t hreshold events eac h. An aster isk in
the method number field on the absorbance screen indi cates current
conditions, not a stored method. See “Programming timed events, threshold
events, and methods” on pag e 3-35 for information on how to store a method.
Remote control
To operate under Empower or MassLynx control, the detector uses the
Ethernet bus connector (see “Making Ethernet connections” on page 2-14).
To connect the detector to your HPLC system, see “Making fluid line
connections” on page 2-6.
When under th e control of an ex t ernal data sy st em, the detector is operati n g
under remote control conditions. The Remote Control icon, containing the
letter E, is present on the absorbance screen (see the table on page 3-4).
See “Making signal connections” on page 2-11, for more information on
connecting the detector to an external system.
Verifying the detector
After you have installed the detector, verify that it is operating properly by
performing the procedures in this section.
For complete validation procedures, you must obtain the Waters accuracy and
linearity cuvette kits and system qualification tool for the detector. See
Appendix C for part numbers and ordering information.
Tip: Before you pump solvent or mobile phase through the system, flush the
lines with filtered, degassed, and sparged HPLC-grade methanol. Then pump
your mobile phase, provided that there are no miscibility problems, at 1
mL/min for 15 minutes minimum.
Before you begin
Because the detector is shipped dry, you must pump solvent through the unit
before initial use.
Rule: To ensure accurate verification, be sure to start up the detector and
follow steps 1 to 3 in this section and 1 to 4 in “Recording samp le and
Using the operator interface 3-27
Page 96

reference beam energies” on page 3-28 before pumping any mobile phase or
solvent through the flow cell.
To pump solvent through the unit before initial use:
1. Connect the detector to a data system or chart recorder. Refer to
Chapter 2 for complete information on connecting the detector to
external devices.
2. Power-on the detector. The front panel displays a series of initialization
messages for about 5 minutes. Refer to “Initializing the detector” on
page 3-2.
3. When initialization is complete, the detector displays the absorbance
screen. For an explanation of the detector keypad, see “Using the
keypad” on page 3-6.
4. Allow the detector to warm up for at least 30 minutes before operating.
Tip: I f th e sta r tup verificati o n di a g n o st i c te st s fa i l , n o te the error
message to determine the corrective action. Refer to Chapter 5.
Recording sample and reference beam energies
To determine baseline values on your detector for future reference and to
monitor lamp aging (decreased lamp output energy), you need to record the
baseline sample and reference beam energies to compare against future
readings. Use these baseline values to troubles hoot the detector to determine
whether
• the solvent is contaminated.
• the flow cell is contaminated.
• the lamp needs to be replaced.
• there is an air bubble in flow cell.
To record the sample and reference beam energies:
1. On the absorbance screen, use the arrow keys to highlight the λ field.
2. Enter 230 into the λ field, and t hen pr ess Enter.
3-28 Preparing the Detector
Page 97

3. Press DIAG and then press 2, Sample & ref energy. The sample and
reference energy diagnostic display appears.
Sample and reference energy diagnostic display
4. Record th e nu mbers for later comparison.
Rule: Run this procedure each time you change the detector lamp.
5. Flush the flow cell with approximately 30 to 60 mL of HPLC-grade
methanol at 1 mL/min for 15 minutes minimum to clean the cell.
You are now ready to run the peak response verification test. If the following
test fails, repeat it.
Make the fluid connections described in “Making fluid line connections” on
page 2-6, before beginning the peak response test.
Ve rifying peak response
This test checks the detector peak res ponse.
To check peak response:
1. On the absorbance screen, use the arrow keys to highlight the λ field.
2. Enter 254 into the λ field, and then pres s Enter.
3. Press Enter again to activate the sensitivity field.
4. Set the sensitivity to 2.0 AUFS.
Using the operator interface 3-29
Page 98

5. Set the pump flow rate in your HPLC system to 1.0 mL/min.
6. Inject 1 µL acetone.
When the test is successful, your chart recorder or data system displays a
peak.
Wavelength calibration
You can calibrate the detector manually from the keypad. You can use the
manual calibration key to recalibrate the detector at any time during
operation, or if there are any calibration errors during startup. You do not
have to reboot the detector after a successful wavelength calibration.
To calibrate the detector manually:
1. Press Calibrate (Shift 3) from the detector keypad.
A message appears asking whether you re moved the cuvette and flushed
the flow cell with a transparent solvent (Waters recommends methanol
or water).
Cuvette wavelength calibration message
2. Press Enter to continue the calibration cycle, or press Cancel to return to
the absorbance screen without calibrating the detector.
After you press Enter, the detect or cycles through the calibration
procedure and briefly displays a series o f i nitializatio n messages s imilar
to those you saw at startup (see “Initializing the detector” on page 3-2).
If calibration is successful, the detector beeps three times and displays
the maximum error in nanometers of the furthest calibration shift from
the last cal i bration.
3-30 Preparing the Detector
Page 99

Calibration successful message
3. Press Enter to complete calibration.
A “Calibration complete” message is displayed momentari ly. Other
messages su ch a s “O ptimizing system performance” an d “R e storing last
setup” may appear before the display returns to the absorbance screen.
Result: If calibr ation is succe ssful, the erro r message (<Err or>) that was
displayed on the absorbance screen before you recalibrated the detector
disappears.
4. If calibration is not su ccessful, r etry, recycle power to the det ector, or se e
Chapter 5.
Operating the detector in single wavelength mode
The detector is optimized for singl e wavelength operation, whic h is the default
operating mode.
To invoke single wavelength mode:
1. From the absorbance (or HOME ) screen, press the λ/λλ key (Shift Auto
Zero) if the detector is in dual wavelength (the wavelength icon shows
λλ) mode. The detector displays a message indicating it is switching to
single wavelength operation.
Wavelength mode change message (for single wavelength)
Using the operator interface 3-31
Page 100

2. Enter the wavelength and sensitivity on the absorbance screen, as well
as any secondary parameters and timed or threshold eve nts.
See also:
• Figure “Secondary functions of the absorbance screen” on page 3-18
• Table titled “Primary and secondary function (method) parameters”
on page 3-19 through Table titled “Threshold events “To”
parameters” on page 3-39
Caution: Changing the sensitivit y (AUFS) s etting af fects the 2- V output.
3. To select a second sensitivity setting while in single wavelength mode,
press A/B and enter the appropriate AUFS on the channel B screen.
A single wavelength is tracked on channel A, allowing you to use
channel B to monitor absorbance with an alternate AUFS setti ng, or to
make the primary absorbance measurement using a specific AUFS on
channel A.
Example: While operating in single wavelength mode, set an AUFS of
2.0000 on the second channel. This provides 1.000 V/AU on the channel
B 2-V output.
The detector automatically engages the second order filter for all
wavelengths > 370 nm.
Operating the detector in dual wavelength mode
You can operate the detector with expanded chart out selections using dual
wavelength mode. In addition to absorbance offered with singl e wavelength
mode, dual wavelength offers the following functions:
• Absorbance (A and B)
•MaxPlot
• RatioPlot (A/B)
• Difference plot (A-B)
Section “Primary and secondary functions” on page 3-14 and the Table titled
“Primary and secondary function (method) parameters” on page 3-19 explain
these functions and their default and operating parameters in detail.
3-32 Preparing the Detector
 Loading...