

Page 1

DSA Series Spectrum Analyzer
User Manual
DSA-115
DSA-136
Page 2

General Warranty
We warrants that the product will be free from defects in materials and
workmanship for a period of 3 years from the date of purchase of the
product by the original purchaser from
for accessories is 12 months. This warranty only applies to the original
purchaser and is not transferable to a third party.
If the product proves defective during the warranty period, we will either
repair the defective product without charge for parts and labour, or will
provide a replacement in exchange for the defective product. Parts,
modules and replacement pr o ducts used by our company for warranty work
may be new or reconditioned like new. All replaced parts, modules and
products become the property of our company.
To obtain service under this warranty, the customer must notify our
company of the defect before the expiration of the warranty period.
Customer shall be responsible for packaging and shipping the defective
product to the designated service centre, a copy of the customer's proof of
purchase is also required.
This warranty shall not apply to any defect, failure or damage caused by
improper use or improper or inadequate maintenan ce and car e. We shall
not be obligated to furnish service under this warranty a) to repair damage
resulting from attempts by personnel other than our company
representatives to install, repair or service the product; b) to repair damage
resulting from improper use or connection to incompatible equipment; c) to
repair any damage or malfunction caused by the use of not our supplies; or
d) to service a product that has been modified or integrated with other
products when the effect of such modification or integrat ion i ncrea se s the
time or difficulty of servicing the product.
our company. The warranty period
Please contact the nearest Sales and Service Offices for services or a
complete copy of the warranty statement.
Excepting the after-sales services provided in this summary or the
applicable warranty statements, we will not offer any guarantee for
maintenance definitely declared or hinted, including but not limited to
the implied guarantee for marketability and special-purpose
acceptability. We should not take any responsibilities for any indirect,
special or consequent damages.
Page 3

Table of contents
List of figures ........................................................................ iii
List of tables .......................................................................... iii
1. General Safety Requir ements .......................................... 1
2. Safety Terms and Symbols ............................................... 4
3. Document Overview .......................................................... 5
4. Quick St ar t .......................................................................... 6
4.1 General Inspection .......................................................... 6
4.2 Safety Precaution before O peration ............................. 6
4.3 First T ime to Power on .................................................... 9
4.4 Front Panel ..................................................................... 10
4.5 Rear Panel...................................................................... 16
4.6 User Interface ................................................................ 18
4.7 Build-in Help ................................................................... 19
4.8 Basic Measurement ...................................................... 20
5. Menu Interpretation ......................................................... 24
5.1 【FREQ】Frequency ................................................... 24
5.2 【SPAN】 ...................................................................... 27
5.3 【AMPTD】Amplitude ................................................. 28
5.4 【Auto】Auto Tune ...................................................... 32
5.5 【BW】Bandwidth ........................................................ 32
5.6 【Trace】 ....................................................................... 34
5.7 【Detector】 .................................................................. 36
5.8 【Display】 .................................................................... 37
5.9 【Sweep】 .................................................................... 39
5.10 【Trig】 ........................................................................ 40
5.11 【Source】 .................................................................. 40
5.12 【Demod】Demodulation ......................................... 42
5.13 【Peak】 ..................................................................... 43
5.14 【Marker】 .................................................................. 45
5.15 【Marker→】 .............................................................. 48
5.16 【Marker Fctn】Marker Function ............................ 50
5.17 【Meas】Measurement ............................................ 51
5.18 【Meas Setup】 ......................................................... 55
5.19 【System】 ................................................................. 56
i
Page 4

5.20 【File】 ........................................................................ 61
5.21 【Print】 ...................................................................... 61
5.22 【Save】 ..................................................................... 62
6. Specification .................................................................... 64
6.1 Frequency ....................................................................... 64
6.2 Amplitude ........................................................................ 65
6.3 Sweep ............................................................................. 67
6.4 Trac king G enerator ....................................................... 67
6.5 Demodulation ................................................................. 68
6.6 Frequency Counter ....................................................... 69
6.7 Inputs and Outputs ........................................................ 69
6.8 General S pecification .................................................... 70
7. Warranty ........................................................................... 72
7.1 Troubleshooting ............................................................. 72
7.2 Spectrum Analyzer Repair ........................................... 73
8. Appendix ........................................................................... 74
Appendix A: Enclosure ........................................................ 74
Appendix B: General Care and Cleaning ......................... 74
ii
Page 5

List of figures
Figure 4-1 Front panel .............................................................. 10
Figure 4-2 Function Keys ......................................................... 11
Figure 4-3 Numeric Keypad..................................................... 14
Figure 4-4 The knob ................................................................. 15
Figure 4-5 Direction keys ......................................................... 15
Figure 4-6 Rear Panel .............................................................. 16
Figure 4-7 User interface ......................................................... 18
Figure 4-8 Full Span ................................................................. 21
Figure 4-9 Set frequency span ................................................ 22
Figure 4-10 Set reference level ................................................. 23
List of tables
Table 4-1 Working Power Variation Range ............................. 7
Table 4-2 Front Panel Description .......................................... 10
Table 4-3 Function Key Description ....................................... 11
Table 4-4 Rear Panel Description ........................................... 16
Table 4-5 User interface Description ...................................... 18
Table 5-1 Detector type comparison ...................................... 36
Table 5-2 [Factory] Settings ..................................................... 57
iii
Page 6

1.General Safety Requirements
1. General Safety Requirements
Before use, please read the following safety precautions to
avoid any possible b odil y inj ury and t o prevent this produc t or
any other connected products from damage. To avoid any
contingent dang er, ensure this product is only used wit hin t he
ranges specified.
Use Proper Power Cord. Use only the power cord supplied
with the product and certif i ed to use in your country.
Product Grounded. This instrument is grounded through the
power cord grounding conductor. To avoid electric shock, the
grounding conductor must be grounded. The product must be
grounded properly before any connection with its input or
output terminals.
Check all Terminal Ratings. To avoid fire or shock hazard,
check all ratings and markings on this product. Refer to the
user manual for more information about ratings before
connecting to the instrument.
Use Proper Overvoltage Protection. Make sure that no
overvoltage (such as that caused by a thunderstorm) can
reach the product, or el se the oper ator might expose to danger
of electrical shock.
Do not operate without covers. Do not operate the
instrument with covers or panels removed.
Avoid exposed circuit. Be careful when working on exposed
circuitry to avoid risk of elec t r ic shock or other injury.
Do not operate if an y damage. If you suspect damage to
the instrument, have it inspected by qualified service
personnel before further use. Any maintenance, adjustment or
replacement especially to circuits or accessories must be
performed by qualified ser vice personnel.
Use your Oscillosco pe in a well-ventilated area. Make sure
the instrument installed with proper ventilation.
Do not operate in damp conditions. In order to avoid short
1
Page 7

1.General Safety Requirements
circuiting to the interior of the device or electric shock, please
do not operate in a humid environment.
Do not operate in an explosive atmosphere. In order to
avoid damages to the device or personal injuries, it is
important to operate the device away from an explosive
atmosphere.
Keep product s urfac es cle an and dry. To avoid the influence
of dust or moisture in air, please keep the surface of device
clean and dry.
Electrostatic Prevention. Operate the instrument in an
electrostatic discharge protective environment to avoid
damage induced by st atic discharges. Always ground both the
internal and external conductors of cables to release static
before making connections.
Protect the Input Terminals of Instrument. Do not bend or
hit the input terminals and the connected devices, (such as
filter, attenuator, etc.) as such stress may cause damages to
devices and the instrument. Do not mix the use of 50Ω and
75Ω connectors and/or cables.
Do Not Overload the Input. To avoid damaging the
instrument, the signals at i nput ter minal must be less t han 50V
DC voltage components and 30 dBm (1 W) AC (RF)
components.
Appropriate Use of Power Meter. If you are not sure of the
characteristics of signal under measure, follow these
recommendations to ensure safe operations: if a RF power
meter is available, use it to measure the power level of this
signal first; or add a rated external attenuator between signal
cable and input terminal of the instrument. Maximum
attenuation, reference level and maximum span frequency
should be selected, so as to make the signals displ ayed within
the screen.
Know About the Specification Conditions of the
Instrument. For maximum perfor mance of the inst rument, use
the analyzer under specified conditions.
2
Page 8

1.General Safety Requirements
Handling Safety. Please handle with care during
transportation to avoid damages to buttons, knob, interfaces
and other parts on the panels.
3
Page 9

2.Safety Terms and Symbols
!
WARNING
Warning indicates conditions or practices that could result
in injury or loss of life.
DANGER
Indicates an immediate hazard or injury possibility.
WARNING
Indicates a possible hazar d or inj ur y.
CAUTION
Indicates potential dama ge to the instrument or other
!
Refer to
Manual
!
CAUTION
Caution indicates the conditions or practices that could
result in damage to this product or other property.
2. Safety Terms and Symbols
Safety Terms
Terms in this manual (The following terms may appear in this
manual):
Terms on the product (The following terms may appear on this
product):
property.
Safety Symbols
Symbols on the product (The following symbols may appear on
the product):
Hazardous
Voltage
Chassis
Ground
4
Page 10

3. Document Overview
Quick Start
This chapter states the matters need to attention before first
power on, how to power on at first time, introduces spectrum
analyzer’s front/rear pane l and us er i nt er f ac e, explains how to
use the instrument with a meas urement example
demonstration.
Menu interpretation
This chapter offers spectrum analyzer’s front panel me nu and
button interpretation.
Specification Parameter
This chapter lists spectru m an alyzer’s specification para meter .
Trouble Shooting
This chapter helps to implement the troubleshooting and deal
with after sale repair.
Appendix
This chapter introduces acc essories of spectrum analyzer and
how to maintain device.
Convention o n but ton and menu key format:
Button: Button character + bold bracket, e.g. 【FREQ】stands for
FREQ button.
Menu key words+brac ket, e.g.[Center frequency] stands for
【FREQ】function’s center frequency item, that is common called
softkey menu item.
Related document:
Related documents including: Quick guide, User manua l,
programme guide and etc.
5
Page 11

4. Quick Start
This chapter states the matters need to attention before first power
on, and how to power on at first ti me,
analyzer’s front/rear pane l and us er i nt er f ac e, explains how to use
the instrument with a measur ement example demonstration.
4.1 General Inspection
When you receive your new instrument, it is recommended
that you check the instru m ent fo ll ow ing these steps:
1.Check for transportation damage.
If it is found that the packaging carton or the foamed plastic
protection cushion has suffered serious damage, do not throw
it away until the complete device and its accessories have
been electrically and mechanically checked.
2.Check the Accessori es
The supplied accessories are described in the "Appendix A:
Enclosure" of this Manual. Please ensure that all the listed
accessories are present and undamaged, if any problems are
found please contact y our distr ibutor or our local office.
3.Check the Complet e Instrument
If there is any physical damage, operational fault, or
performance issue please contact your distributor or our local
office. If there is any damage to the instrument please ensure
you keep the original packaging. Ideally you should always
keep the original packaging if the instrument must be returned
for repair.
introduces spectru m
4.2 Safety Precaution befor e O per a ti on
4.2.1 Check Power Supply
The analyzer is equipped with a three-wire power cord in
accordance with international safety standards. The product must
be grounded properly before being powered on, as floating or
improper ground may cause damage to the instrument or personal
injury.
6
Page 12

Make sure the grounding conductor of the spectrum analyzer is
grounded before turning on the instrument. After which the AC
power cord can be connected. Do not use a non-ground power
cord.
4.2.2 Allowed Variation Range of Supply Power Parameters
The spectrum analyzer is compatible with 100V~240V, 50Hz-60Hz
AC power, Table 4-1 lists the power requirement to run the
spectrum analyzer.
Table 4-1 Working Power Variation Ran ge
Power Supply Parameter
Voltage 100 - 240 VAC
Frequency
Power 22 W
To prevent or lower the risk of damage to the spectrum analyzer
from power interference between instruments, especially from
peak pulses produced by large power consumption instruments, a
220V/110V AC regulated power supply is recommended.
Compatible Range
50 - 60 Hz ±10%
4.2.3 Power Cord Selection
The analyzer is equipped with a three-wire power cord in
accordance with internati onal s afet y standards. This cabl e grou nds
the analyzer cabinet when connected to an appropriate power line
outlet. The cable must be rat ed gr eat er than 250Vac and 2A.
7
Page 13

!
WARNING
Improper grounding may cause damage to the instrument,
or result in personal injury. Make sure the grounding
conductor of the spectrum analyzer is grounded before
turning on the instrument.
Always use a well-grounded power source. Do not use an
external power cable, power cord or an auto transformer
without grounded protecti on. If this produ ct is to be powere d
via an external auto transformer for voltage reduction,
ensure that its common terminal is connected to a neutral
(earthed pole) of the power s upply .
!
WARNING
Make sure the supply power is
the
analyzer
Refer to “First Time to
Power on" section 3.
!
WARNING
The above ESD protections measures cannot be used
when working with over 5 00V!
stable before turning on
to protect it from damage.
4.2.4 Electro-static Discharge (ESD) Protection
ESD is an issue often ignored by users. Damage from ESD on the
instrument is unlikely to occur immediately but will significantly
reduce the reliability of it. Therefore, ESD precautions should be
implemented in the wor k environment, and applied daily.
Generally, there are two steps to manage ESD protection:
1) Conductive table mats to connect hands via wrist bands
2) Conductive ground mat t o connec t f eet via ankle straps
Implement both protection methods will provide a good level of
anti-static protection. If used alone, the protection will not be as
reliable. To ensure user’s safety, anti-static components should
offer at least 1MΩ isolation resistance.
8
Page 14

!
WARNING
Check the power source before turning on the spectrum
analyzer, to protect the device from damage.
Make good use of anti-static technology to protect components
from damage:
1) Quickly ground the internal an d external cond uctor of the coaxial
cable before it is connected w it h t he spec t r um analyzer.
2) Staff must wear anti-static gloves before touching the connector
cord or doing any assemble work.
3) Assure all the instruments are grounded properly to avoid static
storage.
4.3 First Time to Power on
Connect the three-pin A C power cord into the instrument . Insert t he
plug into a power socket provided with a protective ground.
1) Press the power switch
panel.
2) Self-initialization takes about 30 seconds, after the boot screen
the spectrum analyzer w ill defa ult t o t he sc anning curve.
3) After power on, let the spectrum analyzer warm up for 30
minutes for stabilization to obtain the most accurate results.
on the bottom left of the front
9
Page 15
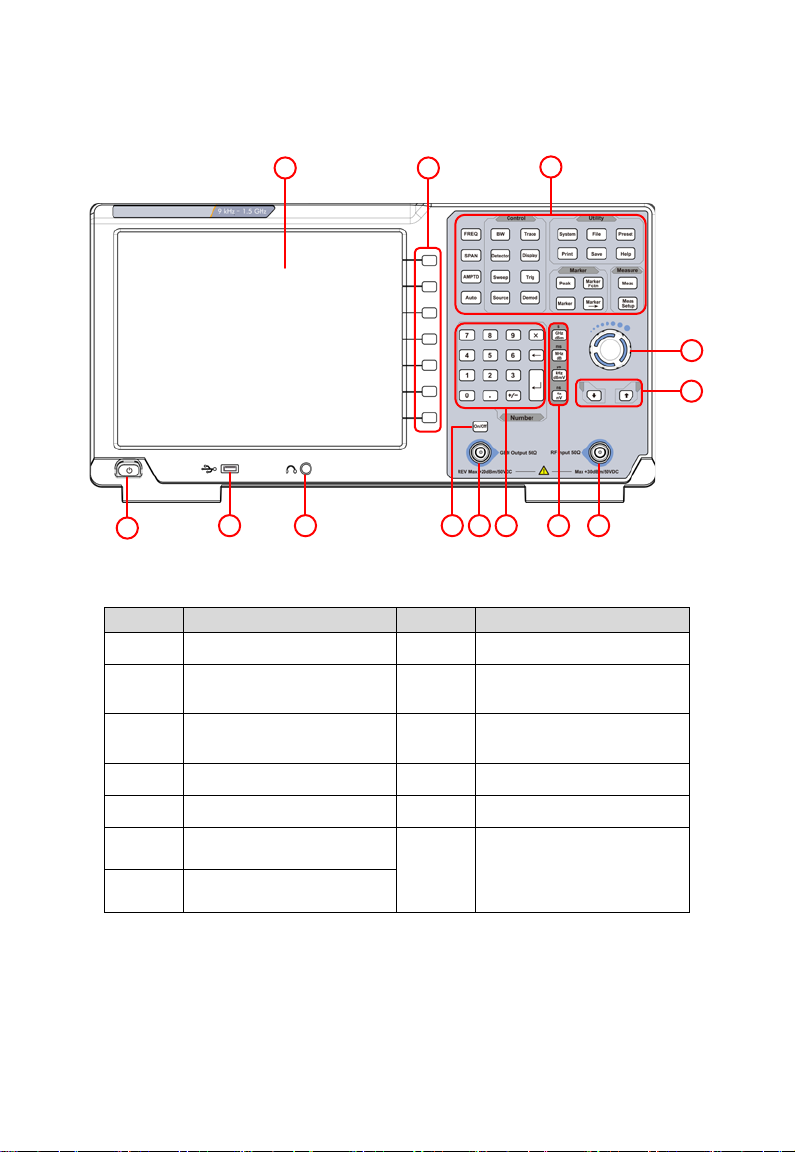
4.4 Front Panel
9 6
11
12
13
4
5
10
1 2
3
78
NO.
Description
NO.
Description
LCD
Numeric keypad
Menu softkeys
Tracking generator
output connector
Function keys
Tracking generator
output On/Off button
Knob
Earphone interface
Arrow keys
USB Host port
RF Input connector
long push to turn off)
Unit keys
Table 4-2 Front Panel Description
①
②
③
④
⑤
⑥
⑦
4.4.1 Front Panel Function Key
Figure 4-1 Front panel
⑧
⑨
⑩
⑪
⑫
⑬
10
Power key
(Push to turn on,
Page 16
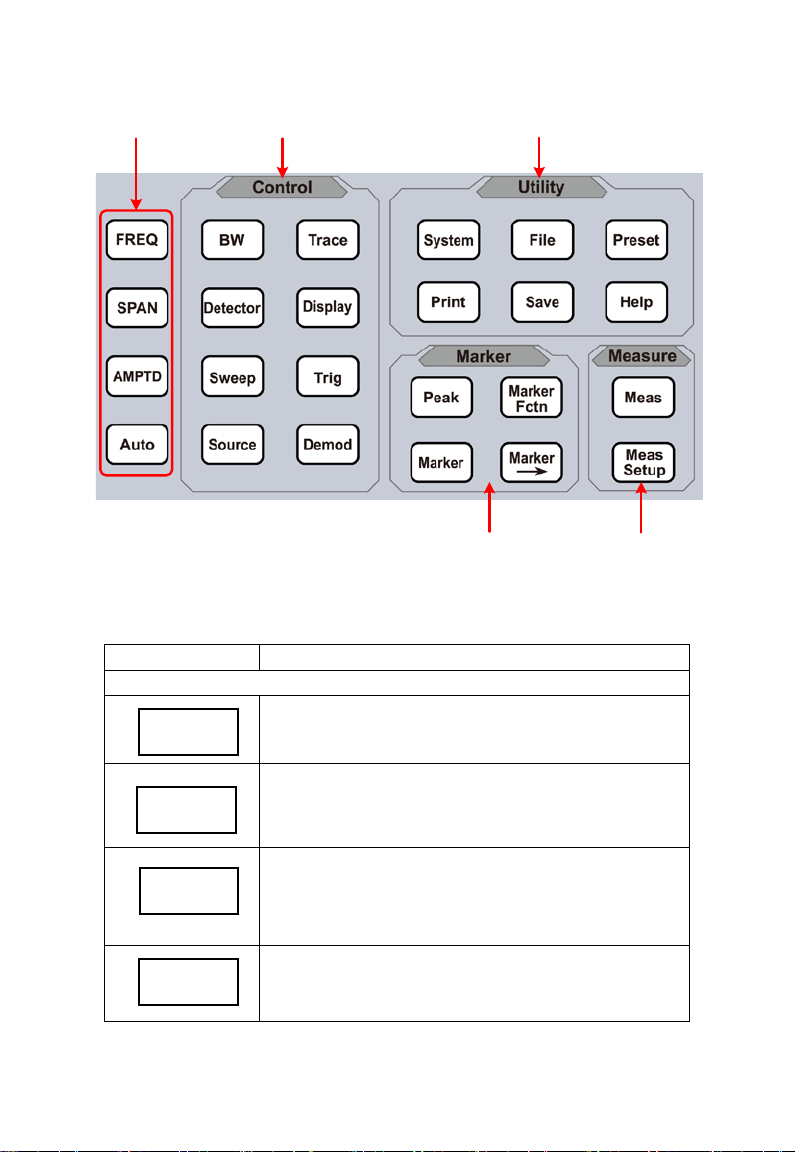
Basic keys
Marker measure
Advanced
measure
Utility keysControl keys
Keys
Description
Basic keys
Activates the frequency sweep span
Activates the reference level function, and
accesses the amplitude softkeys, with
you set functions that affect data on
the vertical axis.
FREQ
SPAN
AMPTD
AUTO
Figure 4-2 Function Keys
Table 4-3 F unctio n Key Description
Activates the center-frequency funct ion, and
accesses the frequency function menu.
function, and set Full Span\Zero Span\Last
Span.
which
Searches the signal automat ically within the
full frequency range.
11
Page 17
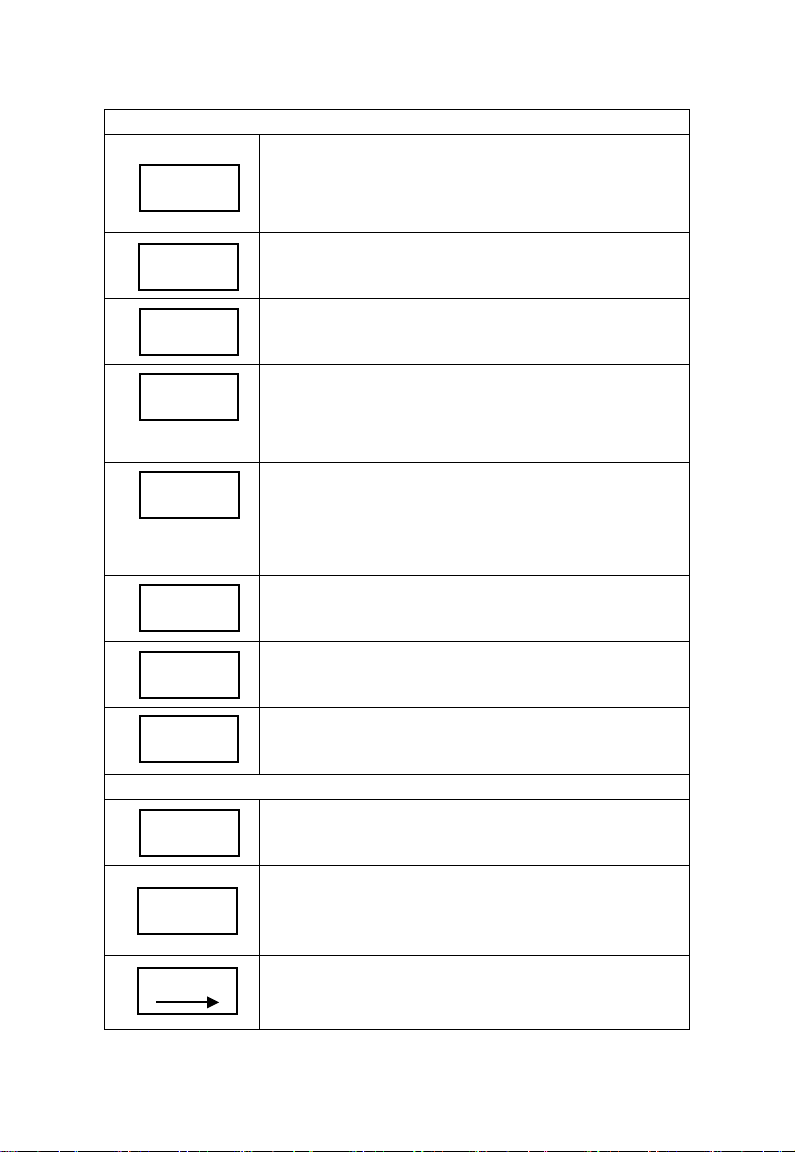
Control keys
Activates the RBW (resolution bandwidth)
function, and accesses the softkeys that
ons and
averaging.
Accesses the softkeys that allow you to
Accesses the softkeys that allow you to
Accesses the softkeys that allow you to
including the display line, graticule and
label.
the sweep time, select the sweep mode of
Accesses the softkeys that allow you to
Marker measure keys
Places a marker on the highest peak, and
l keys that
Accesses the marker function softkeys that
allow you to set other system parameters
based on the current mark er value.
BW
Sweep
Trig
Marker
Trace
Display
Detector
Source
Demod
Peak
Marker
control the bandwidth functi
store and manipulate trace information.
configure detector functions.
control what is displayed on the analyzer,
Accesses the softkeys that allow you to set
the analyzer.
select the trigger mode of the analyzer.
Accesses the softkeys that allow you to set
the tracking generator.
Accesses the softkeys that allow you to set
the demodulation.
accesses the Peak functions menu.
Accesses the marker contro
select the type and number of markers and
turns them on and off.
12
Page 18
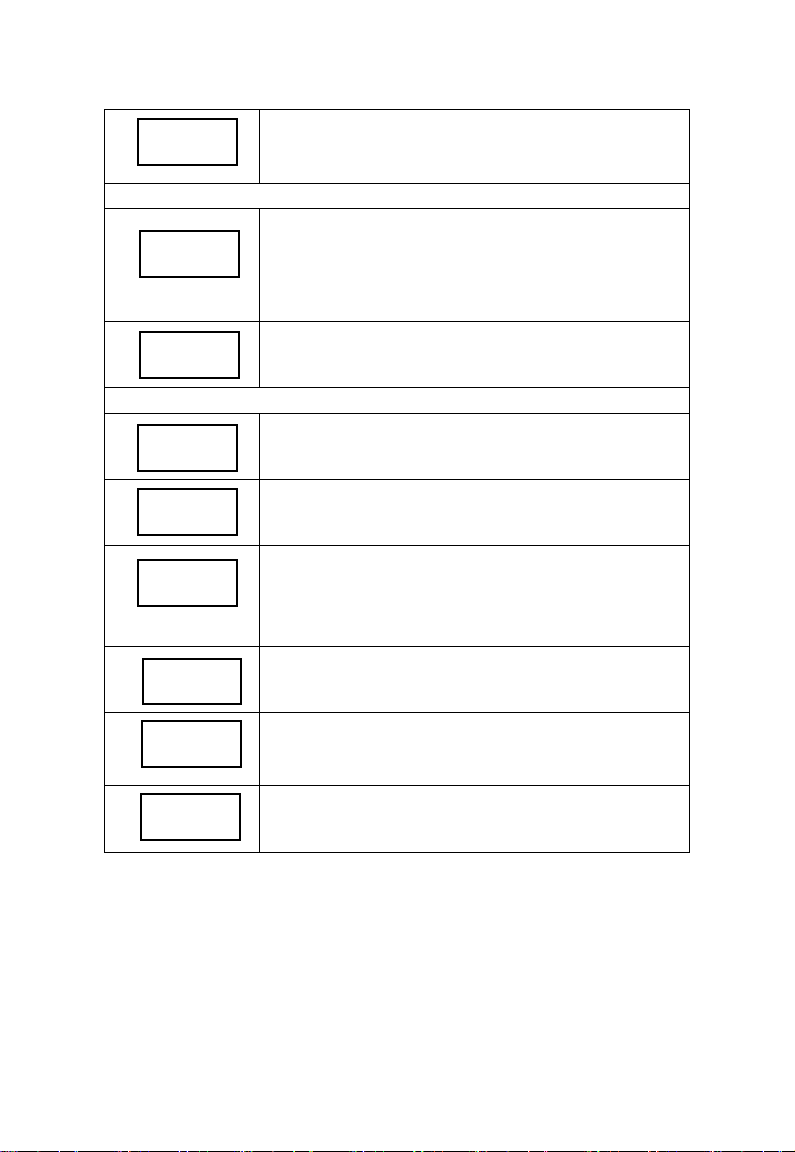
Accesses the menu of special functions,
marker, N dB bandwidth
measure and frequency counting.
Advanced measure keys
Accesses the softkeys that let you make
transmitter power measurements such as
ACPR(adjacent channel power), channel
ameters for the selected
Utility keys
Accesses the softkeys that allow you to
Resets the analyzer to the factory settings
[Preset►].
Accesses the softkeys that allow you to
save current screen, trace data, or user
state.
Press the Help key to activate the help
System
Save
File
Help
Meas
Meas
Setup
Preset
Print
Marker
Fctn
such as noise
power, and OBW(occup ie d bandwidth), etc.
Sets the par
measurement function.
Sets the system parameters, and accesses
the calibration menu.
configure the file system of the analyzer.
or user state. This state can be specified in
【System】→ [PowerOn/Preset►]→
Accesses the softkeys that allow you to set
the print parameters.
system. Press the Help key again to exit.
4.4.2 Parameter Input
Specific parameter v alues are ab le to be ent ered us ing the num eric
keypad, knob, and directional keys.
Numeric Keypad
13
Page 19
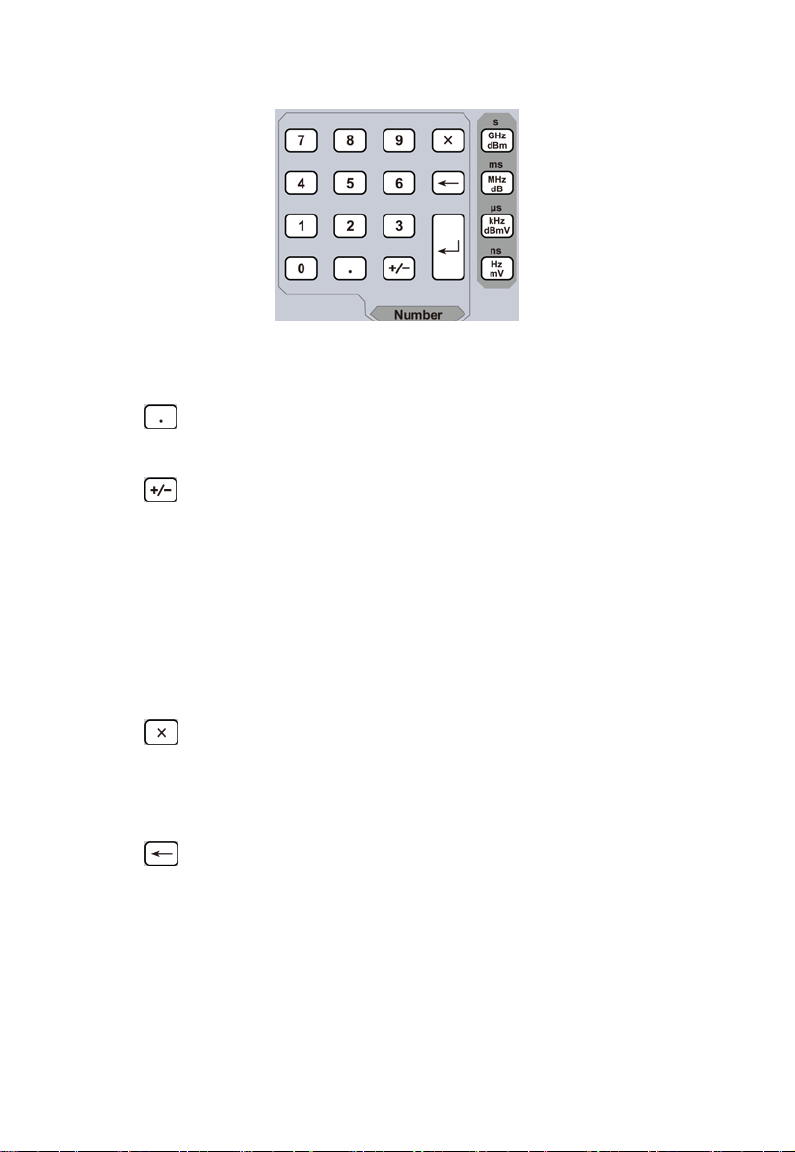
Figure 4-3 Numeric Keypad
1. Numeric keys
Numbers 0-9 are available to be used.
2.
Decimal point
A decimal point "." will be inserted at the cursor position
when this key is pressed.
3.
Sign key
Sign key "+/-" is to toggle the sign of a parameter. When
pressed the first time, a "-" will be inserted and changed into
"+" following the second press.
4. Unit keys
Unit keys include GHz/dBm/s, MHz/dB/ms, kHz/dBmV/μs
and Hz/mV/ns. After entering the desired numbers, choose
an appropriate unit to complete the input. The specific
meaning of unit is decided by the type of input parameter
("frequency", "amplitude" or "time").
5.
Cancel Key
(1) During the editing process this key will clear the inputs in
the active area and exit editing mode at the same time.
(2) Turn off the display in the active area.
(3) Exit current test mode whil e in key board test.
6.
Back Key
(1) During the process of parameter editing, this key will
delete the characters on t he left side of the cursor.
(2) While in the process of file name editing, pressing this
key will delete characters that have been entered.
7. Enter
When pressed, the system will complete the input process
14
Page 20
and insert a default measurement unit for the parameter
automatically.
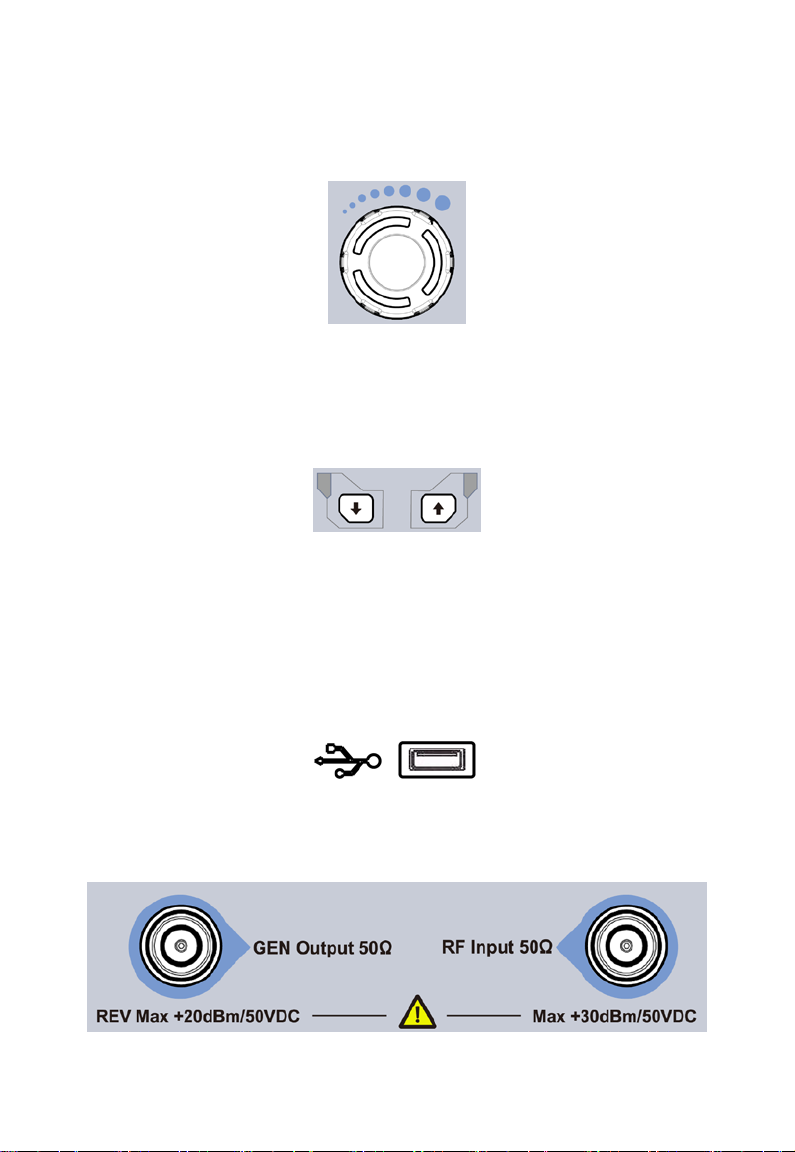
Knob
Figure 4-4 The knob
The knob function:
During parameter edit i ng, turn the knob clockwise to increa se, or
counterclockwise to decrease the parameter values at s peci fied
steps.
Direction key
Figure 4-5 Direction keys
The directional keys have fo llowing functions:
1) Increase or decrease the parameter value at specific steps
while editing a parameter.
2) Move the cursor though the d irectory tree in the【File】function.
4.4.3 Front Panel Connector
1. USB Host
The analyzer may serve as a "host" device to connect to external
USB devices. This interface is available for USB storage devices.
2. GEN Output 50Ω (tracking generator output 50Ω)
15
Page 21
!
CAUTION
Input voltage at RF input port must not be higher than 50 V
DC to avoid damage to the attenuator and input mixer
tracking generator.
!
CAUTION
When input attenuator is higher than 10 dB, the RF port
input signal must be less than +30 dBm.
8 7 6 5 4 3
1
2
NO.
Name
Description
The output of the tracking generator can be connected to a
receiver through an N type male connector, users can purchase
this option if required.
3. RF Input 50Ω
The RF input may be connected to a device v ia a N type connector
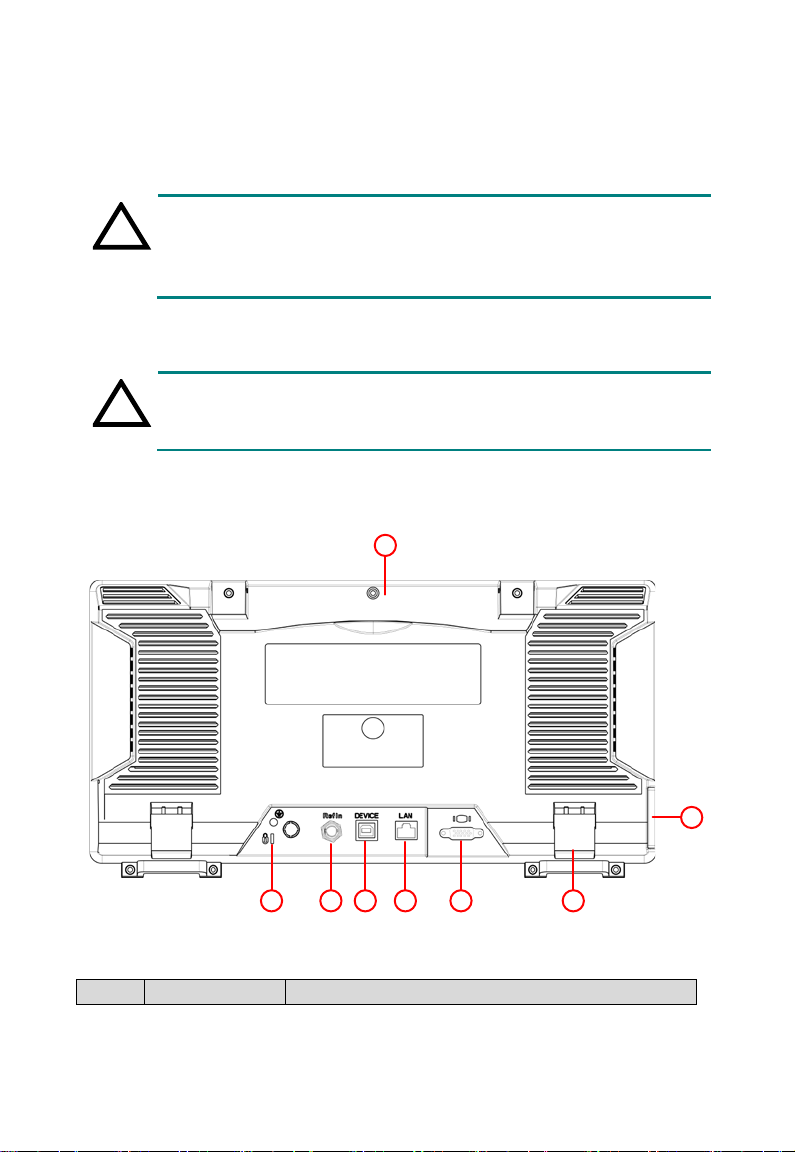
4.5 Rear Panel
Figure 4-6 Rear Panel
Table 4-4 Rear Panel Description
16
Page 22

①
Handle
Stow the handle for mobil e use.
AC power
AC: frequency 50Hz±10%, single-phase
alternative 220V±15% or 110V±15
Stool
To adjust the angle of the dev ice
VGA port
provides a VGA signal output which is
projector
LAN
Through this interface, t he analyzer can
remote control.
USB Device
This configurable USB port permits
connection.
10MHz
IN/OUT
The BNC input or output of the 10 MHz
reference clock
Lock hole
You can lock the spectrum analyzer to a
spectrum analyzer.
②
③
④
⑤
⑥
⑦
connector
interface
interface
%
used through a VGA cable or with a
be connected to your local net w or k for
external USB devices. It suppor ts
PictBridge printer and remote-control
⑧
fixed location using the sec ur ity lock
(please buy it yourself) to secur e t he
17
Page 23
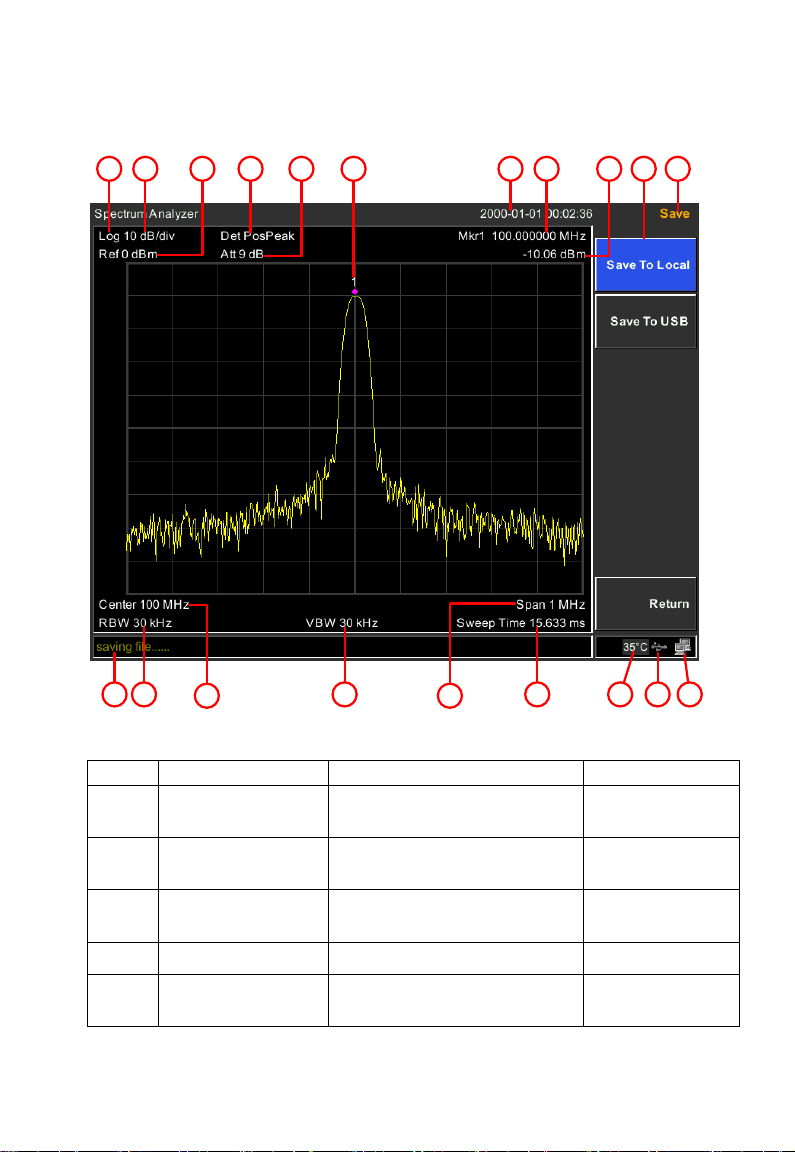
4.6 User Interface
7
15
19
13
10
20
4
9
17
3
5
6
8
18
16
14
12
2
1
11
NO.
Name
Description
Related Key
Amplitude
Can choose logarithmic
AMPTD】→
[Scale Type]
Amplitude
Display division scale
AMPTD】→
[Scale/Div]
Reference level
Reference level
AMPTD】→
[Ref Level]
Detection type
Display detection type
Attenuation
Display input attenuation
setting
AMPTD】→
[Attenuation]
Table 4-5 User interface Description
①
Division Type
②
Division
③
④
⑤
Figure 4-7 User interface
or linear
18
【
【
【
【Detector】
【
Page 24

⑥
Marker
Display current activated
marker
Date/time
Display system date and
time
System】→
[Date/Time]
Display frequency and
marker
Menu item
Menu item of current
function
Menu title
Function of current menu
belongs to.
LAN access
sign
LAN access sign
USB storage
device
Show if USB storage
device is inserted;
Temperature
sign
Display device internal
temperature
Sweep Time
System sweep time
Sweep】→
[Sweep Time]
Span
Display span width
SPAN】→
[Span]
Video
Display video bandwidth
→
[VBW]
Center
frequency
Display center frequency
FREQ】→
[Center Freq]
Resolution
bandwidth
Display resolution
bandwidth
→
[RBW]
System status
Display spectrum
analyzer status
【Marker】
⑦
⑧⑨
⑩
⑪
⑫
⑬
⑭
⑮
⑯
⑰
⑱
⑲
⑳
Marker readout
bandwidth
amplitude of current
【
【Marker】
【
【
【BW】
【
【BW】
4.7 Build-in Help
The built-in help provides information that refers to ev er y function
key and menu key on the front p anel. Users can view this help
information if required.
1.How to acquire built-in help
19
Page 25

Press Help; a prompt abo ut how to obtain help information will
be shown
2.Page up and down
If there is more than one page of information, you can read the
complete information by us ing the directional keys.
3.Close the curre nt help informati on
Press "Help" again to close help.
4.Acquire the menu h el p
A message about how to obt ai n help information will be shown,
press the menu keys to get the c or res ponding help.
5.Acquire the hel p i nformation of any function key
A message about how to obt ai n help information will be shown,
press any function key to get the corresponding help.
4.8 Basic Measurement
Basic measurements inclu de, input signa l frequency and amplitu de
display, marked by a frequency marker. Follow these four si mp le
steps below to implement inp ut s ign al me as urement.
Basic:
1. Setting center frequency;
2. Setting span and resolution bandwidth;
3. Activate marker;
4. Setting amplitude;
For example, to measure a 100MHz -20dBM signal, y ou must t ur n
on the spectrum analyz er and ens ure it i s warmed up for 30
minutes to ensure measur em ent accuracy.
1. Equipment connection:
Connect the output termin al of signal generator to the RF Input
50Ω terminal of spectrum analyzer. Set the parameters as follows:
Frequency 100 MHz
Amplitude -20 dBm
2. Setting parameters:
1) Press 【Preset】 to restore the analyzer to its factory-defined
state. The Spectrum analyzer will display the spectrum from
9kHz to the maximum span width. The signal generated will
display as a vertical line at 100MHz. Refer to Figure 4-8.
20
Page 26

Figure 4-8 Full Span
To clearly observe the signal, r educe the frequency span to 1 MHz
and set the center frequency to 100MHz.
2) Setting Center Frequency
Press "FREQ", select [Center frequency] on c orr esponding pop up
menu. Input "100" and sel ec t t he unit as MHz on the numeric
keypad. The keys can be used to set the exact value but the knob
and directional keys can also be used to set the center frequency.
3) Setting Frequen cy Span
Press 【SPAN】, input "1" and select MHz as its unit using the
numeric keypad; or press 【↓】 to decrease to 1MHz.
Press 【BW】, set [resolution bandwidth] to manual, and input
"30" and select kHz as its unit using t he numer ic keypad; or
press 【↓】to decrease to 30kHz.
Press 【Detector】, set the detect ion t ype to positive peak.
Figure 4-9 shows the sign al at a higher resolution.
Please note that resolutio n bandwidth, video bandwidth and
frequency span are self-adapted. They adjust to cert ain v alues
according to frequency sp an. Sweep time can be self-adapted too.
21
Page 27

Figure 4-9 Set frequency span
4) Activate Marker
—Press【Marker】
button in the function ar ea. Pr ess the so ftkey
to select [Marker 1 2 3 4 5 ], select M ar ker 1, t he ma r ker is
located at horizontal cente r by default, that is the signal peak
point or its neighbor.
—Press Peak, and enter the next level menu, select [Max
Search]. Frequency and a mp l it ude values are read by the
marker and shown on the top right of the display area.
5) Setting amplitude
The reference level will be show n at the top of the display grid. To
get a better dynamic rang e, t he r eal si gnal peak point should be
located at or near the top of display grid (reference level). The
reference level is also the maxi m um value on Y axis. Here we
reduce to 20dB reference level to increase the dynamic range.
Press 【AMPTD】, the amplitude setting menu will pop u p, and the
[reference level] soft key w ill be activated. The reference lev el ca n
be input at the top left of the display grid. Input "-20" using the
numeric keypad and set t he unit to d Bm. You c an als o use the 【↓】
key or the knob for adjustment .
22
Page 28

The reference level is set at -20dBM, which is the signal peak
value near the top of the grid. The b al anc e between the signal
peak value and noise is dynam ic range.
Figure 4-10 Set reference level
23
Page 29

5. Menu Interpretation
This section provides you w it h t he in formation on using the front
panel of the spectrum analyzer.
5.1 【FREQ】Frequency
The frequency range of a channel can be expressed by either of
two groups of par ameter s: Start Frequency and St o p Frequ ency ; or
Center Frequency and Span. If any such parameter is changed,
the others would be adjusted aut omatically in order to ensure the
coupling relationship am ong them
f
= ( f
center
f
= f
span
f
, f
center
frequency, the start frequency and the span respectively.
5.1.1 [Center Freq]
Sets the center frequency of the sweep. When pressed, the
frequency mode is switched to Center Freq and Span in order to
enter the desired paramet er data.
Key Points:
The start and stop frequencie s vary with the center frequency
when the span is constant.
Changing the center frequ ency horizontally shifts the current
sweep channel and the ad justment is limited by the specified
frequency range.
In Zero Span mode, the start frequency, stop frequency and
center frequency are alwa ys equal. If one is changed the others
are updated to match.
You can modify t his parameter using the numeric keys, knob, or
direction keys.
stop
stop
stop
,
−
+ f
f
f
s t a r t
star
) / 2
start
t
and f
(5-1)
(5-2)
denotes the center frequency, the stop
span
24
Page 30

5.1.2 [Start Freq]
Sets the start frequency of t he s w eep. When pressed, the
frequency mode is switched to Star t Freq and St op Freq in order t o
enter the desired paramet er data.
Key Points:
The span and center frequency are changed automatically
according to the start freq uency. The change of the span would
have influence on other syst em p ar ameters. For more details,
please refer to "Span".
In Zero Span mode, the start frequency, stop frequency and
center frequency are alwa ys equal. If one is changed the others
are updated to match.
You can modify this parameter using the numeric keys, knob, or
direction keys.
If start freq is larger than s t op freq w hen setting, then stop freq
will increase automatica lly t o the same value of start freq.
5.1.3 [Stop Freq]
Sets the stop frequency of t he sweep. When pressed, the
frequency mode is switched to Star t Freq and St op Freq in order t o
enter the desired paramet er data.
Key Points:
Modifying the stop freque ncy changes the span and center
frequency, and the change of span i nf lue nc es other system
parameters, see "Span".
You can modify this parameter using the numeric keys, knob, or
direction keys.
If stop freq is larger than star t freq w hen setting, then start freq
will decrease automatically to the same value of stop freq.
5.1.4 [CF Step Auto Man ual]
Sets the step of center frequency. Changing the center
frequency in a fixed step c ontin uously sw itches the c hannel t o be
measured.
Key Points:
25
Page 31

The frequency step type c oul d be "Manual" or "Auto". In Auto
mode, the CF step is 1/10 of spa n i f it is in Non-zero span mode
or equals 25% of RBW while in Z er o s pan mode; in Manual
mode, you can set the step using the numeric, step key s or knob .
Then activate 【Center Frequency】, press step, center
frequency will change as setting step.
After you set an appropria t e frequency step and select center
frequency, you can use using u p and down direction keys to
switch between measurement channels in a specified step i n
order to sweep the adjacent c hannels manually.
You can modify this parameter using the numeric keys, knob, or
direction keys.
Frequency step lends itself to detect the harmonic waves and
bandwidths that are beyond the current span.
For example, for order of harmonic of a 300 M Hz signal, y ou can
use set both the center frequency and frequency step to 300
MHz, and press the up dir ection key conti nuously to incre ase th e
center frequency to 600MHz, that is secondary harmonic. Press
frequency steps to increase center frequency by 300MHz, which
reaches 900MHz . [Frequency Step Auto Manual] sh ows the auto
or manual mode to setting t he steps. When step is under man ual
mode, press [Frequency Step Auto Manual] to return to auto
mode.
5.1.5 [Freq Offset]
You can set a frequency offset to displayed frequency value,
including freq marker valu e. This movement won’t infl uence sweep
frequency range.
While this function activated (frequency offset isn’t 0), you can
modify this parameter using t he numeric keys, knob or directio n
keys. `
5.1.6 [Freq Ref Internal External]
Set the reference freque ncy as internal or external input, t his is
26
Page 32

regarded as whole device reference.
5.2 【SPAN】
Set the spectrum analyzer to span mode. When press 【SPAN】,
[Span],[Full Span],[ Zero Span] and [Last Span] will be av ailable to
configure. You can modify span using the nu meric keys, knob or
direction keys. Use numeric key or [Zero Span] to cl ear span.
5.2.1 [Span]
Sets the frequency range of the sweep. When pressed, the
frequency mode is switched to Center Freq/Span.
Key points:
The start and stop freque ncies are changed with the span
automatically.
In manual span mode, the span ca n be s et dow n t o 0 Hz, that is
zero span mode. And up to the full span described in
"Specification". When it is set to the maximum span, it enters fu ll
span mode.
Modifying the span in non-zero span mode may cause an
automatic change in both CF st ep and RBW if they were in Auto
mode, and the change of RBW may influence VBW (in Auto
VBW mode).
In non-zero span mode, variat i on in the span, RBW or VBW
would cause a change in sweep time.
You can modify this parameter usin g t he numeric keys, knob, or
direction keys.
5.2.2 [Full Span]
Sets the spectrum analyzer to center frequency/sw eep mode, and
span of the analyzer to the maxi m um.
27
Page 33

5.2.3 [Zero Span]
Sets the span of the analyzer to 0 Hz. Both the start and stop
frequencies will equal the c ent er frequency and the horizontal axi s
will denote time. The analyzer here is meas ur ing the time domain
characteristics of amp litud e, located at the corresponding
frequency point. This w ill help to observe the signal (especia lly for
modulated signal) at time domain.
5.2.4 [Last Span]
Changes the span to the previous span setting.
5.3 【AMPTD】Amplitude
Sets the amplitude para m et er s of the analyzer. Through these
parameters, signals under measurement can be displayed at an
optimal view with minimum err or . The pop out amplitude menu
includes [Ref Level], [Attenuation Auto Manual], [Scale/Div],
[Scale Type Lin Log], [Ref Offset], [Ref Unit], and [Preamplifier
On Off].
5.3.1 [Ref Level]
Activate reference level function and sets the maximum power or
voltage for display window.
Key points:
This value is affected by a co mbination of maxi mum mixing lev el,
input attenuation, and pream plifier. When you adjust it, the input
attenuation is adjusted under a constant max mixing lev el,
meeting:
L
− a
Ref
L
Ref
+ a
RF
a
,
,
RF
attenuation, the preampl ifier, and the max mixing level,
respectively.
a
PA
PA
≤
and
L
mix
L
denotes the reference level, the input
mi
x
28
(5-3)
Page 34

You can modify this parameter using the numeric keys, knob, or
direction keys.
Reference level located at the top of axis grid. Measurement
near the reference level would gain better accuracy, but input
signal amplitude should not exceed the reference level; if it
exceeds, the signal will be compressed and distorted, result in
wrong measurement. Analyzer’s input attenuation is related with
reference level, it can self-adjust to avoid signal compression.
Minimum reference level is -80dBm at Log scale under 0dB
attenuation.
5.3.2 [Attenuation Auto Manual]
Sets the front attenuator of the RF input in order to permit big signals
(or small signals) to pass from the mixer with low distortion (or low
noise). It only works under internal mixer mode to adjust input
attenuator insider analyzer. In Auto mode, input attenuator is related
with reference level.
Key points:
When the preamplifier is O n, the input attenuation could be set
up to 39 dB. You can adjust t he r eference level to ensure that
the specified parameters me et the requirement.
Modifying the reference lev el may cause an aut o matic chan ge in
attenuation value; But the change of at t enuation value won’t
influence reference level.
You can modify this parameter using the numeric keys, knob, or
direction keys.
29
Page 35

Attenuator adjustment is to make the maximum signal a mp litu de
pass from mixer less than or equal to -10dBm. E.g. if the
reference level is +12dB m , t he attenuator value is 22dB, then
the input level in mixer is -18dBm (12-22-8=-18), its mainly
purpose is to avoid signal co mpression. Switch [Input Atten Auto
Manual] to manual mode, adj ust the attenuator manually. The
highlight under auto or manual stands for auto coupling and
manual coupling. When attenuator is under manual mode, pr ess
[Input Atten Auto Manual] will match the attenuator and
reference level again.
Note: Maximum input signal amplitude of input attenuator (10dB
input attenuation at least) is +27dBm, higher power signal will
damage input attenuator o r mixer .
5.3.3 [Scale/Div]
Sets the logarithmic units per vertical grid division on the display .
Select 1,2,4 or 10dB log amplitude scale. It’s 10dB/div by default.
Every activated marker is w it h dB as unit, difference between two
markers is treated as mark er difference under dB unit.
Key points:
By changing the scale, the disp layed amplitude range is
adjusted.
The amplitude that can be displayed is from reference level
minus 10 times the current scale value to the reference level.
You can modify this parameter using the numeric keys, knob, or
direction keys.
5.3.4 [Scale Type Lin Log]
Sets the Scale Type of Y-axis t o Lin or Log, the default is Log. It
only works under interna l mixer mode. In general, s elect mV as Lin
amplitude scale unit. Of c our s e t her e w ould be other units for
select.
Key points:
In Log scale type: the Y-axis denotes the logar ithm ic coordinat es,
30
Page 36

the value shown at top of the grid is t he r eference level and the
grid size is equal to the scale valu e. The unit of Y-axis will be
automatically switche d into the default "dBm" when the scale
type is changed from Lin to Log.
In Lin scale type: the Y-axis denotes the linear coordinates, the
value shown at the top of the grid is the r eference level and the
bottom of the grid shows 0 V. The grid size is 10% of the
Reference level and the Scale/Div is invalid. The unit of Y-axis
will be automatically sw itc hed i nt o the default "mV" when the
scale type is changed from Lo g t o Lin.
Other than as mentioned above, the unit of Y-axis is
independent of the Scale Ty pe.
5.3.5 [Ref Offset]
Assigns an offset to the reference lev el to attempt t o compensate
for gains or losses generat ed between the device under
measurement and the analyzer.
Key points:
The changing of this value changes both the readout of the
reference level and the amp l it ude r eadout of the marker, but will
not impact the position of t he cur ve on the screen.
You can modify this parameter using the numeric keys.
This offset use dB as absolute unit, will not c hange with selected
scale and unit.
5.3.6 [Ref Unit►]
Sets the unit of the Y-axis to[dBm], [dBmV], [dBuV], [V] or [W]
Key points:
1) [dBm]
Choose decibel equals to 1mW as ampl itude unit.
2) [dBμW ]
Choose decibel equals to 1μW as amplitude unit.
3) [dBpW]
Choose decibel equal s t o 1pW as amplitude unit.
4) [dBmV]
31
Page 37

Choose decibel equal s t o 1m V as amplitude unit.
5) [dBμV]
Choose decibel equals to 1μW as amplitude unit.
6) [W]
Choose Watts as amplitude unit.
7) [V]
Choose Voltage as a mp l it ude unit.
5.3.7 [Preamplifier On Off]
Sets the status of preamplifier located at the front of the RF
signal path. Turning on the pr eamplifier reduces the displayed
average noise level in ord er t o distinguish small signals from the
noise when working with smal l sig nals.
5.4 【Auto】Auto Tune
Searches for signals automatically throughout the full frequency
range, adjusts the frequen cy and amplitude to their optimum and
realizes one-key signal se ar ch and auto setting of parameters.
Key points: some paramet ers such as reference level, scale, and
input attenuation may be changed during the auto tune.
5.5 【BW】Bandwidth
Sets the RBW (Resolution Bandwidth) and VBW (Video Bandwidth)
parameters of the analyz er . Pop out t he setting menu includes
[RBW Auto Manual], [RBW Mode Default Continuous],[VBW Auto
Manual], [Average On Off], [EMI BW►].
5.5.1 [RBW Auto Manual]
Adjust the resolution band width ranging from 10Hz-3MHz. Use
numeric key, step key or k nob t o sw it ch r esolution bandwidth. The
underline under Auto or Manual means Auto mode or Manual
32
Page 38

mode. Press [Resolution Bandwidth Auto Manual] and hold it unti l
underline under Auto has been highlighted. Then the resolution
bandwidth is under auto c oupling mode.
Key points:
Reducing the value of RB W wi l l increase the frequency
resolution, but may also c ause sweeps to take longer (Sweep
Time is effected by a combin ation o f RBW and VBW when it is in
Auto mode).
RBW decreases with the span ( non-zero span) in Auto RBW
mode.
5.5.2 [RBW Mode Default Continuous]
Adjust resolution step mode, r es ol ut ion mode can be set to 1-3-5,
Default or Continuous mode.
5.5.3 [VBW Auto Manual]
Sets the desired video bandwidth in order t o remove the band
noise. Set the video resolution displays in function area, ranging
from 10Hz to 30MHz by seque nc e st ep. You can modify this
parameter by numeric key, step key or knob. The underline under
Auto or Manual means Au t o mod e or M anual mode. Press [VBW
Auto Manual] and hold it in manua l until the underline highlighted
under Auto to return auto mo de.
Key points:
Reducing the VB W to smooth the s pectrum line and differentiat e
small signals from the noi se. How ever, t his may cause a longer
sweep time. (Sweep Time is effected by a combination of RBW
and VBW when it is in Auto mode).
VBW varies with RBW when it is set to Auto.
5.5.4 [Average On Off]
Trace average function. It doesn’t need narrow VBW to implement
smooth trace. This function set the wave detector to acquisition
mode, continuously get average of the trace to smoot h it.
33
Page 39

5.5.5 [EMI BW►]
Pop out the menu for EMI measurement bandwidth.
1) [EMI bandwidth On Off]
Turn on or off EMI measurement reso lution bandwidth.
2) [1MHz]
Set EMI measurement resolution to 1MHz.
3) [120kHz]
Set EMI measurement resolution to 120kHz.
4) [9kHz]
Set EMI measurement resolution to 9kHz.
5) [200Hz]
Set EMI measurement resolution to 200Hz.
5.6 【Trace】
As the sweep signal is display ed as a t r ace on the screen, you
can set parameters a bout the trace using this key. The analyzer
allows for up to five t races to be d isplay ed at one ti me, and pres s
this key to check the menu for trace. I t includes [Trace 1 2 3 4 5],
[Clear Write], [Max Hold], [Min Hold], [Blank], [Check], [ 1 ↔ 2],
[ 2 - DL → 2], [ 2 ↔ 3], [ 1 → 3] and [ 2 → 3].
5.6.1 [Trace 1 2 3 4 5 ]
Select trace, the ana lyzer offers 1,2,3,4,5 trace. T he selected trace
and corresponding status me nu will be underlined.
5.6.2 [Clear Write]
Refresh current curve and disp lay the analyzer trace.
5.6.3 [Max Hold]
Maintains the maximum for each point of the trace. It continuously
receive scan data and sel ect positive peak value detect mode.
34
Page 40

5.6.4 [Min Hold]
Maintains the minimum fo r each point of the trace. It continuously
receive scan data and sel ect negative peak value detect mode.
5.6.5 [Blank]
Clear the trace on screen. But t he t r ace s t ock will keep still without
refreshing.
5.6.6 [View]
Stops updating trace data and display current trace for
observation..
5.6.7 [Operations►]
Enter trace math related sub m enu.
1) [1 ↔ 2]
Exchange the trace stock 1 dat a with trace stock 2 and place them
in display mode.
2) [2-DL → 2]
Deduct display line value in t r ace s t ock 2. This function execute
once when activated. Pre ss [ 2 - DL → 2] again to execute it the
second time. When this function activated, display line wil l also be
activated.
3) [2 ↔ 3]
Exchange the trace stock 2 dat a with trace stock 3 and place them
in display mode.
4) [1→3]
Exchange the trace stock 1 dat a with trace stock 3 and place them
in display mode.
5) [2→3]
Exchange the trace stock 2 dat a with trace stock 3 and place them
in display mode.
35
Page 41

Detector
Type
Measurement
Auto
Normal wave detect is the most common way
loosing any signal.
Normal
Display pos peak and neg peak alternately
peak.
Pos Peak
Positive peak detection en sur es t hat no peak
signals that are very c lose to t he bas e noise.
Neg Peak
Negative peak detection is used in most cases
signal well.
5.7 【Detector】
While displaying a wider span, each pixel contains spectrum
information associated with a larger subrange. That is, several
samples may fall on one pixel. Which of the samples will be
represented by the pixel depends on the selected detector type.
Press this key to pop out the relev ant menu includes
[Auto],[Normal],[Pos Peak],[Neg Peak],[Sample].
Key points:
Selects an appropri ate type according to the applicat ion i n order
to ensure the accuracy of the me asurement for your application.
The available types are: Pos Pe ak, Neg Peak, Sample.
Every selected type is show n w it h a parameter icon on the left
status bar of screen.
Table 5-1 Detector type comparison
to detect waveform. It can obs er ve the signal
and base noise at the same time w ithout
when noise is detected, or it only display pos
signal is missed, which is useful for measuring
with the self-test of the spectrum analyzer and
is rarely used in the measurement. It is able to
restore the modulation envelope of the AM
36
Page 42

Sample
Sampling detector is cond ucive to
noise better.
measurement noise signal. Compared w ith the
standard detection metho d, it can m easure
5.7.1 [Auto]
Set the detector to auto det ection mode (default mode). In t his
mode, when the span is gr eat er than 1MHz, the detection method
is set as Normal. When the span is less than or equal to 1M Hz, the
detection method is set as Positive Peak.
5.7.2 [Normal]
When noise is detected, the positive and negative peaks are
alternately displayed, otherwise only positive peaks are displayed.
5.7.3 [Pos Peak]
Searches the maximum from the sa mp li ng dat a segment and
displays it at the correspondi ng pixel. Positive peak detector will be
selected when [Max Hold] pr essed.
5.7.4 [Neg Peak]
Searches the minimum from the sampling data segment and
displays it at the correspo ndi ng pixel.
5.7.5 [Sample]
Set the detector to the sampl ing d etector mode. This mode is
usually used for video aver agin g and noise frequency Maker.
5.8 【Display】
Controls the screen displa y of the analyzer, such as setting the on
or off for window zoom, display line, amplitude scale, grid, labe l,
37
Page 43

and display style.
5.8.1 [Full Screen]
Set to full-screen display graphical interface, press any key to exit.
5.8.2 [Zoom On Off]
In multi-window display mode, press this butt on t o zoom in on the
selected window. Press t he key for the first time to enlarge the
selected window to the ent ire gr aphic display area. Press this
button again to exit the ent ire gr aphic display area and restore the
multi-window display mode.
5.8.3 [Display Line On Off]
When this menu is on, an adjustable horizontal reference line is
activated on the screen.
5.8.4 [Ampt Graticule On Off]
Turn on or Off amplitude s cale function.
5.8.5 [Grid On Off]
It’s the grid lines displayin g and hiding menu. When the grid
display line is on, pressing [Grid On Off] again will turn it off.
5.8.6 [Style►]
Set the spectrum analyzer display style as default or WinXP.
5.8.7 [Label On Off]
38
Page 44

Defines the content displayed or hidden in the comments that
appear in the display grid area.
5.9 【Sweep】
Sets parameters about the Sw eep t ime and mode including
[Sweep Time Auto Manual]. [Sweep Single], [Sweep Cont]].
5.9.1 [Sweep Time Auto Manual]
Sets the time interval for the analyzer to complete a sweep.
In non-zero span, the analyzer uses the shortest sweep time o n
the basis of the current RBW and VBW settings if Auto is
selected.
You can modify this parameter using the numeric keys, knob, or
direction keys.
5.9.2 [Sweep Single]
Press [Single Sweep] to s et t he sweep mode to Single. Press
[Single Scan] to restart t he scan when the next trigger signal
arrives. Allows you to set cont inuous scan mode.
5.9.3 [Sweep Cont]
Press [Continuous Scan] t o activate the sweep scan mode.
5.9.4 [Sweep Points]
Sets the desired points for every sweep. That is the number of
points of the current trace.
Key Points:
Changing the points may influence the sweep time which is
limited by the sample rate of t he ADC (Analog to Digital
Converter). That is, the m or e poi nt s us ed, the longer the sweep
39
Page 45

will be.
Changing the points would also influence other system
parameters, thus the instrument restarts the sweep and
measurement cycle.
You can modify this parameter using the numeric keys, knob or
direction keys.
5.10 【Trig】
Sets the trigger type and other as sociated parameters, menu
includes [Auto Run] and [ Vi deo] .
5.10.1 [Auto Run]
Set the trigger mode to the free t r igger mode so that the scan
trigger is as fast as possible with t he spectrum analyzer. It meets
the trigger conditions at any time, that is, continue to generate a
trigger signal.
5.10.2 [Video]
This indicates a trigger signal will be generated when the sy st em
detects a video signal in w hich the voltage exceeds the specified
video trigger level.
5.11 【Source】
When the Source is On, a signa l wit h t he same frequency of the
current sweep signal will be output from the GEN OUTPUT 50Ω
terminal on the front panel. Press t he key will pop o ut related menu
includes [Tracking Source►], [Tracking Source On Off], [Output
Power], [Network Meas ure►].The tracking source i s t ur ned off in
the power-on and reset st at es.
5.11.1 [Track Gen►]
To configure tracking sour ce.
40
Page 46

5.11.2 [Track Gen On Off]
RF output and spectrum rec ept i on ar e fully synchronized on the
frequency sweep, and th e tracking sour ce frequ ency can not be set
individually.
5.11.3 [Output Level]
Tracking Source power output range from 0dBm to -30dBm.
5.11.4 [Network Meas►]
Tracking source network measurement function, mainly for
amplitude and frequency char acteristics measurement; RF out put
and spectrum measurem ent is fully synchronized, can be us ed as
a scalar network analyz er . When the network measurement
function is "on", the me asure ment results show re lative v alues after
"normalized", expressed in "dB". When the network measurement
function is "off", the meas ur ement shows the spectrum
measurement result, expressed in "dBm".
1) [Network Meas On Off]
Turn on or off the tracking sourc e net w ork measurement functio n.
Tracking source network measurement function, mainly for
amplitude and frequency c harac t eristics measurement; RF output
and spectrum measurem ent is fully synchronized, can be us ed as
a scalar network analyz er . When the network measurement
function is "on", the me asure ment results show re lative v alues after
"normalized", expressed in "dB". When the network meas urement
function is "off", the meas ur ement shows the spectrum
measurement result, expressed in "dBm".
2) [Output Level]
Used to set the output power of the t r ace source.
3) [Ref Level]
41
Page 47

This soft menu is us ed to t rack the sour ce networ k measurement of
the user to adjust the measurement results display locat io n.
4) [Sweep Points]
Used to set the number of scanning points for network
measurements.
5) [Sweep Time]
Used to set the scan time for network measurements.
6) [Normalize]
This soft menu is used to track the user' s f ield calibration of the
source network measurements. After connecting the instrument's
RF output to the RF input, press the "normalized" soft menu and
the display shows a straight line on the 0dB scale.
5.12 【Demod】Demodulation
Enter the demodulation se t t ings, t he spectrum analyzer supports
audio demodulation and AM, FM digital demodulation.
5.12.1 [DEMOD►]
Enter Audio Demod soft me nu.
5.12.2 [Demod On Off]
Turn audio demodulation on or off.
5.12.3 [Demod Mode►]
Enter the demodulation m ode s oft menu. Including FMW, FM, AM,
USB, LSB.
5.12.4 [Sound]
When the audio demodulation is on, adjust the speaker output
volume.
5.12.5 [RadioSet►]
42
Page 48

Quick access to the commo n br oadcast band.
5.12.6 [Digital Demod►]
Enter the digital de mod ul ation soft menu.
5.12.7 [AM►]
Enter AM demodulation soft menu.
5.12.8 [AM On Off]
Turn AM demodulation On or O ff.
5.12.9 [Carrier Freq]
Set the carrier frequency of t he AM modulation signal.
5.12.10 [IF BW Auto Manual]
Set the demodulation bandwidth to auto or manual mo de.
5.12.11 [FM►]
Enter FM demodulation soft menu.
5.12.12 [FM On Off]
Turn FM demodulation On or Off.
5.12.13 [Carrier Freq]
Set the carrier frequency of t he FM modulation signal.
5.12.14 [IF BW Auto Manual]
Set the demodulation bandwidth to auto or manual mo de.
5.13 【Peak】
Executes peak searching immediately and opens the Peak set ting
menu.
Key Points:
If Max is selected from th e Peak Se arch o ption, it w ill search a nd
43
Page 49

mark the maximum on the tr ace.
The peak search of Next Peak, Peak Right, Peak Left or peaks
in the peak table must meet the specified parameter condition.
The spurious signal at the zero frequency caused by LO feed
through is ignored.
5.13.1 [Max Search]
Place a frequency scale at the highest point of the trace and
display the frequency and amplitude of the frequency scale in the
upper right corner of the screen. [M ax search] doe s not change the
activated function.
5.13.2 [Next Peak]
Searches the peak whose amp l it ude is the closest to that of the
current peak. The peak is then id entified with a marker. When this
key is pressed repeatedly, you can quickly find a lower peak.
5.13.3 [Left Peak]
Searches the nearest peak located to the left side of the current
peak and meets the curre nt peak and peak thresholds condition.
The peak is then identified w it h a mar k er .
5.13.4 [Right Peak]
Searches the nearest peak located to the right side of the curre nt
peak and meets the curre nt peak and peak thresholds condition.
The peak is then identified w it h a mar k er .
5.13.5 [Min Search]
Searches the peak with the m inimum amplitude on the trace and
identifies it with a marker.
44
Page 50

5.13.6 [Mkr→CF]
Used to move the peak point to the center frequency point.
5.13.7 [Cont Max On Off]
Set the peak search form, off by default. On mode will
automatically search for t he peak.
5.14 【Marker】
The marker appears as a rhombic sign (shown below) for
identifying the point on the t r ace. We can easily readout the
parameters of the marked point on the t race, such as the ampl itude,
frequency and sweep time.
Key points:
The analyzer allows for up to three groups of markers to be
displayed at one time, but only one pair or one single marker is
active every time.
You can use the numeric keys, knob or direction keys t o ent er
the desired frequency or t ime wh en any marker type menu is
active, so as to view the readouts of different po ints on the t race.
5.14.1 [Marker 1 2 3 4 5]
Selects one marker, the default is Marker1. And place the
frequency scale at the cent er of the t r ace. If the frequency
difference is activated, t his softkey changes to the menu under t he
[Difference] function.
If there is already a marker, t his com mand will not produce any
operation. If there are alre ady two markers (e.g. in [Differe nce]
mode), [Marker] changes the active frequency scale to a new
single frequency scale. A mp l it ude and frequency information can
be obtained from the frequency scale (time information whe n the
45
Page 51

sweep width is 0Hz), and thes e values are displayed in the upper
right corner of the activ e function ar ea and t he scre en. You can use
the numeric keys, the step key, or the knob to move the active
frequency scale.
The marker reads data from the current activ e track (t his track may
be track A or track B). If both tr acks are ac t ive or both tracks are in
static display mode, the fr equency scale will read data from track
A.
5.14.2 [Trace 1 2 3 4 5]
In the trace measurement, the frequen cy scale used t o activ ate the
traces.
5.14.3 [Normal]
One of the marker types, w hich is used to measure the values of
X (Frequency or Time) or Y (Amplitude) at cert ain point of the
trace. When selected, a m ar ker w il l app ear with its own digital I D
such as "1" on the trace.
Key points:
If no active marker exists cur r ent ly, a one will be enabled
automatically at the center frequency of current trace.
You can use the knob, direction keys or numeric keys t o mov e
the marker. The readouts of the marker will be displayed on the
upper right of the screen.
The readout resolution of the X-axis corresponds to the sp an
and sweep points. For h igher resolution, add sweep points or
reduce the span.
5.14.4 [Delta]
One of the marker types, w hich is used to measure the delta
values of X (Frequency or Time) and Y (Amplitude) bet ween the
Reference point and cert ain point on the trace. When select ed, a
46
Page 52

pair of markers appears on the trace, which are the Reference
Marker and the Delta Marker. Will be in the active area and the
display area of the upper right cor ner, show ing the amplitude delta
value between the two marker s and frequency difference. If a
single marker already exists, [Delta] will plac e a static marker and
an active marker to the origin al position and a single marker
position. Use the knob, step key, or number keys to move the
marker. If there are two markers, press [Delta] directly. However, if
[Delta] has been activated, press [Delta] to place the still frequency
scale to the active marker. The displayed amplitude difference is
expressed in dB, or is the linear unit in terms of the correspond ing
scale.
Key points:
The Reference Marker w ill be activated at the position of current
marker, or else both the reference marker and Delta Marker wil l
be simultaneously activat ed at t he center frequency location if no
marker is active at the present.
The location of the R ef er ence Marker is always fixed (both in the
X-axis and the Y-axis), wh ile the Delta Marker is active. Y ou can
use the numeric keys, knob or direc t i on keys to change the
location of Delta Marker.
The delta of both the Frequency/Time and the amplitude
between the two markers ar e dis played at the upper right of the
screen.
Tw o w ays to enable a certain point as the reference:
a) Open a "Normal" m arker and locate it onto a point and then
switch the marker type into "Delta", creating a new reference,
then you can modify the lo cat ion of the delta point to achi eve the
delta measurement.
b) Open a Delta Mar ker a nd place it onto a point, then reselect
the Delta menu to lo cate the marker you opened onto this points,
then you can modify the lo cat ion of the delta point to achi eve the
delta measurement.
5.14.5 [Off]
The marker information di s play ed on the screen and functions
based on the marker will be turned off and won’t show up again.
47
Page 53

【
】
5.14.6 [All Off]
Turns off all the opened marker s and the related functions. The
marker won’t show again.
5.14.7 [Marker Table On Off]
Turns on or off the display of all marker table.
5.15
A so ft menu associated with t he mar k er fu nct ion is popped out for
setting the other system parameters (such as Center frequency,
Reference level) by current marker readings. These menus relate
to the frequency of the spectrum analyzer, whether the sweep
width and marker are in normal or delta marker mo de.
Marker→
5.15.1 [Mkr->CF]
Sets the center frequency of the analyzer based on the frequency
of the current marker. This feature quickly moves the signal to t he
center of the screen.
If Normal is selected, the center frequency will be set t o the
frequency of the current m ar ker.
If Delta Marker is se lecte d, the cent er freque ncy w ill be set to t he
frequency at which the Delta Marker is located.
The function is invalid in Zero span mode.
5.15.2 [Mkr->CF Step]
Sets the center frequency step of the analyzer based on the
frequency of the current m ar ker.
If Normal is selected, the c ent er frequency step will be set to the
48
Page 54

frequency of current mar k er.
If Delta Marker is selected, the center frequency step will be set
to the frequency at which the De lta Marker is located.
The function is invalid in Zero s pan mode.
5.15.3 [Mkr->Start]
Sets the start frequency of t he analyzer based on the frequency of
the current marker.
If Normal is selected, the s tart frequency will be set to the
frequency of the current m ar ker.
If Delta Marker is selected, the start frequency will be set to the
frequency at which the Delta Marker is located.
The function is invalid in Zero s pan mode.
5.15.4 [Mkr->Stop]
Sets the stop frequency of t he analyzer based on the frequency of
the current marker.
If Normal is selected, the s t op frequency will be set to the
frequency of the current m ar ker.
If Delta Marker is selected, the stop frequency will b e set to the
frequency at which the Delta Marker is located.
The function is invalid in Zero sp an mode.
5.15.5 [Mkr->Ref Level]
Sets the reference level of t he analyzer based on the amplitude of
the current marker.
If Normal is selected, the r eference level will be set to the
amplitude of the current mar ker.
If Delta Marker is selected, the reference level will b e set to the
amplitude at which the Delta Marker is located.
5.15.6 [MkrΔ->Span]
Changes the span of the ana ly zer to the frequency difference
49
Page 55

between the two markers.
5.15.7 [MkrΔ->CF]
Changes the center frequency of the analyzer to the frequency
difference between the two markers.
5.16 【Marker Fctn】Marker Function
Executes specific marker soft menu.
5.16.1 [Function Off]
Turn off marker measurement function.
5.16.2 [NdB On Off]
Enables the N dB BW measurement or sets the value of N. The N
dB BW denotes the frequency difference between points that are
located on both sides of the curr ent m arker while the amplitude
falls off (N<0) or rises ( N>0) N dB separately,
Key points:
When the measurement s t ar t s, the analyzer will search the
two points which are located at both sides of the current point
and are N dB amplitudes sm al ler or gr eat er t han the current
point, and display the freq uency difference between the two
points.
You can use the numeric keys, knob or direction keys to
modify the value of N, 3 at default.
5.16.3 [Marker Noise On Off]
Turn on or of f the fre quency noise functi on. The funct ion of marking
noise is applied to the selected cur sor, and t hen t he noise Power
Spectr al Density at the cursor is read. When turned on, the
50
Page 56

average noise level read at the frequency scale is normalized to 1
Hz bandwidth for noise power.
5.16.4 [Freq Count►]
Activate the frequency counter function and display the count
results in the upper right corner of the screen. The counter counts
only the signals that are display ed on the screen. The frequency
count also pops up an addit io nal counter function for the soft menu,
including [Freq Count O n Off ].
1) [Freq On Off]
Turn on or off the frequency counter mode. This function is inval id
when the trace signal gen erator is activated. The count value is
displayed in the upper right cor ner of the screen.
2) [Resolution]
Counter resolution is divid ed int o 1 kHz, 100 Hz, 10 Hz, 1Hz.
Changing the counter resolution can change the counter accuracy.
The higher the resolution, t he higher the counting accuracy.
5.17 【Meas】Measurement
Provide a variety of advanced measurement functions, pop-up
spectrum analyzer built -in and user -de fined measure ment function
soft menu, turn on or off the time spectr um, adjacent channel
power measurement, channel power measurement, oc cupied
bandwidth, Pass-Fail measur eme nt menu.
5.17.1 [Measure off]
You can directly close the curr ently running measur eme nt fun ction,
you can also choose to close the measurement menu.
51
Page 57

5.17.2 [Time Spec On Off]
Turn on time spectrum me asur e mode.
5.17.3 [ACPR On Off]
Turn on or off the adjacent channe l pow er measurement. Press
【Meas Setup】 to pop up the p ara meters of th e ad jace nt cha nne l
power measurement soft menu. The adjacent channel power is
used to measure the ratio of the ad ja c ent channel power of the
transmitter. The absolute value of the main channel power and the
absolute value of the adja cent c hannel power are obtained by the
linear power integration m et hod, so that the adjacent channel
power ratio is gained.
5.17.4 [Chanel Power On Off]
Turn on or off channe l power meas urements. Pres s 【Meas Setup】
to pop up the channel power measure me nt par ameter settings soft
menu. The channel power is used to measure the transmitter
channel power, according to the user set the channel bandwidth,
through the linear power integration method to obtain the absolute
value of the main channel power .
5.17.5 [OBW On Off]
Turn on or off the occupied bandwidth measurement. Press
【Meas Setup】 to pop up the parameter setting soft menu for
occupying the bandwidth me asurement. Occupied Bandwidth is a
measure of the bandwidth occupied by the transmitter sign al c an
be measured from the total power r atio within the in-band power
span, with a default value of 99% ( t he user c an set this value).
5.17.6 [Pass-Fail►]
Enter the pass / fail measur ement function soft menu. Pass / fail
52
Page 58

measurement has two modes of window measur ement and area
measurement.
5.17.7 [Window Meas►]
Enter Window measurement soft menu.
5.17.8 [Window Meas On Off]
Turn on or off window measurement mode.
5.17.9 [Amplitude Line On Off]
Turns the amplitude line on or of f, and the amplitude line turns on
when the window measur em ent is on.
5.17.10 [Frequency Line On Off]
Turns the frequency line on or of f, and the frequency line turns on
when the window measur em ent is on.
5.17.11 [Amplitude Upper limit Lower limit]
Used to edit the upper and lower limit on the amplitude line.
5.17.12 [Freq Star t Stop]
Start and stop frequencies for scanning line for editing.
5.17.13 [Window Scan On Off]
Turns window scan on or off. When the wind ow scan is on, only the
window formed by the intersec t io n of t he amplitude line and the
53
Page 59

frequency line is scanned. The peripheral stops scanning; the full
frequency is scanned whe n it is cl osed.
5.17.14 [Limit Meas►]
Enter the soft menu of the area m easurement mode.
5.17.15 [Limit Meas On Off]
Turn On or Off area measurement mode.
5.17.16 [Line Up On Off]
When the upper limit line is tur ned on or off, the upper limit line is
opened by default when the area measurement is on.
5.17.17 [Line Low On Off]
When the lower limit line is t ur ned on or off, the lower limit line is
opened by default when the area measurement is on.
5.17.18 [Shift X/Y Frequency Amplitude]
Frequency: For the actual measurement, the edited area as a
whole superimposed on a freq uency, so that it can implement left
or right shift, easy to meas ure. Does not affect the frequency and
marker of the spectrum an alyzer settings.
Amplitude: The region has been edited on the whole
superimposed on a degree, so that it can move up or down, easy
to measure. Does not affect the amplitude setting of the spectr um
analyzer.
5.17.19 [UpLine Edit►]
Upper line editing is used t o edit t he c ont r ol line above the trace,
depending on the trace.
54
Page 60

5.17.20 [LowLine Edit►]
Lower line editing is used to edit t he cont r ol line above the trace,
depending on the trace.
5.18 【Meas Setup】
Measurement setting men u for t he cor r esponding measurement
parameter settings when adj ac ent channel power, channel power,
occupied bandwidth measurement mode is turned on.
5.18.1 [Channel BW]
Set the bandwidth of the chann el power measurement, and set t he
total display power percen t age of b andwidth.
5.18.2 [Channel Interval]
Set the center frequency di ffer ence of the primary channel to the
adjacent channel.
5.18.3 [Channel Nums
Set the number of upper and lower adjacent channels measured
by adjacent channel powe r .
5.18.4 [Power Percent]
Set the power ratio of occupi ed bandwidth.
55
Page 61

5.19 【System】
A soft menu for system pa ram eter settings pops up. Including
[System Info ►], [Configure I / O ►], [Power On / Reset ►], [Local
Language ►], [Date / Time ►], [User Calibration ►], [System
Service ►]. For first time you use the spectrum analyzer, set the
date and time, the system will store the settings, restart the
machine after power off won’t change the settings.
5.19.1 [System►]
Pop up system information and system log soft menu.
1) [System Information]
2) [System Log]
5.19.2 [Config I/O►]
A so ft menu for setting the interface address of the spectrum
analyzer, including [Network ►]. The spectrum analyzer supports
VGA, LAN and USB interface c ommunication.
1. [LAN►]
Pop out the relative menu for netw ork configuring.
1.1 [IP]
Used to set the IP address of the LAN port.
1.2 [Mask]
Set the subnet mask parameter.
1.3 [Gate]
Set default gateway addre ss .
1.4 [Reset Lan]
To reset the LAN.
56
Page 62

Parameter
Value
Frequency
Center Frequency
750.009000MHz
Start Frequency
9.000kHz
Stop Frequency
1.500009000GHz
Frequency Step
150.000000MHz
Frequency Offset
0Hz
Frequency
Reference
Internal
SPAN
Sweep
1.500000000GHz
AMPTD
Reference Level
0.00dBm
Attenuator
Auto 9 dB
Scale/div
10.00dB
Scale Type
Log Reference Offset
0.00dB
Unit dBm
Preamp
Off
BW
Resolution
Bandwidth
Auto 3MHz
5.19.3 [PowerOn/Preset►]
Used to set the analyzer power on parameters or reset
parameters.
1. [Power Set►]
Power-on parameter settings include [Factory] and [ User] .
2. [Preset►]
Power-on parameter settings include [Factory] and [ User] .
Note: To save the current system configuration as a user-defined
configuration, press the [Save] panel key and select the [User
Status] menu item.
Table 5-2 [Factory] Settings
57
Page 63

Resolution Step
Default
Video Bandwidth
Auto 3MHz
Trace Average
Off
Detector
Detect Type
Auto
Sweep
Sweep Time
Auto 20.000ms
Sweep Term
Continuous Sweep
Source
Tracking Source
Off
Network
Measurement
Off
Trace
Trace
1
Trace Type
Clear Write
Trace 1 Math
1<- ->2
Display
Full Display
Off
Window Zoom
Off
Display Line
Off
Amplitude Scale
Off
Grid
Off
Display Style
Default
Label
On
Trig
Trigger Type
Auto
Demod
Audio Demod
Digital De mo d
Peak
Peak Search
Off
Marker Fctn
NdB
Off
58
Page 64

Marker Noise
Off Frequency Count
Off
Marker
Marker
1 Trace
1
Marker List
Off
Meas
Time Spectrum
Off
Adjacent Power
Off
Channel Power
Off
Occupied
Bandwidth
Off
pass-fail
Off
Meas Setup
Channel Bandwidth
1.000000MHz
Channel Gap
2.000000MHz
Adjacent Number
3
Occupied
Bandwidth
0.99
System
Interface
LAN
IP Address
192.168.1.168
Subnet Mask
255.255.255.0
Gateway
192.168.1.1
Local Language
German
Date/Time
On
Print
Paper Size
A4
Print Language
PCL
Print Type
Black / White
Direction
Horizontal
Copy
1
59
Page 65

5.19.4 [Language►]
To set the system language, in German by default.
5.19.5 [Date/Time►]
Used to set the device date, t ime, and their format.
[Date/Time On Off]
Turn on or off Date/Time display .
[Format►]
Time format can be displa yed as
[Year,Month,Day,Hour,Minute,Second] or
[Hour,Minute,Second,Year,Month,Day].
[Date Set]
Set the display date for spect rum analyzer. Format is
YYYMMDD. E.g. June 22th,2012 should display as 20120622.
[Time Set]
Set the display time for spect r um analyzer. Format is HHMMSS.
E.g. 16:55:30 should display as 165530.
5.19.6 [Calibration►]
Pop up user calibration soft menu including [Start Calibration] and
[Restore Factory].
[Calibration]: Set the signal generator frequency as 440MHz,
power as -20dBm, access to RF instrument RF input, press the
[Start Calibration] softkey, start the implementation of user
calibration.
[Factory]: If you do not need the user calibration compensation
data, press the [Restore F actory ] key to clear the data and r eturn t o
the factory status.
5.19.7 [Service►]
For spectrum analyz er debugging.
60
Page 66

5.20 【File】
Pop up file management soft menu.
5.20.1 [Refresh]
In the directory state, view the latest stored files.
5.20.2 [Type►]
To check file type under directory, includes screen image, trace
data and display all.
5.20.3 [First Page]
Display first page of curre nt directory.
5.20.4 [Prev Page]
Display Previous page.
5.20.5 [Next Page]
Display next page.
5.20.6 [Last Page]
Display last page of curre nt direc t or y.
5.20.7 [Operations►]
Pop out the soft menu for file operation, includes sorting order,
delete, export and import.
5.21 【Print】
Pop out the relative soft menu for printing.
61
Page 67

5.21.1 [Paper Size]
Used to select the size of the paper to be printed, includ ing A4, A3,
B5, C5, Letter.
5.21.2 [Language Pcl Esc]
Used to select the printer langu age, optional for Pcl and Esc.
5.21.3 [Printer Type Black/White Color]
Use to switch from Black/ Whit e print to Color print.
5.21.4 [Orientation Horizontal Vertical]
For the horizontal and ver t ica l pl acement switch.
5.21.5 [Number]
To set the print copies.
5.21.6 [Print Trace]
Prints the current trace.
5.21.7 [Print Screen]
Print the full screen conte nt.
5.22 【Save】
It’s available to save screenshot, trace data, or user status .
5.22.1 [Screen Pixmap►]
Enter screenshot save sof t menu, you can choose to save
screenshots to local or fla sh m emory, the image file format is bmp,
the lower left corner of the scr een stat us d isplay bar will display the
saved screenshots information.
5.22.2 [Trace Data►]
62
Page 68

Enter the trace data save soft menu, you can choose to save t he
trace data to the local or flash memory, t race data file format is csv ,
the bottom left corner of th e screen statu s display trace data saving
information.
5.22.3 [User State]
Save the current system conf ig ur at ion as a user self-defined
configuration. Save it in lo cal. The information on saving the user
status will display in the stat us bar of the bottom left corner of the
screen.
63
Page 69

Frequency
DSA-115
9 kHz to 1.5 GHz
DSA-136
9 kHz to 3.6 GHz
Frequency Span
0 Hz, 100 Hz to max frequency of
Sp an Uncertainty
± span / (sweep points-1)
Internal Frequency Reference
Reference
Frequency
equency Accuracy
±[ (days since last calibrate × freq aging
accuracy ]
6. Specification
This chapter lists the tech nical specifications and general tec hnical
specifications of the spectrum analyzer. Unless othe r w ise st at ed,
the technical specificatio ns apply to the following conditions :
The instrument has been preheated for 30 minutes before use.
The instrument is in the calibrat i on cycle and has been
self-calibrated.
"Typical" and "nominal" fo r t his pr oduct ar e defined as follows
Typical: Refers to the per f or m ance of the product under certain
conditions.
Nominal: Refers to the approximate value under product
application process.
6.1 Frequency
Frequency Range
Frequency
Resolution
Sp an Range
Reference
Fr
Temperature
stability
1 Hz
instrument
10.000000 MHz
rate) + temperature stability + initial
<2.5ppm (15℃ to 35℃)
64
Page 70

Aging rate
<1ppm/year
100 kHz
< -100 dBc/Hz
1 MHz
< -110 dBc/Hz
Bandwidth
Resolution
10Hz to 500kHz (1-10 steps by sequen ce),
1MHz, 3MHz
Resolution Filter
dB : 3 dB)
1 typical (digital and close to G aussian
(VBW)
Amplitude and level
SSB Phase Noise (20℃ to 30℃, fc=1 GHz)
< -82 dBc/Hz
Carrier Offset
10 kHz
Bandwidth
RBW Accuracy < 5%, typical (RBW ≤ 1MHz)
Shape Factor (60
Video Bandwidth
<5:
shape)
10Hz to 3MHz
6.2 Amplitude
DANL to +10 dBm, 100 kHz to 1 MHz,
Amplitude
measurement range
Preamp Off
DANL to +20 dBm, 1 MHz t o1. 5 G Hz,
Preamp Off
Reference Level -80 dBm to +30 dB m, 0.1dB by step
Preamp 20 dB, nominal, 9 kHz to 1.5 GHz
Input Attenuator
Range
Max Input DC
Voltage
0 to 39 dB, in 3 dB step
50 VDC
65
Page 71

Max continuous
power
(Input Attenuation= 0 d B, RB W=1Hz and R BW nor malizes t o 1Hz)
1 MHz to 10 MHz
-130 dBm (Typical)
10 MHz to 1 GHz
-130 dBm (Typical)
1 GHz to 1.5 GHz
-128 dBm (Typical)
1 MHz to 10 MHz
-150 dBm (Typical)
10 MHz to 1 GHz
-150 dBm (Typical)
1 GHz to 1.5 GHz
-148 dBm (Typical)
Frequency response
Preamp Off
±0.8 dB;±0.4 dB (Typical)
Preamp On
±0.9 dB;±0.5 dB (Typical)
Difference and Accuracy
±0.5 dB
±0.4 dB, input signal level
-40 dBm
+30dBm, average continuous power
Display Average Noise Le vel
Preamp Off
Preamp On
(20℃ to 30℃, 30% to 70% relative humidity, input
attenuation=21 dB, refer ence frequency=50 MHz)
RBW Switch
Difference
Input Attenuation
Difference
RBW=10kHz
Log resolution=±0.2 dB, Li n
resolution=±0.01. No minal
20℃ ~30℃
, fc=50 MHz, Preamplifier Off,
21 dB RF attenuation, input signal 0~39 dB
20℃ to 30℃, fc=50 MHz, RB W=1 kHz ,
VBW=1 kHz, peak detector, 21 dB RF
attenuation
Absolute Amplitude
Accuracy
Preamp Off
Preamp On
-20 dBm
±0.5 dB, input signal level
66
Page 72

Uncertainty
Input signal range 0 dBm to -50 dBm
±1.5 dB
Input 9dB RF attenuation, 1MHz to 3.6GHz
<1.5, Nominal
Distortion and spurious response
distortion
fc ≥ 50 MHz, Preamp off, signal input -30
dBm, 0 dB RF attenuation, 20℃ to 30
-65 dBc
fc ≥ 50 MHz, Input double tone level -20 dBm,
0 dB, preamplifier off, 20℃ to 30
+10 dBm
fc ≥ 50 MHz, 0 dB RF attenuation, Preamp
off , 20℃ to 30
>+2 dBm, nominal
connect 50 Ω load at input port, 0 dB input
attenuation, 20℃ to 30
<-85 dBm, typical
-30 dBm signal at input mixer, 20℃ to 30
<-60 dBc
Sweep
Zero Span
Sweep Mode
Continuous, Sing le
VSWR
Second
harmonic
℃
Third-order
frequency interval 100 kHz, input attenuation
intermodulation
1 dB Gain
Compression
℃
Residual
response
Input related
spurious
6.3 Sweep
None-zero Span 10 ms to 3000 s
Sweep Time
6.4 Tracking Generator
Tracking Source Output
Frequency Range 100 kHz to 1.5 GHz
℃
℃
℃
1 ms to 3000 s
67
Page 73

Output power level
range
resolution
Output flatness
± 3 dB
Demodulation
Frequency
Range
Demodulation
Type
Frequency
Range
1Hz, nominal
(Modulation rate ≥ 1kHz)
Depth
5% to 95%
Depth Accuracy
±4%, nominal
Range
Modulation rate
20Hz to 100kHz
-30 dBm to 0 dBm
Output power level
Maximum safe
reverse level
6.5 Demodulation
Audio
Demodulation
Modulation rate 20Hz to 100kHz
AM
Measurement
Modulation Rate
Accuracy
1 dB
Average total power: 30 dBm, DC : ±50
VDC
100 kHz to 1.5 GHz
FM/AM/USB/LSB
10MHz to 1.5GHz
(Modulation rate < 1kHz)
<0.1% modulation rate, nominal
FM
Measurement
Frequency
10MHz to 1.5GHz
68
Page 74

Deviation
20Hz to 200kHz
Deviation
Accuracy
Frequency Counter
RF Input
Impedance
50 Ω, typical
Connector
N Type Female
Tracking Generator Output
Impedance
50 Ω, typical
Connector
N Type Female
10MHz Reference Input
Connector
BNC female
Modulation Rate
Accuracy
1Hz, nominal
(Modulation rate < 1kHz)
<0.1% modulation rate, nominal
(Modulation rate ≥ 1kHz)
±4%, nominal
6.6 Frequency Counter
Resolution 1Hz, 10Hz, 100Hz, 1kHz
Accuracy
±(frequency indication × frequency
reference accuracy + counter resolution)
6.7 Inputs and Outputs
10MHz Reference
Amplitude
0 dBm to +10 dBm
69
Page 75

USB
USB Host
Connector
B Plug
VGA
Display
Type
TFT LCD
Resolution
800*600
Remote Control
USB
USB TMC
LAN
10/100 Base, RJ-45
Mass Memory
Mass Memory
256M Bytes
Temperature
Protocol USB 1.1 (Host End)
USB Device
Connector A Plug
Protocol 2.0 Version
Connector 15-pins D-SUB(female)
Resolution 800*600, 60 Hz
6.8 General Specificatio n
Size 10.4 inches
Color 65536
Operating
Temperature Range
Internal Storage
0 ℃ to 40 ℃
70
Page 76

Storage
Appearance
421 mm (Width)×221 mm (Height)×115 mm
(Depth)
Temperature Range
-20 ℃ to 60 ℃
Dimensions
Weight Approx. 5.0 kg (without package)
71
Page 77

7. Warranty
7.1 Troubleshooting
Ty pical issues that may occur when using your spectrum analyzer:
Power on malfunction
No signal displa y
Wrong measurement results or poor frequency or amplitude
precision.
1. Power on malfunction
Power on malfunction can incl ude a situation where the screen is
still dark (no display) after switch on.
If the screen is still dark after pow er on, please check:
1) If the power supply has been connected correctly and it the
power supply voltage range is w it hi n t he specification.
2) If the power switch has been t ur ned on.
3) If the fan is running, please co nt act us for service.
2. No signal display
If there is no signal display at any wave band. Please try the
following: set a signal generat or at 30 M Hz frequenc y and -20 dBm
power and connect it to the spect r um analyzer RF input connector .
If there is still no signal dis play , there may be a problem with the
spectrum analyzer hardw ar e circuit. Please contact us for service.
3. Wrong measurement results or poor signal frequency
precision
If the display contents shak es a lot or t he frequency readout
exceeds the error range during measurements, check if the signal
source is stable. If so, check if spec t r um analyzer reference is
precise. Select internal or external frequency referenc e according
to measurement condit ions: pr ess 【FREQ】
Internal External].If the frequency is still not precise, t hen t he
spectrum analyzer LO has lost it s phase loc k, ple ase contact us for
service.
→[frequency reference
72
Page 78

!
CAUTION
The use of other materials to package the spectrum
analyzer may damage the instrument. Do not use
polystyrene pellets as packaging materials, they can not
adequately fit the instrument, and can be suc ked int o fan by
the generated electrostatic, causing the spectrum analyzer
damage.
4. Wrong measurement results or poor readout amplitude
precision
If signal amplitude readout is not precise, perform a calibration. I f
amplitude readout is st ill not precise, then it may be a prob lem with
internal circuit, please con tact us for service.
7.2 Spectrum Analyzer Repair
When it is difficult to solve your spectrum analyzer’s proble m, you
can contact us by phone or fax. When it’s confirmed that the
instrument is damaged a n d need r eturn t o repa ir, y ou need to w rap
the spectrum with the original packaging material and t he packing
box, follow the steps below t o package:
1) Write a detailed description of the mal function of the spectrum
analyzer, put it in the box toget her w it h t he spectrum analyzer.
2) Put the instrument in a dustproof / antist atic plastic bag to
reduce possible damage.
3) Place pads in four corners of mother pac kaging carton, then
put the instrument into the mother carton.
4) Seal the carton with tape and tighte n it with nylon tape.
5) Mark the carton with words of "Fragile! Do not touch!
Carefully".
6) Ship by type of precise instruments .
7) Keep all the copies of shipping sheet s.
73
Page 79

Standard Accesso r ies
!
WARNING
Before re applying power, ensure that the instrument is
completely dry, avoiding any e
short circuit resulting from moisture.
8. Appendix
Appendix A: Enclosure
(The accessories subject to final delivery.)
Power Cord
CD Rom
Safety hintsheet
USB Cable
Appendix B: General Care and Cleaning
General Care
Do not store or leave the instru ment where t he liquid cryst al display
could be exposed to direct sunl ight f or lo ng periods of time.
Caution: To avoid any damage to the instrum ent or probes, do not
exposed it to any sprays, liquids, or solvents.
Cleaning
Inspect the instrument and probes as often as oper at ing conditions
require.
To clean the instrument e xterior, perform the following steps:
Wipe the dust from the instrument surface with a soft cloth. Take
care not to scratch the transparent LCD protection screen when
cleaning.
lectric shock or electrical
74
 Loading...