

Page 1

vRealize Operations Manager User
Guide
vRealize Operations Manager 6.4
Page 2

vRealize Operations Manager User Guide
You can find the most up-to-date technical documentation on the VMware Web site at:
hps://docs.vmware.com/
The VMware Web site also provides the latest product updates.
If you have comments about this documentation, submit your feedback to:
docfeedback@vmware.com
Copyright © 2017 VMware, Inc. All rights reserved. Copyright and trademark information.
VMware, Inc.
3401 Hillview Ave.
Palo Alto, CA 94304
www.vmware.com
2 VMware, Inc.
Page 3

Contents
About This User Guide 5
Monitoring Objects in Your Managed Environment by Using
1
vRealize Operations Manager 7
What to Do When... 7
User Scenario: A User Calls With a Problem 8
User Scenario: An Alert Arrives in Your Inbox 12
User Scenario: You See Problems as You Monitor the State of Your Objects 19
Monitoring and Responding to Alerts 32
Monitoring Alerts in vRealize Operations Manager 32
Monitoring and Responding to Problems 36
Evaluating Object Summary Information 37
Investigating Object Alerts 40
Evaluating Metric Information 43
Analyzing the Resources in Your Environment 49
Using Troubleshooting Tools to Resolve Problems 49
Creating and Using Object Details 50
Examining Relationships in Your Environment 55
User Scenario: Investigate the Root Cause of a Problem by Using the Troubleshooting Tab
Options 56
Running Actions from vRealize Operations Manager 59
List of vRealize Operations Manager Actions 60
Working With Actions That Use Power O Allowed 61
Actions Supported for Automation 64
Integration of Actions with vRealize Automation 65
Run Actions From Toolbars in vRealize Operations Manager 66
Troubleshoot Actions in vRealize Operations Manager 67
Monitor Recent Task Status 69
Troubleshoot Failed Tasks 70
Viewing Your Inventory 76
VMware, Inc.
Planning the Capacity for Your Managed Environment Using
2
vRealize Operations Manager 77
Right-Sizing Capacity for Stress-Free Demand and Value 80
User Scenario: Planning Capacity for an Increase in Workload 84
Create a Sample Project to Increase Workload Capacity 84
Create a Sample Project to Add a Host and Virtual Machines 85
View the Result of Your Capacity Projects 86
Planning Hardware Projects in vRealize Operations Manager 87
Create a Project to Plan for Hardware Changes 87
Planning Virtual Machine Projects and Scenarios 88
Create a Virtual Machine Project Using Populated Metrics 88
3
Page 4

vRealize Operations Manager User Guide
Create a Sample Project for a New Virtual Machine 89
Create a Sample Project to Simulate Removing a Virtual Machine 90
Custom Proles in VMware vRealize Operations Manager 91
Custom Datacenters in VMware vRealize Operations Manager 91
Index 93
4 VMware, Inc.
Page 5

About This User Guide
The VMware® vRealize Operations Manager User Guide describes what to do when users experience
performance problems in your managed environment.
As a system administrator, you might become aware of a problem with an object in your environment when
vRealize Operations Manager generates an alert, or when a user contacts you. To help ensure optimal
performance, this information describes how you use vRealize Operations Manager to monitor,
troubleshoot, and take action to address problems. It also provides information on how to assess whether
problems due to over demand or lack of capacity require a system change or upgrade.
Intended Audience
This information is intended for vRealize Operations Manager administrators, virtual infrastructure
administrators, and operations engineers who track and maintain object performance in your managed
environment.
VMware Technical Publications Glossary
VMware Technical Publications provides a glossary of terms that might be unfamiliar to you. For denitions
of terms as they are used in VMware technical documentation, go to
hp://www.vmware.com/support/pubs.
VMware, Inc.
5
Page 6

vRealize Operations Manager User Guide
6 VMware, Inc.
Page 7

Monitoring Objects in Your Managed
Environment by Using
vRealize Operations Manager 1
You can use vRealize Operations Manager to resolve problems that your customers raise, respond to alerts
that identify problems before your customers report problems, and generally monitor your environment for
problems.
When your customers experience performance problems and call you to resolve the problem, the data that
vRealize Operations Manager collects and analyzes is presented to you in graphical forms so that you can
compare and contrast objects, understand the relationship between objects, and determine the root cause of
problems.
To manage your environment as a proactive rather than reactive administrator, you monitor and respond to
alerts. A generated alert noties you when objects in your environment are experiencing problems. If you
resolve the problem based on the alert before your customers notice, then you avoid service interruptions.
You can investigate the problems that generate alerts or that result in calls by using the Analysis,
Troubleshooting, Details, and Environment tabs.
If you nd the root cause of the problem, you might be able to resolve the problem by running an action.
The actions make changes to objects in the target system, for example, the VMware vCenter Server® system,
from vRealize Operations Manager.
This chapter includes the following topics:
“What to Do When...,” on page 7
n
“Monitoring and Responding to Alerts,” on page 32
n
“Monitoring and Responding to Problems,” on page 36
n
“Running Actions from vRealize Operations Manager,” on page 59
n
“Viewing Your Inventory,” on page 76
n
What to Do When...
As a virtual infrastructure administrator, network operations center engineer, or other IT professional, you
use vRealize Operations Manager to monitor objects in your environment so that you can ensure service to
your customers and resolve any problems that occur.
Your vRealize Operations Manager administrator has congured vRealize Operations Manager to manage
two vCenter Server instances that manage multiple hosts and virtual machines. It is your rst day using
vRealize Operations Manager to manage your environment.
User Scenario: A User Calls With a Problem on page 8
n
The vice president of sales telephones the help desk reporting that her virtual machine, VPSALES4632,
is running slow. She is working on sales reports for an upcoming meeting and is running behind
schedule because of the slow performance of her virtual machine.
VMware, Inc.
7
Page 8

vRealize Operations Manager User Guide
User Scenario: An Alert Arrives in Your Inbox on page 12
n
You return from lunch to nd an alert notication in your inbox. You can use
vRealize Operations Manager to investigate and resolve the alert.
User Scenario: You See Problems as You Monitor the State of Your Objects on page 19
n
As you investigate your objects in the context of this scenario, vRealize Operations Manager provides
details to help you resolve the problems. You analyze the state of your environment, examine current
problems, investigate solutions, and take action to resolve the problems.
User Scenario: A User Calls With a Problem
The vice president of sales telephones the help desk reporting that her virtual machine, VPSALES4632, is
running slow. She is working on sales reports for an upcoming meeting and is running behind schedule
because of the slow performance of her virtual machine.
As a network operations engineer, you were just reviewing the morning alerts and did not see any problems
with her virtual machine, so you begin troubleshooting the problem.
Procedure
1 Search for a Specic Object on page 8
As a network operations engineer, you must locate the customer's virtual machine in
vRealize Operations Manager so that you can begin troubleshooting the reported problem.
2 Review Alerts Related to Reported Problems on page 9
To determine if the virtual machine about which the vice president of sales reported problems has
alerts that indicate the cause of the problem, you review the alerts in vRealize Operations Manager for
the object.
3 Use the Troubleshooting Tab Options to Investigate a Reported Problem on page 10
To troubleshoot problems with the VPSALES4632 virtual machine, you evaluate the symptoms,
examine time line information, consider events, and create metric charts to nd the root cause of the
problem.
Search for a Specific Object
As a network operations engineer, you must locate the customer's virtual machine in
vRealize Operations Manager so that you can begin troubleshooting the reported problem.
You use vRealize Operations Manager to monitor three vCenter Server instances with a total of 360 hosts
and 18,000 virtual machines. The easiest way to locate a particular virtual machine is to search for it.
Procedure
1 In the Search text box, located on the vRealize Operations Manager title bar, type the name of the
virtual machine.
The Search text box displays all the objects that contain the string you type in the text box. If your
customer knows that her virtual machine name contains SALES, you can type the string and the virtual
machine is included in the list.
2 Select the object in the list.
The left pane displays the object name and the related objects, including the host system and vCenter Server
instance. The main pane displays the Summary tab.
What to do next
Look for alerts related to the reported problem for the object. See “Review Alerts Related to Reported
Problems,” on page 9.
8 VMware, Inc.
Page 9

Chapter 1 Monitoring Objects in Your Managed Environment by Using vRealize Operations Manager
Review Alerts Related to Reported Problems
To determine if the virtual machine about which the vice president of sales reported problems has alerts that
indicate the cause of the problem, you review the alerts in vRealize Operations Manager for the object.
Alerts on an object give you an insight into problems other than the one that the object user reports.
Prerequisites
Locate the customer's virtual machine so that you can review related alerts. See “Search for a Specic
Object,” on page 8.
Procedure
1 Click the Summary tab for the problematic object.
The Summary tab displays active alerts for the object and for any descendant objects that are classied
at the top alerts.
2 Review the top alerts for Health, Risk, and Eciency.
Top alerts are considered the primary contributors to the current state of the alert badges. Do any of
them appear to contribute to the slow response problem? For example, any ballooning or swapping
alerts, which indicates that you need to add memory to the virtual machine? Any alerts related to
memory contention, which indicates that you need to add memory to the host.
3 If the Summary tab does not include any top issues that appear to explain the reported problem, click
the Alerts tab.
The Alerts tab displays all active alerts for the current object.
4 Review the alerts for problems that are similar to or contribute to the reported problem.
a To view the active and cancelled alerts, click Status: Active to clear the lter and display active and
inactive alerts.
The cancelled alerts might provide information about the problem.
b Click the Created On column to sort the alerts so that you can locate alerts generated on or before
the time when your customer reported the problem.
c To view alerts for the ancestor objects in the same list with the alert for the virtual machine, click
the up arrow and select Host System and Cluster Compute Resources, if they are congured in
your environment.
Add these object types to the list so that you can determine if alerts among the parent objects are
contributing to the reported problem.
5 If you locate an alert that appears to explain the reported problem, click the alert name in the alerts list.
6 On the alert details Summary tab, review the triggered symptoms and recommendations to determine
if the alert indicates the root cause of the reported problem.
What to do next
If the alert appears to indicate the source of the problem, follow the recommendations and verify the
n
resolution with your customer. For an example, see “Run a Recommendation On a Datastore to Resolve
an Alert,” on page 18.
If you cannot locate the cause of the reported problem among the alerts, begin more in-depth
n
troubleshooting. See “Use the Troubleshooting Tab Options to Investigate a Reported Problem,” on
page 10.
VMware, Inc. 9
Page 10

vRealize Operations Manager User Guide
Use the Troubleshooting Tab Options to Investigate a Reported Problem
To troubleshoot problems with the VPSALES4632 virtual machine, you evaluate the symptoms, examine
time line information, consider events, and create metric charts to nd the root cause of the problem.
If a review of the alerts did not help you identify the cause of the problem reported for the virtual machine,
use the Troubleshooting tabs, Symptoms, Timeline, Events, and All Metrics, to troubleshoot the history and
current state of the virtual machine.
Prerequisites
Locate the object for which the problem was reported. See “Search for a Specic Object,” on page 8.
n
Review the alerts for the virtual machine to determine if the problem is already identied and
n
recommendations made. See “Review Alerts Related to Reported Problems,” on page 9.
Procedure
1 If you are viewing the Alert Details tabs, click Virtual Machine in the left pane and select
VPSALES4632 in the lower list.
The main pane updates to the display the object Summary tab.
2 Click the Troubleshooting tab, click the Symptoms tab, and review the symptoms to determine if one
of the symptoms is related to the reported problem.
Depending on how your alerts are congured, some symptoms might be triggered but not sucient to
generate an alert.
a Review symptom names to determine if one or more symptoms are related to the reported
problem.
The Information column provides the triggering condition, trend, and current value. What are the
most common symptoms that aect response time? Do you see any symptoms related to CPU or
memory usage?
b Sort by the Created On date so that you can focus on the time frame in which your customer
reported that the problem.
c Click the Status: Active lter buon to disable the lter so that you can review active and inactive
symptoms.
Based on symptoms, you think the problem is related to CPU or memory use. But you do not know if
the problem is with the virtual machine or with the host.
3 Click the Timeline tab and review the alerts, symptoms, and change events over time that might help
you identify common trends that are contributing to the reported problem.
a To determine if other virtual machines had symptoms triggered and alerts generated at the same
time as your reported problem, click Show Peer Events.
Other virtual machine alerts are added to the time line. If you see that multiple virtual machines
triggered symptoms in the same time frame, then you can investigate ancestor objects.
b Click the Show Ancestor Events and select Host System.
The alerts and symptoms that are associated with the host on which the virtual machine is
deployed are added to the time line. Use the information to determine if a correlation exists
between the reported problem and the alerts on the host.
10 VMware, Inc.
Page 11

Chapter 1 Monitoring Objects in Your Managed Environment by Using vRealize Operations Manager
4 Click the Events tab to view changes in the collected metrics for the problematic virtual machine that
could direct you toward the cause of the reported problem.
a Use the Date Controls option view event for the approximate time when your customer reported
the problem.
b Click through the Workload, Capacity, and Stress badges to determine if any events are associated
with the problem.
c Click Zoom the View and zoom in on any events or event clusters that occurred at or before the
problem was reported.
d Click Show Data Values and place the cursor over an event to view the details about the event.
The events for the selected time also appear in the data grid below the event chart.
e In the left pane, click Host System, click the host name in the list on the lower left pane, and repeat
the analysis of the host using Workload, Capacity, and Stress.
Comparing events on the virtual machine and the host, and evaluating those results, indicates that CPU
or memory issues are the likely cause of the problem.
5 If you can identify that the problem is related to, for example, CPU or memory use, click the All Metrics
tab to create your own metric charts so that you can determine whether it is one or the other, or a
combination.
a If host is still the focus, then start by working with host metrics.
b In the metric list, double-click the CPU Usage (%) and the Memory Usage (%) metrics to add them
to the workspace on the right.
c In the map, click the VPSALES4632 object.
The metric list now displays the virtual machine metrics.
d In the metric list, double-click the CPU Usage (%) and the Memory Usage (%) metrics to add them
to the workspace on the right.
e Review the host and virtual machine charts to see if you can identify a paern that indicates the
cause of the reported problem.
In this scenario, comparing the four charts reveals that CPU use is normal on both the host and the
virtual machine, and the memory use is normal on the virtual machine. However, the memory use on
the host began going consistently high three days before the reported problem on the VPSALES4632
virtual machine.
The host memory is running consistently high, aecting the response time for the virtual machines. The
number of virtual machines it is running is well within the supported amounts. The possible cause might be
too many high process applications on the virtual machines. You can move some of the virtual machines to
other hosts, distribute the workload, or power o idle virtual machines.
What to do next
In this example, you can use vRealize Operations Manager to power o virtual machines on the host so
n
that you can improve the performance of the virtual machines that are in use. See “Run Actions From
Toolbars in vRealize Operations Manager,” on page 66.
If the combination of charts that you created on the All Metrics tab are something that you might want
n
to use again, click Generate Dashboard.
If you did not resolve the problem, continue your investigation.
n
VMware, Inc. 11
Page 12

vRealize Operations Manager User Guide
User Scenario: An Alert Arrives in Your Inbox
You return from lunch to nd an alert notication in your inbox. You can use vRealize Operations Manager
to investigate and resolve the alert.
As a network operations engineer, you are responsible for several hosts and their datastores and virtual
machines, and you receive emails when an alert is generated for your monitored objects. In addition to
alerting you to problems in your environment, alerts should provide viable recommendations to resolve
those problems. As you investigate this alert, you are evaluating the data to determine if one or more of the
recommendations can resolve the problem.
This scenario assumes that you congured the outbound alerts to send standard email using SMTP and that
you congured notications to send you alert notications using the standard email plug-in. When
outbound alerts and notications are congured, vRealize Operations Manager sends you messages when
an alert is generated so that you can begin responding to problems as quickly as possible.
Prerequisites
Verify that outbound alerts are congured for standard email alerts. See vRealize Operations Manager
n
Customization and Administration Guide.
Procedure
1 Respond to an Alert in Your Email on page 13
As a network operations engineer, you receive an email message from vRealize Operations Manager
with information about one of the data stores for which you are responsible. The email notication
informs you about the problem even when you are not presently working in
vRealize Operations Manager.
2 Evaluate Other Triggered Symptoms for the Aected Data Store on page 14
You determined that you need more information about the data store before you decide the best
response. As a network operations engineer, you examine the Impacted Object Symptoms tab to see
the other triggered symptoms for the data store.
3 Compare Alerts and Events Over Time in Response to a Datastore Alert on page 15
To evaluate an alert over time, compare the current alert and symptoms for the datastore to other
alerts and symptoms, other events, other objects, and over time.
4 View the Aected Datastore in Relation to Other Objects on page 16
To view the object for which the alert was generated as it relates to other objects, use the topological
map on the Relationships tab in vRealize Operations Manager to visualize the environment.
5 Construct Metric Charts to Investigate the Cause of the Data Store Alert on page 17
To analyze the capacity metrics related to the generated alert, you create charts in
vRealize Operations Manager that compare dierent metrics. These comparisons help identify when
something changed in your environment and what eect it had on the datastore.
6 Run a Recommendation On a Datastore to Resolve an Alert on page 18
As a network operations engineer, you investigated the alert regarding datastore disk space and
determined that the provided recommendations will resolve the problem, particularly the
recommendation to delete unused snapshots. You use vRealize Operations Manager to delete the
snapshots.
12 VMware, Inc.
Page 13

Chapter 1 Monitoring Objects in Your Managed Environment by Using vRealize Operations Manager
Respond to an Alert in Your Email
As a network operations engineer, you receive an email message from vRealize Operations Manager with
information about one of the data stores for which you are responsible. The email notication informs you
about the problem even when you are not presently working in vRealize Operations Manager.
In your email client, you receive an alert similar to the following message.
Alert was updated at Tue Jul 01 16:34:04 MDT :
Info:datastore1 Datastore is acting abnormally since Mon Jun 30 10:21:07 MDT and was last
updated at Tue Jul 01 16:34:04 MDT
Alert Definition Name: Datastore is running out of disk space
Alert Definition Description: Datastore is running out of disk space
Object Name : datastore1
Object Type : Datastore
Alert Impact: risk
Alert State : critical
Alert Type : Storage
Alert Sub-Type : Capacity
Object Health State: info
Object Risk State: critical
Object Efficiency State: info
Symptoms:
SYMPTOM SET - self
Symptom Name | Object Name | Object ID | Metric | Message Info
Datastore space usage reaching critical limit datastore1 | b0885859-
e0c5-4126-8eba-6a21c895fe1b | Capacity|Used Space | HT above 99.20800922575977 > 95
Recommendations:
- Storage VMotion some Virtual Machines to a different Datastore
- Delete unused snapshots of Virtual Machines
- Add more capacity to the Datastore
Notification Rule Name: All alerts -- datastores
Notification Rule Description:
Alert ID : a9d6cf35-a332-4028-90f0-d1876459032b
Operations Manager Server - 192.0.2.0
Alert details
Prerequisites
Verify that outbound alerts are congured for standard email alerts. See vRealize Operations Manager
n
Customization and Administration Guide.
Verify that the notications are congured to send messages to your users for the alert denition. For an
n
example of how to create an alert notication, see vRealize Operations Manager Customization and
Administration Guide.
Procedure
1 In your email client, review the message so that you understand the state of the aected objects and
determine if you must begin investigating immediately.
Look for the alert name, the alert state to determine the current level of criticality, and the aected
objects.
VMware, Inc. 13
Page 14

vRealize Operations Manager User Guide
2 In the email message, click Alert Details.
vRealize Operations Manager opens on the Summary tab in the alert details for the generated alert and
aected object.
3 Review the Summary tab information.
Option Evaluation Process
Alert name and
description
Recommendations Review the top recommendation, and if available, other recommendations, to
What is Causing the
Issue?
What to do next
If you determine that the recommendations will resolve the problem, implement them. See “Run a
n
Recommendation On a Datastore to Resolve an Alert,” on page 18.
Review the name and description and verify that you are evaluating the alert for which
you received an email message.
understand the steps that you must take to resolve the issue. If implemented, will the
prioritized recommendations resolve the problem?
Which symptoms were triggered? Which were not triggered? What aect does this
evaluation have on your investigation? In this example, the alert that the datastore is
running out of space is congured so that the criticality is symptom based. If you
received a critical alert, then it is likely that the symptoms are already at a critical level,
having moved up from Warning and Immediate. Look at the sparkline or metric graph
chart for each symptom to determine when the problem escalated on the datastore
object.
If you need more information about the aected objects, continue your investigation. Begin by looking
n
at other triggered symptoms for the data store. See “Evaluate Other Triggered Symptoms for the
Aected Data Store,” on page 14.
Evaluate Other Triggered Symptoms for the Affected Data Store
You determined that you need more information about the data store before you decide the best response.
As a network operations engineer, you examine the Impacted Object Symptoms tab to see the other
triggered symptoms for the data store.
If other symptoms are triggered for the object, not just the symptom included in the alert, you can evaluate
them to determine what aect these symptoms could have on the alert to which you are responding, and
whether the recommendations might resolve the problem.
Prerequisites
Verify that you are addressing the alert for which you received an alert message in your email. See
“Respond to an Alert in Your Email,” on page 13.
Procedure
1 In the left pane of vRealize Operations Manager, click the Alerts icon.
2 In any of the alert lists, click the alert name.
The center pane view changes to display the alert detail tabs.
3 Click the Impacted Object Symptoms tab and review the active symptoms.
Option Evaluation Process
Criticality Are other symptoms of similar criticality present that are aecting the object?
Symptom Are any of the triggered symptoms related to the symptoms that triggered the current alert?
Symptoms related to time remaining, capacity, or stress that could indicate storage problems?
14 VMware, Inc.
Page 15

Chapter 1 Monitoring Objects in Your Managed Environment by Using vRealize Operations Manager
Option Evaluation Process
Created On Do the date and time stamps for the symptoms indicate that they were triggered before the alert you
are investigating, indicating that it might be a related symptom? Were the symptoms triggered after
the alert was generated, indicating that the alert symptoms contributed to these other symptoms?
Information Can you identify a correlation between the alert symptoms and the other symptoms based on the
triggering metric values?
What to do next
If your review of the symptoms and the provided information clearly indicates that the
n
recommendations will solve the problem, implement one or more of the recommendations. For an
example, of implementing one of the recommendations, see “Run a Recommendation On a Datastore to
Resolve an Alert,” on page 18.
If your review of the symptoms did not convince you that the recommendations will resolve the
n
problem or provide you with enough information to identify the root cause, continue your investigation
using the Timeline tab. See “Compare Alerts and Events Over Time in Response to a Datastore Alert,”
on page 15.
Compare Alerts and Events Over Time in Response to a Datastore Alert
To evaluate an alert over time, compare the current alert and symptoms for the datastore to other alerts and
symptoms, other events, other objects, and over time.
As a network operations engineer, you use the Timeline tab to compare this alert to other alerts and events
in your environment so that you can determine if you can resolve the problem of the datastore running out
of disk space by applying one or more alert recommendations.
Prerequisites
Verify that you are addressing the alert for which you received an alert message in your email. See
“Respond to an Alert in Your Email,” on page 13.
Procedure
1 In the left pane of vRealize Operations Manager, click the Alerts icon.
2 Click the alert name link.
The center pane view changes to display the alert detail tabs.
3 Click the Timeline tab.
The Timeline tab displays the generated alert and the triggered symptoms for the aected object in a
scrollable timeline format, starting when the alert was generated.
4 To determine if other alerts are generated for the object, click the other alert buons.
In this example, the datastore alert generated a Risk alert, so the other alerts to add to the timeline are
Health and Eciency. Scroll through the timeline using the week timeline at the boom.
5 To view events that might contribute to the alert, click Select Event Type and click the check box for
each event type.
Events related to the object are added to the timeline. You add the events to your evaluation of the
current state of the object and whether the recommendations can resolve the problem.
6 Click Show Ancestor Events and select Host.
Because the alert is related to disk space, adding the host to the timeline allows you to see what alerts
and symptoms are generated for the host. As you scroll through the timeline, when did some of the
related alerts begin? When are they no longer on the timeline? What was the eect on the state of the
datastore object?
VMware, Inc. 15
Page 16

vRealize Operations Manager User Guide
7 Click Show Peer Events.
If other datastores have alerts related to the alert you are currently investigating, seeing when the alerts
for the other datastores were generated can help you determine what resource problems you are
experiencing in your environment.
8 To remove canceled alerts from your timeline, click Select Status and deselect the Canceled check box.
Removing the canceled alerts and symptoms from the timeline clears the view and allows you to focus
on current alerts.
What to do next
If your evaluation of alert in the timeline provided enough information to indicate that one or more of
n
the recommendations to resolve the alert are valid, implement the recommendations. See “Run a
Recommendation On a Datastore to Resolve an Alert,” on page 18.
If you need more information about the aected object, continue your investigation. See “View the
n
Aected Datastore in Relation to Other Objects,” on page 16.
View the Affected Datastore in Relation to Other Objects
To view the object for which the alert was generated as it relates to other objects, use the topological map on
the Relationships tab in vRealize Operations Manager to visualize the environment.
As a network operations engineer, you view a datastore and the related objects in a map to further your
understanding of the problem, and to determine if implementing the alert recommendations will resolve the
problem that the alert identies.
Prerequisites
Evaluate the alert over time and in comparison to related objects. See “Compare Alerts and Events Over
Time in Response to a Datastore Alert,” on page 15.
Procedure
1 In the left pane of vRealize Operations Manager, click the Alerts icon.
2 Click the alert name link.
The center pane view changes to display the alert detail tabs.
3 Click the Relationships tab.
The Relationships tab displays the datastore in a map with the related objects. By default, the badge
that this alert aects is selected only on the toolbar, and objects in the tree show a colored square to
indicate the current state of the badge.
4 To view the alert status of the objects for the other badges, click the Health buon and then the
buon.
As you click each badge buon, the squares on each object indicate whether an alert is generated and
the criticality of the alert.
5 To view alerts for an object, select the object and click Show alerts.
The alert list dialog box appears, allowing you to search and sort for alerts for the object.
6 To view a list of the child objects for an object in the map, click the object.
A list of the number of children by object type appears at the boom of the center pane.
16 VMware, Inc.
Page 17

Chapter 1 Monitoring Objects in Your Managed Environment by Using vRealize Operations Manager
7 Use the options to evaluate the datastore.
For example, what does the map tell you about the number of virtual machines that are associated with
the datastore? If many virtual machines are associated with a datastore, moving them might free
datastore disk space.
What to do next
If your review of the map provided enough information to indicate that one or more of the
n
recommendations to resolve the alert are valid, implement the recommendations. See “Run a
Recommendation On a Datastore to Resolve an Alert,” on page 18.
If you need more information about the aected object, continue your investigation. See “Construct
n
Metric Charts to Investigate the Cause of the Data Store Alert,” on page 17.
Construct Metric Charts to Investigate the Cause of the Data Store Alert
To analyze the capacity metrics related to the generated alert, you create charts in
vRealize Operations Manager that compare dierent metrics. These comparisons help identify when
something changed in your environment and what eect it had on the datastore.
As a network operations engineer, you create custom charts so that you can further investigate the problem,
and to determine if implementing the alert recommendations will resolve the problem that the alert
identies.
Prerequisites
View the topological map for the data store to determine if related objects are contributing to the alert or if
triggering symptoms indicate that the data store is contributing to other problems in your environment. See
“View the Aected Datastore in Relation to Other Objects,” on page 16.
Procedure
1 In the left pane of vRealize Operations Manager, click the Alerts icon.
2 Click the alert name link.
The center pane view changes to display the alert detail tabs.
3 Click the Metric Charts tab.
The Metric Charts tab does not include charts. You must add the charts to compare.
4 To analyze the rst recommendation, Add more capacity to the Datastore Storage, add related charts to
the workspace.
a Enter capacity in the metric list search text box.
The list displays metrics that contain the search term.
b Double-click the following metrics to add the following charts to the workspace:
Capacity | Used Space (GB)
n
Disk Space | Capacity (GB)
n
Summary | Number of Capacity Consumers
n
c Compare the charts.
For example, if the Capacity | Used Space (%) chart shows an increase in used space, but the Disk
Space | Capacity (GB) did not increase and the Summary | Number of Capacity Consumers did
not decrease, then adding capacity is a solution, but it does not address the root cause.
VMware, Inc. 17
Page 18

vRealize Operations Manager User Guide
5 To analyze the second recommendation, vMotion some Virtual Machines to a different Datastore,
add related charts to the workspace.
a Enter vm in the metric list search text box.
b Double-click the Summary | Total Number of VMs metric to add it to the workspace
c Compare the 4 charts.
For example, if the Summary | Total Number of VMs chart shows that the number of virtual
machines did not increase enough to negatively aect the data store, then moving some of the
virtual machines is a solution, but it does not address the root cause.
6 To analyze the third recommendation, Delete unused snapshots of virtual machines, add related charts
to the workspace.
a Enter snapshot in the metric list search text box.
b Double-click the following metrics to add the charts to the workspace:
Disk Space | Snapshot Space (GB)
n
Disk Space Reclaimable | Snapshot Space | Waste Value (GB)
n
c Compare the charts.
For example, if the amount of Disk Space | Snapshot Space (GB) increased and the Disk Space
Reclaimable | Snapshot Space | Waste Value (GB) indicates an area where space can be reclaimed,
then deleting unused snapshots will positively aect the data store disk space problem and resolve
the alert.
7 If this is a problematic data store that you must continue to monitor, you can create a dashboard.
a Click the Generate Dashboard buon on the workspace toolbar.
b Enter a name for the dashboard and click OK.
In this example, use a name like Datastore disk space.
The dashboard is added to your available dashboards.
You compared metric charts to determine if the recommendations are valid and which recommendation to
implement rst. In this example, the Delete unused snapshots of Virtual Machines recommendation appears
to be the most likely way to resolve the alert.
What to do next
Implement the alert recommendations. See “Run a Recommendation On a Datastore to Resolve an Alert,”
on page 18.
Run a Recommendation On a Datastore to Resolve an Alert
As a network operations engineer, you investigated the alert regarding datastore disk space and determined
that the provided recommendations will resolve the problem, particularly the recommendation to delete
unused snapshots. You use vRealize Operations Manager to delete the snapshots.
If you have not enabled actions in the vCenter adapter, you can manually delete the snapshots on your
vCenter Server instance.
Prerequisites
Compare the metric charts to identify the likely root cause of the alert. See “Compare Alerts and Events
n
Over Time in Response to a Datastore Alert,” on page 15 .
18 VMware, Inc.
Page 19

Chapter 1 Monitoring Objects in Your Managed Environment by Using vRealize Operations Manager
Procedure
1 In the left pane of vRealize Operations Manager, click the Alerts icon.
2 Click the alert name link.
3 Click the Summary tab.
4 Click the Other Recommendations arrow to expand the list.
Other recommendations include the Storage vMotion some virtual machines to a different
datastore recommendation and the Delete unused snapshots for virtual machines recommendation.
The delete unused snapshot recommendation includes an action buon.
5 Click Delete Unused Snapshots for Datastore.
6 In the Days Old text box, select or enter the number of days old the snapshot must be to be retrieved for
deletions and click OK.
For example, enter 30 to retrieve all snapshots on the datastore that are 30 days old or older.
7 In the Delete Unused Snapshots for Datastore dialog box, review the Snapshot Space, Snapshot Create
Time, and the VM Name to determine which snapshots to delete, and select the check box for each one
to delete.
8 Click OK.
The dialog box that appears provides a link to Recent Tasks and a link to the task.
9 To verify that the task ran successfully, click Recent Tasks.
The Recent Tasks page appears. The Delete Unused Snapshots action include two tasks, one to retrieve
the snapshots and one to delete the snapshots.
10 Select the Delete Unused Snapshot task that has the more recent completed time.
This is the delete task. The status should be Completed.
In this example, you ran an action on the datastore in vCenter Server. The other recommendations might
also be valid.
What to do next
Verify that the recommendations resolve the alert. Allow a few collection cycles to run after you run the
n
action and verify that the alert is canceled. Alerts are canceled when the conditions that generated them
are no longer true.
Implement the other recommendations. The other recommendations for this alert require you to use
n
other applications. You cannot implement the recommendations from vRealize Operations Manager.
Use other options to investigate the root cause. See “User Scenario: Investigate the Root Cause of a
n
Problem by Using the Troubleshooting Tab Options,” on page 56 for an alternative example for
investigating the root cause of a problem.
User Scenario: You See Problems as You Monitor the State of Your Objects
As you investigate your objects in the context of this scenario, vRealize Operations Manager provides details
to help you resolve the problems. You analyze the state of your environment, examine current problems,
investigate solutions, and take action to resolve the problems.
As a virtual infrastructure administrator, you regularly browse through vRealize Operations Manager at
various levels so that you know the general state of the objects in your managed environment. Although no
one has called or complained, and you do not see any new alerts, you are starting to see that your cluster is
running out of capacity.
VMware, Inc. 19
Page 20

vRealize Operations Manager User Guide
This scenario refers to objects that are associated with the VMware vSphere Solution, which connects
vRealize Operations Manager to one or more vCenter Server instances. The objects in your environment
include multiple vCenter Server instances, data centers, clusters (cluster compute resources), host systems,
resource pools, and virtual machines.
As you perform the steps in this scenario, and progress through the stages of troubleshooting, you learn
how to use vRealize Operations Manager to help you resolve problems. You will analyze the state of the
objects in your environment, examine current problems, investigate solutions, and take action to resolve the
problems.
This scenario shows you how to evaluate the problems that occur on your objects, and take action to resolve
problems.
With the Analysis tab, you view the seings for object resources, click the links provided to further
n
analyze the problem, and examine the policy seings and thresholds.
Using the Troubleshooting tab, you examine the symptoms that triggered on the objects, determine
n
when the problems that triggered those symptoms occurred, identify the events associated with those
problems, and examine the metric values involved.
On the Details tab, you investigate the metric activity as a graph, list, or distribution chart, and view the
n
heat maps to examine the criticality levels of your objects.
With the Environment tab, you evaluate the health, risk, and eciency of various objects as they relate
n
to your overall object hierarchy. You view the object relationships to determine how an object that is in a
critical state might be aecting other objects.
To support future troubleshooting and ongoing maintenance, you can create a new alert denition, and
create a dashboard and one or more views and reports. To plan for growth and account for newly approved
projects, you can create and commit capacity projects. To enforce the rules used to monitor your objects, you
can create and customize operational policies.
Prerequisites
Verify that you are monitoring one or more vCenter Server instances. See the vRealize Operations Manager
Customization and Administration Guide.
Procedure
1 Analyze the State of Your Environment on page 21
The Analysis tabs help you analyze your objects in multiple ways. As a Virtual Infrastructure
Administrator, you use the Analysis tabs to evaluate the details about the state of your objects to help
you resolve problems.
2 Troubleshoot Problems with a Host System on page 23
You use the Troubleshooting tabs to identify the root cause of problems that are not resolved by alert
recommendations or simple analysis.
3 Examine the Environment Details on page 25
Examine the status of your objects in the views and heatmaps so that you can identify the trends and
spikes that are occurring with the resources on your cluster and objects. To determine whether any
deviations have occurred, you can display overall summaries for an object, such as for the cluster disk
space usage breakdown.
4 Examine the Environment Relationships on page 26
You use the Environment Overview and List to examine the status of the badges as they relate to the
objects in your environment hierarchy, and determine which objects are in a critical state for a
particular badge. To view the relationships between your objects to determine whether an ancestor
object that has a critical problem might be causing problems with the descendants of the object, you
use the Environment Map.
20 VMware, Inc.
Page 21

Chapter 1 Monitoring Objects in Your Managed Environment by Using vRealize Operations Manager
5 Fix the Problem on page 28
You use the analysis and troubleshooting features of vRealize Operations Manager to examine
problems that put your objects in a critical state, and identify solutions. To resolve the problems,
where actions exist for the object type, you select an object and an available action that is specic to the
object. Or, you can open the object in the vSphere Web Client and modify the object seings to resolve
the problem.
6 Create a New Alert Denition on page 30
Based on the root cause of the problem, and the solutions that you used to x the problem, you can
create a new alert denition for vRealize Operations Manager to alert you. When the alert is triggered
on your host system, vRealize Operations Manager alerts you and provides recommendations on how
to solve the problem.
7 Create Dashboards and Views on page 31
To help you investigate and troubleshoot problems with your cluster and host systems that might
occur in the future, you can create dashboards and views that apply the troubleshooting tools and
solutions that you used to research and solve the problems with your host system, to make those
troubleshooting tools and solutions available for future use.
Analyze the State of Your Environment
The Analysis tabs help you analyze your objects in multiple ways. As a Virtual Infrastructure Administrator,
you use the Analysis tabs to evaluate the details about the state of your objects to help you resolve problems.
As you browse through the inventory tree, you notice that one of your clusters, named USA-Cluster, is
experiencing capacity problems. You use the Analysis tabs to begin to investigate the cause of the problem
on USA-Cluster, and you start to see problems reported with the capacity on one of your host systems and
other objects.
Prerequisites
Verify that you understand the context of this scenario. See “User Scenario: You See Problems as You
Monitor the State of Your Objects,” on page 19.
Procedure
1 Click Environment > vSphere Hosts and Clusters > USA-Cluster.
2 Click the Analysis tab.
You see red icons on the Capacity Remaining and Time Remaining tabs.
3 Click the Time Remaining tab.
You see that the memory allocation is severely constrained.
VMware, Inc. 21
Page 22

vRealize Operations Manager User Guide
4 View the time remaining breakdown for the cluster.
The icons indicate that zero days remain, with no planned capacity projects considered.
5 Scroll down until you see the Time Remaining in Related Objects pane.
The parent object is the data center, and the peer represents another cluster. The child objects include
the resource pool and host systems. The data center and one of the host systems are experiencing
critical memory problems.
6 Hover your mouse over the red parent and child icons.
The memory capacity has expired on the data center and one of the host systems.
The memory capacity problem on the cluster is aecting the memory capacity of the related objects.
What to do next
Use the Troubleshooting tab to further troubleshoot the capacity problems on your cluster and host system.
See “Troubleshoot Problems with a Host System,” on page 23.
22 VMware, Inc.
Page 23

Chapter 1 Monitoring Objects in Your Managed Environment by Using vRealize Operations Manager
Troubleshoot Problems with a Host System
You use the Troubleshooting tabs to identify the root cause of problems that are not resolved by alert
recommendations or simple analysis.
To further troubleshoot the symptoms of the capacity problems that are occurring on the cluster and host
system, and determine when those problems occurred, you use the Troubleshooting tabs to continue to
investigate the memory problem.
Prerequisites
Use the Analysis tabs to analyze your environment. See “Analyze the State of Your Environment,” on
page 21.
Procedure
1 Click Environment > vSphere Hosts and Clusters > USA-Cluster.
2 Click the Troubleshooting tab and review the symptoms.
The Symptoms tab displays the symptoms that triggered on the selected cluster. You notice that several
critical symptoms exist.
Cluster Compute Resource Time Remaining with committed projects is critically low
n
Cluster Compute Resource Time Remaining is critically low
n
Capacity remaining is critically low
n
3 Analyze the critical symptoms.
a Hover your mouse over each critical symptom to identify the metric used.
b To view only the symptoms that aect the cluster, enter cluster in the quick lter text box.
When you hover over Cluster Compute Resource Time Remaining is critically low, the metric
Badge|Time Remaining with committed projects (%) appears. You notice that its value is less than
or equal to zero, which caused the capacity symptom to trigger and generate an alert on USACluster.
4 Click the Timeline tab to review the triggered symptoms, alerts, and events that occurred on USA-
Cluster over time, and identify when the problems occurred.
a On the toolbar, click Select Event Type.
b Click Date Controls and select Last 7 Days.
Several events appear in red.
c Hover your mouse over each event to view the details.
d To display the events that occurred on the cluster's data center, click Show Ancestor Events, and
select Datacenter.
Warning events for the data center appear in yellow.
e Hover your mouse over the warning events.
You notice that the density is starting to get low, and that a hard threshold violation occurred on
the data center late in the evening. The hard threshold violation shows that the Badge|Density
metric value was under the acceptable value of 25, and that the violation triggered with a value of
14.89.
f To view the aected child objects, click Show Descendant Events and select Host System.
VMware, Inc. 23
Page 24

vRealize Operations Manager User Guide
5 Click the Events tab to examine the changes that occurred on USA-Cluster, and determine whether a
change occurred that contributed to the root cause of the alert or other problems with the cluster.
a On the toolbar, click each badge and view the events that occurred.
The Workload badge displays a graph of the events that occurred on the cluster. Several red
triangles appear at various points in the graph.
b Hover your mouse over each red triangle.
By reviewing the graph, you can determine whether a reoccurring event has caused the errors.
Each event indicates that the guest le system is out of disk space. The aected objects appear in
the pane below the graph.
c Click each red triangle to identify the aected object and highlight it in the pane below.
6 Click the All Metrics tab to evaluate the objects in their context in the environment topology to help
identify the possible cause of a problem.
a In the top view, select USA-Cluster.
b In the metrics pane, expand Badge and double-click Badge|Capacity Remaining (%).
The Badge|Capacity Remaining (%) calculation is added to the lower right pane.
c In the metrics pane, double-click Density.
d In the metrics pane, double-click Workload.
e On the toolbar, click Date Controls and select Last 7 Days.
The metric chart indicates that the capacity for the cluster remained at a steady level for the past
week, but that the cluster density increased to its maximum value in the last several days. The
Badge|Workload (%) calculation displays the workload extremes that correspond to the density
problem.
24 VMware, Inc.
Page 25

Chapter 1 Monitoring Objects in Your Managed Environment by Using vRealize Operations Manager
You have analyzed the symptoms, timeline, events, and metrics related to the problems on your cluster, and
determined that the heavy workload on the cluster has decreased the cluster density in the last several days,
which indicates that the cluster is starting to run out of capacity.
What to do next
Examine the Details views and heatmaps to interpret the properties, metrics, and alerts to look for trends
and spikes that occur in the resources for your objects, the distributions of resources across your objects, and
data maps to examine the use of various resource types across your objects. See “Examine the Environment
Details,” on page 25.
Examine the Environment Details
Examine the status of your objects in the views and heatmaps so that you can identify the trends and spikes
that are occurring with the resources on your cluster and objects. To determine whether any deviations have
occurred, you can display overall summaries for an object, such as for the cluster disk space usage
breakdown.
To examine the problems with your USA-Cluster further, use the Details views to display the metrics and
collected capacity data for your cluster. Each view includes specic metrics data collected from your objects.
For example, trend views use data collected from objects over time to generate trends and forecasts for
resources such as memory, CPU, disk space, and so on.
Use the heatmaps to examine the capacity levels on the cluster, host systems, and virtual machines. The
block sizes and colors are based on the metrics selected in the heatmap conguration. For example, the
heatmap that shows the most abnormal workload for virtual machines is sized by the Badge|Workload (%)
metric, and is colored by the Badge|Anomaly metric.
Prerequisites
Use the Troubleshooting tabs to look for root causes. See “Troubleshoot Problems with a Host System,” on
page 23
Procedure
1 Click Environment > vSphere Hosts and Clusters > USA-Cluster.
2 Examine the detailed information about USA-Cluster in the views.
a Click the Details tab and click Views.
The views provide multiple ways to look at dierent types of collected data by using trends, lists,
distributions, and summaries.
b In the search text box, enter capacity.
The list lters and displays the capacity views for clusters and other objects.
c Click the view named Cluster Capacity Risk Forecast, and examine the number of virtual
machines for USA-Cluster in the lower pane.
Even though the USA-Cluster has two host systems and 30 virtual machines, no capacity exists.
3 Examine the host systems in the cluster, and reclaim capacity from the descendant virtual machines.
a Click the Analysis tab, and click Capacity Remaining.
b In the inventory tree, expand USA-Cluster, and click each of the host systems.
The host system named w2-vcopsqe2-009 is in a critical state, with no capacity remaining.
c In the lower pane, expand Memory, and expand Allocation.
The stress free value is zero, and the amount of memory available is zero, which indicates that the
capacity of the host system has been depleted.
VMware, Inc. 25
Page 26

vRealize Operations Manager User Guide
d Click the Details tab, and click Views, and click the Virtual Machine Reclaimable Capacity view.
e In the lower pane, click the title of the Reclaimable Memory column to sort the list of virtual
machines so that the largest amount of reclaimable capacity is on top.
f To reclaim capacity from several virtual machines, click to the right of the rst virtual machine
name, then press Shift and click to the right of the last virtual machine that has capacity to reclaim.
The virtual machines that have reclaimable capacity are highlighted.
g Click the gear icon, and select Set CPU Count and Memory for VM.
h Click the Current CPU column title to sort the list according to the highest number of CPUs.
Based on the actual use of the virtual machines listed, the New CPU column recommends fewer
CPUs for each virtual machine.
i Click the check box next to each virtual machine that has a recommended lower CPU count, and
click OK.
By reducing the number of CPUs for each virtual machine, you free up capacity on your host
system, and improve the USA-Cluster capacity and workload.
4 Examine the heatmaps for the host system and virtual machine objects in USA-Cluster.
a In the inventory tree, click USA-Cluster.
b Click Details, click Heatmaps, and click through the list of heatmap views.
c Click Which VMs currently have the highest CPU demand and contention?
The heatmap displays blocks that represent the objects in USA-Cluster. The block for a virtual
machine appears in red, which indicates that it has a critical problem.
d Hover over the red block and examine the details.
The cluster, host system, and virtual machine names appear, with links to more information about
the object.
e Click Show Sparkline to display the activity trend on the virtual machine.
f Click each of the Details links to display more information.
To verify that freeing up memory on the virtual machines has improved the workload of the host system
and the cluster, you can now examine the status of the host system and cluster.
You used views and heatmaps to evaluate the status of your objects and identify trends and spikes, and free
up capacity for your host system and USA-Cluster. To further narrow in on problems, you can examine the
other views and heatmaps. You can also create your own views and heatmaps.
What to do next
Examine the badge status for the objects in your environment hierarchy to determine which objects are in a
critical state, and examine the object relationships to determine whether a problem on one object is aecting
one or more other objects. See “Examine the Environment Relationships,” on page 26.
Examine the Environment Relationships
You use the Environment Overview and List to examine the status of the badges as they relate to the objects
in your environment hierarchy, and determine which objects are in a critical state for a particular badge. To
view the relationships between your objects to determine whether an ancestor object that has a critical
problem might be causing problems with the descendants of the object, you use the Environment Map.
As you click each of the badges in the Environment Overview, you see that several objects are experiencing
critical problems with health, workload, and faults. Others are reporting critical risk status, and many are in
critical time remaining and capacity remaining states.
26 VMware, Inc.
Page 27

Chapter 1 Monitoring Objects in Your Managed Environment by Using vRealize Operations Manager
Several objects are experiencing stress. You notice that you can reclaim capacity from multiple virtual
machines and a host system, but the overall eciency status for your environment displays no problems.
Prerequisites
Examine the status of your objects in views and heatmaps. See “Examine the Environment Details,” on
page 25.
Procedure
1 Click Environment > vSphere Hosts and Clusters > USA-Cluster.
2 Examine the USA-Cluster environment overview to evaluate the badge states of the objects in a
hierarchical view.
a In the inventory tree, click USA-Cluster, and click Environment > Overview.
b On the Badge toolbar, click through the badges and look for red icons to identify critical problems.
Option Evaluation Process
Status icons When the status of my object is critical, what must I do to resolve the problem?
How can I be notied before serious problems occur?
Badges: Health, Workload,
Anomalies, and Faults
Badges: Risk, Time
Remaining, Capacity
Remaining, Stress
Badges: Eciency,
Reclaimable Capacity,
Density
How might the health and workload of my host systems be aecting my virtual
machines?
Are anomalies and faults on my host systems and virtual machines aecting
other objects?
How does the stress level of my cluster and host systems aect the virtual
machines descendants?
To improve eciency, how can I reclaim capacity from the cluster, host systems,
resource pool, and virtual machines, and apply the reclaimed capacity to other
objects in my environment?
As you click through the badges, you notice that your vCenter Server and other top level objects
appear to be healthy, but you see that a host system and several virtual machines are in a critical
state for health, workload, and faults. Several objects also have critical problems with time
remaining and capacity remaining.
c Hover your mouse over the red icon for the host system to display the IP address.
d Enter the IP address in the search text box, and click the link that appears.
The host system is highlighted in the inventory tree. You can then look for recommendations or
alerts for the host system on the Summary tab.
3 Examine the environment list and view the badge status for your objects to determine which objects are
in a critical state.
a Click Environment > List.
b Examine the badge states for the objects in USA-Cluster.
c Click the Capacity Remaining badge column name to sort the object list and display the objects
that are in a critical state.
Many of the objects that are at risk for capacity remaining also display critical states for time
remaining, risk, and health. You notice that multiple virtual machines and a host system named
w2-vropsqe2-009 are critically aected. Because the host system is experiencing the most critical
problems, and is likely aecting other objects, you must focus on resolving the problems with the
host system.
VMware, Inc. 27
Page 28

vRealize Operations Manager User Guide
d Click the host system named w2-vropsqe2-009, which is in a critical state, to locate it in the
inventory tree.
e Click w2-vropsqe2-009 in the inventory tree, and click the Summary tab to look for
recommendations and alerts so that you can take action.
4 Examine the environment map.
a Click Environment > Map.
b In the inventory tree, click USA-Cluster, and view the map of related objects.
In the relationship map, you can see that the USA-Cluster has an ancestor data center, one
descendant resource pool, and two descendant host systems.
c Click the host system named w2-vropsqe2-009.
The types and numbers of descendant objects for this host system appear in the list below. Use the
descendant object list identify all of the objects related objects to the host system that might be
experiencing problems.
What to do next
Take action in the user interface to resolve the problems. See “Fix the Problem,” on page 28.
Fix the Problem
You use the analysis and troubleshooting features of vRealize Operations Manager to examine problems
that put your objects in a critical state, and identify solutions. To resolve the problems, where actions exist
for the object type, you select an object and an available action that is specic to the object. Or, you can open
the object in the vSphere Web Client and modify the object seings to resolve the problem.
You have used the Analysis, Troubleshooting, Details, and Environment areas of the user interface to
examine the critical problems that occur on your objects. To resolve those problems, you can select actions
from the Actions menu, which appears in list and view menus, and various dashboard widgets.
The actions that you can select are specic to an object type, such as a virtual machine. Although you can
select an action when you have selected a host system that is experiencing critical problems related to
capacity and time, all but one of the actions that you can take apply to virtual machines. The action to delete
unused snapshots applies to datastores.
Prerequisites
Examine the environment relationships. See “Examine the Environment Relationships,” on page 26.
Procedure
1 Click Environment > vSphere Hosts and Clusters > USA-Cluster.
2 From the Details view, select the host system and take action.
a In the inventory tree, click the host system named w2-vropsqe2-009.
b Click Details > Views, and enter memory in the search text box.
28 VMware, Inc.
Page 29

Chapter 1 Monitoring Objects in Your Managed Environment by Using vRealize Operations Manager
c Click the view named Host Rightsizing CPU, Memory, and Disk Space.
The host system named w2-vropsqe2-009 appears in the lower pane. You see that the provisioned
CPUs and memory for the host system are wasting capacity, and realize that you can free up some
capacity in an aempt to resolve the capacity problem on the host system.
Provisioned Recommendation Reclaimable
16 Core CPUs 10 Core CPUs 35 Core CPUs
127 GB memory 35 GB memory 68 GB memory
4,011 GB disk space 11,158 GB disk space 122 GB disk space
d In the lower pane, click to the right of the host system named w2-vropsqe2-009.
e On the toolbar in the lower pane, click the Open in external application icon, and click Open Host
in vSphere Client.
f Log in to the vSphere Web Client, and modify the provisioned CPU and memory for the host
system.
3 (Optional) From the Environment view, select the host system and take action.
a In the inventory tree, click USA-Cluster.
b Click Environment > List.
c Click to the right of the name of the w2-vropsqe2-009 host system.
d In the lower pane, click to the right of the host system named w2-vropsqe2-009.
e On the toolbar in the lower pane, click the Open in external application icon, and click Open Host
in vSphere Client.
f Log in to the vSphere Web Client, and modify the provisioned CPU and memory for the host
system.
4 (Optional) From the inventory tree, select the host system and take action.
a In the inventory tree, click w2-vropsqe2-009.
b At the top of the toolbar in the right pane, click Actions.
c Click Open Host in vSphere Client.
d Log in to the vSphere Web Client, and modify the provisioned CPU and memory for the host
system.
You have used the available actions to resolve problems on a host system that is experiencing critical
problems. The available action appears in Content > Actions.
What to do next
To become aware of critical problems on your objects before they adversely aect the performance of other
objects and your environment, create an alert denition, and optionally add actions to the alert denition
recommendations. See “Create a New Alert Denition,” on page 30.
VMware, Inc. 29
Page 30

vRealize Operations Manager User Guide
Create a New Alert Definition
Based on the root cause of the problem, and the solutions that you used to x the problem, you can create a
new alert denition for vRealize Operations Manager to alert you. When the alert is triggered on your host
system, vRealize Operations Manager alerts you and provides recommendations on how to solve the
problem.
To alert you before your host systems experience critical capacity problems, and have
vRealize Operations Manager notify you of problems in advance, you create alert denitions, and add
symptom denitions to the alert denition.
Prerequisites
Resolve the problem. See “Fix the Problem,” on page 28.
Procedure
1 In the left pane, click Content > Alert .
2 Enter capacity in the search text box.
Review the available list of capacity alert denitions. If a capacity alert denition does not exist for host
systems, you can create one.
3 Click the plus sign to create a new capacity alert denition for your host systems.
a In the alert denition workspace, for the Name and Description, enter
Hosts - Alert on Capacity Exceeded.
b For the Base Object Type, select vCenter Adapter > Host System
c For the Alert Impact, select the following options.
Option Selection
Impact Select Risk.
Criticality Select Immediate.
Alert Type and Subtype Select Application : Capacity.
Wait Cycle Select 1.
Cancel Cycle Select 1.
d For Add Symptom Denitions, select the following options.
Option Selection
Dened On Select Self.
Symptom Denition Type Select Metric / Supermetric.
Quick lter (Name)
Enter capacity.
e From the Symptom Denition list, click Host System Capacity Remaining is moderately low and
drag it to the right pane.
In the Symptoms pane, make sure that the Base object exhibits criteria is set to All by default.
f For Add Recommendations, enter virtual machine in the quick lter text box.
g Click Review the symptoms listed and remove the number of vCPUs from the virtual machine as
recommended by the system, and drag it to the recommendations area in the right pane.
This recommendation is set to Priority 1.
30 VMware, Inc.
Page 31

Chapter 1 Monitoring Objects in Your Managed Environment by Using vRealize Operations Manager
4 Click Save to save the alert denition.
Your new alert appears in the list of alert denitions.
You have added an alert denition to have vRealize Operations Manager alert you when the capacity of
your host systems begins to run out.
What to do next
Create dashboards and views for future investigation. See “Create Dashboards and Views,” on page 31.
Create Dashboards and Views
To help you investigate and troubleshoot problems with your cluster and host systems that might occur in
the future, you can create dashboards and views that apply the troubleshooting tools and solutions that you
used to research and solve the problems with your host system, to make those troubleshooting tools and
solutions available for future use.
To readily view the status of your cluster and host systems when your CIO asks you about their health, you
can use the decision support dashboards on the vRealize Operations Manager Home page. For example, you
can:
Use the vSphere Clusters dashboard to view the utilization index, CPU demand, and memory use for
n
your clusters. This dashboard also tracks the net use and disk I/O operations.
Use vSphere Cluster Conguration Summary dashboard to track the high availability status, and other
n
conguration items.
Use the vSphere Hosts Overview to examine the capacity levels of your cluster, host systems, and
n
virtual machines.
Use the Health of Host Systems dashboard to view the active alert list, capacity metric chart and
n
heatmap for your host system.
Or, you might need to create your own dashboards to track the status of your clusters and host systems.
If you work in a Network Operations Center environment and have multiple monitors, you can run multiple
instances of vRealize Operations Manager, and dedicate a monitor to each specic dashboard so that you
can visually track the status of your objects.
Prerequisites
Create an alert denition to alert you when the capacity of your host system is geing low. See “Create a
New Alert Denition,” on page 30.
Procedure
1 In the left pane, click Home.
2 Click Dashboard List, and look through the list of existing dashboards to determine whether you can
use the cluster and host system dashboards to track your clusters and host systems.
3 Click the Health of Host Systems dashboard, and review the widgets included on it.
The inclusion of the Object List, Alert List, Metric Picker, Metric Chart, Heatmap, and Top-N widgets
would allow you to easily peruse the status of the host systems that you select in the Object List widget.
This dashboard has the widget interaction congured so that the object you select in the Object List
widget is the object for which the other widgets display data.
VMware, Inc. 31
Page 32

vRealize Operations Manager User Guide
4 Create and congure a new dashboard that has widgets to monitor the health of your host systems and
generate alerts.
a Above the dashboard view, click Actions and select Create Dashboard.
b In the New Dashboard workspace, for the Dashboard Name, enter Health of Host Systems, and
leave the other default seings.
c In the Widget List workspace, add the Object List widget and congure it to display host system
objects.
d Add the Alert List widget to the dashboard, and congure it to display capacity alerts when the
capacity of your host systems becomes an immediate risk.
e In the Widget Interactions workspace, for each widget listed, select the Object List widget as the
provider to drive the data to the other widgets, and click Apply Interactions.
f In the Dashboard Navigation workspace, select the dashboards that receive data from the selected
widgets, and click Apply Navigations.
After vRealize Operations Manager collects data, if a problem occurs with the capacity of your host
systems, the Alert List widget on your new dashboard displays the alerts that are congured for your
host systems.
What to do next
Prepare to share information with others, plan for growth and new projects, and use policies to
continuously monitor all of the objects in your environment. To plan for growth and new projects, see
Chapter 2, “Planning the Capacity for Your Managed Environment Using vRealize Operations Manager,” on
page 77. To generate reports, and create and customize policies, see the vRealize Operations Manager
Customization and Administration Guide.
Monitoring and Responding to Alerts
Alerts indicate a problem in your environment. Alerts are generated when the collected data for an object is
compared to alert denitions for that object type and the dened symptoms are true. When an alert is
generated, you are presented with the triggering symptoms, so that you can evaluate the object in your
environment, and with recommendations for how to resolve the alert.
Alerts notify you when an object or group of objects are exhibiting symptoms that are unfavorable for your
environment. By monitoring and responding to alerts, you stay aware of problems and can react to them in
a timely fashion.
Generated alerts drive the status of the top level badges, Health, Risk, and Eciency.
In addition to responding to alerts, you can generally respond to the status of badges for objects in your
environment.
You cannot assign alerts to vRealize Operations Manager users. Your users must take ownership of an alert.
Monitoring Alerts in vRealize Operations Manager
You can monitor your environment for generated alerts in several areas in vRealize Operations Manager.
The alerts are generated when the symptoms in the alert denition are triggered, leing you know when the
objects in your environment are not operating within the parameters you dened as acceptable.
Generated alerts appear in many areas of vRealize Operations Manager so that you can monitor and
respond to problems in your environment.
32 VMware, Inc.
Page 33

Chapter 1 Monitoring Objects in Your Managed Environment by Using vRealize Operations Manager
Alerts
Alerts are classied as Health, Risk, or Eciency. Health alerts indicate problems that require immediate
aention. Risk alerts indicate problems that must be addressed in the near future, before the problems
become immediate health problems. Eciency alerts indicate areas where you can reclaim wasted space or
improve the performance of objects in your environment.
You can monitor the alerts for your environment in the following locations.
Alerts
n
Health
n
Risk
n
Eciency
n
You can monitor alerts for a selected object in the following locations.
Alert Details, including the Summary, Impacted Object Symptoms, Timeline, Relationships, and
n
Metric Charts tabs
Summary tab
n
Alerts tab
n
Troubleshooting tab
n
Custom dashboards
n
Alert notications
n
Working with Alerts
Alerts indicate a problems that must be resolved so that triggering conditions no longer exist and the alert is
canceled. Suggested resolutions are provided as recommendations so that you can approach the problem
with solutions.
As you monitor alerts, you can take ownership, suspend, or manually cancel alerts.
When you cancel an alert, the alert and any symptoms of type fault, message event, or metric event are
canceled. You cannot manually cancel other types of symptoms. If the alert was triggered by a fault
symptom, message event symptom or metric event symptom, then the alert is eectively canceled. If the
alert was triggered by a metric symptom or property symptom, a new alert might be created for the same
conditions in the next few minutes.
The correct way to remove an alert is to address the underlying conditions that triggered the symptoms and
generated the alert.
Migrated Alerts
If you migrated alerts from a previous version of vRealize Operations Manager, the alerts are listed in the
overview with a cancelled status, but alert details are not available.
User Scenario: Monitor and Process Alerts in vRealize Operations Manager
Alerts in vRealize Operations Manager notify you when objects in your environment have a problem. This
scenario illustrates one way that you can monitor and process alerts for the objects for which you are
responsible.
An alert is generated when one or more of the alert symptoms are triggered. Depending on how the alert is
congured, the alert is generated when one symptom is triggered or when all of the symptoms are
triggered.
VMware, Inc. 33
Page 34

vRealize Operations Manager User Guide
As the alerts are generated, you must process the alerts based on the negative aect they have on objects in
your environment. To do this, you start with Health alerts, and process them based on criticality.
As a virtual infrastructure administrator, you review the alerts at least twice a day. As part of your
evaluation process in this scenario, you encounter the following alerts:
Virtual machine has unexpected high CPU workload
n
Host has memory contention that a few virtual machines cause
n
Cluster has many virtual machines that have memory contention because of memory compression,
n
ballooning, or swapping
Procedure
1 In the left pane of vRealize Operations Manager, click the Alerts icon.
2 In the left pane, click the Health alert lists.
Health alerts are alerts that require immediate aention.
3 Place your cursor in the Criticality column, click the down arrow, and select Sort Descending.
The list is now in order of criticality, with the Critical alerts at the top of the list, followed by Immediate,
Warning, and Info alerts.
4 Review the alerts by name, the object on which it was triggered, the object type, and the time at which
the alert was generated.
For example, do you recognize any of the objects as objects that you are responsible for managing? Do
you know that the x that you will implement in the next hour will x any of the alerts that are
aecting the Health status of the object? Do you know that some of your alerts cannot be resolved at
this time because of resource constraints?
5 To indicate to other administrators or engineers that you are taking ownership of the Virtual machine
has unexpected high CPU workload alerts, hold the Ctrl key, click the selected alerts, and click Take
Ownership.
The Owner column updates with your user name. You can only take ownership of alerts, you cannot
assign them to other users.
6 To take ownership and temporarily exclude the alert from aecting the state of the object, select the
Host has memory contention caused by a few virtual machines alert in the list and click Suspend.
a Enter 60 to suspend the alert of an hour.
b Click OK.
The alert is suspended for 60 minutes and you are listed as the owner in the alert list. If it is not resolved
in an hour, it returns to an active state.
7 Select the row that contains the Cluster has many Virtual Machines that have memory contention
due to memory compression, ballooning or swapping alert and click Cancel to remove the alert from
the list.
This alert is a known problem that you cannot resolve until the new hardware arrives.
The alert is removed from the alert list, but the underlying condition is not resolved by this action. The
symptoms in this alert are based on metrics, so the alert will be generated during the next collection and
analysis cycle. This paern continues until you resolve the underlying hardware and workload
distribution issues.
You processed the critical health alerts and took ownership of the ones to resolve or troubleshoot further.
34 VMware, Inc.
Page 35

Chapter 1 Monitoring Objects in Your Managed Environment by Using vRealize Operations Manager
What to do next
Respond to an alert. See “User Scenario: Respond to a vRealize Operations Manager Alert in the Health
Alert List,” on page 35.
User Scenario: Respond to a vRealize Operations Manager Alert in the Health
Alert List
Generated alerts in vRealize Operations Manager appear in the alert lists. You use the alert lists to
investigate, resolve, and begin troubleshooting problems in your environment.
In this scenario, you investigate and resolve the Virtual machine has unexpected high CPU workload alert.
The alert might be generated for more than one virtual machine.
Prerequisites
Process and take ownership of the alerts you will troubleshoot and resolve. See “User Scenario: Monitor
n
and Process Alerts in vRealize Operations Manager,” on page 33.
Review information about how the Power O Allowed seing works when you run actions. See
n
“Working With Actions That Use Power O Allowed,” on page 61.
Procedure
1 In the left pane of vRealize Operations Manager, click the Alerts icon.
2 In the left pane, click the Health alert lists.
3 To limit the list to virtual machine alerts, click All Filters on the toolbar.
a Select Object Type in the drop-down menu.
b Enter virtual machine in the text box.
c Click OK.
The alerts list displays only alerts based on virtual machines.
4 To locate the alerts by name, enter high CPU workload in the Quick (Name) text box.
5 In the list, click the Virtual machine has unexpected high CPU workload alert name.
The Alert Details Summary tab for the generated alert and aected object appears.
6 Review the Summary tab information.
Option Evaluation Process
Alert Description
Recommendations
What is Causing the Issue?
Non-Triggered Symptoms
Review the description so that you beer understand the alert.
Do you think that implementing one or more of the recommendations will
resolve the alert?
Do the triggered symptoms support the recommendations? Do the other
triggered symptoms contradict the recommendation, indicating that you
must investigate further?
In this example, the triggered symptoms indicate that the virtual machine
CPU demand is at a critical level and that the virtual machine anomaly is
starting to get high.
Some alerts are generated only when all the symptoms are triggered.
Others are congured to generate an alert when any one of the symptoms
are triggered. If you have non-triggered symptoms, evaluate them in the
context of the triggered alerts.
Do the non-triggered symptoms support the recommendations? Do the
non-triggered symptoms indicate that recommendations are not valid and
that you must investigate further?
VMware, Inc. 35
Page 36

vRealize Operations Manager User Guide
7 To resolve the alert based on the recommendation to check the guest applications to determine whether
high CPU workload is an expected behavior, click the Action menu on the center pane toolbar and
select Open Virtual Machine in vSphere Client.
a Log in to the vCenter Server instance using your vSphere credentials.
b Launch the console for the virtual machine and identify which guest applications are consuming
CPU resources.
8 To resolve the alert based on the recommendation to add more CPU capacity to this virtual machine,
click Set CPU Count for VM.
a Enter a new value in the New CPU text box.
The value that appears is the calculated recommended size. If vRealize Operations Manager was
monitoring the virtual machine for six or more hours, depending on your environment, the value
that appears is the CPU Recommended Size metric.
b Select the following options to allow power o or to create a snapshot, depending on how your
virtual machines are congured.
Option Description
Power Off Allowed
Snapshot
c Click OK.
Shuts down or powers o the virtual machine before modifying the
value. If VMware Tools is installed and running, the virtual machine is
shut down. If VMware Tools is not installed or not running, the virtual
machine is powered o without regard for the state of the operating
system.
In addition to whether the action shuts down or powers o a virtual
machine, you must consider whether the object is powered on and
what seings are applied.
Creates a snapshot of the virtual machine before you add CPUs.
If the CPU is changed with CPU Hot Plug enabled, then the snapshot is
taken with the virtual machine running, which consumes more disk
space.
The action adds the recommended number of CPUs to the target virtual machine.
9 Allow several collection cycles to run after implementing the recommended changes and check the alert
list.
What to do next
If the alert does not reappear after several collection cycles, it is resolved. If it reappears, further
troubleshooting is required. For an alternative scenario for troubleshooting alerts, see “User Scenario: An
Alert Arrives in Your Inbox,” on page 12.
Monitoring and Responding to Problems
The organization of the tabs and options in vRealize Operations Manager provides a built-in workow that
you can use when you work with objects in your environment.
The tabs, Summary, Alerts, Analysis, and so on, provide a progressive level of detail about the selected
object. As you work through the tabs, starting with the high level Summary and Alerts tabs, you see the
general state of an object. If you identify a problem, you use the aggregated metrics in the Analysis tabs to
view the state of the object in a more detail. The data provided in the Troubleshooting tabs is useful when
you are investigating the root cause of a problem. The Details tabs are specic data views and the
Environment tabs show object relationships.
As you monitor objects in your environment, you will discover which tabs provide the information that you
need when you are investigating problems.
36 VMware, Inc.
Page 37

Chapter 1 Monitoring Objects in Your Managed Environment by Using vRealize Operations Manager
Evaluating Object Summary Information
The Summary tab that is associated with the other object tabs summarizes Heath, Risk, and Eciency alert
badges for the selected object and displays the top alerts that lead to the current state. It also displays the top
alerts for the descendants of the selected object in the current navigation hierarchy.
As an overview of alerts for an object, object group, or application, you use this tab to evaluate the aect that
alerts are having on an object and to begin troubleshooting problems.
Summary Tab Alert Types
The Health, Risk, and Eciency badge states are based on the number and criticality of the generated alerts
for the selected object.
Health alerts indicate problems that aect the health of your environment and require immediate
n
aention to ensure that service to your customers is not aected.
Risk alerts indicate problems that are not immediate threats but should be addressed in the near future.
n
Eciency alerts tell you where you can improve performance or reclaim resources.
n
Summary Tab for an Object or an Object Group
When you are working with a single object, the Top Alerts are the alerts generated for the object and the Top
Alerts for Descendants are the alerts generated for any child or other descendant objects in the currently
selected navigation hierarchy. For example, if you are working with a host object in the vSphere Host and
Clusters navigation hierarchy, descendants can include virtual machines and datastores.
When you are working with object groups, which can include one object type, such as hosts, or multiple
objects types, such as hosts, virtual machines, and datastores, all the group member objects are descendants
of the group container. The most critical generated alerts for the member objects appear as Top Alerts for
Descendants.
For an object group, the only Top Alerts that might be generated are the predened group population alerts.
A group population alert considers the health of all group members and is triggered if the average health is
above the Warning, Immediate, or Critical threshold. If a group population alert is generated, then the badge
score and color is aected by the alert. If a group population alert is not generated, then the badges are
green. This behavior is because an object group is a container for other objects.
Summary Tab and Related Hierarchies
The alerts that appear on the Summary tab for an object can vary depending on the currently selected
hierarchy in the Related Hierarchies in the left pane.
Depending on the selected hierarchy, you see dierent alerts and relationships on the Summary tab for an
object. The current focus object name is on the center pane title bar, but the descendent alerts depend on the
relationships that the highlighted hierarchy denes in the Related Hierarchies list in the upper left pane. For
example, if you are working with a host object relative to virtual machines in the vSphere Hosts and
Clusters hierarchy, then descendants commonly include virtual machines and datastores. But if you are
working with the same host as a member of an object group, then any alerts on virtual machines that are
also members of the group do not appear because the host and the virtual machines are considered children
of the group and peers among each other. In this example, the focus of the Summary tab is the host in the
context of the group, not the vSphere Hosts and Clusters hierarchy.
VMware, Inc. 37
Page 38

vRealize Operations Manager User Guide
Summary Tab Evaluation Techniques
You can evaluate the state of objects, starting with the Summary tab, by using one or more of the following
techniques.
Select an object or object group, click on the alerts on the Summary tab, and resolve the problems that
n
the alert indicates.
Select an object and examine the information about the current object that is provided in the other tabs.
n
For example, you start on the object Summary tab and compare the generated alerts to the analytic
information about the object on the Analysis tabs.
Select an object, review the alerts on the Summary tab, and select other objects, comparing the volume
n
and types of alerts generated for dierent objects.
User Scenario: Evaluate the Alert Badges for Objects for a
vRealize Operations Manager Object Group
In vRealize Operations Manager, you use alerts on a group to review the summary alert information for
hosts and virtual machine descendant objects so that you can see how the state of one object type can aect
the state of the other.
As a network operations center engineer, you are responsible for monitoring a group of hosts and virtual
machines for the sales department. As part of your daily tasks, you check the state of the objects in the group
to determine if there are any immediate problems or any upcoming problems based on generated alerts. To
do this you start with your group of objects, particularly the host systems in the group, and review the
information in the Summary tab.
In this example, the group includes the following object alerts.
Host has memory contention caused by a few virtual machines is a Health alert
n
Virtual Machine has chronic high memory workload is a Risk alert
n
Virtual Machine is demanding more CPU than the configured limit is a Risk alert
n
Virtual Machine has large disk snapshots is an Eciency alert
n
The following method of evaluating alerts on the Summary tab is provided as an example for using
vRealize Operations Manager and is not denitive. Your troubleshooting skills and your knowledge of the
particulars of your environment determine which methods work for you.
Prerequisites
Create a group that includes virtual machines and the hosts on which they run. For example, Sales Dept
n
VMs and Hosts. For an example of how to create a similar group, see vRealize Operations Manager
Customization and Administration Guide.
Review how the Summary tab works with object groups and related hierarchies. See “Evaluating Object
n
Summary Information,” on page 37.
Procedure
1 In the left pane of vRealize Operations Manager, click the Environment icon.
2 In the center pane, click the Groups tab and click your Sales Dept VMs and Hosts group.
3 To view the alerts for a host and the associated child virtual machines, in the left pane, click Host
System and click the host name in the lower left pane.
The Summary tab displays the Health, Risk, and Eciency badges, the top alerts for the host. Because
the group is still the focus, the alerts for the child virtual machines do not appear in the Top Alerts for
Descendants widgets.
38 VMware, Inc.
Page 39

Chapter 1 Monitoring Objects in Your Managed Environment by Using vRealize Operations Manager
4 To view the Summary tab for the host so that you can also work with the child virtual machines, click
the right arrow to the right of the host name in the lower left pane.
5 Select the vSphere Hosts and Clusters, located in the upper part of the left pane.
To work with alerts for child virtual machines, the host in the vSphere Hosts and Clusters hierarchy
must be the focus of the Summary tab rather than the host as member of the object group.
6 To view the alert details for an alert in the Top Health Alert pane, click the Host has memory
contention caused by a few virtual machines alert name.
When multiple objects are aected, and you click the alert link to view the details, the Health Issues
dialog box appears. If there is only one object aected, the Alert Details Summary tab for the object is
displayed.
7 On the Alert Details Summary tab, begin evaluating the recommendations and triggered symptoms.
A recommendation for this generated alert is to move some virtual machines with high memory
workload from this host to a host with more available memory.
8 To return to the object Summary tab so that you can review alerts for any descendant virtual machines,
click the back buon located to the left of the left pane toolbar icons.
The host is again the focus of the object Summary tab. Generated alerts for the child virtual machines
appear in one or more of the Top Alerts for Descendants panes.
9 Click on each virtual machine alert and evaluate the information provided on the Alert Details
Summary tab.
Virtual Machine
Alert Evaluation
Virtual Machine has
chronic high memory
workload
Virtual Machine is
demanding more
CPU than the
congured limit
The recommendation is to add more memory to this virtual machine.
If one or more virtual machines are experiencing high workload, this situation is probably
contributing to the host memory contention alert. These virtual machines are candidates for
moving to a host with more available memory. Moving the virtual machines can resolve the
host memory contention alert and the virtual machine alert.
The recommendations include increasing or removing the CPU limits on this virtual
machine.
If one or more virtual machines are demanding more CPU than is congured, and the host
is experiencing memory contention, then you cannot add CPU resources to the virtual
machine without further stressing the host. These virtual machines are candidates for
moving to a host with more available memory. Moving the virtual machines would allow
you to increase the CPU count and resolve the virtual machine alert, and might resolve the
host memory contention alert.
10 Based on your evaluation, take action based on the child virtual machine recommendations.
After you take action, it will take a few collection cycles to determine if your actions resolved the virtual
machine and host alerts.
What to do next
After a few collection cycles, look again at your Sales VMs and Hosts group to determine if the alerts are
canceled and no longer appear in the object Summary tab. If the alerts are still present, see “User Scenario:
Investigate the Root Cause of a Problem by Using the Troubleshooting Tab Options,” on page 56 for an
example troubleshooting workow.
VMware, Inc. 39
Page 40

vRealize Operations Manager User Guide
Investigating Object Alerts
The Alerts tab provides a list of generated alerts for the currently selected object. When you are working
with objects, reviewing and responding to generated alerts on the Alert tab helps you manage problems in
your environment.
The alerts notify you when a problem occurs in your environment based on congured alert denitions.
Object alerts are useful to you as an investigative tool in two ways. They can provide you with proactive
notication about problems in your environment before a user calls you to complain, and they provide
information about the object that you can use when troubleshooting general or reported problems.
As you review the Alerts tab, you can add ancestors and descendants to the list to broaden your view of the
alerts. You can see if alerts on the current object aect other objects or how the current object is aected by
the problems indicated by alerts on other objects.
Depending on the best practices and workows of your infrastructure operations team, you can use the
object Alerts tab to manage generated alerts on individual objects.
Take ownership of alerts so that your team knows that you are working to resolve the problem.
n
Suspend an alert so that is temporarily excluded from aecting the Health, Risk, or Eciency state of
n
the object while you investigate the problem.
Cancel alerts that you know are a result of a deliberate action, for example, a network card was
n
removed from a host for replacement, or that are known issues that you cannot resolve at this time
because of resource constraints. Canceling an alert that is generated because of only fault, message
event, or metric event symptoms cancels the alert permanently. Canceling an alert that is generated
because of metric, super metric, or property symptoms can result in the alert being regenerated if the
underlying metric or property condition remains true. It is only eective to cancel alerts generated
because of fault, message event, or metric event symptoms.
Investigating and resolving alerts helps you provide the best possible environment to your customers.
User Scenario: Respond to Alerts on the Alerts Tab for Problem Virtual Machines
You respond to alerts for objects so that you can bring the aected objects back to the required level of
conguration or performance. Based on the information in the alert and using other information provided in
vRealize Operations Manager, you evaluate the alert, identify the most likely solution, and resolve the
problem.
As a virtual infrastructure administrator or operations manager, you troubleshoot problems with objects.
Reviewing and responding to the generated alerts for objects is part of any troubleshooting process. In this
example, you want to resolve workload problems for a virtual machine. As part of that process, you review
the Alerts tab to determine what alerts might indicate or contribute to the identied problem.
The problem virtual machine is db-01-kyoto, which you use as a database server.
The following method of responding to alerts on the Alerts tab is provided as an example for using
vRealize Operations Manager and is not denitive. Your troubleshooting skills and your knowledge of the
particulars of your environment determine which methods work for you.
Prerequisites
Verify that the vCenter Adapter has been congured for the actions in each vCenter Server instance.
n
Verify that you understand how to use the Power O Allowed option if you are running Set CPU
n
Count, Set Memory, and Set CPU Count and Memory actions. See “Working With Actions That Use
Power O Allowed,” on page 61.
40 VMware, Inc.
Page 41

Chapter 1 Monitoring Objects in Your Managed Environment by Using vRealize Operations Manager
Procedure
1 Enter the name of the object, db-01-kyoto, in the Search text box and select the virtual machine in the
list.
The object Summary tab appears. The Top Alerts panes display important active alerts for the object.
2 Click the Analysis tab.
The Workload tab is the rst tab. This badge indicates that the workload is highest by CPU, but
memory is also above the congured limit.
3 Click the Alerts tab.
In this example, the alert list includes the follow alerts that might be related to the problem you are
investigating.
Virtual machine has unexpected high CPU workload.
n
Virtual machine has unexpected high memory workload.
n
4 In the upper left pane, select the vSphere Hosts and Clusters related hierarchy and select ancestor or
descendant alerts to add to the list.
You want to check for possible alerts on ancestor or descendant objects in the context of the selected
hierarchy.
a On the toolbar, click Show Ancestor Alerts and select the Host System and Resource Pool check
boxes.
Any alerts for the host system or resource pool related to this virtual machine are added to the list.
b Click Show Descendant Alerts and select Datastore.
Any alerts for the datastore are added to the list.
In this example, there are no additional alerts for the host, resource pool, or datastore, so you begin
addressing the virtual machine alerts.
5 Click the Virtual machine has unexpected high CPU workload alert name.
The Alert Details Summary tab appears.
6 Review the recommendations to determine if one or more suggested recommendations can x the
problem.
This example includes the following common recommendations:
Check the guest applications to determine whether high CPU workload is expected behavior.
n
Add more CPU capacity for this virtual machine.
n
7 To follow the Check the guest applications to determine whether high CPU workload is expected
behavior recommendation, click Actions on the title bar and select Open Virtual Machine in vSphere
Client.
The vSphere Web Client Summary tab appears so that you can open the virtual machine in the console
and check which applications are are contributing to the reported high CPU workload.
8 To follow the Add more CPU Capacity for this virtual machine recommendation, click Set CPU
Count for VM .
a Enter a value in the New CPU text box.
The default value that appears before you provide a value is a recommended value based on
analytics.
b To allow the action to power o the virtual machine before running the action if Hot Add for CPU
is not enabled, select the Power Allowed check box.
VMware, Inc. 41
Page 42

vRealize Operations Manager User Guide
c To create a snapshot before changing the virtual machine CPU conguration, select the Snapshot
check box.
d Click OK.
e Click the Task ID link and verify that the task ran successfully.
The specied number of CPUs are added to the virtual machine.
What to do next
After a few collection cycles, return to the object Alerts tab. If the alert no longer appears, then your actions
resolved the alert. If the problem is not resolved, see “User Scenario: Investigate the Root Cause of a
Problem by Using the Troubleshooting Tab Options,” on page 56 for an example troubleshooting workow.
User Scenario: Respond to Alerts on a Custom Dashboard
You can use a custom dashboard that includes widgets related to alerts to monitor whether alerts exist in
your environment. The custom dashboard provides a single interface where you can monitor the general
alert status for the objects and object groups, and begin processing the alerts so that you can resolve them.
As a virtual infrastructure administrator, you are responsible for the virtual machines and hosts that are
used by the accounting department. You created alerts to manage the accounting department objects, and
then create a dashboard where the primary widget displays objects in the accounting object group. You now
want to use the dashboard to manage the alerts for this group.
Prerequisites
Create alerts to manage accounting department objects. See vRealize Operations Manager Customization
n
and Administration Guide.
Create a custom dashboard to which you add the Alert List, Top Alerts, and alert widgets. The widgets
n
are congured to monitor objects in your environment. See vRealize Operations Manager Customization
and Administration Guide.
Procedure
1 In the left pane of vRealize Operations Manager, click the Home icon.
2 On the dashboard title bar, click Dashboard and select Accounting VMs and Hosts.
3 In the Acct Dept Alert List, click the Status column header to sort so that the active alerts are at the top
of the list.
4 On the alert list toolbar, click Color Row by Alert Criticality.
The alerts are now highlighted by color so that you can address those with the highest criticality rst.
5 Click the row for the object with the most critical alert to address rst.
Because of the congured widget interactions, the Health, Risk, Eciency, Alert Volume, and Top
Alerts widgets display data for the selected object.
a Review the Health, Risk, and Eciency widgets so that you understand the general alert status of
the object.
b Review the Top Alerts widget to determine the number of alerts for the object.
42 VMware, Inc.
Page 43

Chapter 1 Monitoring Objects in Your Managed Environment by Using vRealize Operations Manager
c Click the alert name in the widget.
For example, click the Acct VM CPU early warning Risk alert. The Alert Details Summary tab
appears.
d Resolve the alert based on recommendations.
For example, to use the If this is a standalone host, add more memory to the host
recommendation, click the link to the instructions for adding memory to a host.
6 To return to the Accounting VMs and Hosts dashboard so that you can process more alerts, click the
back buon located on the left pane toolbar.
7 Select the next alert in the alert list and continue processing the alerts.
What to do next
After a few collection cycles, look again at your alerts to determine if they were canceled and no longer
appear in the dashboard. If the alerts are still present, see “User Scenario: Investigate the Root Cause of a
Problem by Using the Troubleshooting Tab Options,” on page 56 for an example troubleshooting workow.
Evaluating Metric Information
The All Metrics tab provides a relationship map and user-dened metric charts. The topological map helps
you evaluate objects in the context of their place in your environment topology. The metric charts are based
on the metrics for the selected object that you think will help you identify the possible cause of a problem in
your environment.
Although you might be investigating problems with a single object, for example, a host system, the
relationship map allows you to see the host in the context of parent and child objects. It is also works as a
hierarchical navigation system. If you double-click an object in the map, that object becomes the focus of the
map and the available metrics for the object are active in the lower-left pane.
You can also build your own set of metric charts. You select the objects and metrics so that you can get a
more detailed view of changes to dierent metrics for a single object, or for related objects over time.
Where available, the tab also provides pre-dened sets of metric to help you when looking at a specic
aspect of an object. The metrics are organized into the most relevant groups for the selected object, and
provide the most relevant metrics. For example, for a host, the metrics are displayed under CPU, Memory,
Network, and Storage.
Create Metric Charts When You Troubleshoot a Virtual Machine Problem
You create a custom group of metric charts when you troubleshoot a problem with a virtual machine so that
you can compare dierent metrics. The level of detail that you can create using the All Metrics tab in
vRealize Operations Manager can contribute signicantly to your eort to nd the root cause of a problem.
As a virtual infrastructure administrator investigating a reported performance problem with a virtual
machine, you determined that you need to see detailed charts about the following reported symptoms.
Guest le system overall disk space usage reaching critical limit
n
Guest partition disk space usage
n
The following method of evaluating problems using the All Metrics tab is provided as an example for using
vRealize Operations Manager and is not denitive. Your troubleshooting skills and your knowledge of the
particulars of your environment determine which methods work for you.
Procedure
1 Enter the name of the virtual machine in the Search text box, located on the main title bar.
In this example, the virtual machine name is sales-10-dk.
VMware, Inc. 43
Page 44

vRealize Operations Manager User Guide
2 Click the All Metrics tab.
3 In the relationship topology map, click the virtual machine, dk-new-10.
The metrics list, located in the lower left of the center pane, displays virtual machine metrics.
4 On the chart toolbar, click Date Control and select a time that is on or before the symptoms were
triggered.
5 Add metric charts to the display area for the virtual machine.
a In the metric list, select Guest Files System Stats > Total Guest File System Free (GB) and double-
click the metric name.
b To add the guest partition, for example, C:\, select Guest Files System Stats > C:\ > Guest File
System Free (GB) and double-click the metric name.
c To add disk space for comparison, select Disk Space > Capacity Remaining (%) and double-click
the metric name.
6 Compare the charts.
A comparison of the charts shows a similar decrease in the le system free space, and that the virtual
machine disk space capacity remaining is decreasing at a steady rate. You determine that you must add
disk space to the virtual machine, but you do not know if the datastore can support the change to the
virtual machine.
7 Add the datastore capacity chart to the charts.
a In the topology map, double-click the host.
The topology map refreshes with the host as the focus object.
b Click the datastore.
c In the metric list, which is updated to display datastore metrics, select Capacity > Available Space
(GB) and double-click the metric name.
8 Review the datastore capacity chart to determine if sucient capacity is available on the datastore to
support increasing the disk space on the virtual machine.
You know that you need to increase the size of the virtual disk on the virtual machine.
What to do next
Expand the virtual disk on the virtual machine and assign it to stressed partitions. Click Actions, located on
the object title bar, and open the virtual machine in the vSphere Web Client.
Host-Related Metrics
vRealize Operations Manager provides groups of metrics for selected hosts. Each group displays the most
relevant metrics for the host to help you monitor your environment.
To display metric groups, select a host in the Environment Overview, and then select the All Metrics tab.
44 VMware, Inc.
Page 45
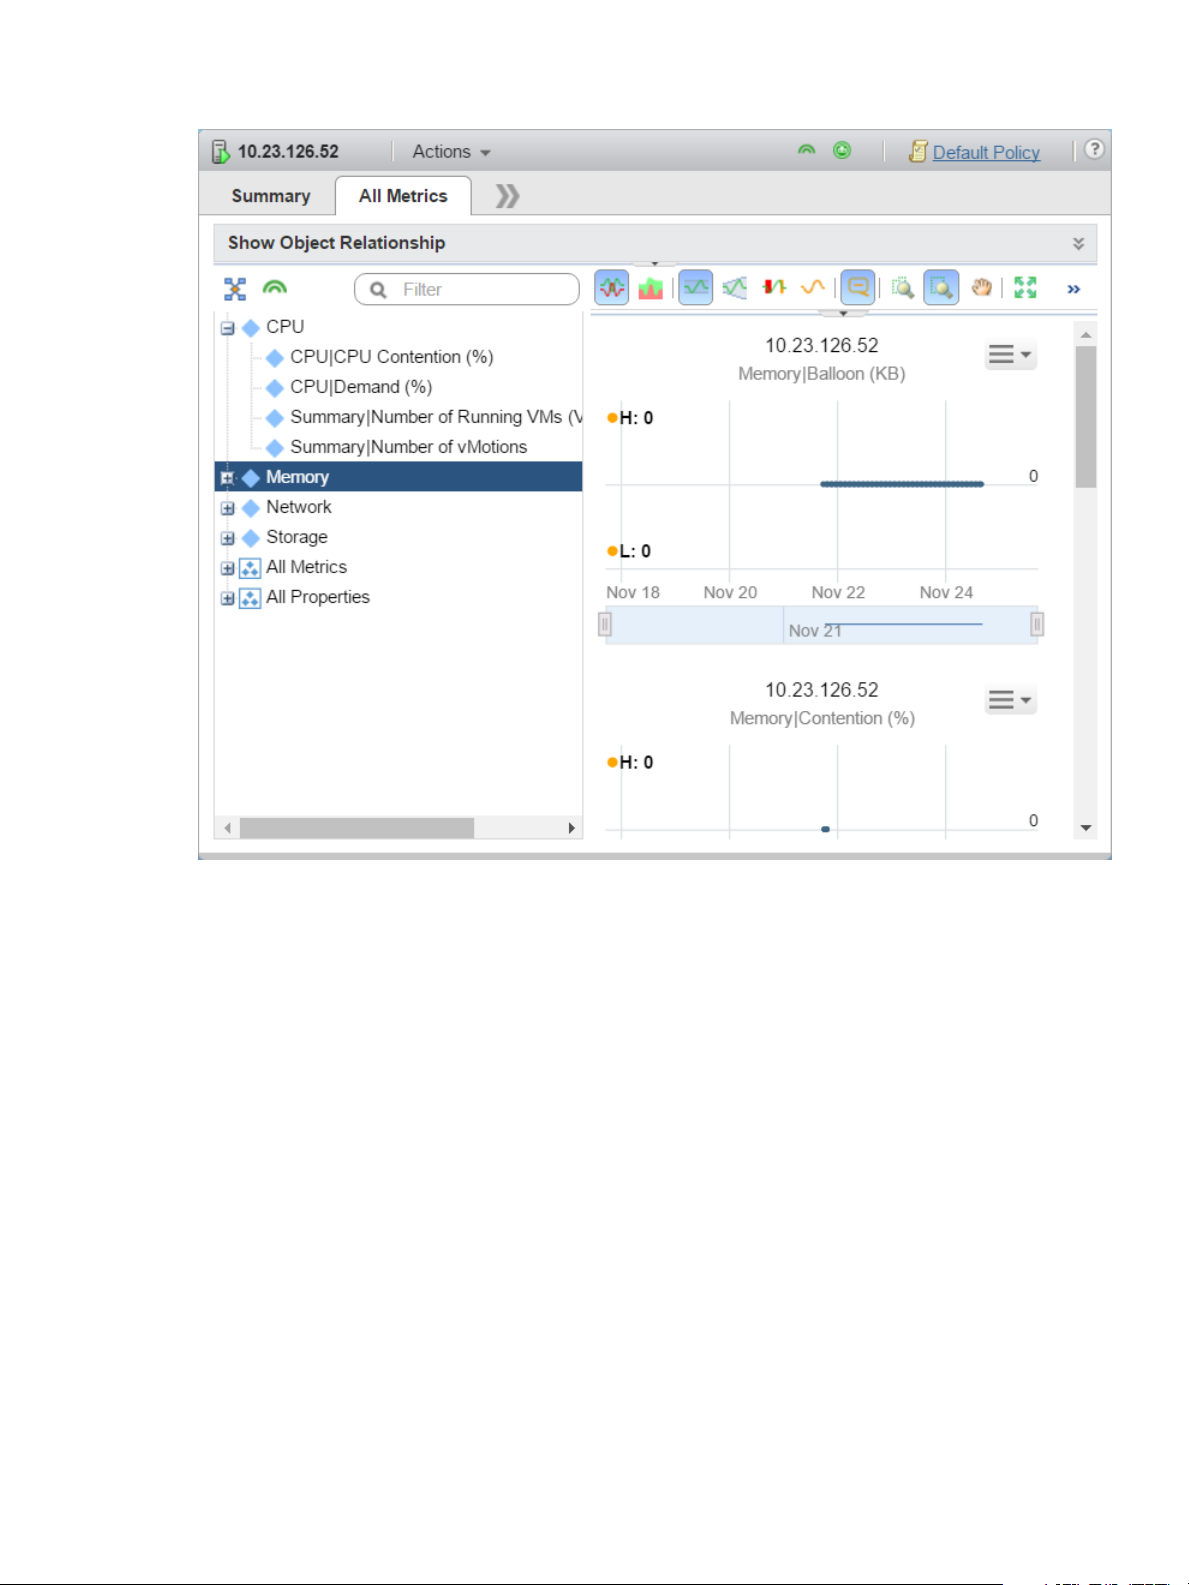
Chapter 1 Monitoring Objects in Your Managed Environment by Using vRealize Operations Manager
To display the metrics contained within a group, click the plus sign next to the group. You can double-click a
group to populate the chart window with a separate chart for each of the metrics in the group. In the
screenshot above, the metrics of the memory group populate the chart window.
VMware, Inc. 45
Page 46

vRealize Operations Manager User Guide
Table 1‑1. CPU Metric Group
Metric Description
CPU|CPU contention (%) This metric shows the percentage of time the VMs in the
CPU|Demand (%) This metric shows the amount of CPU resources a VM
ESXi hosts are unable to run because they are contending
for access to the physical CPUs. The number shown is the
average number for all VMs. The number will be lower
than the highest number experienced by the VM that is
most impacted by CPU contention.
Use this metric to verify if the host can serve all its VMs
eciently. Low contention means that the VM can access
everything it demands to run smoothly. It means that the
infrastructure is providing good service to the application
team.
When using this metric, ensure that the number is within
your expectation. Look at both the relative number and the
absolute number. Relative means a drastic change in value,
meaning that the ESXi is unable to serve the VMs. Absolute
means that the real value itself is high. Investigate why the
number is high. One factor that impacts this metric is CPU
Power Management. If CPU Power Management clocks
down the CPU speed from 3 GHz to 2 GHz, the reduction
in speed is accounted for because it shows that the VM is
not running at full speed.
This metric is calculated in the following way:
cpu|capacity_contention / (200 * summary|
number_running_vcpus)
would use if there were no CPU contention or CPU limit.
This metric represents the average active CPU load for the
past ve minutes.
Keep this number below 100% if you set the power
management to maximum.
This metric is calculated in the following way:
( cpu.demandmhz /
cpu.capacity_provisioned)*100 .
46 VMware, Inc.
Page 47

Chapter 1 Monitoring Objects in Your Managed Environment by Using vRealize Operations Manager
Table 1‑1. CPU Metric Group (Continued)
Metric Description
Summary|Number of running VMs This metric shows the number of running VMs at a given
point in time. The data is sampled every ve minutes.
A large number of running VMs might be a reason for CPU
or memory spikes because more resources are used in the
host. The number of running VMs gives you a good
indicator of how many requests the ESXi host must juggle.
Powered o VMs are not included because they do not
impact ESXi performance. A change in the number of
running VMs can contribute to performance problems. A
high number of running VMs in a host also means a higher
concentration risk, because all the VMs will fail if the ESXi
crashes.
Use this metric to look for a correlation between spikes in
the running VMs and spikes in other metrics such as CPU
contention, or memory contention.
Summary|Number of vMotions This metric shows the number of times a live migration
(vMotion) with no VM downtime or service disruption
took place in a host in the last (x) minutes.
The number of vMotions is a good indicator of stability. In
a healthy environment, this number is stable and relatively
low.
When using this metric, look for a correlation between
vMotions and spikes in other metrics such as CPU
contention and memory contention. Although the vMotion
should not create any spikes, it is highly likely that some
spikes in memory usage contention, and CPU demand and
contention are experienced.
VMware, Inc. 47
Page 48

vRealize Operations Manager User Guide
Table 1‑2. Memory Metric Group
Metric Description
Memory|Balloon (KB) This metric shows the total amount of memory currently
Memory|Contention (%) This metric shows the percentage of time VMs are waiting
Memory|Usage (%) This metric shows the amount of physical memory actively
used by the VM memory control.
Use this metric to monitor how much VM memory the
ESXi has reclaimed through memory ballooning.
The presence of ballooning indicates that the ESXi has been
under memory pressure. ESXi activates ballooning when
its consumed memory reaches a specic threshold. For
example, in vRealize Operations Manager 6.0, the
threshold is >98%.
When using this metric, verify if the size of the ballooning
is increasing. An increase in ballooning indicates that the
lack of memory is not a one time occurrence, and that the
memory shortage is worsening. Look for memory
uctuations which indicate that the VM required the
ballooned out page. If the VM requests a ballooned out
page, this translates into a memory performance problem
for the VM because the page has to be returned from the
disk.
When the balloon target value is greater than the value
shown by the metric, it means that there is more available
memory that can be reclaimed.
to access swapped memory.
Use this metric to monitor ESXi memory swapping. A high
value indicates that the ESXi is running low on memory,
and a large amount of memory is being swapped.
used. The memory usage is displayed as a percentage of
the total congured or available memory. This metric maps
to the Consumed counter in vCenter.
When the metric displays a high value, it indicates that the
ESXi is using a large percentage of available memory.
Check other memory-related metrics to see if the ESXi
requires more memory.
Table 1‑3. Network Metric Group
Metric Description
Network I/O | Aggregate of all instances | Packet Dropped
(%)
Network I/O | Aggregate of all instances | Packet Received
per second
Network I/O | Aggregate of all instances | Packet
Transmied per second
48 VMware, Inc.
This metric shows the percentage of received and
transmied packets dropped in the collection interval.
Use this metric to monitor the reliability and performance
of the ESXi network. A high value indicates that the
network is not reliable and performance decreases.
This metric shows the number of packets received in the
collection interval.
Use this metric to monitor the network usage of the ESXi.
This metric shows the number of packets transmied
during the collection interval.
Use this metric to monitor the network usage of the ESXi.
Page 49

Chapter 1 Monitoring Objects in Your Managed Environment by Using vRealize Operations Manager
Table 1‑4. Storage Metric Group
Metric Description
Datastore I/O|Average observed virtual machine disk I/O
workload
Storage adapter|Aggregate of all instances|Read latency
(ms)
Storage adapter|Aggregate of all instances|Write latency
(ms)
This metric shows the average amount of time required for
a read operation by all the storage adapters.
Use this metric to monitor the read operation of the storage
adapter. A high value indicates that the ESXi is
experiencing storage read operation slowness.
The total latency is the sum of kernel latency and device
latency.
This metric shows the average amount of time required for
a write operation by all the storage adapters.
Use this metric to monitor the write operation performance
of the storage adapter. A high value indicates that the ESXi
is experiencing storage write operation slowness.
The total latency is the sum of the kernel latency and
device latency.
Analyzing the Resources in Your Environment
In addition to monitoring, vRealize Operations Manager provides you with powerful tools for analyzing the
resources and the performance of your virtual environment.
You can use the Analysis tab to analyze the current condition of your virtual environment.
Using Troubleshooting Tools to Resolve Problems
The data provided in the Symptoms, Timeline, Events, and All Metrics tabs help you identify the root
cause of a problem that is not resolved by alert recommendations or simple analysis.
As you are troubleshooting problems with objects in your environment, you can use the troubleshooting
tabs individually or as part of a workow. Each of the tabs displays the collected data in a dierent way.
Sometimes, as you are troubleshooting problems, you move directly from an analysis tab to the All
MetricsAll Metrics tab. Under other circumstances, you know that the Timeline tab might provide the
information that you need.
Symptoms Tab Overview
You can view a list of triggered symptoms for the selected object. You use the symptoms when you are
troubleshooting problems with an object.
The Symptoms tab displays all the triggered symptoms for the currently selected object. A review of the
triggered symptoms provides you with a list of the problems that the currently selected object is
experiencing. If you need to beer understand which symptoms are associated with currently generated
alerts, go to the Alerts tab for the object.
As you evaluate the triggered symptoms, consider the time at which they were created and the
conguration information and trend charts, where applicable.
VMware, Inc. 49
Page 50

vRealize Operations Manager User Guide
Timeline Tab Overview
The timeline provides a view of the triggered symptoms, generated alerts, and events for an object over a
period of time. You use the timeline to identify common trends over time that are contributing to the current
status of objects in your environment.
The timeline provides a three-tier scrolling mechanism that you can use to move quickly through large
spans of time, or slowly and minutely through individual hours when you are focusing on a particular
period of time. To ensure that you have the data that you need, congure the Date Controls to encompass
the problem you are investigating.
It is not always eective to investigate a problem on an individual object by looking only at the object. Use
the ancestor, descendant, and peer options to examine the object in a broader environmental context. This
context often reveals unexpected inuences or consequences for the problem.
The timeline is a tool that provides you a graphical view of paerns. If a symptom is triggered and canceled
by the system at various intervals over time, you can compare the event to other changes to the object or to
the related objects. These changes might be the root cause of the problem.
Events Tab Overview
Events are changes in vRealize Operations Manager metrics that reect changes that occurred on managed
objects because of user actions, system actions, triggered symptoms, or generated alerts on an object. You
use the Events tab to compare the occurrence of events with the generated alerts to determine if a change on
your managed object contributed to the root cause of the alert or other problems with the object.
Events can occur on any object, not just the one listed.
The following vCenter Server activities are some of the activities that generate vRealize Operations Manager
events:
Powering a virtual machine on or o
n
Creating a virtual machine
n
Installing VMware Tools on the guest OS of a virtual machine
n
Adding a newly congured ESX/ESXi system to a vCenter Server system
n
Depending on alert denitions, these events might generate alerts.
If you monitor the same virtual machines with other applications that provide information to
vRealize Operations Manager, and the adapters for those applications are congured to provide change
events, the Events tab includes certain change events that occur on the monitored objects. These change
events might provide further insight into the cause of problems that you are investigating.
Creating and Using Object Details
The views and heat map details provide you with specic data about the object. You use this information to
evaluate problems in more detail. If the current views or heat maps do not provide the information that you
need, you can create one to use as tool as you investigate your specic problem.
50 VMware, Inc.
Page 51

Chapter 1 Monitoring Objects in Your Managed Environment by Using vRealize Operations Manager
Working with Heat Maps
With the vRealize Operations Manager heat map feature, you can locate trouble areas based on the metric
values for objects in your virtual infrastructure. vRealize Operations Manager uses analytics algorithms that
you can use to compare the performance of objects across the virtual infrastructure in real time using heat
maps.
You can use predened heat maps or create your own custom heat maps to compare the metric values of
objects in your virtual environment. vRealize Operations Manager has predened heat maps on the Details
tab that you can use to compare commonly used metrics. You can use this data to plan to reduce waste and
increase capacity in the virtual infrastructure.
What a Heat Map Shows
A heat map contains rectangles of dierent sizes and colors, and each rectangle represents an object in your
virtual environment. The color of the rectangle represents the value of one metric, and the size of the
rectangle represents the value of another metric. For example, one heat map shows the total memory and
percentage of memory use for each virtual machine. Larger rectangles are virtual machines with more total
memory, green indicates low memory use, and red indicates high use.
vRealize Operations Manager updates the heat maps in real time as new values are collected for each object
and metric. The colored bar below the heat map is the legend. The legend identies the values that the
endpoints represent and the midpoint of the color range.
Heat map objects are grouped by parent. For example, a heat map that shows virtual machine performance,
groups the virtual machines by the ESX hosts on which they run.
Create a Custom Heat Map
You can dene an unlimited number of custom heat maps to analyze exactly the metrics that you need.
Procedure
1 In the left pane of vRealize Operations Manager, click Environment.
2 Select an object to inspect from an inventory tree.
3 Click the Heat Map tab under the Details tab.
4 Select the tag to use for rst-level grouping of the objects from the Group By drop-down menu.
If a selected object does not have a value for this tag, it appears in a group called Other Groups.
5 Select the tag to use to separate the objects into subgroups from the Then By drop-down menu.
If a selected object does not have a value for this tag, it appears in a subgroup called Other Groups.
6 Select a Mode option.
Option Description
Instance
General
Track all instances of a metric for an object with a separate rectangle for
each metric.
Pick an specic instance of a metric for each object and track only that
metric.
7 If you selected General mode, select the aribute to use to set the size of the rectangle for each resource
in the Size By list and the aribute to use to determine the color of the rectangle for each object in the
Color By list.
Objects that have higher values for the Size By aribute have larger areas in the heat map display. You
can also select xed-size rectangles. The color varies between the colors you set based on the value of
the Color By aribute.
VMware, Inc. 51
Page 52

vRealize Operations Manager User Guide
In most cases, the aribute lists include only metrics that vRealize Operations Manager generates. If
you select an object type, the list shows all of the aributes that are dened for that object type.
a To track metrics only for objects of a particular kind, select the object type from the Object Type
drop-down menu.
8 If you selected Instance mode, select an aribute kind from the Kind list.
The aribute kind determines the color of the rectangle for each object.
9 Congure colors for the heat map.
a Click each of the small blocks under the color bar to set the color for low, middle, and high values.
The bar shows the color range for intermediate values. You can also set the values to match the
high and low end of the color range.
b (Optional) Enter minimum and maximum color values in the Min Value and Max Value text boxes.
If you leave the text boxes blank, vRealize Operations Manager maps the highest and lowest values
for the Color By metric to the end colors. If you set a minimum or maximum value, any metric at or
beyond that value appears in the end color.
10 Click Save to save the conguration.
The custom heat map you created appears in the list of heat maps on the Heat Maps tab.
Find the Best or Worst Performing Objects for a Metric
You can use heat maps to nd the objects with the highest or lowest values for a particular metric.
Prerequisites
If the combination of metrics that you want to compare is not available in the list of dened heat maps, you
must dene a custom heat map rst. See “Create a Custom Heat Map,” on page 51.
Procedure
1 In the left pane, click Environment and select an object from an inventory tree.
2 Click the Heat Map tab under the Details tab.
All metric heat maps related to the selected resource appear in the list of predened heat maps.
3 In the list of heat maps, click the map to view.
The name and metrics values for each object shown on the heat map appear in the list below the heat
map.
4 Click the column header for the metric you are interested in to change the sort order, so that the best or
worst performing objects appear at the top of the column.
Compare Available Resources to Balance the Load Across the Infrastructure
A heat map can be used to compare the performance of selected metrics across the virtual infrastructure.
You can use this information to balance the load across ESX hosts and virtual machines.
Prerequisites
If the combination of metrics to compare is not available in the list of dened heat maps, you must dene a
custom heat map rst. See “Create a Custom Heat Map,” on page 51.
Procedure
1 In the left pane of vRealize Operations Manager, click Environment.
2 Select an object to inspect from an inventory tree.
52 VMware, Inc.
Page 53

Chapter 1 Monitoring Objects in Your Managed Environment by Using vRealize Operations Manager
3 Click the Heat Map tab under the Details tab.
4 In the list of heat maps, click the one to view.
The heat map of the selected metrics appears, sized and grouped according to your selection.
5 Use the heat map to compare objects and click resources and metric values for all objects in your virtual
environment.
The list of names and metric values for all objects shown on the heat map appear in the list below the
heat map. You can click column headers to sort the list by column. If you sort the list by a metric
column, you can see the highest or lowest values for that metric on top.
6 (Optional) To see more information about an object in the heat map, click the rectangle that represents
this object or click the pop-up window for more details.
What to do next
Based on your ndings, you can reorganize the objects in your virtual environment to balance the load
between ESX hosts, clusters, or datastores.
Using Heat Maps to Analyze Data for Capacity Risk
Planning for capacity risk involves analyzing data to determine how much capacity is available and whether
you make ecient use of the infrastructure.
Identify Clusters That Have Enough Space for Virtual Machines
Identify the clusters in a datacenter that have enough space for your next set of virtual machines.
Procedure
1 In the left pane of vRealize Operations Manager, click Environment.
2 Select vSphere World.
3 Click the Heat Map tab under the Details tab.
4 Select the Which clusters have the most free capacity and least stress? heat map.
5 In the heat map, point to each cluster area to view the percentage of remaining capacity.
A color other than green indicates a potential problem.
6 Click Details in the pop-up window to examine the resources for the cluster or datacenter.
What to do next
Identify the green clusters with the most capacity to store virtual machines.
Examine Abnormal Host Health
Identifying the source of a performance problem with a host involves examining its workload.
Procedure
1 In the left pane of vRealize Operations Manager, click Environment.
2 Select vSphere World.
3 Click the Heat Map tab under the Details tab.
4 Select the Which hosts currently have the most abnormal workload? heat map.
5 In the heat map, point to the cluster area to view the percentage of remaining capacity.
A color other than green indicates a potential problem.
6 Click Details for the ESX host in the pop-up window to examine the resources for the host.
VMware, Inc. 53
Page 54

vRealize Operations Manager User Guide
What to do next
Adjust workloads to balance resources as necessary.
Identify Datastores with Enough Space for Virtual Machines
Identify the datastores that have the most space for your next set of virtual machines.
Procedure
1 In the left pane of vRealize Operations Manager, click Environment.
2 Select vSphere World.
3 Click the Heat Map tab under the Details tab.
4 Select the Which datastores have the highest disk space overcommitment and the lowest time
remaining? heat map.
5 In the heat map, point to each datacenter area to view the space statistics.
6 If a color other than green indicates a potential problem, click Details in the pop-up window to
investigate the disk space and disk I/O resources.
What to do next
Identify the datastores with the largest amount of available space for virtual machines.
Identify Datastores with Wasted Space
To improve the eciency of your virtual infrastructure, identify datastores with the highest amount of
wasted space that you can reclaim .
Procedure
1 In the left pane of vRealize Operations Manager, click Environment.
2 Select vSphere World.
3 Click the Heat Map tab under the Details tab.
4 Select the Which datastores have the most wasted space and total space storage? heat map.
5 In the heat map, point to each datacenter area to view the waste statistics.
6 If a color other than green indicates a potential problem, click Details in the pop-up window to
investigate the disk space and disk I/O resources.
What to do next
Identify the red, orange, or yellow datastores with the highest amount of wasted space.
Identify the Virtual Machines with Resource Waste Across Datastores
Identify the virtual machines that waste resources because of idle, oversized, or powered-o virtual machine
states or because of snapshots.
Procedure
1 In the left pane of vRealize Operations Manager, click Environment.
2 Select vSphere World.
3 Click the Heat Map tab under the Details tab.
4 Select the For each datastore, which VMs have the most wasted disk space? heat map.
5 In the heat map, point to each virtual machine to view the waste statistics.
54 VMware, Inc.
Page 55

Chapter 1 Monitoring Objects in Your Managed Environment by Using vRealize Operations Manager
6 If a color other than green indicates a potential problem, click Details for the virtual machine in the
pop-up window and investigate the disk space and I/O resources.
What to do next
Identify the red, orange, or yellow virtual machines with the highest amount of wasted space.
Examining Relationships in Your Environment
Most objects in an environment are related to other objects in that environment. The Environment tab shows
how objects in your environment are related. You use this display to troubleshoot problems that might not
be about the object that you originally chose to examine. For example, a problem alert on a host might be
because a virtual machine related to the host lacks capacity.
Environment Tab Selections
When you select an object from the inventory of your environment, you can display the related objects in an
overview, list, or map.
The Overview shows all the objects in your environment with a status badge for each object. By clicking
n
a badge, you can see which objects are related.
The List shows only the objects related to your object selection. Depending on the object selected, you
n
can initiate an action or launch an external application.
The Map shows the objects as icons in a hierarchical display. You select an icon to display the number of
n
related objects.
Use the Overview to identify objects in your environment with health, risk, or eciency problems.
Depending on the object type, you might be able to take action on the object from the List view.
Use the Environment Overview to Find Problems
If you are system administrator who is trying to investigate the reason for slow performance in your
environment, you can select key objects such as host systems to see if any related objects such as virtual
machines indicate problems.
Procedure
1 Select Environment > vSphere Hosts and Clusters and select the vSphere World object.
2 Select the Environment tab.
vRealize Operations Manager displays health badges for all objects in the vSphere World.
3 Click each of the host system badges.
The health badge of the virtual machines that belong to the host are highlighted. A host that displays a
good health badge, may have virtual machines that display a warning status.
What to do next
Investigate the reason for the problem. For example, once you determine if the problem is chronic or
temporary, you can decide how to address it. See “Using Troubleshooting Tools to Resolve Problems,” on
page 49.
VMware, Inc. 55
Page 56

vRealize Operations Manager User Guide
User Scenario: Investigate the Root Cause of a Problem by Using the
Troubleshooting Tab Options
One of your customers reports poor performance for his virtual machine, including slowness and fails. This
scenario provides one way that you can use vRealize Operations Manager to investigate the problem based
on information available in the Troubleshooting tabs.
As a virtual infrastructure administrator, you respond to a help ticket in which one of your customers
reports problems with his virtual machine, sales-10-dk. The reported conditions are poor application
performance, including slow load times and slow boot, some of his programs are taking longer and longer
to load, and his les are taking longer to save. Today his programs started to fail and an update failed to
install.
When you look at the Alerts tab for the virtual machine you see an alert for chronic high memory workload
leading to memory stress, where the triggered symptoms indicate memory stress and the recommendation
is to add memory.
Based on past experience, you are not convinced that this alert indicates the root cause, so you review the
Analysis tabs. All of the associated badges are green except for Capacity Remaining, which indicates
memory and disk space problems, and Time Remaining, which has 0 days remaining for memory and disk
space.
From this initial review, you know that problems exist in addition to the memory alert, so you use the
Troubleshooting tabs to do a more thorough investigation.
Review the Triggered Symptoms When You Troubleshoot a Virtual Machine Problem
As a virtual infrastructure administrator, you respond to customer complaints and alerts, and identify
problems that occur on the objects in your environment. You use the information on the Symptoms tab to
help determine whether the triggered symptoms indicate conditions that contribute to the reported or
identied problem.
You must research a problem of poor performance on one of your virtual machines, as reported by one of
your customers. When you view the Alerts tab for the virtual machine, the only alert that appears is named
Virtual Machine is Violating Risk Profile 1 in vSphere Hardening Guide.
When you reviewed the Analysis tabs for the virtual machine, you identied that problems were occurring
with memory and disk space. Now, you focus your aention to the triggered symptoms on the virtual
machine.
The following method of using the Symptoms tab to evaluate problems is provided as an example for using
vRealize Operations Manager, and is not denitive. Your troubleshooting skills and your knowledge of the
particular aspects of your environment determine which methods work for you.
Procedure
1 On the main title bar in vRealize Operations Manager, enter the name of the virtual machine in the
Search text box.
In this example, the virtual machine name is named sales-10-dk.
2 With the virtual machine selected, click the Troubleshooting tab, and click the Symptoms tab.
56 VMware, Inc.
Page 57

Chapter 1 Monitoring Objects in Your Managed Environment by Using vRealize Operations Manager
3 Review and evaluate the triggered symptoms.
Option Evaluation Process
Symptom Are any of the triggered symptoms related to the critical states you see for memory or disk space?
Status Are the symptoms active or inactive? Even inactive symptoms can provide information about the past
state of the object. To add any inactive symptoms, click Status: Active on the toolbar to remove the
lter.
Created On When did the symptoms trigger? How does the time of the triggered symptom compare with the
other symptoms?
Information Can you identify a correlation between the triggered symptoms and the state of the Time Remaining
and Capacity Remaining badges?
From your review, you determine that some of the triggered symptoms are associated with compliance
alerts for the virtual machine as dened in the vSphere Hardening Guide. The violated symptoms triggered for
the alert named vSphere Hardening Guide, which is one of several compliance risk proles provided with
vRealize Operations Manager.
The following symptoms triggered in the compliance alert named Virtual Machine is Violating Risk
Profile 1 in vSphere Hardening Guide:
Independent nonpersistent disks are being used
n
Autologon feature is enabled
n
Copy/paste operations are enabled
n
Users and processes without privileges can remove, connect and modify devices
n
Guests can receive host information
n
Other symptoms also triggered, which are related to memory and time remaining.
Guest file system overall disk space usage reaching critical limit
n
Virtual machine disk space time remaining is low
n
Virtual machine CPU time remaining is low
n
Guest partition disk space usage
n
Virtual machine memory time remaining is low
n
What to do next
Review the symptoms for the object on a timeline. See “Compare Symptoms on a Timeline When You
Troubleshoot a Virtual Machine Problem,” on page 57.
You can nd the vSphere Hardening Guides at hp://www.vmware.com/security/hardening-guides.html.
Compare Symptoms on a Timeline When You Troubleshoot a Virtual Machine Problem
Looking at the triggered symptoms for an object over time allows you to compare triggered symptoms,
alerts, and events when you are troubleshooting problems with objects in your environment. The Timeline
tab in vRealize Operations Manager provides a visual chart on which to see triggered symptoms that you
can use to investigate problems in your environment.
After you identify the following symptoms as possible indicators of the root cause of the reported
performance problems on the sales-10-dk virtual machine, you compare them to each other over time,
looking for interesting or common paerns.
Guest le system overall disk space use reaching critical limit
n
Virtual machine disk space time remaining low
n
VMware, Inc. 57
Page 58

vRealize Operations Manager User Guide
Virtual machine CPU time remaining low
n
Guest partition disk space use
n
Virtual machine memory time remaining is low
n
The following method of evaluating problems using the Timeline tab is provided as an example for using
vRealize Operations Manager and is not denitive. Your troubleshooting skills and your knowledge of the
particulars of your environment determine which methods work for you.
Prerequisites
Review the triggered object symptoms. See “Review the Triggered Symptoms When You Troubleshoot a
Virtual Machine Problem,” on page 56.
Procedure
1 Enter the name of the virtual machine in the Search text box, located on the main title bar.
In this example, the virtual machine name is sales-10-dk.
2 Click the Troubleshooting tab and click the Timeline tab.
3 On the Timeline toolbar, click Date Control and select a time that is on or before the reference
symptoms were triggered.
The default time range is the last 6 hours. For a broader view of the virtual machine over time,
congure a range that includes triggered symptoms and generated alerts.
4 To view the point at which the symptoms were triggered and to identify which line represents which
symptom, drag the timeline week, day, or hour section left and right across the page.
5 Click Select Event Type and select all the event types.
Consider whether events correspond to triggered symptoms or generated alerts.
6 In the Related Hierarchies list in the upper left pane, click vSphere Hosts and Clusters.
The available ancestors and descendant objects depend on the selected hierarchy.
7 To see if the host is experiencing a contributing problems, click Show Ancestor Events.
Consider whether the host has symptoms, alerts, or events that provide you with more information
about memory or disk space issues.
Comparing virtual machine symptoms to host symptoms, and looking at the symptoms over time indicates
the following trends:
The host resource usage, host disk usage, and host CPU usage symptoms are triggered for about 10
n
minutes approximately every 4 hours.
The virtual machine guest le system out of space symptom is triggered and canceled over time.
n
Sometimes the symptom is active for an hour and canceled. Sometimes it is active for two hours. But no
more than 30 minutes occur between cancellation and the next triggering of the symptom.
What to do next
Look at events in the context of the analysis badges and alerts. See “Identify Inuential Events When You
Troubleshoot a Virtual Machine Problem,” on page 59.
58 VMware, Inc.
Page 59

Chapter 1 Monitoring Objects in Your Managed Environment by Using vRealize Operations Manager
Identify Influential Events When You Troubleshoot a Virtual Machine Problem
Events are changes to objects in your environment that are based on changes to metrics, properties, or
information about the object. Examining the events for the problematic virtual machine in the context of the
analysis badges and alerts might provide visual clues to the root cause of a problem.
As a virtual infrastructure administrator investigating a reported performance problem with a virtual
machine, you compared symptoms on the timeline and identied interesting behavior around the guest le
system that you want to examine in the context of other badge metrics to determine if you can nd the root
cause of the problem.
The following method of evaluating problems using the Events tab is provided as an example for using
vRealize Operations Manager and is not denitive. Your troubleshooting skills and your knowledge of the
particulars of your environment determine which methods work for you.
Prerequisites
Examine triggered symptoms, alerts, and events over time. See “Compare Symptoms on a Timeline When
You Troubleshoot a Virtual Machine Problem,” on page 57
Procedure
1 Enter the name of the virtual machine in the Search text box, located on the main title bar.
In this example, the virtual machine name is sales-10-dk.
2 Click the Troubleshooting tab and click the Events tab.
3 On the Events toolbar, click Date Control and select a time that is on or before the symptoms were
triggered.
4 Click Select Event Type and select all of the event types.
Consider whether any changes correspond to other events.
5 Click Show Parent Events and click through the badges on the toolbar to review the events.
Consider whether any of the events, which are listed in the data grid below the chart, correspond to
problems with the host that might contribute to the reported problem.
6 Click Show Child Events and click through the badges on the toolbar to review the events.
Consider whether any of the events show problems with the datastore.
Your evaluation shows no particular correlation between the workload or anomalies and the time at which
the guest le system out of space symptom was triggered each time.
Running Actions from vRealize Operations Manager
The actions available in vRealize Operations Manager allow you to modify the state or conguration of
selected objects in vCenter Server from vRealize Operations Manager. For example, you might need to
modify the conguration of an object to address a problematic resource issue or to redistribute resources to
optimize your virtual infrastructure.
The most common use of the actions is to solve problems. You can run them as part of your troubleshooting
procedures or add them as a resolution recommendation for alerts.
When you grant a user access to actions in vRealize Operations Manager, that user can take the granted
action on any object that vRealize Operations Manager manages, and not only on objects that the user can
access outside of vRealize Operations Manager.
Use Actions with vRealize Operations Manager
(hp://link.brightcove.com/services/player/bcpid2296383276001?bctid=ref:video_actions_vrom)
VMware, Inc. 59
Page 60

vRealize Operations Manager User Guide
When you are troubleshooting problems, you can run the actions from the center pane Actions menu or
from the toolbar on list views that contain the supported objects.
When an alert is triggered, and you determine that the recommended action is the most likely way to
resolve the problem, you can run the action on one or more objects.
List of vRealize Operations Manager Actions
The list of actions includes the name of the action, the objects that each one modies, and the object levels at
which you can run the action. You use this information to ensure that you correctly apply the actions as alert
recommendations and when the actions are available in the Actions menu.
Actions and Modified Objects
vRealize Operations Manager actions make changes to objects in your managed vCenter Server instances.
When you grant a user access to actions in vRealize Operations Manager, that user can take the granted
action on any object that vRealize Operations Manager manages, and not only on objects that the user can
access outside of vRealize Operations Manager.
Action Object Levels
The actions are available when you work with dierent object levels, but they modify only the specied
object. If you are working at the cluster level and select Power On VM, all the virtual machines in the cluster
for which you have access permission are available for you to run the action. If you are working at the
virtual machine level, only the selected virtual machine is available.
Table 1‑5. vRealize Operations Manager Actions Affected Objects
Action Modified Object Object Levels
Rebalance Container Virtual Machines
Delete Idle VM Virtual Machines
Set DRS Automation Cluster
Move VM Virtual Machine
Power O VM Virtual Machine
Shut Down Guest OS for VM Virtual Machine
VMware Tools must be installed and running on
the target virtual machines to run this action.
Power On VM Virtual Machine
Delete Powered O VM Virtual Machine
Set Memory for VM
and
Set Memory for VM Power O
Allowed
Virtual Machine
Data Center
n
Custom Data Center
n
Clusters
n
Host Systems
n
Virtual Machines
n
Clusters
n
Virtual Machines
n
Clusters
n
Host Systems
n
Virtual Machines
n
Clusters
n
Host Systems
n
Virtual Machines
n
Clusters
n
Host Systems
n
Virtual Machines
n
Clusters
n
Host Systems
n
Virtual Machines
n
Clusters
n
Host Systems
n
Virtual Machines
n
60 VMware, Inc.
Page 61

Chapter 1 Monitoring Objects in Your Managed Environment by Using vRealize Operations Manager
Table 1‑5. vRealize Operations Manager Actions Affected Objects (Continued)
Action Modified Object Object Levels
Set Memory Resources for VM Virtual Machine
Set CPU Count for VM
and
Set CPU Count for VM Power
O Allowed
Set CPU Resources for VM Virtual Machine
Set CPU Count and Memory for
VM
and
Set CPU Count and Memory for
VM Power O Allowed
Delete Unused Snapshots for VM Snapshot
Delete Unused Snapshots for
Datastore
Virtual Machine
Virtual Machine
Snapshot
Clusters
n
Host Systems
n
Virtual Machines
n
Clusters
n
Host Systems
n
Virtual Machines
n
Clusters
n
Host Systems
n
Virtual Machines
n
Clusters
n
Host Systems
n
Virtual Machines
n
Clusters
n
Host Systems
n
Virtual Machines
n
Clusters
n
Datastores
n
Host Systems
n
Working With Actions That Use Power Off Allowed
Some of the actions provided with vRealize Operations Manager require the virtual machines to shut down
or power o, depending on the conguration of the target machines, to run the actions. You should
understand the impact of the Power O Allowed option before running the actions so that you select the
best options for your target virtual machines.
Power Off and Shut Down
The actions that you can run on your vCenter Server instances include actions that shut down virtual
machines and actions that power o virtual machines. It also includes actions where the virtual machine
must be in a powered o state to complete the action. Whether the virtual machine is shut down or powered
o depends on how it is congured and what options you select when you run the action.
The shut down action shuts down the guest operating system and then powers o the virtual machine. To
shut down a virtual machine from vRealize Operations Manager, the VMware Tools must be installed and
running on the target objects.
The power o action turns the virtual machine o without regard for the state of the guest operating system.
In this case, if the virtual machine is running applications, your user could lose data. After the action is
nished, for example, modifying the CPU count, the virtual machine is returned to the power state it was in
when the action began.
Power Off Allowed and VMware Tools
For the actions where you are increasing the CPU count or the amount of memory on a virtual machine,
some operating systems support the actions if the Hot Plug is congured on the virtual machine, but for
other operating systems, the virtual machine must be in a powered o state to change the conguration. To
accommodate this need where the VMware Tools are not running, the Set CPU Count, Set Memory, and Set
CPU Count and Memory actions include the Power O Allowed option.
VMware, Inc. 61
Page 62

vRealize Operations Manager User Guide
If you select Power O Allowed, and the machine is running, the action veries whether VMware Tools is
installed and running.
If VMware Tools are installed and running, the virtual machine is shut down before completing the
n
action.
If VMware Tools are not running or not installed, the virtual machine is powered o without regard for
n
the state of the operating system.
If you do not select Power O Allowed and you are decreasing the CPU count or memory, or the hot plug is
not enabled for increasing the CPU count or memory, the action does not run and the failure is reported in
Recent Tasks.
Power Off Allowed When Changing CPU Count or Memory
When you run the actions that change the CPU count and the amount of memory, you must consider several
factors to determine if you want to use the Power O Allowed option. These factors include whether you are
increasing or decreasing the CPU or memory and whether the target virtual machines are powered on. If
you increasing the CPU or memory values, whether hot plug is enabled also aects how you apply the
option when you run the action.
How you use Power O Allowed when you are decreasing the CPU count or the amount of memory
depends on the power state of the target virtual machines.
Table 1‑6. Decreasing CPU Count and Memory Behavior Based On Options
Virtual Machine Power State Power Off Allowed Selected Results
On Yes If VMware Tools is installed and
running, the action shuts down the
virtual machine, decreases the CPU or
memory, and powers the machine back
on.
If VMware Tools is not installed, the
action powers o the virtual machine,
decreases the CPU or memory, and
powers the machine back on.
On No The action does not run on the virtual
machine.
O Not applicable. The virtual machine
is powered o.
The action decreases the value and
leaves the virtual machine in a
powered o state.
How you use Power O Allowed when you are increasing the CPU count or the amount of memory
depends on several factors, including the state of the target virtual machine and whether hot plug is
enabled. Use the following information to determine which scenario applies to your target objects.
If you are increasing the CPU count, you must consider the power state of the virtual machine and whether
CPU Hot Plug is enabled when determining whether to apply Power O Allowed.
62 VMware, Inc.
Page 63

Chapter 1 Monitoring Objects in Your Managed Environment by Using vRealize Operations Manager
Table 1‑7. Increasing CPU Count Behavior.
Virtual Machine Power
State CPU Hot Plug Enabled
On Yes No The action increases the CPU
On No Yes If VMware Tools is installed
O Not applicable. The virtual
machine is powered
powered o.
Power Off Allowed
Selected Results
count to the specied
amount.
and running, the action
shuts down the virtual
machine, increases the CPU
count, and powers the
machine back on.
If VMware Tools is not
installed, the action powers
o the virtual machine,
increases the CPU count,
and powers the machine
back on.
Not required. The action increases the CPU
count to the specied
amount.
If you are increasing the memory, you must consider the power state of the virtual machine, whether
Memory Hot Plug is enabled, and whether there is a Hot Memory Limit when determining how to apply
Power O Allowed.
Table 1‑8. Increasing Memory Amount Behavior
Virtual Machine
Power State
On Yes New memory value ≤
On Yes New memory value >
Memory Hot Plug
Enabled Hot Memory Limit
hot memory limit
hot memory limit
Power Off Allowed
Selected Results
No The action increases
the memory the
specied amount.
Yes If VMware Tools is
installed and running,
the action shuts down
the virtual machine,
increases the memory,
and powers the
machine back on.
If VMware Tools is not
installed, the action
powers o the virtual
machine, increases the
memory, and powers
the machine back on.
VMware, Inc. 63
Page 64

vRealize Operations Manager User Guide
Table 1‑8. Increasing Memory Amount Behavior (Continued)
Virtual Machine
Power State
On No Not applicable. The
O Not applicable. The
Memory Hot Plug
Enabled Hot Memory Limit
virtual machine is
powered o.
Actions Supported for Automation
Power Off Allowed
Selected Results
Yes If VMware Tools is
hot plug is not
enabled.
Not applicable. Not required The action increases
installed and running,
the action shuts down
the virtual machine,
increases the memory,
and powers the
machine back on.
If VMware Tools is not
installed, the action
powers o the virtual
machine, increases the
memory, and powers
the machine back on.
the memory the
specied amount.
Recommendations can identify ways to remediate problems indicated by an alert. Some of these
remediations can be associated with actions dened in your vRealize Operations Manager instance. You can
automate several of these remediation actions for an alert when that recommendation is the rst priority for
that alert.
You enable actionable alerts in your policies. By default, automation is disabled in policies. To congure
automation for your policy, you select Administration > Policies > Policy Library. Then, you edit a policy,
access the Alert / Symptom Denitions workspace, and select Local for the Automate seing in the Alert
Denitions pane.
When an action is automated, you can use the Automated and Alert columns in Administration > Recent
Tasks to identify the automated action and view the results of the action.
vRealize Operations Manager uses the automationAdmin user account to trigger automated actions.
n
For these automated actions that are triggered by alerts, the Submied By column displays the
automationAdmin user.
The Alert column displays the alert that triggered the action. When an alert is triggered that is
n
associated to the recommendation, it triggers the action without any user intervention.
The following actions are supported for automation:
Delete Powered O VM
n
Delete Idle VM
n
Move VM
n
Power O VM
n
Power On VM
n
Set CPU Count And Memory for VM
n
Set CPU Count And Memory for VM Power O Allowed
n
Set CPU Count for VM
n
Set CPU Count for VM Power O Allowed
n
Set CPU Resources for VM
n
64 VMware, Inc.
Page 65

Chapter 1 Monitoring Objects in Your Managed Environment by Using vRealize Operations Manager
Set Memory for VM
n
Set Memory for VM Power O Allowed
n
Set Memory Resources for VM
n
Shut Down Guest OS for VM
n
How to Use Alerts and Actions Together for Automation
(hp://link.brightcove.com/services/player/bcpid2296383276001?
bctid=ref:video_vrealize_alerts_actions_automation)
How to Automate an Alert that has an Associated Action
(hp://link.brightcove.com/services/player/bcpid2296383276001?
bctid=ref:video_vrom_automate_alert_with_action)
How to Create and Automate a New Alert with a Symptom Denition and Action
(hp://link.brightcove.com/services/player/bcpid2296383276001?
bctid=ref:video_vrom_create_alert_automate_symptom_denition)
Roles Needed to Automate Actions
To automate actions, your role must have the following permissions:
Create, edit, and import policies in Administration > Policy Management.
n
Create, clone, edit, and import alert denitions in Content > Alert Management.
n
Create, edit, and import recommendation denitions in Content > Recommendations Management.
n
I You set the permissions used to run the actions separately from the alert and recommendation
denition. Anyone who can modify alerts, recommendations, and policies can also automate the action,
even if they do not have permission to run the action.
For example, if you do not have access to the Power O VM action, but you can create and modify alerts and
recommendations, you can see the Power O VM action and assign it to an alert recommendation. Then, if
you automate the action in your policy, vRealize Operations Manager uses the automationAdmin user to run
the action.
Example Action Supported for Automation
For the Alert Denition named Virtual machine has chronic high CPU workload leading to CPU stress,
you can automate the action named Set CPU Count for VM.
When CPU stress on your virtual machines exceeds a critical, immediate, or warning level, the alert triggers
the recommended action without user intervention.
Integration of Actions with vRealize Automation
vRealize Operations Manager restricts actions on objects that vRealize Automation manages, so that the
actions do not violate any constraints set forth by vRealize Automation.
When objects in your environment are managed by vRealize Automation, actions in
vRealize Operations Manager are not available on those objects. For example, if a host or parent object is
being managed by vRealize Automation, actions are not available on that object.
This behavior is true for all actions, including Power VM, Move VM, Rebalance Container, and so on.
For a complete list of actions, see “List of vRealize Operations Manager Actions,” on page 60.
You cannot turn on or turn o the exclusion of actions on vRealize Automation managed objects.
VMware, Inc. 65
Page 66

vRealize Operations Manager User Guide
Actions Determine Whether Objects Are Managed
Actions check the objects in the vRealize Automation managed resource container to determine which
objects are being managed by vRealize Automation.
Actions such as Rebalance Container check the child objects of the data center container or custom data
n
center container to determine whether the objects are managed by vRealize Automation. If the objects
are being managed, the action does not appear on those objects.
The Move VM action checks whether the virtual machine to be moved is being managed by
n
vRealize Automation.
Is the Virtual
Machine
Managed? Result of Move VM Action
Yes The Move VM action does not appear in the vRealize Operations Manager user interface for that
virtual machine.
No The Move VM action moves the virtual machine to a new host, datastore, or new host and
datastore. The Move VM action does not check whether the new host or datastore is being
managed by vRealize Automation.
The Delete Snapshots action checks whether the virtual machine or datastore is being managed by
n
vRealize Automation.
Actions on Objects that vRealize Automation Does Not Manage
For a host or parent object that is not managed by vRealize Automation, only the virtual machines that are
not being managed by vRealize Automation appear in the action dialog, and you can only take action on the
virtual machines that are not being managed by vRealize Automation. If all child objects are being managed
by vRealize Automation, the user interface displays the message No objects are eligible for the
selected action.
If You Attempt to Run an Action on Multiple Objects
If you select multiple objects and aempt to run an action, such as Power O VM, only the objects that are
not being managed by vRealize Automation, which might include a subset of the virtual machines, appear
in the Power O VM action dialog box.
Run Actions From Toolbars in vRealize Operations Manager
When you run actions in vRealize Operations Manager, you change the state of vCenter Server objects from
vRealize Operations Manager. You run one or more actions when you encounter objects where the
conguration or state of the object is aecting your environment. These actions allow you to reclaim wasted
space, adjust memory, or conserve resources.
This procedure for running actions is based on the vRealize Operations Manager Actions menus and is
commonly used when you are troubleshooting problems. The available actions depend on the type of
objects with which you are working. You can also run actions as alert recommendations.
Prerequisites
Verify that the vCenter Adapter is congured to run actions for each vCenter Server instance. See the
n
vRealize Operations Manager Customization and Administration Guide.
Ensure that you understand how to use the Power O Allowed option if you are running Set CPU
n
Count, Set Memory, and Set CPU Count and Memory actions. See “Working With Actions That Use
Power O Allowed,” on page 61.
66 VMware, Inc.
Page 67

Chapter 1 Monitoring Objects in Your Managed Environment by Using vRealize Operations Manager
Procedure
1 In vRealize Operations Manager, select the object in the environment inventory or select one or more
objects it in a list view.
2 Click Actions on the main toolbar or in an embedded view.
3 Select one of the actions.
If you are working with a virtual machine, only the virtual machine is included in the dialog box. If you
are working with clusters, hosts, or datastores, the dialog box that appears includes all objects.
4 Select the check box to run the action on the object, and click OK.
The action runs and a dialog box appears that displays the task ID.
5 To view the status of the job and verify that the job nished, click Recent Tasks or click OK to close the
dialog box.
The Recent Tasks list appears, which includes the task you just started.
What to do next
To verify that the job completed, click Administration in the left pane and click Recent Tasks. Find the task
name or task ID in the list and verify that the status is nished. See “Monitor Recent Task Status,” on
page 69.
Troubleshoot Actions in vRealize Operations Manager
If you are missing data or cannot run actions from vRealize Operations Manager, review the
troubleshooting options.
Verify that your vCenter Adapter is congured to connect to the correct vCenter Server instances, and
congured to run actions. See vRealize Operations Manager Customization and Administration Guide.
Actions Do Not Appear on Object on page 67
n
An action might not appear on an object, such as a host or virtual machine, because that object is being
managed by vRealize Automation.
Missing Column Data in Actions Dialog Boxes on page 68
n
Data is missing for one or more objects in an Actions dialog box, making it dicult to determine if you
want to run the action.
Missing Column Data in the Set Memory for VM Dialog Box on page 68
n
The read-only data columns do not display the current values, which makes it dicult to properly
specify a new memory value.
Host Name Does Not Appear in Action Dialog Box on page 69
n
When you run an action on a virtual machine, the host name is blank in the action dialog box.
Actions Do Not Appear on Object
An action might not appear on an object, such as a host or virtual machine, because that object is being
managed by vRealize Automation.
Problem
Actions such as Rebalance Container might not appear in the drop-down menu when you view the actions
for your data center.
If a data center is managed by vRealize Automation, actions do not appear.
n
If a data center is not managed by vRealize Automation, you can take action on the virtual machines
n
that are not being managed by vRealize Automation.
VMware, Inc. 67
Page 68

vRealize Operations Manager User Guide
Cause
When vRealize Automation manages the child objects of a data center or custom data center container, the
actions that are normally available on those objects do not appear, because the action framework excludes
actions on objects that vRealize Automation manages. You cannot turn on or turn o the exclusion of actions
on vRealize Automation managed objects. This behavior is normal.
If you removed the vRealize Automation adapter instance, but did not select the Remove related objects
check box, the actions are still disabled.
To make actions available on the objects in your data center or custom data center, either conrm that
vRealize Automation is not managing the objects, or perform the steps in this procedure to remove the
vRealize Automation adapter instance.
Solution
1 To allow actions on an object, go to your vRealize Automation instance.
2 Make the change in vRealize Automation, such as to move a virtual machine.
Missing Column Data in Actions Dialog Boxes
Data is missing for one or more objects in an Actions dialog box, making it dicult to determine if you want
to run the action.
Problem
When you run an action one or more objects, some of the elds are empty.
Cause
The VMware vSphere adapter has not collected the data from the vCenter Server instance that manages the
object or the current vRealize Operations Manager user does not have privileges to view the collected data
for the object.
Solution
1 Verify that vRealize Operations Manager is congured to collect the data.
2 Verify that you have the privileges necessary to view the data.
Missing Column Data in the Set Memory for VM Dialog Box
The read-only data columns do not display the current values, which makes it dicult to properly specify a
new memory value.
Problem
Current (MB) and Power State columns do not display the current values, which are collected for the
managed object.
Cause
The adapter responsible for collecting data from the vCenter Server on which the target virtual machine is
running has not run a collection cycle and collected the data. This can occur when you recently created an
VMware adapter instance for the target vCenter Server and initiated an action. The VMware vSphere
adapter has a 5-minute collection cycle.
Solution
1 After you create a VMware adapter instance, wait an additional 5 minutes.
2 Rerun the Set Memory for VM action.
The current memory value and the current power state appear in the dialog box.
68 VMware, Inc.
Page 69

Chapter 1 Monitoring Objects in Your Managed Environment by Using vRealize Operations Manager
Host Name Does Not Appear in Action Dialog Box
When you run an action on a virtual machine, the host name is blank in the action dialog box.
Problem
When you select virtual machine on which to run an action, and click the Action buon, the dialog box
appears, but the Host column is empty.
Cause
Although your user role is congured to run action on the virtual machines, you do not have a user roll that
provides you with access to the host. You can see the virtual machines and run actions on them, but you
cannot see the host data for the virtual machines. vRealize Operations Manager cannot retrieve data that
you do not have permission to access.
Solution
You can run the action, but you cannot see the host name in the action dialog boxes.
Monitor Recent Task Status
The Recent Task status includes all the tasks initiated from vRealize Operations Manager. You use the task
status information to verify that your tasks nished successfully or to determine the current state of tasks.
You can monitor the status of tasks that are started when you run actions, and investigate whether a task
nished successfully.
Prerequisites
You ran at least one action as part of an alert recommendation or from one of the toolbars. See “Run Actions
From Toolbars in vRealize Operations Manager,” on page 66.
Procedure
1 In the left pane of vRealize Operations Manager, click the Administration icon.
2 Click Recent Tasks.
3 To determine if you have tasks that are not nished, click the Status column and sort the results.
Option Description
In Progress
Completed
Failed
Maximum Time Reached
Indicates running tasks.
Indicates nished tasks.
Indicates incomplete tasks on at least one object when started on multiple
objects.
Indicates timed out tasks.
4 To evaluate a task process, select the task in the list and review the information in the Details of Task
Selected pane.
The details appear in the Messages pane. If the information message includes No action taken, the task
nished because the object was already in the requested state.
5 To view the messages for an object when the task included several objects, select the object in the
Associated Objects list.
To clear the object selection so that you can view all the messages, press the space bar.
VMware, Inc. 69
Page 70

vRealize Operations Manager User Guide
What to do next
Troubleshoot tasks with a status of Maximum Time Reached or Failed to determine why a task did not run
successfully. See “Troubleshoot Failed Tasks,” on page 70.
Troubleshoot Failed Tasks
If tasks fail to run in vRealize Operations Manager, review the Recent Tasks page and troubleshoot the task
to determine why it failed.
This information is a general procedure for using the information in Recent Tasks to troubleshoot problems
identied in the tasks.
Determine If a Recent Task Failed on page 71
n
The Recent Tasks provide the status of action tasks initiated from vRealize Operations Manager. If you
do not see the expected results, review the tasks to determine if your task failed.
Troubleshooting Maximum Time Reached Task Status on page 71
n
An action task has a Maximum Time Reached status and you do not know the current status to the task.
Troubleshooting Set CPU or Set Memory Failed Tasks on page 72
n
An action task for Set CPU Count or Set Memory for VM has a Failed status in the recent task list
because power o is not allowed.
Troubleshooting Set CPU Count or Set Memory with Powered O Allowed on page 72
n
A Set CPU Count, Set Memory, or a Set CPU Count and Set Memory action indicates that the action
failed in Recent Tasks.
Troubleshooting Set CPU Count and Memory When Values Not Supported on page 73
n
If you run the Set CPU Count or Set Memory actions with an unsupported value on a virtual machine,
the virtual machine might be left in an unusable state and require you to resolve the problem in
vCenter Server.
Troubleshooting Set CPU Resources or Set Memory Resources When the Value is Not Supported on
n
page 74
If you run the Set CPU Resources action with an unsupported value on a virtual machine, the task fails
and an error appears in the Recent Task messages.
Troubleshooting Set CPU Resources or Set Memory Resources When the Value is Too High on
n
page 74
If you run the Set CPU Resources or Set Memory Resources action with a value that is greater than the
value that your vCenter Server instance supports, the task fails and an error appears in the Recent
Tasks messages.
Troubleshooting Set Memory Resources When the Value is Not Evenly Divisible by 1024 on page 75
n
If you run the Set Memory Resources action with a value that cannot convert from kilobytes to
megabytes, the task fails and an error appears in the Recent Task messages.
Troubleshooting Failed Shut Down VM Action Status on page 75
n
A shut down VM action task has a Failed status in the Recent Task list.
Troubleshooting VMware Tools Not Running for a Shut Down VM Action Status on page 76
n
A Shut down VM action task has a Failed status in the Recent Task list and the Message indicates that
VMware Tools were required.
Troubleshooting Failed Delete Unused Snapshots Action Status on page 76
n
A Delete Unused Snapshots action task has a Failed status in the Recent Task list.
70 VMware, Inc.
Page 71

Chapter 1 Monitoring Objects in Your Managed Environment by Using vRealize Operations Manager
Determine If a Recent Task Failed
The Recent Tasks provide the status of action tasks initiated from vRealize Operations Manager. If you do
not see the expected results, review the tasks to determine if your task failed.
Procedure
1 In the left pane of vRealize Operations Manager, click the Administration icon.
2 Click Recent Tasks.
3 Select the failed task in the task list.
4 In the Messages list, locate the occurrences of Script Return Result: Failure and review the
information between this value and <-- Executing:[script name] on {object type}.
Script Return Result is the end of action run and <-- Executing indicates the beginning. The
information provided includes the parameters that are passed, the target object, and unexpected
exceptions that you can use to identify the problem.
Troubleshooting Maximum Time Reached Task Status
An action task has a Maximum Time Reached status and you do not know the current status to the task.
Problem
The Recent Tasks list indicates that a task had a status of Maximum Time Reached.
The task is running past the amount of time that is the default or congured value. To determine the current
status, you must troubleshoot the initiated action.
Cause
The task is running past the amount of time that is the default or congured value for one of the following
reasons:
The action is exceptionally long running and did not nish before the threshold timeout was reached.
n
The action adapter did not receive a response from the target system before reaching the timeout. The
n
action might have completed successfully, but the completion status was not returned to
vRealize Operations Manager.
The action did not start correctly.
n
The action adapter might have an error and be unable to report the status.
n
Solution
Check the state of the target object to determine whether the action completed successfully. If it did not,
continue investigating to nd the root cause.
VMware, Inc. 71
Page 72

vRealize Operations Manager User Guide
Troubleshooting Set CPU or Set Memory Failed Tasks
An action task for Set CPU Count or Set Memory for VM has a Failed status in the recent task list because
power o is not allowed.
Problem
The Recent Tasks list indicates that a Set CPU Count, Set Memory, or Set CPU and Memory task has a status
of Failed. When you evaluate the Messages list for the selected task, you see this message.
Unable to perform action. Virtual Machine found
powered on, power off not allowed
When you increase memory or CPU count, you see this message.
Virtual Machine found powered on, power off not allowed, if hot add is
enabled the hotPlugLimit is exceeded
Cause
You submied the action to increase or decrease the CPU or memory value without selecting the Allow
Power option. When you ran the action where a target object is currently powered on and where
Memory Hot Plug is not enabled for the target object in vCenter Server, the action fails.
Solution
1 Either enable Memory Hot Plug on your target virtual machines in vCenter Server or select Allow
Power when you run the Set CPU Count, Set Memory, or Set CPU and Memory actions.
2 Check your hot plug limit in vCenter Server.
Troubleshooting Set CPU Count or Set Memory with Powered Off Allowed
A Set CPU Count, Set Memory, or a Set CPU Count and Set Memory action indicates that the action failed in
Recent Tasks.
Problem
When you run an action that changes the CPU count, the memory, or both, the action fails even though you
know that the Power O Allowed was selected, the virtual machine is running, and the VMware Tools are
installed and running.
Cause
The virtual machine should shut down the guest operating system before it powers o the virtual machine
to make the requested changes. The shut down process waits 120 seconds for a response from the target
virtual machine, and fails without making changes to the virtual machine.
Solution
1 Check the target virtual machine in vCenter Server to determine if it has jobs running that are delaying
the implementation of the action.
2 Retry the action from vRealize Operations Manager.
72 VMware, Inc.
Page 73

Chapter 1 Monitoring Objects in Your Managed Environment by Using vRealize Operations Manager
Troubleshooting Set CPU Count and Memory When Values Not Supported
If you run the Set CPU Count or Set Memory actions with an unsupported value on a virtual machine, the
virtual machine might be left in an unusable state and require you to resolve the problem in vCenter Server.
Problem
You cannot power on a virtual machine after you successfully run the Set CPU Count or Set Memory
actions. When you review the messages in Recent Tasks for the failed Power On VM action, you see
messages stating that the host does not support the new CPU count or new memory value.
Cause
Because of the way that vCenter Server validates changes in the CPU and memory values, you can use the
vRealize Operations Manager actions to change the value to an unsupported amount if you run the action
when the virtual machine is powered o.
If the object was powered on, the task fails, but rolls back any value changes and powers the machine back
on. If the object was powered o, the task succeeds, the value is changed in vCenter Server, but the target
object is left in a state where you cannot power it on using the actions or in vCenter Server without
manually changing the CPU or memory to a supported value.
Solution
1 In the left pane of vRealize Operations Manager, click the Administration icon.
2 Click Recent Tasks.
3 In the task list, locate your failed Power On VM action, and review the messages associated with the
task.
4 Look for a message that indicates why the task failed.
For example, if you ran a Set CPU Count action on a powered o virtual machine to increase the CPU
count from 2 to 4, but 4 CPUs is not supported by the host. The Set CPU tasks reported that it
completed successfully in recent tasks. However, when you aempt to power on the virtual machine,
the tasks fails. In this example the message is Virtual machine requires 4 CPUs to operate, but the
host hardware only provides 2.
5 Click the object name in the Recent Task list.
The main pane updates to display the object details for the selected object.
6 Click the Actions menu on the toolbar and click Open Virtual Machine in vSphere Client.
The vSphere Web Client opens with the virtual machine as the current object.
7 In the vSphere Web Client, click the Manage tab and click VM Hardware.
8 Click Edit.
9 In the Edit Seings dialog box, change the CPU count or memory to a supported value and click OK.
You can now power on the virtual machine from the Web client or from vRealize Operations Manager.
VMware, Inc. 73
Page 74

vRealize Operations Manager User Guide
Troubleshooting Set CPU Resources or Set Memory Resources When the Value is Not Supported
If you run the Set CPU Resources action with an unsupported value on a virtual machine, the task fails and
an error appears in the Recent Task messages.
Problem
The Recent Tasks list indicates that a Set CPU Resource or Set Memory Resource action has a state of Failed.
When you evaluate the Messages list for the selected task, you see a message similar to the following
examples.
RuntimeFault exception, message:[A specified parameter was not correct.
spec.cpuAllocation.reservation]
RuntimeFault exception, message:[A specified parameter was not correct.
spec.cpuAllocation.limits]
Cause
You submied the action to increase or decrease the CPU or memory reservation or limit value with an
unsupported value. For example, if you supplied a negative integer other than -1, which sets the value to
unlimited, vCenter Server could not make the change and the action failed.
Solution
Run the action with a supported value.
u
The supported values for reservation include 0 or a value greater than 0. The supported values for limit
include -1, 0, or a value greater than 0.
Troubleshooting Set CPU Resources or Set Memory Resources When the Value is Too High
If you run the Set CPU Resources or Set Memory Resources action with a value that is greater than the value
that your vCenter Server instance supports, the task fails and an error appears in the Recent Tasks messages.
Problem
The Recent Tasks list indicates that a Set CPU Resource or Set Memory Resource action has a state of Failed.
When you evaluate the Messages list for the selected task, you see messages similar to the following
examples.
If you are working with Set CPU Resources, the information message is similar to the following example,
where 1000000000 is the supplied reservation value.
Reconfiguring the Virtual Machine Reservation to:[1000000000] Mhz
The error message for this action is similar to this example.
RuntimeFault exception, message:[A specified parameter was not correct. reservation]
If you are working with Set Memory Resources, the information message is similar to the following
example, where 1000000000 is the supplied reservation value.
Reconfiguring the Virtual Machine Reservation to:[1000000000] (MB)
The error message for this action is similar to this example.
RuntimeFault exception, message:[A specified parameter was not correct.
spec.memoryAllocation.reservation]
74 VMware, Inc.
Page 75

Chapter 1 Monitoring Objects in Your Managed Environment by Using vRealize Operations Manager
Cause
You submied the action to change the CPU or memory reservation or limit value to a value greater than the
value supported by vCenter Server, or the submied reservation value is greater than the limit.
Solution
Run the action using a lower value.
u
Troubleshooting Set Memory Resources When the Value is Not Evenly Divisible by 1024
If you run the Set Memory Resources action with a value that cannot convert from kilobytes to megabytes,
the task fails and an error appears in the Recent Task messages.
Problem
The Recent Tasks list indicates that a Set Memory Resource action has a state of Failed. When you evaluate
the Messages list for the selected task, you see a message similar to the following example.
Parameter validation;[newLimitKB] failed conversion to (MB, (KB)[2000] not evenly divisible by
1024
Cause
Because vCenter Server manages memory reservations and limit values in megabytes, but
vRealize Operations Manager calculates and reports on memory in kilobytes, you must provide a value in
kilobytes that is directly convertible to megabytes. To do that, the value must be evenly divisible by 1024.
Solution
Run the action where the reservation and limit values are congured with supported values.
u
The supported values for reservation include 0 or a value greater than 0 that is evenly divisible by 1024.
The supported values for a limit include -1, 0, or a value greater than 0 that is evenly divisible by 1024.
Troubleshooting Failed Shut Down VM Action Status
A shut down VM action task has a Failed status in the Recent Task list.
Problem
The Shut Down VM action did not run successfully.
The Recent Tasks list indicates that a Shut Down VM action has a task status of Failed. When you evaluate
the Messages list for the selected job, you see Failure: Shut down confirmation timeout.
Cause
The shut down process involves shuing down the guest operating system and powering o the virtual
machine. The wait time is 120 seconds to shut down the guest operating system. If the guest operating
system does not shut down in this time, the action fails because the shut down action is not conrmed.
Solution
Check the status of the guest operating system in vCenter Server to determine why is did not shut
u
down in the alloed time.
VMware, Inc. 75
Page 76

vRealize Operations Manager User Guide
Troubleshooting VMware Tools Not Running for a Shut Down VM Action Status
A Shut down VM action task has a Failed status in the Recent Task list and the Message indicates that
VMware Tools were required.
Problem
The Shutdown VM action did not run successfully.
The Recent Tasks list indicates that a Shutdown VM action has a tasks status of Failed. When you evaluate
the Messages list for the selected job, you see VMware Tools: Not running (Not installed).
Cause
The Shutdown VM action requires that VMware Tools be installed and running on the target virtual
machines. If you ran the action on more than one object, then VMware Tools was not installed, or installed
but not running, on at least one of the virtual machines.
Solution
In the vCenter Server instance that manages the virtual machine that failed to run the action, install and
u
start VMware Tools on the aected virtual machines.
Troubleshooting Failed Delete Unused Snapshots Action Status
A Delete Unused Snapshots action task has a Failed status in the Recent Task list.
Problem
The Delete Unused Snapshots action did not run successfully.
The Recent Tasks list indicates that a Delete Unused Snapshots action has a tasks status of Failed. When you
evaluate the Messages list for the selected job, you see this message.
Remove snapshot failed, response wait expired after:[120] seconds,
unable to confirm removal
Cause
The delete snapshot process involves waiting for access to datastores. The wait time is 600 seconds to access
the datastore and delete the snapshot. If the delete request is not passed to the datastore in that time, the
action does not nish the delete snapshot action.
Solution
1 Check the status of the snapshot in vCenter Server to determine if it was deleted.
2 If it was not, submit the delete snapshot request at a dierent time.
Viewing Your Inventory
vRealize Operations Manager collects data from all the objects in your environment and displays a health,
risk, and eciency status for each object.
Survey your entire inventory to get a quick idea of the state of any object or click an object name for more
detailed information. See “Evaluating Object Summary Information,” on page 37.
76 VMware, Inc.
Page 77

Planning the Capacity for Your
Managed Environment Using
vRealize Operations Manager 2
You can use the Projects feature in vRealize Operations Manager to plan for capacity allocations and
upgrades in your virtual environment, or to optimize your existing resources. To plan your upcoming
capacity needs, you create a project that anticipates forthcoming changes that aect the capacity of your
objects.
In addition to creating projects to plan for hardware changes or virtual infrastructure changes, you can
create custom proles and custom data centers to help forecast your capacity needs. With custom proles,
you can determine how many instances of an object can t in your environment depending on the available
capacity and conguration. With custom data centers, you can see capacity analytics and badge
computations based on the objects contained in the custom data center.
How Projects Work
A project is a detailed estimation of the capacity that you must have available in your environment based on
upcoming changes. You can dene projects to add or remove resources from objects such as your
vCenter Server instance, clusters, data centers, hosts, virtual machines, and datastores.
With projects, you plan for changes in capacity, and examine the possible outcomes. You can plan for
increases or decreases in the demand for capacity on your objects.
For example, if you plan to hire more sta in the next month, you must increase the capacity on the objects
that they will use. To plan for this upcoming demand, you can create projects. In your projects, you add
hosts to a data center, add memory and CPUs to a host, and increase the capacity of your virtual machines.
VMware, Inc.
77
Page 78
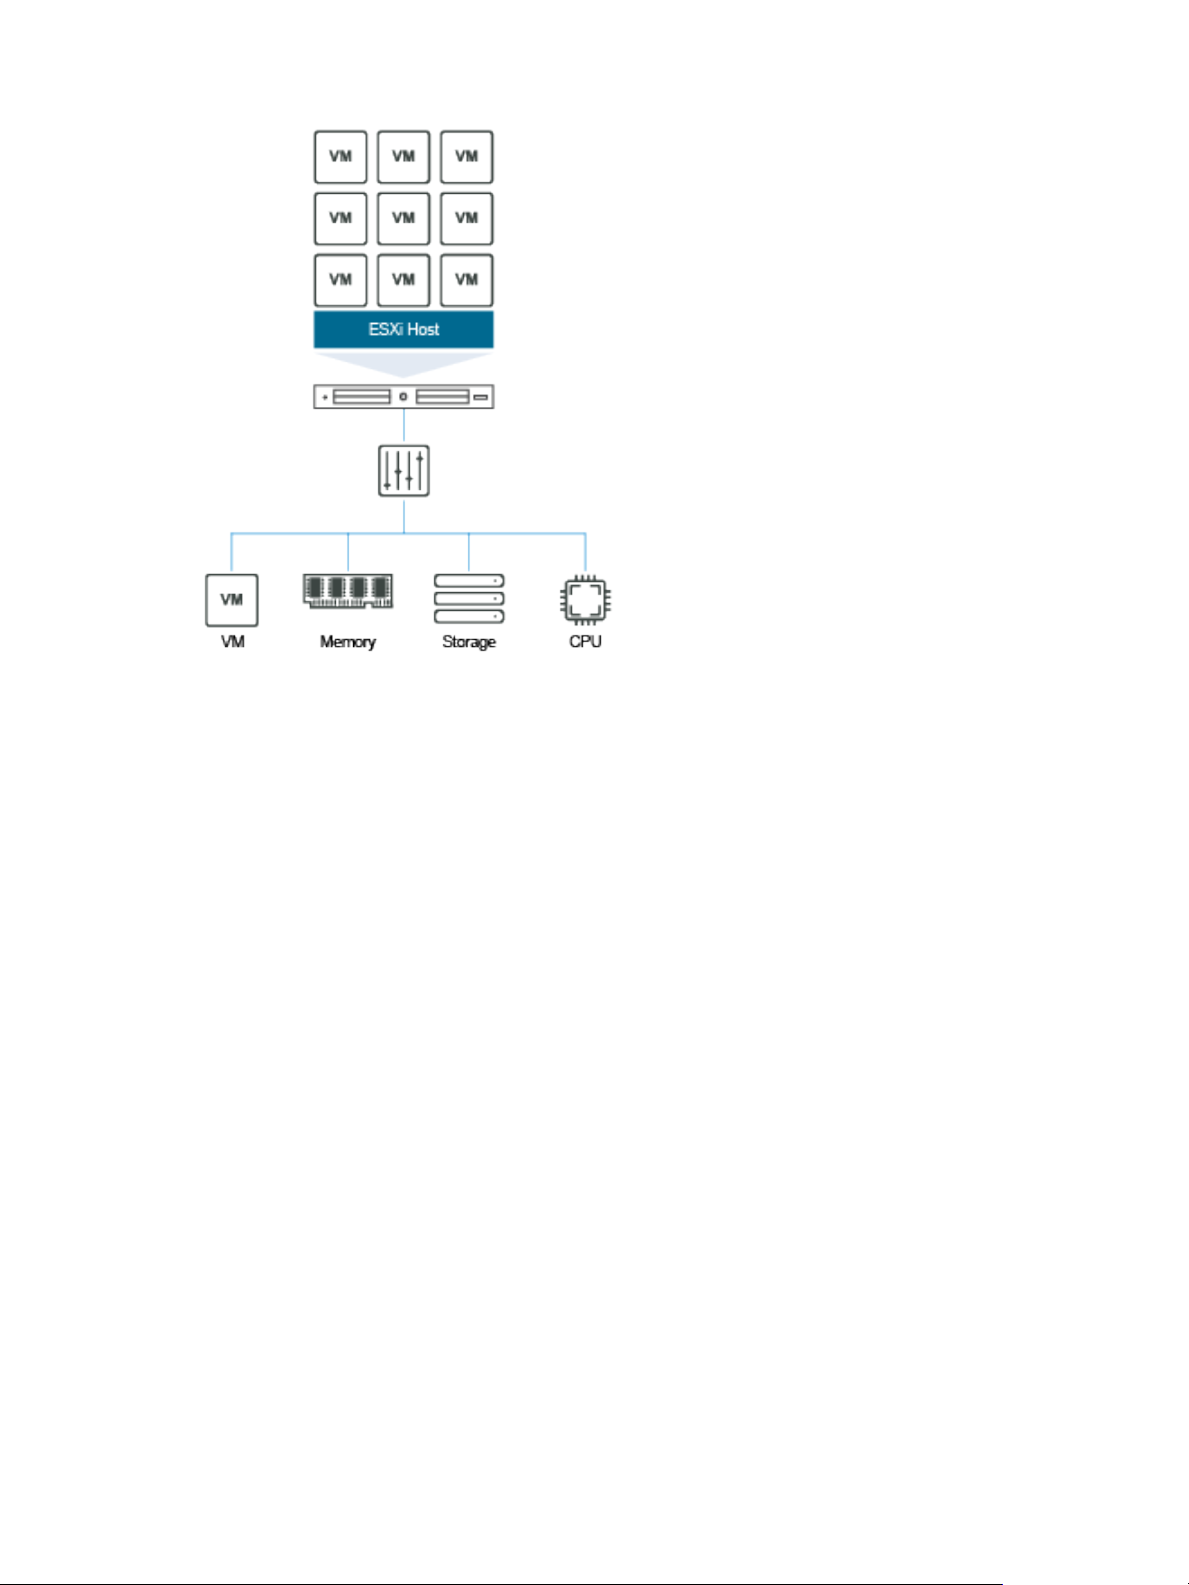
vRealize Operations Manager User Guide
When you create a project, you add one or more capacity scenarios to the project to determine your future
needs. Project scenarios anticipate the changes to capacity or demand that aect the object at an upcoming
time and date. After you save each project, you drag the project to the visualization pane to chart the
capacity forecast. You can see the anticipated capacity needs in the chart based on the values that you
dened in your project scenarios. The visual representation shows how the needs for planned capacity
compare to the resources that you currently have on those objects.
When you are sure that the objects require the planned capacity, you can commit the project to have
vRealize Operations Manager reserve the capacity on those objects.
A project is a supposition about how the capacity and load change on your objects when you change the
conditions in your virtual infrastructure environment. You do not have to implement the changes that your
project represents. By creating the project, you can determine your capacity requirements before you
implement the actual changes.
Projects List
The dened projects appear in a list below the visualization chart. vRealize Operations Manager lters the
list according to the object that you select in the inventory tree. Use the toolbar to create, edit, or delete a
project. To sort by columns in the list, click a column heading. To add a project to the visualization pane,
click the plus icon, or drag the project to the pane between the list and the chart.
Visualization Chart
When you drag one or more projects into the visualization pane, the visualization chart displays each
scenario that you dened in the projects.
The chart displays a numeric value for each scenario that you added to the project. For example, in a project
for a host machine, the scenario named Add Capacity: Percentage is numbered 1.1, and the scenario named
Add Demand: Percentage is 1.2.
To plan another host for your data center, you might also have a second project that includes a scenario
named Add Capacity: Add Host System. The scenario in your second project is 2.1.
78 VMware, Inc.
Page 79

Chapter 2 Planning the Capacity for Your Managed Environment Using vRealize Operations Manager
When you view both projects, the chart displays 1.1, 1.2, and 2.1 to indicate the point in time when each
scenario takes eect.
To view the details about the scenario, move the pointer to the number in the chart.
The projects and scenarios continue to appear in the chart until you delete them or refresh the view.
Project Scenarios Model Changes to Resources
You can use the following project scenarios to forecast capacity.
Table 2‑1. Project Scenarios for Selected Objects
Selected Object Project Scenarios
vCenter Server Capacity
Add or remove host system, datastore, or percentage of capacity.
n
Change absolute capacity.
n
Demand
Add or remove virtual machine or percentage of demand.
n
Change absolute demand.
n
Cluster
Host Capacity
Add, remove, or update hosts.
n
Add, remove, or update datastores.
n
Add or remove virtual machines.
n
Add or remove datastore, or percentage of capacity.
n
Change absolute capacity.
n
Demand
Add or remove virtual machine or percentage of demand.
n
Change absolute demand.
n
VMware, Inc. 79
Page 80

vRealize Operations Manager User Guide
Table 2‑1. Project Scenarios for Selected Objects (Continued)
Selected Object Project Scenarios
Datastore Capacity
Virtual Machine
This chapter includes the following topics:
“Right-Sizing Capacity for Stress-Free Demand and Value,” on page 80
n
“User Scenario: Planning Capacity for an Increase in Workload,” on page 84
n
“Planning Hardware Projects in vRealize Operations Manager,” on page 87
n
“Planning Virtual Machine Projects and Scenarios,” on page 88
n
“Custom Proles in VMware vRealize Operations Manager,” on page 91
n
Add or remove percentage of capacity.
n
Change absolute capacity.
n
Demand
Add or remove virtual machine or percentage of demand.
n
Change absolute demand.
n
Add, change, or remove capacity.
n
Add, change, or remove demand.
n
“Custom Datacenters in VMware vRealize Operations Manager,” on page 91
n
Right-Sizing Capacity for Stress-Free Demand and Value
Performance management and capacity planning vary across organizations and environments. Because the
demand for capacity uctuates in each environment, the top contenders for priority often include high
eciency versus low risk of poor performance. To plan and manage your capacity needs and intelligently
calculate the capacity of your resources, vRealize Operations Manager uses sophisticated models.
With the capacity calculations in vRealize Operations Manager, you can use various sophisticated models to
produce practical correlations between objective measured metrics and subjective goals of acceptable
performance and eciency.
In vRealize Operations Manager, stress involves how high and how long the demand persists relative to the
capacity available, and vRealize Operations Manager uses this value to measure the potential for
performance problems. The higher the stress score, the worse the potential is for degraded performance on
your objects. Depending on the conguration of the policy analysis seings for stress, a score of green might
indicate 0–24 percent of stress. A score of red might indicate more than 50 percent of stress. With the ve-
minute data collections and the intelligent stress calculations, vRealize Operations Manager can easily
identify periods of poor performance.
Demand drives stress. vRealize Operations Manager bases the calculations for right-sizing capacity on past
demand. The goal of right-sizing is to produce a green level of stress, marked by a green Stress badge.
Usable capacity is equal to the total capacity available minus any buers that administrators or users
dened. To measure the right-sized amounts of usable capacity, the capacity calculations use what is called a
stress-free value. Using the demand, stress, and the stress-free value, vRealize Operations Manager
calculates the right size.
The capacity analytics determine the actual and eective demand for resources based on having no
contention. The calculations consider the capacity to be unlimited and free of contention for resources,
which results in no stress on the available capacity. The result is called the stress-free demand or the stressfree value.
80 VMware, Inc.
Page 81

Chapter 2 Planning the Capacity for Your Managed Environment Using vRealize Operations Manager
Where to Find Stress-Free Demand and Stress-Free Value
In some areas of the user interface, vRealize Operations Manager identies capacity as Stress Free Demand,
and in other areas it is identied as Stress Free Value. Both terms mean that the calculated capacity for an
object is free from unacceptable levels of contention and stress, as dened in the policy for the Stress score.
Stress Free Demand appears in Troubleshooting > All Metrics, Views, and Reports.
In Troubleshooting > All Metrics, you can use the metric named Stress Free Demand to examine the
n
CPU demand, disk space allocation and demand, memory consumed, and the vSphere conguration
limit on an object. When you apply this metric to these resources, you can build a metric graph to
display the stress-free demand for an object. The graph displays the high and low stress-free capacity
values over time.
In Content > Views, when you add or edit a view, in the Data and Conguration areas of the
n
workspace, you can use the metric named Stress Free Demand. Use this metric to build views for CPU
demand, disk space allocation and demand, memory consumed, and the vSphere conguration limit.
In Content > Reports, you can use a view that includes the metric named Stress Free Demand to
n
generate a report. The table in the report displays Stress Free Demand as the label. For example, this
metric appears in the report named Cluster CPU Demand (%) Trend View.
Stress Free Value appears on the Object > Analysis > Time Remaining tab, and on the Object > Analysis >
Stress tab.
On the Object > Analysis > Time Remaining tab, you can view the time remaining for CPU demand,
n
memory consumed, disk space demand and allocation, and the vSphere conguration limit. In this
view, the table column name is Stress Free Value.
On the Object > Analysis > Stress tab, the table column name is Stress Free Value. The tables display
n
Stress Free Value as the calculated values for CPU demand, memory consumed, and the vSphere
conguration limit.
Setting the Thresholds for the Stress Score
The analysis seings in the policy that you apply to your objects denes the thresholds for the stress score.
The policy includes default seings for the stress score to be green, yellow, orange, or red. If the seings are
too strict or loose for your environment, you can modify them.
To modify the stress score thresholds, edit the policy that applies to your objects, and click Analysis
. Select an object type and click the lter icon to display the policy analysis seings. In the Stress
area, click the lock icon, expand Stress, and modify the stress thresholds.
In the analysis stress seings, vRealize Operations Manager uses the selected resources, such as Memory
Demand, CPU Demand, and vSphere Conguration Limit to calculate the stress score.
You can set the stress thresholds to your own values, or turn them o. To change a stress score threshold,
click and drag an icon along the slider. To remove a scoring range, such as the default range of 35–49
identied by orange, double-click an icon to disable the range.
VMware, Inc. 81
Page 82

vRealize Operations Manager User Guide
Demand Exceeds is a percentage of capacity. Capacity is also called provisioned capacity. To change the
stress threshold for a resource, double-click the Demand Exceeds percentage, and enter the desired value.
This value denes the point at which vRealize Operations Manager considers the percentage of demand to
be stress. For example, to change the stress threshold for Memory Demand, double-click the current
percentage, such as 70.0 % of capacity, and enter the new percentage of demand to exceed for
vRealize Operations Manager to identify stress.
For each resource, you can change the sliding analysis window value to include the entire range, and set the
peak value to a dierent time depending on how you need vRealize Operations Manager to derive the stress
score.
More About the Stress Score
vRealize Operations Manager calculates the stress zone and stress score for you. The following explanations
cover typical scenarios where Demand does not exceed Capacity.
To determine the stress on an object for a specic time period, you can examine the demand curve to
determine how much of the stress zone the demand occupies. The stress zone is typically where demand
exceeds 70 percent of the total capacity. For example, stress occurs when CPU demand, memory demand, or
memory consumed exceeds 70 percent of the capacity.
In a 60-minute peak period, vRealize Operations Manager bases the Stress score calculation on the following
variables:
Stress threshold, which is the Demand Exceeds seing
n
Stress score threshold, which determines the color of the Stress badge
n
Time range, as in 30 days of analysis
n
Peak detection window, which is the 60-minute peak seing that you can adjust to either a non-zero
n
number of minutes or the entire range.
When the demand exceeds 70 percent, that data point in time is in the Stress zone.
In the policy stress analysis seings, to examine an example graph used to calculate stress, click What is
stress?.
Another example to explain the calculation used for CPU stress is shown here.
82 VMware, Inc.
Page 83
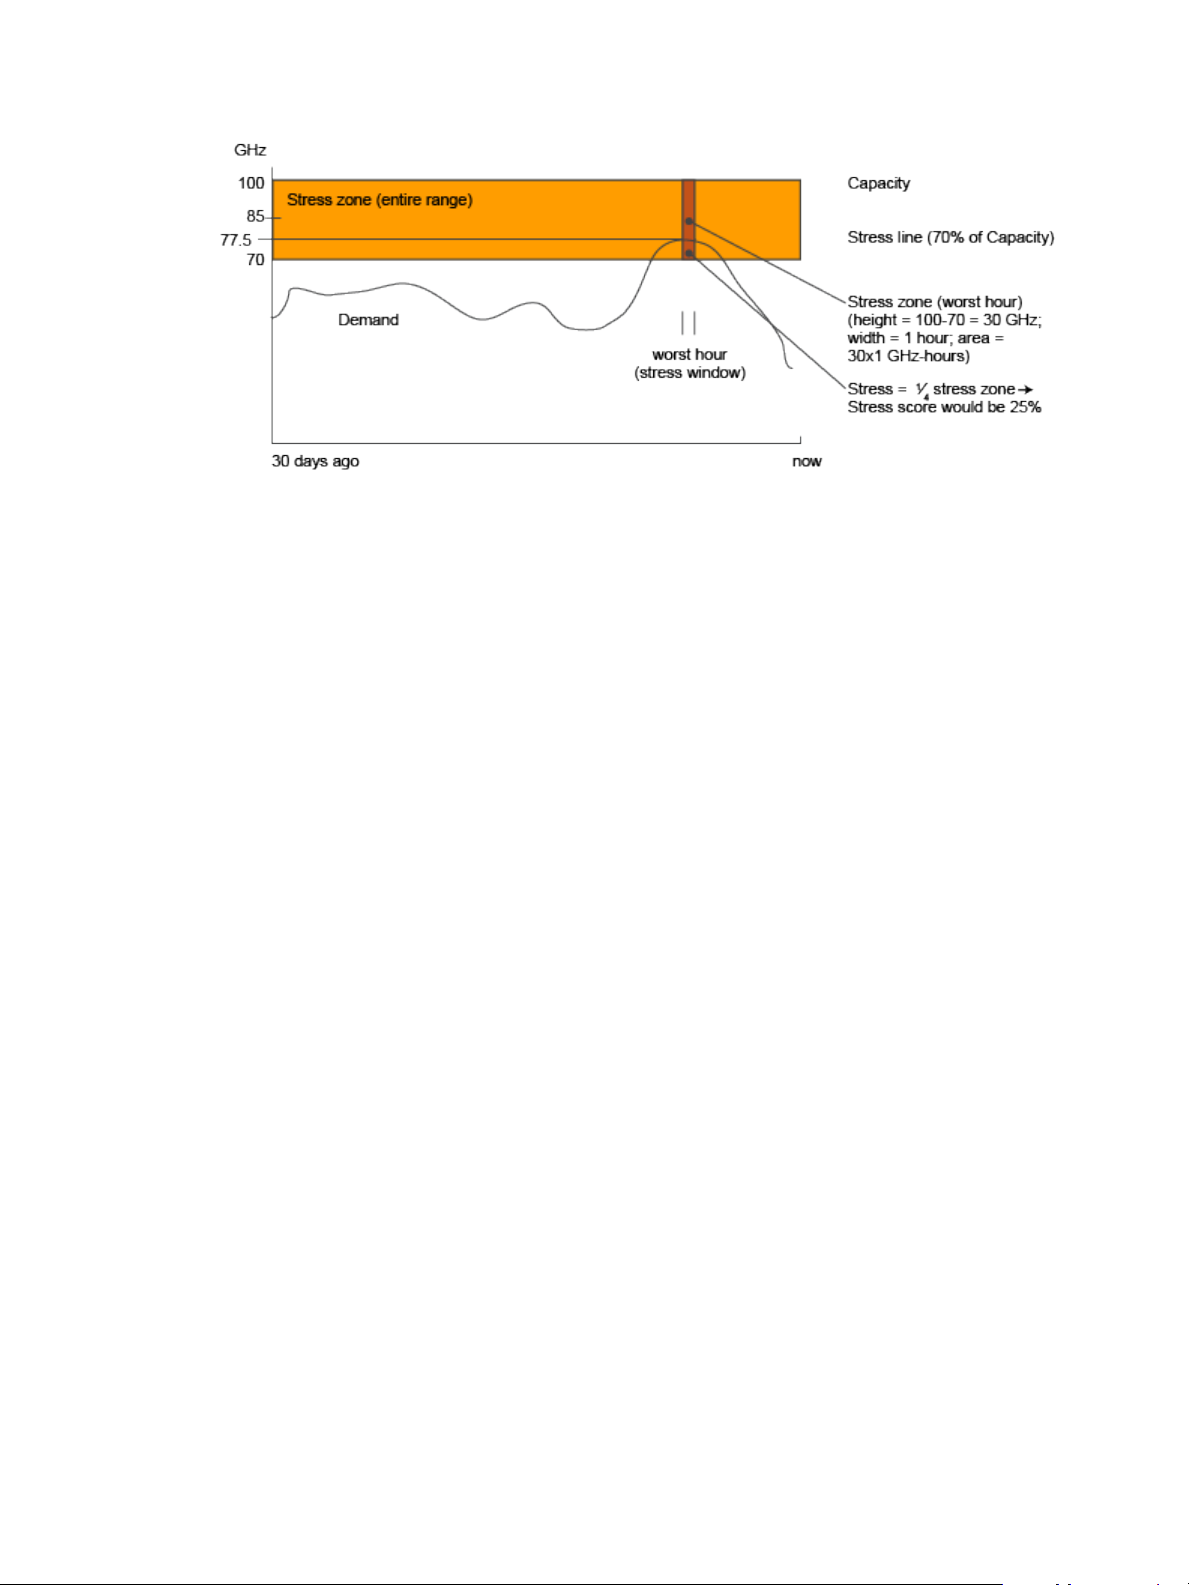
Chapter 2 Planning the Capacity for Your Managed Environment Using vRealize Operations Manager
With a peak detection window size of 60 minutes, vRealize Operations Manager calculates the CPU stress
score. It uses the area under the demand curve and above the stress threshold line as a percentage of the
area covered by the total capacity curve.
Using time stamps of t1 and t2 to identify a 60-minute window in the last 30 days, the stress score depends
on demand, stress threshold, and total capacity over time.
Maximum((Demand - Stress Threshold) ÷ (Total Capacity - Stress Threshold))
This equation applies to the stress calculations for each resource, such as memory demand, memory
consumed, and CPU demand.
If Total Capacity varies during the time range being considered, Stress Threshold must also become
variable, because (Stress Threshold) = (Stress Threshold in %) × (Total Capacity).
Since (Total Capacity) can be a dierent value at a dierent time, as identied by t, then “Stress
Threshold”(t) = “Stress Threshold in %” × “Total Capacity”(t).
As a result, the Stress score is the highest aggregate of demand that exceeds 70 percent of capacity, as a
percentage of the aggregate of capacity within any contiguous interval of 60 minutes in the last 30 days. The
formula for the score is as follows:
Maximum((Demand(t1, t2) - “Stress Threshold”(t1, t2)) ÷ (“Total Capacity”(t1, t2) – “Stress
Threshold”(t1, t2)))
Where:
t1 and t2 are time stamps in the time continuum within the last 30 days.
n
t1 < t2
n
t2 - t1 = 60 minutes
n
Demand(t1, t2) is the demand curve between time t1 and t2.
n
“Stress Threshold”(t1, t2) is the stress threshold curve (as absolute values) between time t1 and t2.
n
“Total Capacity”(t1, t2) is the capacity threshold curve between time t1 and t2.
n
vRealize Operations Manager calculates the aggregate during a contiguous time interval of 60 minutes in
the last 30 days. The Stress score is the percentage of aggregate capacity in the same contiguous time interval
of 60 minutes. An acceptable score yields a green Stress badge.
To view the Stress zone for an object, click Object > Analysis > Stress. Then, examine the Stress breakdown
areas for CPU and memory, the Stress Zone column in the table, and the graph of actual demand.
By calculating the stress score, vRealize Operations Manager provides an intelligent way to evaluate peaks
and uctuations of the capacity of your objects over time.
VMware, Inc. 83
Page 84

vRealize Operations Manager User Guide
User Scenario: Planning Capacity for an Increase in Workload
You are an IT administrator for one of your nancial data centers. You must forecast the capacity
requirements for your virtual infrastructure to plan for an increase in the workload of your cluster and data
center over the next month. To evaluate the demand and supply for capacity on your objects, and forecast
the risk to your current capacity, you create projects and scenarios in vRealize Operations Manager.
Your data center is named Fina_RDDC-01, and includes a cluster named Fina_RDCL-01. You plan to increase
the overall workload on the cluster in this data center by 50 percent in the next month. You must also plan to
add virtual machines and add one or more hosts to this cluster.
In this example, you create a project that includes scenarios to determine the impact of future capacity needs
on your cluster objects. You then create a second project to plan for more capacity needs. Finally, you
examine these projects together in the context of your current capacity so that you can understand the
projected impact of these projects on your future capacity needs.
Prerequisites
Verify that vRealize Operations Manager has collected data for the last several weeks. For information about
connecting vRealize Operations Manager to data sources, see the vRealize Operations Manager Information
Center.
Procedure
1 Create a Sample Project to Increase Workload Capacity on page 84
You are the IT administrator for the nancial data center named Fina_RDDC-01 in your company. You
create a project to plan for an increase in the workload on the cluster named Fina_RDCL-01 by 50
percent in the next month. In the project, you create scenarios that anticipate the eect of the capacity
needs on the hosts, virtual machines, and cluster in the data center.
2 Create a Sample Project to Add a Host and Virtual Machines on page 85
You are the IT administrator for the nancial data center in your company. To plan for capacity needs
on the cluster named Fina_RDCL-01 in the data center named Fina_RDDC-01, you create another project.
In your project, you add virtual machines and a host to the cluster.
3 View the Result of Your Capacity Projects on page 86
You are the IT administrator responsible for the data center named Fina_RDDC-01. You view the eects
of the projects and scenarios that you created on the overall capacity of the cluster in your data center.
Create a Sample Project to Increase Workload Capacity
You are the IT administrator for the nancial data center named Fina_RDDC-01 in your company. You create a
project to plan for an increase in the workload on the cluster named Fina_RDCL-01 by 50 percent in the next
month. In the project, you create scenarios that anticipate the eect of the capacity needs on the hosts,
virtual machines, and cluster in the data center.
You use your new project and scenario to determine what happens to the capacity of the objects in your
environment when you plan for an increase in demand.
Prerequisites
Understand the scope of this sample workow. See “User Scenario: Planning Capacity for an Increase in
n
Workload,” on page 84.
Verify that the cluster named Fina_RDCL-01 in your data center named Fina_RDDC-01 includes multiple
n
hosts and virtual machines.
84 VMware, Inc.
Page 85

Chapter 2 Planning the Capacity for Your Managed Environment Using vRealize Operations Manager
Procedure
1 In the vRealize Operations Manager inventory tree, select your data center named Fina_RDDC-01. Then
select your cluster named Fina_RDCL-01.
2 Click the Projects tab.
3 On the toolbar above the Projects list pane, click Add.
4 In the Projects workspace, enter a name and description for the project.
For example, Fina RDCL Q1 Planning.
5 For the Status, select Planned - no badges .
6 In the workspace, click Scenarios.
7 Under Add Demand, drag the scenario named add percentage of demand to the Scenarios pane.
The scenario is numbered 1.1.
8 In the Conguration pane, congure the demand.
a Click the Implementation Date calendar icon, and select the date one month from today.
b In the Use Global Value text box, enter 50.
9 To add the scenario to your project, click Save and click Close.
vRealize Operations Manager saves the scenario in the project.
What to do next
To add virtual machines and hosts to the cluster named Fina_RDCL-01, create another project and scenario.
See “Create a Sample Project to Add a Host and Virtual Machines,” on page 85.
Create a Sample Project to Add a Host and Virtual Machines
You are the IT administrator for the nancial data center in your company. To plan for capacity needs on the
cluster named Fina_RDCL-01 in the data center named Fina_RDDC-01, you create another project. In your
project, you add virtual machines and a host to the cluster.
You create another project to add a host and virtual machine to the cluster named Fina_RDCL-01 so that you
can see the eect on the capacity of the cluster. The cluster already includes several hosts named
Fina_RDH-01 and Fina_RDH-02.
Prerequisites
Create a project to plan for an increase in the workload on the cluster named Fina_RDCL-01 by 50 percent in
the next month. See “Create a Sample Project to Increase Workload Capacity,” on page 84.
Procedure
1 In the vRealize Operations Manager inventory tree, select the data center named Fina_RDDC-01, and the
cluster named Fina_RDCL-01.
2 Click the Projects tab.
3 On the toolbar above the Projects list pane, click Add.
4 In the Projects workspace, enter a name and description for the project.
For example, Fina RDCL-01 Hosts_VMs Q1 Planning.
5 For the Status, select Planned - no badges .
6 In the workspace, click Scenarios.
VMware, Inc. 85
Page 86

vRealize Operations Manager User Guide
7 Under Add Demand, drag the scenario named add Virtual Machine to the Scenarios pane.
The scenario is numbered 1.1.
8 In the Conguration pane, congure the capacity requirements.
a Under Changes, enter 10 for the number of virtual machines.
b Under Metrics, enter 4 GB for Memory (Consumed).
c For CPU - Allocation model for vCPUs, enter 2.
9 Under Add Capacity, drag the scenario named add Host System to the Scenarios pane.
The scenario is numbered 1.2.
10 In the Conguration pane, congure the host.
a Under Changes, enter 2 for the number of hosts.
b Under Metrics, enter 8 GB for Memory Demand.
c For CPU Allocation, enter 4 for the number of vCPUs.
11 To add the scenario to your project, click Save and click Close.
vRealize Operations Manager saves the scenario in the project.
What to do next
Visualize the eect of your capacity planning projects in the visualization chart. “View the Result of Your
Capacity Projects,” on page 86.
View the Result of Your Capacity Projects
You are the IT administrator responsible for the data center named Fina_RDDC-01. You view the eects of the
projects and scenarios that you created on the overall capacity of the cluster in your data center.
View both of your projects so that you can visualize the anticipated requirements simultaneously. Use the
results to plan your overall capacity needs for the cluster named Fina_RDCL-01 in the data center named
Fina_RDDC-01.
Prerequisites
Create a project so that you can plan to add hosts and virtual machines to the cluster named Fina_RDCL-01.
See “Create a Sample Project to Add a Host and Virtual Machines,” on page 85.
Procedure
1 Select your cluster named Fina_RDCL-01, and click the Projects tab.
2 In the Projects list, select the project named Fina RDCL Q1 Planning, and drag it to the pane just above
the Projects list.
3 Select the project named Fina RDCL-01 Hosts_VMs Q1 Planning, and drag it to the pane just above the
Projects list.
4 To view both projects in the visualization chart, from the Project View drop-down menu above the
chart, select Combine projects in this visualization.
The combined values for your projects appear in the visualization chart.
What to do next
Determine whether to commit the projects so that you can reserve the capacity on the objects in your data
center.
86 VMware, Inc.
Page 87

Chapter 2 Planning the Capacity for Your Managed Environment Using vRealize Operations Manager
Planning Hardware Projects in vRealize Operations Manager
Planning a capacity project for the hardware in your infrastructure involves changes to the host hardware
and datastore hardware. To determine whether you must purchase new hardware, you can create projects.
Before you change your hardware objects, you can create and implement a hardware project to determine
the result of the change. With hardware projects, you can determine the capacity requirements for your
objects before you change the hardware in your environment.
You might need to plan for hardware changes under various circumstances.
If you implement new applications, you must ensure that your objects have enough resources to
n
support the amount of disk space required after you deploy the applications.
If you add hosts to an existing cluster, you must ensure that the cluster can sustain the increase in
n
capacity used during the following quarter of the year.
If you make a conguration change to the demand for memory or CPU on your objects, you must
n
understand the capacity requirements and workloads of your existing objects.
Create a Project to Plan for Hardware Changes
To support an increase in the capacity requirements for the objects in your environment, you can create
projects to determine whether a purchase of new hardware is necessary.
To forecast the capacity requirements for your objects when you add, update, or remove hardware capacity,
you create projects and add scenarios to those projects. This procedure creates a hardware project that
forecasts changes to a host in your cluster.
Prerequisites
vRealize Operations Manager has collected data for the last several weeks. For information about connecting
vRealize Operations Manager to data sources, see the vRealize Operations Manager Information Center.
Procedure
1 In the vRealize Operations Manager inventory tree, select a host.
2 Click the Projects tab.
3 On the toolbar above the visualization area, from the Capacity Container drop-down menu, click Most
Constrained.
4 On the toolbar below the visualization area, click Add.
5 In the Projects workspace, enter a name and description for the project.
6 For the Status, select Planned - no badges .
7 In the workspace, click Scenarios.
8 Under Add Capacity, drag the scenario named add Datastore to the Scenarios area.
9 In the Conguration area, enter the general parameters for the project scenario.
Option Description
Implementation Date
Changes
Populate metrics from
Metrics
Set the date and time to implement the project scenario.
Set the number of datastores to add.
Copy the disk space use and allocation metrics from an existing datastore,
and select an existing datastore.
Set the amount of disk space use and allocation.
VMware, Inc. 87
Page 88

vRealize Operations Manager User Guide
10 To view the eect of your selections in the visualization chart, click Save project and continue editing.
With the Capacity Container set to Most Constrained, the visualization chart might indicate a CPU
shortfall when you implement the project scenario. This shortfall might occur because the CPU
allocation might be greater than the available capacity. In this case, you might need to add CPU capacity
before you implement the project scenario.
11 When you are satised with the capacity forecast based on your seings, click Save to add the scenario
to the project.
12 On the Projects tab, click your project in the list and drag it to the area above the project list.
vRealize Operations Manager applies your project and scenario to the visualization chart. The capacity
forecasted in the project appears as a gray line in the chart.
What to do next
Add the scenario named Add Demand: add percentage of demand to the project, and set the Capacity
Container to Disk Space Allocation. The visualization chart might indicate that when you implement the
project scenario, you have a disk space shortfall. In this case, you might need to add disk space capacity
before you implement the project scenario.
In the visualization chart, evaluate the current available capacity with the actual capacity required if you
change your environment as dened in your project. Determine whether to commit the project so that it
reserves the capacity required for the hardware change.
Planning Virtual Machine Projects and Scenarios
Virtual machine projects help you assess the consequences of changing resources on virtual machines
without applying the changes to your virtual environment. Before you apply changes to your virtual
environment, you can create sample virtual machine projects to model adding or removing virtual machines
to a host or a cluster.
Create a Virtual Machine Project Using Populated Metrics on page 88
n
You can create a project scenario that uses an existing virtual machine prole as a model. The project
scenario simulates the resource requirements when you add one or more virtual machines to a host or
cluster.
Create a Sample Project for a New Virtual Machine on page 89
n
Virtual machine projects assess the consequences of adding a new virtual machine to a cluster or host,
without applying the actual changes to your virtual environment.
Create a Sample Project to Simulate Removing a Virtual Machine on page 90
n
You can create a project that simulates removing one or more virtual machines from a host or a cluster.
You might remove virtual machines when you no longer need them, or when you must move them.
Create a Virtual Machine Project Using Populated Metrics
You can create a project scenario that uses an existing virtual machine prole as a model. The project
scenario simulates the resource requirements when you add one or more virtual machines to a host or
cluster.
When you congure the seings in a project scenario to add virtual machines, you can populate the resource
values for the planned virtual machine from an existing prole. Or, you can copy the values from an existing
virtual machine.
To calculate the capacity metrics values for the virtual machine, vRealize Operations Manager partitions the
capacity for CPU, memory, and disk dimensions, according to the prole that you select.
For information about CPU and memory maximums, see the VMware vSphere documentation.
88 VMware, Inc.
Page 89

Chapter 2 Planning the Capacity for Your Managed Environment Using vRealize Operations Manager
Procedure
1 In the vRealize Operations Manager navigation tree, click the host or cluster that contains the planned
virtual machine reside, and click Projects.
2 Click Add New Project.
3 In the Projects workspace, enter a name and description for the project.
4 For the Status, select Planned - no badges .
5 In the workspace, click Scenarios.
6 Under Add Demand, drag the scenario named add Virtual Machine to the Scenarios area.
7 In the Conguration area, enter the general parameters for the project scenario.
a Select the date and time to implement the project scenario.
b Click Populate metrics from, select an existing prole or an existing virtual machine, and click OK.
Option Action
Copy metric values from a predefined profile.
Copy metric values from an
existing object.
From the Prole drop-down menu, select an existing prole to
populate the metrics values for the planned virtual machine.
From the Existing Virtual Machine drop-down menu, select a virtual
machine to populate the metrics values for the planned virtual
machine. The list displays the virtual machines that reside on the
selected object.
c (Optional) To duplicate virtual machines, increase the virtual machine count.
d To see the eect of the planned virtual machines in the visualization chart, click Save project and
continue editing.
With the Capacity Container set to Most Constrained, the visualization chart might indicate that
you have a CPU shortfall when you implement the project scenario. The shortfall might occur
because the CPU allocation might be greater than the available capacity. In this case, you might
need to add CPU capacity before you implement the project scenario.
8 When you are satised with the capacity forecast based on your seings, click Save to add the scenario
to the project.
9 On the Projects tab, click your project in the list and drag it to the area above the project list.
vRealize Operations Manager applies your project and scenario to the visualization chart. The capacity
forecasted in the project appears as a gray line in the chart.
What to do next
In the visualization chart, evaluate the current available capacity with the actual capacity required if you
change your environment as dened in your project. Determine whether to commit the project so that it
reserves the capacity required for the new virtual machines.
Create a Sample Project for a New Virtual Machine
Virtual machine projects assess the consequences of adding a new virtual machine to a cluster or host,
without applying the actual changes to your virtual environment.
For information about relevant CPU and memory maximums, see the VMware vSphere documentation.
VMware, Inc. 89
Page 90

vRealize Operations Manager User Guide
Procedure
1 Select the destination object in the inventory pane.
If you implement your scenario, the destination object is a cluster or host where you locate the new
virtual machines.
2 Click the Projects tab and click the Add New Project icon.
3 From the Projects workspace, enter the name and a description of the project.
4 Select the Planned status.
5 To add scenarios to this project, click Scenarios.
6 Select the add Virtual Machine scenario and drag it to the Scenarios area.
7 Set the virtual machine count and the conguration for the virtual machine.
vRealize Operations Manager does not require you to set the disk I/O and network I/O use of the new
virtual machines. vRealize Operations Manager uses the average disk I/O and network I/O use across
virtual machines in the host or cluster as an estimation of the new virtual machine use.
8 To see the eect in the visualization chart when your conguration selections are nished, click Save
project and continue editing.
9 To add the scenario to the project, click Save.
10 To close the Project workspace, click Close.
Clicking Close discards all changes. Clicking Save project and continue editing persists any changes
that were not previously saved.
vRealize Operations Manager applies the project to the object you selected. The project shows the current
capacity compared to the expected capacity when you add the virtual machines to the target object.
Create a Sample Project to Simulate Removing a Virtual Machine
You can create a project that simulates removing one or more virtual machines from a host or a cluster. You
might remove virtual machines when you no longer need them, or when you must move them.
Procedure
1 In the vRealize Operations Manager inventory tree, select a host or cluster.
2 Click the Projects tab.
3 On the toolbar below the visualization area, click Add.
4 In the Projects workspace, enter a name and description for the project.
5 For the Status, select Planned - no badges .
6 In the workspace, click Scenarios.
7 Under Remove Demand, drag the scenario named remove selected object to the Scenarios area.
8 In the Conguration area, under Changes, click Select one or more objects to remove.
9 From the list of objects, click the check box for a Virtual machine, and click OK.
10 To add the scenario to the project, click Save.
11 On the Projects tab, click your project in the list and drag it to the area above the project list.
90 VMware, Inc.
Page 91

Chapter 2 Planning the Capacity for Your Managed Environment Using vRealize Operations Manager
vRealize Operations Manager applies your project and scenario to the visualization chart. The capacity
forecasted in the project appears as a gray line in the chart. Compare the current capacity to the expected
capacity if you commit this project to remove one or more virtual machines from the selected object.
What to do next
You can create other projects, and combine or compare the outcomes in the visualization chart.
Custom Profiles in VMware vRealize Operations Manager
A custom prole is a user-dened instance of the capacity allocation and demand for a specic object type.
You can use custom proles to help forecast the capacity needs for your environment.
To determine how many instances of the object can t in your environment, use custom proles with
projects and scenarios. Depending on the available capacity in your environment, you can add one or more
instances of the object that the custom prole capacity requirements represent.
When you create a custom prole for an object type, such as a virtual machine, you create a project and add
a virtual machine scenario to it. In the project scenario, you select your custom prole to populate the
metrics and capacity for that object type to the project scenario. You use the capacity sizing of your custom
prole to forecast the capacity needs for the parent object of the virtual machine.
To determine how many instances of the custom prole object you can include on the parent object, you
select the parent object, click Analysis, and click Capacity Remaining. The custom proles appear on the
What Will Fit section of the Capacity Remaining Breakdown area, and indicate how many instances of the
object t in your environment.
Custom Datacenters in VMware vRealize Operations Manager
A custom data center is a user-dened container for a group of objects that includes clusters, hosts, and
virtual machines. Custom data centers provide capacity analytics and capacity badge computations based
on the objects it contains. You can use custom data centers to forecast and analyze the capacity needs for
your environment.
When you create a custom data center, you can include multiple cluster objects that span multiple
vCenter Server instances. For example, you might have a production environment that spans multiple
clusters, and you must monitor and manage the performance and capacity of the entire production
environment.
After you create your custom data center, you can select it in the list of custom data centers to display a
summary of its health, risk, and eciency. This view displays the top alerts for the data center. To examine
the capacity remaining for the custom data center, click the Analysis tab, and click Capacity Remaining.
You can use your custom data center objects to balance the workload across the clusters in your
environment. Click Home, click Dashboard List, click the dashboard named Workload Distribution, and
view the use of your custom data center in the dashboard.
VMware, Inc. 91
Page 92
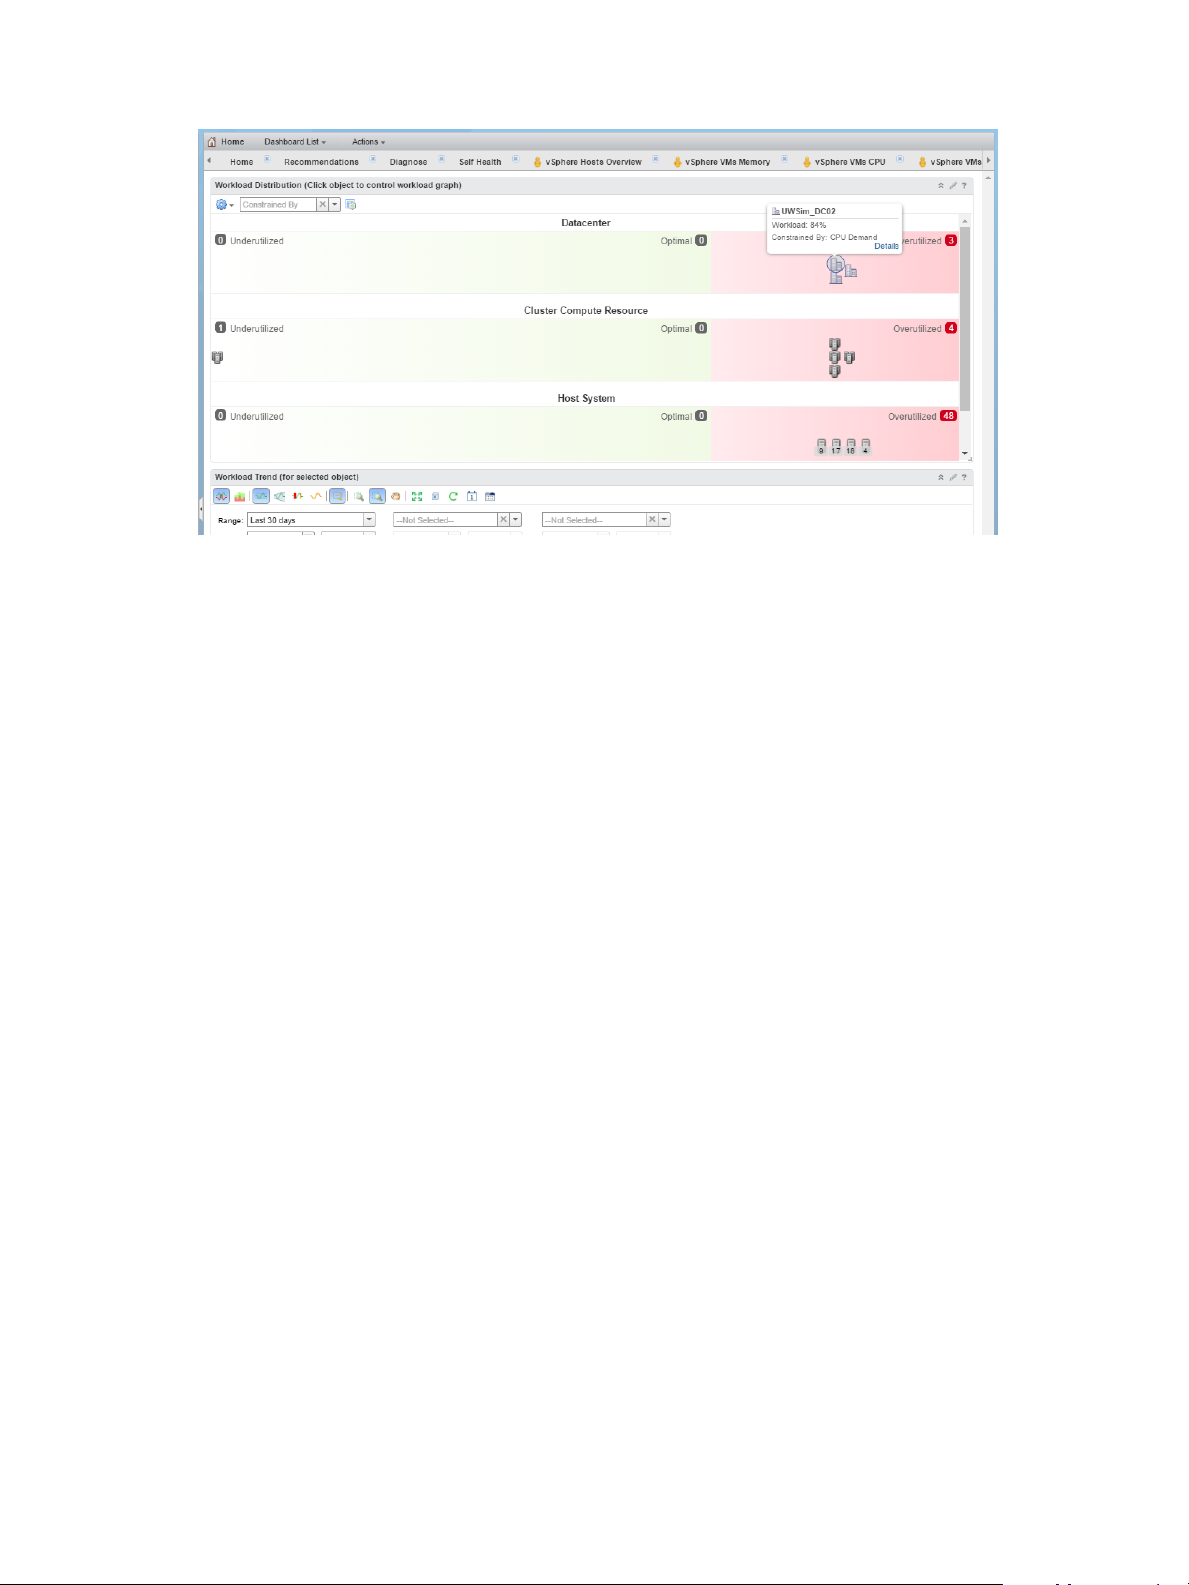
vRealize Operations Manager User Guide
Click the icon for your data center to view its workload trend, CPU and memory workload measurements,
and the vSphere conguration limit.
92 VMware, Inc.
Page 93

Index
A
action integration with vRealize Automation 65
actions
power off allowed 61
recent tasks 69
recommended for automation 64
run 66
shut down virtual machine 60
shut down guest operating system 60
shutdown virtual machine 66
troubleshooting 67–76
troubleshooting missing 67
vCenter Server 59
VMware Tools 61
actions on objects that vRealize Automation
manages 67
add virtual machine project 88
alert
cancel 32, 33
monitor 32, 33
ownership 33
recommendation 35
resolve 35
respond 12–18, 32
suspend 33
alert list
filter 35
sort 33
alert tab 40
alerts
custom dashboard 42
object group 38
object alerts tab 40
object summary tab 37
respond 40
alerts tab
respond 40
using 9
all metrics tab
troubleshooting 43
using 10
analyze data for capacity risk 53
analyzing resources 49
automation, recommended actions 64
B
balance workload, custom data centers 91
best performance 52
C
cancel, alert 32, 33
capacity
in datastores for virtual machines 54
planning 84
remaining in clusters for virtual machines 53
capacity forecast
custom profiles 91
custom data centers 91
capacity planning
custom data centers 77
custom profiles 77
hardware projects 77
virtual machine projects 77
clusters, remaining capacity 53
CPU count, power off allowed action 61
creating custom, create custom 51
custom dashboard
alerts 42
using 42
custom data center 91
custom data centers, workload distribution
dashboard 91
custom data centers in your capacity
planning 77
custom profiles
in project scenarios 91
What Will Fit 91
custom profiles in your capacity planning 77
D
dashboard, custom 42
datastore project scenarios 87
datastore projects 87
datastores
space for virtual machines 54
wasted space 54
details view
resource comparison 52
worst performance 52
VMware, Inc. 93
Page 94

vRealize Operations Manager User Guide
E
email alert, respond 12–18
environment
inventory 76
object relationships 55
environment overview 55
events 59
events tab
troubleshooting 50
troubleshooting tab 59
using 10
F
filter, alert list 35
forecast capacity
custom data centers 91
custom profiles 91
forecast hardware capacity 87
G
glossary 5
H
hardware project scenarios 87
hardware projects 87
hardware projects in your capacity planning 77
heat map colors 51
heat map details, best performance 52
heat maps 51, 53
host, workload 53
host project scenarios 87
host projects 87
how to
automate an alert and associated action 64
create and automate an alert with an
action 64
use alerts and actions for automation 64
I
increase workload with projects 84
integration of actions with vRealize
Automation 65
intended audience 5
inventory
environment overview 76
viewing 76
M
memory, power off allowed 61
metric groups, host 44
metric chart 43
metrics charts tab, user scenario 17
missing actions 67
monitor
alert 32, 33
recent tasks 69
monitor objects 7
O
object
monitor 7
searching 8
object alerts tab 40
object group, manage alerts 38
object relationships, environment 55
object symptoms tab, user scenario 14
objects comparison 52
objects that vRealize Automation manages 67
ownership, alert 33
P
planning, capacity needs 84
planning capacity with projects 77
populated metrics for projects 88
power off allowed actions
CPU count 61
memory 61
problems
User Scenario:Analyze the State of Your
Environment 21
User Scenario:Create a New Alert
Definition 30
User Scenario:Create Dashboards and
Views 31
User Scenario:Examine the Environment
Details 25
User Scenario:Examine the Environment
Relationships 26
User Scenario:Fix the Problem 28
User Scenario:Troubleshoot Problems 23
User Scenario:You See Problems as You
Monitor the State of Your Objects 19
profiles, for projects 88
project, increase workload 84
project scenarios
add virtual machines and host 85
custom profiles 91
hardware 87
project profiles 88
projects
add virtual machines and host 85
add virtual machine from a profile 88
combine results 86
hardware 87, 88
overview 77
planning capacity 77
94 VMware, Inc.
Page 95

Index
populated metrics 88
removing virtual machines 90
R
reading heat maps 51
recent tasks
actions 69
monitor 69
troubleshooting 70–76
recommendation, alert 35
recommendations, respond to alert 18
relationships tab, user scenario 16
resolve, alert 35
resource comparison 52
respond
alert 12–18
alerts 40
email alert 12–18
respond to alert, user scenario 12–18
respond to problems
User Scenario:Analyze the State of Your
Environment 21
User Scenario:Create Dashboards and
Views 31
User Scenario:Create a New Alert
Definition 30
User Scenario:Examine the Environment
Details 25
User Scenario:Examine the Environment
Relationships 26
User Scenario:Fix the Problem 28
User Scenario:Troubleshoot Problems 23
User Scenario:You See Problems as You
Monitor the State of Your Objects 19
right-sizing capacity 80
S
scenarios
user calls with a problem 8–10
you browse the environment
User Scenario:Analyze the State of
Your Environment 21
User Scenario:Create a New Alert
Definition 30
User Scenario:Create Dashboards
and Views 31
User Scenario:Examine the
Environment Details 25
User Scenario:Examine the
Environment
Relationships 26
User Scenario:Fix the Problem 28
User Scenario:Troubleshoot
Problems 23
User Scenario:You See Problems as
You Monitor the State of
Your Objects 19
scoring stress 80
search for object 8
setting stress score thresholds 80
shut down guest operating system, action 60
shut down virtual machine, action 60
snapshots
delete unused action 60
run delete unused action 66
sort, alert list 33
stress calculations 80
stress scoring 80
stress-free demand 80
stress-free value 80
summary tab, using 9, 38
suspend, alert 33
symptoms tab
troubleshooting 49, 56
using 10
symptoms list 56
T
tabs, about 36
tasks, monitor 69
thresholds for stress score 80
timeline 57
timeline tab
troubleshooting 50, 57
user scenario 15
using 10
troubleshooting
actions 67–76
all metrics 43, 49
events 49, 50
recent tasks 70–76
symptoms 49
timeline 49, 50
User Scenario
Troubleshoot Problems 23
Create Dashboards and Views 31
Fix the Problem 28
Analyze the State of Your
Environment 21
Create a New Alert Definition 30
Examine the Environment Details 25
Examine the Environment
Relationships 26
You See Problems as You Monitor
the State of Your Objects 19
VMware, Inc. 95
Page 96

vRealize Operations Manager User Guide
troubleshooting tab
all metrics tab 10
events tab 10
symptoms tab 10
timeline tab 10
user scenario 56
using 10
troubleshooting missing actions
actions 67
missing actions 67
U
use 5
user scenario
respond to alert 12–18
troubleshooting problems 7
troubleshooting tab 56
User Scenario:Analyze the State of Your
Environment 21
User Scenario:Create a New Alert
Definition 30
User Scenario:Create Dashboards and
Views 31
User Scenario:Examine the Environment
Details 25
User Scenario:Examine the Environment
Relationships 26
User Scenario:Fix the Problem 28
User Scenario:Troubleshoot Problems 23
User Scenario:You See Problems as You
Monitor the State of Your Objects 19
vRealize Automation and actions 67
W
waste
across datastores 54
in virtual machines 54
reclaim datastores 54
What Will Fit, custom profiles 91
what-if scenarios, adding new virtual
machines 89
workload, host 53
workload distribution dashboard, custom data
centers 91
worst performance 52
V
videos, automated actions 64
virtual machine
projects 89
shutdown vm action 66
virtual machines
delete powered off action 60
power off action 60
power on action 60
run delete powered off action 66
run power off action 66
run set memory action 66
run power on action 66
run set CPU action 66
set memory action 60
set CPU action 60
waste 54
virtual machine projects 88
virtual machine sample project, removing virtual
machines sample project 90
VMware Tools, actions 61
vRealize Automation action integration 65
96 VMware, Inc.
 Loading...