

Page 1

VIBER X2 Pro™
An instrument for analysing and trending
Manual Ver. 1.0
English
Page 2

2
Page 3

Index
1.0 Important information 4
2.0 Introduction 4
2.1 Scope of supply 5
2.2 Menu and funktions 6
2.3 Menu for vibration 7
3.0 Warning messages 9
4.0 Battery status bar 10
4.1 Changing Battery 10
5.0 How to interpret vibration levels 10
6.0 ISO standard 10816-312 11
7.0 Vibration analysis 12
8.0 Recommended bearing condition levels 13
9.0 Trend View 14
9.1 Create a measurement project 15
9.2 Create a “Route Plan” and edit a project 38
9.3 Trend measurements 40
9.4 Transfer of data to Trend View 42
9.5 General description and viewing trends 51
10.0 Technical data 52
3
Page 4

1 Important information
Safety precautions
Vibration measurement involves measurement on rotating machines. Keep a safe distance to rotating parts and
secure transducers and transducer cables from rotating parts. Always follow internal, local and national
security regulations! When working with weights on the rotor always secure the start switch with a locker and
also use the emergency switch for double safety. This is especially important when the machine is remote
controlled.
VMI takes no responsibility for any accidents on people and machines.
VMI and our authorized dealers will take no responsibility for damages on machines and plants as the result
of the use of VIBER X2 ProTM measurements.
VMI has the aim to improve and develop our work, why surely an upgraded version of this manual will be
distributed in the future. As a result of this, we might change and correct these items in later issues without
further notice. Also changes in the VIBER X2 ProTM equipment may take place that affects this information.
2 Introduction
VIBER X2 Pro™ is designed for maintenance/repairer personnel. It is an excellent tool, for basic condition
monitoring checks, easy to use and reliable for status analyse. The VIBER X2 Pro™ instrument has the
following features:
Accurate measurements for 4 selectable frequency ranges. Gives high reliability.
Real-time measurement of the total vibration level and the Bearing Condition (BC) measures and
displayed simultaneously, facilitates analysis of bearing faults.
Fast and easy fault analysis screen displaying the five highest peaks with amplitude and frequency one
by one.
Measurement quantities and their units and presentation can be selected by the user from the
following list:
o g-value = Acceleration (RMS, Peak or Peak-Peak)
o a = Acceleration (m/s2) (RMS, Peak or Peak-Peak)
o V = Velocity (mm/sec) (RMS, Peak or Peak-Peak)
o V = Velocity (inch/sec) (RMS, Peak or Peak-Peak)
o D = Displacement (mils) (RMS, Peak or Peak-Peak)
o D = Displacement (μm) (RMS, Peak or Peak-Peak)
Bar indicator shows measurement stability.
Bearing Condition measurements in the frequency range (0,5 – 16 kHz).
Fast and easy fault analysis displaying the five highest peaks frequency in Hz or RPM in main screen
display.
Large dynamic range of the vibration signal (up to 50g).
Low power consumption.
High performance accelerometer.
Vibration, danger alarms by red and yellow colour LED’s.
Fast battery charging capacity using an external charger, provided in the delivery.
Display with backlight.
4
Page 5

LED’s
idicato
A complete delivery is:
VIBER X2 Pro™, machine
condition analyzer
Accelerometer, magnet
included
1 m transducer cable
Cable for transfer between
“VIBER X2 Pro” and
computer
Battery charger
VMI “Trend View” software
Manual for instrument and
software
Shoulder bag
Calibration certificate
2.1 Scope of supply
The VIBER X2 PRO™ keypad
* ON/OFF Orange key *MENU and ACCEPT Green key *SAVE key for Route measurement
*Arrow white keys *LED:s
Green LED lights, when any key is pressed.
Yellow LED lights, when the measurement is above the warning set level.
Red LED lights when the measurement is above the danger set level.
5
Page 6

6
Page 7

Frequency range
Frequency of the highest peak
2-400 Hz
2 - 400 Hz
6 – 1600
6 – 1600* Hz
11-3200 Hz
11 to 2000* Hz
10-1000 Hz
10 to 1000 Hz
Frequency
Vibration
Theoretically
Measured
Deviation
Velocity
Displacement
Displacement
Hz
mm/s (RMS)
µm (RMS)
µm (RMS)
%
2
10
795,8
203
-74,5
2,5
10
636,6
540
-15,2 3 10
530,5
549
3,5
5
10
318,3
321
0,85
10
10
159,16
160
0,53
80
10
19,89
20
0,55
The frequency appears as follows:
The Frequency range of the highest peak in relation to the frequency range setting is described in the below
table, the limit of the maximum frequency* of the peak is 1000 Hz.
Reliability is reduced when measuring Displacement with accelerometer and double integration.
7
Page 8
Calibration
lost!
Battery
too low
Shut-off
in 5 sec
Missing
transducer
3 Warning messages
The following message may appear in normal operation:
This message may appear if the calibration data is lost from the permanent FRAM memory
or if the calibration data are corrupted. In such cases, the instrument must be re-calibrated;
otherwise it will measure incorrectly. The message appears only once, and then
default calibration data is used.
When this message appears, the battery voltage is too low to ensure a correct running
condition. The measurements may be invalid! The instrument battery pack must be charged
immediately, using the external charger. In order to temporarily decrease the power
consumption, the backlight will be switched OFF. The instrument can still work, but only
for a short while. If even in this condition the voltage remains low, the instrument will shut
off in 20 sec.
This message appears only if the Auto-shut off setting is enabled. The user may cancel the
shut-off condition, pressing any key except ON/OFF. If no key is pressed the instrument
will shut off in 5 seconds.
This message appears only if the Transducer power setting is enabled and indicates that the
transducer is missing or is out of order.
When the Transducer power setting is disabled, the user has the possibility to use another external source for
the vibration input (a signal generator or a buffered output from another device).
When the instrument starts, the Transducer power is always ENABLED. When this message appears, it will
remain on the screen, even if the transducer is plugged-in. To continue the normal running mode in such a
condition, switch the screen temporarily to another menu. When you come back, the message disappears.
8
Page 9

4 Battery status bar
When the measurement window is activated, a battery symbol appears on the top of
the screen (see page 7) which shows approximately how much battery capacity is left.
If the battery voltage drops below approximately: 3.3 V then the instrument turns off.
When the battery charger is connected, a moving staple moves back and forth, and a
green LED lights up until the battery is fully charged.
4.1 Changing Battery
The unit has an embedded Lithium battery and after a number of years when the
battery is exhausted we recommend that a VMI reseller or service centre makes the
replacement.
5 How to interpret vibration levels
User with no previous experience, we recommend to use the ISO 10816-3 standard.
The standard normally calls for a measure in velocity based on mm/s RMS. To better
understand what this measure means, consider the reading as a mean or average value
of the back and forward motion of the machine. This measure gives a good
understanding of the amount of "break down energy", causing mainly wear and fatigue
in the machine, or the structure.
The instrument measuring the total RMS-value of the vibration in the frequency range.
This RMS value is the square average sum of all the measured vibrations, in the actual
frequency range.
CALCULATION:
If the simultaneous vibration caused by unbalance is (4mm/s), by misalignment (2
mm/s) and by the gear mesh (5 mm/s), then the total vibration measured on the
VIBER X2 Pro is 6.7 mm/s.
Total vibration (RMS) =
9
Page 10
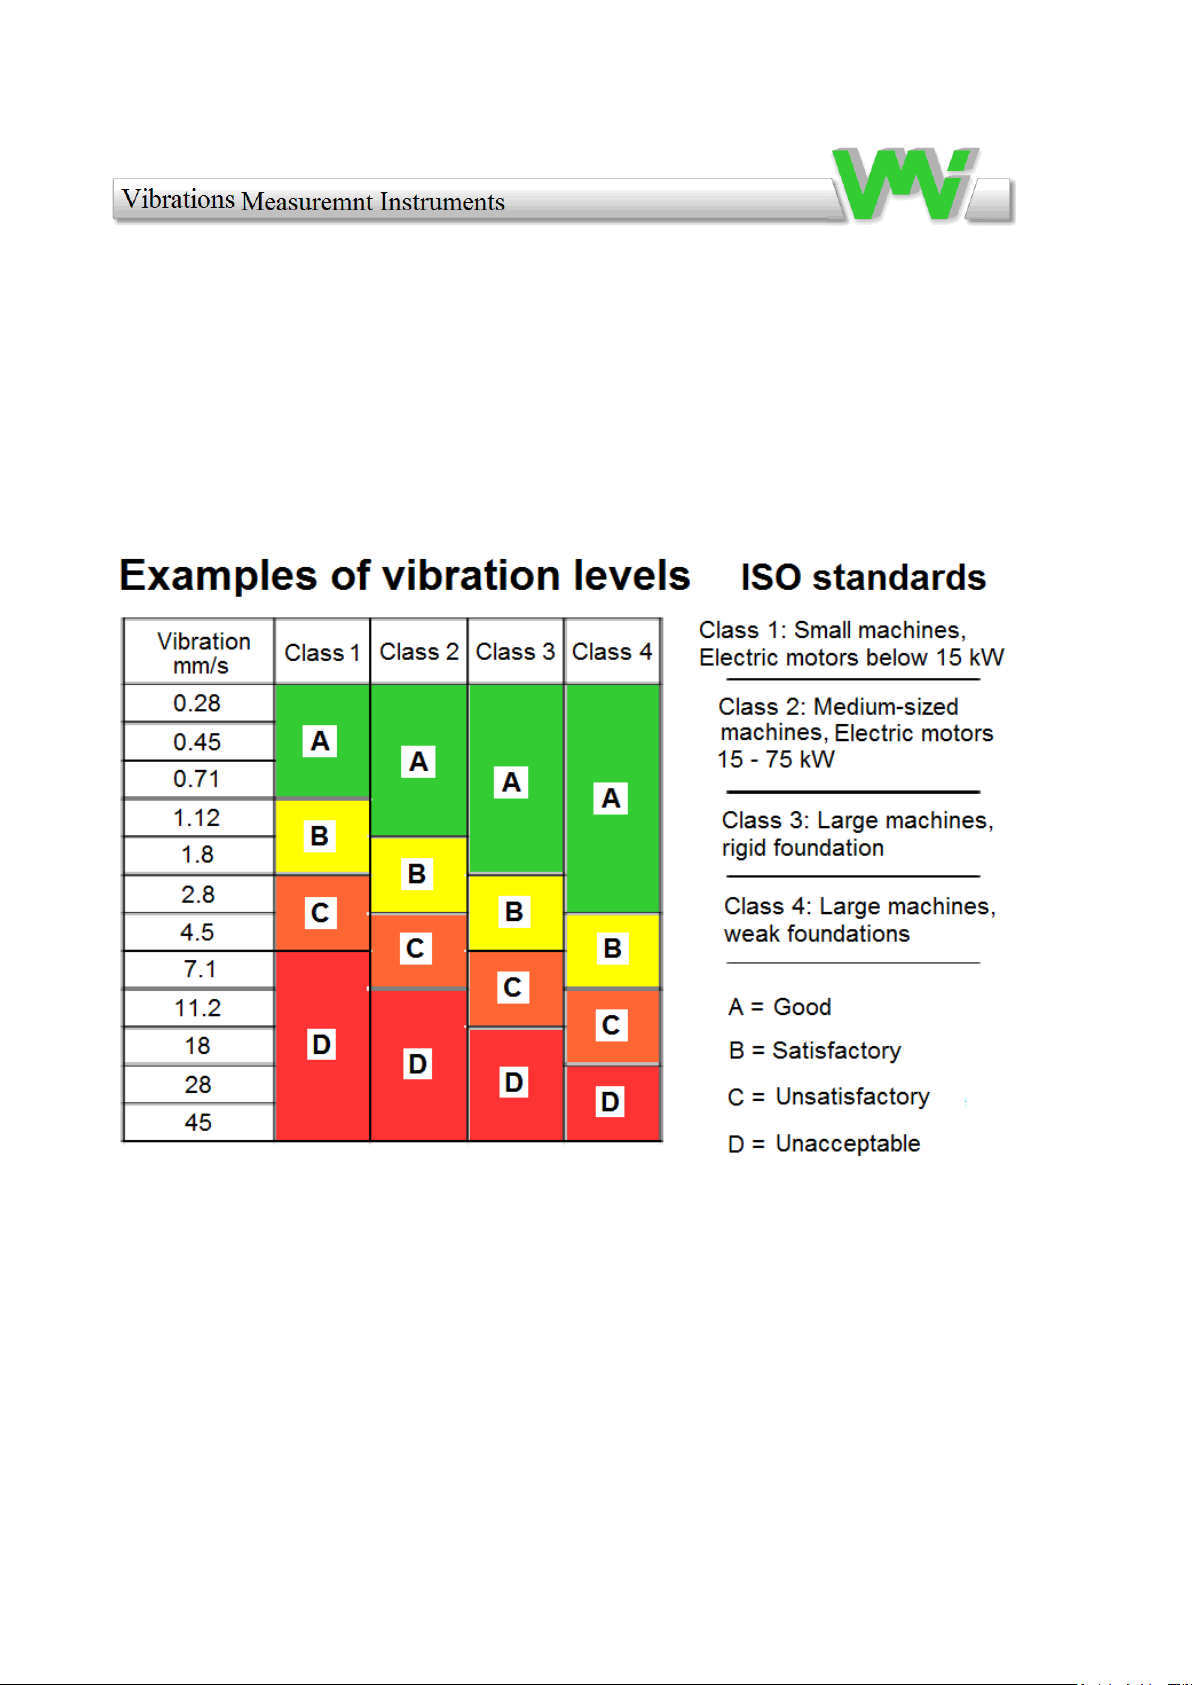
6.0 Excerpt from ISO standard
Iso Standard 10816-3 classifies machines differently depending on whether they are
flexible or rigid (fixed) mounted. This reflects the location of the machine's "rigid
resonances" related to the machine's operating speed.
10
Page 11

7 Vibration analysis
7.1 Recommended vibration levels
The following is an extraction of part of the old standard ISO 2372 class 4, large
machines on flexible foundations, with some common findings added. Use this
simplified list as a first indication, when approaching a newly commissioned machine
or after some time in operation. Investigate the reason for any machine that vibrates
above 3 mm/s RMS.
0 – 3 mm/s 0 – 0,12 in/s
Small vibrations – None or very small bearing wear. Rather low noise level.
3 – 7 mm/s 0,12 – 0,28 in/s
Noticeable vibration levels are often concentrated to some specific part as well as
direction of the machine. Noticeable bearing wear. Seal problems occur in pumps
etc. Increased nois level; try to investigate the reason. Plan an action during next
regular stop. Keep the machine under observation and measure at shorter time
intervals than before to detect a deterioration trend if any. Compare vibrations to
other operating variables.
7 – 11 mm/s 0,28 – 0,43 in/s
Large vibrations and high noise levels. This is detrimental to the safe operation of
the machine. Stop operation if technically or economically possible. Few machines
can withstand this levels without internal or external damage. Reduce any further
running time to an absolute minimum.
≥ 11 mm/s - ≥ 0,43 in/s –
Very large vibrations and high noise levels. This is detrimental to the safe
operation of the machine. Stop operation if technically or economically possible.
Few machines can withstand this level without internal or external damage. Reduce
any further running time to an absolute minimum.
11
Page 12
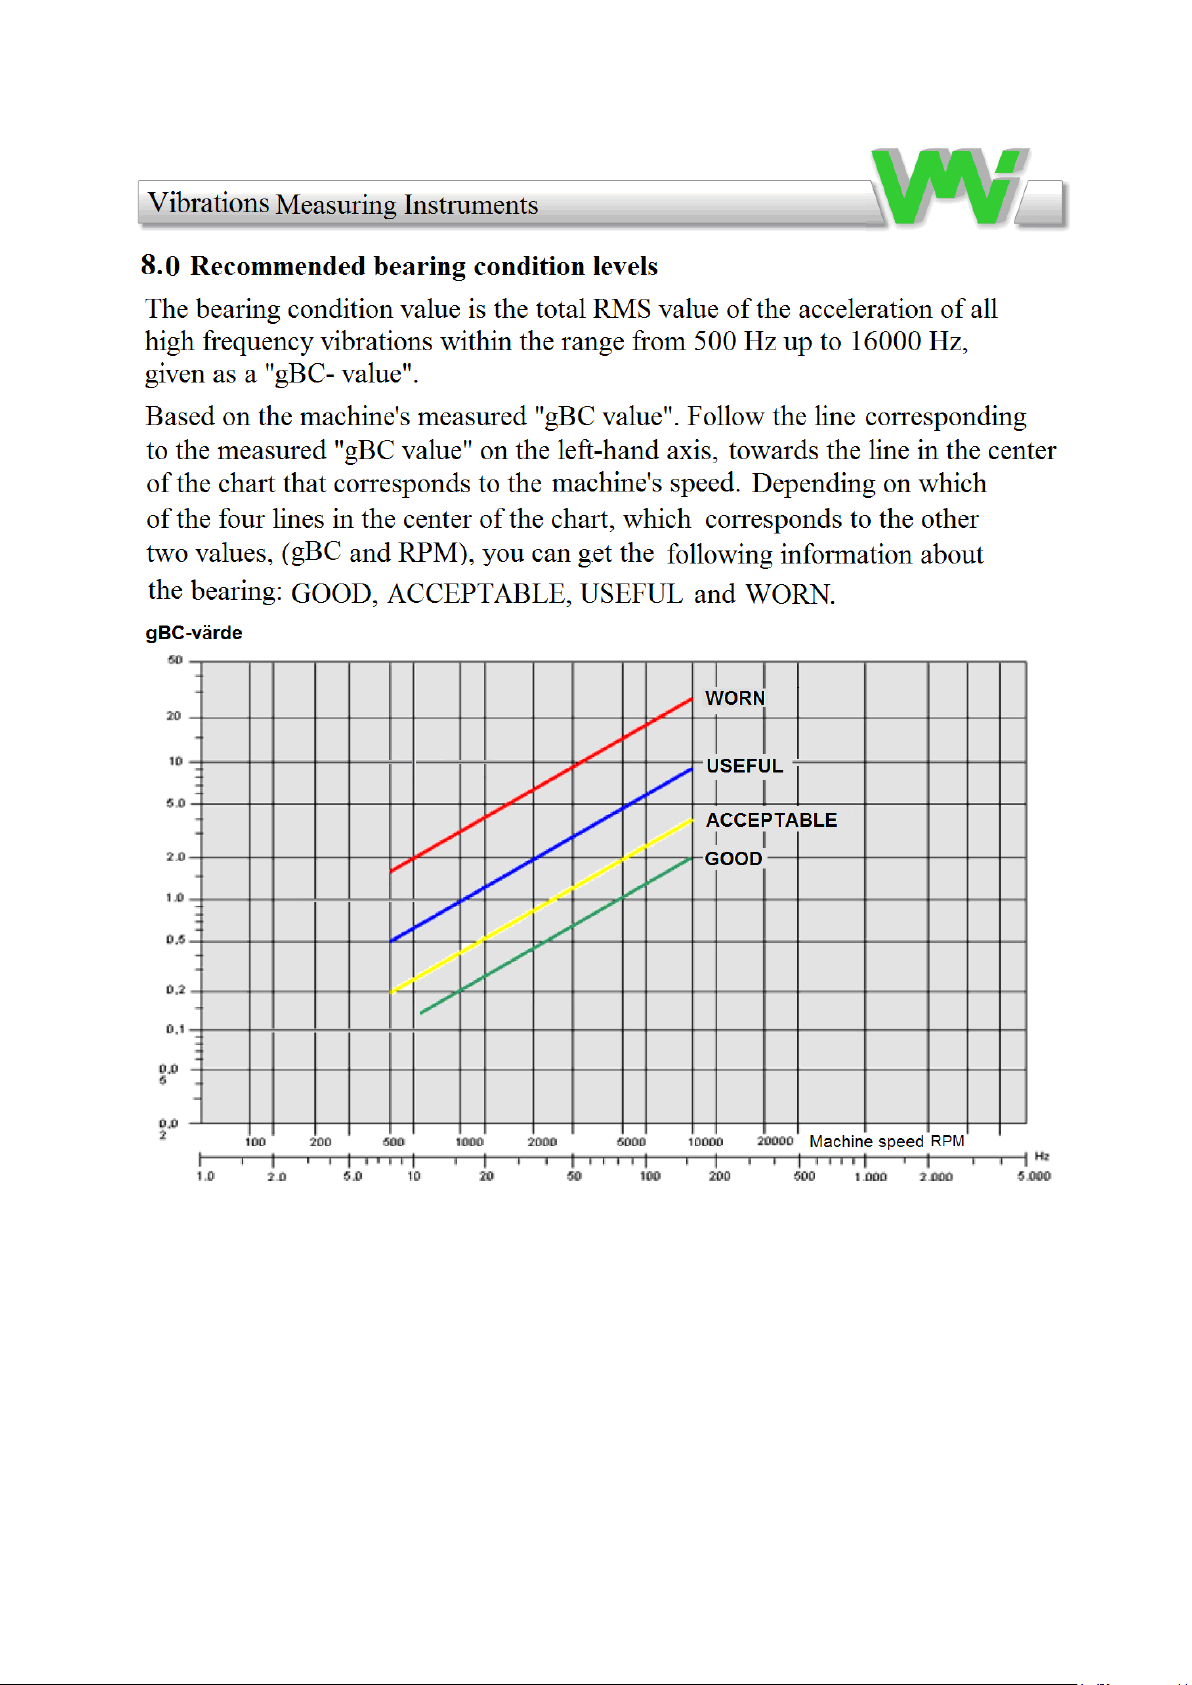
The diagram above is a help to translate bearing condition values. About, for example, the measured
gBC value is 2.0g. It shows that if a machine has a speed of approximately: 10000 RPM, the bearing
may still be good while a machine with a speed of about 550 RPM with the same gBC value can be
considered as consumed. If vibrations of other causes occur (eg flow, pressure shock, gears) and
within the frequency range, it may also give high "gBC values" without damage to the bearings. A
high "gBC value" can also be expected if the bearing is poorly lubricated or overloaded (eg in case of
poor alignment or hard tension drive belt). Compare this value with the bearing temperature. If both
the "gBC value" and the temperature are high or increase in a trend measurement, then there is
probably a bearing problem.
12
Page 13

9 Trend View software use for trends and route
This software is designed to trend measurement and this enables the users to monitor
the condition in machines.
Trends are one method to perform condition monitoring (CM). TREND VIEW™ is
designed for use only with VIBER X2 Pro™ and VIBER X3™.
For every plant or building, you can create a database and a rout with up to 100
measurements. If there are need for several measurement points, you can create
several projects with 100 new storage locations. Each measurement store vibration
amplitude and bearing condition. This covers normally 5 – 20 machines / project,
depending on how many directions are measured on every bearing* and the number of
bearings. That amount is equivalent to number of measuring points in a route.
If only one direction is measured at each measuring point, choose the direction with
the highest vibration. After the measurement, the data can be uploaded to the
computer. In the computer you can store almost an unlimited number of machines.
You can choose what unit you want to display in TREND VIEW™.
Analyzing this information, periodically, you can act proactively and avoid failures.
Regarding installation of the software, see the installation guide.
* Bearing condition is stored in horizontal direction on each bearing. If you not
measures this direction you must choose one of the direction you measure. Change
direction in properties.
13
Page 14
9.1 Create a measurement project
You start by creating a "measurement project" to store measurement values.
In this manual, we show an example of how to build a "measurement project" or
"database" with two grinding machines. Grinding machine 1 and Grinding machine 2.
For both machines we measure : Vibration, Bearing condition (BC) The machines
belong to the "Grinding department".
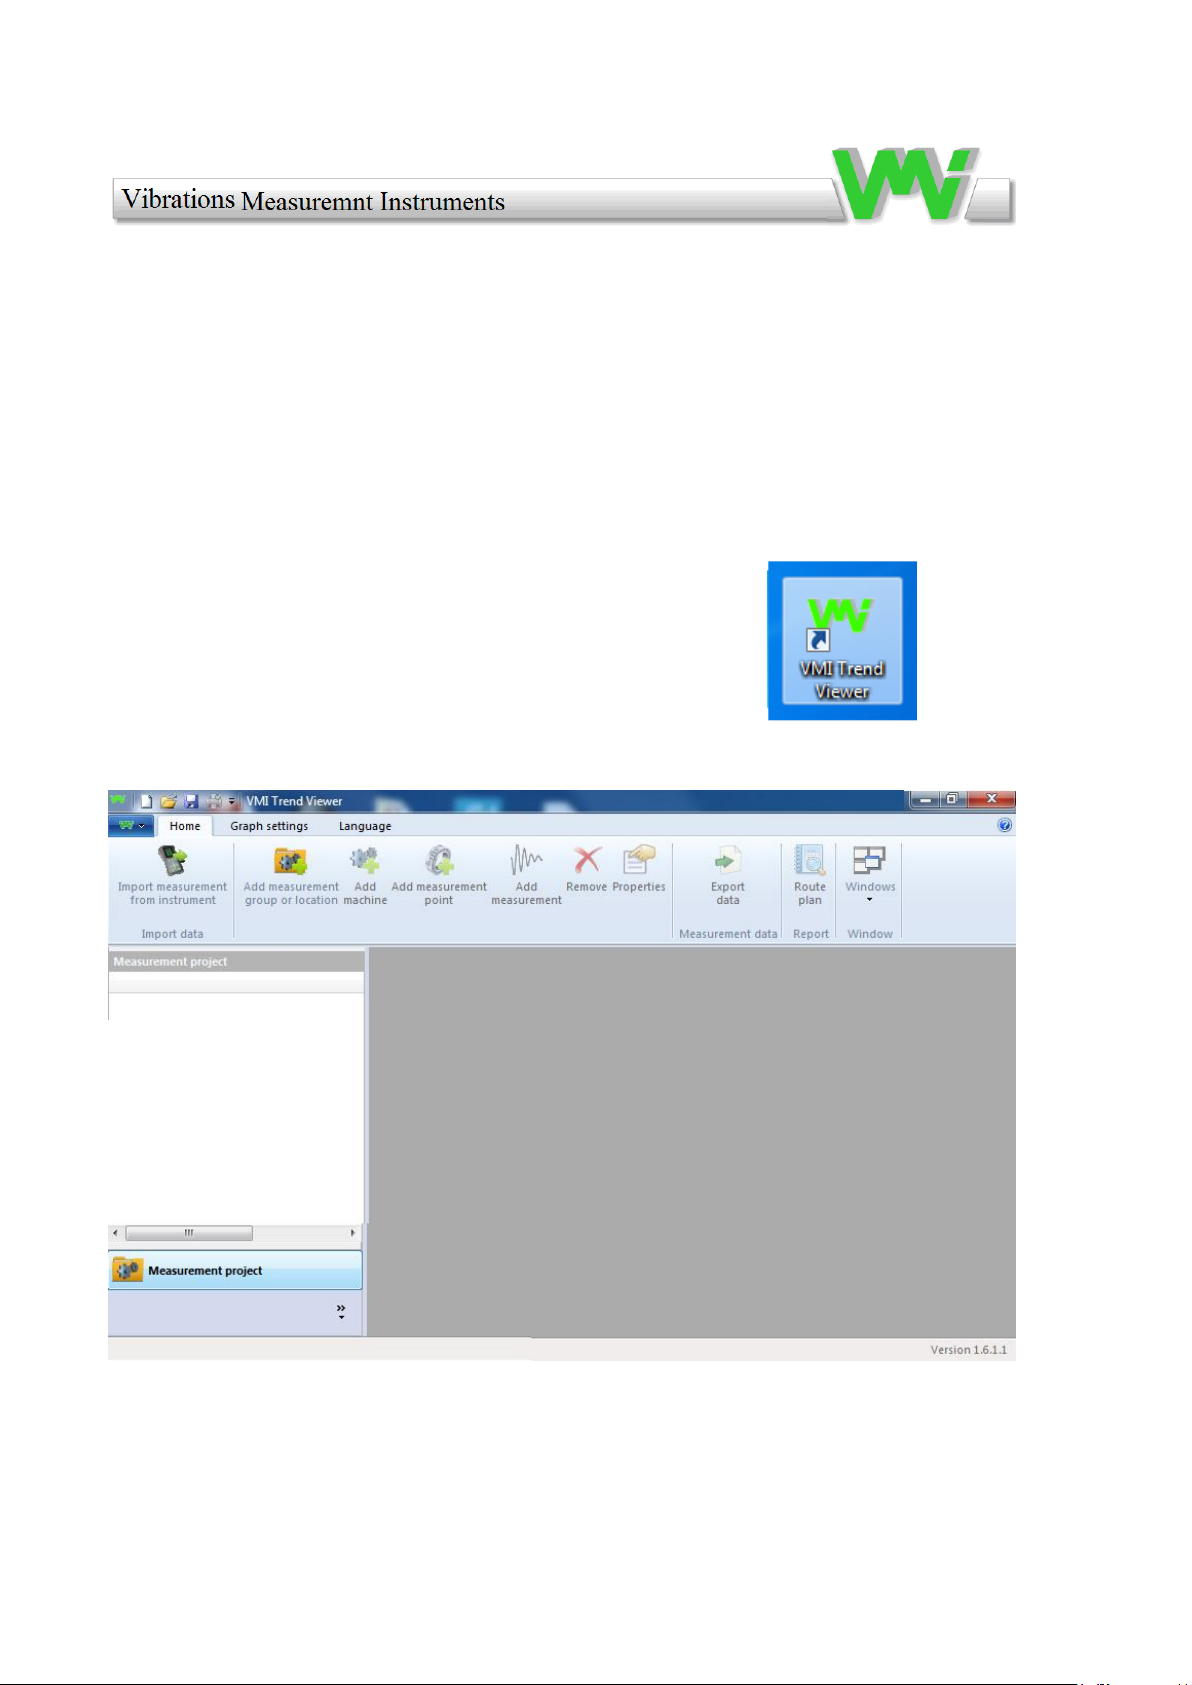
Start the "Trend View" program by clicking on the icon: on the
desk.
14
Page 15

You can also click on the symbol that shows a "white sheet of paper" to create a new
project.
15
Page 16

Here is the new project. You can not measure temperature or perform balancing with
VIBER X2 Pro.
You can build a hierarchical tree, from a plant or department down to a single
measuring point, or just set up a single machine. In this example, we select
"Department" (Grinding Department). We also add two machines,
(Grinding machine 1) and (Grinding machine 2). Next step is to click on the icon:
If you click on the icon "Add Group or Location" before you create a
project, you will receive the following prompt:
16
Page 17

Assign the project a name by clicking on the green "W"
17
Page 18
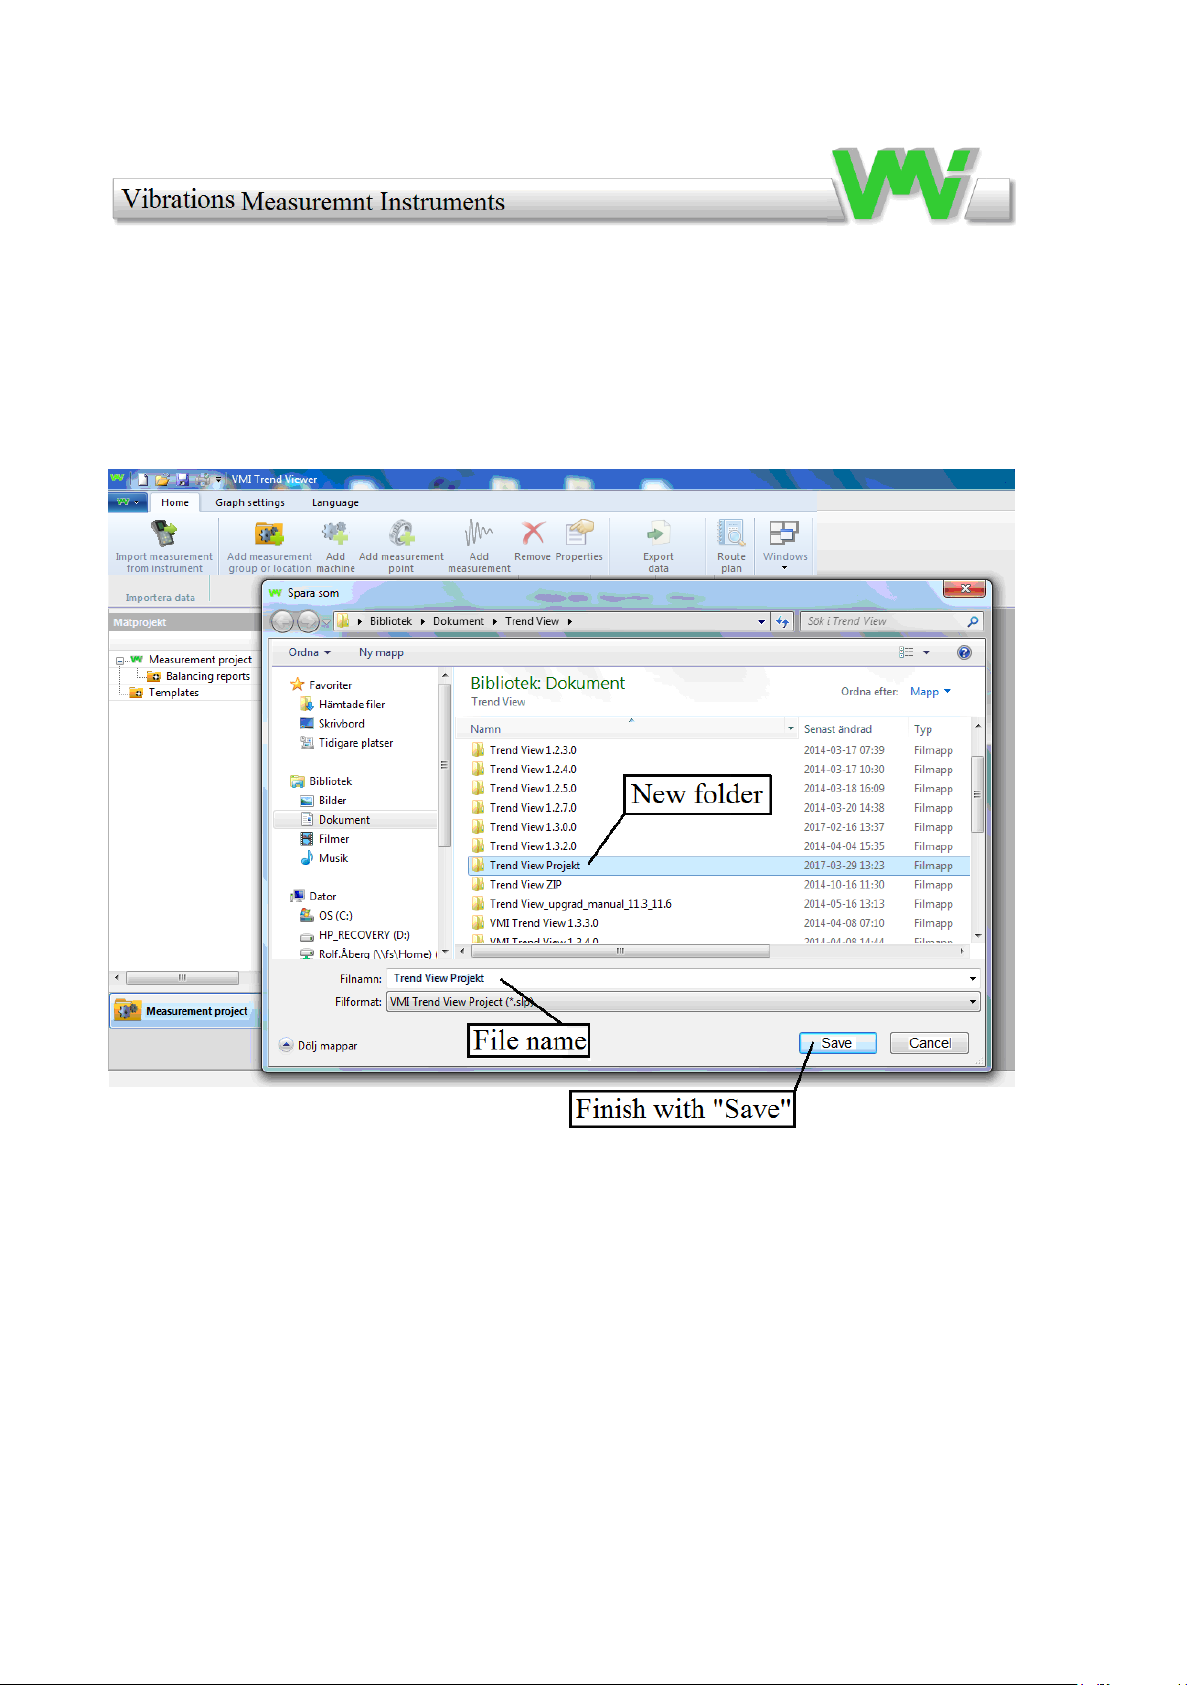
Assign a project name to the project and decide where you want to save your projects.
Create a "Folder" and give it a name, for example: "Trend View Project".
18
Page 19
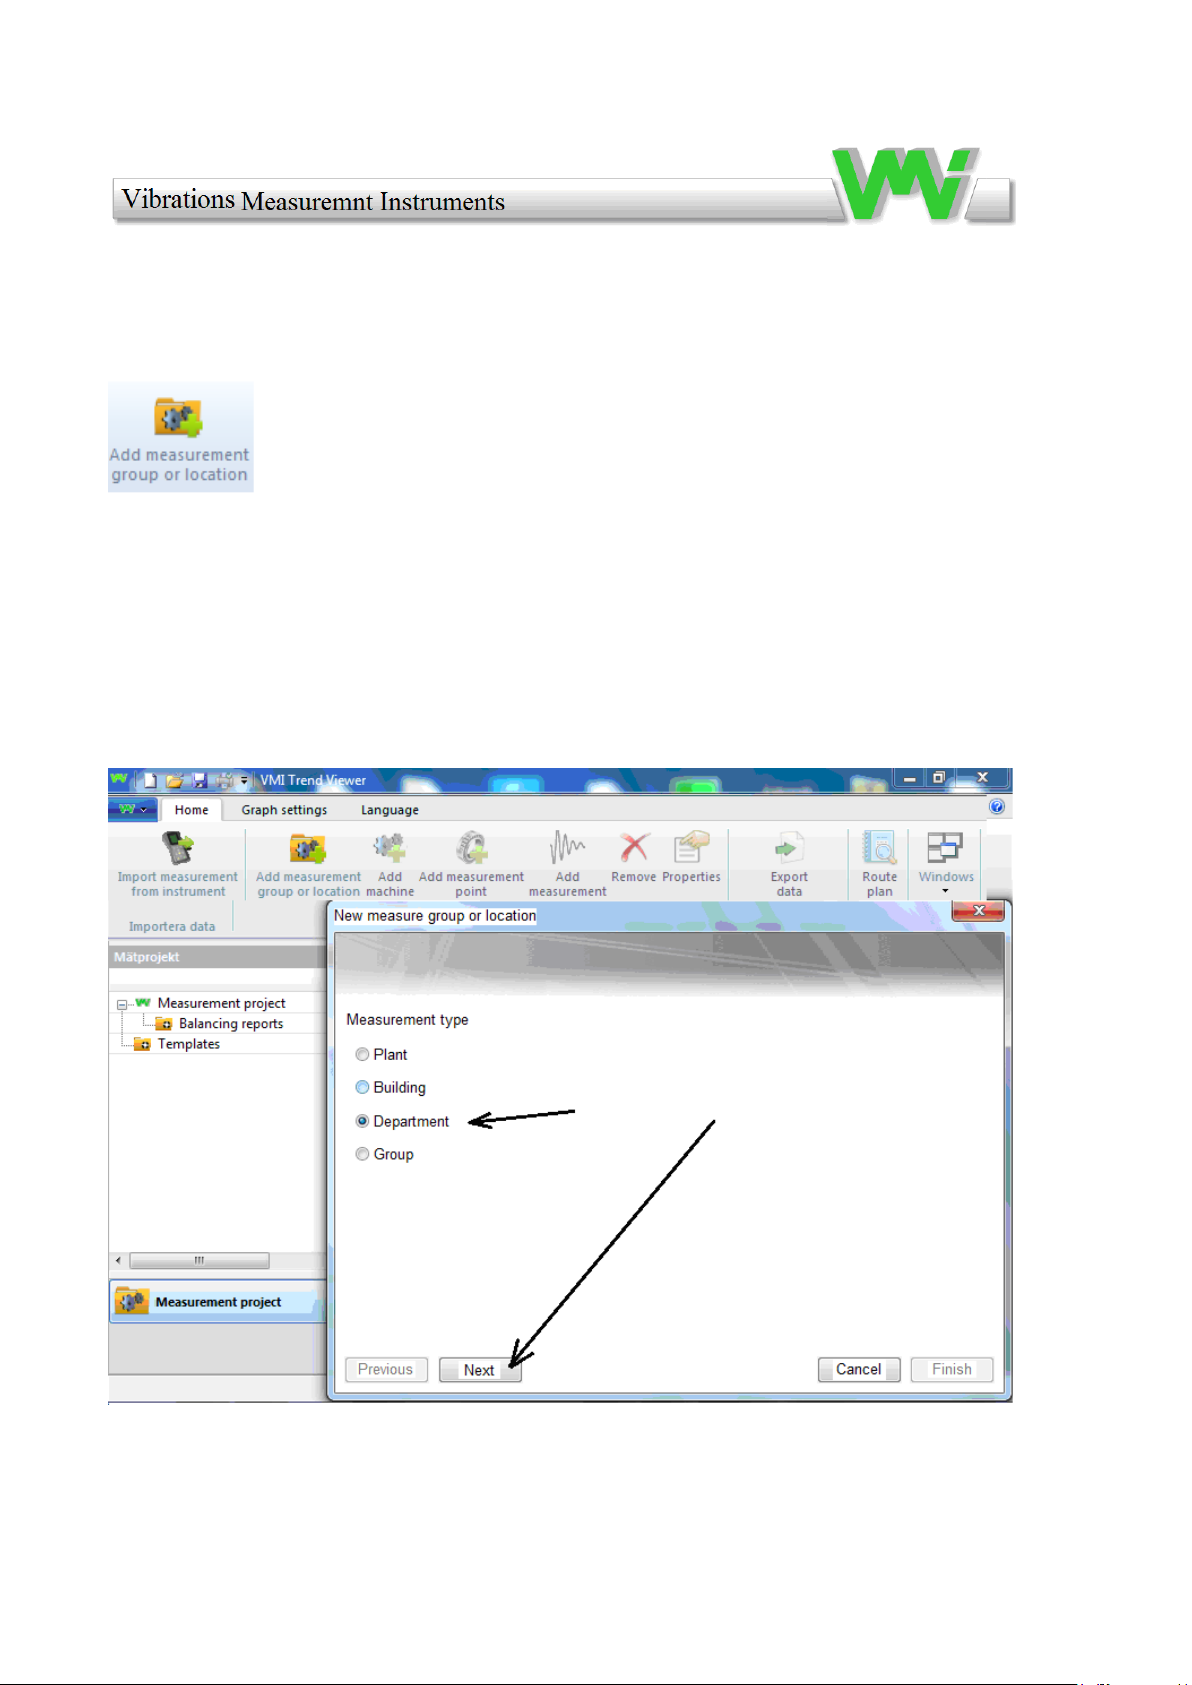
Continue by clicking on the "Add measurement group or location" icon.
Select "Department" for our example. In other cases, choose the option that suits. The
top level of the project (Database) is usually a building or department, which must be
added to the project. Then click on the next.
19
Page 20
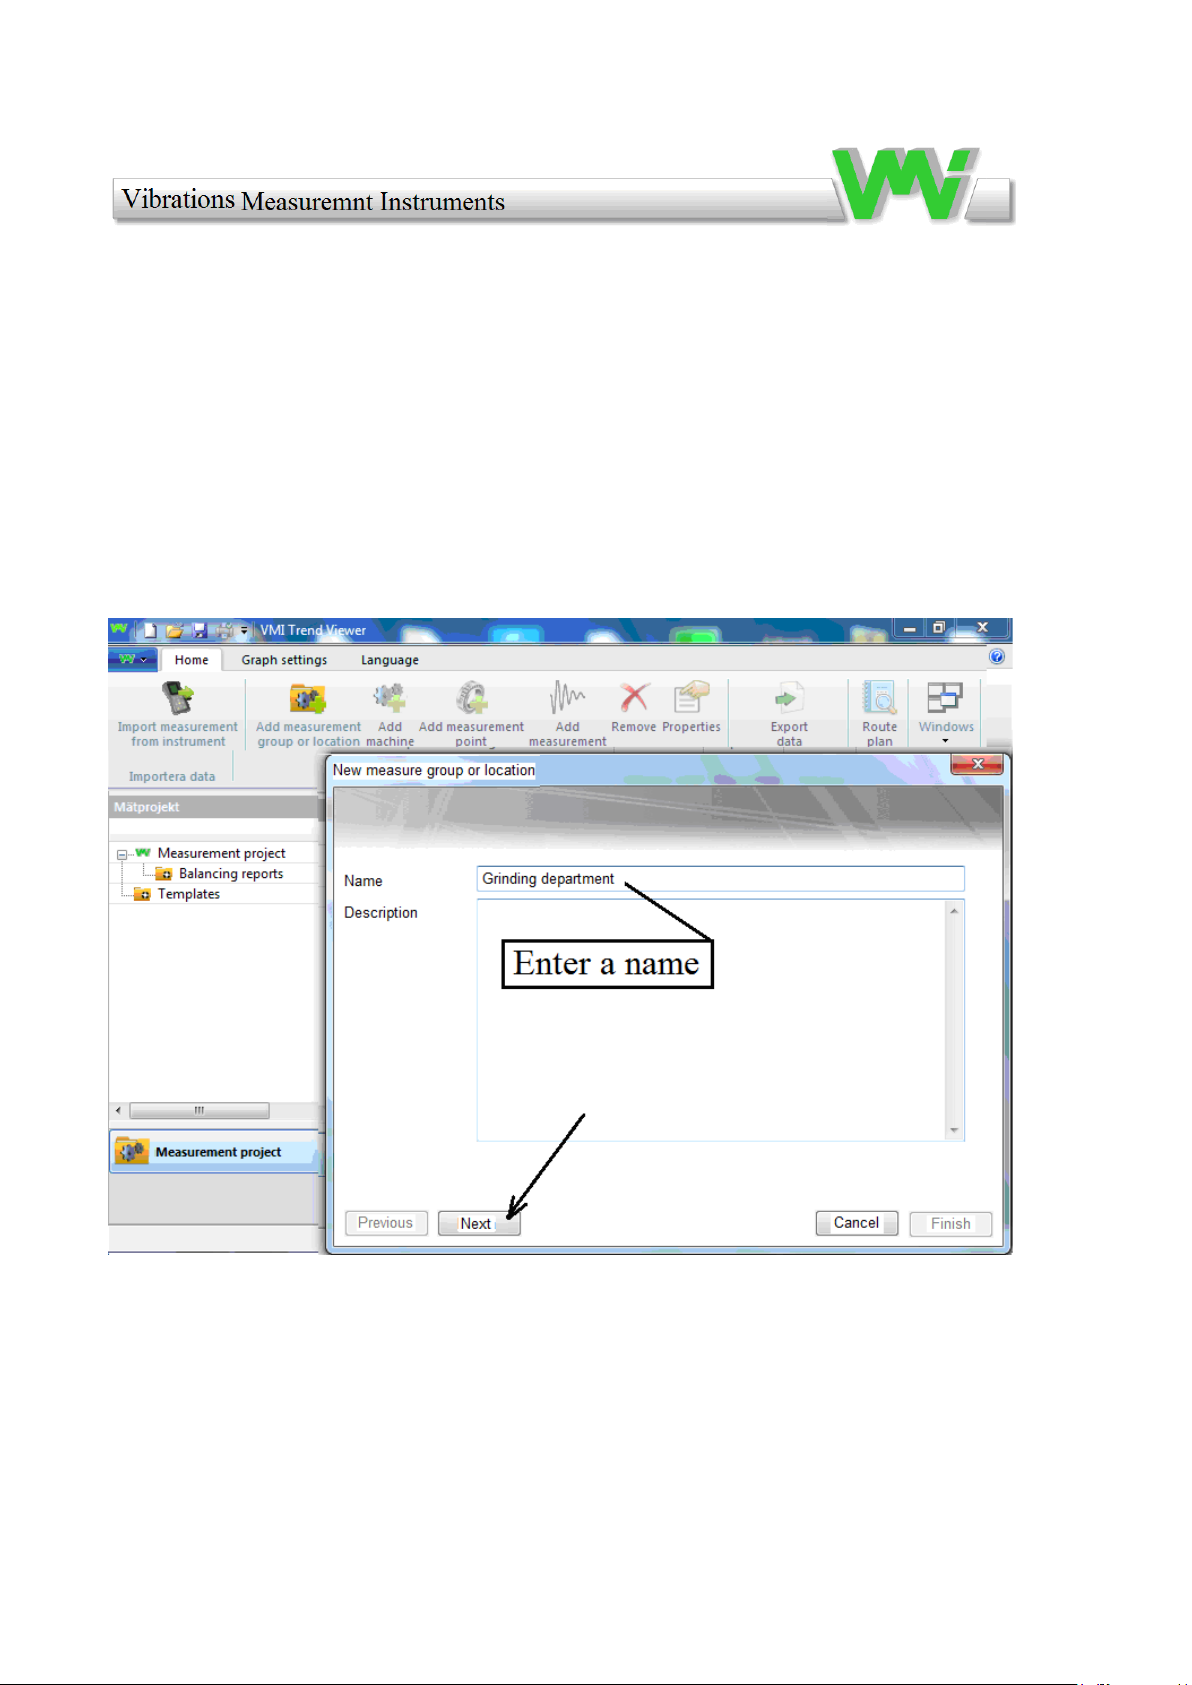
Enter a name for the department, proceed with a click on "Next".
20
Page 21
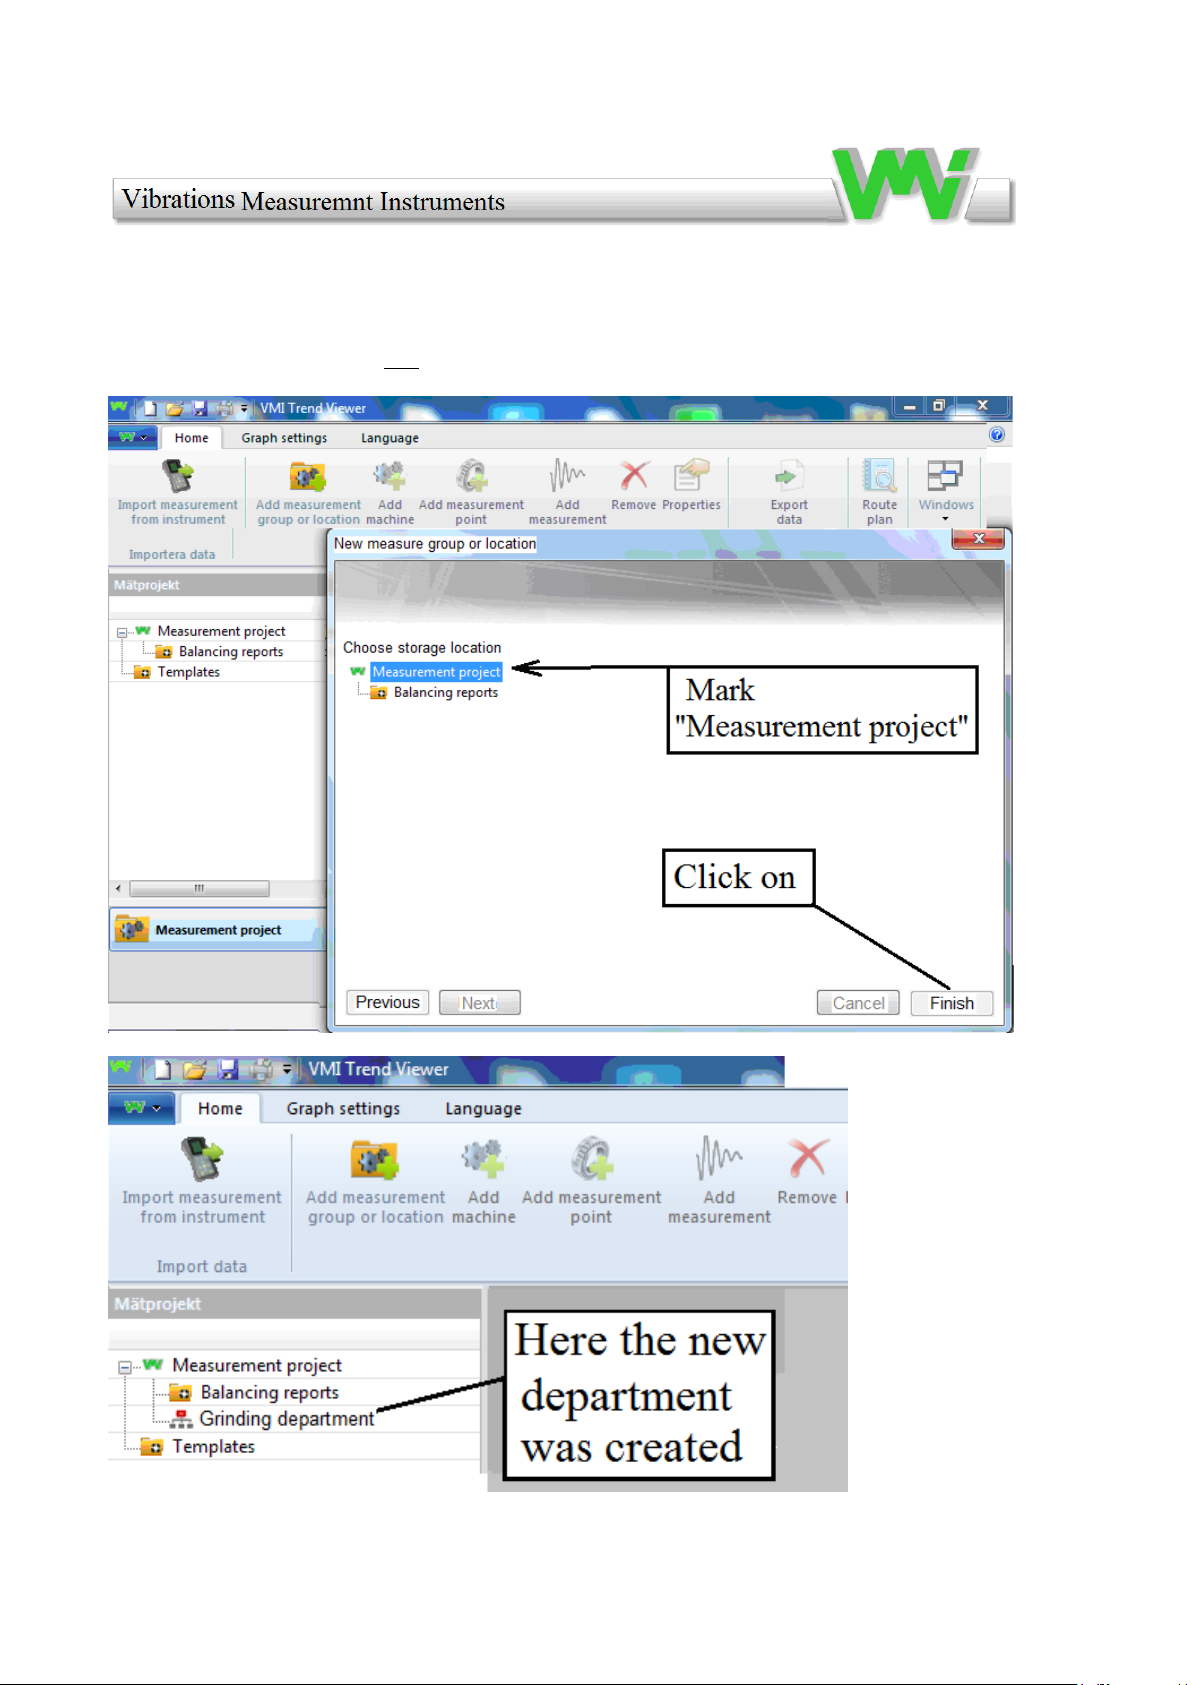
Select the type of measurement you want to do "Measuring Project" or "Balancing
reports". In our ex. We choose "Measurement Projects" because we will perform trend
measurements. You can not perform balancing with VIBER X2 Pro. Click "Finish".
21
Page 22
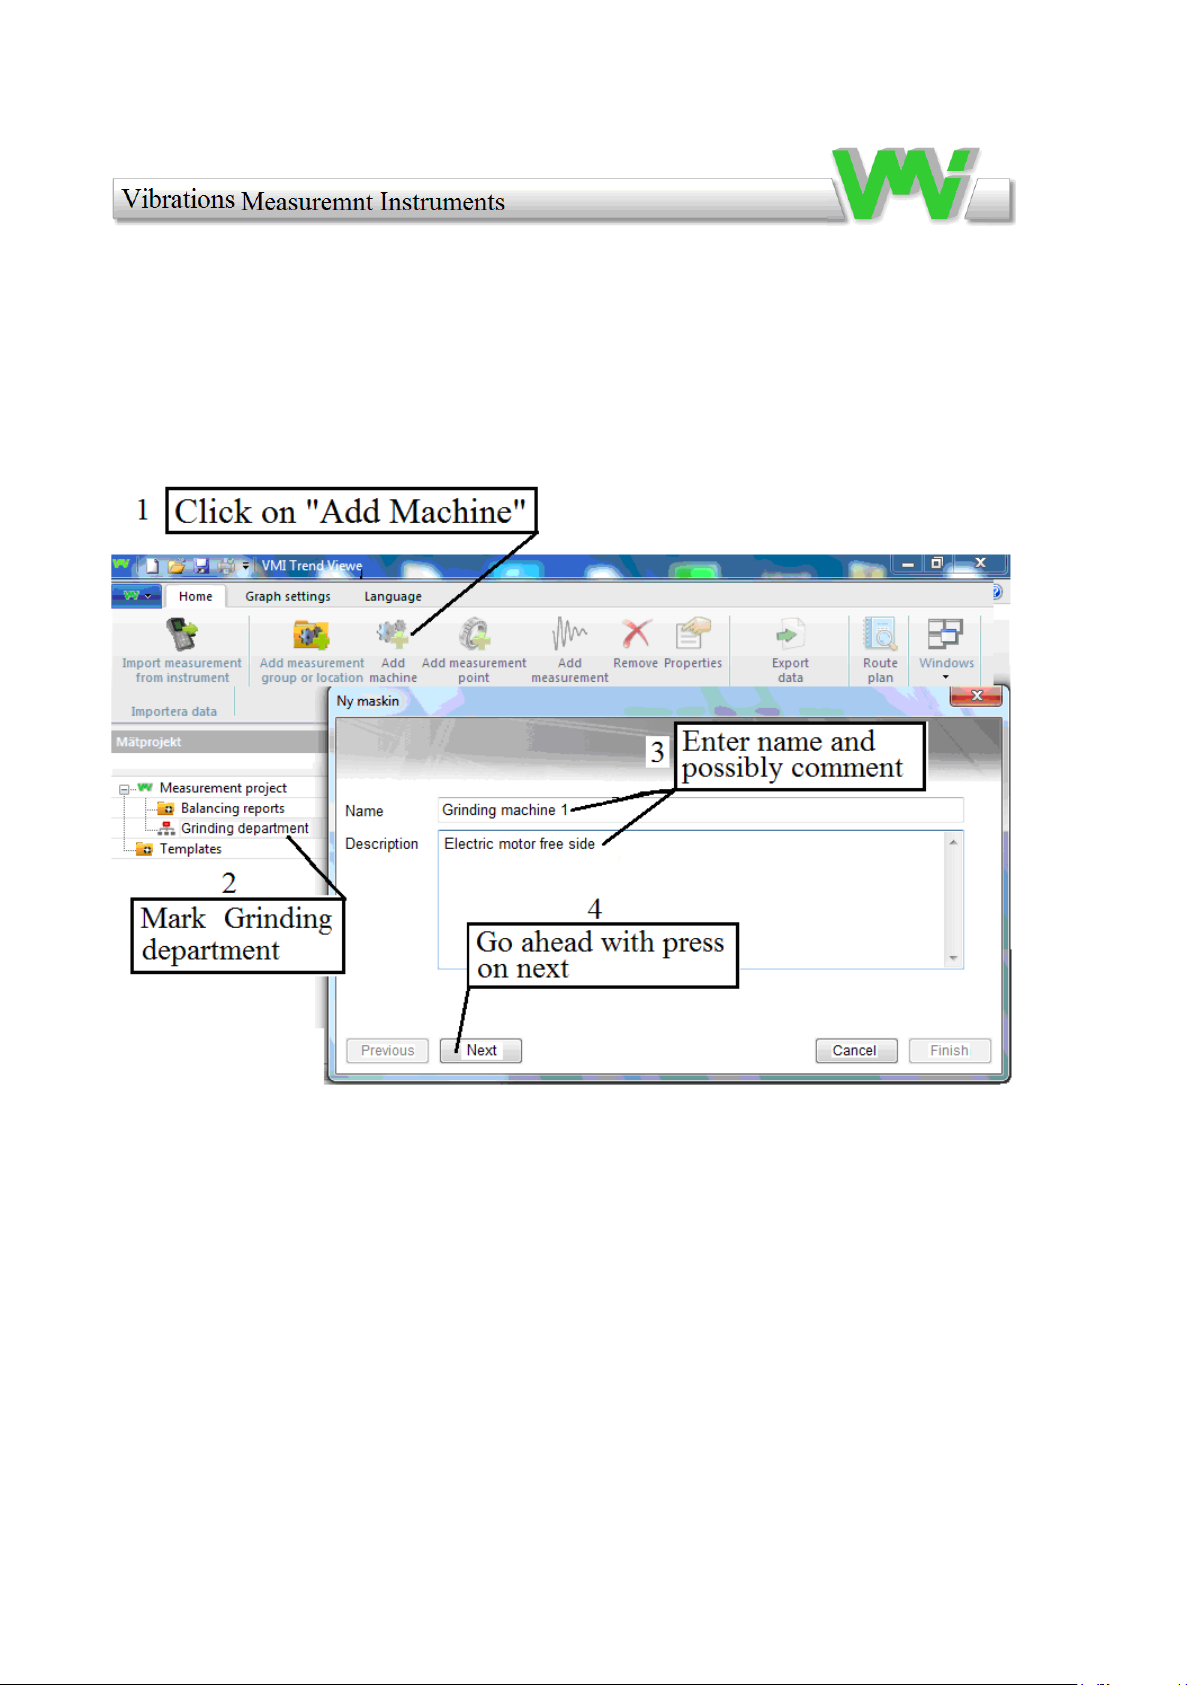
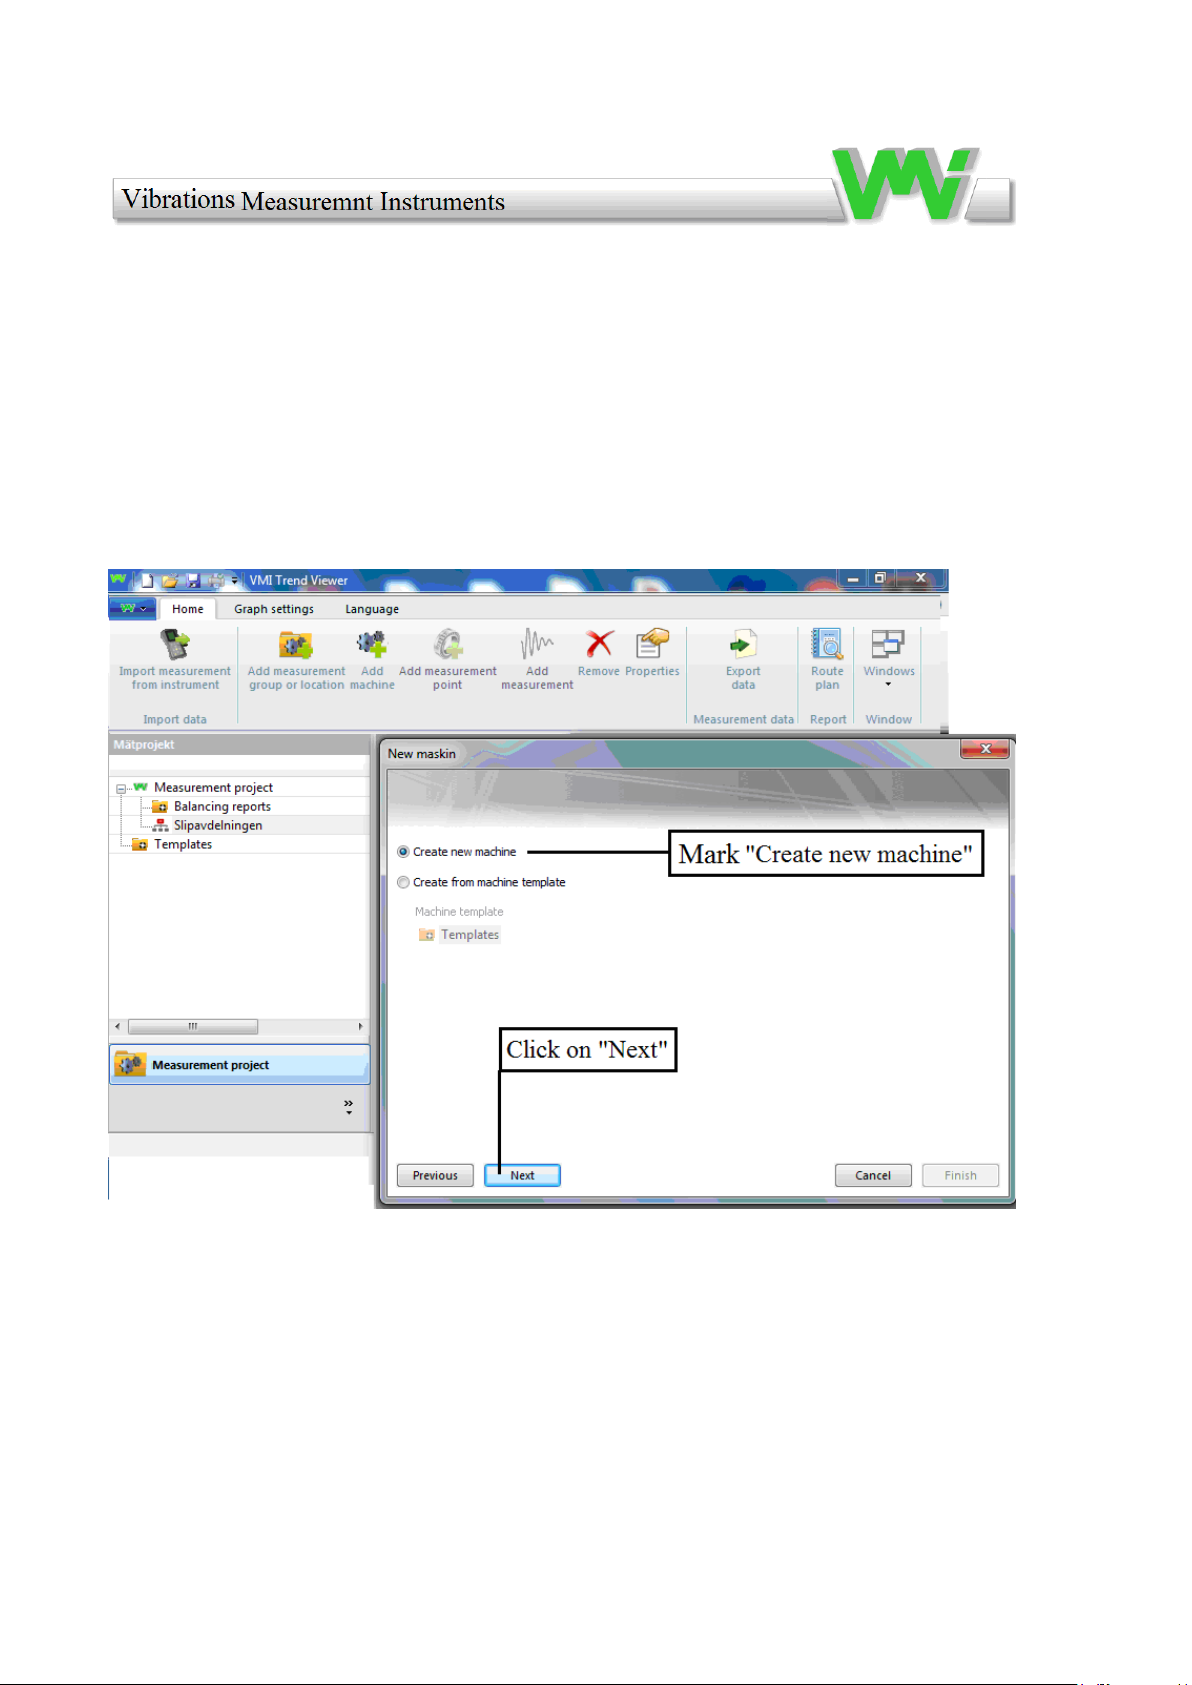
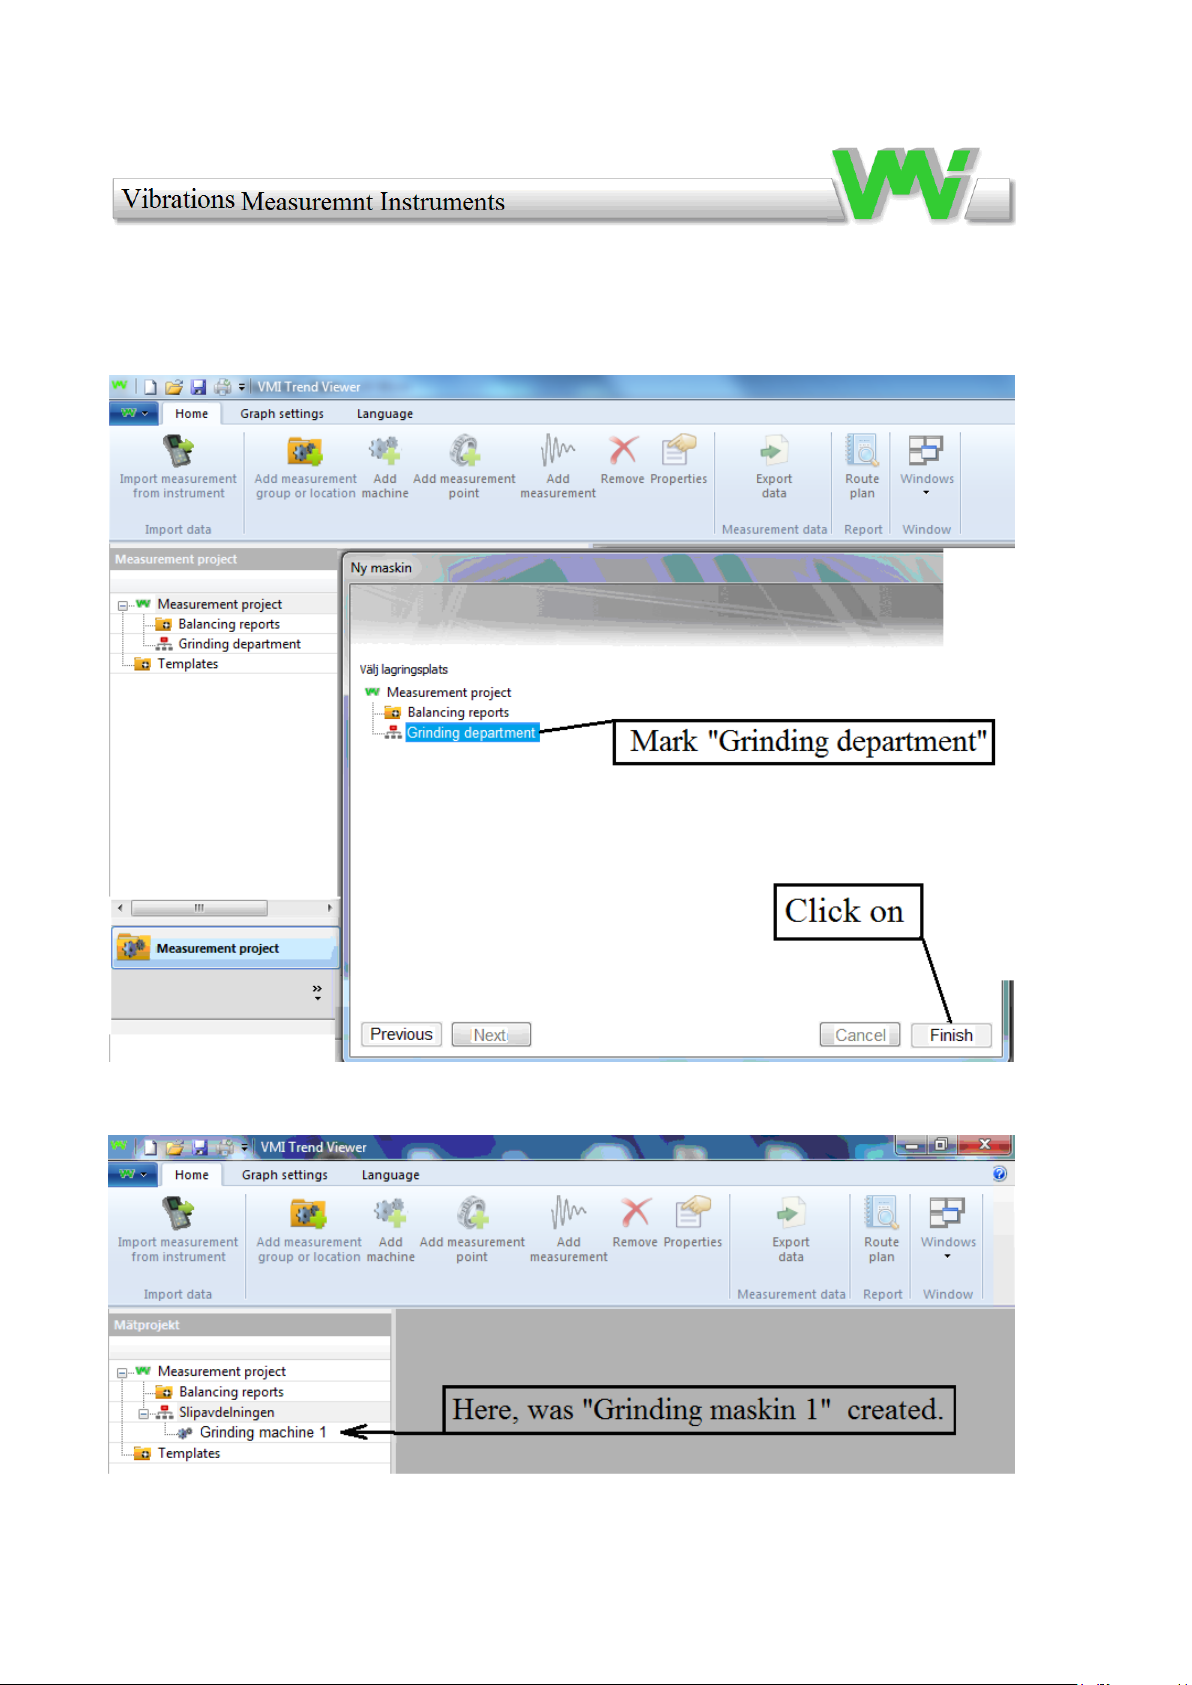
The next step is to add a machine
22
Page 23
23
Page 24
24
Page 25
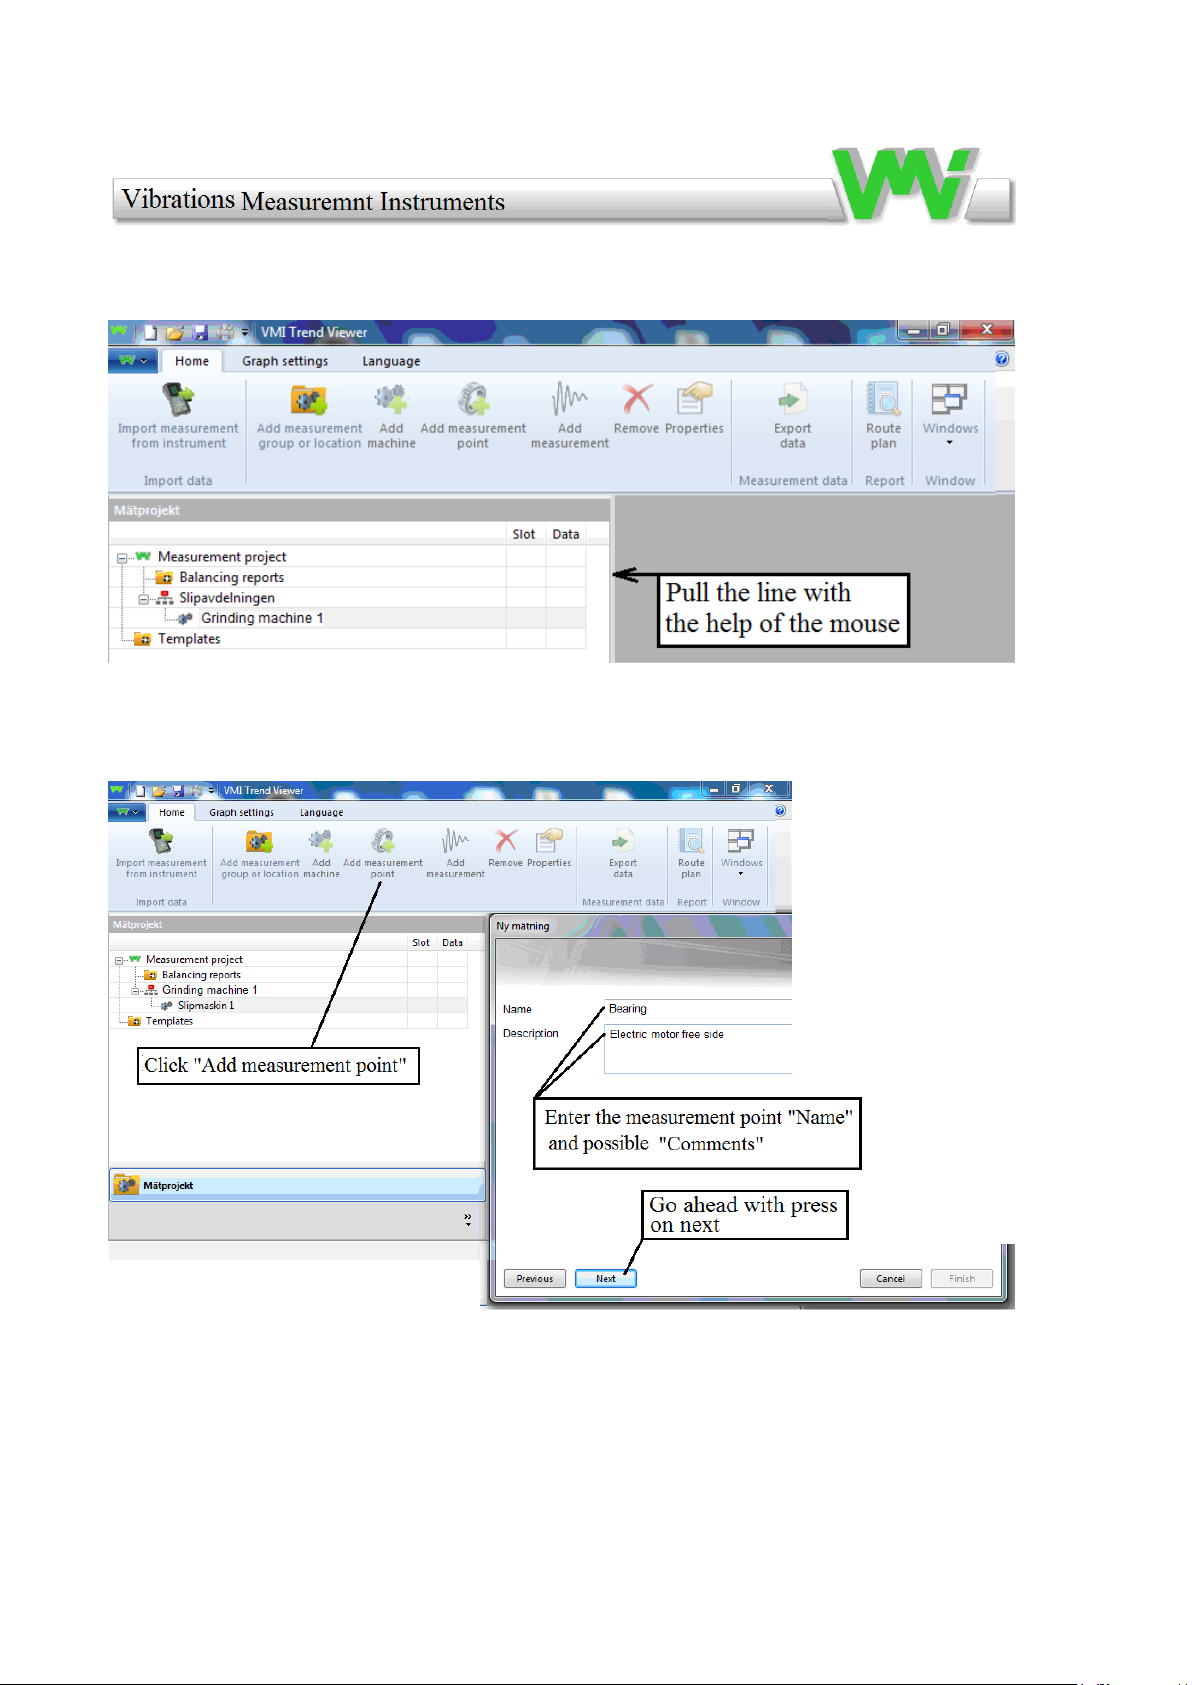
Mark "Grinding machine 1", drag the line to see "Slot" and "Data".
The next moment is to add a measurement point (usually a bearing). In this example
we want to measure two bearings in three directions for each machine.
25
Page 26
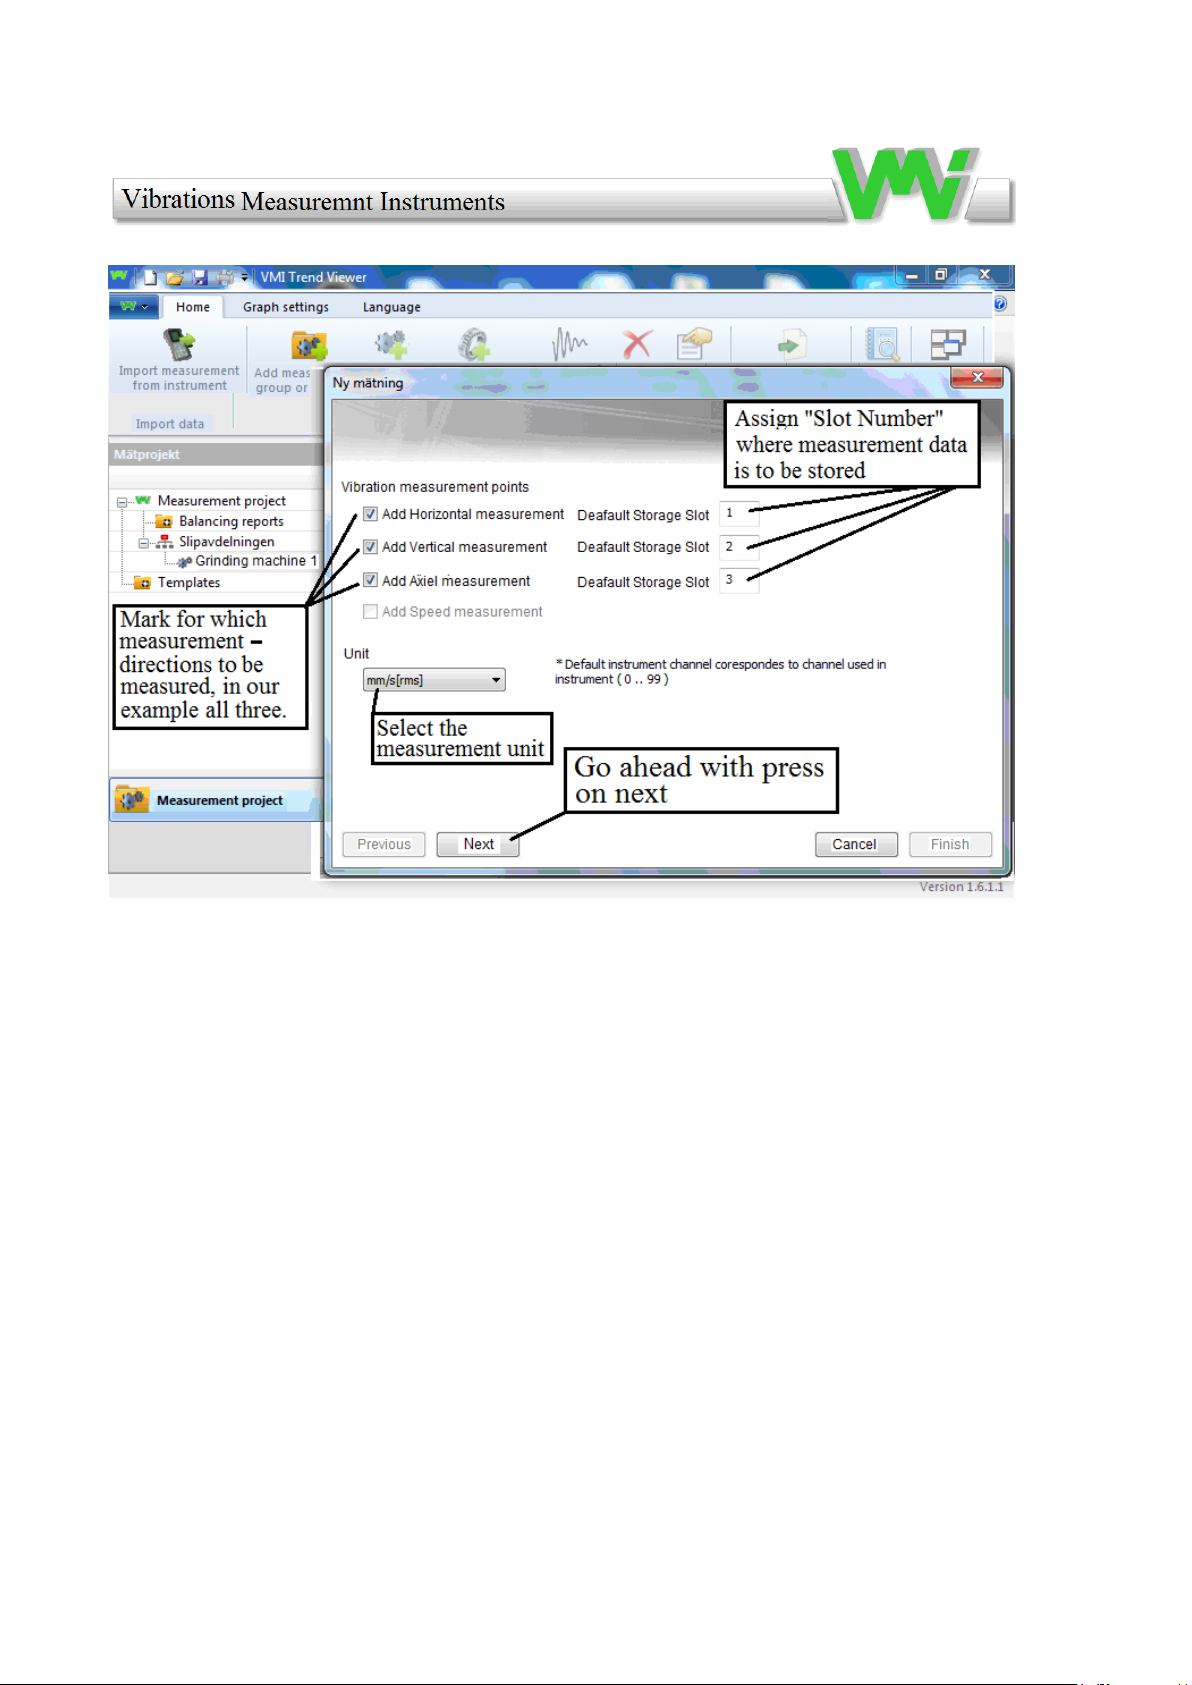
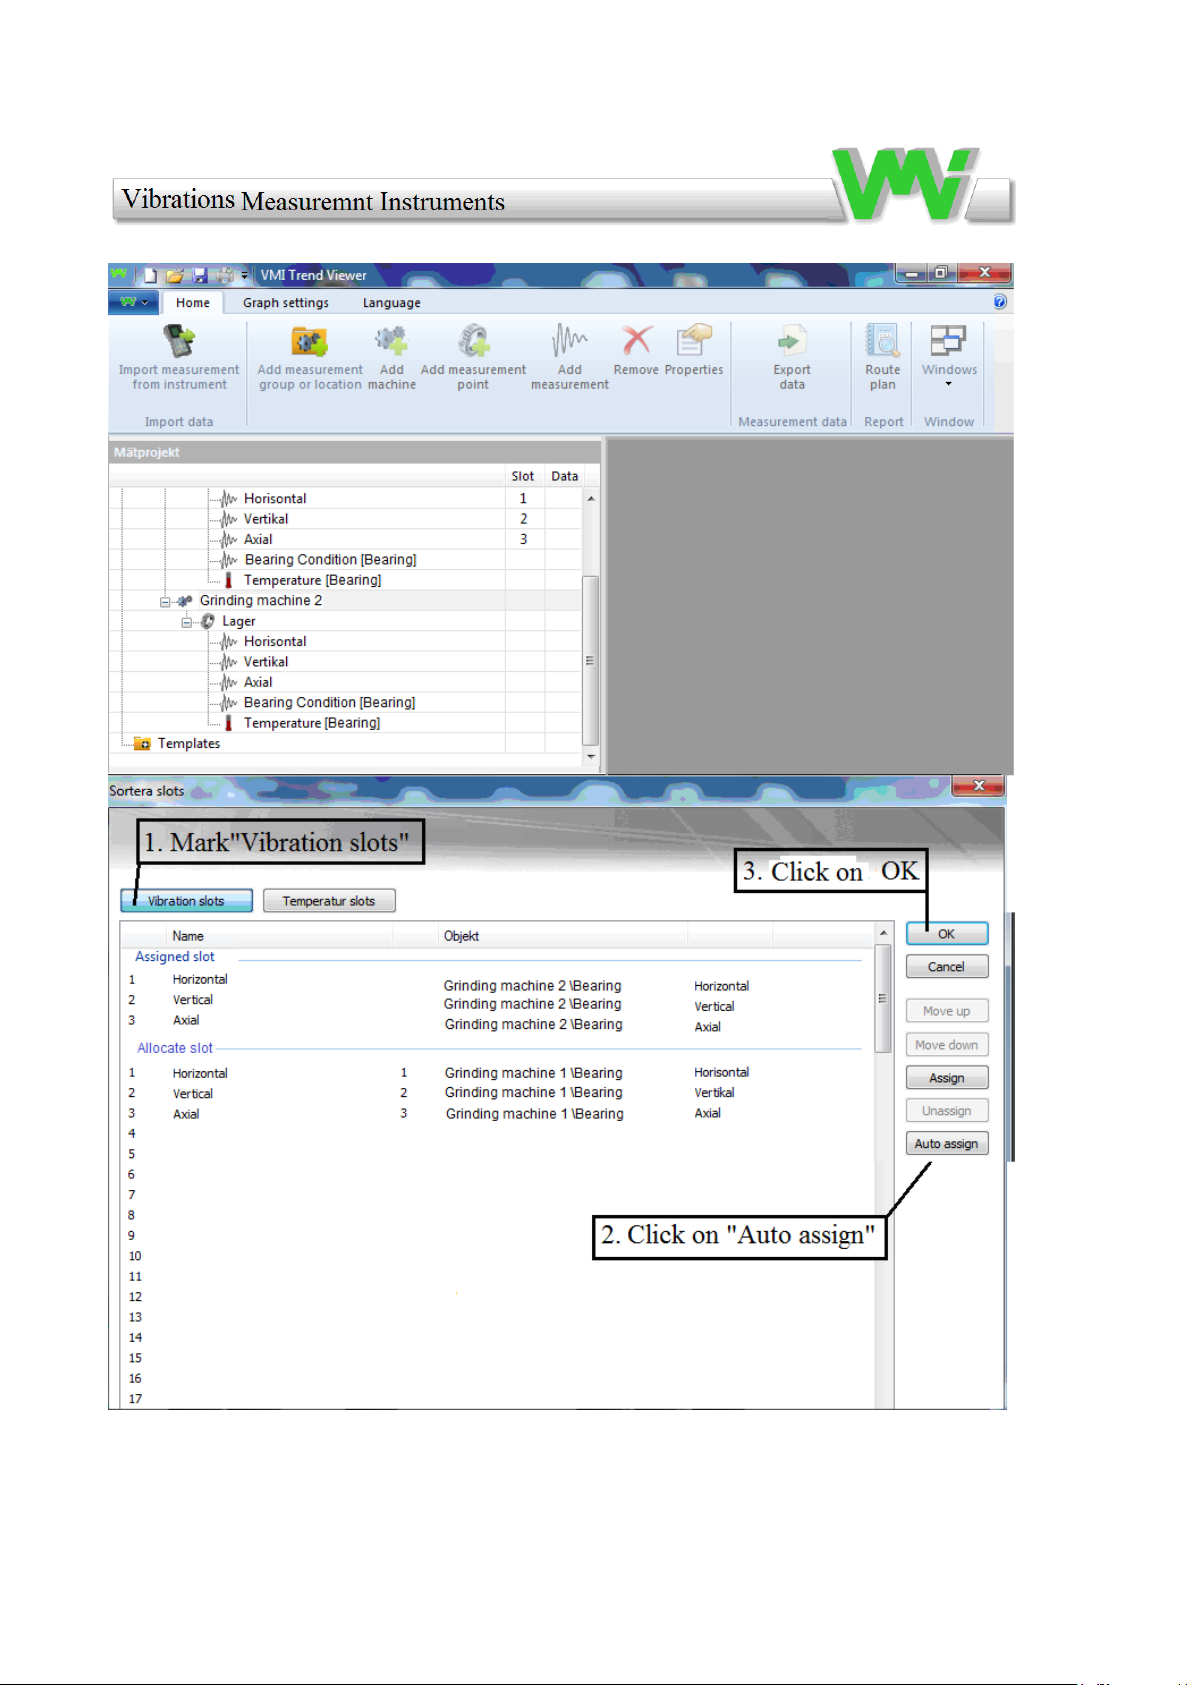
You can skip the allocation of "Slot number" and, at a later time, perform an
automatic sorting of storage slots locations (Auto Assign), see pages 35 - 37.
26
Page 27
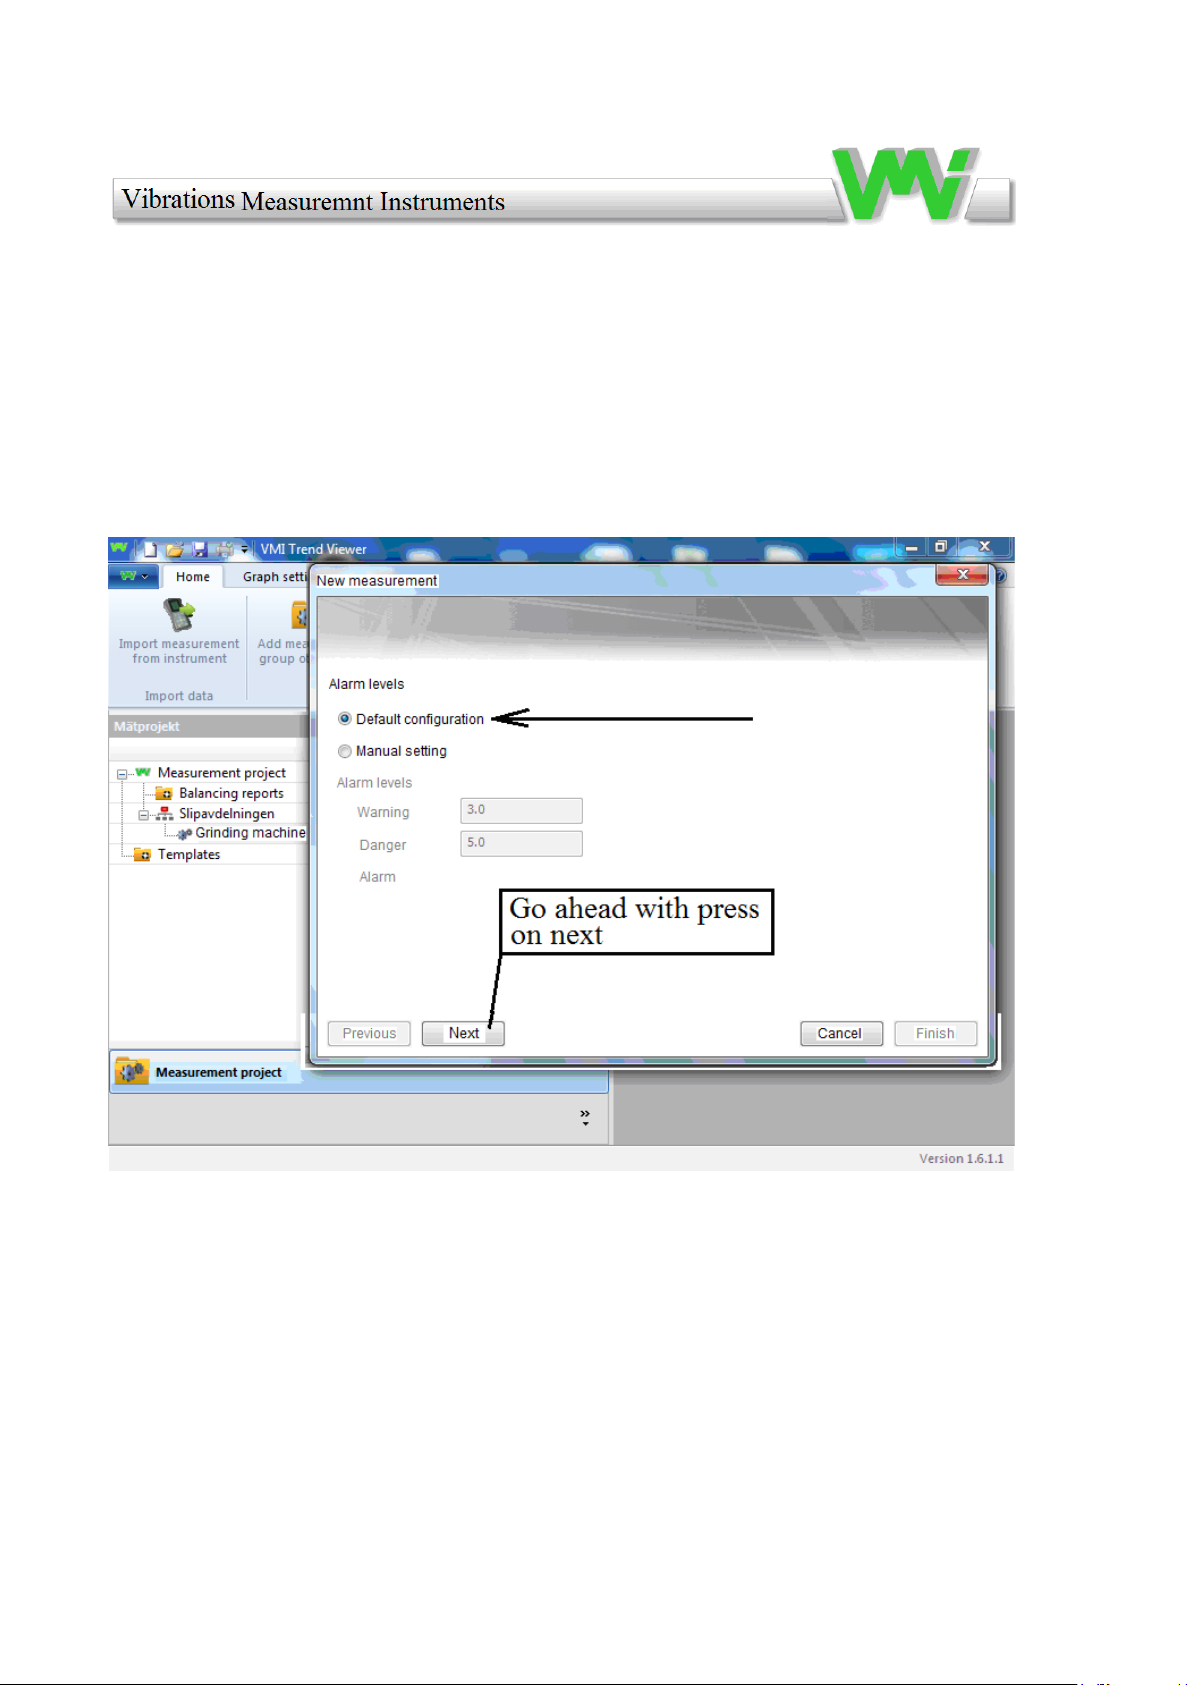
The next dialog box allows you to select alarm levels, manually or from a standard
table. In the example, we choose the default.
27
Page 28
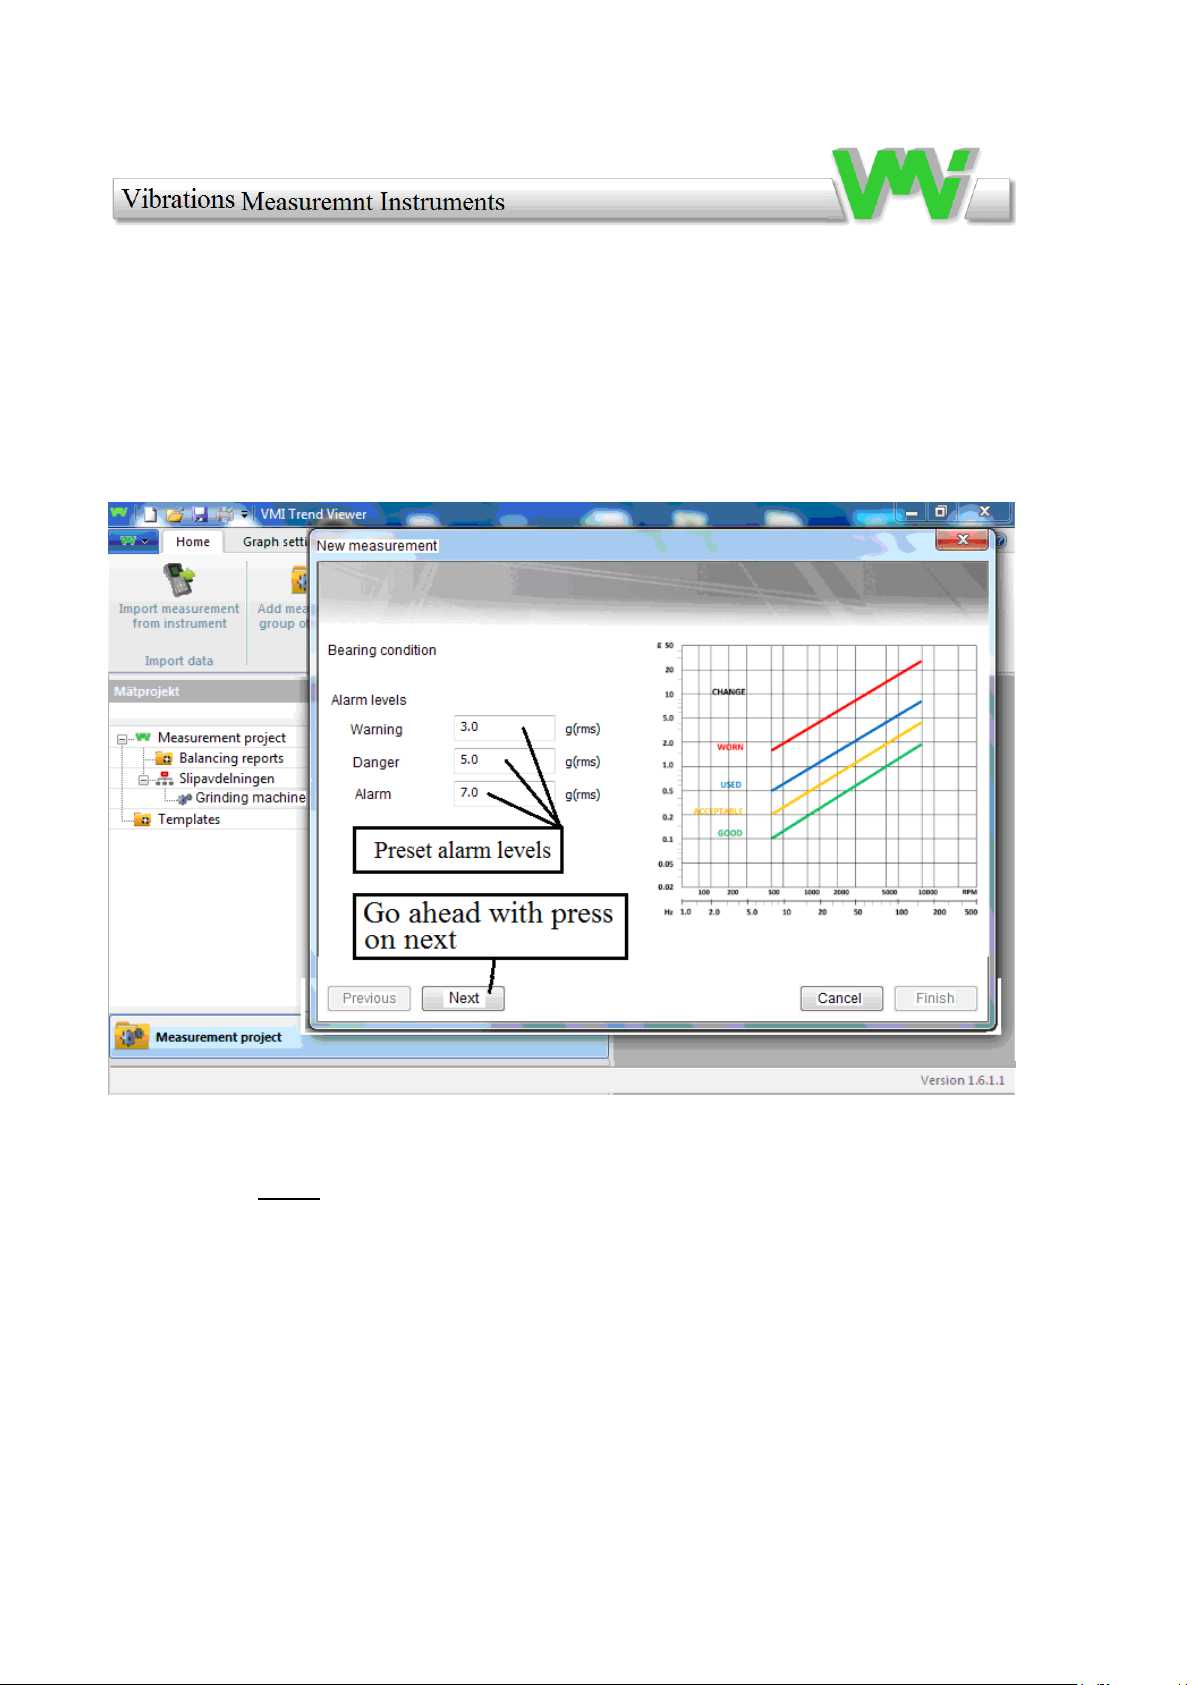
Temperature is not measured with VIBER X2 Pro™.
28
Page 29
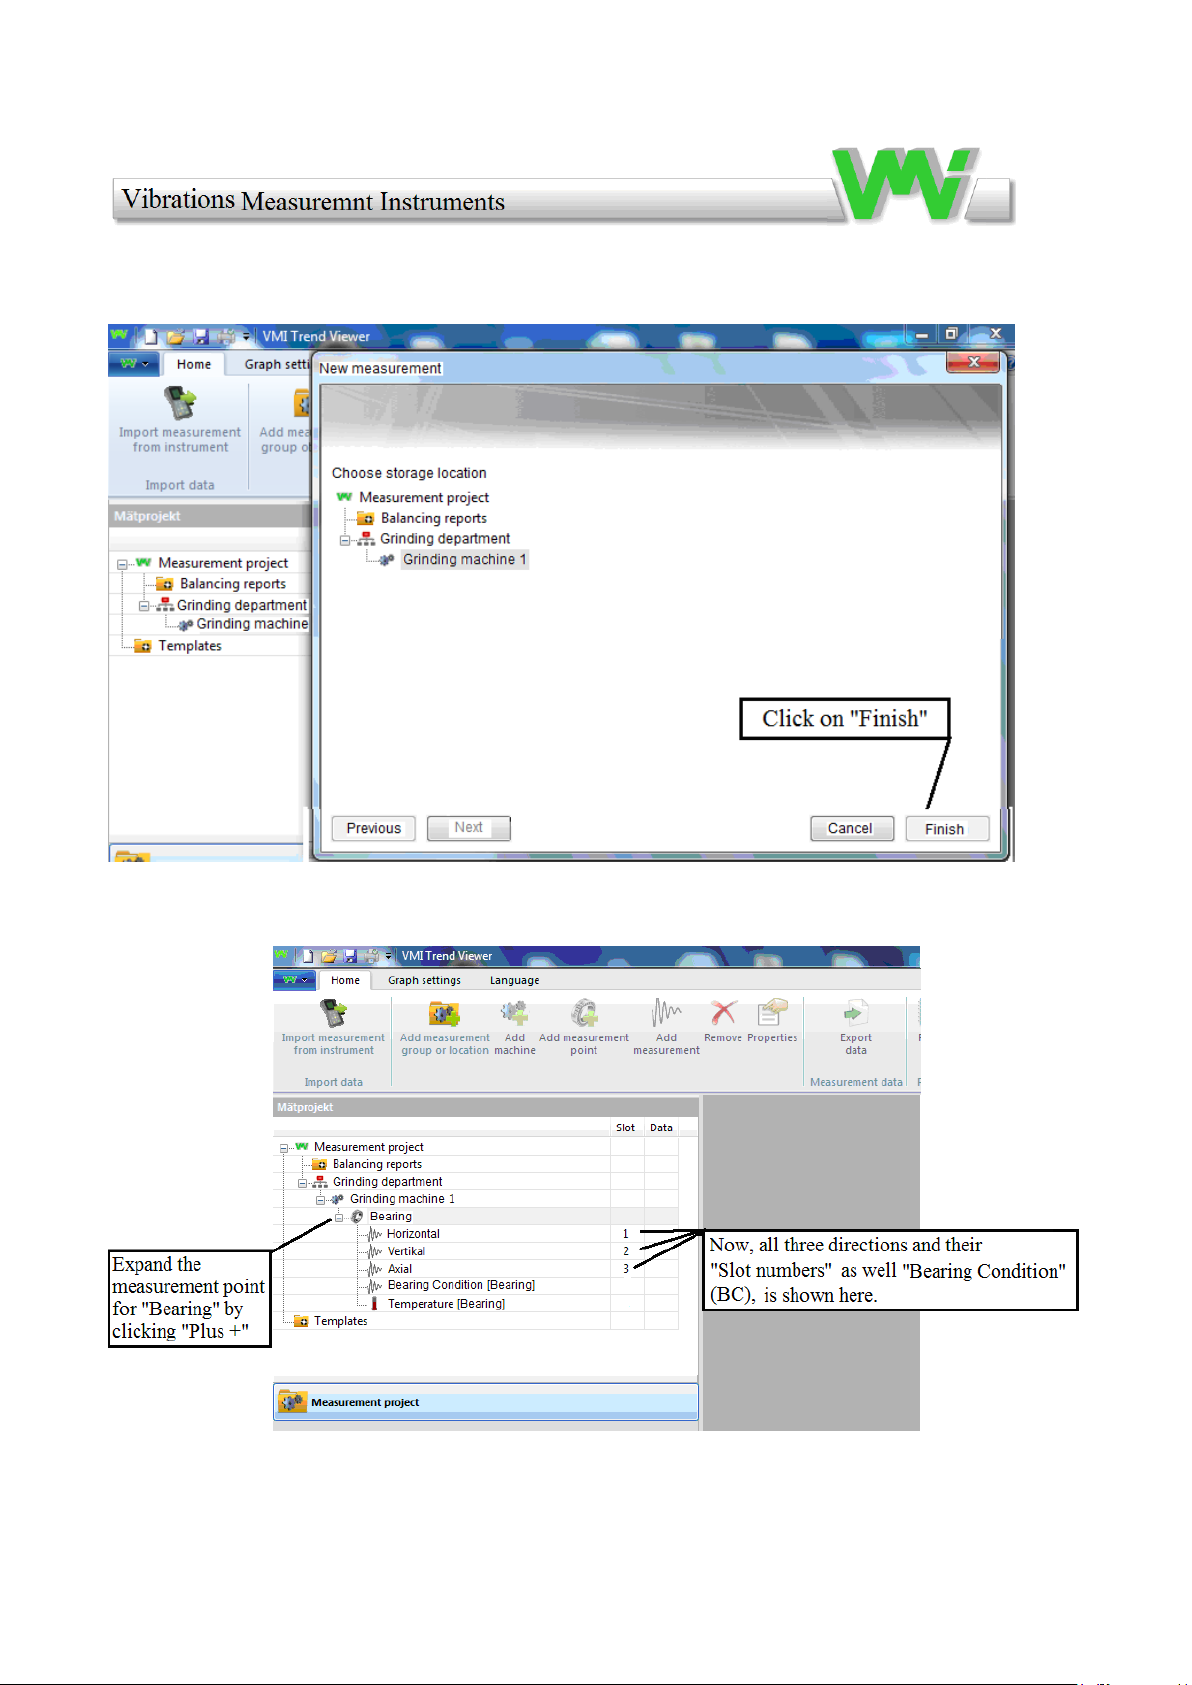
29
Page 30
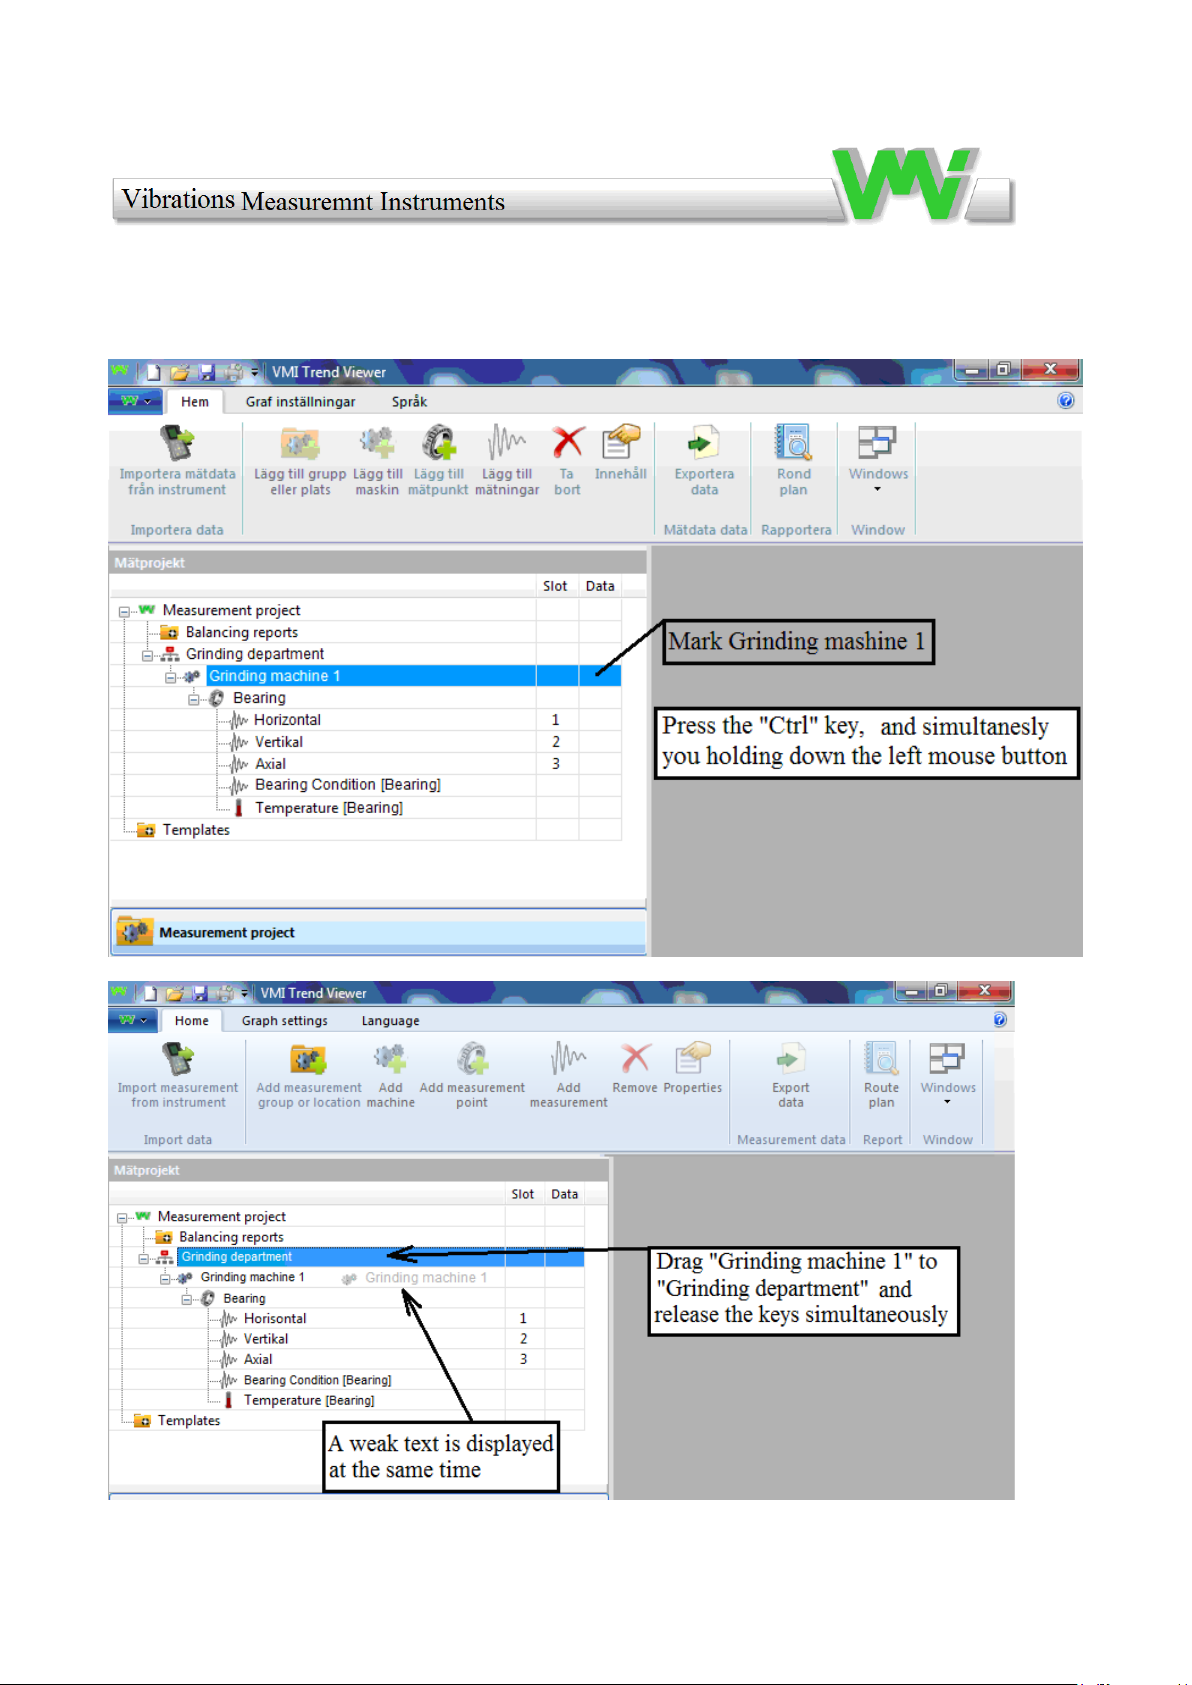
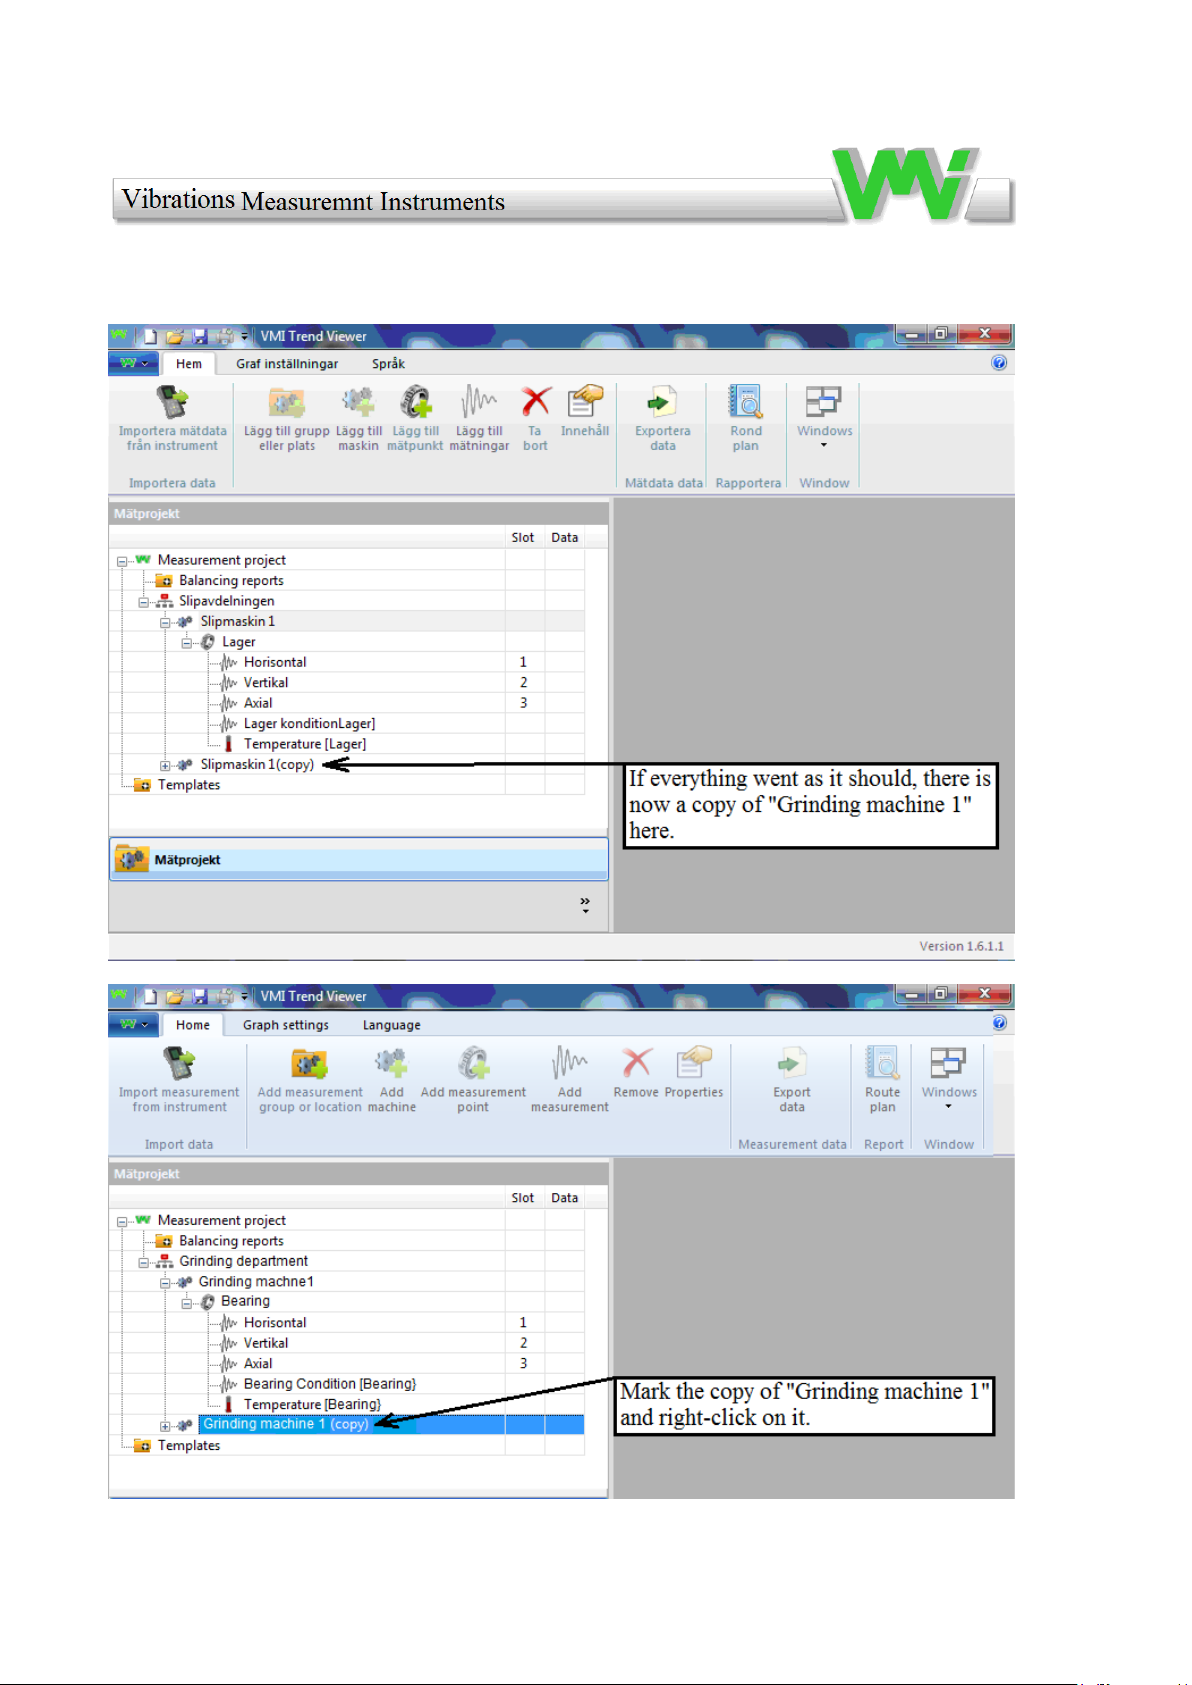
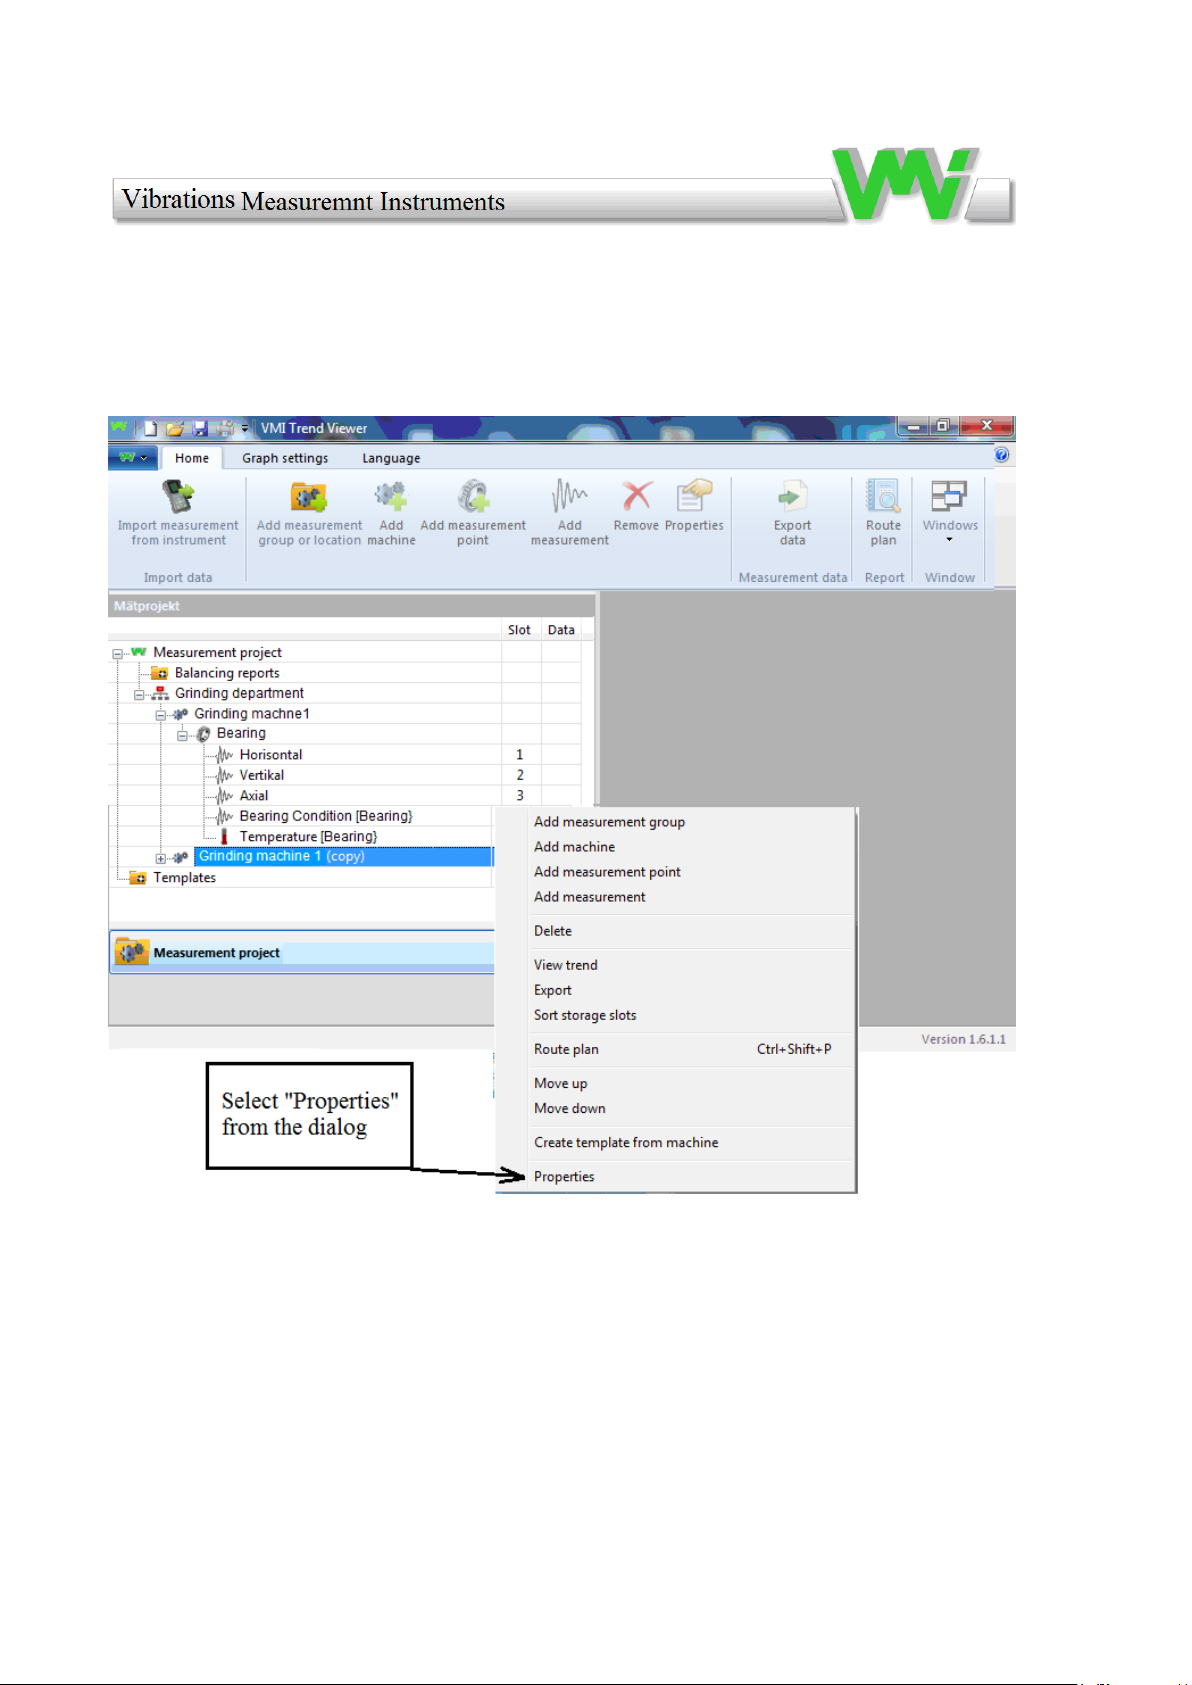
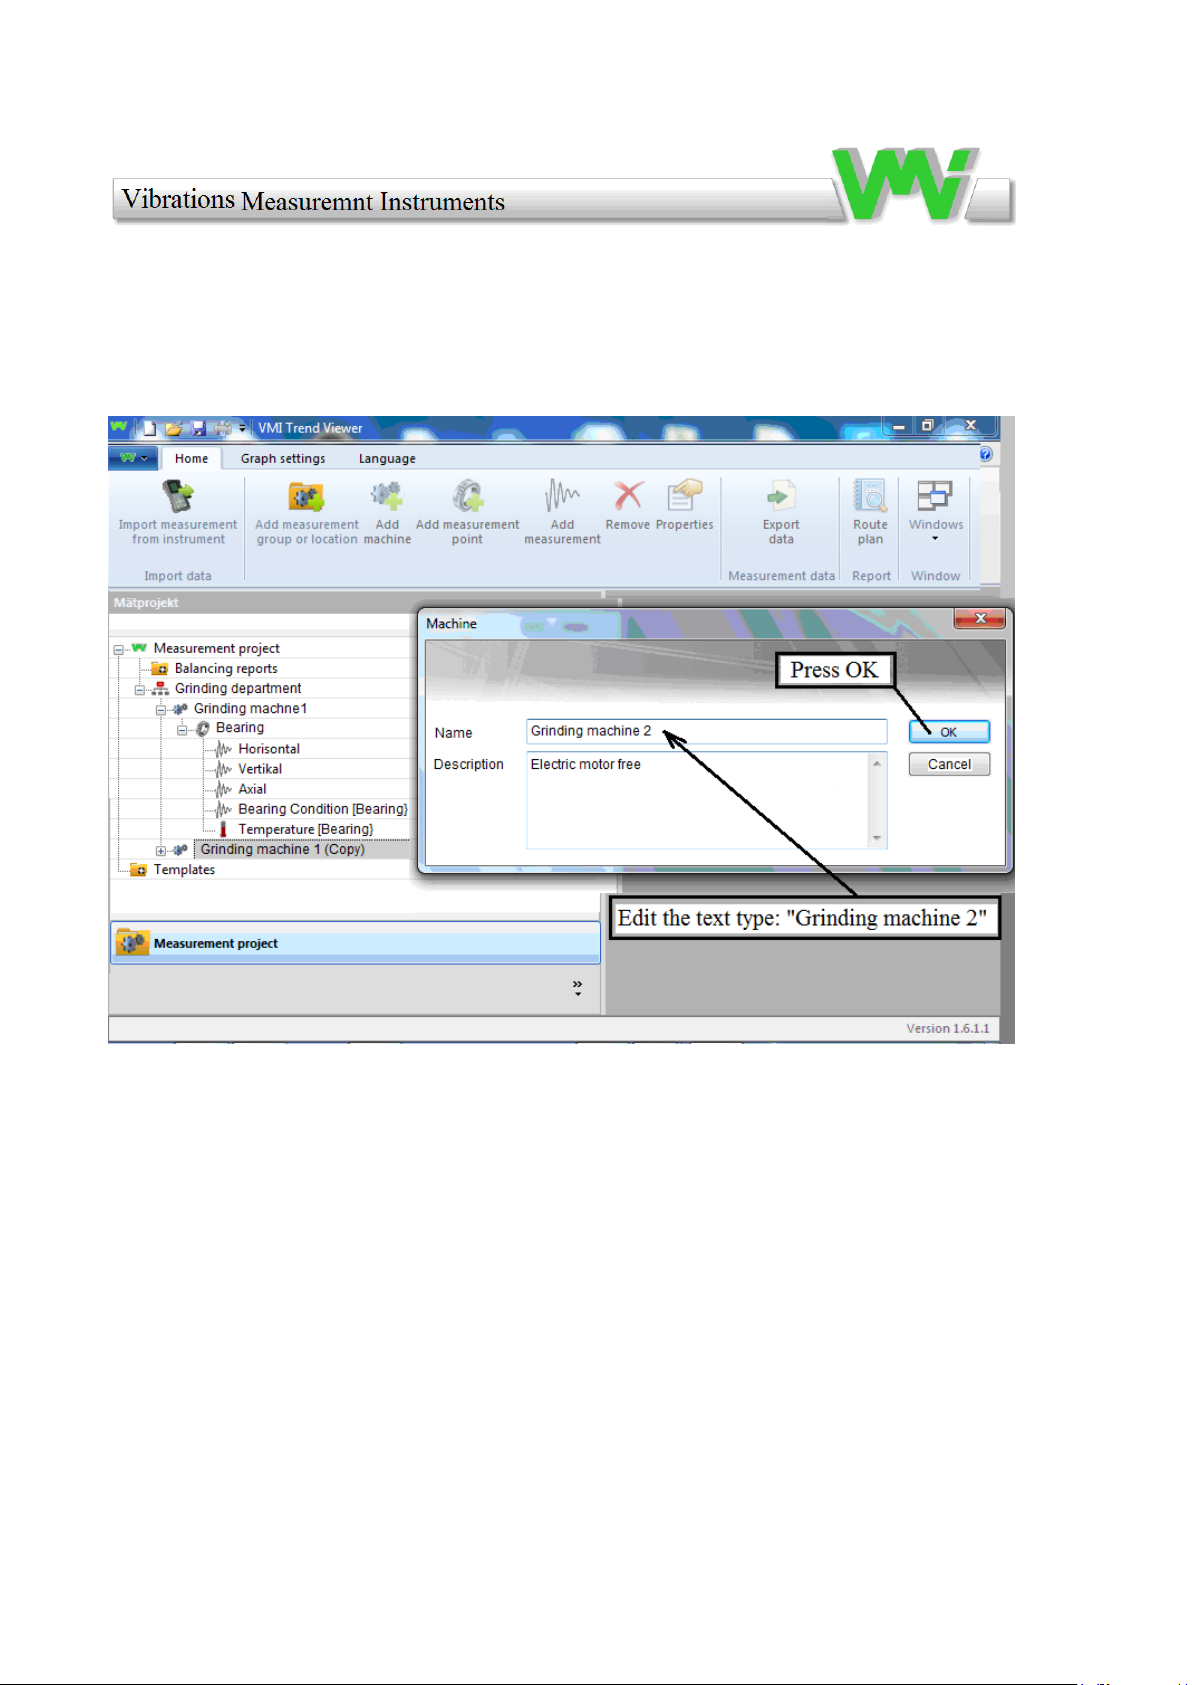
Thus, "Grinding machine 1" is finished. To create "Grinding machine 2" you can now
make a copy of grinding machine 1, and then edit it.
30
Page 31
31
Page 32
32
Page 33
33
Page 34
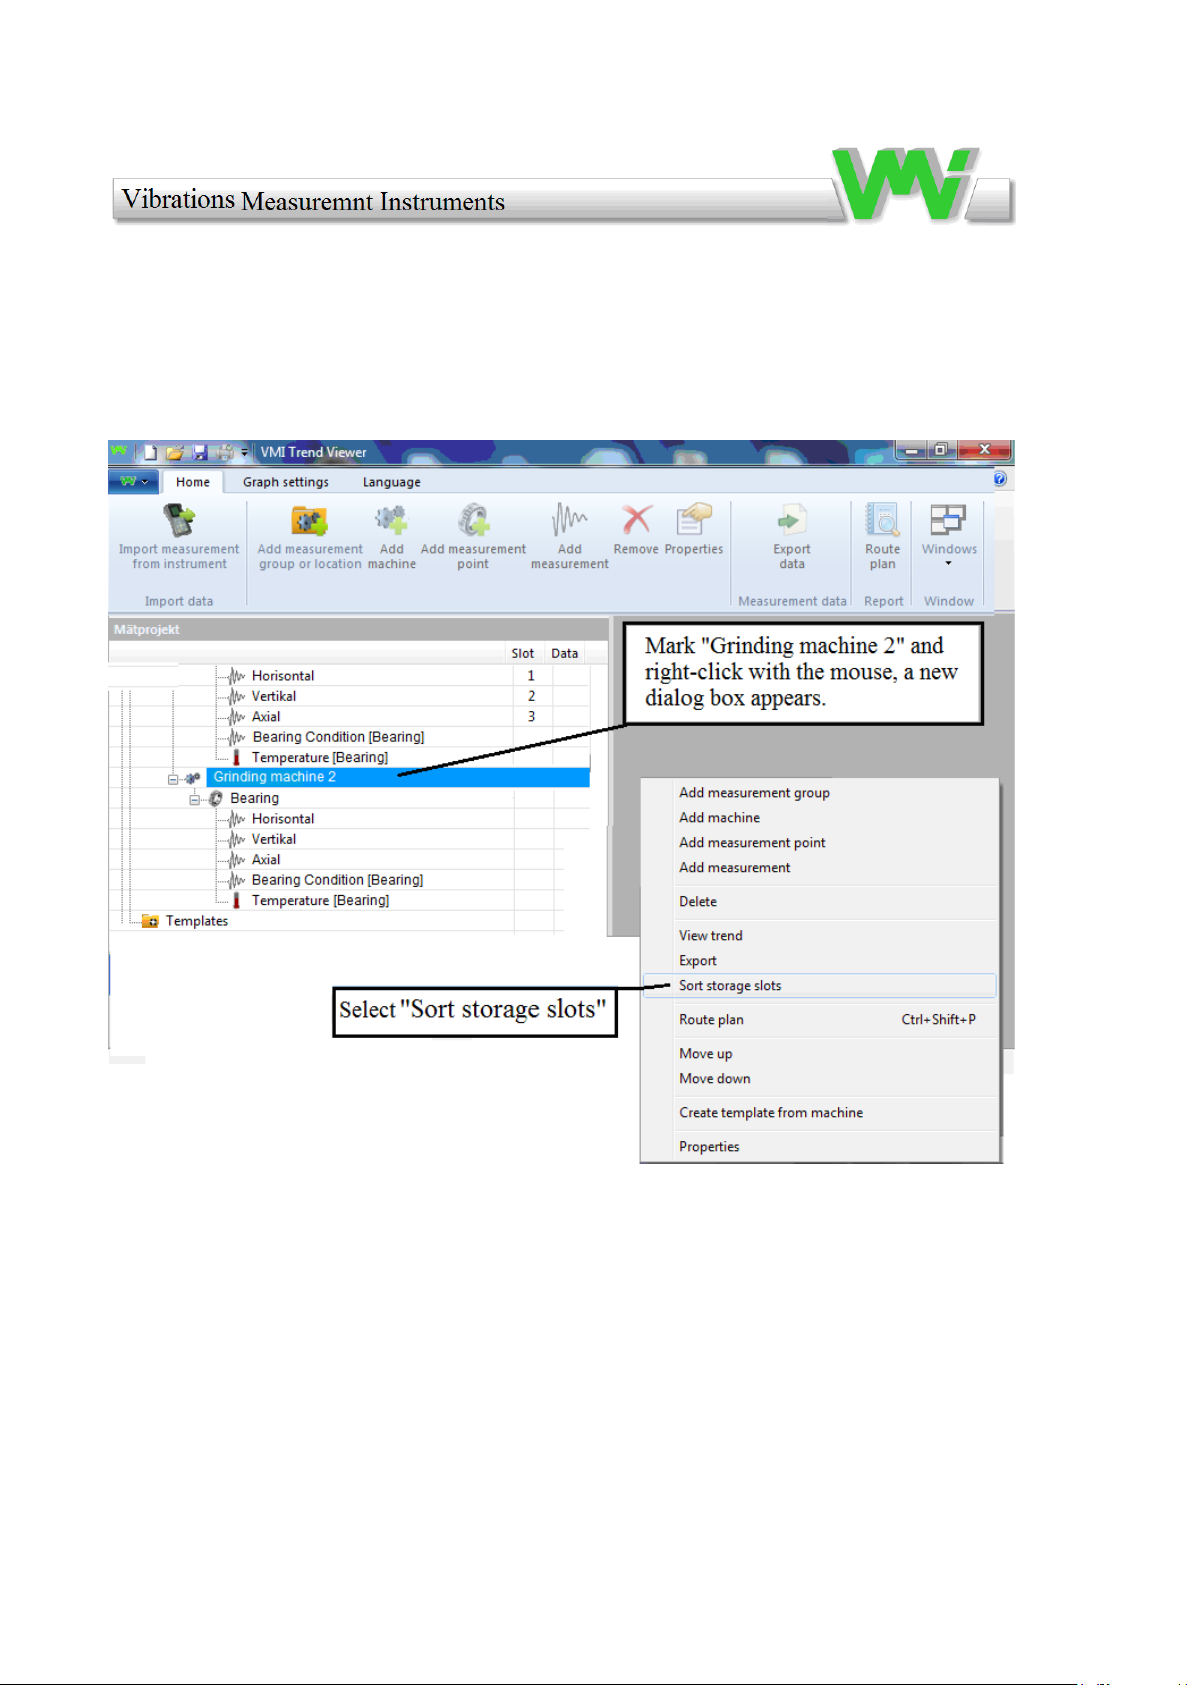
Now we need to assign "Grinding machine 2" slot number (Storage locations).
34
Page 35
35
Page 36
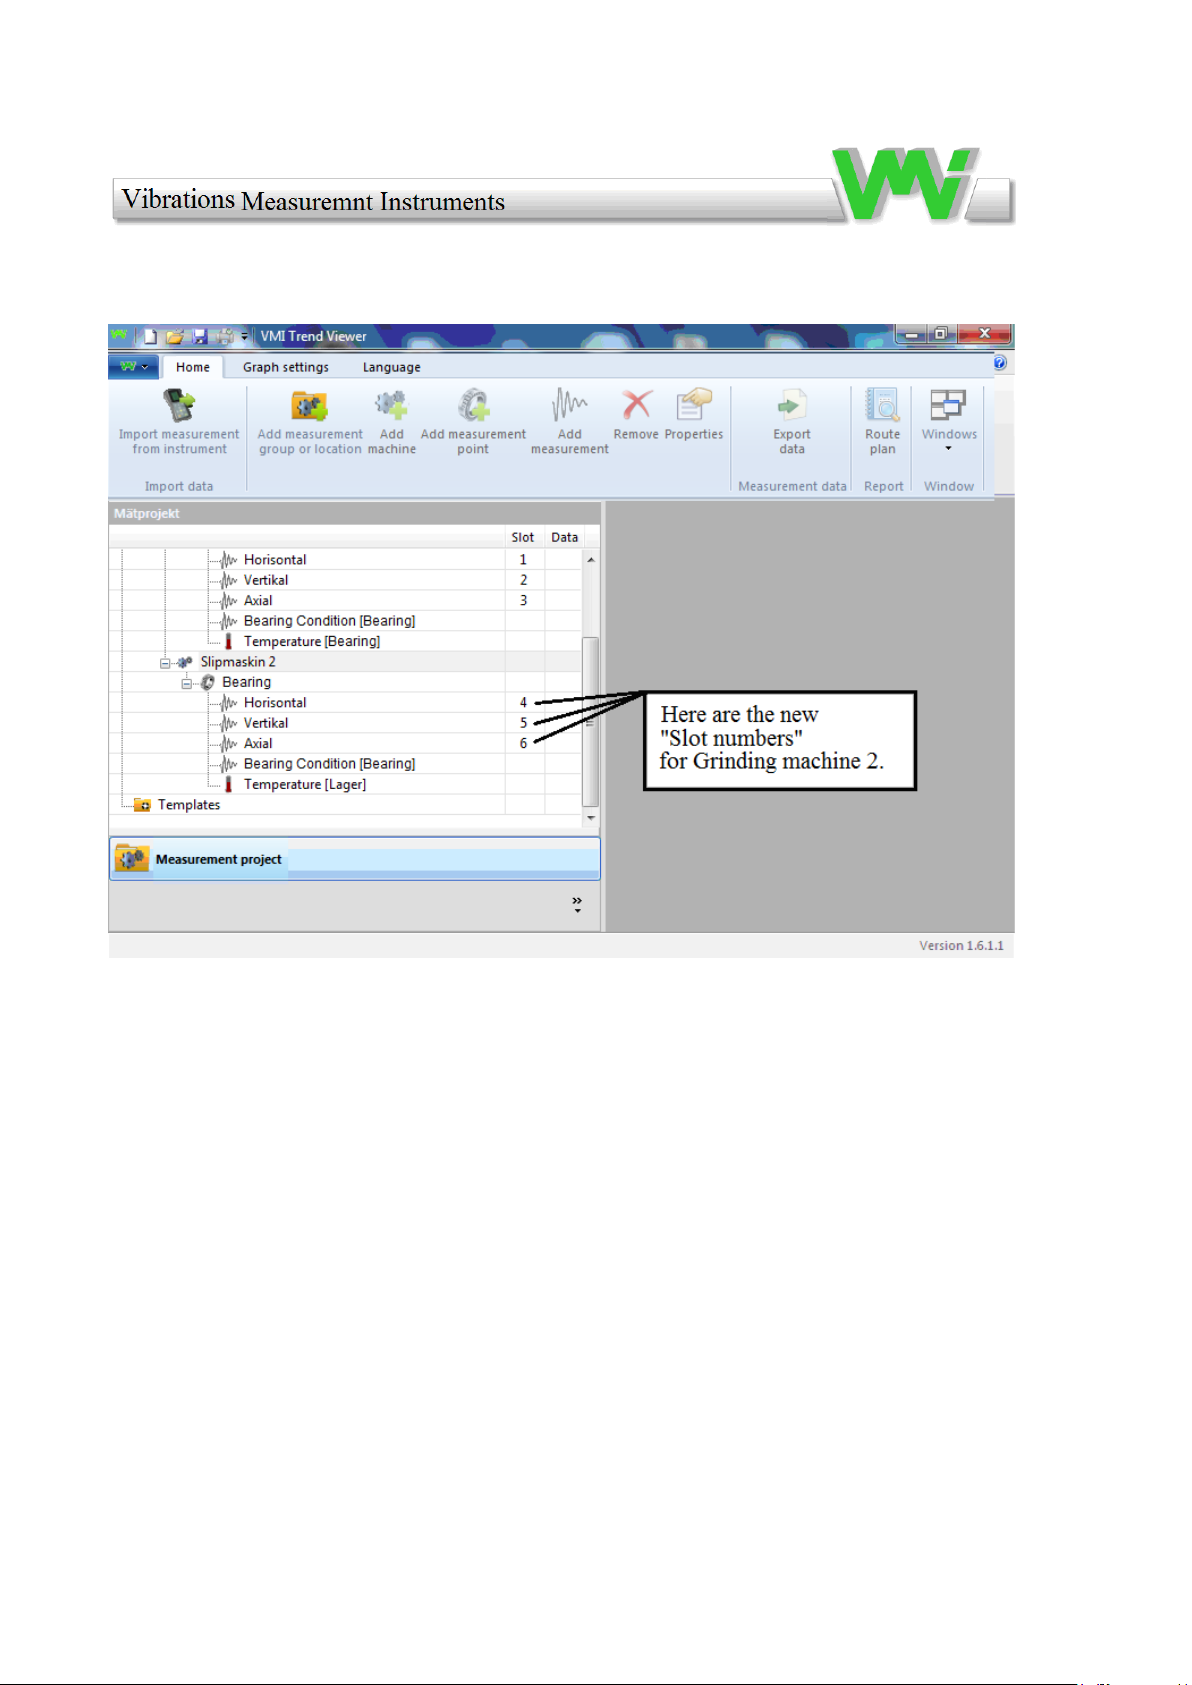
Thus, the first "project" is finish and you can now start measuring on the machines and
then transfer measurement data to "Trend View".
36
Page 37
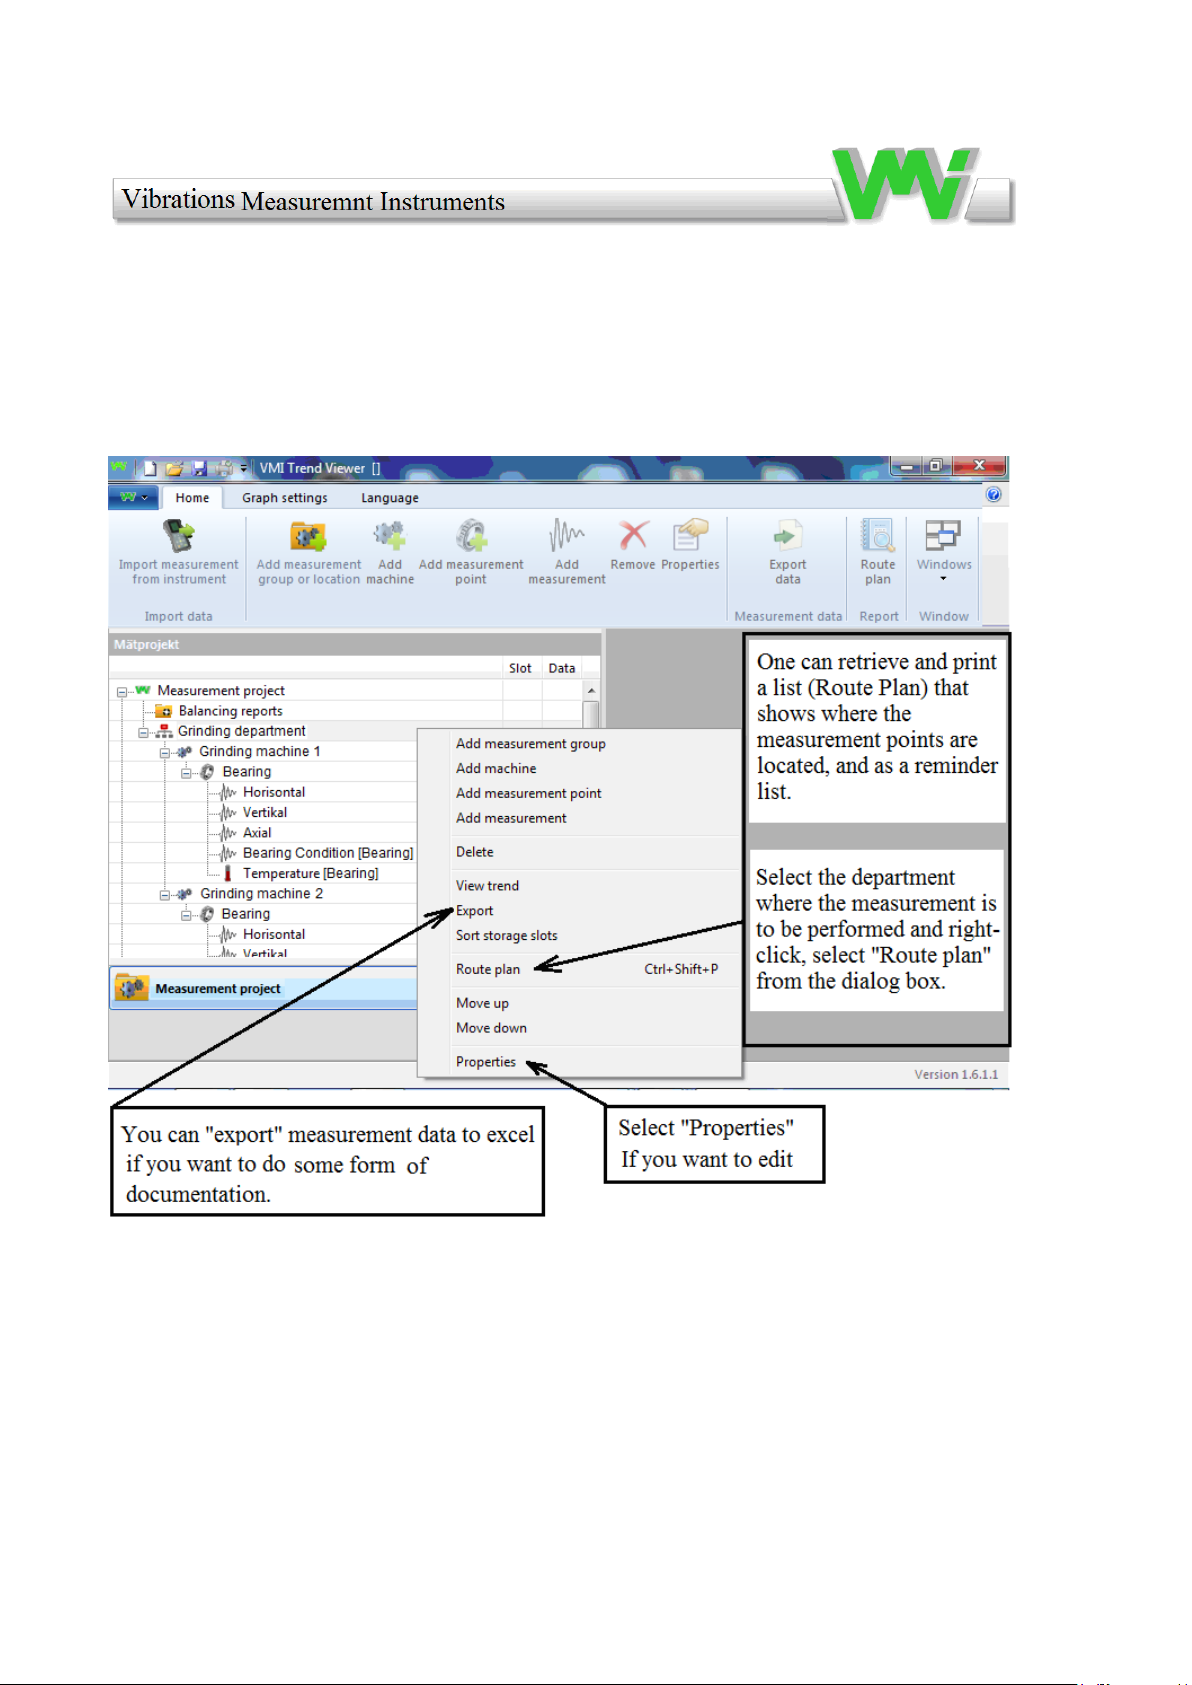
9.2 Create a "Route Plan" and edit a project
We recommend that the route plan be printed out and used every time you make
measurements. Make a route plan based on how often the measurement is done, such
as week, month, half year etc.
37
Page 38
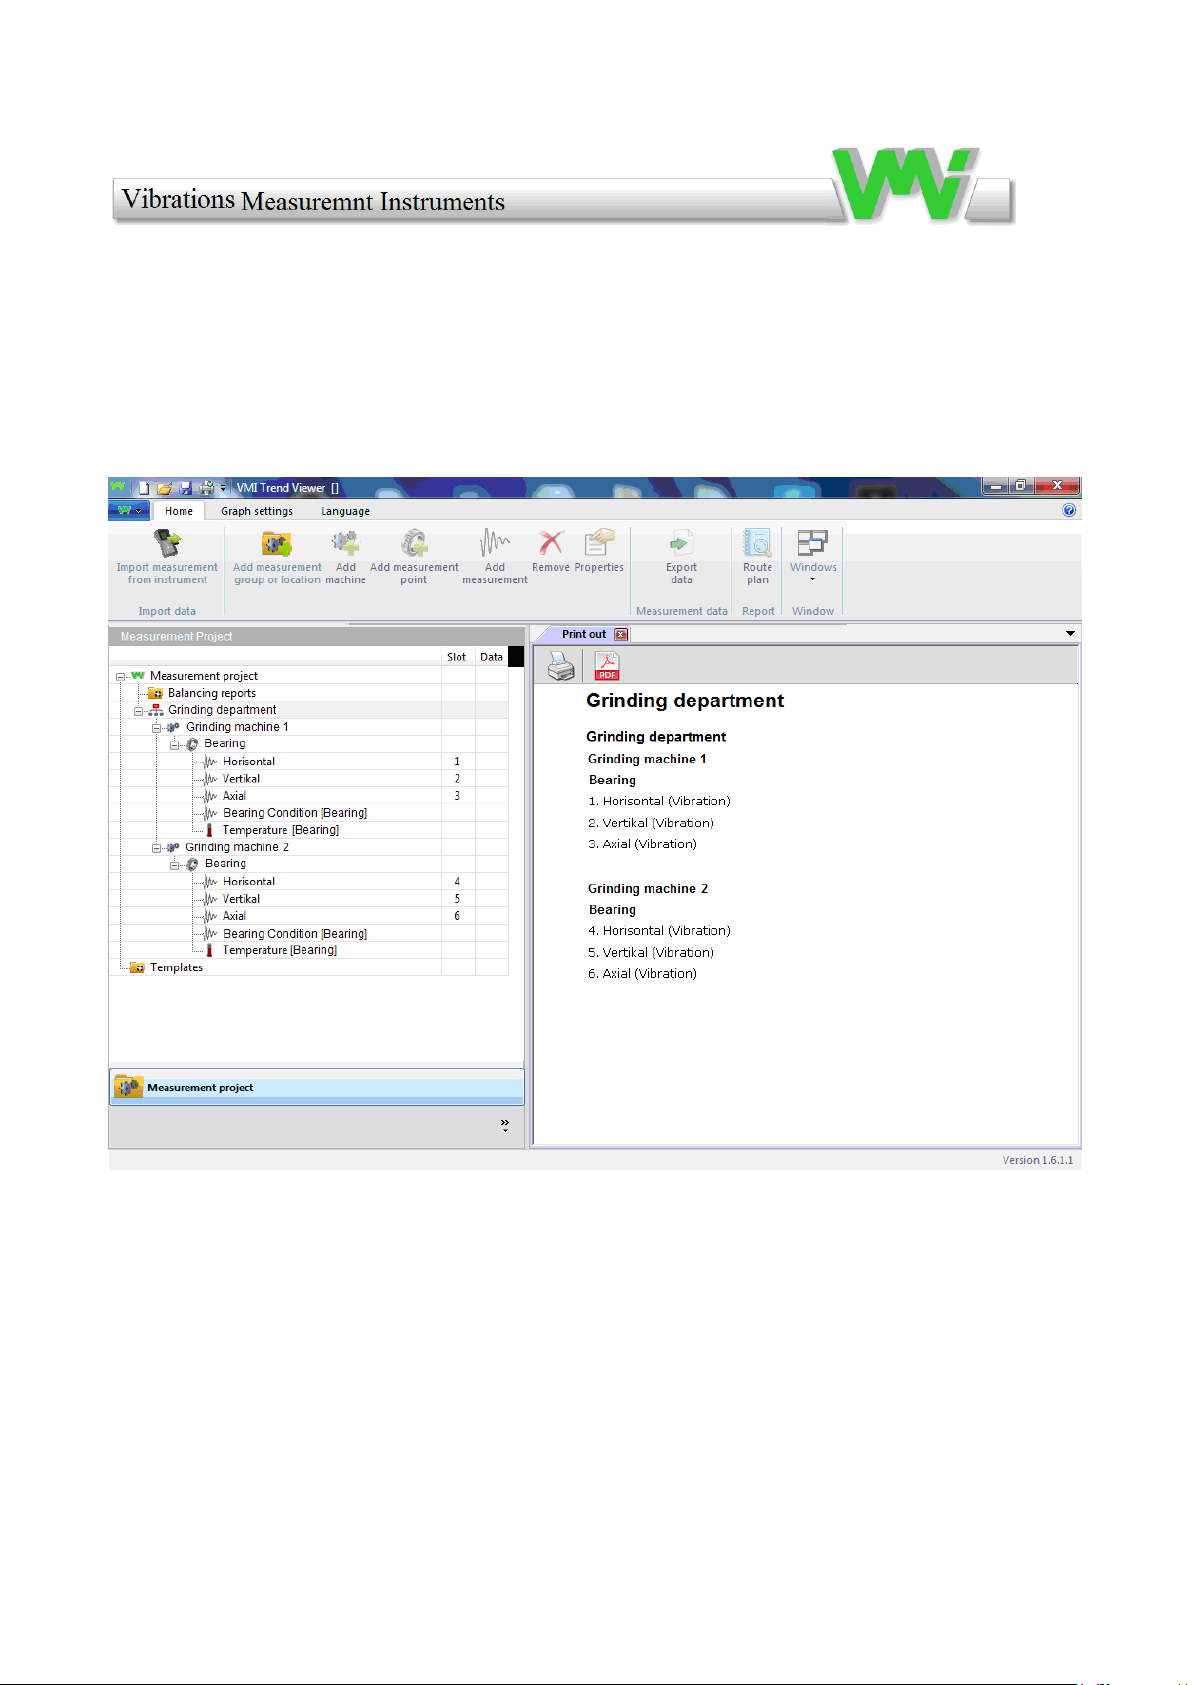
When selecting "Route plan", a list appears to the right in the picture, that can be
printed out.
38
Page 39
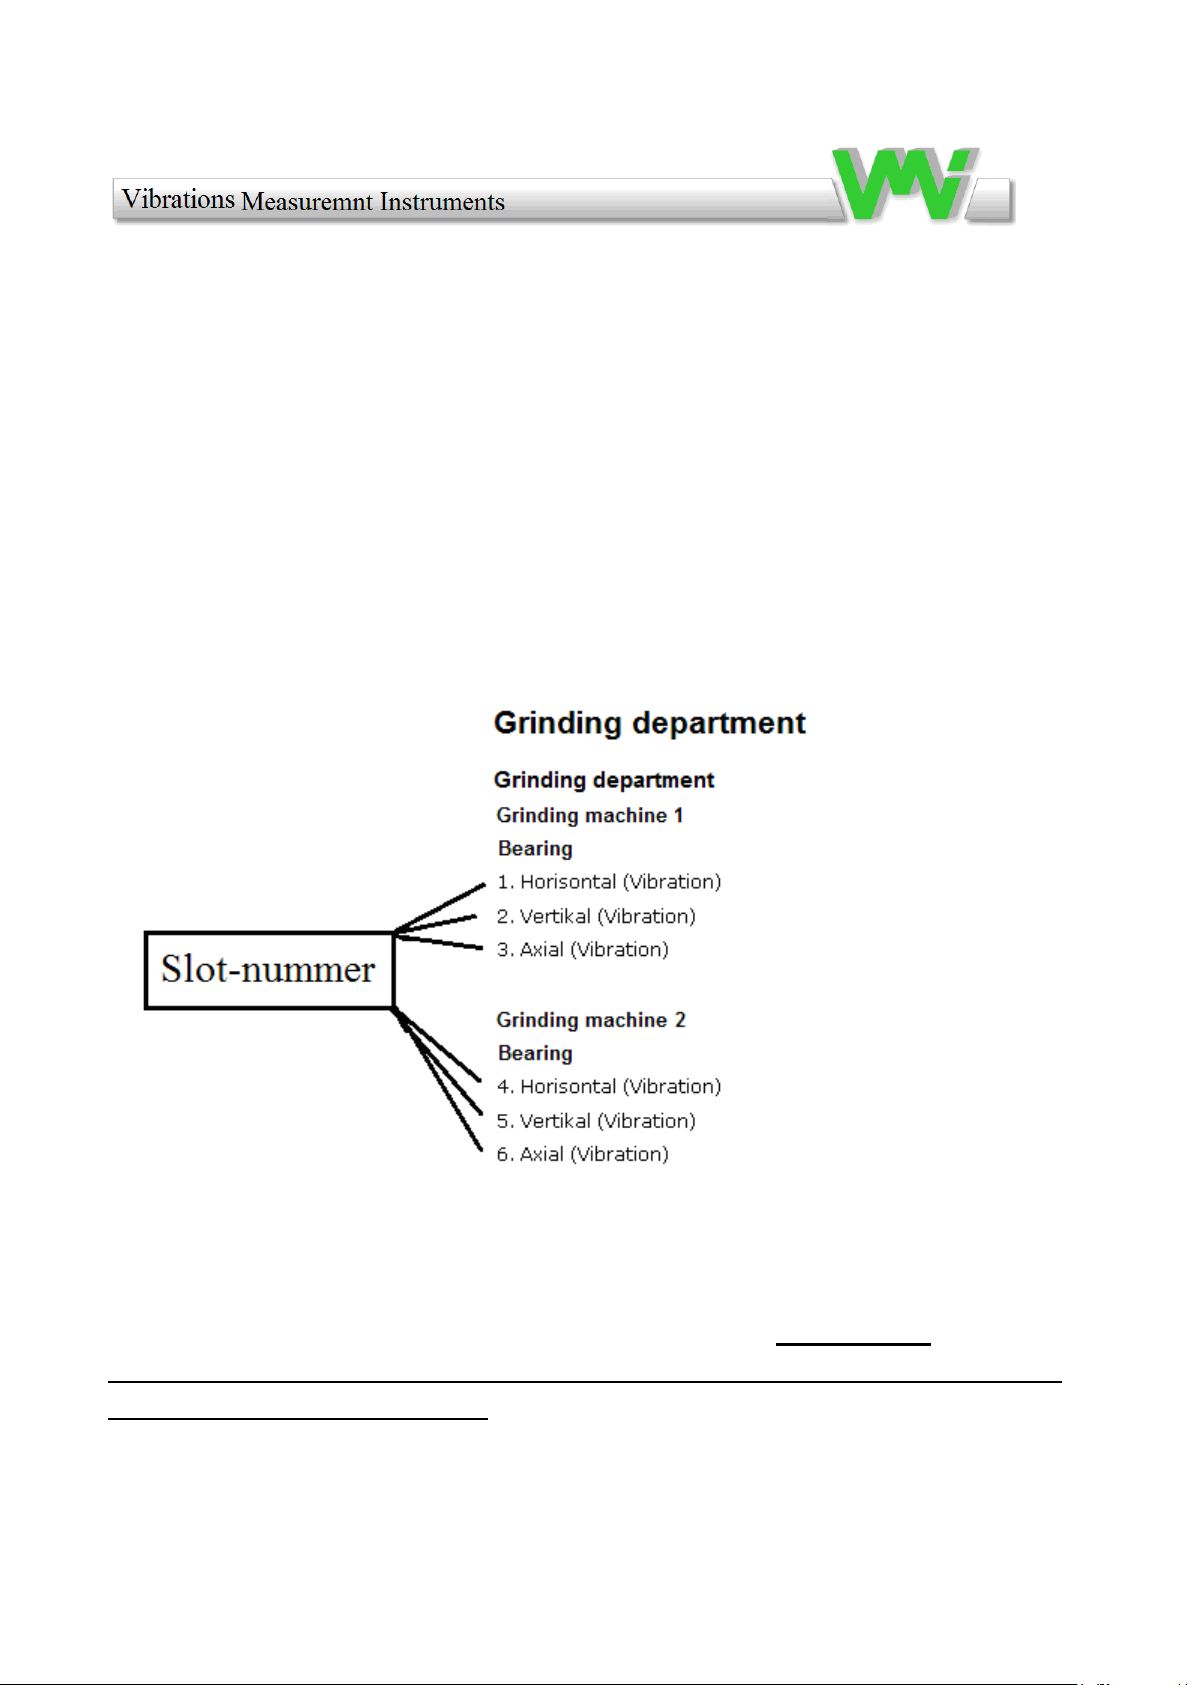
9.3 Trend measurements
Perform the project (database) with the machines you want to measure within the same
interval, (weekly, monthly, etc.).
Mark the machines according to the printed list:
Each new measurement performed on the same machine must be stored in the same
"slot number" (memory cell) as the previous measurement. Before a new
measurement is performed, first the previous measurement must be transferred
to the "Project" in Trend View.
39
Page 40
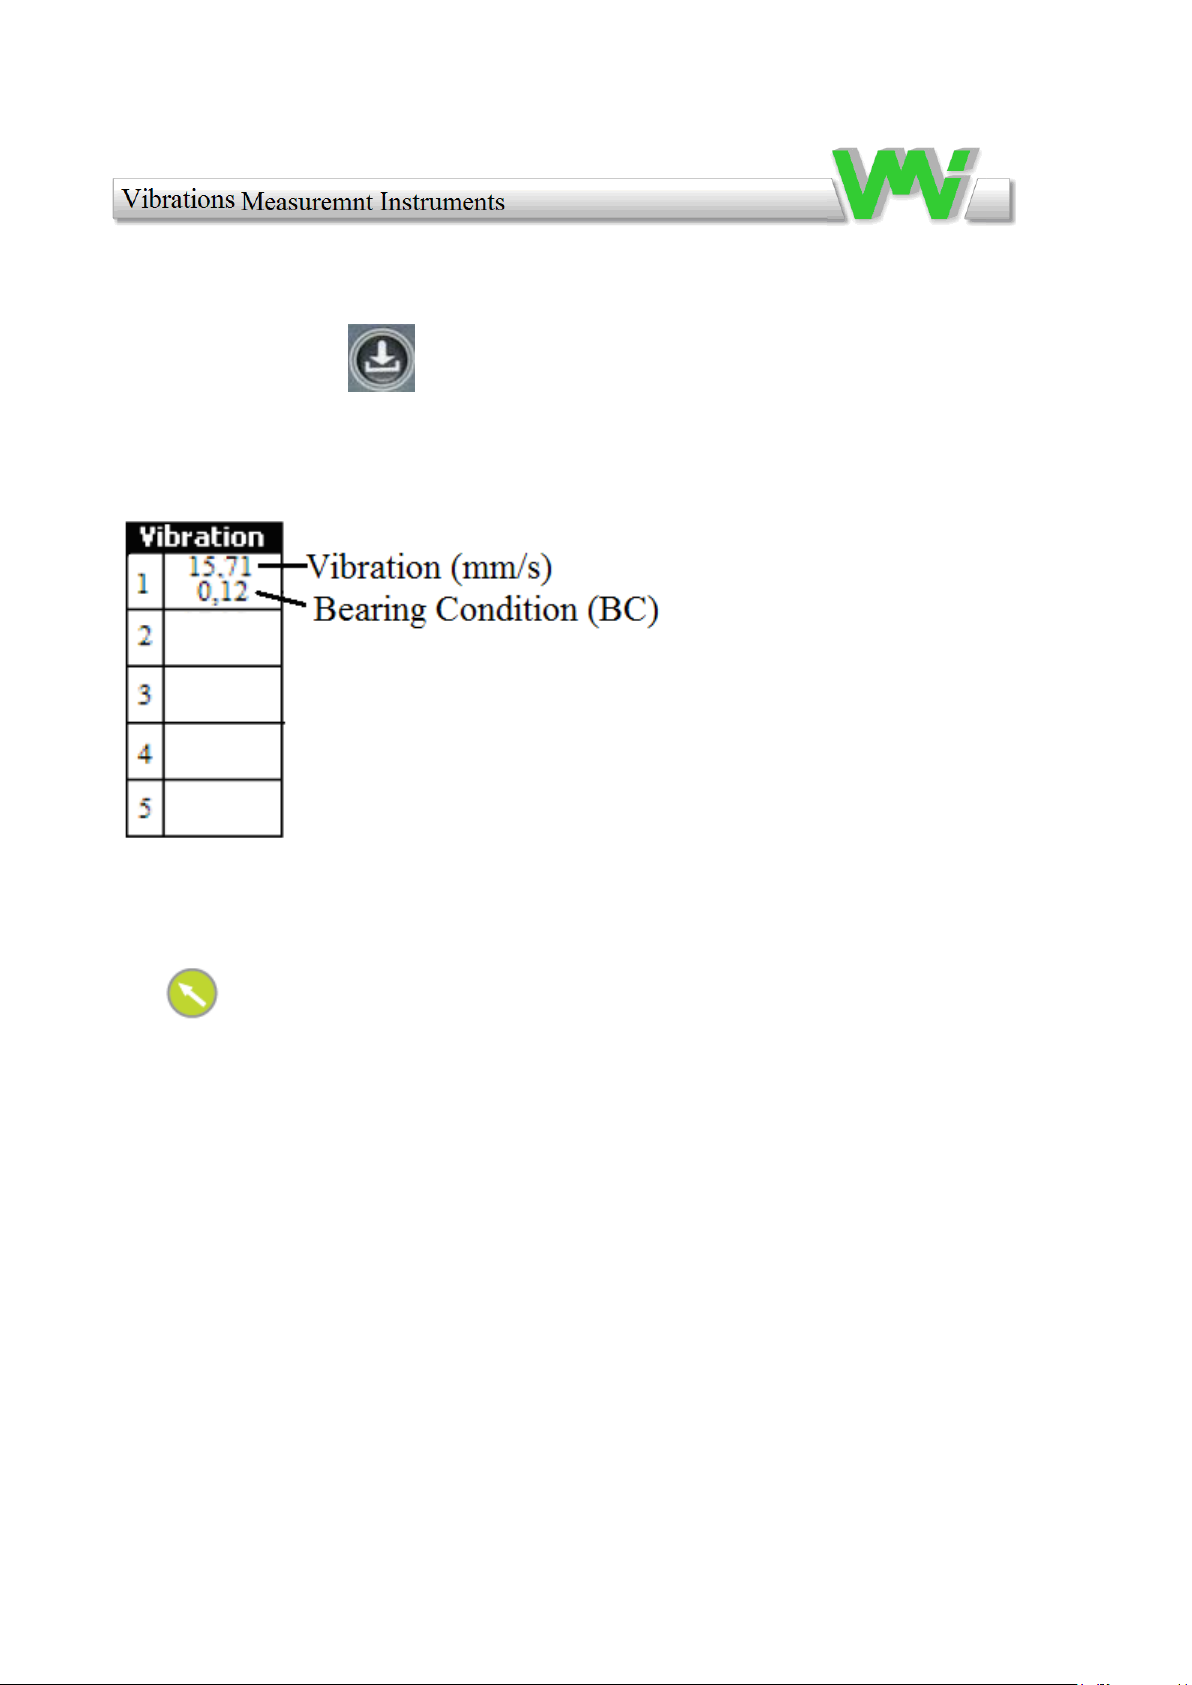
Press the SAVE key to save a measurement, and the vibration storage table
appears on the instrument display:
If you want to place the measurement value in "slot number 1" confirm with the green
key. If you want to move the measurement value to another slot number, use
the arrow keys.
40
Page 41
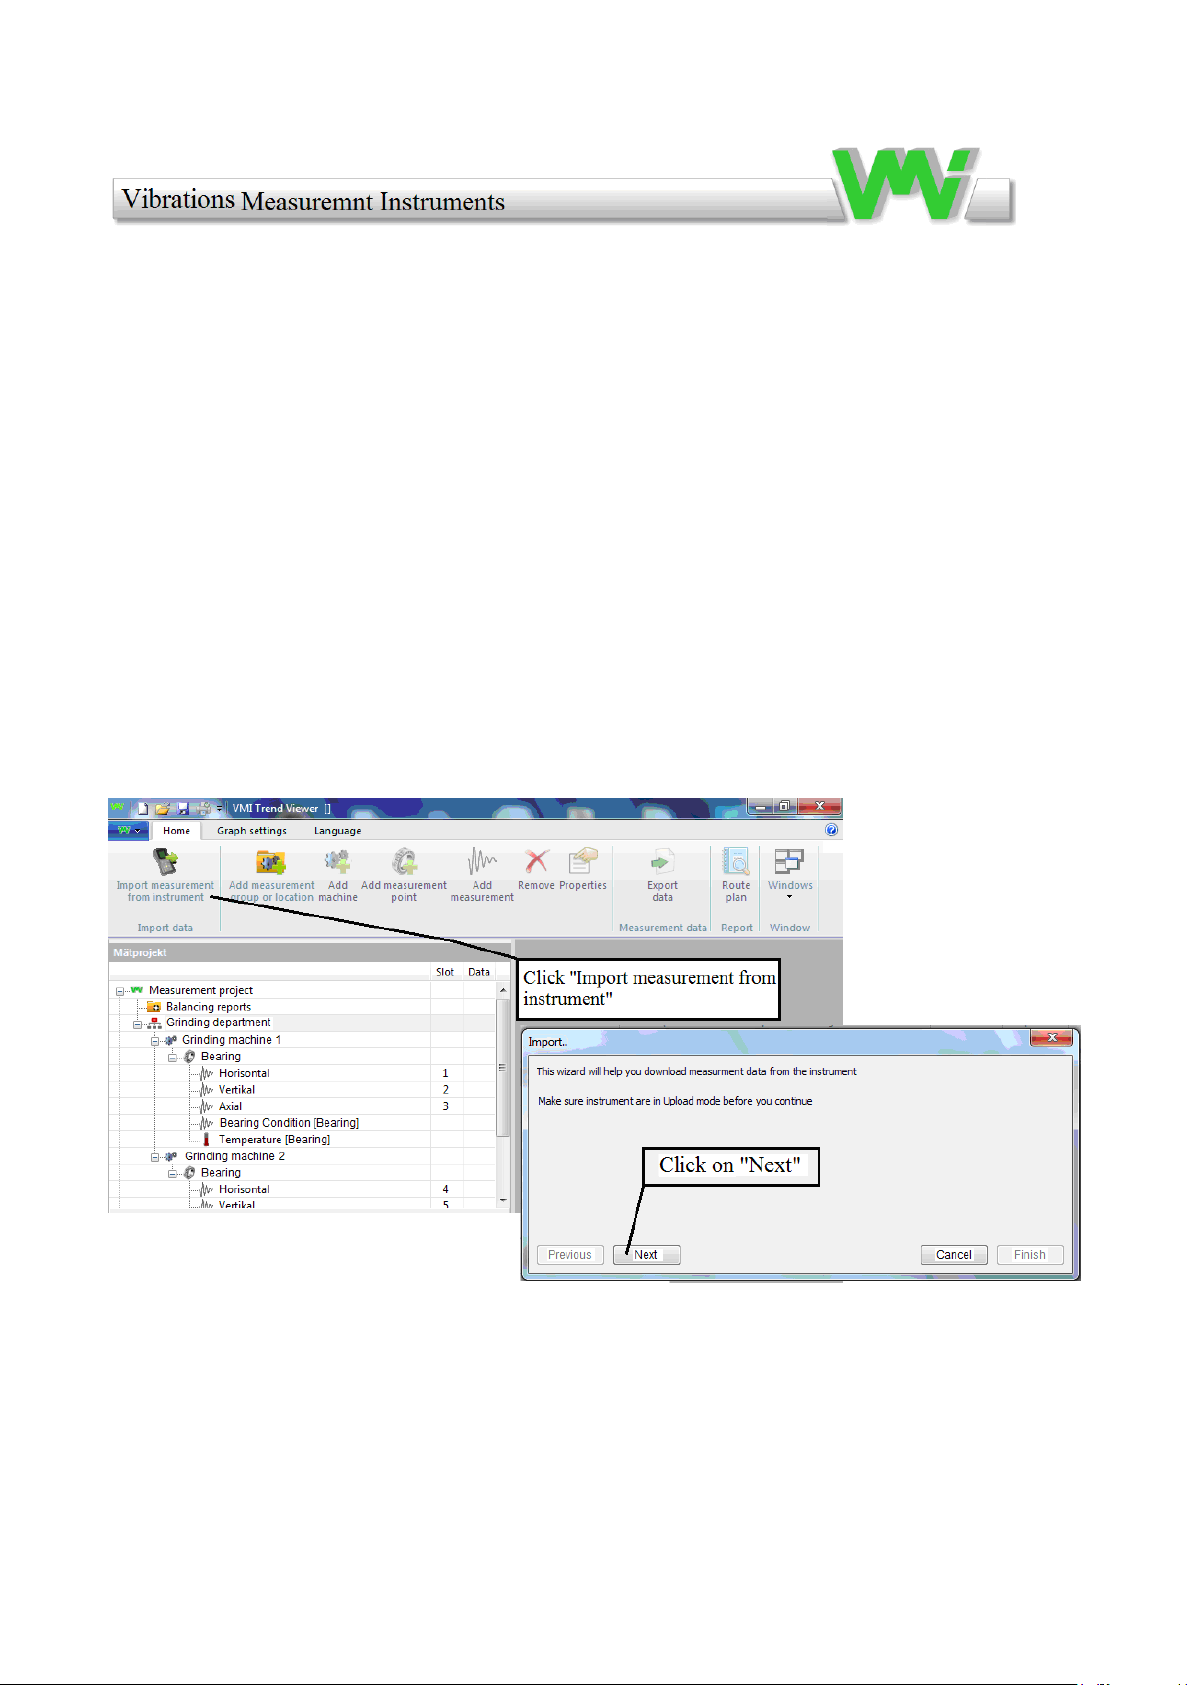
9.4 Transfer of data to Trend View
When each measurement in a route is complete, measurement data must be transferred
to the “Trend View” computer software. Note. It is important that you make the
"transfer" in the correct order, see below.
1) Connect "(USB - 3.5mm plug)- cable" to the instrument "Serial data connector" ,
and the USB side to the computer's USB input. You must verify that the correct serial
port is selected by the computer (If a problem occurs, see the special installation
instructions for the PC software.
2) Start the VIBER X2 Pro ™ instrument, and select "Upload" from the function
menu.
3) Open "Trend View" and select "Import measurement data from instrument"
41
Page 42
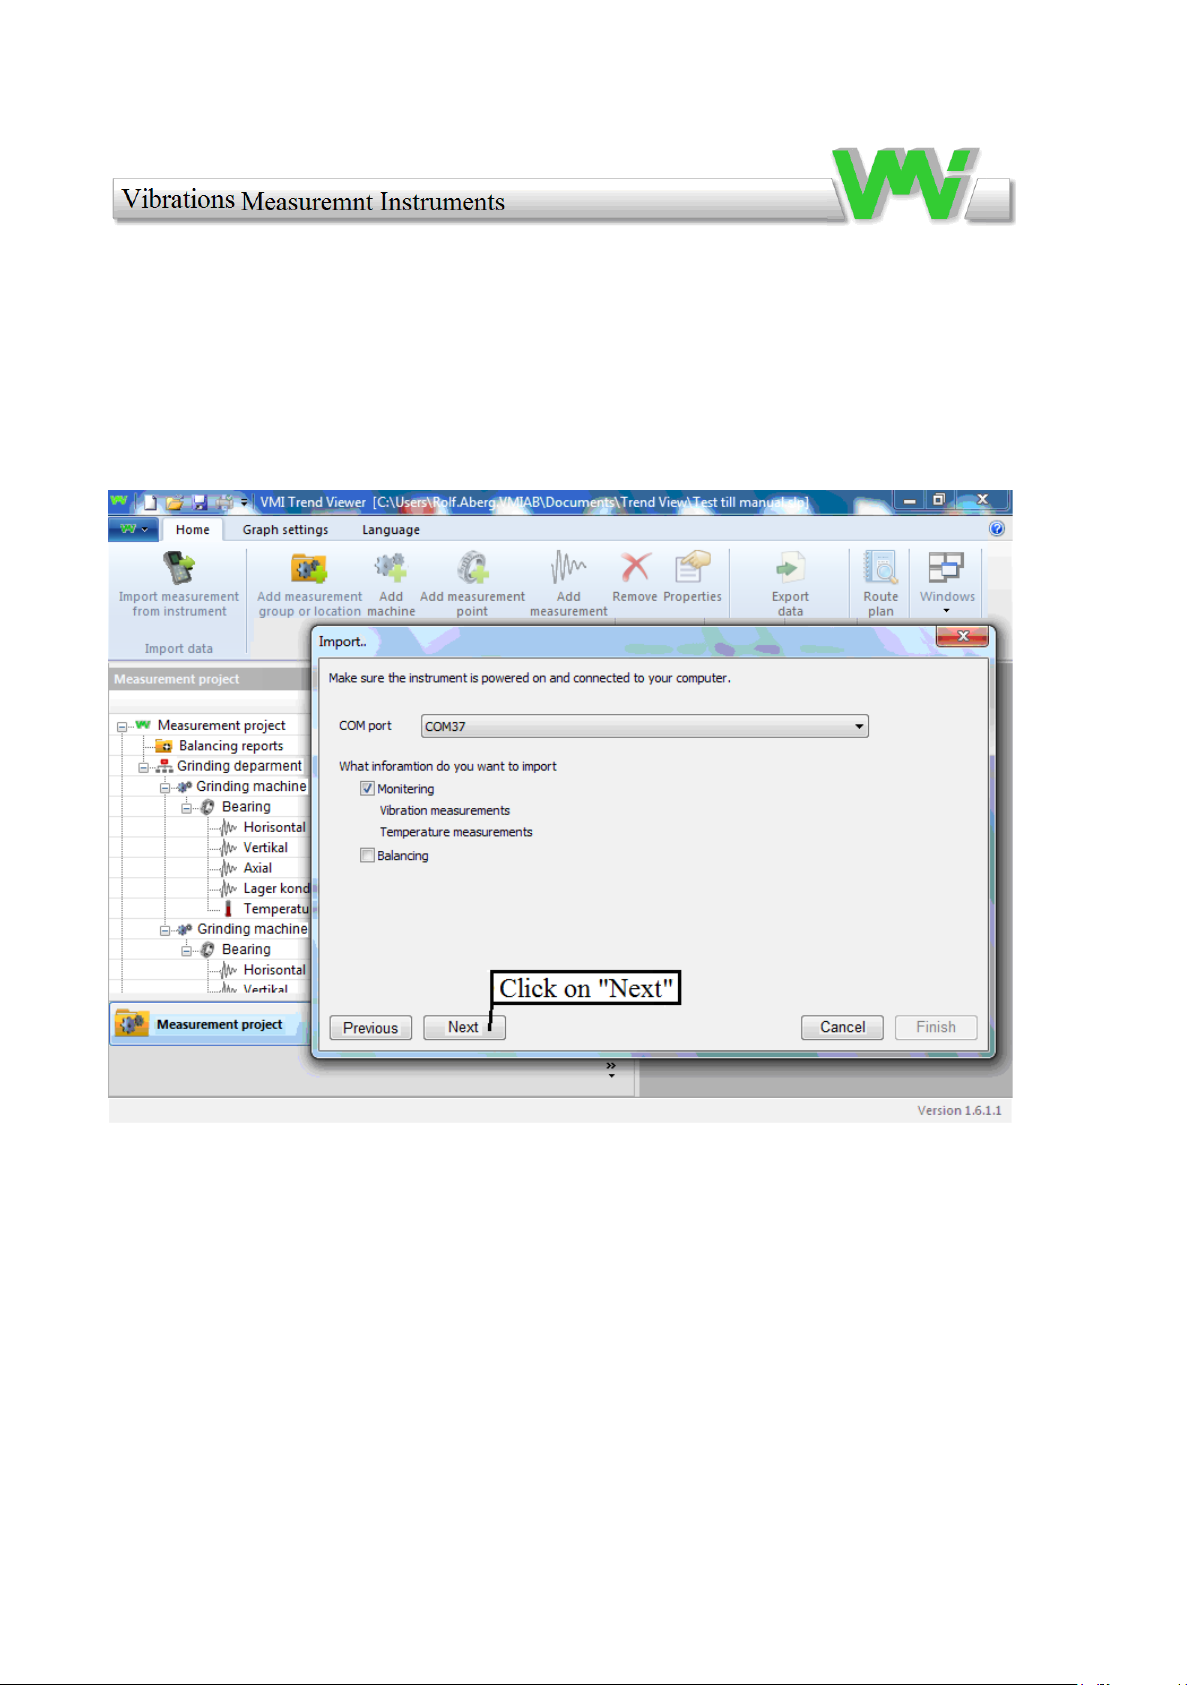
Note. The VIBER X2 Pro ™ instrument must be "on" and upload must be selected
from the function menu, confirm with the green key. A rotating symbol appears on the
screen. In this mode, you continue in "Trend View" by clicking "Next" in the dialog
box.
42
Page 43
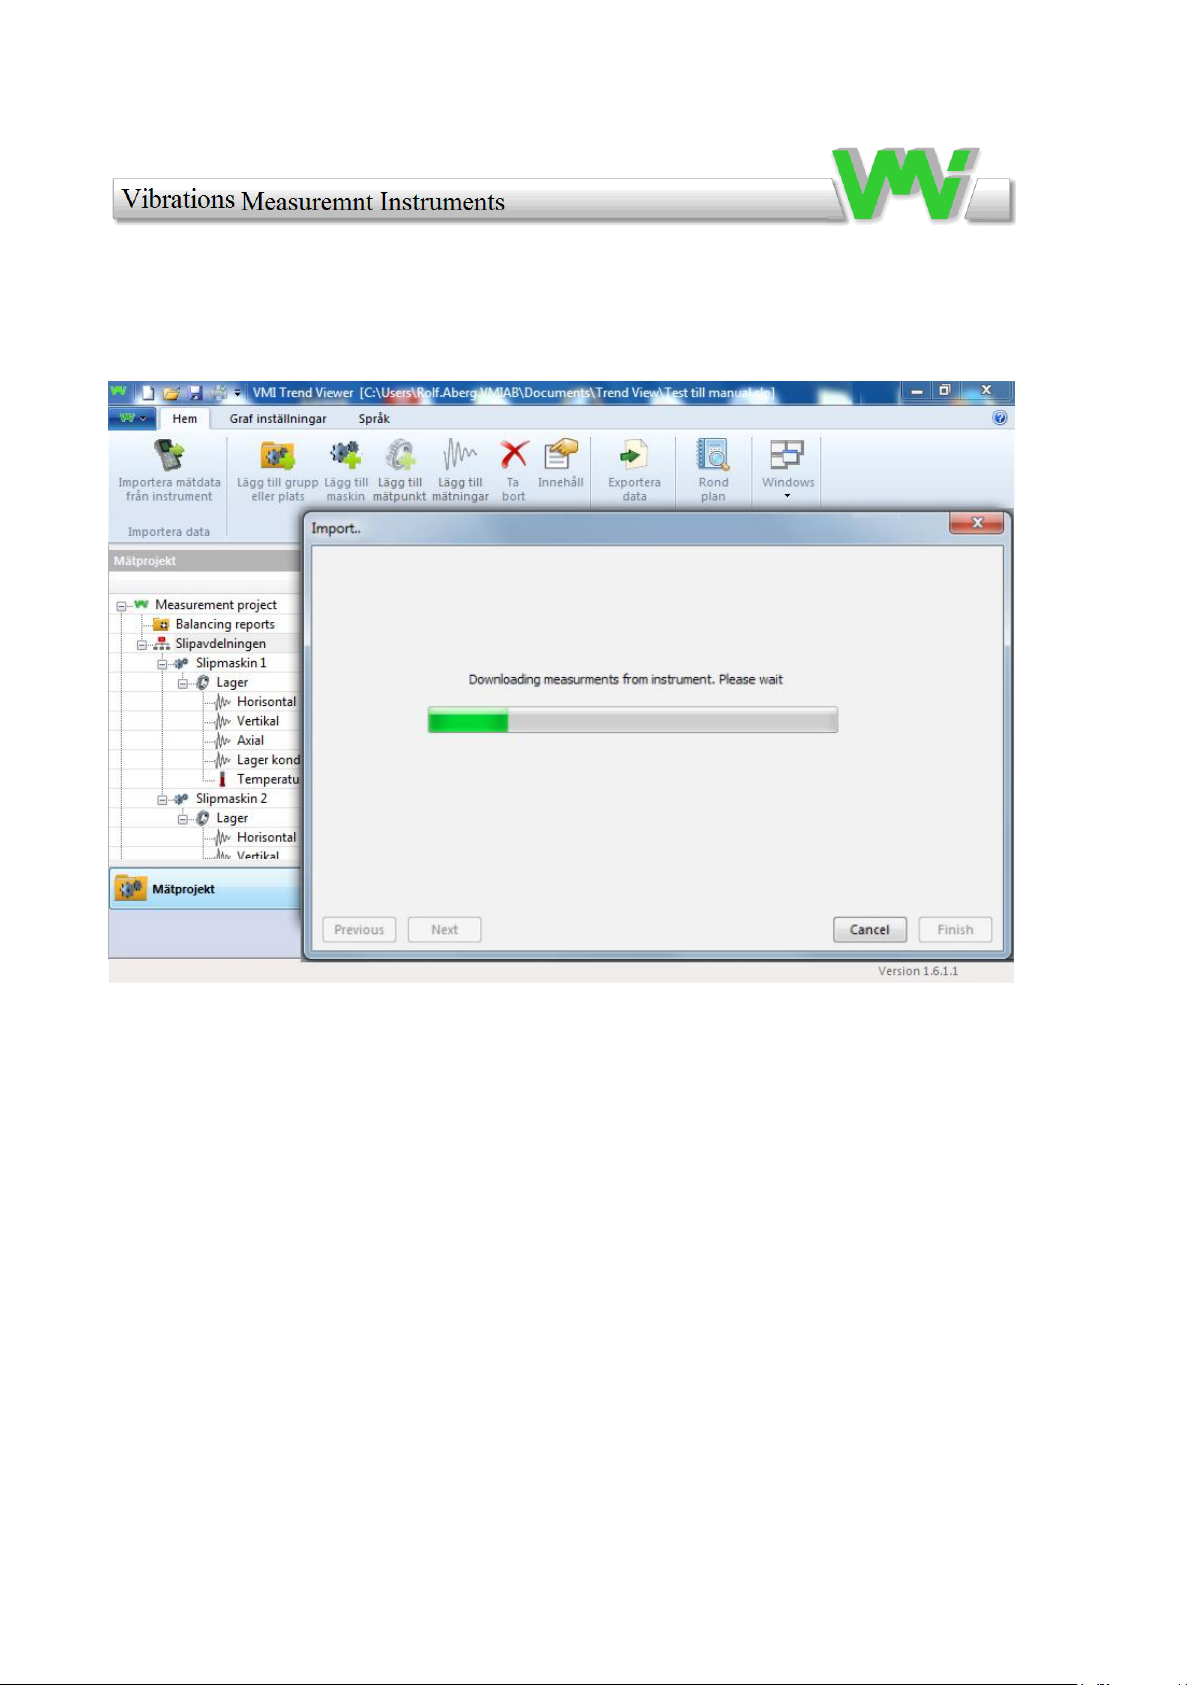
Wait a while, and the transfer procedure will start.
43
Page 44
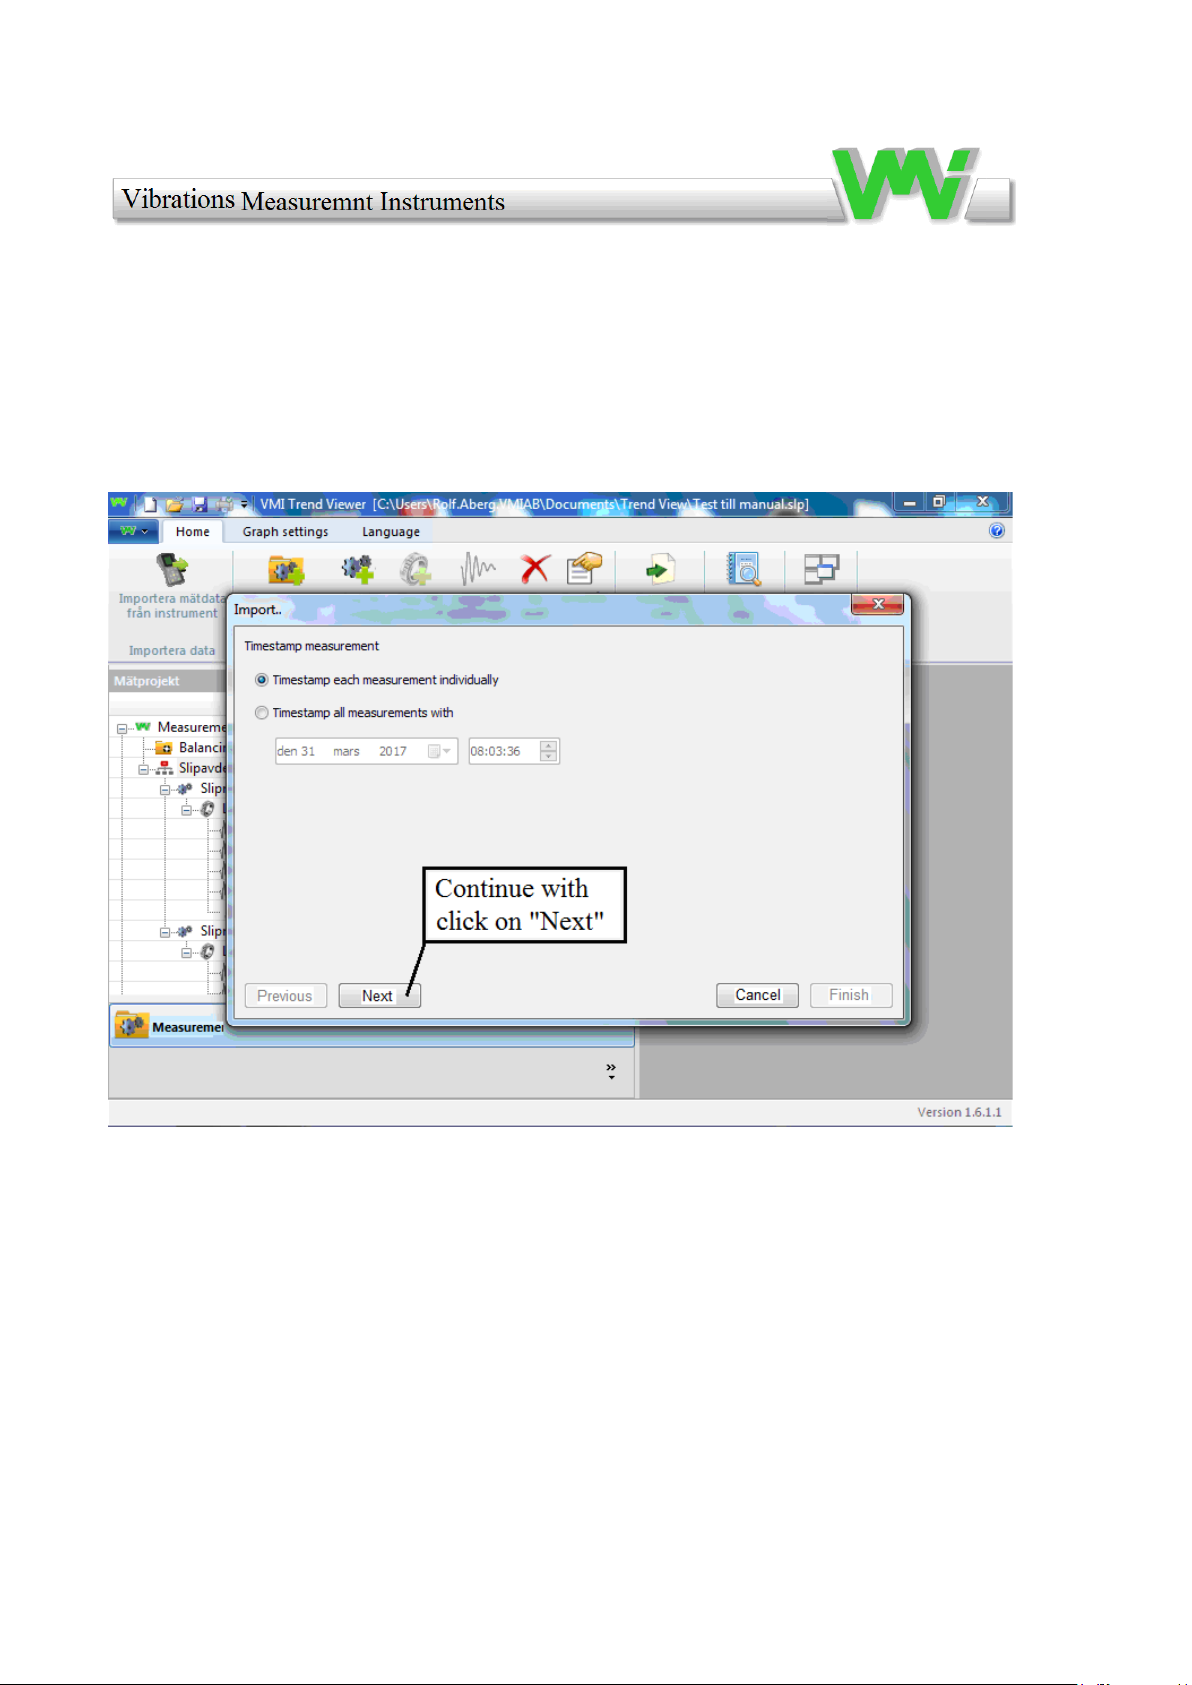
Since the instrument does not store times when the measurement was performed, but
only time for the transfer, you have to change the date manually. If you want to save
the times when the measurement was performed select: "Timestamp each
measurement individualy".
44
Page 45
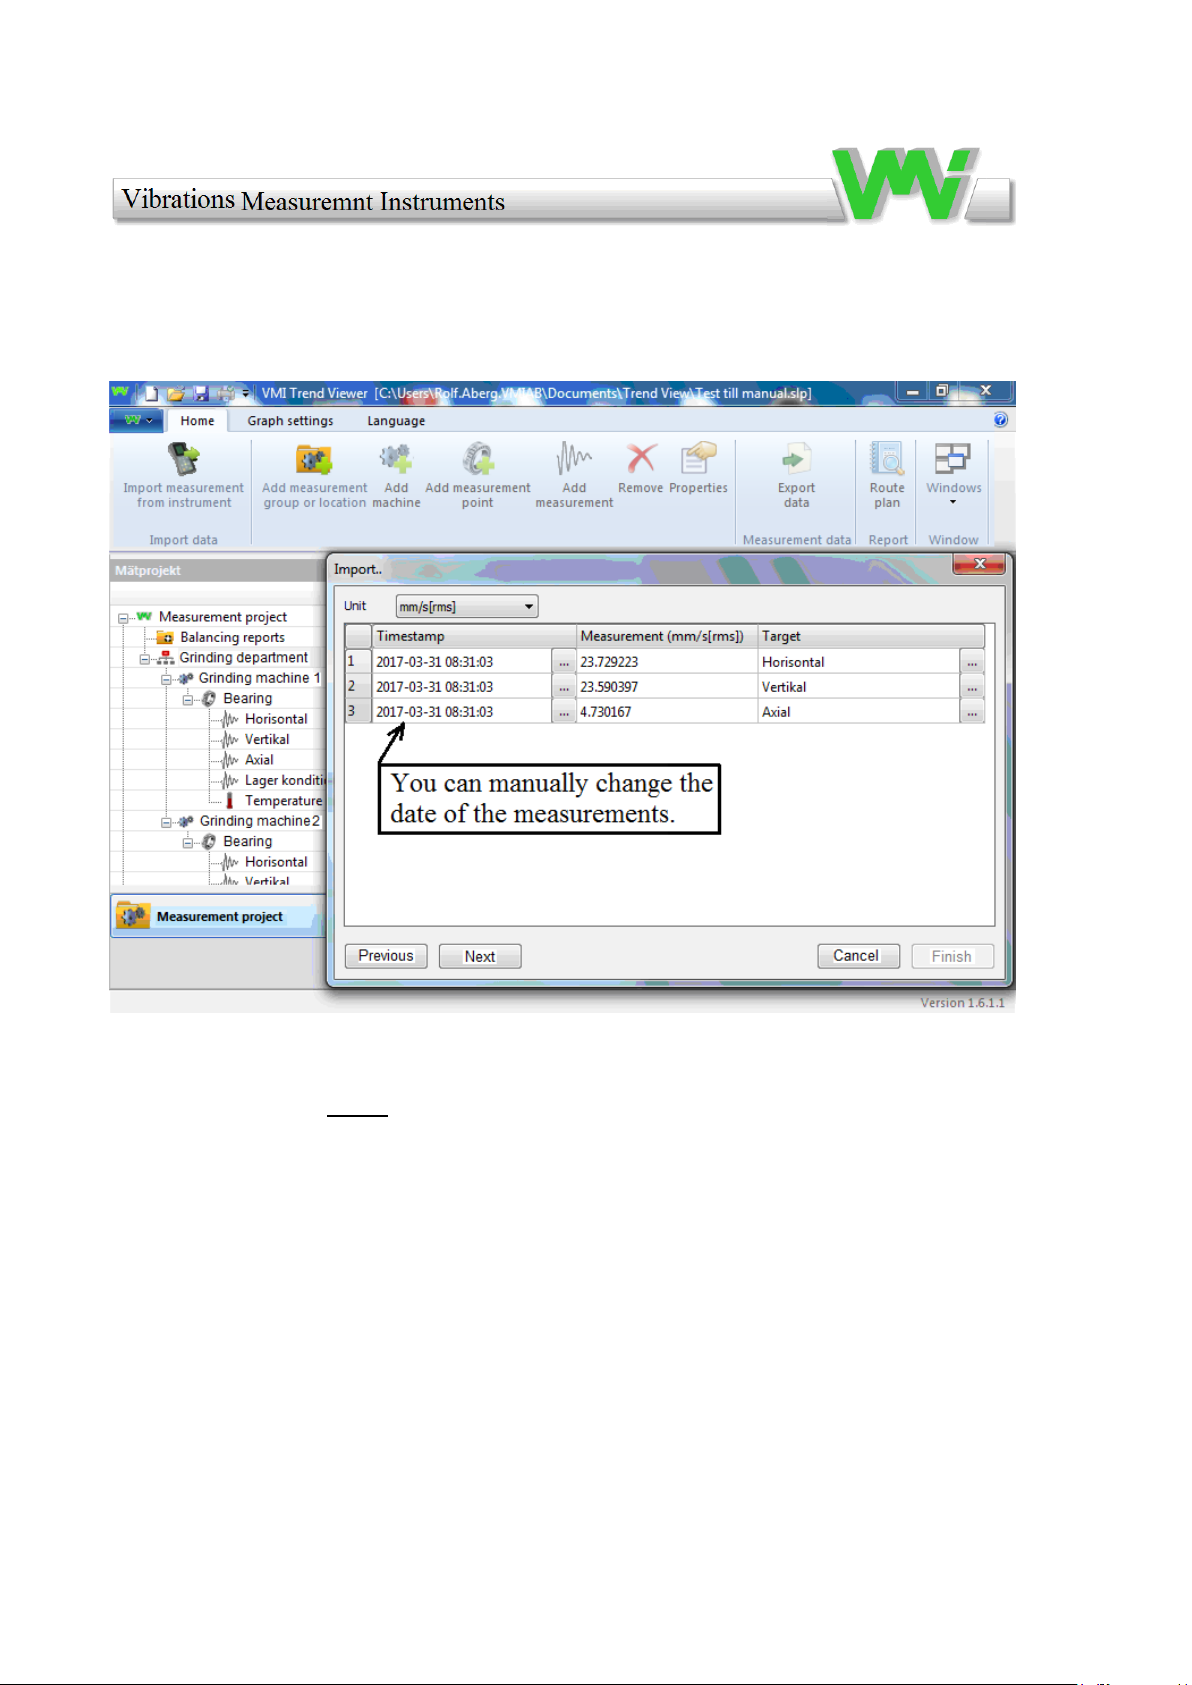
Here shows all vibration data from the first measurement.
Note. Temperature is not measured with VIBER X2 Pro™.
45
Page 46
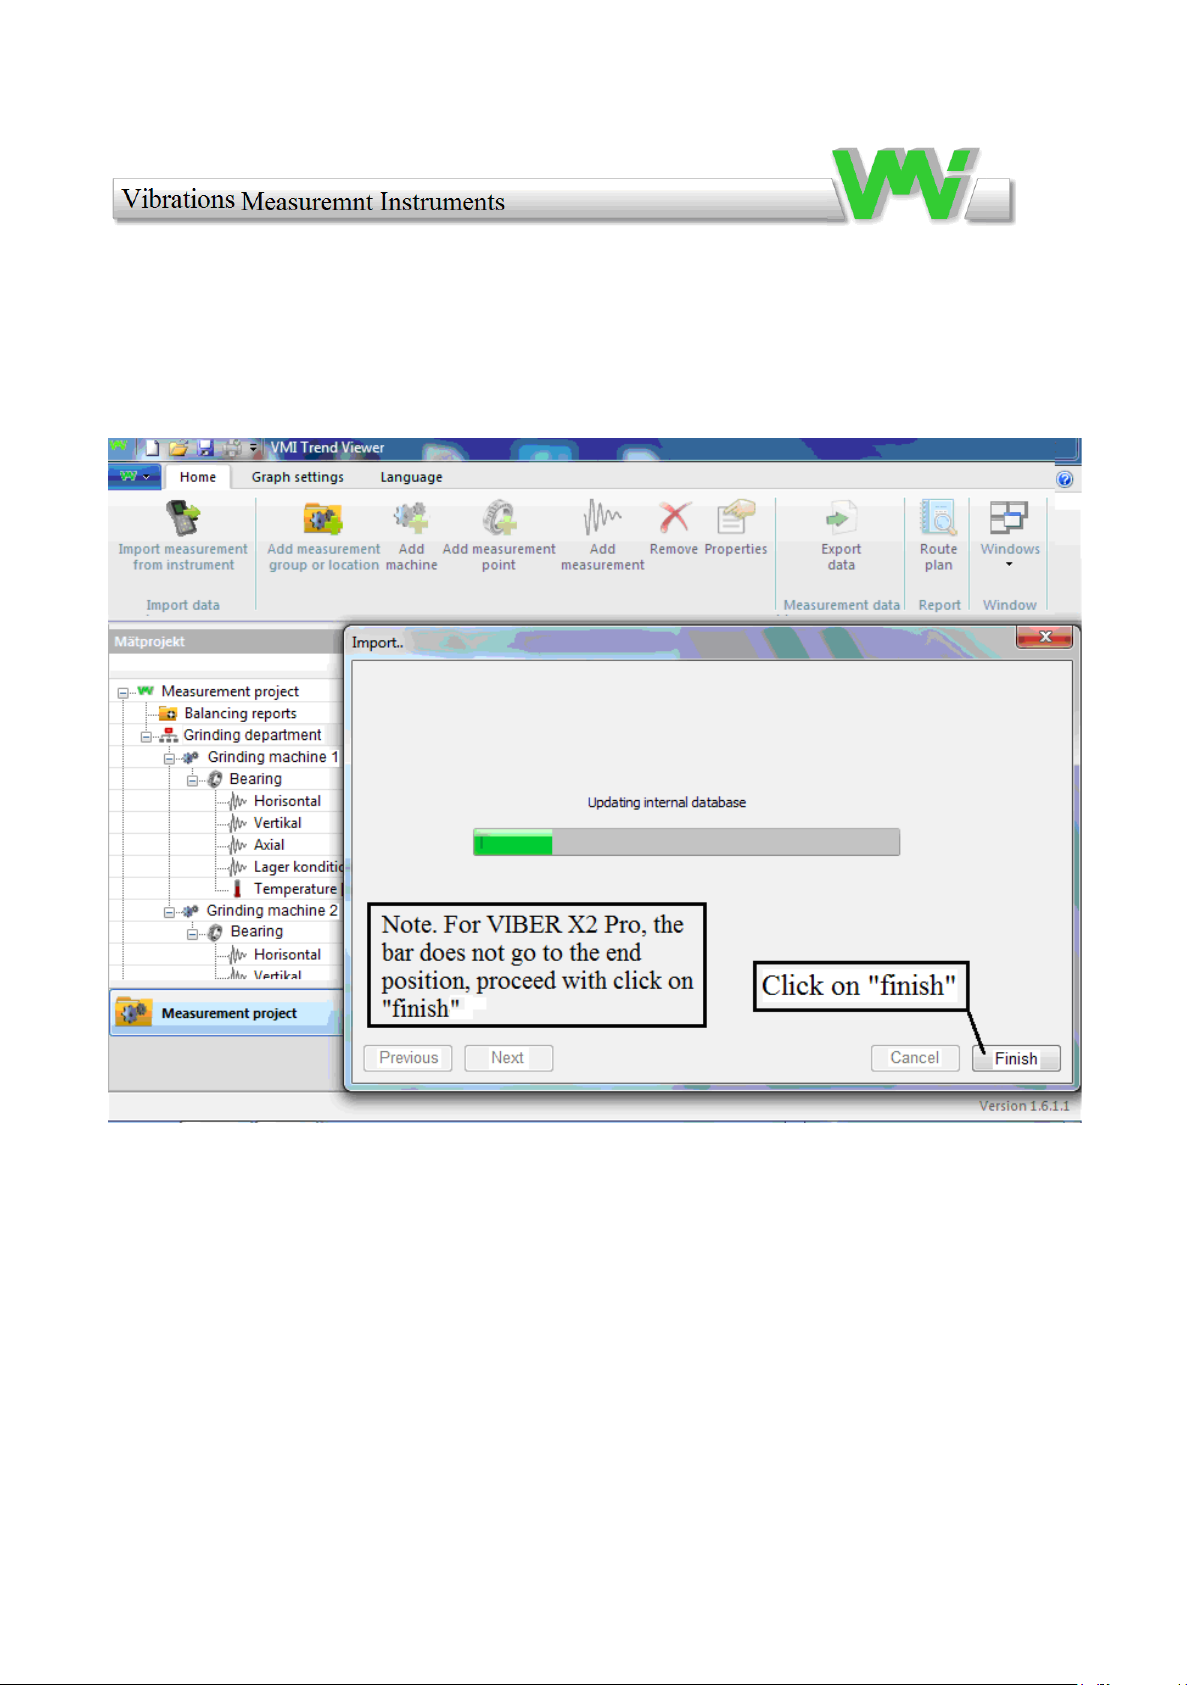
Data is transferred to the project,
46
Page 47
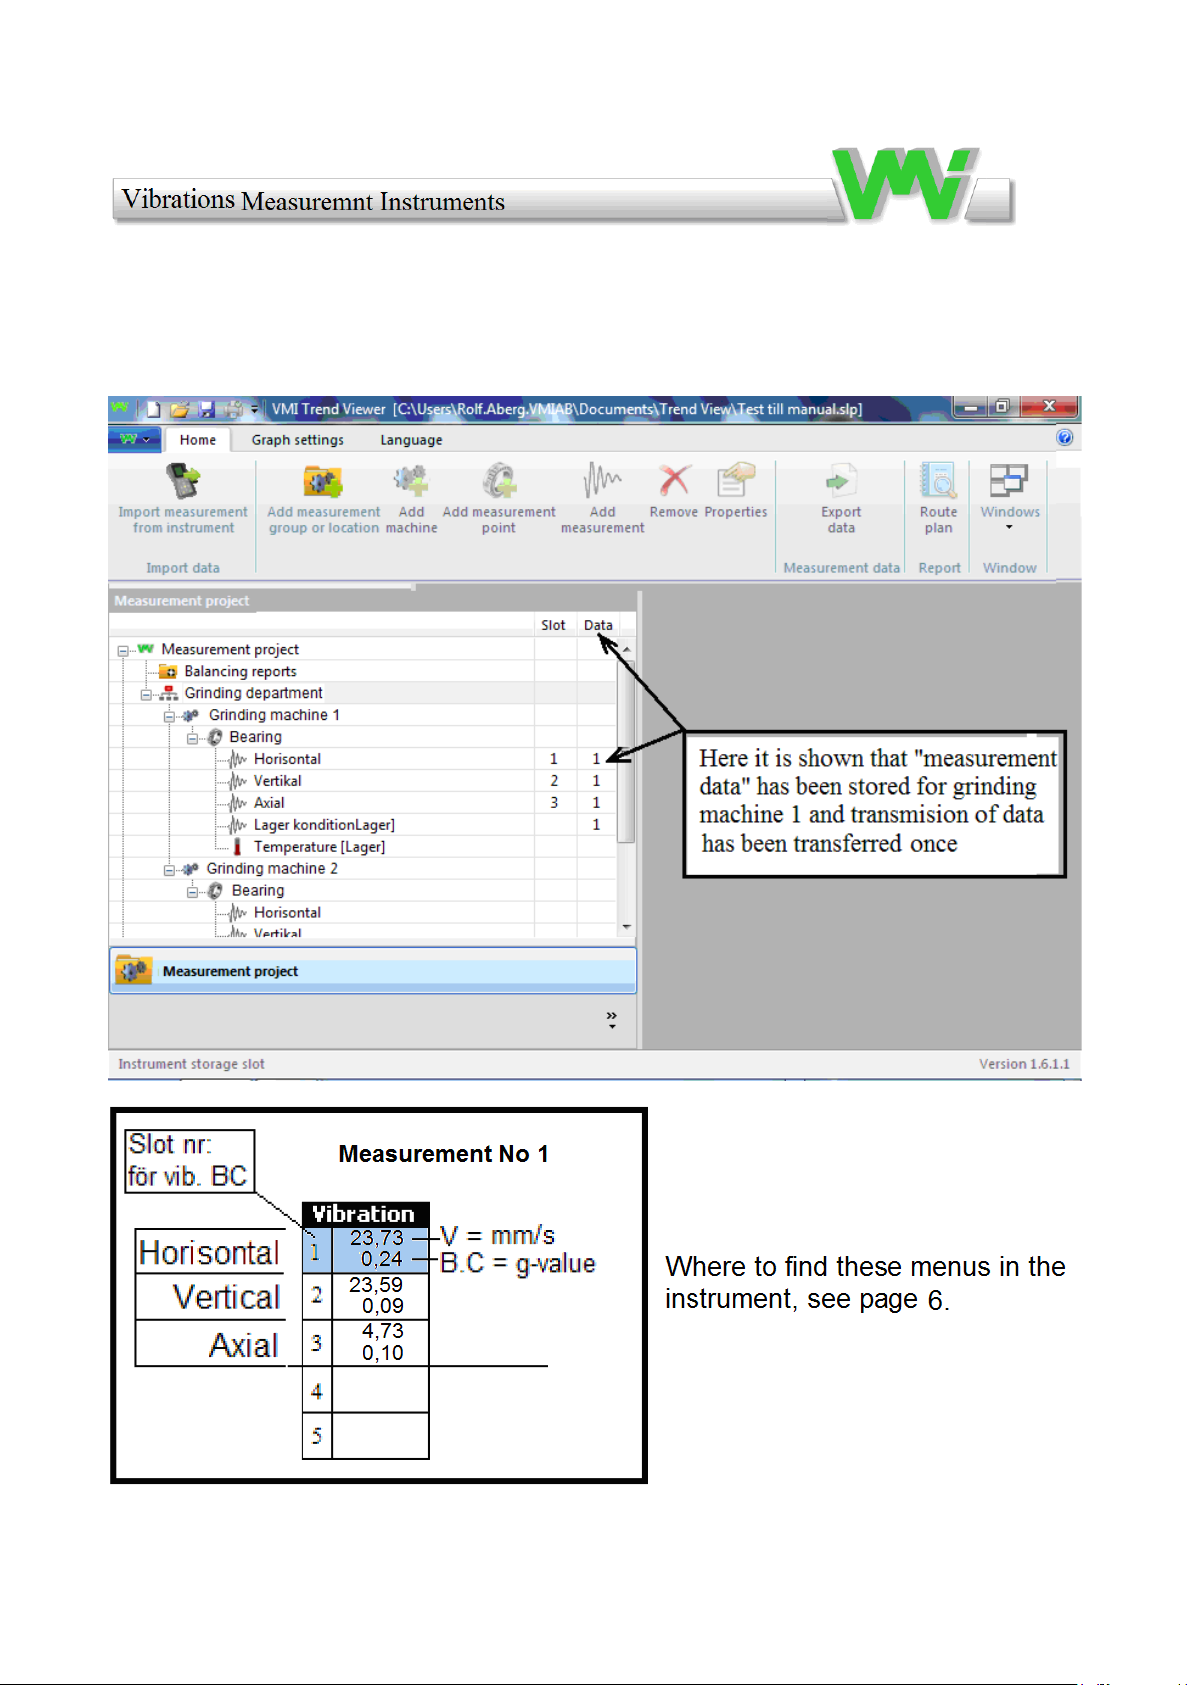
Transmission of measurement data for "Grinding machine 1" is now complete. In
order to see a graph showing the trend, at least two "2" measurements, at different
times, must be performed and transferred to the project.
47
Page 48
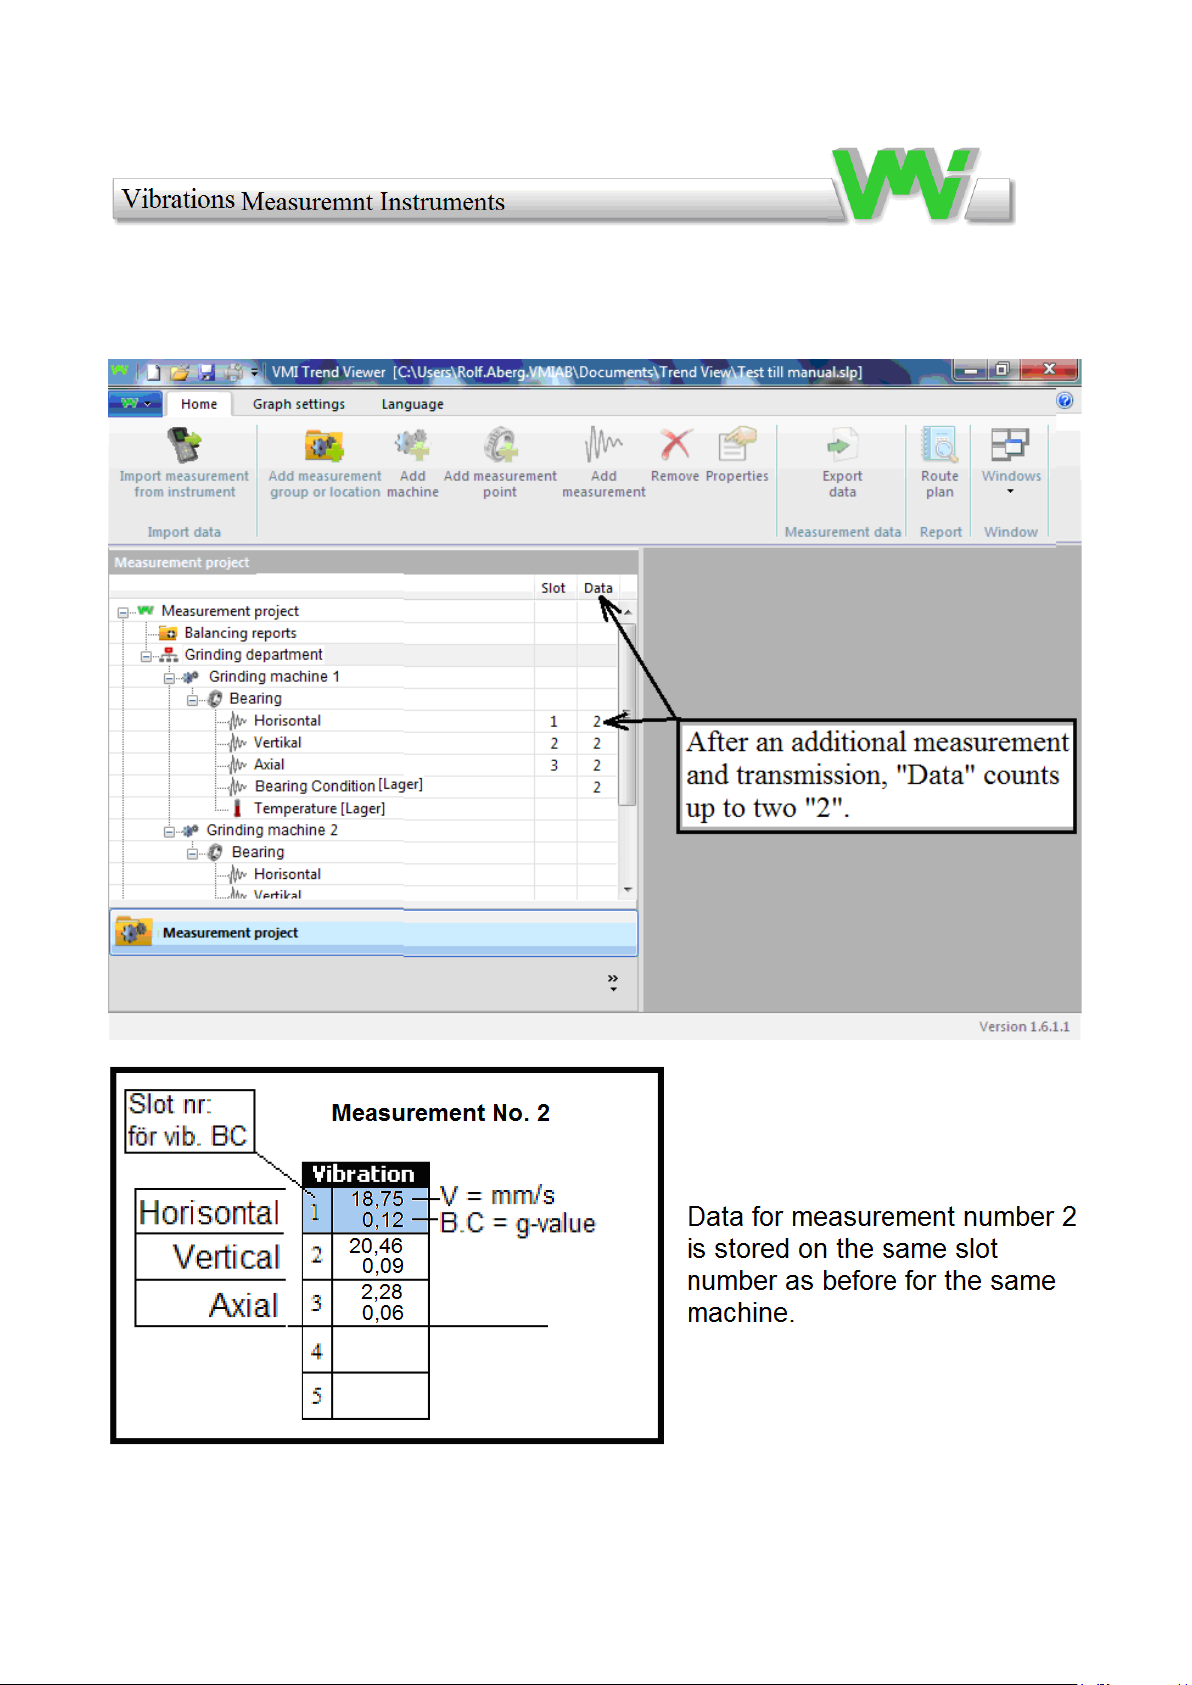
After the second measurement for the same machine, the new measurement values are
stored in the same "Slot-places" as before, in our case: 1, 2, 3 for vibration.
48
Page 49
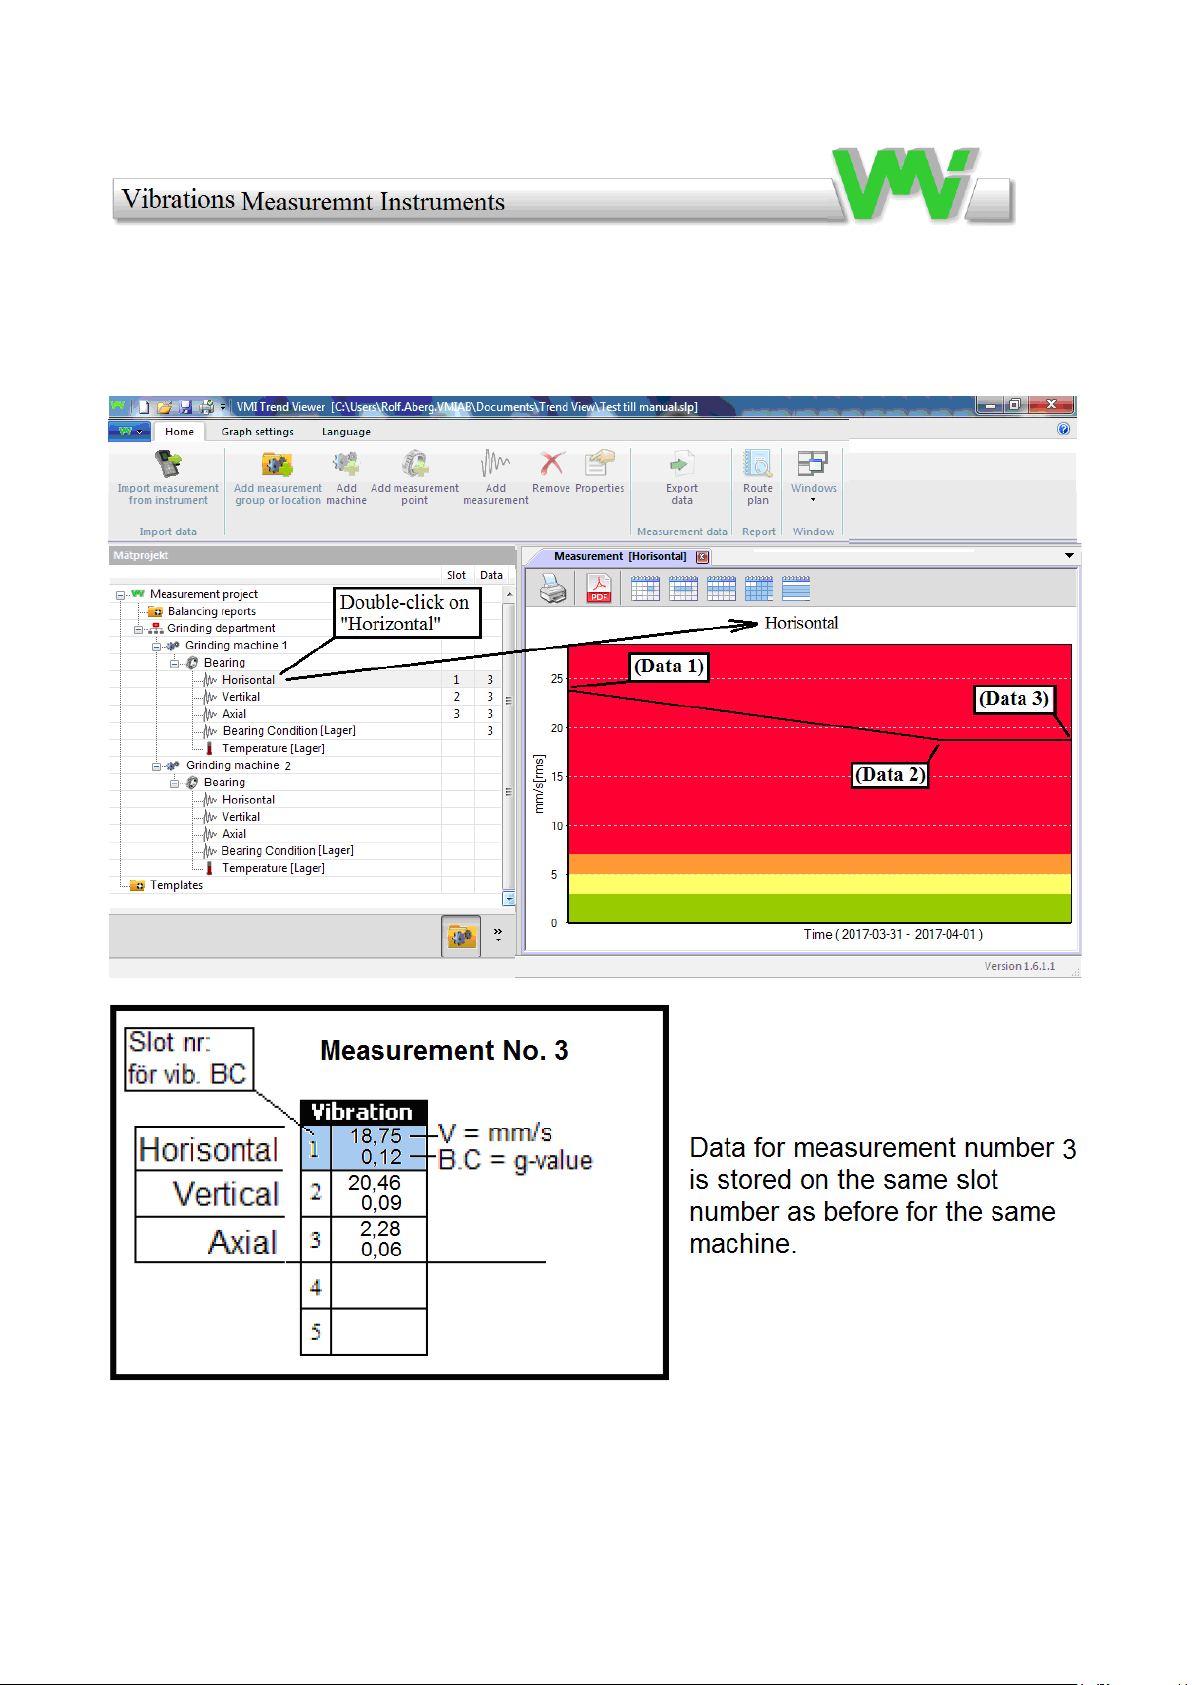
To see a "Graph", double-click the vibration direction you want to see. The graph
below shows "measurement data" after three measurements (those blue-marked in
horizontal direction) and after three data transfers.
49
Page 50
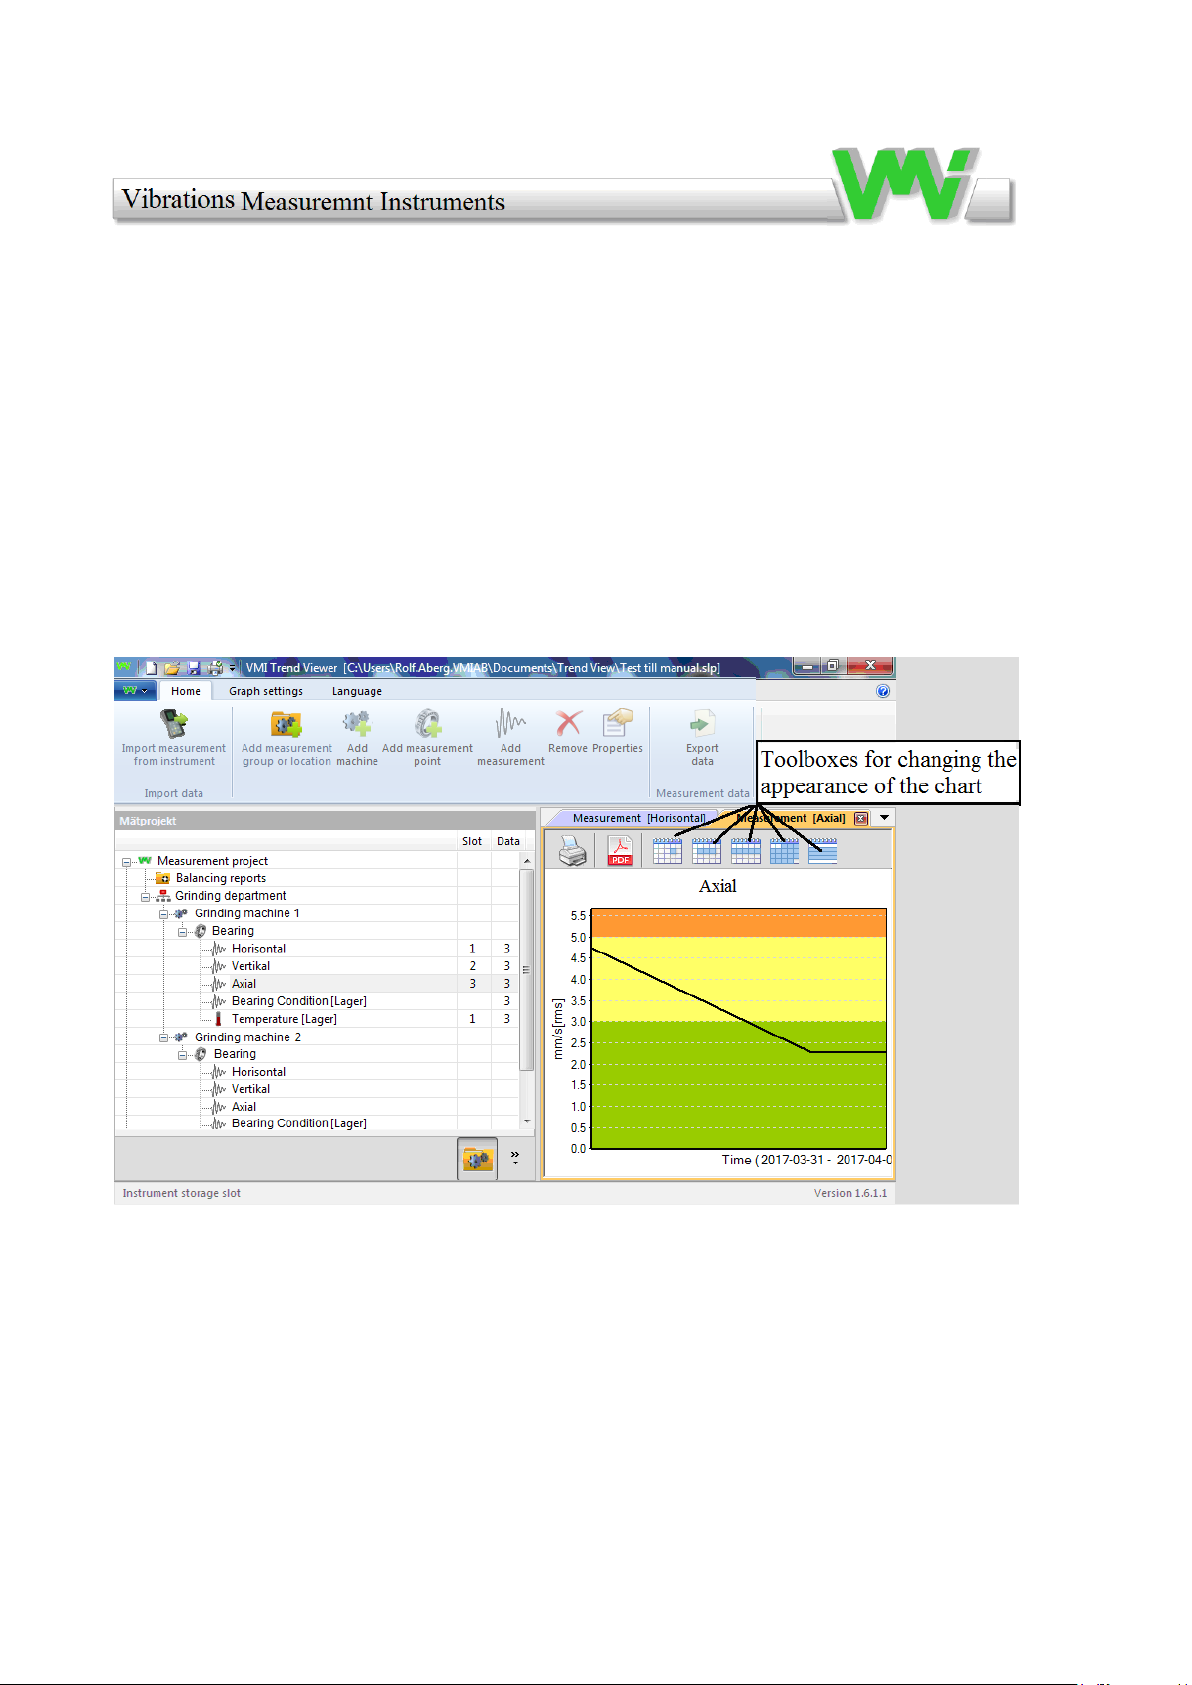
9.5 General description and viewing trends
After all measurements are saved, you can choose to study a graph to see any
deviations of the vibration of the machine.
To see the "Trend chart", select and double-click the project tree and in the direction
you want to study.
The window that shows the graph is automatically adjusted according to the number of
measurements performed. To change the window view, use the "toolboxes" in the
chart header.
Properties can be used to change units in the chart, all measurement points can be
expressed in the following units: Vibration (mm/s), Acceleration (m/s²) or expressed
as a g-value, and displacement (μm).
If the Trend measurement shows a large change in vibration or Bearing Condition,
then you should measure the machine for shorter intervals.
50
Page 51
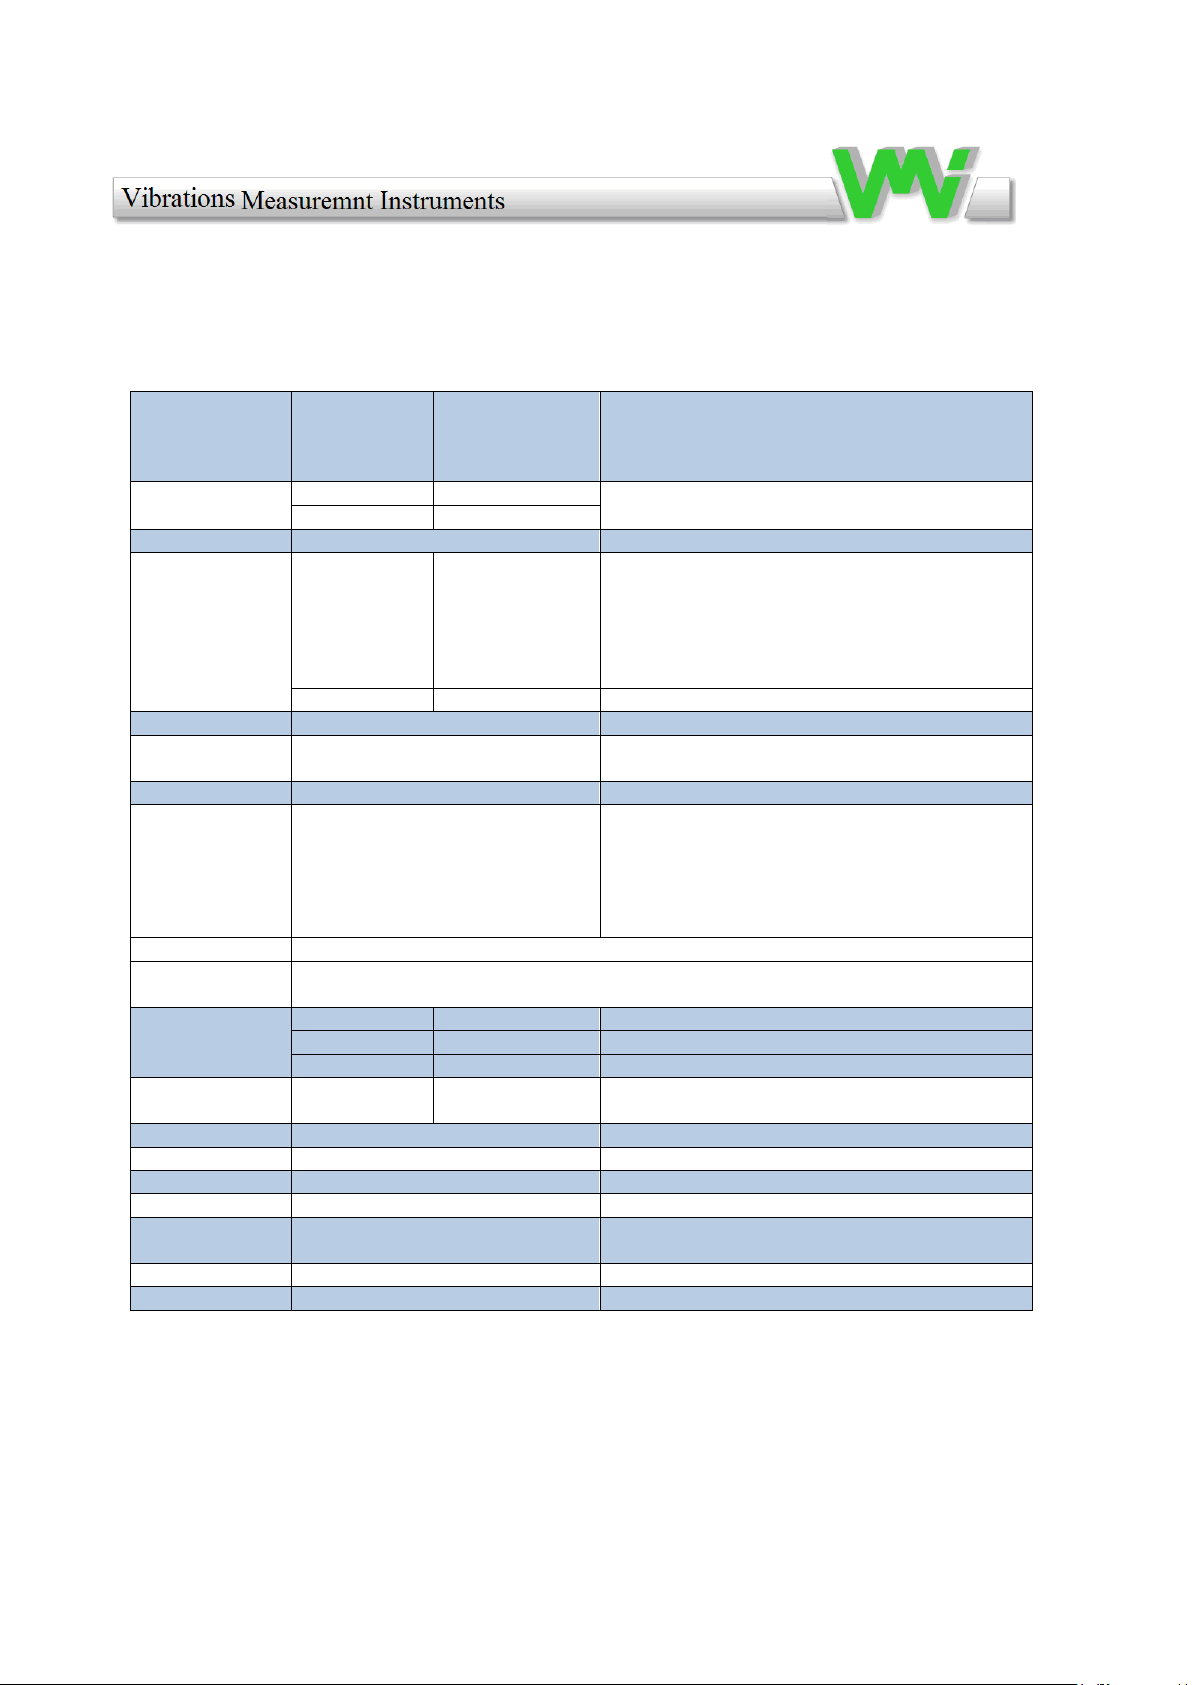
10.0 Technical data VIBER X2 Pro
Vibration transducer
Accelerometer
Standard 100 mV/g ±
15 %
(selectable sensitivity in the instrument)
0,1 – 9999 mV/g
Input amplitude
range
Vibration
Max 50 g RMS
With other sensor up to 500 g and 50 g BC.
Bearing condition
Max 5 gBC
Dynamic range
80 dB (159,16 Hz and with auto ranging)
Frequency range
Vibration
2 - 400 Hz
10 - 1000 Hz
6 – 1600 Hz
11 – 3200 Hz
Note 1
Bearing condition
0.5 to 16 KHz
Vibration units
g-value, m/s2, mm/s, in/s, µm, mils
Note 2
Amplitude
presentation
RMS, Peak, Peak-Peak
Note 2
Analysis
Five highest peaks can be displayed
VMI Trend Viewer Software included for PC
Frequency range of
peak detection
Frequency range
2 – 400 Hz
6 – 1600Hz
11 – 2000 Hz
10 – 1000 Hz
Note 3
Storage Capacity
100 measurements can be stored
Communication
interface
USB 2.0
Accuracy
Vibration
± 3 %
Note 4
Bearing condition
± 5 %
Note 4a
Frequency/RPM
± 0.2%
Battery
Rechargeable
Lithium
2300 mA/h, max 60
°C
Note 5
Operating time
1 Week normal use
External charger
5,0 V regulated @ 2000 mA
LCD display
B&W 64 X 120 pixels with background light
Note 6
Enclosure protection
IP 65
Operating temp.
Range
0 to 50 °C
Note 7
Weight
340 gram
Note 8
Size (LxWxH)
145mm x 77mm x 47mm
51
Page 52

Note 1. User selectable between Hz and RPM. When measuring displacement with
an accelerometer is the minimum measurable frequency 3 Hz.
Note 2. User selectable
Note 3. Only 11 to 2000 Hz differs
Note 4. Full scale is 50g for acceleration other units are frequency dependent.
Note 4a. Over 0,15 gBC
Note 5. Capacity of the batteries can vary depending on hardware revision. Max
2300 mAh. (storage temp. -20 to max 60 °C).
Note 6. Operating temp. min 0°C to max 50 °C, storage temp. max 72 °C.
Note 7. The restriction concerns display.
Note 8. Instrument, including battery and transducer.
OBS. If you change to another accelerometer, then you have to change the
sensitivity (mV/g). This is done in the menu under “Transducer”.
52
Page 53

Warranty
1 February 2017
Vibration Measurement Instrument International AB (VMI)
Warranty disclaimer
VMI warrants the products to be free from defects in material and workmanship under normal use and service
within two years from the date of purchase and which from our examination shall disclose to our reasonable
satisfaction to be defective. Warranty claimed products shall be returned prepaid to VMI for service. We
reserve the right to repair or to replace defective products. Always try to explain the nature of any service
problem; by e-mail or telephone. Check first all-natural problems, like empty batteries, broken cables, etc.
When returning the product, be sure to indicate that the purpose is to make repairs and indicate the original
invoice number and date of shipment to you, if possible.
Warranty exclusions
Damage that not results from defect in material or workmanship or by incautious use is excluded. Damage
resulting from repairs performed other than by an authorized service Centre. The limited two year warranty
and remedies contained herein are in lieu of all other warranties, expressed or implied including any warranty
of merchantability and any warranty of fitness for a particular purpose, and all other remedies, obligations or
liabilities on our part. In addition, we hereby disclaim liability for consequential damages for breach of any
expressed or implied warranty, including any implied warranty of merchantability and any implied warranty
of fitness for a particular purpose. The duration of any implied warranty which might exist by operation of law
shall be limited to one year from the date of original retail purchase. Batteries are excluded from Warranty.
NOTE: Some countries do not allow the exclusion or limitation of consequential damages, and some countries
do not allow limitation on how long an implied warranty lasts, so the above exclusions or limitations may not
apply to you. This warranty gives you specific legal rights and you may also have other rights that vary from
country to country. If you have problems with your instrument during or after the warranty period, first
contact the distributor you purchased the unit from.
53
Page 54

VMI International AB
Sweden WWW.vmiab.com
54
 Loading...