

Viavi Xgig User Manual

Xgig Analyzer
Version 7.3
User’s Guide


Xgig Analyzer
Version 7.3
User’s Guide
Viavi Solutions
1-844-GO-VIAVI
www.viavisolutions.com

Notice
Every effort was made to ensure that the information in this manual was accurate at the
time of printing. However, information is subject to change without notice, and Viavi
reserves the right to provide an addendum to this manual with information not available at
the time that this manual was created.
Copyright/Trademarks
© Copyright 2015 Viavi Solutions Inc. All rights reserved. No part of this guide may be
reproduced or transmitted, electronically or otherwise, without written permission of the
publisher. Viavi Solutions and the Viavi logo are trademarks of V iavi Solutions Inc. (“Viavi
”).
All other trademarks and registered trademarks are the property of their respective
owners.
Copyright release
Reproduction and distribution of this guide is authorized for US Government purposes
only.
Terms and conditions
Specifications, terms, and conditions are subject to change without notice. The provision
of hardware, services, and/or software are subject to Viavi’s standard terms and conditions, available at www.viavisolutions.com/en/terms-and-conditions.
Xgig Analyzer User’s Guide
Page ii Version 7.3 December 2015

Third Party License Agreements
LZ4 - Makefile
Copyright (C) Yann Collet 2011-2015
All rights reserved.
BSD license
Redistribution and use in source and binary forms, with or without modification,
are permitted provided that the following conditions are met:
– Redistributions of source code must retain the above copyright notice,
this list of conditions and the following disclaimer.
– Redistributions in binary form must reproduce the above copyright notice,
this list of conditions and the following disclaimer in the documentation
and/or other materials provided with the distribution.
THIS SOFTWARE IS PROVIDED BY THE COPYRIGHT HOLDERS AND
CONTRIBUTORS "AS IS" AND ANY EXPRESS OR IMPLIED WARRANTIES,
INCLUDING, BUT NOT LIMITED TO, THE IMPLIED WARRANTIES OF
MERCHANTABILITY AND FITNESS FOR A PARTICULAR PURPOSE ARE
DISCLAIMED. IN NO EVENT SHALL THE COPYRIGHT HOLDER OR CONTRIBUTORS
BE LIABLE FOR ANY DIRECT, INDIRECT, INCIDENTAL, SPECIAL, EXEMPLARY, OR
CONSEQUENTIAL DAMAGES (INCLUDING, BUT NOT LIMITED TO, PROCUREMENT
OF SUBSTITUTE GOODS OR SERVICES; LOSS OF USE, DATA, OR PROFITS; OR
BUSINESS INTERRUPTION) HOWEVER CAUSED AND ON ANY THEORY OF
LIABILITY, WHETHER IN CONTRACT, STRICT LIABILITY, OR TORT (INCLUDING
NEGLIGENCE OR OTHERWISE) ARISING IN ANY WAY OUT OF THE USE OF THIS
SOFTWARE, EVEN IF ADVISED OF THE POSSIBILITY OF SUCH DAMAGE.
You can contact the author at:
- LZ4 source repository: https://github.com/Cyan4973/lz4
- LZ4 forum froup: https://groups.google.com/forum/#!forum/lz4c
Xgig Analyzer User’s Guide
December 2015 Version 7.3 Page iii

Xgig Analyzer User’s Guide
Page iv Version 7.3 December 2015

CONTENTS
v

Contents
PART ONE: Using Xgig Analyzer
Chapter 1 Introduction
The Xgig Systems .... ... ... .... ... ... ... .... ... ... ................................................................. ... ... ... ................................4
Xgig Blades .....................................................................................................................................................4
Xgig Fixed-Port Systems .................................................................................................................................4
Connecting the Xgig Analyzer to a Target System ..........................................................................................5
Xgig Hardware to Xgig Analyzer Software Connection .............................................................................6
Xgig Analysis and Control Software ................................................................................................................8
Xgig TraceControl ....................................................................................................................................8
Xgig Performance Monitor .......................................................................................................................8
Xgig TraceView ........................................................................................................................................8
Xgig Expert ..............................................................................................................................................8
Software Road Map .................. ... ... ... .... ................................................................ ... .... ... ... ......................9
Xgig Software Limitations .........................................................................................................................9
Installation ....................................... ................................ ................................. .......................................10
New Features .................................. ... ... ................................................................. ... ... .................................11
Getting Help ................... .... ... ................................................................. ... ....................................................12
Xgig Online Help .....................................................................................................................................12
Xgig Hardware Manuals .........................................................................................................................12
Decode Improvements ....... ................................................................. ... ... ... .... ... ....................................12
Technical Assistance ...............................................................................................................................12
PART TWO: Using Xgig TraceControl
Chapter 2 About Xgig TraceControl
Introduction to TraceControl ..........................................................................................................................16
Chapter 3 Getting Started with Xgig TraceControl
Launching Xgig TraceControl ........................................................................................................................18
Customizing the Menu Bar .....................................................................................................................18
Secure Login for Xgig Chassis ...............................................................................................................18
Port Status View ......................................................................................................................................19
Link Status View ......................................................................................................................................26
Capturing Traffic .......................... ... ... .... ... ... ................................................................. ..........................26
Launching Other Applications .................................................................................................................30
Domains, Links, and Sync Groups ........................... .... ... ... ... .... ... ... ... .... ... ... ... ..............................................30
Select Ports for Domain Creation Dialog Box .........................................................................................31
Controlling the Chassis using a USB Connection ........ ... .... ... ... ... .... ... ... ... ... .... ... ....................................37
Setting Cable Lengths for Interconnected Chassis .................................................................................39
Chassis, Blade, Port, and TTL Selection ................................................................................................40
Changing Port Functions ................................ ... .... ... ... ... .... ... .................................................................42
Default Port and Domain Labels .............................................................................................................44
Creating a New Domain ..........................................................................................................................47
Locking Ports for Use .............................................................................................................................48
Persistent Domains (Running Disconnected) .........................................................................................49
Network Connections ..............................................................................................................................50
vi Xgig Analyzer User’s Guide

Chassis Upgrade and Maintenance Options .................................................................................................51
Chassis Software Upgrade .....................................................................................................................52
Chassis Shutdown ..................................................................................................................................55
PCIe Tuning Wizard ......................................................................................................................................56
Tuning for 12G SAS ......................................................................................................................................61
Xgig Tuning and Equalization ........................................................................................................................67
Tuning .....................................................................................................................................................67
Equalization ............................................................................................................................................69
Technical Overview of Tuning and Equalization .....................................................................................72
Chapter 4 Xgig TraceControl Capture Configuration
Configure Ports or Domains ..........................................................................................................................76
Clock Sync ..............................................................................................................................................77
Applying the Configuration to Hardware .................................................................................................77
Saving a Configuration ...........................................................................................................................78
Saving a Configuration to TC API ...........................................................................................................78
Loading a Configuration ..........................................................................................................................78
Working with Surveyor ............................................................................................................................79
Log Real Time Statistics .........................................................................................................................81
PCIe Device and Address Mappings ......................................................................................................83
Capture PCIe Devices and Addresses ...................................................................................................87
TraceControl Options ..............................................................................................................................88
TraceControl Automated Options ...........................................................................................................90
Configuration Editor .......................................................................................................................................92
General Settings ............................................................................................................................................93
Link Speed ..............................................................................................................................................95
Signal Regeneration ....................................... ... .... ... ... ... .... ... ... ... .... ... ... ... ... .... ... ....................................99
Traffic Summary ....................................................................................................................................101
Payload/Frame Size .............................................................................................................................101
Number of Segments and Trace Size ...................................................................................................102
Scrambling ................................... ....................................................... ..................................................104
FEC (Forward Error Correction) ...........................................................................................................105
CDR (Clock Data Recovery) .................................................................................................................105
Transceiver Rate .......................................... ... ... .... ...............................................................................105
FCoE CRC Checking ............................................................................................................................106
Output Voltage .......................................... ... ... ... .... ... ............................................................................106
Capture and Trigger Setup ..........................................................................................................................107
Overview Pane ............................................ ... ................................................................. .....................107
Capture Filter Editor ...............................................................................................................................111
Capture Options .................................................................................................................................... 113
Transition Editor ........... ... ... ... .... ... ... ... .... ................................................................ ... .... ........................118
Trigger Modes .......................................................................................................................................121
Triggering on Time-out or Within a Window of Time ........................................................... .................. 131
Triggering with Mixed Ports ..................................................................................................................133
Triggering on Any SCSI Error ...............................................................................................................134
Contents
Xgig Analyzer User’s Guide vii

Contents
Triggering Across Devices ....................................................................................................................134
Lane Control ................................................................................................................................................136
Segment Capture Options ...........................................................................................................................139
Chapter 5 Template Browser/Template Editor
Template Browser ........................................................................................................................................144
Available Templates Browser ................................................................................................................144
Pre-Defined and User-Defined Templates ............................................................................................145
Template Editor ...........................................................................................................................................146
Standard Template Editor .....................................................................................................................146
LAN Conversation Frame Editor ...........................................................................................................151
Chapter 6 Xgig TraceControl Hints and Tips
Hints and Tips ........................................................... .... ...............................................................................160
Keyboard Shortcuts .. ... ................................................................. ... ... .... ... ... ... ... .... ... ... ... ............................161
PART THREE:
Using Xgig Performance Monitor
Chapter 7 About Xgig Performance Monitor
Introducing Xgig Performance Monitor ........................................................................................................166
Chapter 8 Getting Started with Xgig Performance Monitor
Launching Xgig Performance Monitor .......................... ...............................................................................168
Secure Login for All Xgig Chassis ........................................................................................................168
Launching the Application .....................................................................................................................168
Status Bar Features .................................................. ... ... .... ... ... ............................................................169
Selecting the Sync Group .................. .... ... ... ... ... ................................................................. ..................170
Chapter 9 Xgig Performance Monitor Port Configuration
Select Ports to Monitor Dialog Box ............................... ... ... ... .... ... ... ... .... ... ... ... ... .... ... ..................................172
Discover Different Subnets ...................................................................................................................172
Sync Groups and Domains ...................................................................................................................173
Port Viewing and Selection ...................................................................................................................173
Dialog Buttons .......................................... ................................................................ .... ........................174
Setting Cable Lengths for Interconnected Chassis ...............................................................................175
Chassis Upgrade and Maintenance Options ...............................................................................................175
Changing Port Functions .............................................................. ... ... .... ... ... ... ... .... ... ... ... .... ........................176
Licensing for Xgig Multi-Function Blades ..............................................................................................177
Chapter 10 Xgig Performance Monitor Configurat ion
Monitor Views ..............................................................................................................................................180
Resource Browser ................................................................................................................................180
Chart View ............................................................................................................................................181
Meter View ............................................................................................................................................182
List View ................................................................................................................................................182
Status LEDs (LED View) .......................................................................................................................187
Summary of Status LEDs (LED Summary View) ..................................................................................188
Hardware Options ................. ................................................................. ... ..................................................189
Port Settings - General Settings Tab ....................................................................................................189
viii Xgig Analyzer User’s Guide

Port Settings - Lane Control Tab ...........................................................................................................192
Performance Monitor Options .....................................................................................................................193
Preferences ..........................................................................................................................................193
Utilization Display Option .......................................... ... ... .... ... ... ... .... ... ..................................................205
Metric Options .......................................................................................................................................206
Statistics Logging Function ............................................. .... ... ... ... .... ... ... ... ... .........................................207
Toolbar Functions ........................................................................................................................................208
PART FOUR: Using Xgig TraceView
Chapter 11 About Xgig TraceView
Introducing Xgig TraceView ................................................................ .... ... ... ... ... .........................................212
Chapter 12 Getting Started with Xgig TraceView
Launching Xgig TraceView .........................................................................................................................214
Secure Login for Xgig Chassis .............................................................................................................214
Launching the TraceView Application ...................................................................................................214
Working With Traces .............................................................................................................................215
Working With Domains ................................................................................................................................216
Open a Domain .....................................................................................................................................216
Select Ports/Domain to Analyze Dialog Box ............................................. ... .... ... ... ... .... ... ... ... ... .... ... .....218
Selecting Chassis, Blades, Ports, and Segments .................................................................................221
Segment Selection ................................................................................................................................223
Saving a Trace ......................................................................................................................................223
Chapter 13 Configuring Xgig TraceView
TraceView Configuration .............................................................................................................................228
Saving a Configuration .........................................................................................................................228
Loading a Configuration ........................................................................................................................228
Ports Side-by-Side Configuration ..........................................................................................................229
Setup Port Groupings ...........................................................................................................................231
Navigating a Trace ................................................... .... ...............................................................................234
Using the Find Tab to Set Up Complex Searches ................................................................................235
Quick Find .............................................................................................................................................236
Search for Marked Locations ................................................................................................................247
Display Protocol Layers ............ ... ... ... .... ... ... ... ... .... ... ... ... .... ... ... ... .........................................................250
Display Lane for PCIe ...........................................................................................................................250
Filter And Hide .................................... ................................................................ .... ... ... ...............................250
Filter Status Area ............ ... ... .... ... ................................................................ .........................................251
Quick Filter ............................................................................................................................................251
Quick Hide ............................................................................................................................................255
Bit Level Find/Filter/Hide .......................................................................................................................258
Using the Filter Tab to Perform Filter Operations .................................................................................259
Ordered Sets .. ... ................................................................. ... ...............................................................260
Out-of-Band Data (SAS/SATA Only) ......................................................... ... .... ... ..................................262
Graphical Display of OOB and Speed Negotiation Events ...................................................................275
Graphical Display of Power Management Events .................................................................................283
Contents
Xgig Analyzer User’s Guide ix

Contents
Graphical Transmitter Training States ...................................................................................................285
PCIe Device and Address Mappings ....................................................................................................286
Overlapping Data ............................................ ... .... ... ... ... .... ..................................................................291
Working With Columns ................................................................................................................................292
Icon Column ..........................................................................................................................................293
Spreadsheet Options ............................................................................................................................294
Context Menu Options for Columns ............. ... ... .... ... ... ... ......................................................................296
Summary Fields and Field Groups .......................................................................................................299
Column and Decode Display for Partial Frames ...................................................................................305
Column Operations ......................................... ... .... ... ............................................................................305
Detailed Find/Filter/Color Window ...............................................................................................................309
Detailed Find/Filter/Color Overview ......................................................................................................309
Available Templates Browser ................................................................................................................310
Filter Groups ................ ... ................................................................. ... ... ... ... .... .....................................313
Aliases (Name Replacement) ................ ... ... .................................................................... ... ... ... ............313
Assigning Colors ............................................. ... .... ...............................................................................315
Chapter 14 Using the Secondary Panes in Xgig TraceView
Using the Exchanges View Pane ................................................................................................................318
Contents of Exchanges View ................................................................................................................319
Navigating in Exchanges View ..............................................................................................................320
Using the Details Pane ................................................................................................................................324
Inspector View .......................... ... ... ... .... ............................................................. ... ... .... ........................324
Dword View ...........................................................................................................................................332
LaneView ..............................................................................................................................................334
Using the Traffic Summary Pane .................................................................................................................336
Traffic Summary SAS/SATA Counters ..................................................................................................342
Traffic Summary Fibre Channel Counters ............................................................................................355
Using the LTSSM Panes for PCIe ..............................................................................................................359
Generating LTSSM Data . ... ... .... ................................................................ ... .... ... ... ... ............................360
Box Car View .................. ... ... .... ... ... ................................................................. ... ... ... .... ........................361
Metrics View ..........................................................................................................................................362
Flowchart View .......................................... ... ... ... .... ... ... ... .... ..................................................................363
Chapter 15 Xgig TraceView Histograms
Histogram Overview ........................... ... ... .... ... ... ... ......................................................................................366
Histogram Controls .......................... ... ... ... .... ... ... ... ... .... ...............................................................................367
Chapter 16 Xgig TraceView Template Editor
Using Template Editor .................................................................................................................................370
Pre-Defined and User-Defined Templates ............................................................................................370
Making Edits to the Template .............................................................. ... ... ... .........................................371
Chapter 17 Annotated Traces, Expert Traces, and Decode Switches
Working with Traces Annotated by Expert ..................................................................................................382
Viewing the Annotations in TraceV iew ..................................................................................................382
Working with Expert Traces .........................................................................................................................384
x Xgig Analyzer User’s Guide

Decode Switches ............................. ... ... ... .... ... ... .........................................................................................385
/C/ Encodings .............................................................. ... ......................................................................386
SCSI Interpretations .............................................................................................................................386
LUN Interpretations ...............................................................................................................................387
FC-AE-FCLP ................................... .......................... .......................... .......................... ........................387
SCSI DATA Integrity Field (T10-DIF) ....................................................................................................387
Viavi Signatures .............................................. ... .... ... ... ... .... ... ... ... .........................................................388
SAS/SATA Interpretations .....................................................................................................................388
RDMA/iWARP Interpretations ...............................................................................................................389
IP TOS Interpretation ............................................................................................................................389
Reserved/Obsolete Values ...................................................................................................................389
Chapter 18 Converting Files from Other Platforms
Converting Bus Doctor Files ........................................................................................................................394
Supported Bus Doctor trace file formats ...............................................................................................394
Converting traces ..................................................................................................................................394
Opening traces .....................................................................................................................................395
Converter notes ....................................................................................................................................395
Channel mappings and nomenclature ..................................................................................................396
Converting I-Tech Files ................................................................................................................................396
Supported I-Tech trace file formats .......................................................................................................396
Converting I-Tech traces .......................................................................................................................397
Opening traces .....................................................................................................................................397
Converter notes ....................................................................................................................................397
I-Tech specific notes .............................................................................................................................398
Channel mappings and nomenclature ..................................................................................................399
Chapter 19 Xgig TraceView Tools
Contents
Get Information on Decodes .......................................................................................................................402
Delta Calculator ...........................................................................................................................................402
SAS Hashed Address Calculator ................................................................................................................402
Copy Event Data (Filter on Data Events) ....................................................................................................403
Export to Text File ........................................................................................................................................403
Grid Options ..........................................................................................................................................404
Text Options ..........................................................................................................................................404
Set the Beginning and End Points for Export ........................................................................................404
Print the Selected View ...............................................................................................................................405
Show Capture Configuration .......................................................................................................................405
Get Trace Information .................................................................................................................................405
Timestamp Options .....................................................................................................................................406
TraceView Options ......................................................................................................................................407
Dialogs Tab ..........................................................................................................................................408
Expert/Protocol Decodes Tab ............................................................................................................409
Ports Side-by-Side Configuration Tab .............................................................................................. 411
Search Tab ............................................................................................................................................412
Xgig Analyzer User’s Guide xi

Contents
TCP/UDP Port Mappings ................... ... ... .... ... ................................................................ .... ... .....................413
WWN and MAC Address Decoding .............................................................................................................414
Chapter 20 Xgig Trace View Hints and Tips
TraceView Hints and Tips ............................................................................................................................416
Toolbar ............ ................................................................. ... ... .... ... ... ............................................................418
Keyboard Shortcuts .. ... ................................................................. ... ... .... ... ... ... ... .... ... ... ... ............................421
PART FIVE: Using Xgig Expert
Chapter 21 Xgig Expert
Key Features of Xgig Expert .................................................................................................................426
Opening a Trace ...................................................................................................................................426
Switching to TraceView .........................................................................................................................427
PART SIX: Appendices
Appendix A Analyzer File Formats
Appendix B Connection and Wiring Examples
Example Direct Connection, Fibre Channel Network ..................................................................................434
Example Connection Through Taps, Fibre Channel Network .....................................................................435
Appendix C Protocol Display Color Coding
Appendix D Xgig Chassis Trigger/Stop from the Command Line
Requirements .......................................................................................................................................441
Command Line Interface ......................................................................................................................442
Examples of Using Wget ......................................................................................................................443
Output Samples ........................................................................ ... .........................................................444
Example Script ............. ................................................................ .... ... ... ... ... .........................................446
xii Xgig Analyzer User’s Guide

PART ONE: Using Xgig Analyzer
1

PART ONE: Using Xgig Analyzer
2 Xgig Analyzer User’s Guide 3

Chapter 1
Introduction
In this chapter:
• The Xgig Systems
• Xgig Blades
• Connecting the Xgig Analyzer to a Target System
• Xgig Analysis and Control Software
• New Features
• Getting Help

Chapter 1, Introduction The Xgig Systems
The Xgig Systems
The Xgig Family of Distributed Systems for Monitoring, Analysis, and Testing are multi-purpose
systems designed for engineering, field service, and network operations personnel. Xgig platforms
can be rack-mounted at your data center or strategically located anywhere in your network. For
Fibre Channel, Gigabit Ethernet, PCIe/NVMe, or SAS/SATA applications, Xgig chassis contain a
set of hardware analyzer blades that attach through SFP or XFP transceivers to the circuit or
device under test and software programs for hardware control and data analysis. For detailed
information about each of the Xgig systems, refer to the Xgig Family Hardware Guide, the
Xgig5000 Family Hardware Guide, or the Xgig1000 Hardware Guide on the product USB
memory drive.
The Xgig Analyzer software features data capture, real-time performance reporting, protocol
analysis, and error rate measurements. The software automatically extracts and decodes the data
correctly. The software displays the data in several formats for statistical analysis. Extensive find,
hide, and filter capabilities speed up the job of protocol analysis.
Xgig Blades
Blades within an Xgig chassis perform application-specific tasks. The Multi-Function Blade ports
can support a variety of different functions depending on the license for the blade. Possible
functions include analysis, traffic modification, and traffic generation.
Each blade consists of four major elements: serial gigabit connection, real-time performance
measurement, filter and trigger, and capture to memory. Xgig blades ensure both accurate data
collection and transparency on the link. The blade has sophisticated triggering and filtering to
isolate error conditions in the data. Pre-capture filtering can expand the capture time to minutes.
For detailed information about each type of Xgig blade, refer to the Xgig Blade Hardware Guide,
the Xgig5000 Blade Hardware Guide, or the Xgig1000 Hardware Guide on the product USB
memory drive.
Xgig Fixed-Port Systems
An Xgig fixed-port system is a self-contained bench setup Xgig system. These systems are
available as either fixed-function (Analyzer) or multi-function. All ports, connectors, and controls
found on an Xgig chassis containing Xgig blades are present on these systems. The multi-function
system ports can support a variety of different functions depending on the license for the system
ports. Possible functions include analysis, traffic modification, and traffic generation.
Xgig fixed-port systems consist of four major elements: serial gigabit connection, real-time
performance measurement, filter and trigger, and capture to memory. Xgig fixed-port systems
ensure both accurate data collection and transparency on the link. The system has sophisticated
triggering and filtering to isolate error conditions in the data. Pre-capture filtering can expand the
capture time to minutes.
For detailed information about Xgig fixed-port systems, refer to the Xgig Family Hardware Guide
or the Xgig1000 Hardware Guide on the product USB memory drive.
4 Xgig Analyzer User’s Guide
Device 2
Device 1
Point to
Device 2
Device 1
Hub Port
Snoop
Device 2Device 1
Optical
Splitter
Snoop
Hub
Point
Snoop
A-In
A-Out
B-In
B-Out
Xgig
Xgig Analyzer
Xgig Analyzer
Analyzer
Connecting the Xgig Analyzer to a Target System Chapter 1, Introduction
Connecting the Xgig Analyzer to a Target System
There are three methods for placing an Xgig analyzer in a Fibre Channel or Gigabit Ethernet
system, as shown in Figure 1. These are:
• Point-to-point
• Hub Port Snoop
• Optical Splitter Snoop
Refer to Appendix B, “Connection and Wiring Examples”
connecting analyzer ports.
Figure 1: Placing the Analyzer in a Target Network System
for examples of the physical wiring for
Xgig Analyzer User’s Guide 5

Chapter 1, Introduction Connecting the Xgig Analyzer to a Target System
With the point-to-point connection, the Xgig is placed in a series, between the source and
destination. If the analyzer is configured for analog passthrough, a small amount of jitter, with an
acceptable eye opening, is added to the signal as it passes through the analyzer. If the Xgig is
configured for digital retiming at the front end, any jitter in the incoming signal is corrected, but
idle characters may be added or dropped from the traffic.
The transmit port of a hub is active at all times. A hub port is in bypass mode until a signal is
returned to the receive connection. This property of a hub can be used to passively snoop a
network.
Connect only the transmit port of the hub to the receive port of the analyzer. The analyzer captures
the data while the hub port remains in bypass mode. With the analyzer connected to one port on
the hub, you can remove or reconnect the analyzer without disturbing the links under test.
Another alternative is the Optical Splitter Snoop or Fiber Tap. This alternative allows you to
connect or remove the analyzer without disturbing the links under test. This is valid only for Fibre
Channel or Gigabit Ethernet.
If you cannot interrupt the network and you need maximum versatility for sniffing at different
configuration points, consider using the Viavi Snoop GBIC or a Viavi Fiber Tap. This product
provides an additional pair of ports for simultaneous transparent monitoring of either Gigabit
Ethernet or Fibre Channel links without causing any link loading or down time of the system under
test.
Xgig Hardware to Xgig Analyzer Software Connection
For Xgig, the analyzer blade(s) resides in a different system from your Xgig client software. You
must have an Ethernet connection between the Xgig chassis and the system running your Xgig
client software. For Xgig1K and Xgig5K chassis, you may control the chassis using the USB
connection if it is supported by your Xgig client software.
Xgig Access Through a Firewall
In general, Xgig client software should be able to access an Xgig Chassis that lies behind a
firewall. Ports must be open as described in the following table to permit operation across a
firewall for Xgig applications:
Table 1: Requirements for Xgig Access Through a Firewall
Application TCP/UDP Port Direction
Administration Web Pages 80 (HTTP) Out Apache Web Server
Administration Web Pages 21 (FTP) In None
Xgig Analyzer 2000 or 52000 or ... In/Out Xgig Analyzer Server
Xgig Maestro 2000 or 52000 or ... In/Out Xgig Maestro Server
Xgig Maestro 6000 In/Out Xgig Maestro Server
Xgig Maestro 135 (DCOM) In/Out Xgig Maestro Server
Server Application
on Port
6 Xgig Analyzer User’s Guide

Connecting the Xgig Analyzer to a Target System Chapter 1, Introduction
The main TCP port number used to communicate with an Xgig chassis is port 2000. If your IT
department blocks the TCP port 2000 on the network, you can still change it to 52000 or any other
number of your choice. However this change must be done on all client computers and all Xgig
chassis on your network at the same time, otherwise some chassis won't be visible and accessible
from some clients.
On the client side, you can change the default TCP port 2000 by selecting
from the
Apply to change the port. You can also change the TCP port for the most recently used chassis by
Start menu. A dialog appears where you can type in a value for the TCP port. Click
Edit Xgig TCP Port
clicking the chassis name(s) in the Most Recently Used Chassis section of the dialog. Again, you
must update all the clients and chassis on your network at the same time; otherwise the Xgig
applications will not see some chassis.
For sites where Xgig Maestro is not used, it is suggested that the DCOM port remain closed.
Network Address Translation (NAT) is not supported. An Xgig Chassis protected by a firewall that
uses Network Address Translation (NAT) cannot be accessed from Xgig clients outside the
firewall.
Finally, client-initiated chassis upgrades do not work across network firewalls since they use
random TCP port numbers between the client and the chassis. The Xgig client installers
automatically open the Windows Firewall for the syncgroupupgradeutil.exe and
probeupgradeutility.exe, but again, network firewalls will prevent the client-initiated chassis
upgrades from succeeding. In that case, you should always upgrade your chassis from the chassis
Administration web page.
Xgig Analyzer User’s Guide 7

Chapter 1, Introduction Xgig Analysis and Control Software
Xgig Analysis and Control Software
The Xgig Analyzer software is a suite of four programs for controlling hardware capture and
analyzing the data. The first three programs are described in this book. Refer to the Xgig Expert
help system for information on Xgig Expert.
Xgig TraceControl
Xgig TraceControl configures and runs the protocol analyzer to capture data. Using the Xgig
TraceControl, you can set the payload filter and trace size, select the capture and trigger criteria,
and start/stop the capture of data.
Xgig Performance Monitor
Xgig Performance Monitor displays real time performance and error parameters passing through
the analyzer. Use the Xgig Performance Monitor to monitor the performance of each channel and
detect errors. You can vary the update rate to suit your measurement and all meters scale
automatically. Both the instantaneous, average, and maximum rates are plotted on the screen.
Xgig T raceView
Xgig TraceView displays the data captured by the analyzer. Xgig TraceView will either show data
currently in trace memory or open a file containing saved data. Xgig TraceView displays traces,
searches and filters the traces, and extracts portions of the trace. You can export the traces to a
delimited format that can be used by other databases and spreadsheets.
Xgig Expert
Expert is an analysis tool for Fibre Channel, FCP-SCSI, Gigabit Ethernet, FCoE, IP, TCP, iFCP,
FCIP, SAS, SATA, PCIe/NVMe, AHCI, and iSCSI traffic. Xgig Expert automatically identifies
protocol violations and errors within the trace as well as providing a rich set of metrics for
performance and behavioral analysis. Traces from Gigabit Ethernet topology, Fibre Channel
topology (Arbitrated Loop, Public Loop, Switch Fabric, etc.), and SAS/SATA topologies are
supported and automatically analyzed when opened.
8 Xgig Analyzer User’s Guide

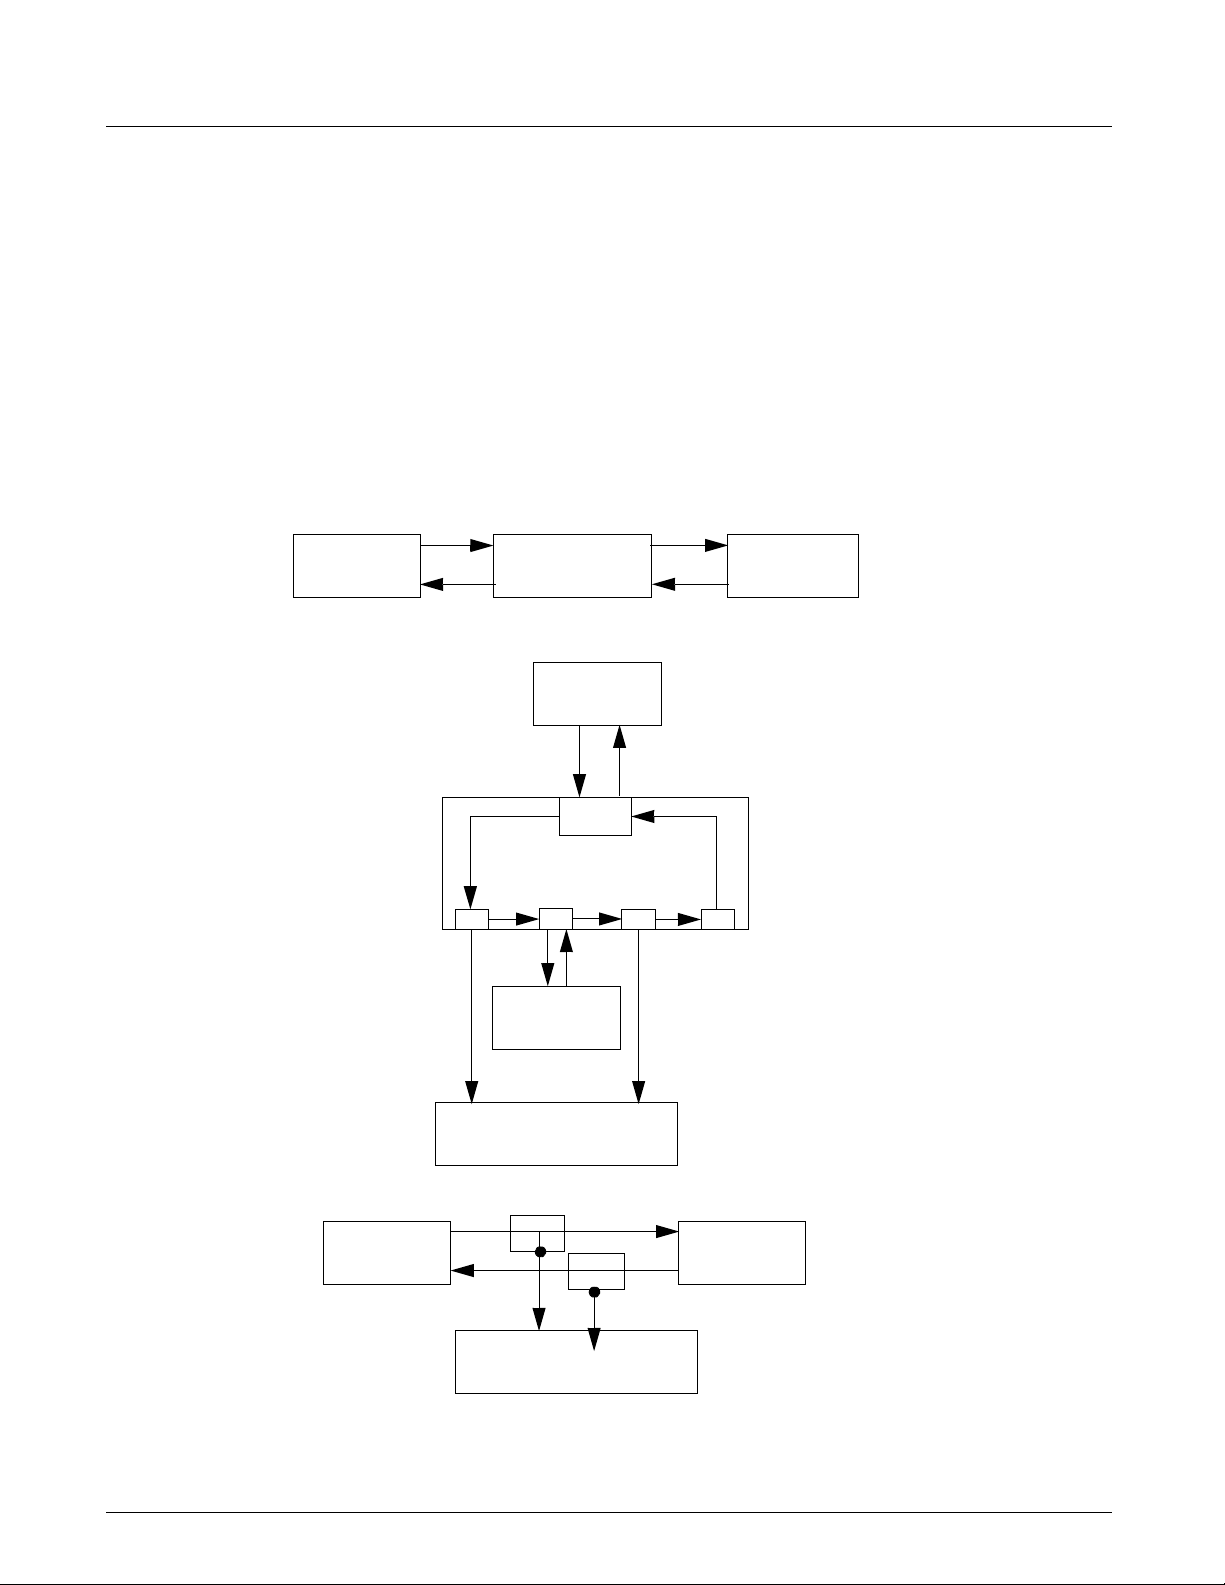
TraceControl
Performance
Monitor
TraceView
Expert
Launch TraceView or
Expert after Stopping
Analyzers
Move Between View of
Decodes and Statistics
Xgig Analysis and Control Software Chapter 1, Introduction
Software Road Map
The diagram below shows how the Xgig suite of programs are interrelated.
Figure 2: Xgig Client Applications Road Map
Xgig Software Limitations
Domains that contain ports on different chassis when Xgig chassis are cascaded are called
inter-chassis domains. Intra-chassis domains refer to domains where all ports are on the same
chassis. A Sync Group can have up to 8 locked inter-chassis domains. There is no limit on the
number of unlocked domains, except that each port must belong to only one domain at a time.
Also, the number of intra-chassis domains is only limited by the number of port-pairs on the
chassis.
If you perform a soft reboot of the Xgig chassis, all ports will be disconnected.
Xgig Expert performance is related to several factors – the size of the trace, the number of ports in
the trace, and the CPU speed and memory capacity of the computer running the Xgig Expert
client. You can improve performance by manipulating any of these variables. Reducing the size of
the trace information or reducing the port count in the trace will improve Xgig Expert's
performance. Increasing the processing power and memory of your client PC will also improve
performance. Although Xgig Expert will eventually process extremely large traces (e.g., 32 GB)
with extremely large port counts (e.g., 64 ports), opening such traces will take many hours.
If you need to open large-file/high-port-count traces, it is recommended that you add as much
memory and CPU speed to the client system as possible. It is also recommended that you make
sure you do not include more ports than are needed or make traces larger than needed when using
Xgig Expert.
Xgig Analyzer User’s Guide 9

Chapter 1, Introduction Xgig Analysis and Control Software
Installation
Below is an overview of the installation process. For system requirements and complete
installation instructions for the Xgig Analyzer software, refer to the Xgig Analyzer Software
Installation Guide.
The general steps are outlined below:
1 Check to make sure your system meets the system requirements for installing Xgig Analyzer
software.
2 Install any new hardware in your Xgig chassis. Refer to the documentation that comes with the
new blade.
3 Installation requires the removal of older versions of software. Remove all older versions of
GTX, IBT, Expert, or Xgig software before installing the new version.
4 Install the new Xgig Analyzer software on your PC system.
5 If the new version requires an upgrade to the Xgig chassis, you will receive a separate USB
memory drive to upgrade the software on the Xgig chassis. Xgig remote analyzer system
hardware is shipped with all required software installed. However, upgrading to a new version
of Xgig Analyzer software may require an upgrade of software at the Xgig system. Refer to
the Xgig Family Hardware Guide, the Xgig5000 Family Hardware Guide, or the Xgig1000
Hardware Guide for more information on installing software on the Xgig chassis.
10 Xgig Analyzer User’s Guide

New Features Chapter 1, Introduction
New Features
This release of Xgig Analyzer includes the following new features:
• PCIe specific features:
• A new option to capture traces with compression of TS1 and TS2 events.
• The Xgig can capture the PERST# and CLKREQ# signal transitions and produce the L1
substates in the LTSSM.
• The Devices And Addresses dialog now draws the PCIe topology in the Topology tab.
• New equalization presets are available for the SFF 8639 interposer.
• Detects and support the NVMe Dual Port configuration on the SFF 8639, when the
DualPortEn# pin is low.
• Support the new Right-angle and Left-angle interposers.
• PCIe Tuning Wizard in TraceControl allowing to change the Equalization settings
manually and semi-automatically.
• NVMe over ROCE/ROCEv2/IBXoE is now decoded when the following TraceView
menu is checked:
View/Decode Switches/RDMA Payload Interpretation/NVMe Protocol
• TraceV iew LTSSM Boxcar V iew lists sequences is visited repeatedly, Theay are displayed
as a single bubbles listing the states visited and the number of loops.
•Other new features:
• Xgig-Expert can now skip optional Ethernet headers (like the VnTag) and Fibre Channel
headers when present and produce proper metrics.
• TraceView now has a new Quick Find "Not" option to find anything that does not match
the criterion.
• TraceView now has a new Quick Find "rgn" operator to search for address ranges.
• New 12G SAS preset for link config#32.
Xgig Analyzer User’s Guide 11

Chapter 1, Introduction Getting Help
Getting Help
Xgig Online Help
We have included an extensive, online Help system with the Xgig analyzer software. The online
Help system contains all the information and instructions for operating Xgig software that is in this
guide, plus additional information. See the Xgig Expert help system for additional reference
material about Fibre Channel operation and protocols. Press the Help button from within any
application to access the online help.
Xgig Hardware Manuals
The Xgig Hardware Family Guide explains the hardware and connectors for the legacy models of
the Xgig chassis. Refer to this document for information on how to install, configure, upgrade, and
administer the legacy Xgig hardware chassis.
The Xgig Blade Hardware Guide provides information on ports/LEDs and instructions on how to
install or remove the blade for the Xgig chassis.
The Xgig5000 Hardwar e Family Guide explains t he hardware and connectors for all models of the
Xgig5000 chassis. Refer to this document for information on how to install, configure, upgrade,
and administer the Xgig5000 chassis.
The Xgig5000 Blade Hardware Guide provides information on ports/LEDs and instructions on
how to install or remove the blades for the Xgig5000 chassis.
The Xgig1000 Hardware Guide explains the hardware and connectors for all models of the
Xgig1000 fixed-port systems. Refer to this document for information on how to install, configure,
upgrade, and administer the Xgig1000 chassis.
The Xgig1000 Interposers Hardware Guide explains the connectors and hardware for all models
of the Xgig1000 interposers. Refer to this document for information on how to install and connect
these devices.
Decode Improvements
Decode improvements implemented in each release are documented in the file named
CurrentProtocolVersions.txt in the CurrentProtocols folder located in the installation
folder.
Technical Assistance
If you require technical assistance,
call 1-844-GO-VIAVI (1-844-468-4284) or
e-mail Techsupport-snt@viavisolutions.com.
For the latest technical assistance information, go to
http://www.viavisolutions.com/en/services-and-support/support/technical-assistance.
12 Xgig Analyzer User’s Guide

PART TWO: Using Xgig TraceControl
13

PART TWO: Using Xgig TraceControl
14 Xgig Analyzer User’s Guide 15

Chapter 2
About Xgig TraceControl
In this chapter:
• Introduction to TraceControl

Chapter 2, About Xgig TraceControl Introduction to TraceControl
Introduction to TraceControl
Xgig TraceControl is one of four programs in the Xgig Analyzer software suite. Xgig
TraceControl provides data capture for Viavi hardware analyzer systems. Use Xgig TraceControl
to:
• Configure Viavi analyzers with capture and trigger settings
• Start and stop a capture
• Create sets of hardware analyzer ports for making captures
• Save sets of hardware analyzer ports and configurations for later use
• Save captures to disk for analysis
• Save log of real time statistics
Xgig Analyzer software supports the JXgig family of test/analysis systems. Xgig analyzer
software supports up to 64 ports (4 Xgig chassis with 4 blades, each blade with 4 ports) when
concatenating Xgig chassis. The maximum number of ports in a domain depends on what types of
Xgig, Xgig5000, or Xgig1000 systems you have.
Xgig Analyzer software supports the Xgig family of test/analysis devices. The Xgig, Xgig1000,
and Xgig5000 allow you to analyze networks wi th a variety of p rotocols, including Fibre Channel,
SAS/SATA, Gigabit Ethernet, PCIe/NVMe, and AHCI. The function of ports on blades in a
chassis is controlled through TraceControl software.
16 Xgig Analyzer User’s Guide
 Loading...