

Page 1

Geist™
Intelligent Rack PDU
Installer/User Guide
Unit Monitored Upgradeable with IMD-03x
Page 2

The information contained in this document is subject to change
without notice and may not be suitable for all applications. While every
precaution has been taken to ensure the accuracy and completeness
of this document, VertivTMassumes no responsibility and disclaims all
liability for damages resulting from use of this information or for any
errors or omissions. Refer to other local practices or building codes as
applicable for the correct methods, tools, and materials to be used in
performing procedures not specifically described in this document.
The products covered by this instruction manual are manufactured
and/or sold by Vertiv. This document is the property of Vertiv and
contains confidential and proprietary information owned by Vertiv.
Any copying, use or disclosure of it without the written permission of
Vertiv is strictly prohibited.
Names of companies and products are trademarks or registered
trademarks of the respective companies. Any questions regarding
usage of trademark names should be directed to the original
manufacturer.
Technical Support Site
If you encounter any installation or operational issues with your product, check the pertinent
section of this manual to see if the issue can be resolved by following outlined procedures.
Visit https://www.Vertiv.com/en-us/support/ for additional assistance.
Vertiv™ | Intelligent Rack PDU Installer/User Guide
Page 3

TABLE OF CONTENTS
1 Overview 1
1.1 Environmental 1
1.2 Electrical 2
1.3 Networking 2
1.3.1 Ethernet 2
1.3.2 Protocols 2
1.3.3 User Interfaces 2
1.4 Regulatory Compliance 2
1.4.1 Underwriters Laboratories (UL) 3
1.4.2 CE 3
1.4.3 Federal Communications Commission (FCC) 3
1.4.4 RoHS/WEEE 3
2 Installation 5
2.1 Mounting 5
2.1.1 Power Connection 18
2.1.2 U-Lock Operation 18
2.1.3 P-Lock Operation 18
3 Setup 21
3.1 Interchangeable Monitoring Device (IMD-03X) 21
3.1.1 Monitored 21
3.1.2 Enhanced Monitored (IMD-03E) 22
3.1.3 Enhanced Monitored with RS-232 (IMD-03E-S) 23
3.1.4 Rapid Spanning Tree Protocol (RSTP) 24
3.2 Network Setup 25
3.3 Web Interface 29
3.3.1 Home Page 29
3.3.2 Sensors Tab 30
3.3.3 System Tab 35
3.3.4 Help Tab 52
4 Vertiv™ Intelligence Director 53
4.1 Aggregation 53
4.2 Master rPDU 53
4.3 Network Configuration 54
4.3.1 Downstream Devices 54
4.4 Views 56
4.4.1 Summary 57
4.4.2 Groups 58
4.4.3 List 59
i
Page 4

4.4.4 Group Configuration 60
4.5 Interfaces 61
4.5.1 Group SNMP Data 62
4.5.2 Tips and Troubleshooting 62
5 Appendices 63
Appendix A: Technical Support 63
Appendix B: Visible Light Communication (VLC) 65
Appendix C: Vertiv™ Mobile App 65
Appendix D: Available Sensors 72
Appendix E: IMD Display Codes 73
ii
Vertiv™ | Intelligent Rack PDU Installer/User Guide
Page 5
1 OVERVIEW
The Geist™ Rack Power Distribution Unit (rPDU) gives data center managers the flexibility to install the
intelligence required today, with the option to upgrade technology as needs evolve. From basic power to
power monitoring, the rPDU product line adapts to a business' needs now and in the future.
To establish this upgrade path, vertiv engineers took the robust rPDU design and incorporated an
Interchangeable Monitoring Device (IMD). PDUs last for many years and with the IMD design, businesses
are able to upgrade their PDUs to newer monitoring technologies in the future without having to replace
the entire rPDU. The hot-swappable IMD is changed out in a few simple steps, without interrupting power
to critical servers.
1.1 Environmental
The operational environmental limits pertaining to temperature, humidity and elevation are as defined in
the following tables.
Table 1.1 Temperature Limits
DESCRIPTION MINIMUM MAXIMUM
Operating 10°C (50°F) 60°C (140°F)
Storage -40°C (-40°F) 70°C (158°F)
Table 1.2 Humidity Limits
DESCRIPTION MINIMUM MAXIMUM
Operating 5% 95% (non-condensing)
Storage 5% 95% (non-condensing)
Table 1.3 Elevation Limits
DESCRIPTION MINIMUM MAXIMUM
Operating 0 m (0 ft.) 3,050 m (10,000 ft.)
Storage 0 m (0 ft.) 15,240 m (50,000 ft.)
1
Page 6

1.2 Electrical
Electrical product characteristics and performance are defined in the following table. Also, please see the
product nameplate for additional rating limits.
Table 1.4 Receptacle Ratings
TYPE RATINGS
NEMA 5-15R or L5-15R 125VAC, 12A
NEMA 5-20R or L5-20R 125VAC, 16A
NEMA 6-20R or L6-20R 250VAC, 16A
NEMA L5-30R 125VAC, 24A
NEMA L6-30R 250VAC, 24A
IEC-60320 C13 250VAC, 10A (UL & CSA12A, 250VAC)
IEC-60320 C19 250VAC, 16A (UL & CSA16A, 250VAC)
U-Lock Locking IEC-60320 C13 250VAC, 10A (UL & CSA12A, 250VAC)
U-Lock Locking IEC-60320 C19 250VAC, 16A (UL & CSA16A, 250VAC)
Combination C13/C19
Saf-D-Grid 277VAC, 16A
250VAC, 16A (UL & CSA16A, 250VAC) with C20 cord
250VAC, 10A (UL & CSA12A, 250VAC) with C14 cord
1.3 Networking
The product communications requirements are defined in the next sections.
1.3.1 Ethernet
The Ethernet link speed for this product is: 10/100 Mb; full duplex.
1.3.2 Protocols
The communication protocols supported by this product include: ARP, IPv4, IPv6, ICMP, ICMPv6, NDP,
TCP, UDP, RSTP, STP, DNS, HTTP, HTTPS (TLSv1.3), SMTP, SMTPS, DHCP, SNMP (V1/V2c/V3), LDAP,
TACACS+, RADIUS, NTP, SSH, RS232 and Syslog.
1.3.3 User Interfaces
This product supports the following user interfaces: SNMP, JSON-based Web GUI, JSON API and
Command-line interface using SSH or Serial (RS232).
1.4 Regulatory Compliance
Vertiv™ products are regulated for Safety, Emissions and Environment Impact per the following agencies
and policies.
2
Vertiv™ | Intelligent Rack PDU Installer/User Guide
Page 7

1.4.1 Underwriters Laboratories (UL)
UL standards are used to assess products; test components, materials, systems and performance; and
evaluate environmentally sustainable products, renewable energies, food and water products, recycling
systems and other innovative technologies.
The UL standards specific to this equipment are as noted on the device nameplate.
1.4.2 CE
The placement of the CE mark on a product signifies a manufacturer's declaration that the product
complies with the applicable European (EU) health, safety and environmental protection requirements,
including EU legislation and product directives. The CE mark is required for products offered for sale
within the European Economic Area (EEA).
The specific regulations, directives and standards applicable to each product are specified on the
Declaration of Conformity.
1.4.3 Federal Communications Commission (FCC)
The Federal Communications Commission (FCC) regulates interstate and international communications
by radio, television, wire, satellite and cable in all 50 states, the District of Columbia and U.S. territories. An
independent U.S. government agency overseen by Congress, the FCC is the United States' primary
authority for communications laws, regulation and technological innovation.
The FCC standards specific to this equipment are:
• This Class A device complies with Part 15 of the FCC Rules. Operation is subject to the following two
conditions:
i. This device may not cause harmful interference.
ii. This device must accept any interference received, including interference that may cause
undesired operation.
• This Class A digital apparatus complies with Canadian ICES-003.
Cet appareil numérique de la classe A est conforme à la norme NMB-003 du Canada.
WARNING! Changes or modifications to this unit not expressly approved by the party
responsible for compliance could void the user's authority to operate this equipment.
1.4.4 RoHS/WEEE
RoHS, also known as Lead-Free, stands for Restriction of Hazardous Substances. RoHS, also known as
Directive 2002/95/EC, originated in the European Union and restricts the use of six hazardous materials
found in electrical and electronic products. All applicable products in the EU market after July 1, 2006,
must pass RoHS compliance. RoHS impacts the entire electronics industry and many electrical products
as well.
WEEE stands for Waste from Electrical and Electronic Equipment. WEEE Directive 2002/96/EC mandates
the treatment, recovery and recycling of electric and electronic equipment (90% ends up in landfills). All
applicable products in the EU market must pass WEEE compliance and carry the Wheelie Bin sticker.
See product label for RoHS/WEEE compliance marks.
1 Overview
3
Page 8

This page intentionally left blank
4
Vertiv™ | Intelligent Rack PDU Installer/User Guide
Page 9
2 INSTALLATION
Install your Rack PDU according to the images in the mounting section.
NOTE: Before beginning installation, visit
documents/it-management/it-management-compliance-regulatory-information
information.
To install your unit:
1. Attach the unit to the rack using appropriate hardware.
2. Plug the rPDU into an appropriately rated and protected branch-circuit receptacle.
3. Plug in the devices to be powered by the rPDU.
4. Turn On each device connected to the rPDU.
NOTE: Vertiv™ recommends powering-up connected devices sequentially to avoid high inrush current.
https://www.vertiv.com/en-us/support/technical-
, for important safety
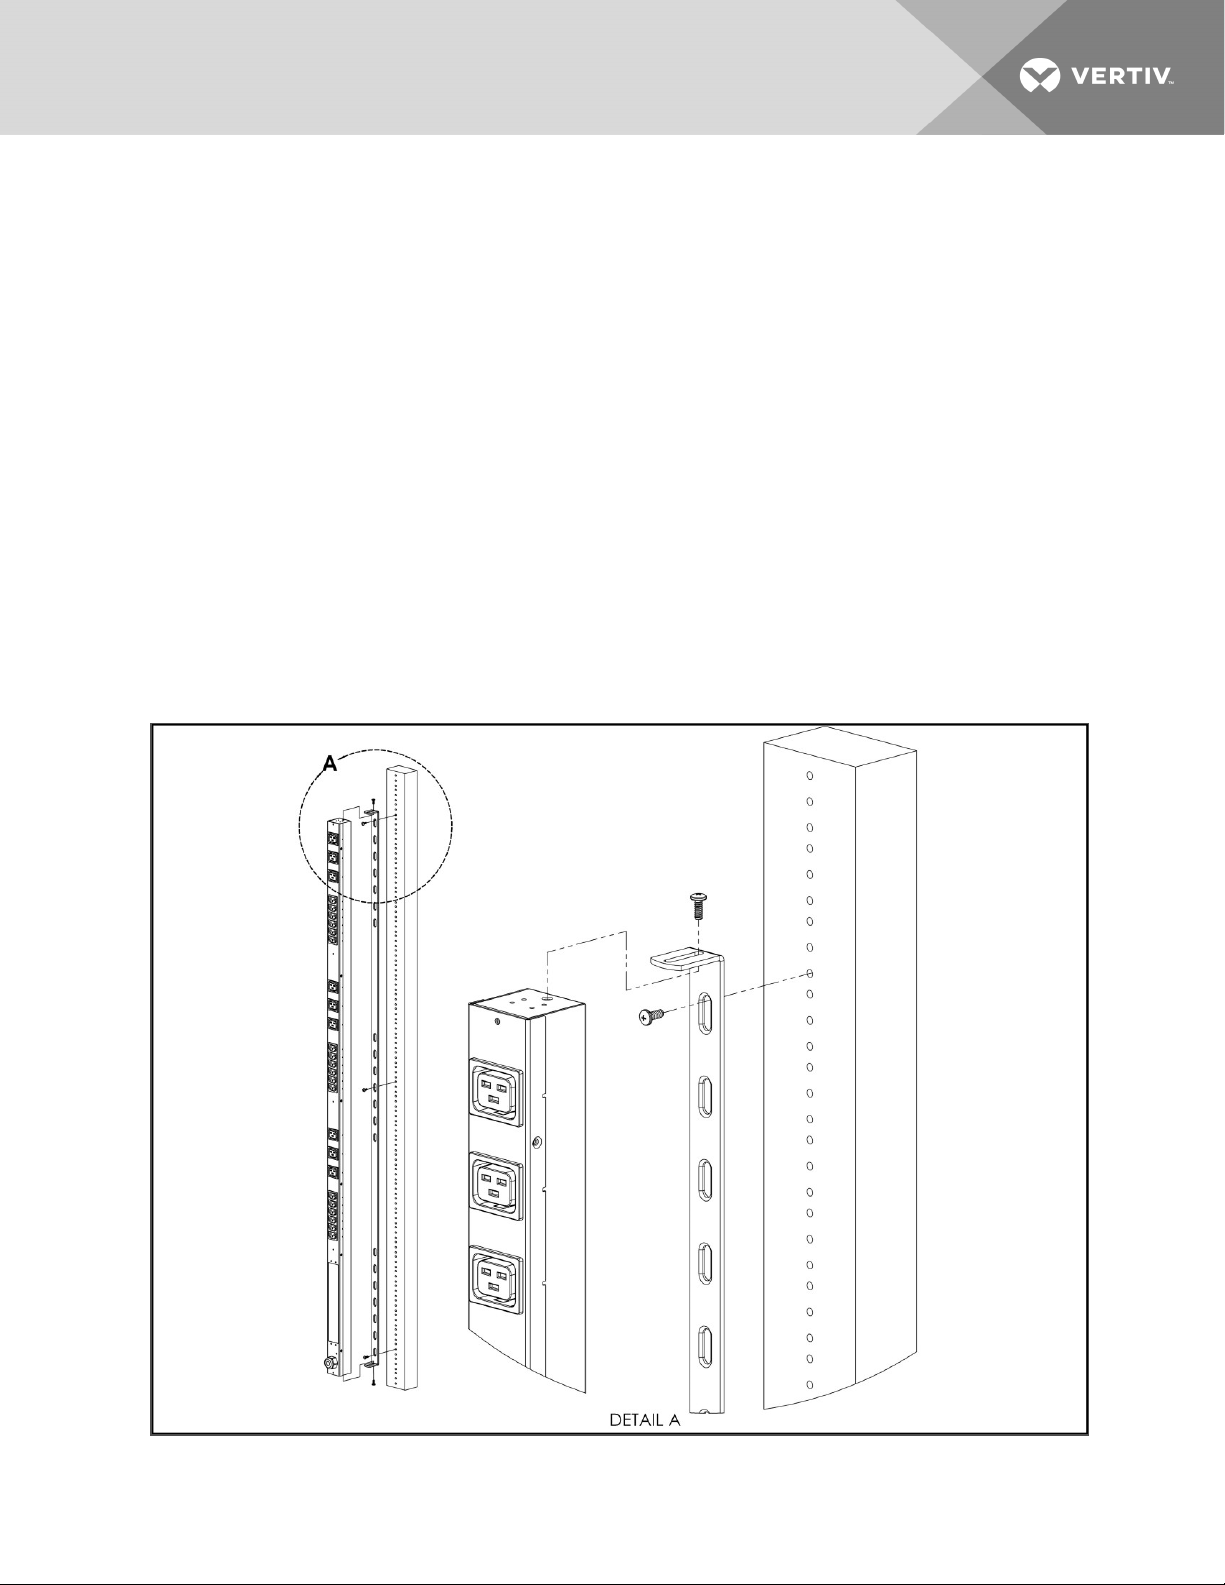
2.1 Mounting
Optional brackets are sold separately.
Figure 2.1 Full-Length Brackets
5
Page 10
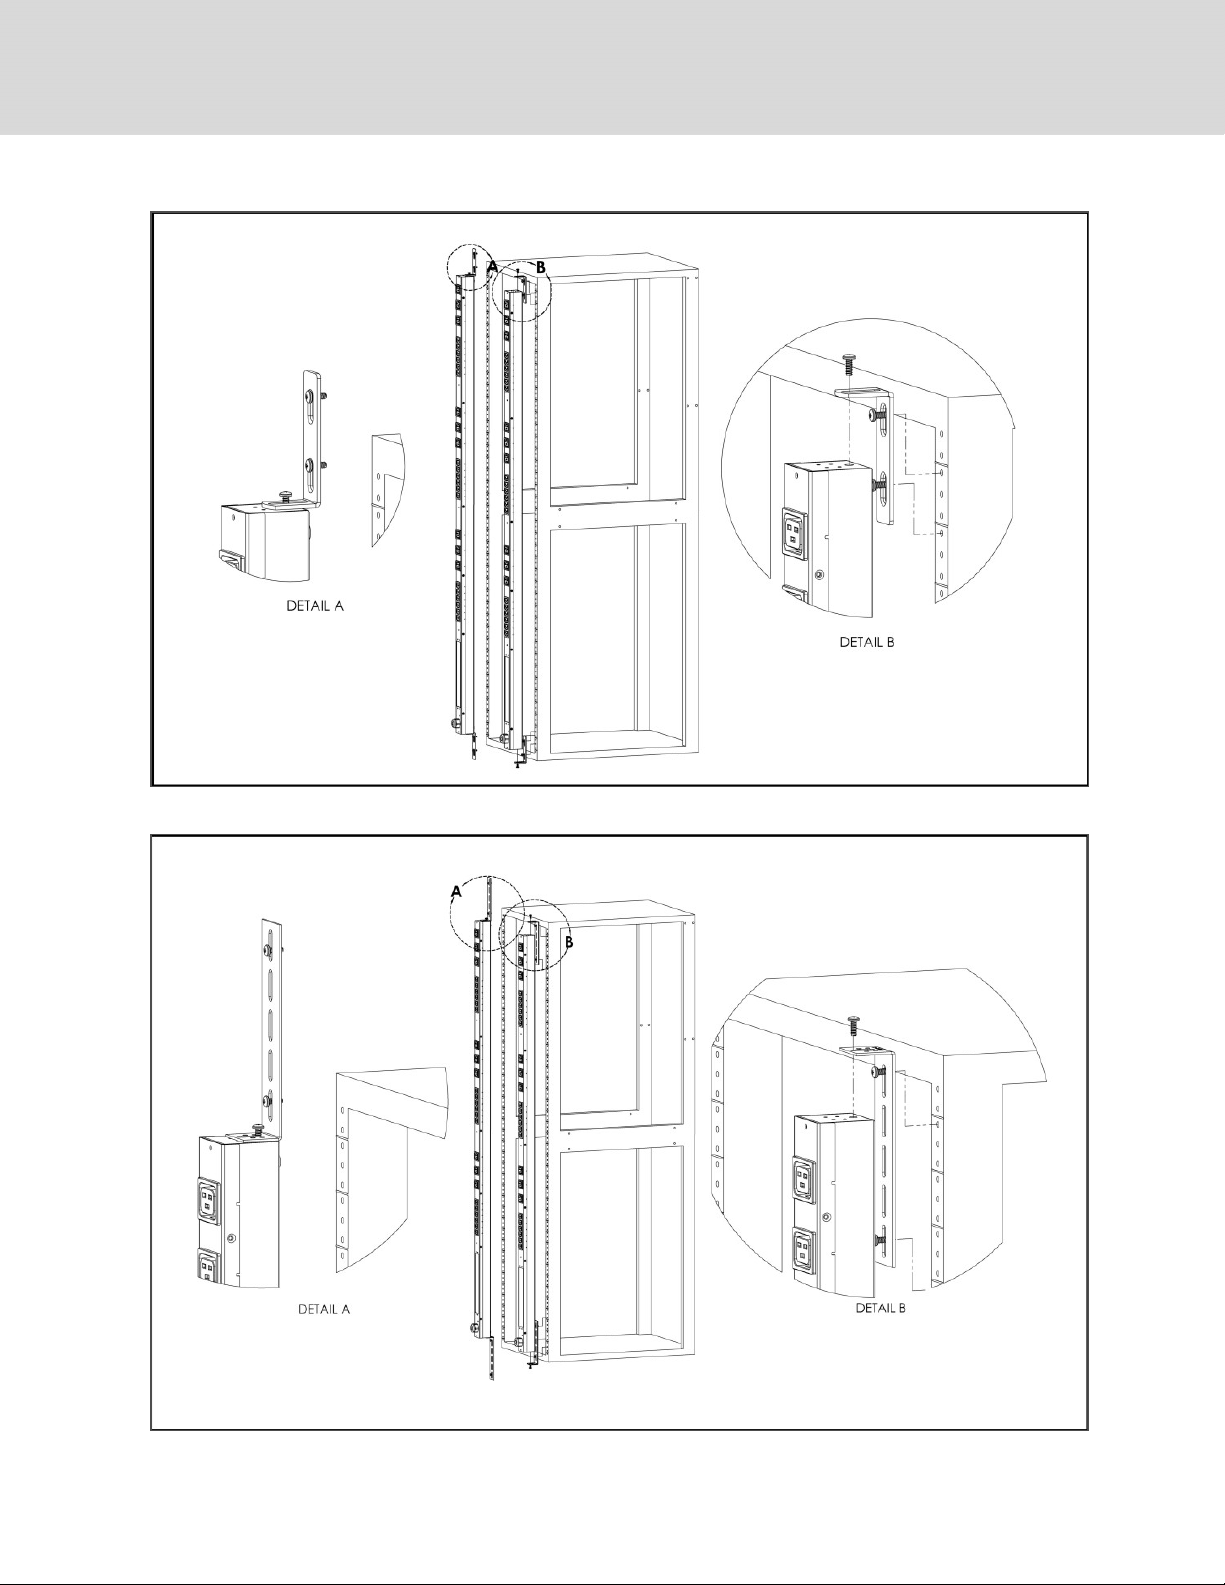
Figure 2.2 Mini L-Brackets
Figure 2.3 Vertical Extension Brackets
6
Vertiv™ | Intelligent Rack PDU Installer/User Guide
Page 11
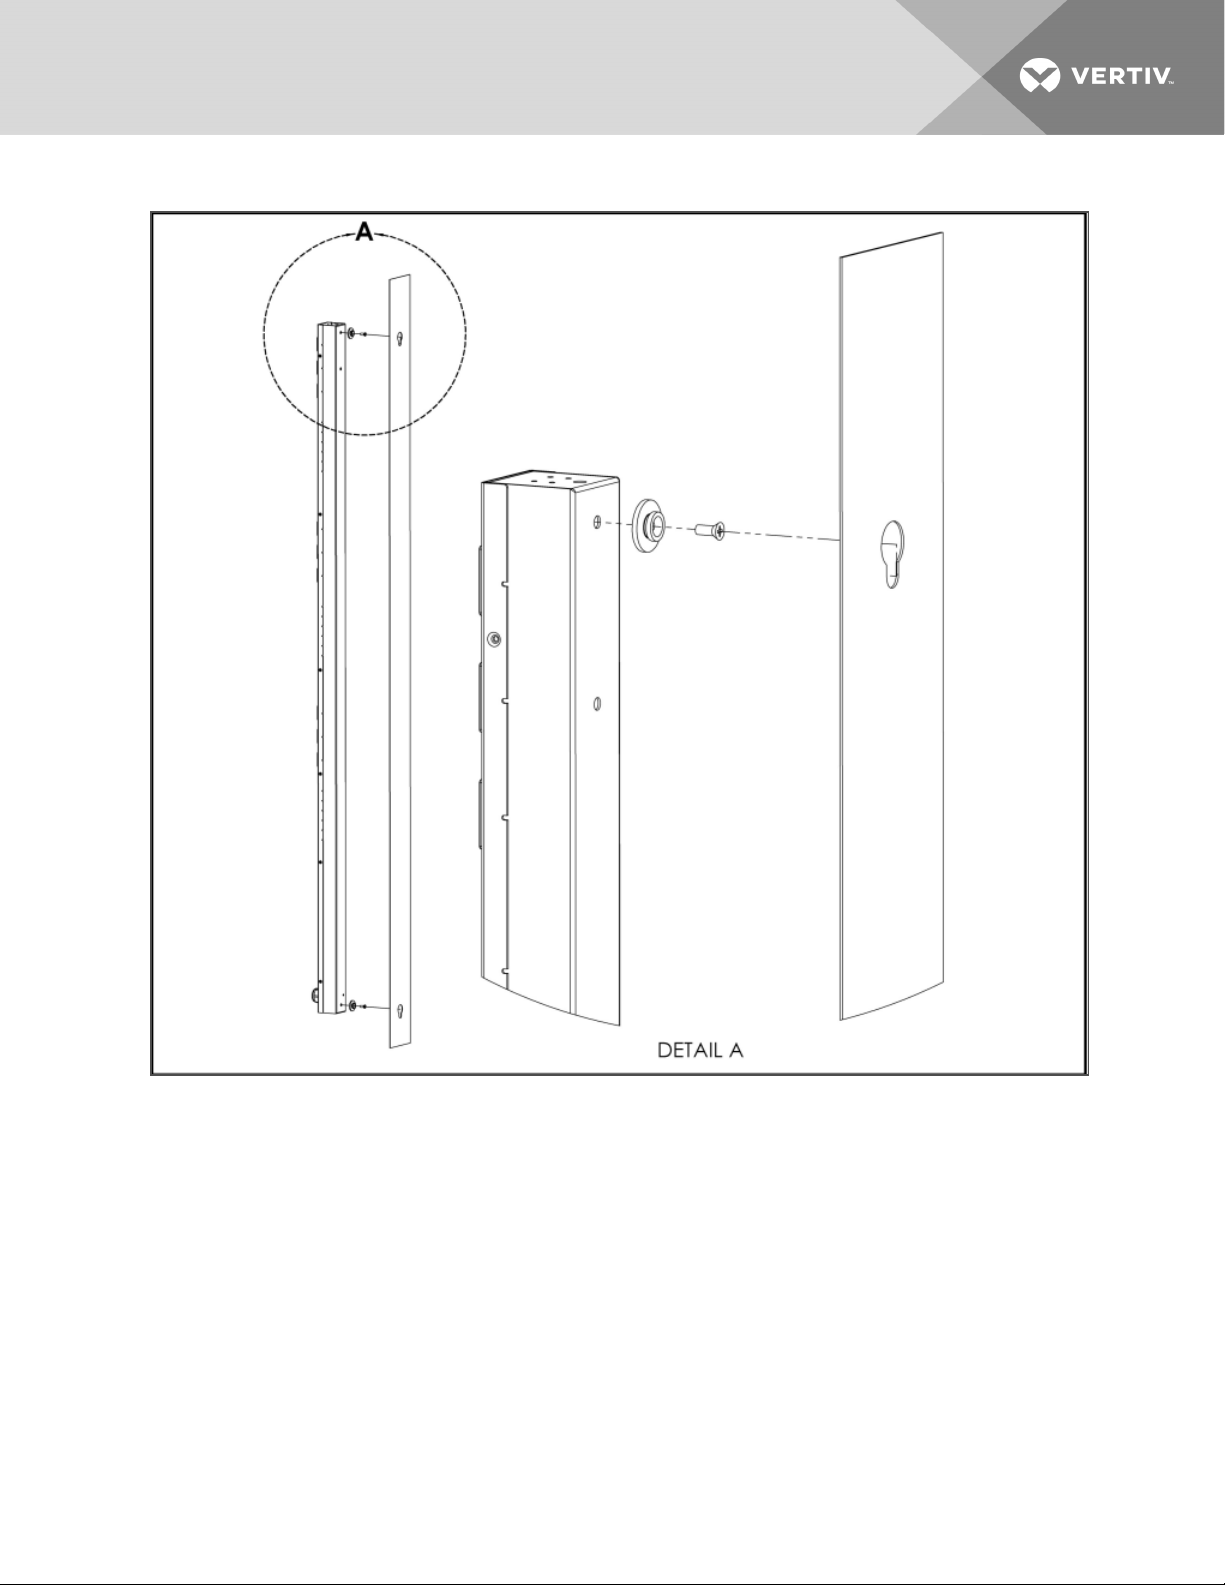
Figure 2.4 Toolless Mounting Hardware
2 Installation
7
Page 12
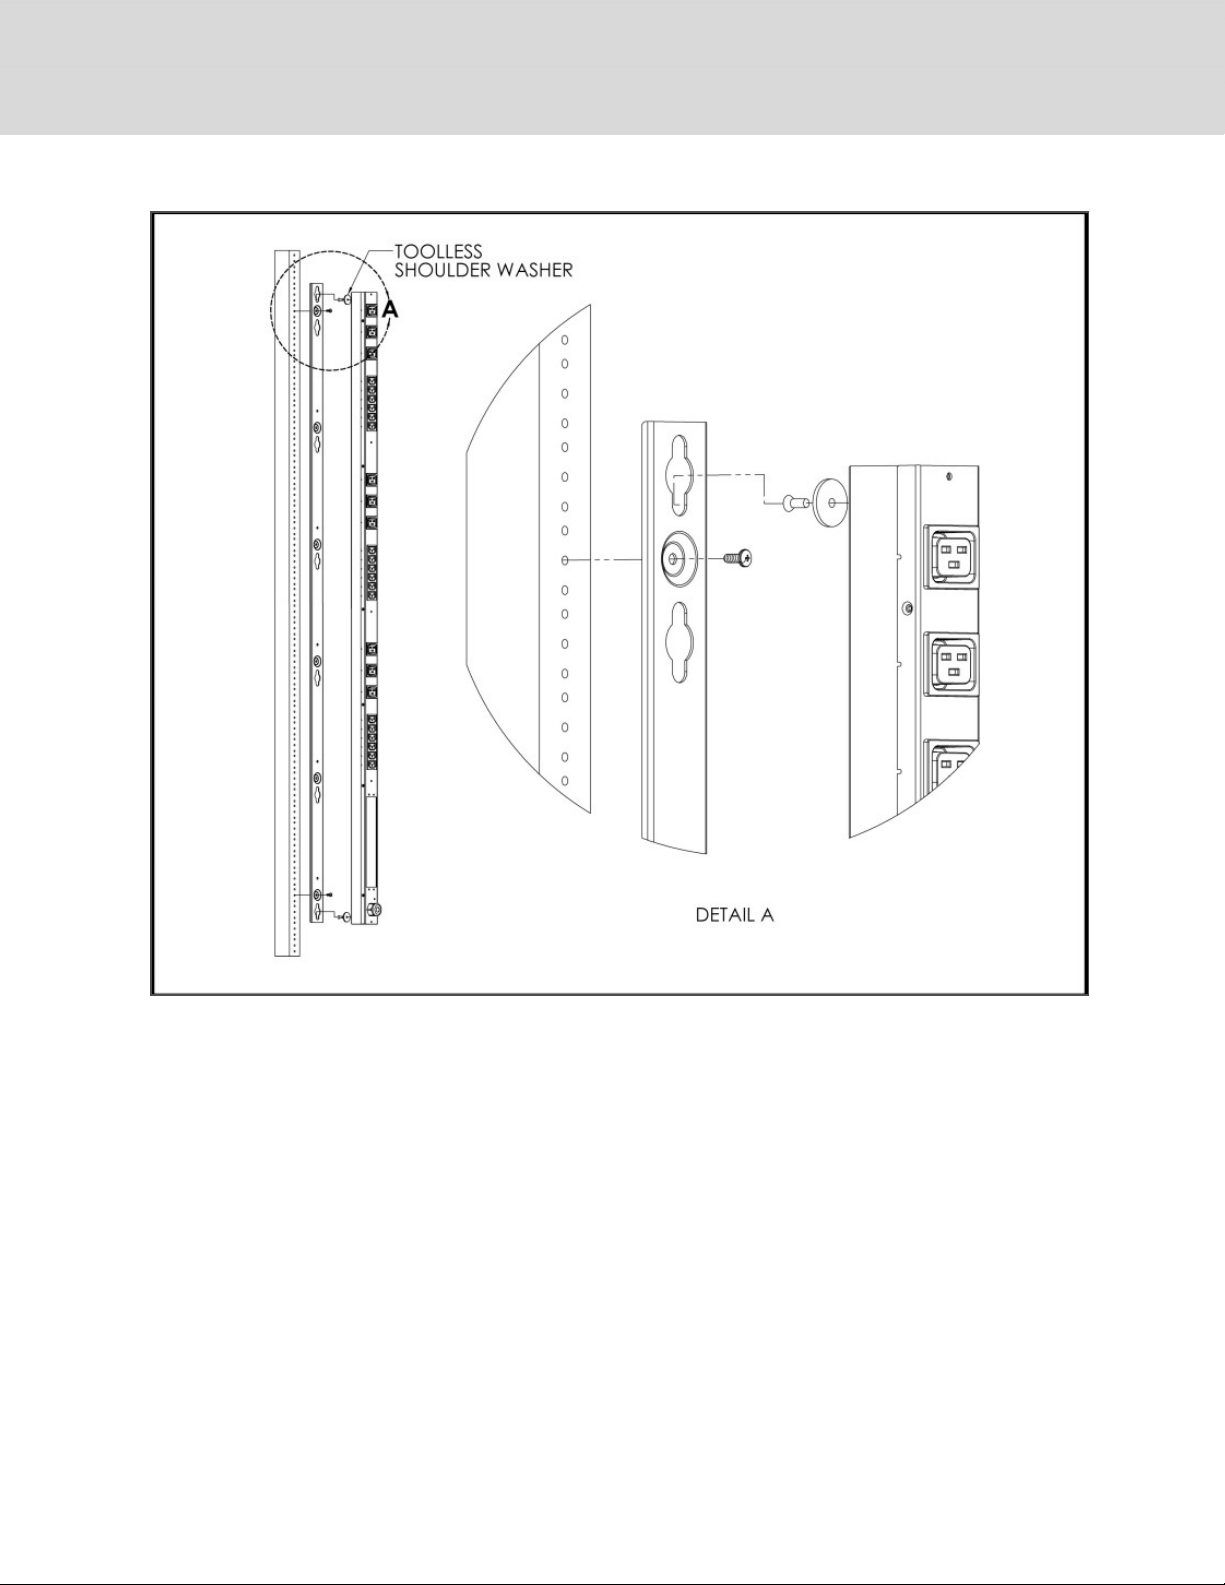
Figure 2.5 Toolless Full-Length Brackets
8
Vertiv™ | Intelligent Rack PDU Installer/User Guide
Page 13
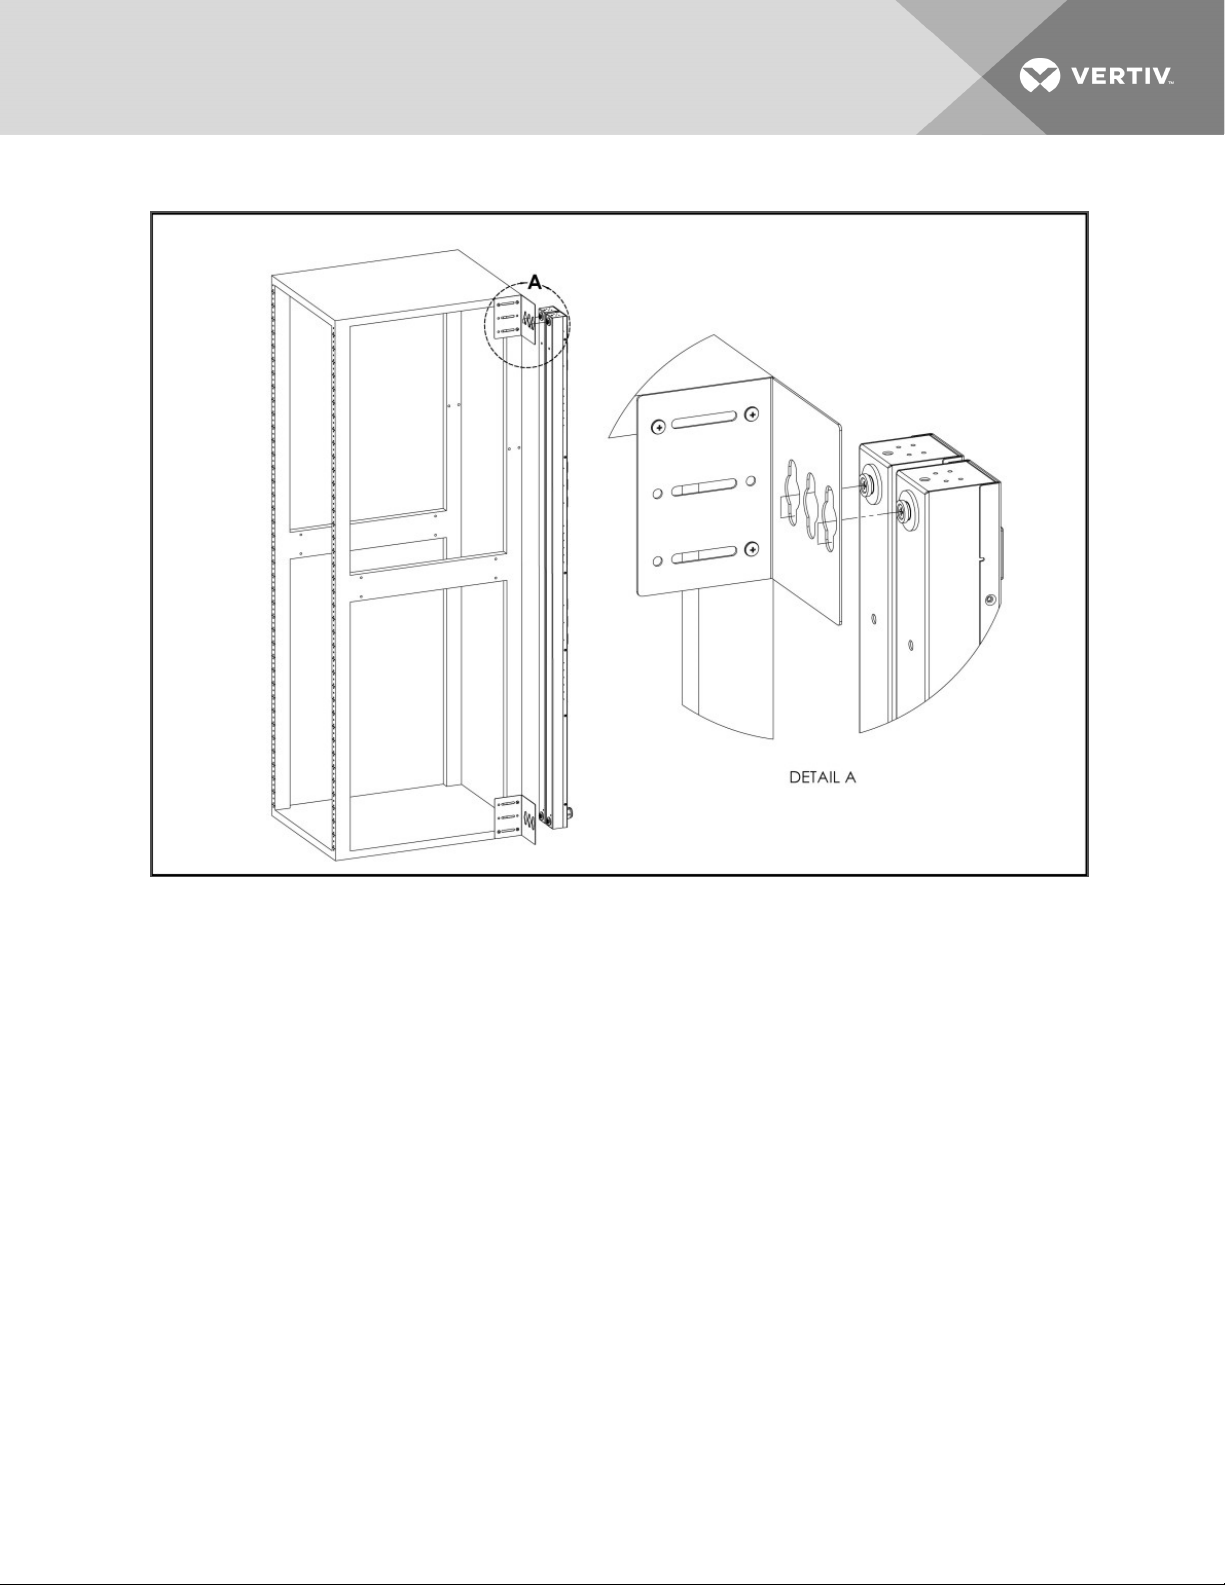
Figure 2.6 Single Side-Mount, Two-Unit Brackets
2 Installation
9
Page 14
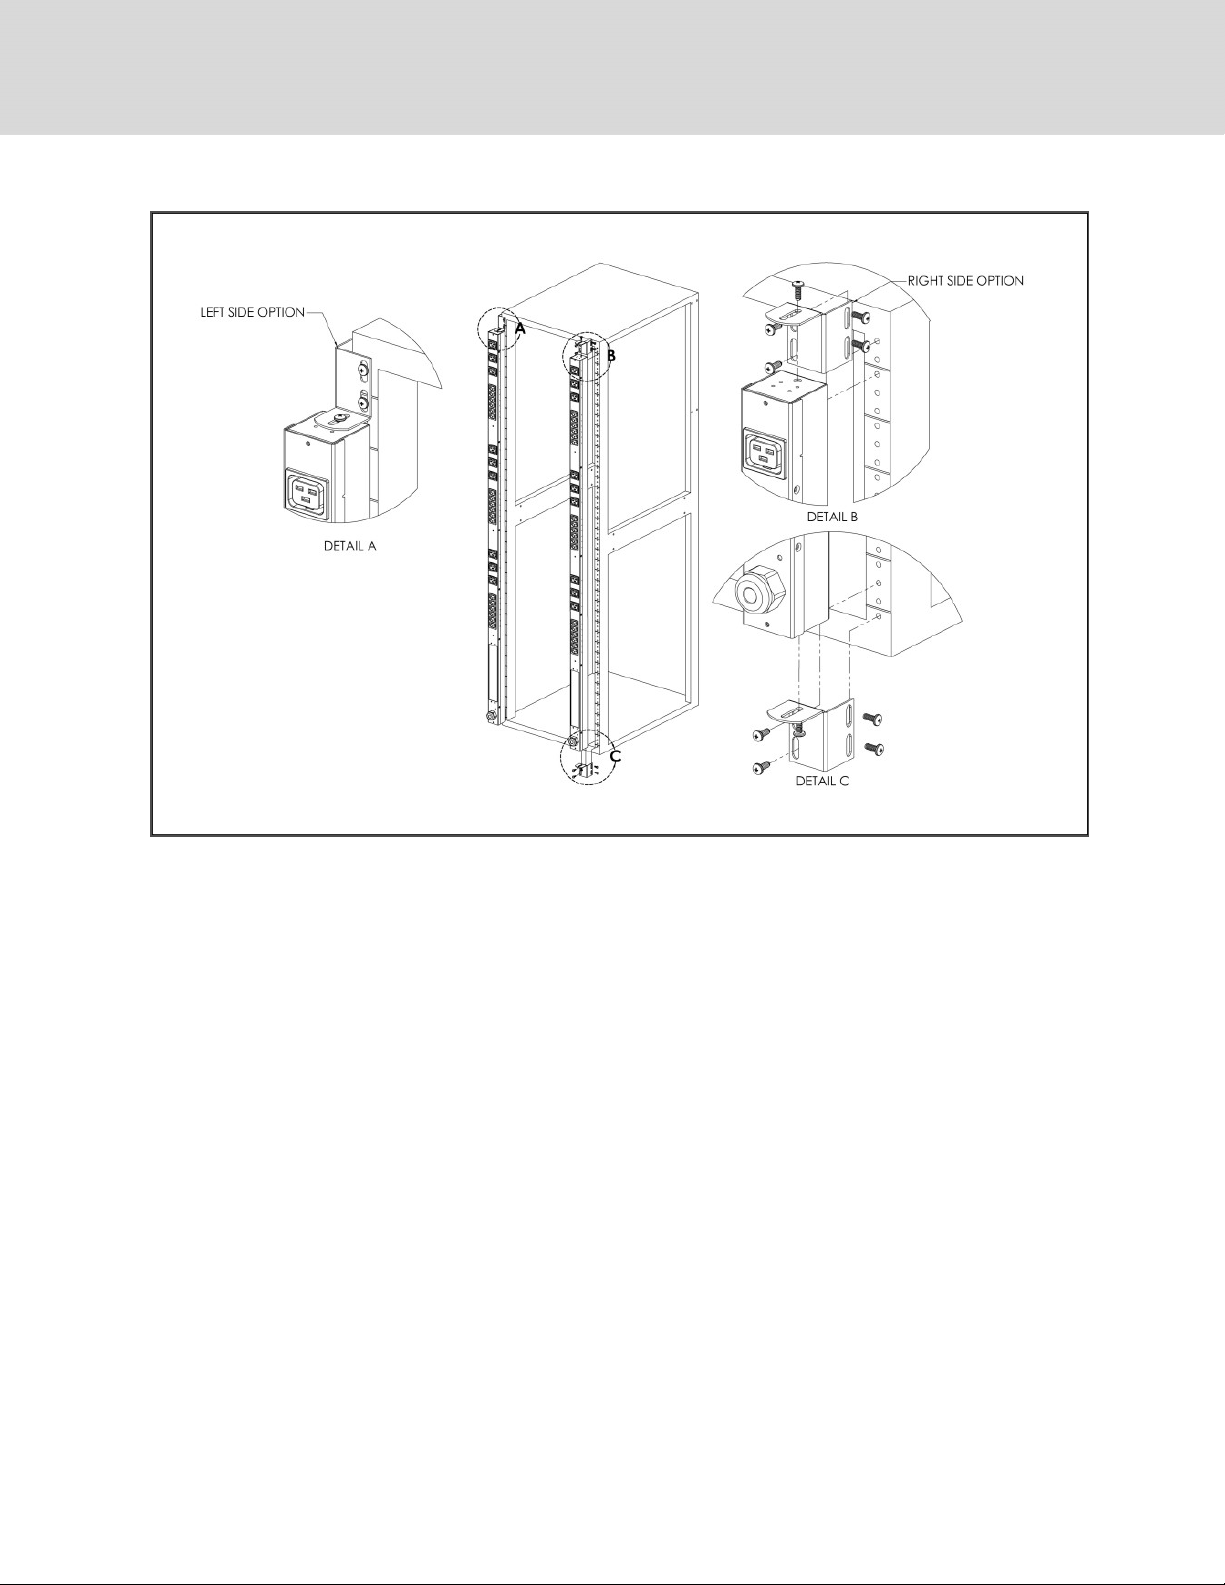
Figure 2.7 Offset/Side-Mount Brackets
10
Vertiv™ | Intelligent Rack PDU Installer/User Guide
Page 15
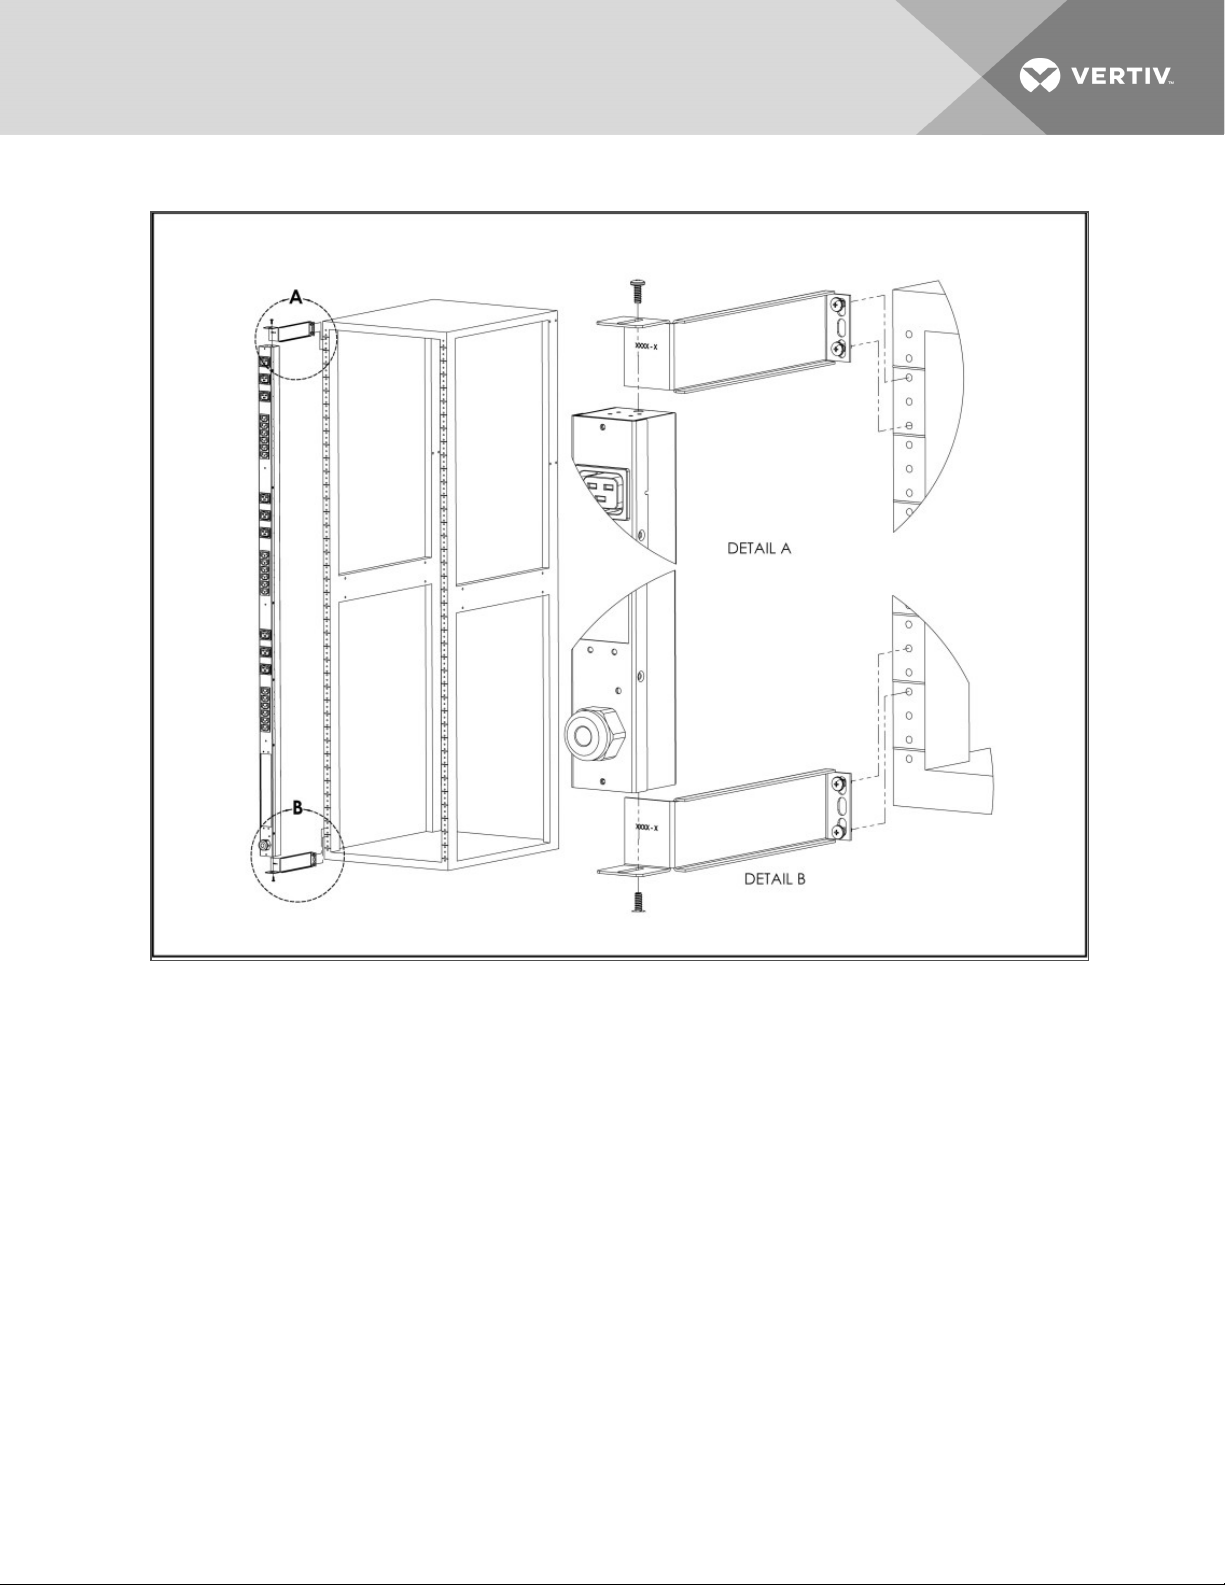
Figure 2.8 7" Extension Brackets
2 Installation
11
Page 16
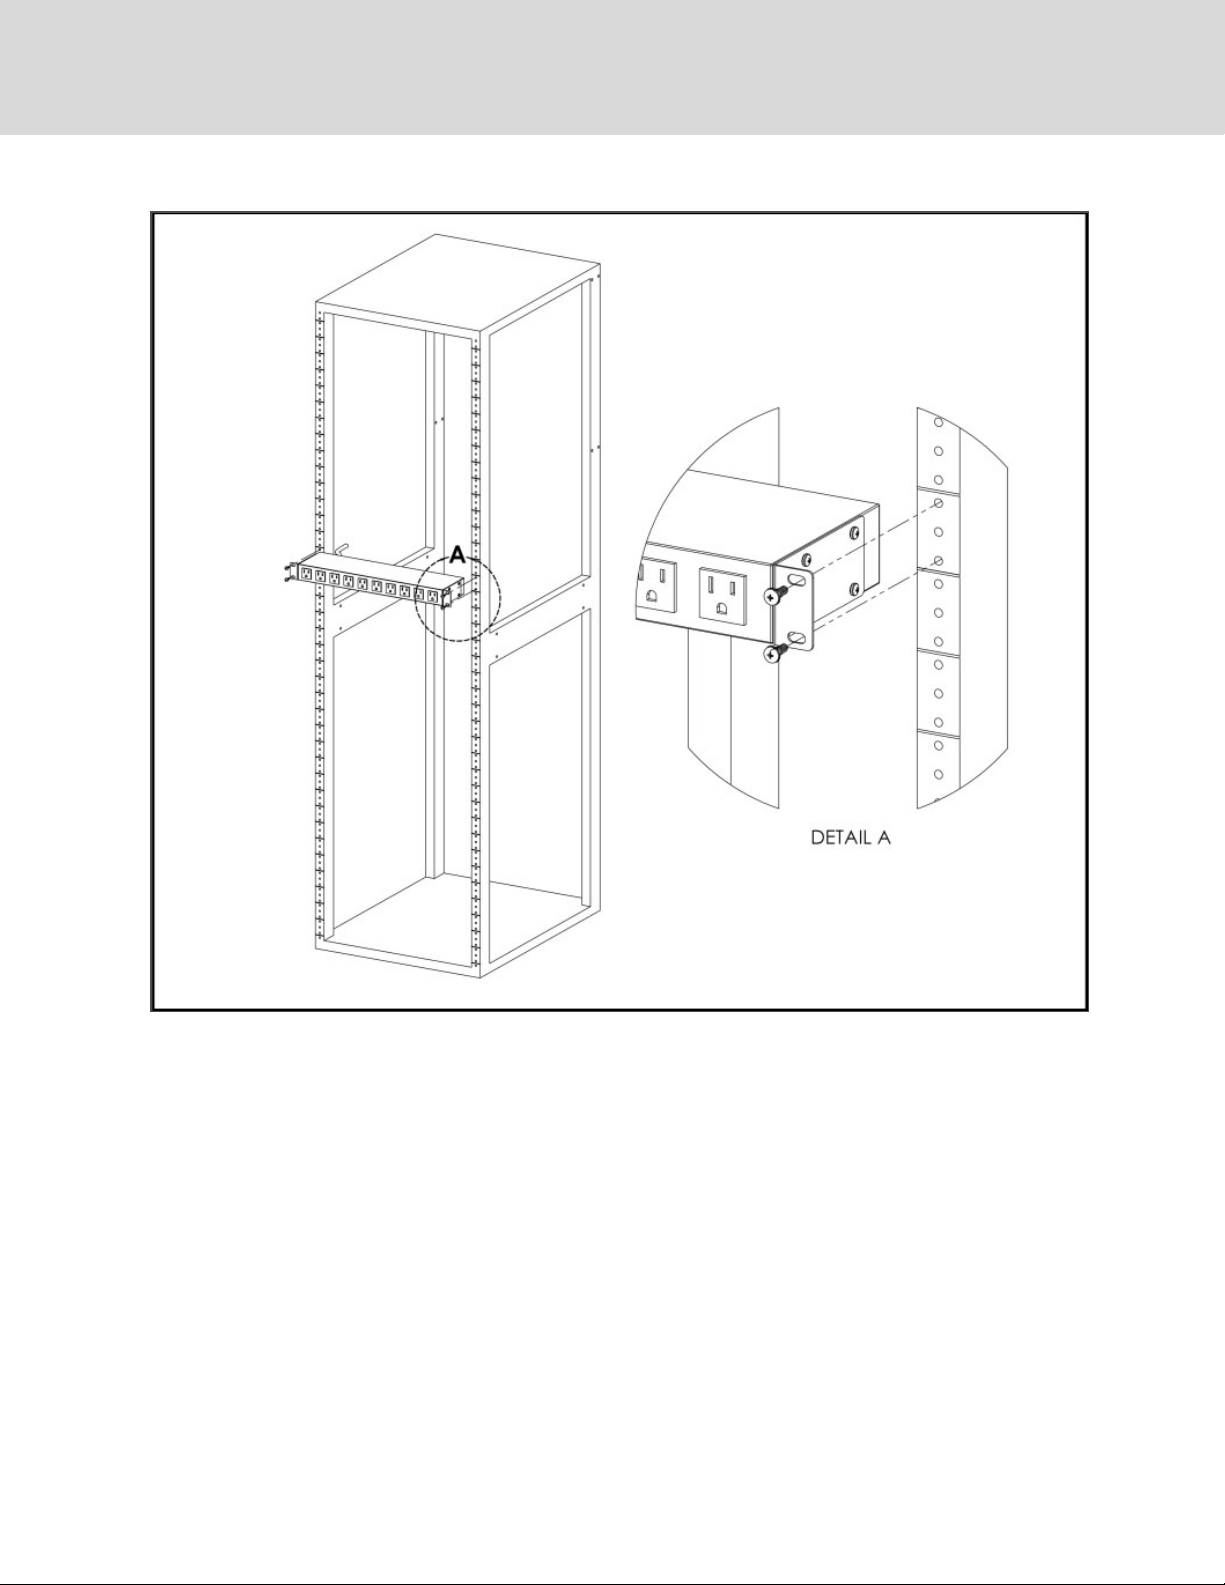
Figure 2.9 Flush-Mount Bracket
12
Vertiv™ | Intelligent Rack PDU Installer/User Guide
Page 17
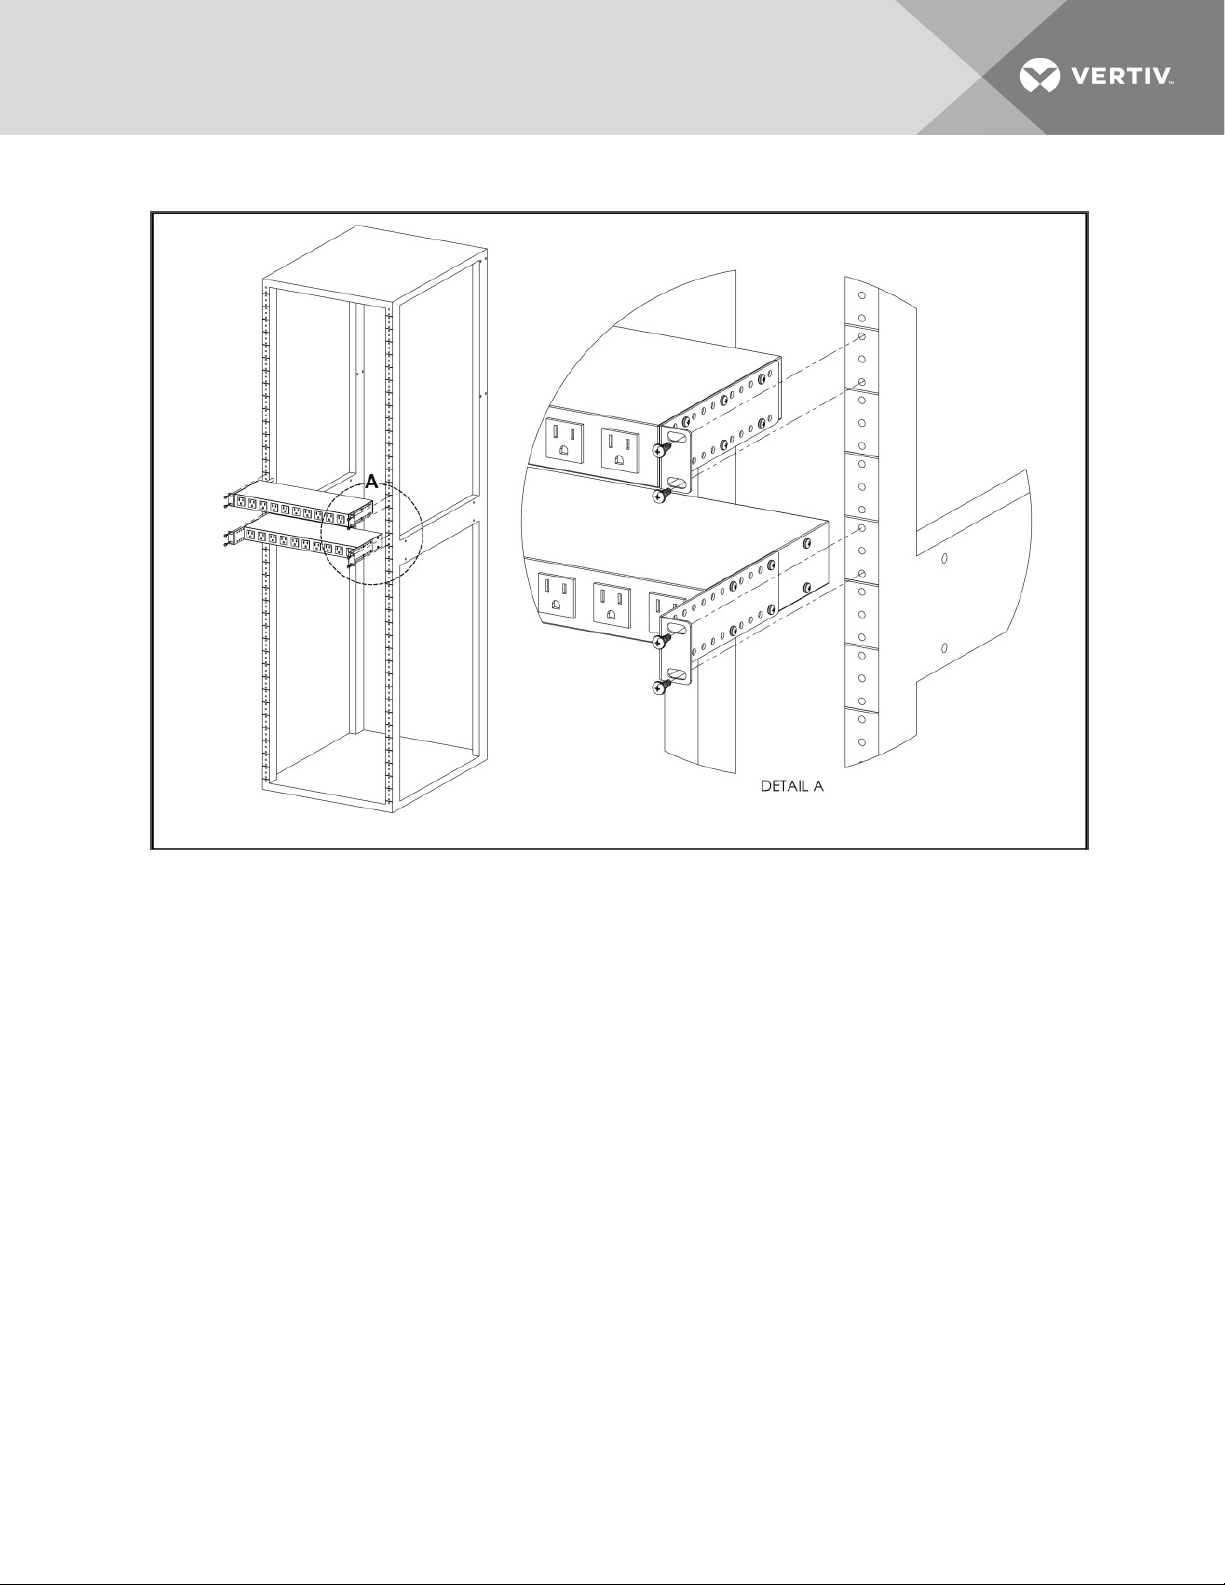
Figure 2.10 Adjustable-Mount Bracket
2 Installation
13
Page 18
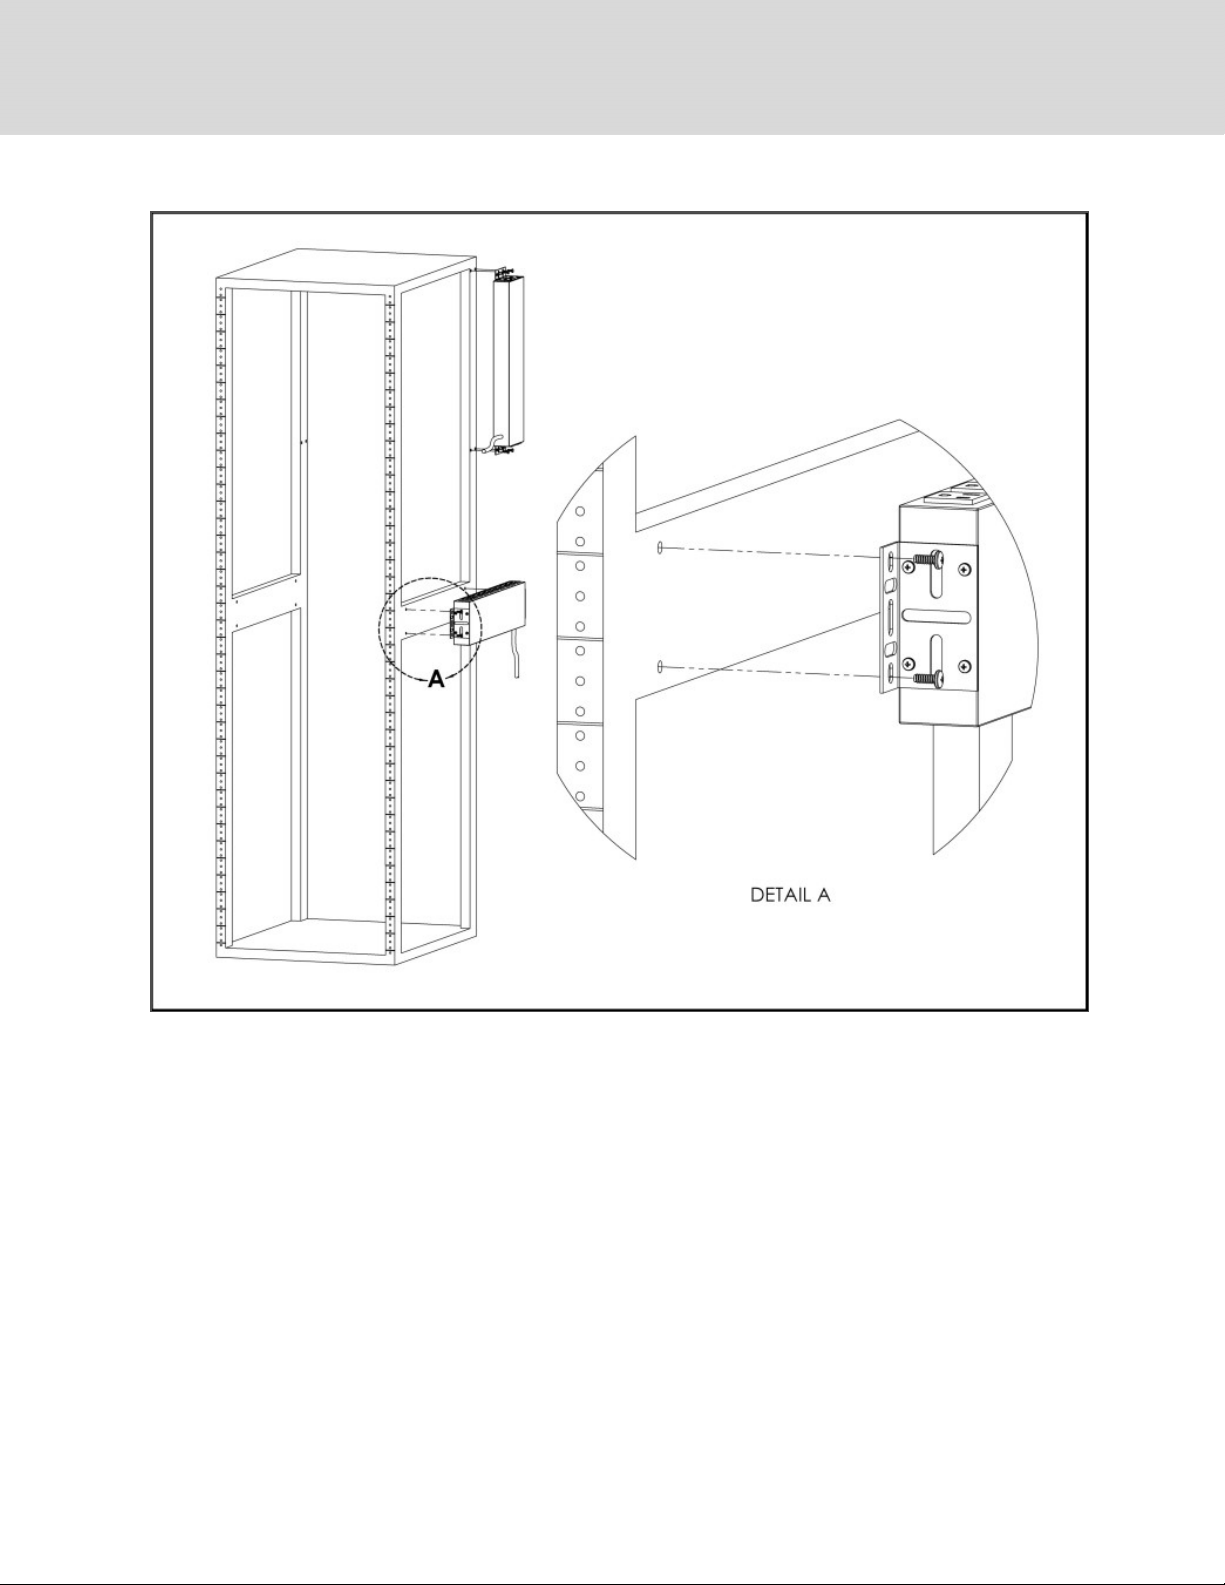
Figure 2.11 Panel-Mount Bracket
14
Vertiv™ | Intelligent Rack PDU Installer/User Guide
Page 19
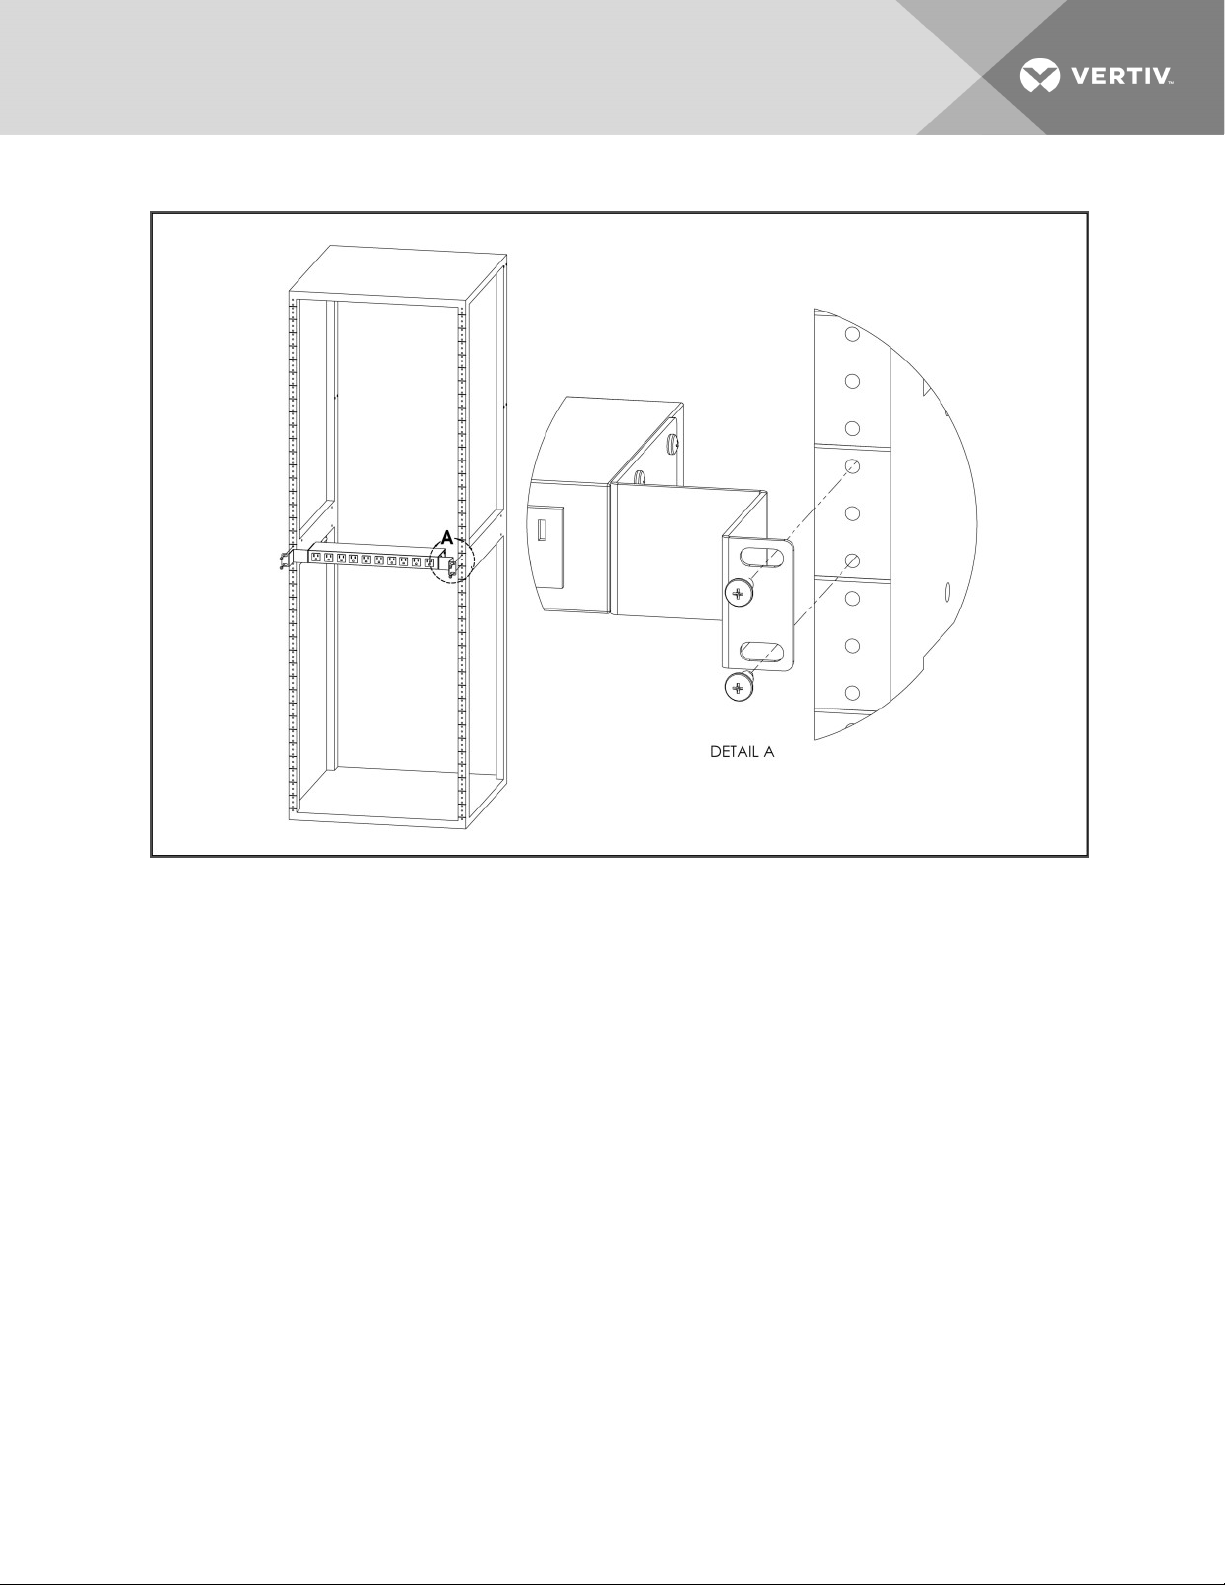
Figure 2.12 23" Conversion Mounting Brackets
2 Installation
15
Page 20
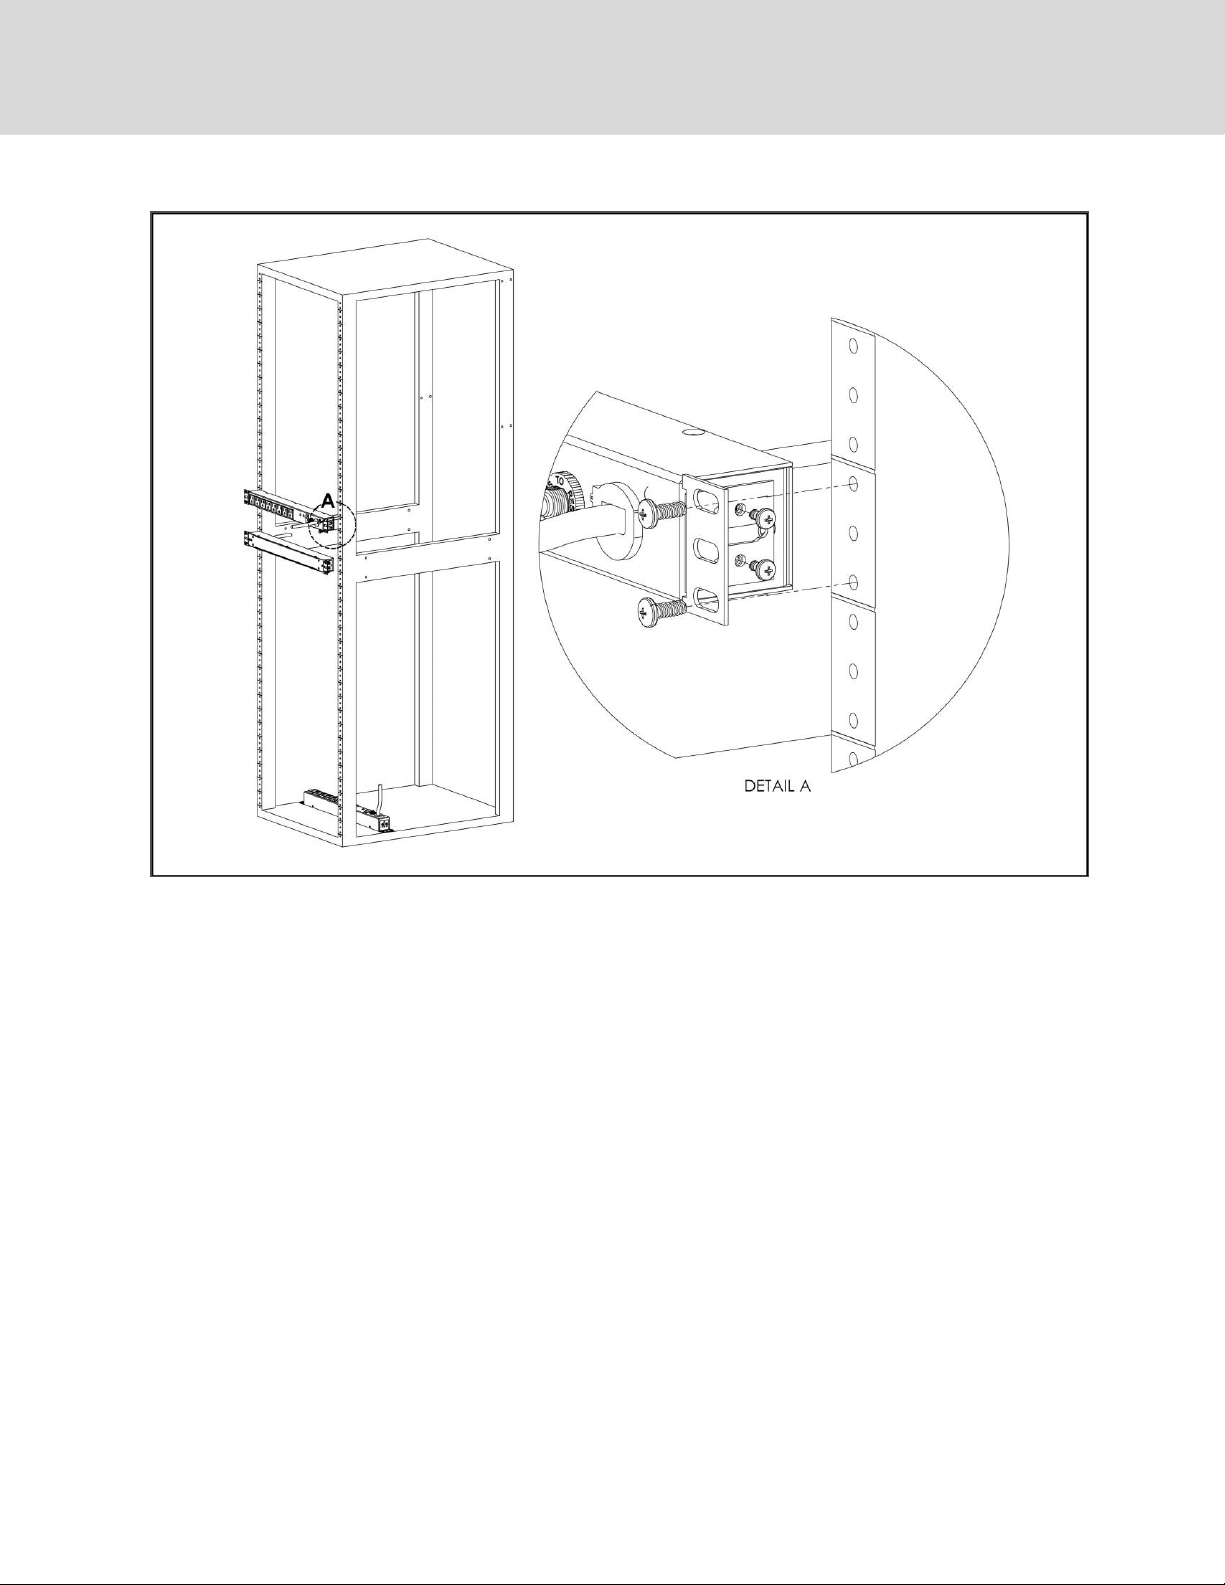
Figure 2.13 19" Horizontal/Panel-Mount Brackets
16
Vertiv™ | Intelligent Rack PDU Installer/User Guide
Page 21
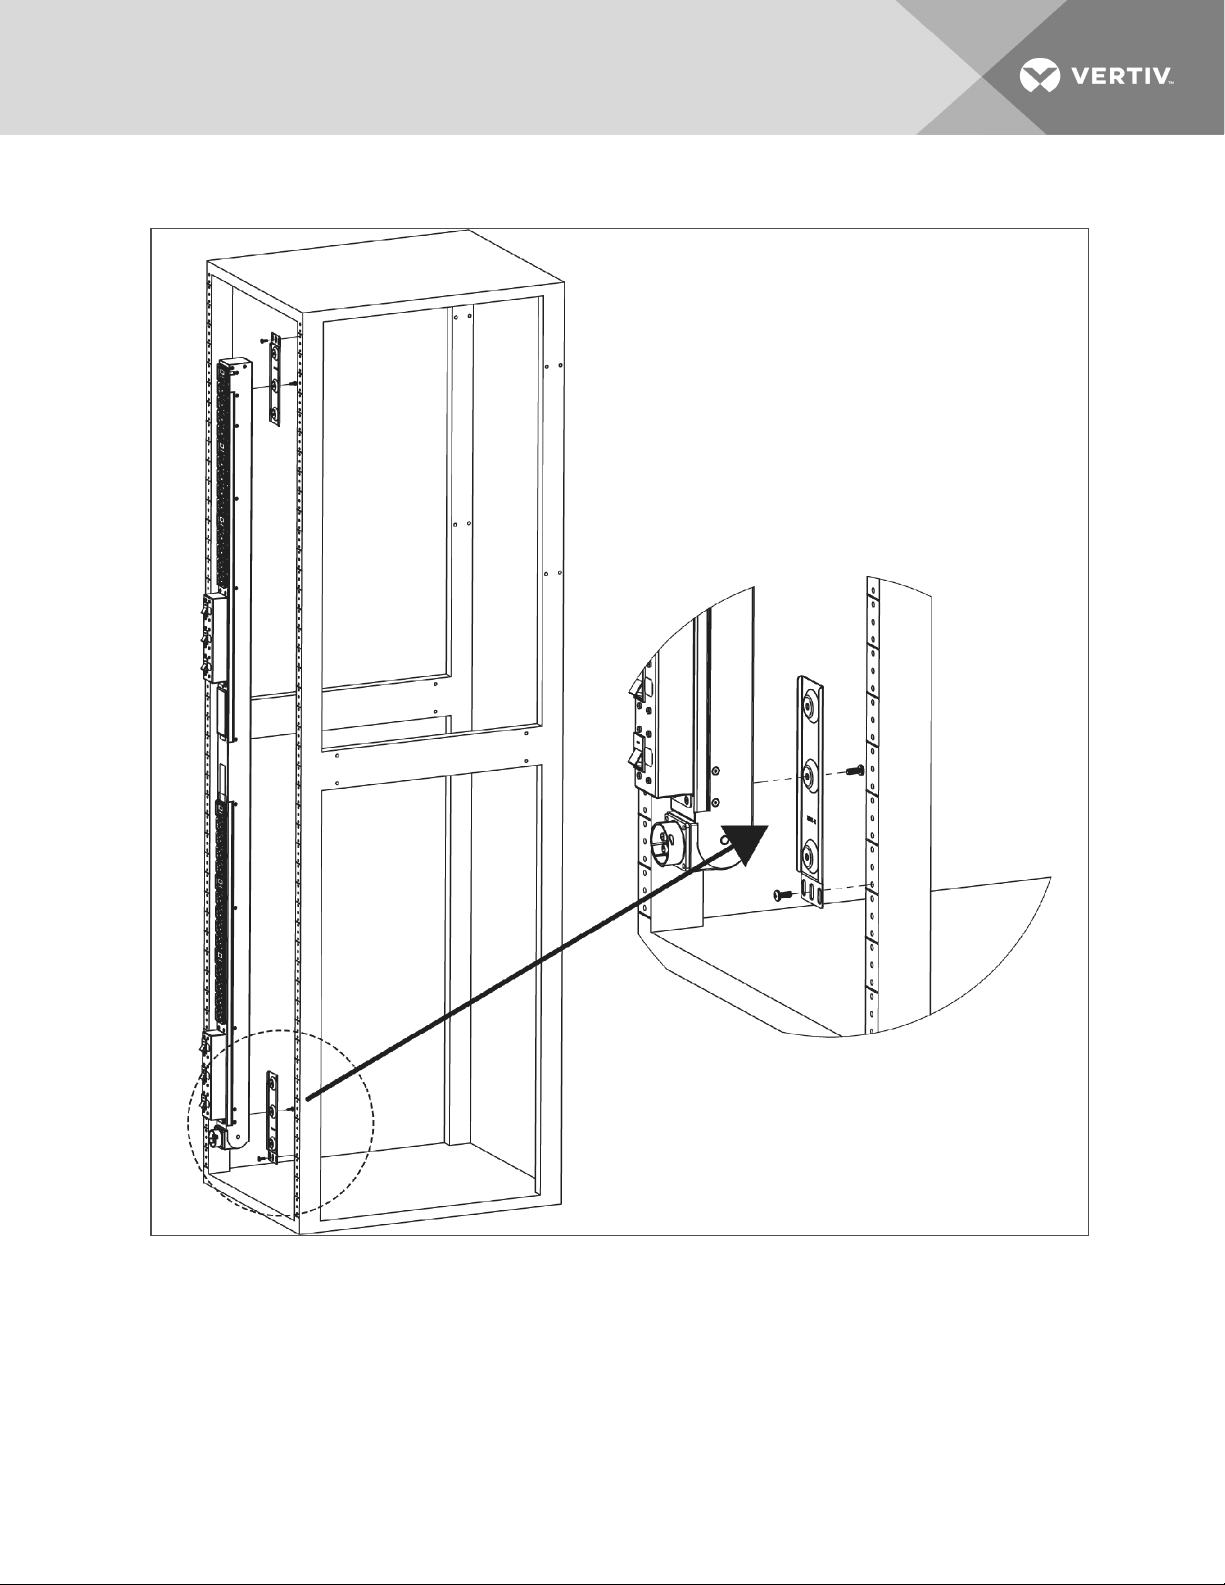
Figure 2.14 Mount Brackets for UPDU with Pivoting End
2 Installation
17
Page 22
2.1.1 Power Connection
Plug the rPDU into an appropriately rated and protected branch circuit receptacle.
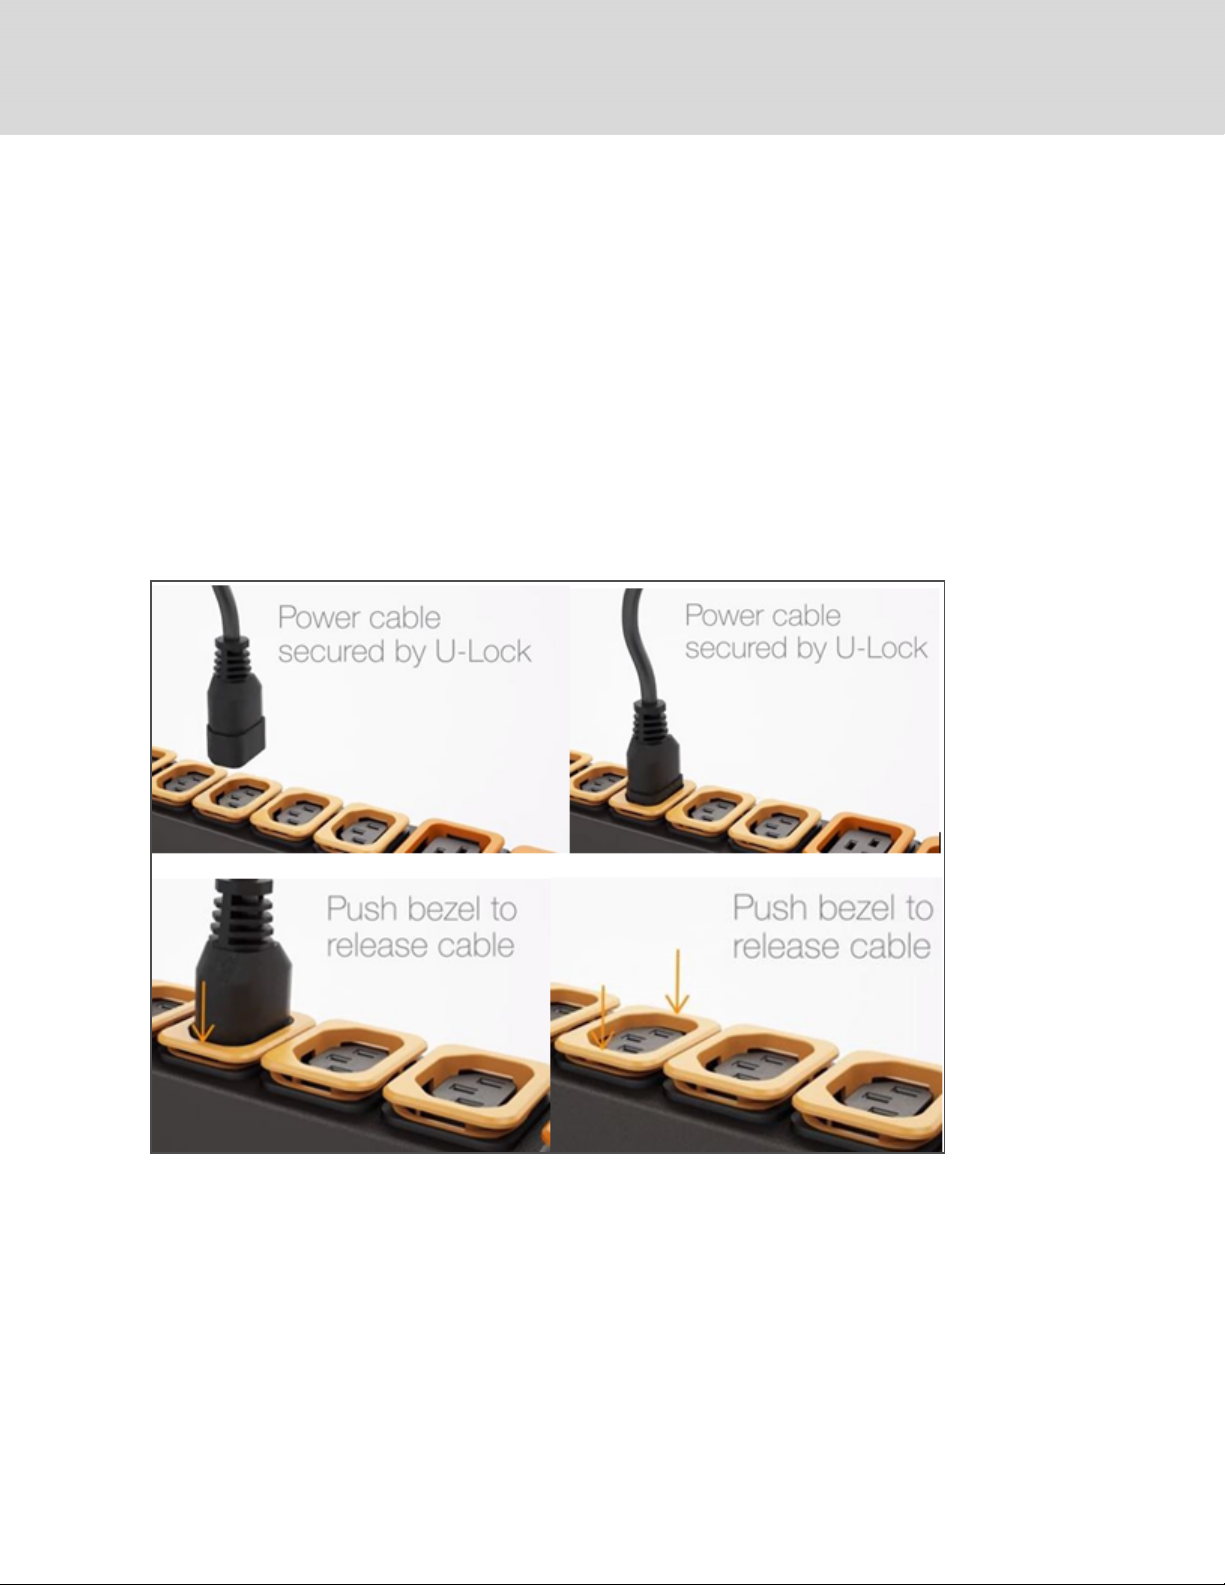
2.1.2 U-Lock Operation
Plug in the devices to be powered by the rPDU.
Vertiv™ patented U-Lock power cord retention.
• Uses standard power cords.
• Cord insertion-activated locking system.
• Easy push-and-hold Bezel unlocking feature.
Figure 2.15 U-Lock Cord Retention Operation
2.1.3 P-Lock Operation
Plug in the devices to be powered by the rPDU.
• Vertiv Combination C13/C19 Outlet with P-Lock power cord retention.
• Compatible with P-Lock power cords.
• Use press-and-hold tabs on the P-Lock cord to release from outlet.
18
Vertiv™ | Intelligent Rack PDU Installer/User Guide
Page 23
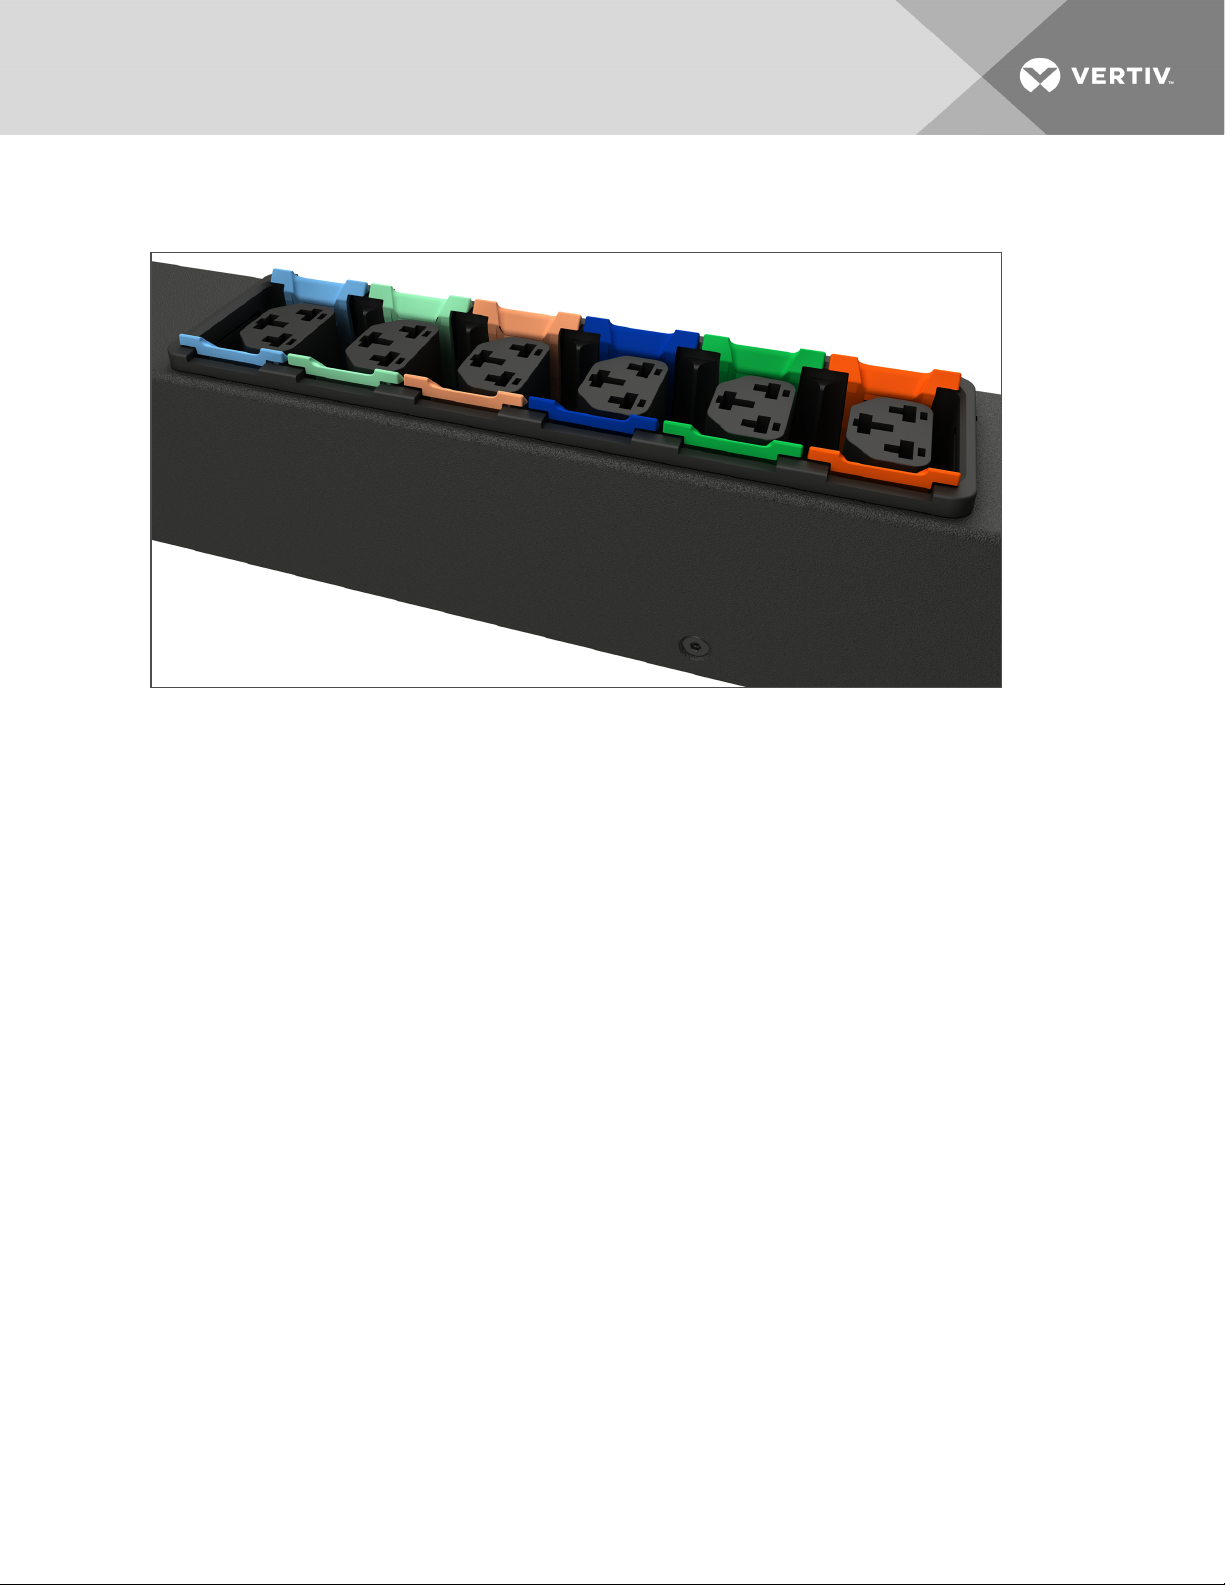
Figure 2.16 P-Lock Cord Retention Operation
2 Installation
19
Page 24

This page intentionally left blank
20
Vertiv™ | Intelligent Rack PDU Installer/User Guide
Page 25

3 SETUP
3.1 Interchangeable Monitoring Device (IMD-03X)
The IMD-03x adds additional functionality over the IMD-02x modules, which includes expanded sensor
support and enhanced firmware features. The IMD can be replaced and upgraded to allow data centers to
future-proof their locations. There are three versions of the IMD-03x.
3.1.1 Monitored
The IMD-03x adds additional functionality over the IMD-02x modules, including expanded sensor support
and enhanced firmware features.
Figure 3.1 IMD-03x Module
Table 3.1 IMD-03x Module Descriptions
NUMBER NAME DESCRIPTION
Dual Ethernet
1
Ports
Hard-Reboot
2
Button
Network Reset
3
Button
4 Local Display The localdisplayshows the phase, line and circuit current values (in amperes).
5 DisplayButtons
The dual ethernet ports act as a two-port ethernet switch, allowing for multiple devices to be daisychained.
Pressingthe hard-reboot button reboots the IMD. Thisacts asa power-cycle for the IMD; it does not
change or remove any user information.
Holding the network-reset button for 15 seconds during normaloperation willrestore the default IP
address and reset the user accounts.
There are three buttons near the IMD display; a back button, a forward button and a center button.
The functions of these buttons are described in .
21
Page 26

Table 3.2 Display Button Functions
BUTTON SYMBOL DESCRIPTION
Back Button Decrement to the previous channel.
ForwardButton Increment to the next channel.
Toggle between scrolling and static displaymodes. Holding this button for
3 seconds initiates aparameter reset sequence. This sequence consists of
an
rset
Center Button
Center Button x3
message, followed bya
countdown. Once the countdown expires, an
andthe network,
reset to default values. If the button isreleased at any time duringthis
sequence, the reset willbe aborted.
Pressingthis button 3 times within2 seconds enables VLC mode. Pressing
the button while VLC mode is active returns the unit to the standard
current display.
http
dflt
user accounts and
message and then a3-second
8888
message is displayed
LDAP/RADIUS
informationis
Back and Forward Buttons
Back and Center Buttons
and
and
Pressingboth buttons at the same time flipsthe display 180 degrees.
Pressingboth buttons at the same time displaysthe primaryIPv4 address
for the unit.
NOTE: Display Button functionality may vary based on unit configuration.
3.1.2 Enhanced Monitored (IMD-03E)
The Enhanced IMD-03E is a more advanced option for data centers that need full remote monitoring,
alarms and remote sensors. It is built with the IMD-03X module, which provides dual ethernet ports and a
local display. The IMD-03E uses the Enhance Communication Card (ECC) that adds a Remote Sensor Port
for the connection of optional environmental sensors or accessories.
NOTE: The IMD-03E has been discontinued and replaced with the IMD-03E-S.
Figure 3.2 IMD-03E Module
22
Vertiv™ | Intelligent Rack PDU Installer/User Guide
Page 27

Table 3.3 IMD-03E Module Descriptions
NUMBER NAME DESCRIPTION
1
2
3
4
5
6
7
Dual
Ethernet
Ports
HardReboot
Button
Network
Reset
Button
Local
Display
Display
Buttons
Remote
Sensor Port
Proprietary
Connectivity
The dual ethernet ports act as a two-port ethernet switch, allowing for multiple devices to be daisychained.
Pressingthe hard-reboot button reboots the IMD. Thisacts asa power-cycle for the IMD; it does not
change or remove any user information.
Holding the network-reset button for 5 seconds during normal operationwillrestore the default IP
address and reset the user accounts.
The localdisplayshows the phase, line and circuit current values (in amperes).
There are 3 buttons near the IMD display; aback button, a forward button anda center button. The
functions ofthese buttons are described in DisplayButton Functions on page 22.
RJ-12 port for connectingVertiv™ plug-and-playremote digital sensors (sold separately). Each digital
sensor has a unique serialnumber and is automaticallydiscovered. GU2 PDUs support up to 16 sensors.
The optional Vertiv™ A2D Converter can be added to support analog sensing. The optionalSN-Adapter
can be added to support Liebert®Integrated andModular Sensors. For more information, see Available
Sensors on page 72
RJ-45 port for future expansion.
3.1.3 Enhanced Monitored with RS-232 (IMD-03E-S)
All Vertiv™ Geist™ Unit Level Monitoring rPDUs ship with the IMD-03E-S module. This module provides all
of the same features as the IMD-03E, with the addition of a RS232 serial port using RJ-45.
Figure 3.3 IMD-03E-S Module Descriptions
3 Setup
23
Page 28

Table 3.4 IMD-03E-S Module Descriptions
NUMBER NAME DESCRIPTION
Dual
1
Ethernet
Ports
The dual ethernet ports act as a two-port ethernet switch, allowing for multiple devices to be daisy- chained.
Hard-
2
Reboot
Button
Network
3
Reset
Button
Local
4
Display
Display
5
Buttons
Remote
6
Sensor
Port
Serial
7
Port
USB
8
Port
Pressingthe hard-reboot button reboots the IMD. Thisacts asa power-cycle for the IMD; it does not
change or remove any user information.
Holding the network-reset button for 5 seconds during normal operationwillrestore the default IP address
andreset the user accounts.
The localdisplayshows the phase, line and circuit current values (in amperes).
There are three buttons near the IMD display: a back button, a forward button and a center button. The
functions ofthese buttons are described in the DisplayButton Functions onpage 22.
RJ-12 port for connectinga Vertiv™ plug-and-playremote digital sensors (sold separately). Each digital
sensor has a unique serialnumber and is automaticallydiscovered. GU2 PDUs support up to 16 sensors. The
optionalVertiv™ A2D Converter canbe added to support analog sensing.The optionalSN-ADAPTER canbe
added to support Liebert®Integrated andModular Sensors. For more information, see Available Sensors on
page 72..
RS-232 viaRJ-45 port.
USB port used to uploadfirmware, backup/restore device configuration or expandlogging capacity viaUSB
storage device. Provides upto 500mA power capacityfor USB- connected devices.
3.1.4 Rapid Spanning Tree Protocol (RSTP)
Upgradable monitored devices, built with the IMD-03E, include two ethernet ports that work together as
an internal ethernet bridge. One of these ports can be used to connect the IMD to an existing network or
both ports can be used at the same time to connect one IMD to another in a daisy-chain configuration.
When both network interfaces are connected, the IMD implements a network bridging protocol called the
Rapid Spanning Tree Protocol (RSTP). RSTP is an IEEE standard that is implemented by all managed
bridges. Using RSTP, bridges in the network exchange information to find redundant paths or loops.
When a loop is detected, the bridges in the network work together to temporarily disable the redundant
paths. This allows the network to avoid broadcast storms caused by the loops. In addition, RSTP regularly
checks for changes in the network topology. When a connection is lost, RSTP allows the bridges to quickly
switch to a redundant path.
NOTE: RSTP imposes a limit of 40 links between bridges, including IMDs.
24
Vertiv™ | Intelligent Rack PDU Installer/User Guide
Page 29

3.2 Network Setup
The Upgradeable IMD has a default IP address for initial setup and access. Once you have assigned an IP
address, the default IP address is no longer active.
To restore the default IP address and reset all user-account information:
If the user-assigned address or passwords are lost or forgotten, press and hold the network reset button
located below the Ethernet Port for 15 seconds. Holding the center button of the LED display for 10
seconds also resets the network and user account information.
The Network Page, located under the
System Tab
, allows you to assign the network properties manually
or to use DHCP to connect to your network. Access to the unit requires the IP address to be known. Use of
a static IP or a reserved DHCP is recommended. The default address is displayed on the front of the unit.
• IPAddress:
• Subnet Mask:
• Gateway:
192.168.123.123
255.255.255.0
192.168.123.1
To access the unit for the first time, you must temporarily change your computer's network settings to
match the
192.168.123. xxx
subnet. To setup the unit, connect it to your computer's Ethernet Port, then
follow the appropriate instructions for your computer's operating system.
To set up the network for a Windows operating system:
1. Access the network settings for your operating system.
• Using Microsoft Windows 2000, XP or Server 2003, click
• Using Microsoft Windows 7 or Server 2008, click
Start>Control Panel >Adjust your Computer's
Settings >View Network Status and Tasks>Change Adapter Settings or
Start >Settings >Network Connections.
click
Start>Settings>Control Panel>Network and Sharing Center>Change Adapter Settings.
• Using Microsoft Windows 8 or Server 2012, move the mouse to the bottom or top right corner,
click
Settings - Control Panel - Large or Small Icons - Network and Sharing Center>Change
Adapter Settings.
• Using Microsoft Windows 10, click
Start >Network and InternetC>hange Adapter Settings
2. Locate the entry under LAN, High-Speed Internet or Local Area Connection that corresponds to
the Network Card (NIC). Double-click on the network adapter's entry in the Network Connections
list.
3 Setup
NOTE: Most computers will have a single Ethernet NIC installed, but a WiFi or 3G adapter also shows as
a NIC in this list. Be sure to choose the correct entry.
25
Page 30

3. Click
Properties
to open the Local Properties window.
Figure 3.4 Local Area Connection Properties
4. Select
Internet Protocol Version 4 (TCP/IPv4)
from the list, then click
Properties.
NOTE: If you see more than one TCP/IP entry, as in the example above, the computer may be
configured for IPv6 support as wellas IPv4; make sure to select the entry for the IPv4 protocol. Write
down the current NIC card settings so you can restore them to normal after you have completed the
setup procedure.
26
Vertiv™ | Intelligent Rack PDU Installer/User Guide
Page 31

Figure 3.5 Internet Protocol Version 4
5. Choose
255.255.255.0
OK - OK
6. In a web browser, enter
Use the following IP address
, set IP address to
192.168.123.1
and Subnet Mask to
. For initial setup, Default Gateway and the DNS Server entries can be left blank. Select
to close both the Internet Protocol Properties and Local Properties windows.
http://192.168.123.123
to access the unit. If you are setting up the unit for the
first time, the unit requires you to create an Admin account and password before you can proceed.
7. After the Admin account is created, log in to the unit.
8. By default, the default sensors page is displayed. Navigate to the
Page
to configure the device's network properties. The unit's IP address, Subnet Mask, Gateway
System Tab
, then the
Network
and DNS settings can either be assigned manually or acquired via DHCP.
9. Click
Save.
NOTE: After the changes are saved, the browser will no longer be able to reload the web page from the
192.168.123.123
address and displays a
Page not FoundorHost Unavailable
message; this is normal.
After you are finished configuring the unit's IP address, repeat the steps above changing the
computer's Ethernet NIC card settings to the ones you wrote down prior to changing them.
3 Setup
27
Page 32

To set up the network for a MAC:
1. Click the
System Preferences
Figure 3.6 MAC System Preferences
icon on the Dock and choose
Network
.
2. Ensure ETHERNET is highlighted on the left side of the NIC window. In most cases, there will be one
ETHERNET entry on a Mac. Write down the current settings so you can restore them to normal
after you have completed the setup procedure.
3. Select
Manually
Subnet Mask to
from the Configure IPv4 drop-down list, then set IP Address to
255.255.255.0
and click
Apply
.
192.168.123.1
and
NOTE: The Router and DNS Server settings can be left blank for this initial setup. In a web browser,
enter
http://192.168.123.123
to access the unit. If you are setting up the unit for the first time, the unit
requires you to create an Admin account and password before you can proceed.
4. After the Admin account is created, log in to the unit.
28
Vertiv™ | Intelligent Rack PDU Installer/User Guide
Page 33

5. By default, the default sensors page is displayed. Navigate to the
System Tab
, then the
Network
page to configure the device's network properties. The unit's IP address, Subnet Mask, Gateway
and DNS settings can either be assigned manually or acquired via DHCP.
6. Click
Save.
NOTE: After the changes are saved, the browser will no longer be able to reload the web page from the
192.168.123.123
address and displays
Page not FoundorHost Unavailable
message; this is normal. After
you are finished configuring the unit's IP address, repeat the steps above changing the computer's
Ethernet NIC card settings to the ones you wrote down prior to changing them.
3.3 Web Interface
The Upgradeable Monitored units come with an embedded web interface. The unit is accessible via a
standard, unencrypted HTTP connection or via an encrypted HTTPS (TLS) connection.
NOTE: An administrator account (username and password) must be created when logging in the
device the first time.
3.3.1 Home Page
The Home Page gives both current and historical views of the unit’s data. Real-time readings are provided
for all rPDU data and individual circuits' data.
Figure 3.7 Home Page
3 Setup
29
Page 34

Table 3.5 Home Page Descriptions
NUMBER NAME DESCRIPTION
Sensors, System
1
andHelp Tab
2 Log In/Log Out
Alarms and
3
Warnings
4 Device ID Unique product identification and cannot be changed. May be required for technical support.
Mouseover to show submenus: Sensors, System andHelp.
Click to
Log InorLog Out
NOTE: Both username and password are case sensitive and no spaces are allowed.
Prohibited characters for username are: $&`:<>[ ] { }"+%@/ ; =?\^|~',
Indicates the number ofalarms and warnings currentlyoccurring, if any.
of the unit.
Total and Individual
5
Phase Monitor
6 Current Monitor Displays AC current draw statistics for each individualcircuit on the rPDU.
7 Operation Icon Modifysettings.
8 Configuration Icon Modifylabel name.
9 Device Label Displays the user-assigned label ofthis unit.
10 Vertiv™ Logo Clicking on this logo from any page will reload the home page.
Displays AC current, voltage and power statistics for each individual phase and for the totalof all
phases combined.
3.3.2 Sensors Tab
Click the
down menu.
Sensors Tab
to access the
Overview,Alarms
and
Warnings
and
Logging
page from the drop-
Overview
You must log in before making any changes. Only users with Control level or higher authorization have
access to these settings.
To change a device label:
1. Click the
name or model and cannot be changed.
2. Click
Configuration
Save.
icon for the rPDU and change the label. The Name is the rPDU's factory
30
To change device operation:
1. Click the
Operation
icon.
2. Select the operation to perform:
• Cancel - cancels the current operation if it has not been completed.
• Reset Energy - resets the total energy measured in kWh.
• Restore Defaults - restores device settings to their factory default. This includes Labels, Delays
and Power-on Actions for the device.
NOTE: These actions affect the entire device.
3. Select
Submit
to issue the action.
Vertiv™ | Intelligent Rack PDU Installer/User Guide
Page 35

To change a Phase or circuit label:
1. Click the
Configuration
phase or circuit name and cannot be changed.
2. Click
Save.
To change phase operation:
1. Click the
2. Select
3. Select
Operation
Reset Energy
Submit
to issue the action.
icon for the phase or circuit and change the label. The Name is the physical
icon.
- to reset the total Energy measured in kWh for the selected phase.
3 Setup
31
Page 36

Alarms and Warnings
The Alarms and Warnings page allows you to establish alarm or warning conditions (events) for each
power and circuit reading. Events are triggered when a measurement exceeds a user-defined threshold,
either going above the threshold (high-trip) or below it (low-trip). Events are displayed in different
sections, based on the device or measurement the event is associated with. Each event can have one or
more actions to be taken when the event occurs.
Figure 3.8 Alarms and Warnings Page
Table 3.6 Alarms and Warnings Descriptions
NUMBER DESCRIPTION SYMBOL DESCRIPTION
Warning symbol. Event is displayed in orange.
1
2
3
4 Displays the conditions for the alarms and warnings settings.
Status of each
event.
Add/Delete/Modify
alarms and
warnings.
N/A Empty, ifthere is noalert condition.
Notify user of
tripped Events and
request
acknowledgment.
Alarm symbol. Alarm is displayed in red.
Acknowledged event symbol. Symbolremains until the condition measured
returns to normal.
Add new alarms and warnings.
Modifyexisting alarms and warnings.
Delete existing alarms and warnings.
When a warningor alarm event occurs, you can click on thissymbolto
acknowledge the event and stop the unit from sendinganymore notifications
about it.
NOTE: Clicking this symbol does not clear the warning or alarm event - it just
stops the notifications from repeating.
32
Vertiv™ | Intelligent Rack PDU Installer/User Guide
Page 37

To add a new Alarm or Warning Event:
1. Click the
Add/Modify
alarms and warnings button.
2. Set the desired conditions for this event as follows:
a. From the drop-down lists, select the name of the phase or circuit, the trigger measurement, the
severity and the type.
NOTE: High trips if the measurement goes above the threshold and low trips if the measurement goes
below the threshold.
b. Enter the desired
c. Enter the desired
Threshold Value
Clear Delay
time in seconds. Any value other than0means once this event is
(any number between
-999.0
through
999.0
).
tripped, the measurement must return to normal for this many seconds before the event will
clear and reset. Clear Delay can be up to 14,400 seconds (4 hours).
d. Enter the desired
Trip Delay
time in seconds. Any value other than0means that the
measurement must exceed the threshold for this many seconds before the Event will be
tripped. Trip Delay can be up to 14,400 seconds (4 hours).
e. Latching Mode, if enabled, this event and its associated actions remain active until the event is
acknowledged, even if the measurement subsequently returns to normal.
f. To specify where the alert notifications are sent when this alarm or warning event occurs, click
the
Add
icon to create a new action.
g. Select the desired options from the drop-down menu:
• Target is the email address or SNMP manager, where the notifications are sent when the
event is tripped. For more information on configuring a target email address see Email on
page 48.
NOTE: Target Delays and Repeats are shared across all alarms. If multiple delay or repeat values are
needed for specific targets, each one must be added to the target list and then the appropriate Enabled
box checked on each alarm.
• Delay determines how long this Event must remain tripped for before this Action's first
notification is sent. This is different from the Trip Delay above. Trip Delay determines how
long the threshold value has to be exceeded before the Event itself is tripped. This delay
determines how long the Event must remain tripped before this Action occurs. Delay can
be up to 14,400 seconds (4 hours). A Delay of0will send the notification immediately.
• Repeat determines whether multiple notifications will be sent for this Event Action. Repeat
notifications are sent at the specified intervals until the Event is acknowledged or until the
Event is cleared and reset. The Repeat interval can be up to 14,400 seconds (4 hours). A
Repeat of0disables this feature and only one notification will be sent.
3. Click
Save
to save this notification action.
NOTE: More than one action can be set for an alarm or warning; to add multiple actions, just click the
Add
icon again and set each one as desired. Each alert can have up to 32 Actions associated with it.
3 Setup
33
Page 38

To change an existing alarm or warning event:
1. Click the
2. Modify the settings as needed and click
Modify
icon next to the alarm or warning event you wish to change.
Save
.
3. After an action is added, it has a checkbox in the enabled column at the far left. By default when an
action is added it is is unchecked (disabled). Click the checkbox to enable it. This allows you to
selectively turn different actionsOnand
Off
for testing.
To delete an existing alarm or warning event:
1. Click the
2. Click
Delete
Delete
icon next to the alarm or warning event you wish to remove.
and
Save
to confirm.
Logging
The Logging page allows you to access the historical data recorded by the rPDU by selecting the desired
sensors and time range to be logged. The Logging page permits selecting all or selecting none. To do so,
click on the drop-down, choose
Figure 3.9 Logging Page
Select AllorSelect None
and click on the appropriate check mark.
34
Vertiv™ | Intelligent Rack PDU Installer/User Guide
Page 39

Table 3.7 Logging Page Descriptions
NUMBER NAME DESCRIPTION
Clicking the
1 Data log download
2 Loginterval
3 Clear log data Delete the log file.
4 Select All/Select None
5 Logging
Clicking the
spreadsheet software.
The frequency at which data is written to the log file. The logging interval
can be 1-600 minutes with the default setting being 15 minutes.
Click on drop-down menu, select
the check mark.
Click measurement value to select or deselect desired logging
parameters. By default, allmeasurements are selected. Press
changes.
JSON
link downloads the data log in
CSV
downloads the datalog in
JSON
format.
CSV
format for use in
Select AllorSelect None
andclick on
Save
to save
NOTE: The maximum loggable time frame is determined by number of measurements being logged and
the interval at which data is written to the log file.
3.3.3 System Tab
NOTE: You must be logged in as Admin to modify settings in the
System Tab
.
Users Account Page
The Users Account Page in the System menu allows you to manage or restrict access to the unit's
features by creating accounts for different users.
Figure 3.10 User Account Page
Table 3.8 User Account Page Descriptions
NUMBER DESCRIPTIONS
1 Addnew user account.
2 Modifyuser account.
3 Delete user account.
NOTE: Only an Administrator-level account can add, modify or delete users. Control-level and Viewonly accounts can change their own passwords using the Modify User icon, but cannot add or delete
accounts or modify other accounts. The Guest account cannot add, delete or modify any account, not
even itself.
3 Setup
35
Page 40

To add or modify a user account:
1. Click the
AddorModify User
icon.
2. Create or modify the account information as needed.
a. Username: The name of the account. User names may be up to 24 characters long, are case-
sensitive and may not contain spaces or any of these prohibited characters: $&`:<>[ ] { }"+%@/ ;
=?\^|~',
NOTE: A username cannot be changed after the account is created.
b. Administrator: If set to
True
, this account has Administrator-level access to the unit and can
change any setting.
c. Control: If set to True, this account has Control-level access. Setting Administrator to
automatically set Control to
True
as well. Setting this to
False
makes the account a View-only
True
account.
d. New Password: Account password may be up to 24 characters long, are case-sensitive and may
not contain spaces.
e. Account Status: Set the account to
EnabledorDisabled
. Disabling an account prevents it from
being used to log in, but does not delete it from the account list.
3. Click
Save
.
User Account Types
• Administrator: Administrator accounts (accounts with both administrator and control authority set
to
True
, as above) have full control over all available functions and settings on the device, including
the ability to modify system settings and add, modify or delete other users' accounts.
will
• Control: Control accounts (accounts with only control set to
True
) have control over all settings
pertaining to the device's sensors. They can add, modify or delete alarms and warning events and
notification actions and can change the names or labels of the device and its sensors. Control
accounts cannot modify system settings or make changes to other users' accounts.
• Enabled: If both administrator and control are set to
False
, the account is an Enabled account, which
is View-only. The only changes, an Enabled account is permitted to make are changing their own
account's password and changing the preferred language for their own account. Enabled accounts
cannot change any device or system settings.
• Guest: Any user that views the unit's web page without logging in is automatically viewing the unit as
Guest. By default, the Guest account is a View-only account and cannot make changes to any
settings, although the administrator can elevate the Guest account to control-level access if desired,
allowing anyone to make changes to names, labels, alarm events and notifications without logging in.
The Guest account cannot be deleted but can be disabled to require log in for viewing system
status.
To change a user password:
1. Log in to your account.
2. Click your
3. Enter a new password and click
Username
in the top right corner of the page.
Save
.
36
Vertiv™ | Intelligent Rack PDU Installer/User Guide
Page 41

Figure 3.11 Change User Password Page
Network
The unit’s network configuration is set on the
Network
tab of the System menu. Settings pertaining to the
unit’s network connection are:
• Hostname: The hostname may be used as a method for device identification on the network.
• Protocol: Click on the IPv6 drop-down menu, select
EnabledorDisabled
and click on
Save
.
• Interfaces: Used to configure the IP address of the rPDU, enable/disable DHCP and to view Link State
and Uptime. The device supports up to eight user-configured IP address entries.
• Ports: Used to view and/or modify Ethernet port settings and RSTP status of each port on the rPDU.
• Routes: Displays configured routes and is where you will set your Gateway address for the rPDU.
Default routes are distinguished by a
destinationof0.0.0.0or"::"
, with a Prefix of0and Interface of
Only one default route can exist for IPv4 and one for IPv6.
• DNS: Allows the unit to resolve host names for email,
• Bridge Priority: Click on the Bridge Priority drop-down menu, select
NTP
and
SNMP
servers.
Value
and click on
Save
.
all
.
3 Setup
37
Page 42

Figure 3.12 Network Configuration Page
38
Vertiv™ | Intelligent Rack PDU Installer/User Guide
Page 43

To edit the interfaces parameters:
1. Click the
Modify
icon
2. Modify desired fields.
a. Label b. Enable -
Change
the desired name of the selected interface.
Enable/Disable
the selected interface. If only one interface is available, disabling the
interface restricts access to the device requiring a network reset.
c. DHCP -
3. Click
NOTE: Any changes made to the network interface settings take effect once the
Enable/Disable
Save
.
DHCP on the selected interface.
Save
button is
clicked. If you have changed the IP address, it will appear as if the unit is no longer responding because
the browser will not be able to reload the web page. Close the browser window, type the new IP address
into the browser's address bar and the unit will be accessible.
To add a new IP Address:
1. Click the
2. Enter the
Add
icon.
IPv4orIPv6
Address and Prefix/Subnet Mask into appropriate fields. Up to 8 IP
addresses can be statically assigned.
3. Click
Save
.
To modify an existing IP Address:
1. Click the
Modify
icon.
2. Edit the IP address and Prefix/Subnet Mask fields as needed.
3. Click
Save
.
To modify port settings:
1. Click the
Modify
icon.
2. Enter the appropriate information.
a. Change port label if desired.
b. Enable/Disable port.
c. Assign STP cost. This designates this interface's contribution to the root path cost, when it
serves as the root port.
3. Click
Save
.
To add a new route:
1. Click the
Add
icon.
2. Enter the appropriate information.
a. Destination IP address for desired route.
b. Enter Prefix for desired route
c. Enter Gateway IP address.
d. Select Interface that route applies.
3. Click
Save
.
3 Setup
39
Page 44

To modify an existing route:
1. Click the
Modify
icon.
2. Edit the desired fields.
3. Click
Save
.
To add a new DNS Server Address:
1. Click the
Add
icon.
2. Enter the IP of the desired DNS server. Up to two DNS servers can be added.
3. Click
Save
.
To modify an existing DNS Server Address:
1. Click the
Modify
icon.
2. Edit the DNS Server Address field as required.
3. Click
Save
.
To change RSTP settings:
1. Change the settings, as desired.
a. Enable: Enable or Disable RSTP protocol
b. Mode: RSTP mode supports falling back to STP when necessary.
c. Click on the
Bridge Priority drop-down
menu, select the appropriate Value and click on
d. Max Hops: Used when mode enabled to RSTP.
e. Hello Time: The interval, in seconds, between periodic transmissions of configuration messages
by designated ports.
f. Max Age: The maximum age, in seconds, of the information transmitted by this interface, when
it serves as the root bridge. Set at 2 seconds.
g. Forward Delay: The delay, in seconds, used by bridges to transition the root bridge and
designated ports into forwarding mode. Set at 21 seconds
2. Click
Save
.
Save
.
40
Web Server
The unit’s Web Server configuration can be updated on the
• HTTP Interface: Enables/disables access via HTTP. HTTPS interface is always enabled. Available
options are, enabled or disabled. It is not possible to disable the web interface completely.
• HTTP/HTTPS Server Port: Allows you to change the TCP ports which the HTTP and HTTPS
services listen to for incoming connections. The defaults are port 80 for HTTP and 443 for HTTPS.
Web Server
tab of the System menu.
Vertiv™ | Intelligent Rack PDU Installer/User Guide
Page 45

Figure 3.13 HTTP Configuration Page
• SSL Certificate: Allows uploading your own signed SSL Certificate file to replace the default one. The
certificate can be either self-signed or signed from a Certification Authority. Certificate must be in
either
PEMorPFX
(PKCS12) format.
Figure 3.14 Secure Sockets Layer Certificate (SSLC)
• PEM Format
• The public certificate and private key must reside in the same file.
• The certificate must follow standard x.509.
• The private key must be generated with the
• The
•
PFX
combination of a
PEM RSA
private key may be password secured.
Format - Support is also available for the PKCS12 standard (.pfx) which is a binary encrypted
PEM
public certificate and its
RSA
algorithm and in
PEM
private key. When generating a
PEM
format.
you are prompted for an optional password.
Reports
The Reports page allows you to schedule the device to send recurring status reports.
NOTE: SMTP email must be set-up on the device via the emailpage.
To Add or Modify a scheduled report:
1. Click the
2. Select the Days the report is to be sent.
3. Select the time of the day to Start sending reports.
4. Set the interval (in hours).
5. Select the Target email address for the reports to be sent.
6. ClickOKto save changes.
AddorModify
icon.
PFX
certificate
3 Setup
41
Page 46

To Delete a scheduled Report:
1. Click on the
Delete
icon next to the report to delete.
2. ClickOKon the pop-up window to confirm.
Remote Authentication
The Remote Authentication page allows you to designate one of three authentication protocols for
remote access to the device. By default, the device uses the local database to authenticate users. Remote
authentication allows the device to authenticate a user with a remote server. If remote authentication fails,
it will revert to local authentication.
To change Remote Authentication settings:
Select the mode from the drop-down menu.
• Disabled - Local Authentication
• LDAP - Lightweight Directory Access Protocol
• TACACS+ - Terminal Access Controller Access Control System Plus
• RADIUS - Remote Authentication Dial-In User Service
LDAP
The Lightweight Directory Access Protocol (LDAP) can be set up through this menu.
NOTE: Knowledge of your LDAP server settings is required to set up the Geist™ rPDU device for this
remote authentication protocol. If you are not familiar with these settings, consult your LDAP server
administrator.
Configuration for remote authentication using LDAP.
• LDAP Server Address: Specify the host address for LDAP. The
address in brackets (e.g.,
[2001:0DB8:AC10:FE01::]
) or a host name.
HOST
can be an IPv4 address, an IPv6
• LDAP Server Port: Used to set the LDAP port number. The default port for LDAP is 389 - use for
Security Type
• LDAP Mode: From drop-down menu, select
• Security Type: From drop-down menu, select
NoneorStartTLS
. Use 636 for Security Type
Active DirectoryorOpenLDAP.
None,SSLorStartTLS
SSL
• Bind DN: Distinguished Name used to bind to the directory server. Blank string for Bind DN and
Password implies anonymous bind.
• Bind Password: Password used to bind to the directory server.
• Base DN: DN to use for the search base.
42
Vertiv™ | Intelligent Rack PDU Installer/User Guide
Page 47

The remaining fields come from the NIS schema, defined in RFC2307. They are used to authenticate users
in LDAP. Leaving them blank will use the default value.
• User Filter: LDAP filter for selecting users.
• "uid" Mapping: Name of the server attribute that corresponds to the
• "uidNumber" Mapping: Name of the server attribute that corresponds to the
uid
attribute in the schema.
uidNumber
attribute in
the schema.
• Group Filter: LDAP filter for selecting groups.
• "gid" Mapping: Name of the server attribute that corresponds to the
• "memberUid" Mapping: Name of the server attribute that corresponds to the
gid
attribute in the schema.
memberUid
attribute in
the schema.
• Enabled Group: Users in this group have view-only privileges as described in the Users section of this
manual.
• Control Group: Users in this group have control privileges as described in the Users section of this
manual.
• Admin Group: Users in this group have admin privileges as described in the Users section of this
manual. LDAP users do not count toward minimum number of required Admin users.
Click
Save
.
The Enabled Group, Control Group and Admin Group fields tell how to map groups to user permissions. A
user must belong to one of these groups to access the device. If a user belongs to more than one group,
then the group with the highest permission is used.
Figure 3.15 LDAP Menu
3 Setup
43
Page 48

TACACS+
The Terminal Access Controller Access-Control Plus Protocol (TACACS+) can be set up through this
menu.
NOTE: Knowledge of your TACACS+ server settings is required to set up the Geist™ rPDU device for
this remote authentication protocol. If you are not familiar with these settings, consult your TACACS+
server administrator.
Configuration for remote authentication using TACACS+.
Figure 3.16 TACACS+ Menu
• Primary Authentication Server: The primary authentication/authorization server, which can be an
IPv4 address, an IPv6 address in square brackets (e.g.,
[2001:0DB8:AC10:FE01::]
) or a host name. The
Primary Authentication Server is used for both authentication and authorization. This AA server
address/host name is required..
• Alternate Authentication Server: The alternate authentication/authorization server, which can be an
IPv4 address, an IPv6 address in square brackets or a host name. The Secondary Authentication
Server is used for both authentication and authorization.
• Primary Accounting Server: The primary accounting server, which can be an IPv4 address, an IPv6
address in square brackets or a host name. The Primary Accounting Server is optional. If configured,
the server is notified when a user is authorized.
• Alternate Accounting Server: The alternate accounting server, which can be an IPv4 address, an
IPv6 address in square brackets or a host name. The Secondary Accounting Server is optional. If
configured, the server is notified when a user is authorized.
• Shared Secret: The secret shared by client and server. The Shared Secret is required.
• Service: The value to use for the service field in TACACS+ requests. Valid options are
PPP
and
raccess
• Admin Attribute: A user with this attribute will have
admin
privileges as described in the Users
section of this manual. TACACS+ users do not count toward minimum number of required admin
users.
• Control Attribute: Users with this attribute will have control privileges as described in the Users
section of this manual.
44
Vertiv™ | Intelligent Rack PDU Installer/User Guide
Page 49

• Enabled Attribute: Users with this attribute will have view-only privileges as described in the Users
section of this manual.
• Click
Save.
NOTE: The Attribute-Value Pairs (AVPs) returned by the server during authentication/authorization
determine the user permissions. The Group Attribute field tells the system which AVP contains the
user’s access group. If the AVP value matches the Admin Group field, then the user has Admin (full)
access. If the AVP value matches the Control Group field, the user has control access. If the AVP
matches the Enabled Group field, the user has view-only access. If no matches are found, then the user
will not have access to the unit. A blank Group field will not match any AVPs.
RADIUS
The Remote Authentication Dial-In User Service Protocol (RADIUS) can be set up through this menu.
NOTE: Knowledge of your RADIUS server settings is required to set up the Geist™ rPDU device for this
remote authentication protocol. If you are not familiar with these settings, consult your RADIUS server
administrator.
Configuration for remote authentication using RADIUS.
Figure 3.17 RADIUS Menu
3 Setup
• Primary Authentication Server: Enter the IP address of the primary
authentication/authorization/accounting server. The Primary Authentication Server can be an IPv4
address, an IPv6 address in square brackets
(e.g.,
[2001:0DB8:AC10:FE01::]
) or a host name. The Primary Authentication Server is used for
authentication, authorization and accounting. This AA server is required.
• Alternate Authentication Server: If applicable, enter the IP address of the alternate
authentication/authorization/accounting server. The Alternate Authentication Server can be an
IPv4 address, an IPv6 address in square brackets (e.g.
[2001:0DB8:AC10:FE01::]
) or a host name. The
Secondary Authentication Server is used for authentication, authorization and accounting.
• Shared Secret: Enter a secret word or passphrase in the Shared Secret field (applies to both primary
and secondary authentication and accounting servers). The Shared Secret is required.
• Group Attribute: Identifies the Attribute-Value Pair (AVP) that tells which access group the user
belongs to. Valid values are
filter-id
and
management-privilege-level.
• Admin Group: A user belonging to this group has Admin privileges as described in the Users section
of the manual.
45
Page 50

• Control Group: A user belonging to this group has Control privileges as described in the Users
section of the manual.
• Enabled Group: A user belonging to this group has Enabled (view-only) privileges as described in the
Users section of the manual.
• Click
Save.
NOTE: The Attribute-Value Pairs (AVPs) returned by the server during authentication/authorization
determine the user permissions. The Group Attribute field tells the system which AVP contains the
user’s access group. If the AVP value matches the Admin Group field, then the user has Admin (full)
Access. If the AVP value matches the Control Group field, the user has Control access. If the AVP
matches the Enabled Group field, the user has view-only access. If no matches are found, then the user
will not have access to the unit. A blank Group field will not match any AVPs.
Display
The unit's display configuration can be changed via the Display tab of the System menu. Settings
pertaining to the unit’s display are:
• Display Mode: Sets the unit to display current or total power (displayed as kW) on the local LED
display.
• VLC: Allows user to enable or disable VLC mode from GUI (default is disabled).
Figure 3.18 Display Mode/VLC Configuration Page
Time
The unit's time and date are set on this page.
Figure 3.19 Time Configuration Page
46
Vertiv™ | Intelligent Rack PDU Installer/User Guide
Page 51

There are two mode available: Network Time Protocol (NTP) and Manual.
• NTP synchronizes the unit's time and date to the specified time zone using listed NTP Servers. NTP
servers can be reconfigured.
• In Manual mode, the date and time must be typed as indicated on the left of the field.
SSH
The SSH menu allows you to configure settings for SSH access to the device.
Figure 3.20 SSH Configuration Page
• SSH Access: Enables/disables access via SSH.
• SSH Port: Allows you to change the port which the SSH service listen to for incoming connections.
The default is Port 22.
USB
The USB menu allows you to configure settings for the USB port on the unit.
• USB : Enables/disables port.
Serial Port
The Serial Port menu allows configuring settings for the serial port, enabling or disabling the port and
setting the baud rate.
1. Click on the Serial Port drop-down menu, select
2. Click on the Baud Rate drop-down menu, select the
3. Click on
Save
.
Figure 3.21 System drop down, menu – Serial Port
EnabledorDisabled
Baud Rate
value.
.
3 Setup
47
Page 52

Email
The unit is capable of sending email notifications to up to 10 email addresses when an alarm or warning
event occurs.
Figure 3.22 Email Configuration Page
Table 3.9 EmailConfiguration Page Descriptions
NUMBER DESCRIPTION
1 Add new target emailaddress
2 Modifyexisting target emailaddress
3 Delete existing target emailaddress
4 Send test email
To send emails, the unit must be configured to access the mail server, as follows:
• SMTP Server: The name or IP address of a suitable SMTP or ESMTP server.
• Port: The TCP port which the SMTP Server uses to provide mail services. Typical values would be
Port 25 for an unencrypted connection or 465 and 587 for a TLS/SSL-encrypted connection, but
these may vary depending on the mail server's configuration.
• From Email Address: The address which the unit's emails appear to come from. Many hosted email
services, such as Gmail, require this to be the email account of a valid user.
• Username and Password: The login credentials for the email server. If your server does not require
authentication (open relay), these can be left blank.
Microsoft Exchange servers must be set to allow SMTP relay from the IP address of the unit. In addition,
the Exchange server must be set to allow Basic Authentication, so the unit is able to log in with the AUTH
LOGIN method of sending its login credentials. Other methods, such as AUTH PLAIN and AUTH MD5 are
not supported.
48
Vertiv™ | Intelligent Rack PDU Installer/User Guide
Page 53

To add or modify a target email address:
1. Click the
2. Enter the email address and then click
AddorModify
icon.
Save
.
To delete a target email address:
1. Click the
2. Click
Delete
Delete
icon next to the address you wish to delete.
on the pop-up window to confirm.
To send a test email:
1. Click the
Test email
icon next to the address you wish to test.
2. A pop-up window indicates the test email is being sent, clickOKto dismiss the pop-up.
SNMP
Simple Network Management Protocol (SNMP) can be used to monitor the unit's measurements and
status, if desired. SNMP V1, V2c and V3 are supported. In addition, alarm traps can be sent to up to two IP
addresses.
Click on
Figure 3.23 SNMP Configuration Page
ZIP
to download the
mib.zip
file containing both the MIB file and the CSV-formatted spreadsheet.
3 Setup
The SNMP-V1/V2c and SNMP-V3 Service can be enabled or disabled independently . The service listens
for data-read requests on Port 161, which is the usual default for SNMP services; this can also be changed.
The Management Information Base (MIB) can be downloaded from the unit, if needed, via the MIB link at
the top of the web page. Clicking this link downloads a
.zip
archive containing both the MIB file itself and a
CSV-formatted spreadsheet describing the available OIDs in a human-readable form to assist you in
setting up your SNMP manager to read data from the unit.
49
Page 54

Figure 3.24 SNMP Users Configuration Page
The Users section allow configuring the various Read, Write and Trap communities for SNMP services.
You can also configure the authentication types and encryption methods used for the SNMP V3 if
desired. Click the
Modify
icon to change settings.
Traps allow defining the SNMP types that you wish to be sent and the IPaddress of the recipients.
To configure a trap destination:
1. Locate the
Traps
section of the SNMP page and click the
Add
icon.
2. Enter the IP address where the trap should be sent to in the Host field.
3. Change the Port number if required.
4. Select the trap version to be used (V1, V2c or V3) and click
A test trap may be sent by clicking on the
update/change the Trap settings. Click the
Test
icon next to the Host IP address. You can also
Modify
icon next to the Host IP address.
Save
.
SYSLOG
Syslog data can be captured remotely but must first be set up and enabled using the Syslog page.
NOTE: This function is primarily useful for diagnostic purposes and should be left disabled unless
advised to enable it by Vertiv™technical support for troubleshooting a specific issue.
Admin
The Admin page allows the administrator of the device to save their contact information along with the
device description and location. Once the information is saved by an administrator, other (nonadministrator) users can view the information. Also, the System Label can be modified on this page. This
label is typically shown in the title bar of the web browser's window and/or on the browser tab(s) currently
viewing the device.
Locale
50
The Locale page sets the default language and temperature units for the device. These settings will
become the default viewing options for the device, although individual users can change these options for
their own accounts. The guest account will only be able to view the device with the options set here.
Vertiv™ | Intelligent Rack PDU Installer/User Guide
Page 55

Utilities
The Utilities page in the System menu provides the ability to restore defaults, reboot the communication
system and perform firmware updates.
The Restore Defaults section permits restoring the unit's settings to the factory defaults. There are two
options:
• All Settings: Erases all of the unit's settings, including all network and user accounts settings,
effectively reverting the entire unit back to its original out-of-the-box state.
• All Non-Network Settings: Erases all settings except the Network and User Accounts.
The Reboot section allows the user to perform a system reboot. This function will not affect power delivery
to connected equipment. Use the Firmware Update section to load firmware updates into the unit.
Firmware updates, when available, can be found on the Vertiv™ website:
Vertiv.com/Firmware-Support
.
You can also subscribe to a mailing list, to be notified of when firmware updates become available.
Firmware updates typically come in a
package itself, a copy of the SNMP MIB, a
.zip
archive file containing several files including the firmware
readme
text file explaining how to install the firmware and
various other support files as needed. Be sure to unzip the archive and follow the included instructions.
NOTE: Firmware updates can be performed via HTTP interface only. Updates over the HTTPS interface
are not currently supported.
To update firmware via a USB flash drive:
1. Download latest firmware from
distribution/geist-upgradeable-series-v5-firmware/
https://www.vertiv.com/en-us/support/software-download/power-
and unzip the folder.
2. Get a USB flash drive and format it as FAT32.
3. Create a directory on the USB flash drive called
4. Open the unzipped firmware folder and copy the
5. Paste this file into the
FIRMWARE
folder on the flash drive.
FIRMWARE
.firmware
(must be uppercase).
file.
6. Plug the USB flash drive into PDU.
During the update, the IMD will stop scrolling data. After the update is complete, a boot message will
appear on the display. After reboot is complete, the IMD will resume scrolling data on the display.
3 Setup
51
Page 56

3.3.4 Help Tab
Info Page
The Info Page displays the unit's current configuration information, including the device name and ID, the
type of IMD installed, the unit's current firmware versions and network information. Manufacturer support
information is also here.
Figure 3.25 Info Page
52
Vertiv™ | Intelligent Rack PDU Installer/User Guide
Page 57

4 VERTIV™ INTELLIGENCE DIRECTOR
Vertiv™Intelligence Director brings a single unified viewing layer for small deployments of Vertiv Geist™
rPDUs, Vertiv UPSs and environmental sensors. When deployed, Vertiv Intelligence Director offers
enhanced functionality, using the rack PDU not as a stand-alone device but as a gateway to understand
the broader device ecosystem in which it’s installed.
4.1 Aggregation
The initial element of Veritiv Intelligence Director, available with Vertiv™ Geist™ rPDUs running firmware
5.3.0 or later, is called Aggregation. This single element allows you to:
• Use a single IP address assigned to the Master rPDU to monitor up to 50 devices, the master and 49
downstream devices.
• Allow rPDUs downstream from the master to self-configure network settings.
• Create aggregated measurements like total rack power and total row power, including averages,
minimums and maximums.
4.2 Master rPDU
Aggregation requires the designation of a Master rPDU, deployed with IMD-3E and IMD-03E. The IMD of
the master device facilitates and configures the device network, the interconnected array of Vertiv™
Geist™ rPDUs, Vertiv™ UPS and environmental sensors, while aggregating select data points from these
devices. It also interacts with the management network for monitoring and management of itself and its
downstream devices.
Figure 4.1 Sample Configuration
The IMD-3E is the default intelligence card for Vertiv™Geist™ GU2 rPDUs, which include switched (model
numbers beginning with MNS), outlet monitored (model numbers beginning with MNR) and switched
plus outlet monitored (model numbers beginning with MNU) products. To serve as the Master rPDU,
rPDUs with a legacy intelligence card must first be upgraded to the IMD-3E.
53
Page 58

4.3 Network Configuration
Aggregation is enabled on the Master rPDUs only. As each master can support up to 49 downstream
devices, the number of masters depends on the overall size of the installation and the preferred network
architecture.
The Master rPDU must be commissioned before it is connected to the primary management network or to
the downstream device network. This commissioning is typically accomplished using a laptop or local
machine connected directly to Port 1 on the IMD.
After local connectivity is established, you can commission the Master rPDU.
To commission the master rPDU:
1. Use the top drop-down menu to navigate to
System>Locale
.
2. Select the appropriate Default Language and Temperature Units from the drop-down menus.
These settings are pushed to the downstream devices in its network.
3. Browse to
4. Browse to
a. Aggregation: Choose
Network>Protocol
System>Utilities.
Enabled
. For IPv6, choose
Enabled
from the drop-down menu.
Change the settings as desired.
from the drop-down menu.
b. Managed Device Username: Defines the username configured on all downstream devices.
c. Managed Device Password: Defines the password configured on all downstream devices.
5. Enter the new password; verify the password and click
6. Click
Submit
. If Aggregation is enabled, the Device Tab appears next to the Sensors Tab on the top
OK.
navigation bar.
After Aggregation is enabled on the Master rPDU, configure the remaining Master rPDU settings. Connect
the Master rPDU to management network (Port 1) on the IMD and the device network (Port 2).
NOTE: The Master rPDU has a built-in DHCP network to assign addresses to its downstream devices.
This DHCP network uses
192.168.124.0/24
addresses and they cannot be used for the management
network.
4.3.1 Downstream Devices
In the initial release of aggregation, downstream devices are defined as rPDUs within the Geist™ GU1 and
GU2 product platforms as well as Vertiv™ Liebert® GXT4, GXT5 and PSI5 UPS and USB-connected Vertiv™
VRC cooling. All Geist™ GU1 rPDUs must be running firmware Version 3.3.3 or later; Geist™' GU2 rPDUs
must be running Version 5.3.0 or later. If the rPDUs are newly ordered and have never been configured
with network settings, they are ready for aggregation out-of-the-box. If the rPDUs have been deployed in
a computing environment and commissioned with local LAN settings and user accounts, each rPDU must
be reset to its factory defaults using the Utilities page. The Master rPDU then pushes configuration data
to the downstream devices, including:
• Network settings
• Default Language and Temperature Units
• Username
• Password
54
Vertiv™ | Intelligent Rack PDU Installer/User Guide
Page 59

To set up a new installation with one Master rPDU:
1. Install downstream rPDUs in racks and power-on the racks.
2. Daisy-chain the downstream rPDUs to one another where appropriate using ports labeled 1 and 2
on the IMD.
• If daisy-chaining, ensure that no more than 100 rPDUs are chained together.
• If connecting daisy-chains to a network switch, no daisy-chain should be longer than 20 rPDUs.
• A star network or other design is also acceptable in lieu of a daisy-chain.
3. Install the Master rPDU in rack . Using a laptop or a local machine, connect to Port 1 to configure
Aggregation.
4. Connect the Master rPDU to the management network using Port 1.
5. Connect the Master rPDU to the downstream network using Port 2.
To set up an existing installation with one Master rPDU:
NOTE: Use the following instructions if existing Geist™ rPDUs are connected in a daisy-chain.
1. Designate a Master rPDU and disconnect it from the management network.
2. Reset all downstream rPDUs to factory default settings. The physical ethernet connections in the
daisy-chain can remain the same; however, if previously connected in a looped configuration, the
final PDU in the chain should be disconnected from the network switch.
3. Enable Aggregation on the Master rPDU.
4. Connect the Master rPDU to the management network using Port 1.
5. Connect the Master rPDU to the downstream network using Port 2.
Multiple Master rPDUs
For installations with multiple Master rPDUs, keep in mind that each device network must operate as a
stand-alone, isolated network. Consider a 200 rPDU example, represented in the Sample Network
Configuration on page 56. This installation would require a minimum of 4 Master rPDUs, each operating its
own stand-alone device network. Each master is visible on the management network and acts as a DHCP
server for its downstream devices. A user on the management network can navigate through each master
to reach the interface of a downstream device. Other considerations may affect the quantity of Master
rPDUs. If you have a row network architecture, you may prefer 1 Master rPDU at the start of each row, as
opposed to a master that traverses several rows. Depending on how these 200 cabinets are divided into
rows, you may have more than 4 Master rPDUs. When the configuration is decided, follow the appropriate
process for aggregation.
4 Vertiv™Intelligence Director
55
Page 60

Figure 4.2 Sample Network Configuration
NOTE: RSTP is disabled by default in Geist™ GU1 rPDUs running 3.4.0 or later and Geist™ GU2 rPDUs
running 5.3.3 or later. In previous firmware, RSTP is enabled on both platforms. Aggregation does not
support RSTP. Leaving RSTP enabled limits an rPDU daisy-chain within aggregation to 40 devices.
Disabling RSTP on downstream devices will remove the 40-device limitation.
4.4 Views
When communication is established between the master and downstream devices, several views are
automatically populated within the user interface. The new views are under the Device Tab in the top
navigation bar are:
• Summary
• Groups
• List
• Group Configuration
56
Vertiv™ | Intelligent Rack PDU Installer/User Guide
Page 61

Figure 4.3 Device Tab
4.4.1 Summary
The summary view aggregates data from all downstream devices, presenting a concise outline of relevant
power, environmental and alarm details.
Rack PDUs
The rPDU network is summarized by the following data points:
• Energy: The total rPDU energy within the device network.
• Power Sum: The total rPDU power load within the device network.
• Power Minimum: The lowest group rPDU power load within the device network.
• Power Maximum: The highest group PDU power load within the device network.
• Power Average: The average group PDU power load within the device network.
NOTE: These readings are repeated per phase (shown when only 3-phase rPDUs present).
UPS
The UPS network is summarized by the following data points:
• Power Maximum: The highest group UPS power load within the device network.
• Power Average: The average group UPS power load within the device network.
• Battery Autonomy Minimum: The lowest UPS battery run time within the device network.
• Battery Autonomy Average: The average UPS battery run time within the device network.
• Battery Charge Minimum: The lowest UPS battery charge within the device network.
• Battery Charge Average: The average UPS battery charge within the device network.
4 Vertiv™Intelligence Director
57
Page 62

Environmental (Sensors)
The Environmental category is summarized by the following data points:
NOTE: Humidity values are blank when temperature-only sensors are used.
• Temperature Minimum: The lowest temperature within the device network.
• Temperature Maximum: The highest temperature within the device network.
• Temperature Average: The average temperature within the device network.
• Humidity Minimum: The lowest humidity within the device network.
• Humidity Maximum: The highest humidity within the device network.
• Humidity Average: The average humidity within the device network.
Notifications
Notifications shows outstanding alarms from devices in the device network.
4.4.2 Groups
After groups are established within the Group Configuration, the Groups view summarizes power and
environmental data. The available data points are:
Group rPDU
• Energy: The total rPDU energy within the group.
• Power Sum: The total rPDU power load within the group.
• Power Minimum: The lowest rPDU power load within the group.
• Power Maximum: The highest rPDU power load within the group.
• Power Average: The average rPDU power load within the group.
NOTE: These readings are repeated per phase (shown when only 3-phase rPDUs present).
Group UPS
• Power Maximum: The highest UPS power load within the group.
• Power Average: The average UPS power load within the group.
• Battery Autonomy Minimum: The lowest UPS battery run time within the group.
• Battery Autonomy Average: The average UPS battery run time within the group.
• Battery Charge Minimum: The lowest UPS battery charge within the group.
• Battery Charge Average: The average UPS battery charge for the group.
58
Vertiv™ | Intelligent Rack PDU Installer/User Guide
Page 63

Group Environmental
• Temperature Minimum: The lowest temperature within the group.
• Temperature Maximum: The highest temperature within the group.
• Temperature Average: The average temperature within the group.
• Humidity Minimum: The lowest humidity within the group.
• Humidity Maximum: The highest humidity within the group.
• Humidity Average: The average humidity within the group.
4.4.3 List
The list view presents an inventory of all devices within the master’s Device network.
The inventory is subdivided into in the following categories:
Rack PDUs
All rPDUs in the device network roll into this category and present the following data points:
• State: The status of the rPDU. Status is either normal or unavailable (loss of connectivity).
• Name: rPDU label. Clicking on the name opens a browser tab for device access.
• Group: The group name. If there is no user-created group, the group name is Unassigned.
• Energy: rPDU energy.
• Power: Total rPDU power load.
UPS
All UPS devices in the device network roll into this category and present the following data points:
• State: The status of the UPS. Status is either normal or unavailable (loss of connectivity).
• Name: UPSlabel. Clicking on the name opens a browser tab for device access.
• Group: The group name. If there is no user-created group, the group name is Unassigned.
• Input Voltage: UPS input voltage.
• Output Source: The UPS operating mode which can be: Normal, Bypass, Battery, Booster, Reducer,
Off or Other.
• Status: The battery status, which can be: Normal , Low, Depleted or Unknown
• Battery Autonomy: UPS battery run time.
• Charge: UPS battery charge.
4 Vertiv™Intelligence Director
59
Page 64

ENV (Environmental Sensors)
All Environmental Sensors in the device network roll into this category and present the following data
points:
• State: The status of the Sensor. Status is either normal or unavailable (loss of connectivity).
• Name: Sensor label. Clicking on the name opens a browser tab for device access.
• Group: The group name. If there is no user-created group, the group name is Unassigned.
• Device: Displays the sensor parent rPDU label and MAC address.
• Temperature: Temperature reading (main temperature only with GT3HD sensors).
• Humidity: Humidity reading. This field is blank if only SRT temperature sensors are deployed.
Environmental sensors, report their values through the MIB of the rPDUs to which they are connected.
They are not standalone sensors with their own IP addresses. In this release, the only valid sensors are
rPDU-connected Geist™ SRT, Geist™ GTHD or GTHD3 sensors.
NOTE: The name of any device can be customized by logging into the device and editing through the
Configuration icon.
NOTE: To delete a device which has been removed from the network, select the
device. Selecting
Delete
deletes the device and any Environmental Sensors connected to it.
Trash
icon next to the
4.4.4 Group Configuration
On the Group Configuration page, you can define groups of devices for data aggregation and analytic
purposes. A group often refers to a unit of measure within a computing environment that includes
multiple downstream devices, such as a rack with two rPDUs, UPS devices and environmental sensors or a
row within a facility that includes multiple racks.
Figure 4.4 Group Configuration
60
Vertiv™ | Intelligent Rack PDU Installer/User Guide
Page 65

The Group Configuration page lists the automatically discovered devices under the
Unassigned
showing:
• One or more icons defining the type of device such as, rPDU, Environmental Sensor or UPS.
• Device label
• Serial number
• MAC address
• ID
Configured groups of devices (typically representing racks) are shown on the left.
To create a new group:
column
1. Click the
2. Click the
3. Edit the label, if desired, and click
plus sign (+)
Configuration
to the left of Groups, to add a new group under Groups.
icon to change the name of the group label.
Save
.
4. To assign devices to the group, highlight the desired group (within Groups category) and highlight
the desired devices within the Unassigned category.
5. Click the
Right Arrow
to assign the devices to the group.
6. Repeat the process for other groups, as needed.
NOTE: Groups can be reordered by clicking the up or down arrows.
To remove devices from a group:
Highlight the devices and click the
Right Arrow
.
To delete a group:
Click the
Trash
icon next to the group name.
NOTE: Deleting a group returns all of its devices to the Unassigned group.
4.5 Interfaces
Downstream Devices are combined to form groups, each device retains its own stand-alone user interface
and SNMP data.
To access the Downstream Device User Interface:
1. From the List view, use your mouse to hover over the entries in the table. A yellow highlight and
text box appear as you pause on the devices. The text box reveals the IP address of the device.
2. Navigating to IP address to access the web server interface of the device.
3. Click the name of the device to access the hyperlink to the web server.
To access Downstream Device SNMP Data:
SNMP Data is available using port-mapped access through the master device IP address using the
Geist™_v5 MIB. The MIB file is downloadable from the master device SNMP page.
4 Vertiv™Intelligence Director
-or-
61
Page 66

1. From the List view, use your mouse to hover over the entries in the table. A yellow highlight and
text box appear as you pause on the devices. The text box reveals the SNMP port of the device.
2. In the MIB browser, enter the SNMP port listed.
NOTE: Software to monitor individual downstream devices must be capable of accepting a unique
SNMP port number per monitored device.
Figure 4.5 MIBBrowser
4.5.1 Group SNMP Data
Aggregated data, both summary (such as total kWh and maximum kW) and group data is available
through the master rPDU IP address and default SNMP Port 161. Within the MIB structure, the folders
differentiate the data points available from the Master rPDU:
• v5: Contains data points for the individual Master rPDU.
• Oneview: Contains data points for aggregated data across all downstream devices.
4.5.2 Tips and Troubleshooting
• Summary and Group aggregated data cannot be used to generate SNMP traps.
• SNMP community names are configured on each device. Follow the device links displayed on the List
page under the Devices menu and logging into each device to configure SNMP.
• Do not change the default SNMP port number when logged into a downstream device.
• SNMP traps and alarms are routed from a device to the management network through the master
device.
62
Vertiv™ | Intelligent Rack PDU Installer/User Guide
Page 67

5 APPENDICES
Appendix A: Technical Support
A.1 Resetting an rPDU
If the rPDU loses communication, the processor may be manually rebooted without affecting power to the
outlets. Pressing the reboot button on the face of the IMD will cause the processor to reboot. The web
interface will remain off-line during boot-up. For more information, see Interchangeable Monitoring Device
(IMD-03X) on page 21
A.2 Service and Maintenance
No service or maintenance is required. Do not attempt to open the rPDU or you may void the warranty.
There are no user-serviceable parts inside the rPDU other than the field-replaceable Interchangeable
Monitoring Device (IMD). Geist™recommends removing power from the unit before installing or removing
any equipment.
The IMD is designed to be field-replaceable by properly trained and qualified service personnel only. The
IMD is designed to be replaced while the rPDU is still connected to AC mains power. Please refer the
Geist™ rPDU IMD Modules Replacement Guide for more information.
A.3 More Technical Support
Technical support can be found at
Americas
• Website:
• Email: geistsupport@vertiv.com
• Telephone: 1-888-630-4445
Europe and Middle East
• Technical Support:
• Email: eoc@Vertiv.com
• Telephone: 44 1823 275100
Asia
• Telephone (English): 1-888-630-4445 (US number)
• Telephone (Chinese): +86 755 2354 6462
www.Vertiv.com/geist
www.Vertiv.com/en-emea/support
www.Vertiv.com/support
.
A.4 Using Microsoft Exchange as an SMTP server
If your facility uses a Microsoft Exchange email server, it can be used by the IMD rPDU to send alarm and
warning notification emails. However, the Exchange server may need to be configured to allow SMTP
connections from the unit first, as later version of Exchange server often have SMTP services or basic
authentication disabled by default. If you encounter difficulties in getting your IMD rPDU to send emails
through your Exchange server, the following notes may be helpful in resolving the problem.
63
Page 68

NOTE: These suggestions apply only if you are using your own, physicalExchange server. Microsoft’s
hosted Office 365 service is not compatible with the IMD rPDU using firmware versions prior to v3.0.0,
as Office 365 requires a StartTLS connection. Firmware versions 3.0.0 and beyond have support for
StartTLS and are compatible with Office 365.
1. First, since the IMD rPDU cannot use IMAP or Microsoft’s proprietary MAPI/RPC Exchange/Outlook
protocols to send messages, you will need to enable SMTP by setting up an SMTP Send Connector
in the Exchange server. More information on setting up an SMTP Send Connector in Exchange can
be found at this Microsoft TechNet article:
http://technet.microsoft.com/en-
us/library/aa997285.aspx
2. Second, you may need to configure your Exchange server to allow messages to be relayed from the
monitoring unit. Typically, this will involve turning on the
Reroute incoming SMTP mail
option in
the Exchange server’s Routing properties, then adding the IMD rPDU’s IP address as a domain
which is permitted to relay mail through the Exchange server. More information about enabling
and configuring SMTP relaying in Exchange can be found at this Microsoft TechNet article:
http://technet.microsoft.com/en- us/library/dd277329.aspx
The SMTP AUTH PLAIN and AUTH LOGIN authentication methods for logging in to the server are often
no longer enabled by default in Exchange Server; only Microsoft’s proprietary NTLM authentication
method is enabled.
To re-enable the AUTH LOGIN method:
1. In the Exchange console select
2. Right-click the
3. Select the
4. Deselect the
5.
ApplyorSave
Client Server
Authentication
Offer Basic only after TLS
and click
Exit
Server Configuration - Hub Transport
and select
Tab and click the
Properties
.
Basic Authentication
checkbox.
.
.
checkbox.
NOTE: You may need to restart the Exchange service after making these changes.
Finally, once you have enabled SMTP, relaying and the AUTH LOGIN Basic Authentication method, you
may also need to create a user account specifically for the IMD rPDU to log into. If you have already
created an account prior to enabling the SMTP Send Connector or you are trying to use an account
created for another user and the IMD rPDU still cannot seem to connect to the Exchange server, the
account probably did not properly inherit the new permissions when you enabled them as above. This
tends to happen more often on Exchange servers that have been upgraded since the account(s) you are
trying to use were first created, but can sometimes happen with accounts when new connectors and
plugins are added regardless of the Exchange version. Delete the user account, then create a new one for
the monitoring unit to use and the new account should inherit the SMTP authentication and mailrelaying permissions correctly.
If none of the above suggestions succeed in allowing your IMD rPDU to send mail through your Exchange
server, then you may need to contact Microsoft’s technical support for further assistance in configuring
your Exchange server to allow SMTP emails to be sent from a third-party, non-Windows device through
your network.
64
Vertiv™ | Intelligent Rack PDU Installer/User Guide
Page 69

Appendix B: Visible Light Communication (VLC)
The VLC feature on Upgradeable PDUs allows the user to unobtrusively upload product information into a
database management system via the embedded LED display. This product feature provides new
opportunities to monitor and enable larger amounts of rPDU power data to be obtained via the unit’s
display and all without physically connecting to the rPDU.
Using a smart device, such as a smart phone or tablet with the Vertiv™ Mobile application installed, it is
possible to capture data from the LED display when running in VLC mode, which can be enabled/disabled
easily by using the display buttons on the device or using the GUI on monitored units.
By default, the Upgradeable LED display will provide the current (Amps) per input and circuit breaker. By
enabling the VLC feature, the LED Display will scroll through a set of alpha-numeric characters. Utilizing
the Vertiv Mobile app the user can scan the LED display and retrieve additional power metrics including
volts, amps, watts, volt-amps and kilowatt hours. Before VLC, the power data was only available on
network-connected PDUs by viewing the GUI or using external software to collect and display the data.
The VLC feature provides this data on local metered only devices, as well as on monitored units without
the need to connect them to the network.
WARNING! This feature, when enabled, causes the unit to emit flashing lights, text or number
sets at frequencies that can induce adverse reactions. Persons susceptible to adverse
reactions as a result of such emissions or persons who have been diagnosed with epilepsy
should not utilize or enable this feature.
To enable VLC:
Press the center button 3 times in under 2 seconds.
NOTE: With the release of firmware Version 3.3.0, Vertiv™has added support for the VLC feature to all
standard Metered and Monitored Upgradeable products, as well as a significant majority of its
engineered-to-order range. Certain custom models of Upgradeable PDUs may not have VLC support
within the Vertiv™ Mobile app. If your custom product is not supported by the Vertiv™ Mobile app it will
be noted in the product specification sheet. Please contact your sales representative if you would like
assistance with this. The latest firmware updates can be found at
Vertiv.com/Firmware-Support
.
Vertiv™ Mobile app is available in the App Store for iOS devices.
Appendix C: Vertiv™ Mobile App
The Home screen allows the user to initiate a device scan or export data to a CSV file.
• Scan: Turns on scan mode to allow the app to capture VLC data from the Upgradeable rPDU.
• Export: Pressing the
.csv
file to be emailed to desired recipients.
Export
button will launch the smart device's email app and attach the
Database
5 Appendices
65
Page 70

Figure A.1 Vertiv Mobile App Home Screen
To scan an rPDU
1. Press
Scan
on the Home screen to load the Vertiv Mobile app scanning engine.
Figure A.2 Vertiv Mobile App Scanning Screen
66
Vertiv™ | Intelligent Rack PDU Installer/User Guide
Page 71

2. Position the smart device so that the characters on the LED display are between the lines on the
screen. The LED characters should be clear and in focus. If the characters appear too bright or too
dark, the exposure setting can be adjusted by using the sliding bar at the bottom of the screen.
The app captures data as soon as it can see the LED characters inside the horizontal lines. Scan
progress is displayed as a percentage. If the scan percentage is increasing slowly or resetting, the
device has trouble in reading the data properly. In this case, try repositioning the device to improve
results. After the scan reaches 100%, the app loads the Readings page.
NOTE: When a device is scanned for the first time, the Vertiv Mobile app recognizes the serial number
as being new and ask if it should be added to the database as shown in the following image. If the
device is added to the database, all future scanned data is added to the device serial number record.
Figure A.3 Vertiv™ Mobile App New Device Screen
5 Appendices
C.1 Scanning Tips
The VLC feature relies upon the light for its communication. If the lighting around the display or the
lighting going through the lens of the smart device is not optimal, then the OCR (Optical Character
Recognition) will struggle to capture the data. When looking at the smart device screen during capture,
you can see if the characters of the LED display are in focus and bright, if they are blurred, with a
surrounding glow or are faint, then the VLC capture will fail to work quickly and may be unable to scan at
all.
Proper capture methods
• High Contrast between LED display and background
• No glow around LED display characters
• LED display characters between horizontal guidelines
67
Page 72

Improper capture methods
• Blurry image
• Overexposed image
• Glow around LED display characters
• LED display characters not between horizontal guidelines
C.2 Failure modes and Errors
The Vertiv™Mobile App retries a scan 2 times, if the scan cannot be completed. The scan fails, if the smart
device is unable to correctly capture all the VLC data correctly. One of the following messages is
displayed:
• Scan failed: Incorrect set configuration.
• Scan failed: Incorrect data sequence.
• Scan failed: Adjust your position or the exposure and try again.
Press
Cancel
to return to the Home screen or
Retry
to return to the Scan page.
C.3 Readings
The Readings screen displays scan results for each rPDU scanned using VLC.
Figure A.4 Vertiv Mobile App Readings Screen
NOTE: The unit serial number is displayed in the title bar of the Readings screen. This serial number
matches the serial number displayed on the label of the rPDU.
68
Vertiv™ | Intelligent Rack PDU Installer/User Guide
Page 73

Pressing the
Settings
icon enables the user to customized the data that is displayed in the scan results.
• Collapse Rows: Allows user to collapse or expand the Readings screen to help properly display data
on smart devices with smaller screens.
• Unit Data to Display: Selects which data is shown on the Readings screen. All data is stored within the
database regardless of settings here. These settings are global and will apply to any scanned unit.
Figure A.5 Vertiv™ Mobile App Settings Screen
5 Appendices
69
Page 74

C.4 Export
The Export button on the Home screen opens the smart device's default email app to send the database
of scanned devices in
Figure A.6 Vertiv™ Mobile App Export Screen
.csv
format to the desired recipients.
NOTE: An email app must be properly configured on the smart device to utilize the Export function.
The Vertiv™ Mobile App does not directly support email functionality. Vertiv cannot troubleshoot email
errors as this could be an issue with either the device or with the email service being used.
Each rPDU you scan adds a new entry to the database. There is no limit to the number of individual rPDU
that can be added, but the database has a limit of 10 scans per rPDU. Additional scans of the unit will
overwrite the oldest data for that unit.
The
.csv
data output organizes data first by serial number and then by date and time. You can further
organize the data by using the filter option in Microsoft Excel. The data structure is split into two sections:
rPDU configuration and power data.
The rPDU Configuration Data includes:
• Serial Number
• Frame Definition
• Date/Time stamp
• IPv4 address
The Power Data includes:
• Power Readings
• Totals
70
Vertiv™ | Intelligent Rack PDU Installer/User Guide
Page 75

Table A.1 rPDU Configuration Data
SERIAL NUMBER FRAMEDEF
Product's unique serial number. This is the
same serial number present on the units
label.
Part of the VLC
configuration data and used
for debugging.
YYYY-MM-DDHH-MM-SS
Time stamp of
when the scan
occurred.
IP ADD
The IPv4 address of the unit. Locally
Metered units will show Null IP
address.
Table A.2 Power Data
VOLTS AMPS WATTS VA KWH
1 Volt 1 Amp 1 Watt 1 VA 1 kWh
Input Phase for Single-Phase units. Phase Aor Phase AB, if 3Phase.
2 Volts 2 Amps 2 Watts 2 VA 2 kWh
Phase B or Phase BC, if3-Phase.
3 Volts 3 Amps 3 Watts 3 VA 3 kWh
Phase Cor Phase AC, if 3-Phase.
Phase
Amperes
Phase
Amperes
Phase
Amperes
Phase Real
Power
Phase Real
Power
Phase Real
Power
Phase
Apparent
Power
Phase
Apparent
Power
Phase
Apparent
Power
Phase
KilowattHours
Phase
KilowattHours
Phase
KilowattHours
4 Volts 4 Amps 4 Watts 4 VA 4 kWh
Secondary Input Phase for Single-Phase units. Phase A or Phase
AB, if3-Phase
5 Volts 5 Amps 5 Watts 5 VA 5 kWh
Secondary Phase B or Phase BC, if3-Phase.
6 Volts 6 Amps 6 Watts 6 VA 6 kWh
Secondary Phase Cor Phase AC, if 3-Phase.
Phase
Amperes
Phase
Amperes
Phase
Amperes
Phase Real
Power
Phase Real
Power
Phase Real
Power
Phase
Apparent
Power
Phase
Apparent
Power
Phase
Apparent
Power
Phase
KilowattHours
Phase
KilowattHours
Phase
KilowattHours
NOTE: Some Geist™ GU models have dual Inputs with Monitoring or dual Inline Monitoring; these units
can have up to three additional power readings.
Table A.3 Breakers/Circuits
BREAKER 1 BREAKER 2 BREAKER 3 BREAKER 4 BREAKER 5 BREAKER 6
Breaker/Circuit 1
Amps
Breaker/Circuit 2
Amps
Breaker/Circuit 3
Amps
Breaker/Circuit 4
Amps
Breaker/Circuit 5
Amps
Breaker/Circuit 6
Amps
5 Appendices
71
Page 76

Table A.4 Totals
TOTAL WATTS (REAL POWER) TOTAL VA (APPARENT POWER) TOTAL KWH
The totalof Watts shown in sections 1-6 The totalof VA shown in sections 1-6 The totalkWh shown in sections 1-6
NOTE: The tables above are an outline of data that is present in the
Database .csv
file as is not
representative of the actual format of the CSV file. Data stored will vary based on product
configuration.
Appendix D: Available Sensors
D.1 Remote Sensors
• SRT: Stainless Remote Temperature.
• GTHD: Temperature/Humidity/Dew Point.
• GT3HD: Temperature/Humidity/Dew Point with two SRT sensors.
• RTAFHD3: Temperature/Air Flow/Humidity/Dew Point.
• A2D: Converts analog I/O Sensors to Remote Digital Sensors.
D.2 Analog I/O Sensors
• FS-15: Flood (Water) Sensor.
• PFS-100 US / PFS-100 UN: Power Failure Sensor.
• RPDS: Door Switch Kit.
D.3 Liebert® Integrated and Modular Sensors
NOTE: An adapter is required to use any of the following sensors.
• SN-T: One Temperature Probe.
• SN-TH: One Temperature Probe and one Humidity Probe.
• SN-Z01: Integrated Cable with one Temperature Probe.
• SN-Z02: Integrated Cable with three Temperature Probes.
• SN-Z03: Integrated Cable with four Probes (three Temperature and one Humidity).
• SN-2D: Two-Door Switch Monitor Sensor.
D.4 Connecting Remote Sensors
Up to 16 plug-and-play remote sensors can be attached to the unit at any time via the RJ-12 connectors
on the front of the unit. In some cases, splitters may be required to add additional sensors. Each sensor
has a unique serial number and is automatically discovered and added to the web page. The sensors'
serial number determines their display order on the web. Sensor name can be customized on the Sensors
Overview page.
NOTE: Sensors use CAT 5, CMP wire and RJ-12 connectors. Wiring must be straight-through. Reverse
polarity temporarily disables all of the sensors until corrected. Sensors use a serial communication
protocol and are subject to network signaling constraints dependent on shielding, environmental noise
and length of wire. Typicalinstallations allow runs of up to 600 ft. (180m) of sensor wire.
72
Vertiv™ | Intelligent Rack PDU Installer/User Guide
Page 77

Appendix E: IMD Display Codes
Table A.5 IMD Display Codes
DISPLAY
Err1
8888
“--” (Two dashes on
the right most display
position)
boot
boot
updt
rset dflt
bcup
IMD
TYPE
IMD-01
(Metered
only)
IMD-02,
IMD-03,
IMD-3
IMD-02,
IMD-03,
IMD-3
IMD-01 IMD is booting and discovering the input board.
IMD-02,
IMD-03,
IMD-3
IMD-02,
IMD-03,
IMD-3
IMD-02,
IMD-03,
IMD-3
IMD-02,
IMD-03,
IMD-3
EXPLANATION
The IMD discovered either none or more than one input boards.This may be caused byinternal
cabling issues or an unresponsive input board. This is also displayed if there isa measurement
error reported bythe input board.
IMD is booting and has yet to discover the simple displayandshows
for more thana few seconds there is a problem with the displayboard or with internal cabling.
The IMD cannot communicate with the input board. This mayalso be shown intermittently for
individualmeasurements. There is aproblem with the input board or with internalcabling.
Firmware is initializing. This willbe displayed while firmware is being updated in slave boards.
Firmware update in progress.
Following user action,
parameter reset,
bcup
(Backup) willappear during a configuration backup.
rset
(Reset) willappear during a parameter reset sequence. During a
dflt
(Default) willappear briefly.
boot
on it.If this isdisplayed
rest conf
IMD-02,
IMD-03,
IMD-3
rest
(Restore) and
Conf
(Configuration) will appear during aconfiguration restore.
5 Appendices
73
Page 78

This page intentionally left blank
74
Vertiv™ | Intelligent Rack PDU Installer/User Guide
Page 79

Vertiv™ | Intelligent Rack PDU Installer/User Guide
Page 80

Vertiv.com | Vertiv Headquarters, 1050 Dearborn Drive, Columbus, OH, 43085, USA
© 2020 Vertiv. Allrights reserved. Vertiv™ and the Vertivlogo are trademarks or registered trademarks ofVertiv Group Corp. Allother names and logos
referred to are trade names, trademarks or registered trademarks oftheir respective owners. While every prec aution has been taken to ensure accuracy
andcompleteness herein, Vertiv Group Corp. assumes no responsibility, and disclaims allliability, for damages resultingfrom use of this information or for any
errors or omissions. Specifications are subject to change without notice.
VM1225_SL-70565_REV04_05-20
 Loading...