


OM17-P4000VIS-NIR
Operating Instructions
VIS/NIR Spectrophotometer Probe
Table of Contents
Section 1
1-1 Warranty & Safety
Section 2
2-1 System Overview
Section 3
3-1 Software Installation Guide
3-7 Ocean Optics Spectrometer Configuration
3-11 Setting Port Order
3-12 Setting Integration Time
Section 4
4-1 Field Operations - Electronics
4-12 Importing sample locations for Interpolation
4-15 Bench Top Usage
4-15 Test/Example data
Section 5
5-1 Probe Platform Installation
5-3 Platform Operation
5-4 VIS/NIR Probe Operation
5-6 Soil Coring
5-8 Probe Rotation
5-10 Soil Anchoring System
5-12 Probe Removal and Tractor Installation
Section 6
6-1 Maintenance and Lubrication
6-4 EC Point Replacement
6-9 Probe Removal
6-5 Case Removal
Section 7
7-1 Troubleshooting
Section 8
8-1 Glossary
8-5 Appendix
1-1
OM17-P4000VIS-NIR
Warranty
Veris Technologies warrants this product to be free of defects in materials and
workmanship for a period of one (1) year from the date of delivery to the purchaser.
Veris Technologies will repair or replace any product returned to Salina, Kansas, which
appears upon inspection to be defective in materials or workmanship. Veris
Technologies will have shall have no obligation under this warranty for the cost of labor,
down-time, transportation charges, or for the repair or replacement of any product that
has been misused, carelessly handled, modified, or altered.
ALL OTHER WARRANTIES OF ANY KIND, WHETHER EXPRESSED OR IMPLIED,
INCLUDING BUT NOT LIMITED TO ANY IMPLIED WARRANTY OF
MERCHANTABILITY OR OF FITNESS FOR A PARTICULAR PURPOSE AND ALL
CLAIMS FOR CONSEQUENTIAL DAMAGES, ARE SPECIFICALLY DISCLAIMED AND
EXCLUDED.
Safety
1-2
OM17-P4000VIS-NIR
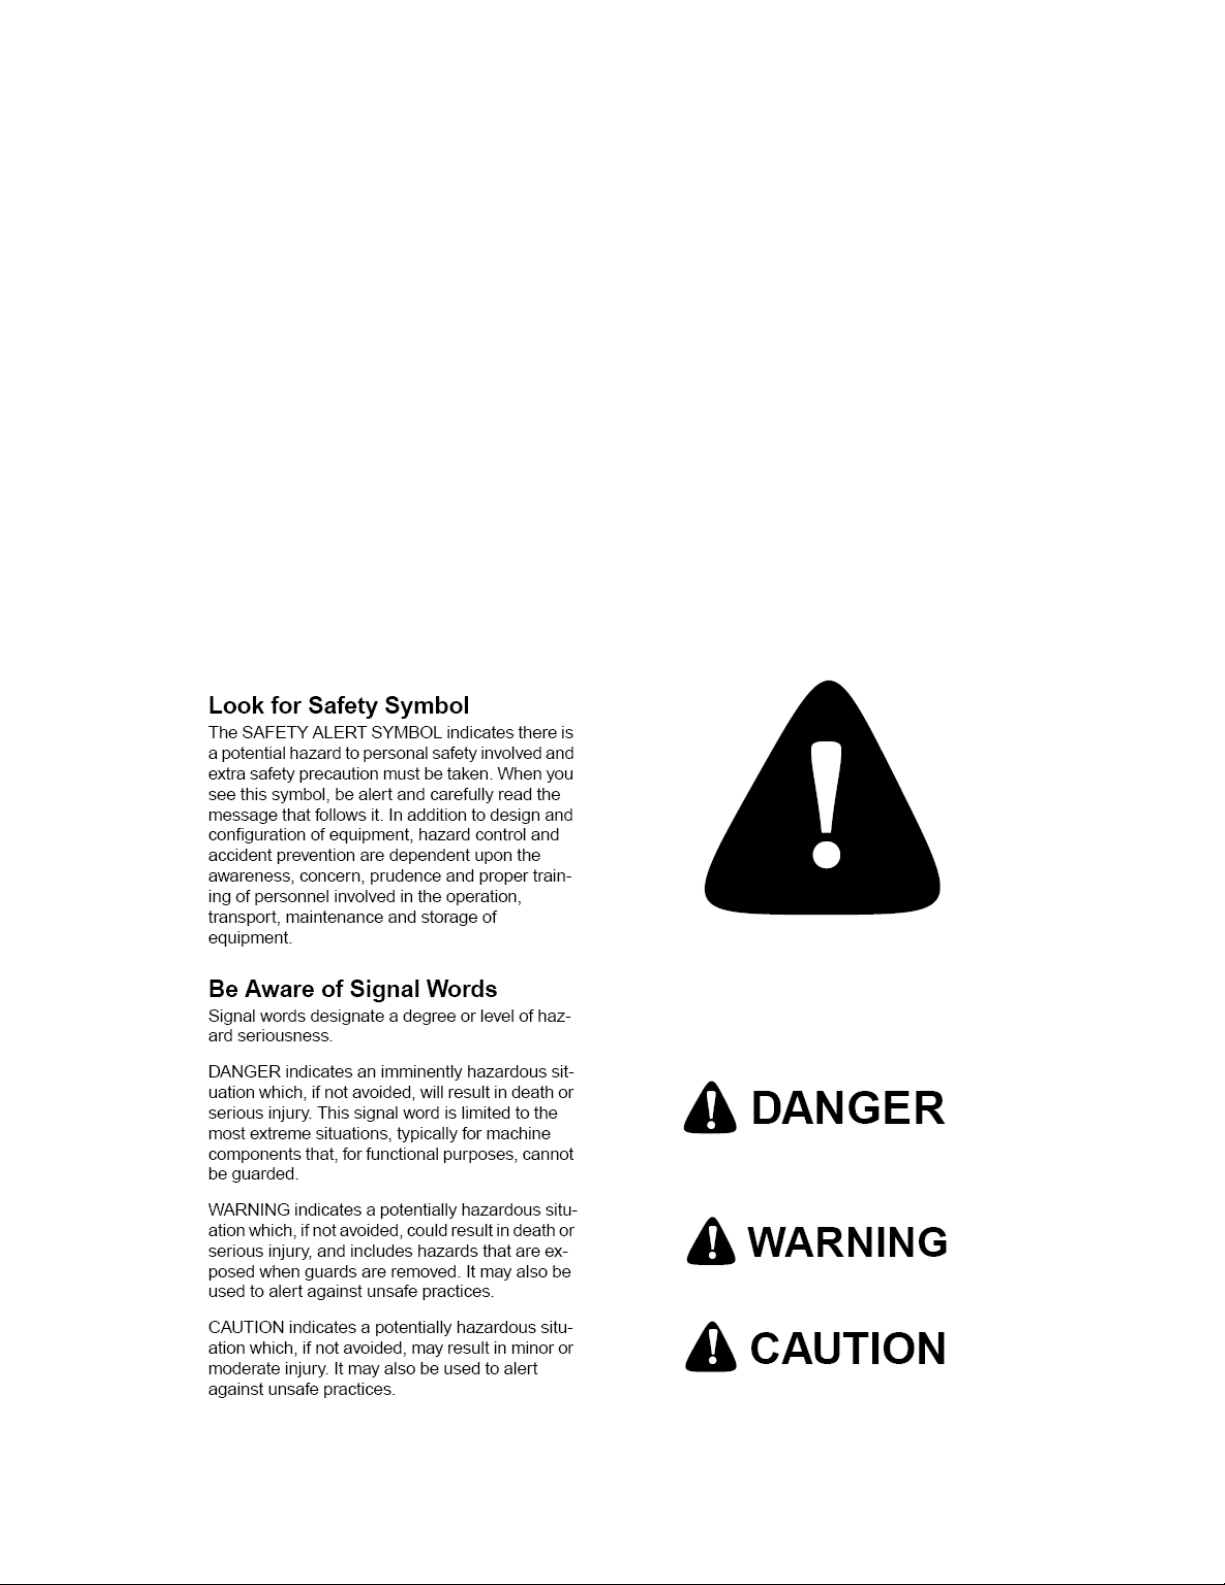
Important! Read the following SAFETY PROCEDURES before operating the Veris
MSP
• Escaping fluid under pressure can penetrate the skin causing serious injury. Avoid
the hazard by relieving pressure before disconnecting hydraulic lines. Use a piece of
• Use paper or cardboard, NOT BODY PARTS, to check for suspected leaks.
• Wear protective gloves and safety glasses or goggles when working with hydraulic and
high-pressure wash systems.
• If an accident occurs, see a doctor immediately. Any fluid injected into the skin must
be surgically removed within a few hours or gangrene may result.
• Pinch point hazard: to prevent injury, stand clear when raising
or lowering any part of the Veris P4000.
• Install all transport locks before transporting or working underneath.
• Detach and store implements in an area where children normally do not play. Secure
implement by using blocks and supports.
• Keep feet clear of foot and probe when lowering.
• Do not probe where utility lines may be present. Use ‘Call Before You Dig’ services.
• Use paper or cardboard, NOT BODY PARTS, to check for suspected leaks.
• Wear protective gloves and safety glasses or goggles when working with hydraulic and
high-pressure wash systems.
• If an accident occurs, see a doctor immediately. Any fluid injected into the skin must
be surgically removed within a few hours or gangrene may result.
• Read Operations Manual before operating machine
• Review safety instructions with operators before operating machine and at least
annually
• Riders obstruct the operator’s view. They could be struck by foreign objects or
thrown from the machine.
• Never allow children to operate equipment.
• To prevent possible electrical shock, or damage to the instrument, do not connect to
any power source greater than twelve (12) volts DC.
• Do not grease or oil implement while it is in operation.
• Disconnect battery ground cable (-) before servicing or adjusting electrical systems or
before welding on implement.
• Remove buildup of mud, oil or debris.
• Be prepared if a fire starts
• Keep a first aid kit and fire extinguisher handy.
• Be careful when touching the probe after use, the sapphire window gets hot.
1-3
OM17-P4000VIS-NIR
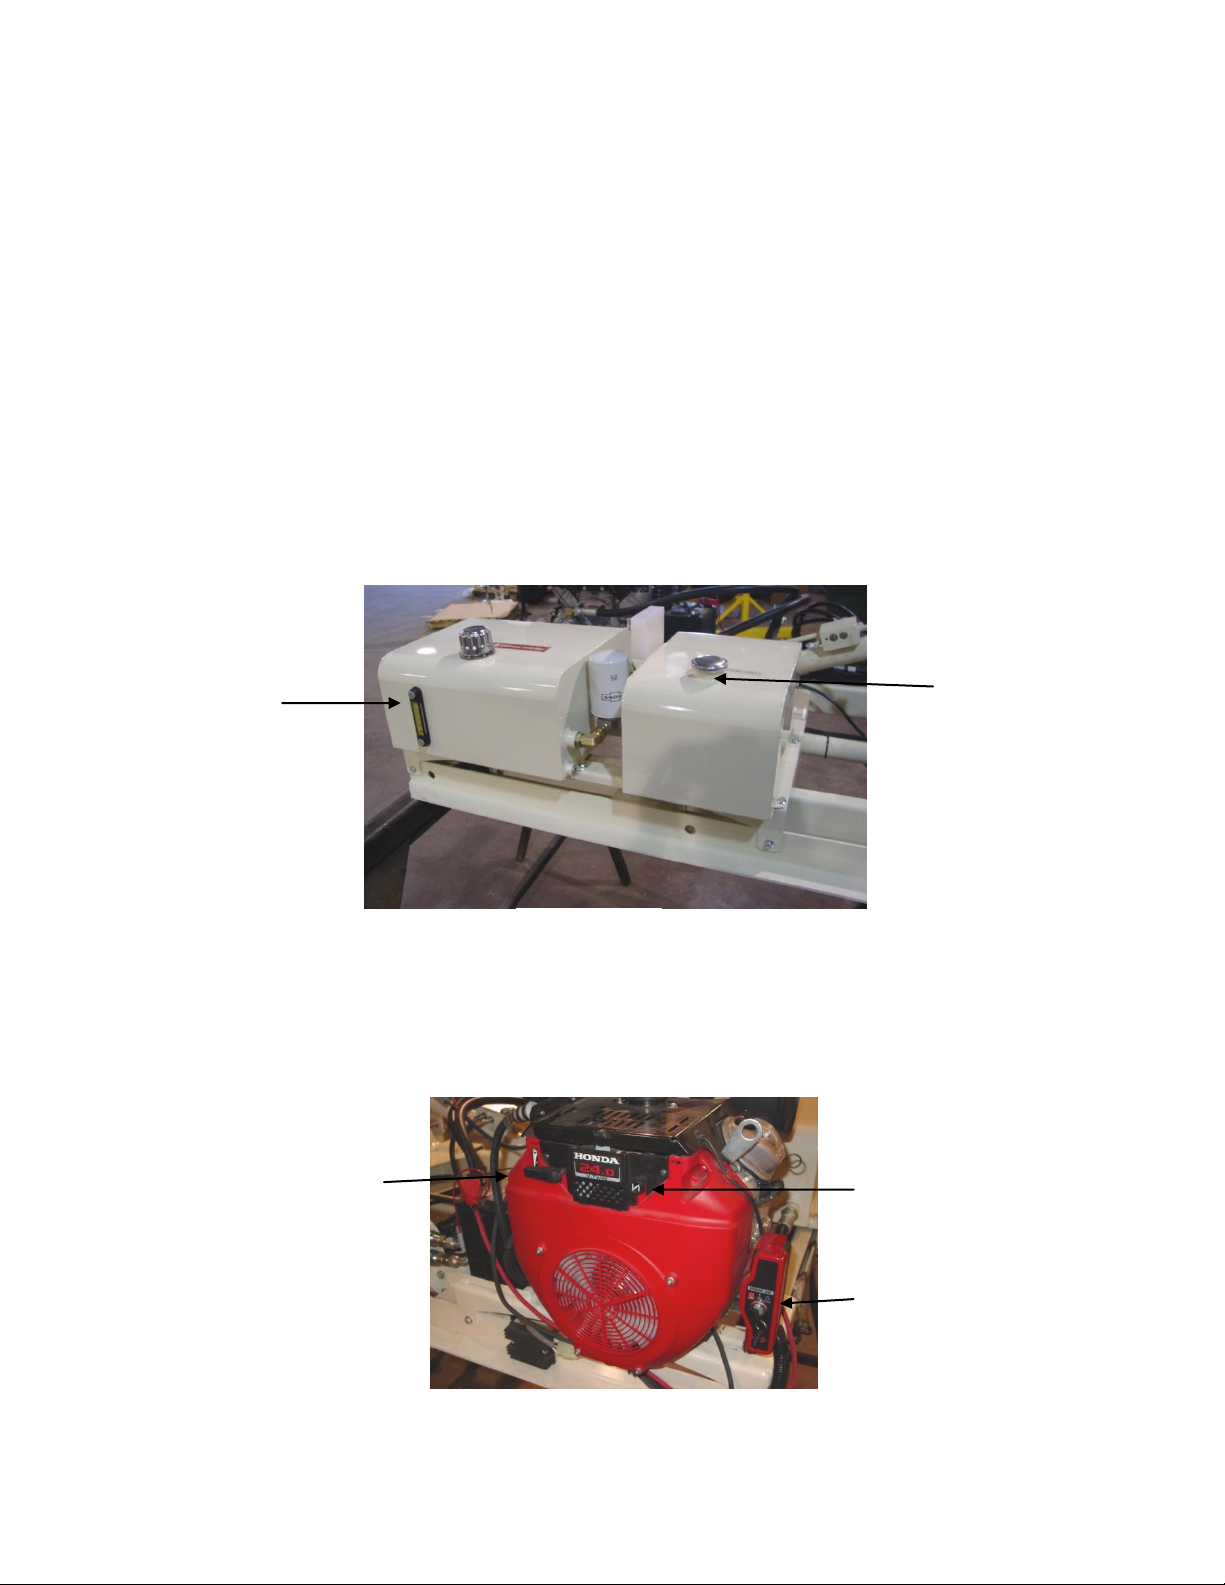
Hyd sight
gauge
Fuel Tank
Figure 1
Starter Switch
Choke
Throttle
Figure 2
Section 2
VERIS P4000 Probe Platform
System Overview
Before you begin using your P4000, it’s important to familiarize yourself with the basic
components and controls
Pre-operation checks:
1) Engine oil Level – refer to Honda GX 670 engine manual
2) Hydraulic fluid -- fluid level should be at or near upper black line on sight gauge
of hydraulic reservoir. (Figure 1). If not add suitable ISO 32 hydraulic fluid with a
viscosity index of 95- 140. Unit is filled at factory with Mobilfluid 424.
3) Check gas level – unleaded gasoline only
4) Check for any loose fasteners or hydraulic leaks.
Controls:
1) Engine controls are located on the engine itself. (figure 2) . Refer to Honda
engine manual for detailed information.
2-1
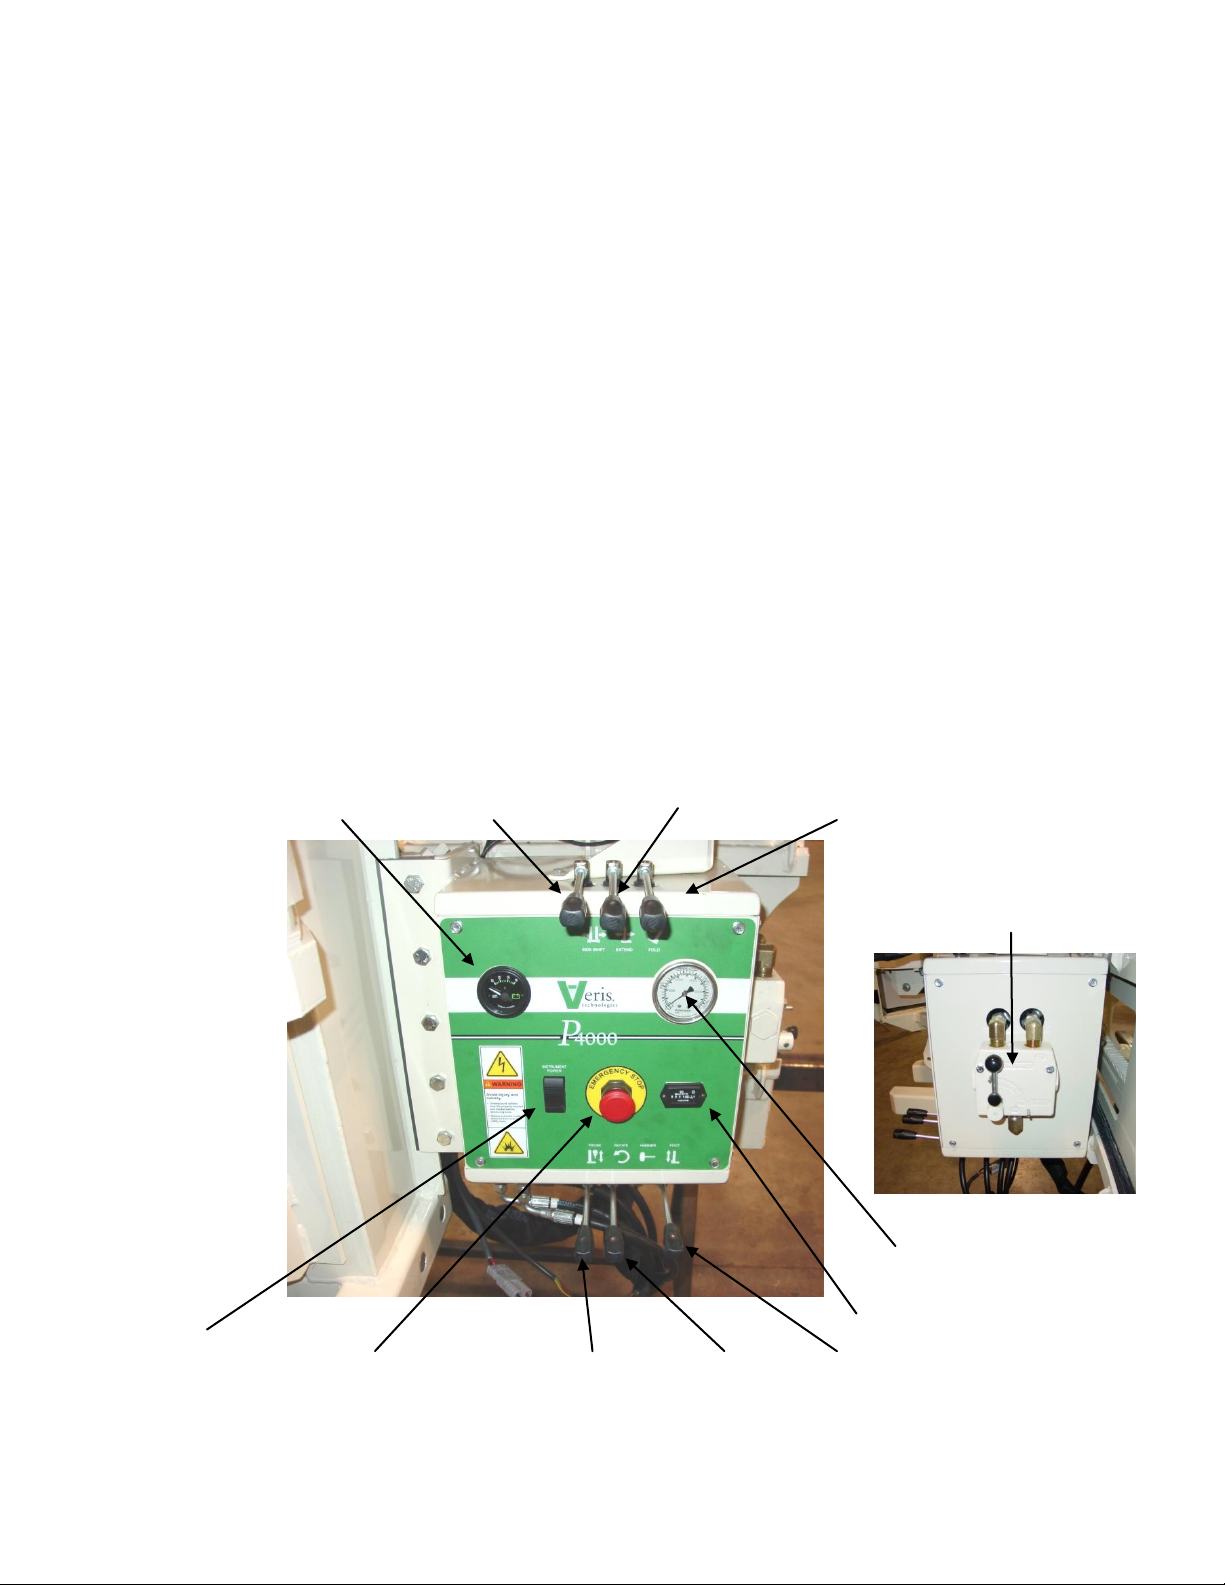
Hydraulic Controls
Figure 3
Figure 4
Voltage meter Side Shift control Extension control Fold control
Probe speed
Flow control
12v power switch Engine emergency stop Probe control Rotation control Foot control
Hyd pressure gauge
Engine hour meter
All system monitoring and probe control functions are contained on the
console mounted to the right of the probe, referred to as the “foot”. (Figures 3,4)
a) Voltage meter – monitors battery voltage
b) Side shift control – allows lateral movement of probe for multiple insertions at
a given location.
c) Extension control -- used to extend probe from transport to field use position
d) Fold control – folds probe from transport to use position
e) Probe speed flow control – controls insertion speed of NIR/EC Force Probe to
operator preference
f) Hydraulic pressure gauge – monitors system pressure during hydraulic
cycling
g) Hour meter—monitors engine operation for routine maintenance
h) Foot Control – Raises and lowers foot
i) Rotation control – aids in soil core insertion in tough soils. Down is clockwise-
direction required for coring.
j) Probe control – Raises and lowers probe assembly
k) Engine emergency stop – immediately shuts down engine if need arises.
l) 12VDC power switch for auxiliary and spectrometer power.
OM17-P4000VIS-NIR
2-2
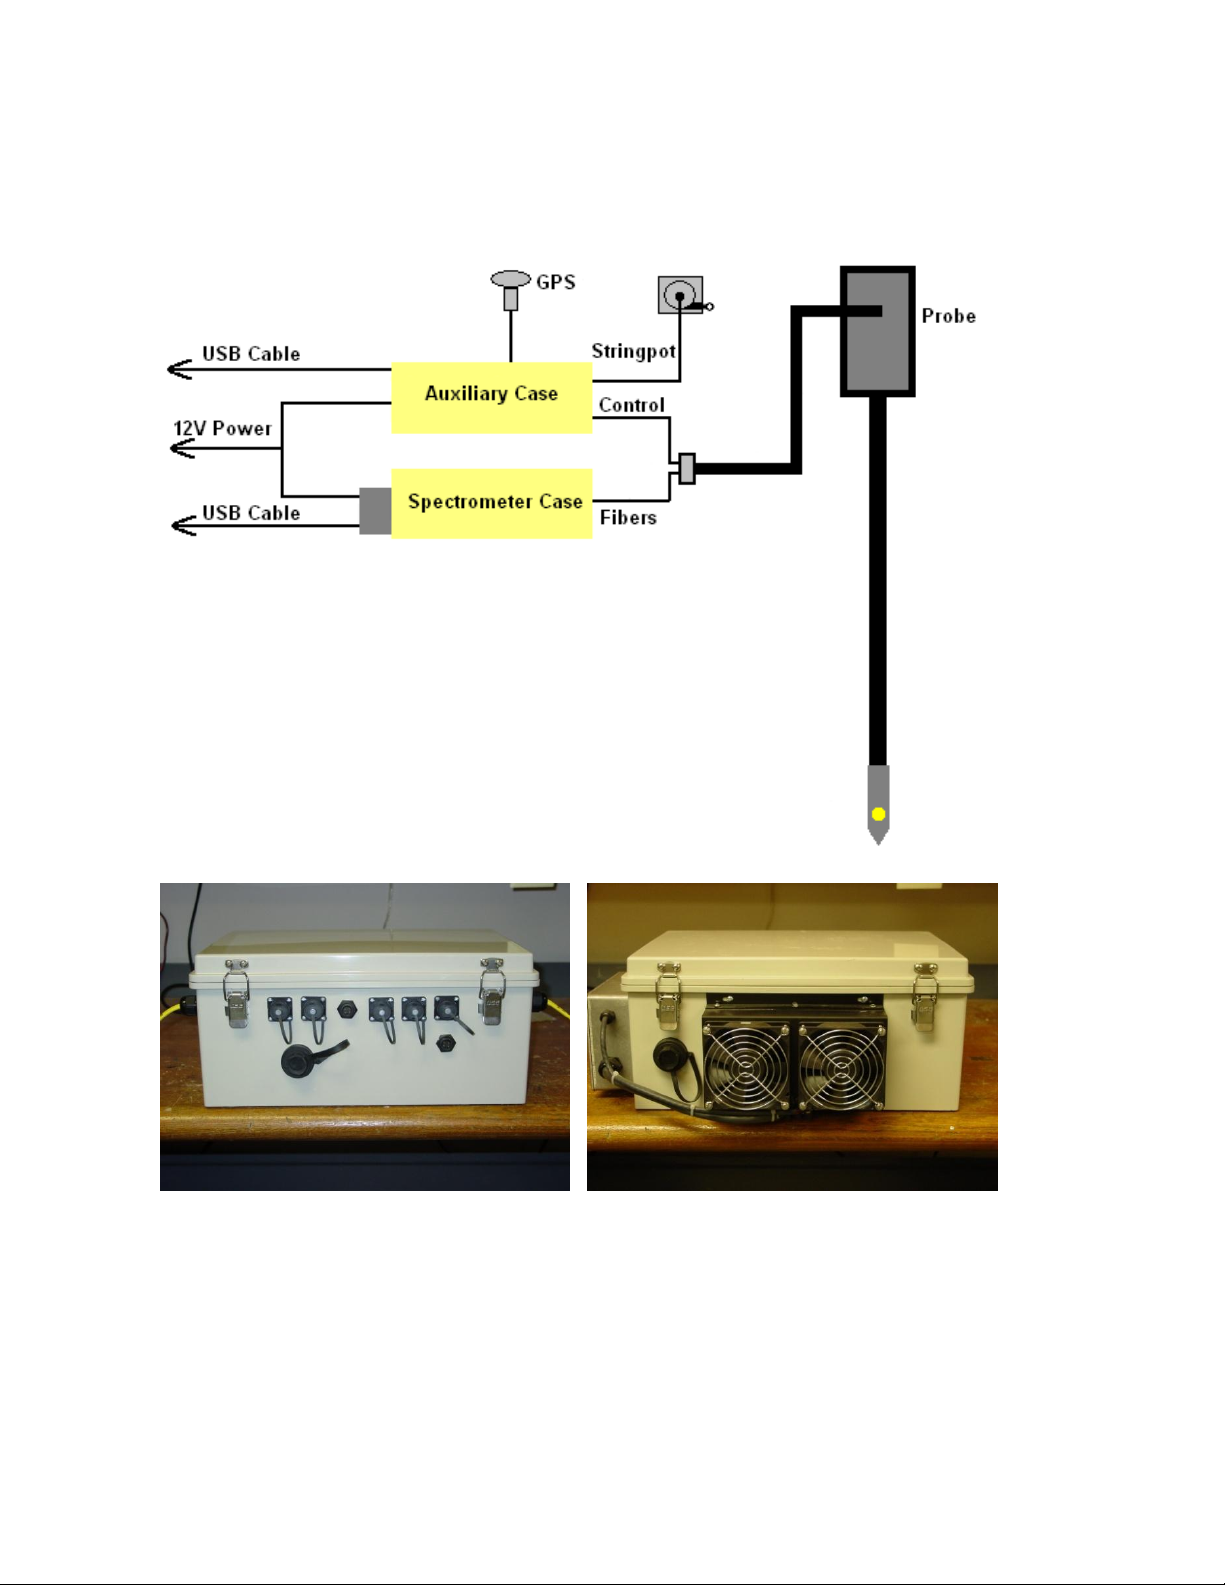
System diagram
OM17-P4000VIS-NIR
Electronics
Figure 5
Figures 6 and 7
2-3
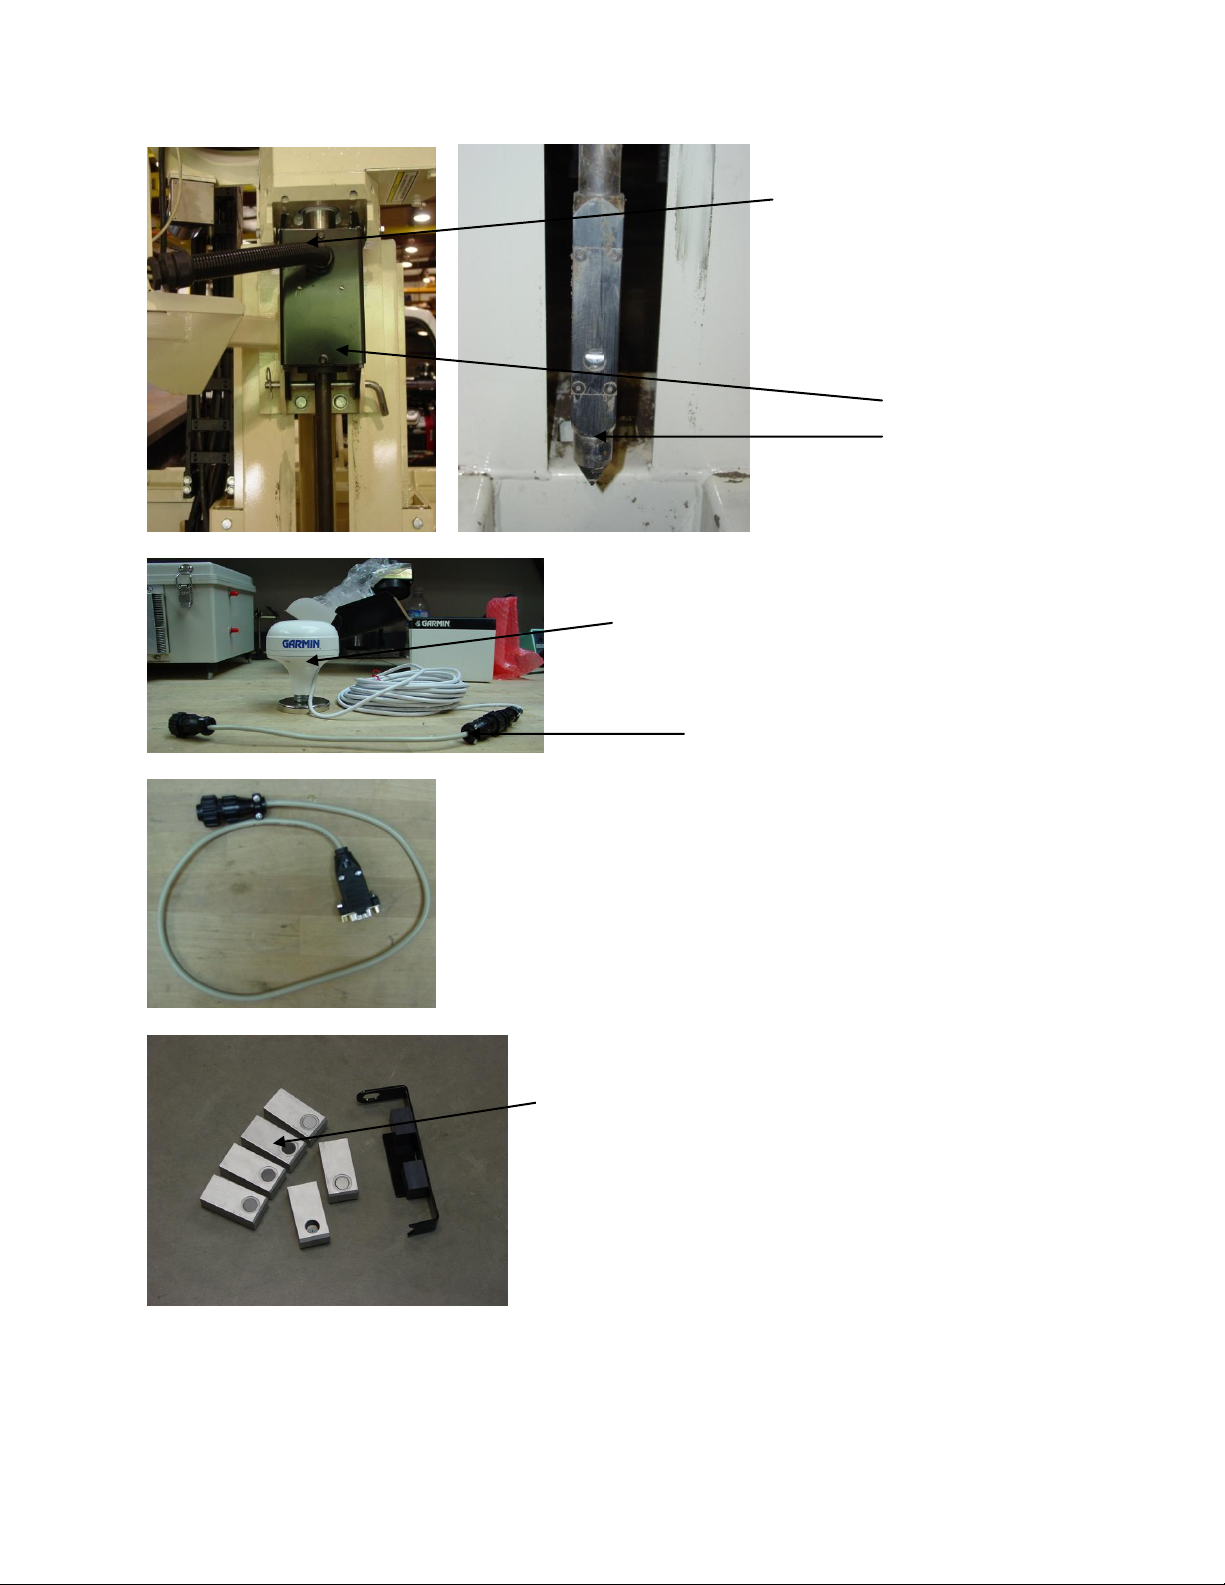
Figure 8&9
Probe module
#34848
Cable that includes fiber, motor
control and lamp power
Garmin GPS
# 21221 – for U.S. customers only
GPS adaptor cable #30727
Note: This adaptor cable is
required in order for
compatibility with the provided
Garmin GPS.
GPS serial adaptor cable
#35482
This will connect the serial port of a GPS to the
GPS port on the auxiliary case, for using an
alternate GPS to the Garmin. External power is
required for the GPS to function.
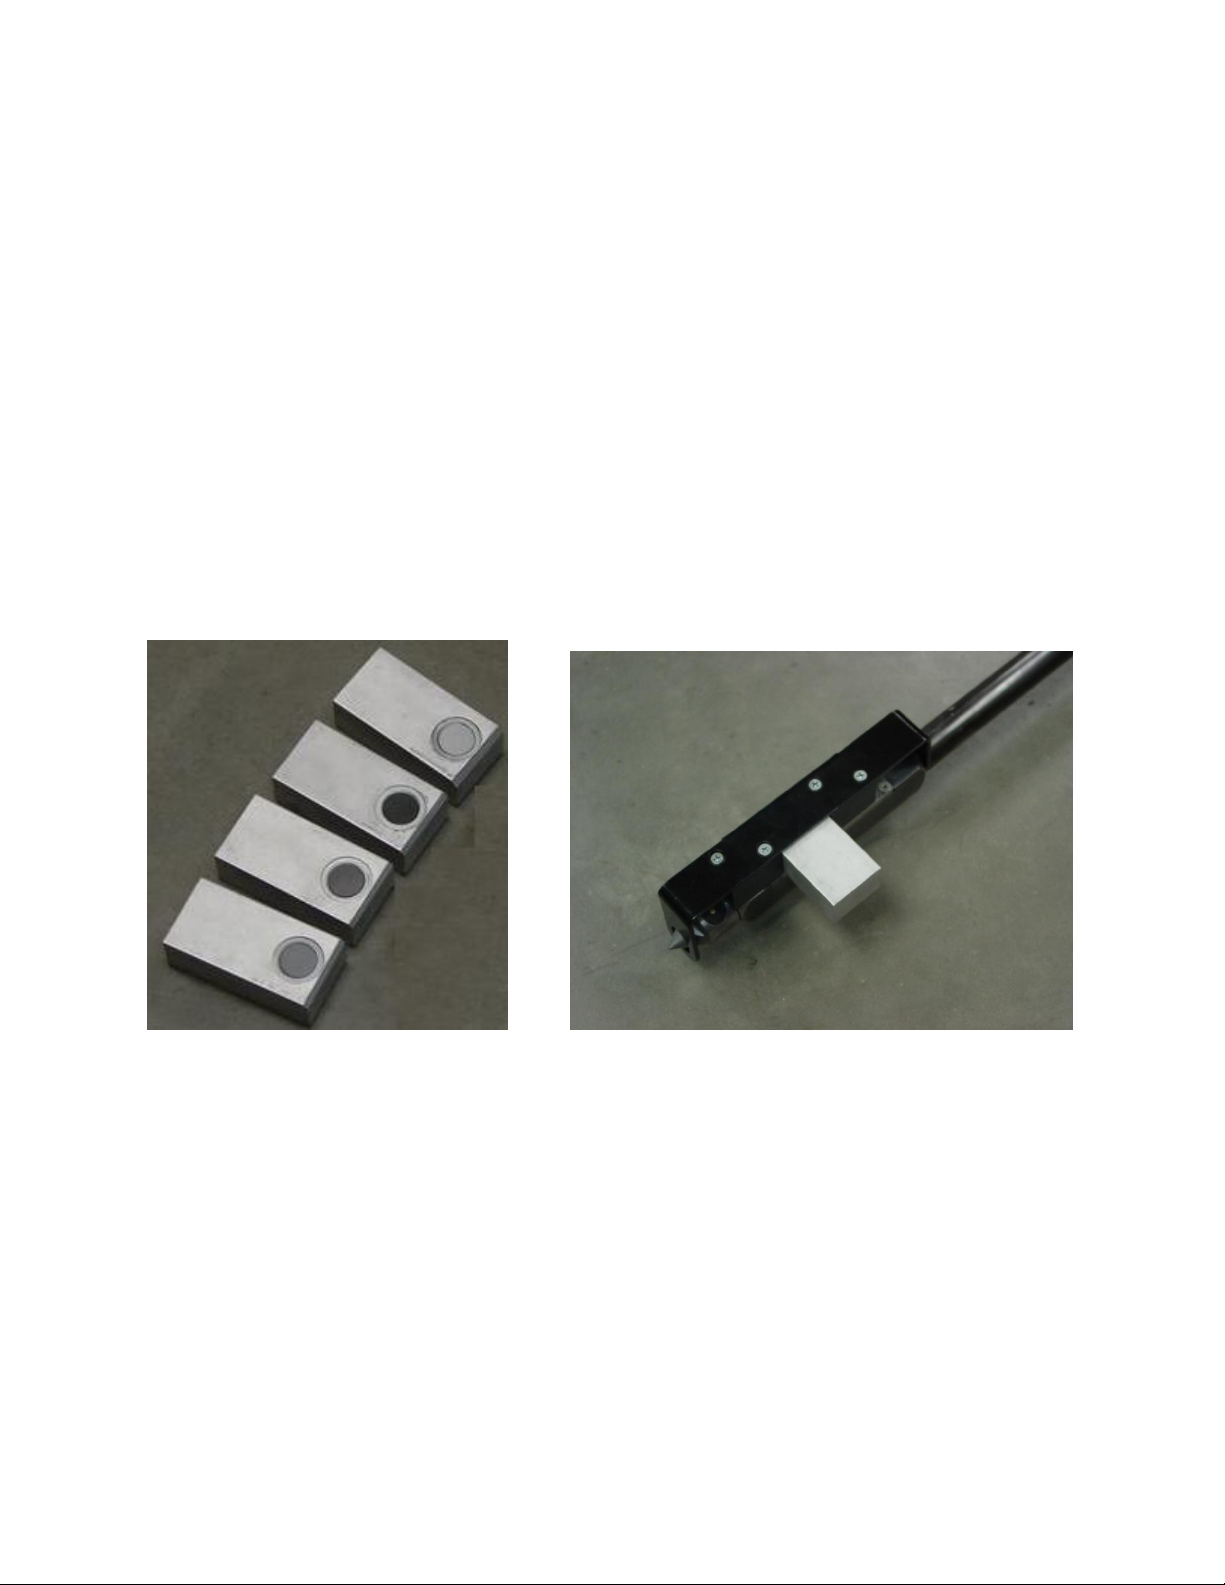
External reference blocks
which are used to calibrate
instrument during the system
check. (Labeled ER1 – ER4)
OM17-P4000VIS-NIR
Figure 10
Figure 11
Figure 12
2-4
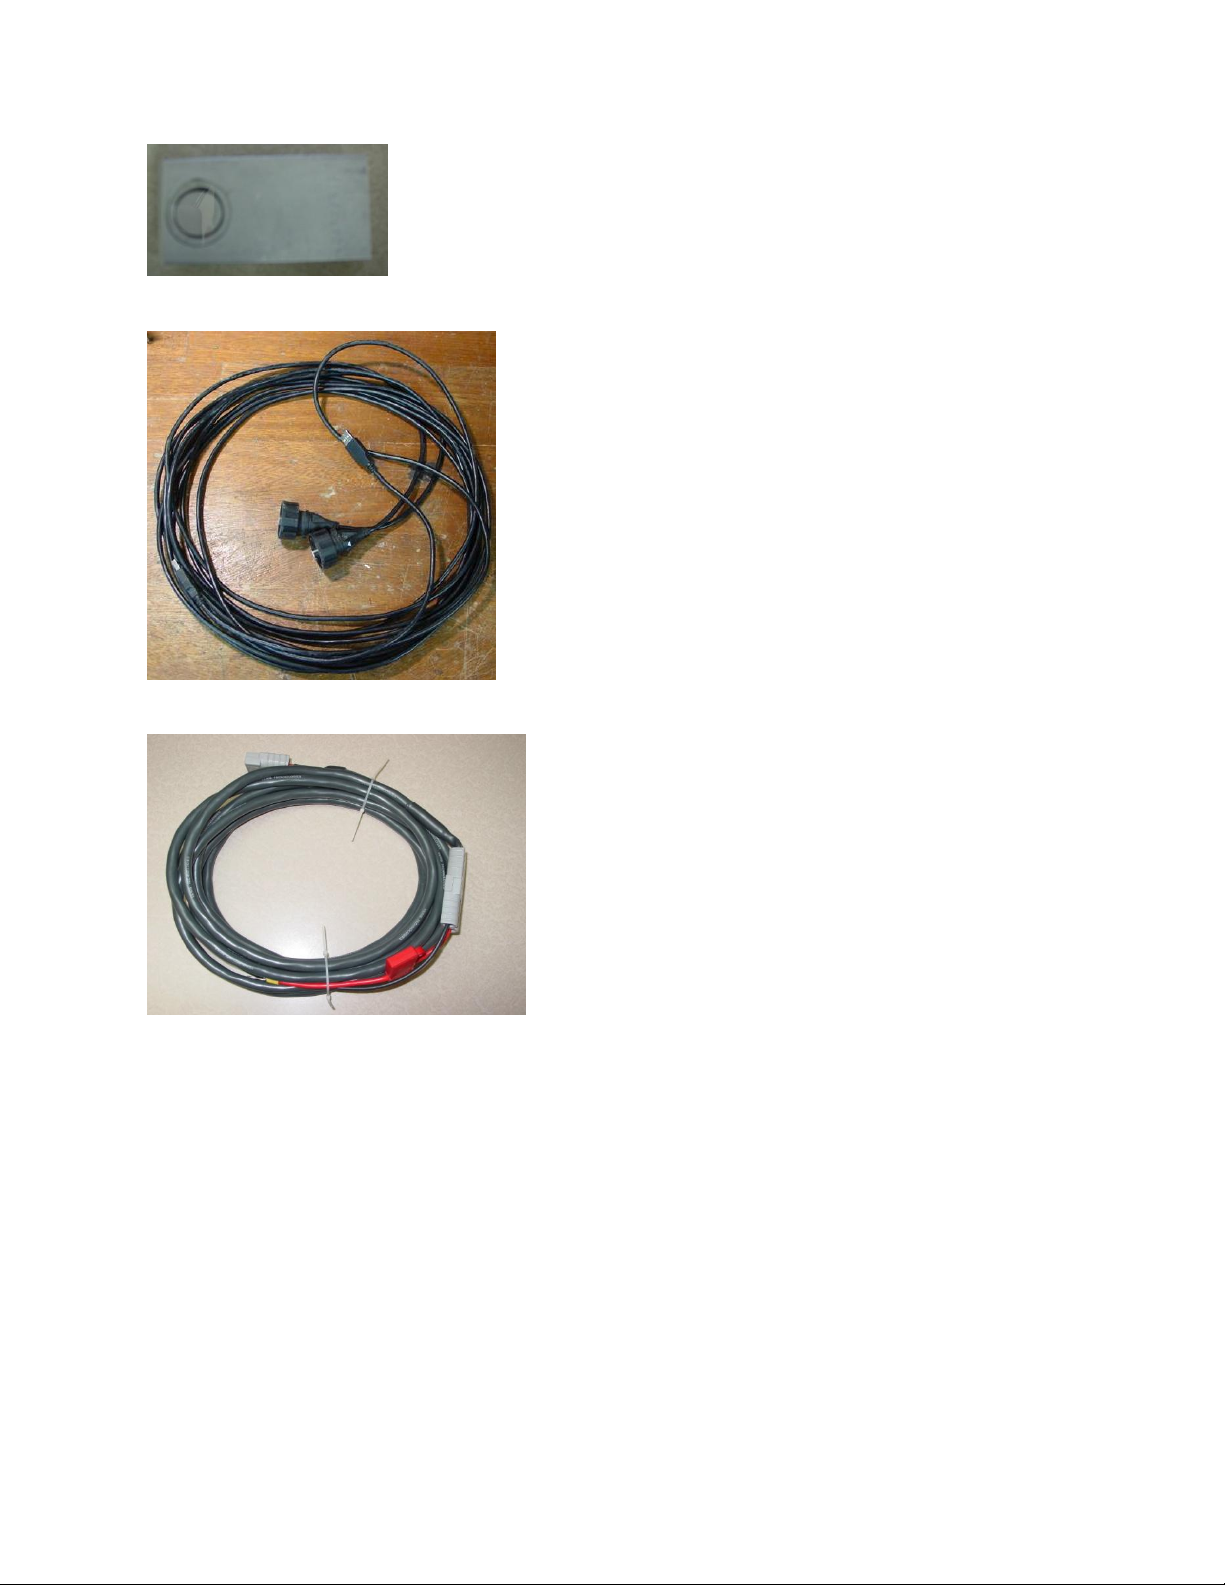
Figure 13
Reference block to be used for the manual
reference check, which needs to be taken every
10 mins or after every samples.
#38841
5-meter USB cables
#30281
Power cable
#39985
This is used to power the
instrument from a vehicle (for
field use).
Note: Only use 15-amp fuse
OM17-P4000VIS-NIR
Figure 14
Figure 15
2-5
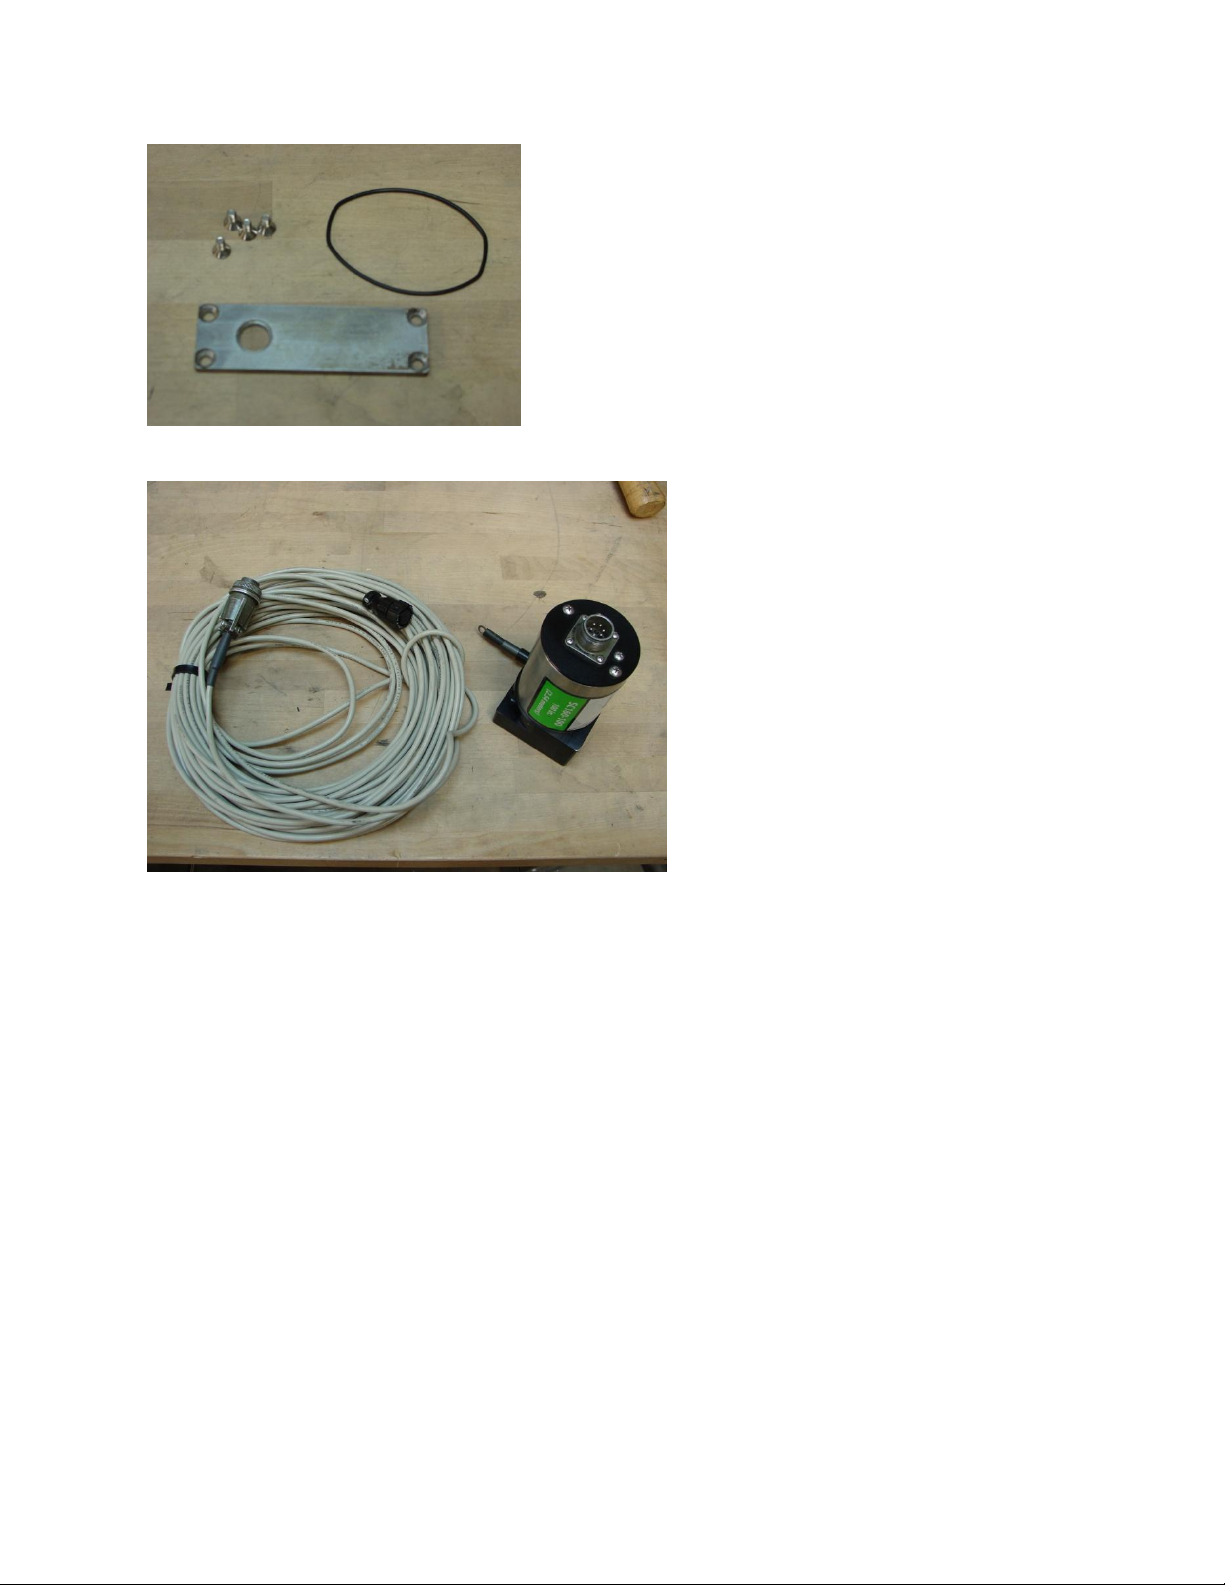
Figure 16
Probe Wear plate assembly
#38847
String Pot #SC160
String Pot Cable #38866
OM17-P4000VIS-NIR
Figure 17
2-6
OM17-P4000VIS-NIR
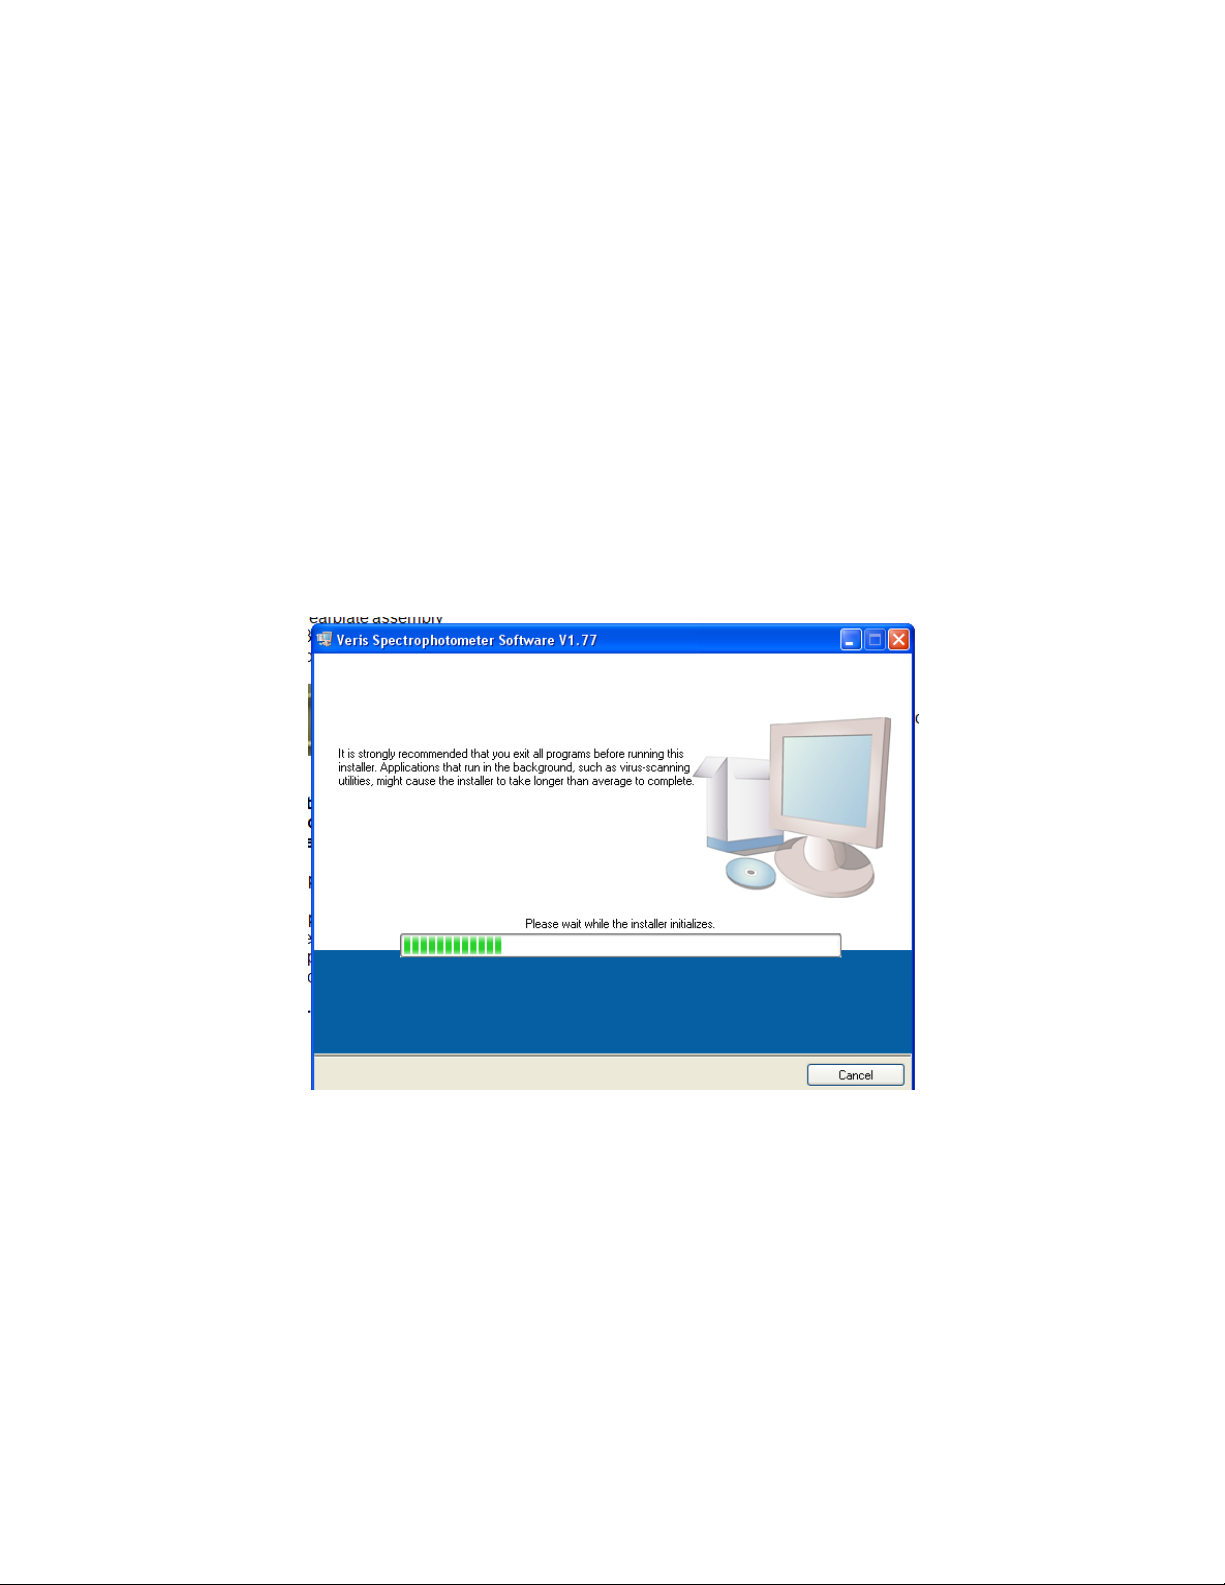
The Veris
Spectrophotometer
Software installer will
guide the user through
installation of the Veris
operating software and
the necessary drivers
needed to run the
spectrometers. Note:
Do not plug in USB
cables for cases at
this time.
Section 3
Software Installation and Setup
Software Installation
Note: For computers outside the United States of America, please make the following
change to the computer’s regional settings before installing the Veris
Spectrophotometer Software.
Step 1: Open control panel and double click on Regional and Language Options
Step 2: Click on Customize, the following screen will appear. The Decimal symbol
needs to be a “.” while the Digit grouping symbol needs to be a “,”. The will ensure
proper operation of the software. Once the changes have been made click OK and
proceed with installation.
Veris Spectrophotometer Software Installation
Figure 1
Veris Spectrophotometer Software V1.77 and up will run on either Windows XP,
Vista or 7—32 bit operating systems only
3-1
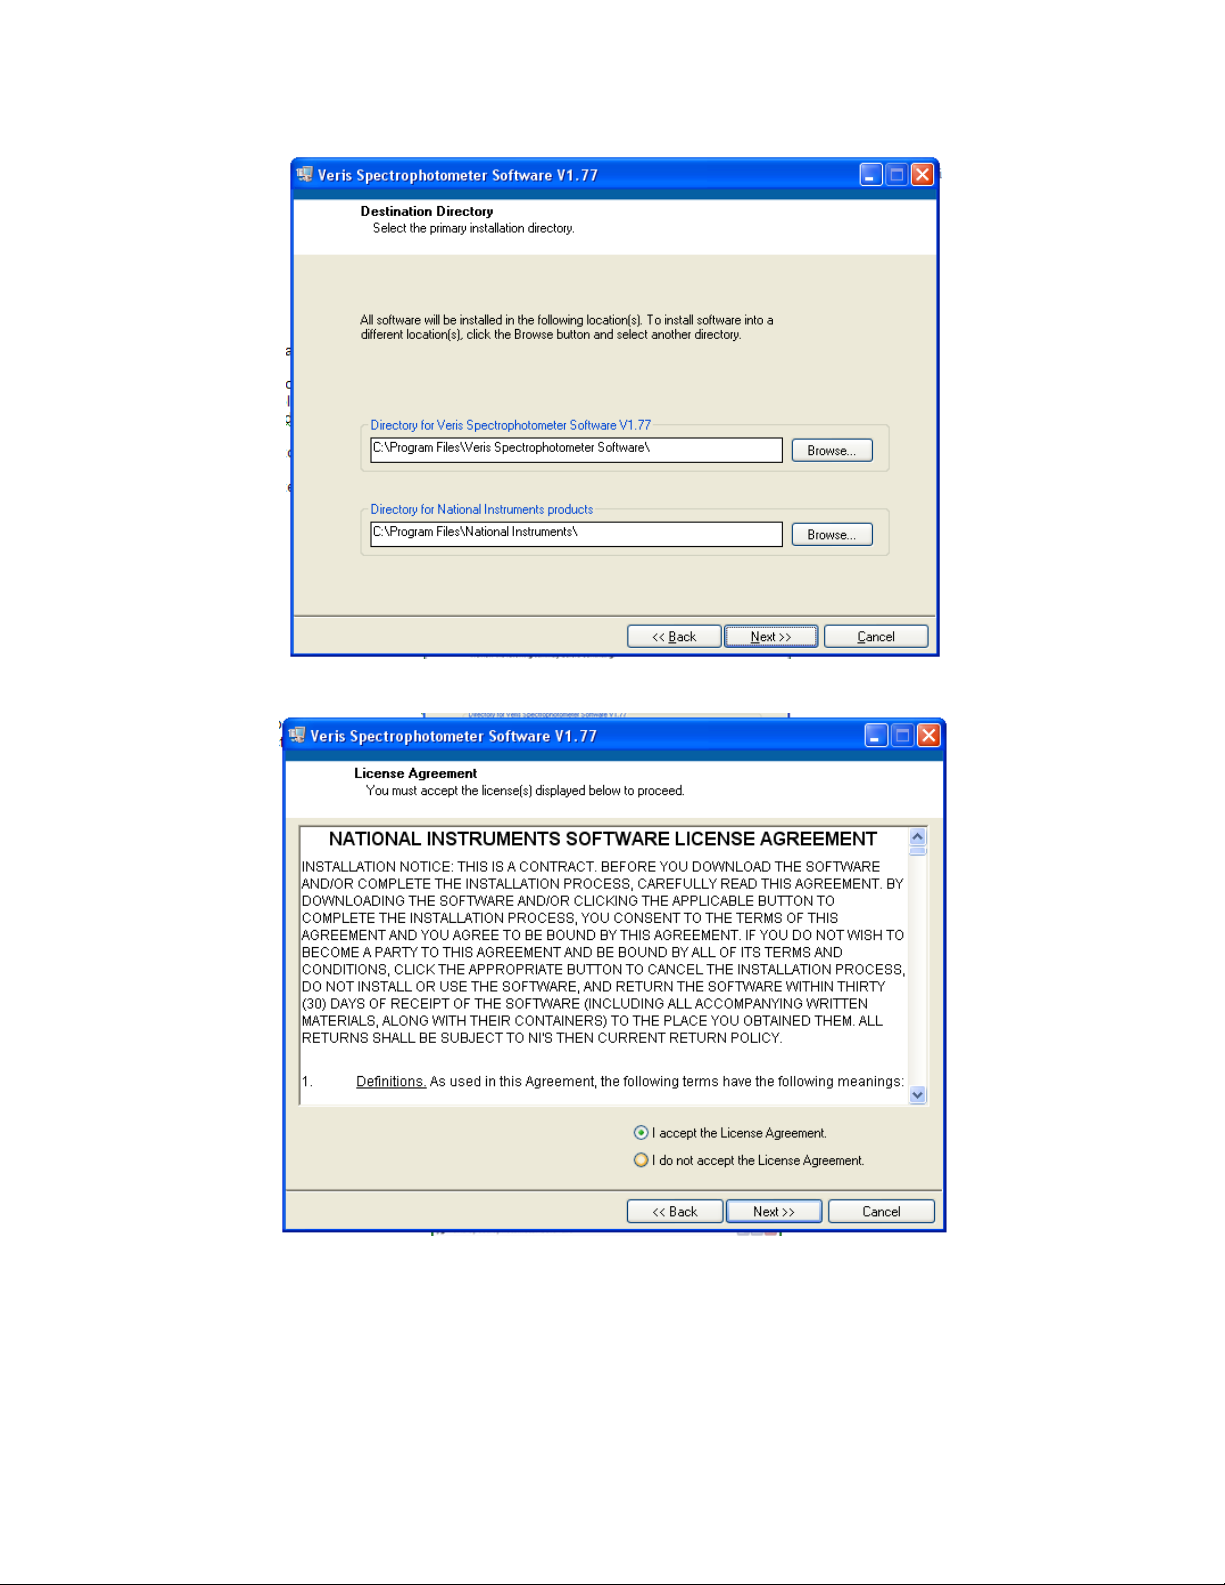
Figure 2
Keep the default
directory and click next
OM17-P4000VIS-NIR
Figure 3
3-2
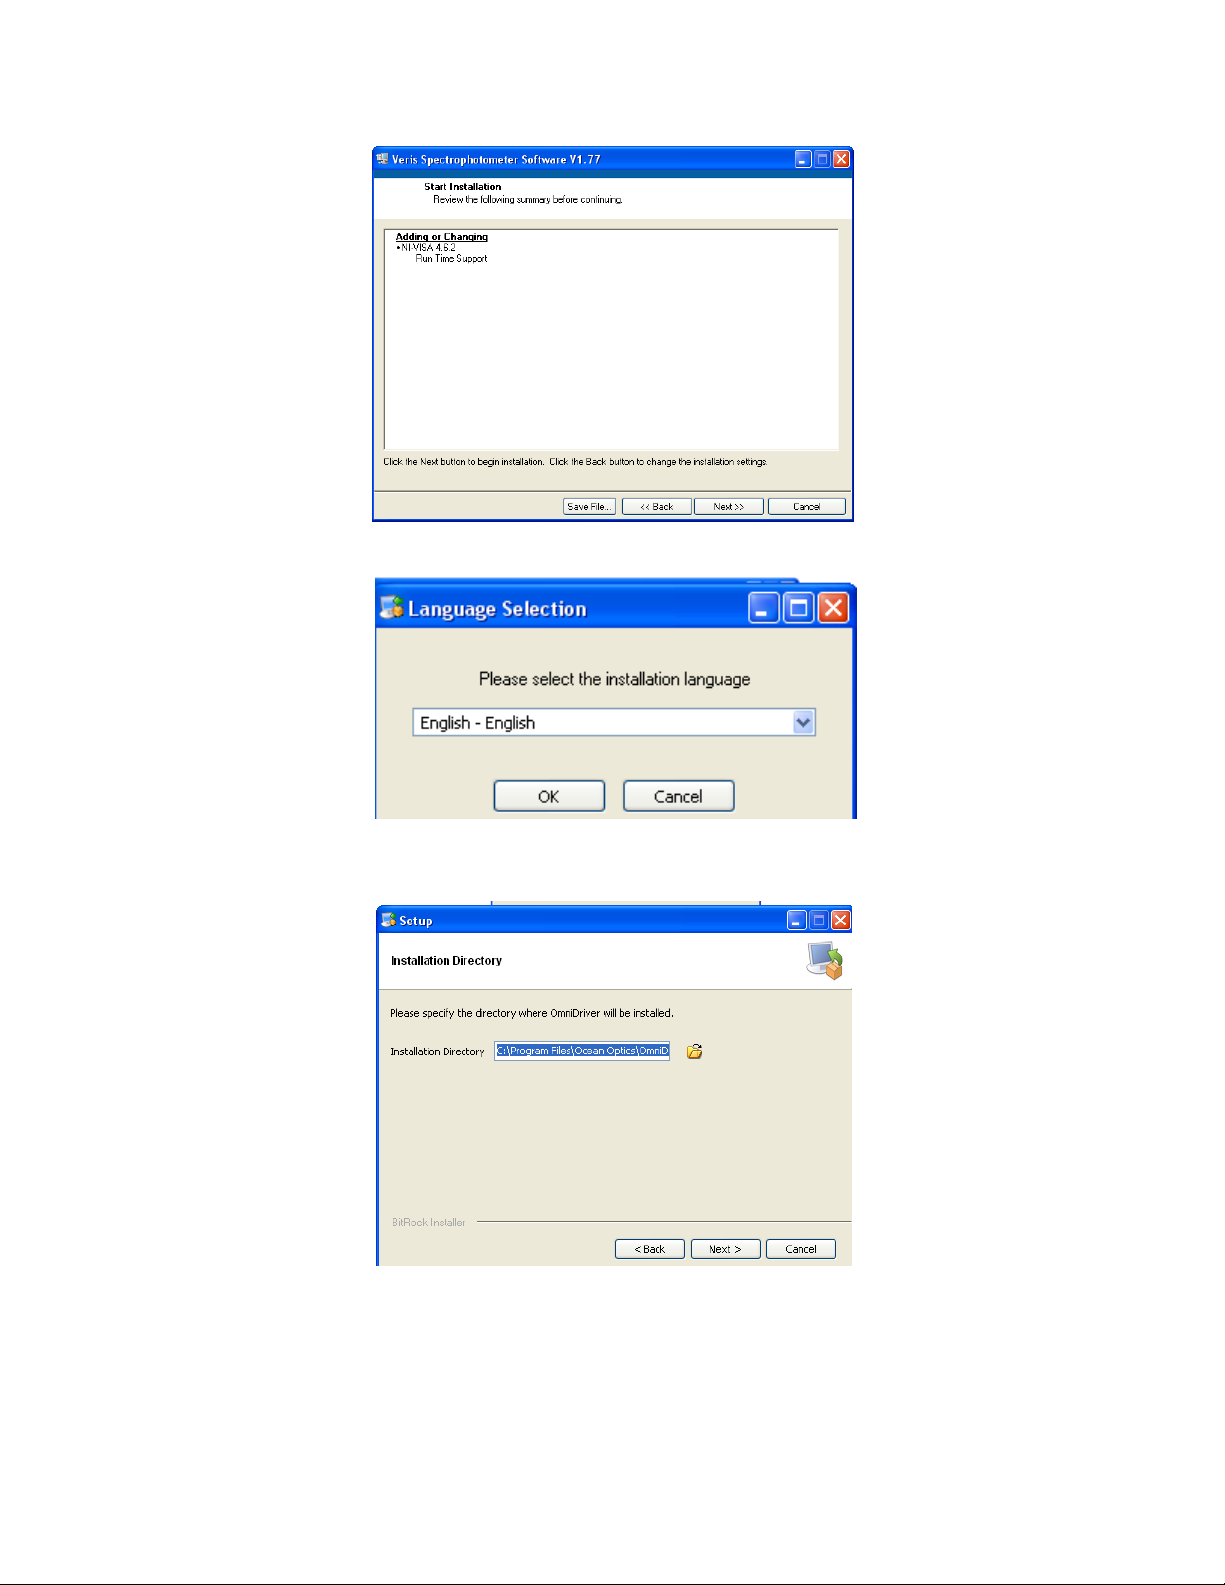
Figure 4
Select next to
complete install
Now the ocean optics
drivers will be installed.
Select language and
continue.
Leave the default
directory and click next
OM17-P4000VIS-NIR
Figure 5
Figure 6
3-3
OM17-P4000VIS-NIR
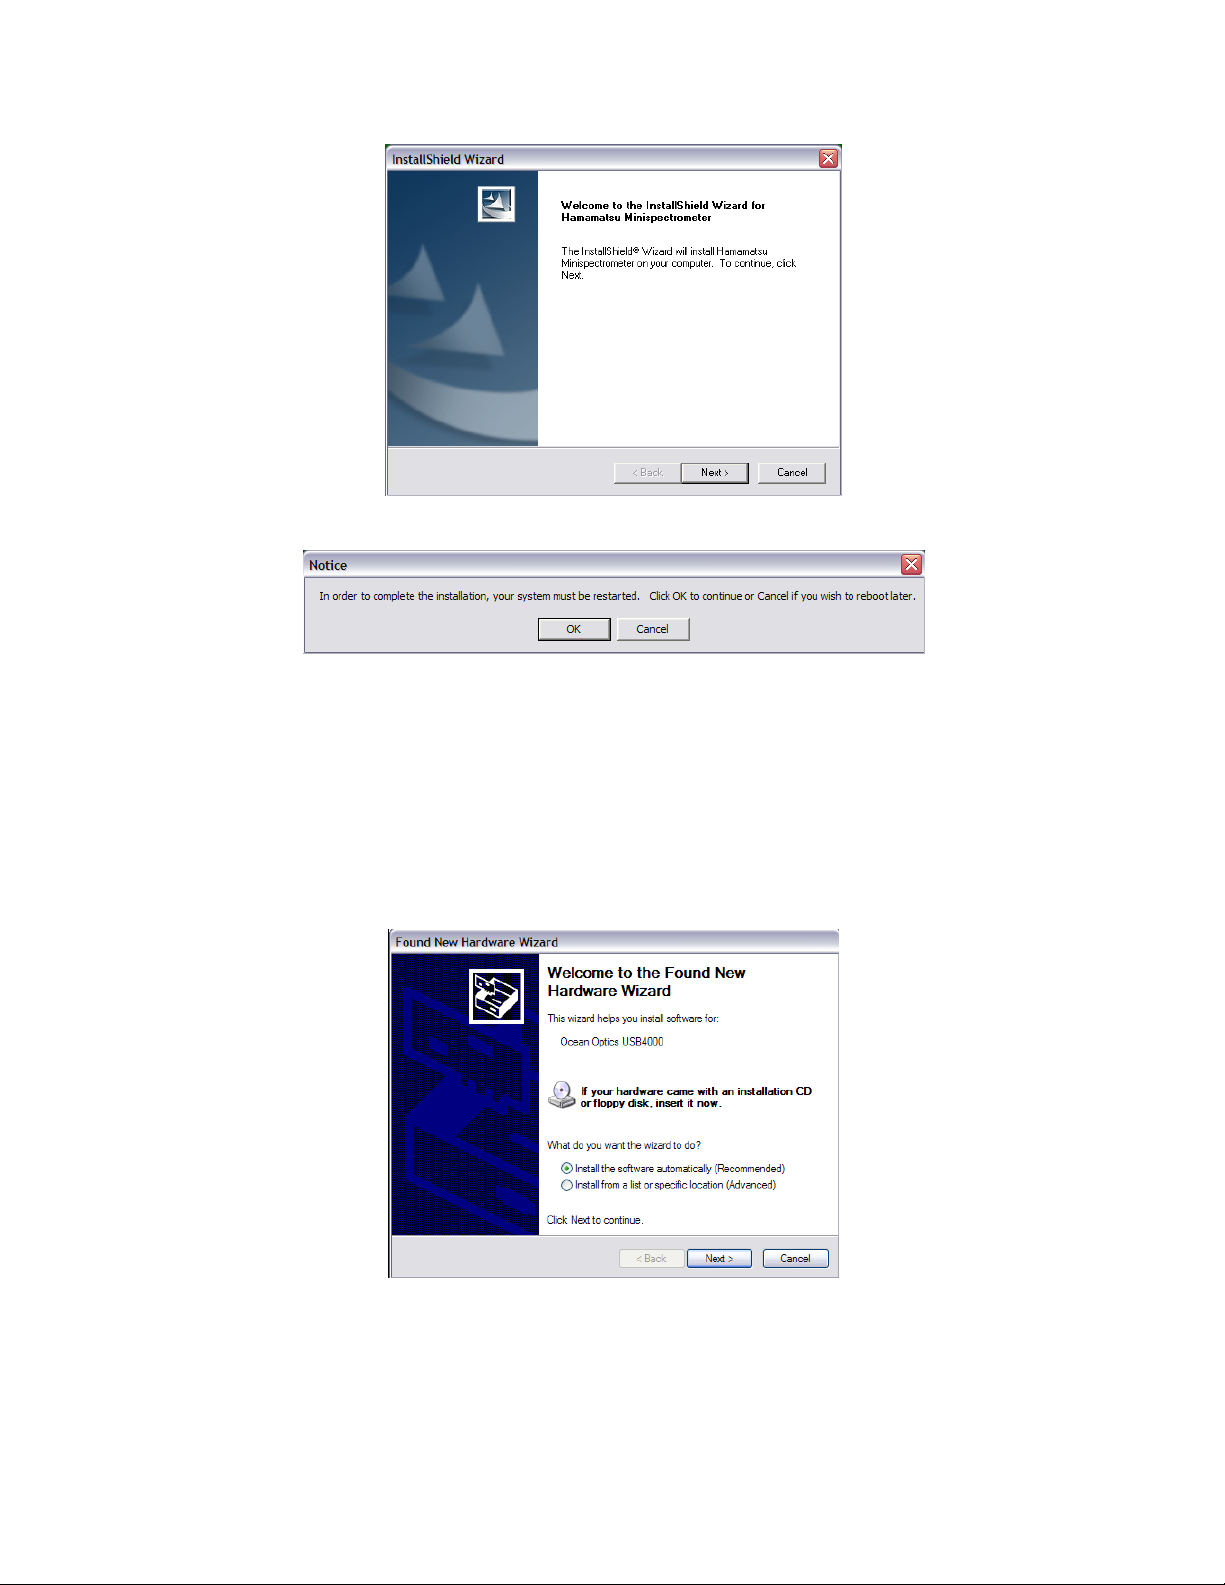
Next the Hamamatsu
Minispectrometer
installation guide will
appear. Click next two
process through the
installer
At this point it is
OK to restart the
computer
Select Install the
software automatically,
then click Next to
complete the hardware
installation.
Figure 7
Figure 8
Once the restart is complete, plug in the USB cables for the auxiliary and spectrometer
cases
MS Windows may then bring up the following screens about the Ocean Optics
spectrometer and the Hamamatsu spectrometer.
Figure 9
3-4
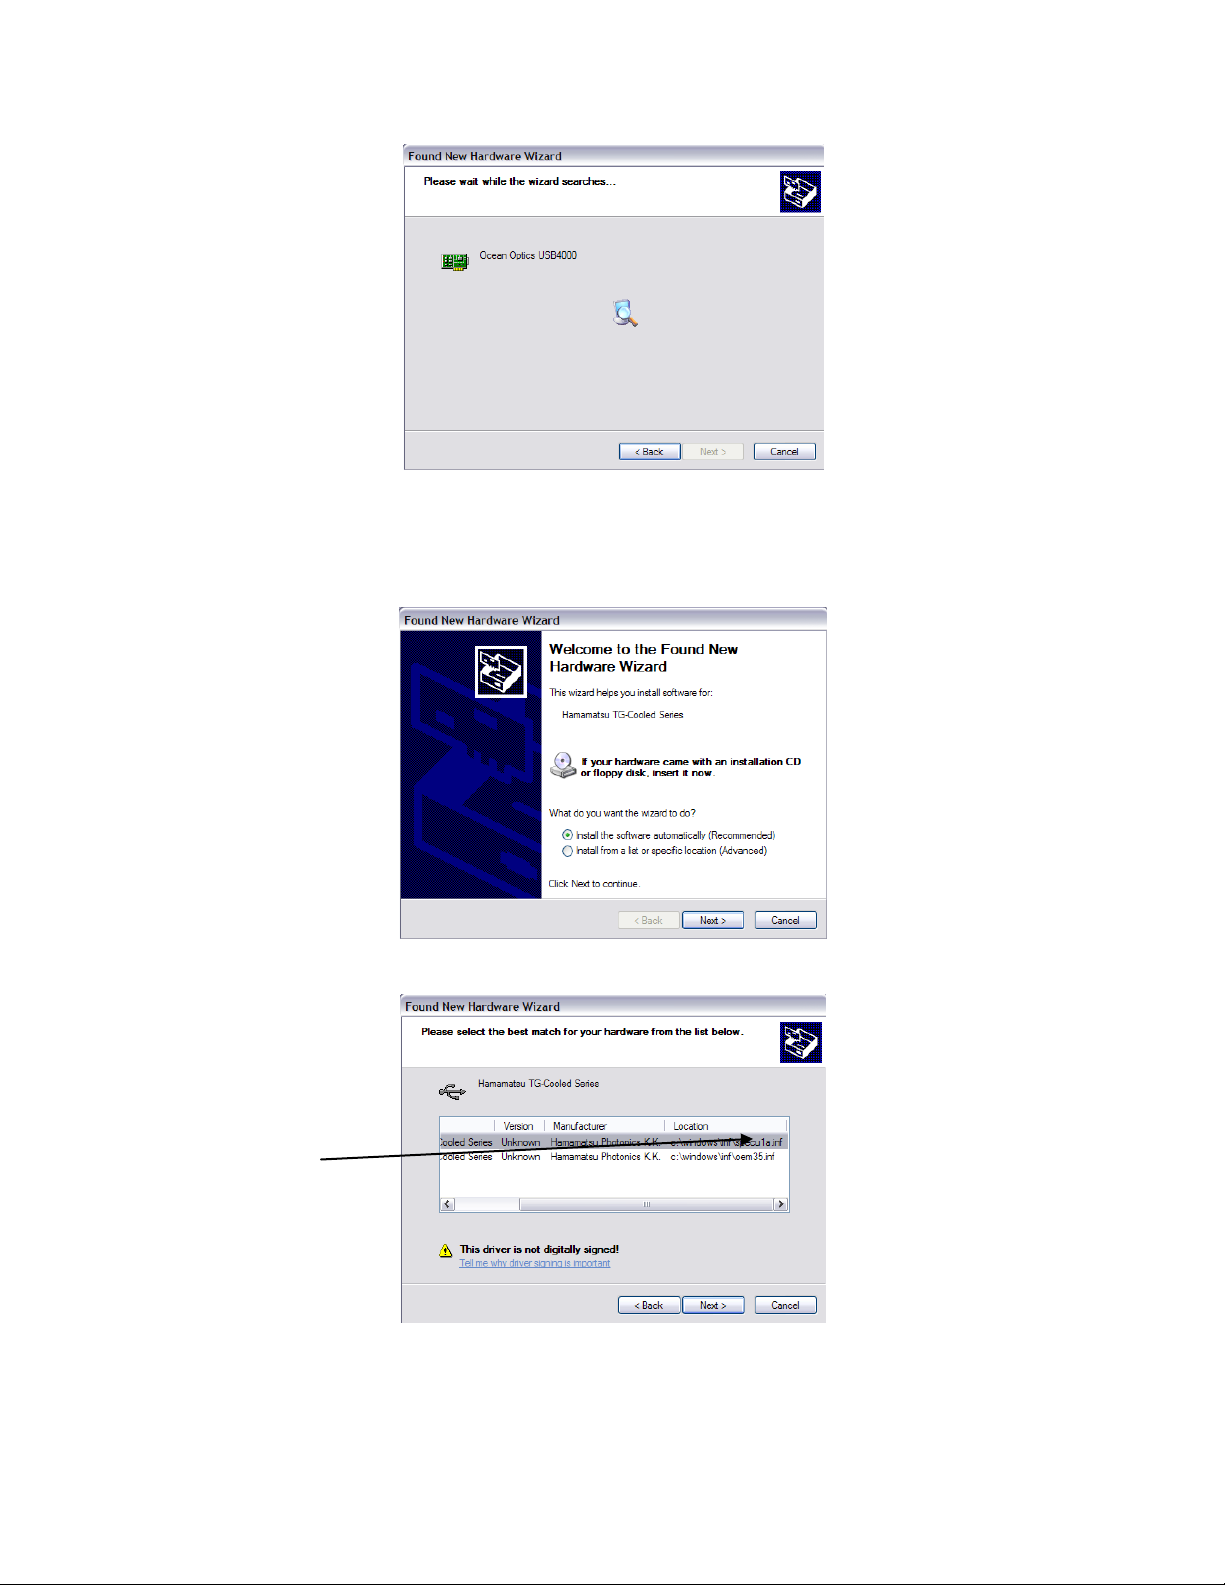
OM17-P4000VIS-NIR
Windows will
automatically find the
correct drivers for the
Ocean Optics USB4000.
For the Hamamatsu
installation select Install
the software
automatically then Next
to complete installation.
If this screen appears
asking for the driver
version to be installed
always use the
specu1a.inf, then
select Next.
Figure 10
After completing the Ocean Optics MS Windows installer, the Hamamatsu installer may
appear. Note: These installers may appear in any order.
Figure 11
Figure 12
3-5
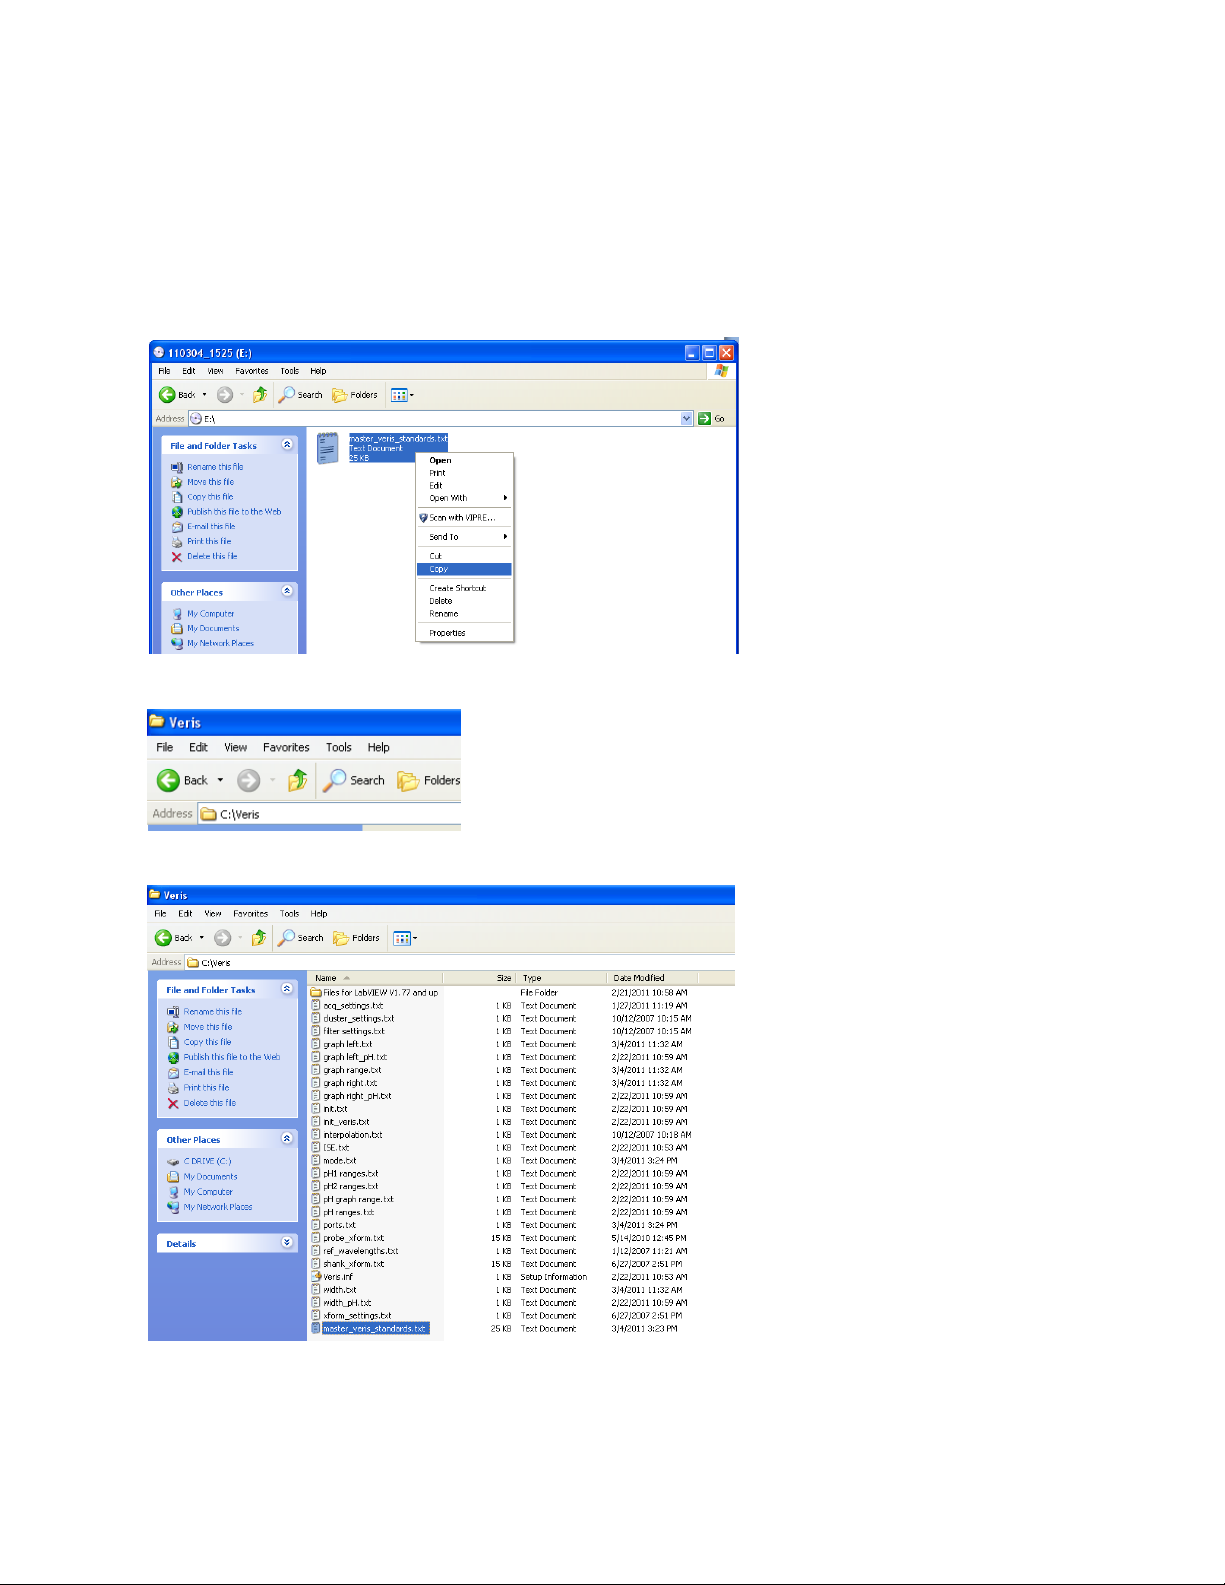
OM17-P4000VIS-NIR
The master_veris_standards
file is specific to your external
references and is provided by
Veris.
Installation of Calibration Files
This must be complete for the software to be operational
Copy the master_veris_standards.txt file from the calibration CD into the C:\Veris
directory
Figure 13
Figure 14
Figure 15
3-6
OM17-P4000VIS-NIR
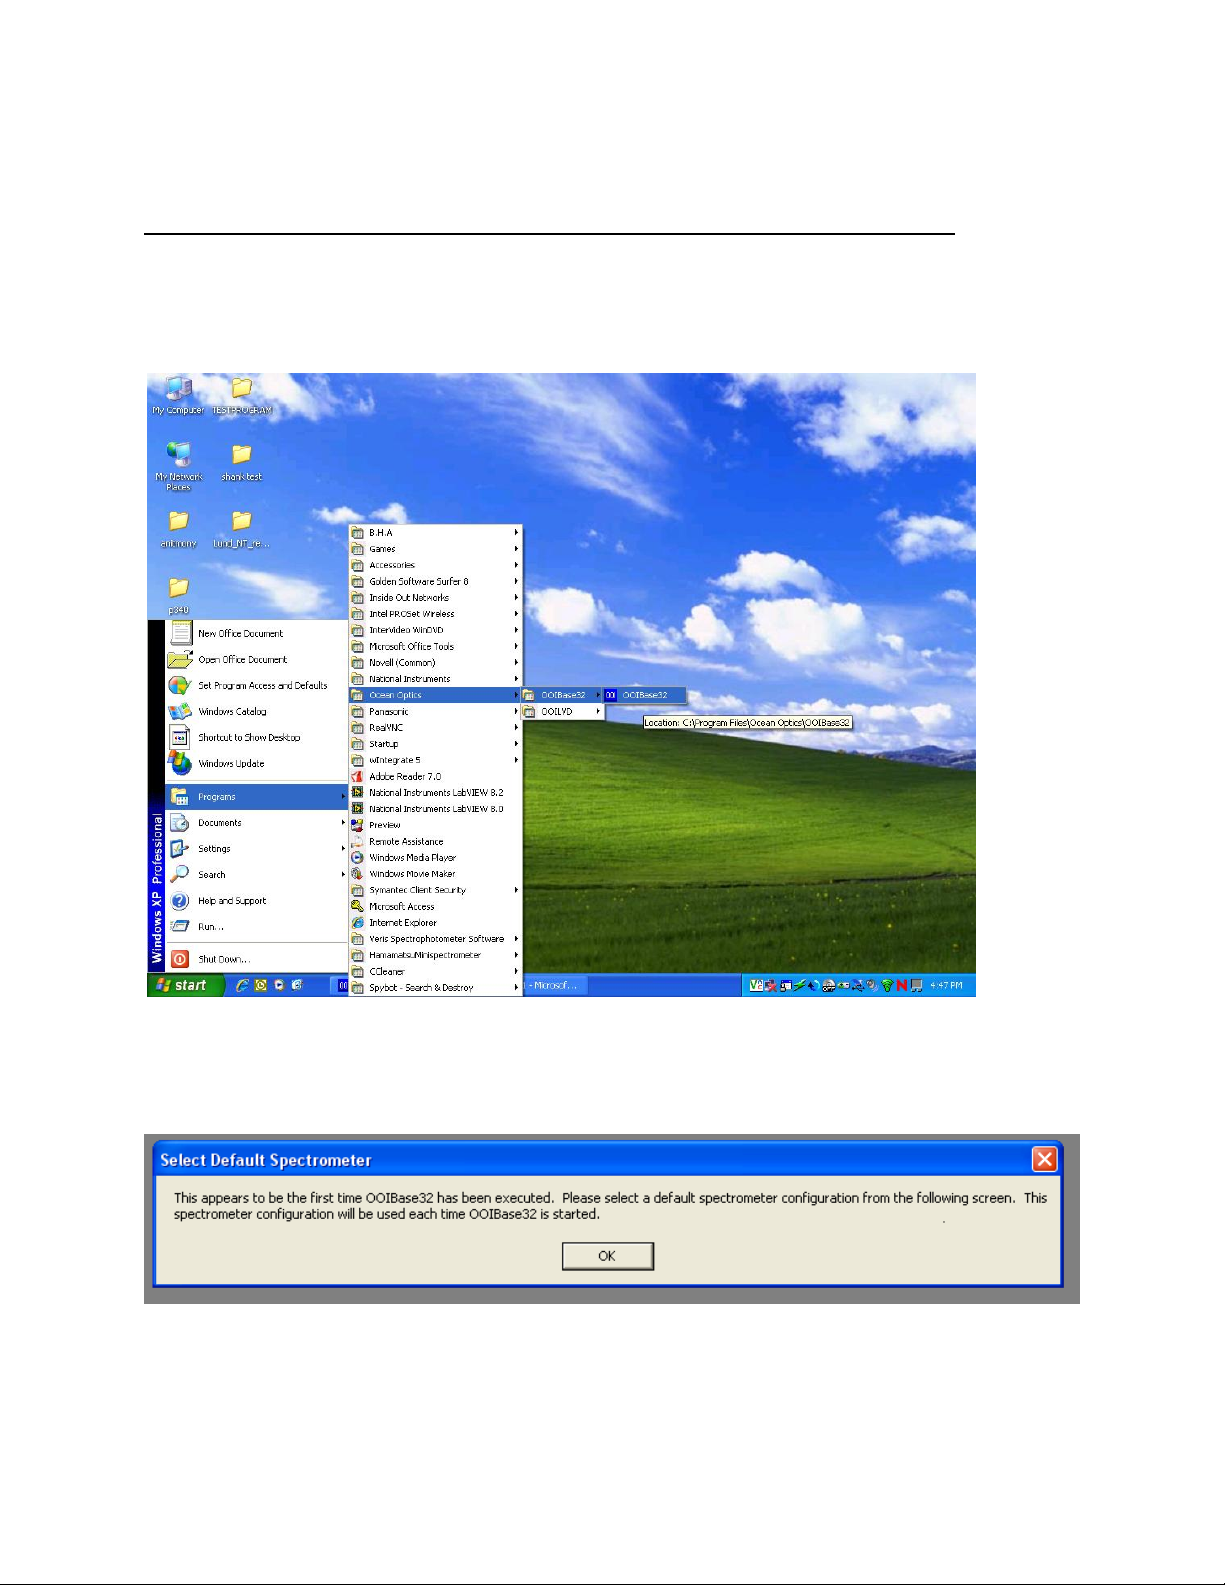
Ocean Optics Spectrometer Configuration
Only necessary for Veris Spectrophotometer Software V1.76 and below
Step 1: Open OOIBase32 Software
Start Ocean Optics software (Start programs Ocean Optics OOIBase32)
a. If software asks for a default spectrometer file click cancel
Figure 16
If it asks for a spectrometer configuration click, OK
Figure 17
3-7
OM17-P4000VIS-NIR
If software asks for a default spectrometer file click Cancel
Figure 18
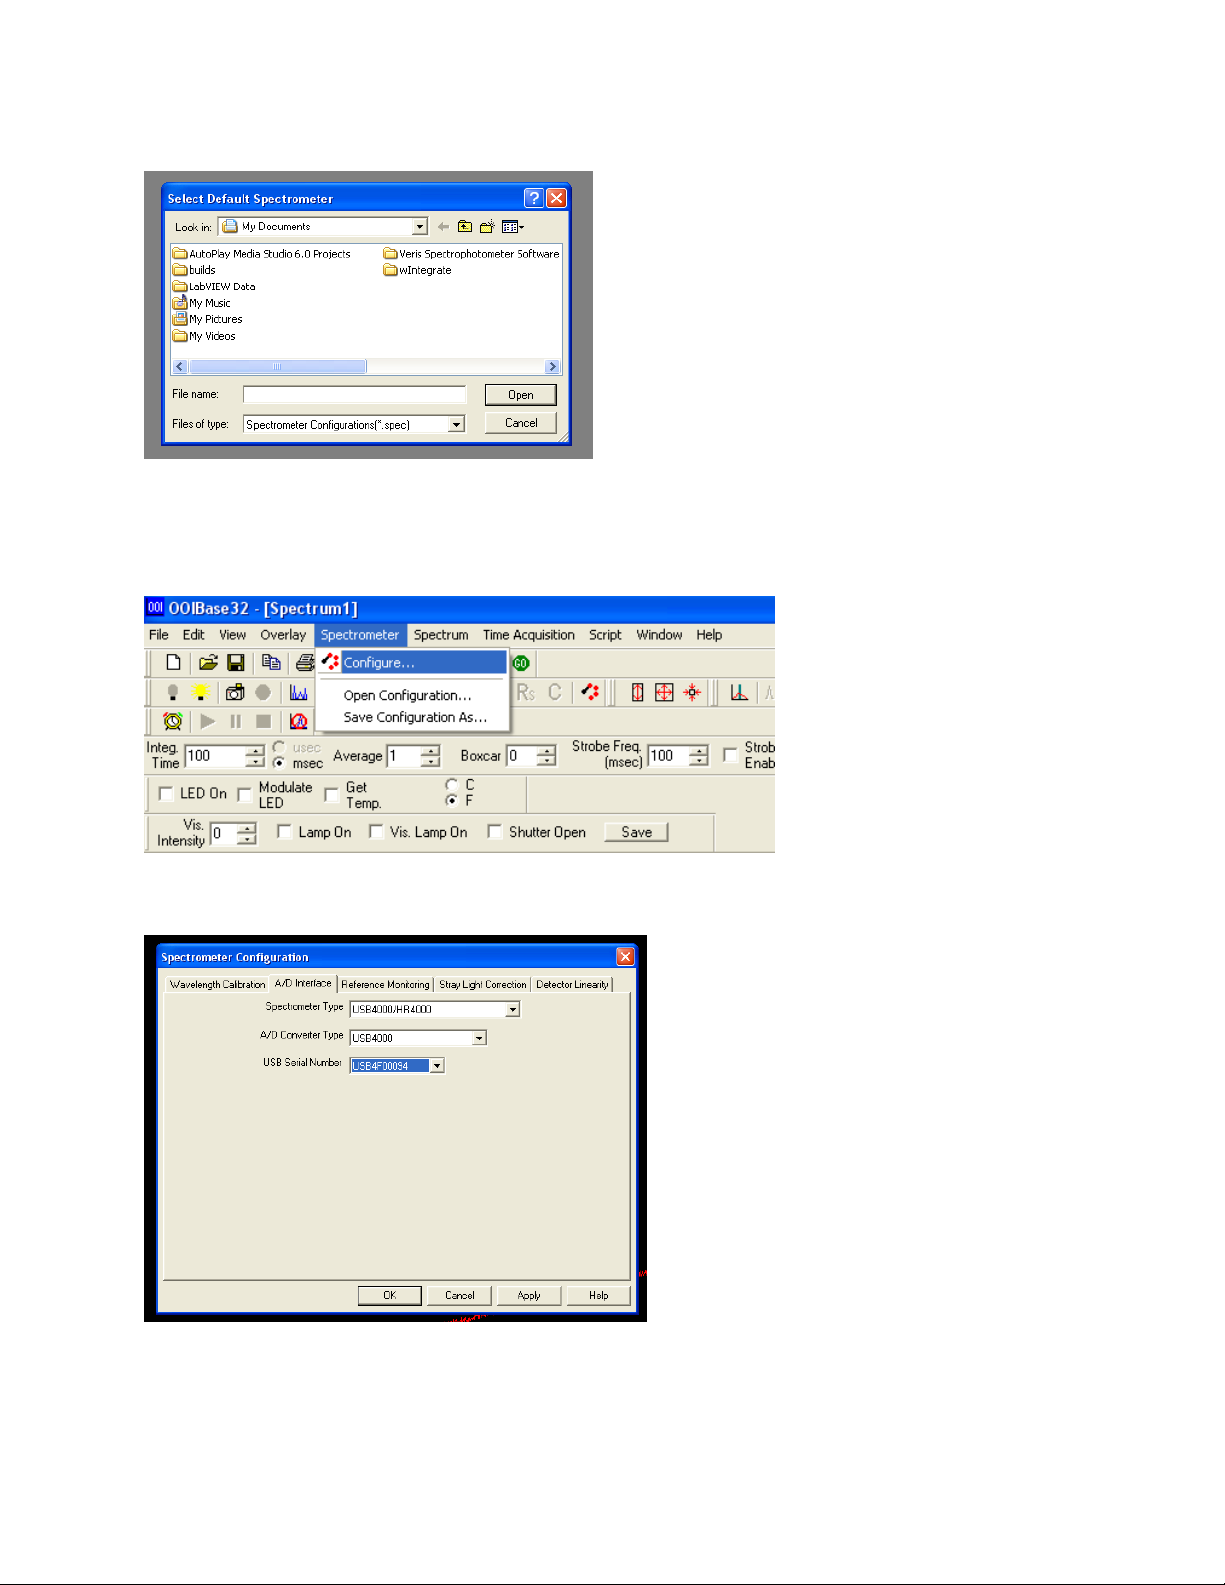
Step 2: Open Configuration
Click on Spectrometer in the toolbar at the top and then select Configure
Figure 19
On the configuration screen select the A/D Interface tab
Figure 20
Note: Under Spectrometer Type if USB4000/HR4000 is not available select S4000
3-8
OM17-P4000VIS-NIR
Under serial # only one spectrometer number should be present. If no serial number is
present close out of the software, unplug the USB cable and reinsert the USB cable,
wait to see if windows recognizes a new device, then proceed to the open the Ocean
Optics software and try again.
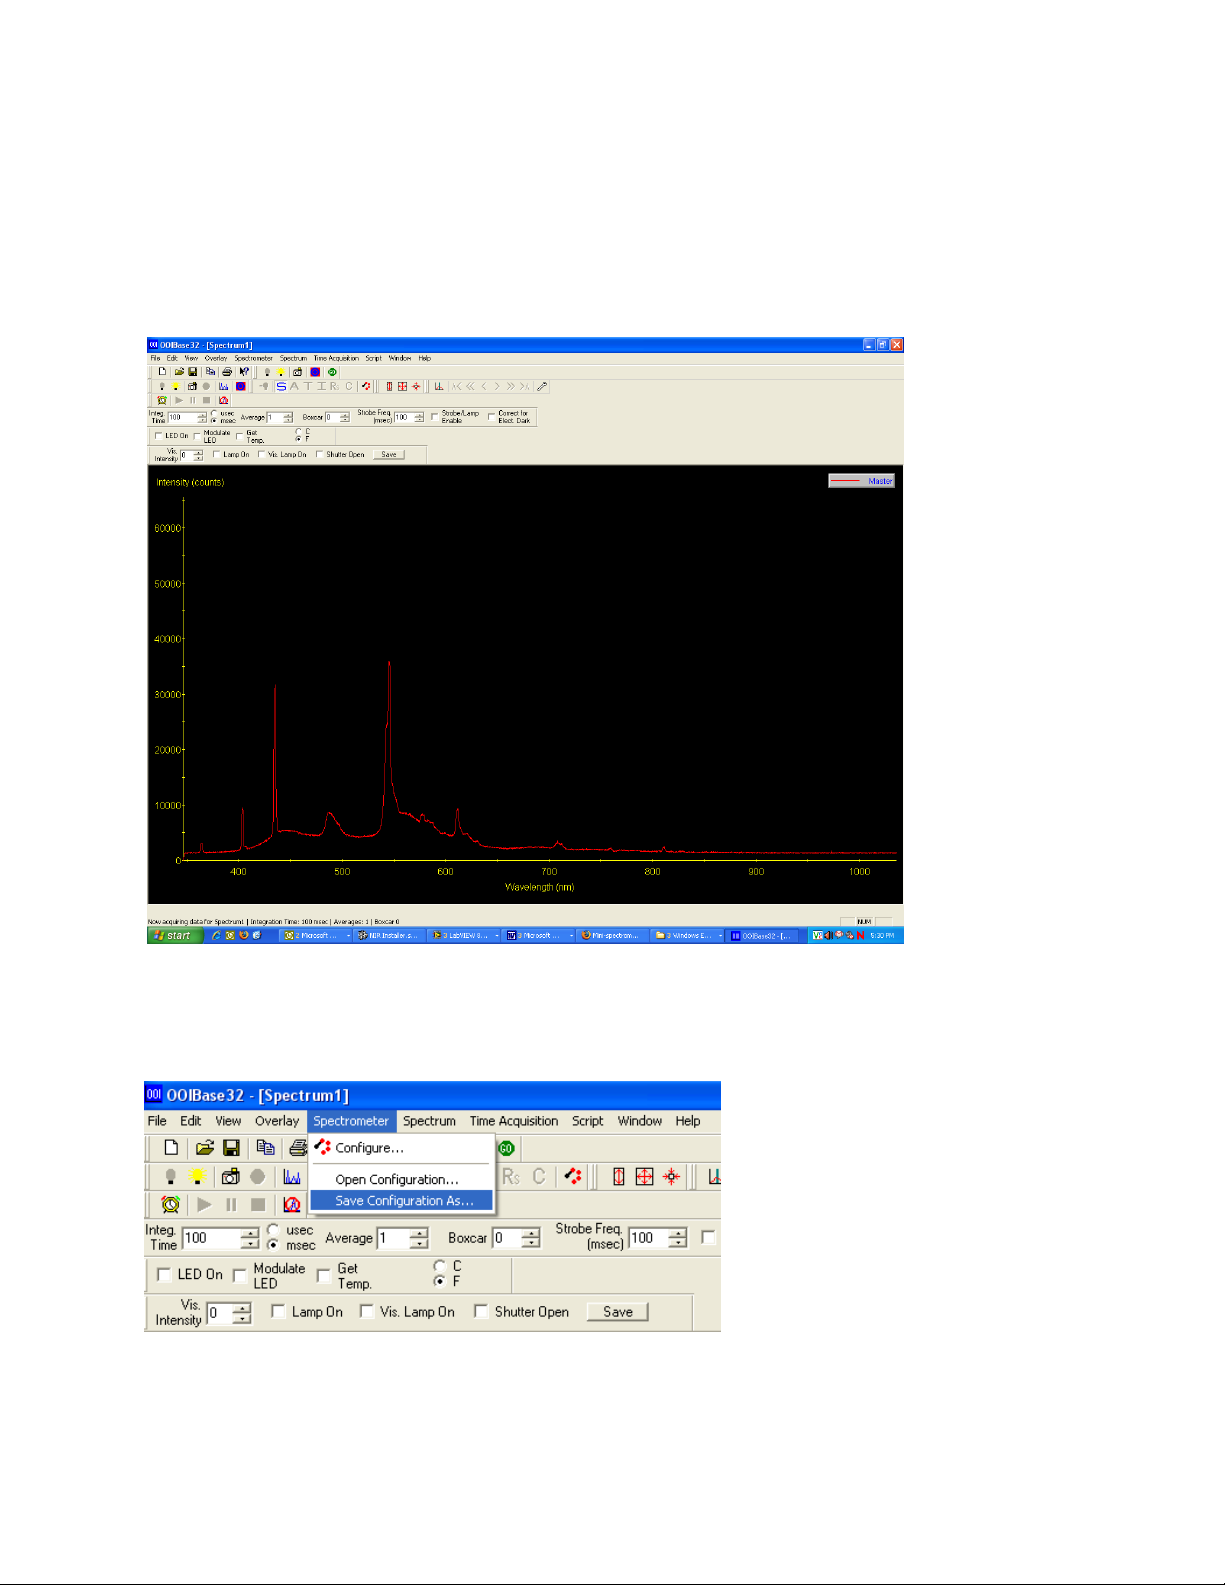
Click OK and a spectrum will be present on the screen.
Figure 21
Example of spectrum that should be shown on screen (when light is on at probe).
Step 3: Save Configuration
Figure 22
3-9
OM17-P4000VIS-NIR
Click on Spectrometer then Save Configuration As.
Figure 23
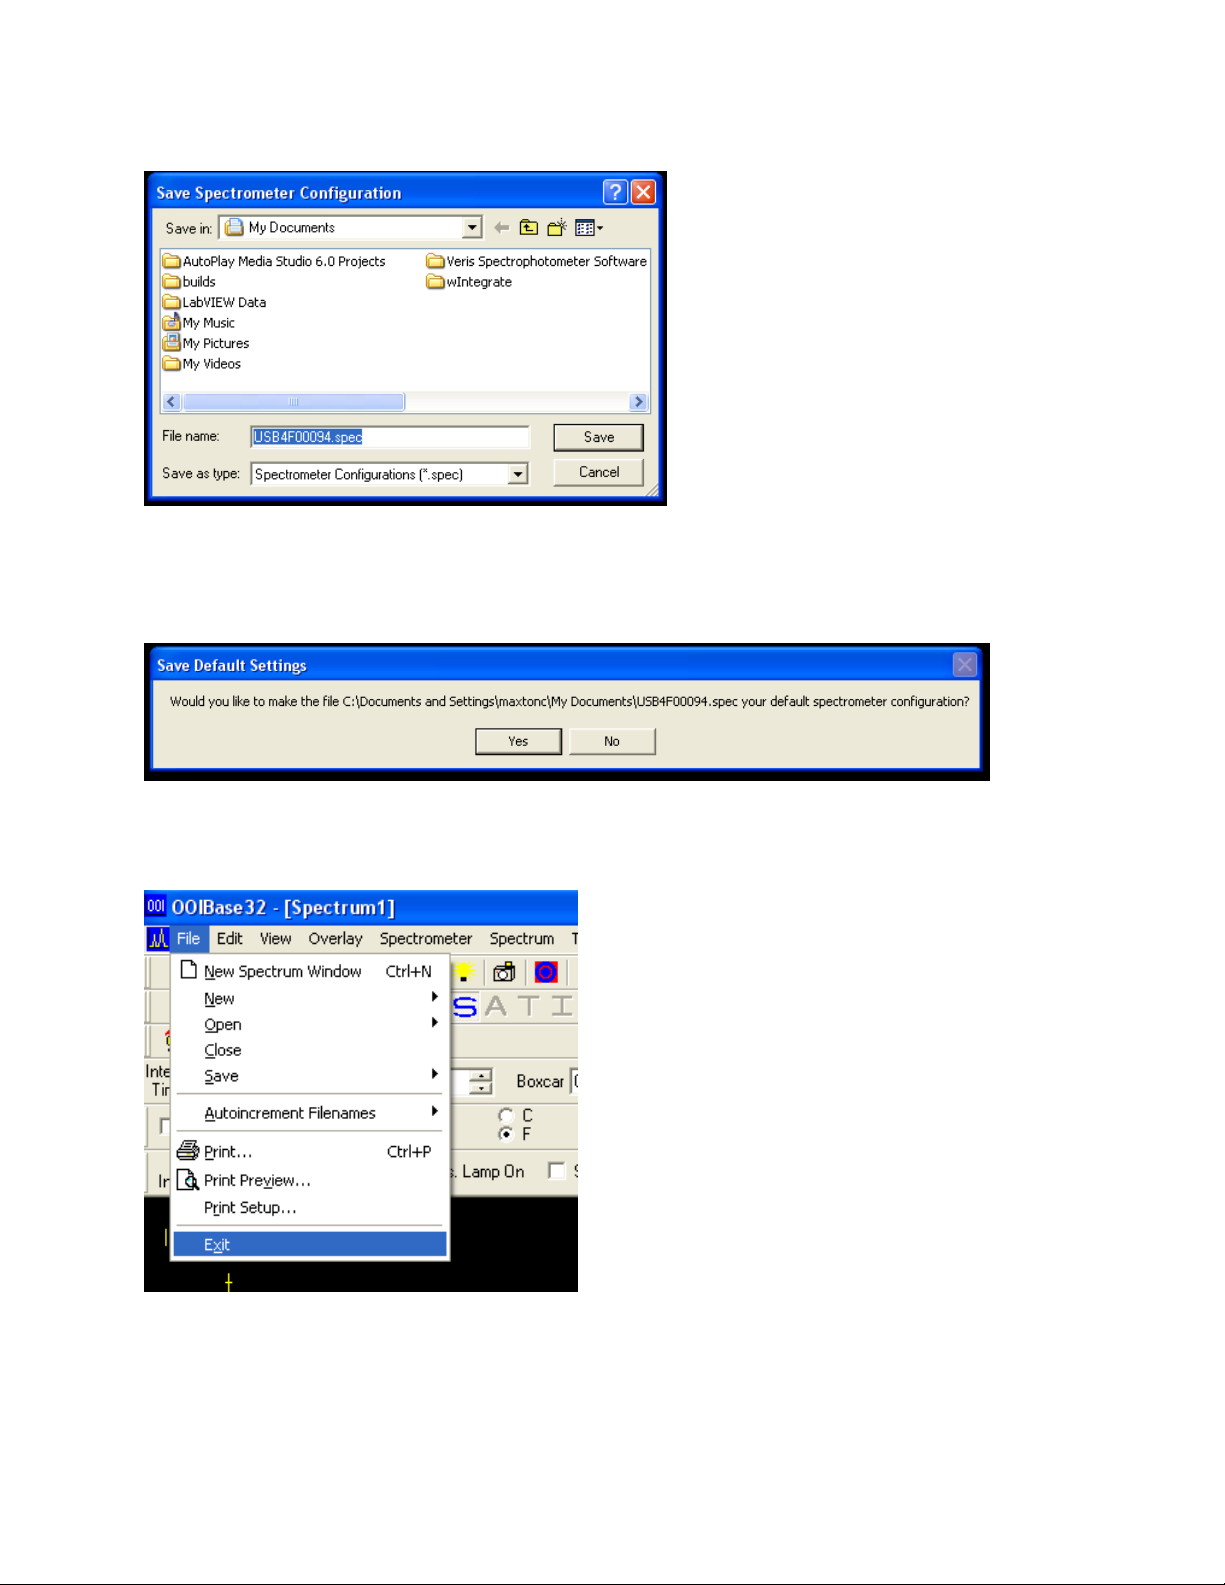
The Save Spectrometer Configuration should automatically fill in the file name with the
serial number. Click Save.
Figure 24
Choose yes to make the spectrometer configuration the default settings.
The spectrometer has now been configured.
Figure 25
Exit the software.
3-10
OM17-P4000VIS-NIR
Auxiliary case ports
Spectrometer case ports
The software could increment the
number of the ports by one
depending on the computer. For
example, the device manager
shows ports 20,21,22,23,9 but the
software shows 21,22,23,24,10.
Just use the incremented numbers
if this situation occurs.
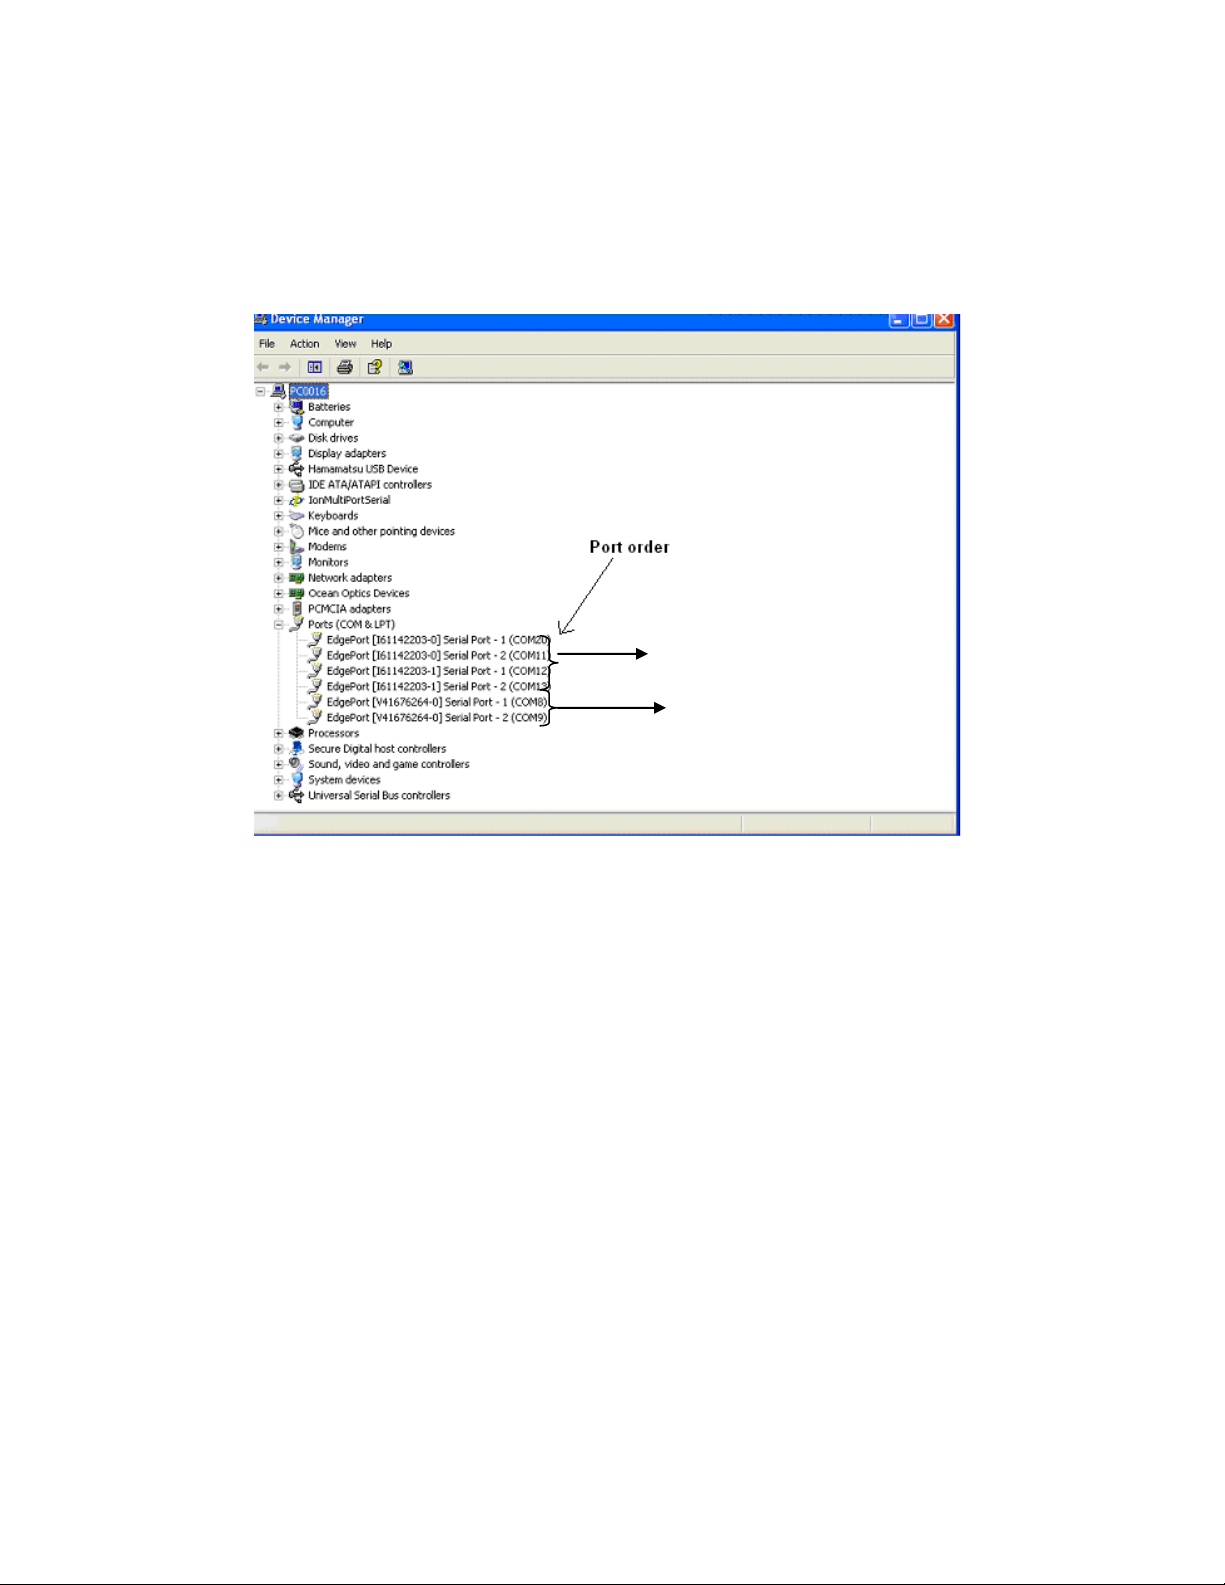
Setting Port Order
1. Check Device Manager for port order (Start settings control panel system
hardware tab device manager double click ports)
2. Ports will be listed in order, as they should be set in software.
Figure 26
In this example the order to set the ports would be as follows: (see Figure 25.) Different
computers will have the ports in different orders; however if the software is used on one
computer only, the ports will never change. The ports will always be in the order of
spare, GPS, temp, control, and spectrometer. For future reference, make note of the
com port order your computer is using.
Spare: COM20
GPS: COM11
Temp: COM12
Control: COM13
Spectrometer: COM8
The last port (COM9) will not be used.
3-11
OM17-P4000VIS-NIR
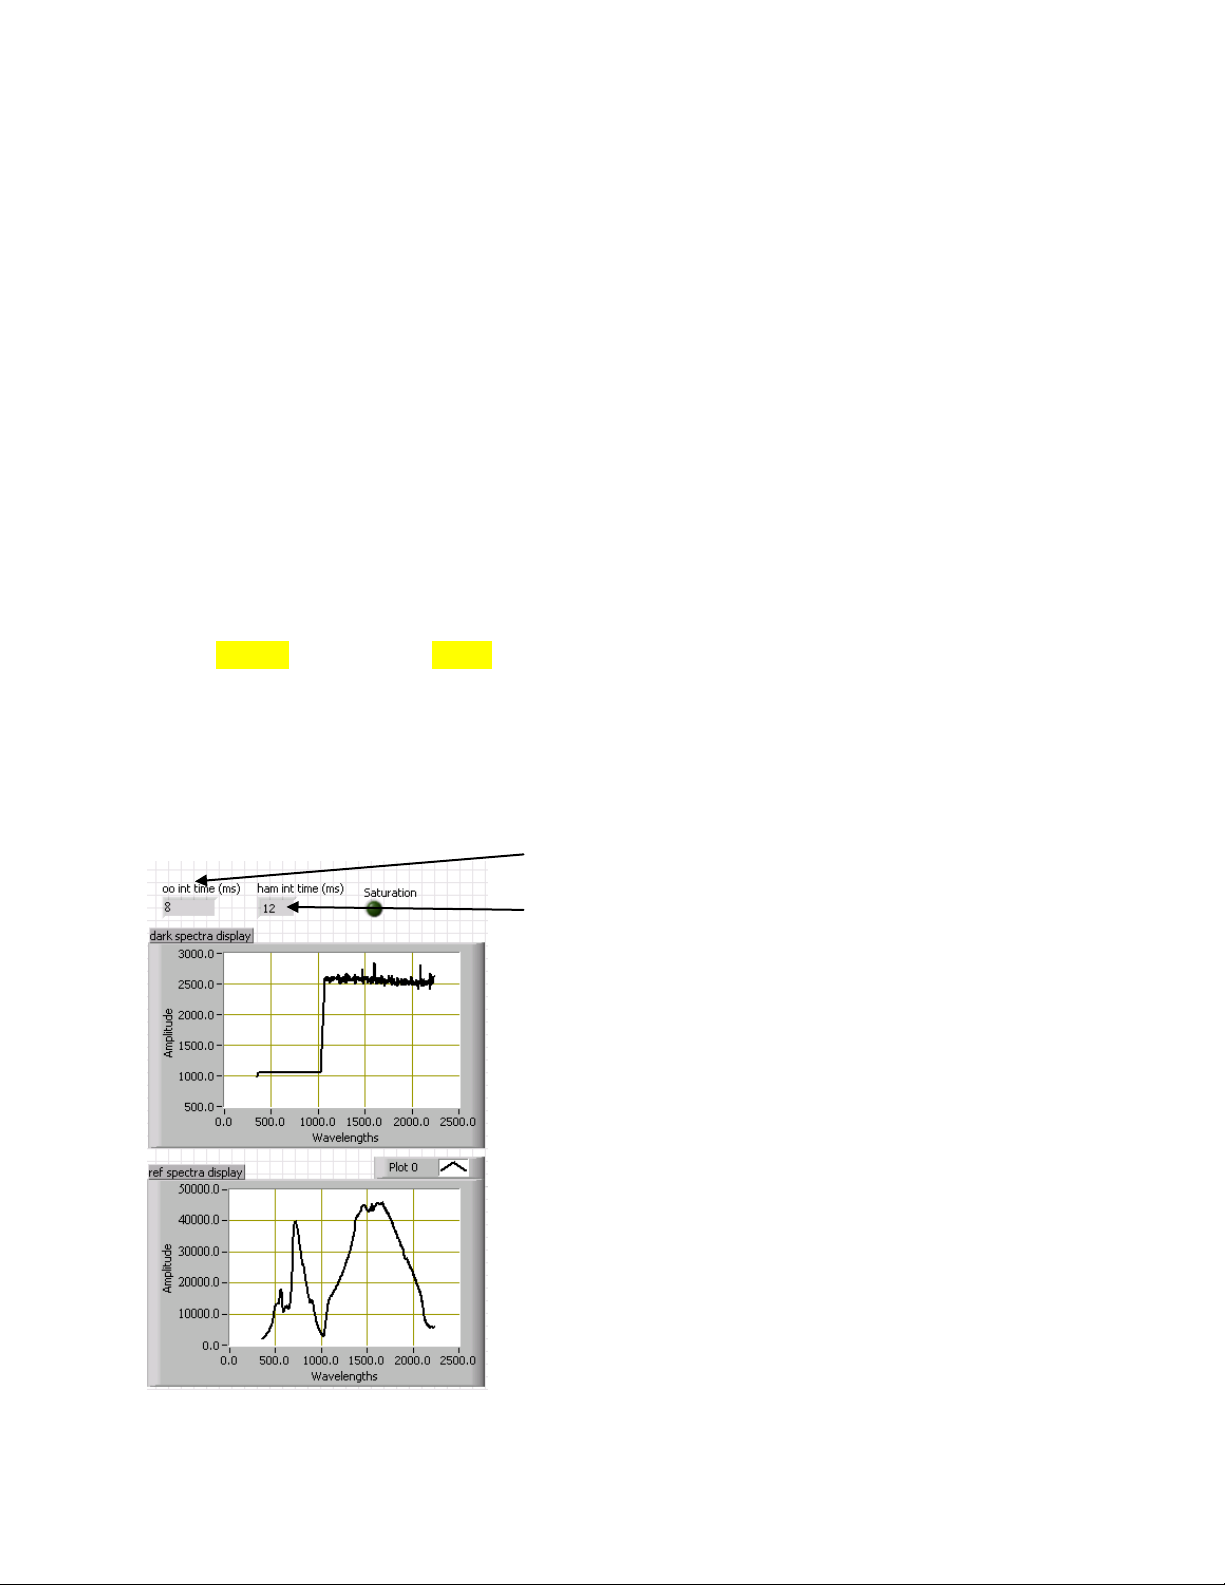
Example of ref spectra shown
in system check and acquisition
with correct integration time set.
Figure 27
Make sure to check the integration
time while going through the initial
setup of the instrument.
Ocean Optics Integration time
Hamamatsu Integration time
Setting Integration Time:
The integration time is the amount of time the spectrometers collect the spectral data for
averaging. It is important to have this set correctly because too much light will saturate
the spectrometer, while too little light won’t allow the full range of the detector to be
used. The integration time needs to be set before acquiring spectral data. This is
especially important for users switching between probe and shank modules as
the optics are different and the amount of light seen between each device varies.
Step 1: Open the Veris Spectrophotometer Software and start the system check. After
the first Dark and Reference measurements are stored, check the ref spectra display
(example shown below). The two peaks shown should be around 40000.00 counts.
The first peak is controlled by the oo int time, while the second peak is controlled by the
ham int time. If peaks are too high, then lower the integration time. If peaks are too low
then raise the integration time.
Step 2: Once it has been determined which way to move the integration time, exit the
software and open the acq_settings.txt file located in the C:\Veris directory.
0.010 12.000 5.000 8.000 0.150 0.150 0.300 0.150 2.000
Example of data stored in acq_settings.txt
The second value represents the ham int time,while the third value represents the oo int
time. Raise or lower these values then save the file, open the Veris Spectrophotometer
Software, run a dark and reference measurement, and then check these values again to
see how the peaks changed.
3-12
OM17-P4000VIS-NIR
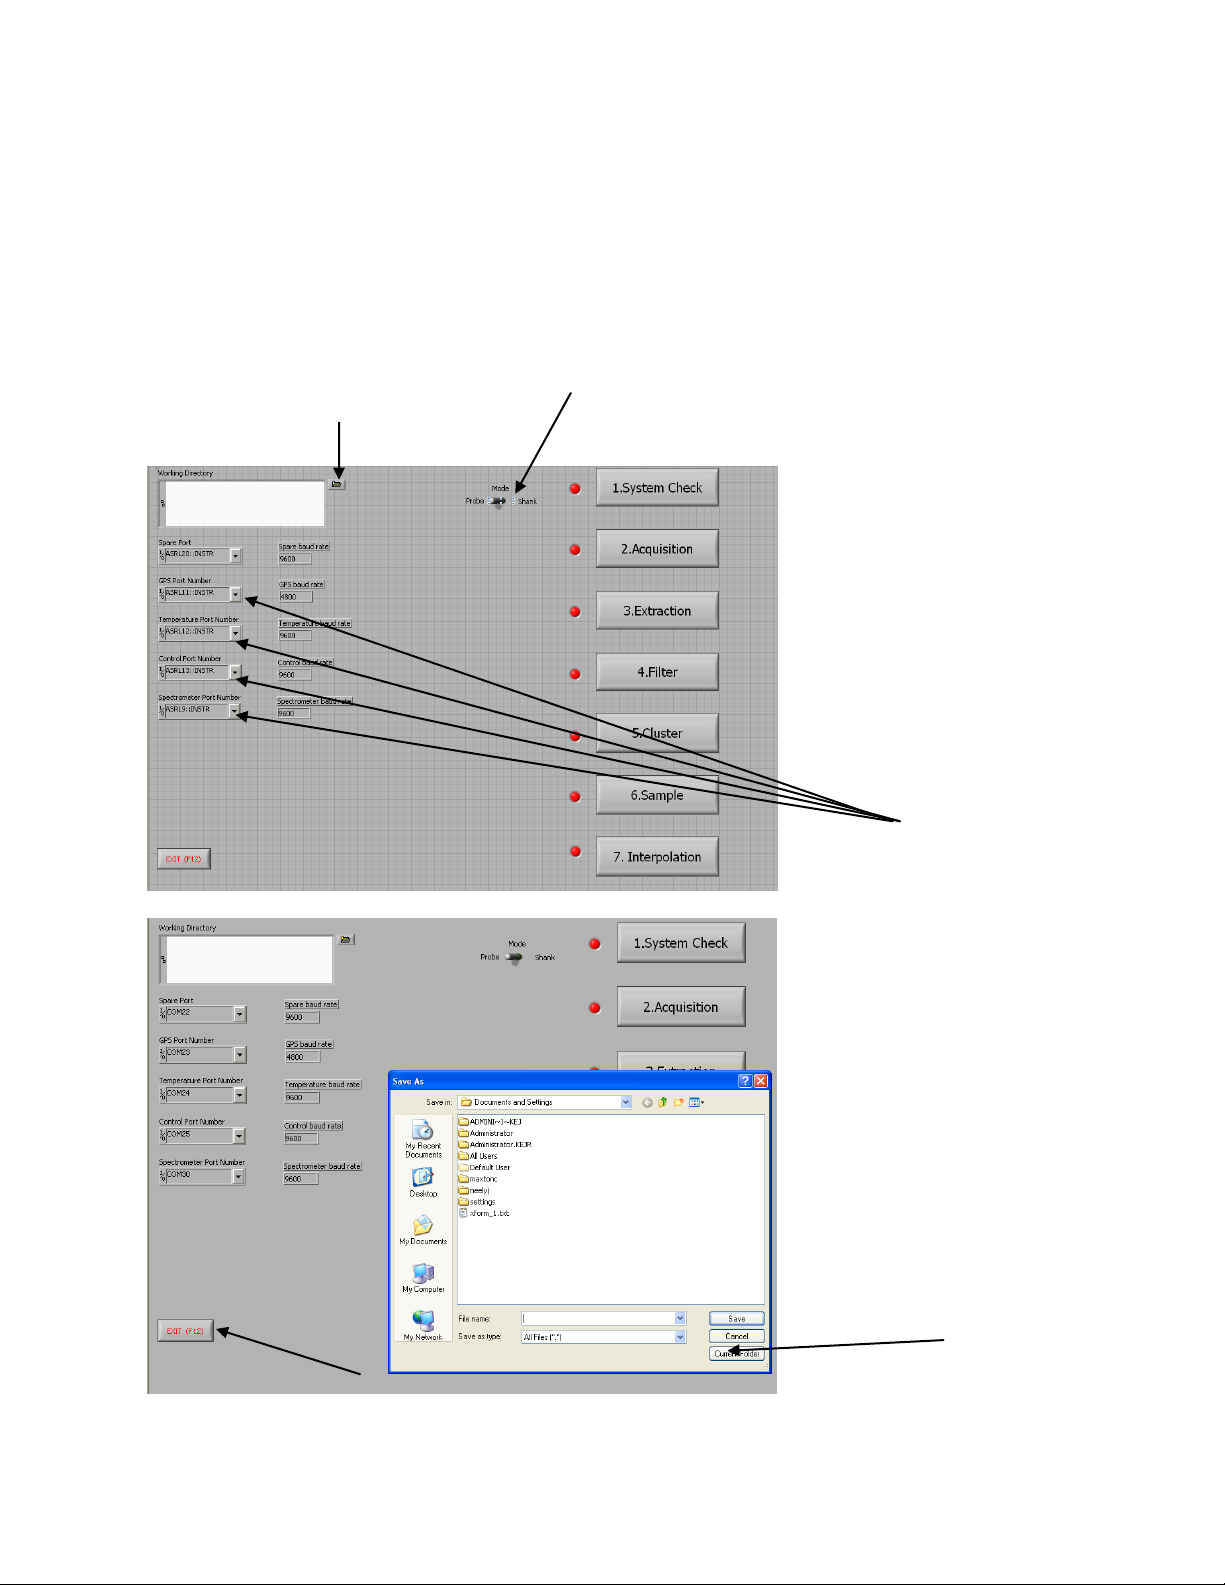
Folder icon to select working directory.
A field folder must be selected before
any steps can be completed. Note:
Each field or site must have its own
Once the desired
directory is found,
click on current folder.
BEFORE STARTING:
1. Before taking any
data let system run
for 20 minutes to
allow the
spectrometers to
stabilize.
2. Connect
spectrometers to
PC.
3. Open Veris software
4. The port order must
be set (see Setting
Port Order). This
needs to be done
the first time the
software is run on a
machine, after that
the port order will be
stored for future use.
Port terminology
may be labeled
COM or ASRL.
Both are acceptable
if port number is
correct.
Press EXIT or F12 when ready to quit the software; this will
ensure the port order will be saved.
Set software for either probe or shank mode. If the
incorrect mode is selected and system check or
acquisition entered, then the auxiliary case will need
to be reset by shutting off power and turning back on
before entering software again.
Section 4
Field Operation - Electronics
Operating software - This will need to be completed every time the software is started.
Open Veris operating software:
Figure 1
Figure 2
4-1
OM17-P4000VIS-NIR
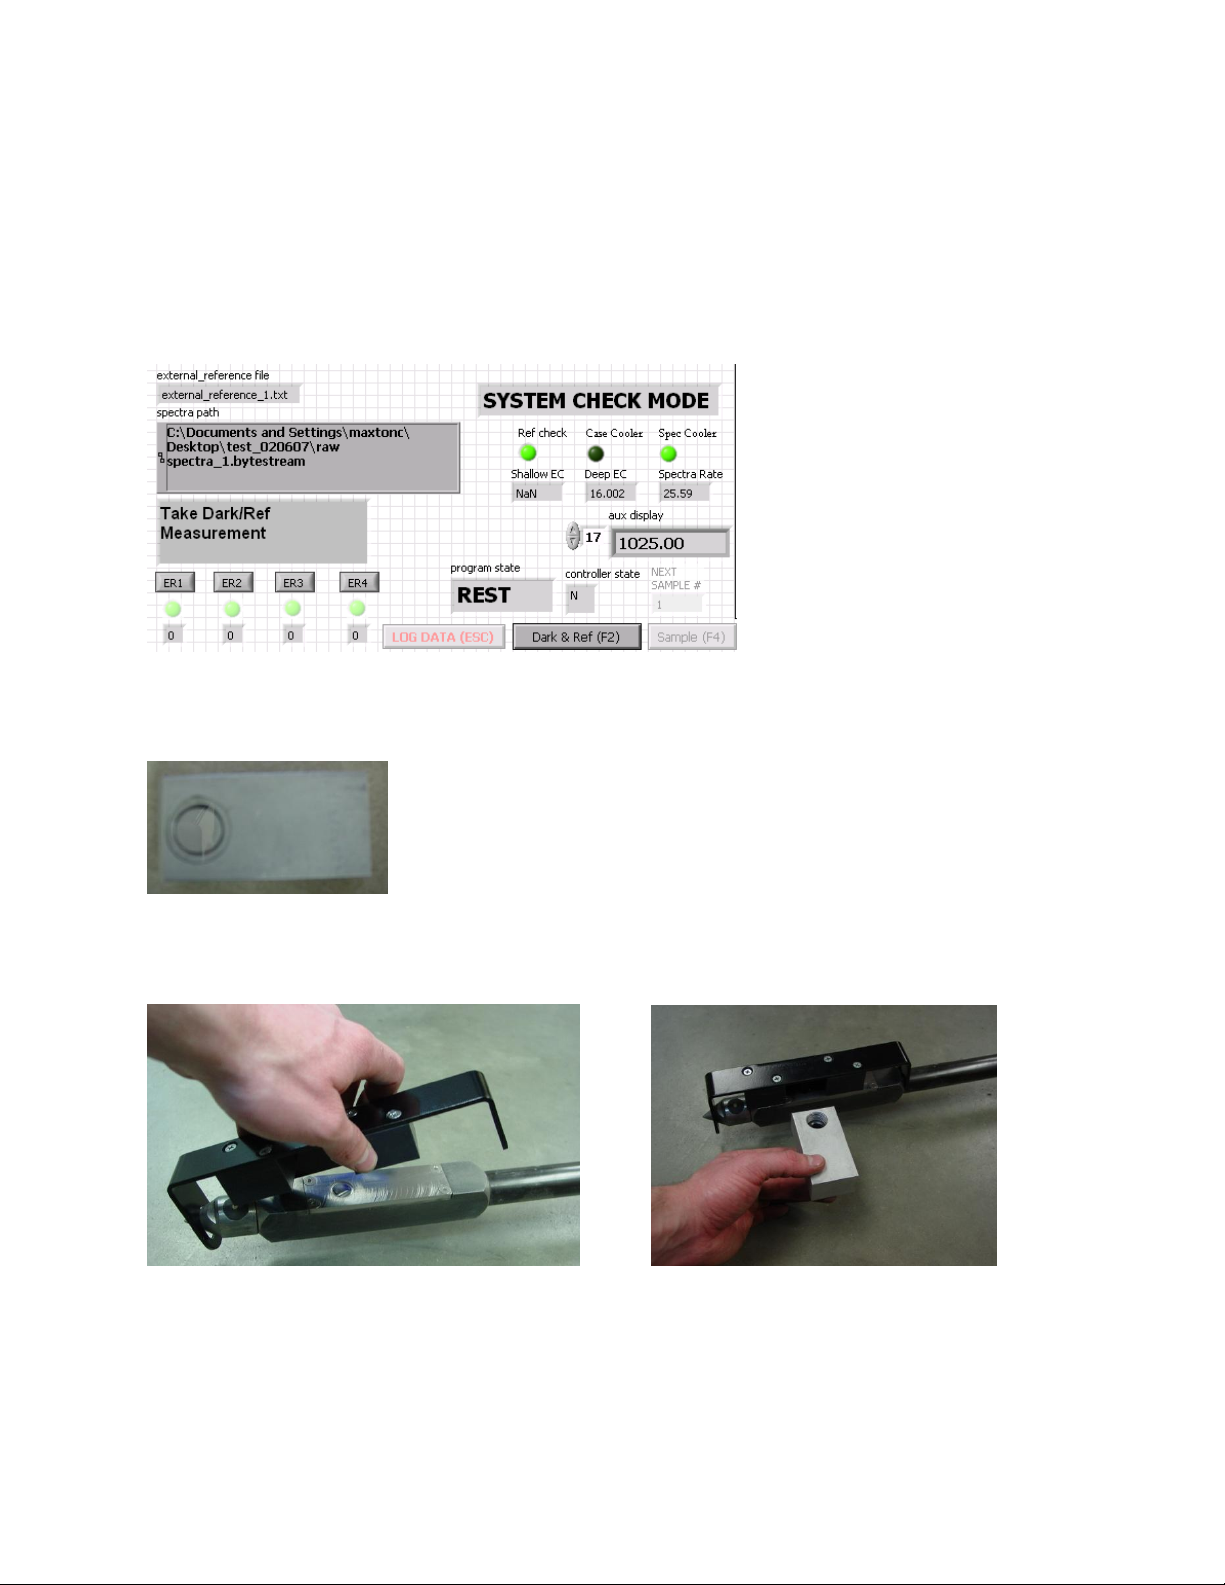
Example of what screen will
look like when manual
reference needs to be taken.
First place the reference block
holder on the end of the probe
as shown
Then slide references in front of
window. Be sure reference
material is facing the window
How to take Manual Reference
In order to calculate reflectance a dark and reference measurement must be taken
initially when the software starts, and then every 10 minutes to ensure all
measurements are accurate and to compensate for any discrepancies in the
spectrometer or light source due to temperature. The software will alert the user when
these conditions occur by displaying Take manual reference in the system message as
well as the ref check light flashing.
Figure 3
Before placing the reference block on top of the wear plate window wipe the wear
plate window clean of any debris.
Figure 4
Reference block to be used for dark/ref measurements. This is the block stamped
dark/ref.
Figure 5A & 5B
4-2
OM17-P4000VIS-NIR
1. System Check – This step calibrates the spectra data to known standards to ensure
data integrity. This is accomplished by: A) manually placing four external reference
standards against the window and collecting spectra measurements for each standard;
and B) transforming the data to a master set of data provided by Veris.
A) Before running the external references make sure the window on the probe and the
window on the reference are clean. When program state reads REST and controller is
in neutral (N), place the correct external reference adjacent the probe window and then
press the corresponding external reference button. If the External Reference (ER)
failure light is yellow, check to make sure the correct external reference was placed
adjacent wear plate and that the correct external reference button was pressed, and
then run the external reference again. Once ER light illuminates, proceed to next
reference, after taking a manual reference. Once each external reference has been
run at least once, press end or F12. This will exit this program and initiate the create
transform program, which will take the data just acquired and compare it to the master
data to create a current transform. If the transform is created successfully, then that
transform will be applied to all spectra data acquired during the acquisition.
External References External References securely in place
Figure 6A & 6B
Place the ER securely onto the probe wear-plate. Make sure to align the window on the
ER to the window on the probe, and magnets hold the ER firmly in place. The reference
material goes towards the ground and lines up directly adjacent the sapphire window on
the wear-plate.
4-3
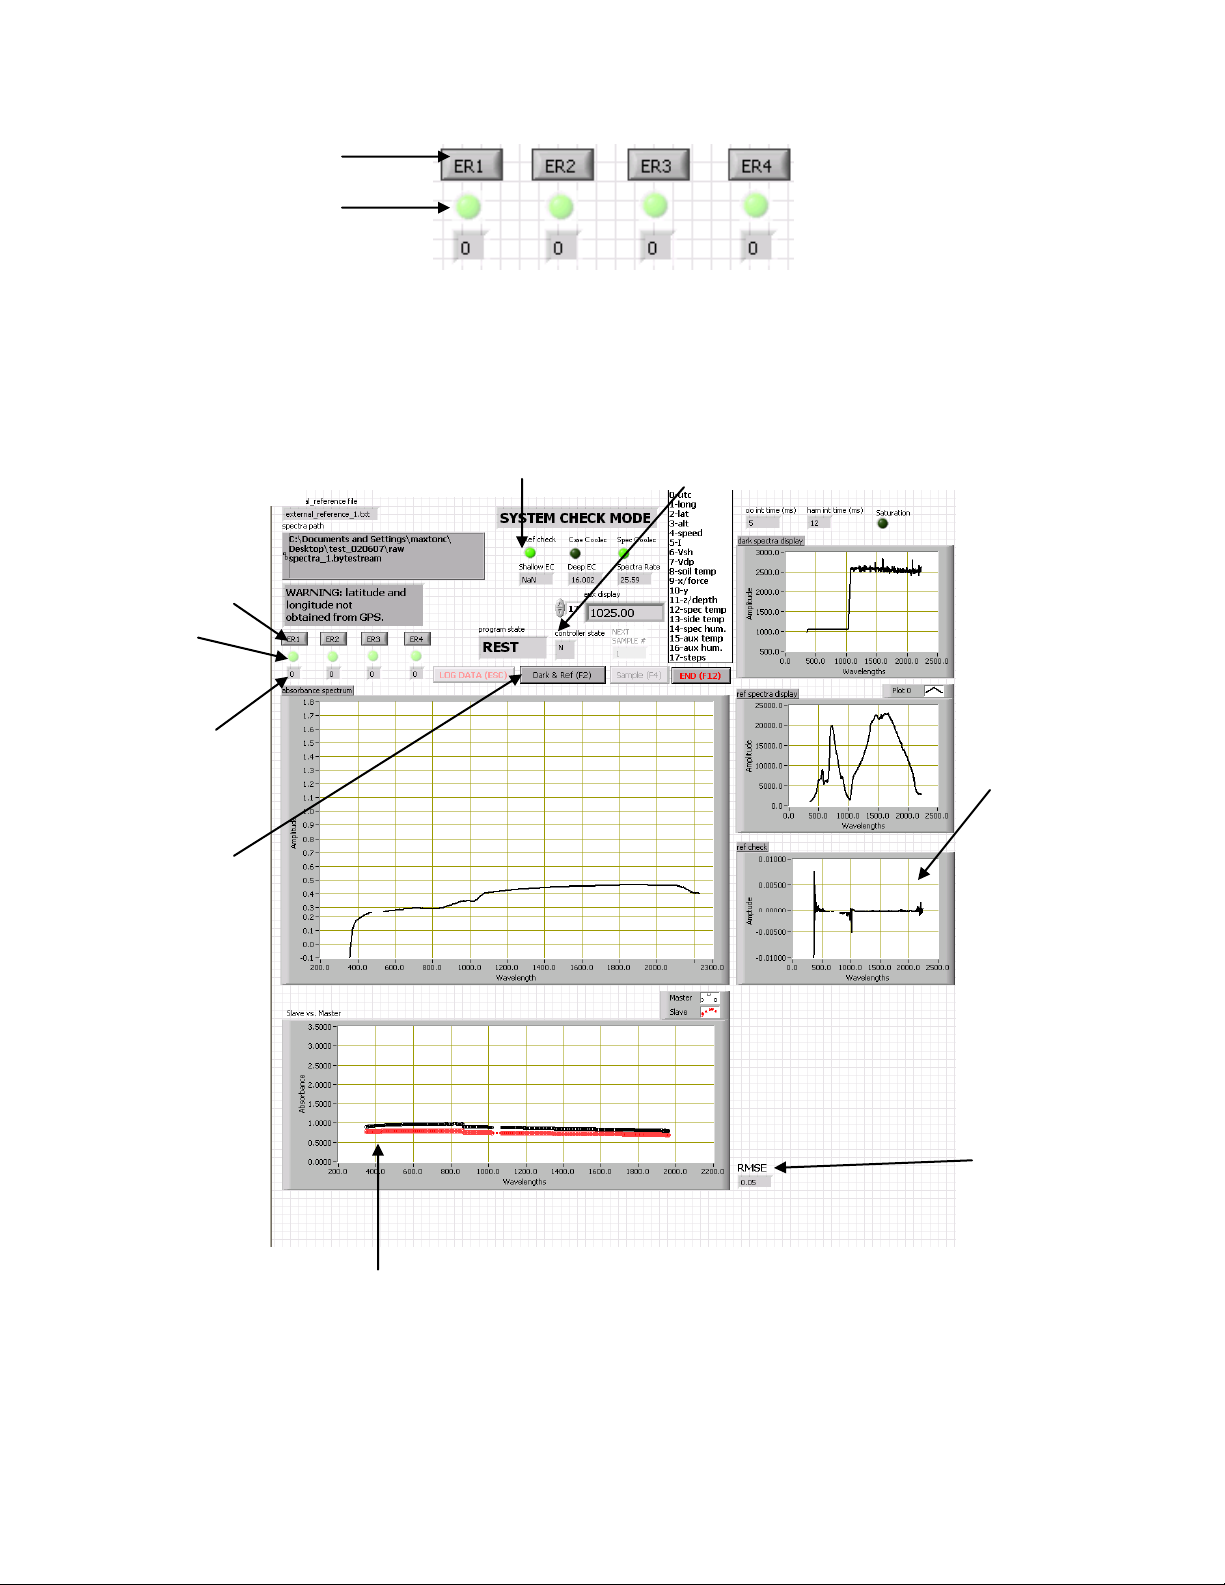
Figure 7
External
Reference buttons
Failure light
Number of times
each reference
has been ran,
since system
check was
opened.
Manually stores
dark/reference
data. This should
be done if there is
a failed reference
check. This could
be caused by the
shank steps not
being within
specification, or
one of the
spectrometers is
not running. Try to
clear out the
reference by
pressing F2. If
problem persists
shut down system
and restart.
Auxiliary data can be scrolled through by the up and
down arrows on the left of the indicator. Data
corresponds to chart listed on the right of indicator.
Note: a reading of –1.50 indicates failure of that
component or communication problem. See
Glossary for Auxiliary data information table.
Ref check graph:
This should be close to
a straight line except
for the edges and the
center. The reference
check light will indicate
if this is an acceptable
reference check.
Root mean squared
error of current
external reference.
By default the RMSE
should be within .10
for references 1,2,& 4
and within .15 for
reference 3.
Reference check light is
green for good references
and red for a failed
reference. If a reference
fails, press F2 to store a
new dark and reference.
Ref check light
This compares the slope
of the previous transform
to the current transform
Graph that compares current
external reference to master
reference. These should
correlate to one another if
system check has been
completed before.
A yellow ER light
indicates possible
problem. Regard as a
good reference unless
transform step fails.
ER buttons
Indicator light will be
yellow or green
OM17-P4000VIS-NIR
Figure 8
4-4

OM17-P4000VIS-NIR
Raw master and
slave data
(external
reference). The
master is black
and the slave is
grey.
Master and slave
data with
transform applied
master is black
and slave is grey.
Root mean
squared error for
current transform.
Maximum allowed
RMSE for a good
transform.
Compares the
offset of the
previous transform
the current
transform
Indicates when transform is
complete. READY TO
MOVE TO NEXT STEP—
DATA ACQUISITION.
Previous transform will
be a straight line the first
time system is ran.
External
reference data
that was just
taken.
Master data file, which
will be used to transform
slave (master file
provided by Veris)
Indicates if transform is
Figure 9
Once the transform is complete press close window or F12. If the transform was
successful, the software will inform the user and continue on to acquisition. If the
transform failed, the program will enter the system check again so the references can
be ran once more. If the transform fails again, either there is a system problem
(spectrometer malfunction, window is dirty, or references not taken properly) or the
tolerance for the maximum allowed RMSE could be set too low; see program
modifications to change this.
4-5

OM17-P4000VIS-NIR
Before mapping complete the following:
Start system at least 20 minutes before starting to map to ensure the spectrometers
have stabilized
Make sure auxiliary sensor data is coming in (see Glossary for auxiliary sensor data
definition).
Make sure all auxiliary lights are green.
Complete all steps above. Make sure Reference Check (Ref Check) light is green, and
GPS data are being received.
2. Data Acquisition – The collection of spectral and auxiliary data in the field. Data is
streamed to a file in a compact format.
Pressing the PROBE button stores spectrum data as absorbance and auxiliary data,
which includes EC data, the PROBE button key has been pressed again or the probe
pulled out of the ground. No data can be logged if there is no GPS signal or there is a
bad ref check. No data, including EC data, will be stored unless the program is in LOG
mode.
System will alert the user to take a dark and reference every 10 minutes—the next time
the PROBE button is pressed after a 10-minute period.
If an extra dark and reference is desired, pressing F2 or Dark & Ref stores a new
reference and dark spectrum. Pressing F4 or sample will store transformed spectrum
data as absorbance into the acquisition_samples file located in the field directory.
Once all data has been acquired press F12 or End to return to the main interface.
Soil EC is recorded simultaneously with NIR data. When EC is being collected, EC
value will appear in the shallow window. The deep will be a -1 because it is not used
with the probe. Note: unit must be in Log mode for EC to be recorded. Also, see
Maintenance section for information on testing EC system output.
4-6

Ref check light This
green light indicates a
good reference
These indicate the temperatures and the
humidity of the system. If they are not
within range (see specifications) the
indicator light will be red, if this occurs
the system should be shut down.
Dark spectrum
that was stored
when program
state was in dark
mode
Reference
spectrum that
was stored when
program state
was in reference
mode.
Ref check
compares the
previous
reference data
to current
reference.
As in system check, this should be close to a straight line
except for the edges and the center. Since this is a bad
reference it is indicated by the ref check light at the top of the
screen. In this situation press F2 to store a new reference.
Pressing
PROBE stores
spectrum data
as absorbance
and auxiliary
data, which
includes EC
data, until
probe has
been hit again
or logging
stops
automatically
when probe
pulled out of
ground. No
data can be
logged if there
is no GPS
signal or there
is a bad ref
check. Use
PROBE to
store data
while mapping
a field. No
data, including
EC data, will
be stored
unless it
program is in
LOG mode.
Auxiliary data indicator
Auxiliary data can
be scrolled
through by
pressing the up or
down arrow to the
left of the indicator.
The auxiliary data
corresponds to the
chart listed on the
right of the
indicator.
Figure 10
EC indicators
Log and GPS
lights—must be
green for data to
be recorded
Note: Make sure to run through the setting the
integration time procedure after starting up
system for the first time or after switching
between probe and shank mode
OM17-P4000VIS-NIR
As long as the acquisition software is closed properly using F12, all data is saved and
the acquisition can be opened at a later time with new data being appended to the data
taken previously.
4-7

OM17-P4000VIS-NIR
Transform which
will be applied to
field files created
in the acquisition
(bytestream
files).
Spectrum
acquired using
LOG mode
during
acquisition.
Reference check
spectrum
acquired during
acquisition.
Number of
references and dark
spectra taken during
acquisition.
All reference
spectrum taken
during acquisition.
All dark spectrum
taken during
acquisition.
Output file that contains
transformed field absorbance
spectrum taken during LOG
mode of acquisition.
Figure 11
How to know you’re collecting high quality NIR measurements:
a) Log light and GPS lights are both green
b) Ref check light is green
c) Spectrum absorbance doesn’t jump as the probe is pushed down
d) Absorbance spectrum shows a typical soil spectra pattern (Figure
52), and is changing slightly as the data is collected.
e) External references can be attached to probe at any time in Data
Acquisition mode. Absorbance should be highest for ER3 and
lowest for ER4.
f) Wear plate window is not broken, or cracked. This is caused by
excess wear, or rocky fields. Be sure to check window during
these situations and replace probe wear plate if necessary.
3. Data Extraction – The spectra and auxiliary data are read out of the compact format
(bytestream) file and averaged, then the output is stored in an ASCII format. EC data is
extracted into file named ec.txt. The extraction program will extract all the bytestream
files and apply the appropriate transform, then output the data into a single text file.
Once all the data has been processed, indicated by a green complete light, click on
close window or F12 to return to main interface.
4. Filtering -The spectra are compressed using principal components compression, and
outliers are removed. Maps of each principal component (up to 10) are displayed, and
the results of the PC analysis and filtering are output to ASCII formatted files.
4-8

Score plots of
spectrum data that
indicate grouping of
spectra.
Number of outlying
spectra removed
during filtering.
Total number of
spectra.
Wavelengths used by
the spectrometers.
There are 384 total
wavelengths.
Graphs of each
principal component;
this is an ASCII text
file and may be
imported into other
mapping software.
The PC data are in the
field folder, and are
named PC scores.txt
Loadings of each
principal component.
Once all the data
has been filtered and
the complete light is
green press close
window or F12 to
return to main
interface.
OM17-P4000VIS-NIR
Figure 12
4-9

OM17-P4000VIS-NIR
Map of proposed sample locations
based on clustering. Each circle
PC scores file to be clustered. represents a sample location.
File where GPS
locations of
proposed
sample locations
is stored.
Number of
points in each
cluster.
The number of
clusters should
be equal to the
number of
desired sample
locations.
This indicates
the status of the
program. First
the program will
space the
spectra evenly,
then cluster the
spectra.
Each plot
represents a
cluster.
Map of all data
with each color
representing a
different cluster.
Figure 13
5. Clustering – Clusters the principal components (PC's) of the spectra into the same
number of clusters as desired sample points. When the clustering program opens it will
ask if the settings are correct. The settings this refers to are the number of clusters or
sample locations, and the number of PC’s to use for clustering. By default there will be
3 PC’s used and 15 locations to sample. If more sample locations are desired, then this
can be changed at this time. Up to 10 PC’s can be chosen, however 95% of the data is
contained within the first 3 PC’s. If these settings are acceptable, then select YES or, to
update the settings press NO. If NO was selected, update the settings and press
continue to begin clustering the data. Once the data has been clustered, the program
status will say done and the complete light will be lit. Press close window or F12 to
return to the main interface.
For Probe mode the program will suggest which GPS locations along with which 10cm
increment of soil will provide optimal calibration based on the spectral variability.
4-10

OM17-P4000VIS-NIR
Map of the proposed locations (black circles) and
the actual locations (black squares). The cursor
(not shown) will show the user their current location
when the cursor is over the proposed location or
the location desired to be sampled, then press OK
or enter to store that location as an actual location
that was sampled and take a sample of the soil.
Number of
next actual
locations to be
sampled.
When the
cursor is over
the desired
sample
location press
OK or enter.
File where the
GPS of the
actual
locations is
stored.
Current auxiliary data
that corresponds to the
chart on the right.
Figure 14
6. Soil Sampling – Allows the user to navigate to the GPS coordinates of desired
sample locations (from Step 5), and record actual sample locations. The actual
locations that are saved during sampling program will be used for the interpolation of
the spectra in the next step.
Once all the desired sampled locations have been stored, press close window or F12 to
return to the main interface.
4-11

OM17-P4000VIS-NIR
Input
sampled
locations to
interpolate
Input field
data
Output file
with data at
each
sampled
location
Number of
spectra at
each
location
Distance in meters to search
through spectra in the x direction
Distance in meters to search
through spectra in the y direction
Distance in meters to search for
spectra in the z direction. This is
half of the distance of the depth
increments. This is only used
for the probe mode.
Increments in meters to space out the
1 meter of depth for the probe data.
This is only used in probe mode.
Spectral
data is
graphed as
it is found in
the
interpolation
program.
7. Interpolation – Uses a Gaussian weighting to average spectra near a sampled
location, so the data can be matched up with properties of interest for calibration.
Spectra near to the location are weighted higher than spectra far away. Also, this will
interpolate several probes into one value if desired. Outputs a file named
spectra@locations.txt to the working directory. This file contains the spectra and
auxiliary data for each sampled GPS location.
Once the interpolation begins it will ask if the settings are correct. The settings this
refers to are a, b, and the depth increments. By default a and b will be 3 meters, if a
larger search area is desired then these can be updated. If the settings are fine press
YES, if the settings need to be updated select NO. After selecting NO and updating the
settings then press continue to begin the interpolation. After the interpolation is done the
complete light will be green, then press close window or F12 to return to the main
interface.
For Probe mode the depth increments determine how to split up the data taken. If .1 is
chosen then that data will be split up into 10cm increments and the output file will show
depths of .05, .15. .25…95. This is because the interpolation searches half of the depth
increment in each direction so the .05 measurement is from data at 0-10cm in depth
and the .15 measurement is from 0-20cm in depth and so on. The output file will
include data from the whole core profile, not just the specific depth suggested from the
clustering. See examples on next page.
Figure 15
Note: always use exit button or press F12 to close out of Veris NIR software.
4-12

OM17-P4000VIS-NIR
The example on the left illustrates how
the interpolation can use multiple cores
to obtain one value. If the a distance
was equal to 3m and the b distance
equal to 3m, then all three probes would
be interpolated into one to obtain the
value for the 10cm sample. If this is not
desired then make sure that a and b are
less than the actual probe spacing.
Figure 16
Figure 17
Interpolation (continued)
This example on the left shows the interpolated output vs. the sampling depth
increments. If a core was taken and cut into 10 cm depth increments the output file will
show 05 cm thru 95 cm, but the 05 cm data corresponds to the interpolated value using
0-10 cm data, not the data at precisely 05 cm. This continues down the probe until
through the 95 cm measurement. Likewise, in the example on the right a 20 cm depth
increment was used and the output file shows depths from 10 cm thru 90 cm. The 10
cm measurement corresponds to the interpolated data found between 0 – 20 cm. This
continues for every 20 cm increment of soil.
4-13

OM17-P4000VIS-NIR
Importing sample locations for interpolation
Versions 1.4 and later.
This is only to be used when sampling is not completed in the Veris software. By
following these steps the user could map a field and then flag the GPS locations where
samples were collected and use those locations to get the interpolated values from the
Veris software.
Step 1: Collect field data, then extract and filter the data. Exit the Veris
Spectrophotometer Software once these steps have been completed.
Step 2: Create a file of the GPS coordinates of the sampled locations. The file should
be created in the following format. Column A is the sample number, column B is the
longitude, and column C is the latitude. Save the file as actual locations.txt in the
working directory, where the field data has been stored.
Figure 18
Example of actual locations.txt file
Step 3: Open the Veris Spectrophotometer Software and chose interpolation. The
software will use the locations stored in the actual locations.txt file, and give an
interpolated spectra, and auxiliary data for each location. The output will be a file called
spectra@locations.txt, which will be created in the working directory.
4-14

OM17-P4000VIS-NIR
Sample holders
with soil.
Make sure the
soil is level with
the top of the
sample holder to
ensure a tight fit
with the probe.
Bench top Usage
To use the spectrophotometer to obtain measurements in the a bench top setting, first
complete the system check as described in the field usage steps, then proceed to the
acquisition. Mount the probe on the probe bench top stand. Place a soil sample in the
sample holder and place the holder against the face of the probe window. Use the
sample button or F4 to store a dark, reference, and then a sample spectrum. These
transformed spectra are stored in the acquisition_samples.txt file located in the field
folder.
Figure 19
Figure 20
4-15

OM17-P4000VIS-NIR
Working directory icon
Test/Example Data
In order to gain experience with the software before mapping, test/example datasets are
included with the Veris software. This allows the user to experiment with the system,
without logging data or having GPS signal.
1. Start Operating software (Start programs Veris Spectrophotometer
Software Veris Data Processing)
2. Select working directory by clicking on folder icon.
Figure 21
3. Set ports (see setting port order)
4. Click on system check (see system check for more information).
5. Close acquisition and exit Veris software.
6. Go to C:\Veris\test data probe copy all files into the directory that was setup in
7. Start software again and proceed through the extraction, filter, cluster, sample
a. Run through all four external references
b. Exit system check
c. Start acquisition
step 2.
(no locations can be stored without GPS), and interpolation. For more information
on each of these steps, see Field Operations.
4-16

OM17-P4000VIS-NIR
14” from rear edge
to rear of bumper
Section 5
Field Operation
P4000-S
Installation
The P4000-S is designed to be installed in ¾ ton – 1 ton pickups and due to the wide
range of bed and frame dimensions on the market, there are no mounting holes in lower
frame flange. Some drilling and fabrication will be required. You may choose to
perform this on your own, or may wish to have a local welding or truck shop do this for
you.
Steps:
1) Properly lift probe assembly in folded position with a minimum of two nylon straps
and lower into pickup bed.
2) Center side-to-side in bed and so rear portion of skid frame rail is 14” forward of
farthest point on rear bumper (Figure 1). This will ensure that foot will not contact
bumper when the skid is in the retracted position.
3) Ideally 4 mounting bolts (½” Gr5) are adequate for fastening the probe skid to the
frame of the truck. Choose mounting location based on frame obstructions such
as spring hangers, fuel tank hoses, etc. This will take some time, measuring both
top and underneath the bed to make sure bolts will align with skid frame
4) Locate all four positions and fabricate “L” straps from at least 3/8” material and
bolt or weld to frame. Make sure that fuel tanks, fuel line, and brake lines are not
in danger of being drilled or welded. Drilling is preferable and two ½” bolts in the
vertical position are adequate. (Figure 2)
5-1

OM17-P4000VIS-NIR
Figure 1
Figure 2A & B
Start out with ¼”
pilot hole for
drilling up through
Top View
Figure 3
Figure 4
Figure 1
5) Using the “L” straps as templates, you can drill the hole through the bottom side
of the skid frame rail. Tip: If you start out with small pilot holes (1/4”or less) it
takes less effort to drill through the bed and frame rail, then drill out to full
dimension from on top.
6) If for some reason you must locate one or two of lower “L” mounts ahead or
behind the skid frame rail, you can fabricate some clips to hold down in place.
Ideally at least two bolts should go through the skid frame to ensure that probe is
properly connected to bed (Figure 3)
7) Securely bolt down and connect power cable to battery of vehicle.
5-2

OM17-P4000VIS-NIR
Figure 5
Figure 6
KEEP FEET CLEAR OF
FOOT AND PROBE
Field Operation
Probe Platform
- Start engine and allow it to warm a minute or two before cycling – a few minutes
if during cold weather.
- Extend to full rear position
- Fold into upright position (figure 5)
- Lower foot to soil
- Raise probe (figure 6)
- Install Probe or core sampling
components
Important! -- When folding and retracting the platform make sure that
probe mast clears engine muffler. This can be achieved by shifting left to right as
you fold the unit.
5-3

OM17-P4000VIS-NIR
KEEP FEET CLEAR
OF FOOT AND
Figure 7
Figure 8
Field Operation
VIS/NIR Probe
Checking Electrical Signal Continuity and Electrode Isolation
It is recommended that you routinely check the EC signal to verify that all functions are
working properly. See Maintenance and Lubrication Section for a step-by-step
procedure. It is advisable to perform this test on a routine basis (weekly or every 20-25
hours of data collection) to ensure you are obtaining reliable data.
Operation
Before probing refer to Section 4 for electronics operation. Remove hairpin from string
pot piston (Figure 7). Set probe speed --- not recommended over 3cm/sec. This is
adjustable via the probe speed flow control on the side of the control panel. (Figure 9)
Begin probing: with probe mast vertical, insert probe into soil until top of window
is not visible. (Figure 8.) This starting position is recommended so ambient light
will not be collected.
Pressing Probe button begins storing spectrum data and auxiliary data until
probe is stopped or raised. Once insertion is initiated, do not stop or reverse
unless problem has occurred or desired depth is achieved. Data recording stops
when probe is raised. GPS and Log lights must be green for data to be recorded.
While probing monitor the following: Streaming spectra rate and Streaming Aux
Display. If either of these is not streaming, stop immediately and diagnose the
problem. See Section 7 Troubleshooting.
After 10 minutes the program will alert the user to take a manual reference. Several
manual references may be required.
5-4

OM17-P4000VIS-NIR
Figure 9
Operational tip
Use side-shift function to move probe to adjacent probing locations.
Do not let stringpot cable snap back into spool; factory stringpot repair will be
required if cable retracts too rapidly.
For best results, clear plant residue from probe insertion area.
5-5

OM17-P4000VIS-NIR
Figure 10
Figure 11
Figure 12
Field Operations
Soil Coring
Once you have competed probing, remove NIR/EC force probe as outlined in Section 6.
- Install drive coupler to rotating head by means of drive retainer (Figure 10)
- Install PETG liner onto cutting shoe and thread into sampling tube (Figure 11)
- Install sampling tube into drive coupler and push into soil.
Use slow and steady insertion speed and minimal
rotation to push core sampler into the soil. A brief
rotation at bottom of stroke will snap off the core in
tight clay, giving you a fuller core as you retract.
(Figure 12) Excessive rotation may affect the
condition of your cores.
5-6

OM17-P4000VIS-NIR
Figure 13
Figure 14 Figure 15
Remove sampler tube and remove cutting shoe from sampling tube by tapping and
rotating, or by use of wrench (provided). (Figure 13)
Cap the lower end of core with black vinyl cap, and the top with red. (Figures 14-15)
5-7

OM17-P4000VIS-NIR
Field Operations
Probe Rotation Option
An optional accessory for the P4000 is the Probe Inverter Option. This allows the
operator to quickly rotate the NIR/EC force probe upwards to allow access to the coring
tools without removal of the probe itself.
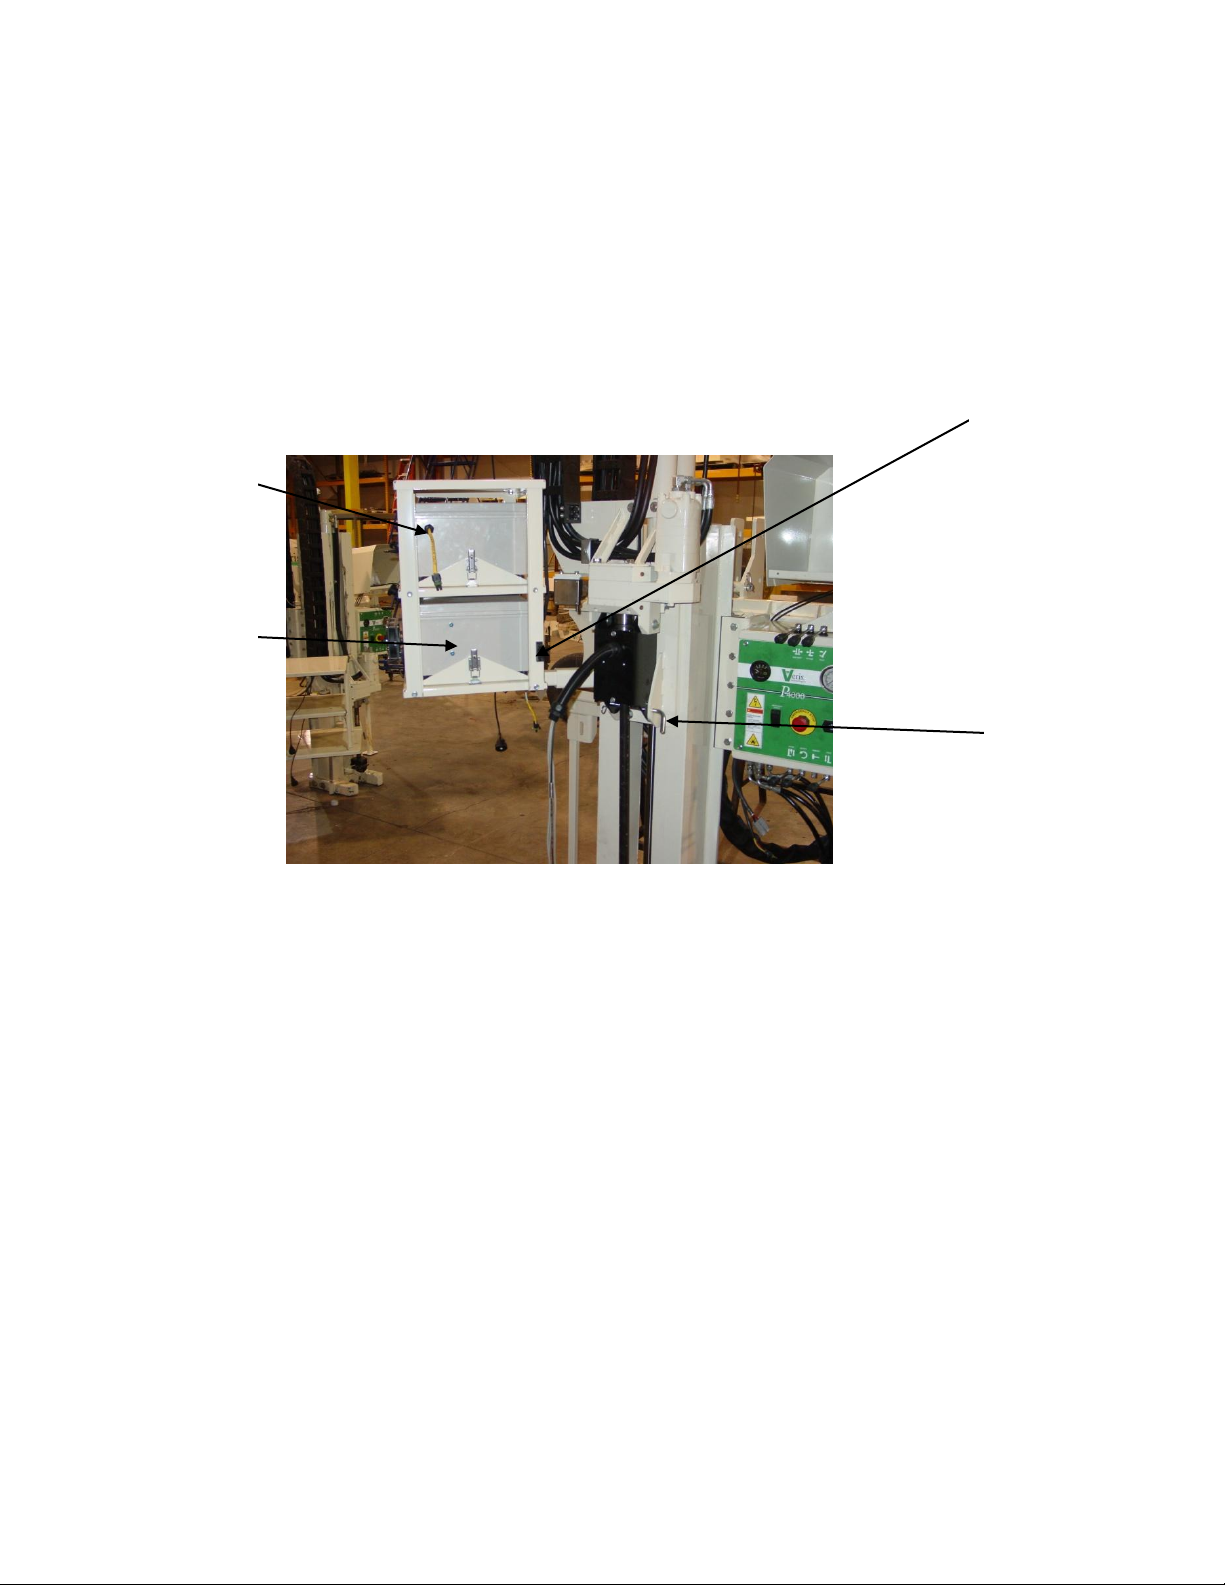
Below Figure 16 shows the NIR/EC force probe rotated down. To rotate upwards first
pull the quick latch as shown in Figure 16
Next rotate the probe to the up position as shown in Figure 17
Figure 16 Figure 17
5-8

OM17-P4000VIS-NIR
Once in the up position (Figure 18) ensure the quick latch is locked as shown in Figure
19. If the latch is not locked the probe may rotate round and cause personal injury.
Figure 18 Figure 19
5-9

OM17-P4000VIS-NIR
Figure 20
Figure 21
Field Operations
Optional Anchoring System
In some field conditions it may be necessary to drive soil anchors into the soil to obtain
adequate depth with probe or core sampler. If this is the case, you will need PN 40209
Anchoring Package.
Installation and Removal
- Retract probe until is in the most forward position.
- Side shift to the far right and lower foot.
- Place anchor in center of foot opening and lower probe drive until hex enters hex
drive on probe. (Figure 20)
- Drive in slowly using Probe and Rotation controls. Apply adequate force to push
as you rotate. If you rotate too rapidly, the anchor will simply auger a hole, and
will not anchor properly --- Drive in until all flighting is below ground level and
probe is at bottom of stroke.
- Raise foot, side shift to far left, and repeat this process. (Figure 21)
5-10

1. Extend platform out to full extension
2. Attached chain binders on each side of probe
3. Slip anchor plates over anchors and bind down each side (figure 22)
OM17-P4000VIS-NIR
Figure 22
Anchoring will limit your side travel somewhat, but you should still be able to take
multiple cores with the anchors installed.
- Do not use extension control while anchors are connected
- Remove the anchors in reverse sequence.
- If anchors have shifted during use and you are unable to slide the hex head of
the anchor back into the hex drive – use the foot to gently nudge the anchor back
into re-alignment.
Note: Be careful when lowering the probe with the instrument cases in
place. Remove left hand anchor first – otherwise you might push the head
of the anchor into the instrument mount when lowering probe to remove
RH anchor.
5-11

OM17-P4000VIS-NIR
Figure 23 P & T Hoses
Figure 24
Field Operations
P4000T Removal and Tractor installation
The P4000 is designed to work equally well on a tractor, or as a skid mount unit.
Removing probe from skid –
- Install three point stabilizer stands into probe and temporarily lock in mid position
with ¾” pinch bolt.
- Extend and unfold the probe.
- Lower foot to ground level.
- Remove fold cylinder pin, and carefully retract fold cylinder until it is fully
retracted. You may have to gently move fold control valve back and forth to
relieve pressure on pin for removal.(Figure 23)
- Carefully remove lower link pins and lower probe down by retracting foot cylinder
- Lower stabilizer stands and lock with ¾” bolt
- Retract probe platform and shut of engine. (Figure 23)
- Disconnect wiring and 4 hoses on bottom of console (Figure 24)
- Disconnect main Pressure and Tank hose from platform (Figure 25)
5-12

OM17-P4000VIS-NIR
Figure 25
Fold and
Extend hoses
Disconnect
wiring
Figure 26
Stabilizer
link bushing
Installing on Tractor –
- All bushings and pins are provided for Category I and II three-point hitches.
- Connect lower links – make sure you include the stabilizer link bushings(Figure
26)
- Connect top link
- Raise three point to desired height and level with top link
- Install lower stabilizer mount on drawbar and tighten 5/8” bolts
- Connect LH and RH stabilizer to upper and lower points, adjust, and lock with
jam nut.
- Connect hydraulic hoses noting P and T
- Retract stabilizer stands and engage hydraulics -- locking valve into detent with
tarp strap or other device. Make sure that flow is correct or controls will be
backward.
5-13

OM17-P4000VIS-NIR
Figure 1
Section 6
Maintenance and Lubrication
Proper maintenance and lubrication of the Veris P4000G will allow you to collect high
quality NIRS and EC data, and greatly extend the useful life of the unit. Veris
Technologies strongly suggests that you follow the following guidelines:
MAINTENANCE: Storage of Spectrophotometer
Spectrometer and Auxiliary cases are water resistant; store NIRS system indoors or
under roof. Water damage to spectrometers and electronic components is not covered
by warranty.
MAINTENANCE: Electrical Continuity and Isolation
It is advisable to perform this test on a routine basis (weekly or every 20-25 hours of
data collection) to ensure you are obtaining reliable data.
1) Probe electrode isolation – Check isolation of the dipole to the point with a
Digital Multi Meter if the coulter electrode is properly isolated, a reading of
12K ohm should be obtained.
6-1

OM17-P4000VIS-NIR
Test Load
-1
3
LOG
Figure 3
Instrument Signal Testing – The Veris Auxiliary Instrument is shipped with an
Instrument Test Load (Part No. 10447) that will enable you to quickly check the
instrument to ensure that it is functioning properly. To perform this test, do the following:
1) Disconnect the signal cable from the amp pin (signal) terminal on the auxiliary
case.
2) Connect the test load to the signal terminal.
3) Switch on the unit and perform System Check and Data Acquisition.
4) The display should show: (See Figure 30)
Shallow 3 (approx.)
Deep -1 (Not used in Probe Mode)
5) If the readings vary significantly (more than one whole number) contact Veris
service department.
6) Once the test is complete, remove the test load and reinstall the implement
signal cable.
Figure 2
6-2

OM17-P4000VIS-NIR
Figure 4
Figure 5
Maintenance: NIRS Wear-plate Replacement
Step 1:
With the probe out of the ground remove the wear-plate using a 3/32 hex wench.
Step 2:
Insert new O-ring into new shank wear-plate
Step 3:
Make sure both the surface of the wear plate and the surface of the probe are clean
before placing the new probe wear plate onto probe and securing with four new bolts.
Step 4:
Put the wear-plate back on and secure using a 3/32 hex wrench
6-3

OM17-P4000VIS-NIR
EC Point Replacement Procedure
While replacing the EC point take extra care to not damage the fiber optic cable.
Figure 6
Remove window sheath by loosening the four hex screws.
Figure 7 Figure 8
Clean hex screw with some pointed tool. Then loosen the hex screw on the side of the
housing to release the reflection module.
6-4

OM17-P4000VIS-NIR
Figure 9
Remove the bolts on the front cover to gain access the terminal block.
Figure 10
Now disconnect the EC Point wires from the terminal block. Use an ohm meter to check
witch wires to disconnect. The dipole on the EC point will be red 22ga wire. The case
of the EC point will be black 22ga wire.
6-5

OM17-P4000VIS-NIR
Figure 11
Using two wrenches unscrew the EC point from the probe housing.
Figure 12
Once the EC point is unscrewed pull the wires out.
6-6

OM17-P4000VIS-NIR
Figure 13
New replacement EC point.
Figure 14
Feed the wires of the new EC point down the probe. Using two wrenches tighten down
the EC point to the probe housing.
6-7

OM17-P4000VIS-NIR
Figure 15
Make sure the o-ring is pressed in the groove all the way before installing the window
sheath. Now secure the window sheath using the four hex screws. Tighten down the
hex screw on the side of the window housing. Move up to the top and connect the EC
point wires to the terminal block. Be careful with the fiber optic cable when putting the
front cover back on. It can be pinched between cover and probe. Once cover is on
secure with the bolts.
6-8
OM17-P4000VIS-NIR
Cables
Fibers
Loom
Clip
Mounting
Pin
Probe Removal
This procedure is needed when removing the probe for bench top use, road transport,
or for soil coring.
Step 1:
Disconnect the fibers from the spectrometer case, and the cables to the auxiliary case.
Step 2:
Remove loom from clip.
Step 3:
Figure 16
Step 3:
Firmly grasp probe, and remove the mounting pin holding the probe on the platform.
6-9

OM17-P4000VIS-NIR
Auxiliary case
Spectrometer case
Mounting plates
Latches
Case Removal and Installation
When the spectrometer and auxiliary cases need to be removed for storage, repair, or
bench top use follow these instructions.
First disconnect all wires and the optical fibers connected to the auxiliary and
spectrometer cases.
Each case is secured with two latches, and case and latch assembly can be removed
as a unit.
Figure 17
Figure 18
6-10

OM17-P4000VIS-NIR
Section 7
Troubleshooting
Troubleshooting EC module
Data missing from display reading –
1. Unit must be in contact with soil to record data points
2. Check GPS and DGPS signal; Veris instrument is programmed to eliminate all nonDGPS geo-referenced points.
3. Shut power off and restart
4. Check electrical continuity
5. Check input voltage, 12 v minimum required
Troubleshooting NIRS
No spectrum is present on graph or spectrum is not updating in Acquisition
1. Ensure USB cables are tightly connected
2. Shut down software and cases and restart system
3. Check port settings
4. Open each spectrometer individually in the manufactures software(procedure #7 & 8)
MS Windows brings up an new hardware found wizard when I plug in my cases
1. Select ‘Install software automatically’ and allow hardware wizard to configure device
Ports won’t save in Veris Spectrophotometer Software
1. Make sure the Exit button is being used to close out of the software, not the X in the
upper right hand corner.
No GPS data is coming in during acquisition
1. Check to ensure nothing is obstructing GPS signal (ex. buildings)
2. Is the GPS plugged into the correct port? (second one from the right on auxiliary
case)
3. Check to make sure GPS adaptor is in place
4. Follow the steps of the GPS troubleshooting guide to further diagnose problem
System check only allows one External Reference to be taken
1. Check to ensure the Ref Check light is green
2. Check the shutter movement distance (auxiliary indicator #17, should be 5.21 +/- .05
3. Check for green lights on the temperature and humidity indicators
Transform does not pass during System Check
1. Check to ensure the correct ER was placed under the shank and the correct ER
button was pressed during the system check.
2. Make sure instrument had a 20 minute warm up period
3. Make sure ER was pressed firmly in place, so little ambient light entered the shank
4. Run System Check again – run all four external references
7-1

OM17-P4000VIS-NIR
Computer crashes or has been hard reset while acquiring data
1. Once computer has restarted open Veris Spectrophotometer Software again.
2. Step through software till clustering has been complete. The cluster program will
generate a map, which will let the user know the last point where data was stored.
Using the map as a guide open the acquisition and begin to store data again. The
acquisition will append the new data to the previous data stored.
Reference check will not pass after several tries or steps are out of range
1. Close out of software
2. Shut down power/ restart power to cases
3. Check the port settings
4. Restart software and run dark/reference again
5. Complete procedure #9,on shutter movement.
Auxiliary data not updating or ports not setting up correctly
1. Shut down power, and restart cases
2. Ensure USB cables are secured tightly
3. Follow the steps outlined in procedure #10, to ensure data is present on the ports.
7-2
OM17-P4000VIS-NIR
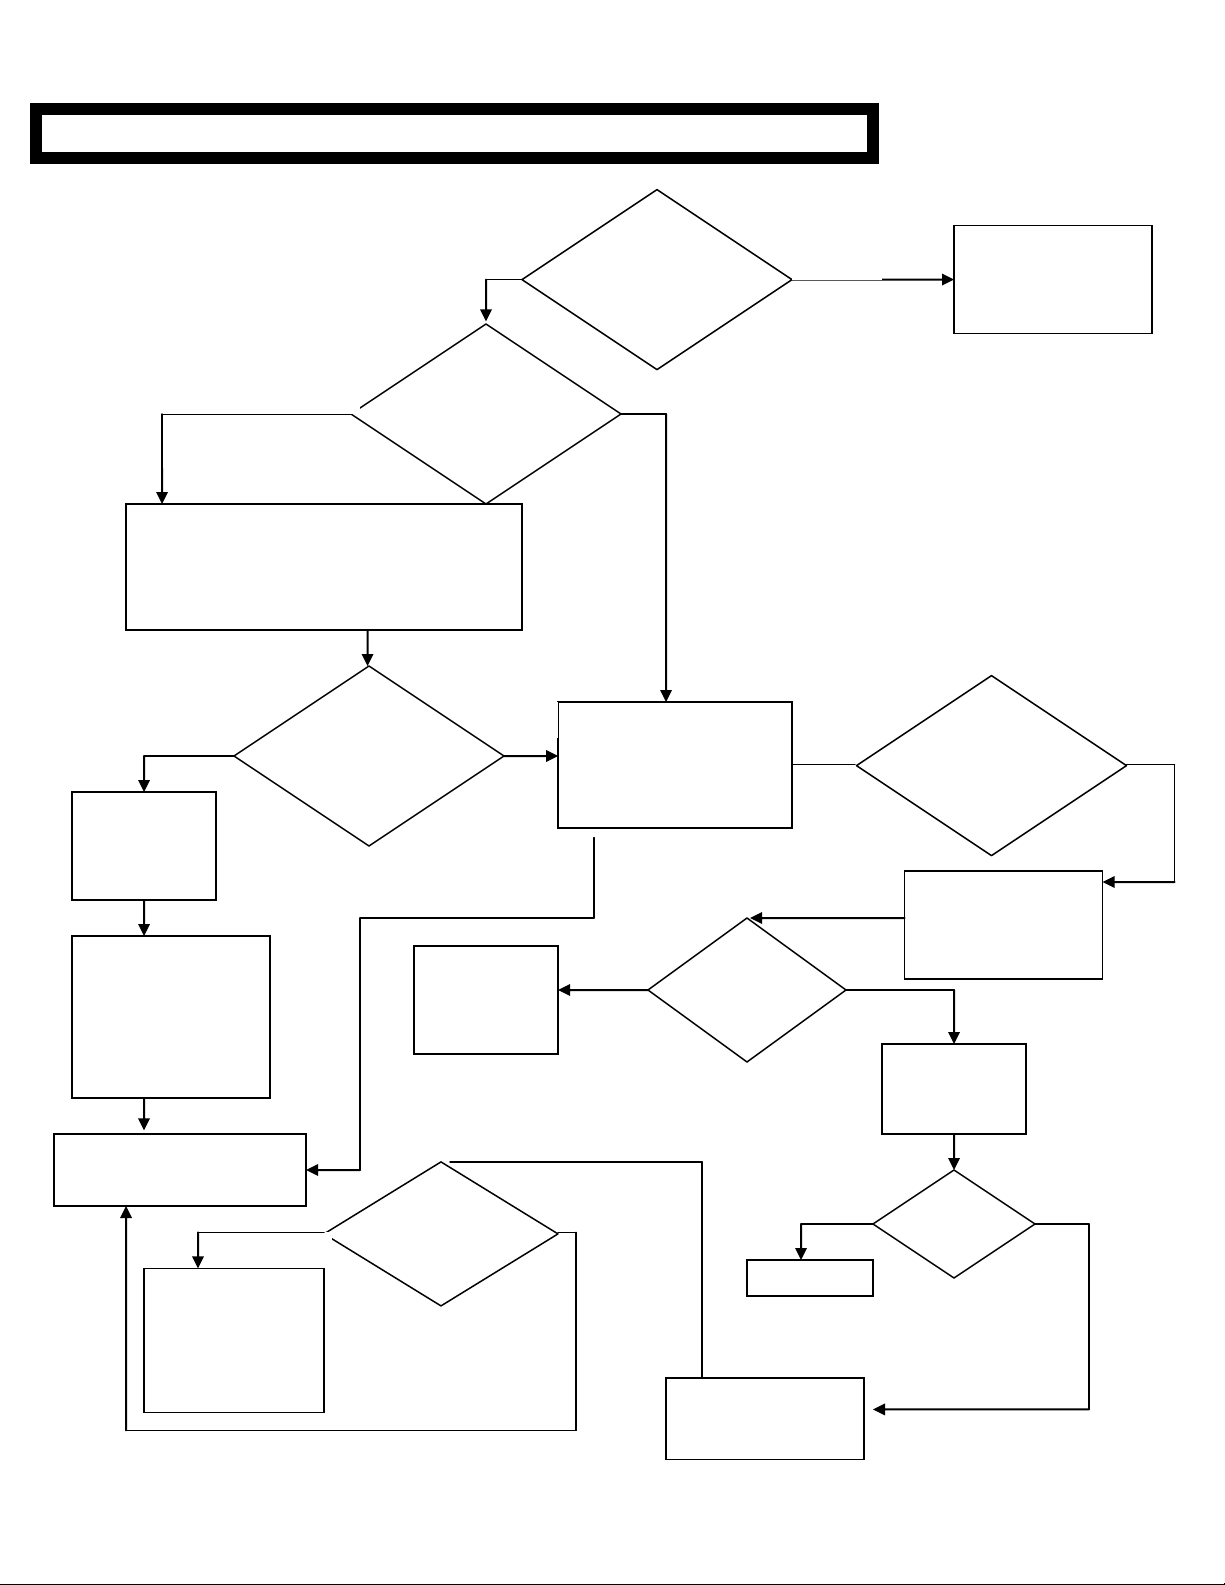
Problem: No response from Hamamatsu Spectrometer (1100-2200nm)
Does
Hamamatsu
software open?
(Proc. #7)
NO
Hamamatsu is
operating correctly.
Restart Veris
Spectrophotometer
Software and try again.
Does
Hamamatsu
report error
message?
Error stating temperature out of range
Error stating cannot find/open device
Check the device manager for Hamamatsu
hardware. To do so
Right click on the My Computer icon on the
desktop. Go to properties, click on the hardware
tab, then on the device manager button. Check to
see if Hamamatsu is listed in the alphabetical list.
Is Hamamatsu
present in
device
manager?
Shut down power to cases,
restart computer with cases
shut down. Once computer
comes back up, turn on
power and retry Hamamatsu
software.
YES
YES
NO
Does software
report
temperature still
out of range?
Open spectrometer
port in HyperTerminal
(Procedure #10) and
check the last digit of
string
YES
Check to
ensure case is
powered, USB
cables securely
connected.
Unplug and replug
USB cables. Wait to
see if a windows
installer comes up
asking to install
spectrometer software.
Afterwards reopen
software.
Last digit of
string = 1?
YES
Check fuse on
Hamamatsu
power supply
(Proc. #11)
Is fuse
good?
NO
Replace fuse
NO
Spectrometer
case is out of
temperature
range.
Check voltage to
Hamamatsu. (Proc.
#12)
Reinstall Hamamatsu software
using disk provided.
5V on
Hamamatsu?
Check for 12V at
power source (ex.
power supply,
battery), check
power connections.
Contact Veris
service department.
NO
YES
YES
Error stating temperature out of range
Software failed to open
7-3

OM17-P4000VIS-NIR
GPS port open in
HyperTerminal
Check HyperTerminal port
settings and ensure port is
present in the device
manager (see port settings)
Ensure GPS adaptor is
in place and GPS is
plugged into correct
spot on Auxiliary Case
(see system overview).
Check Veris
Spectrophotometer Software
port settings
Reinstall Edgeport drivers
Power down cases and
restart computer, once
computer is back up turn
power on to cases and
check again
Check GPS quality factor. (see
program modifications under
acq_settings.txt)
Is data
streaming in
HyperTerminal
? (Proc. #9)
NO
YES
Is port present
in device
manager?
(Proc. #3)
YES
NO
Is USB cable
plugged in
securely?
Plug USB
cable in
NO
Is the power
turned on to
the auxiliary
case?
Turn on power
to case
NO
YES
YES
Troubleshooting GPS
If GPS fails to come in it could be for a variety of reasons. The easiest way to isolate
the problem is to open the GPS port in HyperTerminal (see troubleshooting with
HyperTerminal).
7-4

OM17-P4000VIS-NIR
How to check Ocean Optics spectrometer
1) Click on start Programs Ocean Optics OOIBase32 Start OOIBase32
software
2) Check graph it see if spectrum is present (see figure below). The spectrum
should change as different objects are placed in front of the window on the
probe.
Figure 1
3) If there is no spectrum present or graph does not update as objects are placed
beneath the shank. Then the spectrometer needs to be configured. To
configure click on spectrometer configure A/D Interface tab
7-5

OM17-P4000VIS-NIR
Figure 2
4) Under Spectrometer Type select S4000. For the A/D Converter Type select
USB4000. The USB Serial Number will have one serial number present, which is
unique to each spectrometer, select the available serial number.
5) Click OK to save the settings and return to the main screen. A spectrum should
now be present.
6) Close OOIBase32 software, restart computer, and open Veris
Spectrophotometer Software to begin mapping again.
7-6

To open Hamamatsu spectrometer individually
Open spectrometer icon
1) Click on Start Programs HamamatsuMinispectrometer
EvaluationSoftware SpecEvaluation
2) Click on open spectrometer
Figure 3
3) Click on Open under Select Spectrometer
OM17-P4000VIS-NIR
Figure 4
4) Click on start and check to see if spectrum graph changes as different objects
are placed adjacent the probe window. This ensures the Hamamatsu
spectrometer is working properly. If this is not the case then close Hamamatsu
software, shut down power, restart computer and try Hamamatsu software again.
7-7

Figure 5
Start
OM17-P4000VIS-NIR
7-8

OM17-P4000VIS-NIR
Figure 7
Troubleshooting NIRS with HyperTerminal
If auxiliary data fails to come in properly, then the port and device can be verified
outside of the software by utilizing the HyperTerminal. If the port works properly here
then the data should be present in the Veris Operating software. If the ports fail to open
or does not have any data present then check the physical connections to the auxiliary
box, unplug the USB cords, shut down the system, and restart the computer, then check
for the auxiliary data again.
How to open HyperTerminal
o On MS Windows 2000 or XP machine
o Start Programs Accessories Communications HyperTerminal
o Enter name of connection ex. com3@9600
o Click OK
Figure 6
o Select the correct com port from the connect using option.
o Click OK
7-9

OM17-P4000VIS-NIR
Enter com port properties for your device. See the Port Properties section for the
standard settings.
Figure 8
o Click OK
o HyperTerminal session now open and data should be present. See Port
Definitions for example HyperTerminal data.
.
Port Properties
o Temperature Port
Bits per second: 9600
Data bits: 8
Parity: None
Stop bits: 1
Flow control: None
o GPS
Bits per second: 4800
Data bits: 8
Parity: None
Stop bits: 1
Flow control: None
o Control Port
Bits per second: 9600
Data bits: 8
Parity: None
Stop bits: 1
Flow control: None
7-10

o Spectrometer Port
Bits per second: 9600
Data bits: 8
Parity: None
Stop bits: 1
Flow control: none
Port Definitions
o Temperature Port – Reads in soil temperature.
o GPS Port – Reads in GPS coordinates.
OM17-P4000VIS-NIR
Example of temperature port connected in HyperTerminal
Example of GPS port connected in HyperTerminal.
o Control Port – Reads in EC, Auxiliary case temperature and humidity, and
shutter steps. After opening this port if no data is present type S for shank
mode or P for probe mode. The letter after E represents the shutter state.
In the case below the shutter is in neutral or rest. If the case reads R the
shutter is in reference or if there is a D the shutter is in dark. To manually
move the shutter type N for neutral, then R for reference, then D for dark.
Example of Control Port connected in HyperTerminal.
How to read control port data strings
Shank Mode
E shutter position, current, voltage deep, voltage shallow *
T temperature, humidity, shutter steps, 0, 0*
7-11

OM17-P4000VIS-NIR
o Spectrometer Port – Reads in Spectrometer temperature and humidity,
side box temperature, cooler state, and spectrometer cooler state.
7-12

OM17-P4000VIS-NIR
Use a flat head screwdriver to
remove fuse
Fuse replacement
There are two fuses inside the spectrometer case and one inside the auxiliary case. To
locate and replace these fuses, follow these steps. First remove the cases see the
following
Spectrometer case fuses
The first fuse is on the side control box. This is a four-amp fuse, which protects the
power to the Hamamatsu spectrometer as well as the internal microcontroller. To locate
this fuse take off the six screws securing the mounting plate on the side of the box.
Figure 9
Internal wiring of the spectrometer case control box
Figure 10
Fuse and fuse holder once removed
The other fuse is located inside the spectrometer case underneath the mounting shelf.
This fuse protects the power to the Edgeport hub, which sends data out through the
USB port.
7-13

OM17-P4000VIS-NIR
Edgeport hub
Ocean Optics USB4000
spectrometer
Silica gel packet
used to remove
moisture in the air.
Note: If humidity in
spectrometer case
is above 90% this
packet needs to be
replaced.
Fiber optic cable
USB output cable
Figure 11
Inside view of spectrometer case mounting shelf
To reach the fuse for the Edgeport first disconnect the fiber optic cable to the USB4000,
then disconnect the USB output cable.
Figures 12 and 13
Once the fiber optic cable and the USB output cable have been disconnected, the shelf
can be tilted up and the case will be exposed.
7-14

Figure 14
Edgeport hub
power board, also
the temperature
and humidity
readings are
monitored from
this board
Fuse can be removed using
screwdriver. Replace only with
3-amp fuse.
Spectrometer case mounting shelf tilted back.
OM17-P4000VIS-NIR
Figure 15
7-15

OM17-P4000VIS-NIR
Fuse holder. Replace only with a
4-amp fuse.
Connect negative lead from
voltmeter here (brown wire)
Connect the positive
lead from the voltmeter
here (white wire)
Voltage should read 5V, as
long as spectrometer case is
within temperature range.
The fuse for the auxiliary case protects the voltage for the electrical conductivity board
and the lamp. To replace the fuse open the case and locate the black fuse holder
Figure 16
Checking Spectrometer Input Voltage and Hamamatsu Voltage
Figure 17
Internal wiring of auxiliary case
7-16

OM17-P4000VIS-NIR
Number
Name
Description
0
UTC
Universal Time Coordinated hhmmss.cc
hh = hours, mm = minutes, ss = seconds,
cc = hundredths of seconds
1
Long
GPS Longitude
2
Lat
GPS Latitude
3
Alt
GPS Altitude
4
Speed
Speed (Km/h)
5 I Current used to calculate EC data
6
Vsh
Voltage shallow
7
Vdp
Voltage deep
8
Soil temp
Soil temp
9
X/force
Spare for Shank mode or force for probe mode
10 Y Spare
11
Z/depth
Spare for Shank mode or depth for probe mode
12
Spec temp
Spectrometer case temperature
13
Side temp
Side control box on spectrometer temperature
14
Spec hum.
Spectrometer case humidity
15
Aux temp
Auxiliary temperature
16
Aux hum.
Auxiliary humidity
17
Steps
Steps shank moves during dark/reference check
All temperatures are
in degrees C. If no
data is present for
an auxiliary data
item a –1.50 will be
output.
Section 8
Glossary
Spectrophotometer – A complete system for making spectral measurements. The
system includes a light source, means for collecting light that has interacted with the
material under test, and a spectrometer to measure the collected light.
Spectrometer – Instrument to measure the quantity of light over a spectrum of
wavelengths. The spectrometer is the "measurement engine" of the spectrophotometer.
Auxiliary Data (in system check and acquisition)
Field Auxiliary output definitions
EC_Sh – Electrical conductivity shallow.
EC_Dp - Electrical conductivity deep.
Temp – Soil temperature
Spec_T – Spectrometer case temperature
Ctrl_T – Control box temperature (this is the metal box on the side of the spectrometer
case)
Spec_H – Spectrometer case humidity
Aux_Te – Auxiliary case temperature
Aux_Hu – Auxiliary case humidity
8-1

OM17-P4000VIS-NIR
Specifications
Max ambient temperature to operate system: 110 degrees F
Max spectrometer case temperature: 30 degrees C
Max spectrometer case humidity: 90% RH
If spectrometer case humidity reaches this point, the silica packet inside
spectrometer case needs to be replaced.
Max side case (control box) temperature: 65 degrees C
Max aux case temperature: 65 degrees C
Max aux case humidity: 90% RH
Field Files Description
acquisition_samples_*.txt Transformed samples in absorbance
taken during acquisition.
Figure 1
The first column represents the sample number, except for the first value of –4, which
indicates that the row is the spectrometer wavelength values. There will be a total of
384 wavelength values, which also represents the number of columns in each sample
file. In this example a total of three samples were taken, for each wavelength there is
an absorbance value, so for sample 1 at wavelength 348.84732 the absorbance was
.8793300.
master_veris_standards.txt External reference data in reflectance
standardized against Avian grayscales.
(provided by Veris)
external_reference_*.txt Untransformed external reference data
in reflectance taken during system
check.
xform_*.txt Transform created by comparing
master_veris_standards and latest
xternal_reference files.
raw_spectra_*.bytestream Field data taken in compact bytestream
format. Note: Each time system check
is ran a new .bytestream file and
xform.txt file will be created. Once
system check has been completed
8-2

OM17-P4000VIS-NIR
Figure 3
successfully, then the .bytestream
file will automatically be appended to
if acquisition is stopped and started
again later.
field spectra.txt Auxiliary sensor data and field data in
absorbance extracted and transformed.
Figure 2
The first 17 columns of the field spectra file represent the auxiliary sensor data (see
glossary for definition), each is labeled by a header, following the header is the
wavelength values. The next 384 columns are the absorbance data at each wavelength.
A value of –1 represents no data was present at that time.
Probe field spectra.txt This is output after the extraction
is ran and has all the hole
data interpolated to the same
depth increments.
cleaned field spectra.txt Filtered field spectra can be used
for applying calibration.
loadings.txt Principal components loadings.
PC_scores.txt Principal component scores.
interp_PC scores.txt Interpolated PC scores.
proposed_locations.txt Proposed sample locations
based on clustering.
actual_locations.txt Actual locations stored during
sampling program.
spectra@locations.txt Interpolated spectra and auxiliary
data at actual locations.
8-3

OM17-P4000VIS-NIR
The P_Sample, P_Long, P_Lat, P_Depth are the actual sample number, longitude,
latitude, and depth. The # Spec refers to the number of spectra found near each sample
location. These are the locations that were selected in the sampling program. The
depth is only used in the probe mode. The next 17 columns are the interpolated data
found near each of those actual locations. Then the next 384 columns are the
interpolated spectra data found near each of the actual locations.
Settings Folder
These files are used to store values and paths for the Operating software. These files
are automatically created and should not be altered.
boolean.txt Stores steps of Operating
software.
configuration.txt Stores aux data length and
spectrum length.
spectra path.txt Stores spectra path.
xform path.txt Stores xform path.
8-4

OM17-P4000VIS-NIR
Appendix
#1 Program Modifications
The files in the C:\Veris directory are used to store configuration settings for the Veris
Operating software. These are set to default values, but can be changed.
Veris directory files Description
acq_settings.txt Stores acquisition settings, these
can be configured by the user.
Ex. 0.010 19.000 5.000 15.000 0.150 0.150 0.300 0.150 2.000
These values represent the following controls in this order:
Reference check tolerance
Hamamatsu integration time (ms)
Seconds of data to average
Ocean Optics integration time (ms)
External reference #1 max allowed RMSE
External reference #2 max allowed RMSE
External reference #3 max allowed RMSE
External reference #4 max allowed RMSE
GPS Quality Factor (2 = DGPS 1 = GPS 0 = No GPS)
cluster settings.txt Stores cluster settings, which can be
configured by the user
Ex. 3 15
These values represent the following controls in this order:
Number of principal components to use
Number of clusters
interpolation.txt Stores interpolation settings, which can
be configured by the user.
Ex. 0.100 1.000 2.000 1.000 15.000 0.000 3.000
These values represent the following controls in this order:
Depth increments (probe mode only)
Sample points longitude column
8-5

OM17-P4000VIS-NIR
Sample points latitude column
Spectra latitude column
Spectra depth column (probe mode only)
ports.txt Stores ports and baud rates from
previous time system was run.
ref_wavelengths.txt Stores values of the useable
wavelengths for each spectrometer,
which can be configured by the user.
These wavelengths will be
used to filter the data.
Ex. 450.000 950.000 1150.000 2150.000
These values represent the following controls in this order:
Ocean Optics minimum usable wavelength
Ocean Optics maximum usable wavelength
Hamamatsu minimum usable wavelength
Hamamatsu maximum usable wavelength
probe_xform.txt Stores latest transform.
wlc_*.txt Stores Hamamatsu calibration
coefficients these are provided by Veris.
xform_settings Stores settings for creating transforms,
which the user can configure.
Ex. .075
This value represents the maximum allowed RMSE, when comparing the previous
transform to the current transform.
8-6
 Loading...