

Page 1

Operating Instructions
VIS/NIR Spectrophotometer
Table of Contents
Section 1
1-2 Warranty
1-3 Safety
Section 2
2-1 System Overview
2-6 Software Installation Guide
2-11 Configuring Ocean Optics Spectrometer
2-15 Setting port order
2-16 Setting Integration Time
Section 3
3-1 Field Operations--Electronics
3-13 Bench top usage
3-15 Test/Example data
3-16 Field Operations—NIRS and EC Mobile Sensor Platform
Section 4
4-1 Maintenance and Lubrication
4-8 NIRS Wear-plate replacement
4-11 Shank Removal
4-14 Case Removal
Section 5
5-1 Troubleshooting
5-6 Procedure #1 Checking Ocean Optic Spec
5-8 Procedure #2 Checking Hamamatsu Spec
5-10 Procedure #3 Shutter Movement
5-12 Procedure #4 Troubleshooting with HyperTerminal
5-16 Procedure #5 Fuse Replacement
5-20 Procedure #6 Checking voltage on Hamamatsu
5-21 Procedure #7 Replacing halogen lamp
5-23 Glossary
5-24 Field Auxiliary output definitions
5-27 Program modifications
Pub.# OM17-NIR Shank
Page 2
Pub# OM17-NIR Shank
Section 1
MSP with Near Infrared Spectrophotometer
Warranty
Veris Technologies warrants this product to be free of defects in materials and
workmanship for a period of one (1) year from the date of delivery to the purchaser.
Veris Technologies will repair or replace any product returned to Salina, Kansas, which
appears upon inspection to be defective in materials or workmanship. Veris
Technologies will have shall have no obligation under this warranty for the cost of labor,
down-time, transportation charges, or for the repair or replacement of any product that
has been misused, carelessly handled, modified, or altered.
ALL OTHER WARRANTIES OF ANY KIND, WHETHER EXPRESSED OR IMPLIED,
INCLUDING BUT NOT LIMITED TO ANY IMPLIED WARRANTY OF
MERCHANTABILITY OR OF FITNESS FOR A PARTICULAR PURPOSE AND ALL
CLAIMS FOR CONSEQUENTIAL DAMAGES, ARE SPECIFICALLY DISCLAIMED AND
EXCLUDED.
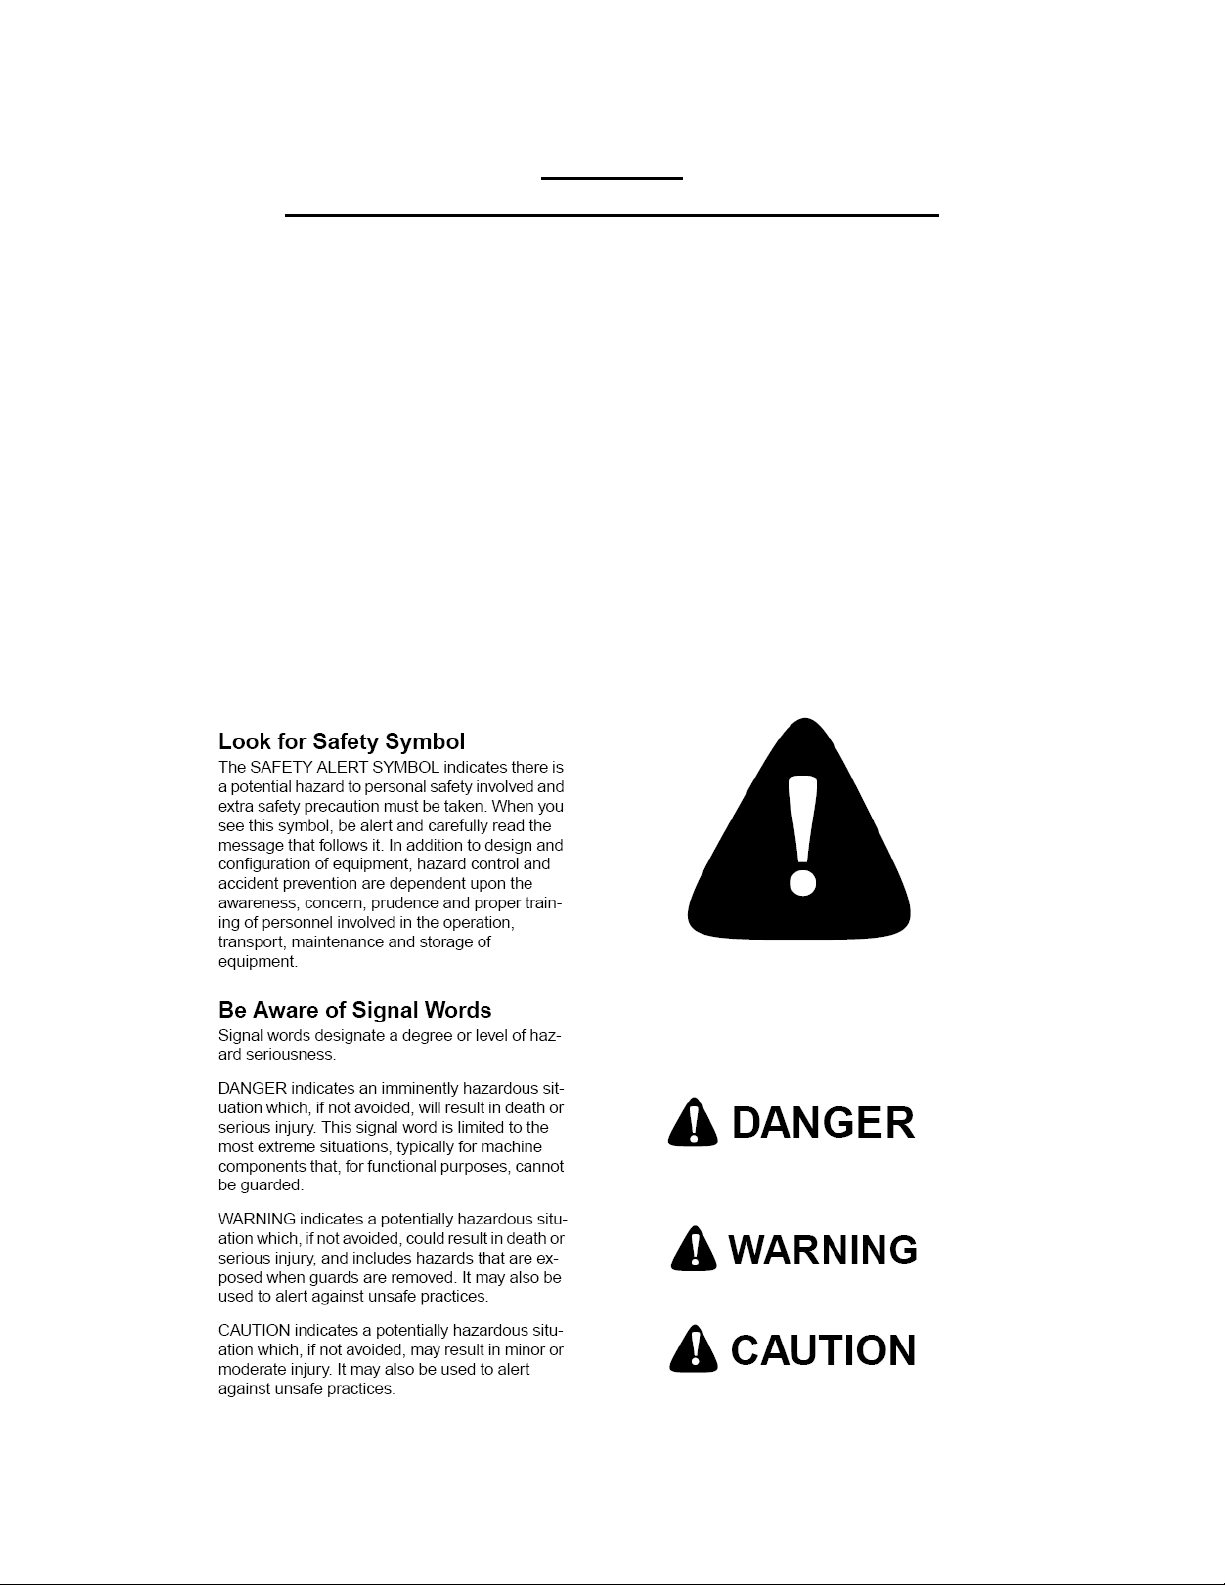
Safety
Important! Read the following SAFETY PROCEDURES before operating the Veris
MSP:
• Read and understand all instructions on safety decals
1-2
Page 3

Pub# OM17-NIR Shank
• Escaping fluid under pressure can penetrate the skin causing serious injury. Avoid
the hazard by relieving pressure before disconnecting hydraulic lines. Use a piece of
paper or cardboard, NOT BODY PARTS, to check for suspected leaks.
• Wear protective gloves and safety glasses or goggles when working with hydraulic and
high-pressure wash systems.
• If an accident occurs, see a doctor immediately. Any fluid injected into the skin must
be surgically removed within a few hours or gangrene may result.
• Pinch point hazard: to prevent injury, stand clear when raising or lowering any part of
the Veris MSP.
• Install all transport locks before transporting or working underneath.
• Detach and store implements in an area where children normally do not play. Secure
implement by using blocks and supports.
• Read Operations Manual before operating machine
• Review safety instructions with operators before operating machine and at least
annually
• Never stand on or use tire as a step
• Do not tow the implement on public roads without the optional light package, or without
the proper safety equipment and licensing as required by your State Department of
Transportation. Always use safety chain.
• Riders obstruct the operator’s view. They could be struck by foreign objects or
thrown from the machine.
• Never allow children to operate equipment.
• To prevent possible electrical shock, or damage to the instrument, do not connect to
any power source greater than twelve (12) volts DC.
• Do not grease or oil implement while it is in operation.
• Disk edges are sharp. Be careful when working in this area.
• Disconnect battery ground cable (-) before servicing or adjusting electrical systems or
before welding on implement.
• Remove buildup of mud, oil or debris.
• Be prepared if a fire starts.
• Keep a first aid kit and fire extinguisher handy.
1-3
Page 4
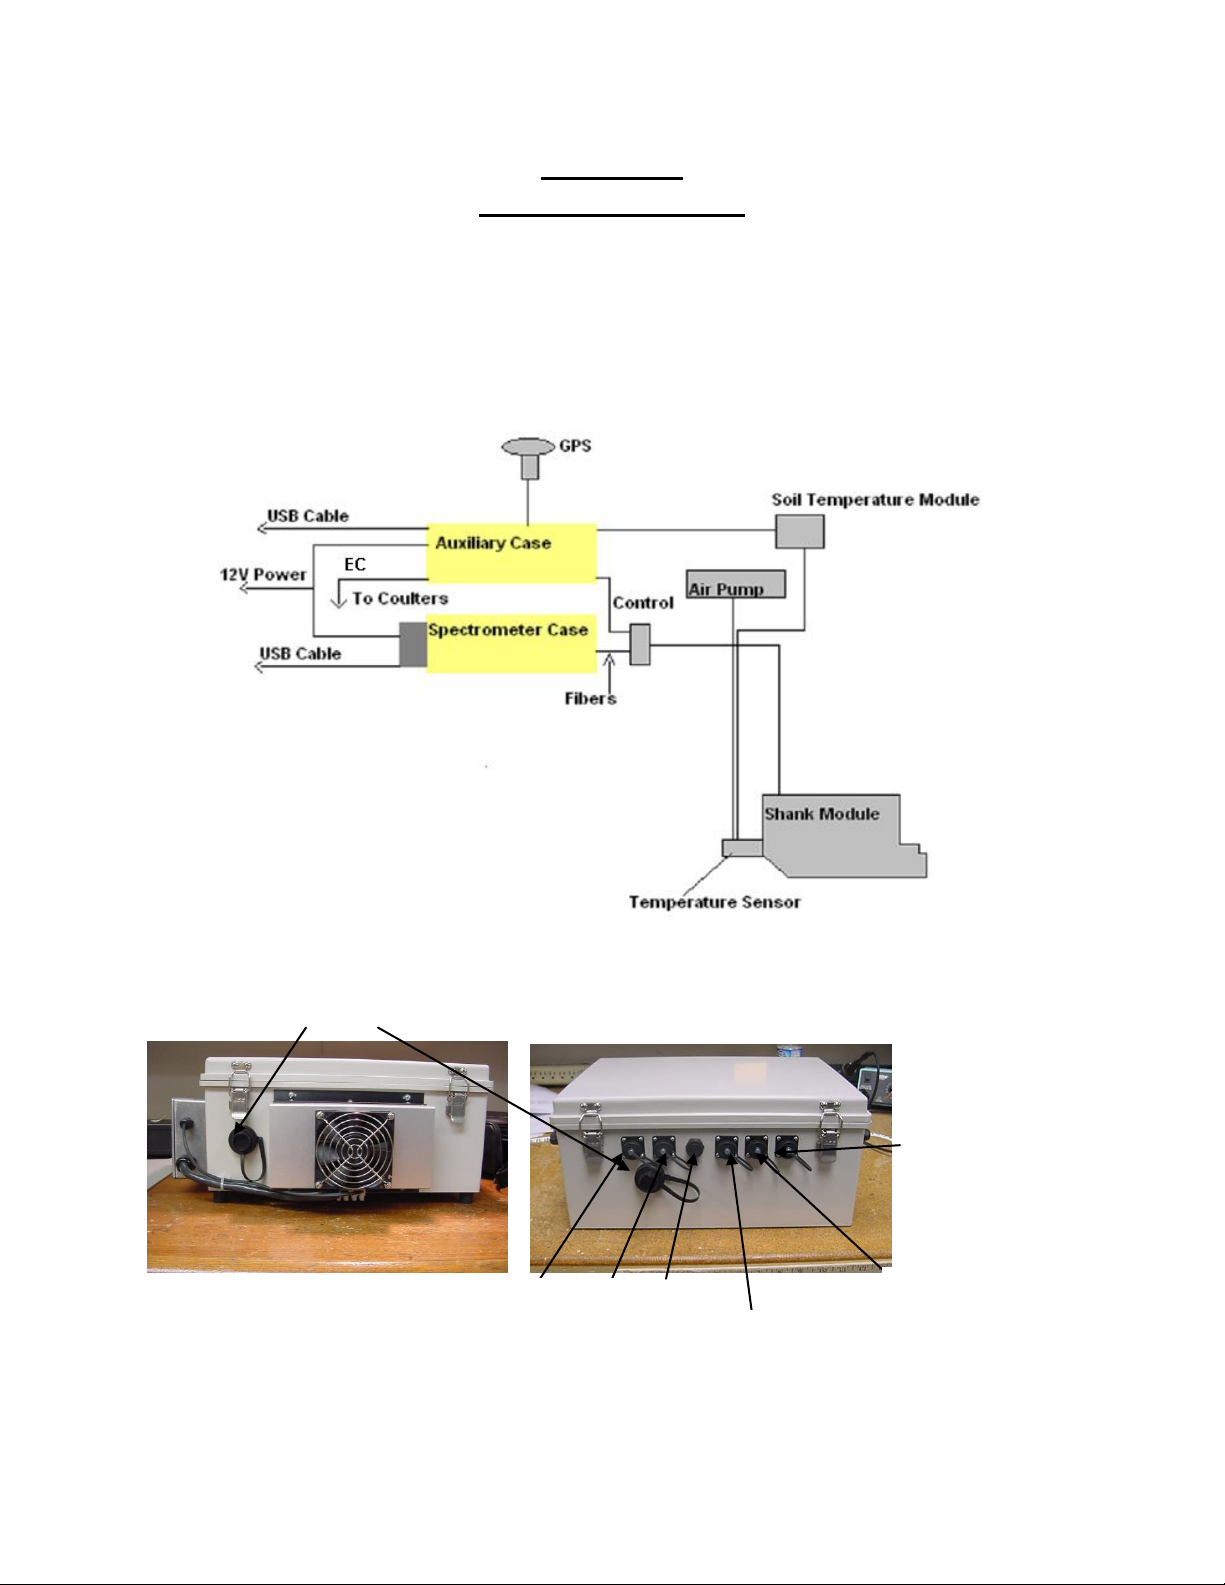
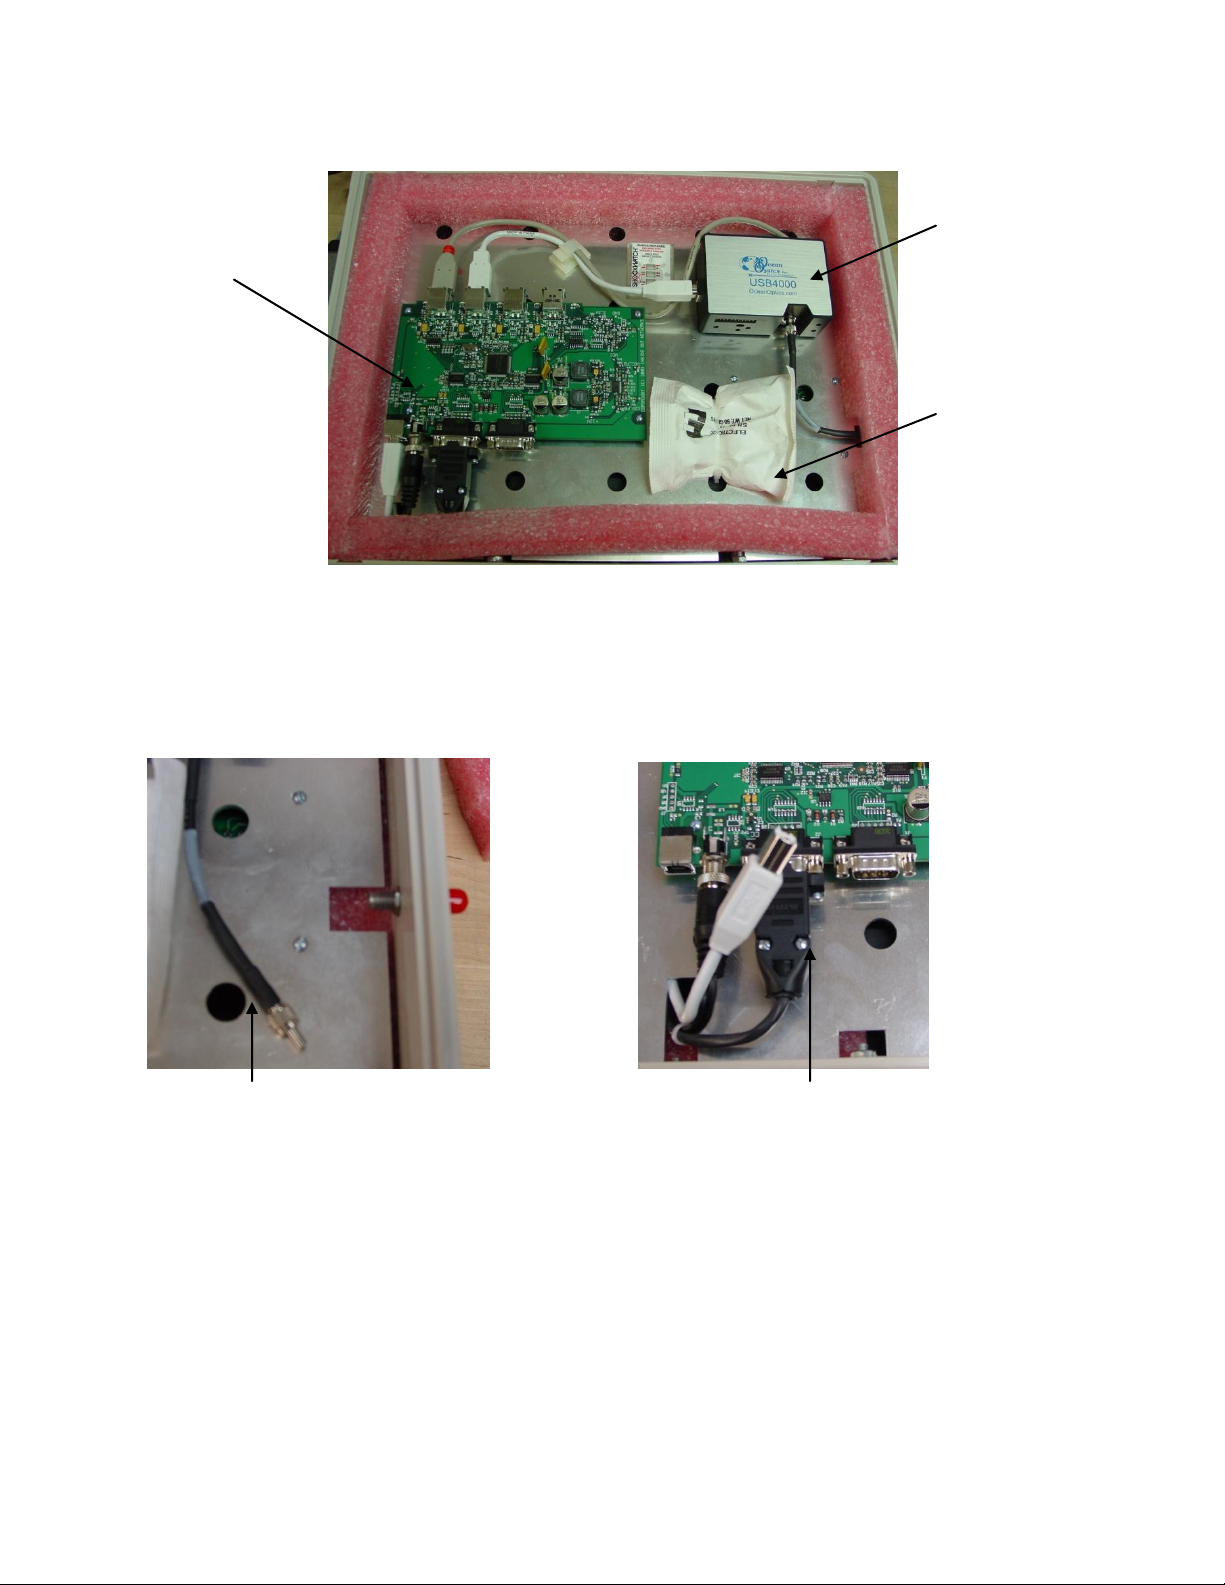
Pub# OM17-NIR Shank
Spectrometer case
EC
Lamp
Temperature
Motor
GPS
Spare
Auxiliary case
USB ports
Section 2
System Overview
Description:
The Veris Spectrophotometer acquires absorbance measurements of soil while being
pulled through the field. Alternatively, the unit can be set up in stationary mode in a
laboratory to acquire absorbance measurements of samples.
System diagram
Figure 1
Figures 2 and 3
2-1
Page 5
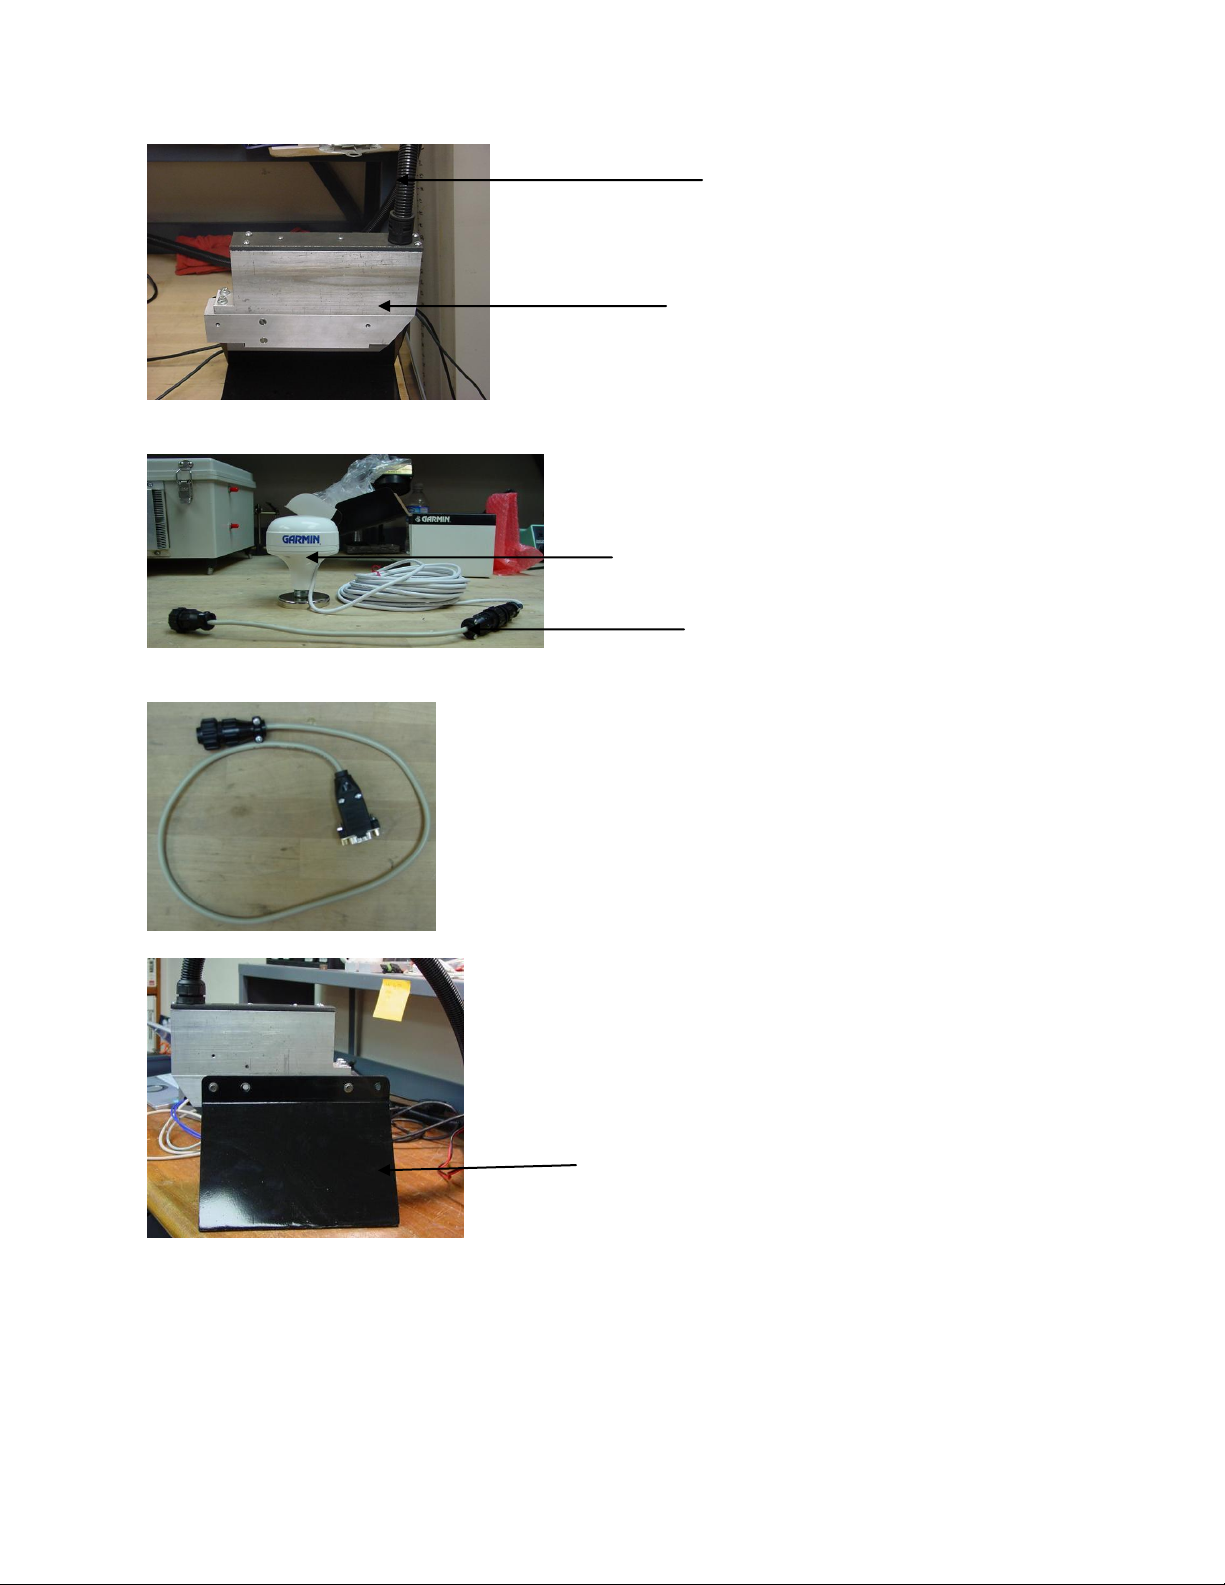
Figure 4
Shank module
#30267
Cable that includes fiber, motor
control and lamp power
Garmin GPS
# 21221
GPS adaptor cable #30727
Note: This adaptor cable is
required in order for
compatibility with the provided
Garmin GPS.
Shank bench top
stand
#33204
GPS serial adaptor cable
#35482
This will connect the serial port of a GPS to the GPS
port on the auxiliary case, for using an alternate GPS
to the Garmin. External power is required for the GPS
to function.
Figure 5
Pub# OM17-NIR Shank
Figure 6
Figure 7
2-2
Page 6
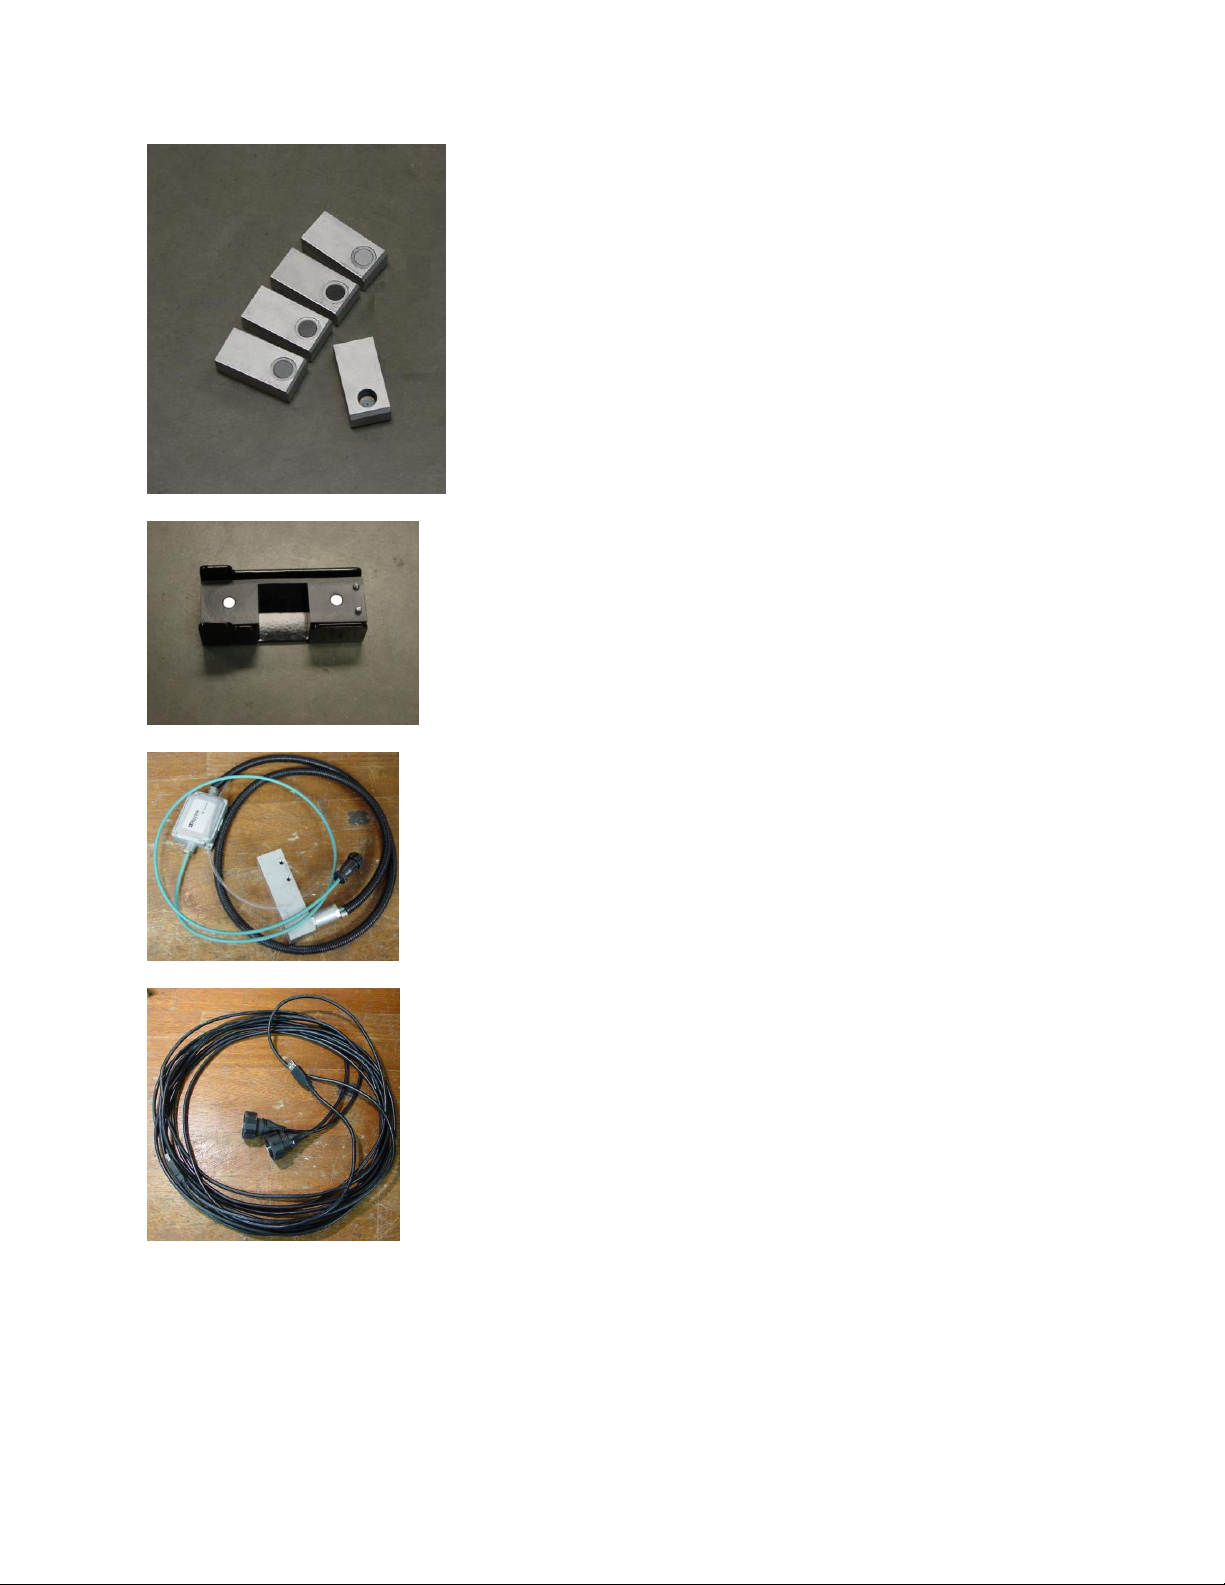
Figure 8
External reference blocks
and reference block holder
which are used to calibrate
instrument during the system
check.
External reference block
holder
Soil temperature sensor
#30276
5-meter USB cables
#30281
Pub# OM17-NIR Shank
Figure 9
Figure 10
Figure 11
2-3
Page 7
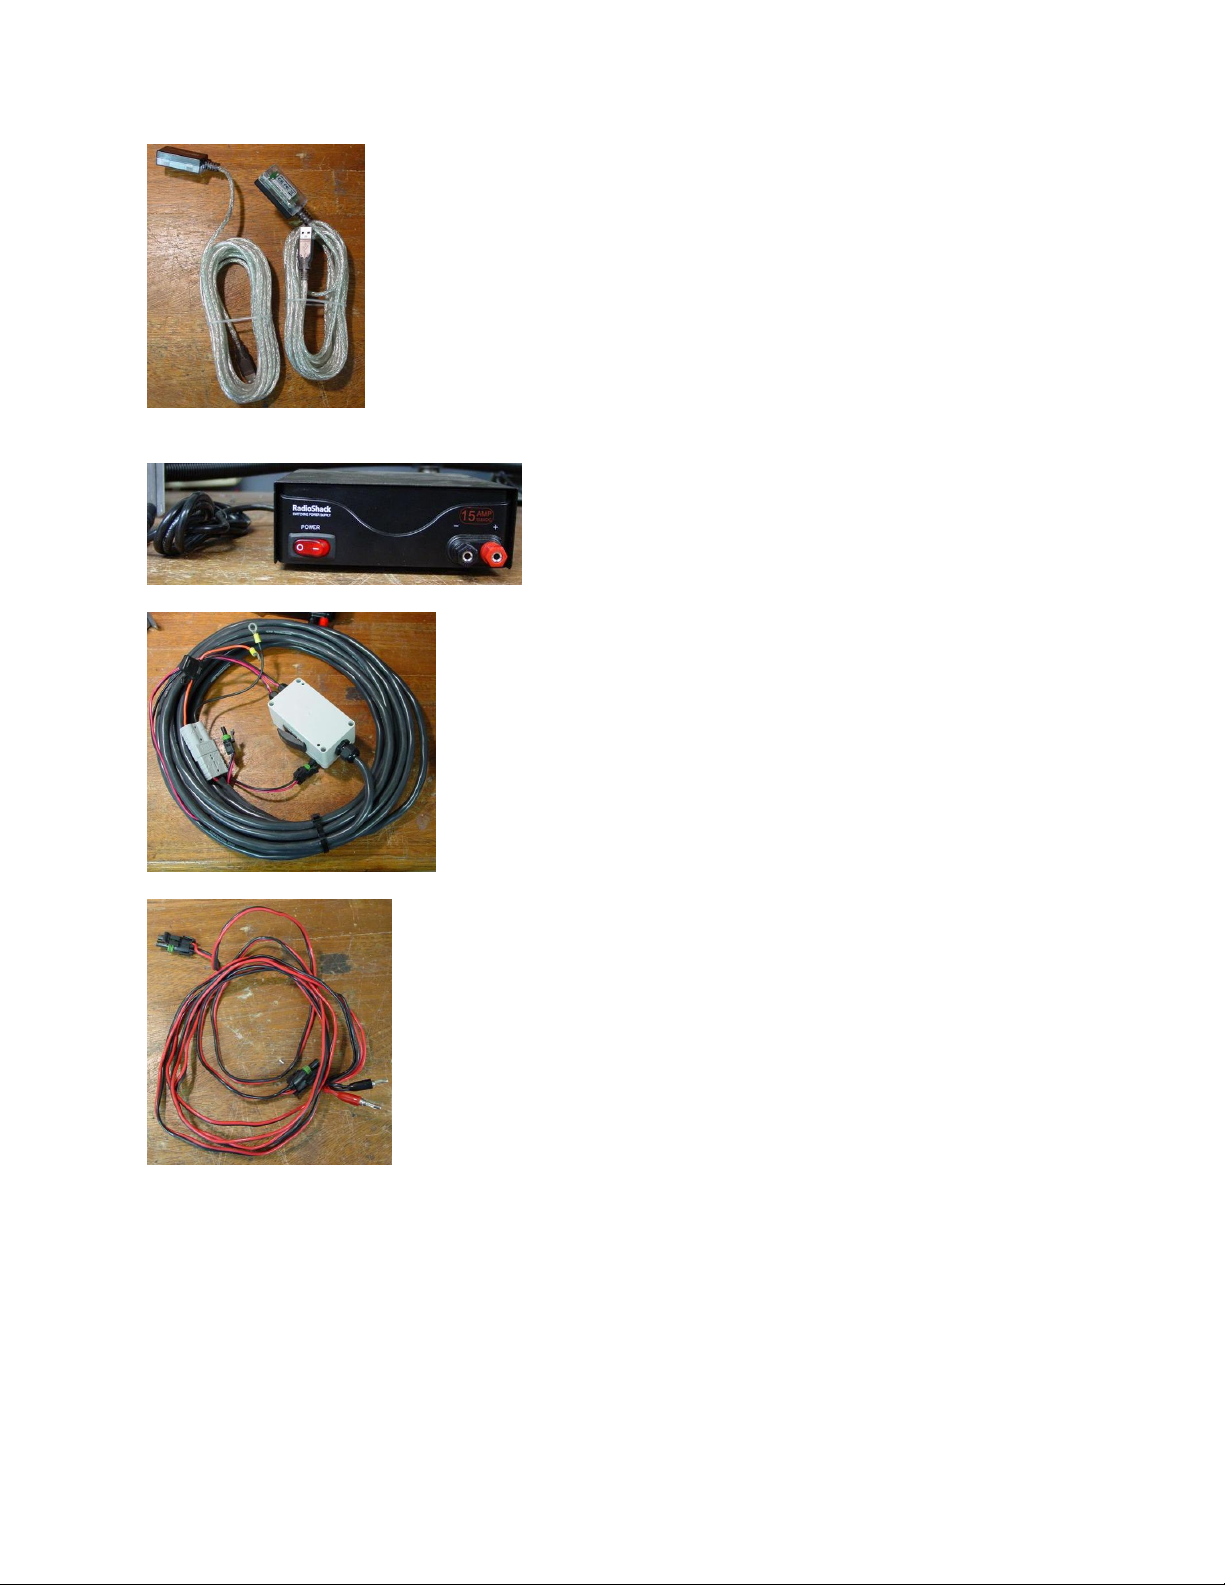
Figure 12
USB repeaters
#32891
These are to be used only when the
regular 5-meter long USB cables
are not long enough.
15-amp power supply
#34669
This will power the instrument
in a bench top setting.
Power cable
#33158
This is used to power the
instrument from a vehicle (for
field use).
Note: Only use 15-amp fuse
Power cable for 15-amp power supply
Figure 13
Pub# OM17-NIR Shank
Figure 14
Figure 15
2-4
Page 8
Pub# OM17-NIR Shank
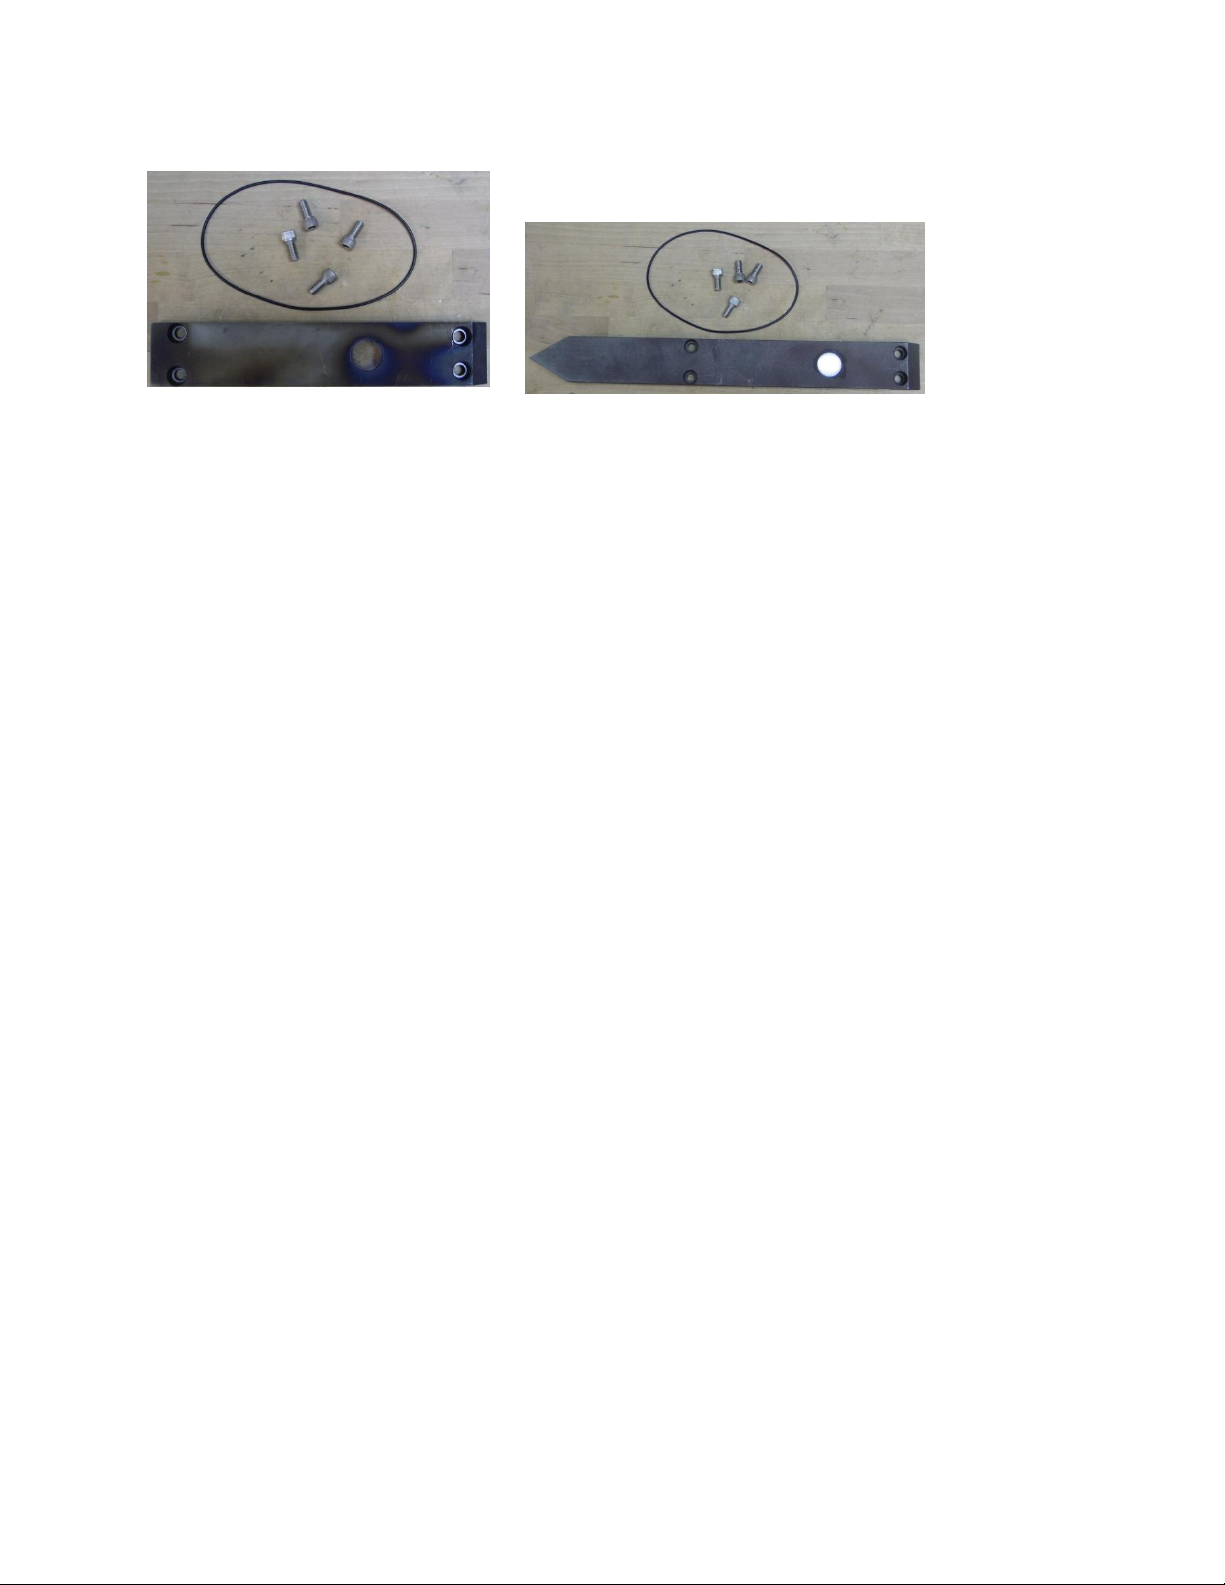
Wearplate assembly
#31934
For serial #s 1001 thru 1005
Wearplate assembly
#35488
For serial #s 1006 and beyond
Figures 16 & 17
Note: For computers outside the United States of America, please make the
following change to the computer’s regional settings before installing the Veris
Spectrophotometer Software.
Step 1: Open control panel and double click on Regional and Language Options
Step 2: Click on Customize, the following screen will appear. The Decimal symbol
needs to be a “.” while the Digit grouping symbol needs to be a “,”. The will ensure
proper operation of the software. Once the changes have been made click OK and
proceed with installation.
2-5
Page 9
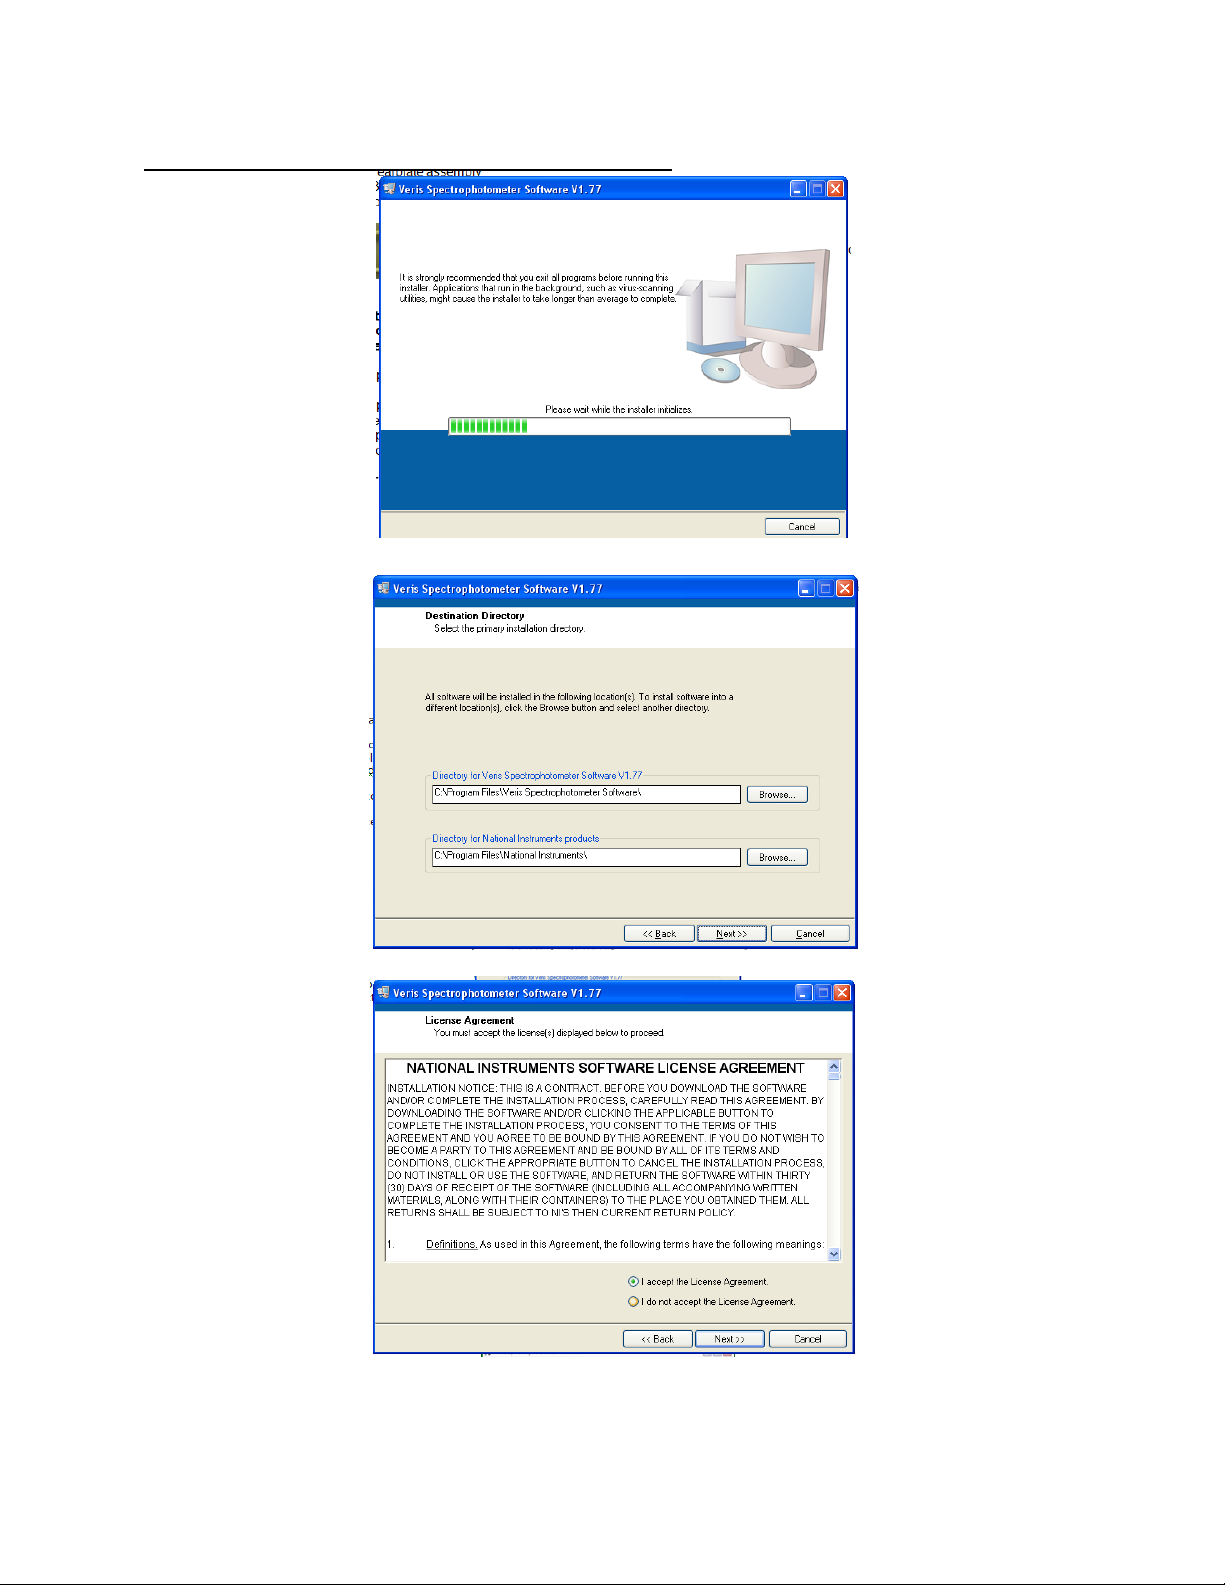
Veris Spectrophotometer Software Installation
The Veris
Spectrophotometer
Software installer will
guide the user through
installation of the Veris
operating software and
the necessary drivers
needed to run the
spectrometers. Note:
Do not plug in USB
cables for cases at
this time.
Keep the default
directory and click next
Veris Spectrophotometer
Software V1.77 and up will
run on either Windows XP,
Vista or 7—32 bit operating
systems only
Figure 18
Pub# OM17-NIR Shank
Figure 19
Figure 20
2-6
Page 10
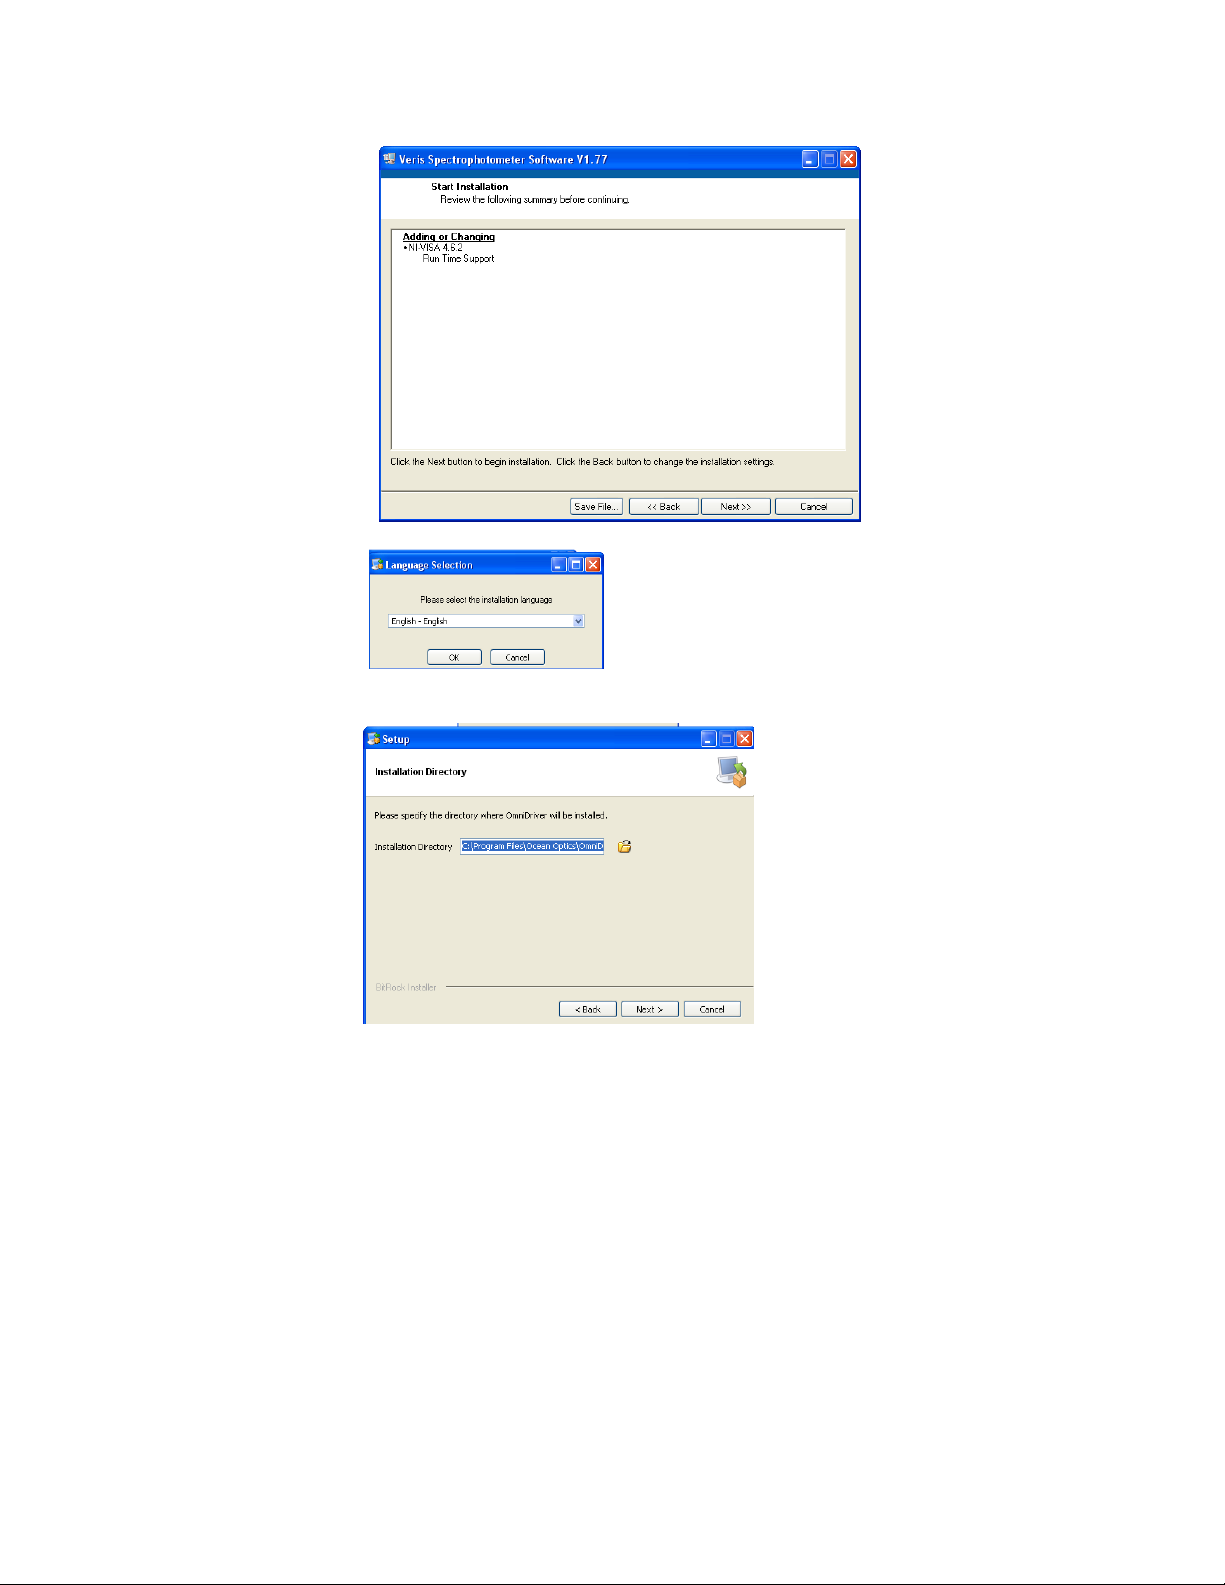
Now the ocean optics
drivers will be installed.
Select language and
continue.
Leave the default
directory and click next
Select next to
complete install
Figure 21
Figure 22
Pub# OM17-NIR Shank
Figure 23
2-7
Page 11
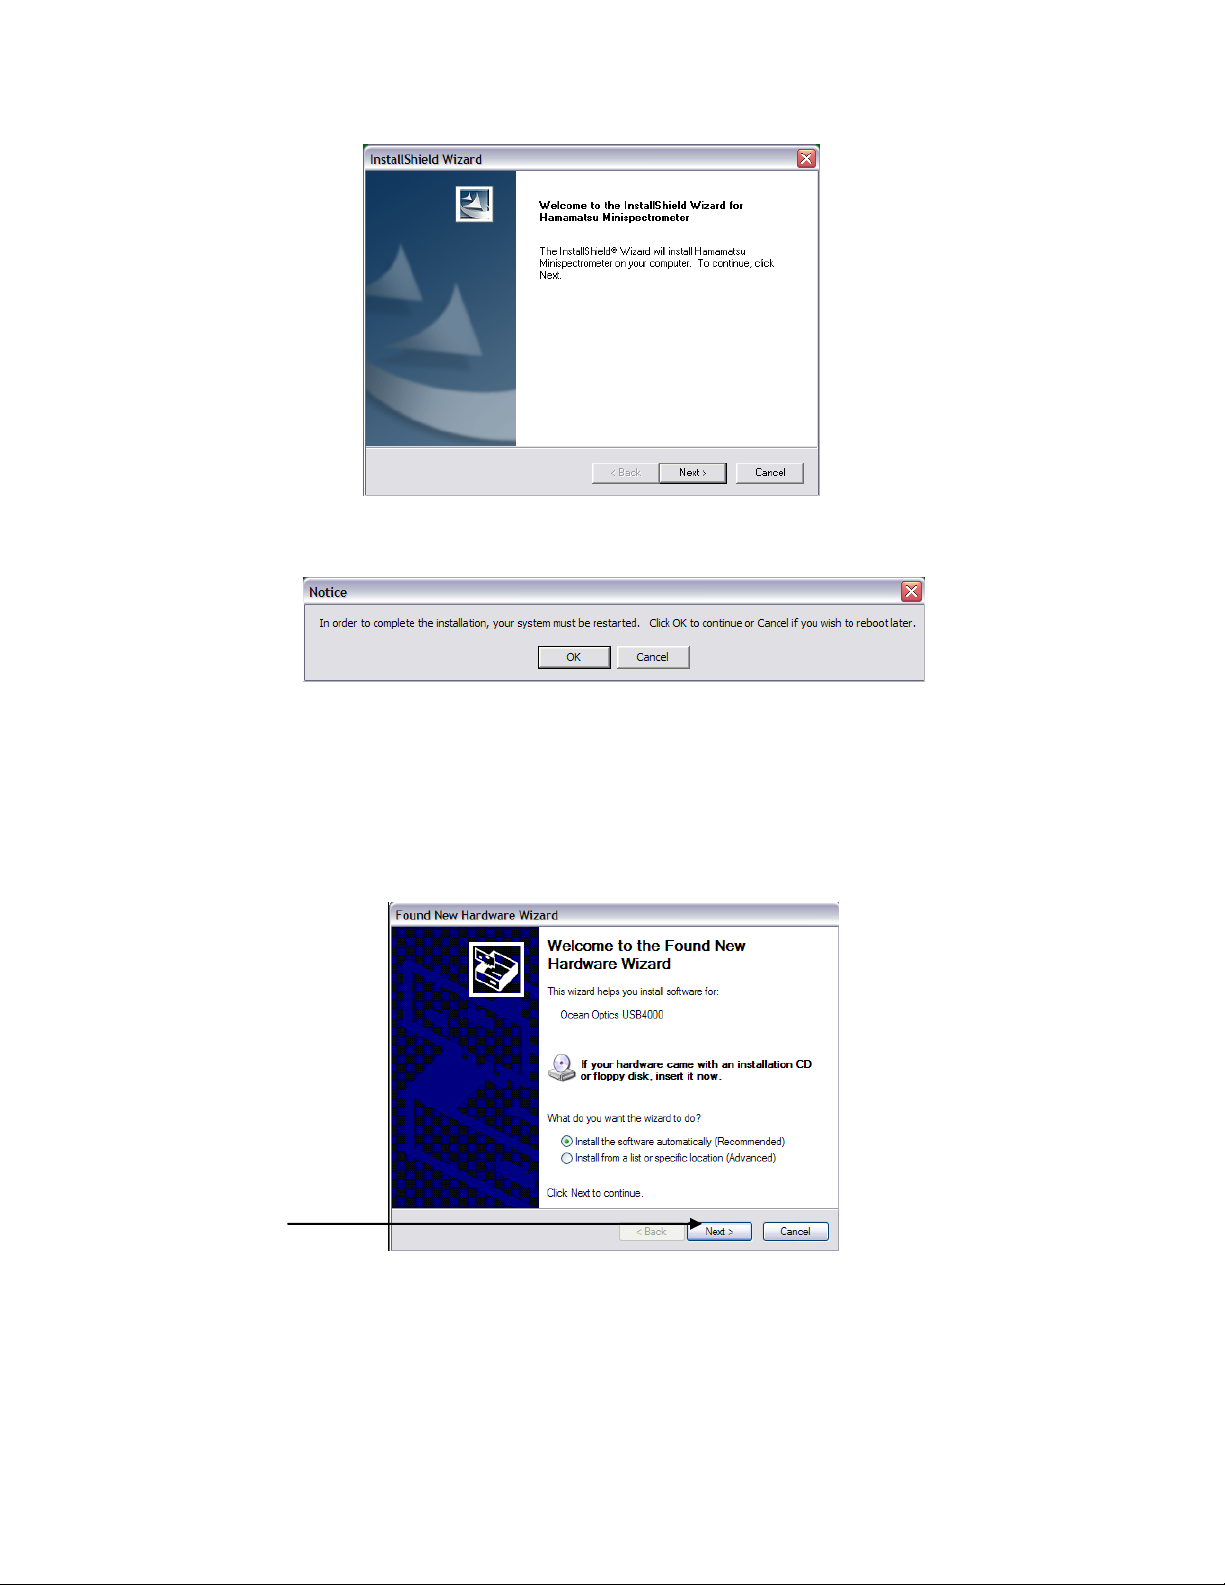
Figure 24
At this point it is
OK to restart the
computer
Select Install the
software automatically,
then click Next to
complete the hardware
installation.
Next the Hamamatsu
Minispectrometer
installation guide will
appear. Click next two
process through the
installer
Pub# OM17-NIR Shank
Figure 25
Once the restart is complete, plug in the USB cables for the auxiliary and spectrometer
cases
MS Windows may then bring up the following screens about the Ocean Optics
spectrometer and the Hamamatsu spectrometer.
Figure 26
2-8
Page 12
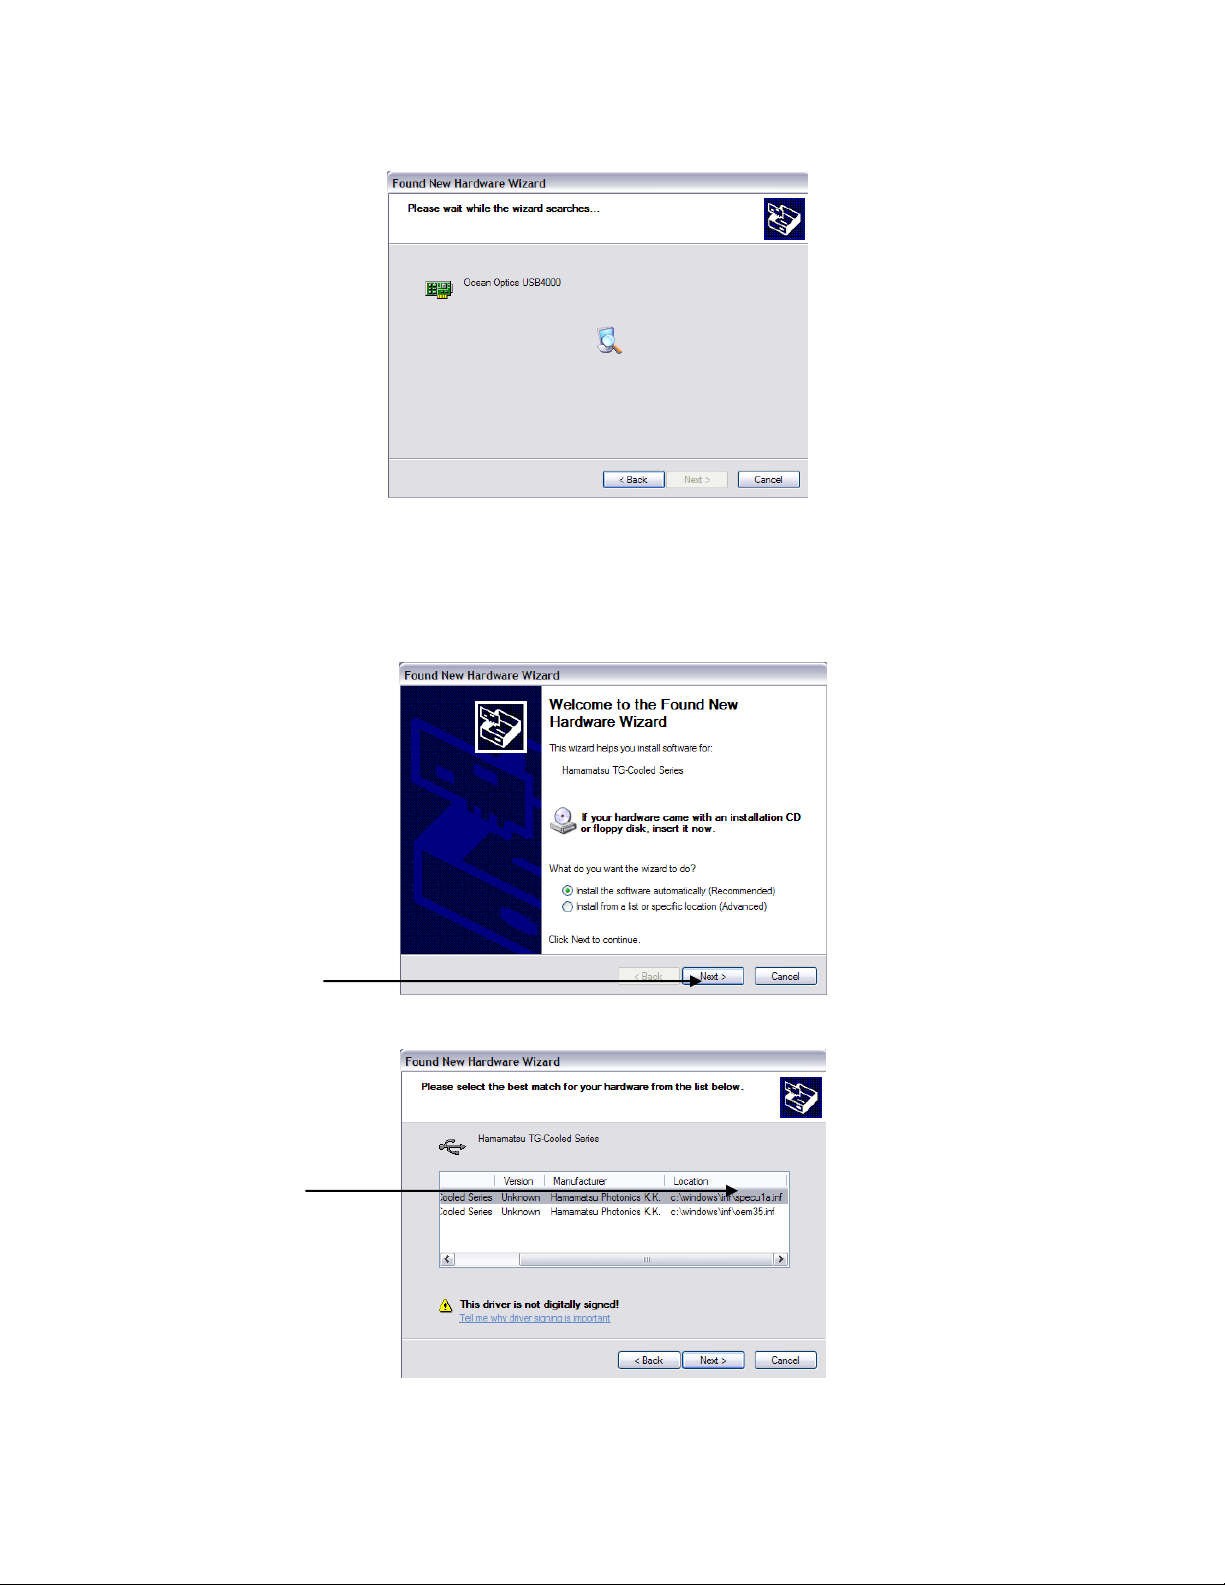
Pub# OM17-NIR Shank
Windows will
automatically find the
correct drivers for the
Ocean Optics USB4000.
For the Hamamatsu
installation select Install
the software
automatically then Next
to complete installation.
If this screen appears
asking for the driver
version to be installed
always use the
specu1a.inf, then
select Next.
Figure 27
After completing the Ocean Optics MS Windows installer, the Hamamatsu installer may
appear. Note: These installers may appear in any order.
Figure 28
Figure 29
2-9
Page 13
Pub# OM17-NIR Shank
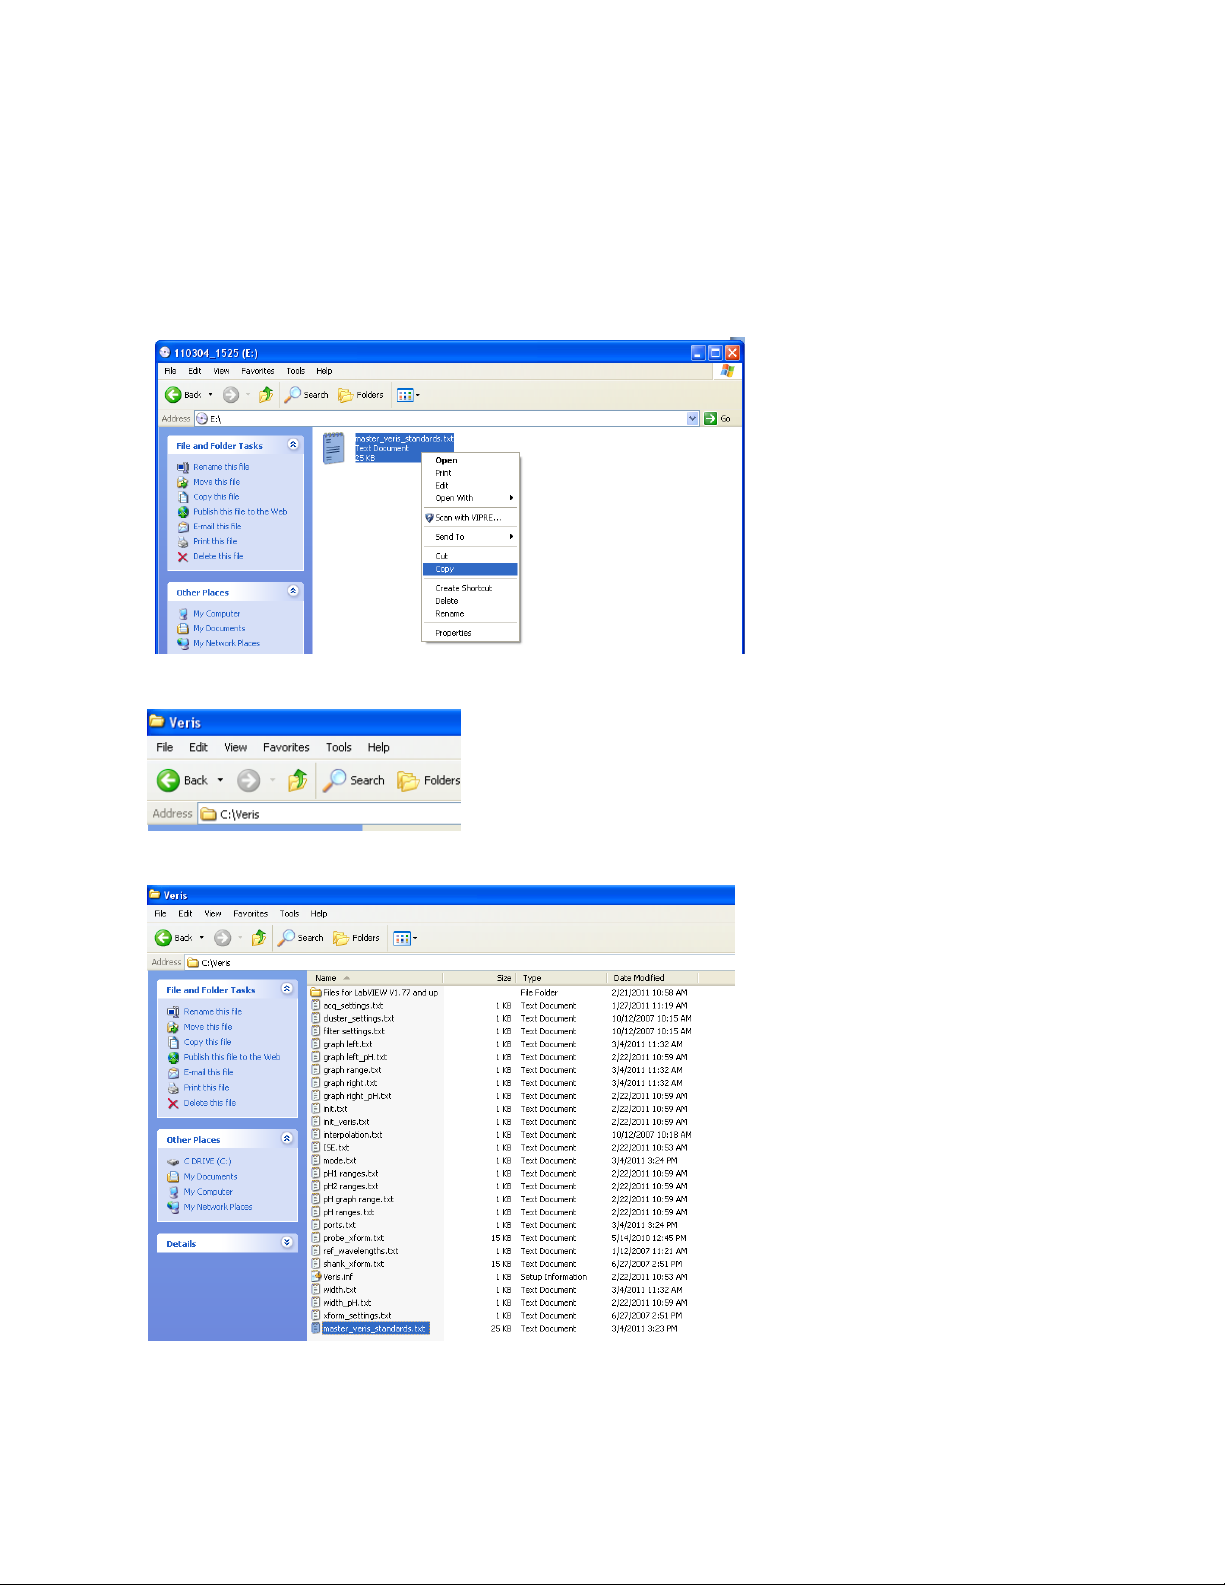
The master_veris_standards
file is specific to your external
references and is provided by
Veris.
Installation of Calibration Files
This must be complete for the software to be operational
Copy the master_veris_standards.txt file from the calibration CD into the C:\Veris
directory
Figure 30
Figure 31
Figure 32
2-10
Page 14
Pub# OM17-NIR Shank
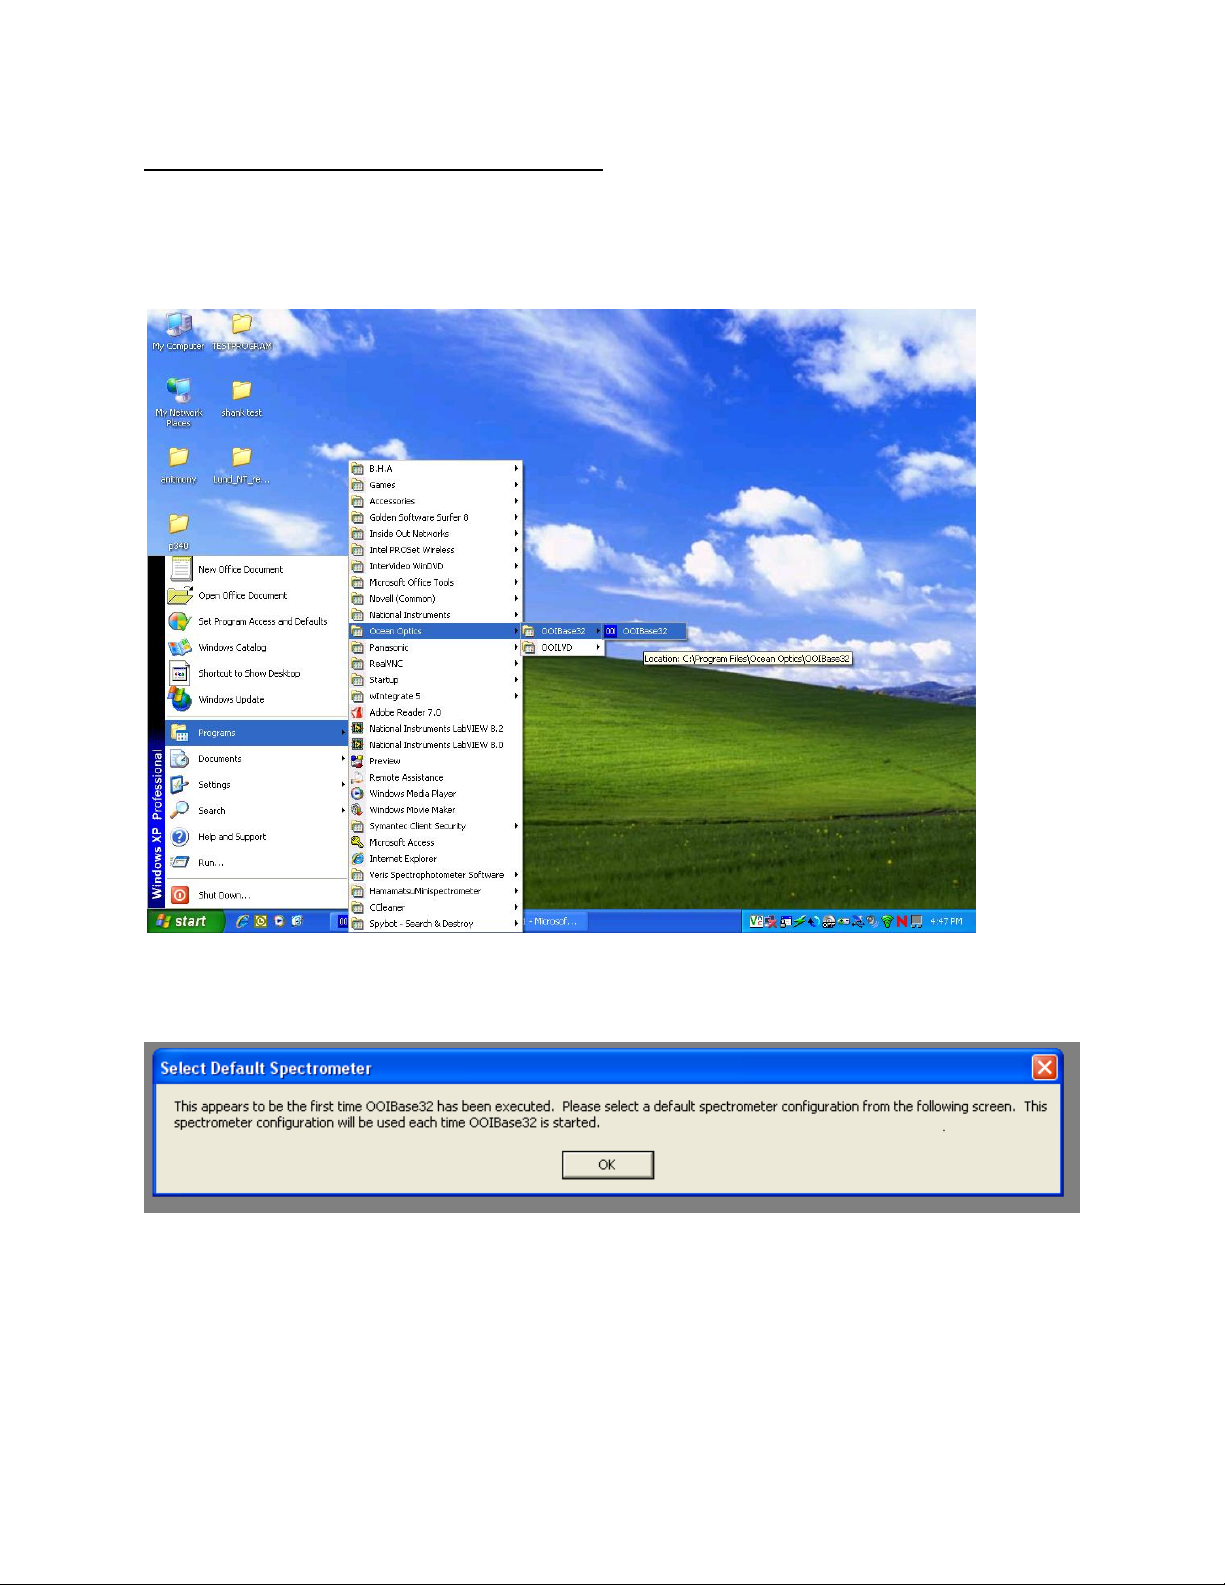
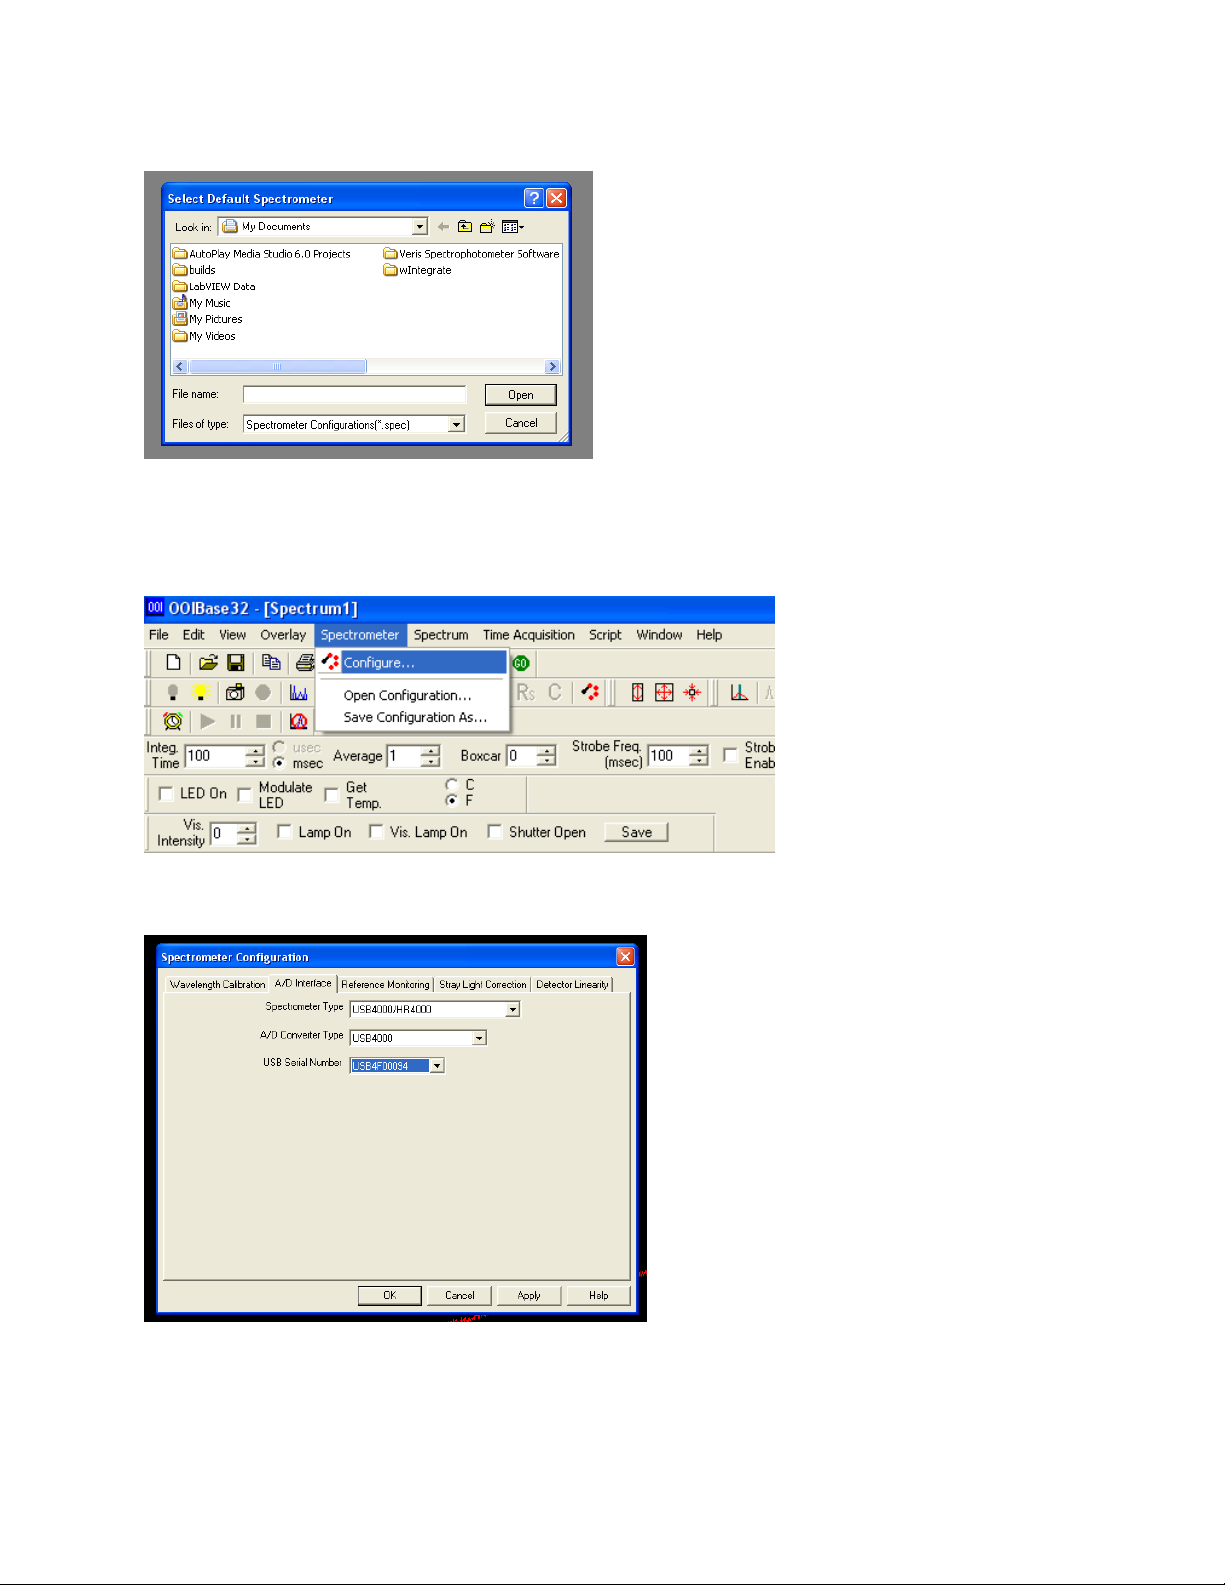
Configuring Ocean Optics Spectrometer
Step 1: Open OOIBase32 Software (only necessary for Veris Spectrophotometer
Software V1.76 and below)
Start Ocean Optics software (Start programs Ocean Optics OOIBase32)
a. If software asks for a default spectrometer file click cancel
Figure 33
If it asks for a spectrometer configuration click, OK
Figure 34
2-11
Page 15
Pub# OM17-NIR Shank
If software asks for a default spectrometer file click Cancel
Figure 35
Step 2: Open Configuration
Click on Spectrometer in the toolbar at the top and then select Configure
Figure 36
On the configuration screen select the A/D Interface tab
Figure 37
Note: Under Spectrometer Type if USB4000/HR4000 is not available select S4000
2-12
Page 16
Pub# OM17-NIR Shank
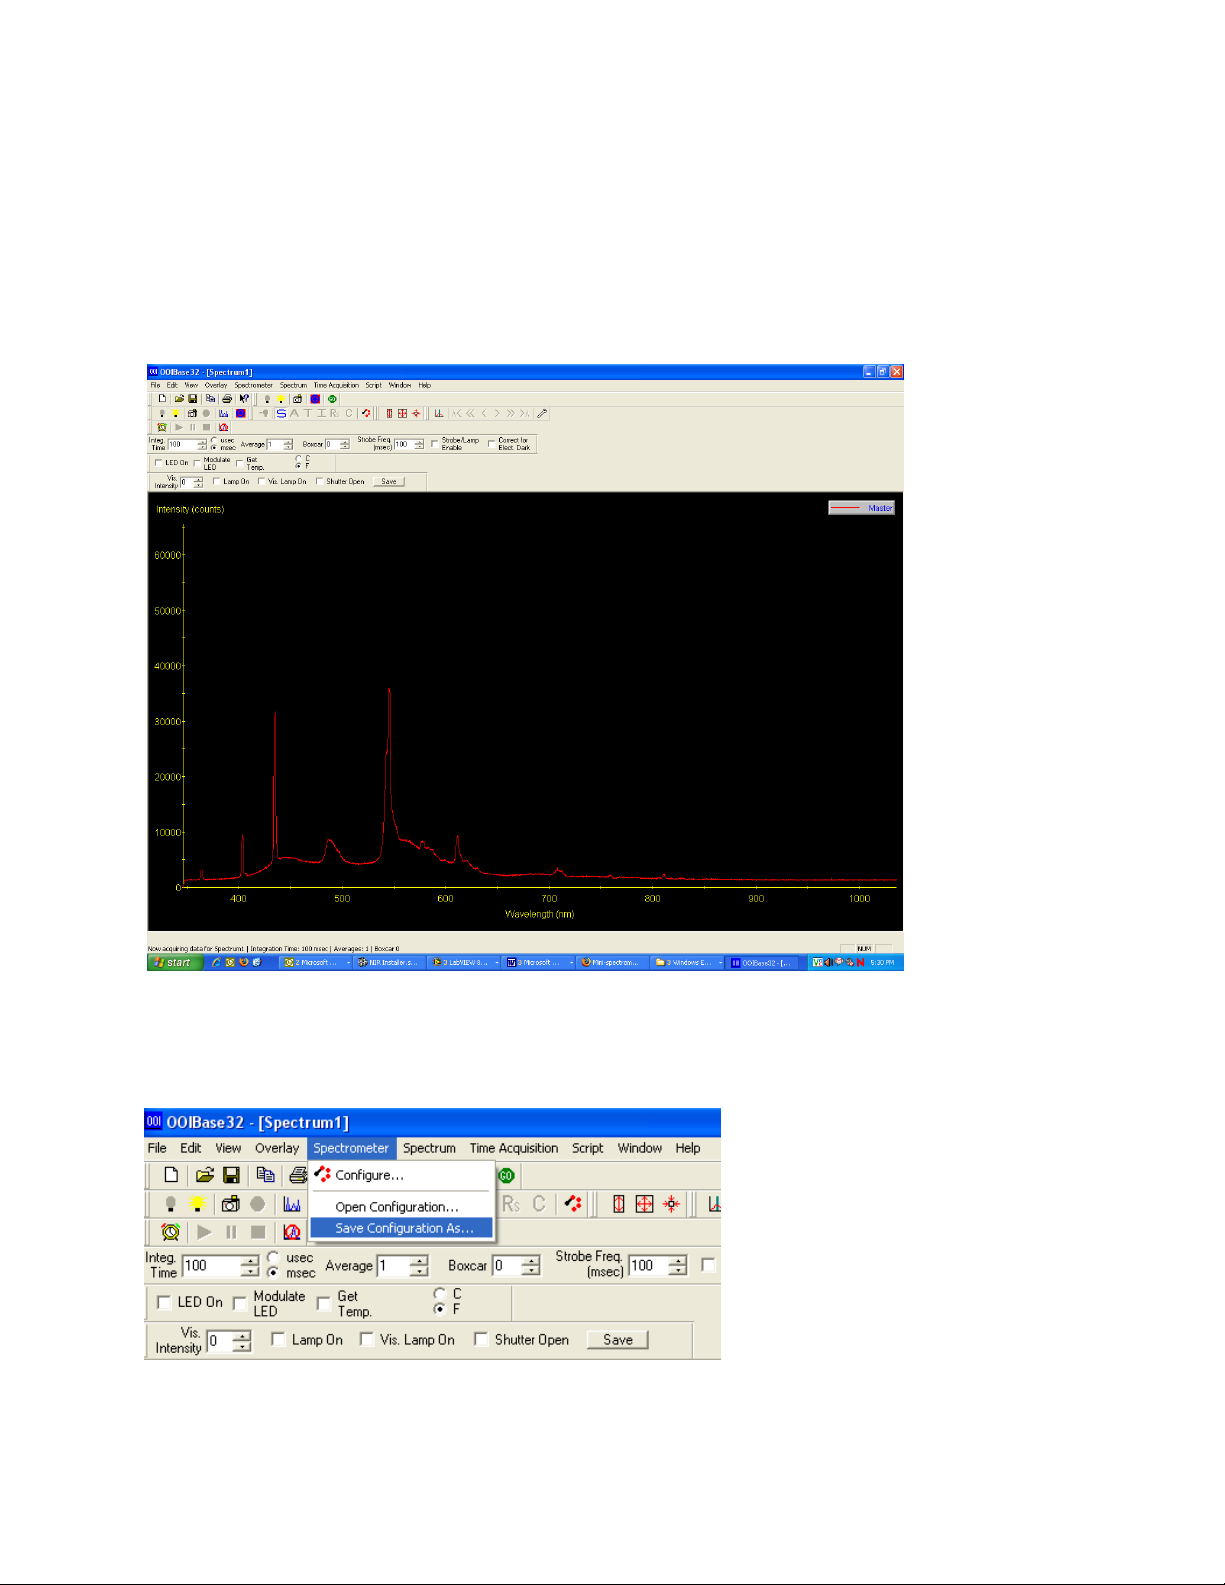
Under serial # only one spectrometer number should be present. If no serial number is
present close out of the software, unplug the USB cable and reinsert the USB cable,
wait to see if windows recognizes a new device, then proceed to the open the Ocean
Optics software and try again.
Click OK and a spectrum will be present on the screen.
Figure 38
Example of spectrum that should be shown on screen (when light is on at shank).
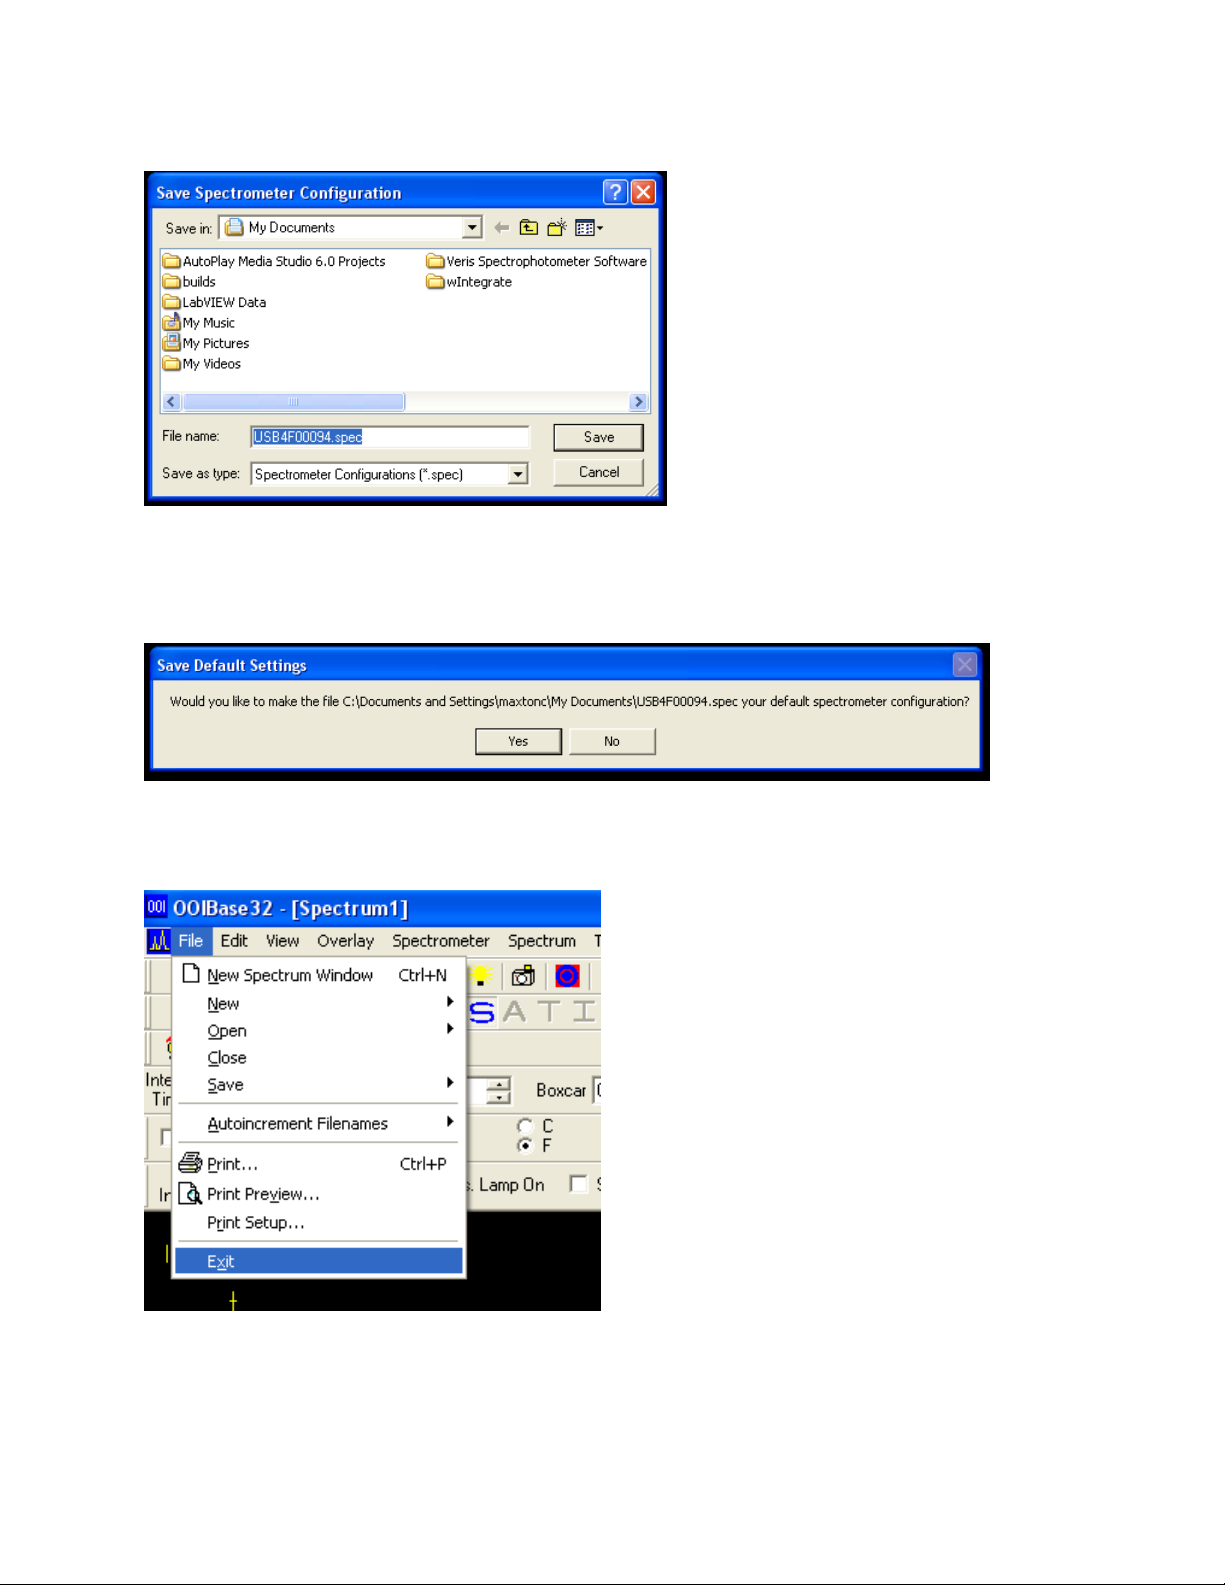
Step 3: Save Configuration
Figure 39
2-13
Page 17
Pub# OM17-NIR Shank
Click on Spectrometer then Save Configuration As.
Figure 40
The Save Spectrometer Configuration should automatically fill in the file name with the
serial number. Click Save.
Figure 41
Choose yes to make the spectrometer configuration the default settings.
The spectrometer has now been configured.
Figure 42
Exit the software.
2-14
Page 18
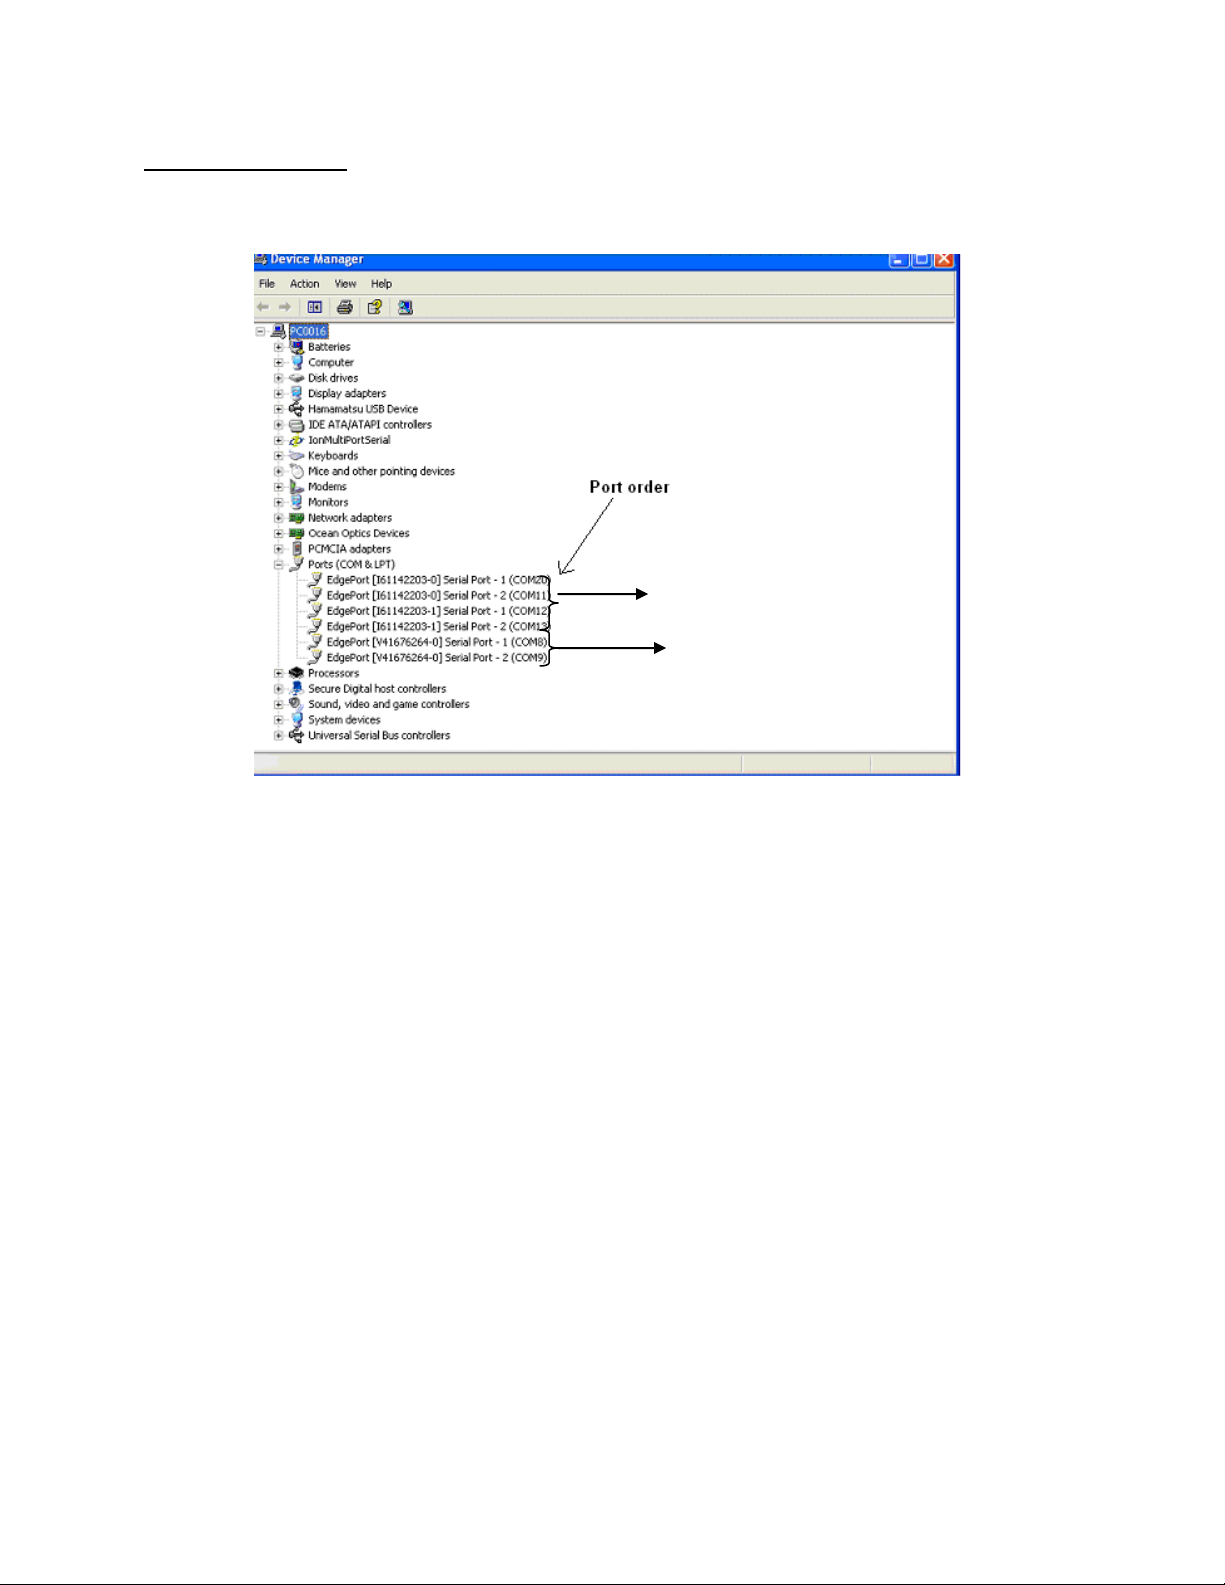
Setting port order
Auxiliary case ports
Spectrometer case ports
The software could increment the
number of the ports by one
depending on the computer. For
example, the device manager
shows ports 20,21,22,23,9 but the
software shows 21,22,23,24,10.
Just use the incremented numbers
if this situation occurs.
- Check Device Manager for port order (Start settings control panel
system hardware tab device manager double click ports)
- Ports will be listed in order, as they should be set in software.
Pub# OM17-NIR Shank
Figure 43
In this example the order to set the ports would be as follows: (see Figure 5.) Different
computers will have the ports in different orders; however if the software is used on one
computer only, the ports will never change. The ports will always be in the order of
spare, GPS, temp, control, and spectrometer. For future reference, make note of the
com port order your computer is using.
Spare: COM20
GPS: COM11
Temp: COM12
Control: COM13
Spectrometer: COM8
The last port (COM9) will not be used.
2-15
Page 19
Pub# OM17-NIR Shank
Example of ref spectra shown
in system check and acquisition
with correct integration time set.
Ocean Optics Integration time
Hamamatsu Integration time
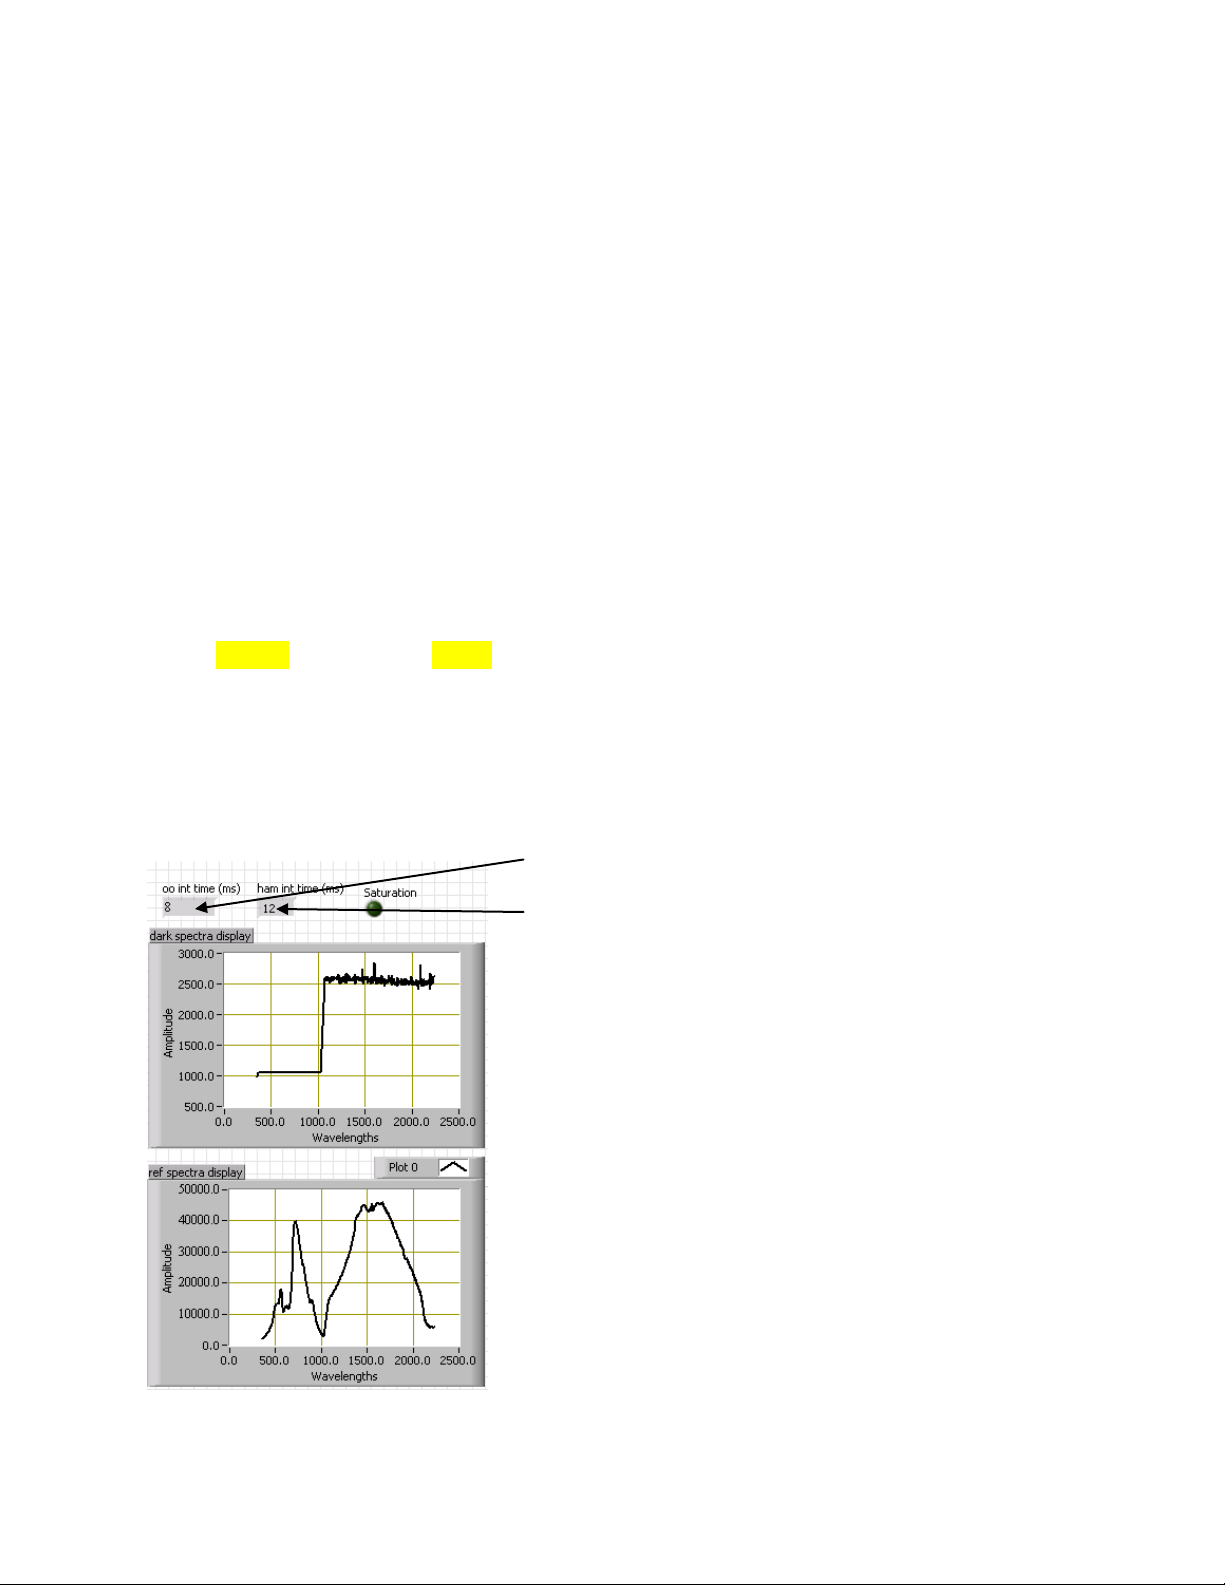
Setting Integration Time:
The integration time is the amount of time the spectrometers collect the spectral data for
averaging. It is important to have this set correctly because too much light will saturate
the spectrometer, while too little light won’t allow the full range of the detector to be
used. The integration time needs to be set before acquiring spectral data. This is
especially important for users switching between probe and shank modules as
the optics are different and the amount of light seen by each device varies.
Step 1: Open the Veris Spectrophotometer Software and start the system check. After
the first Dark and Reference measurements are stored check the ref spectra display
(example shown below). The two peaks shown should be around 40000.00 counts.
The first peak is controlled by the Ocean Optics (oo) int time, while the second peak is
controlled by the Hamamatsu (ham) int time. If peaks are too high, then lower the
integration time. If peaks are too low then raise the integration time.
Step 2: Once it has been determined which way to move the integration time, exit the
software and open the acq_settings.txt file located in the C:\Veris directory.
0.010 12.000 5.000 8.000 0.150 0.150 0.300 0.150 2.000
Example of data stored in acq_settings.txt
The second value represents the ham integration time, while the third value represents
the oo integration time. Raise or lower these values then save the file, open the Veris
Spectrophotometer Software, run a dark and reference measurement, and then check
these values again to see how the peaks changed.
2-16
Page 20
Pub# OM17-NIR Shank
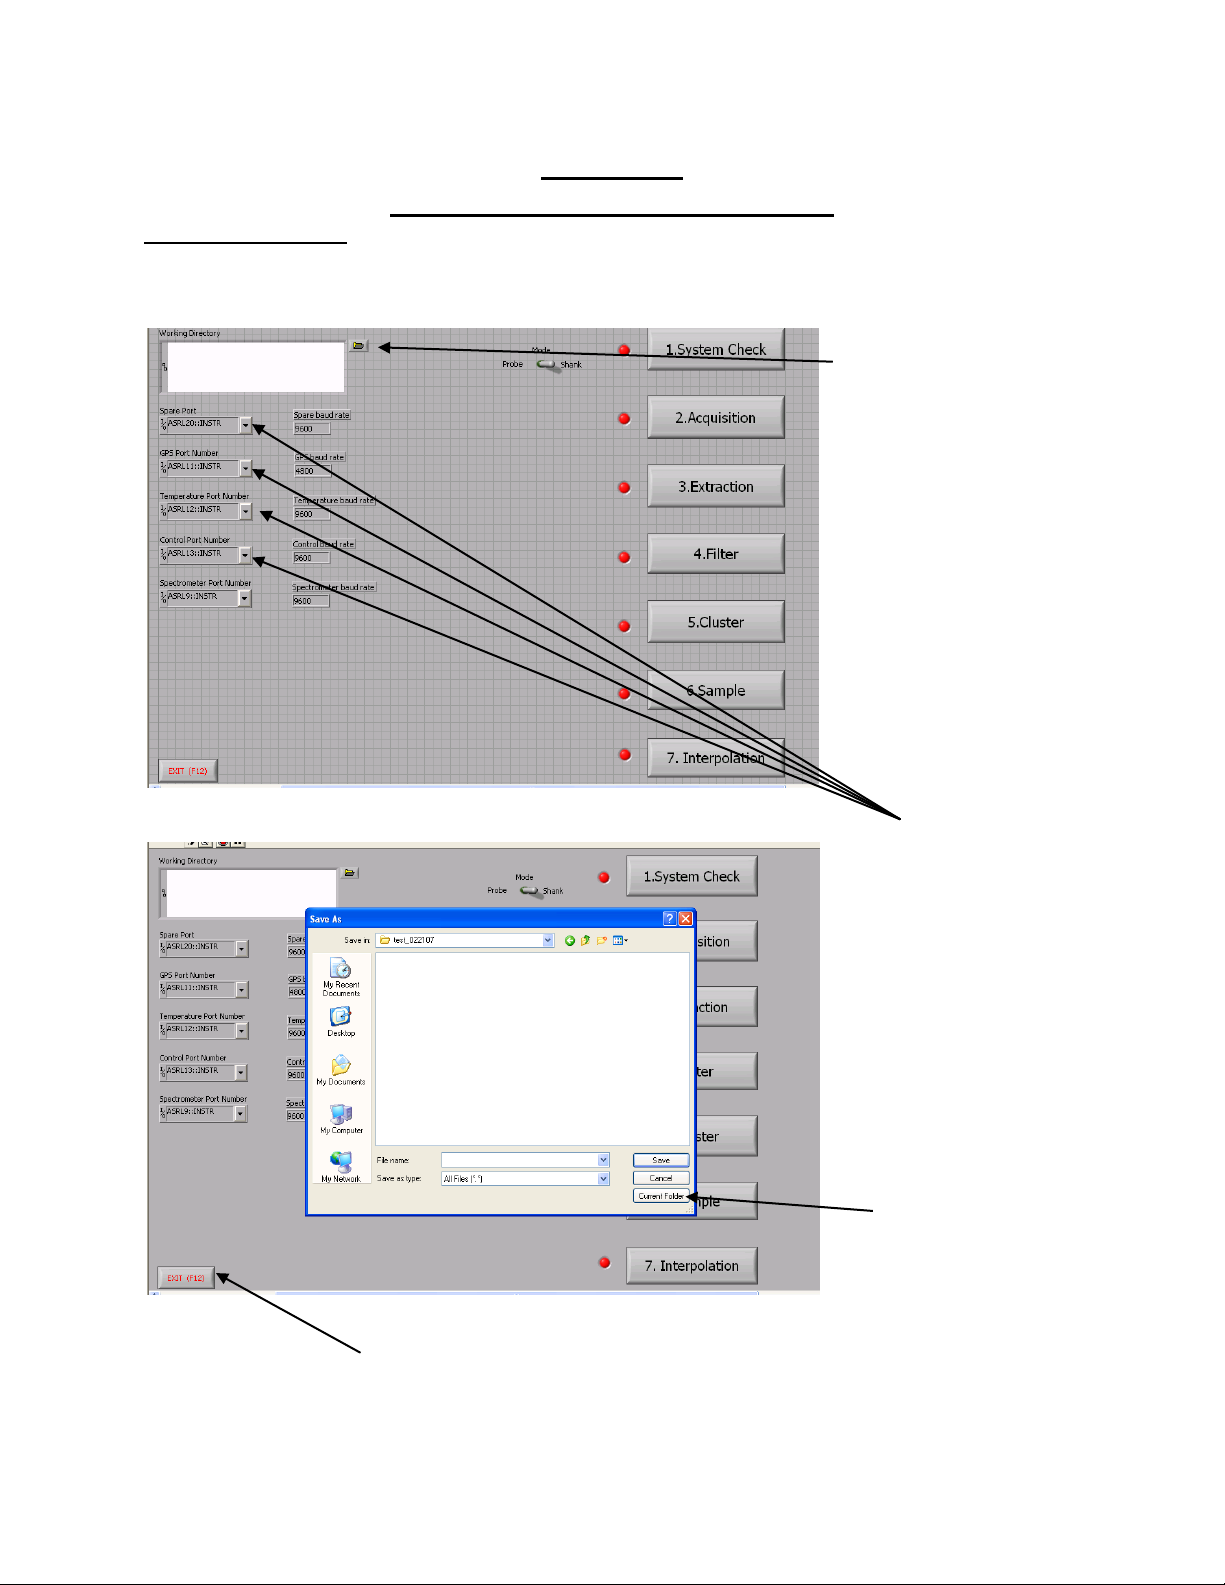
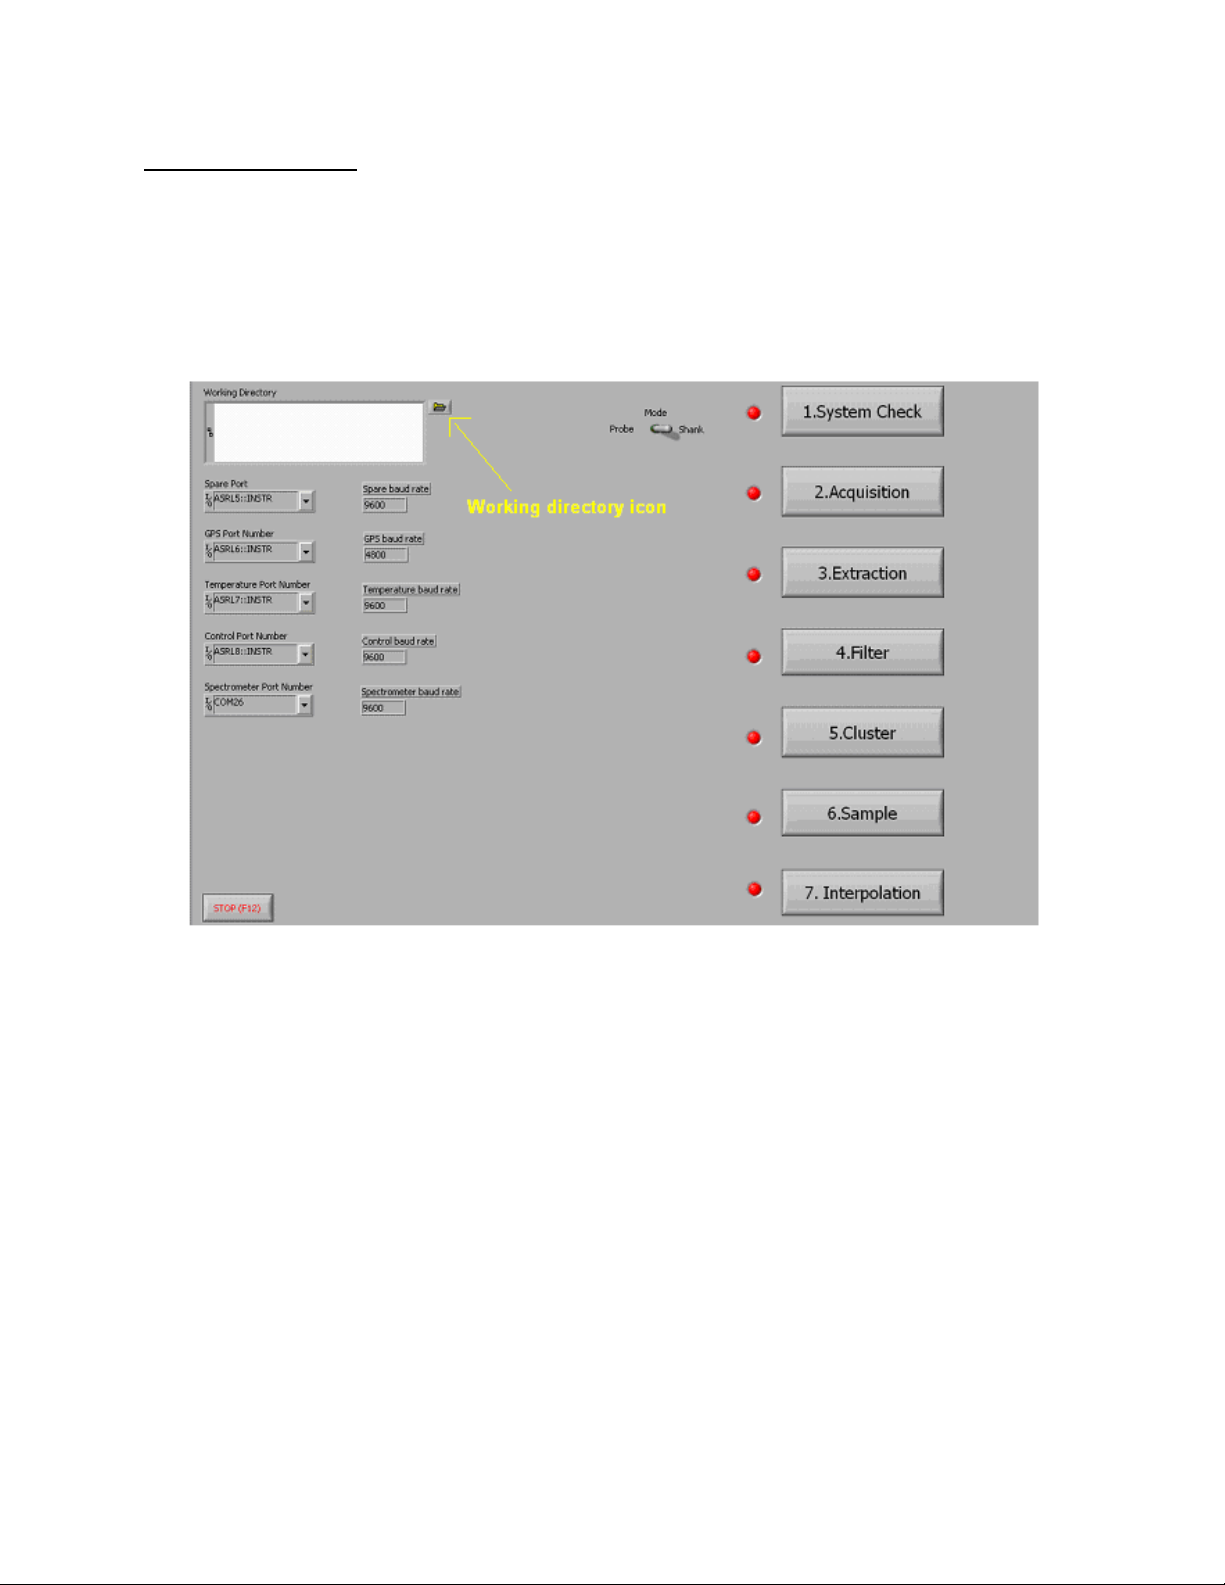
Folder icon to select working
directory.
A field folder must be selected
before any steps can be
completed. Note: Each field or
site must have its own folder.
Once the desired
directory is found,
click on current folder.
BEFORE STARTING:
1. Before taking any
data let system run
for 20 minutes to
allow the
spectrometers to
stabilize.
2. Connect
spectrometers to
PC.
3. Open Veris software
4. The port order must
be set (see Setting
Port Order). This
needs to be done
the first time the
software is run on a
machine, after that
the port order will be
stored for future use.
Port terminology
may be labeled
COM or ASRL.
Both are acceptable
if port number is
correct.
Press EXIT or F12 when ready to quit the software; this will
ensure the port order will be saved.
Section 3
Field Operations: Electronics
Operating software – Software that will guide the user through the field usage steps.
This will need to be completed every time the software is started. Open Veris operating
software:
Figure 1
Figure 2
3-1
Page 21
Pub# OM17-NIR Shank
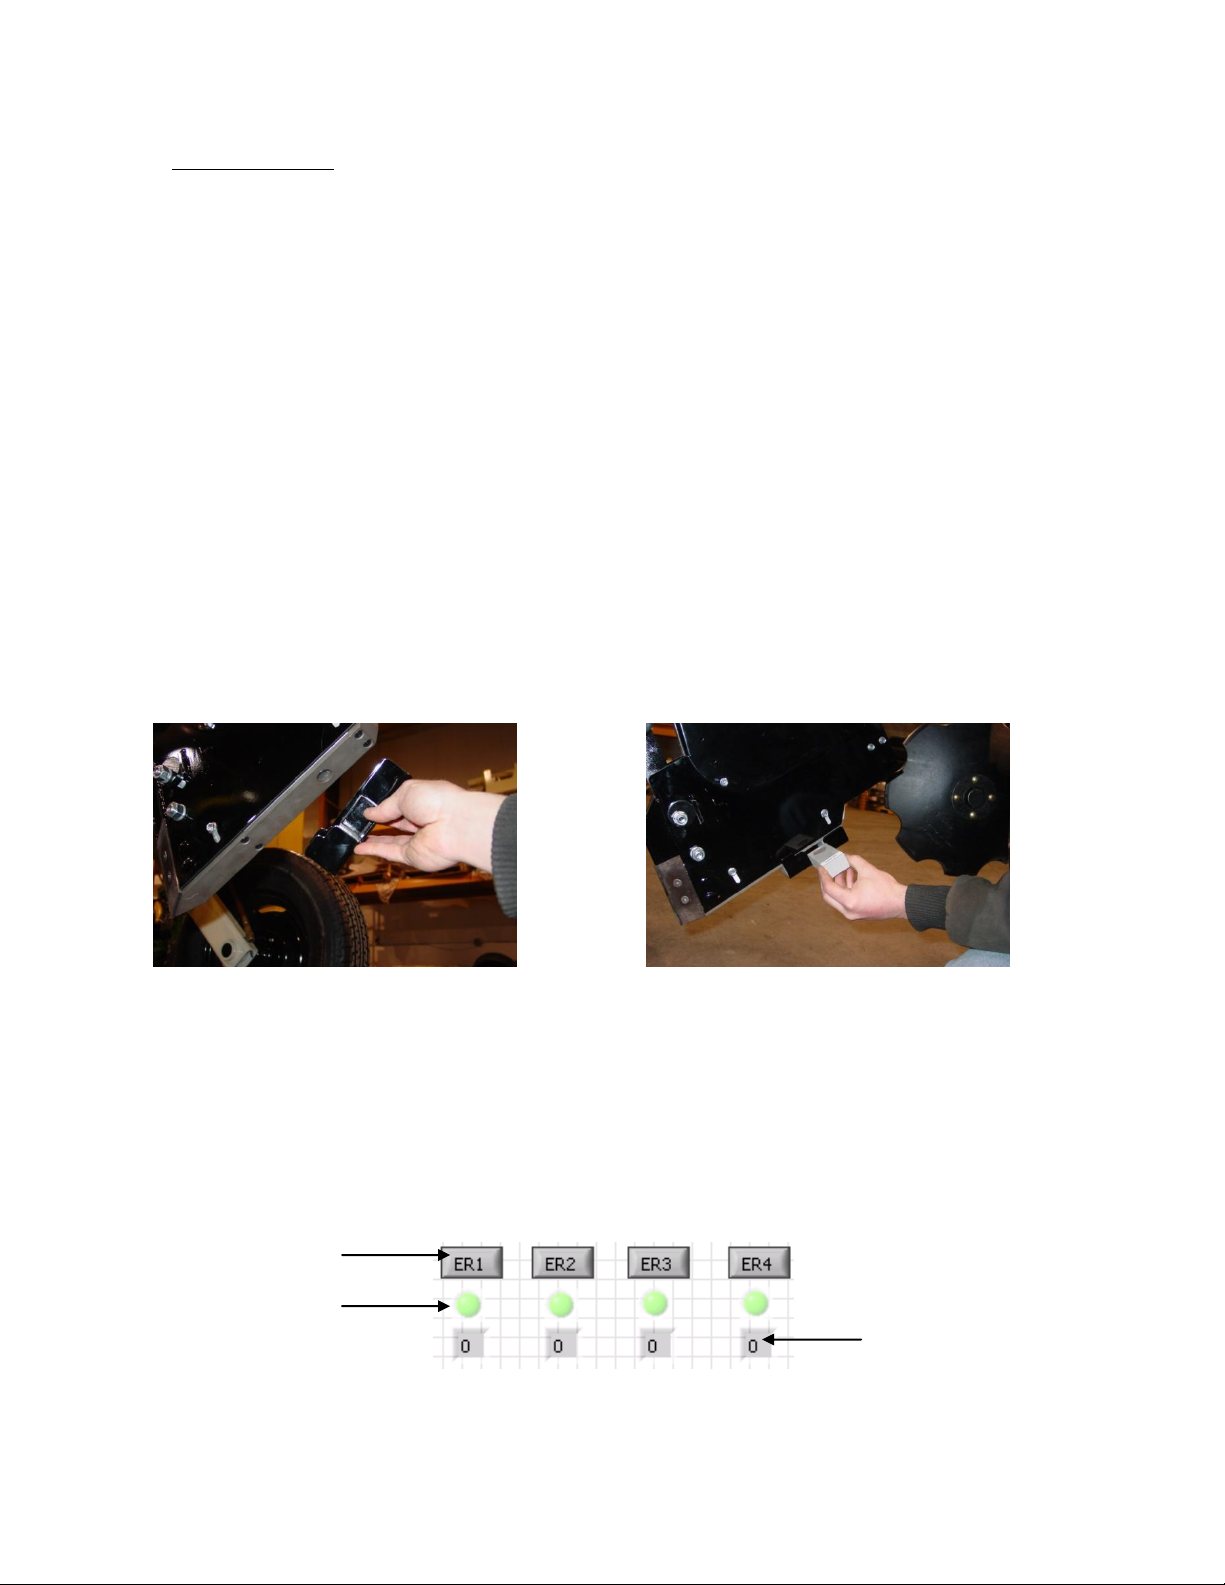
Indicator light will be
yellow or green
Number of times each
ER has been sampled
1) System Check – This step calibrates the spectra data to known standards to ensure
data integrity. This is accomplished by A) manually placing four external reference
standards against the window and collecting spectra measurements for each standard,
then B) transforming the data to a master set of data provided by Veris.
A) After the Dark and Reference cycle has completed and the ref check light has turned
green, the system is ready for the external references. Before running the external
references make sure the window on the shank and the window on the references are
clean. References can be checked in any order and as many times as necessary.
When program state reads REST, the ref check light is green, and controller is in
neutral (N), place the correct external reference under shank and then press the
corresponding external reference button. If the External Reference (ER) failure light is
yellow, check to make sure the correct external reference was placed under the shank
and that the correct external reference button was pressed, then run the external
reference again. When ER light turns green or yellow, proceed to next reference. Once
each external reference has been run at least once, press end or F12. This will exit this
program and initiate the create transform program, which will take the data just acquired
and compare it to the master data to create a current transform. If the transform is
created successfully, then that transform will be applied to all spectra data acquired
during the acquisition.
Placing the reference holder beneath shank ER held securely beneath shank
Figures 3 & 4
Place the ER securely onto the shank wearplate. The dowel pins on the ER fit into four
allen-head screws on the wearplate. This aligns the ER in the correct position, and
magnets hold the ER firmly in place. The reference material goes towards the front of
the shank and lines up directly underneath the sapphire window on the wearplate. The
allen-head screws can get packed with soil after the system has had soil contact. A flathead screwdriver can be used to remove the soil so the ER can be put in place.
Figure 5
3-2
Page 22
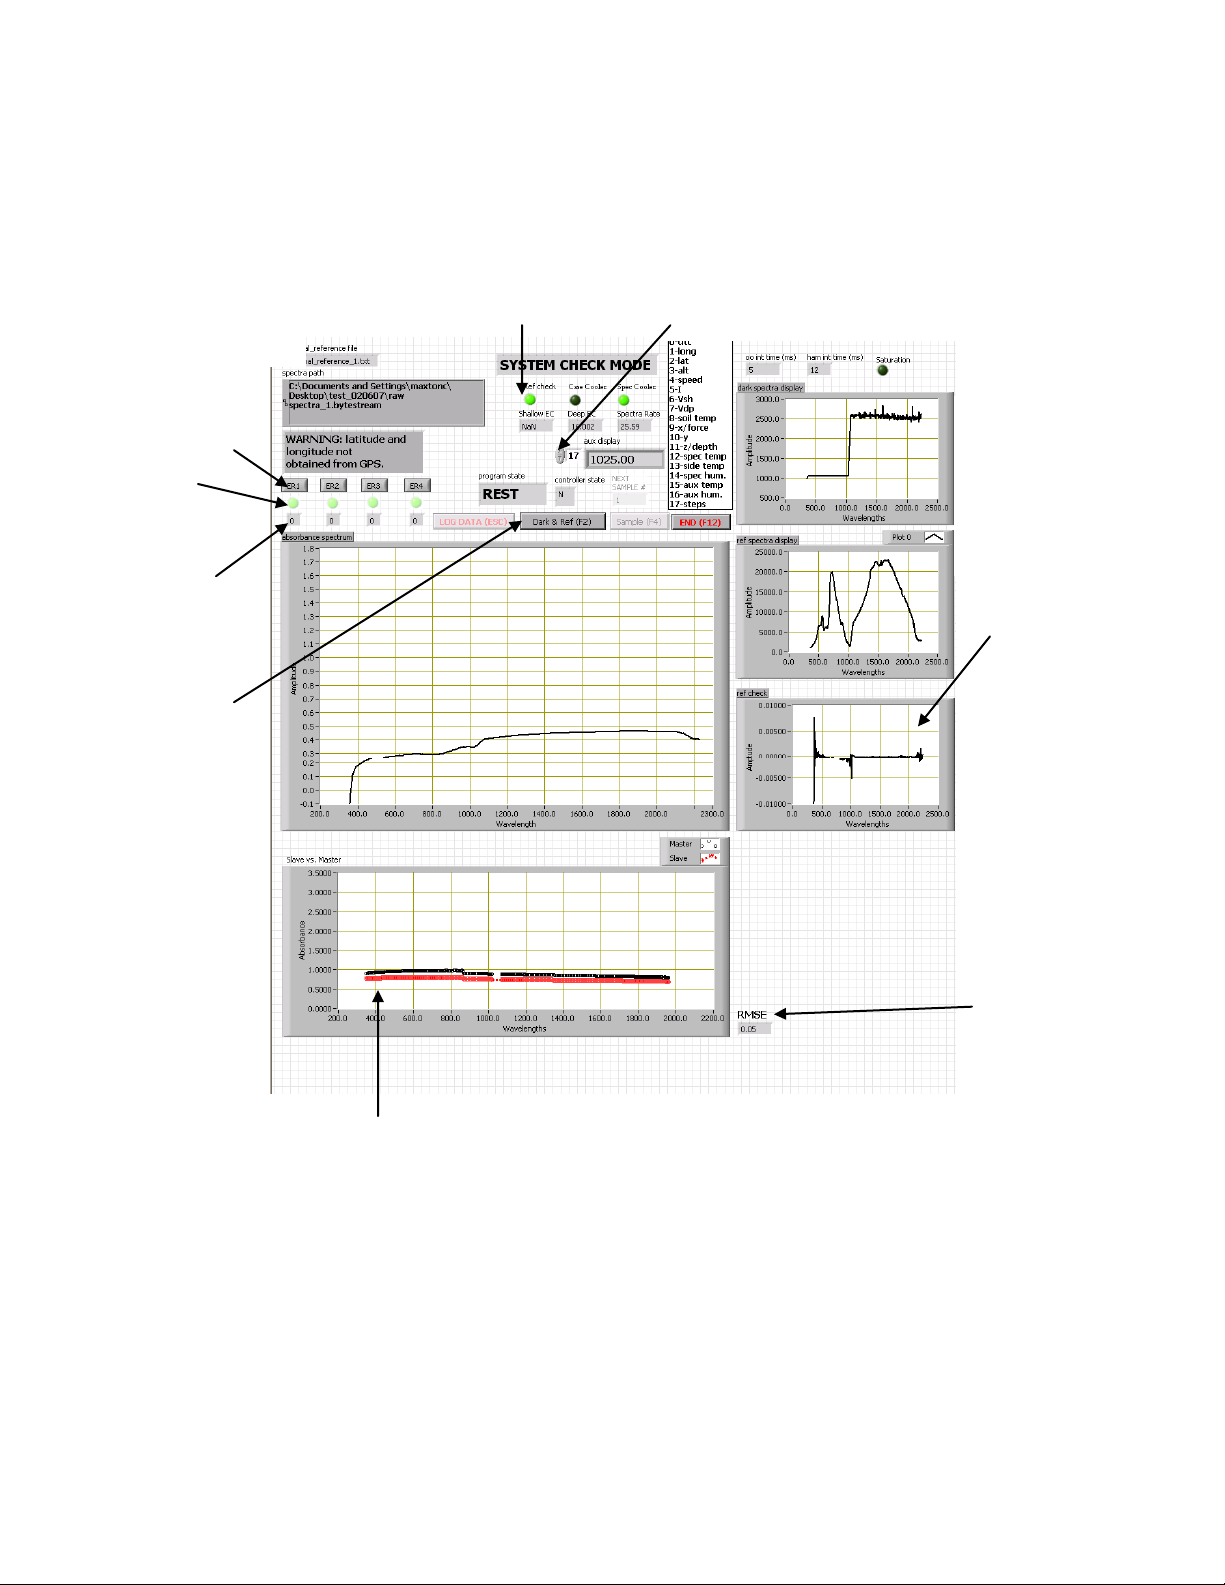
Pub# OM17-NIR Shank
External
Reference buttons
Failure light
Number of times
each reference
has been ran,
since system
check was
opened.
Manually stores
dark/reference
data. This should
be done if there is
a failed reference
check. This could
be caused by the
shank steps not
being within
specification, or
one of the
spectrometers is
not running. Try to
clear out the
reference by
pressing F2. If
problem persists
shut down system
and restart.
Auxiliary data can be scrolled through by the up and
down arrows on the left of the indicator. Data
corresponds to chart listed on the right of indicator.
Note: a reading of –1.50 indicates failure of that
component or communication problem. See
Glossary for Auxiliary data information table.
Ref check graph:
This should be close to
a straight line except
for the edges and the
center. The reference
check light will indicate
if this is an acceptable
reference check.
Root mean squared
error of current
external reference.
By default the RMSE
should be within .10
for references 1,2,& 4
and within .15 for
reference 3.
Reference check light is
green for good references
and red for a failed
reference. If a reference
fails, press F2 to store a
new dark and reference.
Ref check light
Graph that compares current
external reference to master
reference. These should
correlate to one another if
system check has been
completed before.
A yellow ER light
indicates possible
problem. Regard as a
good reference unless
transform step fails.
Shank steps should
be 5.2 cm within +.03 cm. If steps are
not within this range
then press F2 to
store another
dark/ref.
Figure 6
3-3
Page 23
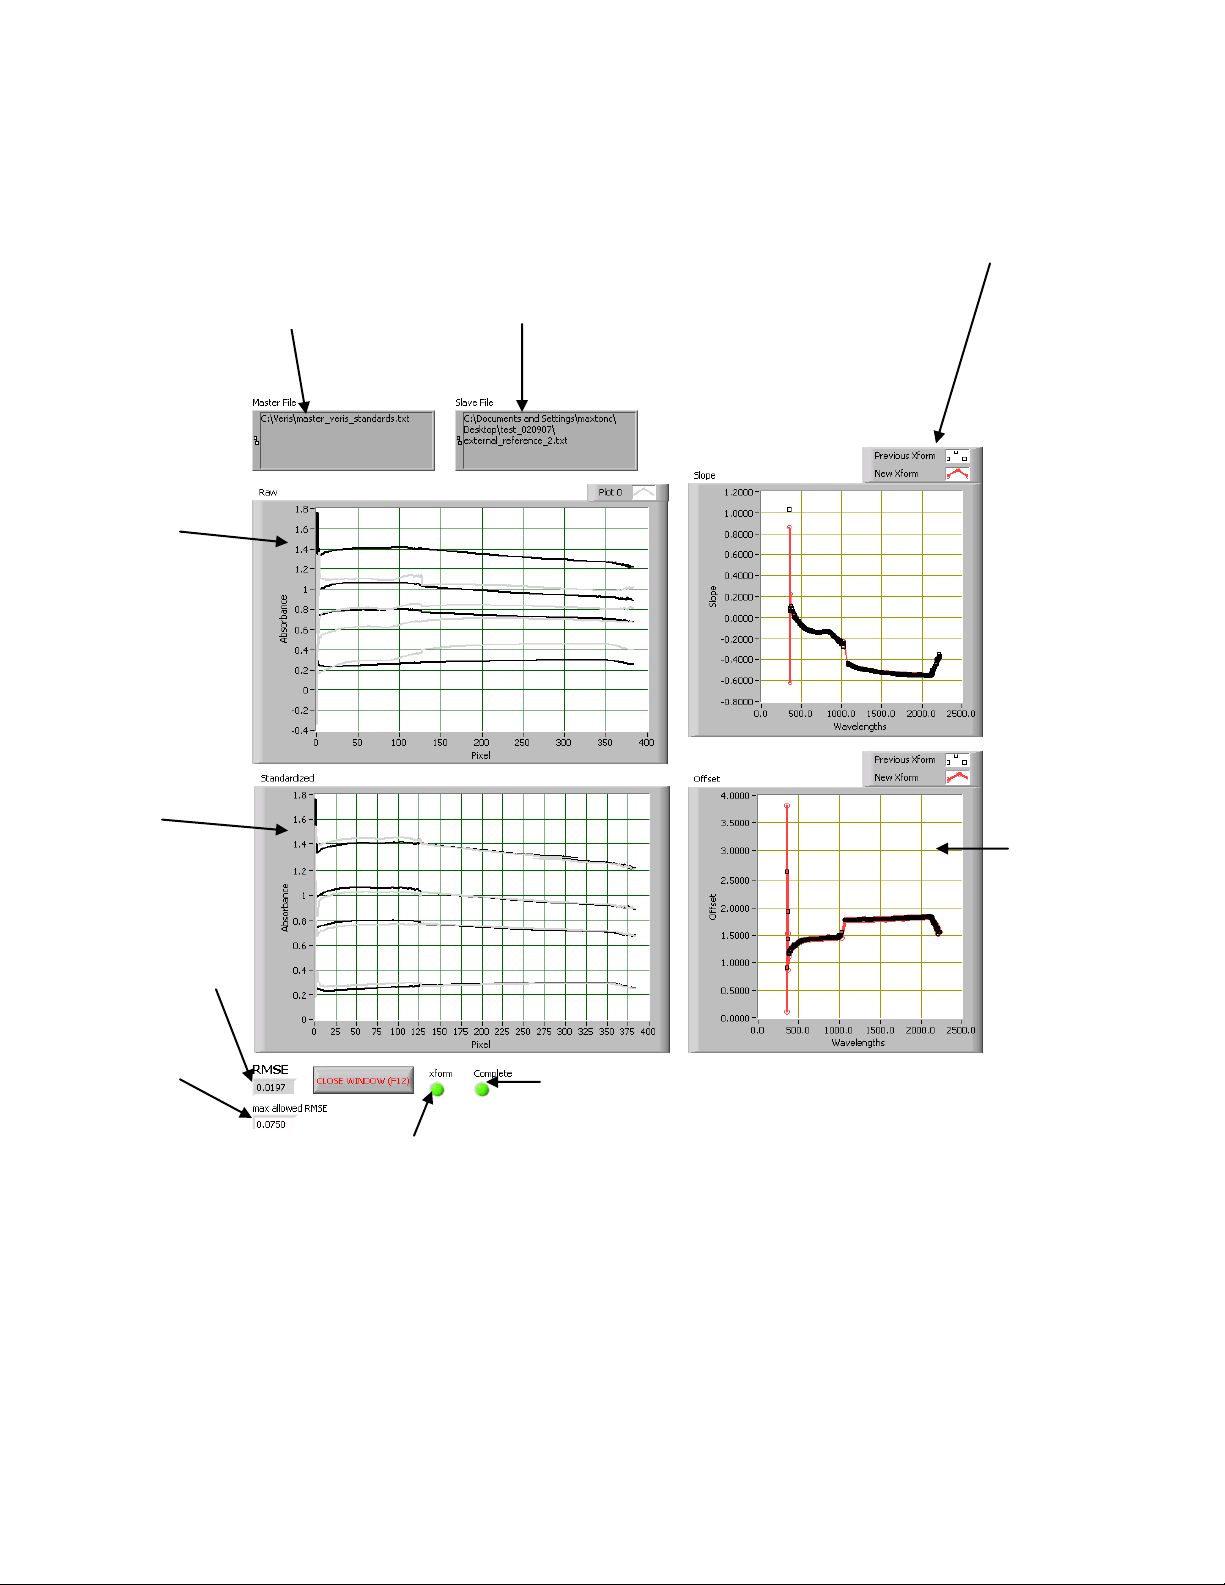
B) Transform step.
Raw master and
slave data
(external
reference). The
master is black
and the slave is
grey.
Master and slave
data with
transform applied
master is black
and slave is grey.
Root mean
squared error for
current transform.
Maximum allowed
RMSE for a good
transform.
Compares the
offset of the
previous transform
the current
transform
Indicates when transform is
complete. READY TO
MOVE TO NEXT STEP—
DATA ACQUISITION.
This compares the slope
of the previous transform
to the current transform
Previous transform will
be a straight line the first
time system is ran.
External
reference data
that was just
taken.
Master data file, which
will be used to transform
slave (master file
provided by Veris)
Indicates if transform is acceptable.
Figure 7
Master data file is provided by Veris.
Pub# OM17-NIR Shank
Once the transform is complete press close window or F12. If the transform was
successful, the software will inform the user and continue on to acquisition. If the
transform failed, the program will enter the system check again so the references can
be ran once more. If the transform fails again, either there is a system problem
(spectrometer malfunction, window is dirty, or references not taken properly) or the
tolerance for the maximum allowed RMSE could be set too low; see program
modifications to change this.
3-4
Page 24

Pub# OM17-NIR Shank
Before mapping complete the following:
Start system at least 20 minutes before starting to map to ensure the spectrometers
have stabilized
Make sure auxiliary sensor data is coming in (see Glossary for auxiliary sensor data
definition).
Make sure all auxiliary lights are green.
Complete all steps above. Make sure Reference Check (Ref Check) light is green, and
GPS data are being received.
Set depth so that EC coulters penetrate approximately 1.5"
Make sure the implement frame is level with the ground surface
Pull forward with shank in ground. The absorbance should not rise more than 0.1.
2) Data Acquisition--electronics – The collection of spectral and auxiliary data in the
field. Data is streamed to a file in a compact format.
Pressing LOG button or ESC key stores spectrum data as absorbance and auxiliary
data, which includes EC data, until LOG button or ESC key has been pressed again. No
data can be logged if there is no GPS signal or there is a bad ref check. No data,
including EC data, will be stored unless it program is in LOG mode. Whenever shank is
raised out of the soil, press LOG button or ESC key to stop logging, re-press LOG
button or ESC key to re-start logging when shank is in soil.
System will automatically collect a dark and reference every 10 minutes—the next time
the LOG button or ESC key is pressed after a 10-minute period. Before re-starting at
the end of each round, check to make sure system isn’t collecting a dark and reference.
If an extra dark and reference is desired, pressing F2 or Dark & Ref stores a new
reference and dark spectrum. Pressing F4 or sample will store a reference, dark, then
transformed spectrum data as absorbance into the acquisition_samples file located in
the field directory.
When all data have been acquired press F12 or End to return to the main interface.
Soil EC is recorded simultaneously with NIR data, provided the unit is equipped with soil
EC coulter module, and cables are connected properly. When EC is being collected, EC
values will appear in the shallow and deep EC windows, as shown in Figure 10. Note:
unit must be in Log mode for EC to be recorded. Also, see Maintenance section for
information on testing EC system output.
3-5
Page 25
Ref check light This
green light indicates a
good reference
These indicate the temperatures and the
humidity of the system. If they are not
within range (see specifications) the
indicator light will be red, if this occurs
the system should be shut down.
Dark spectrum
that was stored
when program
state was in dark
mode
Reference
spectrum that
was stored when
program state
was in reference
mode.
Ref check
compares the
previous
reference data
to current
reference.
As in system check, this should be close to a straight line
except for the edges and the center. A bad reference is
indicated by the ref check light at the top of the screen. If this
situation occurs, press F2 to store a new dark and reference.
Pressing LOG
or ESC stores
spectrum data
as absorbance
and auxiliary
data, which
includes EC
data, until
LOG or ESC
has been hit
again. No data
can be logged
if there is no
GPS signal or
there is a bad
ref check. Use
LOG to store
data while
mapping a
field. No data,
including EC
data, will be
stored unless
it program is in
LOG mode.
Auxiliary data indicator
Auxiliary data can
be scrolled
through by
pressing the up or
down arrow to the
left of the indicator.
The auxiliary data
corresponds to the
chart listed on the
right of the
indicator.
Figure 8
EC indicators
Log and GPS
lights—must be
green for data to
be recorded
Pub# OM17-NIR Shank
As long as the acquisition software is closed properly using F12, all data is saved and
the acquisition can be opened at a later time with new data being appended to the data
taken previously.
3-6
Page 26
Pub# OM17-NIR Shank
Transform which
will be applied to
field files created
in the acquisition
(bytestream
files).
Spectrum
acquired using
LOG mode
during
acquisition.
Reference check
spectrum
acquired during
acquisition.
Number of
references and dark
spectra taken during
acquisition.
All reference
spectrum taken
during acquisition.
All dark spectrum
taken during
acquisition.
Output file that contains
transformed field absorbance
spectrum taken during LOG
mode of acquisition.
Figure 9
How to know you’re collecting high quality NIR measurements:
a) Log light and GPS lights are both green
b) Ref check light is green
c) Spectrum absorbance doesn’t jump as unit is pulled ahead
d) Absorbance spectrum shows a typical soil spectra pattern (Figure
52), and is changing slightly as the data is collected.
e) External references can be attached to shank at any time in Data
Acquisition mode. Absorbance should be highest for ER3 and
lowest for ER4.
f) Wear plate window is not broken, or cracked. This is caused by
excess wear, or rocky fields. Be sure to check window during
these situations and replace shank wear plate if necessary.
3) Data Extraction – The spectra and auxiliary data are read out of the compact format
(bytestream) file and averaged, then the output is stored in an ASCII format. EC data is
extracted into file named ec.txt.
The extraction program will extract all the bytestream files and apply the appropriate
transform, then output the data into a single text file. After each bytestream file has
been extracted, the message “EOF” will appear. Press enter to continue on to the next
file. Once all the data has been processed, indicated by a green complete light, click on
close window or F12 to return to main interface.
3-7
Page 27
Pub# OM17-NIR Shank
Score plots of
spectrum data that
indicate grouping of
spectra.
Number of outlying
spectra removed
during filtering.
Total number of
spectra.
Wavelengths used by
the spectrometers.
There are 384 total
wavelengths.
Graphs of each
principal component;
this is an ASCII text
file and may be
imported into other
mapping software.
The interpolated PC
data are in the field
folder, and are named
interp_PC scores.txt
Loadings of each
principal component.
Once all the data
has been filtered and
the complete light is
green press close
window or F12 to
return to main
interface.
4) Filtering -The spectra are compressed using principal components compression, and
outliers are removed. Maps of each principal component (up to 10) are displayed, and
the results of the PC analysis and filtering are output to ASCII formatted files.
Figure 10
3-8
Page 28

Pub# OM17-NIR Shank
Map of proposed sample locations
based on clustering. Each circle
PC scores file to be clustered. represents a sample location.
File where GPS
locations of
proposed
sample locations
is stored.
Number of
points in each
cluster.
The number of
clusters should
be equal to the
number of
desired sample
locations.
This indicates
the status of the
program. First
the program will
space the
spectra evenly,
then cluster the
spectra.
Each plot
represents a
cluster.
Map of all data
with each color
representing a
different cluster.
Figure 11
5) Clustering – Clusters the principal components (PC's) of the spectra into the same
number of clusters as desired sample points. When the clustering program opens it will
ask if the settings are correct. The settings this refers to are the number of clusters or
sample locations, and the number of PC’s to use for clustering. By default there will be
3 PC’s used and 15 locations to sample. If more sample locations are desired, then this
can be changed at this time. Up to 10 PC’s can be chosen, however 95% of the data is
contained within the first 3 PC’s. If these settings are acceptable, then select YES or, to
update the settings press NO. If NO was selected, update the settings and press
continue to begin clustering the data. Once the data has been clustered, the program
status will say done and the complete light will be lit. Press close window or F12 to
return to the main interface.
3-9
Page 29

Pub# OM17-NIR Shank
Map of the proposed locations (black circles) and
the actual locations (black squares). The cursor
(not shown) will show the user their current location
when the cursor is over the proposed location or
the location desired to be sampled, then press OK
or enter to store that location as an actual location
that was sampled and take a sample of the soil.
Number of
next actual
locations to be
sampled.
When the
cursor is over
the desired
sample
location press
OK or enter.
File where the
GPS of the
actual
locations is
stored.
Current auxiliary data
that corresponds to the
chart on the right.
Figure 12
6) Soil Sampling – Allows the user to navigate to the GPS coordinates of desired
sample locations (from Step 5), and record actual sample locations. The actual
locations that are saved during sampling program will be used for the interpolation of
the spectra in the next step.
Once all the desired sampled locations have been stored, press close window or F12 to
return to the main interface.
3-10
Page 30

Pub# OM17-NIR Shank
Input
sampled
locations to
interpolate
Input field
data
Output file
with data at
each
sampled
location
Number of
spectra at
each
location
Distance in meters to search
through spectra in the x direction
Distance in meters to search
through spectra in the y direction
Distance in meters to search for
spectra in the z direction. This is
half of the distance of the depth
increments. This is only used
for the probe mode.
Increments in meters to
space out the 1 meter of
depth for the probe data.
This is only used in probe
mode.
Spectral
data is
graphed as
it is found in
the
interpolation
program.
7) Interpolation – Uses a Gaussian weighting to average spectra near a sampled
location. Spectra near to the location are weighted higher than spectra far away.
Outputs a file named spectra@locations.txt to the working directory. This file contains
the spectra and auxiliary data for each sampled GPS location.
Once the interpolation begins it will ask if the settings are correct. The settings this
refers to are a, b, and the depth increments. By default a and b will be 3 meters, if a
larger search area is desired then these can be updated. If the settings are fine press
YES, if the settings need to be updated select NO. After selecting NO and updating the
settings then press continue to begin the interpolation. After the interpolation is done the
complete light will be green, then press close window or F12 to return to the main
interface.
Figure 13
Note: always use exit button or press F12 to close out of Veris NIR software.
3-11
Page 31

Pub# OM17-NIR Shank
How to import sample locations for interpolation with Veris software (versions 1.4
and later)
This is only to be used when sampling is not completed in the Veris software. By
following these steps the user could map a field and then flag the GPS locations where
samples were collected and use those locations to get the interpolated values from the
Veris software.
Step 1: Collect field data, then extract and filter the data. Exit the Veris
Spectrophotometer Software once these steps have been completed.
Step 2: Create a file of the GPS coordinates of the sampled locations. The file should
be created in the following format. Column one is the sample number, column two is
the longitude, and column three is the latitude. Save the file as actual locations.txt in
the working directory, where the field data has been stored.
Figure 14
Example of actual locations.txt file
Step 3: Open the Veris Spectrophotometer Software and chose interpolation. The
software will use the locations stored in the actual locations.txt file, and give an
interpolated spectra, and auxiliary data for each location. The output will be a file called
spectra@locations.txt, which will be created in the working directory.
3-12
Page 32
Pub# OM17-NIR Shank
Sample holders
with soil.
Make sure the
soil is level with
the top of the
sample holder to
ensure a tight fit
with the shank.
Shank bench top stand
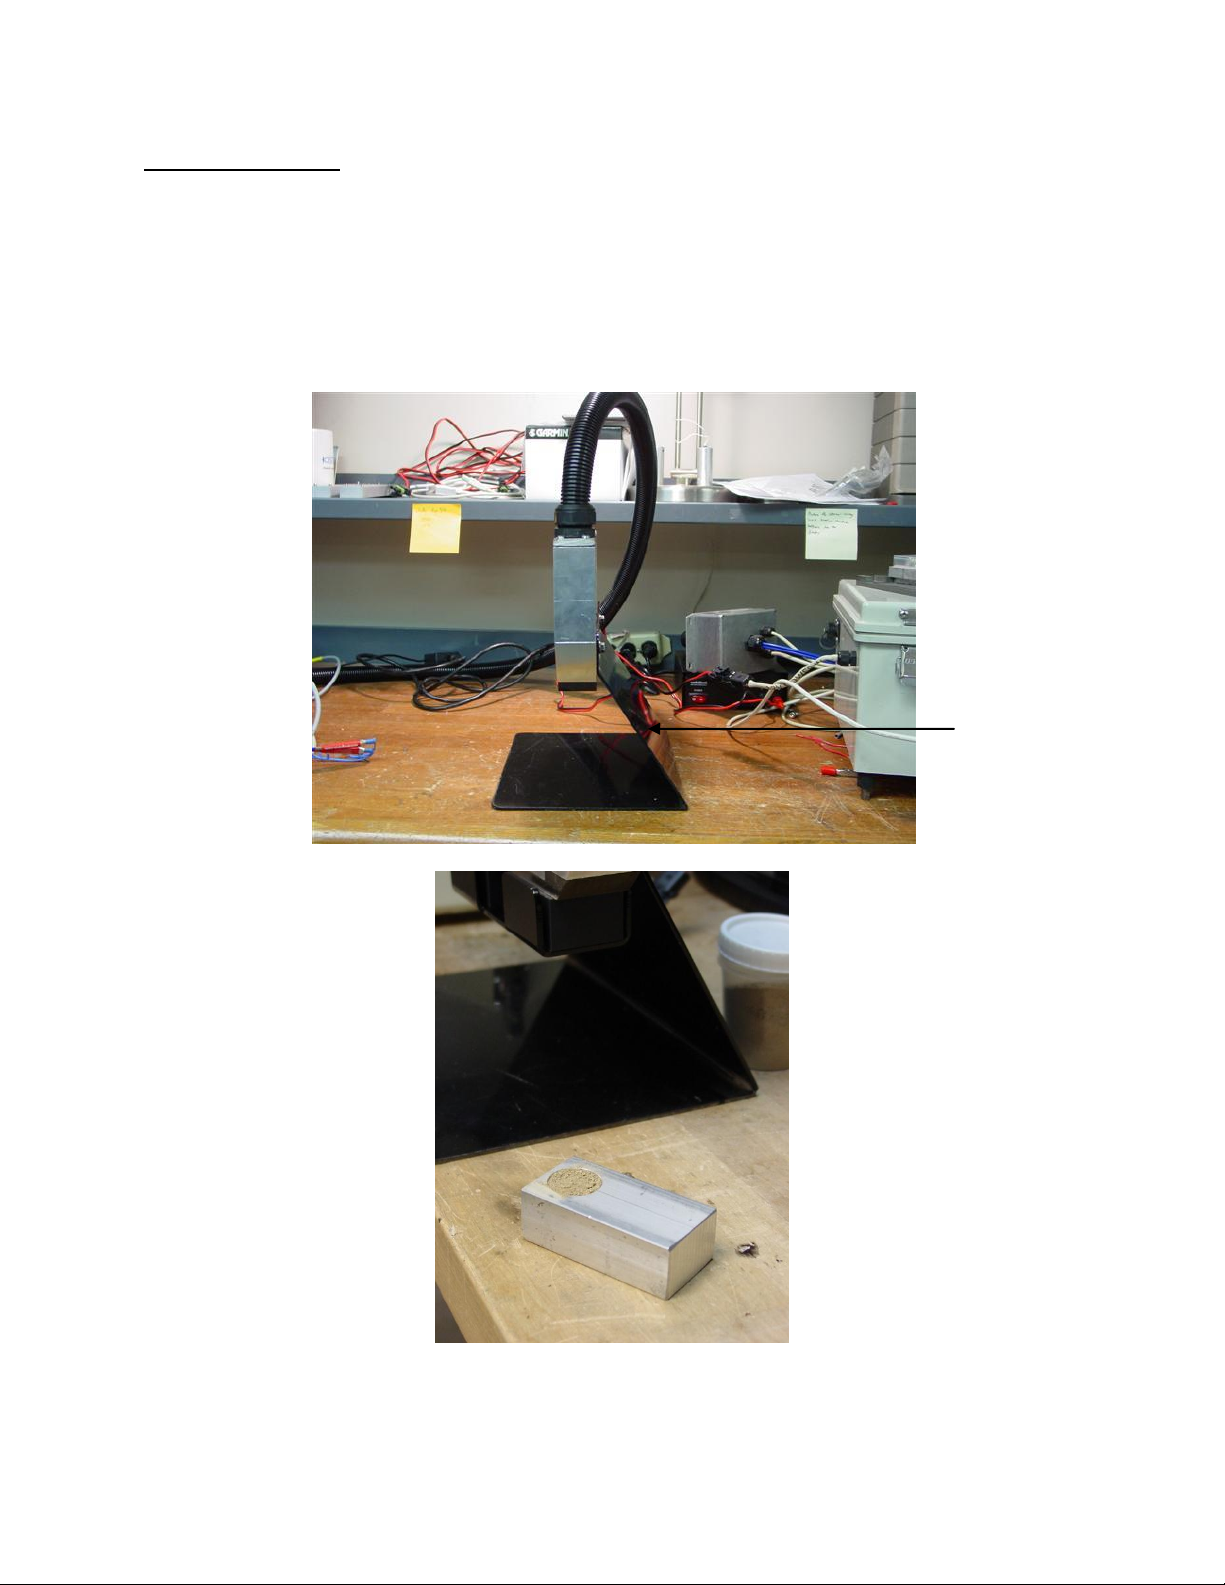
Bench top Usage
To use the spectrophotometer to obtain measurements in the a bench top setting, first
complete the system check as described in the field usage steps, then proceed to the
acquisition. Mount the shank against the shank bench top stand (shown below). Place
a soil sample in the sample holder and place the holder against the face of the shank
window. Use the sample button or F4 to store a dark, reference, and then a sample
spectrum. These transformed spectra are stored in the acquisition_samples.txt file
located in the field folder.
Figure 15
Figure 16
3-13
Page 33

Pub# OM17-NIR Shank
Placing the sample holder securely against the shank.
Figure 17
3-14
Page 34
Pub# OM17-NIR Shank
Test/Example Data
In order to gain experience with the software before mapping, test/example datasets are
included with the Veris software. This allows the user to experiment with the system,
without logging data or having GPS signal.
1. Start Operating software ( Start programs Veris Spectrophotometer
Software Veris Data Processing)
2. Select working directory by clicking on folder icon.
Figure 18
3. Set ports (see setting port order)
4. Click on system check (see system check for more information).
- Run through all four external references
- Exit system check
- Start acquisition
5. Close acquisition and exit Veris software.
6. Go to C:\Veris\test data copy all files into the directory that was setup in step 2.
7. Start software again and proceed through the extraction, filter, cluster, sample
(no locations can be stored without GPS), and interpolation. For more information
on each of these steps, see Field Operations.
3-15
Page 35
Pub# OM17-NIR Shank
adjust
toplink to
level
operate
implement
parallel to
soil
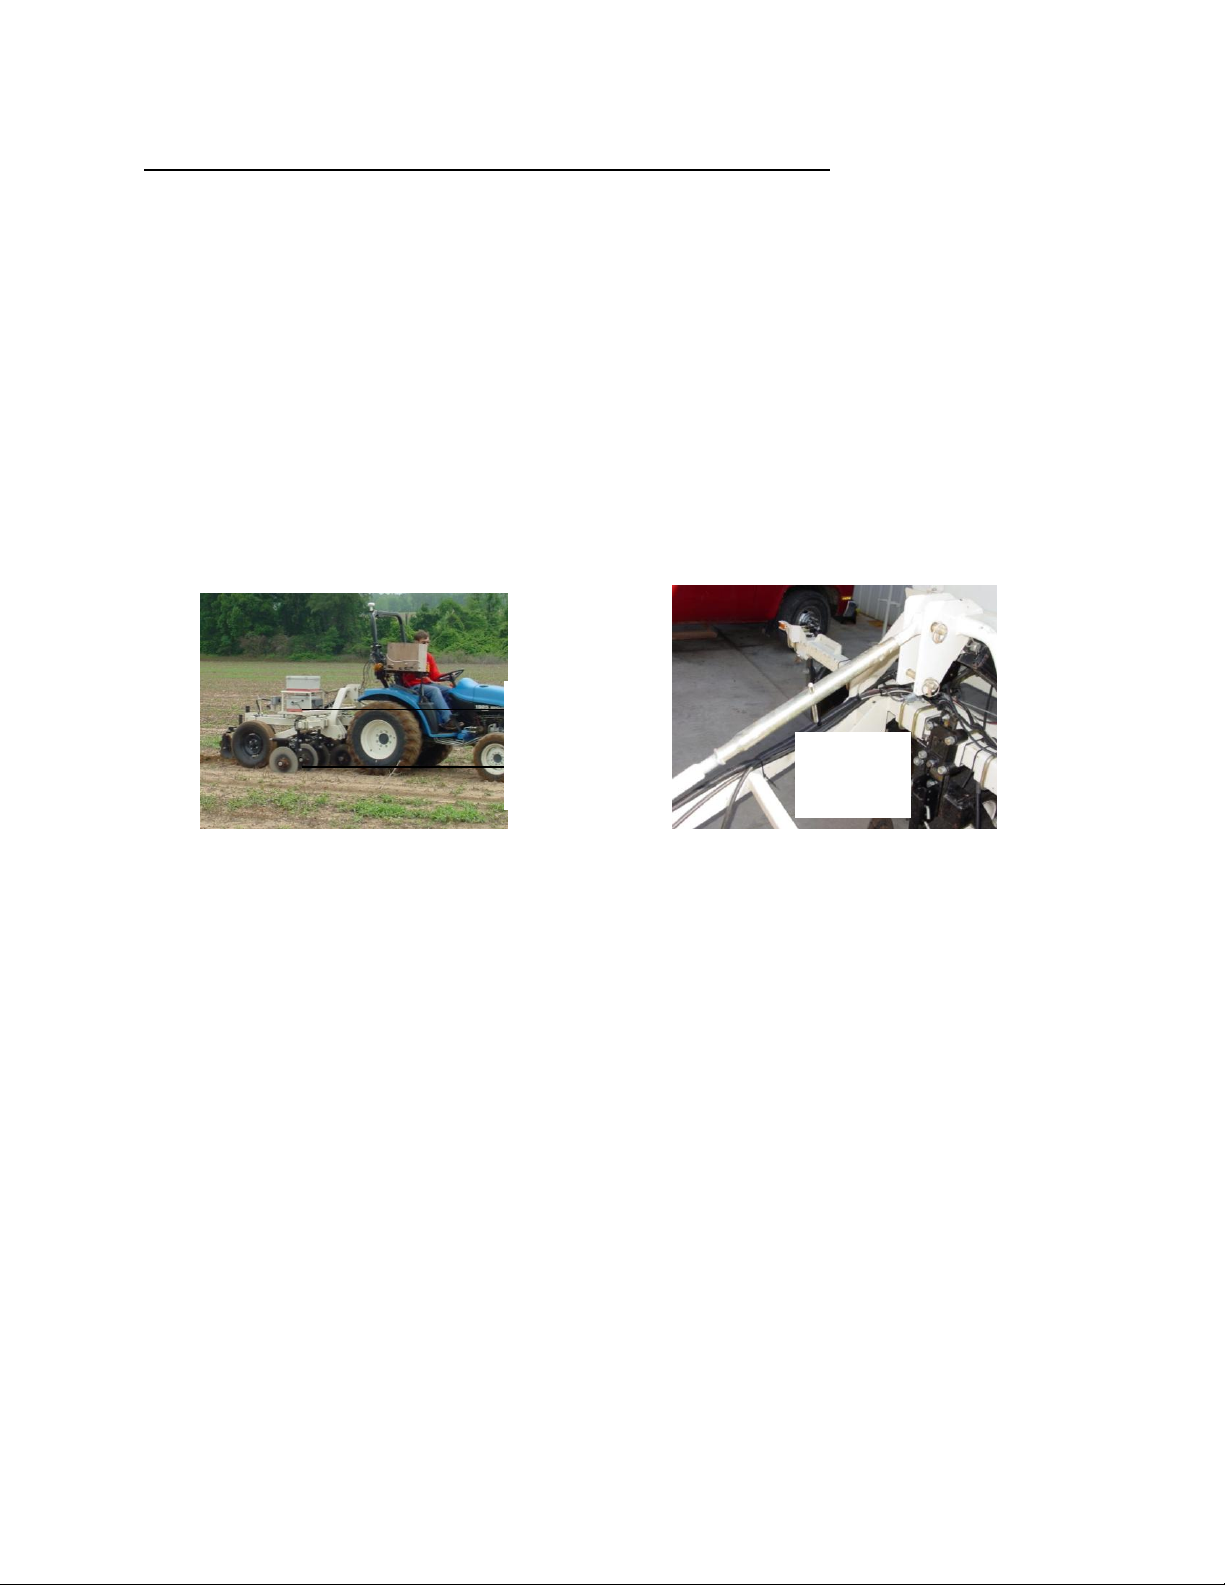
Field Operations—NIRS and Soil EC Mobile Sensor Platform
Checking Electrical Signal Continuity and Electrode Isolation
It is recommended that you routinely check the EC signal to verify that all functions are
working properly. See Maintenance and Lubrication Section for a step-by-step
procedure. It is advisable to perform this test on a routine basis (weekly or every 20-25
hours of data collection) to ensure you are obtaining reliable data.
Setting Operating Depth
Begin field operation by lowering unit into soil. For good electrical conductivity, all
coulter electrodes must be in direct contact with the soil, at all times and in every region
of the field. A depth of 1-2” (2.5-5 cm) is recommended. To insure this depth is
consistently achieved, 400-600 lbs. (180-275 kg) of additional weight are normally
required. Veris offers optional weights, or they can be supplied by the customer. Do
not adjust the tension on the coulter electrode springs to increase soil contact or
penetration. They are pre-set at the factory with the proper tension.
Figure 19 Figure 20
Field Condition
Field should be in a uniform state. Mapping after intensive primary tillage is not
recommended. The soil must have a minimum of 10% available water, and cannot be
frozen. If rocky conditions exist, you may wish to consider the optional coulter rock
guard kit, PN 15169.
Speed
Proper field operating speed depends on field conditions. Because of the importance of
consistent contact, the unit must not be allowed to bounce over rough fields at high
speeds.
Pulling Vehicle
The implement may be pulled with a variety of vehicles: 20-50 hp tractor, 4WD pickup
or Jeep.
3-16
Page 36

Pub# OM17-NIR Shank
Swath width and Navigation
Setting the swath width and navigation system is at the discretion of the customer. A
40-60’ (12-18 m) swath works well in most areas. In areas of high soil variability, a
narrower swath may be preferred. Several methods of navigation are possible:
following previous crop rows, swath guidance, or using a field navigation computer.
While it is important to map in a consistent pattern, it isn’t absolutely critical that each
pass be exactly the same distance from the previous pass.
Signal Cable
Attach the EC signal cable to the quick connect coupler at front of frame, and to Signal
Port on the Auxiliary case
Figures 21 and 22
Adjustable Wing Extensions (XA option)
The MSP3150 with XA (Extendable Array): This option allows the re-positioning of the
electrodes to fit various bed and crop configurations. Adjustment is made by loosening
the jam nuts and set screws located on the lower front of each side of the toolbar,
adjusting the toolbar wing extensions, and re-tightening the set screws. Veris suggests
setting the toolbars at either the maximum or minimum setting, not at a point in
between. A limiter bolt determines full extension, so there should be no danger of
extending to the point at which the outside coulters disconnect from the main frame.
Important – do not attempt to combine maps in which two different investigative depths
are used.
• Pinch point hazard: to prevent injury, stand clear when raising or lowering any part of
the Veris MSP. Disengage automatic cycling function before working around unit.
• Install all transport locks before transporting or working underneath.
3-17
Page 37

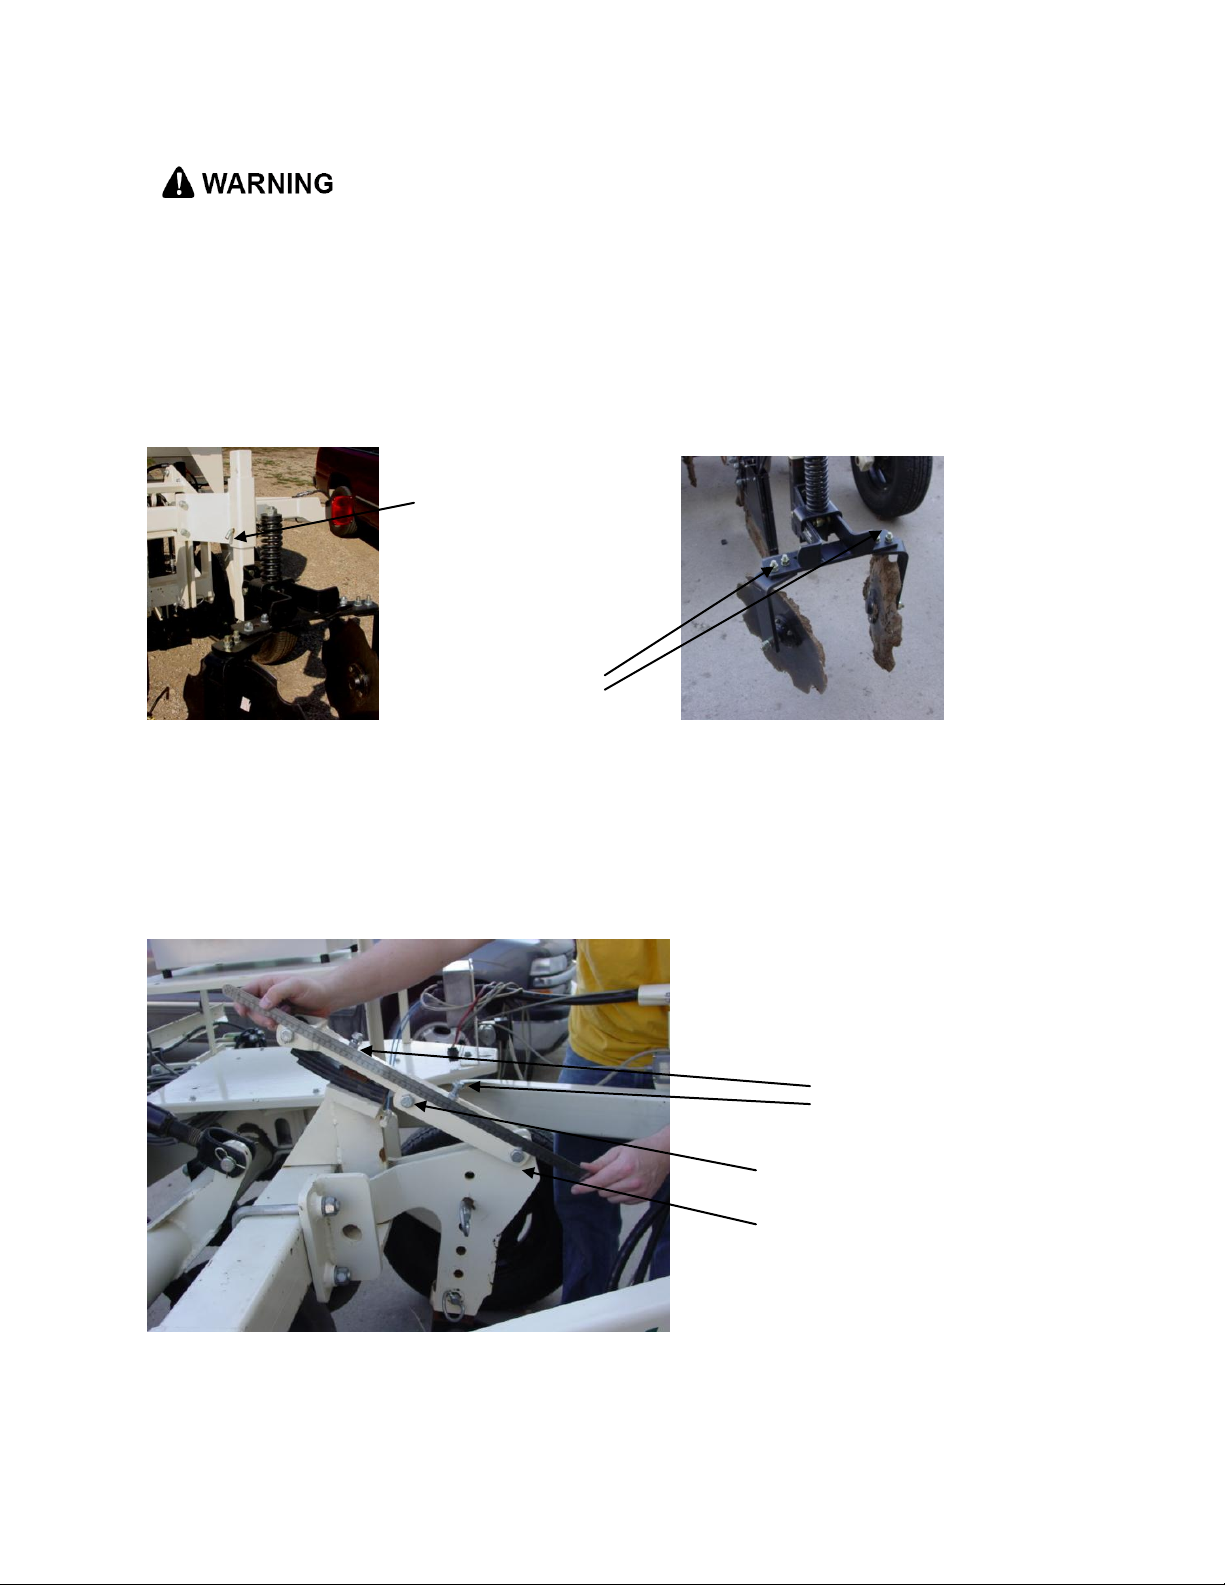
Pub# OM17-NIR Shank
set screws and jam
nuts
Coulter adjustment bolts:
jam nuts and set bolts
Figure 23
Coulter: Pull MSP forward and check depth of coulter and shank. Coulter should be
cutting residue ahead of shank, but not penetrating deeper than the shank. Adjust
height of coulter by loosening top and side jam nuts and set bolts, and re-positioning
coulter. Do not remove top bolt or coulter may drop out of holder.
Figure 24
3-18
Page 38

Pub# OM17-NIR Shank
Cam adjustment
Trailing edge of shoe
Optical shoe leveling: once the mainframe is level, and you have chosen the desired
operational depth, the final adjustment is the forward and backward tilt of the optical
shoe.
1) Lower into the soil and pull forward with the shank in the soil.
2) Check to see of the trailing edge of the shoe is firmly down on the surface of the
soil.
3) If not loosen both ½” mounting bolts and rotate cam to allow forward or rear
adjustment, re-tighten and run again.
Figure 25
3-19
Page 39
Pub# OM17-NIR Shank
Closing Disks
depth adjustment
pin
Closing Disks
angle
adjustments
Toggle trip adjustment bolts:
jam nuts and set bolts
Start with pivot bolt
1/8” lower than
outboard mounting
bolts
• Pinch point hazard: to prevent injury, stand clear when raising or lowering any part of
the Veris MSP. Disengage automatic cycling function before working around unit.
• Install all transport locks before transporting or working underneath.
Closing disks: Adjust closing disks as needed to properly close trench and bring residue
over row-cleaned zone. Do not operate these deeper in soil than necessary.
Figure 26 and 27.
Setting toggle trip: In order for shank to trip when encountering an obstacle in the soil,
but not trip excessively, toggle trip pivot must set lower than outboard pivot points.
Adjust top adjustment bolts until pivot bolt is approximately 1/8” lower than outboard
mounting bolts. If shank trips too easily, increase dimension slightly. Caution, setting
this pivot point excessively low may cause shank damage.
Figure 28
3-20
Page 40
Pub# OM17-NIR Shank
no
continuity
grounded
bolt
coulter
terminal
Section 4
Maintenance and Lubrication
Proper maintenance and lubrication of the Veris MSP will allow you to collect high
quality NIRS and EC data, and greatly extend the useful life of the unit. Veris
Technologies strongly suggests that you follow the following guidelines:
MAINTENANCE: Storage of Spectrophotometer
Spectrometer and Auxiliary cases are water resistant; store NIRS system indoors or
under roof. Water damage to spectrometers and electronic components is not covered
by warranty.
MAINTENANCE: Electrical Continuity and Isolation
It is advisable to perform this test on a routine basis (weekly or every 20-25 hours of
data collection) to ensure you are obtaining reliable data.
1) Coulter electrode isolation – check so see that no metal part of the any
coulter electrode is in contact with the implement frame. This may be by
visual inspection or by connecting one lead of an ohmmeter to the individual
coulter electrode, and the other to a grounded fastener on the frame. If the
coulter electrode is properly isolated, no reading will be obtained. Make sure
that all electrode coulter clamp bolts are properly tightened to prevent lateral
movement of the coulter electrode.
Figures 1 and 2
2) Signal Continuity – To properly measure conductivity, good electrical signal
continuity must be present from the coulter electrode to the instrument. The
Implement Test Box (Part No. 10759) allows you to quickly check this.
Use the following method:
a) Connect the signal cable to the terminal on the test box.
b) Touch one lead of an ohmmeter to the #1 coulter blade (left hand,
standing behind the unit) and the other lead to the #1 terminal on the test
box. A reading of less than 2 ohms is normal.
4-1
Page 41
Pub# OM17-NIR Shank
Connect to coulter
blade
Ohmmeter
Connect one lead to Test Box
terminal (corresponding to
each coulter)
Test Load
Figure 3
c) Continue to check each coulter electrode in succession,
left to right.
d) If any coulter electrode exhibits no continuity or
resistance higher than 2 ohms, refer to the maintenance or trouble
shooting sections for possible causes.
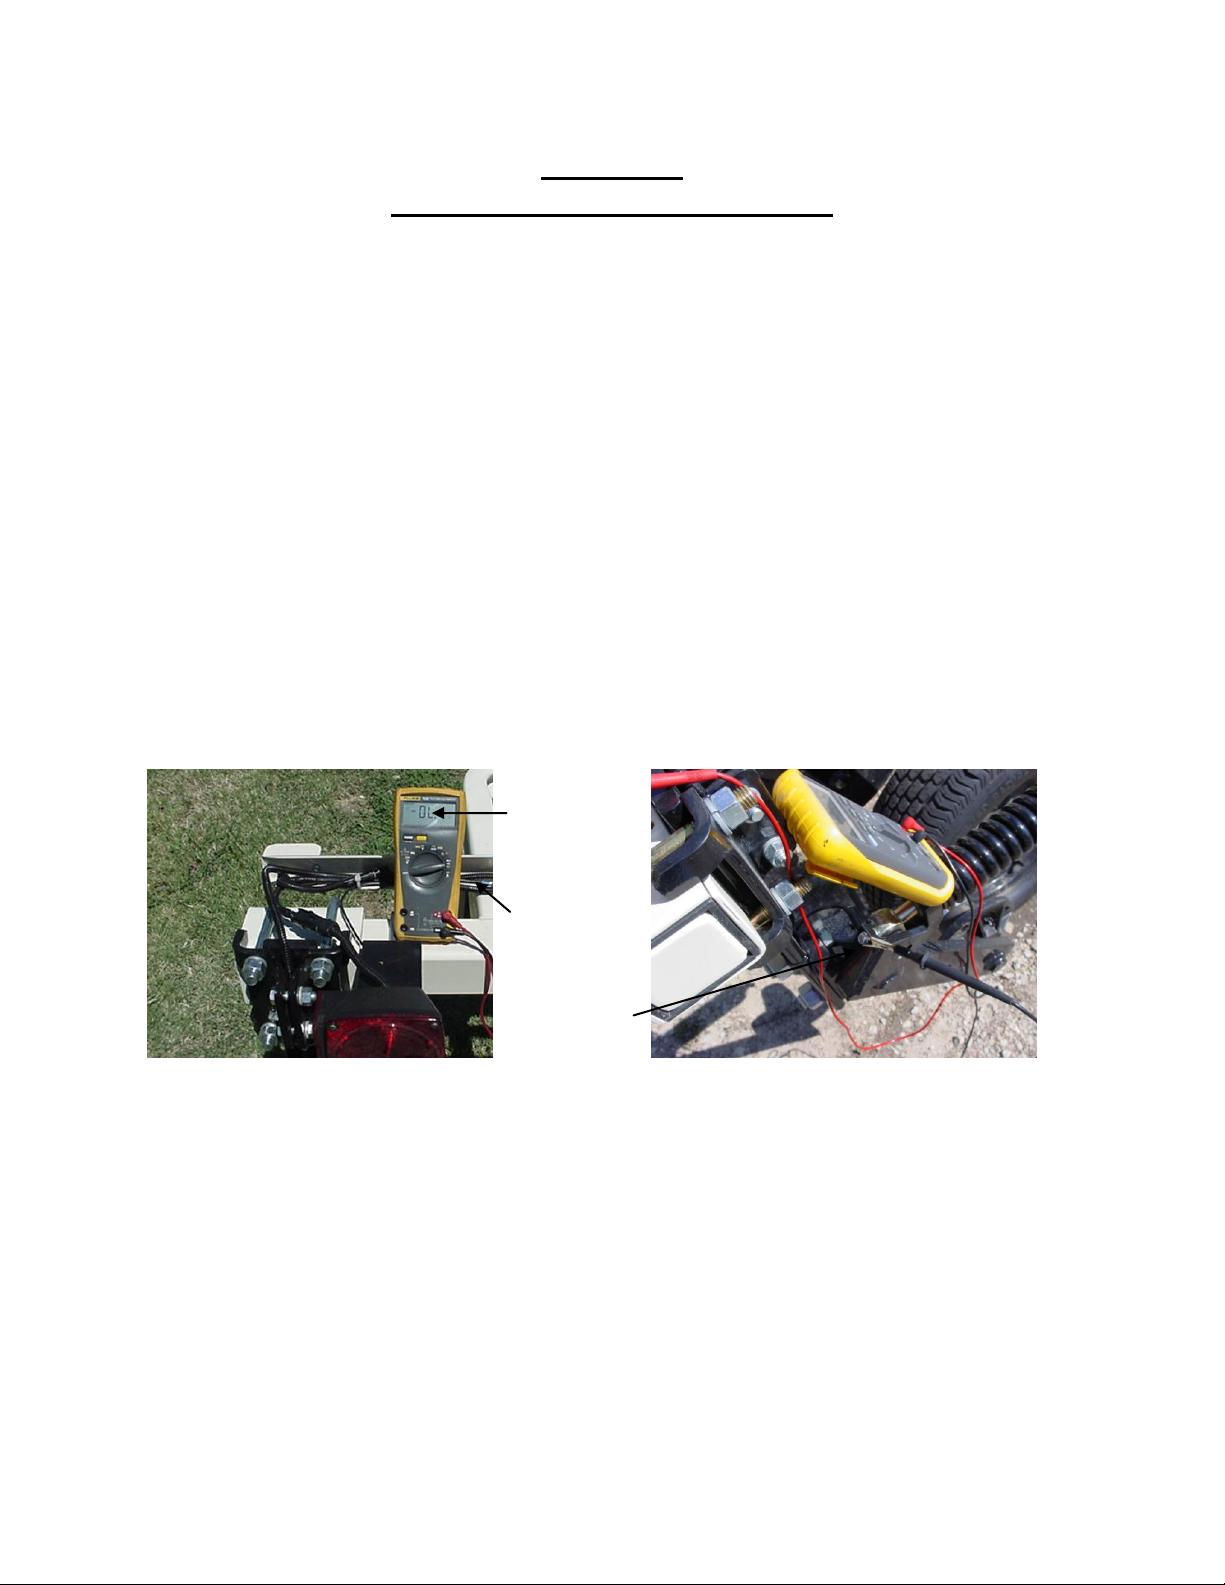
Note: It is advisable to perform this test on a routine basis (weekly or every
20-25 hours of data collection) to ensure you are obtaining reliable data.
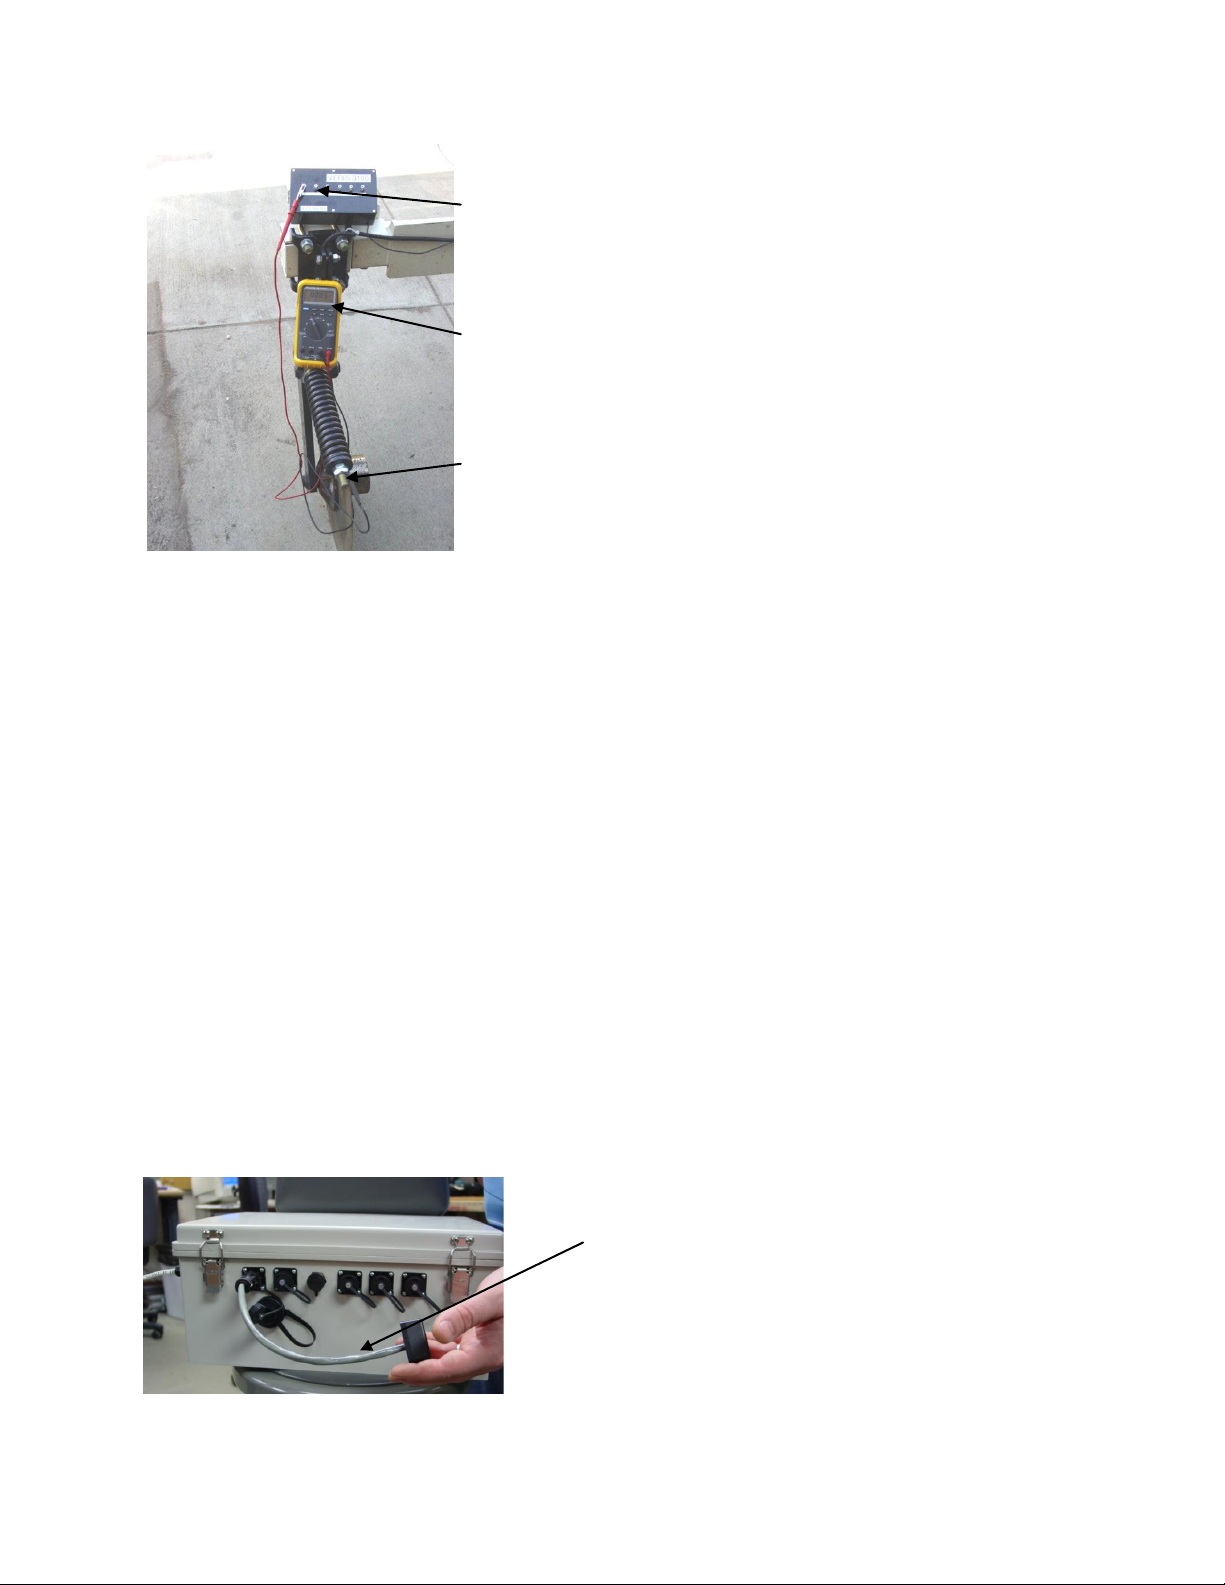
Instrument Signal Testing – The Veris MSP EC Manager is shipped with an Instrument
Test Load (Part No. 10447) that will enable you to quickly check the instrument to
ensure that it is functioning properly. To perform this test, do the following:
1) Disconnect the signal cable from the amp pin (signal) terminal on the auxiliary
case.
2) Connect the test load to the signal terminal.
3) Switch on the unit and perform System Check and Data Acquisition.
4) The display should show: (See Figure 30)
Shallow 3 (approx.)
Deep 27 (approx.)
5) If the readings vary significantly (more than one whole number) contact Veris
service department.
6) Once the test is complete, remove the test load and reinstall the implement
signal cable.
Figure 4
4-2
Page 42

Pub# OM17-NIR Shank
27
3
LOG
Figure 5
Note: It is advisable to conduct this test as a routine check to ensure that you are
obtaining reliable EC data.
ADJUSTMENTS
Commutators-The spring-loaded commutators are located in the center of each coulter
electrode hub cap. They are factory preset, and should not need routine adjustment. If
a continuity test shows abnormally high resistance, the commutators should be
checked. This may be performed in the following manner:
1) Remove the 3/8” allen head set screw.
2) Remove the commutator by turning counter-clockwise.
3) Depress the spring loaded tip on a hard surface to determine if
plunger has adequate tension and can move freely.
4) If the plunger will not move freely, replace, and coat with dielectric silicone grease.
5) If the commutator appears to be in good working order, reinstall
in the hub, and adjust until it bottoms against the spindle end.
Rotate 1/2 turn backward to allow adequate clearance. Improper
adjustment will result in premature failure (too little tolerance) or
poor continuity (too much tolerance).
6) Reinstall locking set screw and tighten firmly on top of
commutator. The top of the setscrew should be even with the
face of the hub. If not, remove and adjust the commutator
inward or outward as necessary.
7) Re-test coulter electrode continuity.
4-3
Page 43

Here is a cut away view of the hubcap assembly:
cap
commutator
Setscrew
spindle
Pub# OM17-NIR Shank
Figure 6
Note: If you are still unable to obtain favorable resistance readings, check for excessive
corrosion at the coulter blade mounting bolts, or the terminal located near the coulter
pivot. It may be necessary to grind the spindle end smooth, if a dimple has developed.
MAINTENANCE: LUBRICATION
• Pinch point hazard: to prevent injury, stand clear when raising or lowering any part of
the Veris MSP. Disengage automatic cycling function before working around unit.
• Install all transport locks before transporting or working underneath.
Rockshaft pivot points – Each pivot (located at the left and right) contains
an upper and lower grease zerk. Due to the limited motion
of the rockshaft, these should be lubricated on 40-hour
intervals. This may vary based on the number of times the
unit is raised and lowered.
4-4
Page 44

Figure 7
Pivot grease
zerks (2 per
hangar; 4 total )
grease zerks
grease zerk
Rachet jack -- 20 hour intervals
Pub# OM17-NIR Shank
Figure 8
Electrode coulters Pivot --In all but the most extremely rocky conditions, the coulter
electrodes should not flex in the field, thus minimal movement will be realized at the
pivot. 80-hour intervals should be sufficient.
Figure 9
Hubs --Use good quality wheel bearing or lithium grease for lubrication, but we suggest
that you grease the hubs sparingly. Over-lubricating the hub will result in pre-mature
4-5
Page 45

Pub# OM17-NIR Shank
grease zerk
seal failure, and an excessive amount of grease in the hub cap/commutator. On an
interval of 150 hours, 1-2 strokes of grease should be sufficient.
Figure 10
Wheel hubs --
On an annual basis, disassemble, clean, and properly repack the wheel hubs with
suitable wheel bearing grease. It is advisable to replace the seals. As with any tapered
roller bearing, proper pre-load will extend the life of the assembly. Fully tighten the nut,
then rotate backward up to ¼ turn, so that the hub turns freely, without endplay. Install
cotter pin, and reinstall hub cap.
Coulter electrode hubs --
The coulter electrode hubs operate in a significantly harsh environment, and annual
inspection is of utmost importance. The double-lip seals are designed to keep grease
in, and contaminates out, but they are the cause of practically all hub failures. It is
advisable to disassemble, clean, repack, and re-install annually. To perform this
maintenance, do the following:
1) Remove hub cap by turning in a clockwise direction (left-hand
thread
prevents loosening in operation).
2) Remove cotter pin, castle nut, thrust washer, and remove hub.
3) Remove outer bearing and knock out inner bearing using a
wooden dowel or brass rod. Be sure to match each bearing to
its location on the hub and do not mix bearings between hubs.
Natural wear will cause the bearing and race to form pattern that
is unique to that set.
4) Thoroughly wash hub and bearings in solvent and dry.
5) Replace bearings and races that show excessive wear or
pitting.
6) Pack with grease, and reassemble -- or reassemble, and pack
via grease zerk with wheel bearing or lithium grease. It is
advisable to replace the seals.
4-6
Page 46

Pub# OM17-NIR Shank
Seal
Hub
Nut
Thrust Washer
Bearing
Swing arm
7) Adjust bearing pre-load as mentioned above. Excessive preload may cause plugging in extremely loose soil conditions, and
excessive endplay may damage the commutators.
8) Inspect the sealing o-ring on the hub cap, and reinstall by
threading counter-clockwise on the hub.
9) Adjust commutator clearance as mentioned above in section on
commutator adjustments.
Figure 11
4-7
Page 47

Pub# OM17-NIR Shank
Maintenance: NIRS Wear-plate Replacement
• Pinch point hazard: to prevent injury, stand clear when raising or lowering any part of
the Veris MSP. Disengage automatic cycling function before working around unit.
• Install all transport locks before transporting or working underneath.
Step 1: Pull shank back and secure with pin in the top hole of the black adjustment bar.
Figure 12
Figure 13
4-8
Page 48
Pub# OM17-NIR Shank
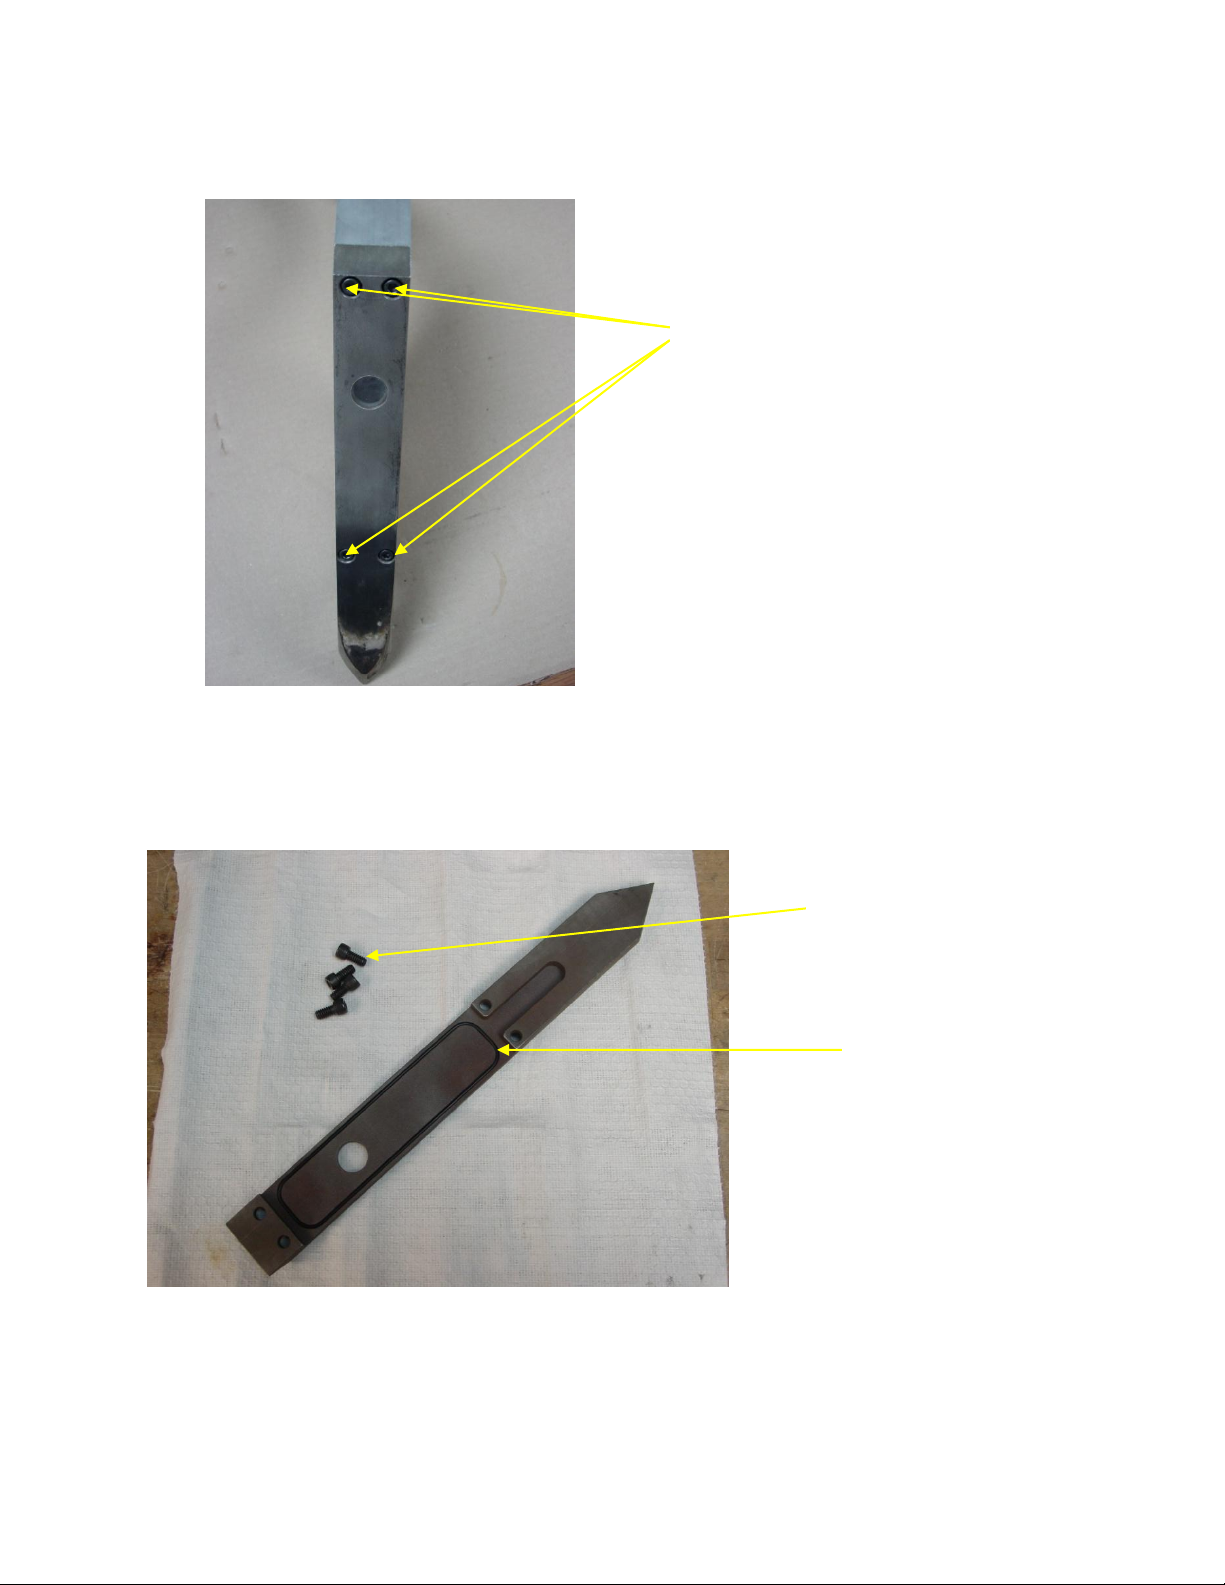
3/16 hex bolts
3/16 hex bolts
O-ring
Step 4: Using 3/16 hex wrench remove the four bolts securing shank wear plate.
Figure 14
Step 5: Insert new O-ring into new shank wear plate.
Figure 15
4-9
Page 49

Pub# OM17-NIR Shank
Step 6: Make sure both the surface of the wear plate and the surface of the shank are
clean before placing the new shank wear plate onto shank and securing with four new
bolts.
Figure 16
4-10
Page 50
Pub# OM17-NIR Shank
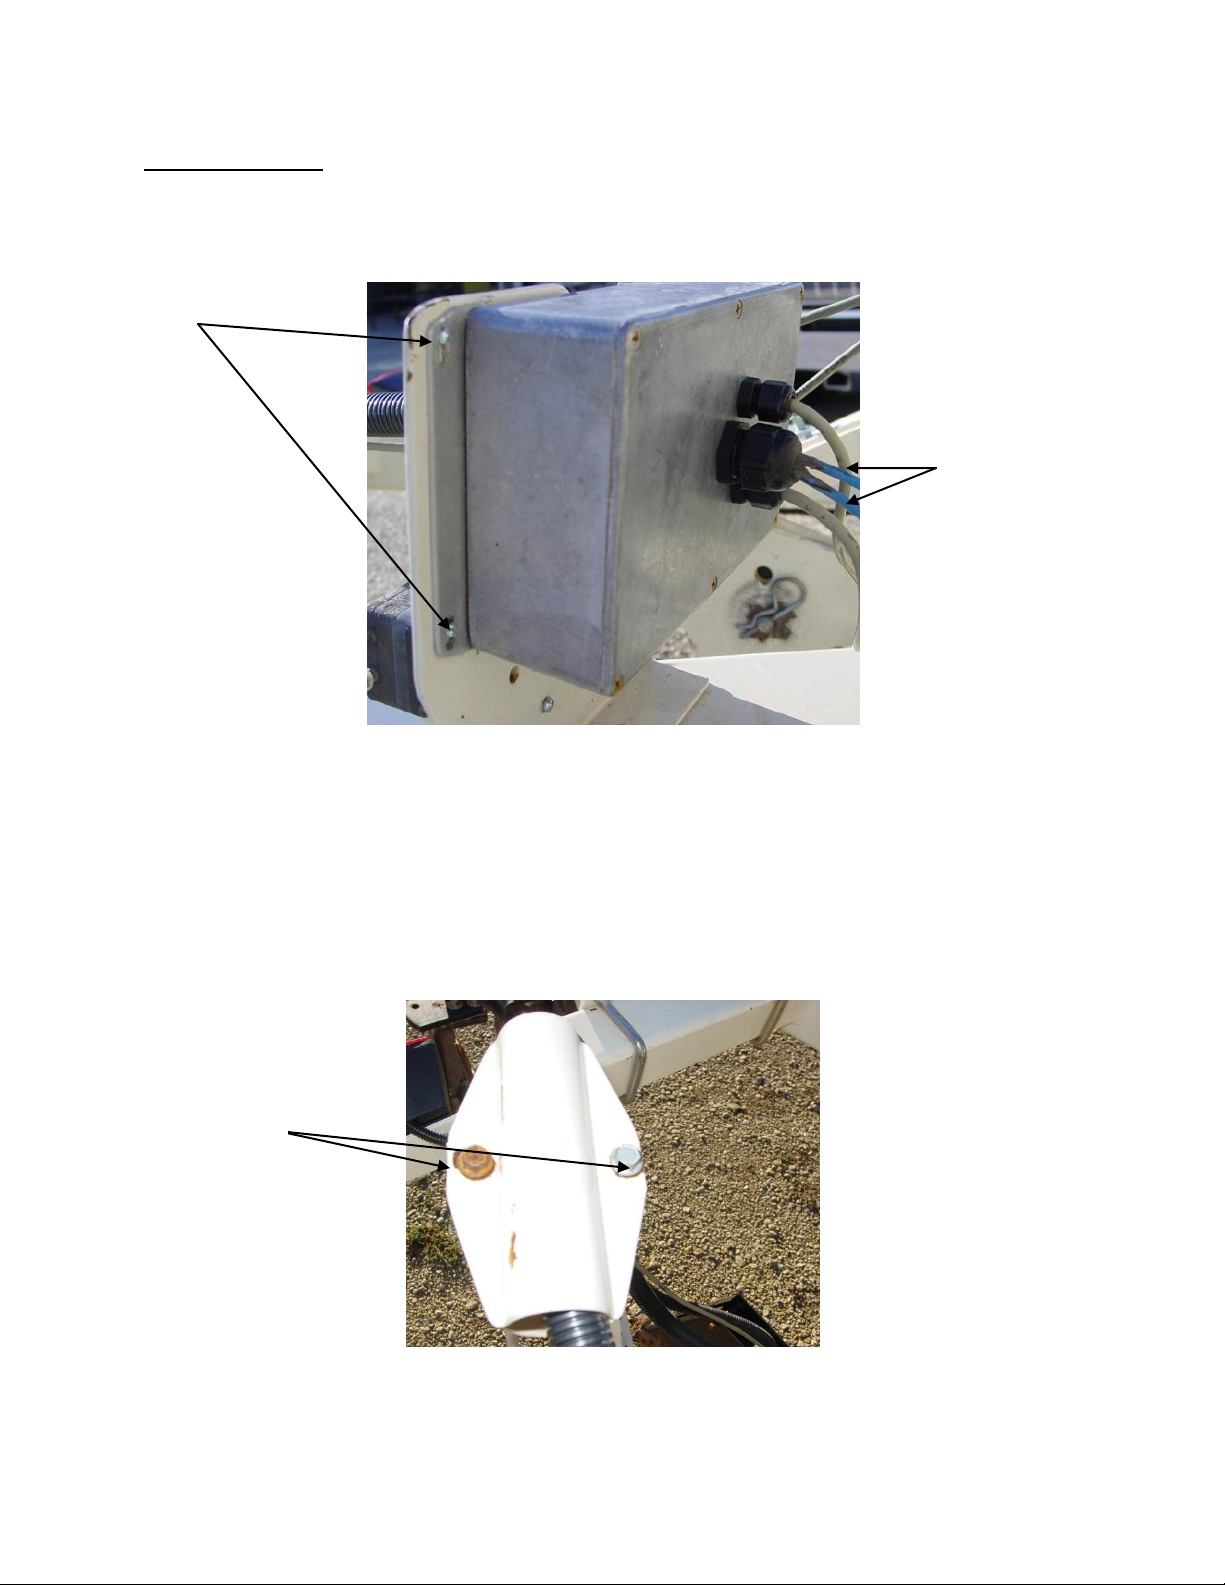
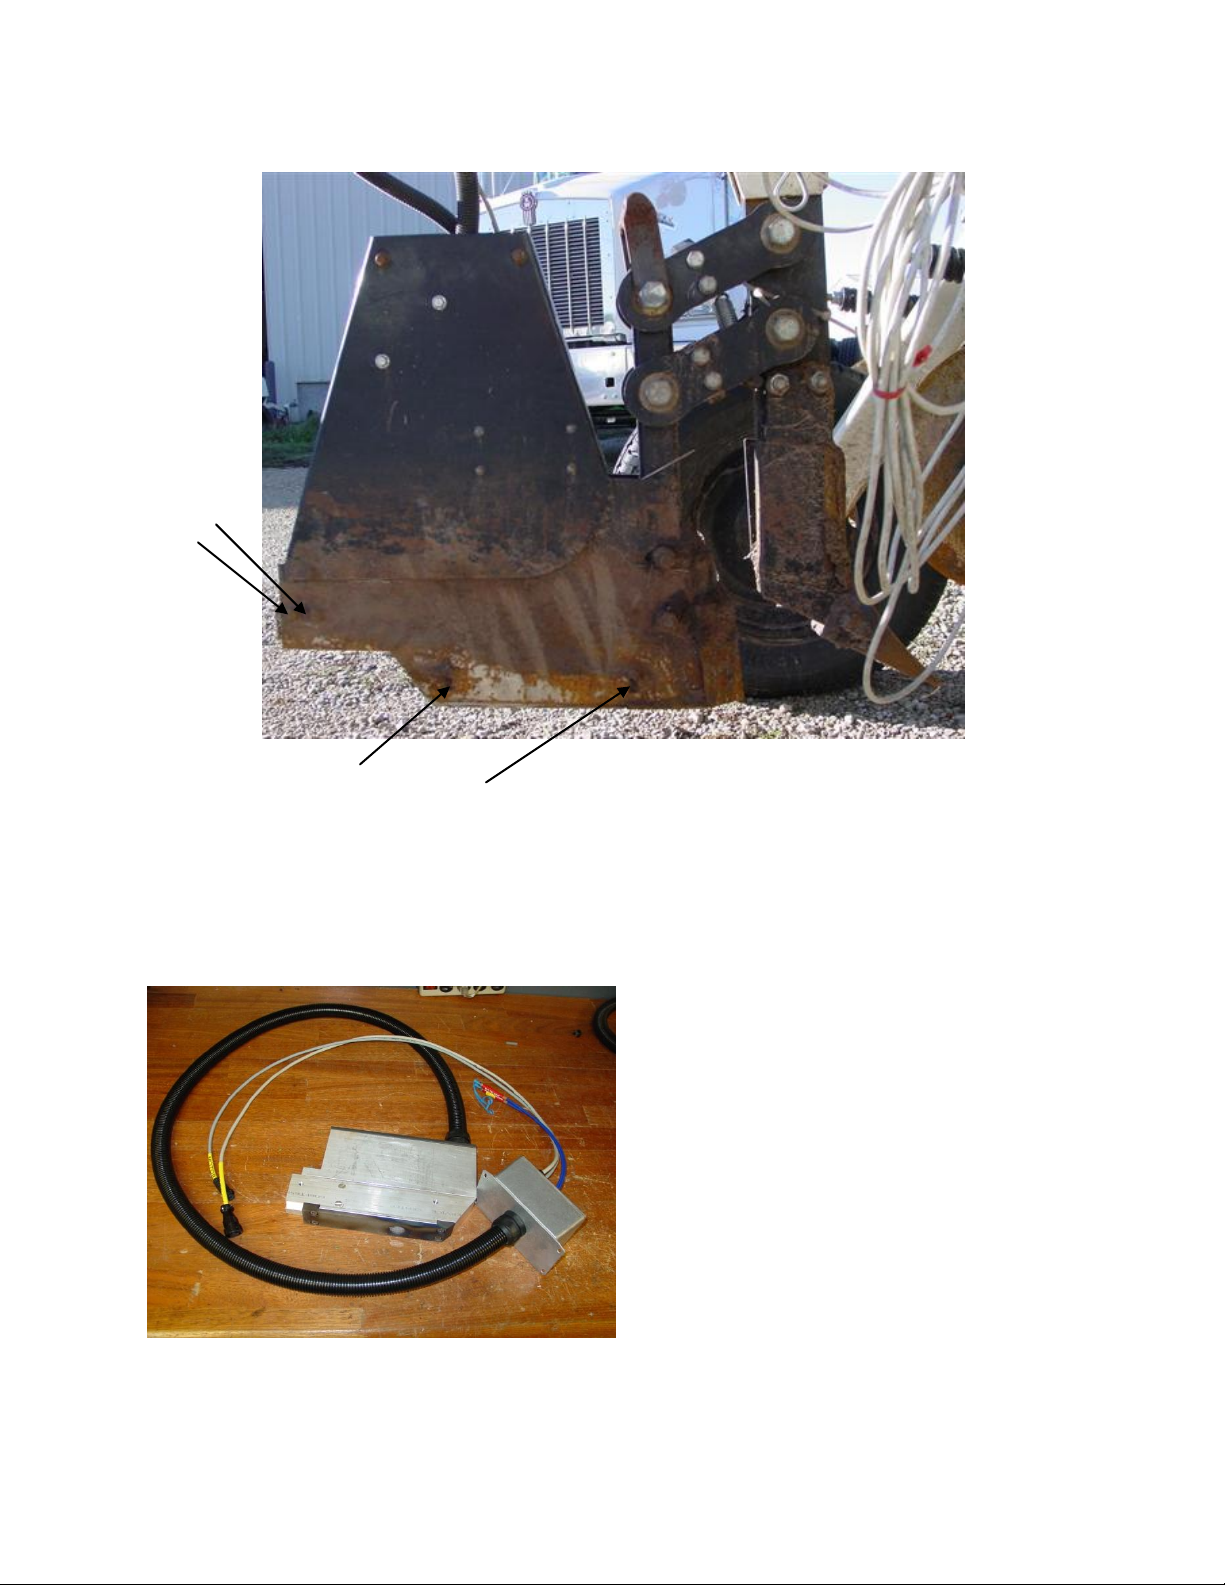
Shank bulkhead connector box
Bulkhead
connector box
screws.
Note:
There are four
screws total.
Only two are
pictured here, the
other two are on
the opposite
side.
Fiber optic cables
Note: Always place
caps on fiber
connector after
disconnecting, to
prevent fiber from
getting
contaminated.
Shank Removal
This procedure is needed when removing the shank for bench top use or for repair.
Figure 17
Step 1:
Disconnect the fibers from the spectrometer case
Step 2:
Remove the four screws holding on the shank bulkhead connector box, using a flat
head screwdriver.
Step 3: Remove the two bolts holding the cable in place using a ½” socket
Figure 18
4-11
Page 51

Pub# OM17-NIR Shank
Temperature module bolts
Shank bolts
Shank side plate bolts
Figure 19
Step 4:
Remove the four shank side plate bolts on the left side using a 3/8” socket wrench.
Remove the shank side plate and set aside.
Step 5:
Remove the two temperature module bolts on the left side using a 3/8” socket wrench.
Step 6:
Remove the two shank bolts on the left side using a 3/8” socket wrench.
4-12
Page 52
Pub# OM17-NIR Shank
Temperature
module bolts
Shank bolts
Complete shank module
after removal
Figure 20
Step 4:
Remove the two temperature bolts on the right side using a 3/8” socket wrench. The
temperature module should be free now. Remove and place to the side.
Step 5:
Remove the two shank bolts on the right side, the shank should now be free.
Figure 21
4-13
Page 53

Pub# OM17-NIR Shank
Auxiliary case
Spectrometer case
Mounting plates
Latches
Case Removal and Installation
When the spectrometer and auxiliary cases need to be removed for storage, repair, or bench top
use follow these instructions.
First disconnect all wires and the optical fibers connected to the auxiliary and spectrometer
cases.
Each case is secured with two latches, and case and latch assembly can be removed as a unit.
Figure 22
Figure 23
4-14
Page 54

Pub# OM17-NIR Shank
Section 5
Troubleshooting
Troubleshooting EC module
Map doesn’t match known or expected soil types --
1. Check electrical continuity using Implement Test Box as discussed above.
2. Check isolation of coulter electrodes
3. Remove any buildup of moist soil on toolbar
4. Check blade bolt tightness and corrosion
5. Map additional fields to see if similar condition results
6. Contact Veris Service Department
EC values change with field speed, or when unit stops moving
(If both shallow and deep EC array values change, focus on coulters 2 & 5; if shallow
array coulters 3 & 4; if deep array coulters 1 & 6)
1. Check electrical continuity carefully—rotating coulter blade as measurement is
made
2. Remove coulter hub cap and inspect spring-loaded commutator and coulter spindle
for wear; replace commutator or grind spindle end smooth if necessary
No conductivity readings on instrument display--
1. No continuity on coulter electrode # 2 or # 5.
2. Check for excessive corrosion on coulter terminal.
3. Check for broken signal wire by disconnecting wire from coulter electrode and
checking continuity from end of wire to corresponding terminal on test box. Replace
coulter wiring (PN 15601) or signal cable (PN 13602) as required.
4. Check for collapsed spring-loaded commutator on # 2 or # 5.
Data missing from display reading –
1. Unit must be in contact with soil to record data points; lower unit or add weights to
ensure consistent 1”-2” (2.5-5 cm) penetration into soil
2. Check GPS and DGPS signal; Veris instrument is programmed to eliminate all non-
DGPS geo-referenced points.
3. Shut power off and restart
4. Check electrical continuity
5. Check input voltage, 12 v minimum required
Excessive number of negative readings in data --
1. Increase depth of penetration.
2. Slow down in extremely rough fields.
3. Alter transect pattern to avoid areas of heavy residue (combine swath)
5-1
Page 55

Pub# OM17-NIR Shank
Troubleshooting NIRS
No spectrum is present on graph or spectrum is not updating in Acquisition
1. Ensure USB cables are tightly connected
2. Shut down software and cases and restart system
3. Check port settings
4. Open each spectrometer individually in the manufactures software(procedure #7 & 8)
MS Windows brings up an new hardware found wizard when I plug in my cases
1. Select ‘Install software automatically’ and allow hardware wizard to configure device
Ports won’t save in Veris Spectrophotometer Software
1. Make sure the Exit button is being used to close out of the software, not the X in the
upper right hand corner.
No GPS data is coming in during acquisition
1. Check to ensure nothing is obstructing GPS signal (ex. buildings)
2. Is the GPS plugged into the correct port? (second one from the right on auxiliary
case)
3. Check to make sure GPS adaptor is in place
4. Follow the steps of the GPS troubleshooting guide to further diagnose problem
System check only allows one External Reference to be taken
1. Check to ensure the Ref Check light is green
2. Check the shutter movement distance (auxiliary indicator #17, should be 5.21 +/- .05
3. Check for green lights on the temperature and humidity indicators
Transform does not pass during System Check
1. Check to ensure the correct ER was placed under the shank and the correct ER
button was pressed during the system check.
2. Make sure instrument had a 20 minute warm up period
3. Make sure ER was pressed firmly in place, so little ambient light entered the shank
4. Run System Check again – run all four external references
Computer crashes or has been hard reset while acquiring data
1.Once computer has restarted open Veris Spectrophotometer Software again.
2. Step through software till clustering has been complete. The cluster program will
generate a map, which will let the user know the last point where data was stored.
Using the map as a guide open the acquisition and begin to store data again. The
acquisition will append the new data to the previous data stored.
Reference check will not pass after several tries or steps are out of range
1. Close out of software
2. Shut down power/ restart power to cases
3. Check the port settings
4. Restart software and run dark/reference again
5. Complete procedure #9,on shutter movement.
5-2
Page 56

Pub# OM17-NIR Shank
Troubleshooting NIRS continued
Auxiliary data not updating or ports not setting up correctly
1. Shut down power, and restart cases
2. Ensure USB cables are secured tightly
3. Follow the steps outlined in procedure #10, to ensure data is present on the ports.
How many times do I need to run system check?
A system check transform should be run at least once for each field mapped.
Is the data treated before output to file?
The data is not pretreated before output. If a pretreatment is desired for calibration the
user can pretreat their data using their spectral processing software (ex. Unscrambler).
Ref check light turns red.
If the ref check light turns red, then another dark and reference needs to be stored.
This can be done by click on the Dark & Ref button. This may need to be done several
times to flush out the bad reference. Having the ref check light turn red will prevent the
user from logging.
5-3
Page 57

Pub# OM17-NIR Shank
Problem: No response from Hamamatsu Spectrometer (1100-2200nm)
Does
Hamamatsu
software open?
(Proc. #7)
NO
Hamamatsu is
operating correctly.
Restart Veris
Spectrophotometer
Software and try again.
Does
Hamamatsu
report error
message?
Error stating temperature out of range
Error stating cannot find/open device
Check the device manager for Hamamatsu
hardware. To do so
Right click on the My Computer icon on the
desktop. Go to properties, click on the hardware
tab, then on the device manager button. Check to
see if Hamamatsu is listed in the alphabetical list.
Is Hamamatsu
present in
device
manager?
Shut down power to cases,
restart computer with cases
shut down. Once computer
comes back up, turn on
power and retry Hamamatsu
software.
YES
YES
NO
Does software
report
temperature still
out of range?
Open spectrometer
port in HyperTerminal
(Procedure #10) and
check the last digit of
string
YES
Check to
ensure case is
powered, USB
cables securely
connected.
Unplug and replug
USB cables. Wait to
see if a windows
installer comes up
asking to install
spectrometer software.
Afterwards reopen
software.
Last digit of
string = 1?
YES
Check fuse on
Hamamatsu
power supply
(Proc. #11)
Is fuse
good?
NO
Replace fuse
NO
Spectrometer
case is out of
temperature
range.
Check voltage to
Hamamatsu. (Proc.
#12)
Reinstall Hamamatsu software
using disk provided.
5V on
Hamamatsu?
Check for 12V at
power source (ex.
power supply,
battery), check
power connections.
Contact Veris
service department.
NO
YES
YES
Error stating temperature out of range
Software failed to open
5-4
Page 58

Pub# OM17-NIR Shank
GPS port open in
HyperTerminal
Check HyperTerminal port
settings and ensure port is
present in the device
manager (see port settings)
Ensure GPS adaptor is
in place and GPS is
plugged into correct
spot on Auxiliary Case
(see system overview).
Check Veris
Spectrophotometer Software
port settings
Reinstall Edgeport drivers
Power down cases and
restart computer, once
computer is back up turn
power on to cases and
check again
Check GPS quality factor. (see
program modifications under
acq_settings.txt)
Is data
streaming in
HyperTerminal
? (Proc. #9)
NO
YES
Is port present
in device
manager?
(Proc. #3)
YES
NO
Is USB cable
plugged in
securely?
Plug USB
cable in
NO
Is the power
turned on to
the auxiliary
case?
Turn on power
to case
NO
YES
YES
Troubleshooting GPS
If GPS fails to come in it could be for a variety of reasons. The easiest way to isolate
the problem is to open the GPS port in HyperTerminal (see troubleshooting with
HyperTerminal).
5-5
Page 59
Pub# OM17-NIR Shank
Procedure #1
Check Ocean Optics spectrometer
This procedure is only necessary with Veris Spectrophotometer Software V1.76
and below
1) Click on start Programs Ocean Optics OOIBase32 Start OOIBase32
software
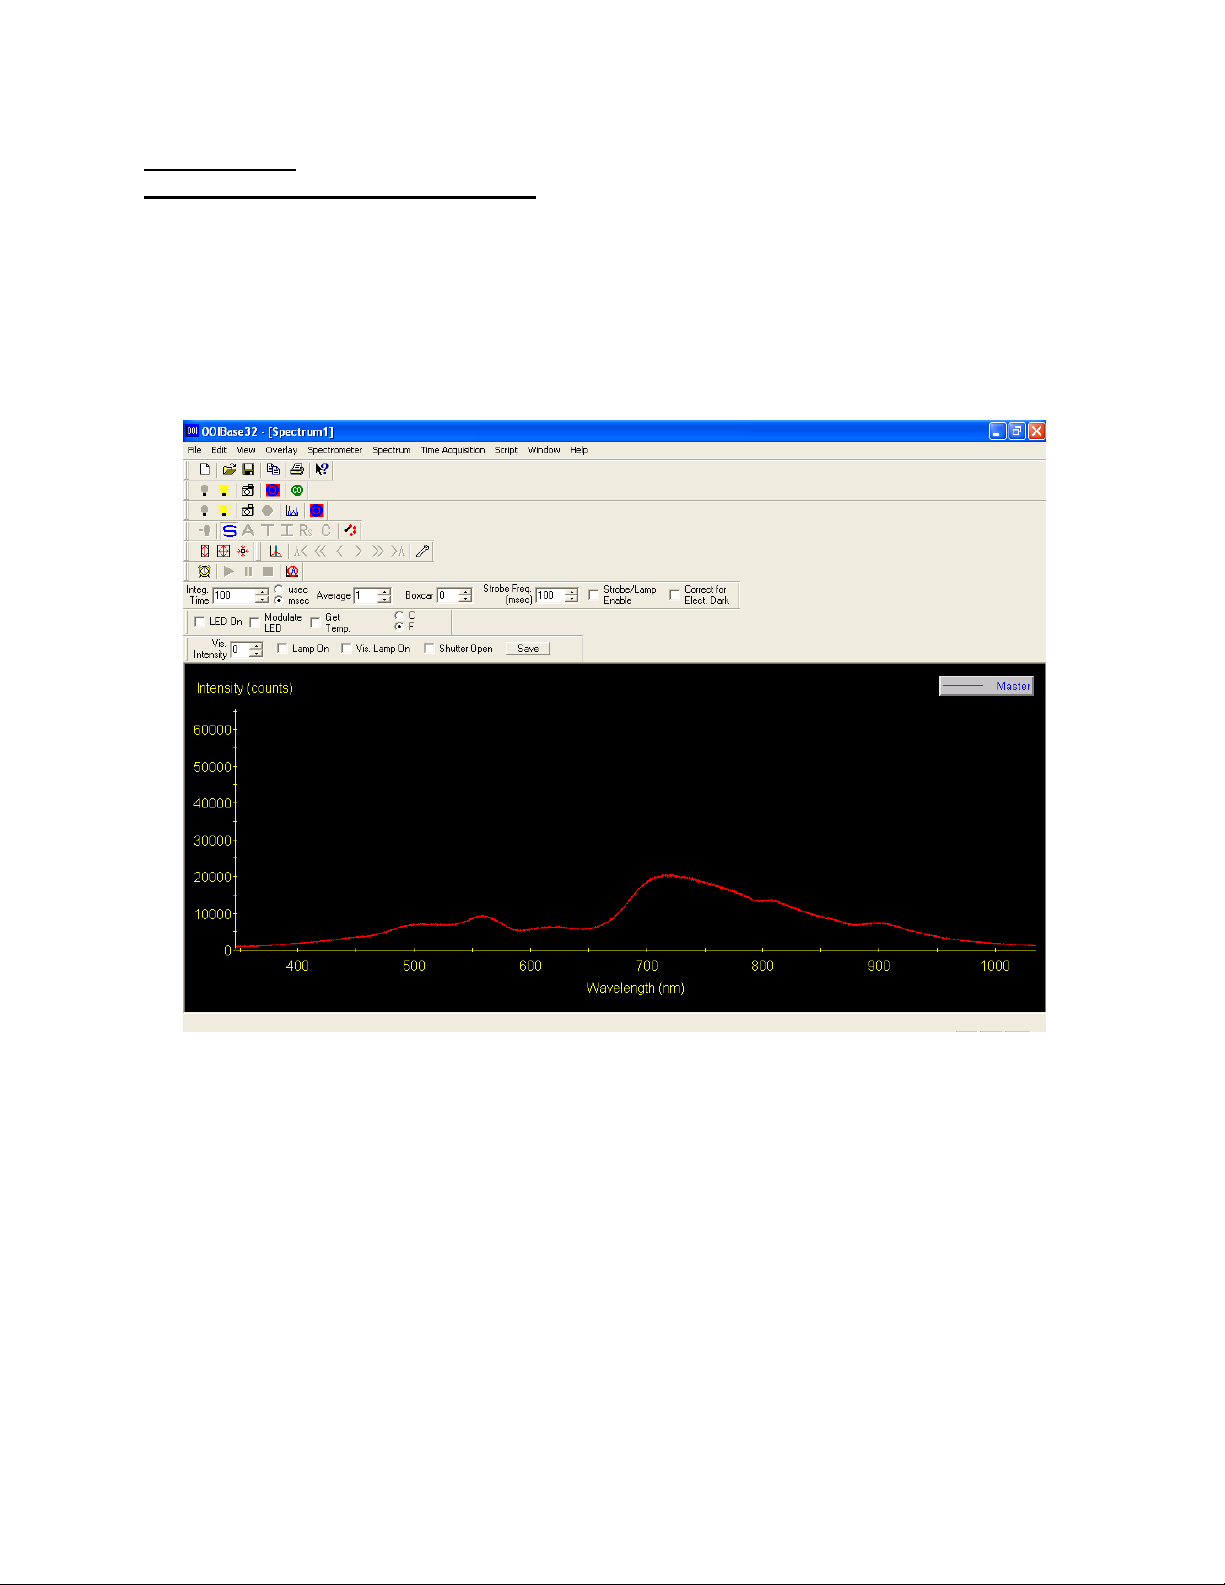
2) Check graph it see if spectrum is present (see figure below). The spectrum
should change as different objects are placed in front of the window on the
shank.
Figure 1
3) If there is no spectrum present or graph does not update as objects are placed
beneath the shank. Then the spectrometer needs to be configured. To
configure click on spectrometer configure A/D Interface tab
5-6
Page 60

Pub# OM17-NIR Shank
Figure 2
4) Under Spectrometer Type select S4000. For the A/D Converter Type select
USB4000. The USB Serial Number will have one serial number present, which is
unique to each spectrometer, select the available serial number.
5) Click OK to save the settings and return to the main screen. A spectrum should
now be present.
6) Close OOIBase32 software, restart computer, and open Veris
Spectrophotometer Software to begin mapping again.
5-7
Page 61

Procedure #2
Open spectrometer icon
Check Hamamatsu spectrometer
1) Click on Start Programs HamamatsuMinispectrometer
EvaluationSoftware SpecEvaluation
2) Click on open spectrometer
Figure 3
3) Click on Open under Select Spectrometer
Pub# OM17-NIR Shank
Figure 4
4) Click on start and check to see if spectrum graph changes as different objects
are placed under shank window. This ensures the Hamamatsu spectrometer is
working properly. If this is not the case then close Hamamatsu software, shut
down power, restart computer and try Hamamatsu software again.
5-8
Page 62

Pub# OM17-NIR Shank
Start
Figure 5
5-9
Page 63

Pub# OM17-NIR Shank
Shutter is shown in
neutral position. Note
light has been turned
off for photograph.
Shutter is shown in
reference position.
Shutter is shown in dark
position. Note light has
been turned off for
photograph.
Procedure #3 - Shutter Movement Troubleshooting
During data acquisition if the steps are not within 5.21 +\- .05, or if there are problems
doing dark/reference checks, the shutter could either be out of sequence or not
operating properly. Complete the steps below to get the shank back into sequence.
N= neutral, window open, light visible, no actuator rod
Figure 6
R= reference, shutter blocking window, virtually no light visible
Figure 7
D= dark, light visible, actuator rod visible
Figure 8
Step 1:
Disconnect lamp cable from auxiliary case, no light should be showing (lamp cable
includes power to proximity sensor)
Step 2:
Turn on power to the cases
Step 3:
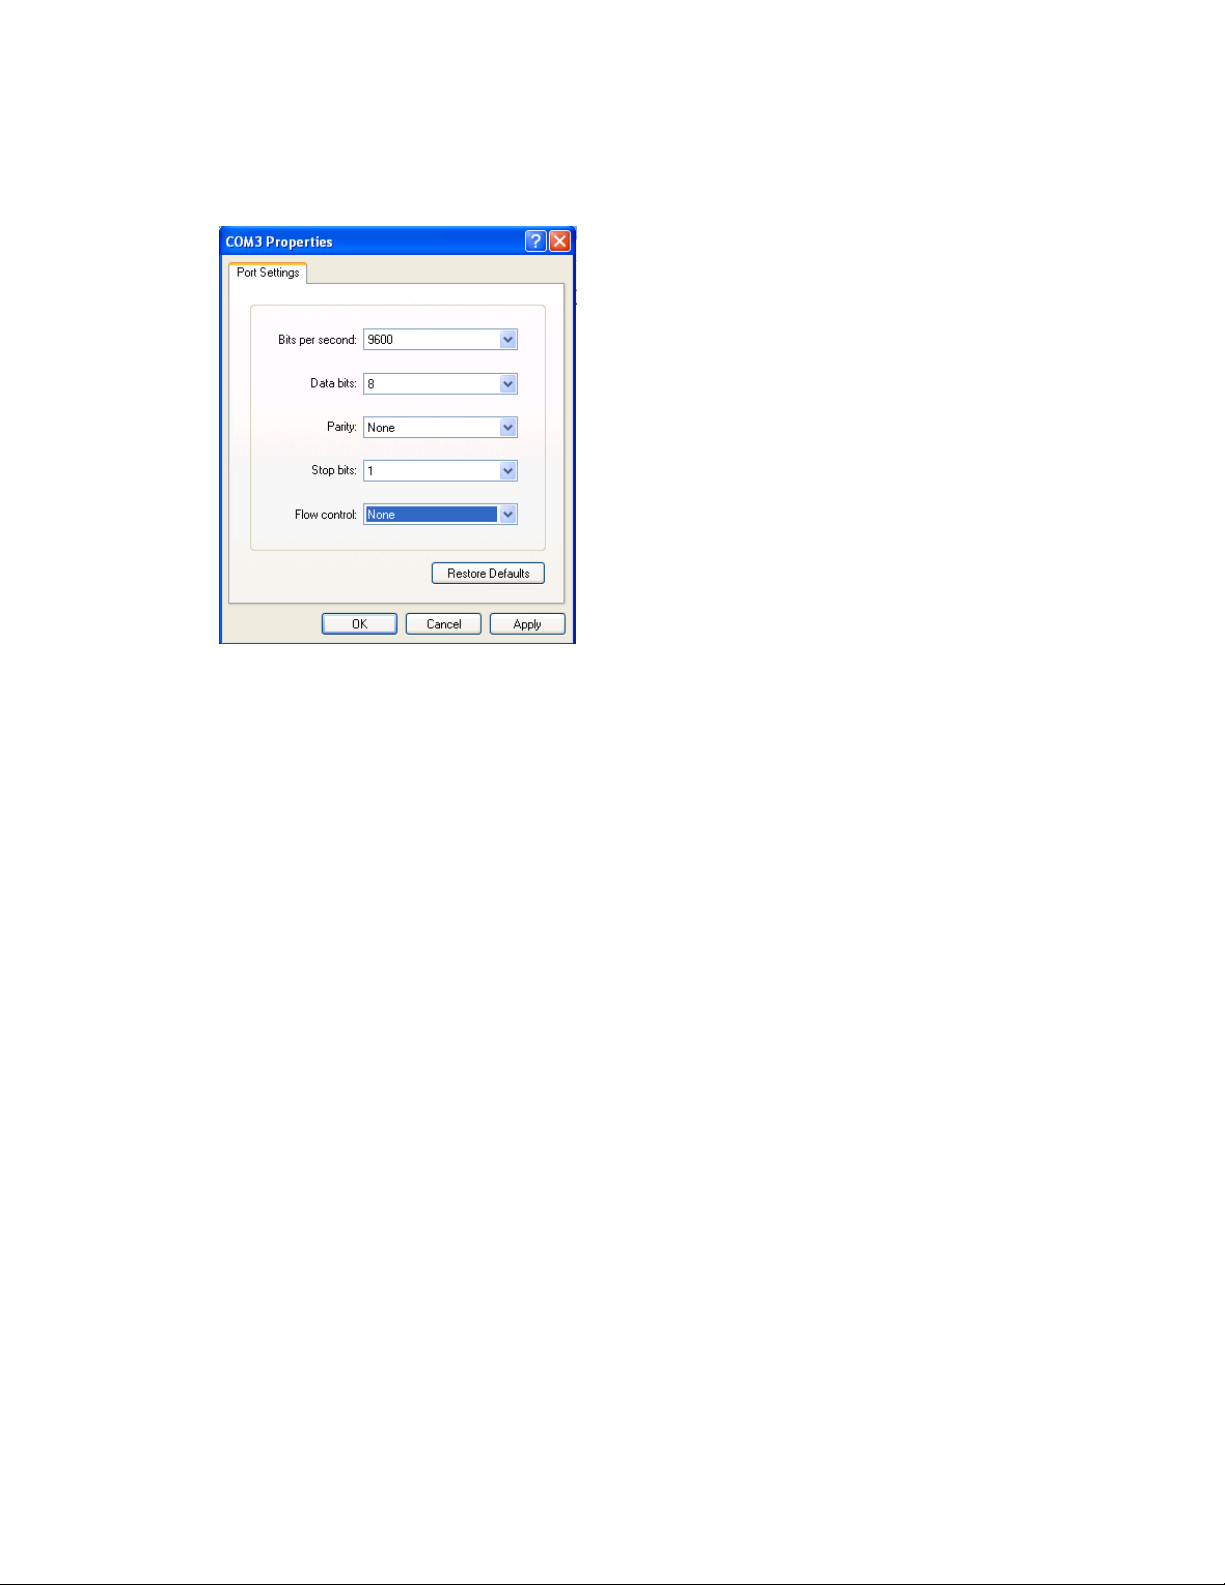
Open HyperTerminal to the control port use these settings:
Bits per second: 9600
Data bits: 8
Parity: None
Stop bits: 1
Flow control: None
5-10
Page 64
Pub# OM17-NIR Shank
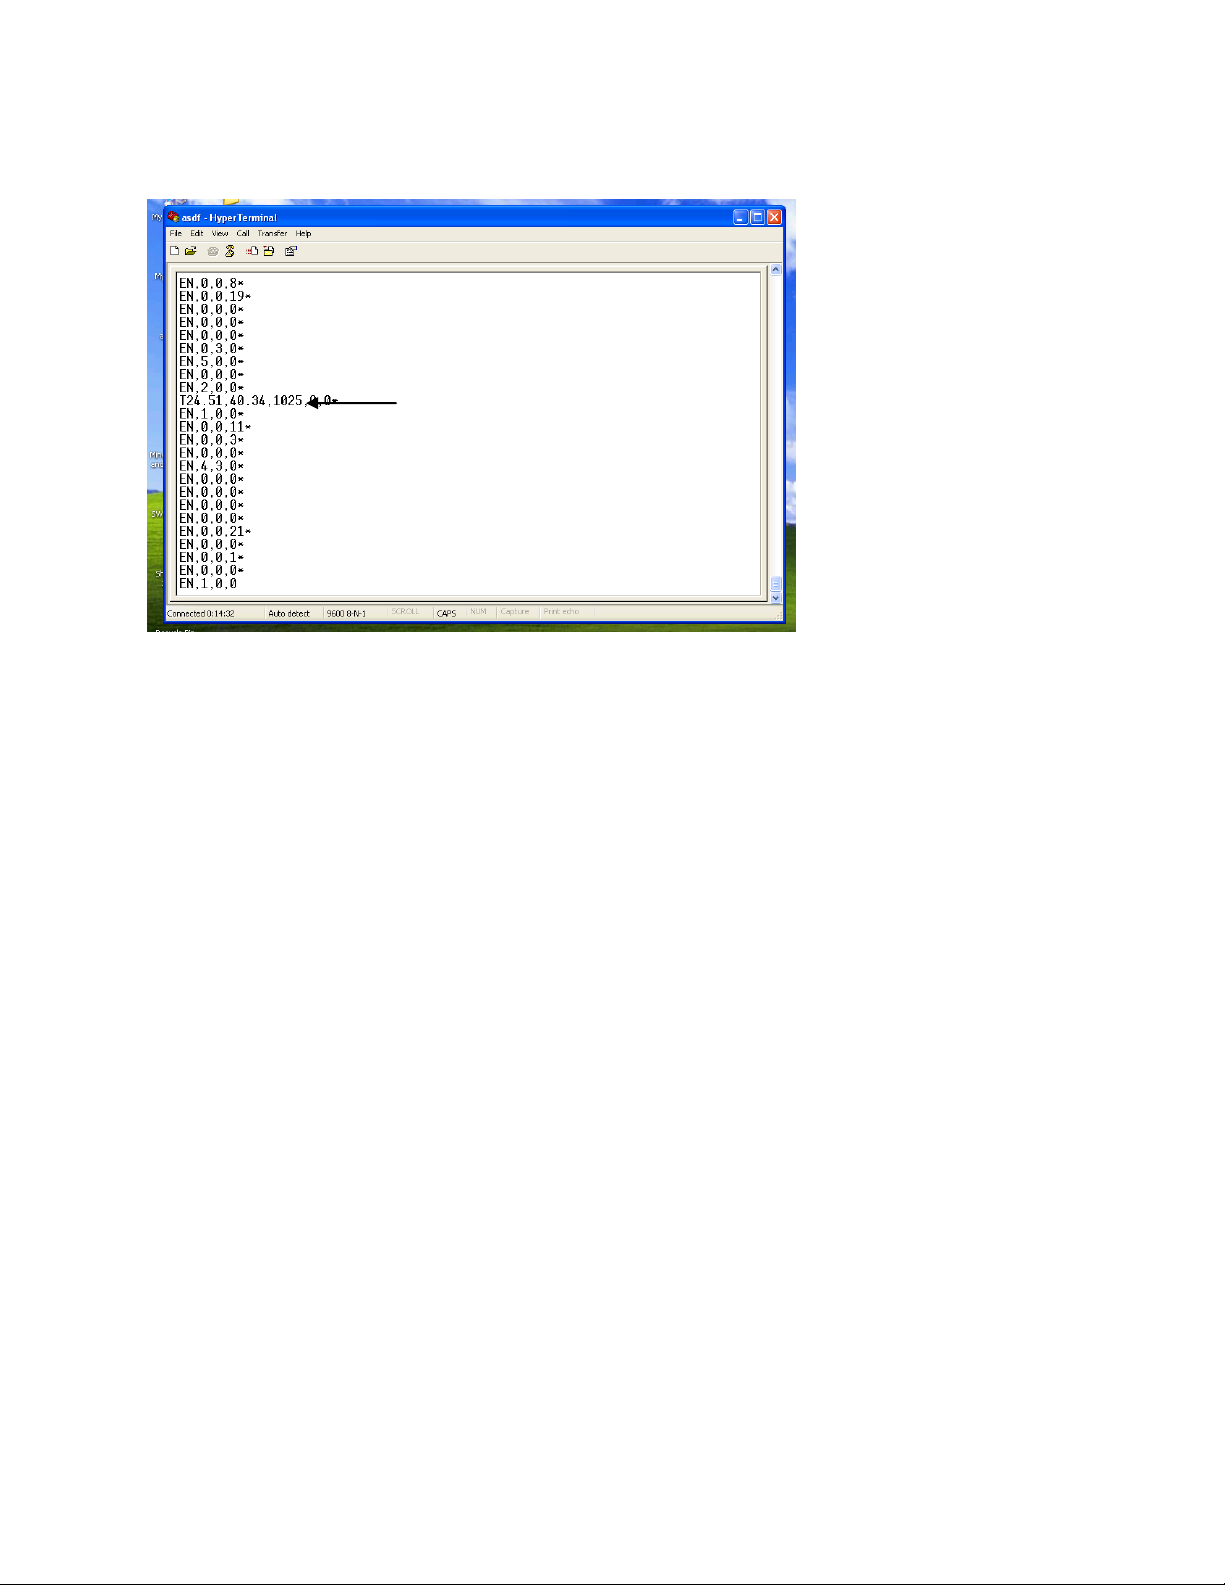
This number is the steps of the
shutter. In this example it is 1025
Step 4:
Type ”S” (data should start streaming); EN etc
Figure 9
Step 5:
Type “R” and wait 10 seconds; ER etc should appear.
Step 6:
Type “D” and wait 10 seconds; ED etc should appear.
Step 7:
Type “N” and wait 10 seconds; EN etc should appear.
Step 8:
Repeat steps 5-7 again
Step 9:
Plug lamp cable back in
Step 10:
Repeat steps 5-7 twice
Step 11:
Check the value of steps the shutter moved (see picture above)
If 1025 plus or minus 5 is shown here then there is no problem and the shutter is
moving fine. If 1101 shown then the proximity sensor needs to be checked and reset.
This will require repair from Veris. If 0 is shown then the shutter is not moving/binding.
This will require repair from Veris. If any other value is shown then repeat steps 5-7
again to see if the shutter will move to its 1025 steps
5-11
Page 65

Pub# OM17-NIR Shank
Figure 11
Procedure 4 - Troubleshooting NIRS with HyperTerminal
If auxiliary data fails to come in properly, then the port and device can be verified
outside of the software by utilizing the HyperTerminal. If the port works properly here
then the data should be present in the Veris Operating software. If the ports fail to open
or does not have any data present then check the physical connections to the auxiliary
box, unplug the USB cords, shut down the system, and restart the computer, then check
for the auxiliary data again.
How to open HyperTerminal
o On MS Windows 2000 or XP machine
o Start Programs Accessories Communications HyperTerminal
o Enter name of connection ex. com3@9600
o Click OK
Figure 10
o Select the correct com port from the connect using option.
o Click OK
5-12
Page 66
o Enter com port properties for your device. See the Port Properties
section for the standard settings.
Figure 12
o Click OK
o HyperTerminal session now open and data should be present. See Port
Definitions for example HyperTerminal data.
.
Port Properties
o Temperature Port
Bits per second: 9600
Data bits: 8
Parity: None
Stop bits: 1
Flow control: None
o GPS
Bits per second: 4800
Data bits: 8
Parity: None
Stop bits: 1
Flow control: None
Pub# OM17-NIR Shank
5-13
Page 67

o Control Port
Bits per second: 9600
Data bits: 8
Parity: None
Stop bits: 1
Flow control: None
o Spectrometer Port
Bits per second: 9600
Data bits: 8
Parity: None
Stop bits: 1
Flow control: none
Port Definitions
o Temperature Port – Reads in soil temperature.
Pub# OM17-NIR Shank
Example of temperature port connected in HyperTerminal
o GPS Port – Reads in GPS coordinates.
Example of GPS port connected in HyperTerminal.
o Control Port – Reads in EC, shutter position, Auxiliary case temperature
and humidity, and shutter steps. After opening this port if no data is
present type S for shank mode or P for probe mode. The letter after E
represents the shutter state. In the case below the shutter is in neutral or
rest. If the case reads R the shutter is in reference or if there is a D the
shutter is in dark. To manually move the shutter type N for neutral, then R
for reference, then D for dark. The shutter can only be moved in this
order.
5-14
Page 68

Example of Control Port in shank mode connected in HyperTerminal.
How to read control port data strings
Shank Mode
E shutter position, current, voltage deep, voltage shallow *
T temperature, humidity, shutter steps, 0, 0*
o Spectrometer Port – Reads in Spectrometer temperature and humidity,
side box temperature, cooler state, and spectrometer cooler state.
Pub# OM17-NIR Shank
5-15
Page 69

Pub# OM17-NIR Shank
Use a flat head screwdriver to
remove fuse
Procedure #5 - Fuse replacement
There are two fuses inside the spectrometer case and one inside the auxiliary case. To
locate and replace these fuses, follow these steps. First remove the cases see
procedure #6
Spectrometer case fuses
The first fuse is on the side control box. This is a four-amp fuse, which protects the
power to the Hamamatsu spectrometer as well as the internal microcontroller. To locate
this fuse take off the six screws securing the mounting plate on the side of the box.
Figure 13
Internal wiring of the spectrometer case control box
Figure 14
Fuse and fuse holder once removed
The other fuse is located inside the spectrometer case underneath the mounting shelf.
This fuse protects the power to the Edgeport hub, which sends data out through the
USB port.
5-16
Page 70
Pub# OM17-NIR Shank
Edgeport hub
Ocean Optics USB4000
spectrometer
Silica gel packet
used to remove
moisture in the air.
Note: If humidity in
spectrometer case
is above 90% this
packet needs to be
replaced.
Fiber optic cable
USB output cable
Figure 15
Inside view of spectrometer case mounting shelf
To reach the fuse for the Edgeport first disconnect the fiber optic cable to the USB4000,
then disconnect the USB output cable.
Figures 16 and 17
Once the fiber optic cable and the USB output cable have been disconnected, the shelf
can be tilted up and the case will be exposed.
5-17
Page 71

Edgeport hub
power board, also
the temperature
and humidity
readings are
monitored from
this board
Fuse can be removed using
screwdriver. Replace only with
3-amp fuse.
Figure 18
Spectrometer case mounting shelf tilted back.
Pub# OM17-NIR Shank
Figure 19
5-18
Page 72

Pub# OM17-NIR Shank
Fuse holder. Replace only with a
4-amp fuse.
The fuse for the auxiliary case protects the voltage for the electrical conductivity board
and the lamp. To replace the fuse open the case and locate the black fuse holder
Figure 20
Internal wiring of auxiliary case
5-19
Page 73

Pub# OM17-NIR Shank
Connect negative lead from
voltmeter here (brown wire)
Connect the positive
lead from the voltmeter
here (white wire)
Voltage should read 5V, as
long as spectrometer case is
within temperature range.
Procedure #6 - Checking Spectrometer Input Voltage and Hamamatsu Voltage
Figure 21
5-20
Page 74

Pub# OM17-NIR Shank
Procedure #7 Replacing halogen lamp
1. Remove the shank from the implement following procedure on page 4-11
2. Remove the top plate on the shank by unscrewing four screws
Figure 22
USE CAUTION WHEN HANDLING TOP COVER! TOO MUCH MOVEMENT
CAN FLEX AND BREAK THE FIBER OPTIC CABLE.
3. Using a 3/32 hex wrench loosen the set screw holding in the lamp housing.
Figure 23
5-21
Page 75
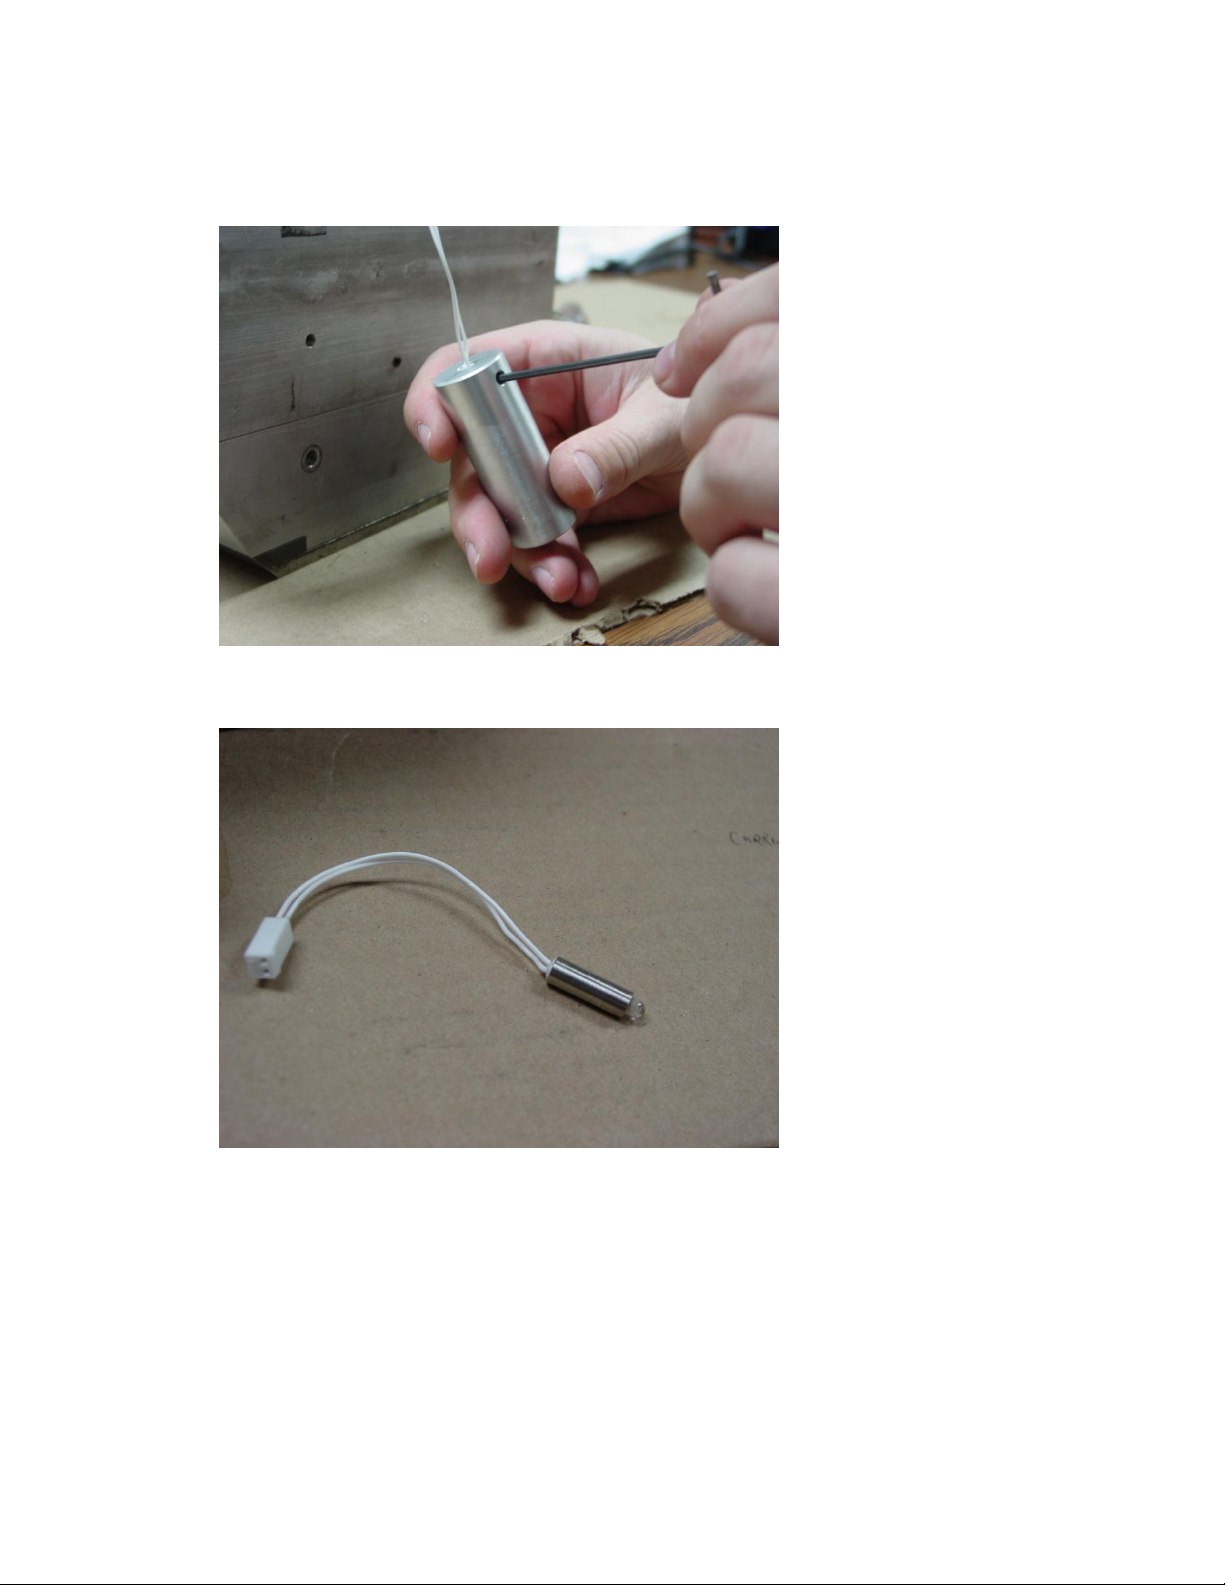
Pub# OM17-NIR Shank
4. Now remove the housing, use a 3/32 hex wrench to loosen the set screw holding
in the lamp.
Figure 24
5. Disconnect the lamp and replace with a new lamp
Figure 25
Handle the lamp with care. Make sure not to touch the bulb itself. The bulb can
fair prematurely if oils are on the bulb. Bulb can be cleaned with alcohol if
touched.
6. Reassemble the shank following the same steps used for disassembly.
5-22
Page 76

Pub# OM17-NIR Shank
Number
Name
Description
0
UTC
Universal Time Coordinated hhmmss.cc
hh = hours, mm = minutes, ss = seconds,
cc = hundredths of seconds
1
Long
GPS Longitude
2
Lat
GPS Latitude
3
Alt
GPS Altitude
4
Speed
Speed (Km/h)
5 I Current used to calculate EC data
6
Vsh
Voltage shallow
7
Vdp
Voltage deep
8
Soil temp
Soil temp
9
X/force
Spare for Shank mode or force for probe mode
10 Y Spare
11
Z/depth
Spare for Shank mode or depth for probe mode
12
Spec temp
Spectrometer case temperature
13
Side temp
Side control box on spectrometer temperature
14
Spec hum.
Spectrometer case humidity
15
Aux temp
Auxiliary temperature
16
Aux hum.
Auxiliary humidity
17
Steps
Steps shank moves during dark/reference check
All temperatures are
in degrees C.
Shank steps should
be 5.2 cm within +.03 cm. If no data is
present for an
auxiliary data item a
–1.50 will be output.
Glossary
Spectrophotometer – A complete system for making spectral measurements. The
system includes a light source, means for collecting light that has interacted with the
material under test, and a spectrometer to measure the collected light.
Spectrometer – Instrument to measure the quantity of light over a spectrum of
wavelengths. The spectrometer is the "measurement engine" of the spectrophotometer.
Auxiliary Data (in system check and acquisition)
Program state – Indicates the current program state. This can either be REST, DARK,
REF, SAMPLE, or LOG.
REST – System can either LOG data or SAMPLE data.
DARK – Shank cuts off light from the spectrometers and stores a dark spectrum.
REF – Shank moves reference material in front of window and stores a ref
spectrum.
SAMPLE – Program is storing spectrum data for material placed under shank
window.
LOG – Program is logging field data this includes spectrum data and auxiliary
data.
5-23
Page 77

Pub# OM17-NIR Shank
Field Auxiliary output definitions
EC_Sh – Electrical conductivity shallow.
EC_Dp - Electrical conductivity deep.
Temp – Soil temperature
Spec_T – Spectrometer case temperature
Ctrl_T – Control box temperature (this is the metal box on the side of the spectrometer
case)
Spec_H – Spectrometer case humidity
Aux_Te – Auxiliary case temperature
Aux_Hu – Auxiliary case humidity
Specifications
Max ambient temperature to operate system: 110 degrees F
Max spectrometer case temperature: 30 degrees C
Max spectrometer case humidity: 90% RH
If spectrometer case humidity reaches this point, the silica packet inside
spectrometer case needs to be replaced.
Max side case (control box) temperature: 65 degrees C
Max aux case temperature: 65 degrees C
Max aux case humidity: 90% RH
Field Files Description
acquisition_samples_*.txt Transformed samples in absorbance
taken during acquisition.
Figure 22
The first column represents the sample number, except for the first value of –4, which
indicates that the row is the spectrometer wavelength values. There will be a total of
384 wavelength values, which also represents the number of columns in each sample
file. In this example a total of three samples were taken, for each wavelength there is
an absorbance value, so for sample 1 at wavelength 348.84732 the absorbance was
.8793300.
master_veris_standards.txt External reference data in reflectance
standardized against Avian grayscales.
(provided by Veris)
external_reference_*.txt Untransformed external reference data
in reflectance taken during system
check.
5-24
Page 78

Pub# OM17-NIR Shank
xform_*.txt Transform created by comparing
master_veris_standards and latest
xternal_reference files.
raw_spectra_*.bytestream Field data taken in compact bytestream
format. Note: Each time system check
is ran a new .bytestream file and
xform.txt file will be created. Once
system check has been completed
successfully, then the .bytestream
file will automatically be appended to
if acquisition is stopped and started
again later.
field spectra.txt Auxiliary sensor data and field data in
absorbance extracted and transformed.
The first 17 columns of the field spectra file represent the auxiliary sensor data (see
glossary for definition), each is labeled by a header, following the header is the
wavelength values. The next 384 columns are the absorbance data at each wavelength.
A value of –1 represents no data was present at that time.
cleaned field spectra.txt Filtered field spectra.
loadings.txt Principal components loadings.
PC_scores.txt Principal component scores.
interp_PC scores.txt Interpolated PC scores.
proposed_locations.txt Proposed sample locations
based on clustering.
actual_locations.txt Actual locations stored during
sampling program.
spectra@locations.txt Interpolated spectra and auxiliary
data at actual locations.
5-25
Page 79

Pub# OM17-NIR Shank
The P_Sample, P_Long, P_Lat, P_Depth are the actual sample number, longitude,
latitude, and depth. The # Spec refers to the number of spectra found near each sample
location. These are the locations that were selected in the sampling program. The
depth is only used in the probe mode. The next 17 columns are the interpolated data
found near each of those actual locations. Then the next 384 columns are the
interpolated spectra data found near each of the actual locations.
Settings Folder
These files are used to store values and paths for the Operating software. These files
are automatically created and should not be altered.
boolean.txt Stores steps of Operating
software.
configuration.txt Stores aux data length and
spectrum length.
spectra path.txt Stores spectra path.
xform path.txt Stores xform path.
5-26
Page 80

Pub# OM17-NIR Shank
Program Modifications
The files in the C:\Veris directory are used to store configuration settings for the Veris
Operating software. These are set to default values, but can be changed.
Veris directory files Description
acq_settings.txt Stores acquisition settings, these
can be configured by the user.
Ex. 0.010 19.000 5.000 15.000 0.150 0.150 0.300 0.150 2.000
These values represent the following controls in this order:
Reference check tolerance
Hamamatsu integration time (ms)
Seconds of data to average
Ocean Optics integration time (ms)
External reference #1 max allowed RMSE
External reference #2 max allowed RMSE
External reference #3 max allowed RMSE
External reference #4 max allowed RMSE
GPS Quality Factor (2 = DGPS 1 = GPS 0 = No GPS)
cluster settings.txt Stores cluster settings, which can be
configured by the user
Ex. 3 15
These values represent the following controls in this order:
Number of principal components to use
Number of clusters
interpolation.txt Stores interpolation settings, which can
be configured by the user.
Ex. 0.100 1.000 2.000 1.000 15.000 0.000 3.000
These values represent the following controls in this order:
Depth increments (probe mode only)
Sample points longitude column
Sample points latitude column
Spectra latitude column
5-27
Page 81

Pub# OM17-NIR Shank
Spectra depth column (probe mode only)
ports.txt Stores ports and baud rates from
previous time system was run.
ref_wavelengths.txt Stores values of the useable
wavelengths for each spectrometer,
which can be configured by the user.
These wavelengths will be
used to filter the data.
Ex. 450.000 950.000 1150.000 2150.000
These values represent the following controls in this order:
Ocean Optics minimum usable wavelength
Ocean Optics maximum usable wavelength
Hamamatsu minimum usable wavelength
Hamamatsu maximum usable wavelength
shank_xform.txt Stores latest transform.
wlc_*.txt Stores Hamamatsu calibration
coefficients these are provided by Veris.
xform_settings Stores settings for creating transforms,
which the user can configure.
Ex. .075
This value represents the maximum allowed RMSE, when comparing the previous
transform to the current transform.
5-28
 Loading...