

Verabar
®
Velocity Averaging
Flow Sensors
True Performance in
Flow Measurement
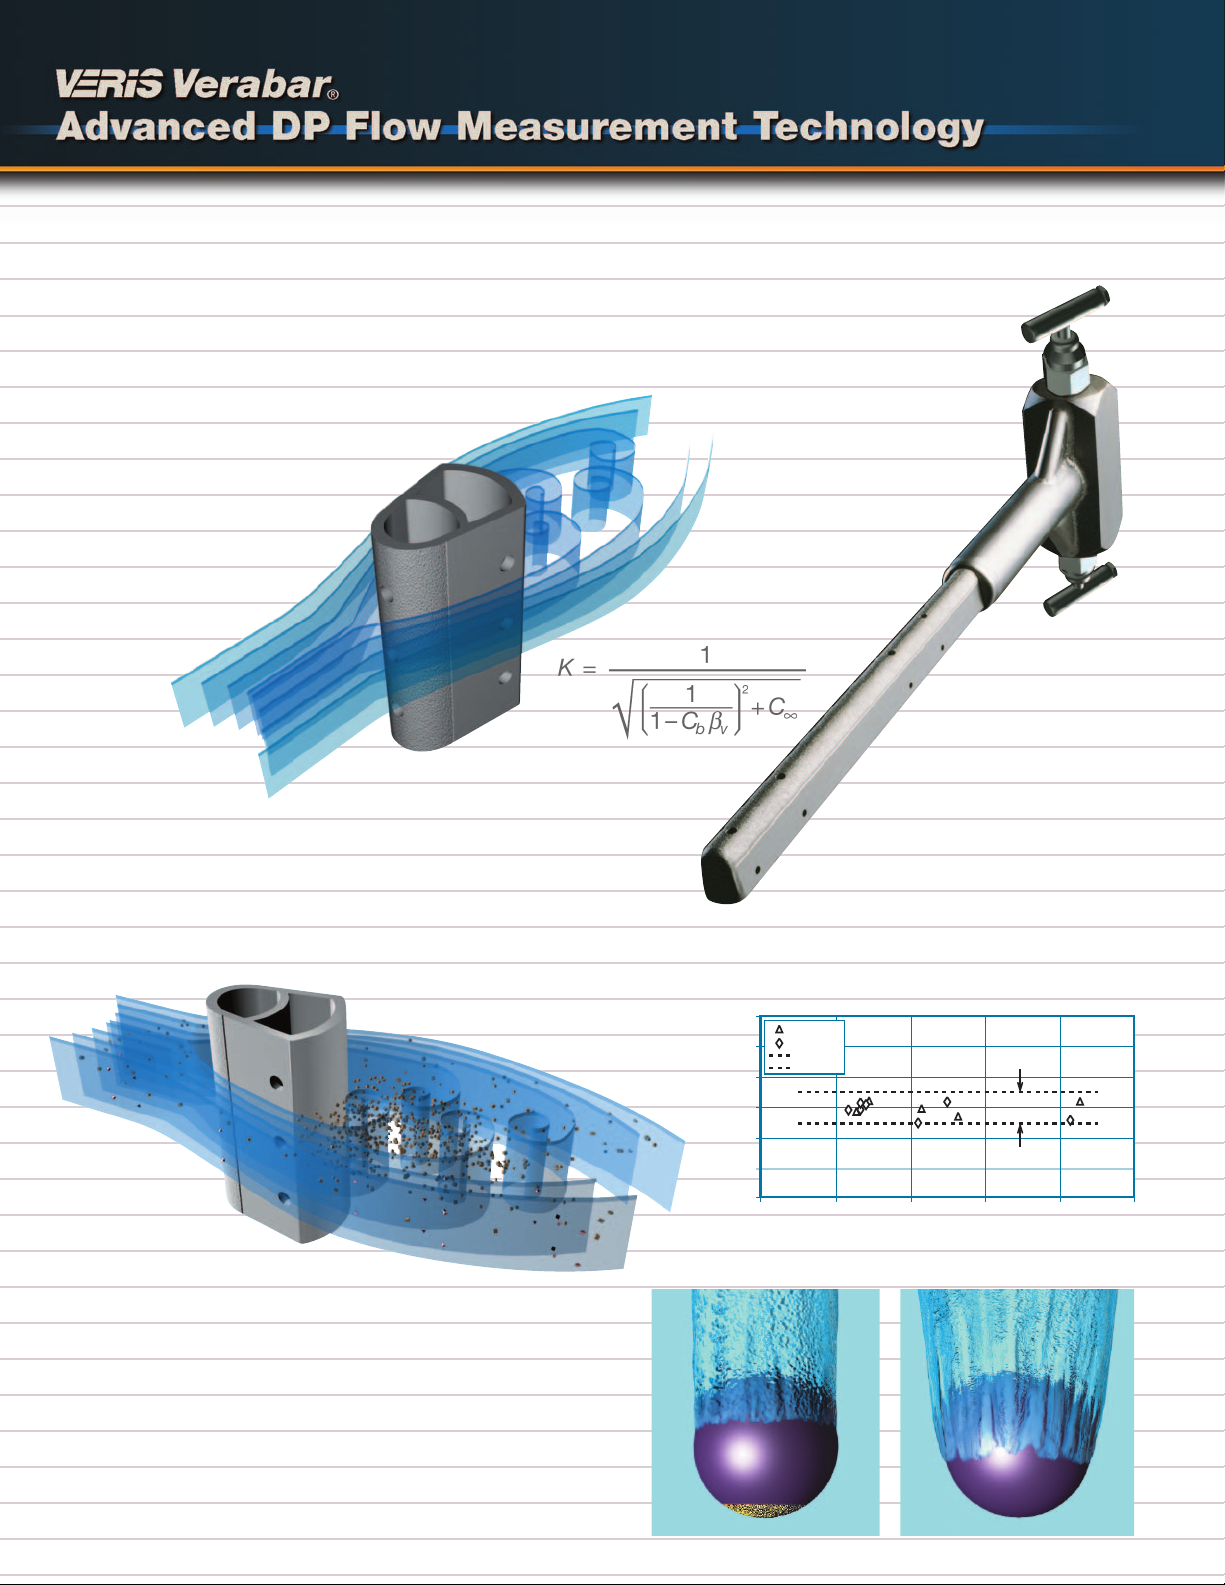
Superior Signal Stability
and Greater Resistance to Clogging
Clogging can occur in low pressure ports located in or near the partial vacuum
at the rear of the sensor. The Verabar design locates the low pressure ports
on the sides of the sensor, forward of the fluid
separation point and turbulent wake
area. This virtually eliminates clogging
and produces an extremely
stable signal.
Rough Surface Smooth Surface
± 1/2 Percent
3%
2%
1%
0%
-1%
-2%
-3%
0% 5% 10% 15% 20% 25%
Percent Blockage
Percent Deviation from the Published K
Air Tests
Water Tests
0.5 Percent
Error Band
Lower Drag and Extended Turndown
Golf balls fly farther because they have a dimpled surface
that lowers aerodynamic drag.
The grooves and roughness on the Verabar’s frontal surface
apply the same principle. This simple design feature relieves the
partial vacuum at the rear of the sensor, reducing the pressure drag.
This extends the accuracy and rangeability to very low velocities.
The Most Accurate and Reliable
Technology for Measuring Gas, Liquid
and Steam
Developed from aerospace technology, the
Verabar averaging pitot flow sensor provides
unsurpassed accuracy and reliability.
With its solid one-piece construction
and bullet shape, the Verabar
makes flow measurement
clog-free and precise.
The unique sensor shape
reduces drag and flow
induced vibration.
And the location
of the low
pressure
ports eliminates the
potential for clogging
and improves signal
stability.
Test Data Summary
From Veris Research…True Performance in DP Flow Measurement
In God We Trust…
All Others Bring Data
The unique and exclusive breakthrough in improved accuracy
derived from the development of
a verified theoretical model
predicts the Verabar flow
coefficients. This elimi-
nates the need for
calibration tests to
characterize the
flow coefficients.
Without such a model,
the uncertainty of the flow
coefficients is dramatically
increased and expensive
calibration may be required.
Empirical test data from indepen-
dent laboratories verified the theore-
tical model and flow coefficients as a
constant, independent of Reynolds number
and within ±0.5% of the predicted value. The
derivation of the theoretical model and test data
is published in the Verabar Flow Test Report (ED-100).

Unique Valve Head
Verabar offers a new concept…
built-in valves in the head of the
instrument.
This superior design:
• Simplifies installation and
maintenance.
• Lowers the
connecting
hardware
cost by
reducing the
number of
fittings.
Transmount
A Transmount flow system
is the first choice for all
liquids; and for gas and
steam applications, with
slight variations in pressure
and temperature.
Mass
Transmount
A Mass Transmount flow
system should be selected on
steam and gas applications
with variable temperature
and pressure.
Field Flow
Systems
Ready to install, the
Verabar can be ordered
with a manifold, transmitter
or local indicating
meter.
The Proof of Verabar Accuracy
Accurate Flow Coefficients
The true test of a flow measurement device is its ability
to repeat its published flow coefficient within its accuracy
band.
Verabar
has been
thoroughly
tested at
independent
flow laboratories
(all sensor sizes, in
multiple pipe sizes,
in gas and liquids).
Spring-Lock
Complete
Installation
in Less than
an Hour
Partial Insert
• Designed specifically for
high velocity cooling water
applications, large diameter
pipes, large vertical stacks
and buried water lines
• Extends 1/3 into pipe to
reduce procurement
and installation
costs— specifically
useful when a
hot tap is required
• Partial Insert hot
tap sensors can be
inserted/retracted with
no reduction in flow rate
Spring-Lock…
Offers a Superior Mounting
Method
This advanced, patented design ensures
the sensor remains sealed, locked and
pre-loaded to the opposite wall regardless
of changes in pipe diameter due to pressure, temperature or mechanical force.
This design has important advantages:
• Fugitive emission and leak prevention…
The Spring-Lock continually compensates for the differential in packing and
body growth rates due to increased
temperature.
• Increases sensor strength,
thereby eliminating the
need for an opposite wall
support. A locked, preloaded sensor is four
times stronger than
a non-preloaded,
cantilevered sensor.
• Other mounting methods
do not pre-load the sensor
or the packing seal and are subject to
increased sensor vibration, metal fatigue,
breakage and leakage.
0.74
.073
0.72
0.71
K 0.70
0.69
0.68
0.67
0.66
0 5 10 15 20 25
Velocity (fps)
Test Location: Utah water Research Laboratory
Test Data: November 13, 1991
Fluid: Water at 60 deg F
Meter Size: 6 inch, Schd 40, -10
Serial No: V1000.05.1
±1.0%
Visual load
indicator
Spring
travel
Compensates for
changes in pipe
diameter
Actual Flow Test

The Verabar offers the widest application range
of any flow sensor. It accurately measures gas, liquid
and steam.
High Pressure Design
2500# ANSI Class
6000PSI and 1000ºF
The Verabar’s versatile design lends itself to
a wide range of applications. Contact Veris
application engineering for
your special requirements.
Square and
Rectangular Ducts
Large Stacks and Ducts
Up to 21 feet
(6 meters)
Specialized Mounting
• PVC • Concrete
• FRP • Cast Iron Pipe
Regular Models — (Threaded Components)
Model Number Type of Mounting
Tube Fitting
V100 (Single Support)
V110 (Double Support)
Spring-Lock
V150 (No opposite
support required)
Hot Tap Models — (Threaded Components)
Screw Drive
V200
Low Pressure
Hand Insertion
V250
Hot Tap Models — (Flanged Components)
Model Number Type of Mounting
Screw Drive
V400
Low Pressure
Hand Insertion
V450
Flanged Models — (Flanged Components)
Flanged
V500 (Single Support)
V510 (Double Support)
Flanged Spring-Lock
V550 (No opposite
support required)
V100
Verabar Model Selector
Verabar Applications
V110 V150
V500 V510 V550
V200 V250
V400 V450
Gas Liquid Steam
Natural Gas Cooling/Chilled water Saturated
Compressed Air Boiler Feed Water Superheated
Combustion Air De-Mineralized Water Main Header
Hydrocarbon Gas Hydrocarbon Liquids Custody Transfer
Hot Air Cryogenic Distribution
Blast Furnace Gas Thermal Transfer Fluids Energy Studies
Extended Range Applications
Fast and Easy Model Selection
The easy-to-operate Veracalc computer program features:
• Flow Calculations: DP from flow rate, or flow rate from DP.
• Model Selection: Complete model selection from drop down menus.
• Structural Analysis: Verifies sensor strength at flowing conditions.
• Temperature and Pressure Limits: Error warnings if limits are exceeded.
The Veracalc PC program is available from your local representative,
the factory or it can be downloaded from our website at www.veris-inc.com.

Verabar Lowers Installed
Costs
Verabar can save you more than 60%
in installation costs over an orifice
plate in a 10” pipe.
The graph shows the total installed
cost by pipe size of the orifice plate,
the Verabar, and the resultant Verabar
savings. The most significant portion
of the savings is the reduction in the
linear inches of weld.
Savings in Weld Time Installed Cost Savings
Verabar Has the Lowest
Operating Costs
Verabar pays for itself in less than
a year.
The graph shows the yearly operating
cost savings and equivalent horsepower
savings of the non-constricting, low
permanent pressure loss Verabar
compared to the extremely constricting,
high permanent pressure loss orifice
plate. Savings are shown for gases,
liquids and steam— at typical design
velocities, by pipe size.
Verabar vs. Orifice Operating Cost Savings
Through Accuracy of Measurement, Low Installed and Operating Costs,
Verabar Proves Its Performance, Efficiency and Value.
Verabar Maintains Its
Accuracy
Orifice plates show long term
deterioration of accuracy.
The initial accuracy of the orifice
plate is ±1%. However, long term
accuracy deteriorates unless the plate
is periodically inspected. Senior, dual
chamber fittings are available to check
the plate without requiring system
shutdown, but such fittings are very
expensive.
Condition % Deviation
Wear of knife edge:
0.010” -2.2
0.020” -4.5
0.050” -13.1
Dirt and grease
deposits in pipe -11.1
Valve lubrication upstream:
one side of plate -15.8
both sides -24.0
Leaks around plate -8.2
Plate warpage -9.6
Orifice Plate Test Results
Florida Gas Transmission Company
conducted a test to quantify various
conditions which can result in inaccurate measurement. A partial list of the
results is shown:
Pipe Size (Inches)
10 20 30 40 48
$ 1,000
$ 500
$ 10,000
$ 5,000
$ 100,000
$ 50,000
Dollar
Savings
Verabar Installed Cost
Orifice
Installed Cost
Verabar Installed
Cost Savings
Natural Gas
Steam
Air
Horsepower
Savings @
$ 0.05/KWH
300
200
100
50
10
5
1
Pipe Size (Inches)
10 20 30 40 48
$ 1,000
$ 500
$ 10,000
$ 5,000
$ 100,000
$ 50,000
Dollar
Savings
Liquids
Valve lubr. (-24%)
Warpage (-9,6%)
63 inches
of linear welding
Only 4 inches
of linear welding
Wear (-13.1%)
Dirt & grease (-11.1%)
Leaks (-8.2%)
$
$
$
$
$
$
$
$
$
$
$
$
$
$
$
$

Aerodynamic-Shaped Sensors
Extreme aerodynamic shapes that
permit the stream lines to reattach are
subject to airfoil type lift forces. This
occurs when
the angle of
attack varies
due to sensor
misalignment,
or the direction
of the fluid
varies, as is
common in
industrial piping
with upstream
disturbances.
Result:
The lift forces
can cause an
unpredictable
shift in the low
pressure distribution, producing
inaccurate measurement.
Quality Assurance
Veris manufactures its own leak-proof,
solid one-piece sensor. Our primary
goal is to provide the highest quality
and most accurate sensor in the
industry.
This can result in a significant undetectable loss in accuracy.
Verabar is designed to meet or exceed
applicable ANSI and ASME codes.
The Verabar is available to meet
B31.1,
B31.3, B31.8, NACE MR-01-75, etc.
Additional QA capabilities include
code welding, hydrostatic and other
non-destructive testing.
Why Average the Velocity
Profile?
Verabar averages the velocity profile
through multi-sensing ports which span
the entire pipe diameter. Other types of
non-averaging insert meters are SINGLE
POINT INSERT METERS (turbine, vortex,
magnetic, sonic, etc.). They assume a
“textbook: turbulent velocity profile, and
use a single “critical” point to infer an
average velocity. In actual industrial applications, sensors are located downstream
of disturbances, such as elbows or valves,
which produce non-uniform velocity profiles. This makes it virtually impossible to
locate a single point that represents the
average velocity.
Result: Inaccuracy ranging from ±10%
to ±20%.
Round Sensors
Round sensors produce unpredictable
accuracy. The original round sensors
were designed for economical fluid
balancing and did
not meet industrial
demands for
accuracy. Round
sensors have
a variable fluid
separation point
that causes an
unstable low
pressure distribution around
the sensor.
Result:
Inaccuracy in
excess of ±5%
and as high
as ±10%.
ISO 9001 Certified
Problems with Other Sensor Shapes
Diamond and T-Shaped Sensors
These sensors produce pulsating, noisy
signals. They improved accuracy by use
of a sharp edge to fix the
fluid’s separation
point. However,
this greatly
amplified the
vortex shedding
forces.
Result:
The sharp
edges generate
extreme vortices,
causing sensor
vibration, pulsations and a noisy
signal to the point
that transmitter
dampening and
signal averaging
are recommended.
Other manufacturers use a three-piece
sensor design that has no positive
mechanical method of maintaining
a seal between the tubes. Therefore,
temperature, pressure, vibration and
even manufacturing variations can
cause leakage between the chambers.
HL
HL
Verabar Round T-shaped
sensor sensor sensor
Textbook
profile
Actual profiles
Other
Verabar
Flow
Flow
Flow
Flow
Lift forces
Flow
Flow
Fixed separation
point
Variable separation
point
Control valve
Elbow
Low
Reynolds
Number
Location of average velocity
6315 Monarch Park Place •Niwot, CO 80503 USA •Phone: 303-652-8550 •Fax: 303-652-8552 VB-100 (2/09)
E-Mail: contact@veris-inc.com •Website: www.veris-inc.com Printed in USA
Verabar…True Performance in Flow Measurement
⎫
⎪
⎬
⎪
⎭
H L H L H
L
L
 Loading...