

Page 1

WANsuite® 7105
Reference Manual
February 2003
34-00316.C
i
Page 2

Copyright Notice Copyright © 2002 Verilink Corporation. All rights reserved. No part of this publication may be
reproduced, transmitted, transcribed, stored in a retrieval system, or translated into any language
in any form by any means without the written permission of Verilink.
Manual Reorder # 34-00316.C
February 2003
Trademarks Verilink
®
and WANsuite® are registered trademarks of the Verilink Corporation. FrameStart™
and ServiceAware™ are trademarks of the Verilink Cor poration.
All other brand and product names used herein are trademarks or registered trademarks of their
respective manu facturers.
Documentation Disclaimer
This document does not create any express or implied warranty about Verilink or about its products or services. Verilink’s sole warranty is contained in its product warranty. The end-user documentation is shipped with Verilink’s products and constitutes the sole specifications referred to
in the pro duc t war ran ty. Ve rili nk ha s ma de reas ona ble effor ts to ve rify tha t the in for mat ion contained herein is accurate, but Verilink assumes no responsibility for its use or for any infringement of patents or other rights of third parties that may result. The customer is solely
responsible for verifying the suitability of Verilink’s products for its use. Specifications are subject to change without notice.
Warranty Verilink's produ ct warranty is included at the back of this document. FCC Requirements This equipment has been tested and found to comply with the limits for a Class A digital device,
pursuant to Part 15 of FCC Rules. These limits are designed to provide reasonable protection
against harmful interference when the equipment is operated in a commercial environment. This
equipment generates, uses, and can radiate radio frequency energy and if not installed and used
in accordance with the instruction manual, may cause harmful interference to radio communications. O per atio n of t his e qui pmen t in a r esid ent ial a rea i s like ly to cau se ha rm ful int er fere nce in
which case the user is required to correct the interference at his own expense. This device must
also acc ept any interference received, including interference that may cause undesired operation.
WARNING: For use only with a certified Class 2 power supply. See “Power Source” in
“Appendix A, Specifications.”
WARNING: Changes or modifications to this unit not expressly approved by the party
responsible for compliance could void the user’s authority to operate the
equipment.
ii WANsuite 7105
This equipment complies with Part 68 of the FCC Rules. On the rear or bottom of the unit is a
label that contains the FCC registration number and other information. If requested, provide this
information to the telephone company.
1 All direct connections to the network lines must be made using standard plugs and jacks
(compliant with Part 68). The table below presents a list of applicable registration jack
USOCs, facility interface codes (FICs), and service order codes (SOCs). These are required
when ordering service from the telco.
Port ID REN/SOC FIC USOC
1.544 Mbps SF
1.544 Mbps SF, B8ZS
1.544 Mbps ANSI ESF
1.544 Mbps ANSI ESF, B8ZS
2 If the unit appears to be malfunctioning, it should be disconnected from the network lines
until the source of trouble is determined to be your equipment or the telephone line. If your
equipment needs repair, it should not be reconnected until it is repaired.
6.0F 04DU9-BN
RJ-48C jack
04DU9-DN
04DU9-1KN
04DU9 -1SN
Page 3

3 The unit has been designed to prevent harm to the network. If the telephone company finds
that the equipment is exceeding tolerable parameters, it can temporarily disconnect service.
In this case, the telephone company will give you advance notice, if possible.
4 No cust omer is author ized to repair this eq uipmen t, rega rdles s of wa rranty statu s.
5 If the telephone company alters its equipment in a manner that will affect the use of this
device, it must give you warning so that you have the opportunity for uninterrupted service.
You will be advised of your right to file a complaint with the FCC.
6 If the equipment malfunctions, all repairs should be performed by our company or an
authorized agent. It is the responsibility of users requiring service to report the need for
service to our company or to one of our authorized agents.
Industry Ca nada Certified Equipment Label
The Industry Canada label identifies certified equipment. This certification means that the
equipment meets certain telecommunications network protective, operational, and safety
requirements. The Industry Canada does not guarantee the equipment will operate to the user’s
satisfaction.
Before installing this equipment, users should ensure that it is permissible to be connected to the
facili ties of th e lo cal tele com mun icat ion s co mp any. The eq uip me nt mu st also be inst alle d us ing
an acceptable method of connection. In some cases, the compa ny’s inside wiring associated w ith
a single line individual service may be extended by means of a certified connector assembly
(telephone extension cord). The customer should be aware that compliance with the above conditions m ay not prevent degradation of service i n som e situati ons.
Repairs to certified equipment should be coordinated by a representative designated by the supplier. Any repairs or alterations made by the user to this equipment, or equipment malfunctions,
may give the telecommunications company cause to request the user to disconnect the equipment.
Users should ensure for their own protection that the electrical ground connections of the power
utility, telephone lines, and internal metallic water pipe system, if present, are connected
together. This precautio n ma y be particularly important in rur al areas.
CAUTION: Users should not attempt to make such connections themselves, but
should contact the appropriate electric inspection authority, or
electrician, as appropriate.
NOTICE: The Ringer Equivalence Number (REN) assigned to each terminal
device provides an indication of the maximum number of terminals
allowed to be connected to a telephone interface. The termination on
an interface may consist of any combination of devices subject only to
the requirement that the sum of the Ringer Equivalence Numbers of all
the devi ces do es not exceed five ( 5).
Canadian Emissions Requirements
This digital apparatus does not exceed the Class A limits for radio noise emissions from digital
apparatus set out in the Radio Interference Regulations of the Canadian Department of Communications.
Le présent appareil numérique n’émet pas de bruits radioélectriques dépassant les limites applicables aux appareils numériques (de la class A) prescrites dans le Règlement sur le brouillage
radioélectrique edicté par le ministère des Communications du Canada.
Safety P recauti ons When handling this equipment, follow these basic safety precautions to reduce the risk of elec-
tric shock and injury:
• Follow all warnings and instructions marked on the product and in the manual.
• Do not place this product on an unstable cart, stand, or table. It may fall, causing seri ous damage to
the product.
iii
Page 4

• Slots in the unit/rack are provided for ventilation to protect it from overheating. These openings must
not be blocked or covered. Never place this product near a radiator or heat register.
• This product should be operated only from the type of power source indicated on the marking label
and manual. If you are unsure of the type of power supply you are using, consult your dealer or local
power company.
• Do not allow anything to rest on the power cord. Do not locate this product where the cord interferes
with the free movement of people.
• Do not overload wall outlets and extension cords, as this can result in fire or electric shock.
• Never push objects of any kind into the unit. They may touch dangerous voltage points or short out
parts that could result in fire or electric shock. Never spill liquid of any kind on this equipment.
• Unplug the equipment from the wall outlet and refer servicing to qualified service personnel under the
following conditions:
• When the power supply cord or plug is damaged or frayed.
• If liquid has been spilled into the product.
• If the product has been exposed to rain or water.
• If the product has been dropped or if the housing has been damaged.
iv WANsuite 7105
Page 5

Table of Contents
Preface
Scope ..................................................................................................................................................... xi
Manual Organization ...................................................................................................................... xi
Typographic Conventions .............................................................................................................xii
Related Verilink Documents ................................................................................................................ xii
Customer Service and Technical Support .................... ............................ ........... .................... ............. xii
Support from Your Network Supplier ...........................................................................................xii
Support from Verilink ................... .................... .................... .................... .................................... xii
Telephone .............................................................................................................................. xiii
E-mail .................................................................................................................................... xiii
Intern et ..... ......... ....... ......... ......... ......... ....... ......... ......... ......... ....... ......... ......... ......... ............... xiii
Returning a Unit to Verilink ............................................................................................................... xiii
Chapter 1 About the WANsuite 7105
Introduction ......................................................................................................................................... 1-1
Features of the WANsuite 7105 . .................... .................... .................... ............................................ 1-3
Performance ................................................................................................................................. 1-3
Mini-D ac s . .... .. ..... .... ..... .. ..... .... ..... .. .... ..... .... ... .... ..... .... .. ..... .... ..... .. ..... .... ..... .. .... ..... .... ..................1-4
Automatic Protection Switching (APS) ....................................................................................... 1-4
Percent Utilization Reports ..........................................................................................................1-4
Test Access Jacks ......................................................................................................................... 1-4
SNMP Manage m e n t ..... .. .. ................ ....................... ............... ....................... ................ ............... 1-5
Embedded Web Server ................................................................................................................. 1-5
Optional Advanced Network Management .................................................................................. 1-5
About FrameStart Technology ........................................................................................................... 1-5
WANsuite 7105 Overview and Advantages ............ ........... .................... ..................................... .......1-6
Features Summary .............................................................................................................................. 1-7
Front Panel .......................................................................................................................................... 1-9
Local Supervisory Port ............................................................................................................... 1-10
Data Interface Module (Rear Panel) .................................................................................................1-11
10/100 Ethernet ........................... .................... .................... .................... .................... ...............1-11
Ethernet LED Indicators ...................................................................................................... 1-12
Serial Interfaces .......................................................................................................................... 1-12
Network Interfaces ..................................................................................................................... 1-12
Power Connection ............................................................................................................................. 1-13
Shelf U n i t Po w er Option s ....... .. ......... ................ ....................... ............... ....................... ........... 1-13
Power Failure ............................................................................................................................. 1-13
v
Page 6

Chapter 2 Installation
WANsuite 7105 Components ..................... .................... .................... .................... .................... ........2-1
Unpacking and Inspection .................................................................................................................2-1
Supplied Materials .......... ............................ .................... ........... ........... .................... .......................... 2-2
Configuring the Unit’s IP Address ..................................................................................................... 2-2
Installation Wizard ....................................................................................................................... 2-2
Chapter 3 Web Server Interface
Acces si n g th e W eb S erver In te rf a c e ... ......... ...................... ................ ...................... ................ ...........3-1
Layout of Interface Screens ......................................................................................................... 3-2
Unit Screen ................ ...................... ................ ....................... ............... ....................... ...................... 3-2
Interfaces .. .. .. ....................... ...................... ................ ....................... ............... .................................... 3-5
Network Screens ..........................................................................................................................3-5
Error Status and Alarm Thresholds Table ............................................................................. 3-8
Network APS Screen ........................................................................................................... 3-10
Network APS Status Table .................................................................................................. 3-11
Performance Screens ........................................................................................................... 3-13
Serial Screens ............................................................................................................................. 3-14
DTR Alarm Control and Status Table ................................................................................. 3-18
10/100 Ethernet Screen (IP Service Details) ..................... .................... .................... .................3-19
Supervisory Screen ..................................................................................................................... 3-21
DTR Alarm Control and Status Table ................................................................................. 3-22
Services Screen ................................................................................................................................. 3-22
Data L ine Monit o r Co n f i g u rat i on T ab l e ........ .. .. ................ ................ ...................... ................ .. 3-23
Adding a Ser v i ce ....... ......... ....................... ................ ...................... ................ ....................3-24
Service Detai ls Sc r e en ......... ............... ....................... ................ ...................... ........................... 3-25
Interface Det ai l s But t o n .... ................ ................ ...................... ....................... ............... .......3-26
Type Details Button .............................................................................................................3-26
Delet e Se r v ice Butto n ....... .. ... ...................... ................ ...................... ................ ..................3-26
DS0 Monitor Details Screen ......................................................................................................3-26
DS0 Sta t u s and A la r m T ab l e ....................... ....................... ............... ....................... ........... 3 -2 7
Frame Relay Service Details Screen .......................................................................................... 3-29
Status and A larms Ta b l e . ......... ...................... ................ ....................... ...................... ......... 3-33
SCADA Details Screen ................................ ....................................................... .......................3-36
PPP Service Details Screen ........................................................................................................ 3-37
Param e t ers T o N eg o t i a t e .... ... .. ...................... ................ ....................... ............... ................ 3-39
PPP Sta t i sti c s .. .. ... ............... ....................... ................ ...................... ................ .................... 3-40
PAP Table ............................................................................................................................ 3-41
CHAP Table ........................................................................................................................ 3-42
IP Serv i ce D et ai l s Screen .... .. ......... ................ ...................... ................ ...................... ................ 3-43
Applic ations ........ ....... ......... ......... ......... ....... ......... ......... ......... ...... ......... ......... ......... ......................... 3-43
Endpoint Table Screen ............................................................................................................... 3-43
Endpoint Details Screen ...................................................................................................... 3-44
Endpoint Service Details ..................................................................................................... 3-47
DLCI Details Screen ............................................................................................................3-47
vi WANsuite 7105
Page 7

Service Aware Screen ................................................................................................................ 3-52
Rule De t ai l s Screen ...... .. ......... ...................... ................ ....................... ...................... ......... 3-53
Traffic Meter Statistics Screen ............................................................................................ 3-54
SNMP D et a i l s Scr een . ............... ....................... ................ ...................... ....................... ............. 3-55
Diagnostics Screen .......... ........... ............................ .................... ........... .................... ................. 3-56
Test Details Screens .............................................................................................................3-57
Trap L og S c r een .... .. ................ ................ ...................... ....................... ................ ...................... 3-61
Top Talkers Screen .................................................................................................................... 3-61
IP Gateway Details Screen ......................................................................................................... 3-63
RIP Parameters .................................................................................................................... 3-63
OSPF Pa r a m e t er s ..... .. ... ......... ............... ....................... ................ ...................... ..................3-64
Circuit Table Screen ............................................................................................................ 3-64
Static Route Table Screen .................................................................................................... 3-67
ARP Table Screen ...............................................................................................................3-69
Trusted Neighbor Table Scre en ......................... .................... .................... .................... ......3-71
Area Table Screen ...............................................................................................................3-72
Virtual Link T ab l e S creen ................ ................ ...................... ................ ...................... ....... 3-74
Originate Ping ............................................................................................................................ 3-75
TCP Server ................................................................................................................................. 3-76
TCP Server Details Screen .................................................................................................. 3-76
Netwo r k Add r e s s T ra n s l at i on (N A T ) ............... ...................... ................ ....................... ............. 3-78
NAT Details Screen .............................................................................................................3-78
Dynamic Host Configuration Protocol (DHCP) ........................................................................ 3-84
DHCP Server Details Screen ............................................................................................... 3-85
HDLC Monitor Service Table Screen ........................................................................................ 3-90
HDLC Monitor Details Screen ............................................................................................ 3-90
Bridge ........... ........... ......... ............ ........... ........... ......... ........... ............ ........... ......... .................... 3-93
Simple Mail Transfer Protocol (SMTP) ..................................................................................... 3-97
SMTP Screen ....... .. ................ ...................... ................ ...................... ................ .................. 3-97
Encryption .. ............. ........................... ............ ............. .............. .................... ........... ..................3-98
Utilities ............................................................................................................................................. 3-98
Upload/Save ............................................................................................................................... 3-98
TFTP Configuration ............................................................................................................ 3-99
Password ..................................................................................................................................3-100
Log Out .................................................................................................................................... 3-100
In-ban d Management ... ......... ................ ...................... ................ ...................... ................ .......3-101
Use of Connected Local Router ......................................................................................... 3-101
Use of Local WANsuite 7105 as a Gateway ......... ........... ..................................... ............3-101
Chapter 4 VT100 Interface
Acces si n g th e V T 1 0 0 In t er f a ce ....... ... ............... ....................... ...................... ................ .................... 4-1
Screen Co mpone n ts . ................ ....................... ............... ....................... ...................... .................. 4-1
Cursor Co n t ro l s . ...................... ................ ...................... ....................... ................ ........................ 4-2
Field Types ...................................................................................................................................4-2
Menu Structure ............................................................................................................................. 4-3
System Screen ..................................................................................................................................... 4-4
Mainte n ance Re se t ......... .. ................ ................ ...................... ................ ....................... ............... 4-5
Save and Restart ........................................................................................................................... 4-6
vii
Page 8

Interfaces Screen . .. ....................... ................ ...................... ................ ...................... ........................... 4-6
Network Screens ..........................................................................................................................4-7
Error Status and Alarm Thresholds Table ............................................................................. 4-9
Network APS Screen ........................................................................................................... 4-11
Network APS Status Table .................................................................................................. 4-12
Performance Screens ........................................................................................................... 4-13
Serial Screens ............................................................................................................................. 4-15
Current Pin Status ................................................................................................................ 4-19
Ethernet (IP Details) Screen .......................................................................................................4-19
Supervisory Configuration Screen .............................................................................................4-21
Service Table Screen ........................................................................................................................4-22
Data L ine Monit o r Ta b le .................. ................ ...................... ................ ....................... ............. 4-23
Service Detai ls Sc r e en .... ......... ................ ...................... ................ ...................... ................4-25
DS0 Monitor Details Screen ......................................................................................................4-26
DS0 Sta t u s and A la r m T ab l e ....................... ....................... ............... ....................... ........... 4 -2 7
Frame Relay Service Details Screen .......................................................................................... 4-29
PPP Service Details Screen ........................................................................................................ 4-35
Param e t ers to N eg o t iate ...................... ................ ...................... ....................... ................ .... 4-36
PPP Sta t i sti c s .. .. ... ............... ....................... ................ ...................... ................ .................... 4-37
PAP Table ............................................................................................................................ 4-38
CHAP Table ........................................................................................................................ 4-39
SCADA Service Details Screen ............................. .................... .................... .................... ........4-39
IP Serv i ce D et ai l s Screen .... .. ......... ................ ...................... ................ ...................... ................ 4-41
Applic ations ........ ....... ......... ......... ......... ....... ......... ......... ......... ...... ......... ......... ......... ......................... 4-42
Endpoint Table Screen ............................................................................................................... 4-42
Endpoint Details Screen ...................................................................................................... 4-43
Endpoint Service Details Screen ......................................................................................... 4-45
DLCI Details Screen ............................................................................................................4-45
DLCI Sta ti s t ic s Screen .. ............... ....................... ...................... ................ ....................... ....4-49
DLCI Table Screen ..............................................................................................................4-50
SNMP .. ........... ......... ............ ........... ......... ........... ........... ............ ......... ........... ........... .................. 4-51
SNMP D et a i l s Scr een ..... .. ................ ...................... ................ ....................... ...................... 4-51
Trap L og ... ............... ....................... ................ ...................... ....................... ............... . ...............4-51
Trap L o g Sc r een ........... .. .. ................ ................ ...................... ................ ...................... .......4-52
IP Gatew ay ..... ... ...................... ................ ...................... ................ ....................... ...................... 4-52
IP Gatew ay Screen ... ................ ...................... ................ ....................... ............... ................ 4-52
RIP Parameters .................................................................................................................... 4-53
OSPF Pa r a m e t er s ..... .. ... ......... ............... ....................... ................ ...................... ..................4-53
Circuit Table Screen ............................................................................................................ 4-54
Static Route Table Screen .................................................................................................... 4-56
Static ARP Table Screen ..................................................................................................... 4-59
Trusted Neighbors Screen ............... ........... .................... .................... .................................4-60
Area Table Screen ...............................................................................................................4-61
Virtual Link T ab l e S creen ................ ................ ...................... ................ ...................... ....... 4-63
TCP Server ................................................................................................................................. 4-65
TCP Server Screen ...............................................................................................................4-65
Dynamic Host Configuration Protocol (DHCP) ........................................................................ 4-67
DHCP Server Details Screen ............................................................................................... 4-68
Bridge ........... ........... ......... ............ ........... ........... ......... ........... ............ ........... ......... .................... 4-72
Encryption .. ............. ........................... ............ ............. .............. .................... ........... ..................4-75
viii WANsuite 7105
Page 9

Service Aware ............................................................................................................................ 4-76
Service Aware Scree n ....................... ................ ...................... ................ ...................... ....... 4-76
Rule Co n fi g u ra t i o n Scr een .......... ... ......... ...................... ................ ...................... ................ 4-77
Traffic Meter Statistics Screen ............................................................................................ 4-78
Diagnostics ................................................................................................................................. 4-79
Diagnostics Screen ............... ........... ........... ........... .................... ............................ ........... ...4-79
Test Details Screens .............................................................................................................4-80
Top Talkers ................................................................................................................................ 4-84
Originate Ping ............................................................................................................................ 4-85
Originate Ping Screen ..........................................................................................................4-85
Netwo r k Add r e s s T ra n s l at i on (N A T ) ............... ...................... ................ ....................... ............. 4-86
NAT Details Screen .............................................................................................................4-87
HDLC Monito r .... .. ......... ................ ...................... ....................... ................ ...................... ......... 4-93
HDLC Monitor Table Screen .............................................................................................. 4-93
HDLC Monitor Details Screen ............................................................................................ 4-94
Simple Mail Transfer Protocol (SMTP) ..................................................................................... 4-97
SMTP Screen ....... .. ................ ...................... ................ ...................... ................ .................. 4-98
TFTP .......................................................................................................................................... 4-98
TFTP Configuration Screen ................................................................................................. 4-99
Appendix A Specifications
Network 1, 2, and 3 Interfaces ........................................................................................................... A-1
Serial Interface(s) (Data 1 and Data 2) .............................................................................................. A-1
Management Interfaces ...................................................................................................................... A-2
10/100 Ethernet ........................... .................... .................... .................... .................... ................ A-2
Supervisory Port .......................................................................................................................... A-2
Diagnostics ........................................................................................................................................ A-2
Alarms ................................................................................................................................................ A-4
Power ................................................................................................................................................. A-4
Mecha nic al . ..... .... .. ..... .... ..... .. ..... .... ..... .. .... ..... .... ... .... ..... .... .. ..... .... ..... .. ..... .... ..... .. .... ..... ..................... A-4
Enviro n m e n t al ....... ................ ....................... ............... ....................... ................ ................................ A-4
Frame Relay Statistics Collected in 96 15-minute Intervals ............................................................. A-5
PPP Statistics Collected in 96 15-minute Intervals ........................................................................... A-5
Industry Listings ................................................................................................................................ A-6
Standa rds .... .. ... ............... ....................... ................ ...................... ....................... ................................ A-6
Ordering Information .........................................................................................................................A-6
Optional Equipment ...........................................................................................................................A-7
Connector Pin Assignments ............................................................................................................... A-8
Serial Interface Pin Assignments for DTE Mode (Packet Use Only) ........................................ A-8
Serial Interface Pin Assignments for DCE Mode ....................................................................... A-9
Ethernet Connection Pin Assignments ........................................................................................ A-9
Netwo r k 1 In t erf a c e Pi n As s i g n me n t s ... .. ................ ............... ....................... ................ ............ A-10
Network 2 and Network 3 Interface Pin Assignments .............................................................. A-10
ix
Page 10

Supervisory Port Pin Assignments ............................................................................................ A-10
Appendix B SNMP Agent
Introduction .........................................................................................................................................B-1
SNMP Co n f i g u rat i o n P aramete r s ........... .. ... ......... ...................... ................ ...................... ..................B-1
SNMP MIBs ......... ....................... ................ ...................... ................ ...................... ...........................B-1
SNMP T ra p Co n fi g u r at i o n ... .. ................ ................ ...................... ................ ....................... ...............B-2
Generi c Tra p s ...... ........................ ........................ ............................. .............................. .B-3
Standard Traps ................................................................................................................B-4
Soon-To-Be-Standard Traps ...........................................................................................B-5
Enterprise-Specific Traps ...............................................................................................B-8
Generic MIB Loading Instructions ...................................................................................................B-10
x WANsuite 7105
Page 11

C
HAPTER
0
P
REFACE
This reference guide for the Verilink WANsuite 7105 intelligent integrated
access dev ice (I
and cabling. It is not a user’s guide containing step-by-step procedures. This
manual is designed to be used as a reference regarding commands, interface
ports, configuration parameters, and other information specific to your 7105
unit.
Scope
The WANsuite 7105 has been designed to fit into an AS2000 rack or shelf.
Where appropriate, the text refers you to a specific AS2000 manual for
greater detail.
Manual Organization
The chapters and appendices in this manual are arranged for quick reference
when you need it. You do not have to read previous chapters to understand
the subsequent chapters. Appendices are designed to complement the main
chapters.
• Chapter 1, "About the WANsuite 7105"– This chap ter describes product
features and capabilities.
2
AD) describes unit features and specifications, configuration,
• Chapter 2, "Installation" – This chapter describes unit port connections and
powering informatio n.
• Chapter 3, "Web Server Interf ace" – This chapter describes the menu screens
and configuration para meters accessed through the Web server inte rface.
• Chapter 4, "VT100 Interface" − This chapter describe s the menu screens and
configuration parameters accessed through the VT100 interface.
• Appendix A, "Specifications" – This appendix defines the specifications for
the WANsuite 7105. In addition, this se ction provides ordering information
(part numbers) and all the connector pin as signmen ts for the interfa ces on the
back of the WANsuite 7105 unit.
Preface xi
Page 12
• Appendix B, "SNMP Agent" − This appendix defines which Management
Information Base (MIB) fil es are supported by the WANsuite 7105 SNMP
agent. In addition, instr uctions are provided for loadi ng these MIB files into
most SNMP management stations.
Typog ra phic Conve ntions
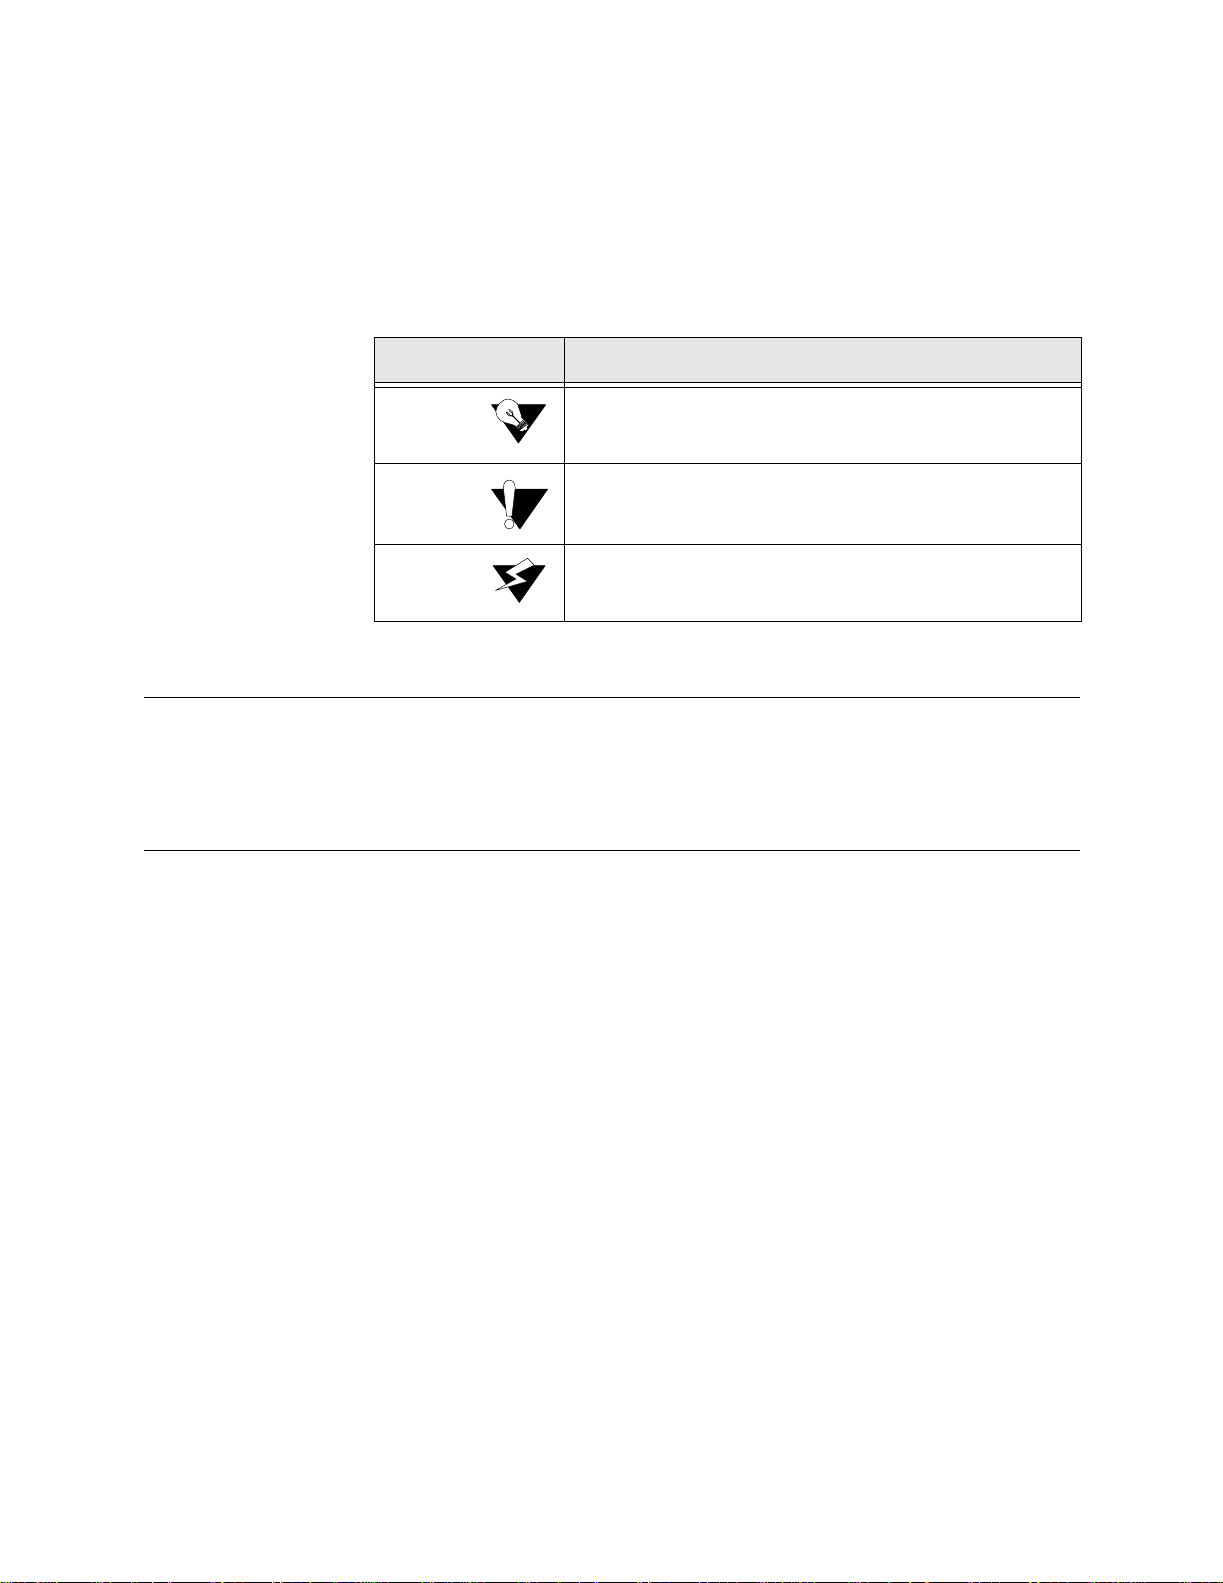
The following table lists the conventions used throughout this guide.
Convention Description
A Notice calls attentions to important features or instructions.
A Caution alerts you to serious risk of data l oss or other results that
may cause you or the unit trouble if the wa rning is not hee d ed.
A Warning alerts you to the risk of serious damage to the unit or
injury and possible death to the end user.
Related Verilink Documents
The Verilink manual AS2000, The Basics provides general information about
Verilink products and may be referred to for assistance:
Customer Service and Technical Support
Verilink provides easy access to customer support information through a
variety of servi ces. This section descri bes these services.
Support from Your Network Supplier
If assistance is required, contact your network supplier. Many suppliers are
authorized Verilink service partners who are qualified to provide a variety of
services, including network planning, installation, hardware maintenance,
application training, and support services. When you contact your network
supplier for assistance, have the following information ready:
• Diagnostic error messages
• A list of system hardware and softwar e, including revision levels
• Details about recent con fi guration changes, if applica ble
Support from Verilink
xii WANsuite 7105
If you are unable to receive support from your network supplier or want to
contact us directly, Verilink offers worldwide customer support by telephone,
e-mail, and through Verilink’s Internet Web site.
Page 13

Telephone
Customer support is available by telephone 24 hours a day, 7 days a week. To
speak directly with a Verilink customer service representative, you may dial
one of the following numbers:
•Sales and Marketing: 800-VERILINK (837-4546)
•Technical Support: 800-285-2755 (toll-free)
256-327-2255 (local)
You can request sales and marketing information or pose a technical support
question about your Verilink product by contacting us at the e-mail addresses
provided below. Verilink will respond to e-mailed requests for support during
regular business hours (8–5 CST, Monday–Friday).
•Sales and Marketing: info@verilink.com
•Technical Support: support@verilink.c om
Internet
Visit Verilink’s Web site to access the latest Verilink product information,
technical publications, news releases, contact information, and more:
If this reference manual is revised to reflect code changes or other updates,
the most recent version will be posted to the Verilink Web site.
Returning a Unit to Verilink
If for any reason you must return your Verilink product, it must be returned
with the shipping prepaid, and pack aged to t he best commerci al stand ard for
electronic equipment. Verilink will pay shipping charges for delivery on
return. You are responsible for mode and cost of shipment to Verilink.
You must have a Return Material Authorization (RMA) number marked on
the shipping package. To obtain an RMA number, call Customer Service at
800-926-0085, extension 2282 or 2232. Products sent to Verilink without
RMA numbers will be returned to the sender unopened, at the sender’s
expense.
When calling Verilink for an RMA number, please have the following
information available:
• Model number and serial number for each unit
• Reason for return and symptoms of problem
http://www.verilink.com
• Purchase order number to cover charges for out-of-warranty items
• Name and phone number of per son we can conta ct i f we have quest ions about
the unit(s)
Preface xiii
Page 14

The address for you to use when returning a unit to Verilink will be provided
when the RMA is issued. The standard delivery method for return shipments
is Standard Ground for domestic returns and International Economy for
international returns (unless otherwise specified).
xiv WANsuite 7105
Page 15

Introduction
C HAPTER
1
CHAPTER 1ABOUT THE WANSUITE 7105
The telecommunications network service market is rapidly changing, where
network monitoring, control, and higher performance in packet processing are
not only expected, but demanded, at competitive price points. Verilink’s
WANsuite family is based on our innovative, next-generation WAN access
architecture − a h ighly fle xible and powerf ul architect ure th at can me et the
needs of many different customers in many different applications. Because it
is so flexible, WANsuite products will continually evolve, offering our
customers cutting-edge features at competitive prices.
The WANsuite 7105 is a rack-mounted unit designed to occupy a single slot
position of the Verilink AS2000 rack or shelf. The AS2000 shelf has several
different variations: (1) a dual-line shelf that accomm odates tw o cards, (2) a
quint-line shelf that can accommodate up to five cards, and (3) a multi-line
shelf that can acco mmodat e up to 13 cards. A servic e aware T1/FT1
CSU/DSU, the WANsuite 7105 has three Network ports (all of which operate
in long-haul or short-haul mode); two Serial ports software-configurable for
RS-232, EIA-530, EIA 530A, or V.35 electrical connections; an asynchronous
Supervisory port; a 10/100Base-T Ethernet interface; six status LEDs, and
three sets of test ac cess B antam jack s. Capa ble of acco mmoda ting a w ide
range of network configurations, the WANsuite 7105 effectively combines
voice, data, and network traffic over a single transmission facility and works
with non-proprietary network management solutions.
All of WANsuite 7105’s installation, performance configuration, traffic
monitoring, alarm reporting, and diagnostic capabilities can be configured
through the unit’s embedded We b server interface (WANsight™) using
Microsoft
locally through the Ethernet port or the Supervisory port, or remotely through
the Network port. Especially advantageous is WANsuite’s advanced
monitorin g and co ntrol ca pabilit y that gives network administrators the
ability to plan future capacity requirements. To extend the WANsuite 7105’s
functionality even further, Verilink offers an element management software
system for reporting and real-time diagnostics.
®
Internet Explorer™ . The W eb ser ver interfa ce can be accessed
About the WANsuite 7105 1-1
Page 16

The unit’s built-in ServiceAware™ technology allows network managers to
maximize available WAN bandwidth and verify SLAs. This management
platform allows the end user to see network activity (performance) and
problems (diagnostics) on any permanent virtual circuit (PVC), access line, or
physical circu it.
Verilink’s FrameStart™ technology is standard with WANsuite 7105 and
benefits the initial installation of frame relay circuits by eliminating the
requiremen t for a frame rel ay test se t. Fram eStart ens ures that T1 circu it
status, signal quality, loopback code detection, access link condition, and the
various Layer 2 frame relay investigation and reporting features are available
and accura te.
The WANsuite 7105 boasts a built-in mini-dacs. This f eature enables the uni t
to switch or “groom” individual DS0s. You can groom any DS0 from any
interface into any time slot.This feature makes the WANsuite 7105 ideal for
applications that switch DS0s from one T1 onto two separate fractional T1
lines.
The WANsuite 7105 is equipped with integrated Automatic P rotection
Switching (APS), which makes back-up facilities available for a customer’s
most critical business locations. With APS enabled, customers can rely on the
fact that their most important data will reach its desired destination. This
means a business can increase its “up time,” offering uninterrupted service,
without having to increase its network’s complexity.
The WANsuite 7105 also monitors and measures utilization. Whether
running packet or TDM data, the WANsuite 7105 can measure the percent of
utilization on each network or serial interface. High and low-level alarms
notify network managers in advance that bandwidth may need to be
reallocated.
Another feature of the WANsuite product line, IP Gateway enables IP
packet rout ing throughout a LAN/WAN network architecture using static
routing configurations or dynamic routing protocols (Routing Information
Protocol − RIP 1 and RIP 2 − or Open Shortest Path First − OSPF).
RIP 1 and RIP 2 allow routers to exchange routing information. WANsuite
then uses this information exchange to build routing tables for IP Packet
routes. After building the routing tables, WANsuite periodically broadcasts
the contents to neighboring routers so that your network can choose the most
efficient rou tes available.
OSPF uses link-state routing algorithms to calculate routes based on the
number of routers, transmission speeds, delays, and route costs. Using the
OSPF protocol, WANsuite works with other routers in your
telecommunications fabric to dynamically change routing “on the fly” to make
use of the most efficient and cost-effective transit across your network.
Because IP Gateway enables WANsuite to route IP traffic either statically or
dynamically across your LAN/WAN architecture, your need for costly routers
is substantially reduced. WANsuite is a one-stop solution that can help you
meet the requirements of your many different applications.
1-2 WANsuite 7105
Page 17

DHCP uses a server-clien t architecture to assign IP addresses to PCs and
workstations on the LAN. The DHCP server dynamically assigns these IP
addresses, which can be either temporary or permanent, to each PC or
workstation (DHCP client). These IP addresses are "housed" on the DHCP
server.
NAT e nables an enterprise to set up two sets of IP addresses − one set fo r
internal network use (or LAN traffic) and one set for external use (or Internet
traffic). This can provide a layer of security for a company by eliminating
outside access to internal IP addresses from the Int ernet.
TCP Server, a feature of the WANsuite product line, provides connectivity
to multiple endpoints by associating a TCP port with each endpoint, and
reduces the number of physical connections at the central site to one
10/100Base-T Ethernet port.
Bridging separate LANs together is another option for the IP traffic. Using
the IEEE Standard 802.1D Transparent Bridging specification, the
WANsuite 7105 can simplify your network architecture by allowing you to
bridge sep arate LAN s acros s a WAN so th ey operat e as a sin gle LAN.
The WANsuite 7105 gives service providers and enterprise customers the
capability to m onitor end -to-end net work perfo rmance (with support for up
to 256 virtual circuits) as well as the capability to verify Service Level
Agreements (SLAs); isolate performance problems to the LAN, local loop or
frame relay network; determine appropriate bandwidth needs; and monitor
network trends to aid in future capacity planning.
Features of the WANsuite 7105
Performance
Historically, WAN access devices have tended to perform well as
single-function devices such as CSU/DSUs, but have not been optimized to
address higher level traffic issues such as service levels and integration.
Verilink's architecture and Web-based user interface work together to address
all access issues as services and ap plications , rather than as circ uits and
protocols, for exceptional WAN management performance.
To further leverage its Web server interface, Verilink's new architecture lets
you upgrade firmware and save or upload configurations via the Web from a
Web browser. Password control is also available.
NOTICE: Verilink recommends the use of Microsoft’s Internet Explorer 5.0 or
higher. If you use other Internet browsers to access the Web server
interface, screen elements will not display as described in this manual.
About the WANsuite 7105 1-3
Page 18

Mini-Dacs
The WANsuite 7105’s built-in mini-dacs lets the unit switch or groom any
DS0 from the main Network 1 port to any of the unit’s interfaces. The
mini-dacs offers complete grooming independent of DS0 or time slot.
Automatic Protection Switching (APS)
Using N etwork APS , custom ers can i ncrease their serv ice avail ability by
automatica lly swit ching b etween two T1 lines in the event of p erform ance
degradation or circuit failure. The WANsuite 7105 at the customer premise
constantly monitors the status and quality of the T1 line signal on both
primary and secondary lines. If the primary line’s performance degrades
below a customer-set threshold or if a circuit fails, the WANsuite 7105
automatically switches from the primary to the secondary line. This feature
does not depend on whether or not the primary and secondary lines are
provided by a sing le carri er o r alternat e carr iers. Th e la tency b etween t he ti me
the threshold is met and the time the switch is made to the backup line is less
than 50 ms. APS meets the standards set by TR54017.
Percent Utilization Reports
The WANsuite 7105 employs two methods for reporting percent utilization of
bandwidth. Both methods are required to accurately report utilization on voice
and data services.
The first of these methods is the DS0 utilization monitor, which reports
utilization of voice bandwidth as it is received from the Network ports.
Through the DS0 utilization monitor screens, you can configure idle DS0
patterns and set high and low utilization alarms.
The other method for reporting percent utilization is High-Level Data Link
Control (HDLC) monitoring, which reports utilization on synchronous data
services transmitted via the three Network or two Serial interfaces. HDLC
monitor screens also let you configure high and low utilization alarms.
The unit will report utilization alarms if DS0 or HDLC utilization stays high
for any given 15-minute period or at the end of any 24-hour period during
which utilization drops below the user-specified threshold. The WANsuite
7105 saves utilization statistics in 15-minute increments for 24 hours, and
each 24-hour period is summarized for up to 30 days.
Test Access Jacks
Three sets of Bantam jacks are on the front panel of the WANsuite 7105.
These test jacks provide local test access for the Network 1 port, and provide
technicians with quick and easy access to Layer 1 diagnostics.
1-4 WANsuite 7105
Page 19

SNMP Management
With integrated SNMP in-band management, enterprise managers can now
manage Verilink WANsuite units and their integral CSU/DSUs as a single
unit. With only one LAN segment in the network, all Verilink WANsuite
platforms can be managed by SNMP. With self-learning functionality, these
platforms learn their fra me relay environm ent and eliminate the n eed for
remote, trained personnel. Once an IP address has been established for a
properly connected remote unit, all configuration parameters may be
downloaded from the central site; no additional interaction is required at the
remote site to establish connectivity. WANs can be constructed using frame
relay or leased-line services. Verilink’s WANsuite 7105 allows any port to be
configured for any of its available service technologies through simple
software configuration. Network managers can now fine tune the enterprise
network for the lowest cost and highest performance.
Embedded Web Server
An embedded Web server supplies a simple-to-use interface for configuration
and statistics collection, with a service table for mapping services to ports, an
endpoint table for configuring and monitoring service endpoints, and a user
table for traffic monitoring and control.
Optional Advanced Network Management
As an option for the WANsuite 7105, Verilink offers a network management
system based on RedPoint's NetVoyant™ software, which was designed to
provide IT professionals with the information required to make informed,
enterprise-wide capacity planning and investment decisions. NetVoyant is an
NT-based element managem ent sys tem that includes a n ODB C-co mpliant
database, CORBA IDLs for customization and flexibility, a real-time
diagnostics toolset, and extensive reporting and trending application support.
This solution employs an open-system, multi-vendor support approach for
network management, monitoring, and the collection of statistics from any
SNMP-based networking device including Verilink equipment already in the
field.
WANsuite extends the functionality of NetVoyant’s software by incorporating
customized configuration modules. This advanced network management
system is offered as an option for the WANsuite 7105. Please contact
RedPoint for availability and pricing information.
RedPoint Sales: (972) 221-6500
RedPoint Technical Support: (651) 552-2111
About FrameStart Technology
The WANsuite 7105’s FrameStart technology ensures that frame relay service
is operational prior to installation and connection to other equipment.
About the WANsuite 7105 1-5
Page 20

FrameStart’s integral frame relay circuit installation and diagnostic tools help
reduce equipment and installation costs, simplify configuration setup, and
alleviate frame relay connection uncertainties − all in one unit.
The WANsuite 7105 supports both FrameStart Install and Monitor modes as
well as Layer 2 statistics gathering and diagnostic capabilities that maximize
network availability and manage the growth of the network.
FrameSta rt Ins tall e nables step-by-step validation of network operations and
requires no data terminal equipment such as routers or FRADs. If a DTE
device is connected, operation is halted to perform installation diagnostics.
With FrameStart Install, you have the power to perform advanced tests
including the following:
• Local Manageme nt Interface (LM I) Sourcing
• End-to-end Integrity
• PVC Delay
• Network Receive Level
FrameSta rt Monito r com plements F rameSt art Instal l to moni tor real -time
network conditions nonintrusively when connected to real-world applications.
FrameStart Monitor diagnostics maintain and manage the activity of the frame
relay network from the host FrameStart unit. FrameStart Monitor also offers
the following:
• LMI Monitoring
• LMI Auto-Sourcing
• SOS Mode
• New Circuit Installation
Flexible Mounting Options are available. The WANsuite 7105 comes as a
stand-alo ne unit o r as a rack -mounte d card i n a dual-li ne shelf. When
rack-mounted, the shelf provides redundant power with circuit breakers.
Quint-line shelf and multi-line shelf mounting options are also available.
WANsuite 7105 Overview and Advantages
Verilink’s WANsuite 7105 is an innovative, highly intelligent, software-based
WAN access device optimized for frame relay access. The WANsuite 7105
provides network managers with the tools necessary to monitor and
troubleshoot voice, data, and network transmission systems. The ability to use
the WANsuite 7105 as an IP Gateway greatly increases its flexibility while
reducing the customer’s networking costs. In addition, the WANsuite 7105
delivers valuable tools for the following:
• Measuring and reporting network performance and utilization
1-6 WANsuite 7105
• Verifying Service Level Ag reement s (SLAs)
• Managing network resources to ensure optimum performance
• Analyzing trends to aid in network planning
Page 21

• Managing Web browser and/or in-band/out-of-band SNMP
WANsuite 7105 advantages include the following:
• Offers three Network ports, two Serial ports, an asynchronous Supervisory
port, and an Ethernet port − the WANsuite 7105 is extremely flexible and
adapts to numerous network applications
• Provides quick and easy access to Layer 1 diagnostics via its three Bantam
test jacks
• Grooms DS0s from any interface − the WANsuite 7105’s built-in
mini-dacs allows DS0 switching independent of time slot.
• Measures utilization on Network and Serial interfaces − the WANsuite
7105 helps service providers or network managers optimize bandwidth
before problems arise
• Ensures a higher level of service − WANsuite 7105 acts as an expert frame
relay Service Level advisor for service providers and users.
• Lowers facility costs − WANsuite 7105's easy installation and
configuration cut down on maintenance and sparing costs.
• Reduces the need for costly route rs with its IP Gateway feature − WANsuite
handles all your networki ng needs.
Features Summary
• A powerfu l core a rchitec ture:
• 10/100Base-T Ethernet por t for Management or IP Gateway
• Three Network ports configu rable in either long-haul or short-haul modes
• Dual Serial ports software -configurable for RS-232, EIA-530, EIA 530A,
or V.35
• Supervisory port for local management via VT100
• Mini-Dacs
• DS0 switching independent of time slot
• Front Panel Test Access Jacks
• Quick and easy access to Layer 1 diagnostics
• DS0 and HDLC Utilization Reports
• Configurable utilization thresholds
• High and low utilization alarms
• IP Gateway:
• Frame Relay or PPP
• 10/100Base-T Ethernet port
• Static routes
• Static Address Resolution Protocol (ARP)
About the WANsuite 7105 1-7
Page 22

• Dynamic routing protocol s, inc luding RIP 1, RIP 2, and OSPF
• Un-numbered Network
• Address Management: NAT and DHCP
• Programmable alarm thresholds
• Transparent Bridging
• Configurable Serial (Data) Port:
• Supports V.35, EIA-530, EIA-530A, and RS-232
• Security Features
• IP Host Access List
• Multilevel password acc ess
• NAT
• Supervisory Control and Data Acquisition (SCADA):
• Diagnostics
• Data Monitor functi on shows all traffic activity on a given RTU port of
a remote site, as if a data scope were physic ally connected between
the WANsuite unit and the RTU.
• RTU loopback lets you set a remote unit’s RTU port in loopback mode
so tha t a ny da ta sent to wards the RTU from the c entral site w ill be
echoed back towards the central site. Verifies data integrity to the
RTU port.
• TCP Server allows multiple conne ctions to TCP clients.
• Asynchronous multicast ing lets the WANsuite 7105 tr ansmit identic al data
to multiple endpoints.
• SCADA traffic priority puts SCADA traf fic in a specific queue over a
frame relay l ink and puts all other traffic (Ethernet, In-Band Management,
Serial Fram e Relay ) i n a normal priority que ue.
• Encryption on a per-DLCI basis with configurable encryption key
lengths up to 448 bits. This feature offers secure connections to
data-sensitive SCADA sites.
• A Suite of Perform ance Monitori ng Tools:
• Monitoring capability for up to 256 virtual circuits (Data Link Connection
Identifiers, or DLCIs)
• T1/FT1 performance monitoring, including complete diagnostic
capabilitie s and test modes
• SLA monitoring and management
• Committed Information Rate (CIR) enforcement per DLCI
1-8 WANsuite 7105
• Programmable alarm thresholds
• E-mail notificat ion of alarm status for immediate notification of potential
network problems
Page 23
• Management Interfaces:
• WANsight − an innovative, embedded Web-based user interface for
remote configurati on and real-time reporting via Web browser (Verilink
recommends Microsoft Inte rnet Explorer 5.0 or higher) that decr eases
installati on and configuration time for service employees, simplifies
troubleshooting and fault isolation of network problems, and optimizes
management of both TDM and frame-based services
• VT100 or TELNET
• Local Supervisory port
• Ethernet port for management or IP routing
• Frame Relay Aware:
• Support for leased-l ine and frame relay services
• Layer 2 end-to-end visibility and control
• Embedded f rame relay test set
• Layer 3 support for visibil ity beyond the Network layer (up to 25
protocols)
• “Top T alker” re ports − lets you find out who’s generating the most IP
traffic on your LAN
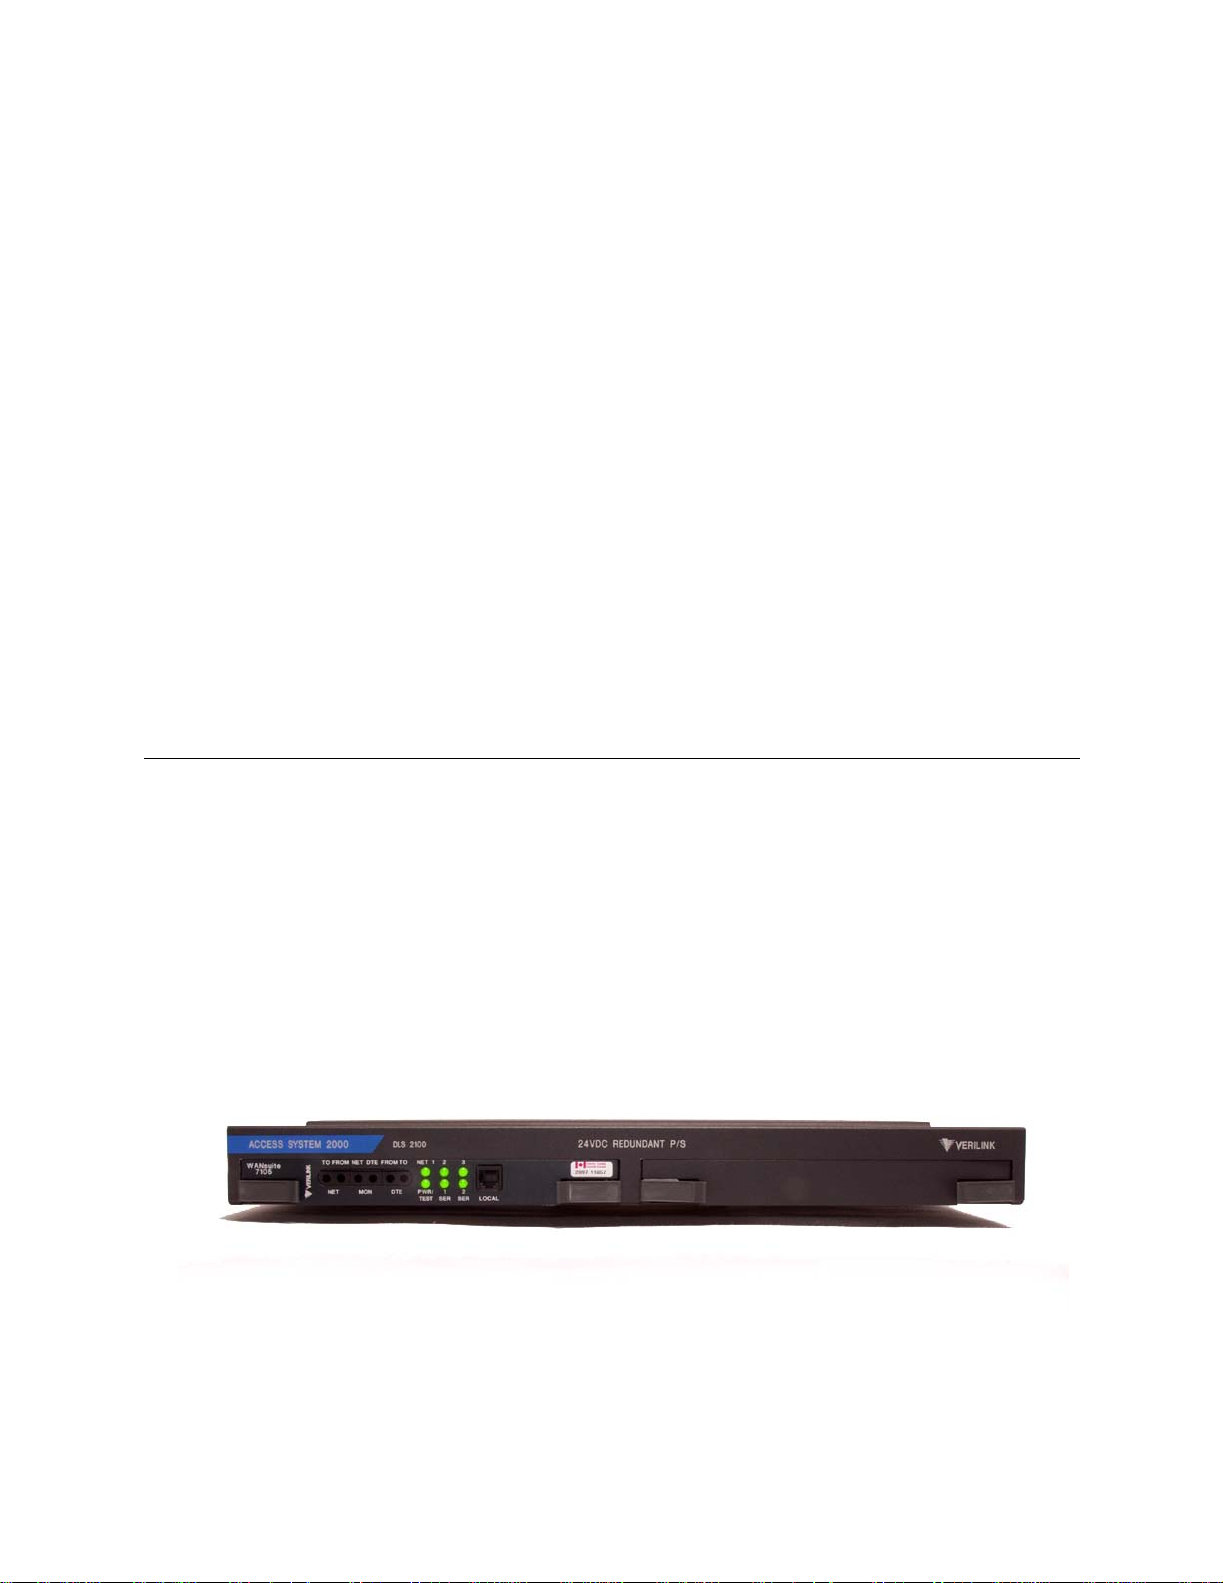
Front Panel
The front panel of the WANsuite 7105 application module (Figure 1.1)
provides the following:
• Six LED status indicators
• A local RJ-11 Supervisory port
• Three sets of Bantam jacks for diagnostics
• Ejector handles for installing the module in a shelf slot
Figure 1.1
Front Panel of WANsuite 7105
About the WANsuite 7105 1-9
Page 24

The front panel LED status indicators are defined in the table below:
Control/
Indicator
NET 1 AND
NET 2 (when
in APS mode)
NET 1, NET 2
(when not in
APS mode),
and NET 3
SER 1
(DATA 1) and
SER 2
(DATA 2)
PWR/TEST
Function/Description
The indicators are off (not illumi nated) if the port has not been configured.
When the physical networ k port is the act ive line:
The indicator lights red if the link is dow n.
The indicator lights amber if the T1 link i s up and at least one
configured protocol is not estab lished.
The indicator lights green if the link is up and all configured protoc ols
are esta blished.
When the physical networ k port is in the stand-by line:
The indi cator is off (no t illuminated) when the lin k is up.
The indicator is red when the link i s dow n.
NOTE: TDM is considered a protocol. It is establishe d wh enever the T1 link
is up.
The indicators are off (not illumi nated) if the port has not been configured.
The indicator lights red if the link is dow n.
The indicator lights amber if the T1 link i s up and at least one
configured protocol is not estab lished.
The indicator light green if the link i s up and all confi gured protocols
are esta blished.
NOTE: TDM is considered a protocol. It is establishe d wh enever the T1 link
is up.
Port in DTE Mode:
The indicator is off (no t illuminate d) if the port has not been configured.
The indicat or ligh ts red if DSR i s not ac tive and the con figur ed pro tocol i s not
established.
The indicator lights amber if DSR is not acti ve or the configured pr otocol is
not established.
The indicator lights green if DSR is active and the conf igured protocol is
established.
DTR Alarm Enable d (Port in DCE Mode):
This indicator is off (not illuminated) if the port has not been configure d.
The indicator lights green if DTR is active and the configured protocol is
established.
The indicator lights red if DTR is not active and the configured protocol is
not established.
The indicator lights amber if DTR is not acti v e or the config ured protocol is
not established.
DTR Alarm Disabl ed (Port in DCE Mode ):
The indicator is off (no t illuminate d) if the port has not been configured.
The indicator lights green if the configured protocol is established.
The indicator lights red if the configured prot ocol is not est ablished.
The indicator lights g reen if power is applied to the unit.
The indicator lights amber in test modes (port looped or BERT
active).
Local Supervisory Port
The SUPERVISORY PORT, labeled on the front panel as LOCAL, is an RJ-11
female DCE connector configured for 8 bits, no parity, and 1 stop bit. Bit
1-10 WANsuite 7105
Page 25
rates are configured through the Web server interface or VT100 interface. The
local Supervisory port can be set to speeds of 1200, 2400, 4800, 9600, 19200,
38400, 57600, or 115200 bps. The initial default rate of the local Supervisory
port is 19200 bps.
NOTICE: For information on pinout assignments for this connector, refer to
page A-8. See Ordering Information on page A-6 for information on
cables for this connector.
The Supervisory port performs several different functions. It serves as the
VT100 interface port, providing VT100 screens. It also supports asynchronous
PPP, providing access to the Web Server interface. In addition, the
Supervisory port is an asynchronous data port. Data is encapsulated in frame
relay packets and then transmitted through a Network port.
On power-up, the Supervisory port sends out diagnostic messages at the bit
rate of 115.2 kbps until the Supervisory service acquires the Supervisory port.
These diagnostic messages can disrupt the connected device; however, you
can configure the unit to disable their transmission.
NOTICE: A null modem (crossover) cable is required to connect a modem to the
Supervisory port.
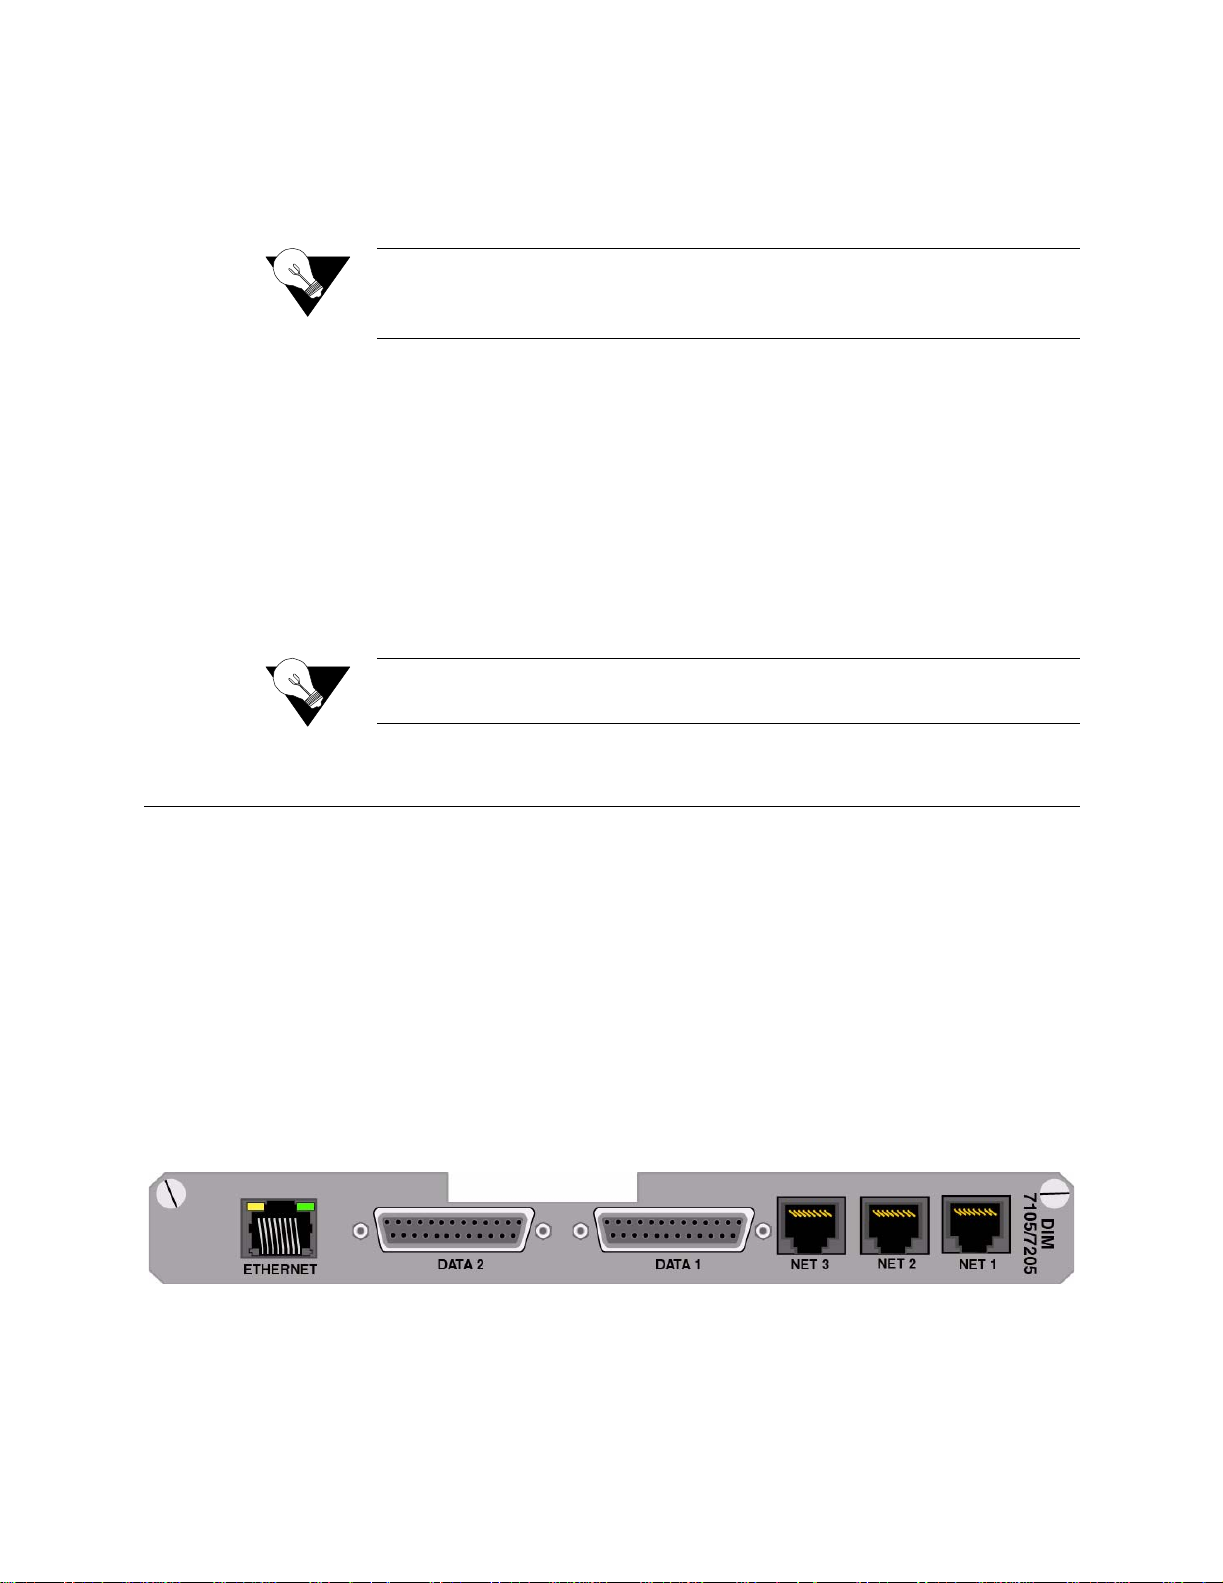
Data Interface Module (Rear Panel)
The Data Interface Module (DIM) − or rear connector module − mate s wi th
the associated WANsuite 7105 module and connects it to the data equipment.
As shown in Figure 1.2, the rear panel of the DIM 7105 provides the
following:
•Two RS-232 DB-25 connectors
•Three RJ-48C j acks
•One 8- pin m odular 10/100Base-T Ethernet port
The two DB-25 connectors are Serial data ports (labeled
), and the thre e RJ-48C jac ks are Net work interfaces (labeled NET 3, NET 2,
2
and NET 1).
Figure 1.2
10/100 Ethernet
WANsuite 7105 Rear Panel
DATA 1 and DATA
The WANsuite 7105 provides one 10/100 ETHERNET interfac e for IP
Gateway, S NMP, and Web server ac cess. T his interfa ce is an 8-pin m odular
About the WANsuite 7105 1-11
Page 26

Serial Interfaces
jack that complies with standard twisted-pair, 10/100Base-T requirements.
The 10/100Base-T cable is supplied by the end user. Refer to Ethernet
Connection Pin Assignments on page A-9 for pin assignments and cable
descriptions.
Ethernet LED Indicators
There are two unlabeled indicator LEDs on either side of the 10/100 Ethernet
jack. The LED on the left side of the jack pulses amber to indicate data
activity (either transmit or receive). The LED on the right side of the jack
lights green to indicate that the link layer is operational.
The two SERIAL interfaces (labeled DA TA 1 and DA TA 2 ) l ocated on the rear
of the unit are multi-protocol interfaces presented physically as DB-25
connections. The protocols supported by these interfaces are RS-232,
EIA-530, EIA-530A, and V.35.
Cables that adap t the DB-25 interface to the 34-pin V.35 interfa ce are
available. These cables are listed as optional equipment on page A-7 of
Appendix A. DB-25 to DB-25 cables also are available if your installation
needs req uire them . See Ordering Information on page A-6 for details. Pin
assignmen ts for the serial in terface are listed i n Appe ndix A, Specifications.
CAUTION: FCC rules require that interconnecting cables carrying high-speed
Network Interfaces
Labeled on the rear panel of the WANsuite 7105 as NET 1, NET 2, and NET 3,
the Network interfaces’ connections are standard RJ-48C, 8 -pin modular jacks
that contain an automatic line build out (ALBO). This ALBO allows the unit
to be located a substantial distance away from the telco Network interface
with a receive signal level to −27 dB. These interfaces operate in either
long-haul or short-haul mode. To view their pinout assignments, refer to
Network 1 Interface Pin Assignments or Network 2 and Network 3 Interface
Pin Assignments on page A-10.
The Netwo rk inter face transm it LBO l evel s hould be set as ins tructed in Line
Build-Out (Long Haul) on page 3-6. Maximum suggested cable lengths for the
connection from the unit to the network are listed in the table below.
data be shielded appropriately in order to minimize radio frequency
interference.
1-12 WANsuite 7105
Page 27

Calculations are based on a cable temperature of 70 °F, 0.083 µF/mile
capacitance, a 27-dB loss, and a 100-Ω, non-loaded, twisted-pair cable.
Cable Type
26-gauge PIC 6.8 4,400
24-gauge PIC 5.4 5,500
22-gauge PIC 4.2 7,100
19-gauge P IC 3.0 10,000
(PIC - Plastic Insulated Cable)
CAUTION: In accordance with FCC Rules, Part 68.218(b), you must notify the
Power Connection
No external power supply is required for the WANsuite 7105; power is
received from its AS2000 rack connection.
When power is applied to the unit, the front panel LED indicators flash for
approximately 10 to15 seconds as the unit initializes. The green
will remain illuminated as long as the unit receives power. This LED turns
amber when the unit is in test mode.
Loss per 1000 ft
(dB)
telephone company prior to disconnecting this product.
Max Cable L ength
(ft)
POWER LED
Shelf Uni t P owe r Options
Three shelf options for mounting the WANsuite 7105 are described below:
•Multi-line shelf (MLS 2000 and 2200 series) holds 13 application
modules and 2 modular power supplies (AC or DC)
•Quint-line shelf (QLS 2500) holds five modules and contains an internal
AC or DC power supply. This shelf is a stand-alone unit.
•Dual-line shelf (DLS 2100) holds two modules and is powered by
external powers supplies. (Verilink offers a universal AC/DC power
supply.)
Power Fa ilure
If the POWER indicator does not illuminate, check the rack power connections
and the primary circuit breaker.
The WANsuite 7105 provides non-volatile memory retention of the unit
configuration in case of a power failure. This feature allows the unit to
automatically restore normal service and retain pre-existing time and date
information following a power loss.
About the WANsuite 7105 1-13
Page 28

1-14 WANsuite 7105
Page 29

C HAPTER
2
C
HAPTER
2
I
NSTALLATION
This chapter describes the contents of your WANsuite 7105 shipment and
provides information on connecting and installing the unit.
The WANsuite 7105 uses an “Installation Wizard” to help you automatically
install the unit quickly and correctly. Procedures for using this Installation
Wizard are also describe d in this c hapter.
For information on installing and replacing shelves, modules, and
supplies, refer to the Verilink manual AS2000, The Basics.
WANsuite 7105 Components
The complete WANsuite 7105 assembly consists of an application module
and a rear data interface module (DIM), together occupying a single shelf-slot
position accessible from the front and back of the Verilink AS2000 rack or
shelf. The DIM is installed from th e rear of t he shelf into the b ackplan e. The
WANsuite 7105 front module is installed from the front. The DIM is always
installed first and removed last; the WANsuite 7105 front module is installed
last and removed first.
Unpacking and Inspection
The WANsuite 7105 is shipped in cardboard cartons with foam inserts for
shock and vibration protection. When your shipment arrives, inspect the
shipping container and contents, and compare all items with those listed on
the packing list.
If the contents of the shipment are incomplete or if there is mechanical
damage or defect, notify the carrier and Verilink. (See Support from Verilink
on page xii.) If the shipping container or cushioning material is damaged,
notify the carrier and Verilink immediately and make a notation on the
delivery receipt that the container was damaged. (If possible, obtain the
signature and name of the person making delivery.) Retain the packaging
material until the contents of the shipment have been checked for
power
Installation 2-1
Page 30

completeness and the unit has been checked both mechanically and
electrically.
Supplied Materials
The WANsuite 7105 unit ships with the following standard items:
• T1 network cable
• Serial (Supervis ory) cable
• Verilink Documentation CD
For specific applications, see Optional Equipment on page A-7 for additional
cables and adapters. Contact Verilink Technical Support for part numbers or
further assist ance.
Configuring the Unit’s IP Address
The WANsuite 7105 can be configured and monitored through the Web server
interface o r the VT10 0 interface, but the uni t must first b e configured with an
IP address. You can configure the unit’s I P address using the Verilink
Configuration Wizard, which is included on your documentation CD.
Installation Wizard
NOTICE: You may also access the Ve rilink Configuration Wizard on the
Verilink We b site: www.verilink.com.
To configure the IP address using the Verilink Configuration Wizard, follow
the steps listed below:
1 Using the supplied cable, connect the unit’s RJ-11 Supervisory port to a
COM port on your PC. (Take note of which COM port is connected.)
2 Insert the Verilink CD (provided with the WANsuite 7105) into your PC’s
CD-ROM drive.
3 Use Windows “Explore” to view the contents of the CD and select the
folder labeled “Utilities.” In this folder will be a file named
this executable fil e is the Verilink Configuration Wizard application.
ipwiz.exe;
2-2 WANsuite 7105
Page 31
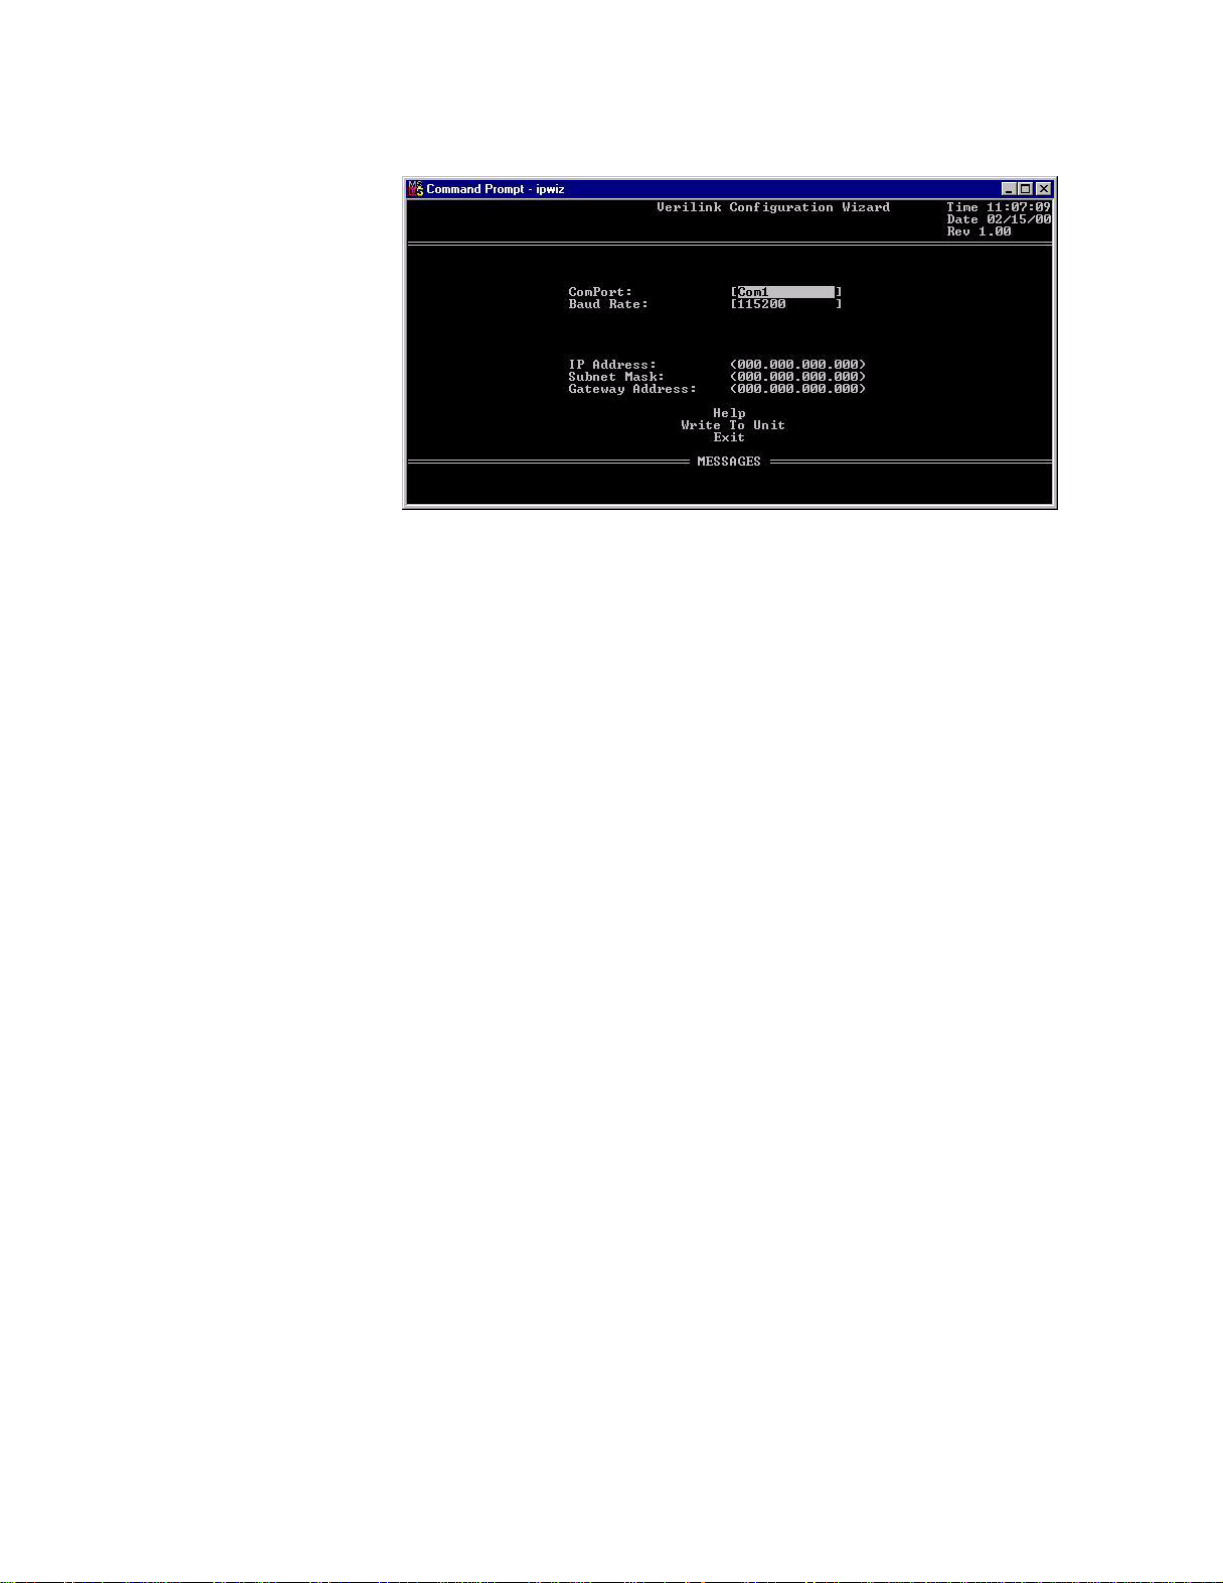
Double-click on this file to launch the program. After the program is fully
launched, you will see the following screen:
4 Using the Tab key to move fr om field t o fie ld, move the cursor to the “COM
Port” field. Using the Spacebar, toggle between the available options until
the correct COM port is sho wn (COM1, COM2, COM3, or COM4). Be s ure
to choose the same COM port as the port to which the unit is connected.
5 By default, the “Baud Rate” field will display 115200 (bits per second). For
the purpose of this installa tion, do not change the displayed baud rate from
its default. Proceed directly to the next step.
6 Using the Tab key again, move the cursor to the “IP Address” field and
enter the appropriat e IP address for the unit (xxx.xxx.xx x.xxx). If necessary,
repeat this process for the “Subnet Mask” and “Gateway Address” fields.
7 Next, move the cursor to the “Write To Unit” field and press the Enter key.
The program will prompt you to reset the unit.
8 To reset the unit, cycle the unit’s power (i.e., disconnect the power supply
cable from the unit and then reconnect it). The Configuration Wizard will
then automatically download the configuration information to the unit.
9 Note the status messages displayed at the bottom of the Configuration
Wizard screen. When the download is complete, your PC will beep and the
status message bar will displa y “Finished.”
10 Finally, move the cursor to the “Exit” prompt and press Enter. The
Configuration Wizard pr ogram will close.
Installation 2-3
Page 32

2-4 WANsuite 7105
Page 33

C HAPTER
3
C
HAPTER
3
W
EB
S
ERVER INTERFACE
The WANsuite 7105 has an innovative, embedded Web-based user interface
(WANsight) for remote configuration and real-time reporting via Microsoft
Internet Explorer 5.0 or higher. Access to the Web server interface and how
the interface is used to configure the WANsuite 7105 unit are described in
detail below.
NOTICE: Verilink recommends the use of Microsoft’s Internet Explorer 5.0 or
higher because if you use other Internet browsers to access the Web
server interface , some screen elemen ts will not disp lay as describe d in
this manual.
NOTICE: The material presented in this chapter follows the order listed in the
navigation bar on t he left side of the Web server interface screen.
However, because the parameters you specify in the Service Table
attach proto cols to inter faces , you m ust c onfig ure t he Serv ice Table
first. (See " Service s Scr een" on page 3-22.) You wi ll not b e a ble to
allocate channels (see "DS0 Monitor Details Screen" on page 3-26)
until the Service Table has been configured.
Configuration through the VT100 interface is covered in Chapter 4.
Accessing the Web Server Interface
You can access the Web server interface by connecting to its IP address. This
connection can be directly through the 10/100 Ethernet port, in-band PPP over
any port, or in-band via encapsulated IP traffic on the Frame Relay circuit.
NOTICE: Any changes to the unit’s configuration MUST be followed by a
“Submit” (if there is a “Submit” button on the screen) and a
“Save and Restart.”
Web Server Interface 3-1
Page 34

To access the Web server interface, type the unit’s IP address in the browser’s
Address (or Location) field, and press the Enter key.
Layout of Interface Screens
When you first access the Web server interface, your browser will display a
screen that is divided into three frames. The upper frame forms a border
across the top of the screen; it identifies the Verilink unit in service and
displays the hardware and software revision and serial numbers under which
the unit is operating. The far right corner of the upper frame displays whether
or not a “Save an d Restar t” is nece ssary when param eters are change d on the
currently displayed screen.
The area beneath the upper frame is divided into two side-by-side frames. The
frame on the left side of t his area d epicts a hierarch ical “tree” structure used
to navigate through the various interface screens. Each “branch” on the tree
guides you to more specific upper-level information about the unit and its
configuration. Note that the Interfaces, Applications, and Utilities branches do
not link to a page − these branches simply provide structure for navigation.
The frame on the right side of the screen will display the actual configuration
screen. The screen captures throughout this chapter show only the
configurat ion portio n of the screen, except in t he case of the Un it screen ,
which sh ows all t hree frames . The Un it scr een represe nts the to p of the
navigation tree.
Unit Screen
The Unit screen in Figure 3.1 is the first screen displayed by the unit’s Web
server in terface. It lets you view an d se t spec ific inform ati on a bout the u nit i n
service.
3-2 WANsuite 7105
Page 35

Figure 3.1
Unit Screen
The Unit screen displays the following fields:
Field Function
Object ID Display-only field used to point an SNMP agent to this ID.
Up Time Displays the amount of time the unit has been up and running.
Contact Used to store the name of a point-of-contact for system failure.
Name Read/write field that holds the unit’s nam e.
Location Read/writ e field that holds the unit's location.
FrameStart ID Re ad/write field that holds the unit's ID, which uniquely
identifies the unit and is used in the FrameStart applications.
User Definable
Fields
Read/write fields for user-s pec ific labels and values. Inform ation
resides in non-vola tile memory.
Time Read/write field that holds the unit's internal time setting in
standard 24-hour HH:MM:SS format.
Date Read/write field that holds the unit's internal date setting in
standard MM/DD/YY format.
Web Server Interface 3-3
Page 36

The Unit screen provides the following user-activated buttons:
Button Function
Submit Sets any values that have been changed. The top “Submit”
button sets any unit parameters changed in the upper section of
the screen, and the lower “Submit” button sets the real-time
clock.
Maintenance Reset Brings up a screen where you can reset unit to its default TDM
or Packet, Packet 3, or Packet 4 configuration.
Save and Restart Saves the cu rrent configuration and performs a restart.
Maintenance Reset
Save and Restart
Use this button to access a screen where you can perform a Maintenance
Reset (Figure 3.2Figure 3.2). When you click on the arrow in the pull-down
menu box on the screen, you will have the option to perform a TDM, Packet,
Packet 3, or Packet 4 reset. When you select one of these options, all previous
configurations will be lost and the unit will be set back to the specified
factory default.
Figure 3.2
Maintenance Reset Screen
Use this button to save the current configuration settings and proceed with the
restart as shown in Figure 3.3.
3-4 WANsuite 7105
Figure 3.3
Save and Restart Screen
NOTICE: Performing a “Maintenance Reset” or a “Save and Restart” will
terminate communications with the unit.
Page 37

Interfaces
Network Screens
The WANsuite 7105 has the following interfaces: Network 1, Network 2,
Network 3, Serial 1, Serial 2, 10/100 Ethernet, and Supervisory. Each of the
interfaces and their associ ated screen s/menus a re des cribed be low.
The Network 1 (shown below in Figure 3.4), Network 2, and Network 3
screens o ffer the sam e param eters ex cept for t he follo wing: the “Functio n”
parameter is found only on the Network 2 screen (top portion shown in Figure
3.5), and the “Timing” parameter is not included on the Network 3 screen
(top portio n shown in Figure 3 .6). Becaus e APS is configure d in the N etwork
2 screen only, there is an additional user-activated button, “Network APS,” on
the Network 2 screen that does not appear on either the Network 1 or
Network 3 screen. All three Network ports operate in the long-haul or shorthaul mode. The Network screens let you view and make changes to the
Network interface's configuration as described below. In addition, these
screens provide a table that displays the alarm values for the Network
interface.
Figure 3.4
Network 1 Scree n
Web Server Interface 3-5
Page 38

Figure 3.5
Network 2 Screen (T op Portion Only)
Function (Network 2
Only)
Figure 3.6
Network 3 Screen (T op Portion Only)
In the “Slaved” function, Network 2 timing is slaved to Network 1 and the
port operates as a DSX like Network 3. In the “Network” function, Network 2
combines with Seri al 2 to op erate as an indep enden t DSU/CS U. In th e “APS
Backup” function, Network 2 becomes a shadow of Network 1 by functioning
as a backup line for Network APS.
Values: Slaved, Network, APS Backup
Default: Slaved
NOTICE: The “Function” parameter fundamentally affects the operation of the
unit. Even though this parameter is found only on the Network 2 screen,
its setting affects all three Network ports and the Service table.
Mode
Line Build-Out (Long
Haul)
DSX Level (Short
Haul)
Framing
3-6 WANsuite 7105
Selects the network service type.
Values: Long-Haul, Short-Haul
Default: Long-Haul
Sets the transmit Line Build Out (LBO) for the Long-Haul Network interface.
Values: 0, −7.5, −15.0, −22.5 dB
Default: 0 dB
Specifies the DTE DSX-1 interface output level.
Values: 0−110, 111−220, 221−330, 331−440, 441−550, 551−660, >661 ft
Default: 0−110 ft
Selects the framing for the Network side of the DSU/CSU.
Values ESF, D4
Default: ESF
Page 39

Coding
Sets the Network side line coding.
Values: AMI, B8ZS
Default: B8ZS
Timing
Sets the timing source to synchronize the unit’s internal timing generators. In
all cases, slips are controlled to occur on frame boundaries at the Network
ports when timing synchronization is lost. The options are as follows:
Network 1
“Function” parameter (on the Network 2 screen) in “Slaved” Mode − Inte rnal,
Network 1, Network 2, Network 3, Serial 1, Serial 2
“Function” parameter (on the Network 2 screen) in “Network” Mode −
Internal, Network 1, Network 3, Serial 1
“Function” parameter (on the Network 2 screen) in “APS Backup” Mode −
Internal, Network 1, Network 3, Serial 1, Serial 2
Network 2
“Function” parameter in “Slaved” or “APS Backup” Mode − timing parameter
is ignored
“Function ” parameter in “Netwo rk” Mode − Internal, Network 2, Serial 2
Definitions of the timing sources are as follows:
Internal – The unit’s internal frequency standard (T1 1.544 Mbps ± 50 bps)
is used for all timing.
Network 1, Network 2, Network 3 – Timing is derived from the Network
port recovered clock.
Zero Suppression
PRM Enable
Learn DS 0s on Boot
Serial 1, Serial 2 – Timing is derived from the Serial port recovered clock.
Determines whether ones density insertion is activated after 15 zeros. This
parameter is ignored if the Coding parameter is set to “B8ZS.”
Values: Disable, Enable
Default: Disable
Lets you establish which performance messaging standard will be employed
to initiate Performance Report Message (PRM) functions. Setting this field to
“Enable” instructs the unit to use ANSI T1.403, which sends a PRM once
every second. Setting this field to “Disable” instructs the unit to use AT&T
TR54016, which provides performance reporting on request only.
Values: Disable, Enable
Default: Disable
Determines if the unit will attempt to discover active DS0s after power-up or
Save and R estart. Active DS 0s will t hen be assigned to the firs t associ ated
network service.
Values: Disable, Enable
Default: Disable
Web Server Interface 3-7
Page 40

Learned D S0 Rate
Specifies the rate at which each disc overed DS 0 wil l be set.
Values: As 56K/64K
Default: As 64K
NOTICE: The unit will search for active DS0s for a maximum of 7 seconds if
learning “As 64k” and for 30 seconds if learning “As 56K.”
Error Status and Alarm Thresholds Table
The unit can be programmed to generate an alarm condition based on a
specific level of performance degradation. The Network screens present a
table that provides current error status and alarm threshold information.
Acceptable alarm thresholds are set for periods of 15 minutes (900 seconds)
and samp led every sec ond. Th e error type s listed in th e paragra phs below can
be preset to a value between 0 and 900 seconds. Setting a field to “0” (zero)
disables the alarm on that statistic. To effectively disable alarm reporting, set
all fields to “0” (ze ro).
The 15-minute time frame is not based on the TR 54016 or T1.403 interval
boundaries, but is a time window based on the accumulated counts over the
previous fifteen 1-minute intervals. In all cases, if the number of actual
network errored seconds in the previous 15 minutes reaches the preset
threshold for the specified error type, an alarm condition is declared.
ES
SES
LOSS
The four columns o f the s tatus tab le are as follows:
• Status Displays the current status of the Network port.
• Alarm Displays t he alarm value of the Ne twork po rt. The u nit
declares an alarm as soon as the count exceeds the threshold
set.
• Count Displays t he numb er of eve nts or o ccurrence s of this statistic
that have been detected.
• Threshold A read/write field that can be set to a desirable threshold.
The table provides error sta tus and alarm thre shold in formation f or the
following error pa rameters:
Sets the Errored Seconds (ES) threshold. An ES is a 1-second period in which
at least one logic error occurred. The default value is 45 seconds.
Sets the Severely Errored Seconds (SES) threshold. An SES is a 1-second
period in which at least 320 Cyclic Redundancy Check (CRC) errors or one
Out -o f -F rame (O OF) err or occurred . The de fault val ue is 5 sec onds.
Sets the Loss of Signal Seconds (LOSS) threshold. A LOSS is a 1-second
period in which the T1 received signal is interrupted. The default value is 5
seconds.
3-8 WANsuite 7105
Page 41

UAS
Sets the Unavailable Seconds (UAS) threshold. A UAS is a 1-second period
in which consecutive severely errored seconds cause an unavailable state. The
default is 0 (zero) seconds (Disabled).
CSS
BPVS
OOFS
AISS
RAS
Reset Timer
Sets the Controlled Slip Seconds (CSS) threshold. The default is 0 (zero)
seconds (Disabled).
Sets the Bipolar Violation Errored Seconds (BPVS) threshold. A BPVS is a 1second period in which at least one bipolar violation occurred. The default is
0 (zero) seconds (Disabled).
Sets the Out of Frame Seconds (OOFS) threshold. An OOFS is a 1-second
period in which a frame sync loss occurred. The default value is 5 seconds.
Sets the Alarm Indication Signal Seconds (AISS) threshold. An AISS is a 1second period when unframed all ones are received. The default is 0 (zero)
seconds (Disabled).
Sets the Remote Alarm Seconds (RAS) threshold. A RAS is generated by the
terminal equipment when an improper signal is received from the facility (or
upon receipt of unframed all ones). The default is 0 (zero) seconds (Disabled).
Sets the Reset Timer threshold. This field is the contiguous number of
seconds that an alarm parameter must be clear before the alarm is reset.
Applicable values range from 000 through 900. A value of “000” means the
alarm will never be reset.
The Network screens provide the user-activated buttons described in the table
below.
Button Function
Submit Sets any values that have been changed.
Network APS
(Network 2 Only)
Clea r Al ar ms Reset s th e al ar m condi ti o ns and co u nt s to zer o .
Learn DS0s Now Learn s whic h DS 0s are active and assigns the m to the first
Performance Displays a Network Performance/Summary screen (Figure 3.9)
Channels Displays the Ch annel Table Details Scr een on page 3-28,
Displays the Network APS screen (Figure 3.7) where APS
configuration parameters can be set or changed and APS
performance data can be acc essed and monitored (Figure 3.8).
associated network service. Learned DS0s are based on the idle
pattern specified in the Channel Table (see below).
that shows a summary of the current count of the number of
error events that have occurred over the past 24 hours and the
past 30 days.
showing each channe l by index number. Each chann el’ s rate and
service (by number) are displayed and can be changed through
user in pu t , as can the Id le P attern. Pa ir in f o r m ation is als o
displayed on this scre en.
Web Server Interface 3-9
Page 42

CAUTION: Performance data will be lost upon power cycle or after performing a
Maintenance Reset or a Save and Restart.
Network APS Screen
Configuration of APS parameter s and access to collected activit y data are
accessible on the Network APS screen shown in Figure 3.7.
Figure 3.7
Network APS Screen
Mode
Manual Inhibit
3-10 WANsuite 7105
Four modes are available to the Network APS. In the TR54017 Mode, units
on each end of the links work together to provide one-way protection (i.e.,
only the impaired direction of service will be restored). In the Auto A/B
Mode, the unit operates as a single-ended A/B switch that can automatically
switch from the active line to the stand-by line if the active line can no longer
carry servi ce. Unit s configu red for th e Alter nate Carr ier Mode w ork toget her
so that both carry service on the same line. In the Alt Master Mode, the unit
is configured as the Master side of the Alternate Carrier Mode. In the Alt
Slave M ode, the unit is con figured as the S lave side o f the Al ternate Carrier
Mode.
Values: TR54017, Auto A/B, Alt Master, Alt Slave
Default: TR54017
Three options are available for manually inhibiting a line. If set to “Disabled,”
neither line is manually inhibited from carrying service. If set to “Primary,”
Page 43

the Primary line is inhibited from carrying service. If set to “Backup,” the
Backup line is manually inhibited from carrying service.
Values: Disabled, Primary, Backup
Default: Disabled
Revert
Status
ES Threshold
If disabled, service does not return to the primary line until the backup line
fails. If enabled, service automatically returns to the primary line when the
primary line is able to carry service again.
Values: Disable, Enable
Default: Disable
Network APS Status Table
In addition to the configurable fields listed above, the Network APS screen
displays a table that lets you set specific thresholds and view the Primary and
Backup Line status for other parameters listed below.
Indicates t he status of the s pecified li ne. The s tatus ca n be “D isabled” i f the
Network APS function is not enabled on the Network 2 configuration screen.
Otherwise, the line status is either “Active” or “Stand-By” with any of the
following qualifiers appended: /Failed, /Inhibit, or /LB. The /Failed qualifier
is appended when the carrier fails or when either the Errored Seconds or
Consecutive Severely Errored Seconds threshold is reached. The /Inhibit
qualifier is appended when the Errored Seconds threshold or Consecutive
Severely Errored Seconds is manually inhibited or when the far end inhibits
the line. The /LB qualifier is appended when the line is in a loopback test.
Sets the number of errored seconds in a 15-minute period before a transfer
request is triggered. Setting the threshold value to zero disables this event
from causing a line transfer.
Values: 0−900 s
Default: 20 s
ES Count
ES Switch Event
CSES Threshold
CSES Count
Indicates number of errored seconds in the current 15-minute historical
interval. This count is cleared at the beginning of a new 15-minute historical
interval. I t is also cleared w henever t he line be comes available to carry
service.
Indicates if an exceeded ES threshold has caused a transfer to the standby
line.
Sets number of consecutive severely errored seconds before a transfer request
is triggered. Setting the threshold value to zero disables this event from
causing a line trans fer.
Values: 0−900 s
Default: 2 s
Indicates number of consecutive severely errored seconds in the current 15minute historical interval. This count is cleared whenever a non-severely
errored sec ond occu rs.
Web Server Interface 3-11
Page 44

CSES Switch Event
Indicates if an exceeded CSES threshold has caused a transfer to the standby
line.
Availability Timer
Minimum amount of time free of errors during active events that must expire
before this line is returned to service availability.
Values: 0−900 s
Default: 900 s
The Network APS screen provides the user-activated buttons described in the
table below.
Button Function
Submit Sets any values that have been changed.
Clear Primary Even ts Clears the primary line APS events and counts.
Clear Backup Events Clears the backup line APS eve nts and counts.
Primary History Displays the primary line history of APS activity in 15-
minute buckets for the past 24 hours (Figure 3.8).
Backup History Displays the backup li ne histo ry of APS ac tivit y in 15-minut e
buckets for the past 24 hours.
Figure 3.8
Network APS 24-Hour His tor y
Period
Timestamp
Occurrences
Duration
Status
3-12 WANsuite 7105
Period for which the APS 24 Hour History is displayed.
Time when the historical period was completed.
Number of times active line has been switched to standby line.
Number of seconds service was provided on this line.
Displays the status of this line at the end of the period.
The APS 30 Day History screen and the Backup History screens include the
same parameters found on the APS 24 Hour History screen.
Performan ce screen s for N etwork in terfaces ot her tha n APS a re shown below.
Page 45

Performance Screens
The “Performance” button on the Network screen will display a Performance
Summary screen (Figure 3.9), which displays a summary of the error events
that have occurred over the past 24 hours and 30 days.
In addition to the error parameters found in the Error Status and Alarm
Thresholds Table on page 3-8, the following error parameters are included on
the Network Performance/Summary table:
BES
LOFC
CRCES
A Bursty Error Second (BES) is a 1-second period during which more than
one but fewer than 320 CRC6 errors occurred.
The Loss of Frame Count (LOFC) represents the number of times a loss of
frame is declared. A loss of frame is declared after 2.5 seconds of continuous
loss of signal or OOF.
A Cyclic Redundancy Check Errored Seconds (CRCES) is a method of
confirming the integrity of received data.
Beneath t he Perfo rmance/Cu rrent scre en are two butt ons: “Per formance 24
Hour” and “Performance 30 Day.” Clicking either of these buttons will
display a detailed summary of the error events that have occurred during each
15-minute interval of the past 24 hours (Figure 3.10) or during each interval
(day) of the past 30 days (Figure 3.11).
Figure 3.9
Network Perfor mance/Summary Screen
Web Server Interface 3-13
Page 46

Figure 3.10
Perf orman ce 24 Hour Screen
Serial Screens
Figure 3.11
Perf orman ce 30 Day Scre e n
NOTICE: All references in this manual to the Serial 1 and Serial 2 interfaces
correspond directly to the WANsuite 7105’s Data 1 and Data 2 ports,
respectively.
The parameters on the Serial 1 and Serial 2 screens except for the “Rx Invert
Clock” parameter, which is found only on the Serial 2 screen; therefore, only
the Serial 2 screen (Figure 3.12) is shown below.
3-14 WANsuite 7105
Page 47

Figure 3.12
Serial 2 Screen
Type
Mode
This param eter sel ects the ty pe of i nterface ( based on i ts elec trical signa l
character istics) used by the equipmen t conne cted to th e Serial po rt.
Values: V.35, RS-232, EIA-530, EIA-530A
Default: V.35
NOTICE: V.35 requires the use of an optional cable. Refer to Optional Equipment
on page A-7 for ordering information.
By default, the Serial port serves as a DCE port in both Packet and TDM
Modes. However, the Serial port can serve as a DTE port when the unit is in
Packet M ode.
If the Serial port connects to a DTE device (such as a FRAD or a router), the
Mode parameter must be set to “DCE.” If this port connects to a DCE device
(such as a DSU/CSU), this parameter must be set to “DTE” (valid only for
Packet Mode, not TDM).
Values: DCE, DTE
Default: DCE
NOTICE: DTE Mode requires the use of an optional DTE cable. Refer to Optional
Equipment on page A-7 for ordering information.
Packet Rate
If the port is running in Packet Mode, the Rate must be configured to the
desired port speed (in bits per second). In TDM Mode, the port speed rate will
Web Server Interface 3-15
Page 48

be set by configuring the next four parameters (Start Channel, Number of
Channels, Bundling, and Channel Rate).
Values: Synchronous, nx64 kbps (where n = 1–32) or nx56 kbps (where
n = 1−31); or asynchronous, 1200, 2400, 4800, 9600, 19200,
38400, 57600, 115200 bps
Default: 1536 kbps
Bundling
Start Channel
Number of Channels
Selects whether the DTE channel assignment is made as a “Contiguous”
group or as “Alternate” channels. Selecting “Alternate” ensures ones density.
Because the unit allows individual channels to be configured for a service, a
value of “Arbitrary” will be returne d for this parame ter if the current channel
allocation is not contiguous or Alternate. The “Arbitrary” value can only be
supplied by the unit − it cannot be set by the user.
Values: Contiguous, Alternate, Arbitrary
Default: Contiguous
NOTICE: Because “Alternate” Bundling assigns every other channel, only half
the channels are available.
Selects the starting channel in the 24-channel DS1 bit stream. Starting with
the specified channel, the unit automatically assigns the channels that follow.
Values: 1 through 24
Default: 1
Specifies the number of channels to be assigned to the DTE.
Values: 0 through 24
Default: 24
Channel Rate
Format
Tx Clock
3-16 WANsuite 7105
The unit can operate at any data rate that is a multiple of 56 or 64 kbps. If
“Νx64K” is selected, the ones density requirements of the T1 network line
must be ensured . If “Νx56K” is selected, ones density for the selected DS0
channel is maintained.
Values: Nx56K, Nx64K
Default: Nx64K
NOTICE: Start Channel, Number of Channels, and Channel Rate cannot be
changed if Bundling is not also changed from “Arbitrary.”
Selects the port’s operating mode.
Values: Sync, Async
Default: Sync
Selects the clock the unit uses to sample the data transmitted from the DTE.
When se t to “ In tern al, ” th e da ta i s sa mple d d irec tly wi th th e t rans mit data
Page 49

clock that is also supplied to the DTE as Transmit Clock. The “External”
option uses the external clock from the DTE.
Values: Internal, External
Default: Internal
NOTICE: The “External” option is valid only in Packet Mode.
TX Invert Clock
RX Invert Clock
(Applies to Serial 2
Screen Only)
Flow Control
Character Size
Data is received from the customer’s equipment on the other clock edge.
Values: Disable, Enable
Default: Disable
NOTICE: You will need to change this parameter if the propagation delay on the
serial cable causes data errors. This acts as a manual data aligner.
The Rx Invert Clock parameter is only available for use in DTE Mode on the
Serial 2 port. Consequently, this configuration option should remain disabled
when configuring services for the Serial 1 port. Data is sent to the customer’s
equipment on the other clock edge.
Values: Disable, Enable
Default: Disable
Selects the type of flow control to be used if the port is asynchronous.
Values: None, Xon/Xoff, RTS/CTS
Default: None
Selects the number of bits required to make up one asynchronous character.
Values: Five, Six, Seven, Eight
Default: Eight
Parity
Stop Bit
RTS
Sets the parity bit if the port is asynchronous.
Values: None, Odd, Even
Default: None
Selects the number of bits required to end the asynchronous character.
Values: 1, 2
Default: 1
The Request To Send parameter determines the source from which the unit
reads the RTS signal status. If set to “Normal,” the unit gets RTS from the
DTE on the Serial interface. If set to “Forced True,” RTS is always perceived
as “On.”
Values: Normal, Forced True
Default: Normal
Web Server Interface 3-17
Page 50

RTS/CTS Delay
The Request To Send/Clear To Send parameter determines how long the unit
waits before it changes the level of CTS to match RTS when the CTS
parameter is set to “Internal.”
Values: Normal (~30 ms delay), Long (~100 ms delay)
Default: Normal
CTS
DCD
DSR
LL
The Clear T o Send p arameter can be set to “Forced Tr ue,” “For ced Fal se,” or
“Internal.” If this parameter is set to “Internal,” the CTS control lead follows
the Request to Send (RTS) control lead from the DTE after a delay of a
duration established by the RTS/CTS Delay parameter.
Values: Forced True, Forced False, Internal
Default: Fo rced Tru e
The Data Carrier D etect p arameter ca n be se t to “Forc ed True ,” “Forced
False,” or “Intern al.” If se t to “Intern al,” DC D is “O n” when network carrier
is being received from the remote end, and is “Off” when network carrier is
not being recei ved from the far end.
Values: Forced True, Forced False, Internal
Default: Fo rced Tru e
Data Set Ready can be set to “Forced True,” “Forced False,” or “Internal.”
The “Internal” option sets DSR “On” if the port is enabled and “Off” if the
port is disabled.
Values: Forced True, Forced False, Internal
Default: Fo rced Tru e
The Local Loopback parameter can be set to “Enable” or “Disable.” Selecting
“Enable” allows the unit to go into Local Loop when the LL pin on the Serial
port goes high. The unit exits the loop when the LL pin goes low. If you
select “Disable,” the unit ignores the LL pin on the Serial port.
Values: Disable, Enable
Default: Disable
V.54
Current Pin Status
3-18 WANsuite 7105
Selecting “Enable” allows the unit to respond to in-band V.54 loop codes. If
you select “Disable,” the unit ignores these codes.
Values: Disable, Enable
Default: Disable
Shows the status of the DTE Serial port pins.
DTR Alarm Control and Status Table
In addition to the configurable fields, the Serial screen displays a table that
lets you set the Data Terminal Ready (DTR) Alarm Control parameters and
view the c urrent DT R Alarm Statu s.
Choices for DTR Alarm Control are “Enable” and “Disable”; the default
setting is “Disable.” Setting DTR Alarm Control to “Enable” allows the unit
to go into alarm on a loss of DTR, which occurs when the Serial port detects
that the D TR s ignal is low . Th e DTR Stat us fi eld indi cates the cu rrent state o f
the DTR alarm.
Page 51

To make changes to any Serial port parameter, simply set the parameter to the
desired selection and click the “Submit” button at the bottom of the screen.
10/100 Ethernet Screen (IP Service Details)
The 10/100 Ethernet (IP Service Details) screen (Figure 3.13) lets you
configure the IP parameters described below.
Unit IP Address
Subnet Mask
Gateway IP Address
Figure 3.13
10/100 Ethernet (IP Service Details) Screen
A unique network address assigned to this unit.
Defines the network portion of the unit’s IP address.
IP address of the default gateway (router) on the LAN side of the unit.
DHCP Client
Client Identifier
Physical Add ress
If DHCP Client is enabled at power-up, the unit will request its IP, Mask, and
Gateway addresses from a DHCP server located on the LAN side of the unit,
and the unit will use these addresses. If the DHCP request is unsuccessful, the
unit will use the configured addresses shown on this screen.
NOTICE: Always verify that a DHCP server is available on the network before
enabling DHCP Client. If, on power-up, a DHCP server is not found, a
60-second timeout will occur.
Displays a unique identifier for a specific IP address.
Displays unique MAC address.
NOTICE: If you manually change the IP address, you must “Save and Restart.”
(See Save and Restart on page 3-4.) The first three address parameters
above can also be configured using the Installation Wizard on page 2-2.
Web Server Interface 3-19
Page 52
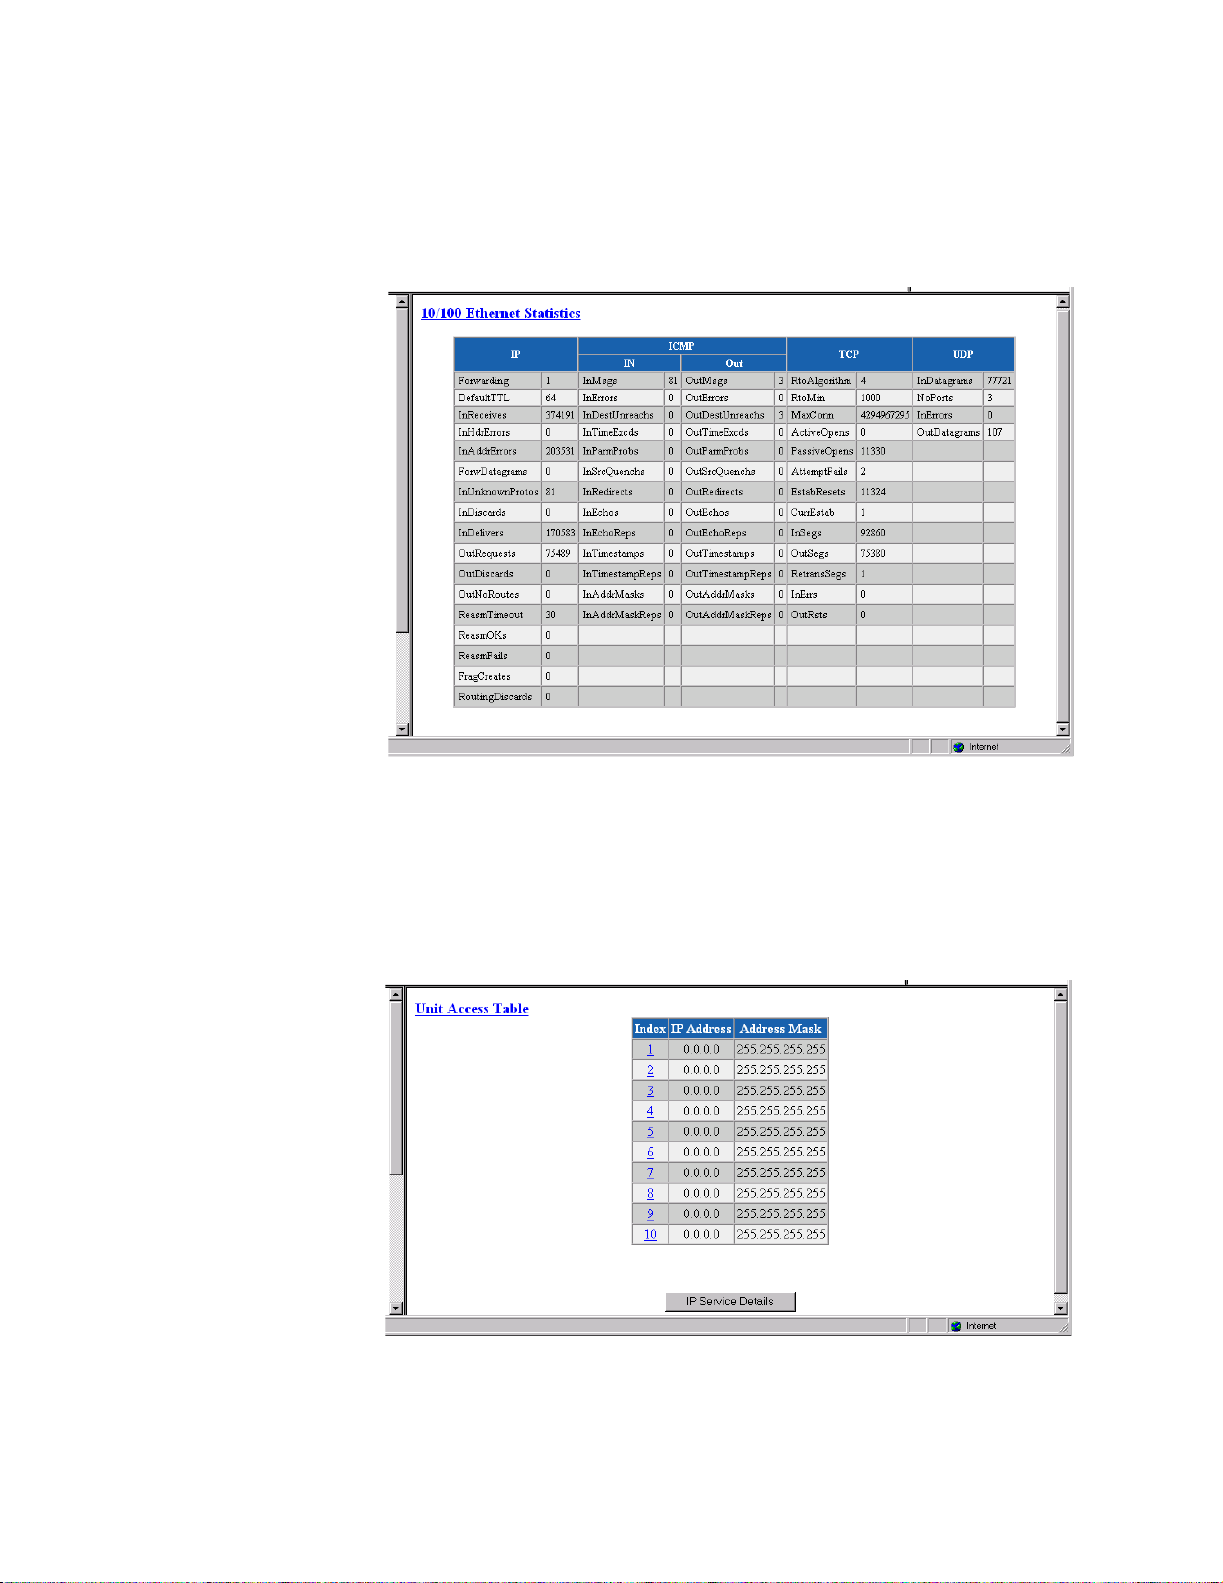
To view details about the current condition of IP, ICMP (In and Out), TCP,
and UDP parameters, click on the “Ethernet Stats” button at the bottom of the
screen. The Ethernet Statistics screen (Figure 3.14) contains no user-selectable
fields or options; it is simply a representation of the applicable MIB II
parameters.
Figure 3.14
Ethernet Stats Screen
Click on the Unit Access Table button on the Ethernet (IP Details) screen to
view the Unit Access Table (Figure 3.15), which specifies up to 10 different
IP networks that may access the unit’s parameters. If no IP networks are
supplied, any host may access the unit. Select any Index number on the table
to view the Unit Access Details (Figure 3.16) that correspond with that Index
number.
3-20 WANsuite 7105
Figure 3.15
Unit Access Table
Page 53

Figure 3.16
Supervis ory Screen
The Supervisory screen (Figure 3.17) displays the current speed of the
Supervisory port interface, and other asynchronous parameters.
Unit Access Details
Speed
Character Size
Diagnostic Messages
Figure 3.17
Supervisor y Screen
Changes the Supervisory port speed (in bits per second).
Values: 1200, 2400, 4800, 9600, 19200, 38400, 57600, 115200
Default: 19200
Selects the number of bits required to make up one asynchronous character.
Values: Five, Six, Seven, Eight
Default: Eight
Enables the Supervisory port to send out diagnostic messages upon power-up.
Values: Enable, Disable
Default: Enable
NOTICE: When in SCADA Mode, these diagnostic messages disrupt the connected
device. Therefore, if using the SCADA Mode, set this value to
“Disable.”
NOTICE: Diagnostic Messages must be set to “Enable” for the Verilink
Configuration Wizard to work.
Web Server Interface 3-21
Page 54

Parity
Sets the parity bit.
Values: None, Odd, Even
Default: None
Stop Bit
Current Pin Status
Selects the number of bits required to end the character.
Values: 1, 2
Default: 1
Shows the status of the DTE Supervisory port pins.
DTR Alarm Control and Status Table
In addition to the configurable fields, the Supervisory screen displays a table
that lets you set the Data Terminal Ready (DTR) Alarm Control parameters
and view the curre nt DTR Alarm Status .
Choices for DTR Alarm Control are “Enable” and “Disable”; the default
setting is “Disable.” Setting DTR Alarm Control to “Enable” allows the unit
to generate an alarm on loss of DTR, which occurs when the Serial port
detects that the DTR signal is low. The DTR Status field indicates the current
state of th e DTR alarm.
Services Screen
The Services screen (Figure 3.18) provides a view of the unit’s defined
services and displays the Interface, Type, and Pair parameters for each
service.
Figure 3.18
The Status for a particular service will display as one of the following:
Services Screen
• Dead − The service is not functional because required resource s are not
available.
• Changed − The service parameter was changed and a Save and Restart is
required for the service to function.
• Down − The service is not able to pass data because the physical layer is
down.
3-22 WANsuite 7105
Page 55
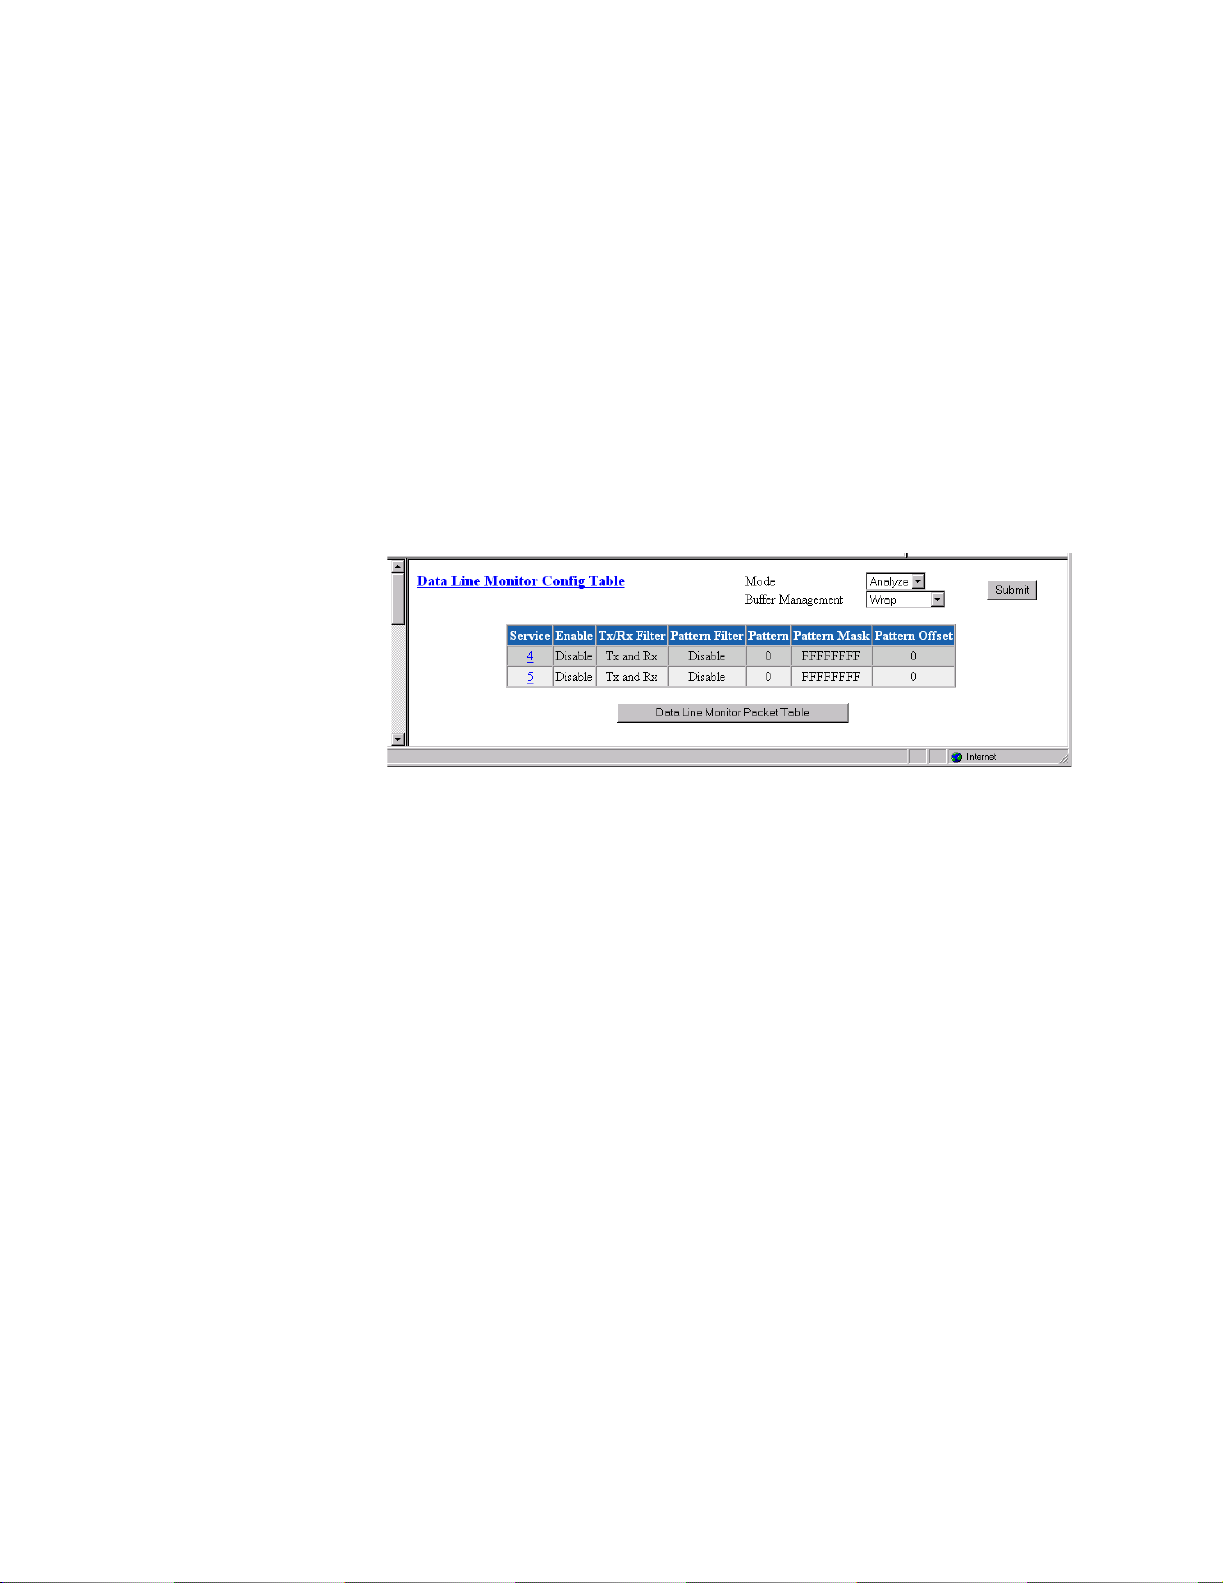
• Physical Up − The service is not able to pass data because it has not
completed any required negotiations.
• Up − The service is ready to pass data.
• Idle − The service has nothing to do.
The table in the cen ter of th e scree n displays the avai lable serv ices list ed by
index number. To view more detailed information about a service, click on
the index number associated with the desired service on the Services screen
and then click on one of the user-activated “Details” buttons on the Service
Details screen as described on page 3-25.
Data Line Moni tor Conf iguration Table
Click on the Data Line Monitor Config Table butt on at the top of the Service
screen to view a screen that displays SCADA port information (Figure 3.19).
Mode
Buffer Management
Service
Enable
Figure 3.19
The two m odes ava ilable are “Analy ze” and “Live.” T he Live Mode l ets you
capture data and create a usable text file of the captured data. In Analyze
Mode, the packet switch will return the data via the Data Line Monitor Packet
Table (see Figure 3.20) whereas in the Live Mode the Data Line Monitor
Packet Tab le will a ppear empty for SNMP calls.
Displays whether displayed data is set to “Wrap” or “Stop on Full.”
Indicates which service is being monitored.
Displays whether capture is Enabled or Disabled.
Data Line Monitor Config Table
Tx/Rx Filter
Pattern Filter
Pattern
Pattern Mask
Pattern Offset
Displays the direction of the captured data.
Displays the Enable/Disable status of the Packet Filter.
Displays which specific pattern is being searched for.
Displays the bits the unit is looking for.
Displays the offset in the packet that matches the pattern. If the offset is set to
255, the f ilter will s earch the packe t for the pa ttern.
Web Server Interface 3-23
Page 56

Click on t he “Data Line M onitor P acket Tab le” butt on at the b ottom of the
screen to view the table that displays the captured data. The screen shows
about 10 lines of active data, and if a line is selected, the screen will display
further decoded data below.
Figure 3.20
Data Line Monitor Packet Table
The Data Line Monitor Details screen (Figure 3.21) is displayed by clicking
the appropriate Services link on the Data Line Monitor Config Table screen.
You use this screen to define the parameters listed above.
Figure 3.21
Data Line Monitor Details Screen
3-24 WANsuite 7105
Adding a Service
To add a service, begin by clicking the “Add Service” button on the Services
screen. A new service listed by the next incremental index number will appear
on screen. The Interface for the newly added service will be “Unassigned.” To
assign an interface for the new service, click on its index number, which will
take you to the Service Details screen described below.
NOTICE: Any changes to settings in the Service Table require a “Save and
Restart” for them to take effect.
Page 57

Service Details Screen
Clicking on an index number under the Service Index column will display a
Service Details screen such as the one shown below (Figure 3.22). (In this
example, the selected service type is Fra me Relay.)
Figure 3.22
Service Details Scree n
The Service Details screen lets you change for each service the parameters
listed below.
Parameter Options
Interface Una ssigned, Supervisory, Network 1, Network 2, Network 3,
Serial 1, Serial 2, 10/100 Ethernet, Virtual*
Type TDM, PPP, Frame Relay, SCADA, IP, tty
Pair User - assigned integ er field that spec i f ie s w he r e to ro u t e th e tr affic
from this Service. If the Service is terminated by the unit, set this
value to “0 ” ( zero) .
* PPP is the only service that may be attac hed to the Virtual inter face. You would choose the
Virtual in terface for PPP if you elected to run PPP over Frame Rel ay. When you attach PPP to
the Virtual interf ace, you must supply an endpoint over which to send PPP encapsulated da ta,
and that endpoint must be for a Frame Relay D L CI.
In addition, the Service Details screen provides the following user-activated
buttons:
Button Function
Submit S ets any values that have been changed.
Interface Details Opens the Details screen for the Interface of the currently select ed
service.
Type Details Opens the Details screen for the Type of the current ly s elected
service.
Delete Service Opens the Confirm Delete Service screen.
Web Server Interface 3-25
Page 58
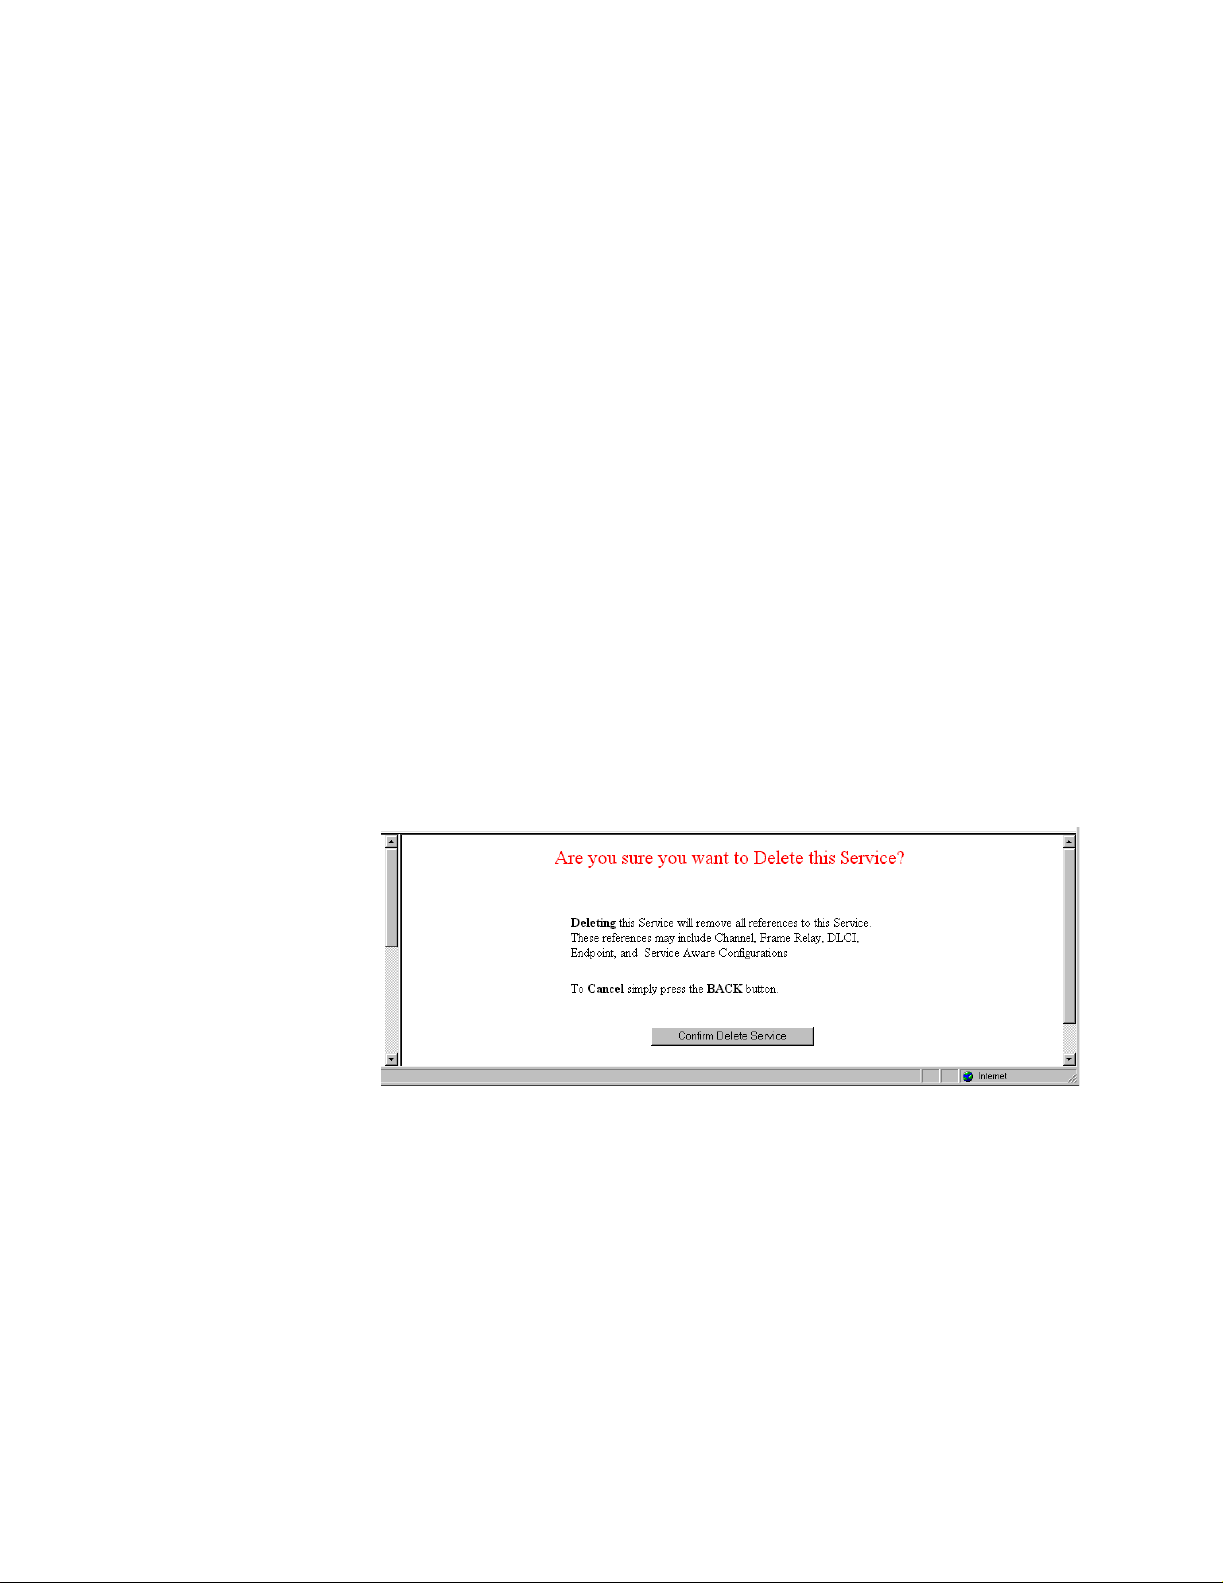
Interface Details Button
Clicking the “Interface Details” button on the Service Details screen lets you
view inte rface param eters for the se lected ser vice. Yo u will also see th e
interface parameters for the selected service if you click on the interface under
the “Inte rface” col umn on t he Serv ices screen .
Type Details Button
Clicking the “Type Details” button on the Service Details screen lets you
view (an d, in some cases, c hange) interface p aramete rs for the specified
service. The details displayed depend on the type of service currently in effect
for the s elected se rvice. Yo u will se e this sam e screen if you click on t he
service under the “Type” column on the Services screen. Type Details screens
for the various serv ices are presented be low.
Delete Service Button
Click the “Delet e Service” button to remove the currently conf igured service
identified by the Service Details screen. Deleting the selected service will
remove all references to this service.
After clic king the “Delete Service” button, you will b e present ed with a
confirmation screen (Figure 3.23). Click the “Confirm Delete Service” button
to confirm the removal of the selected service. To cancel, simply invoke your
browser’s “Back” function.
Figure 3.23
Confirm Delete Service Screen
DS0 Monitor Details Screen
To access the DS0 Monitor Details Screen, click on “TDM” in the Type
column on the Service Details screen. This screen lets you configure what are
considered high and low DS0 utilization parameters, and will report alarms if
the monitored statistics rise above or fall below those specified settings. This
helps determine customer load patterns so that channel bandwidth can be
reallocate d as neces sary.
3-26 WANsuite 7105
Page 59
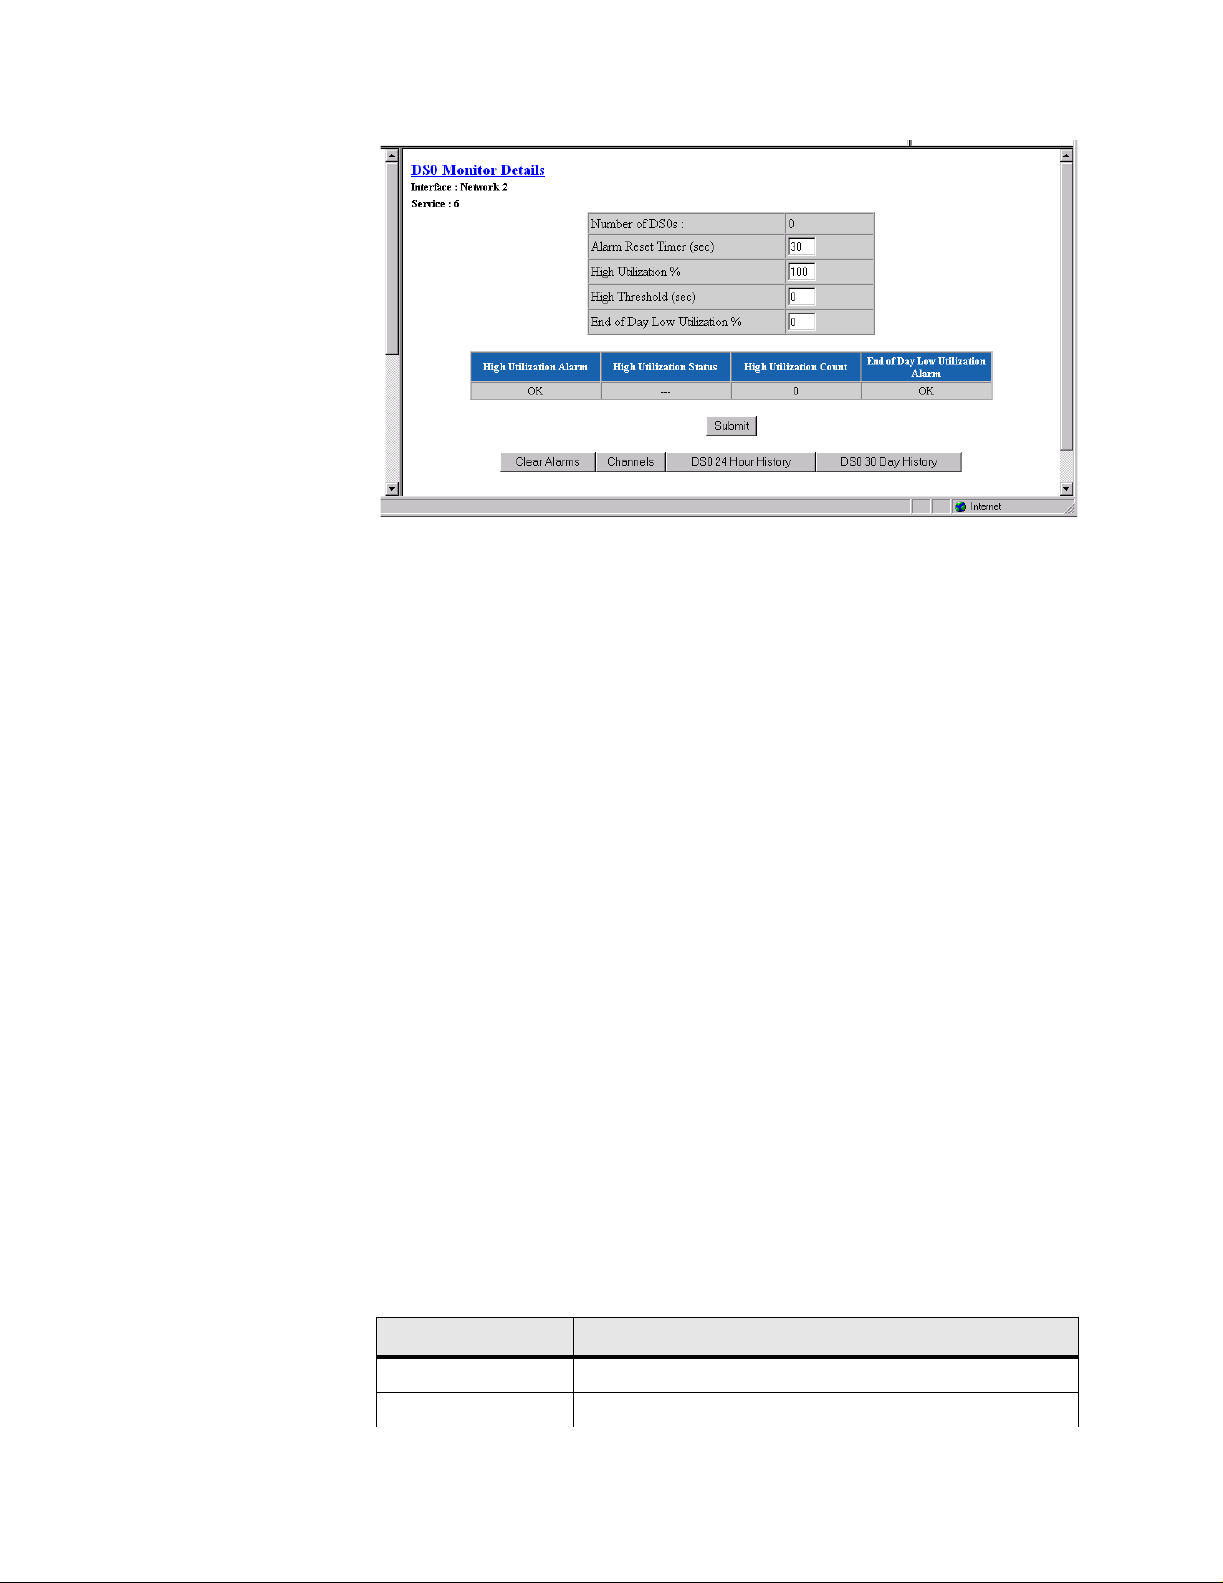
Figure 3.24
DS0 Monitor Details Sc re en
Number of DS0s
Alarm Reset Timer
(sec)
High Utilization %
High Threshold (sec)
End of Day Low
Utilization %
Number o f active D S0s (0 −24) assigned on a per-service basis.
Number of seconds that an alarm condition must not be present before an
alarm is re set. Ze ro (0) indi cates the Alarm R eset Tim er is dis abled.
Values: 0−900
Default: 30
Lets you configure as a percent what is considered high utilization.
Values: 1−100
Default: 100
Lets you configure a high-utilization threshold (in seconds), above which an
alarm will report.
Values: 0−900
Default: 0 (Disabled)
Lets you configure as a percent what is considered low utilization at the end
of the day. If the utilization is below this level when the day ends, an alarm
reports.
Values: 0−100
Default: 0 (Disabled)
DS0 Status and Alarm Table
Each second, the TDM services will count the number of active DS0s and
update their statistics. This table also gives the status of the alarms (OK,
Alarmed) related to DS0s.
The user-activated buttons listed below are at the bottom of the DS0 Monitor
Details screen.
Button Function
Submit Sets any values that have been changed.
Clear Alarms Clears all utilization alarms.
Web Server Interface 3-27
Page 60

Button Function
Channels Displays the Channel Table details for the Network 1,
Network 2, or Network 3 services (Figure 3.25)
DS0 24 Hour History Displays DS0 monitor history in 15-min buckets for the past
24 hours (Figure 3.26).
DS0 30 Day History Displays DS0 monitor history in 24-h r buck ets for t he past 30
days (Figure 3.27).
Figure 3.25
Channel Table Details Screen
Rate
Service
Pair
3-28 WANsuite 7105
The Channel Table Details screen lets you establish the Rate, Service, Pair,
and Idle Pattern p arameter s for any available c hannel . The scre en param eters
are described below.
The unit can operate at any data rate that is a multiple of 56 or 64 kbps.
Values: 56K, 64K
Default: 64K
Specifies the service to which this channel is allocated. Refer to the Service
Table to s ee how t he current servic es are co nfigured.
Channel number from paired service.
Values: 1−24
Default: Current channel number
Page 61

Idle Pattern
Selects the DS0 idle pattern sent by the unit and lets the unit determine if the
DS0 idle pattern has been sent by the other end.
Values: 0−FF (He x)
Default: 7F
Figure 3.26
Figure 3.27
DS0 Monitor 24 Hour History Screen
DS0 Monitor 30 Day History Screen
The DS0 Monitor 24 Hour History and 30 Day History screens show the
following statistics for the specified period.
Period
Timestamp
Period for which the DS0 monitor history is displayed.
System-up-time value during which the utilization historical period was
completed.
% Utilization of DS0(s)
Percent of DS0s utilized (−1, 0−100) over the period. A −1 indicates an
invalid value or unavailable data.
High Utilization (sec)
Number of seconds (0−900) greater than or equal to the high utilization
paramete r specified for the period i n the utili zation alar m tab le.
A “Clear History” user-activated button is also included on the 24 Hour and
30 Day History screens.
Frame Relay Service Details Screen
Click on “Frame Relay” under the “Type” column on the Services screen to
access th e Frame Relay Ser vice De tails screen (Figu re 3.28). This screen lets
you access the configuration parameters described in the paragraphs below.
Web Server Interface 3-29
Page 62
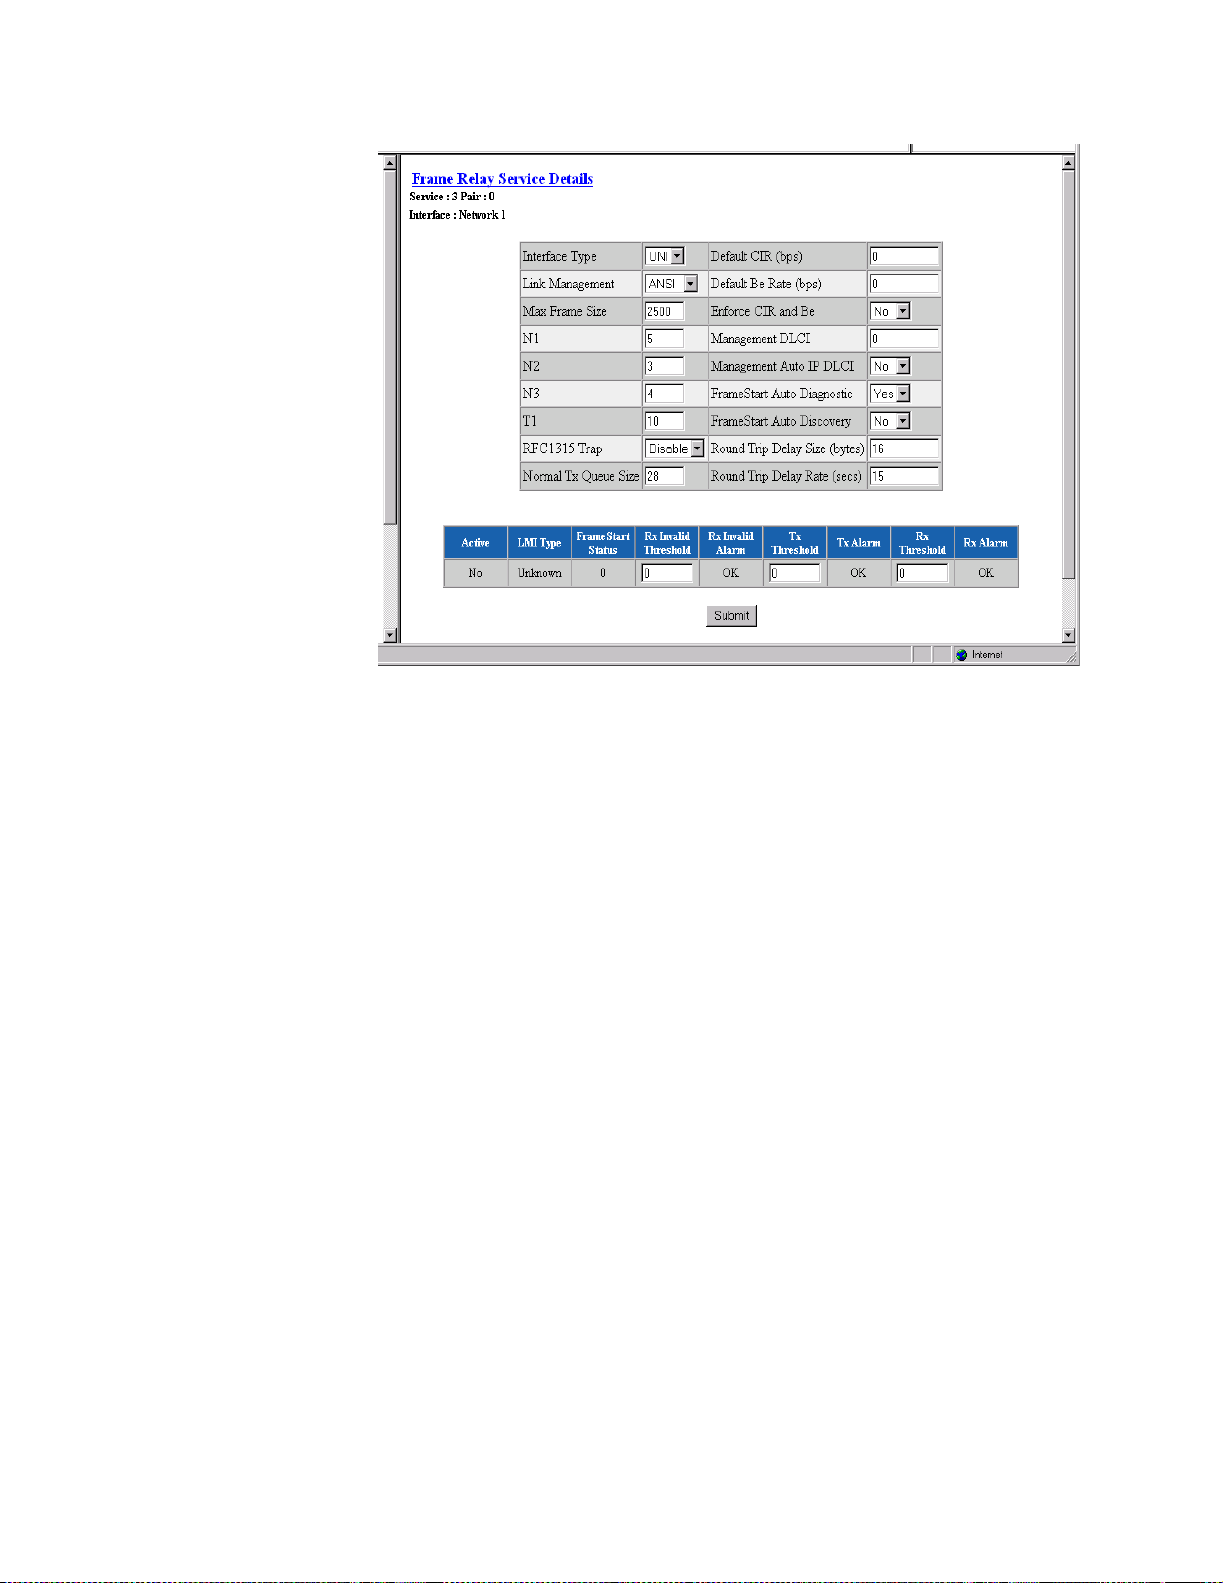
Figure 3.28
Frame Relay Service Details Screen
Interface Type
Link Management
Max Frame Size
If this service is conn ected to a Frame Relay net work, the Interface Type
should be set to “UNI” because it is the user side of a user-to-Network
interface. I f it is co nnected to a FR AD/ router, t he Inter fac e Type s hould b e set
to “NI” because it is the network side of a user-to-Network interface. If it is
connected to an equipment set for Network-to-Network interface, the Interface
Type should be set to “NNI.”
Values: UNI, NI, NNI
Default: UNI if interface is Network, NI if interface is Serial
Set this parameter to the link management used by the equipment connected
to it. If set to “Auto,” the unit will learn the link management type and
display it on the status portion of this screen.
Once it discovers the link management type, set the unit to the discovered
value so that subsequent unit or network re-initialization will be faster.
Values: Auto, ANSI, CCITT, LMI, None
Default: ANSI
If Auto Diagnostic is set to “Yes,” the unit will discard received frames that
are larger than the maximum frame size. If Auto Diagnostic is set to “No,”
these large received frames will be sent, but will be counted in the Rx Invalid
statistics.
Values: 64–4096
Default: 2500
N1
3-30 WANsuite 7105
This counter indicates the number of “keep alive” status inquiries sent
between full status requests.
Values: 5–255
Default: 5 if interfa ce is N etwork (U NI), 6 i f interfa ce is Serial (NI).
Page 63

N2
The N2 counter specifies the total number of link reliability errors and
protocol errors that can occur during the sliding event monitor count defined
by N3. If this count is exceeded, the port is declared inactive.
Values: 1–255
Default: 3
N3
This counter represents a Monitored Events Count. For a network, a
monitored event is the receipt of a status inquiry message or the expiration of
the polling verification timer T2. For a FRAD, a monitored event is the
transmission of a status inquiry message. This parameter defines the size of
the sliding window used by the unit to determine whether a channel or user
device is active.
Values: 5–255
Default: 4
T1
This parameter specifies the number of seconds the unit waits between issuing
status inquiry messages.
Values: 5–30
Default: 10
RFC1315 Trap
Normal Tx Queue Size
When this parameter is set to “Enable,” the unit will send the standard
RFC1315 frame relay DTE circuit state change trap every time a DLCI
changes state, provided at least one destination IP address for trap is
configured in the SNMP configuration.
Values: Disable, Enable
Default: Disable
Each Frame Relay service has two distinct transmit queues: one for normalpriority traffic and one for high-priority traffic. At this time, only SCADA and
TCP Server traffic are considered high-priority and are placed in the highpriority queue. All other types of traffic are placed in the normal-priority
queue.
This parameter defines how many normal priority frames can be put in front
of a high-priority frame. The software always checks for high-priority frames
before placing normal-priority frames in the transmit queue. However, once
the frames are in the hardware transmit queue, their order of transmission
cannot be changed.
If SCADA and/or TCP Server are not up, set this parameter to 28 (the
default). If SCADA and/or TCP Server are up, set this parameter according to
the SCADA host system’s ability to support higher latency. For example, if a
SCADA host system has a timeout of 500 ms when polling remote devices
through a DDS Fr ame Rel ay servic e, the No rmal Tx Q ueue S ize param eter
should be set to 2. This would allow two 1500-byte IP frames to be sent
between SCADA frames without reaching the 500-ms limit. If the SCADA
host application has a timeout lower than 500 ms, this parameter should be set
to 1. This then ensures a minimum latency for SCADA applications.
However, it will slow IP traffic since only one IP frame at a time can be
placed in the hardw are transmit queu e.
Web Server Interface 3-31
Page 64

Default CIR (bps)
This is the Committed Information Rate (in bits per second) provided by your
frame relay service provider. The unit will apply this value to each DLCI
learned from the network side to gather statistics and to perform CIR
enforcem ent, if req uired. If a DLCI i s configu red with a CIR different from
the default, the DLCI configuration will be used instead.
Values: 0–1536000
Default: 0
Default Be (bps)
Enforce CIR and Be
Management DLCI
Management Auto IP
DLCI
This is the Excess Burst Rate (in bits per second) provided by your frame
relay service provider. The unit will apply this value to each DLCI learned
from the network side to gather statistics and to perform CIR enforcement, if
required. If a DLCI is configured with an Excess Burst different from the
default, the DLCI configuration will be used instead.
Values: 0–1536000
Default: 0
If this parameter is set to “Yes,” the unit will enforce Committed Information
Rate and Excess Burst according to the Link Injection Parameter.
Values: No, Yes
Default: No
NOTICE: The Auto Diagnostic parameter must be set to “Yes” to enforce CIR and
Be.
If there is a DLCI entered (and submitted) in this field, it will be the only
DLCI that looks for in-band management packets. If a value of “0” (zero) is
entered in this field, all DLCIs will look for management packets.
If this parameter is set to “Yes,” the unit will monitor the specified
management DLCI for five pings over 5 seconds, after which the unit uses the
destination address as its management IP address.
LMI Sourcing
FrameStart Auto
Discovery
3-32 WANsuite 7105
If this parameter is set to “Yes,” the unit will source LMI messages for that
service. Set this pa rameter to “Yes” if the service is not paired .
When set to “No,” the unit will not be the source of LMI messages for that
service. LM I mess ages will be exchan ged tr ansparentl y betwee n the paire d
services.
Values: No, Yes
Default: No
NOTICE: If either side of the Frame Relay connection goes down, you will be
unable to remotely access any connected units.
When this parameter is set to “Yes,” the unit will send FrameStart discovery
and delay frames to each DLCI it learns as soon as the DLCIs are set active.
This is required to calculate round-trip delay as well as to discover remote
WANsuite units. This parameter should be set to “Yes” only on network
services that have a WANsuite unit(s) at the far end of the frame relay
Page 65

connection. Also, if set to “Yes,” the unit will gather SLA parameters such as
frame and data delivery ratio as defined in the Frame Relay Forum
Implementation, FRF.13. Those gathered statistics are then displayed on the
DLCI Statistics Screen on page 3-51.
Values: No, Yes
Default: No
Round T rip Delay Size
(bytes)
Round T rip Delay Rate
(secs)
Active
LMI T ype
FrameStart Status
Rx Invalid Thr eshold
Specifies the frame size (in bytes) to use when sending Round Trip Delay
packets.
Specifies the rate (in seconds) at which Round Trip Delay packets are sent.
Status and Alarms Table
The table displayed at the bottom of the Frame Relay Service Details screen
reports on the status and condition of LMI parameters and on Receive/
Transmit alarms and thresholds. Alarm threshold levels may be changed by
entering a new threshold value in the appropriate field of the table and
clicking the “Submit” button. Table fields are described below.
Read-only field shows whethe r or not (No or Yes) an alarm is act ive.
Read-only status indicates ANSI, CCITT, LMI rev. 1, or Unknown.
Read-only status indicates Sourcing, Monitoring, or 0.
Number of invalid frames received during a 15-minute interval after which an
invalid alarm will be triggered. Default of “0” disables this alarm.
Rx Invalid Alarm
Tx Threshold
Tx Alarm
Rx Threshold
Rx Alarm
Status of t his alar m indicat es OK o r Alarme d.
Number of bits per second sent during a 15-minute interval after which a Tx
alarm will be triggered. Default of 0 disables this alarm.
Status of t his alar m indicat es OK o r Alarme d.
Number of bits per second sent during a 15-minute interval after which an Rx
alarm will be triggered. Default of 0 disables this alarm.
Status of t his alar m indicat es OK o r Alarme d.
The Frame Relay Details screen provides the following user-activated buttons:
Button Function
Submit S ets any values that have been changed.
Frame Relay Statis tics Opens the Frame Relay Port Statistics scr een for the current
Frame Relay serv ice.
Web Server Interface 3-33
Page 66
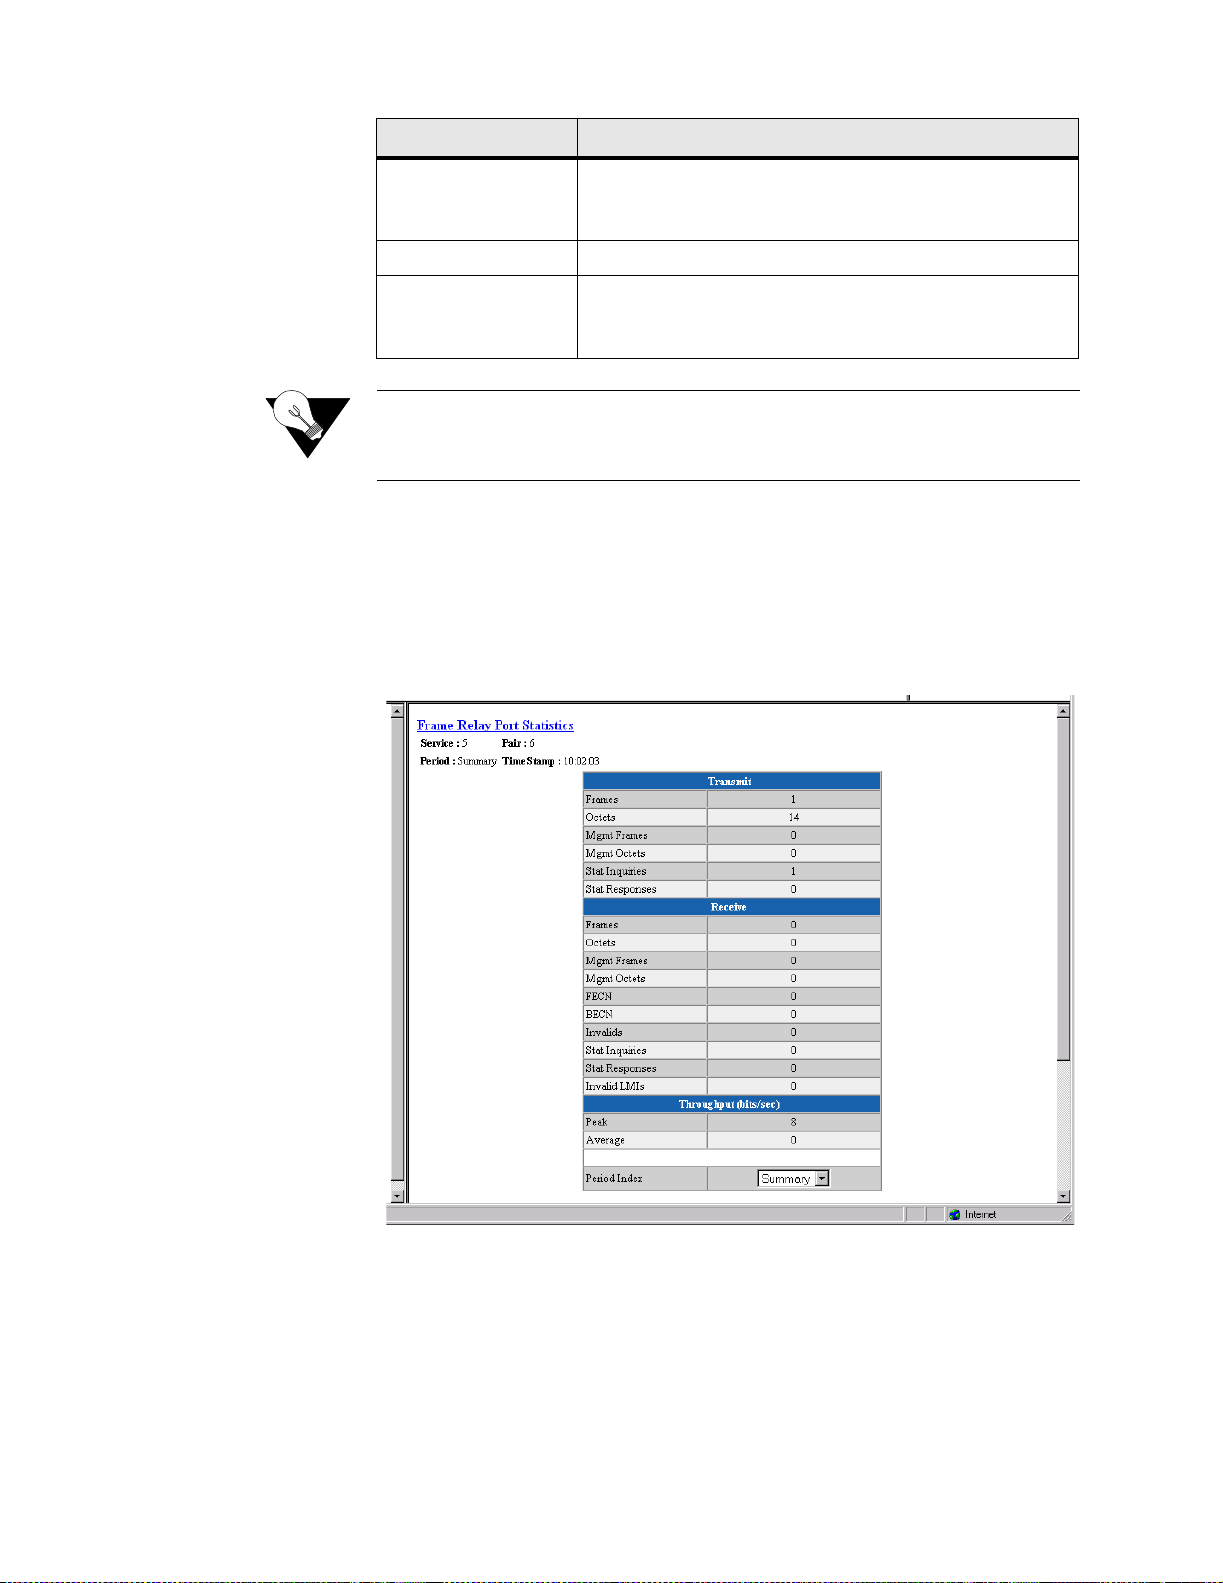
Button Function
DLCI Table Opens the DLCI Table screen, which displays all the DLCIs
on the current service. Refer to DLCI Table Screen on
page 3-52 for mo re information.
Clear Alarms Clears all Frame Relay alarms.
Pair Type Details Opens another Frame Relay Servic e Details scr een that
reverses the service and the pair so you can view both sides
of the pair.
NOTICE: When a “Submit” command is executed, the Frame Relay link will be
re-initialized with the new parameters, causing a brief interruption in
data transfer.
Clicking the “Frame Relay Stati stics” button br ings up a table (Figure 3.29) that
reports on the st atus and condition of LMI parameters and on Receive/Transmit
alarms and thresholds. Alarm threshold levels may be changed by entering a
new threshold val ue in the appropriate field on the Frame Relay Service Details
screen and clicking the “Submit” button.
Figure 3.29
Frame Relay Port Statistics Screen
Frames
Octets
Mgmt Frames
Mgmt Octets
3-34 WANsuite 7105
Transmit
Number of frames transmitted by the port.
Number of octets transmitted by the port.
Number of management frames transmitted by the port.
Number of management octets transmitted by the port.
Page 67
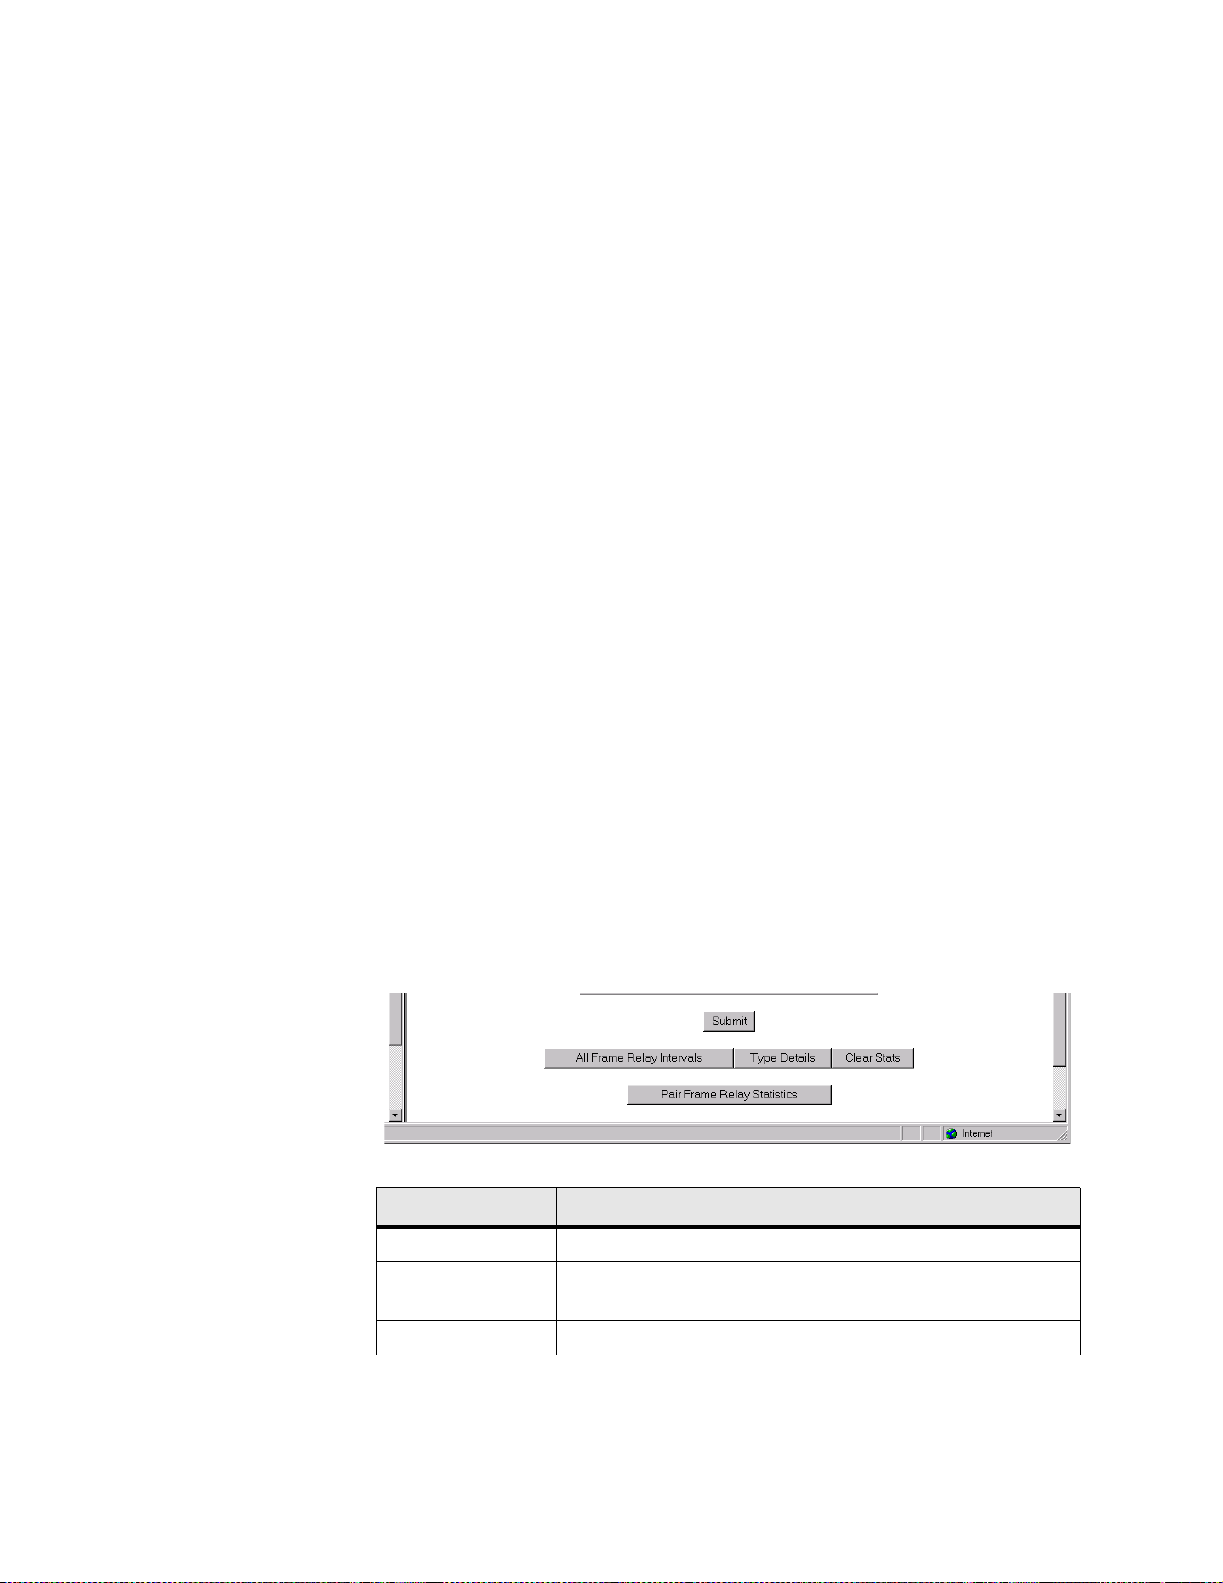
Stat Inquiries
Number of octets transmitted in frame relay LMI status inquiries.
Stat Response s
Frames
Octets
Mgmt Frames
Mgmt Octets
FECN
BECN
Invalids
Stat Inquiries
Stat Response s
Invalid LMIs
Number of octets transmitted in frame relay LMI status responses.
Receive
Number of frames received by the port.
Number of octets received by the port.
Number of management frames received by the port.
Number of management octets received by the port.
Number of Forward Explicit Congestion Notification frames received.
Number of Backward Explicit Congestion Notification frames received.
Number of invalid frames received.
Number of octets received in frame relay LMI status inquiries.
Number of octets received in frame relay LMI status responses.
Number of invalid Local Management Interface frames received.
Throughput (bits /sec)
Peak
A verage
Period Index
Peak bandwidth (in bits per second) as measured over a 10-second period.
Average bandwidth (in bits per second) used by the port.
Selects t he interval (Curre nt, Summ ary, or 1−96) to be viewed on the Frame
Relay Port Statisti cs screen .
The Fram e Relay Port Sta tistics scre en provi des the us er-activ ated butt ons
shown in Figure 3.30 and described below.
Figure 3.30
Button Function
Submit Sets any values that have bee n changed.
All Frame Relay
Intervals
Frame Relay Port Statistics Screen Buttons
Opens the Frame Rel ay Stat is tics scre en tha t shows al l stat is ti cs
for all parameters.
Type Details Returns you to the Frame Relay Servi ce Details screen.
Web Server Interface 3-35
Page 68

Button Function
Clear Stats Clears all Frame Relay statistics.
Pair Frame Relay
Statistics
SCADA Details Screen
Click on “SCADA” under the “Type” column on the Services screen to view
the SCADA Details screen (Figure 3.31). This menu gives you access to the
configuration parameters described in the paragraphs below.
Figure 3.31
Opens anot her Frame Relay Statistics screen tha t r everses the
service and the pair so you can view statistics for both sides of
the pair.
SCADA Details Screen
Message Size
Idle Character Delay
Input Terminator
Data Direction
Maximum number of characters to buffer before sending a frame.
Values: 0−1024
Default: 256
Maximum number of idle character time to wait before sending a frame.
Values: 0−65535
Default: 10
Decimal v alue of t he charac ter that t erminates a mess age befo re sending a
frame.
Values: 0−255
Default: 0
Data direction that the port will support. If set to “Input,” the port will only
accept incoming data and will not transmit data. If set to “Output,” the port
will ignore any incoming data. If set to “Both,” the port will process all data.
Values: Input, Output, Both
Default: Both
3-36 WANsuite 7105
Page 69
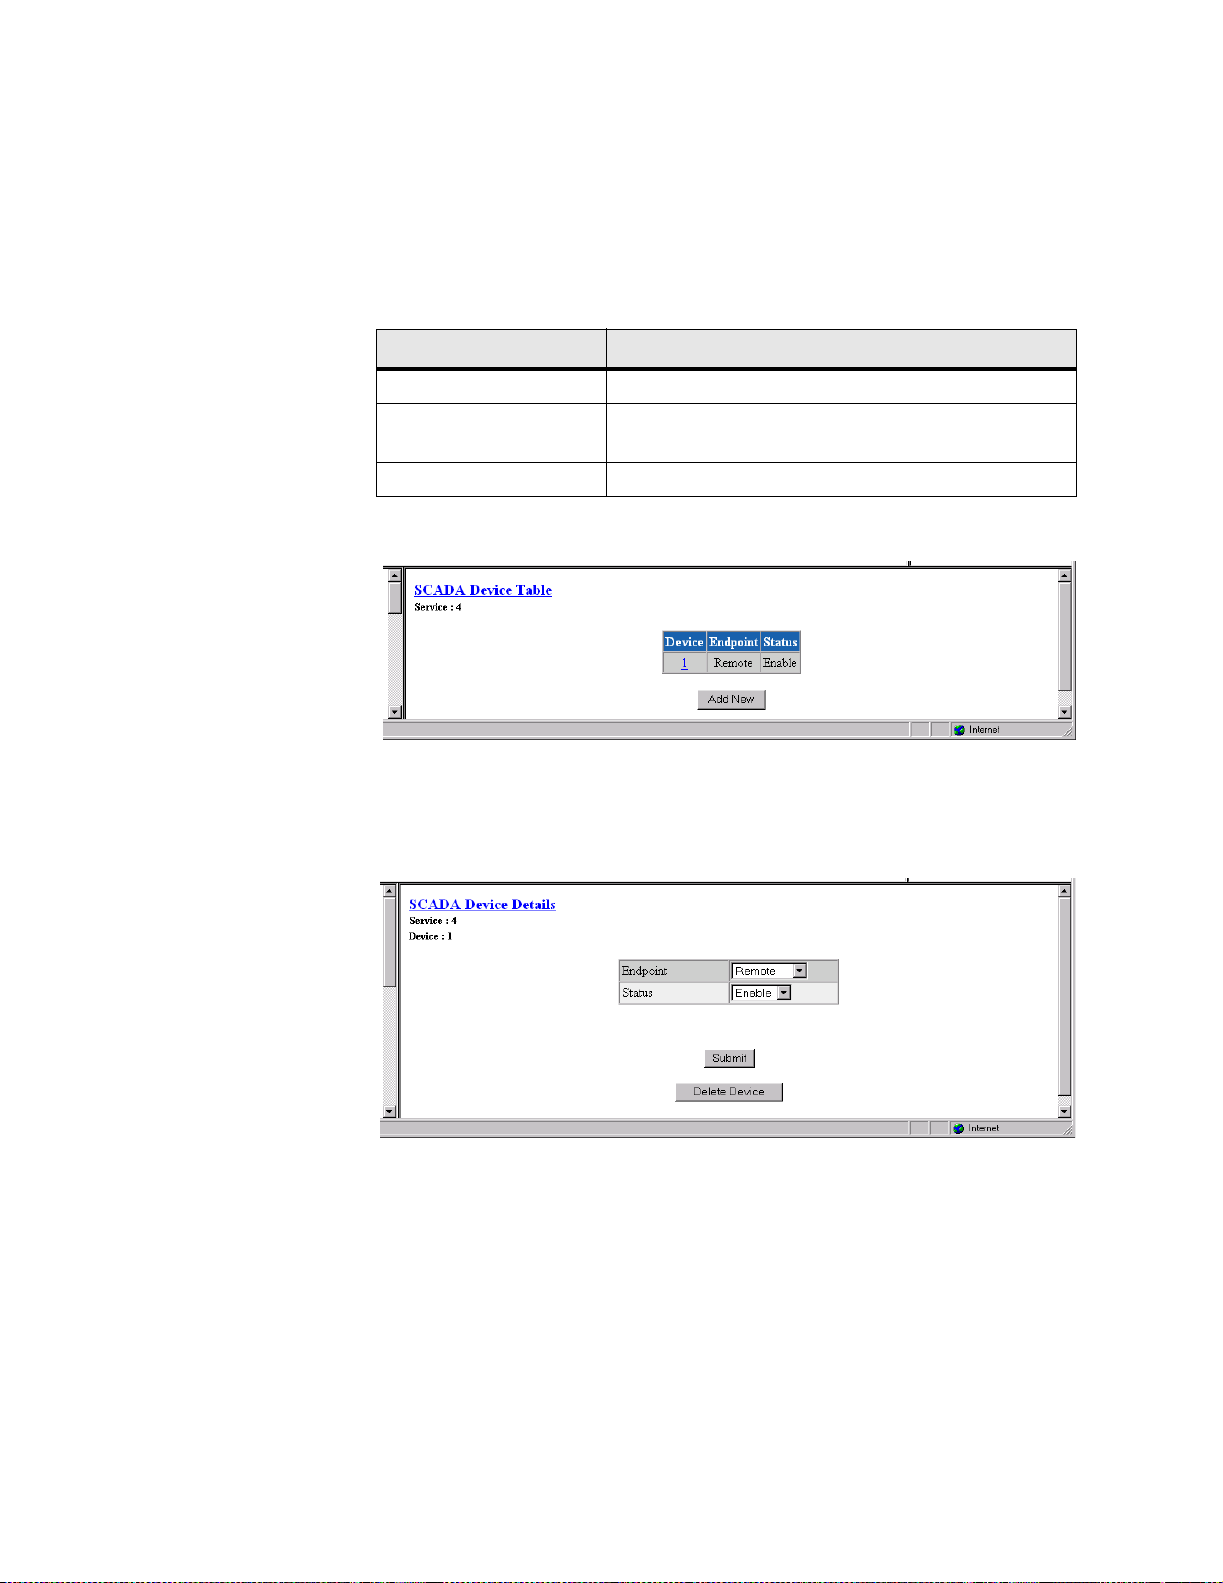
SCADA Loopback
Determines if and where SCADA will loopback received data.
Values: None, Loopback to Network, Loopback to Port
Default: None
The table below these parameters displays the SCADA statistics.
The SCADA Details screen provides the following user-activated buttons:
Button Function
Submit Sets any values that have been changed.
SCADA Device List Displays a table tha t sh ows the mapping between
SCADA devices and endpoints
Clear SCADA Statistics Clears all SCADA statisti cs.
(Figure 3.32).
Figure 3.32
SCADA Device Table Screen
Select the appropriate numbered link under the “Device” column to access the
SCADA Device Details screen (Figure 3.33) where you can map SCADA
devices to endpoints.
Figure 3.33
SCADA Device Details Screen
PPP Service Details Screen
Click on “ PPP” u nder the “ Type” column on the Ser vices scre en to vi ew the
PPP Service Details screen (Figure 3.34). This menu gives you access to the
configuration parameters described in the paragraphs below.
Web Server Interface 3-37
Page 70
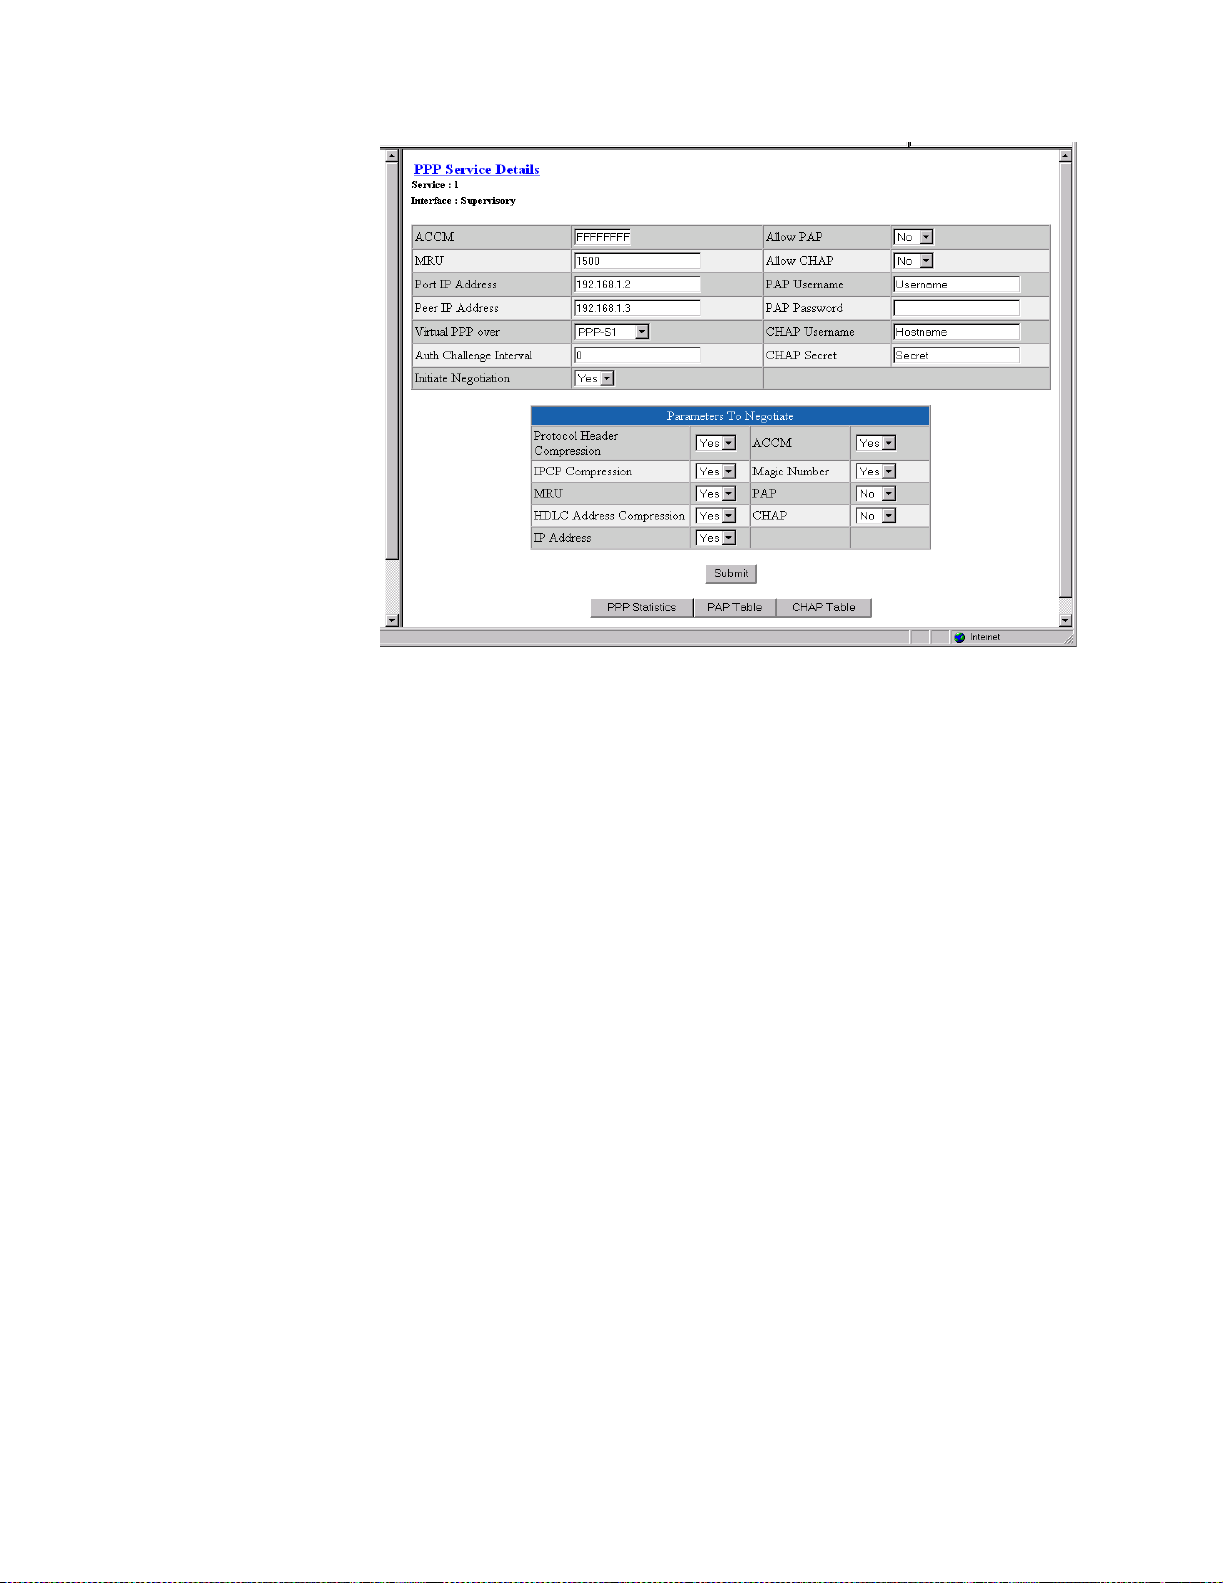
Figure 3.34
PPP Service Details Screen
ACCM
MRU (Maximum
Receive Units)
Port IP Address
Peer IP Address
Virtual PPP over
Auth Challenge
Interval
The Asynchronous Control Character Map (ACCM) configuration option
provides a method to negotiate the use of control character transparency on
asynchronous links.
Values: 0–FFF FFFFF ( Hex)
Default: FFFFFFFF
This configuration option may be set to inform the peer that the
implementation can receive larger packets, or to request that the peer send
smaller packets.
Values: 128–4096
Default: 1500
The IP Address of the port. For unnumbered PPP link, set to 0.0.0.0 and set
IP Address Negotiation to “No.”
Default: 192.168.1.2
Enter the IP address of the peer that will negotiate authentication protocols.
Default: 192.168.1.3
Endpoint name over which to send PPP encapsulated data (i.e., PPP over
Frame Relay). Valid only when the PPP interface is Virtual.
The time interval (in seconds) between CHAP challenges. A value of “0”
(zero) disables the periodic authentication challenge.
Values: 0−3600
Default: 0 (disabled)
3-38 WANsuite 7105
Page 71

Allow PAP
This parameter lets the peer negotiate for PAP.
Values: No, Yes
Default: No
Allow CHAP
PAP Username
PAP Password
CHAP Username
CHAP Secret
Initiate Negotiation
This parameter lets the peer negotiate for CHAP.
Values: No, Yes
Default: No
Type the appropriate PAP Username in this field to log on to the peer.
Values: User estab lished
Default: Username
Enter the password necessary to log on to the peer under a given PAP
Username.
Values: User estab lished
Default: None)
Type the appropriate CHAP Hostname in this field to challenge the peer.
Values: User estab lished
Default: Hostname
Enter the S ecret (i. e., passw ord) neces sary to challeng e the peer .
Values: User estab lished
Default: Secret
Determines whether the port actively negotiates with the peer site or passively
waits for negotiation requests.
Values: Yes, No
Default: Yes
Parameters To Negotiate
The table displayed near the bottom of the PPP Service Details screen shows
which parameters, defined in the table below, are set to be negotiated. You
can specify which parameters should be negotiated by clicking on the pulldown menu next to each parameter and selecting the desired option.
Parameters that can be negotiated are described below.
Parameter Description
Protocol Header
Compression
IPCP (IP Control
Protocol)
Compression
MRU (Maximum
Rece iv e U n it s )
Provides a method to compre ss PP P prot ocol headers.
Default = Yes
Provides a method to compress TC P heade r s using Van
Jacobsen compress ion.
Default = Yes
Used to inform the peer that th e implementation can receive
larger packets, or to request that the peer send s ma ller packets.
Default = Yes
Web Server Interface 3-39
Page 72

Parameter Description
HDLC Address
Compression
IP Address Dynamically negot iates for IP addresses; otherwise, it is
ACCM Provides a method to negotiate the use of control character
Magic Number Unique numbers useful for detecting loopbacks.
PAP (Password
Authentication
Protocol)
CHAP (ChallengeHandshake
Authentication
Protocol)
Provides a method to negotiate the compression of high-level
data link control (HDLC) addresses.
Default = Yes
assumed both sides know each other’s IP addresses.
Default = Yes
transparency on asynchronous links.
Default = Yes
Default = Yes
An authentication scheme used by PPP servers to validate the
identity of the connection originator.
Default = No
An authentication scheme used by PPP servers to validate the
identity of the originator of the conn ection upon connection or
any time later.
Default = No
PPP Statistics
Clicking the “PPP Statistic s” button brings up a table (Figure 3.29) tha t repor ts
on traffic.
Frames
Figure 3.35
PPP Statist ic s Screen
Transmit
Number of frames transmitted by the port.
Octets
3-40 WANsuite 7105
Number of octets transmitted by the port.
Page 73

Mgmt Frames
Number of management frames transmitted by the port.
Mgmt Octets
Frames
Octets
Mgmt Frames
Mgmt Octets
Invalids
Peak
A verage
Period Index
Number of management octets transmitted by the port.
Receive
Number of frames received by the port.
Number of octets received by the port.
Number of management frames received by the port.
Number of management octets received by the port.
Number of invalid frames received.
Throughput (bits /sec)
Peak bandwidth (in bps) as measured over a 10-second period.
Average bandwidth (in bps) used by the port.
Selects the interval (Current, Summary, or 1-96) to be viewed on the PPP
Statistics s creen.
The PPP Statistics screen provides the following user-activated buttons:
Button Function
Submit Sets any values that have been changed.
All PPP Intervals Opens the PPP Statistics screen that shows all statistics for all
parameters.
Type Details Returns you to the PPP Service Details screen.
Clear Stats Clears all PPP statistics.
PAP Table
At the bottom of the PPP Services Details screen are two buttons that display
tables for PAP and CHAP details. The PAP Table (Figure 3.36) displays the
Usernames and Passwords for 10 entries.
Web Server Interface 3-41
Page 74
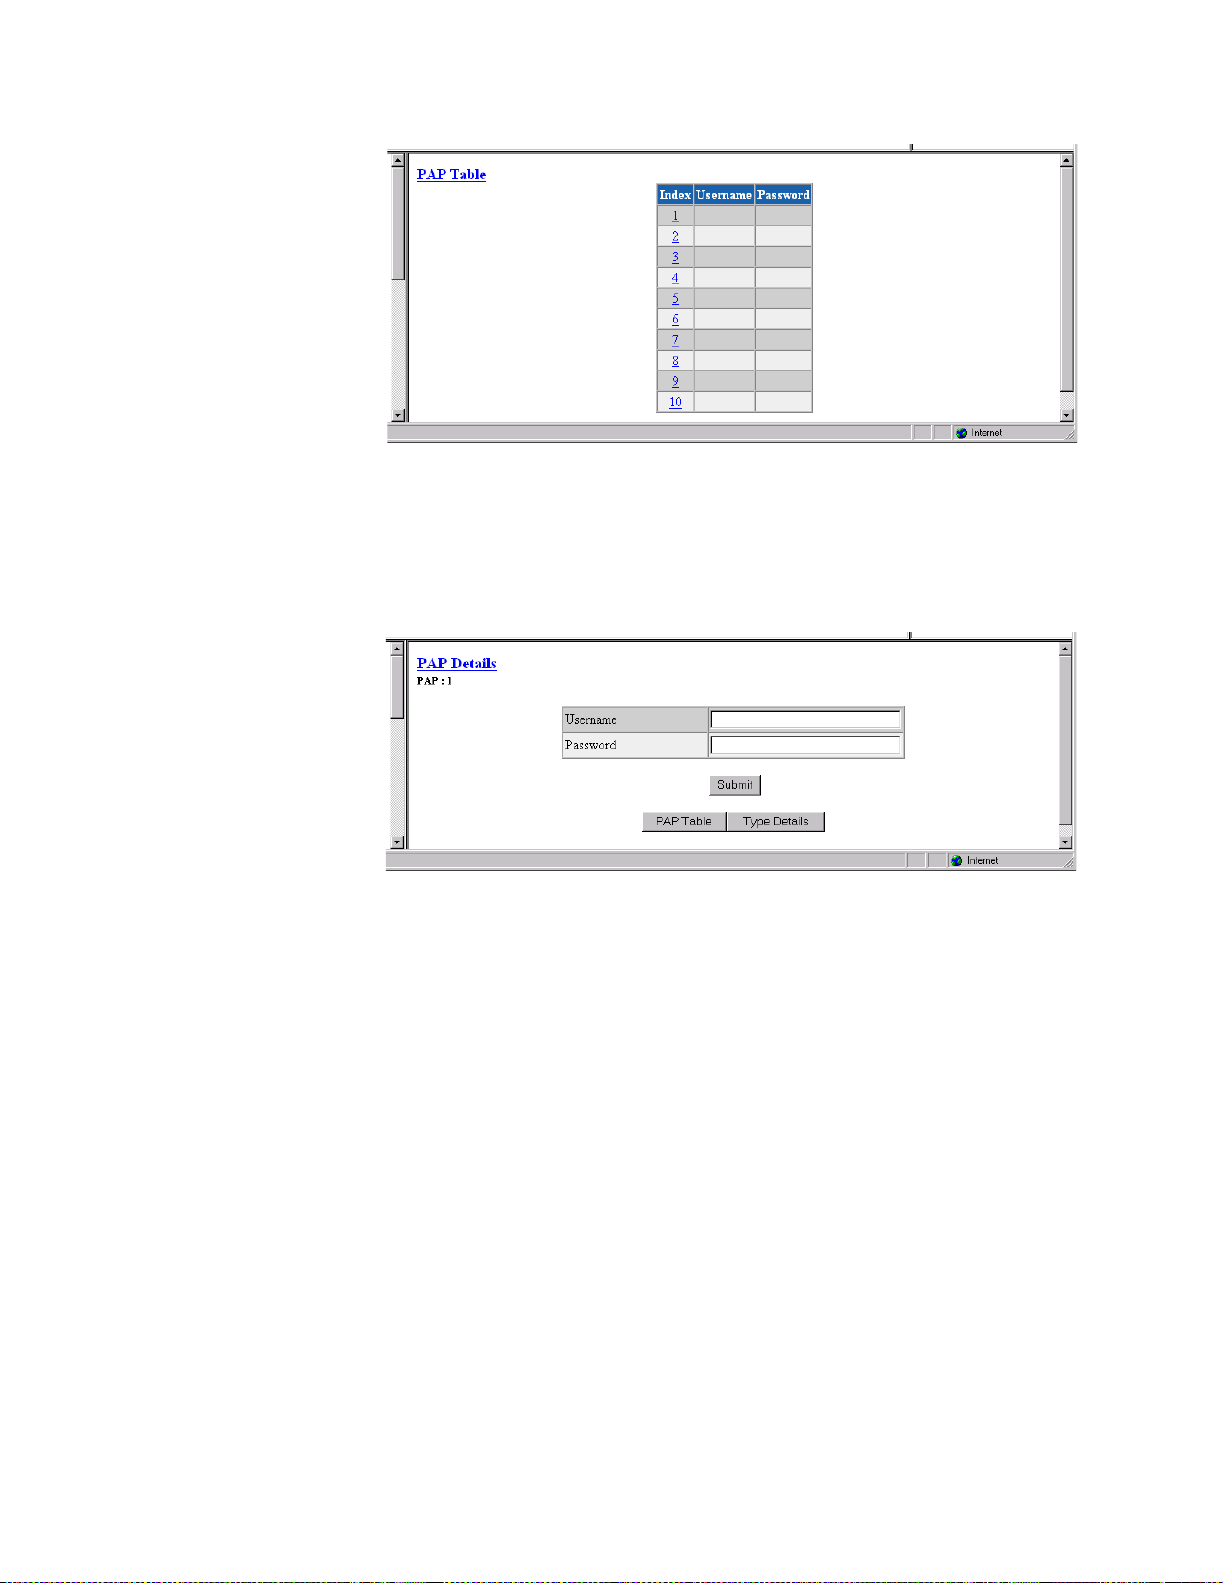
Figure 3.36
PAP Table S cre en
Select an Index number and click the “PAP Details” button at the bottom of
this screen to bring up a PAP Details screen (Figure 3.37) in which you can
view, change, or delete the Username and Password for that particular PAP
Index.
Figure 3.37
PAP Details Screen
To change the Username and Password for a selected PAP Index (PAP: 1 in
the example above), enter the new information in the appropriate fields and
click the “Submit” button.
To delete the Username and Password for a selected PAP Index, delete the
character string displayed in both fields (leaving them blank) and click the
“Submit” button.
The “Type Details” button returns you to the PPP Type Details screen.
CHAP Table
3-42 WANsuite 7105
From the P PP Serv ice Deta ils screen, click th e “CHAP Table” but ton to view
a table (Figure 3.38) of CHAP Username and Secret information for each of
10 entries.
Page 75
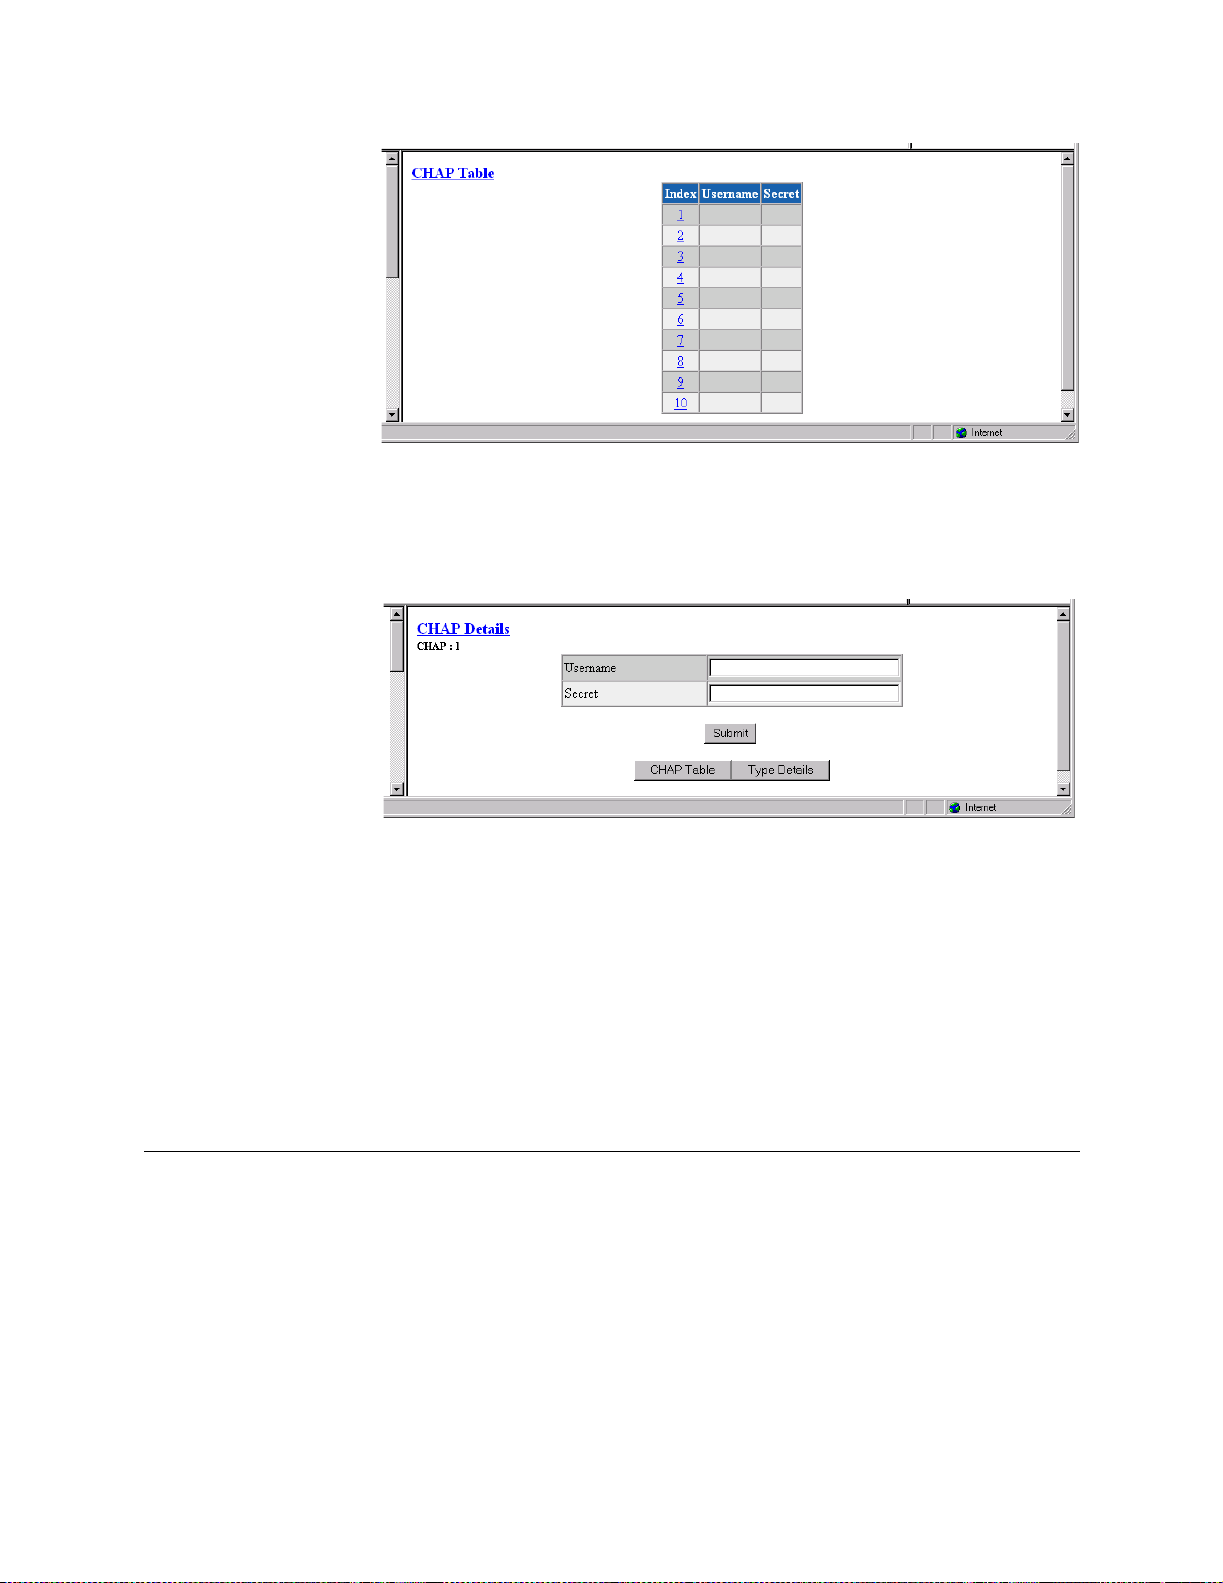
Figure 3.38
Select an Index number and click the “CHAP Details” button at the bottom of
this screen to bring up a screen in which you can change the Username and
Secret fo r that par ticular CH AP Inde x.
CHAP Table Screen
Figure 3.39
To change t he Usern ame a nd Secre t for a s elected CHA P Index, enter t he new
information in the appropriate fields and click the “Submit” button.
The “Type Details” button returns you to the PPP Type Details screen.
IP Service Details Screen
The IP Service Details and Ethernet Stats screens are shown on page 3-19 and
page 3-20, respectively.
Applications
CHAP Details Screen
The Applications screens describe configuration tables and statistics for
Layer 3 and above that do not map to a specific service or interface.
Endpoint Table Screen
The Endpoint Table (Figure 3.40) describes all endpoints terminating in the
unit; links are provided to view the Endpoint Details, Endpoint Service
Details, and Endpoint DLCI Details screens. The unit will automatically learn
all DLCIs from the Network side and relay that information on the Serial side
with default values.
Web Server Interface 3-43
Page 76

The Endpoint Table and its corresponding DLCIs will be saved in the
configuration database only after at least one endpoint parameter has been
changed and submitted as shown on the Endpoint Details Screen on
page 3-45.
NOTICE: The Endpoint Table and its corresponding DLCIs will be saved in the
configuration database only after at least one endpoint parameter has
been changed and submitted in the Endpoint Details Screen on
page 3-45. When in IP Gateway, if you decide to use a “discovered”
endpoint, you must rename it. A discovered endpoint cannot be used
elsewhere (i.e., IP Gateway) until it has been renamed. Also, it will not
be saved in the configuration database.
NOTICE: Endpoint names of the form PPP-Sn and SCADA-Sn are reserved by the
system. These system-generated endpoints cannot be modified.
Figure 3.40
Endpoint Table Screen
For most applications, you will not have to modify the Endpoint Table and
DLCI Table. Modification is necessary, however, to configure remote in-band
management. (See In Band Management on page 3-48.)
Endpoint Details Screen
The Endpoint Details screen (Figure 3.41), which you access by clicking on
an Index number on the Endpoint Table, lets you access the configuration
parameters described in the paragraphs below.
3-44 WANsuite 7105
Page 77
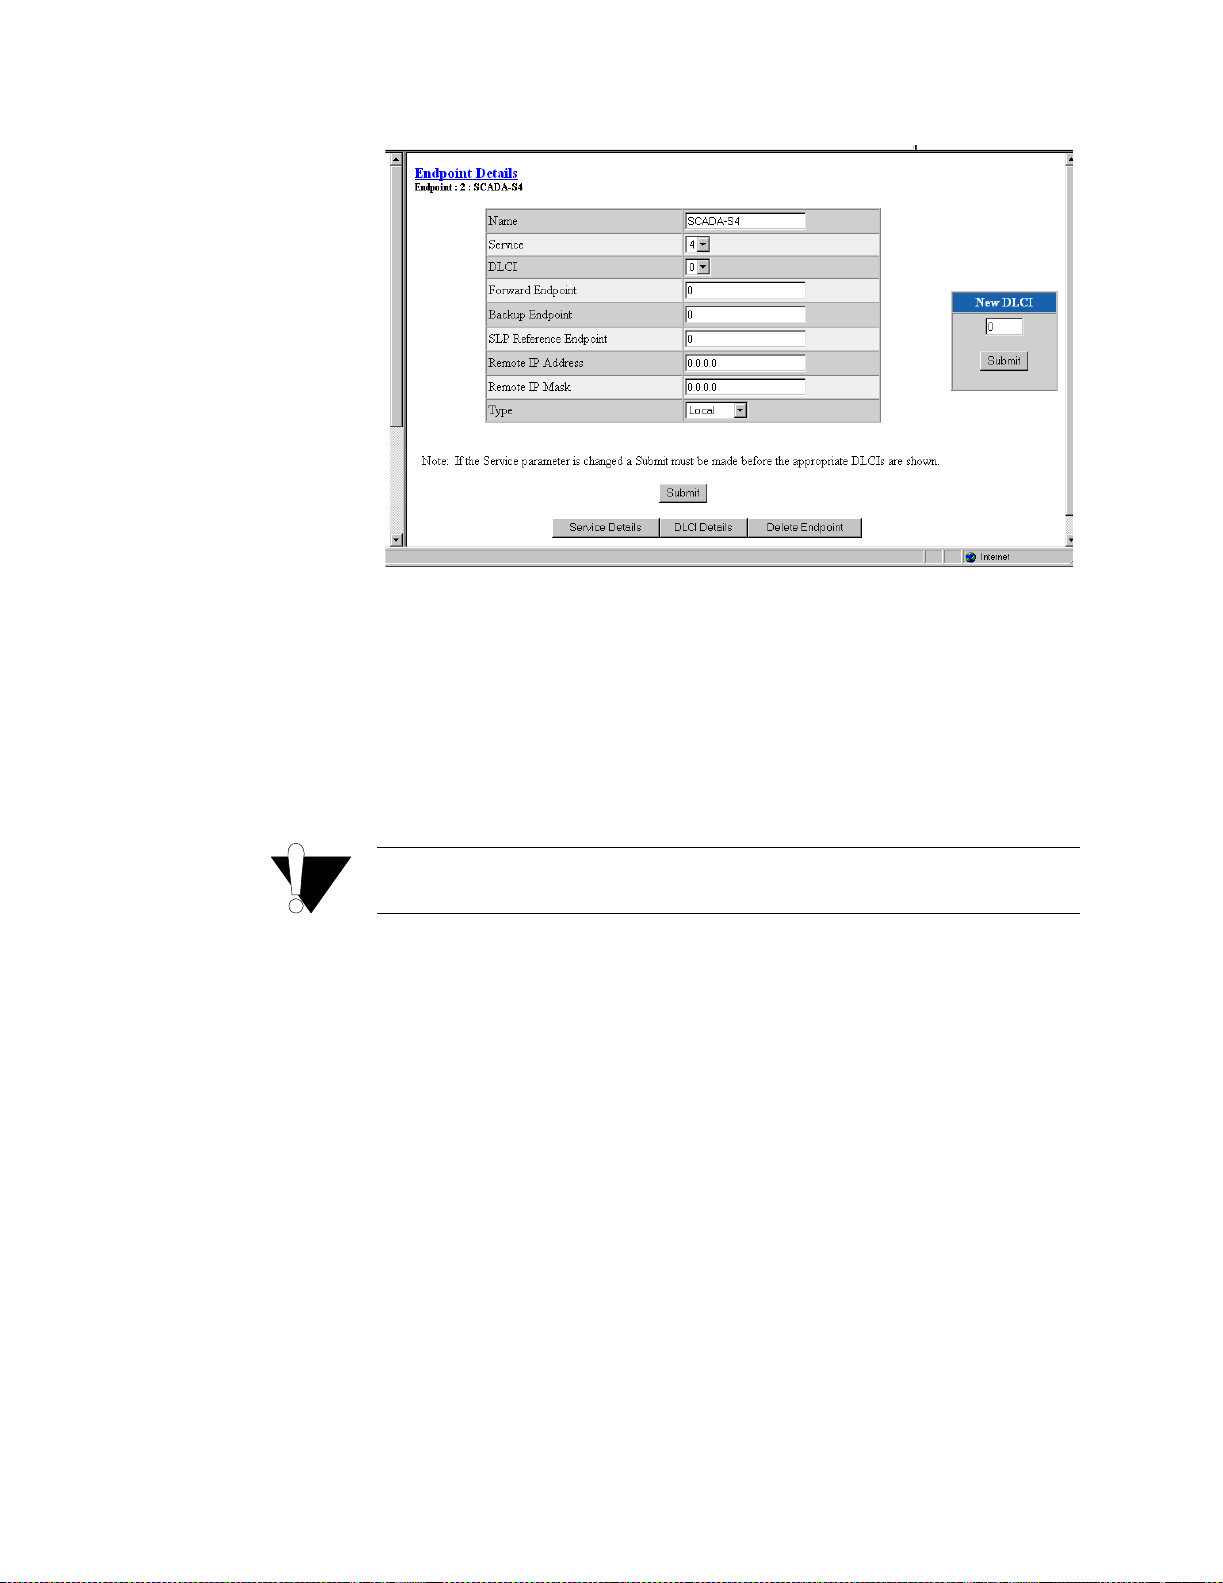
Figure 3.41
Endpoint Details Screen
Name
Service
DLCI
When the unit learns a new DLCI, it creates an endpoint entry and a DLCI
entry if they are not already configured. The endpoint’s Name will
automatically be assigned as “Dynamic”; however, this name can (and most
likely should) be changed to reflect a remote location name. Submitting a
changed Name parameter will save the endpoint entry and its corresponding
DLCI entry in the configuration database.
Value: A string of up to 11 characters
Default: None
CAUTION: When configuring endpoints, the name you assign each endpoint in
the Name parameter field must be unique within the unit.
The Servi ce Index n umber (from th e Service Table) on which this DLC I was
found or configured.
Values: Displays the cu rrently ac tive Serv ices (by i ndex num ber) o r the
Service(s) on which the DLCI was discovered.
Default: 0
The DLCI number.
Values: 16–1023
Default: 0
Forward Endpoint
By default, each DLCI is switched to its pair service in the Service Table
using the same DLCI number. If this endpoint has to be switched to a
different DLCI or a different service, the endpoint index of the destination
must be configured here.
For most applications, you will not need to set this parameter.
Values: 0–256
Default: 0
Web Server Interface 3-45
Page 78

Backup Endpoint
If this DLCI has an alternative endpoint to which this DLCI can be switched
if it becomes inactive, the endpoint index of this alternative endpoint would
be configured here.
For most applications, you will not need to set this parameter.
Values: 0–256
Default: 0
SLP Reference
Endpoint
Remote IP Address
This is the reference endpoint index to use for the Service Level Agreement
parameters. As most applications have the same SLAs for all DLCIs, they
only need to be configured in one DLCI entry. You can then copy the SLA
parameters from the endpoint index of this configured DLCI. If no SLP
reference endpoint is configured and the DLCI SLA parameters are not
configured, the values in the Frame Relay Service Details will be used
(default C IR, Be , enfor cement).
For most applications, you will not need to set this parameter.
Values: 0–256
Default: 0
If this WANsuite 7105 unit is to be used to manage a remote WANsuite7105
unit, you must configure the IP address of the remote WANsuite 7105 unit
here. This DLCI can be used for management only, or for management and
actual data.
If this para meter is set, a P C connect ed to the LAN i nterface of this
WANsuite 7105 can reach a remote WANsuite 7105 through this DLCI. The
remote IP address must be part of an IP network that is different from the
local WANsuite 7105, and the local WANsuite 7105' s IP address must be
configured into the PC. This way, local and remote WANsuite 7105s can be
reached regardless of the availability of the routers connected at the back of
the WANsuite 7105s.
Values: IP address
Default: 0.0.0.0
Remote IP Mask
Type
New DLCI
3-46 WANsuite 7105
If the Remote IP Address is set, the Remote IP Mask must also be set.
Values: IP address
Default: 0.0.0.0
If data received from this DLCI has to be switched to its corresponding
destination port, you must set the type to “Switched.” Set the type to “Local”
for any DLCI used for management purposes only.
Values: Switched, Local
Default: Switched
This field is used to create a new DLCI if it is not already configured. To
create a n ew DLCI, enter a valid DL CI num ber in the field an d click the
“Submit” button. The new DLCI number will be reflected in the DLCI field
of the Endpoint Details screen.
Page 79
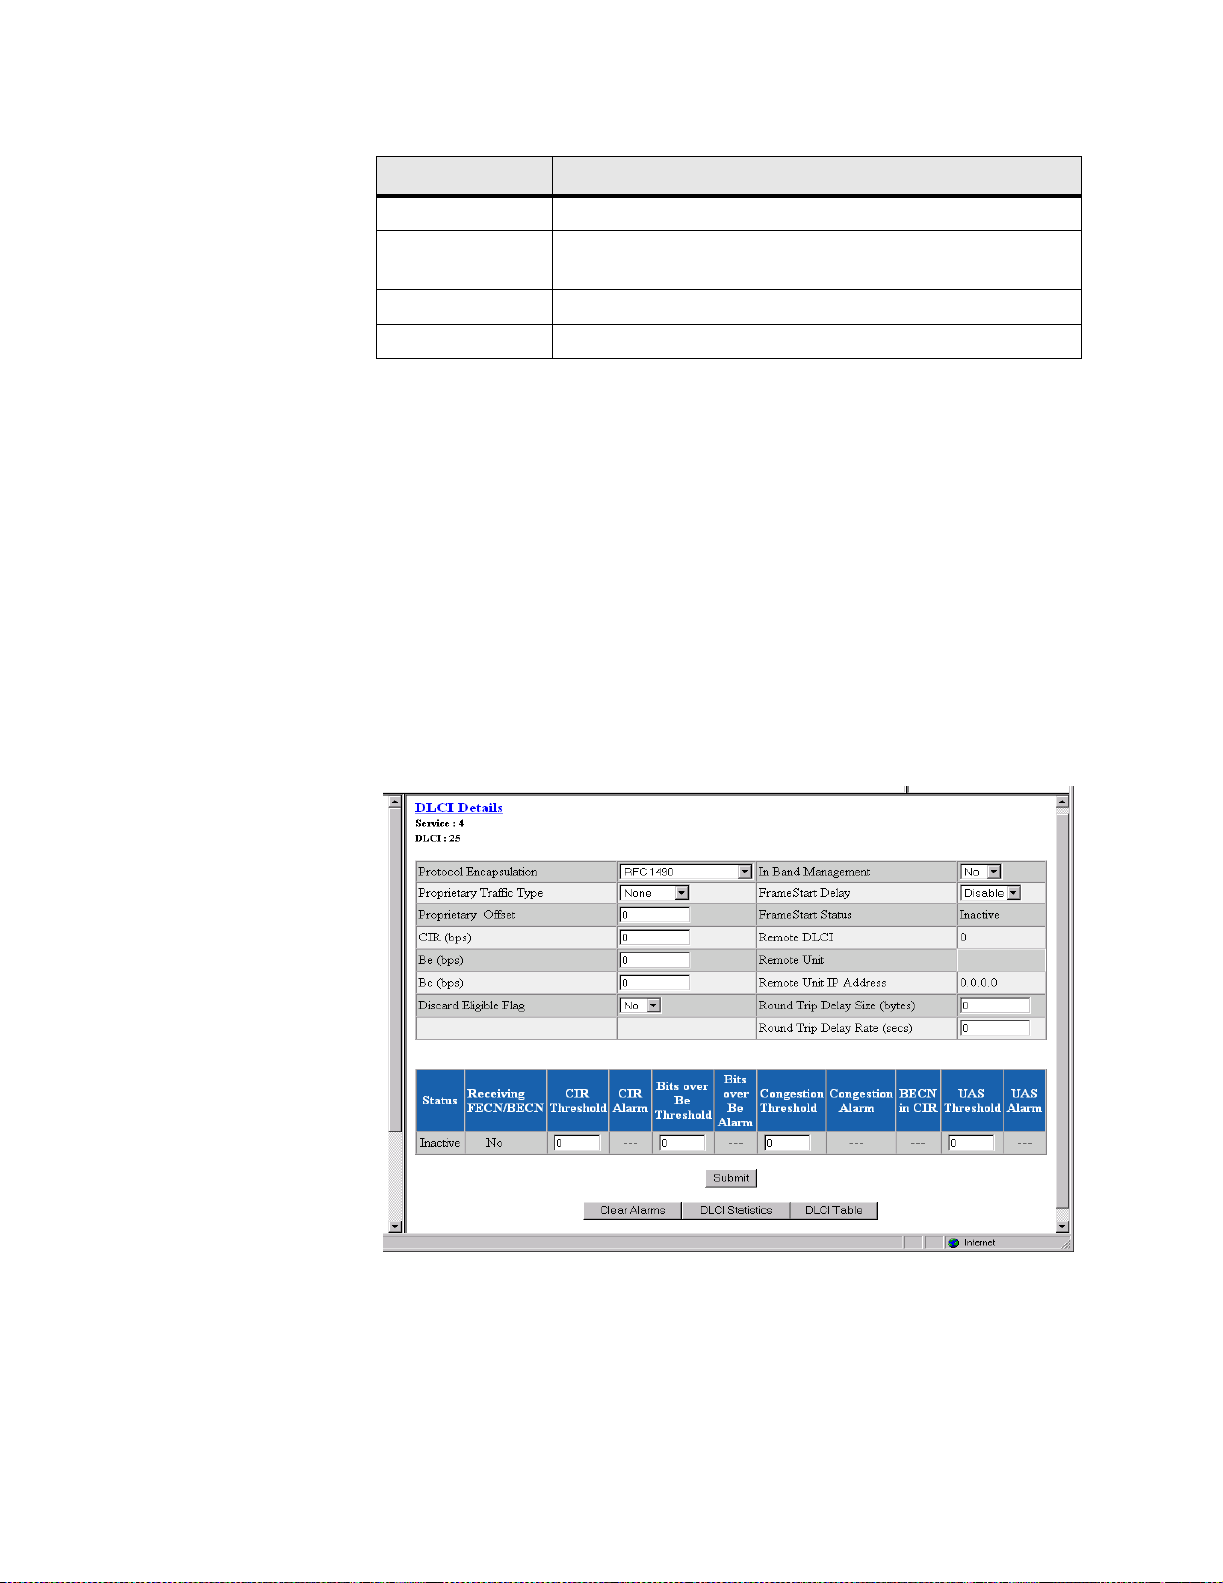
The Endpoint Details screen provides the following user-activated buttons:
Button Function
Submit Sets any values that have been changed.
Service Details Opens the Service details screen showing the selected service's
settings.
DLC I D et ails Di sp lays de ta ils of the select ed D L C I .
Delete Endpoint Deletes the currently displayed endpoint.
Endpoint Service Details
Clicking the “Service Details” button at the bottom of the Endpoint Table
screen displays the typical Service Details screen. Refer to the Service Details
Screen on page 3-25 for a complete description of this type of screen.
DLCI Details Screen
The Endpoint DLCI Details screen (Figure 3.42) lets you access the
configuration parameters described in the following paragraphs. To bring up
this screen, click on a specific DLCI under the “DLCI” column on the
Endpoint Table screen, or on the “DLCI Details” button on the Endpoint
Details screen.
Figure 3.42
DLCI Details Screen
The unit uses the first three configuration parameters (Protocol Encapsulation,
Proprietary Traffic Type, and Proprietary Offset) displayed on this screen to
gather statistics. For in-band management, “RFC 1490” must be the
encapsulation method.
Web Server Interface 3-47
Page 80

Protocol Encapsulation
The type of encapsulation used by the FRAD/router connected to the unit.
Values: RFC 1490, Proprietary, RFC 1490 - Encryption
Default: RFC 1490
Propriet ary Traffi c
Type
Proprie tary Offse t
CIR (bps)
Be (bps)
Bc (bps)
When Protocol Encapsulation is set for “Proprietary,” the Proprietary Traffic
Type parameter defines which protocol is encapsulated.
Values: IP, IPX, Ethertype, None
Default: None
When Protocol Encapsulation is set for “Proprietary,” the Proprietary Offset
parameter defines the number of octets after the frame relay header where the
proprietary traffic type starts.
Values: 0–32
Default: 0
If a Committed Information Rate is configured here, its value will be used
instead of the default committed information rate of the frame relay service.
Values: 0–1536000
Default: 0
If an Excess Burst Rate is configured here, its value will be used instead of
the default excess burst rate of the frame relay service.
Values: 0–1536000
Default: 0
If CIR enforcement is configured to “Yes,” the unit will throttle the
Committed Burst down to this value when frames are received with the
BECN bit set.
Values: 0–1536000
Default: 0
Discard Eligible Flag
In Band Management
FrameStart Delay
FrameStart Status
3-48 WANsuite 7105
If this parameter is set to “Yes” and CIR enforcement is also set to “Yes,” the
unit will set the Discard Eligible (DE) bit for frames sent over CIR.
Values: Yes, No
Default: No
If the unit is to be used as a gateway to reach a remote WANsuite 7105
through this DLCI, set this parameter to “Yes,” and configure the remote IP
address and Mask in the corresponding endpoint.
Values: Yes, No
Default: No
If this parameter is set to “Enable,” the unit will send FrameStart discovery
and delay frames on this DLCI, and will report the state of the remote
Verilink FSx unit. It will also send SOS frames when the FRAD/router
connected to this unit goes inactive.
Values: Enable, Disable
Default: Enable if Auto Discovery is set to “Yes”; Disable otherwise
If the remote unit is a Verilink unit with FrameStart technology and
FrameStart Auto Discovery is enabled, the FrameStart Status field will show
Page 81

the status of the remote unit. The status is “Active” if both the local and
remote DL CIs are a ctive an d the rem ote uni t answers to the discovery frames
sent by this unit. The status is “SOS” if the remote unit is active but the
FRAD/router connected to it is inactive. The status is “Inactive” in all other
cases.
Values: Active, In active, SOS
Default: Inactive
Remote DLCI
Remote Unit
Remote Unit IP
Address
Round T rip Delay Size
Round T rip Delay Rate
If the remote unit is a Verilink unit with FrameStart technology, and
FrameStart Auto Discovery is enabled, this field displays the DLCI number
used on the remote end of this DLCI.
Values: 16−1023
Default: 0
If the remote unit is a Verilink unit with FrameStart technology, and
FrameStart Auto Discovery is enabled, this parameter gives the first three
digits of the unit ID configured on the remote end of this DLCI.
Values: 000−999
Default: 000
Displays the IP address of the remote Verilink unit with FrameStart
technology if FrameStart Auto Discovery is enabled.
Specifies the frame size (in bytes) of packets making round-trip. If the Round
Trip Delay Size is not configured, the Frame Relay Details values will be
used.
Specifies the rate (in seconds) at which Round Trip Delay packets are sent. If
the Round Trip Delay Rate is not configured, the Frame Relay Details values
will be used.
Status
Receiving FE CN/
BECN
CIR Threshold
CIR Alarm
DLCI Status Table
The bottom portion of the screen shows a table detailing the actual status of
DLCI and alarm threshold information as follows:
If this DLCI is up, the status will be “Active”; otherwise, the status will be
“Inactive.”
Values: Active, Inactive
Default: Inactive
When a frame is received with congestion bit set, this parameter is set to
“Yes.” It is set back to “No” when a frame is received without congestion bit
set.
Values: Yes, No
Default: No
Sets the Tx over CIR alarm threshold. This threshold is the number of bits per
second in excess of CIR during a 15-minute interval. Setting this field to “0”
(zero) disables the alarm.
Reports if the Tx over CIR threshold has been exceeded.
Web Server Interface 3-49
Page 82

Bits Over Be Threshold
Sets the Tx over excess burst alarm threshold. This threshold is the number of
bits per second in excess of CIR + Be during a 15-minute interval. Setting
this field t o “0” (z ero) disa bles the alarm.
Bits Over Be Alarm
Congestion Threshold
Congestion Alarm
BECN in CIR
UAS Threshold
UAS Alarm
Reports if the Tx over Be threshold has been exceeded.
Sets the Rx Congestion alarm threshold. This threshold is the number of
frames received with BECN/FECN. Setting this field to “0” (zero) disables
the alarm.
Reports if the Rx Congestion threshold has been exceeded.
Reports if Backward Explicit Congestion Notification (BECN) has been
received within CIR.
Sets the Unavailable Seconds (UAS) alarm threshold. This threshold occurs
after the DLCI is unavailable for a specified number of seconds. Setting this
field to “0 ” (zero) d isables t he alarm .
Reports if the UAS threshold has been exce eded.
The DLCI Details screen provides the following user-activated buttons:
Button Function
Submit Sets and activates any DLCI parameters values that have been
changed.
Clea r Al ar ms Clears all D LC I ala r m s.
DLCI Statistics Displays a table of the statisti cs for this DLCI.
DLCI Table Di sp lay s a table of al l DLCIs on a specif i c fram e rel ay serv ice , with
their state and alarm co n ditions.
DLCI Statistics Screen
Clicking the “DLCI Statistics” button on the DLCI Details screen will display
a summary (Figure 3.43) of the Transmit, Receive, and Performance statistics
for the s elected D LCI for a specific period.
3-50 WANsuite 7105
Page 83
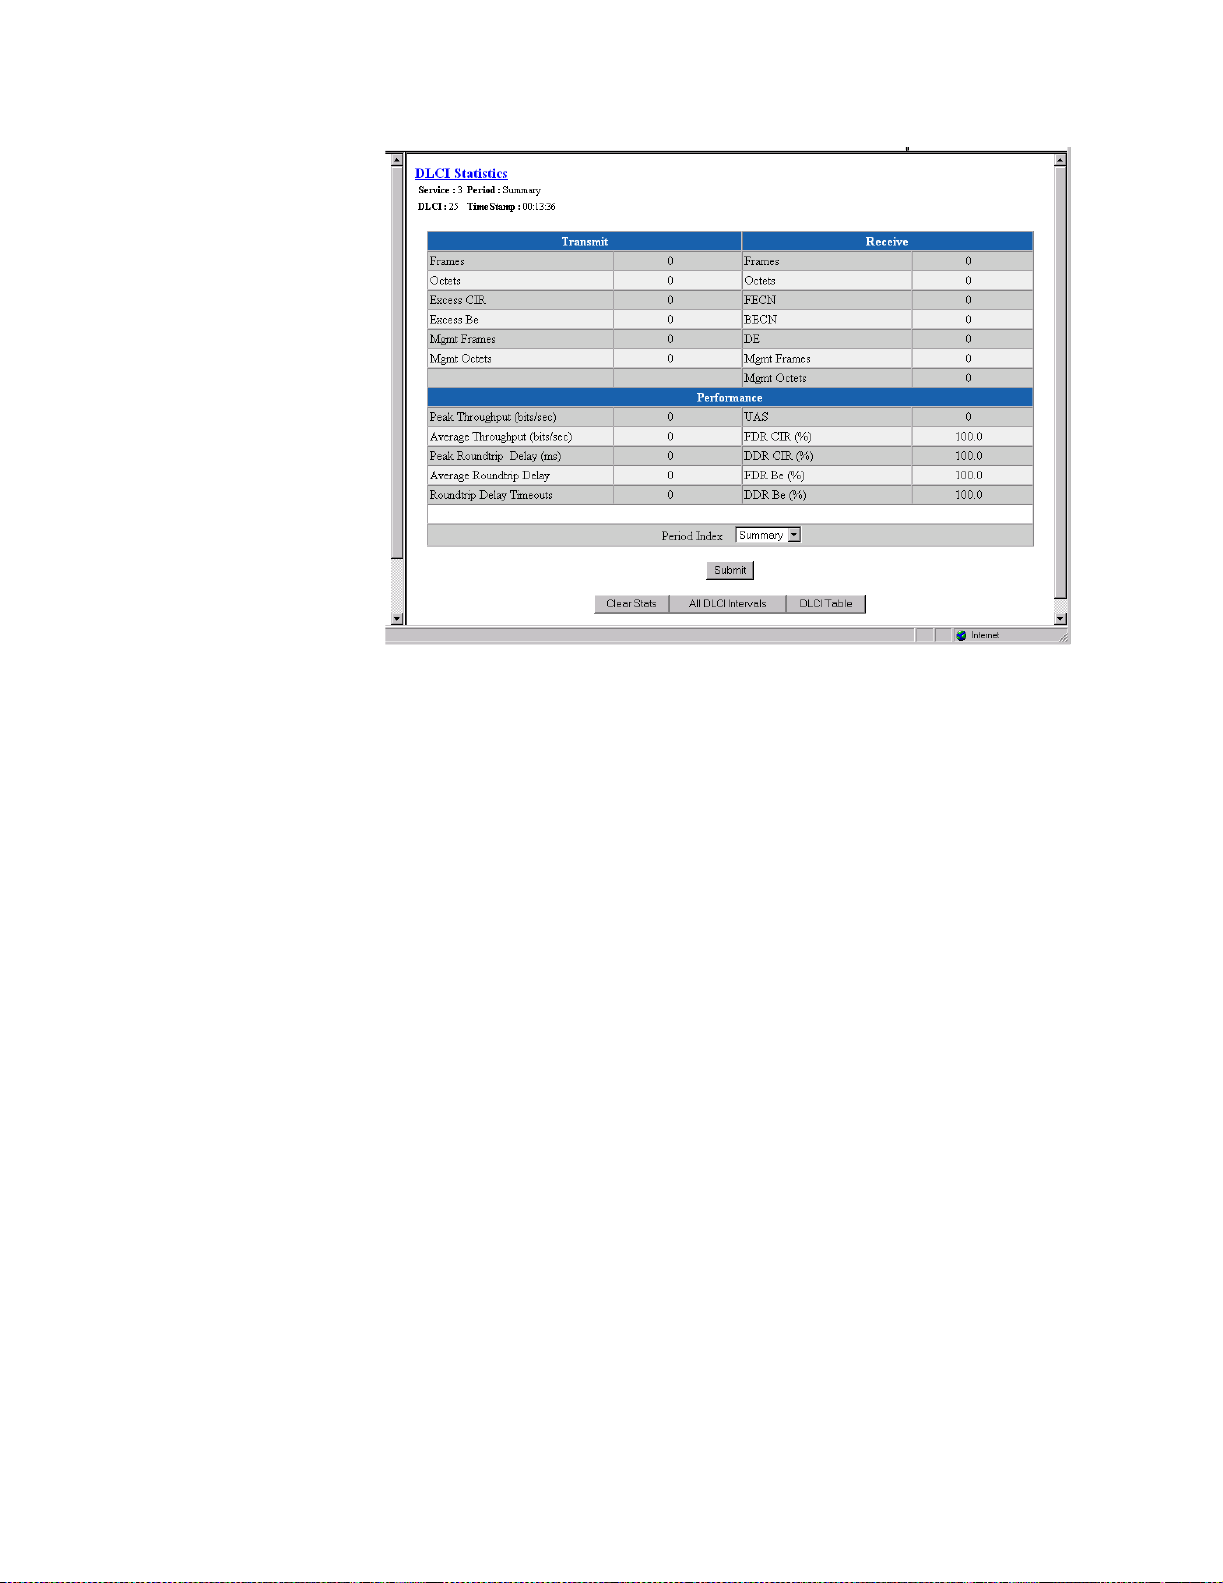
Figure 3.43
DLCI Statistic s Screen
There are ninety-six 15-minute buckets (sampled every second) available for
DLCI statistics. If the unit is powered on at 01:00 PM, the first interval will
be completed at 01:15 PM; subsequent intervals would be completed at xx:30,
xx:45, xx:00 and xx:15. Interval 1 is always the latest (most recent) interval,
and interval 96 will always be the oldest.
The DLC I Statisti cs screen i n the pr eceding fi gure sh ows a sum mary t hat
includes all 96 buckets. You can choose to see statistics for any given bucket
by selecting the desired Period Index from the pull-down menu and clicking
the “Submit” button. Alternatively, you can display all intervals at once by
clicking the “All DLCI Intervals” button beneath the table. The MIB
(ipadv2.mib) describes each avail able stati stic. “FD R” on th e screen a bove
refers to Frame Delivery Ratio, which is the ration of successful frame
receptions to attempted frame transmissions. “DDR” refers to Data Delivery
Ratio or the ratio o f succes sful payl oad bytes received to atte mpted pa yload
bytes transmitted. “DE,” or Discard Eligible, refers to the data that is first
eligible to be discarded when network congestion occurs.
DLCI Table Screen
Clicking the “DLCI Table” button on the DLCI Details screen will display a
table of all DLCIs (Figure 3.44) on a specific Frame Relay service along with
their stat e and alarm condit ions.
Web Server Interface 3-51
Page 84

Figure 3.44
NOTICE: The DLCI Table and DLCI Details screens are available from both the
Service Aware Screen
The Service Aware function recognizes IP traffic and counts the number of
frames and bytes passed for a specific service based on filters by DLCI, by IP
Address, and by IP Port. Each row of the Service Aware table represents a
specific set of filter parameters known as a “rule.” Each rule is established
through the Rule Details screen, which is accessed by clicking on the
appropriate numbered link under the “Index” column on the Service Aware
screen.
DLCI Table Screen
Endpoint Table and the Frame Relay Service Details screens.
The Service Aware screen (Figure 3.45) provides a table showing these
filtered packet counts for up to 10 rules. This table indicates which Service
Aware filters are enabled or disabled, and shows the specific DLCI, IP
Address, and IP Port by which the IP traffic is filtered. In addition, this table
shows the Tx Alarm Thresho ld and the curr ent Tx Al arm stat us (if en abled)
for each rule.
It is also possible to filter PPP services, in which case all information related
to DLCIs is ignored.
Figure 3.45
Service Aware Screen
3-52 WANsuite 7105
Page 85

NOTICE: If you change a Service parameter, you must click on Submit to see the
appropriate DLCIs.
The Servi ce Awar e screen p rovides a “Clear Alarms ” user-acti vated but ton at
the bottom of the screen.
Rule Details Screen
Use the Rule Config screen (Figure 3.46) to establish Service Aware
parameters. To access the screen, click on the appropriate number under the
“Index” column on the Service Aware screen. To establish a rule, you must
select the desired rule configuration options and provide the appropriate filter
information where required. Then press the “Submit” button at the bottom of
the screen.
Service
Figure 3.46
Rule Details Screen
The paragraphs below describe the Rule Details screen parameters and their
options.
Selects the service to which the rule applies. Select from a pull-down list of
available s ervices.
DLCI
Filter By DLCI
NOTICE: If you change a Service parameter, you must click on “Submit” to see
the appropriate DLCIs.
Selects the DLCI to which the rule applies. Select from a pull-down menu
that lists applicable DLCIs.
Enables or disables filtering of the IP traffic by the DLCI specified in the
DLCI pull-down list.
Web Server Interface 3-53
Page 86

NOTICE: To use this filter, you must specify both the Service and DLCI
parameters on the Rule Details screen.
IP Address
IP Mask
Filter By IP Address
IP Port
Filter By IP Port
Tx Alarm Threshold
Tx Alarm
IP Port List
Establishes the IP address by which the rule will filter IP traffic (if enabled).
Represents a range of IP addresses defined so that only machines with IP
addresses withi n th at ran ge are allow ed t o ac cess a n Int ernet service . To ma sk
a portion of the IP address , replace it with the wild card ch aracter “0” (zero).
(For example, 192.44.0.0 represents every computer on the Internet with an IP
address beginning with 192.44.)
Enables or disables filtering of the IP traffic by the IP address specified in the
IP Address or IP Ma sk field.
Establishes the IP port by which the rule will filter IP traffic (if enabled).
Enables or disables filtering of the IP traffic by the IP port specified in the IP
Port field. You may enter the port value directly into this field or select a port
ID from the drop-down list to the right of the field (see next paragraph).
Specifies the threshold in bits per second for the Transmit Alarm on this rule.
Shows th e current T ransmi t Alarm s tatus.
Provides a drop-down list of well-known port IDs for TCP and UDP. To enter
a port ID, select an option from the list and click the “Enter” button. The
selected port ID value will then be reflected in the IP Port field.
Traffic Meter Statistics Screen
The Traffi c Meter S tatisti cs screen ( Figur e 3.47) displ ays the number of
frames and octets sent over a DLCI that have been counted in accordance
with the Service Aw are “ru le” estab lished fo r a Serv ice. As s uch, it is F rame
Relay specific (i.e., DLCIs only occur in Frame Relay links). In addition, this
screen provides data rate performance information for the period of time
specified in the Period Index field (see below). To access this screen, click on
the appropriate link under the “Statistics” column on the Service Aware
screen.
3-54 WANsuite 7105
Page 87

Figure 3.47
The Traffi c Meter S tatisti cs screen re ports on the fol lowing par ameters:
Traffic Met er Statistics Screen
• Tx Frames
• Tx Octets
• Rx Frames
• Rx Octets
• Rate Peak – the peak data rate for the viewed period (see below)
• Rate Average – the average data rate for the viewed period (see below)
The Period Index field is used to define the period of time for which the
Traffic Meter statistics will be reported. It represents the 24-hour, 15-minute
buckets index. Selecting a period and then clicking the “Submit” button will
display the traffic meter statistics for that period. Clicking on the “All Traffic
Meter Intervals” at the bottom of the screen displays the Traffic Meter
Statistics for all intervals as defined below.
Summary
Current
Interval 1, Interval 2,
..., Interval 96
Represents the past 24 hours; reports the additive number of frames/octets, the
highest peak encountered for 24 hours, and the average for 24 hours.
Reports on the current 15-minute interval.
Reports on Intervals 1-96, which correspond to the periods completed 15
minutes ago, 30 minutes ago, ..., 24 hours ago.
SNMP Details Screen
The unit detects and reports T1 alarms and provides several options for
reporting them, one of which is SNMP traps. When a network alarm occurs,
the unit sends a trap message to as many as eight destinations on your
network. The unit will report each alarm by transmitting an SNMP “trap” to
Web Server Interface 3-55
Page 88

each non-zero Trap IP address. The SNMP Details screen (Figure 3.48) lets
you configure the SNMP parameters described in the paragraphs below.
Read Community
Write Community
Figure 3.48
SNMP Details Screen
Accepts a character string identifying the group authorized to perform read
operations. The default setting is “Public.”
Accepts a character string identifying the group authorized to perform write
operations. The default setting is “Private.”
Trap Community
Accepts a character string, which is included in SNMP traps generated by the
unit. The default setting is “Public.”
Trap IP Address
Accepts the IP address of a network device where alarm reporting traps are to
be sent.
Diagnostics Screen
The Diagnostics screen (Figure 3.49) provides a table for viewing the current
settings for the test and maintenance functions performed on the available
interfaces . This scr een show s an uppe r-level vi ew of a ll the int erfaces s o you
can see if any port is under test, and if so, view the results. You may change
diagnostic parameters on the Test Details screen, which is accessed by
clicking on the appropriate link on the Diagnostics screen. The properties of
the Diagnostics table are described in the paragraphs below.
3-56 WANsuite 7105
Page 89
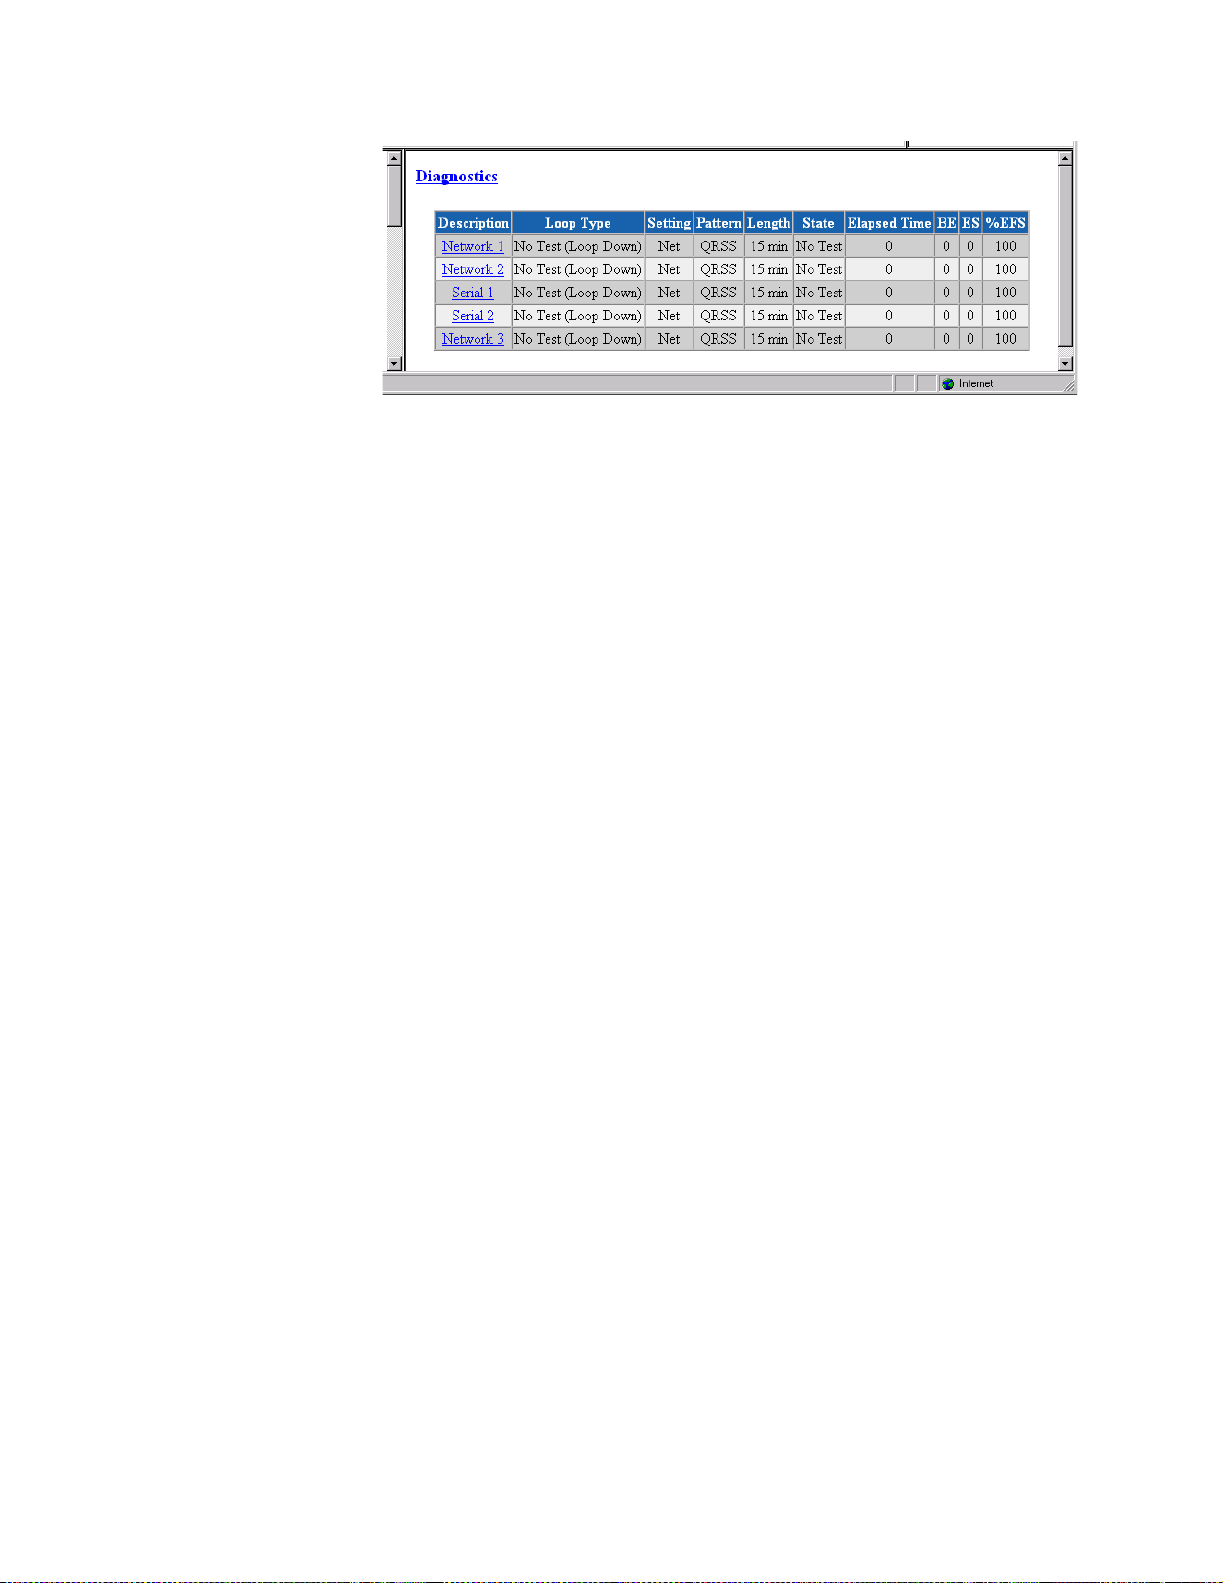
Figure 3.49
Diagnostics Screen
Description
Loop Type
Setting
Pattern
Length
State
Elapsed Time
BE
ES
% EFS
Describes the type of interface selected for testing.
Describes the type of loop test (if any) performed on the selected interface.
Displays the bandwidth on which you wish to perform the BERT.
Specifies the pattern to be transmitted during a BERT for the selected port.
Displays the length of time for which the BERT should run for the selected
interface.
Displays t he curre nt BERT state for the select ed inter face.
Displays the time elapsed since a BERT began or, if completed, the total test
time.
Displays the total number of bit errors detected since the BERT began or
since erro r statistics were la st clear ed.
Displays the number of asynchronous errored seconds that have been detected
since the B ERT b egan or since erro r statistics were last clear ed. This
parameter includes bit error seconds and sync loss seconds.
Displays w hat perce nt of t he total B ERT time ran err or-free. This rati o is
derived f rom the n umber o f error-fre e seco nds divid ed by the n umber of
seconds accumulated in Elapsed Time.
Test Details Screens
The Test Details screens let you set some test parameters and view other readonly parameters. This screen is also used to initiate a BERT or Loop Test.
The Network Interface Test Details screen is shown in Figure 3.50, and its
parameters are described below the figure. The Serial Interface Test Details
screen is shown in Figure 3.51, followed by a description of its parameters.
Web Server Interface 3-57
Page 90
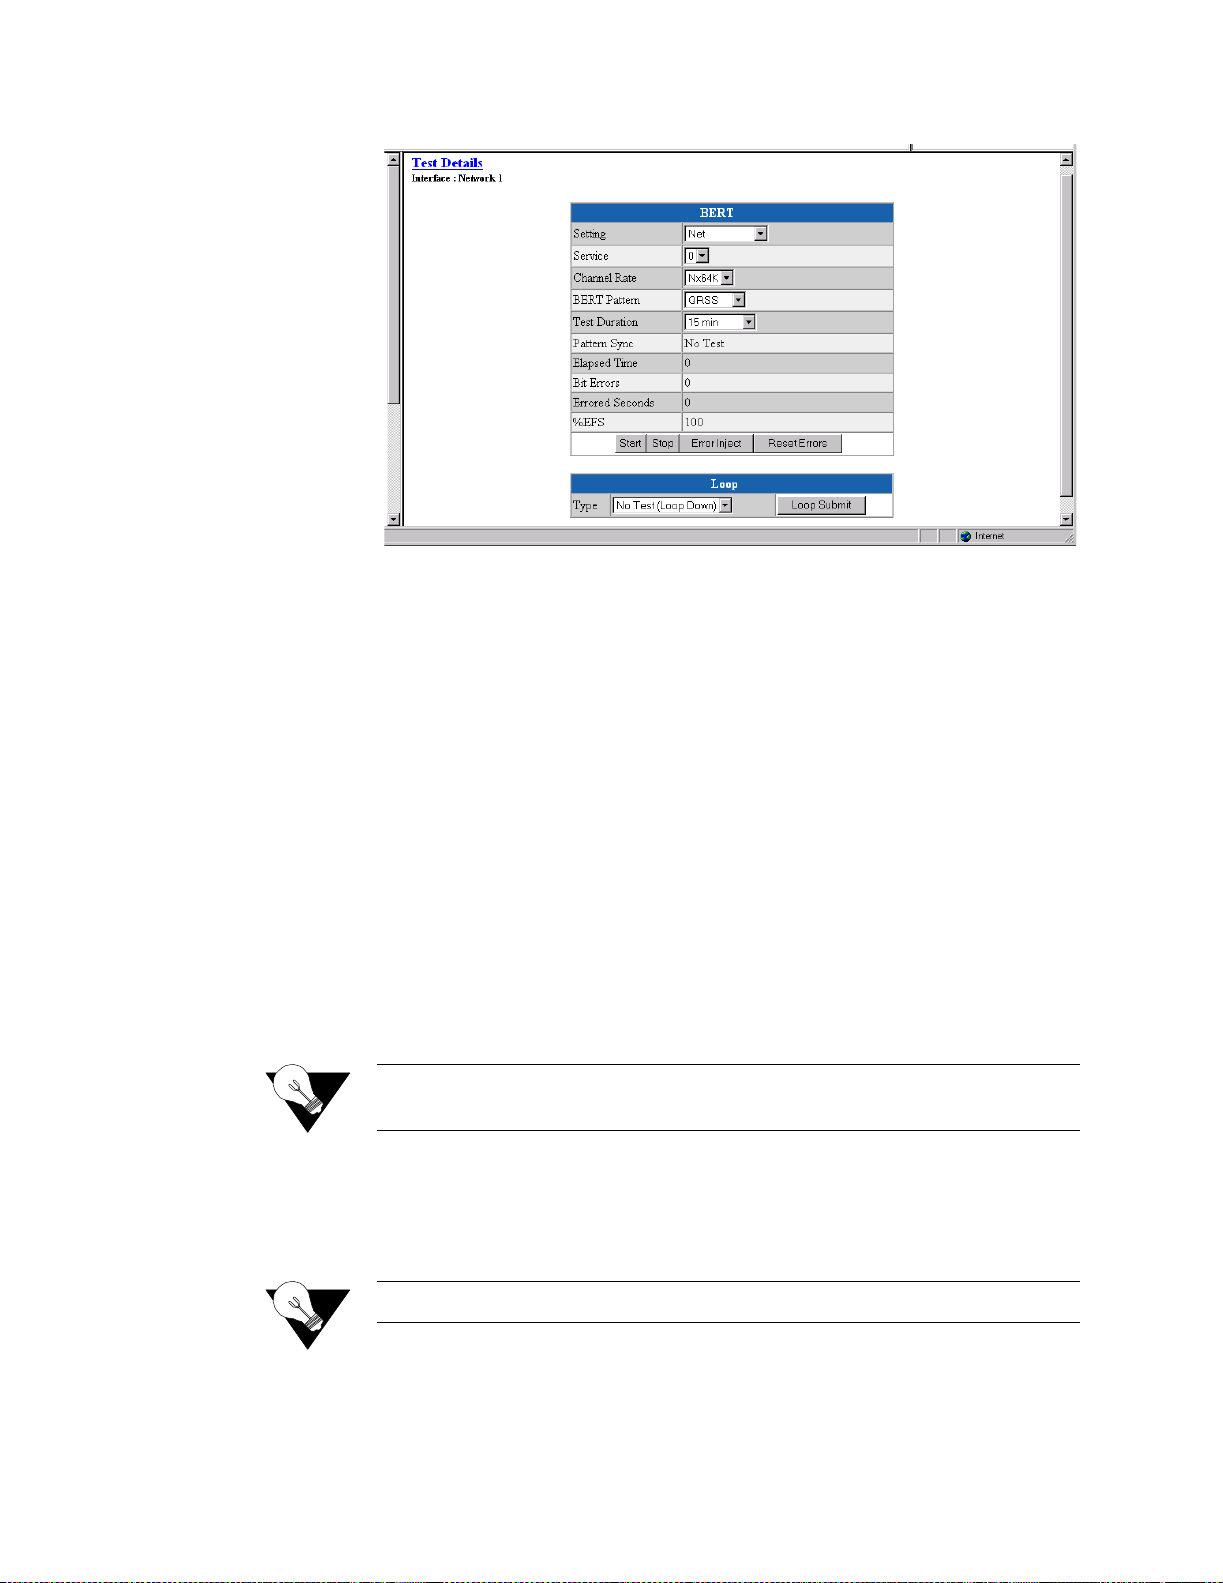
Figure 3.50
Network Interface Test Details Screen
BERT Table on the Network Interface Test Details Screen
The BERT table lets you set the parameters listed below.
Setting
Service
Channel Rate
BERT Pattern
Displays the bandwidth on which you wish to perform the BERT. The
available values for this parameter depend on which interface you select.
Values: Idle, Channel 1...24, Net, Use Service
Default: Net
Selects the cha nnels with a service to BER T (see Services Screen on
page 3-22).
Sets the bit rate to BERT for each selected channel. If “Nx64K” is selected,
the ones density requirements of the T1 network line must be ensured. If
“Nx56K” is selected, ones density for the selected DS0 channel is maintained.
Values: Nx56K, Nx64K
Default: Nx64K
NOTICE: The Service and Channel Rate parameters will appear only on Network
screens.
Specifies the pattern to be transmitted during a test for the selected port.
15
Values: Marks, QRSS, 511, 2047, 2
Default: QRSS
, Spaces
3-58 WANsuite 7105
NOTICE: The 2
15
pattern is the ITU (European) version, not the ANSI version.
Page 91
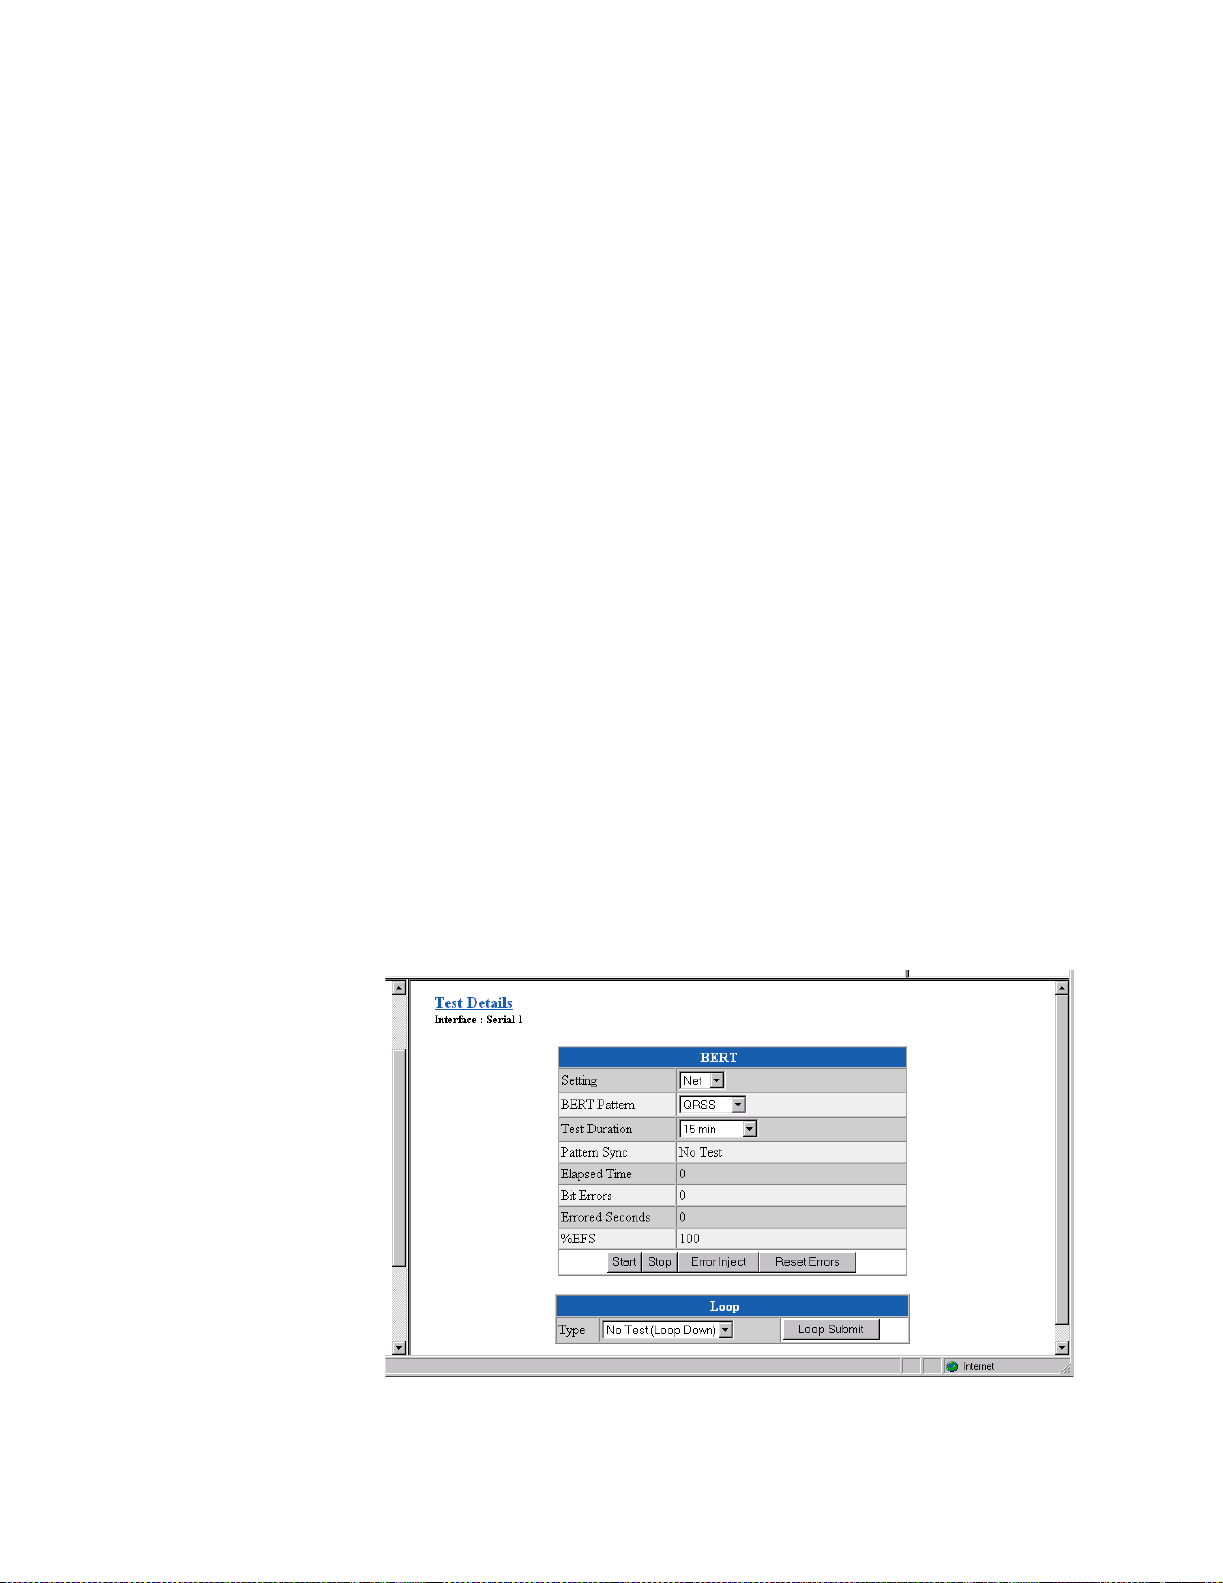
Test Duration
Specifies the length of time the test should run for the selected port.
Values: 15 minutes, 30 minutes, 1 hour, 24 hours, Continuous
Default: 15 minutes
Also on this screen, you can view the following read-only parameters:
Pattern Sync
Elapsed Time
Bit Errors
Errored Seconds
%EFS
Displays the state of pattern sync during a test. If no test is in progress, “No
Test” is displayed. If a test is active, but the receiver is not in pattern sync,
“No Sync” is displayed. If the receiver is in pattern sync, “In Sync” is
displayed.
Displays the time elapsed since a timed test began or, if completed, the total
test time.
Displays the total number of bit errors detected since the test began or since
error statistics were cleared.
Displays the number of asynchronous errored seconds that have been detected
since the t est bega n or since error s tatistics w ere last cl eared.
Displays the percentage of time that the test ran error-free. This ratio is
derived f rom the n umber o f error-fre e seco nds divid ed by the n umber of
seconds accumulated in Elapsed Time.
Loop Table on the Network Interface Test Details Screen
The Loop Table at the bottom of the screen lets you specify the type of Loop
test to be performed. The types of tests available for the Network interface are
shown below. Loopback diagrams are illustrated in Appendix A, Figure A.1.
Values: No Test (Loop Down), payload loopback (PLB), line loopback
(LLB), maintenance loopback (MLB), Far PLB, Far LLB
Default: No Test (Loop Down)
Figure 3.51
Serial Interf ace Test Details Screen
Web Server Interface 3-59
Page 92

BERT Table on the Serial In t e rf a ce Test Details Screen
The BERT table lets you set the test parameters listed below.
Setting
BERT Pattern
Test Duration
Pattern Sync
Displays the bandwidth on which you wish to perform the BERT. The
available values for this parameter depend on which interface is selected.
Values: Net, DTE
Default: Net
Specifies the pattern to be transmitted during a test for the selected port.
15
Values: Marks, QRSS, 511, 2047, 2
, Spaces
Default: QRSS
NOTICE: The 2
15
pattern is the ITU (European) version, not the ANSI version.
Specifies the length of time for which the test should run for the selected port.
Values: 15 minutes, 30 minutes, 1 hour, 24 hours, Continuous
Default: 15 minutes
You can also view the following read-only parameters from this screen:
Displays the state of pattern sync during a test. If no test is in progress, “No
Test” is displayed. If a test is active, but the receiver is not in pattern sync,
“No Sync” is displayed. If the receiver is in pattern sync, “In Sync” is
displayed.
Elapsed Time
Bit Errors
Errored Seconds
%EFS
Displays the time elapsed since a timed test began or, if completed, the total
test time.
Displays the total number of bit errors detected since the test began or since
error statistics were cleared.
Displays the number of asynchronous errored seconds detected since the test
began or since erro r statistics were last clear ed.
Displays the percentage of time the test ran error-free. This ratio is derived
from the n umber of error-fr ee seconds divided by the number of seconds
accumulat ed in Elap sed Tim e.
Loop Table on the Serial Interface Test Details Screen
The Loop Table at the bottom of the screen lets you specify the type of Loop
test to be perform ed. The t ypes of tes ts ava ilable for t he Seria l interfac e are
shown below. Loopback diagrams are illustrated in Appendix A, Figure A.1.
Values: No Test, Port Loop, V.54 Loop, Far V.54 Loop
Default: No Test (Loop Down)
3-60 WANsuite 7105
Page 93
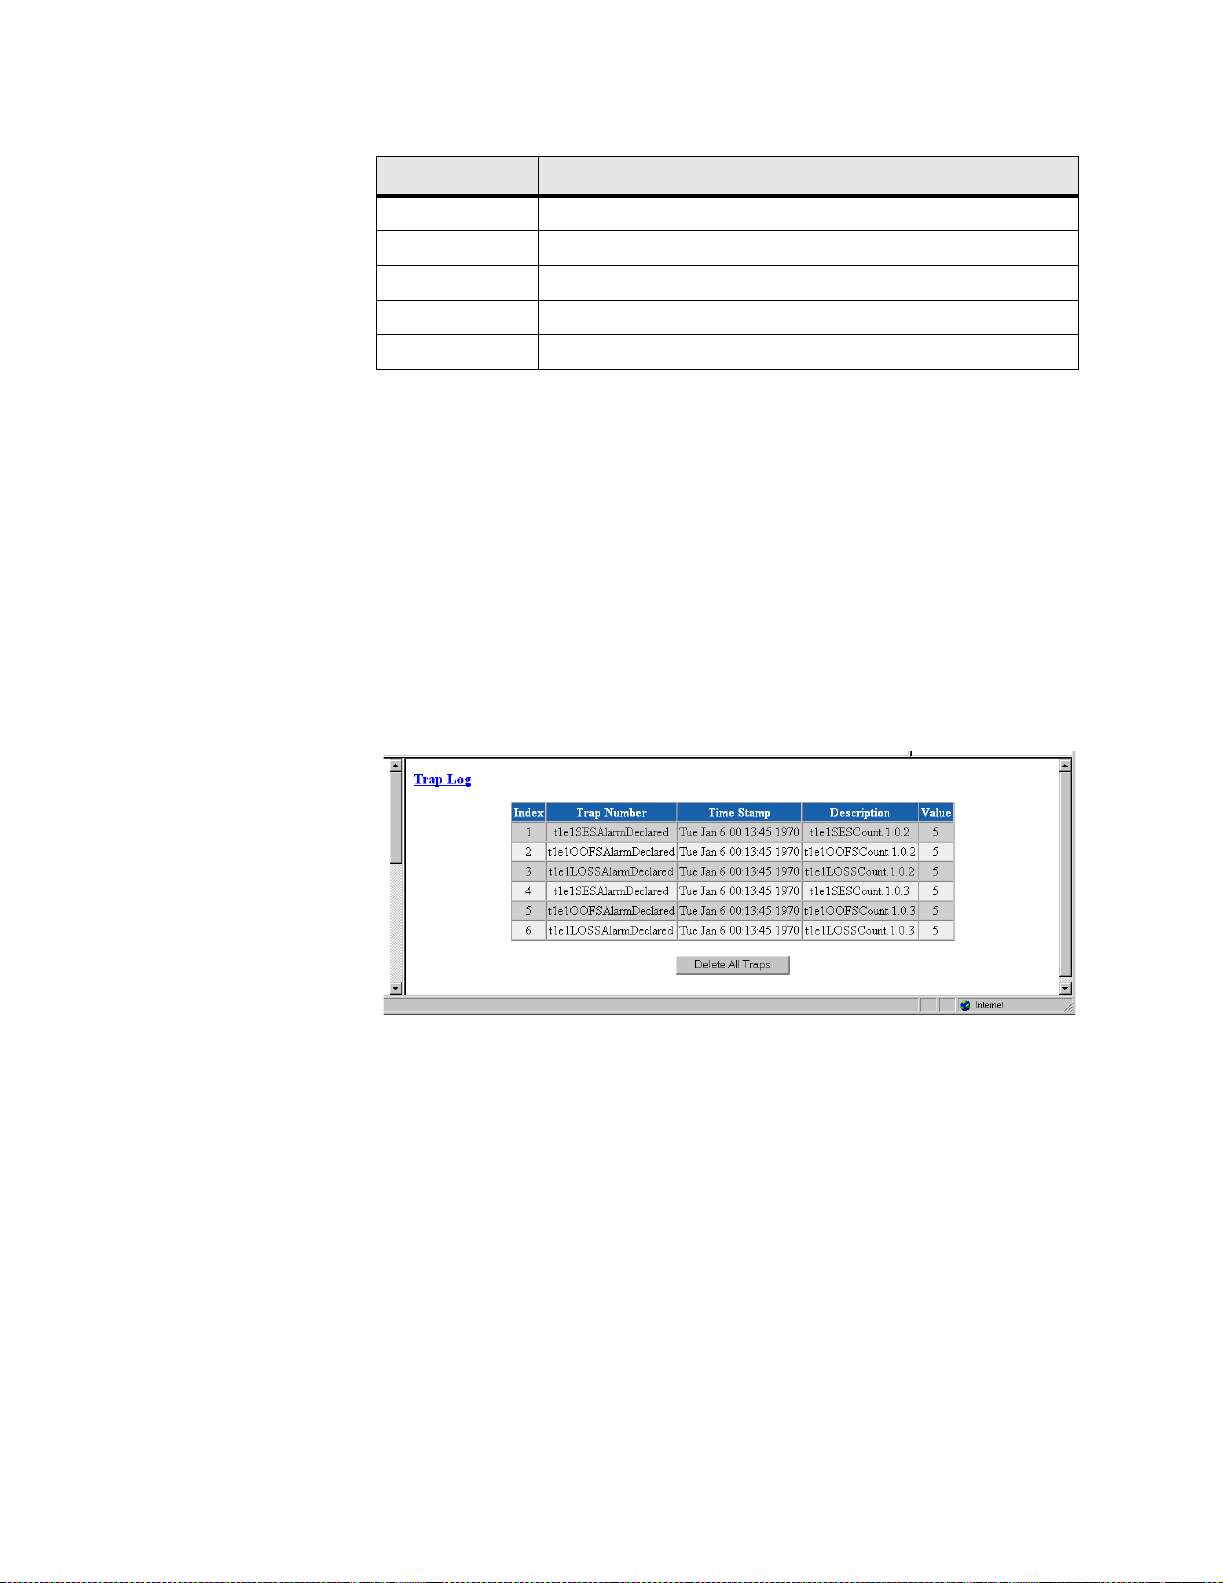
Trap Lo g Screen
The Test D etails sc reens pr ovide the followin g user-act ivated bu ttons:
Button Function
Start Starts the specified BERT.
Stop Stops the currently running BERT.
Error Inject Injects a bit error.
Reset Errors Resets the current error count.
Loop Submit Sets the type of Loop test.
The Trap Log screen (Figure 3.52) shows all traps that have been generated.
A trap is a mecha nism that permits a device to send an alarm for certa in
network events to an SNMP management station; in other words, traps are
notifications of triggered alarms.
The table shown in this screen lists each trap by its Index number, and
displays the type of error captured by the trap (Trap Number), the date and
time that the trap was stored (Time Stamp), its description, and its value.
To remove all trap information store d in memory, click the “Delet e All
Traps” button.
Figure 3.52
To p Talkers Screen
Clicking on the “Top Talkers” link in the navigation tree displays a screen
(Figure 3.53) where you can set the parameters for and initiate the generation
of a list of IP addresses ranked in terms of the number of frames and octets
they have transmitted during a specified reporting period. This report lets MIS
managers determine, based on IP addresses, who is generating the most traffic
on a WAN.
Trap Log Screen
Web Server Interface 3-61
Page 94
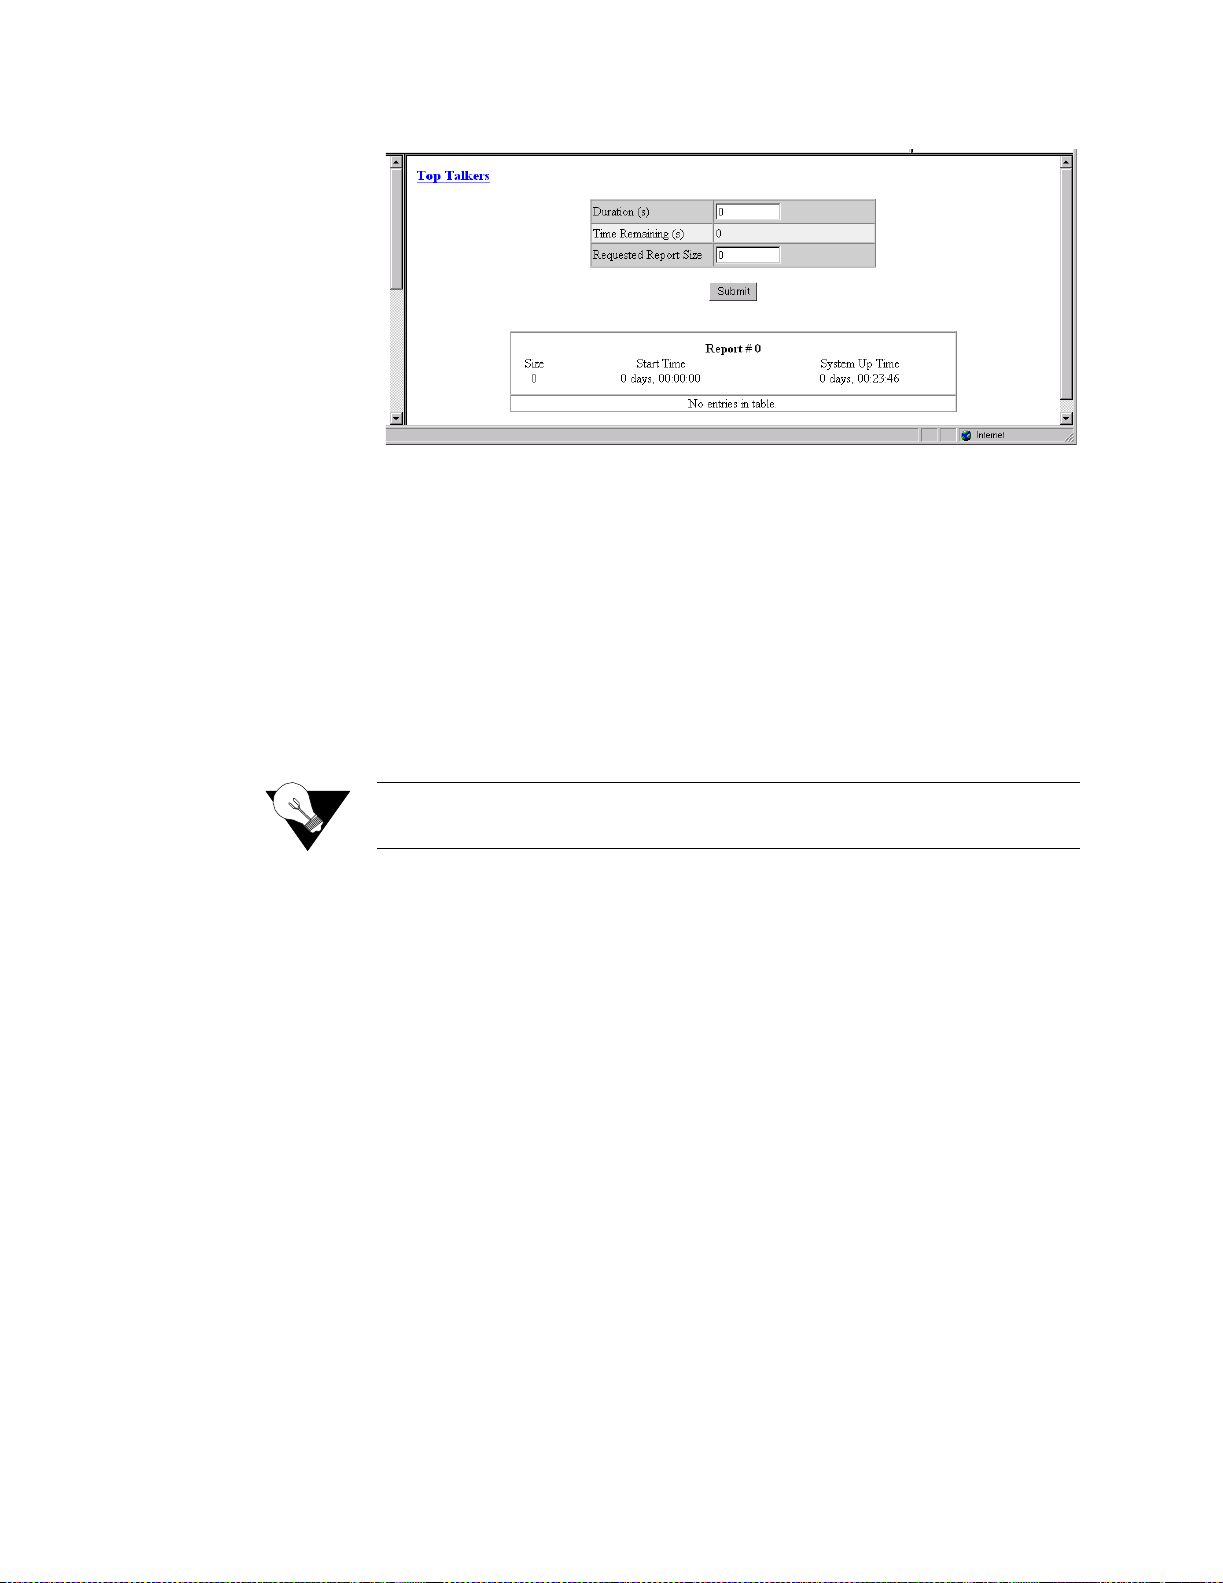
Figure 3.53
Top Talkers Screen
To generate a Top Talkers report, enter the duration parameters and desired
report size in the appropriate fields and then click the “Submit” button.
Duration
Time Remaining
Requested Report Size
Report #
Establishes the amount of time (in seconds) for which the Top Talkers report
will capture IP traffic; typically this value is 900 seconds (15 minutes).
Establishes the amount of time (in seconds) for which the Top Talkers report
will capture IP traffic; typically this value is 900 (15 minutes). As soon as
you initiate generation of the report by pressing the “Submit” button, the
Time Remaining value is copied over to the Duration field.
Establishes how many IP addresses will be reported as the “Top Talkers.”
NOTICE: While you may request any number, the unit is internally limited to a
maximum report size of 20.
As soon as the specified Duration for the report has elapsed, the screen will
refresh itself and the resulting report-specific information will be displayed in
the outlined box at the bottom of the screen. This report comprises elements
as defined in the following paragraphs.
This field displays a unique number used to identify the generated report. This
number is generated automatically, is incremented sequentially for each
report, and can be used by management stations for automatic polling (via the
ipadv2.mib).
Size
Start Time
System Up Time
3-62 WANsuite 7105
Displays the actual number of IP addresses identified as Top Talkers in the
generated report. The maximum report size is 20.
Displays the time at which the Top Talkers report was initiated (based on
System U p Time).
Displays the amount of time the unit has been operational since it was turned
on or last reset.
The Top Talkers table reports in descending order the IP addresses that have
generated the most traffic during the requested report’s duration. For each IP
address listed, the report displays the number of Rx frames, Rx octets, Tx
frames, and Tx octets that have been passed across it. In addition, the
Page 95
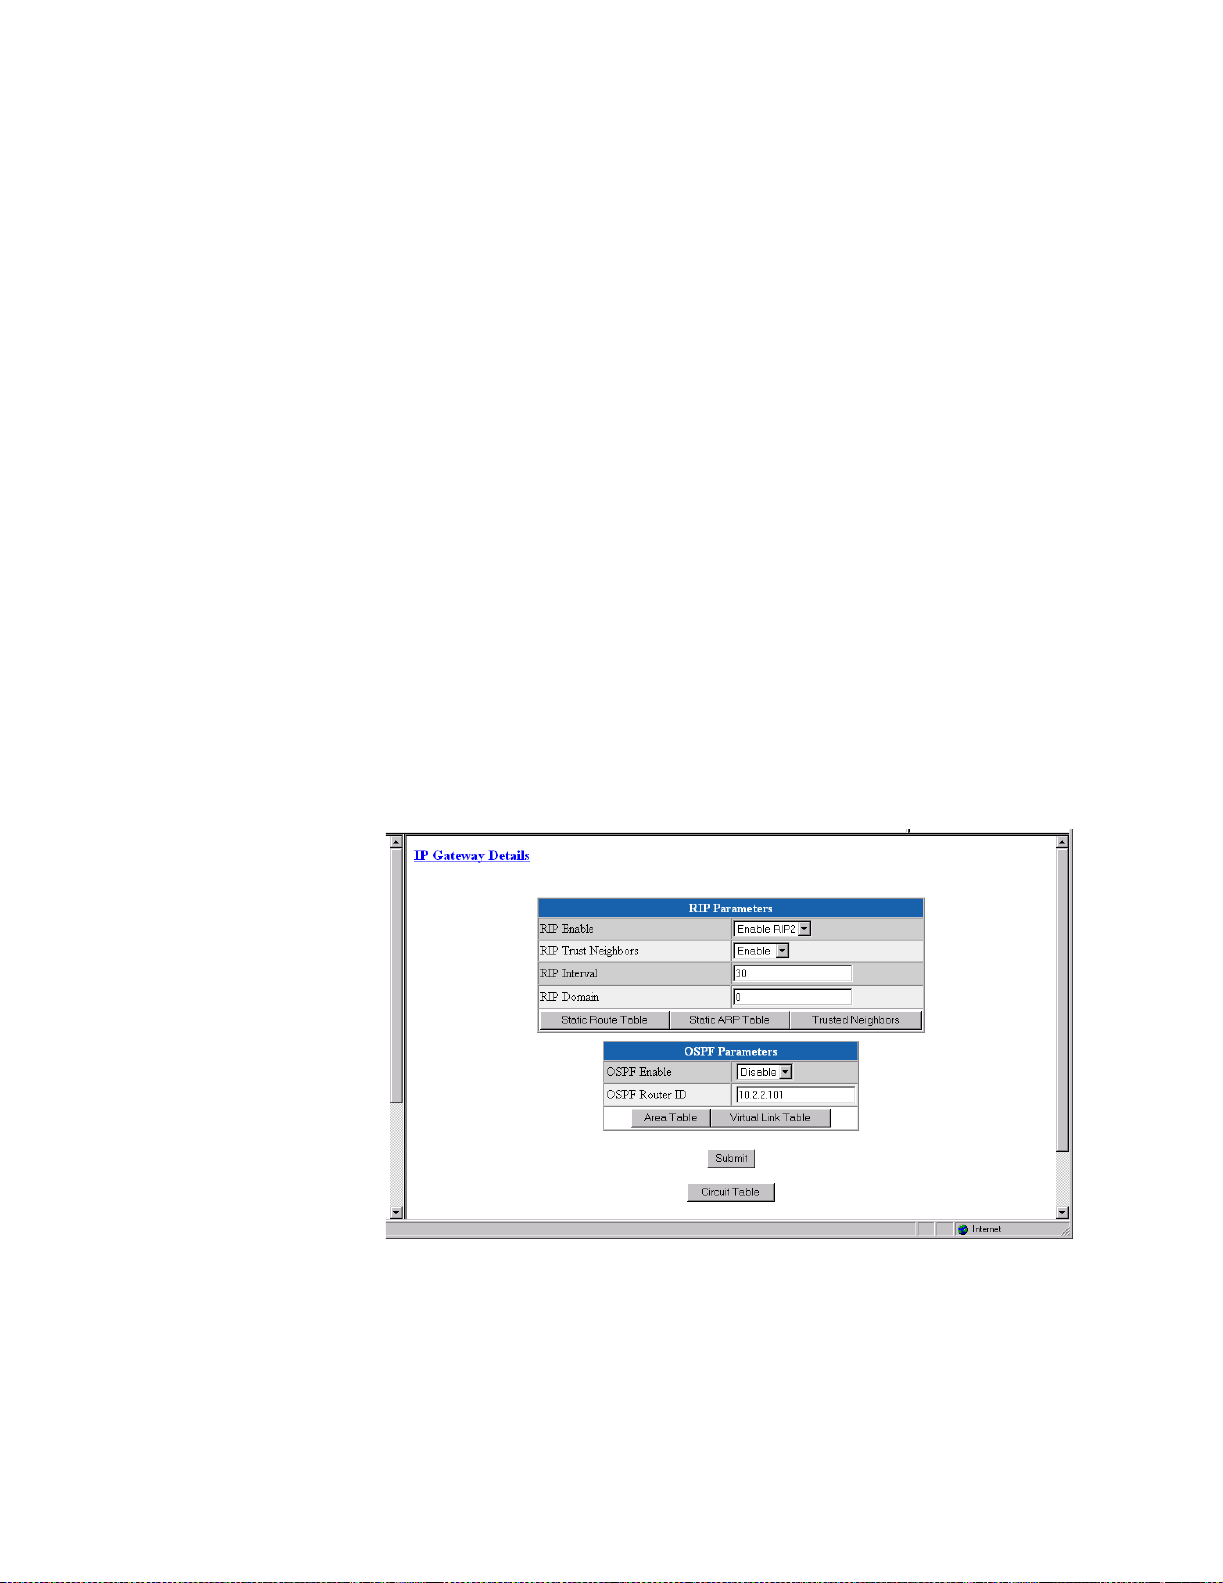
Timestam p field in dicates th e time a t which a packet w as exam ined for the
specified IP address.
IP Gateway Details Screen
The IP Gateway is a feature of the WANsuite 7105 that allows routing of IP
packets from one network to another using static routes configuration and/or
dynamic routing. The IP Gateway uses Routing Information Protocol (RIP) 1
or RIP 2 or Open Shortest Path First (OSPF) routing.
RIP 1 and RIP 2 are protocols that allow exchange of routing information
between two routers. With that information exchange, a router can build its
own routing tables that later can be used for “routing” IP packets.
OSPF is a shortest path first (SPF) or link-state protocol. OSPF is also an
internal gateway protocol (IGP) that distributes routing information between
routers in a single autonomous system (AS). OSPF chooses the least cost path
as the be st path.
While RIP is ideal for small- to medium-sized networks, OSPF is more
suitable for complex networks with a large number of routers. OSPF provides
equal cost multipath routing where packets to a single destination can be sent
via more than one interface simultaneously.
The IP Gateway also supports unnumbered networks. An unnumbered
network is a point-to-point connection without an assigned IP address This
feature reduces the number of IP addresses required.
RIP Enable
Figure 3.54
IP Gateway Details Screen
RIP Parameters
Globally enables RIP1, RIP2, or No RIP.
Values: Disable, Enable RIP1, Enable RIP2
Default: Enable RIP2
Web Server Interface 3-63
Page 96

RIP Trust Neighbors
Globally enables the trusted neighbors feature. If there is a list of trusted
neighbors in an IP Gateway, only RIP packets coming from those trusted
neighbors will be used to build the internal routing table.
Values: Enable, Disable
Default: Enable
RIP Inter val
RIP Domain
OSPF Enable
OSPF Router ID
Interval for RIP packet to be sent. Default is 30 seconds.
Value representing the RIP domain. Default is 0.
OSPF Parameters
Globally enables OSPF.
Values: Disable, Enable
Default: Disable
This 32-bit number assigned to each router running the OSPF protocol
uniquely identifies the router within an autonomous system. Each router
requires a unique router ID. Default is the LAN IP address of the unit.
The IP Gateway Details screen provides the following user-activated buttons:
Button Function
RIP Parameters
Static Routes Ta ble Displays static routes an d dynamic routes information.
Static ARP Table Displays static ARP information.
Trusted Neighbors Displays truste d neighbors information.
OSPF Para meters
Area Table Displays area information.
Virtual Link Table Displays virtual link informat ion.
Submit Submits to the unit information specific to IP Gateway.
Circuit Table Lets you access circuit- related information/operation.
Circuit Table Screen
Access this menu by clicking on the “Circuit Table” button at the bottom of the
IP Gateway menu. This scr een sh ows the conf igured ci rcuit . To configur e a new
circuit, click on “Add New.”
3-64 WANsuite 7105
Page 97

Figure 3.55
Circuit Table Screen
Circuit Details Screen
Access this menu (Figure 3.56) by accessing the appropriate numbered link
under the “Index” column on the Circuit Table screen.
Endpoint
Figure 3.56
Circuit Details Screen .
Endpoint name. By de fault, the first circuit is always the LAN c ircuit. All
other circuits are associated with Endpoint names as defined in the Endpoint
Table as shown in Figure 3.40.
IP Address
IP Mask
Max Transmit Unit
Cost
IP Address of the circuit.
IP mask of the circuit.
Maximum transmit unit this circuit will send at any one time.
Represents the relative time of treatment of an IP packet. This value is used
when there are mu ltiple rout es to th e same d estination . When t wo or more
routes ar e available, the one with the lowest circuit co st is sel ected. A f rame
relay circuit should have a higher value than a LAN circuit.
Web Server Interface 3-65
Page 98

RIP Status
Indicates whether or not RIP is enabled on this circuit.
Values: Disable, Listen and Talk, Talk Only, Listen Only
Default: Listen and Talk
Multicast Status
OSPF Status
OSPF Area
OSPF LSA Timer
OSPF LSU Delay
OSPF Router Priority
Indicates whether or not Multicast is enabled on this circuit.
Values: Enable, Disable
Default: Enable
Indicates w hether o r not OS PF is en abled on this circ uit.
Values: Enable, Disable
Default: Disable
Represent s the area that thi s circuit i s part o f.
Determines how often the Link State Acknowledgment (LSA) packet is sent.
Values: 1−3600
Default: 1
The estimated number of seconds it takes to transmit a Link State Update
(LSU) packet over this circuit interface.
Values: 1−3600
Default: 1
This 8-bit unsigned integer ranges from 1 to 255 and assigns priority to one of
two routers attached to the same network; without an assigned priority, both
routers attempt to become the designated router.
Values: 1−255
Default: 1
OSPF Hello Interval
OSPF D ead Interval
OSPF Auth Key
The time in seconds between the Hello packets that a router sends on a
circuit. This value is also advertised in the router’s Hello packets and must be
identical for all routers on the same network. The smaller the Hello Interval,
the sooner topological changes are detected (but then more traffic is created).
Values: 1−65535
Default: 1
The number of seconds that a router’s Hello’s have not been received before
its neighbors declare the router down. The value must be the same as the
value on the network.
Values: 1−65535
Default: 40
When configured, this parameter allows an authentication procedure to be
executed on the OSPF header. If the 64-bit (8 character) password does not
correspond , the pac ket is t hrown away .
Values: 64 bits ( 8 char acters)
Default: 8 spaces (no authen tication)
3-66 WANsuite 7105
Page 99

The Circuit Details screen provides the following user-activated buttons:
Button Function
Submit Sets any values that have been changed.
Circuit Table Returns you to the previous screen.
Static Route Table Screen
Under some circumstances, it may not be necessary for a router to learn a
route using ordinary means such as RIP or OSPF. It is possible under these
circumstances for you to add a route to the route table of a router.
The Static R outes Table (Figure 3.57) is always associated with a circuit.
Access this menu by selecting the Static Routes Table from the RIP
Parameters Table on the IP Gateway Details screen.
Endpoint
Target IP Address
Target IP Mask
Next Hop
Cost
Route Status
Figure 3.57
Static Route Tab le Screen
Endpoint name ( or interface) thr ough which to send the IP packet to r each the
Target IP Addr ess.
Represents the target network that you want this router to reach.
Mask of the Target network.
IP address of the next device in the route.
Cost of using that route.
Indicates whether a route is enabled or disabled.
The Static Routes Table screen provides the following user-activated buttons:
Button Function
Dynamic Route Table Displays all known routes.
Add New Adds a new static route.
Route Details Screen
Access this menu (Figure 3.58) by clicking on the appropriate numbered link
under the “Index” column on the Static Route Table screen.
Web Server Interface 3-67
Page 100
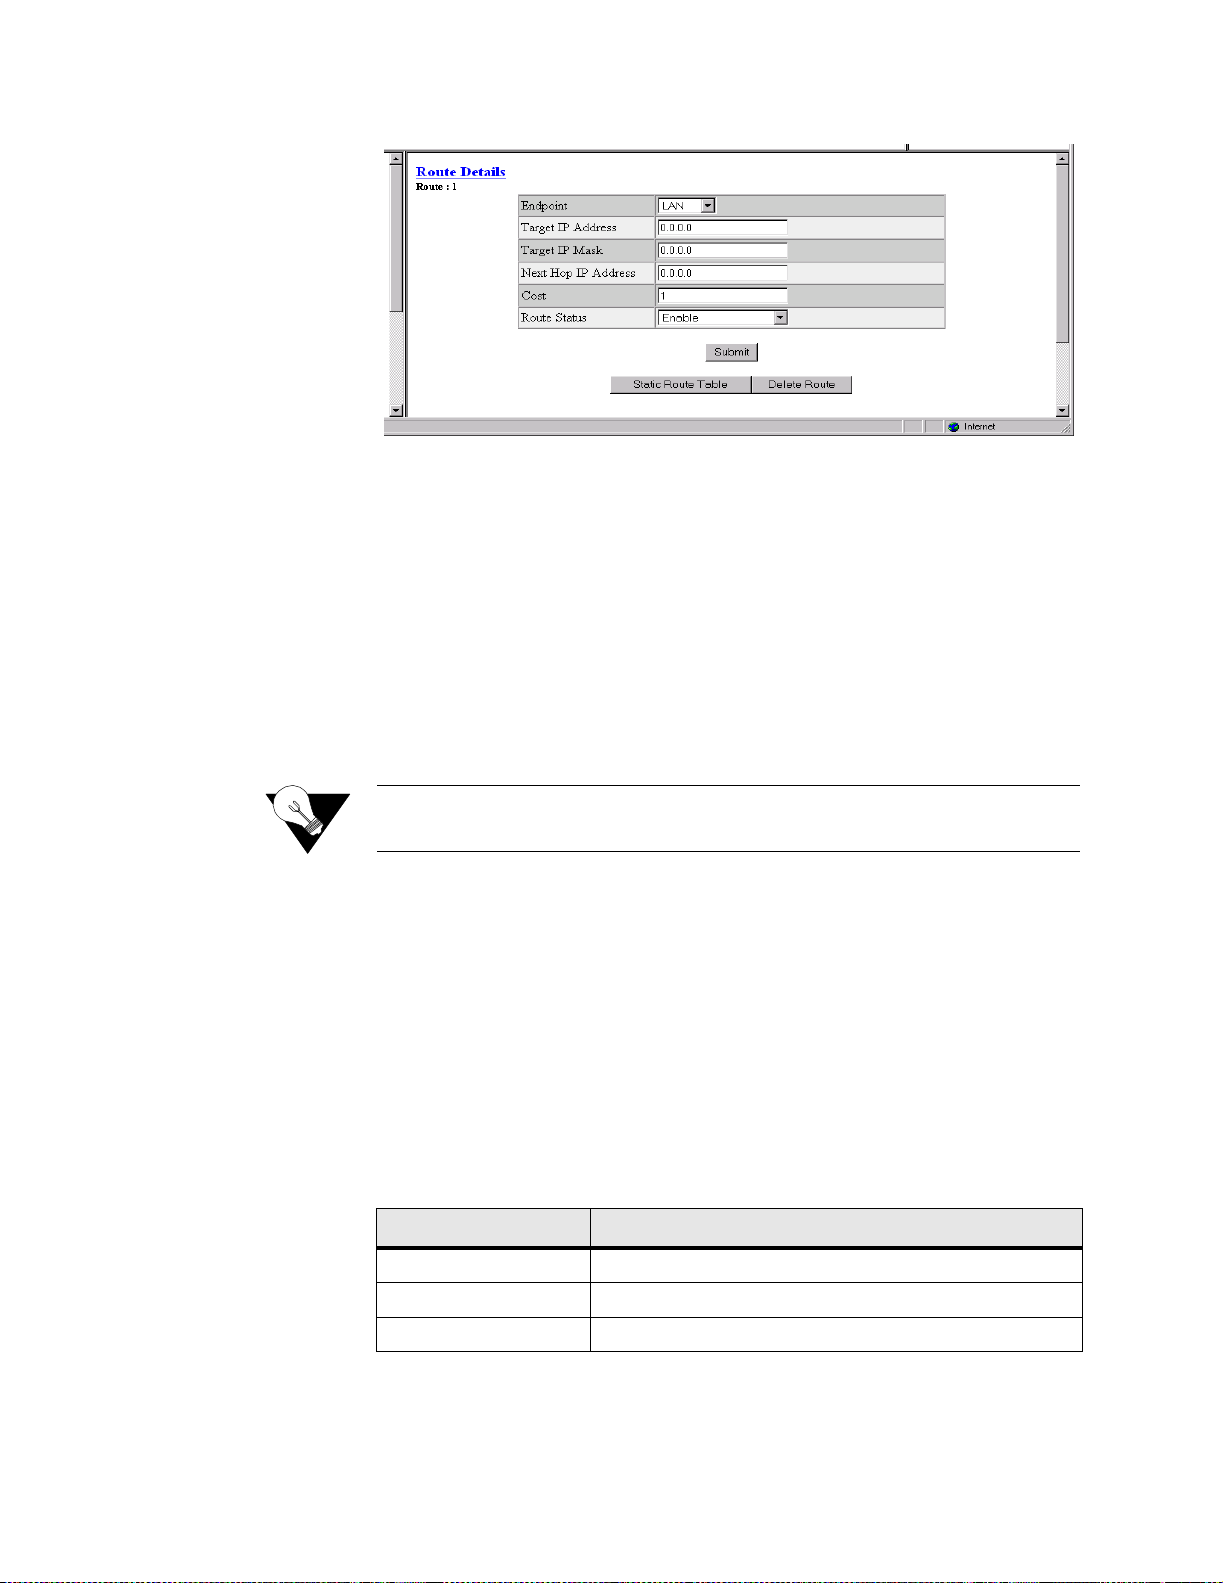
Figure 3.58
Route Details Sc reen
Endpoint
Target IP Address
Target IP Mask
Next Hop IP Address:
Cost
Route Status
Endpoint name ( or interface) thr ough which to send the IP packet to r each the
Target IP Addr ess.
Represents the target network that you want this router to reach.
Values: 0.0.0.0−255.255.255.255
Default: 0.0.0.0
Mask of the Target IP or network.
Values: 0.0.0.0−255.255.255.255
Default: 0.0.0.0
NOTICE: Setting the Target IP Address and Target IP Mask to 0.0.0.0 defines
THE default route for this unit.
IP address of the next device in the route.
Cost of using that route.
Values: 0−65535
Default: 1
Indicates whether or not the current route is enabled.
Values: Disable, Enable, Enable and Advertize
Default: Enable
3-68 WANsuite 7105
The Route Details screen provides the following user-activated buttons:
Button Function
Submit Sets any values that have been changed.
Static Route Table Returns you to the prev ious screen.
Delete Route Deletes the route curren tly displayed.
 Loading...