

Page 1
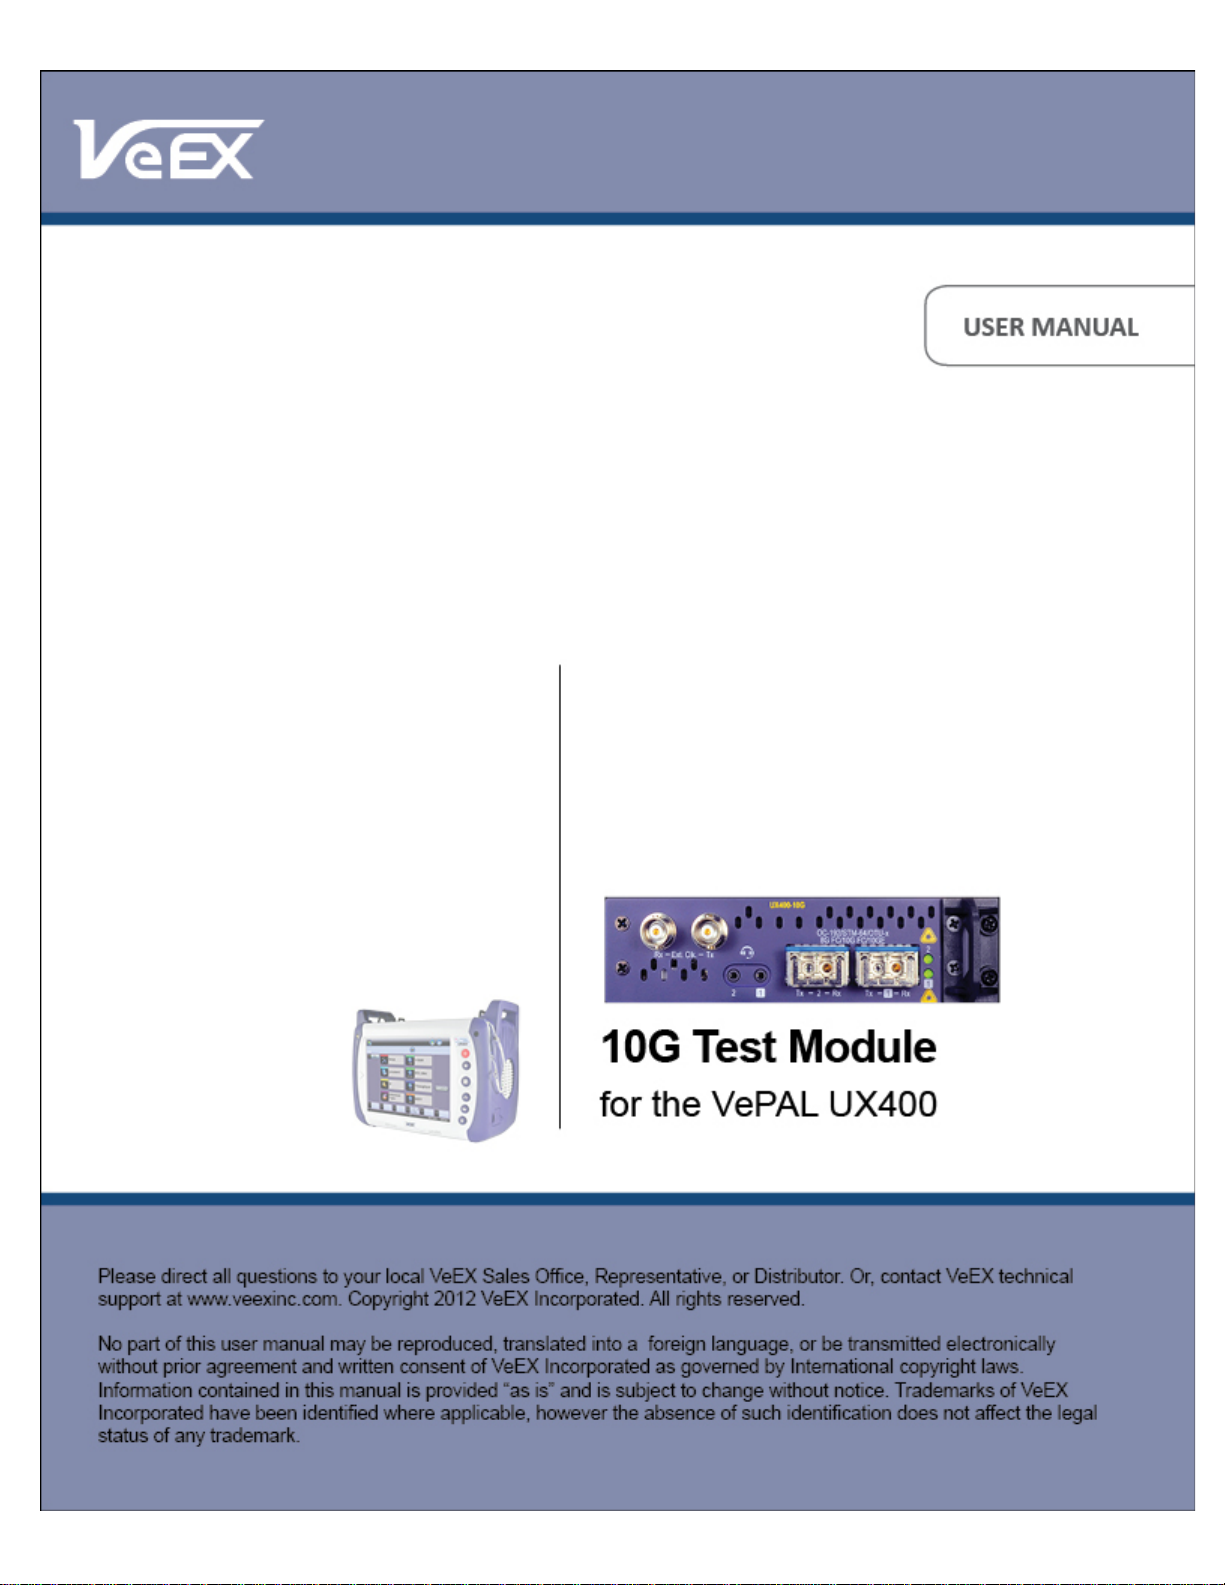
UX400 10G e-Manual D07-00-058P RevA00
Page 1 of 209
Page 2

Table of Contents
UX400 10G e-Manual D07-00-058P RevA00
Page 2 of 209
1.0 About This User Manual
2.0 Introduction to UX400
3.0 Safety Information
4.0 Platform Overview
4.1 Keypad
4.2 Touch Screen Display
4.3 Battery
4.3.1 Using the Built-in Battery Backup System
4.3.2 Battery Overdraw Protection
4.4 Connectors and Panels
4.4.1 Test Modules
4.4.2 RJ- 45 Interface
4.4.3 Bantam Interface
4.4.4 BNC Interface
4.4.5 XFP/SFP Transceiver Interface
4.4.6 SMA Interface
4.4.7 Utility Ports
4.5 LEDs
4.6 Software Upgrade
5.0 Basic Set up and Common Tasks
5.1 Home Screen Tabs
5.2 Common Tasks
5.2.1 Assigning Test Modules
5.3 Platform Settings
5.3.1 Tools
5.3.2 Utilities
5.3.3 Files
Page 3

6.0 10G Ethernet Test Application
UX400 10G e-Manual D07-00-058P RevA00
Page 3 of 209
6.1 Setup
6.1.1 Port Setup
6.1.2 Measurement Setup
6.2 BERT
6.2.1 BERT Setup
6.2.1.1 Header Settings
6.2.1.2 Traffic Settings
6.2.1.3 Error Injection
6.2.1.4 Alarm Injection Settings
6.2.1.5 Starting/Stopping a BERT
6.2.2 BERT Results
6.2.2.1 Summary
6.2.2.2 Signal
6.2.2.2 Errors
6.2.2.3 Alarms
6.2.2.5 Events
6.2.2.6 Traffic
6.2.2.7 Delay
6.2.2.8 Rates
6.2.3 Saving BERT Results
6.3 RFC2544
6.3.1 Setup
6.3.1.1 Header Settings
6.3.1.2 Frames Settings
6.3.1.3 Threshold Settings
6.3.1.4 Throughput, Latency, Frame Loss, and Burst Settings
6.3.1.5 Starting/Stopping a RFC 2544 Measurement
6.3.2 Results
6.3.2.1 Status
6.3.2.2 Summary
6.3.2.3 Signal
Page 4

6.3.3 Saving RFC2544 Results
6.6.2.1 Summary
UX400 10G e-Manual D07-00-058P RevA00
Page 4 of 209
6.4 V-SAM
6.4.1 V- SAM Setup
6.4.2 Results
6.3.2.4 Events
6.3.2.5 Throughput
6.3.2.6 Latency and Jitter
6.3.2.7 Frame Loss
6.3.2.8 Burst
6.4.1.1 Header Settings
6.4.1.2 Service Attributes
6.4.2.1 Configuration Tests
6.4.2.2 Performance Test
6.4.2.3 Signal
6.4.2.4 Event Log
6.5 Throughput
6.5.1 Setup
6.5.1.1 General Throughput Settings
6.5.1.2 Header Settings
6.5.1.3 Traffic Settings
6.5.1.4 Error Injection Settings
6.5.1.5 Alarm Injection Settings
6.5.1.6 Summary
6.5.1.7 Starting/Stopping a Throughput Test
6.5.2 Throughput Results
6.5.2.1 Global Results
6.5.2.2 Per Stream Results
6.5.3 Saving Throughput Results
6.6 Loopback
6.6.1 Setup
6.6.2 Results
Page 5

6.6.2.2 Signal
UX400 10G e-Manual D07-00-058P RevA00
Page 5 of 209
6.6.2.3 Errors
6.6.2.4 Alarms
6.6.2.5 Events
6.6.2.6 Traffic
6.6.2.7 Delay
6.6.2.8 Rates
6.6.2.9 PCS
7.0 OTN/ SDH/ SONET (OTU2/STM -64/OC - 192) Test App
7.1 Setup
7.1.1 Signal Overview
7.1.1.1 Heirarchy
7.1.1.2 Interface
7.1.2 Measurements Setup
7.1.3 General Setup
7.2 Results
7.2.1 Summary
7.2.2 Errors and Alarms
7.2.3 Event Log
7.2.4 Signal
7.1.1.3 Structure
7.1.1.4 Payload
7.1.1.5 Pattern
7.1.2.1 Timer Setup
7.1.2.2 Performance Analysis
7.2.5 Histogram
7.2.6 Graph
7.2.7 Performance Analysis
7.2.7.1 Evaluation According to ITU-T G.821
7.2.7.2 Evaluation According to ITU-T G.826
7.2.7.3 Evaluation According to ITU-T G.828
Page 6

7.2.7.4 Evaluation According to ITU-T G.829
7.4.4.2 Received Traces (RX)
UX400 10G e-Manual D07-00-058P RevA00
Page 6 of 209
7.2.7.5 Evaluation According to ITU-T M.2100
7.2.7.6 Evaluation According to ITU-T M.2101
7.2.8 Alarm Error Definitions for SDH, SONET and OTN
7.2.8.1 SDH
7.2.8.2 SONET
7.2.8.3 OTN
7.3 Alarm / Error Injection
7.3.1 Setup Alarm and Error Injection
7.3.2 Alarm Generation
7.3.2.1 SDH Alarms
7.3.2.2 SONET Alarms
7.3.2.3 OTN Alarms
7.3.3 Error Generation
7.3.3.1 SDH Errors
7.3.3.2 SONET Errors
7.3.3.3 OTN Errors
7.3.4 Error Flow
7.3.4 Pattern Error
7.4 SONET Tools
7.4.1 Overhead Analyzer
7.4.1.1 Section Overhead (SOH)
7.4.1.2 Path Overhead Layer (POH)
7.4.1.3 Summary
7.4.2 Overhead Generator
7.4.3 Pointer Tasks
7.4.3.1 Pointer Analysis
7.4.3.2 Pointer Generator
7.4.3.3 Pointer Sequences
7.4.4 Trace Identifier
7.4.4.1 Transmitted Traces (TX)
Page 7

7.4.5 Payload Labels
UX400 10G e-Manual D07-00-058P RevA00
Page 7 of 209
7.4.6 APS Tasks
7.4.7 Tandem Connection Monitoring (TCM)
7.4.8 Tributary Scan
7.4.9 Round Trip Delay
7.4.10 One Way Delay
7.5 SDH Tools
7.5.1 Overhead Analyzer
7.5.1.1 Section Overhead
7.5.1.2 Path Overhead Layer
7.5.1.3 Summary
7.5.2 Overhead Generator
7.5.3 Pointer Tasks
7.5.3.1 Pointer Analysis
7.5.3.2 Pointer Generation
7.5.3.3 Pointer Sequences
7.5.4 Trace Identifier
7.5.4.1 Transmitted Traces (TX)
7.5.4.2 Received Traces (RX)
7.5.5 Payload Labels
7.5.6 APS Tasks
7.5.6.1 APS Timing
7.5.7 Tandem Connection Monitoring (TCM)
7.5.8 Tributary Scan
7.5.9 Round Trip Delay
7.4.10 One Way Delay
7.6 OTN Tools
7.6.1 Overhead Analyzer & Generator
7.6.1.1 OTN Frame Analysis
7.6.1.2 Optical Transport Unit (OTU) Analysis
Page 8

7.6.1.3 Optical Data Unit (ODU) Analysis
UX400 10G e-Manual D07-00-058P RevA00
Page 8 of 209
7.6.1.4 Optical Payload Unit (OPU) Analysi
7.6.2 Payload Label (Payload Structure Identifier)
7.6.3 Trace Identifier (Trail Trace Identifier)
7.6.4 TCM Tasks (Tandem Connection Monitoring)
7.7 PDH Tools
7.7.1 E1 APS Testing
7.7.2 E1 Frame Words
7.7.3 E1 RX Data
7.7.4 DS1 RX Data
7.8 Profiles
8.0 Warranty and Software
9.0 Product Specifications
10.0 Certification and Declarations
11.0 About VeEX
Go back to top
Page 9

1.0 About This User Manual
UX400 10G e-Manual D07-00-058P RevA00
Page 9 of 209
The purpose of this manual is to help users successfully use the features of VePAL UX400 test platform.
This manual is intended for novice, intermediate, and experienced users. It is assumed that users have basic computer
experience and skills, and are familiar with basic telecommunication concepts, terminology, and safety. For more technical
resources, visit VeEX Inc. website at
Every effort was made to ensure that the information contained in this manual is accurate. However, information is subject to
change without notice. We accept no responsibility for any errors or omissions. In case of discrepancy, the web version takes
precedence over any printed literature.
© Copyright 2012 VeEX Inc. All rights reserved. VeEX is a registered trademarks of VeEX Inc and/or its affiliates in the USA and
certain other countries. All trademarks or registered trademarks are the property of their respective companies.
No part of this document may be reproduced or transmitted electronically or otherwise without written permission from VeEX Inc.
This device uses software either developed by VeEX Inc or licensed by VeEX Inc from third parties. The software is confidential
and proprietary of VeEX Inc. The software is protected by copyright and contains trade secrets of VeEX Inc or VeEX's licensors.
The purchaser of this device agrees that it has received a license solely to use the software as embedded in the device, and the
purchaser is prohibited from copying, reverse engineering, decompiling, or disassembling the software.
If any assistance is needed or there are any questions related to the use of this product, call or e-mail our Customer Care
department for customer support. Before contacting our Customer Care department, have the serial number ready. Please refer
to the Basic Operations section of this manual for details on locating the unit serial number.
www.veexinc.com.
Customer Care:
Phone: +1 510 651 0500
E-mail:
Website:
Go back to TOC
www.veexinc.com
Page 10
2.0 Introduction to UX400
UX400 10G e-Manual D07-00-058P RevA00
Page 10 of 209
VeEX® UX400 is the industry’s most flexible, compact, and future-proof test solution for OTN, SDH, SONET, PDH, T-Carrier,
Carrier Ethernet, Mobile Backhaul, Core, and Storage Area Networks. VeEX UX400 is the first truly robust portable platform to
offer test capabilities ranging from DS1/E1 to 100GE and beyond, allowing any combination of test modules tailored for each
particular application or set of requirements. Its versatile and flexible hardware and software architecture optimize configurations
to meet users’ specific needs; from transport applications at rates ranging from DS1/E1 to OC-768/ STM-256, OTU3 and OTU4 to
Carrier and Ethernet Transport applications from 10M to 40GE/100GE and beyond.
Its modular architecture allows for up to six independent test modules and up to six concurrent tests or combination of tests. It
also allows simultaneous local and remote users to share the platform and run independent tests, maximizing the use of
resources.
Key Features of UX400:
Industry’s smallest and most powerful 1.5Mbps to 100G test platform
Supports OTU4/OTU3, 40/100GE, 10GE, 1000Base-X, 10/100/1000Base-T, SDH/SONET up to STM-256/OC-768,
and PDH/DSn test interfaces without having to change modules
Large high resolution 10.4” color touch screen VGA monitor port, microphone/headset, built-in speaker
Built-in GPS timing and Atomic (Rubidium) clock
Provide accurate and stable timing reference when an office clock is not available (e.g. Mobile Station)
Verify the accuracy of a received network clock
Intel Atom 1.6GHz Processor
2GB DDR, 8GB SDD (up to 32GB)
High capacity Li-ion battery pack
>1 hour @ 40G, >8 hours @ 1GE
Battery operation at all rates
1000Base-T management port
Dual USB 2.0 ports
WiFi, 3G UMTS modem, Bluetooth, Memory stick
VFL and OPM hardware options
Weighs <15kg fully loaded including battery
Dual ports to monitor network bi-directionally
PDH/DSn/SDH/SONET from E1/T1 to 40G
OTN from OTU1 to OTU4
Ethernet from 10Base -T to 100GE
Generate +/ - 150ppm clock offset to stress both Ethernet and SDH networks
Jitter and Wander analysis up to STM-1e rates
SyncE and IEEE 1588v2 support with Wander analysis
Pulse mask analysis on PDH/DSn signals
Multiple remote and local users able to share platform for simultaneous testing
Multiple Test Applications and Users
Independent configuration and operation of modules allows multiple users to share platform
Up to 6 test applications can be configured and operated simultaneously, locally and remotely
SCPI remote control interface via IP connection for multiple user/applications
Go back to TOC
Page 11
3.0 Safety Information
UX400 10G e-Manual D07-00-058P RevA00
Page 11 of 209
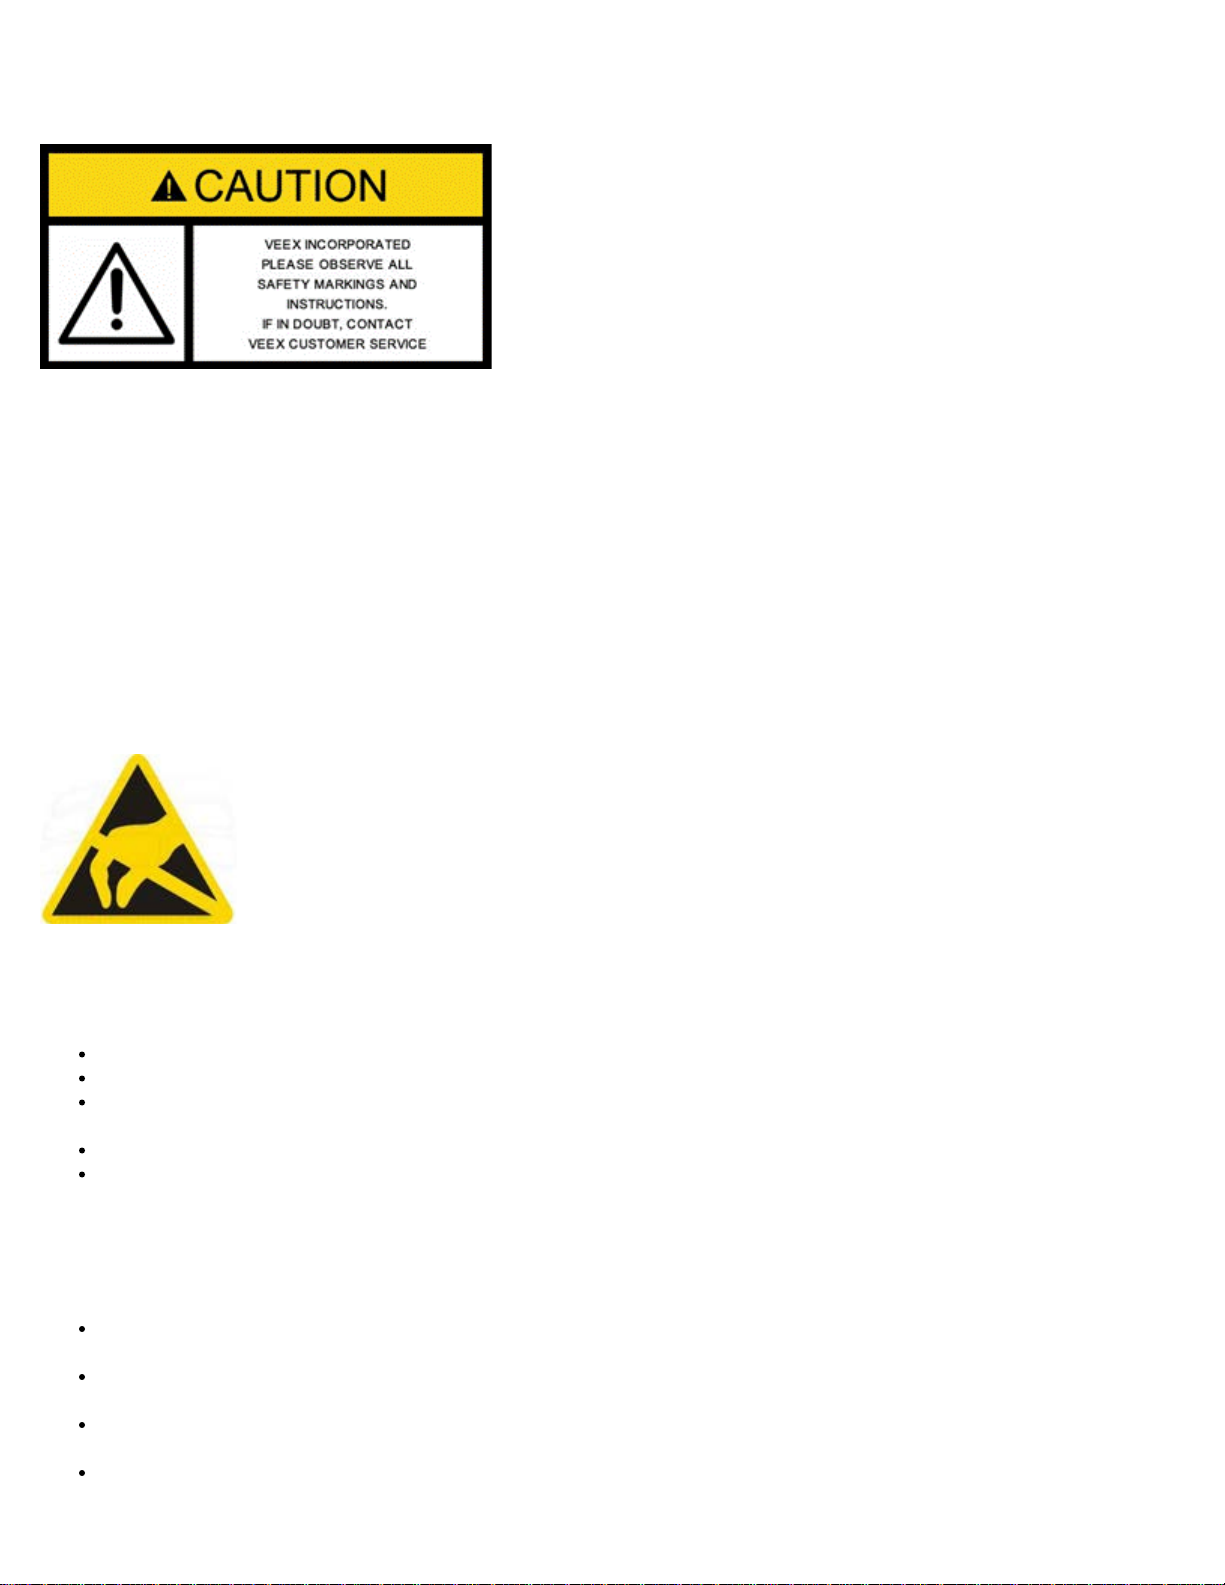
Safety precautions should be observed during all phases of operation of this instrument. The instrument has been designed to
ensure safe operation, however, please observe all safety markings and instructions. Do not operate the instrument in the
presence of flammable gases or fumes or any other combustible environment. VeEX Inc. assumes no liability for the customer's
failure to comply with safety precautions and requirements.
Optical Connectors
The UX400 displays a laser warning icon when the laser source is active to alert the user about a potentially dangerous situation.
It is recommended to:
1. Deactivate the laser before connecting or disconnecting optical cables or patchcords.
2. Never look directly into an optical patchcord or an XFP's or SFP’s connector interface while the laser is enabled. Even
though XFP and SFP optical transceivers are typically fitted with Class 1 lasers, which are considered eye safe, optical
radiation for an extended period can cause irreparable damage to the eyes.
3. Never use a fiber microscope to check the optical connectors when the laser source is active.
ESD: Electrostatic Discharge Sensitive Equipment
Test modules could be affected by electrostatic discharge. To minimize the risk of damage when replacing or handling test
modules, make sure to follow proper ESD procedures and dissipate any electrostatic charge from your body and tools and the
use proper grounding gear.
Perform all work at a workplace that is protected against electrostatic discharging.
Inserting, extracting, or handling test modules.
Never touch any exposed contacts, printed circuit boards or electronic components. - Connecting or disconnecting cables
from modules or platform.
Inserting or removing SFPs, XFPs, or CFPs from the platform.
Always store test modules in ESD protected packaging.
Safe Module Handling
While replacing test modules, all work on the open panel must be performed only by suitably qualified personnel who is familiar
with the dangers both to people and to the instrument itself.
Modules are not hot -swapable. The platform must be turned off and unplugged from VAC mains when removing or
inserting test modules.
For safety and EMC (Electromagnetic Compatibility), empty module slots must be properly covered with blank panel
covers.
Prevent foreign objects from entering the UX400, before, during and after module exchange or re-configuration process.
They could create short circuits or damage internal fans.
Always store test modules by themselves in individual ESD protected packaging (with no loose elements, like screws or
tools).
Page 12

Lithium-ion Battery Precautions
UX400 10G e-Manual D07-00-058P RevA00
Page 12 of 209
Lithium-ion (Li-ion) battery packs are compact and offer high capacity and autonomy, which make them ideal for demanding
applications, like providing long lasting power to portable test equipment. For safety reasons, due to their high energy
concentration, these batteries packs and products containing them must be used, charged, handled, and stored properly,
according to the manufacturer’s recommendations.
Li- ion battery packs contain individual Li-ion cells as well as battery monitoring and protection circuitry, sealed in its plastic
container that shall not be disassembled or serviced.
UX400 battery pack is also fitted with a safety connector to prevent accidental short circuits and reverse polarity.
Always charge the UX400 battery pack inside the UX400 battery bay using the UX400 AC/DC adapter supplied by VeEX.
Do not charge or use the battery pack if any mechanical damage is suspected (shock, impact, puncture, crack, etc).
Do not continue charging the battery if it does not recharge within the expected charging time
Storage: For long term storage, the battery pack should be stored at 20°C/68°F (room temperature), charged to about 30
to 50% of its capacity. Spare battery packs should be charged and used at least once a year to prevent over-discharge
(rotate them regularly).
It is recommended to charge and use battery packs at least every three months. Battery packs shall not go without
recharging (reconditioning) for more than six months.
After extended storage, battery packs may reach a deep discharge state or enter into sleep mode. For safety reasons, Liion batteries in deep discharge state may limit the initial charging current (pre-recharge) before starting their regular fast
charging cycle. The pre-charging state may take several hours.
Air transportation of Li -ion batteries is regulated by United Nations' International Air Transportation Association (IATA)
Dangerous Goods Regulations and by country-specific regulations. Please check local regulations and with common
carriers before shipping Li- ion battery packs or products containing relatively large Li-ion battery packs.
Electrical Connectors
Telephone lines may carry dangerous voltages. Always connect the electrical test ports to known test interfaces which carry low
level signals.
Go back to TOC
Page 13
4.0 Platform Overview
UX400 10G e-Manual D07-00-058P RevA00
Page 13 of 209
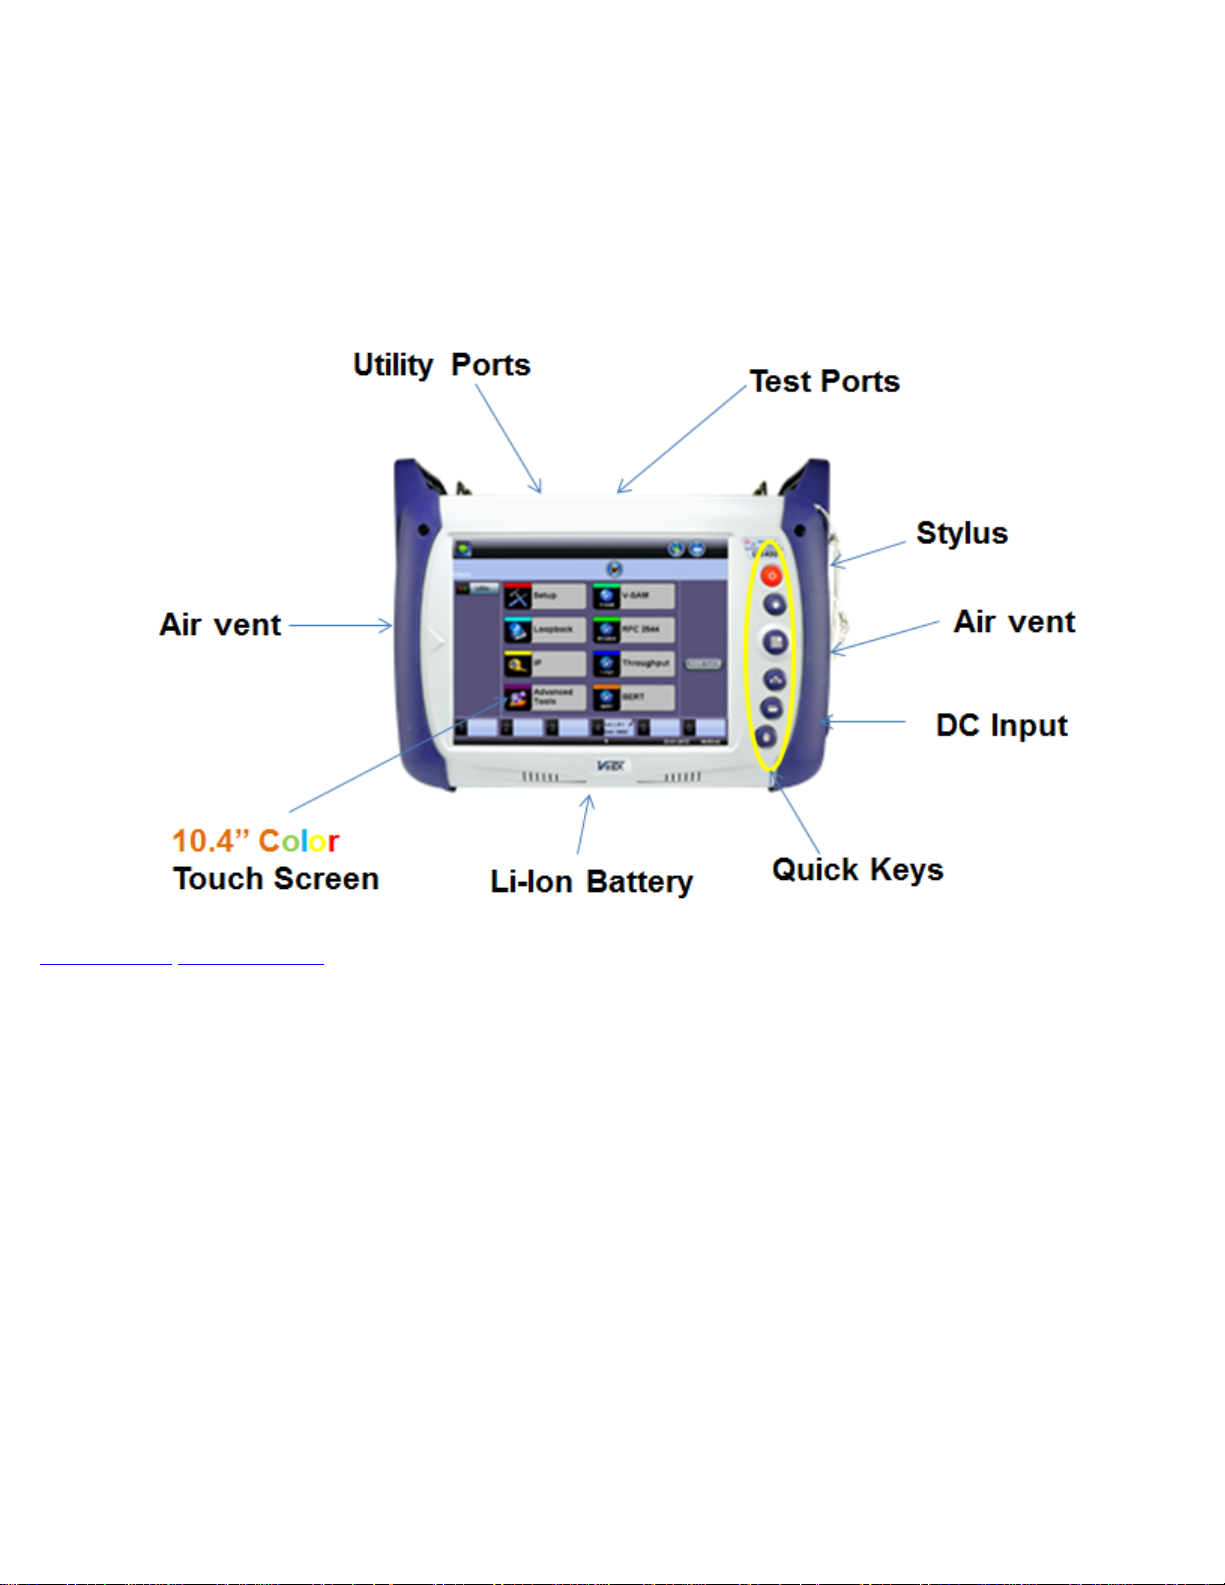
The unit is powered on and off from the red key on the keypad area. To power on the unit, hold the Power key down until a beep
is heard. In order to turn off the unit, press the Power key for at least 2 seconds. If the unit is not responding, holding the Power
key down for more than 10 seconds will force the unit to power down.
Note: No results or configurations are saved during the emergency shut down.
Go back to top Go back to TOC
4.1 Keypad
The keypad comprises the following keys:
Page 14
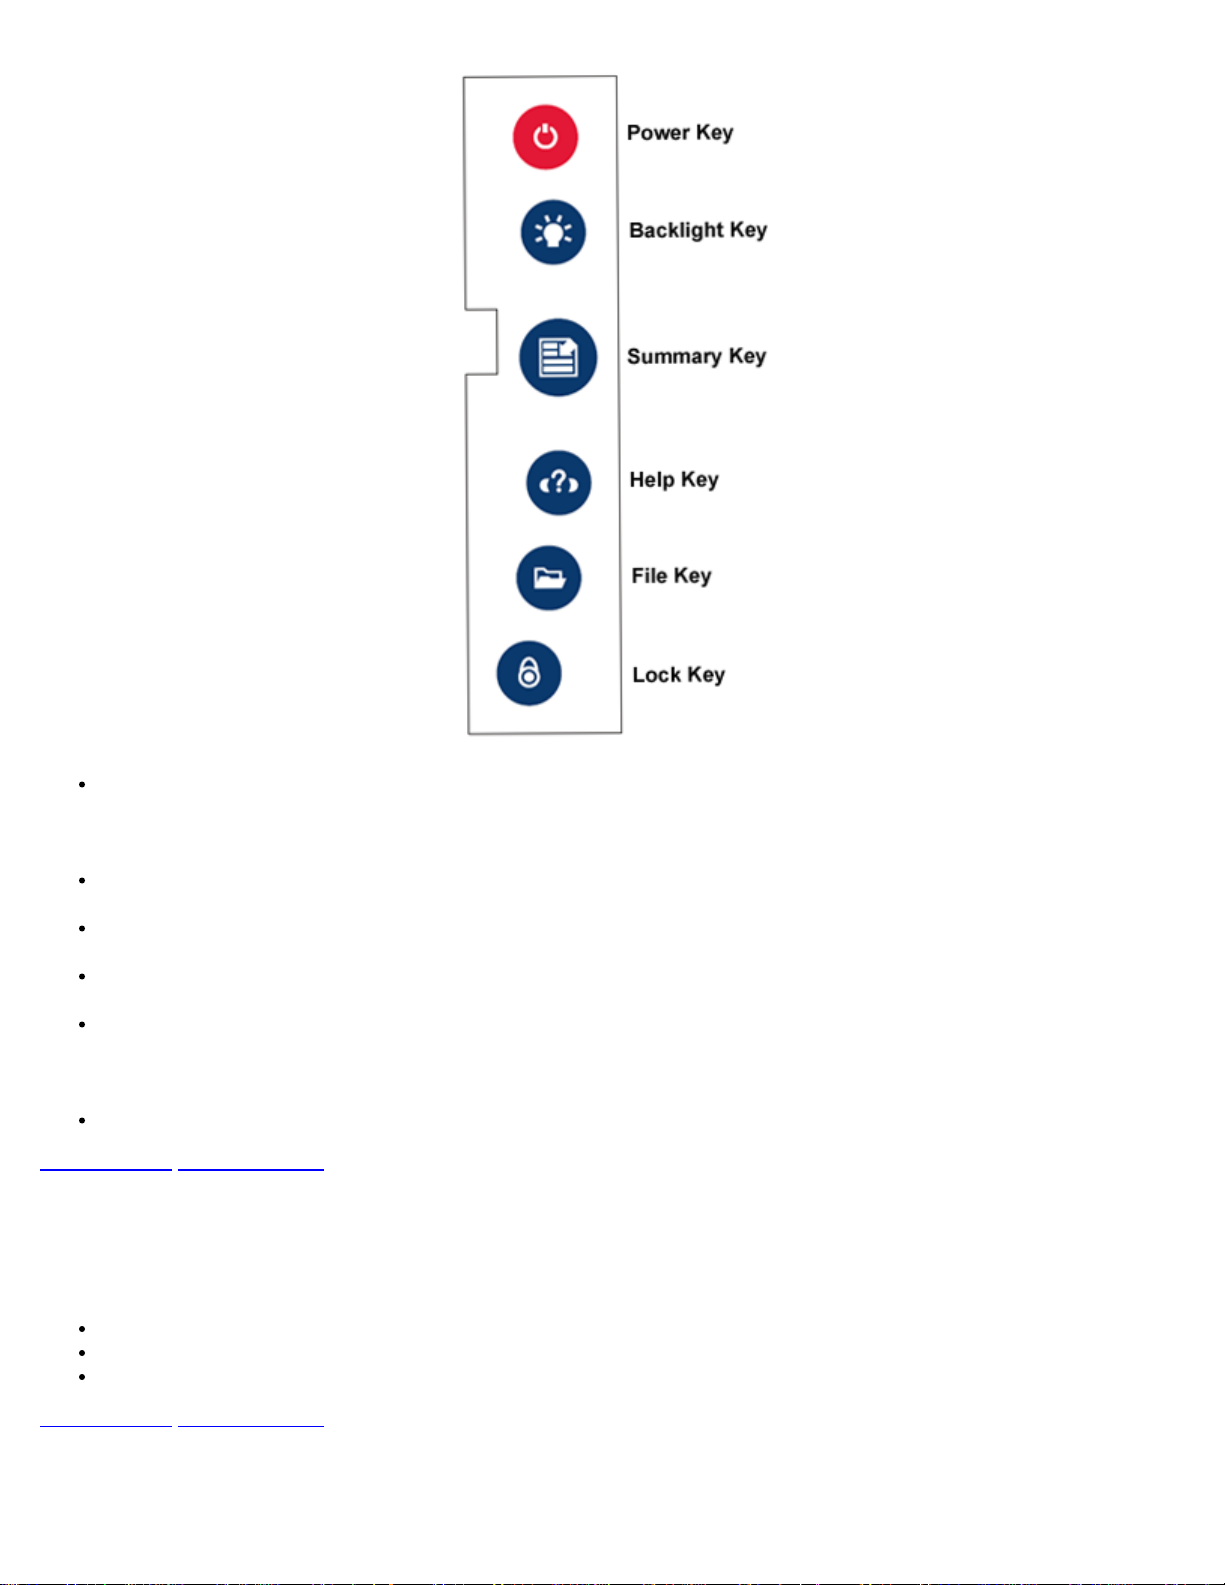
Power key: The unit is powered on and off from the red key on the keypad. The button is recessed to prevent accidental
UX400 10G e-Manual D07-00-058P RevA00
Page 14 of 209
power on. Press the key for 3-5 seconds to turn the unit on. To turn off the unit, press the Power key for at least 2
seconds. If the unit does not respond, holding the Power key down for more than 10 seconds will force the unit to switch
off.
Backlight key: Press the key to turn the backlight off and on. If the backlight is on a timer, the backlight will restart the
timer.
Summary key: Brings on a screen showing a summary of all interfaces/tests. When pressed a second time, it closes the
summary screen and returns to previous screen. This key does not interrupt operations or tests in progress.
Help key: Brings the user to online help, regardless of the current user interface location of the unit. When pressed a
second time, it closes the help screen. This key does not interrupt operations or tests in the progress.
File key: Saves test results in the unit's memory. If the measurement is still running, it will provide a snapshot the moment
the key is pressed. The Save function provides automatic storage with automatic naming and time stamping function. To
process a stored file, please go to 7.0 Files in the V300 Common Functions manual. Press the key again to cancel the
save operation.
Lock key: Can be configured to lock the keypad or capture the current screenshot.
Go back to top Go back to TOC
4.2 Touch Screen Display
The LCD supports touch screen operation. To operate the touch screen to navigate the menus and tabs, use the stylus located
on the right side of the unit. Please observe the following precautions:
Never use excessive pressure on the touch screen as this may damage its functionality.
Never use sharp objects such as a pen, screwdriver, etc., as this may damage the surface.
Clean the surface of the touch screen using a soft cloth and mild detergent only. Do not use alcohol.
Go back to top Go back to TOC
4.3 Battery
The UX400 chassis is equipped with an intelligent Li-ion rechargeable battery pack, which is located in the rear of the unit. The
Page 15

battery will be partially charged upon delivery, so it is recommended to fully charge the battery before use. Please charge the
battery at room temperature to preserve its life and to obtain maximum charge. The battery is charged during operation, provided
UX400 10G e-Manual D07-00-058P RevA00
Page 15 of 209
the unit is connected to the AC Mains using the supplied AC adaptor. Removing the battery while the unit is powered on is not
recommended - this may result in damage. Remove the rubber cover on the right side to connect the AC Main adaptor to the
unit.
Note: Make sure that the key is aligned while plugging in the AC adaptor to the unit. If it is not aligned, the plug will not connect
to the unit and using force will damage the connector.
Battery Charging time
The total charging time depends on the remaining battery capacity percentage and the actual current load in the UX400. An idle
UX400 (no test modules selected or tests running) would recharge faster than an active one.
Attention! For safety reasons, the battery charging time is always limited to a maximum of three hours.
- If the UX400 is being used while charging and a full charge (100% capacity) can not be achieved within three hours, the
charging will automatically stop.
- To resume charging, unplug the AC/DC adapter and let the UX400 work on battery power for a minute or two and plug the
AC/DC back in. This would reset the charging circuity.
Warning! DO NOT disconnect the AC/DC power supply when the UX400 is running under heavy load conditions (greater than
the battery's current ratings), such us certain multi-module multi-test applications.
- If the current required is too high, but still within the battery's limits, a warning message would be displayed, when the AC/DC
adapter is unplugged, while all the tests are properly closed and the UX400 shuts down.
- Under overload conditions, the battery may not be able to supply enough current to keep such test scenario running and its
safety mechanisms may shut the battery down without warning and test results may be lost.
Battery Safety precautions
Refer to section 3.0 Safety Information.
Go back to top Go back to TOC
4.3.1 Using the Built-in Battery Backup System
An internal battery pack option is available for the UX400 system to provide uninterrupted operation during short power outages
or as a time-saving convenience when moving the test set from one point to another, without having to cycle power. Under
certain conditions it can also provide hours of untethered testing autonomy (extended battery operation).
êUse caution when planning to rely on battery operation or backup power availability. Due to its flexibility and scalability, the
capacity of the UX400 system may exceed its battery rating. Independent of how many modules or module combinations are
loaded in the UX400, if the total power required by the active test modules exceeds 95W, the battery operation would be
disabled for safety reasons and to protect the battery pack. Use the tables below to calculate the maximum power consumption
for any desired test scenario.
Release any unused test modules before entering extended battery operation to assure that total power consumption is less than
95W. Use the power gauge information (battery icon) to get an estimate on the autonomy time, which based on the actual power
consumption. Make sure battery is fully charged.
If moving the UX400 from one place to another (e.g. between workstations, benches, racks or equipment rooms) release test
modules as their test cables are disconnected, to reduce the power consumption below 95W and assure a hitless transition.
Modules can then be quickly reactivated by assigning them to a test application and recalling its previous configuration (profile) as
test cables are reconnected. Time is saved by not having to reboot the test system.
Battery Power Capacity
Total Battery Power: 115 Watts
UX400 Platform: 20 Watts
Up to 95 Watts are available to any combination of active test modules (below).
Note: The sum of active test modules cannot exceed the 95W power budget available.
Test Modules’ maximum power requirements (active modules only)
UX400-100GE module: 58 Watts
Page 16
UX400-40G module: 32 Watts
UX400-10G module: 29 Watts
UX400 10G e-Manual D07-00-058P RevA00
Page 16 of 209
UX400-2.5G module: 20 Watts
UX400-1GE module: 15 Watts
Note: Test Modules become active when one of its test ports is assigned to a Test Application; otherwise they remain inactive
with little or no power consumption.
Total AC/DC Power: 250 Watts
220 Watts available to support any combination of active test modules
Actual power consumption (per module) may vary depending on configuration/settings and optic modules being used. Values
listed are maximum estimated ratings for the most demanding conditions.
Inactive modules (not assigned to a test application) do not consume power.
When working on battery-only mode, the UX400 notifies users when the maximum battery capacity has been reached or it is not
enough to support the new module user is trying to activate.
4.3.2 Battery Overdraw Protection
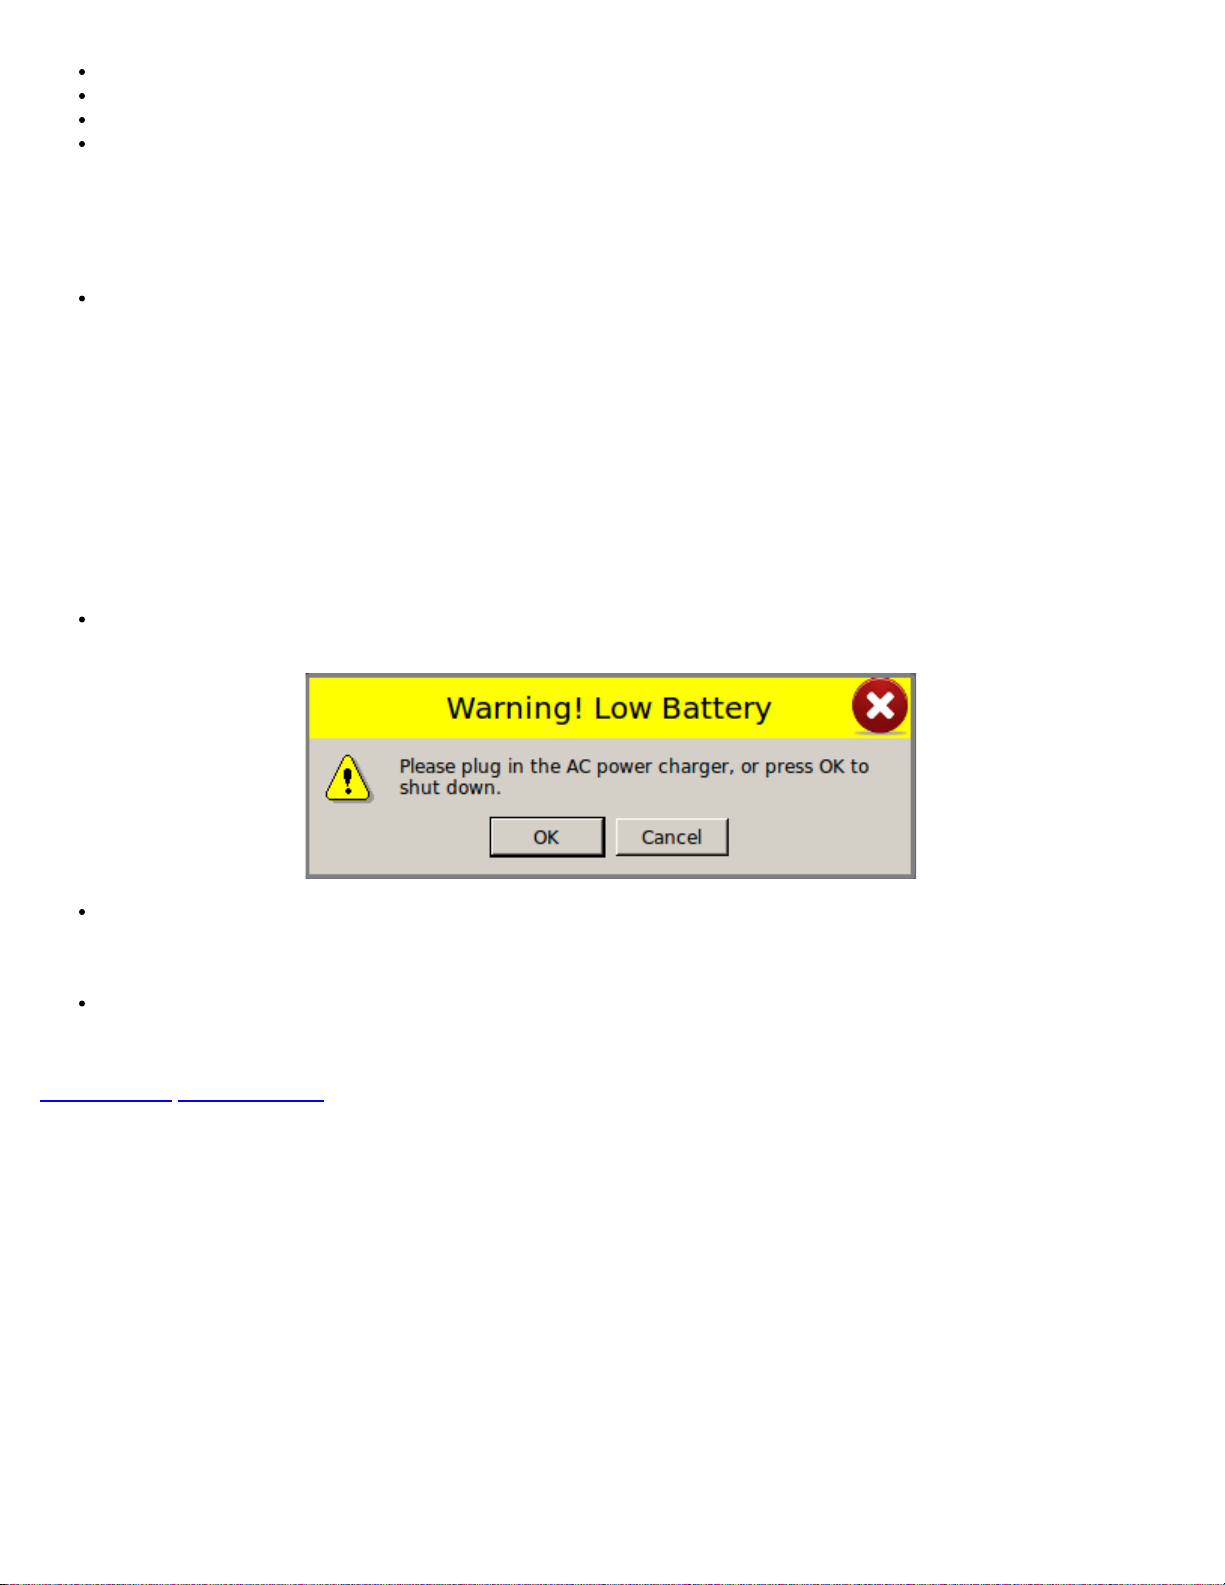
On battery power, when the capacity reaches 10%, the UX400 notifies users with a pop- up warning message and an
intermittent audible alarm.
If the previous message is ignored and the total capacity falls under 5% the UX400 immediately initiates the emergency
shutdown procedure for safety and to protect its battery from damage. Once in this mode all power to modules is
immediately cut and test files are not saved.
In the event that the load exceeds the 95W battery limit when the AC power is interrupted or AC/DC adapter is
unplugged, the UX400 would immediately initiate the emergency shutdown procedure to protect its battery from damage or
any other safety issues. Once in this mode all power to modules is immediately cut and test files are not saved.
Go back to top Go back to TOC
4.4 Connectors and Panels
4.4.1 Test Modules
1G Test Module:
Page 17
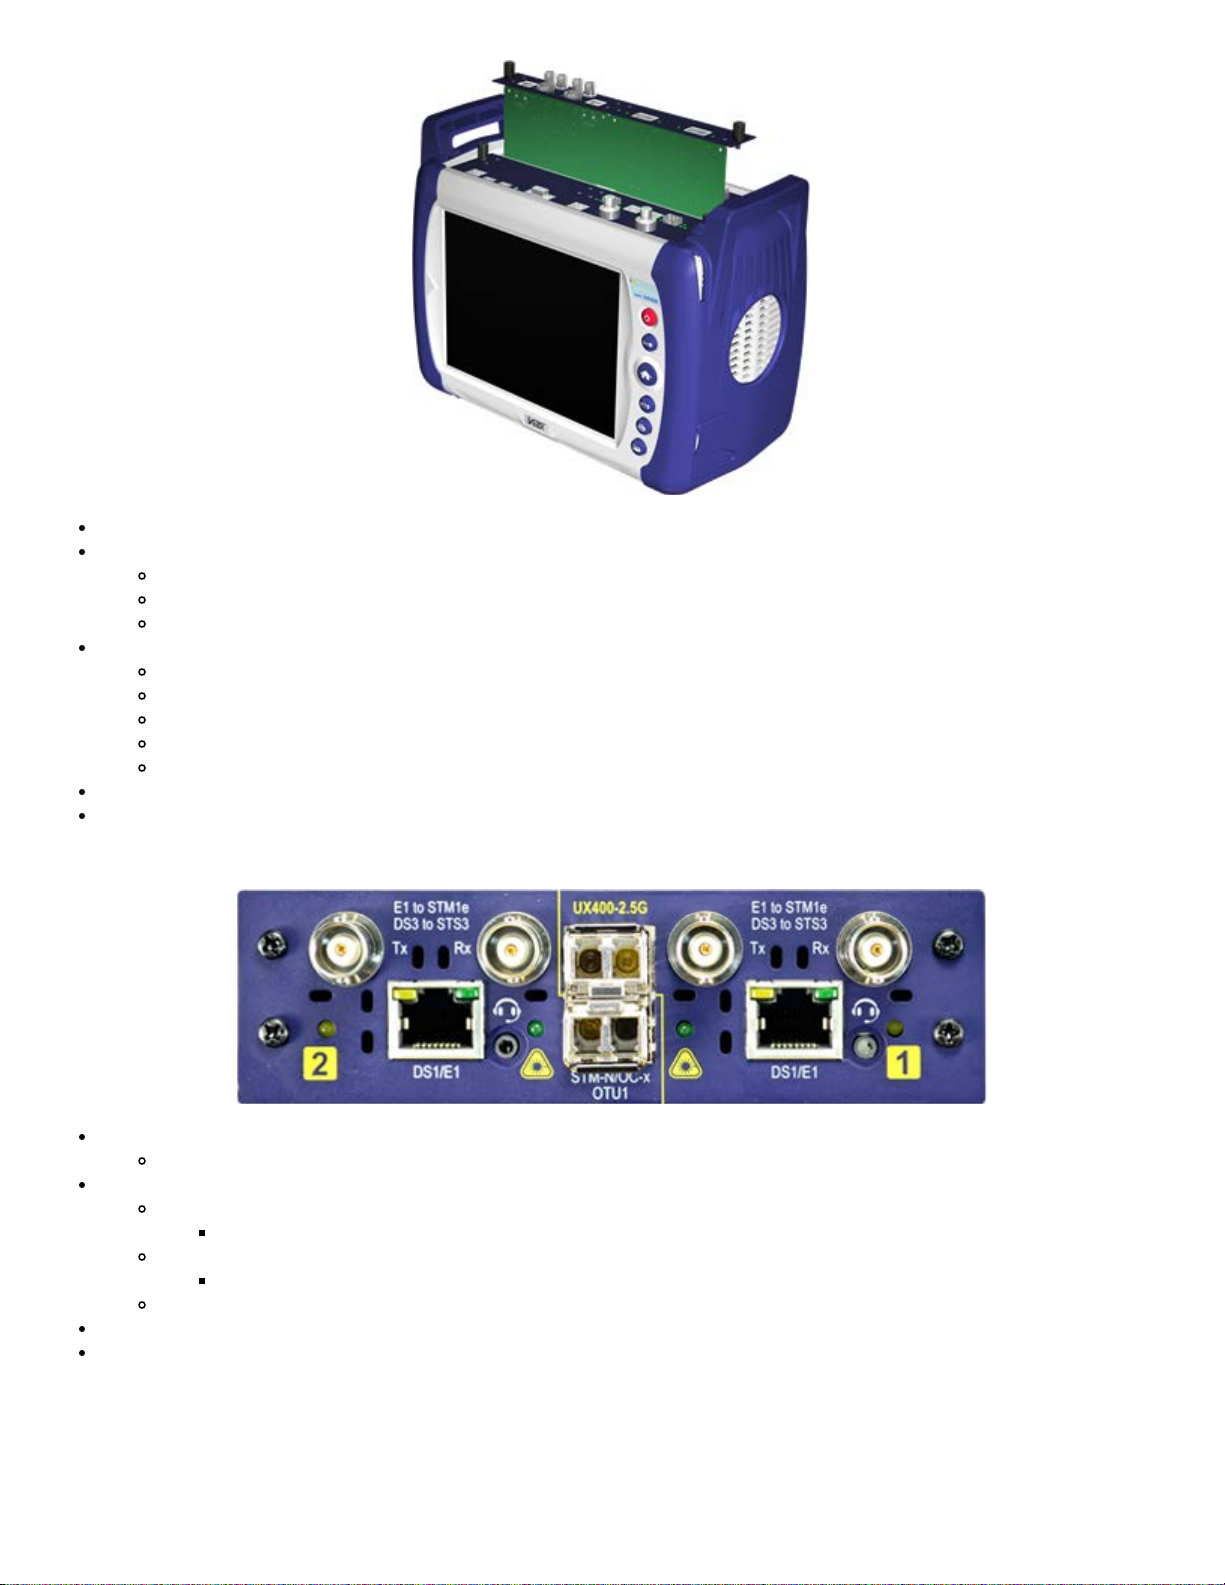
Single slot (up to 6 modules per UX400 > 12 ports)
UX400 10G e-Manual D07-00-058P RevA00
Page 17 of 209
Test Interfaces/Applications
10/100/1000Base-T
100Base-FX/1000Base-X
1/2/4G Fiber Channel
Test modes
Single and Dual Port
Bi-directional Passthrough monitoring
RFC2544, V-SAM per ITU-T Y.1564
Throughput with multiple streams, MPLS, VLAN tags
Loopback
External clock interface (input and output)
Audio headset for VoIP application
2.5G Test Module:
Dual 2.5 G ports
Single BERT, Dual BERT, Bi-directional line/payload through & monitor
Test rates supported
STM-0e/STM-0/STM-1/STM-1e/STM-4/STM-16:
VC-11,VC12,VC-3, VC-4, VC -4 -4c,VC-4 -16c
STS-1/OC-1/OC-3/OC-12/OC-48:
VT-1.5, VT-2, STS-1 SPE,STS-3c SPE, STS-12c SPE,STS-48c SPE
PDH/DSn:E1, E2, E3. DS1, DS3, E4
Audio headset for ISDN PRI and VF applications
Jitter wander to STM-1 rate
10G Test Module:
Page 18
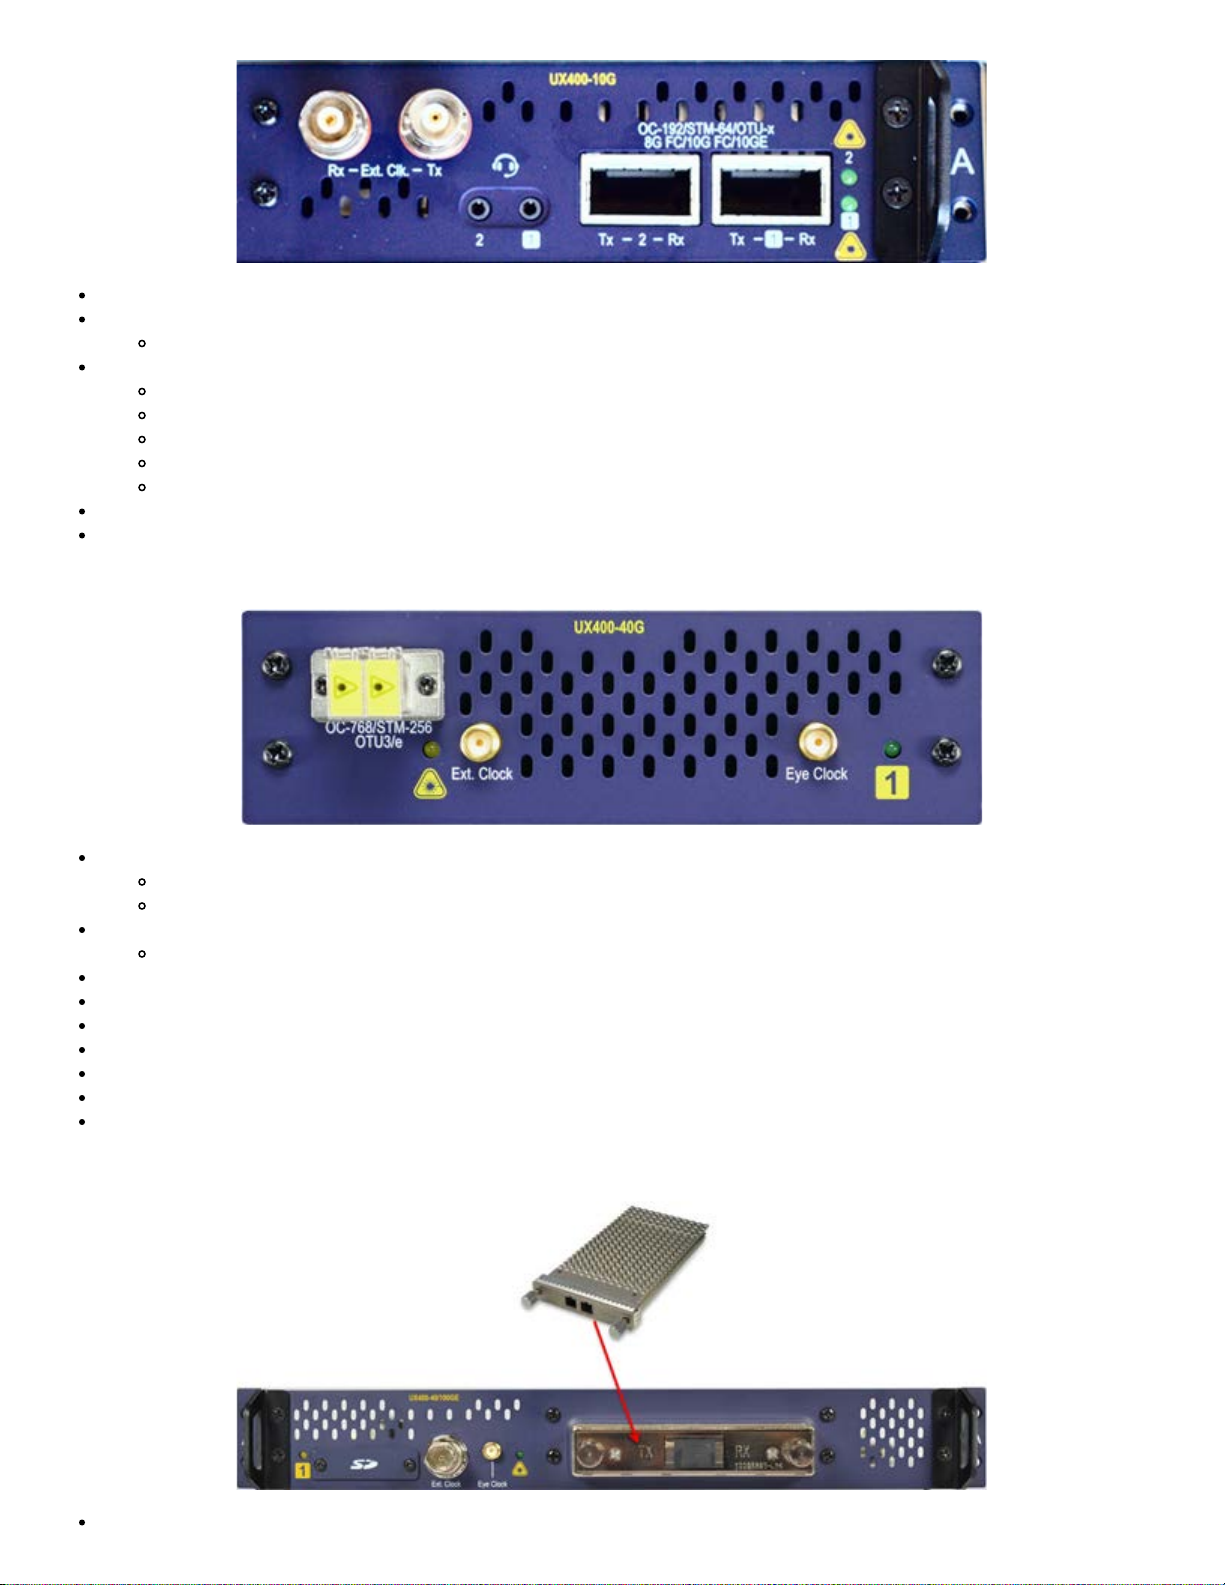
Single Slot (Up to 6 x 10G modules per UX400 i.e. 12 test ports)
UX400 10G e-Manual D07-00-058P RevA00
Page 18 of 209
Dual 10G ports
Dual Port, Single Port, Bi-directional line/payload through & monitor
Applications (same as TX300e)
STM-64: VC -4-64c down to VC12
OC-192: STS-192c SPE
10GE (LAN/WAN)
OTN: OTU2, OTU1e, OTU2e
8GFC, 10GFC
External clock RX and TX
Audio headset (VF)
40G Test Module:
SDH/SONET testing
Generation/evaluation of STM-256 signal according to ITU-T G.707
Generation/evaluation of OC-768 signal according to ANSI T1.105
SDH Mapping
VC-4-256c, VC-4-64c, VC-4-16c, VC-4-4c, VC-4, to VT1.5/VT2.0
PDH Analysis internal E3/E1 analysis
Full ITU-T performance monitoring, APS testing
Test pattern and Alarm generation, Error Insertion
Overhead display, decode and generation
Trace identifier
Pointer Analysis
Tandem analysis
40/100G Test Module:
CFP Modules & Interfaces
Page 19

40GE (40GBase-LR4)
100GE (100GBase-LR4)
UX400 10G e-Manual D07-00-058P RevA00
Page 19 of 209
External clock input (BNC)
Eye clock output (SMA)
SD card
40GE LR4 CFP Module
2 SMF: 1 fiber in each direction with 4x10G wavelengths
100GE LR4 CFP Module
2 SMF: 1 fiber in each direction with 4x25G wavelengths
Go back to top Go back to TOC
4.4.2 RJ- 45 Interface
Balanced, Tx and Rx electrical interfaces for T1 and E1 signals. The port is 120 ohm for E1 signals and 100 ohm for T1 signals.
Go back to top Go back to TOC
4.4.3 Bantam Interface
Balanced, Tx and Rx interfaces for DS1 and E1 signals.
Go back to top Go back to TOC
4.4.4 BNC Interface
Unbalanced, 75 ohm Tx and Rx interfaces for DS3 and E1, E2, E3, E4 and STM-0/STS -1 (51M), STS-3/STM-1E.
Go back to top Go back to TOC
4.4.5 XFP/SFP Transceiver Interface
Optical Transceivers (Tx/Rx) conforming to Multi Source Agreement (MSA) recommendations are supported. Various SFPs are
available for different wavelengths and dynamic range requirements. Check the ordering options for more details. The standard
optical connector type used on SFP transceivers is LC. Please use appropriate low reflectance patchcords (Ultra Physical Contact
[UPC]) and note the damage level associated with each Transceiver. Customers opting to use or provide their own SFPs should
ensure that the transceivers are multi-rate and that digital diagnostics are supported – this enables the optical power and other
measurements when in SDH optical test mode. Furthermore, only SFPs with low jitter and good optical extinction ratio should be
used. To comply with ROHS and other local government requirements, only compliant SFP transceivers should be used.
Go back to top Go back to TOC
4.4.6 SMA Interface
Unbalanced, NRZ electrical clock input
For DS1/T1: 1.544Mbps or 1.544 MHz
For E1: 2.048Mbps or 2.048MHz
Go back to top Go back to TOC
4.4.7 Utility Ports
The Ethernet and USB ports are located on the top of the unit.
RJ45, 10/100/1000Base - T Port
Ethernet applications include:
IP connectivity testing
Net Wiz testing
Transfer measurement results and test profiles between the instrument and a computer using ReVeal UX400 software
Page 20
Upload/download configurable tables between the instrument and a computer using ReVeal UX400 software
Upgrade the instrument software using ReVeal UX400 software
UX400 10G e-Manual D07-00-058P RevA00
Page 20 of 209
Remote control of the instrument using ReVeal UX400 software (optional)
USB Port
The USB port supports:
Memory drives
WiFi adaptor for connectivity and WiFi testing application
Go back to top Go back to TOC
4.5 LEDs
Fixed (Power) LED: A single LED indicates the power state of the unit.
The LED is off when the unit is powered off
The LED is green when the unit is powered on
The LED is orange when the unit is connected to the AC Mains and powered off
Soft LEDs:
for details.
Go back to top Go back to TOC
Each tests module offers detailed soft LEDs and indicators in its test application. Refer to individual modules manuals
4.6 Software Upgrade
There are two methods of updating the test set software: via USB port or ReVeal UX400 software.
Downloading UX400 Software from the VeEX website
Enter Username and Password under Customers Login.
Click on the Customers tab at the top of the screen after successfully logging in.
Click on Software, located in the Functions toolbar on the left side of the screen.
Search for and download the latest UX400 software onto the PC.
Installing New UX400 Software via USB
Unzip the original/downloaded upgrade package file.
Search for a compressed file with the phrase veex-arm.tar.gz, (e.g., "UX400-veex- arm.tar.gz") and copy it onto a USB
stick formatted in the FAT32 file format.
Note: Make sure the new software image is the only file on the USB stick.
Verify that the UX400 unit is powered off and that the DC adaptor connected to the unit is charging the battery. Insert the
USB stick on the top left side of the unit.
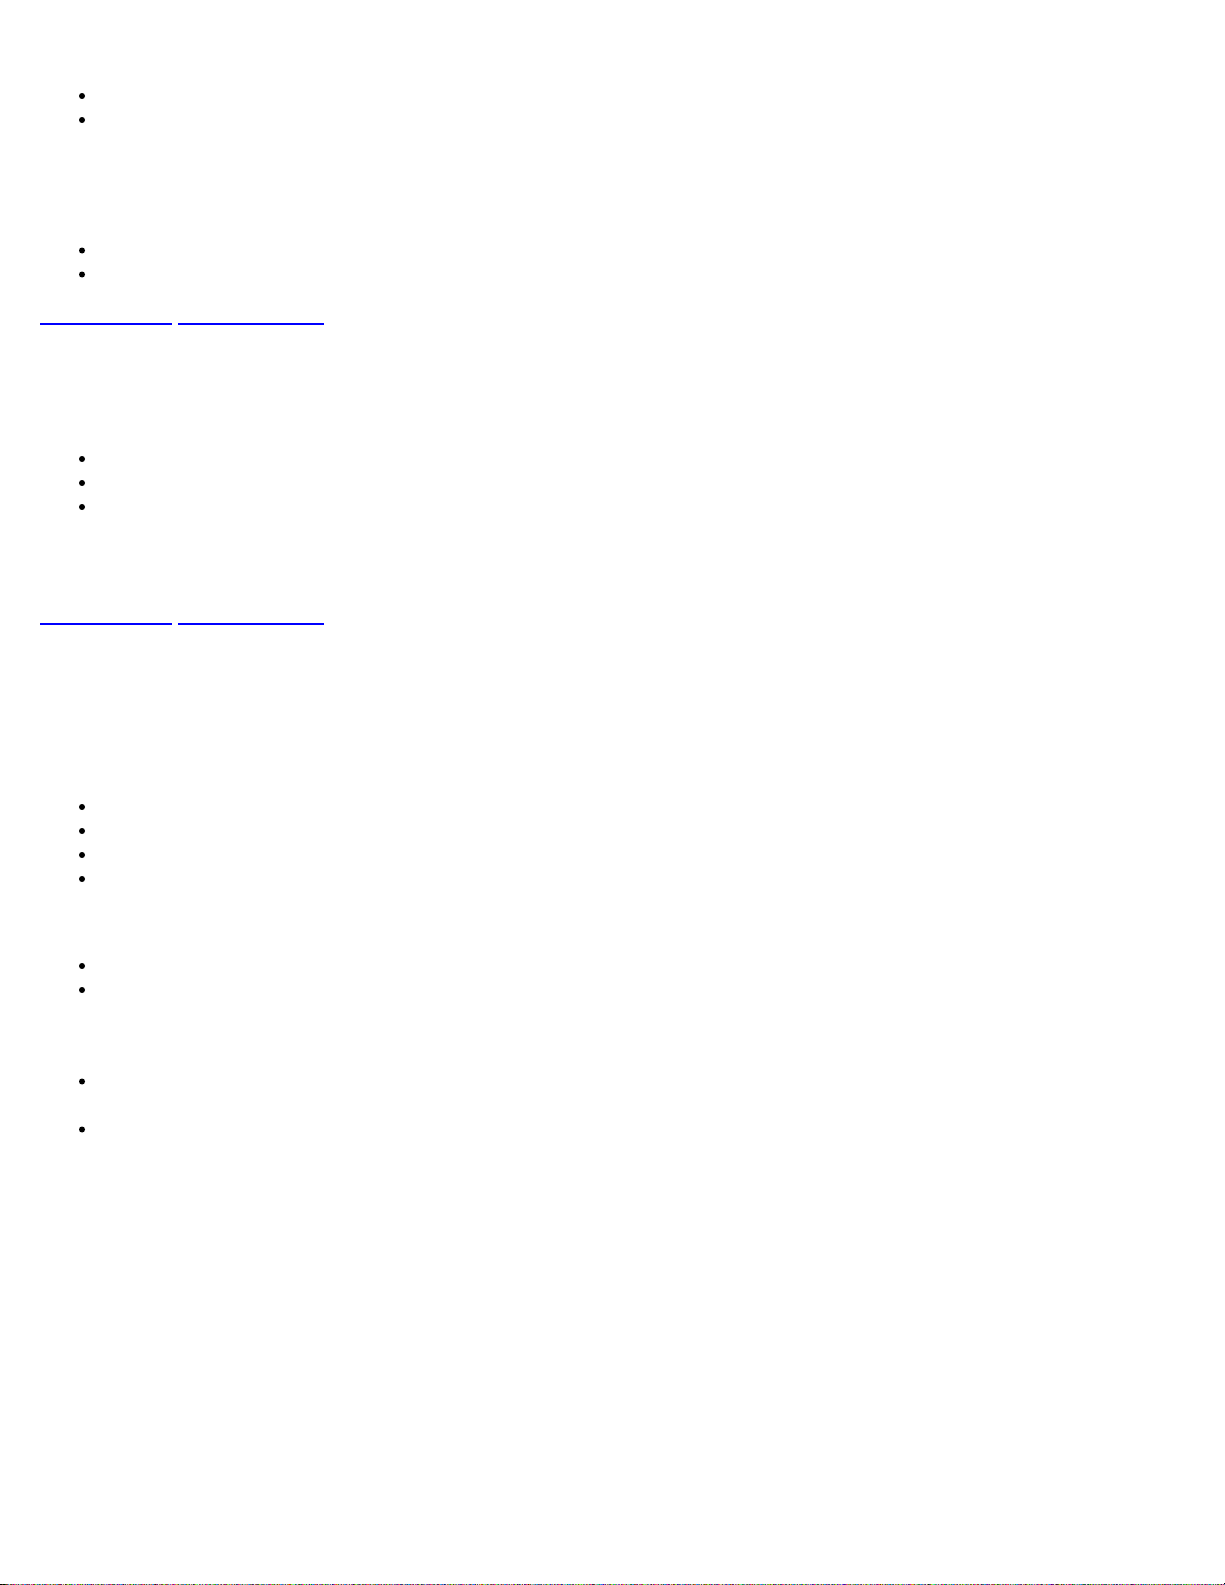
Press and hold the Power and the Backlight keys simultaneously.
Page 21
Release the Power key when the unit starts to boot up.
UX400 10G e-Manual D07-00-058P RevA00
Page 21 of 209
Keep the Backlight key pressed down until one beep is heard.
The unit should now show all the new software packages on the USB. Select the ones that apply.
A message will appear on screen stating the upgrade is in progress. Installing the software will take a few minutes.
Note: Do not remove the USB memory stick until upgrade is complete. Doing so will interrupt the software upgrade and corrupt
the upgrade progress.
Go back to top Go back to TOC
Page 22
5.0 Basic Set up and Common Tasks
UX400 10G e-Manual D07-00-058P RevA00
Page 22 of 209
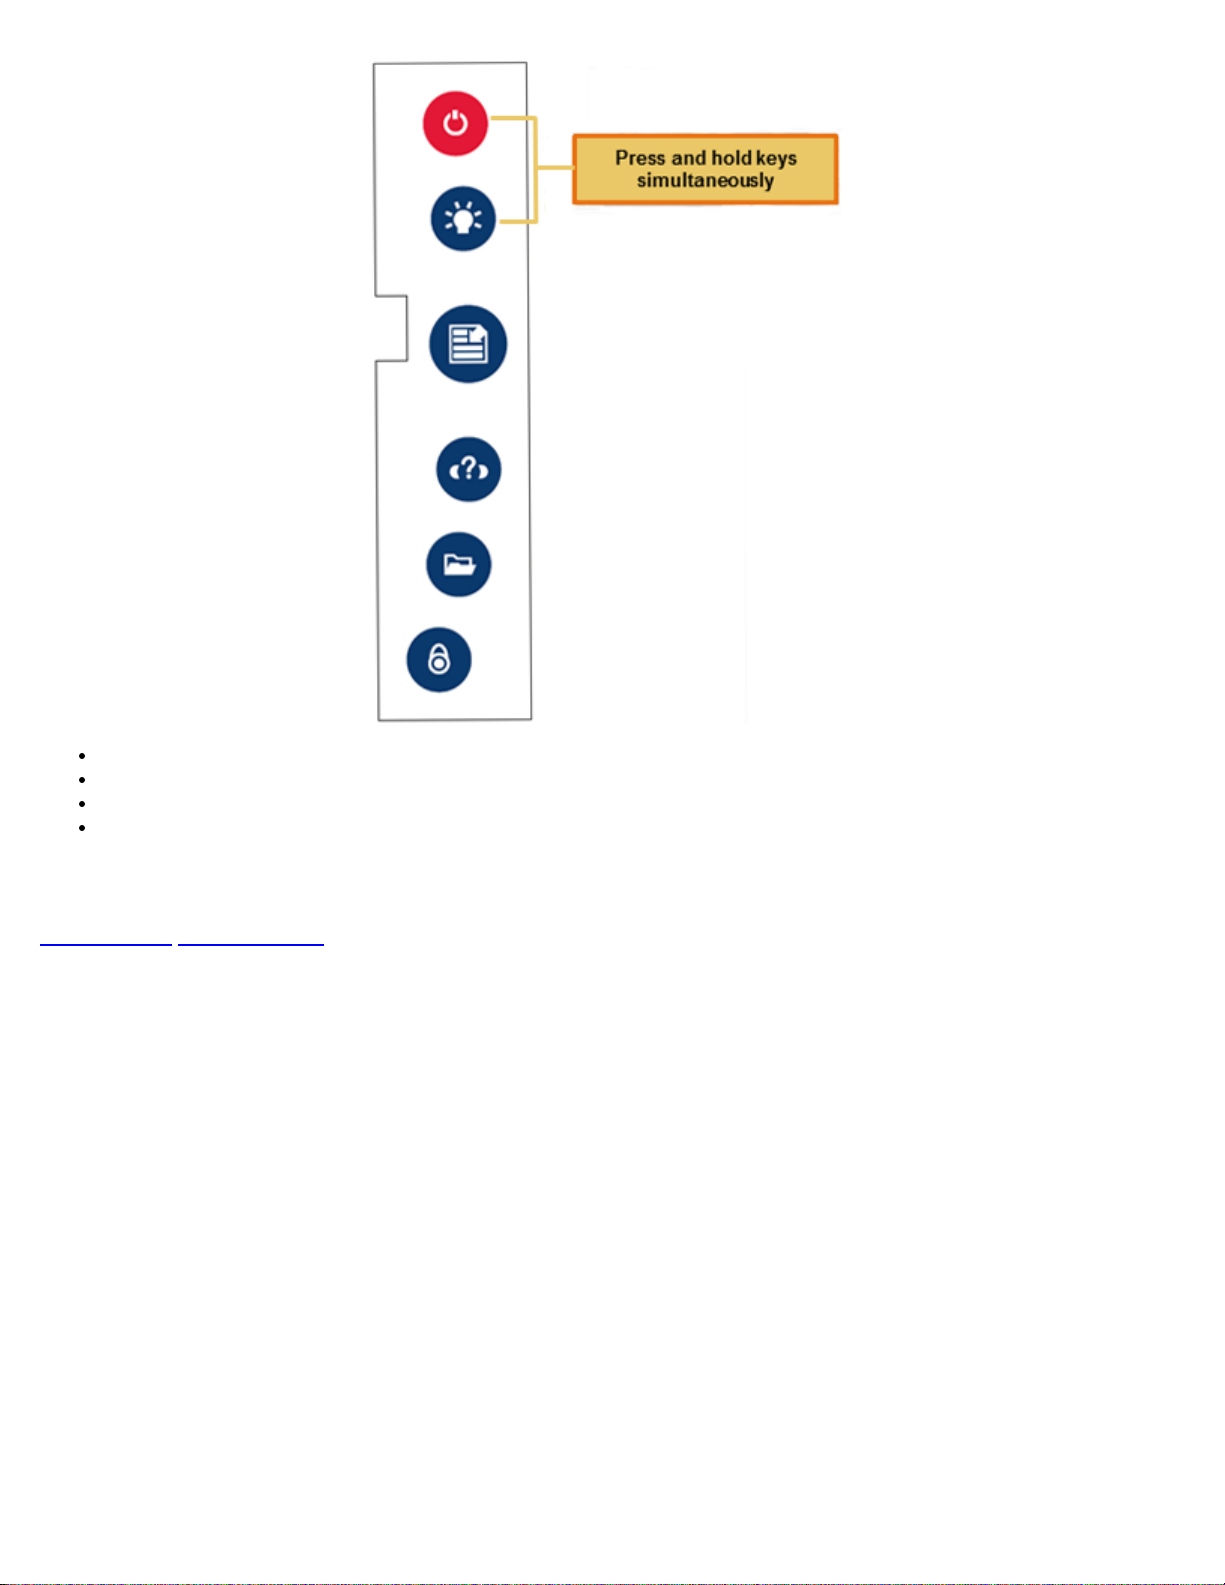
When the UX400 unit is powered on, its system boots up and the first screen displayed shows an image of all the modules installed in the unit. Up to six tests can be
assigned at any given time to be run on the unit.
Main Modules Screen
Go back to top Go back to TOC
5.1 Home Screen Tabs
- On the top left hand side of the screen; to enter the system settings and tools screen
- Go back to the screen displaying the installed test modules
- Go to the home screen of a Test Application assigned to one of the tabs on the bottom of the screen
- Displays the power status of the unit - on AC Power, battery status
- Save to files
Go back to top Go back to TOC
5.2 Common Tasks
5.2.1 Assigning Test Modules
UX400 can simultaneously run up to six tests. There are six test tabs on the bottom of the unit's screen. A different test module can be assigned to each of these tabs.
Test Tabs
1. Click on a free test tab.
An arrow in the top right corner of the tab indicates the selected tab.
2. Select a test module from those displayed on the screen.
All the test technology options available through that module will be displayed.
Test Module Selection
Page 23
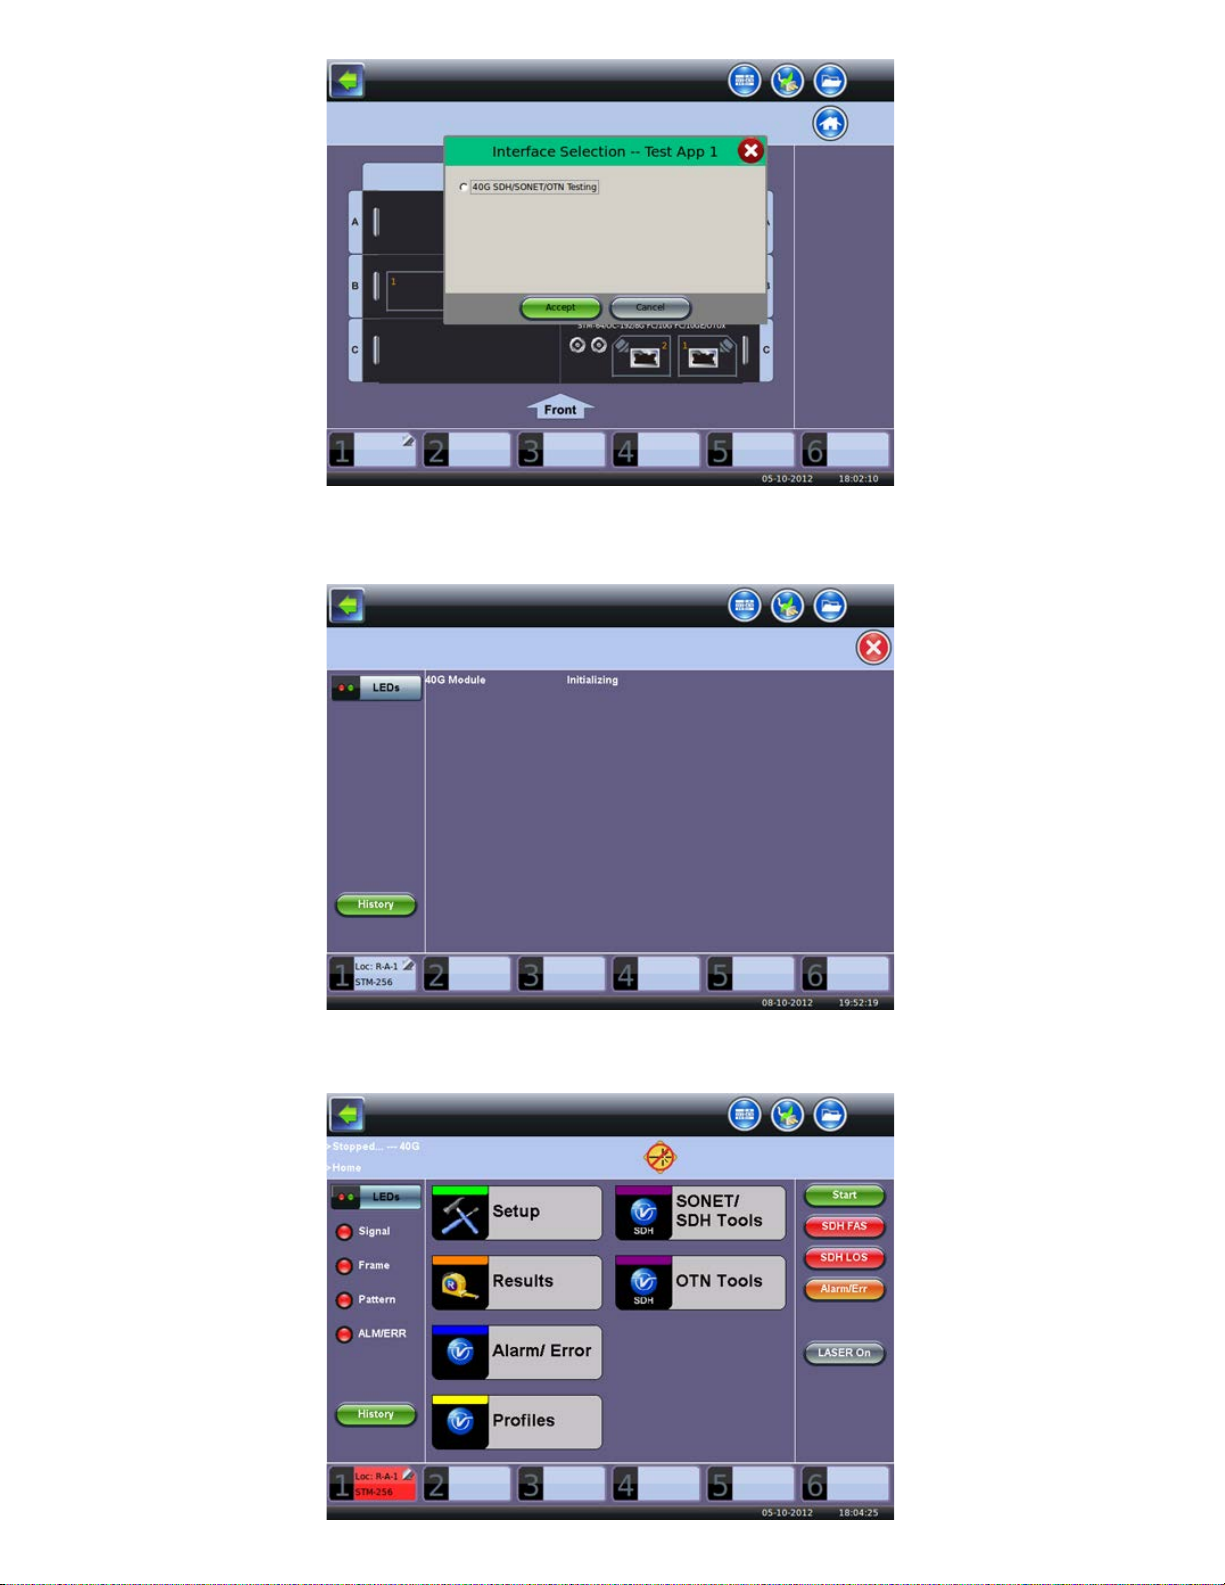
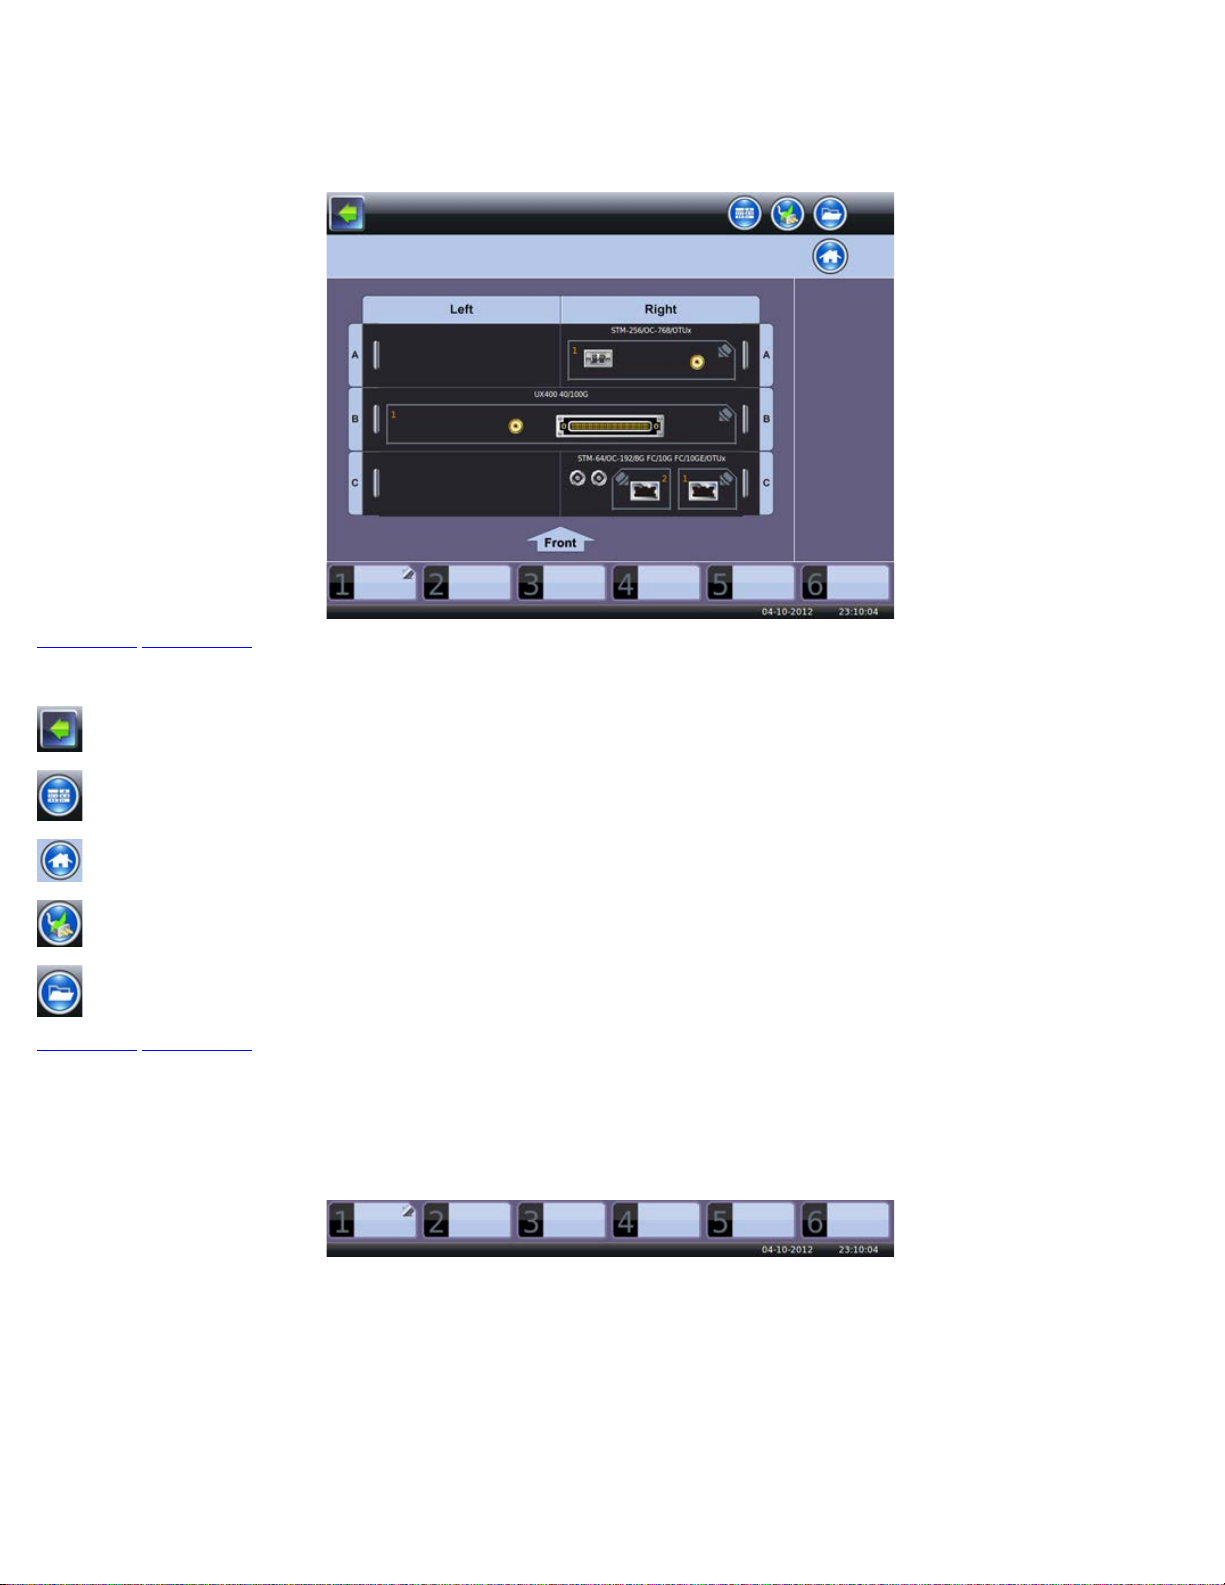
3. Select the technology option best suited for the test you wish to run and then click Accept.
UX400 10G e-Manual D07-00-058P RevA00
Page 23 of 209
The screen will show the progress as the unit is configured for the selected test module.
Test Module Application Loading
When the configuration is complete, the home screen of that test module will be displayed on the screen. The user will be ready to set up the parameters for different tests
possible for that module.
Test Module Application Home Screen (40G)
Page 24
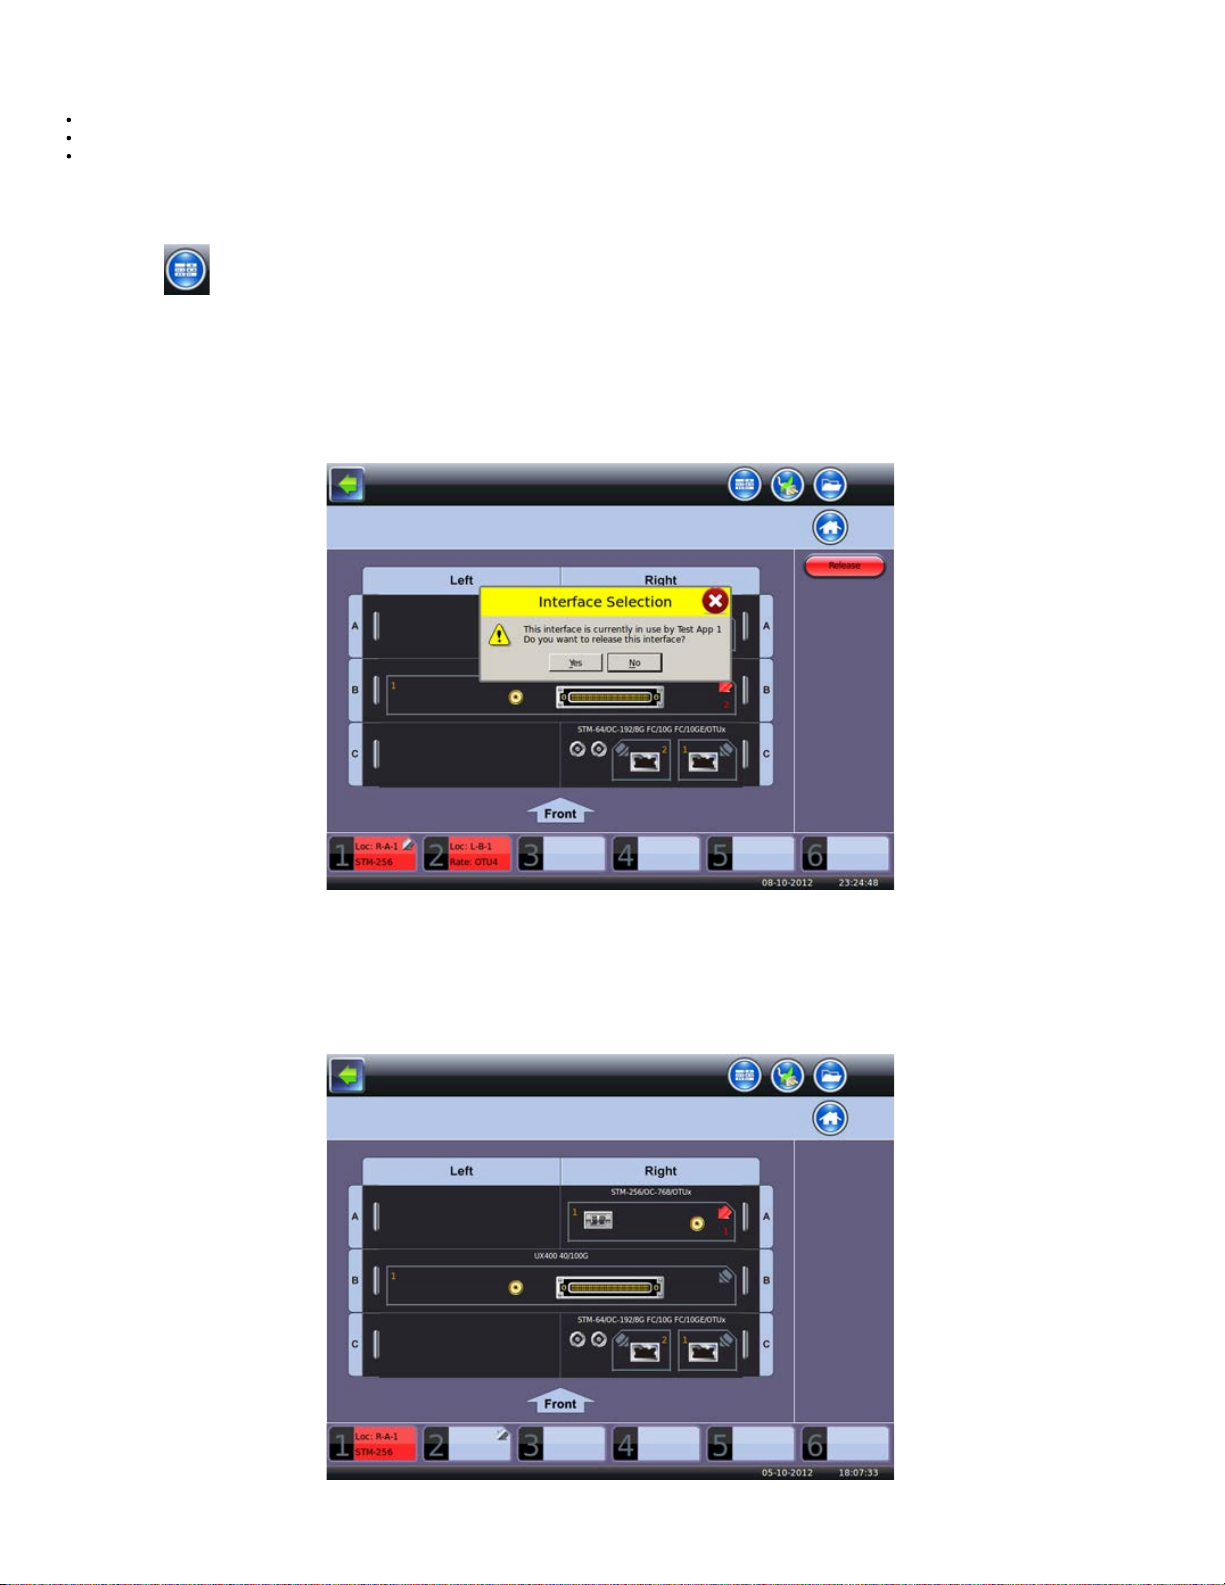
The test tab to which the application was assigned will change color and the details of the test module's location on the unit and the technology selected will be displayed
in the tab. The test tab color indicates the status of the respective test:
Select Module and Technology
UX400 10G e-Manual D07-00-058P RevA00
Page 24 of 209
Red: Indicates that at least one alarm/error has occurred during the test
Yellow: History - Use the History button on the left side of the screen to acknowledge the status and reset the history indication.
Green: Indicates no condition or a test that has not begun yet
To return to main modules screen:
Either click an unassigned tab on the bottom of the screen;
Or click the
To free up an already assigned tab:
1. Click on the tab that needs to be made free.
2. Return to the main modules screen.
3. Click on the "Release" button on the right side of the module location illustration. A pop-up window will ask for confirmation of the action.
button on the top panel of the screen.
Releasing a Test Tab
4. Click "Yes" to confirm and release the tab. The tab is now free to be assigned for another test application.
To assign more test applications:
1. Return to the main modules screen. Make sure an empty tab is selected.
Note: Look for the arrow in the right corner of the tab to ensure that the correct tab is selected.
Select Another Test Tab
2. Follow the same steps as when assigning the first test tab to a test application.
Page 25
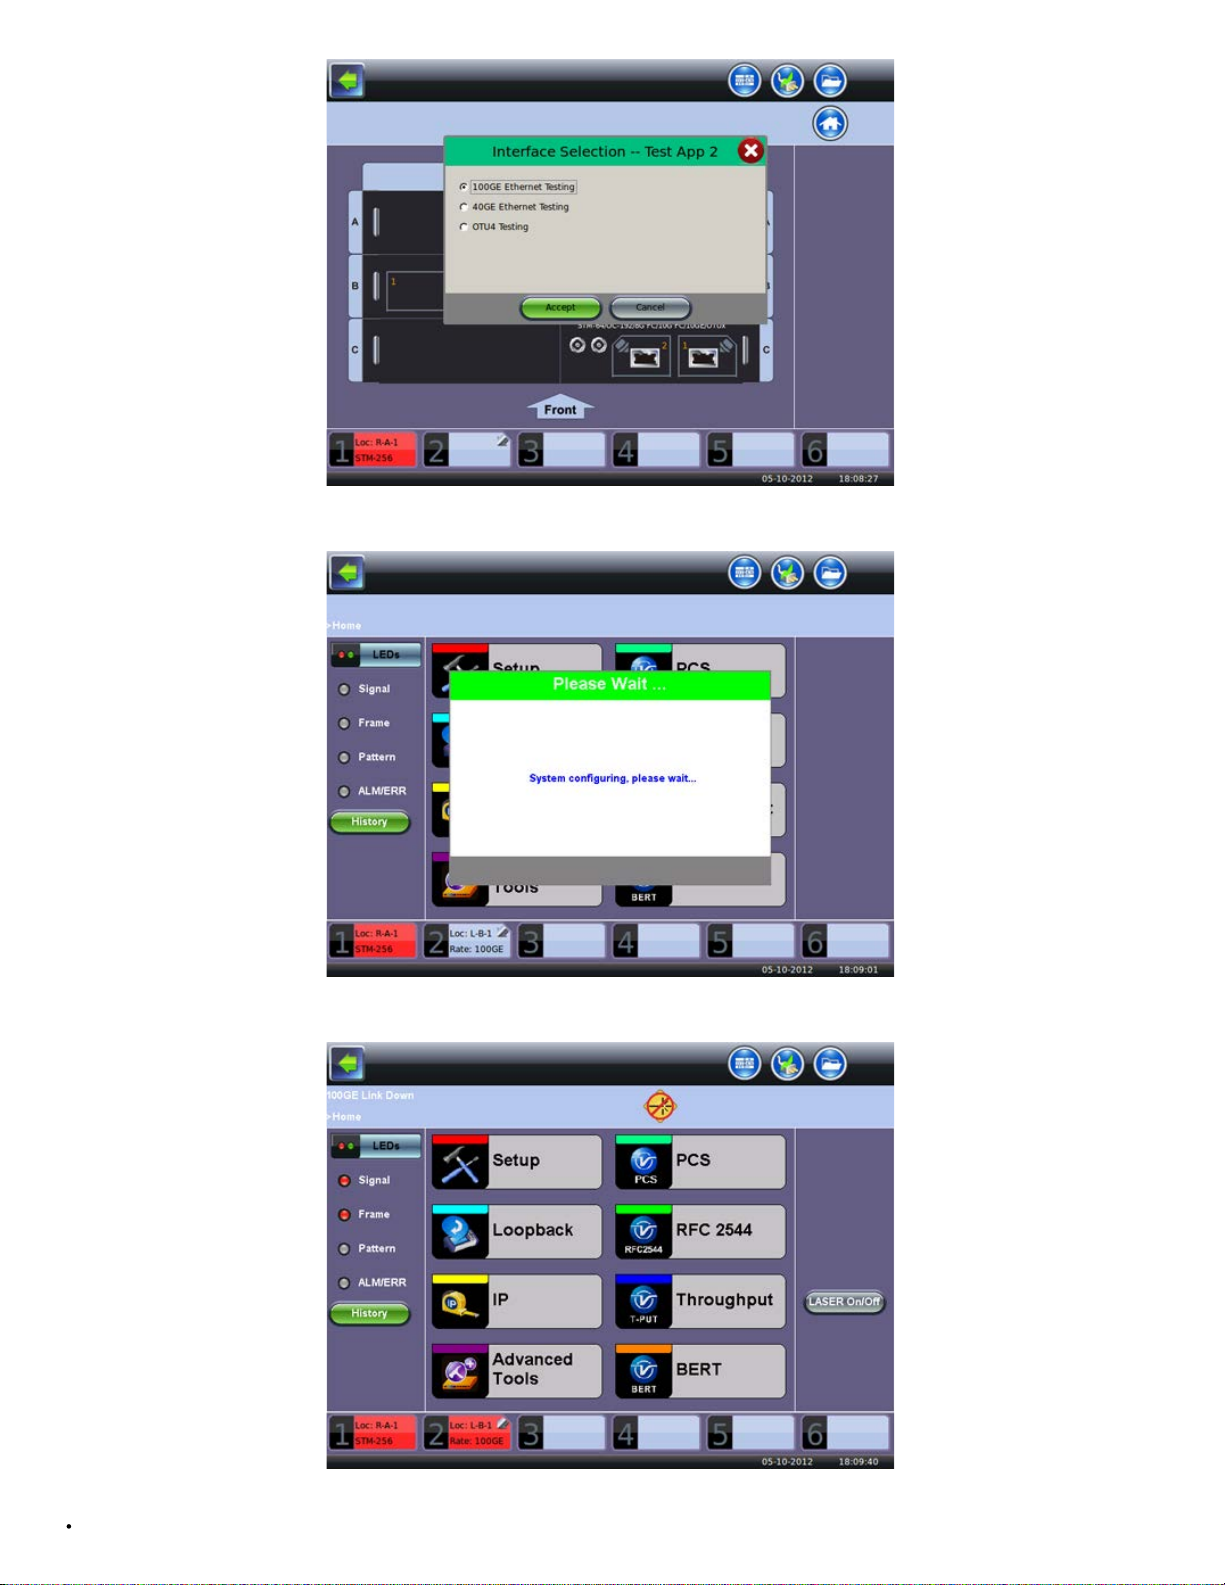
Test Module
UX400 10G e-Manual D07-00-058P RevA00
Page 25 of 209
System Configuring
Application Home Screen (100GE)
Note:
Depending on the type of test module (single or dual port) one or two test tabs can be assigned to a test module.
Page 26
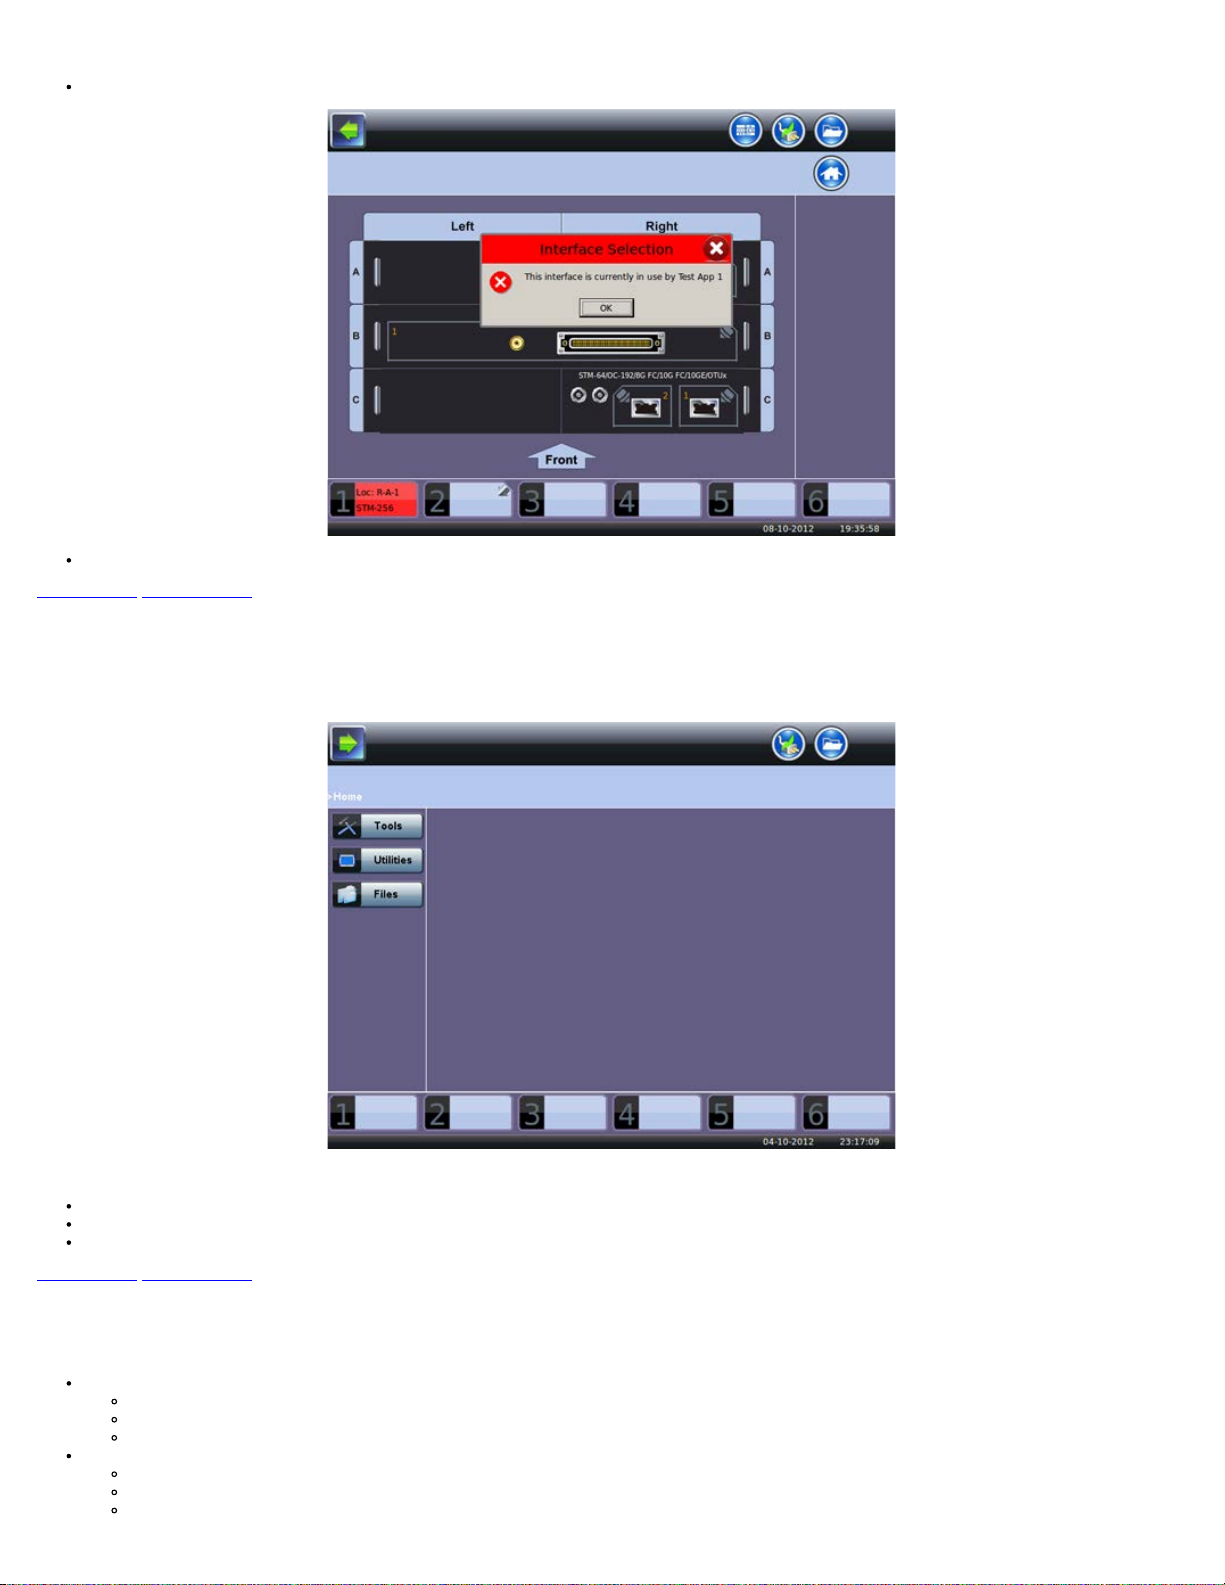
Dual port test modules usually allow two fully independent tests (e.g. one 10GE test in port 1 and another SONET/SDH test on port 2) or dual port applications.
Test ports are identified by their position nomenclature. For example, L - C-2 identifies the port 2 of the test module located on the left column and C row.
UX400 10G e-Manual D07-00-058P RevA00
Page 26 of 209
To switch between different module application screens, click on the respective test tab on the bottom of the screen.
Go back to top Go back to TOC
5.3 Platform Settings
Test ports and network settings are required prior to performing any measurements or applications.
The platform settings screen can be entered by clicking the arrow button on the top left corner of the main screen.
The following options are available:
Tools
Utilities
Files
Go back to top Go back to TOC
5.3.1 Tools
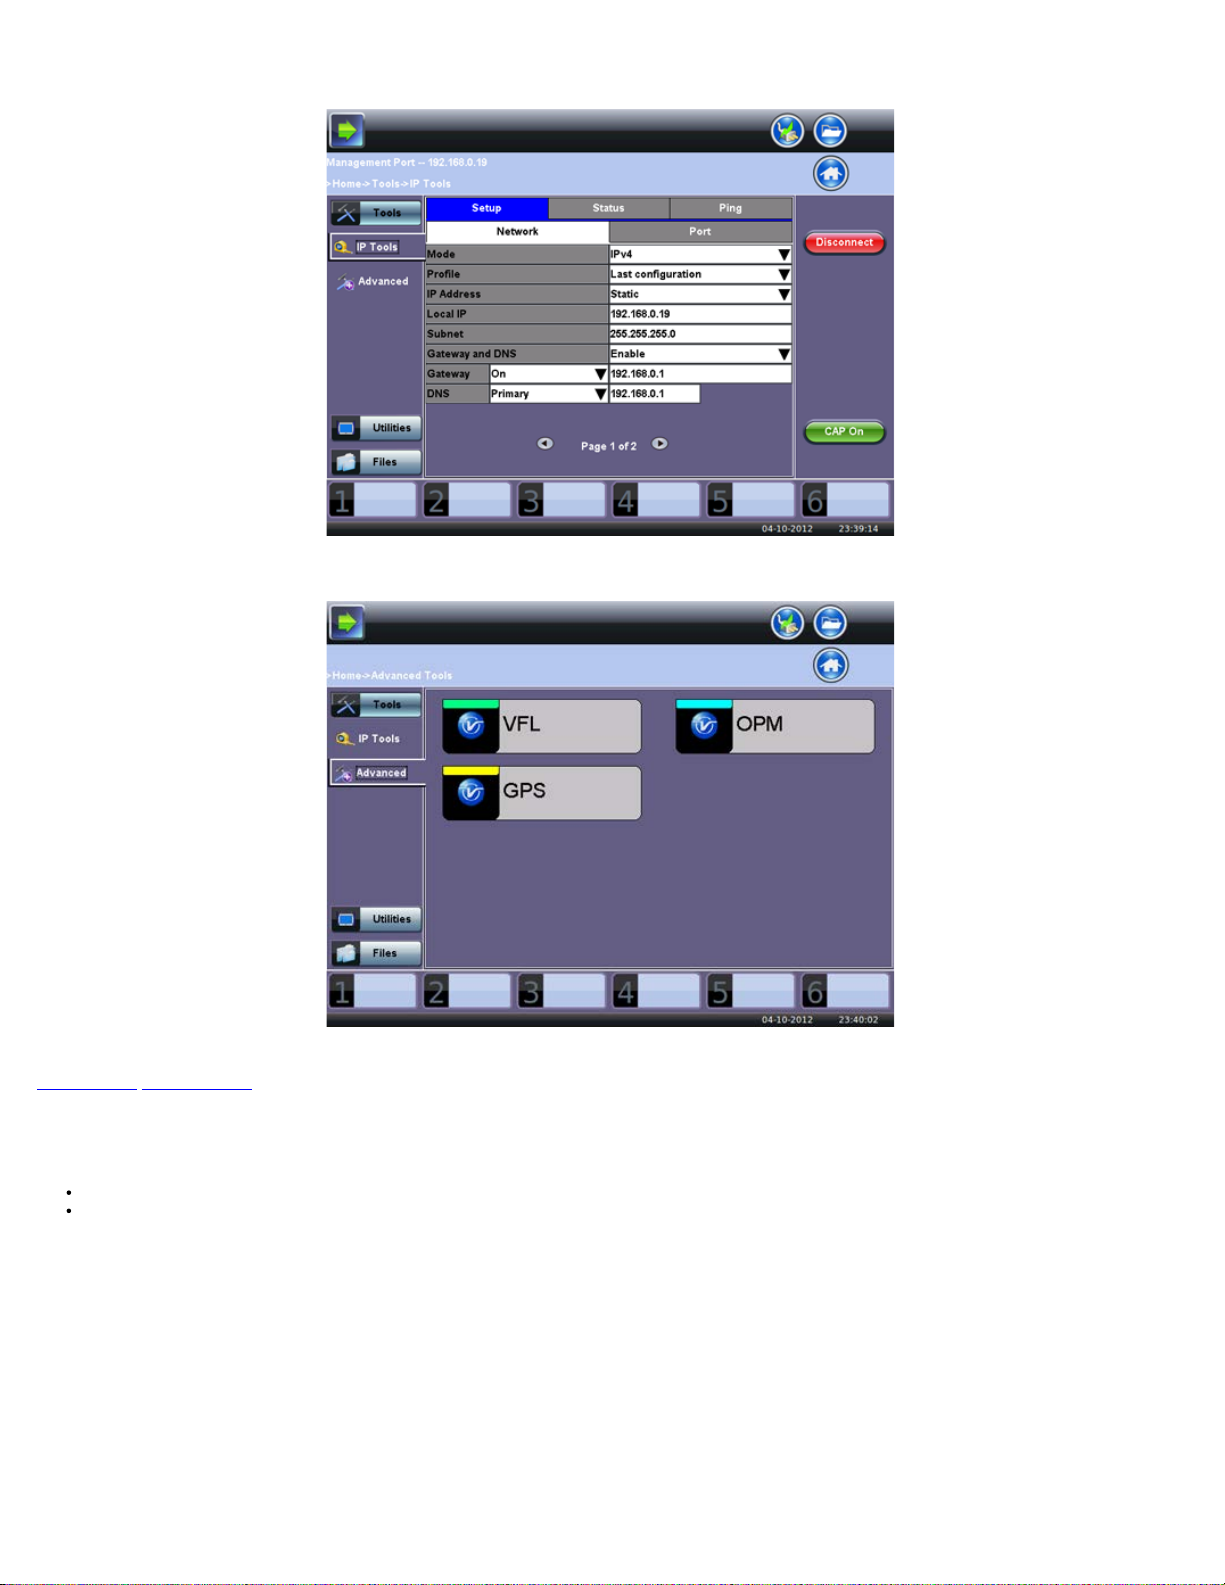
Tap the Tools button to enter the Tools screen. The following can be configured or viewed under the tools tab:
IP Tools:
Setup: Network, Port
Status
Ping: Setup, Result
Advanced:
VFL
OPM
GPS
Page 27
UX400 10G e-Manual D07-00-058P RevA00
Page 27 of 209
IP Tools Setup
Advanced Tools
The Home menu can be accessed at anytime during operation by pressing the Home key.
Go back to top Go back to TOC
5.3.2 Utilities
The Utilities tab on the settings home screen offers the following options:
Settings
Backlight
Utilities Menu
Page 28
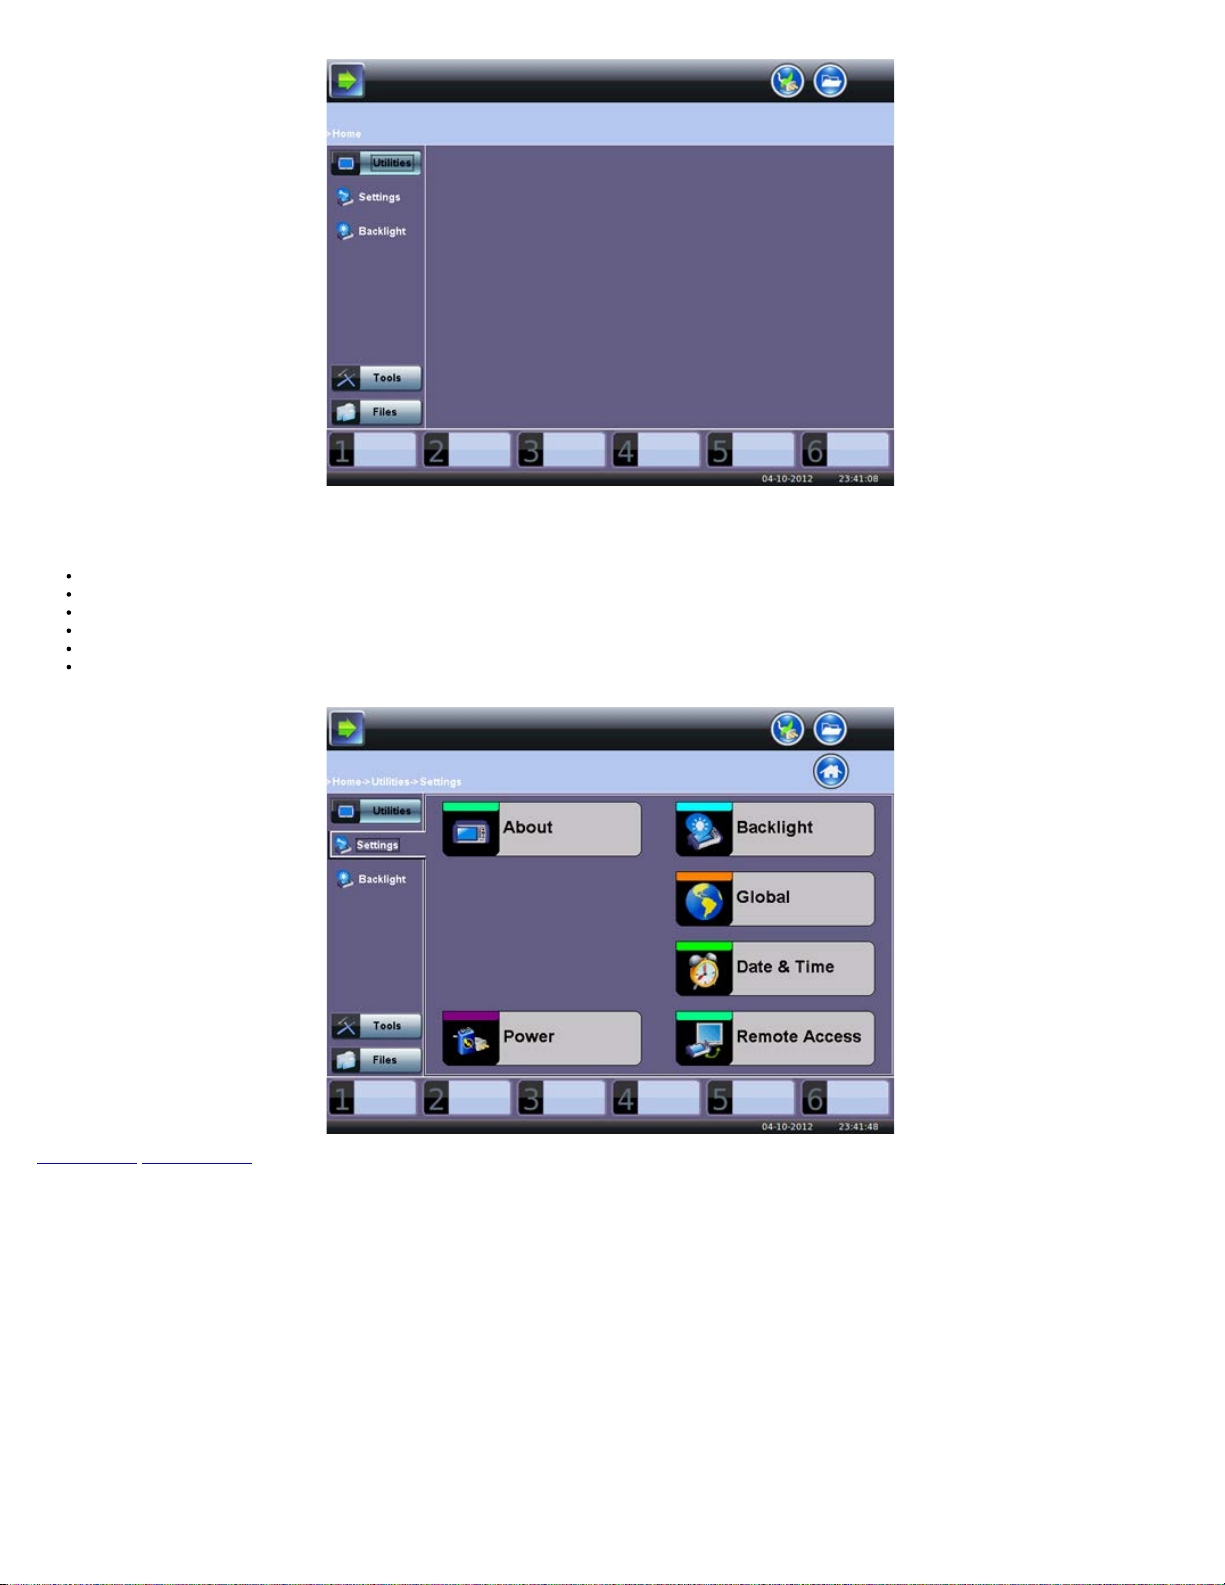
Settings
UX400 10G e-Manual D07-00-058P RevA00
Page 28 of 209
The following options are available under settings:
About
Backlight
Global
Date & Time
Remote Access
Power
Utilities Settings
Go back to top Go back to TOC
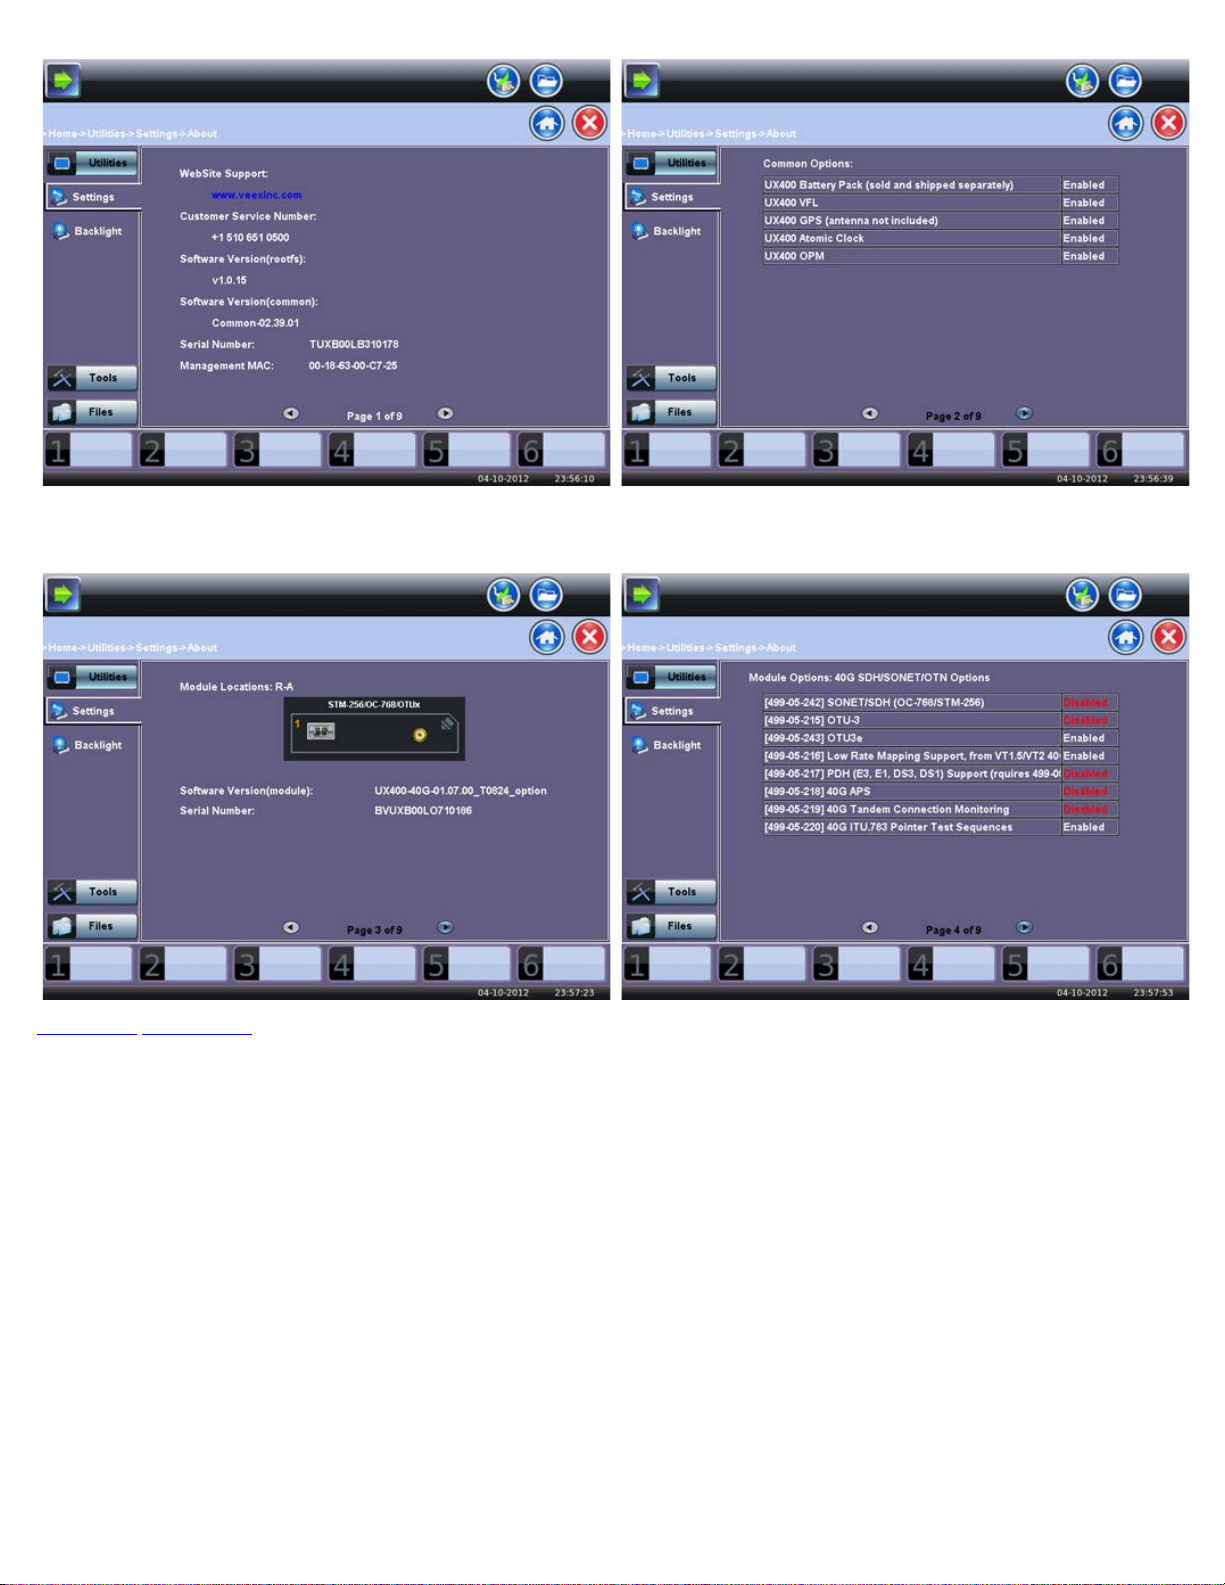
About:
Gives information about the unit - the serial number, the version of the software running on the unit, customer care number, Management MAC address, options installed on
the unit, and also information about the different modules installed on the unit.
Utilities Settings - About Page 1 Utilities Settings - About Page 2
Page 29
UX400 10G e-Manual D07-00-058P RevA00
Page 29 of 209
Utilities Settings
Go back to top Go back to TOC
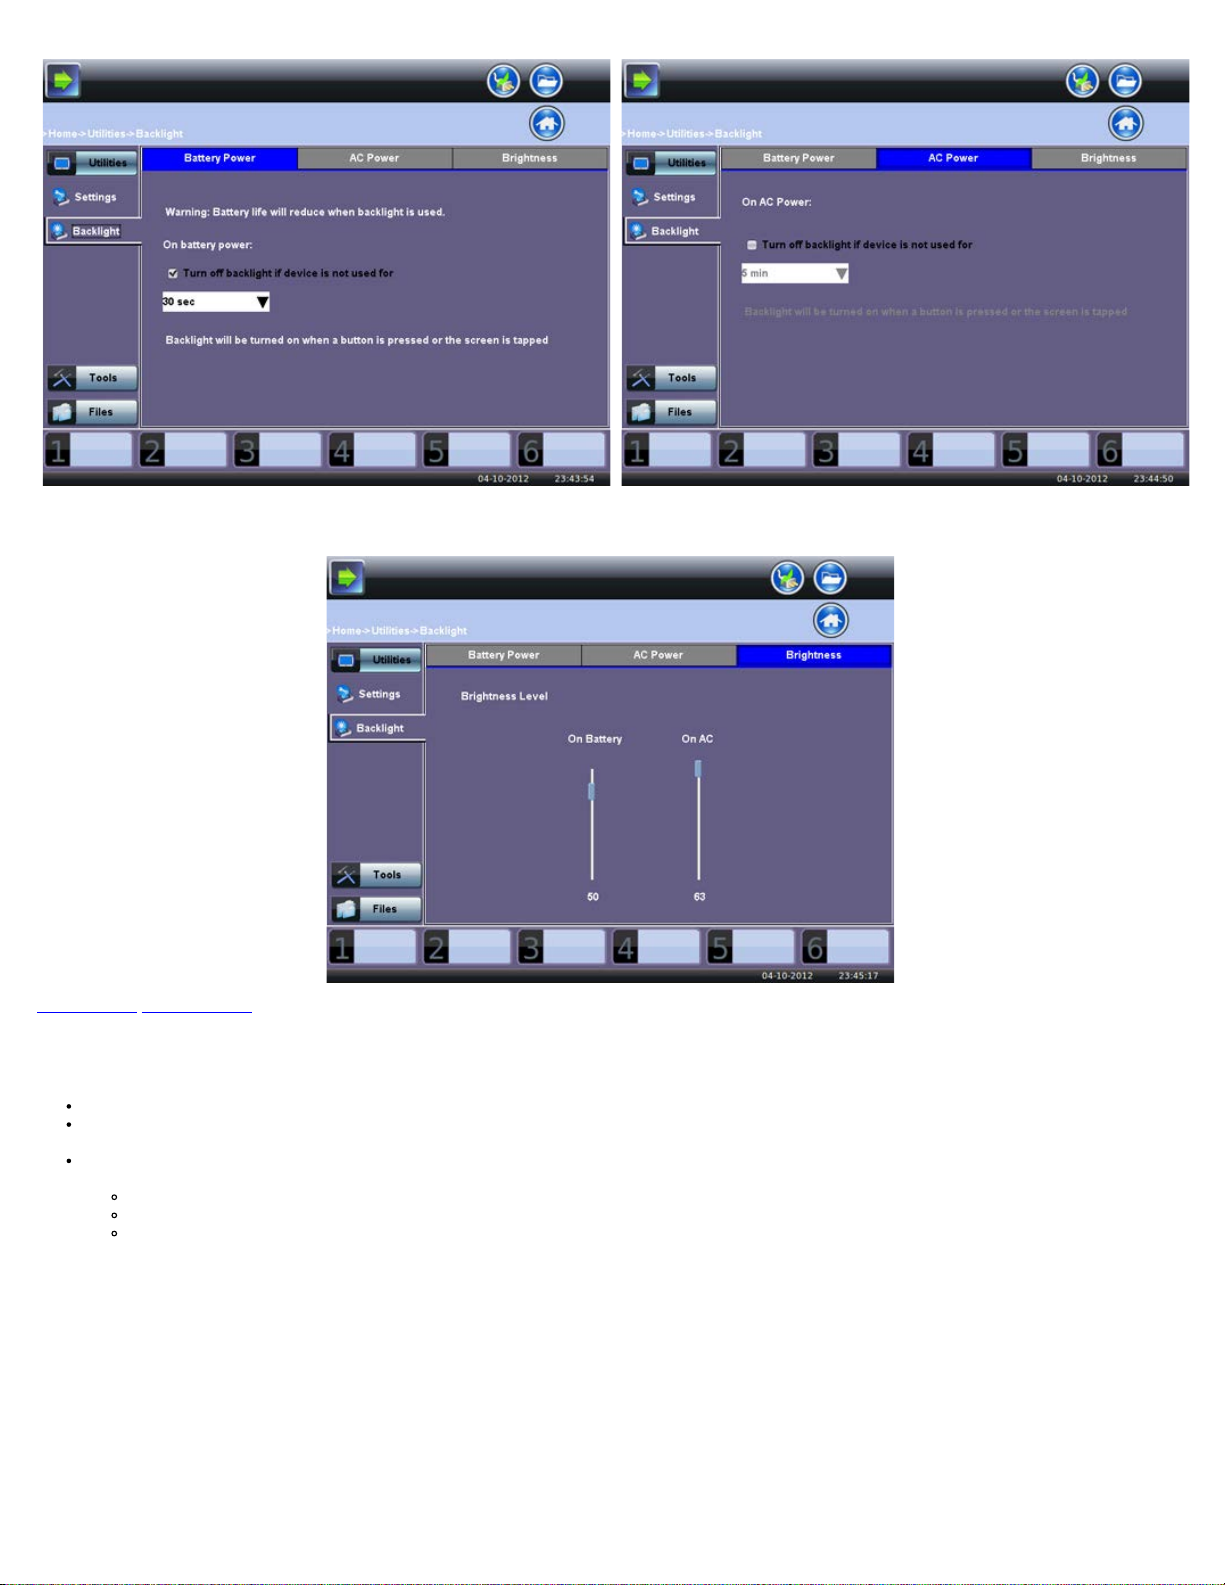
Backlight:
The Backlight tab, which can also be accessed directly from the Utilities menu on the left side of the screen, shows information about the Battery Power, AC Power, and
Brightness adjustment tool.
- About Page 3 Utilities Settings - About Page 4
Utilities Backlight Battery Power Utilities Backlight AC Power
Page 30
UX400 10G e-Manual D07-00-058P RevA00
Page 30 of 209
Utilities Backlight
Go back to top Go back to TOC
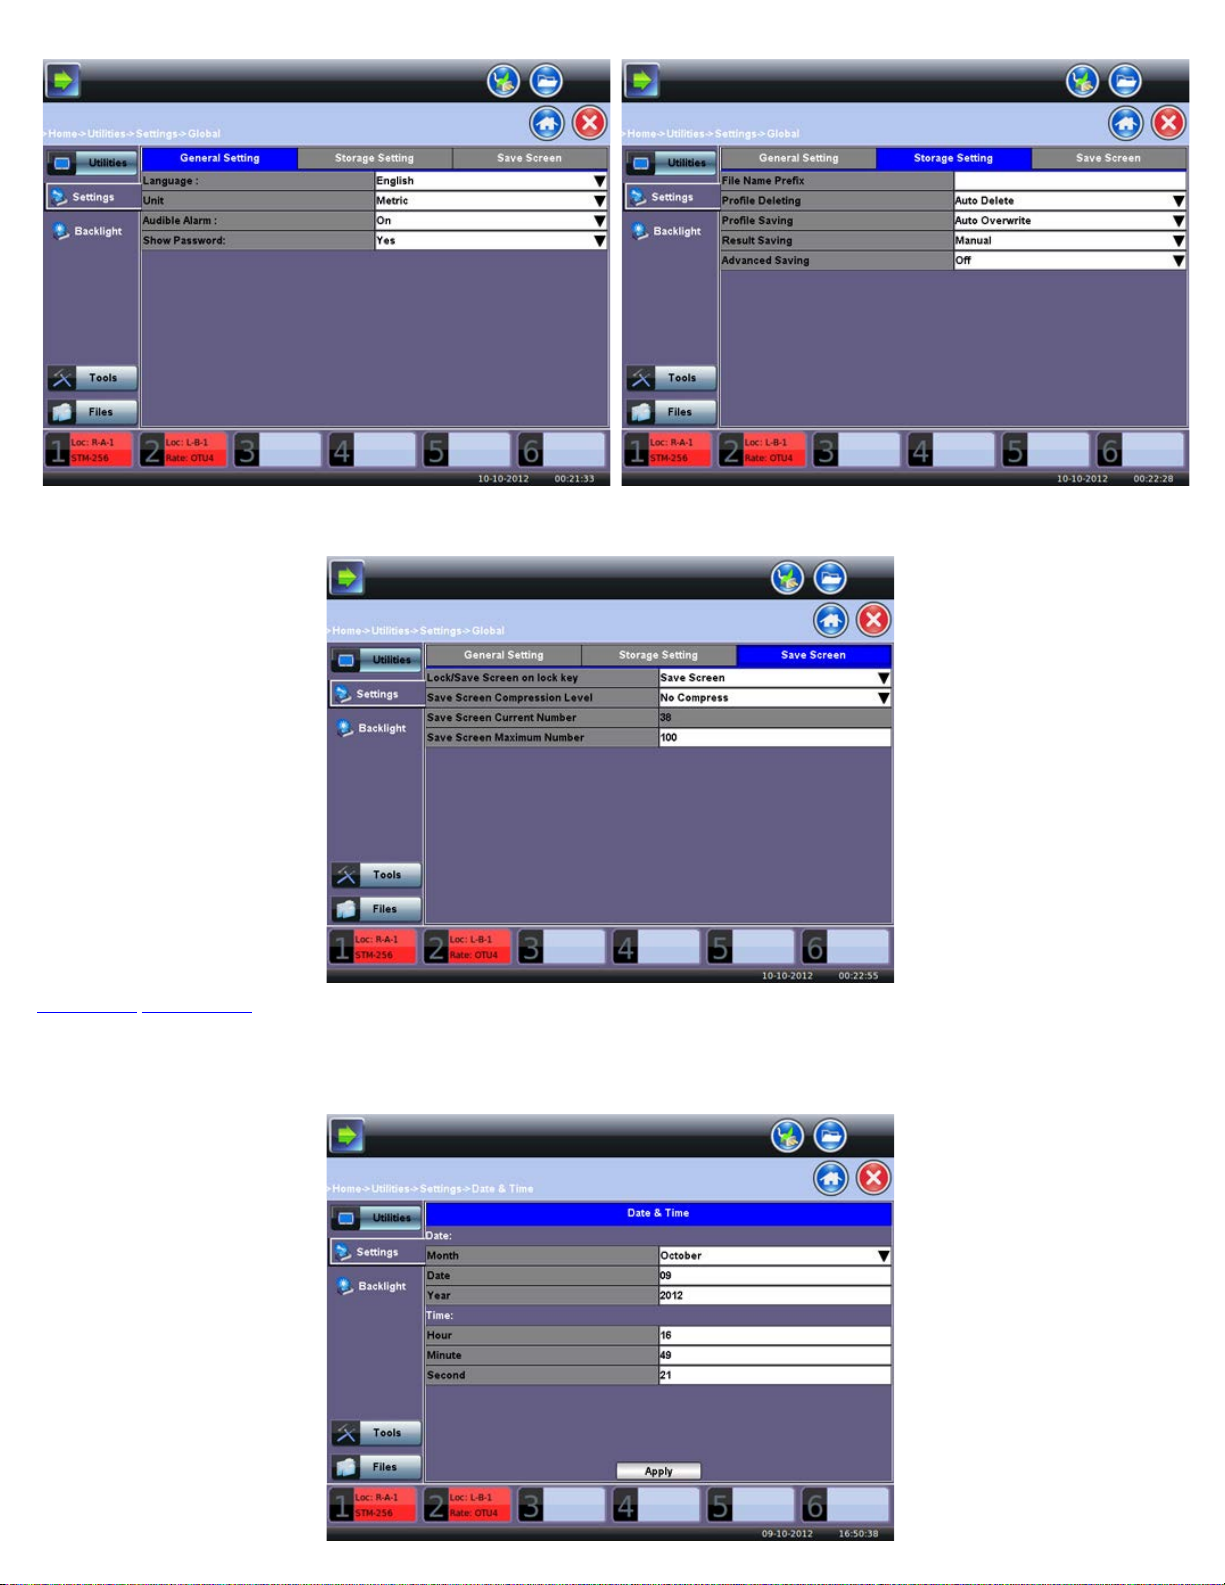
Global:
The Global tab offers the following options to configure:
General Settings: Language, Unit, Audible Alarm, Show Password
Storage Setting: How the system should work while performing operations that deal with storage of files and data: File Name Prefix, Profile Deleting, Profile Saving,
Result Saving, Advanced Saving.
Save Screen: This utility helps in configuring the Lock button on the keypad to either lock the screen or take a screenshot. Select "Save Screen" to configure the
Lock button to take a screenshot. Then the following settings can be configured:
Save Screen Compression Level - The saved screen shot can be compressed to keep the size of the captured file small
Save Screen Current Number - The number of screen shots already captured
Save Screen Maximum Number - The total number of screen shots that may be taken can be configured here
Brightness
Utilities - General Settings Utilities - Storage Settings
Page 31
UX400 10G e-Manual D07-00-058P RevA00
Page 31 of 209
Go back to top Go back to TOC
Date & Time:
The date and time settings for the unit can be set through this tab.
Utilities -
Date & Time Configuration
Save Screen
Page 32
Go back to top Go back to TOC
UX400 10G e-Manual D07-00-058P RevA00
Page 32 of 209
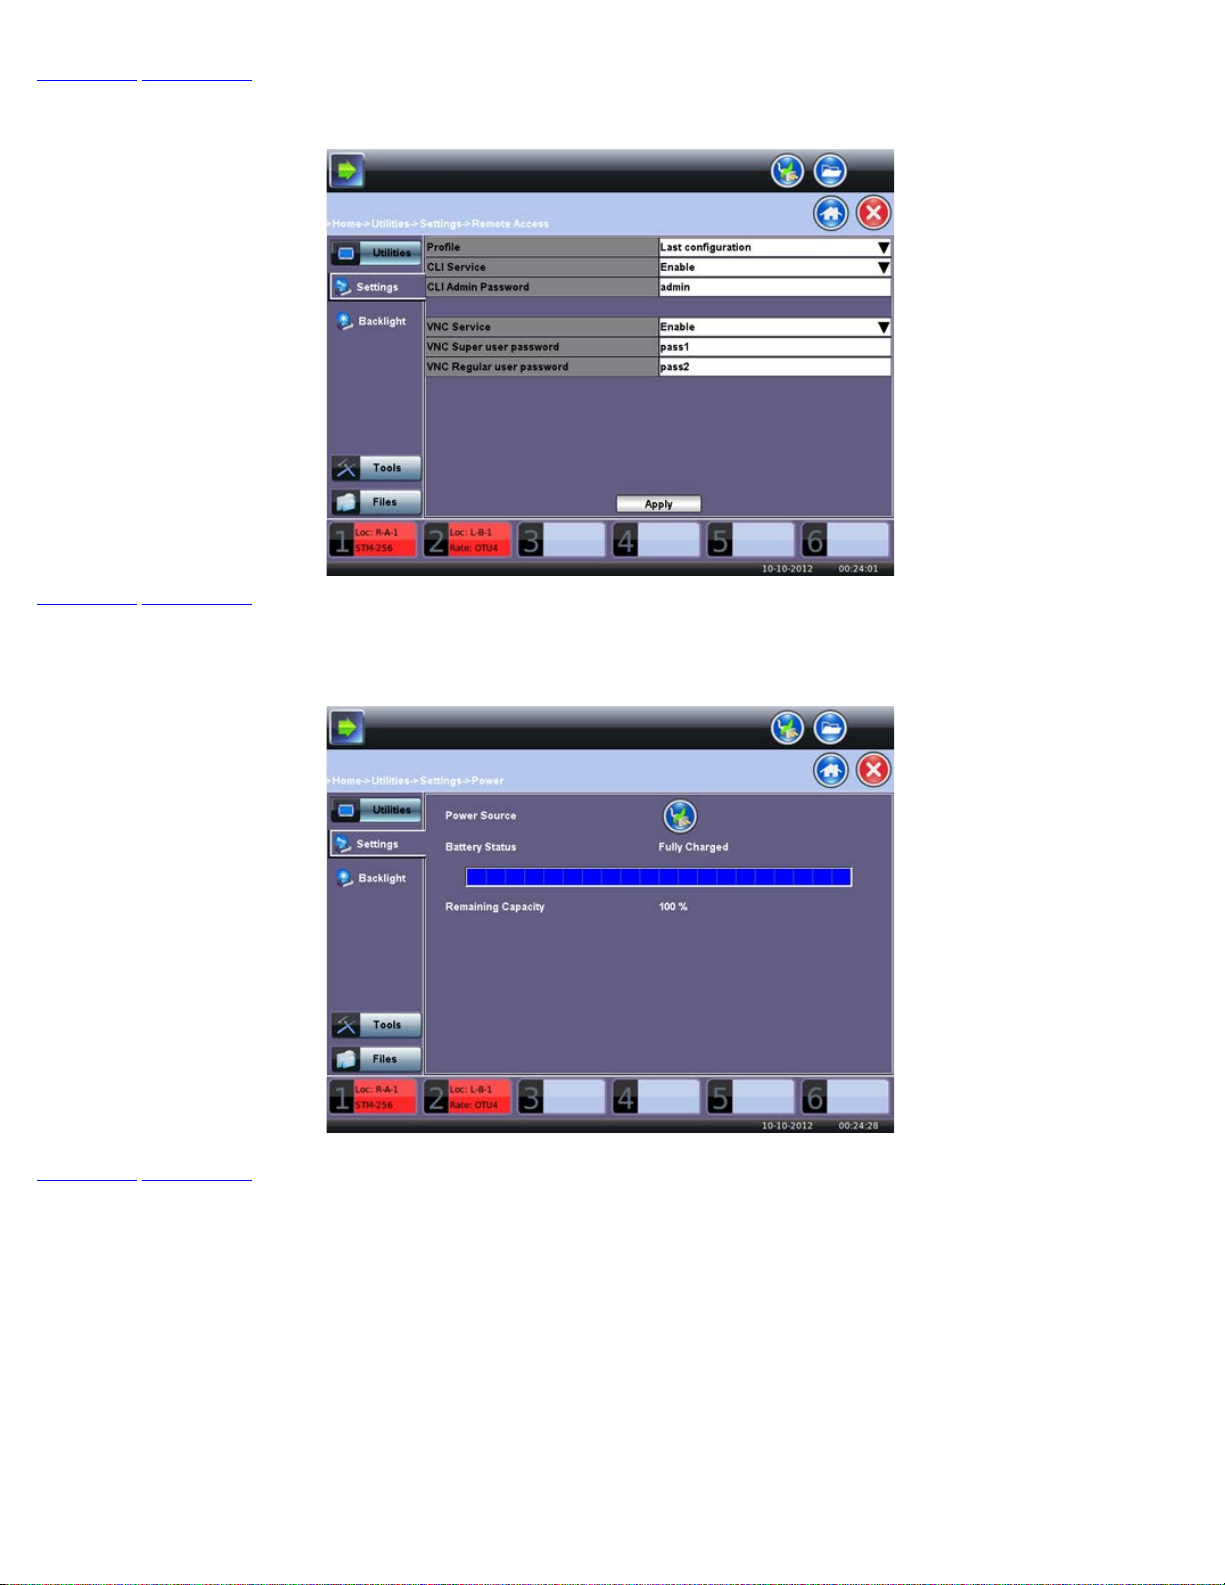
Remote Access:
Remote Access Configuration
Go back to top Go back to TOC
Power:
The Power tab displays the source of the power to the unit and status of the battery.
Power Source and Battery Status
Go back to top Go back to TOC
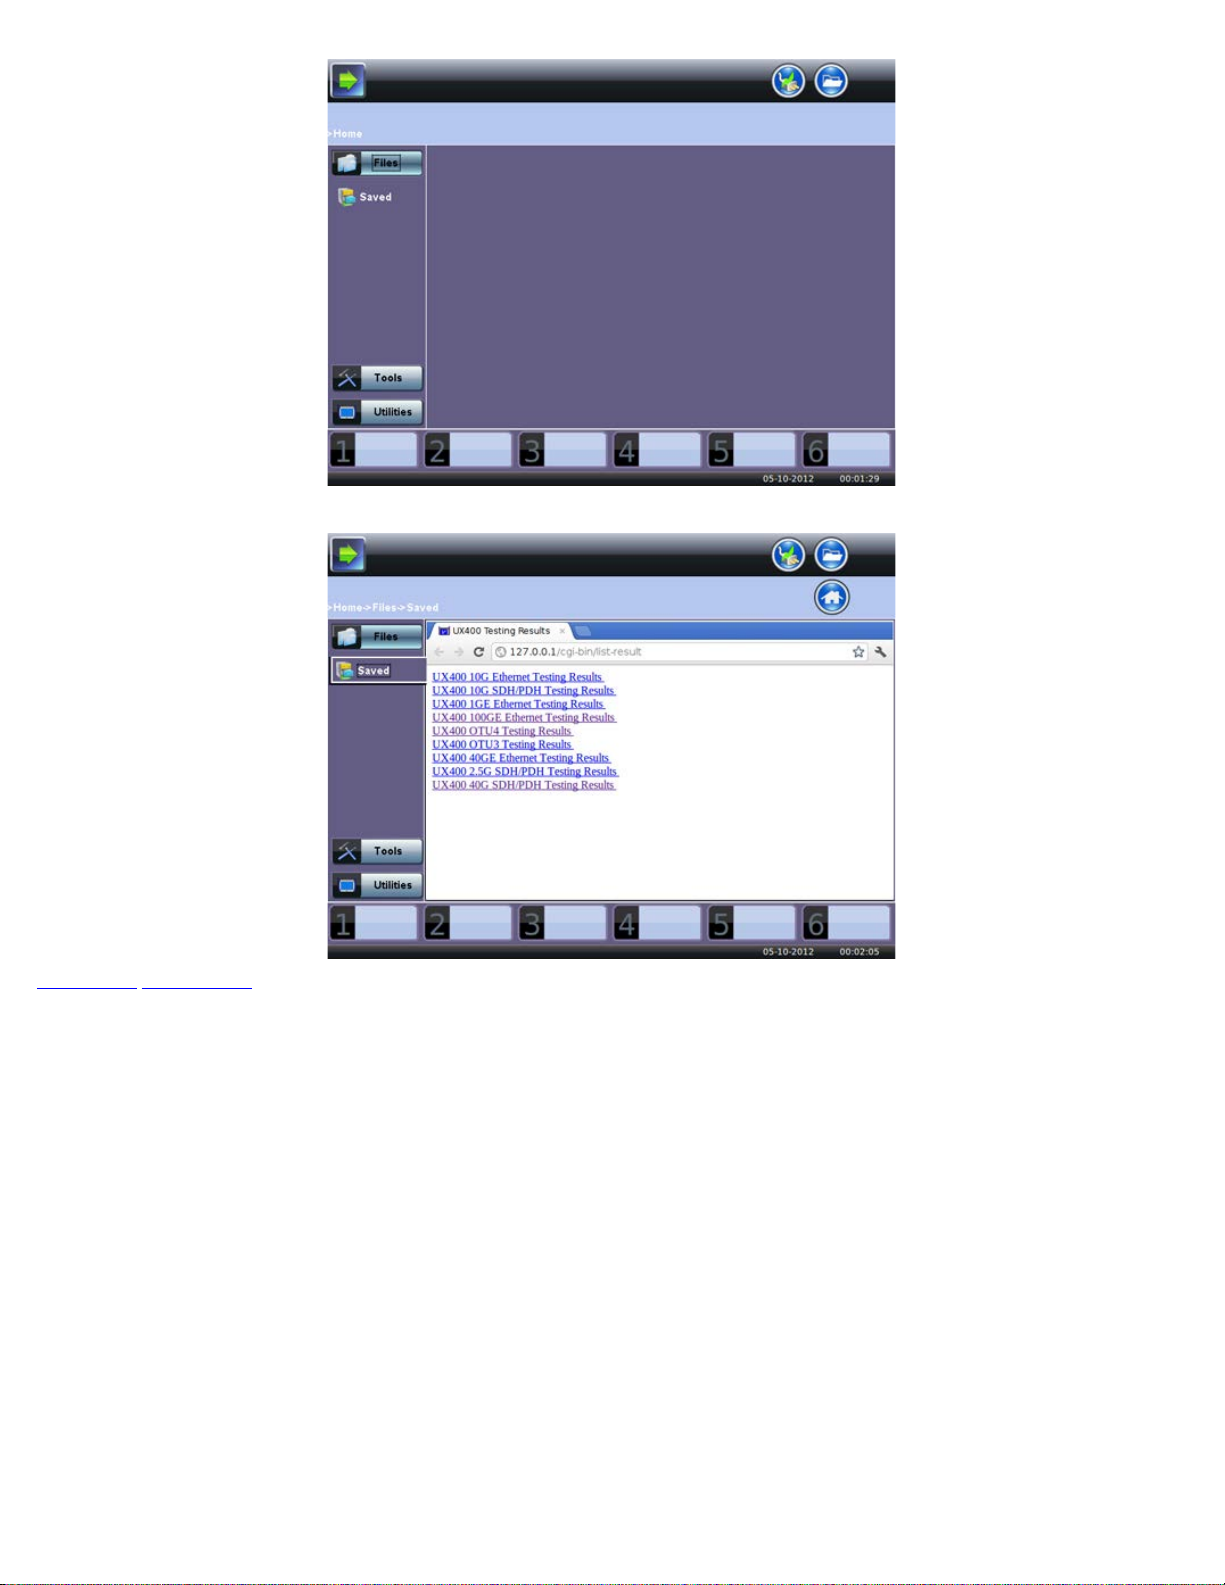
5.3.3 Files
The Files tab shows all the test results files saved on the unit.
Page 33
UX400 10G e-Manual D07-00-058P RevA00
Page 33 of 209
Go back to top Go back to TOC
Page 34
6.0 10G Ethernet Test Application
UX400 10G e-Manual D07-00-058P RevA00
Page 34 of 209
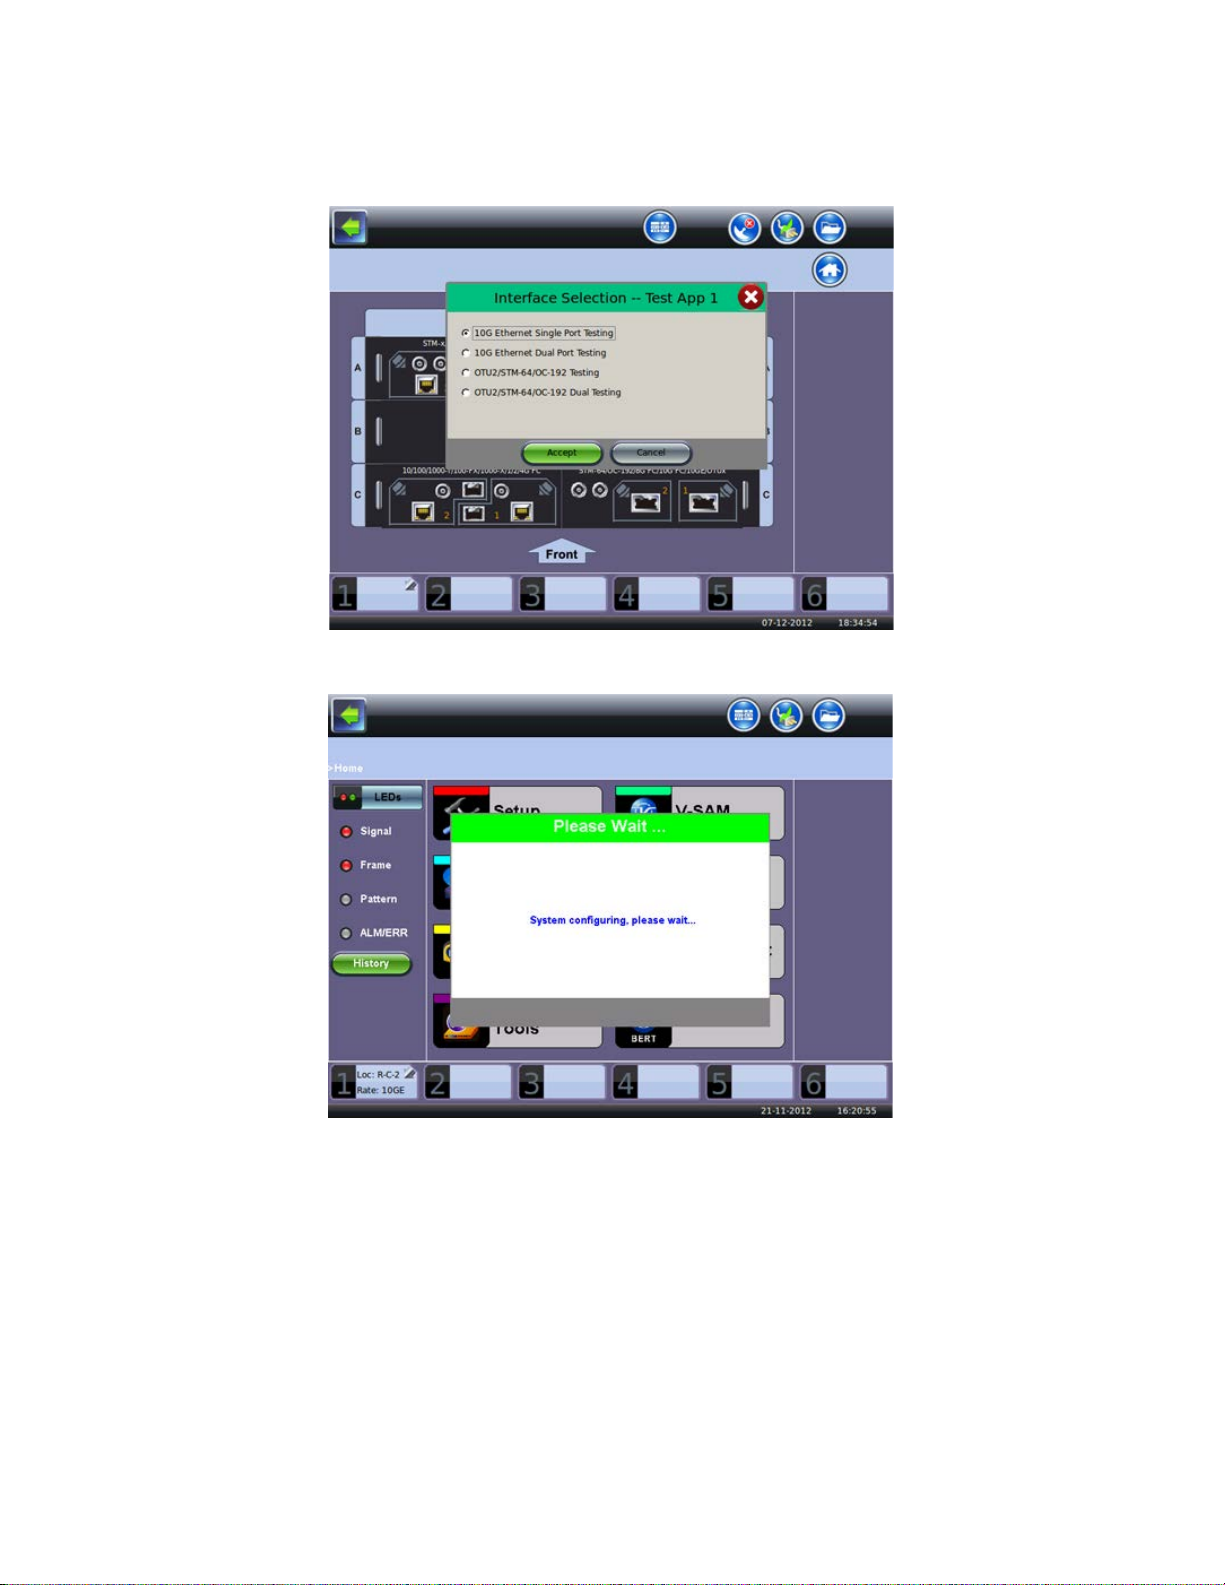
Follow the steps to assign the test module to a test tab as described in Chapter 5 of this manual.
Select the 10G Ethernet Testing Application (Single Port or Dual Port) and click "Accept".
10GE Ethernet Testing App Selection
The module will be configured and the progress will be displayed on the unit's screen.
System Configuring
The 10GE home page will be displayed with links to all possible tests. The Test Tab in the bottom of the screen will be red in color and so will be the soft LEDs for Signal
and Frame on the left side of the screen.
10GE Test App Home Screen (Single Port)
Page 35
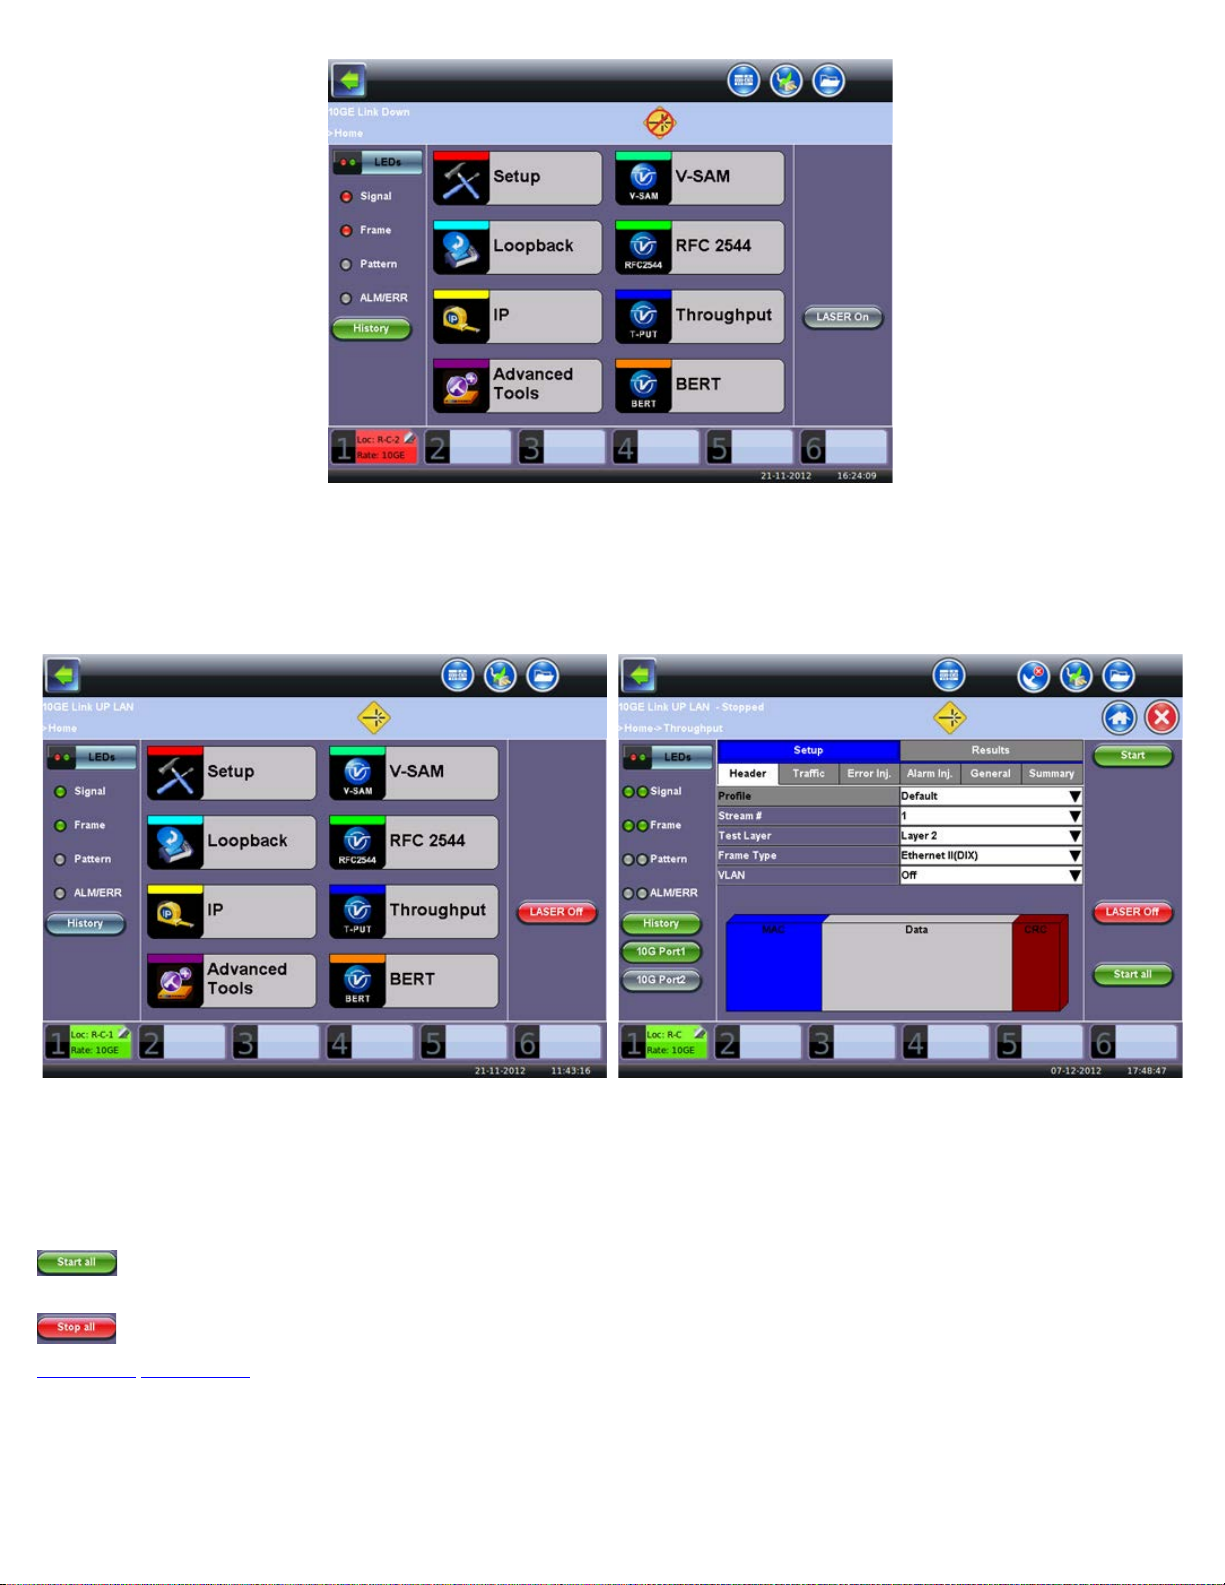
Tap the Laser On/Off button on the right side of the screen.
UX400 10G e-Manual D07-00-058P RevA00
Page 35 of 209
The Laser On/Off button will turn Red, while the soft LEDs for Signal and Frame will start blinking.
Tap the History button displayed below the soft LEDs. The LEDs will now turn steady green and the test tab will also turn green, indicating the module is ready to perform
different tests.
Ready for Testing Tasks 10GE Test App Home Screen (Dual Port)
Ethernet Dual Port Operation
When the dual port interfaces and software options are enabled, the test module can operate a combination of two ports at the same time.
Note: The configuration parameters (header, bandwidth, etc.) for each application (on each of the ports) are completely independent from one another. All test feature
combinations are allowed and completely independent (Loopback, BERT, Throughput, RFC2544, V - SAM) in dual port operation. However, some advanced tools like VoIP,
IPTV, VLAN scan, Packet Capture are only available in single port testing mode. The User Interface will provide an error message when a feature is not available in dual
port operation.
ports.
Go back to top Go back to TOC
Start All: The Start All button is located on the right side of the dual port operation mode screen. Tapping this button will simultaneously start a test on both
Stop All: Once the test starts on both ports, the Start All button will change to Stop All. Tapping on this button will simultaneously stop the test on both ports.
6.1 Setup
6.1.1 Port Setup
Port setup configuration is accessed from the Setup menu located on the home page of 10GE Test App.
UX400 10G Ethernet Test App Setup
Page 36
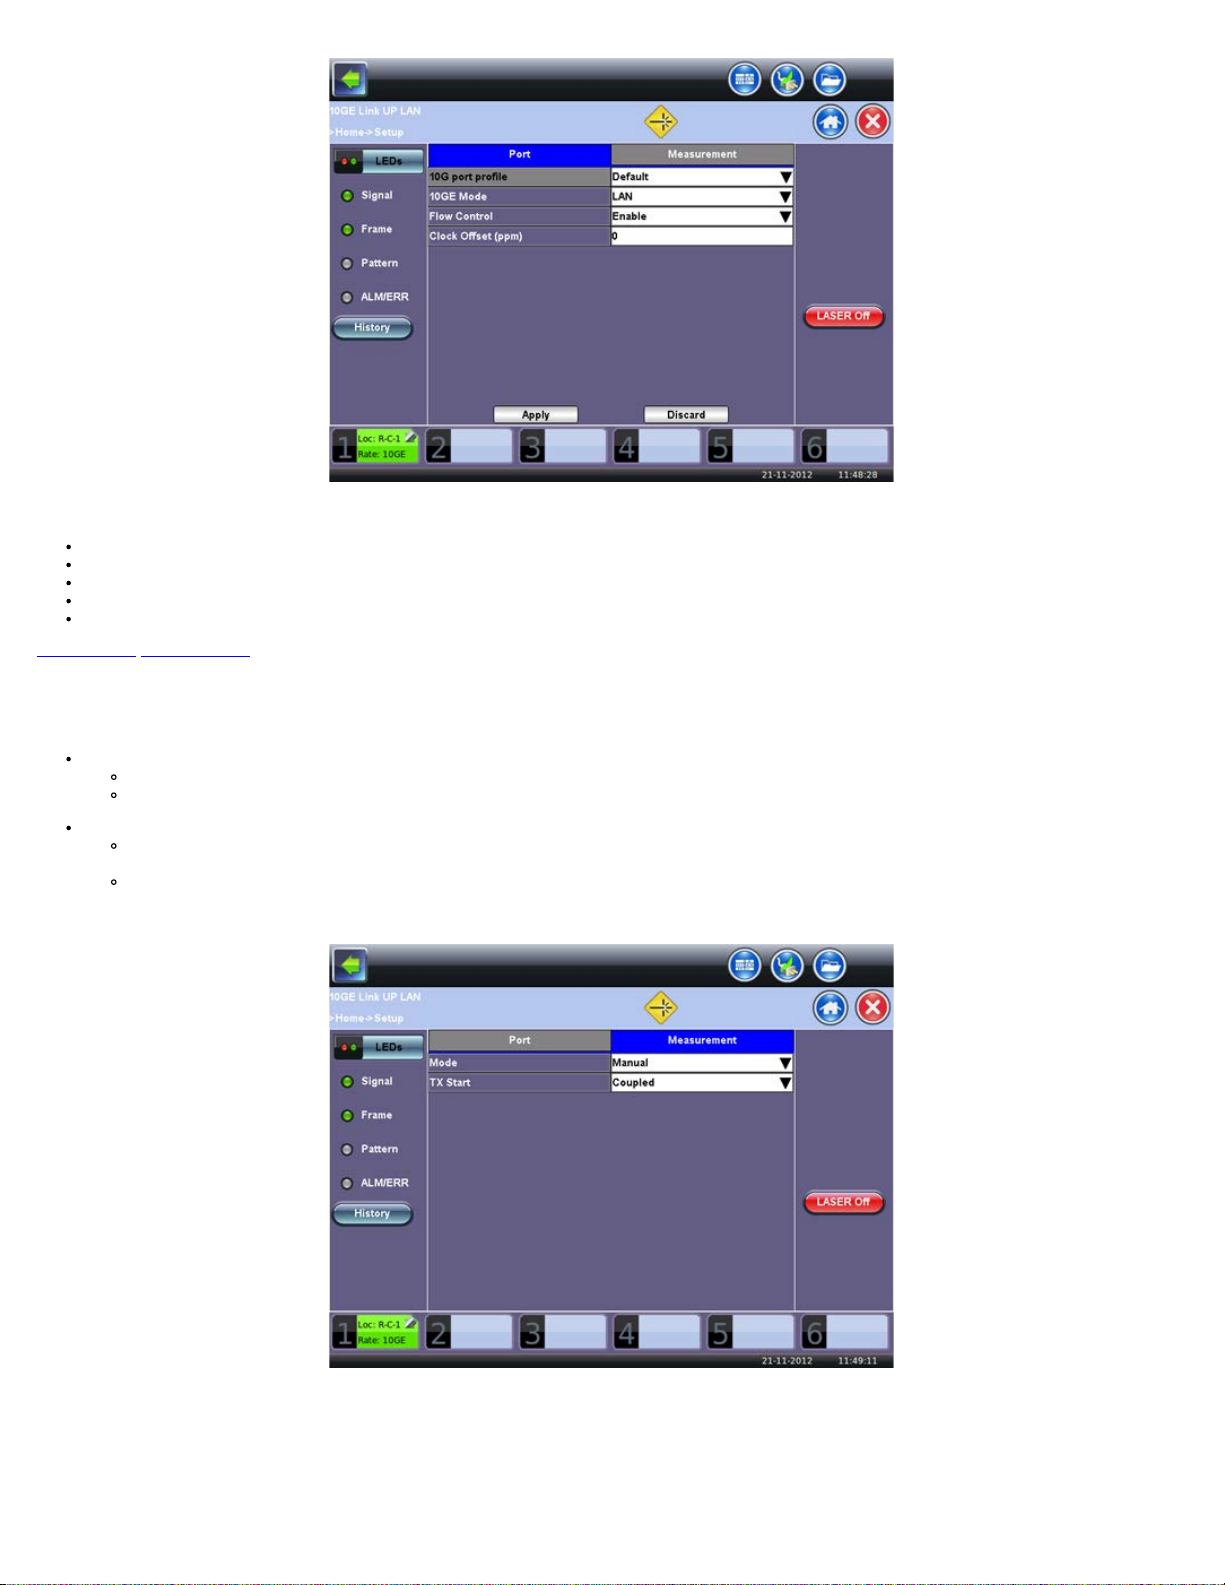
The following configurations are available:
UX400 10G e-Manual D07-00-058P RevA00
Page 36 of 209
10G port profile : Default
10GE Mode: LAN / WAN
WIS Mode (for WAN): SDH / SONET
Flow Control: Enable
Clock Offset (ppm): Can be configured; range is +/- 150ppm
Go back to top Go back to TOC
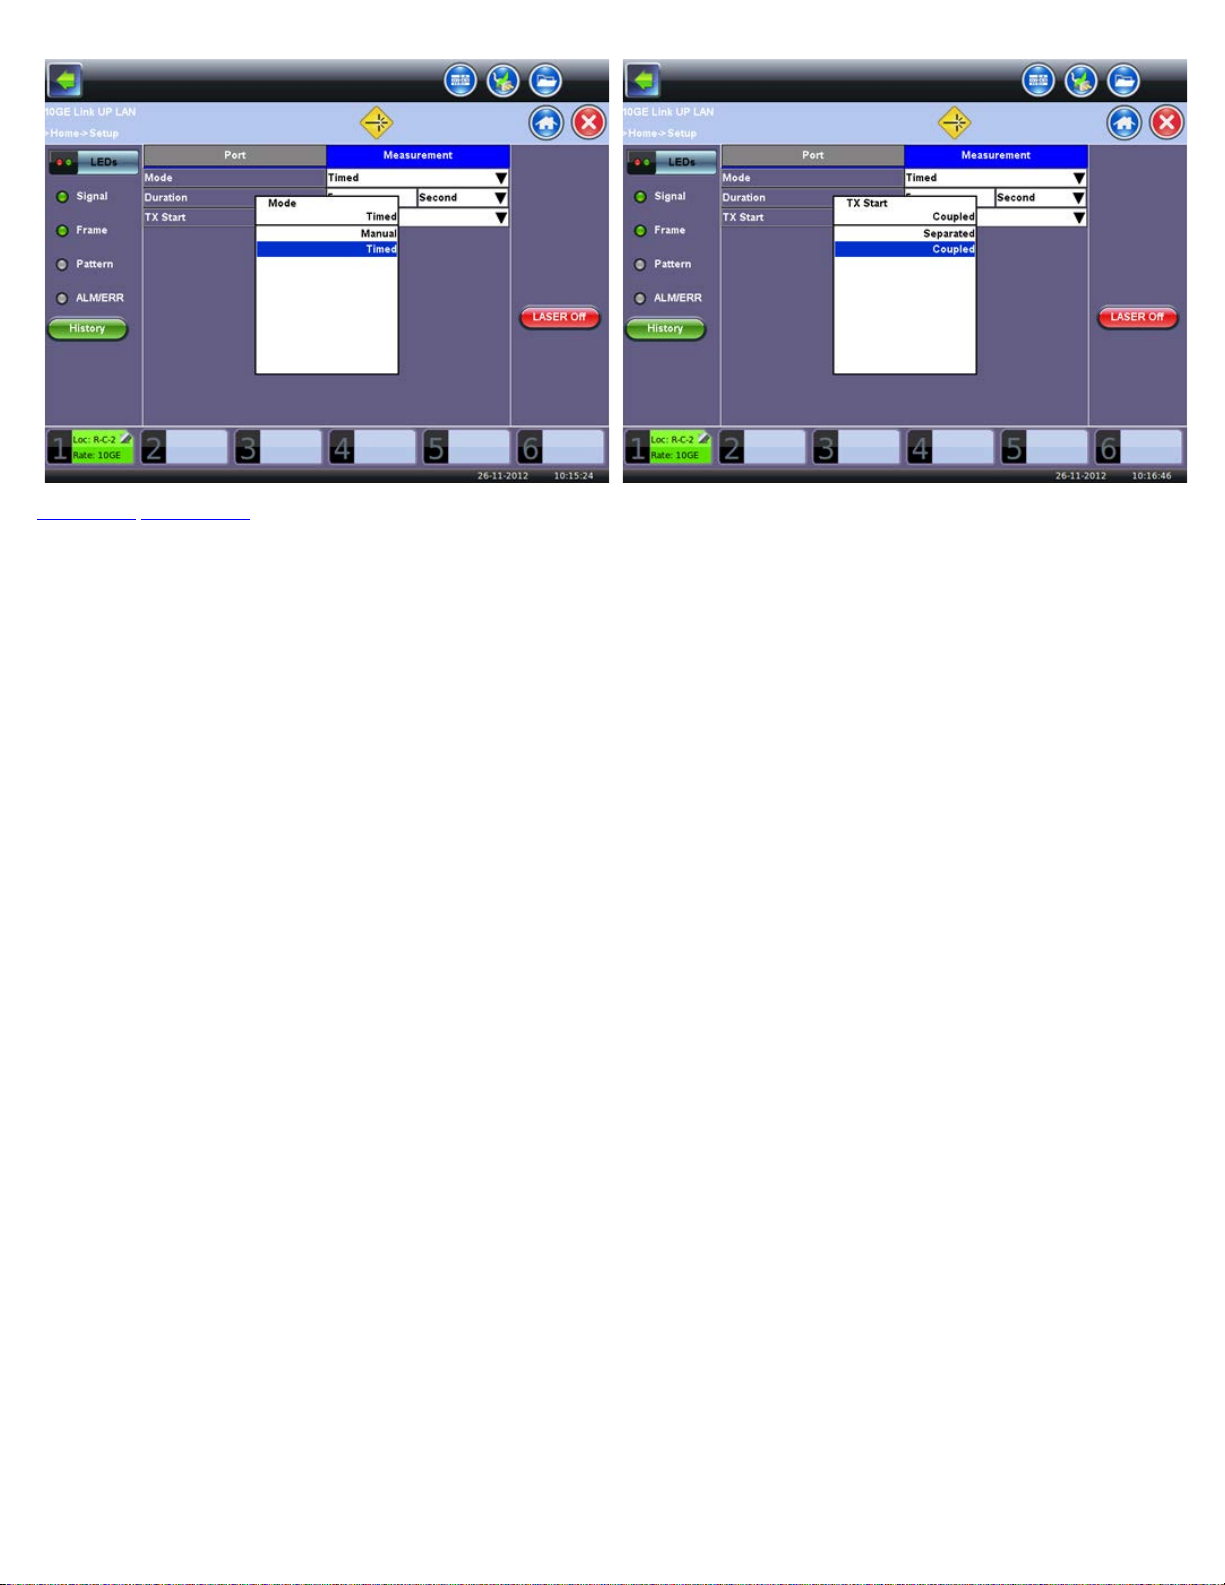
6.1.2 Measurement Setup
The measurement settings are configured on this screen.
Mode: Manual, Timed
Manual mode: User manually starts and stops the measurements.
Timed mode: User defines the duration of the test; after the test is started, the test will run for the configured duration and stop automatically.
TX Start: Separated and Coupled. Configure how the measurements are started when in BERT and Multiple Streams test modes.
Separated: Independent control (Start/Stop) of the transmitter is enabled. At the start of the test only the receiver is turned on -- the user must start the
transmitter manually.
Coupled: Transmitter and receiver are turned on at the same time, and the Tx and Rx measurements start at the same time at the start of the test.
Measurement Setup
Measurement Mode Measurement
TX Start
Page 37
Go back to top Go back to TOC
UX400 10G e-Manual D07-00-058P RevA00
Page 37 of 209
Page 38
6.1 Setup
UX400 10G e-Manual D07-00-058P RevA00
Page 38 of 209
6.1.1 Port Setup
Port setup configuration is accessed from the Setup menu located on the home page of 10GE Test App.
UX400 10G Ethernet Test App Setup
The following configurations are available:
10G port profile : Default
10GE Mode: LAN / WAN
WIS Mode (for WAN): SDH / SONET
Flow Control: Enable
Clock Offset (ppm): Can be configured; range is +/- 150ppm
Go back to top Go back to TOC
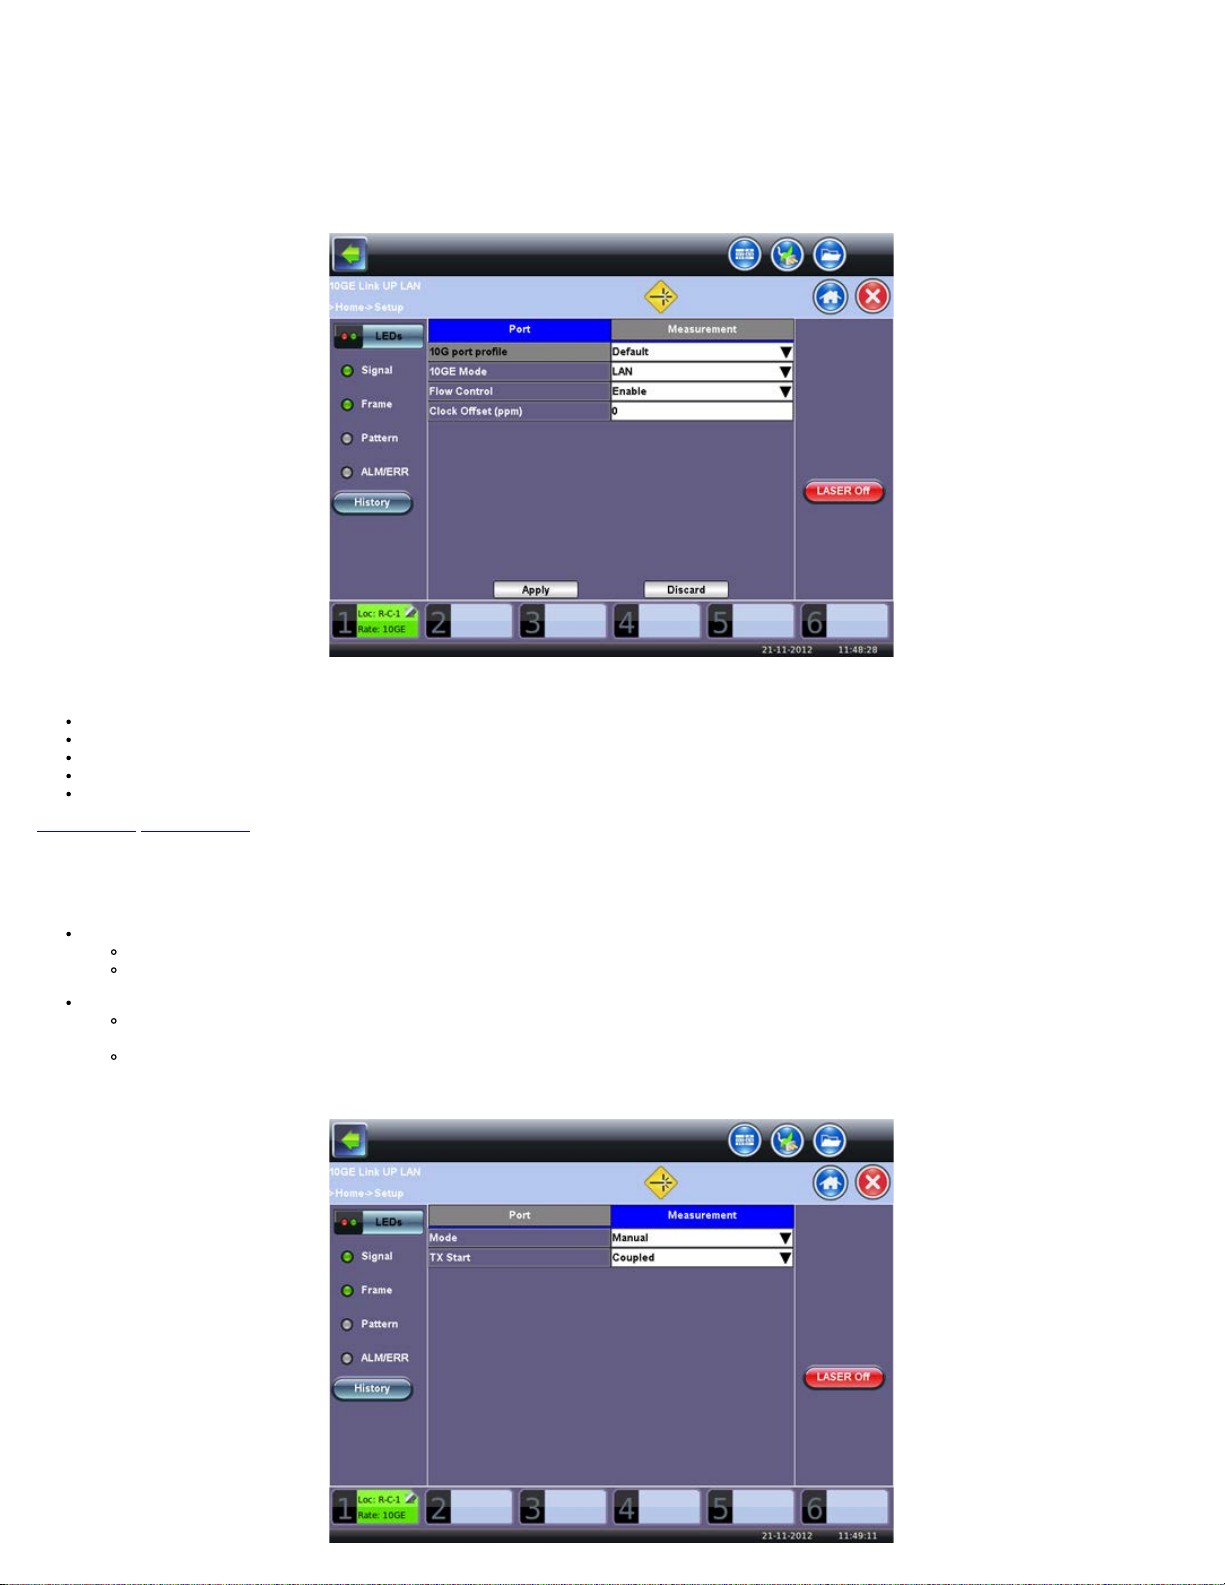
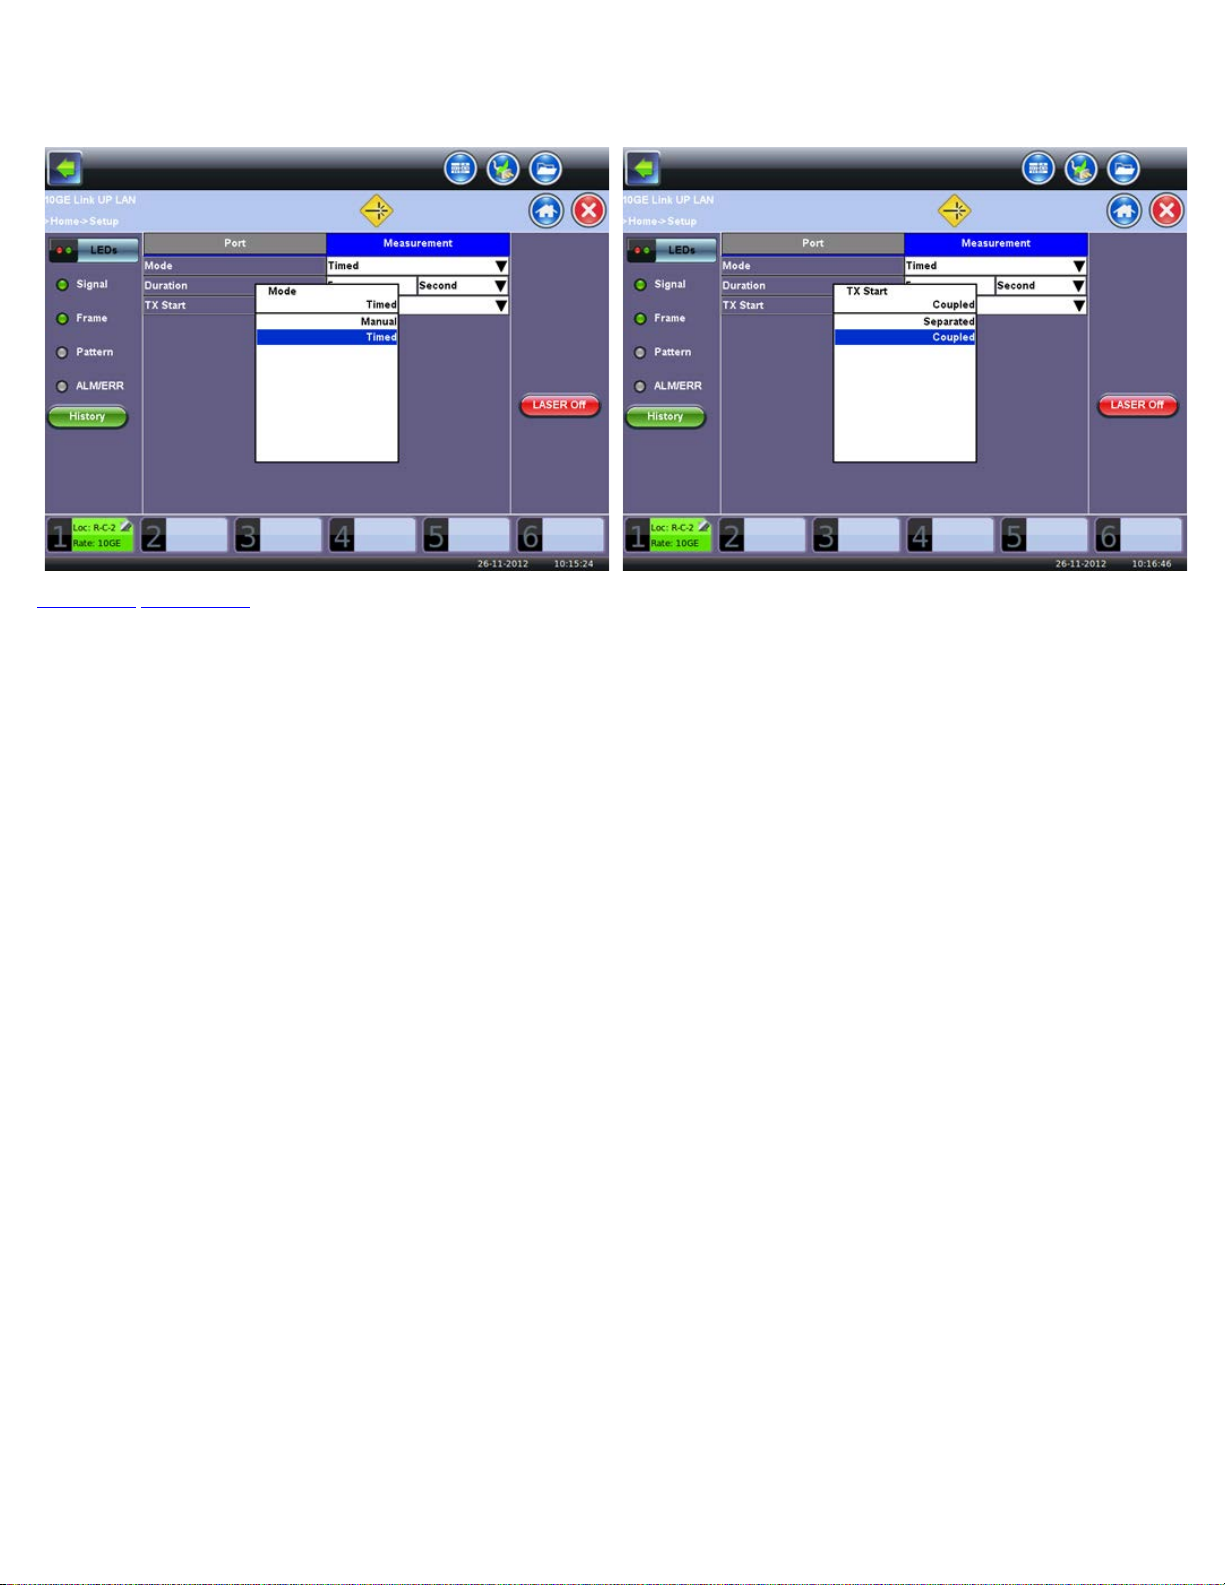
6.1.2 Measurement Setup
The measurement settings are configured on this screen.
Mode: Manual, Timed
Manual mode: User manually starts and stops the measurements.
Timed mode: User defines the duration of the test; after the test is started, the test will run for the configured duration and stop automatically.
TX Start: Separated and Coupled. Configure how the measurements are started when in BERT and Multiple Streams test modes.
Separated: Independent control (Start/Stop) of the transmitter is enabled. At the start of the test only the receiver is turned on -- the user must start the
transmitter manually.
Coupled: Transmitter and receiver are turned on at the same time, and the Tx and Rx measurements start at the same time at the start of the test.
Measurement Setup
Page 39
UX400 10G e-Manual D07-00-058P RevA00
Page 39 of 209
Go back to top Go back to TOC
Measurement Mode Measurement
TX Start
Page 40
6.2 BERT
UX400 10G e-Manual D07-00-058P RevA00
Page 40 of 209
6.2.1 BERT Setup
Overview:
BER testing at Layer 2, 3 and 4 is supported. The BERT can be configured to use either regular PRBS test patterns, stress patterns (specifically for 10Gigabit Ethernet) or
user defined test patterns to simulate various conditions. The test layer, frame header, traffic profile, error injection, and control settings of the far -end device (if applicable)
must be configured prior to testing.
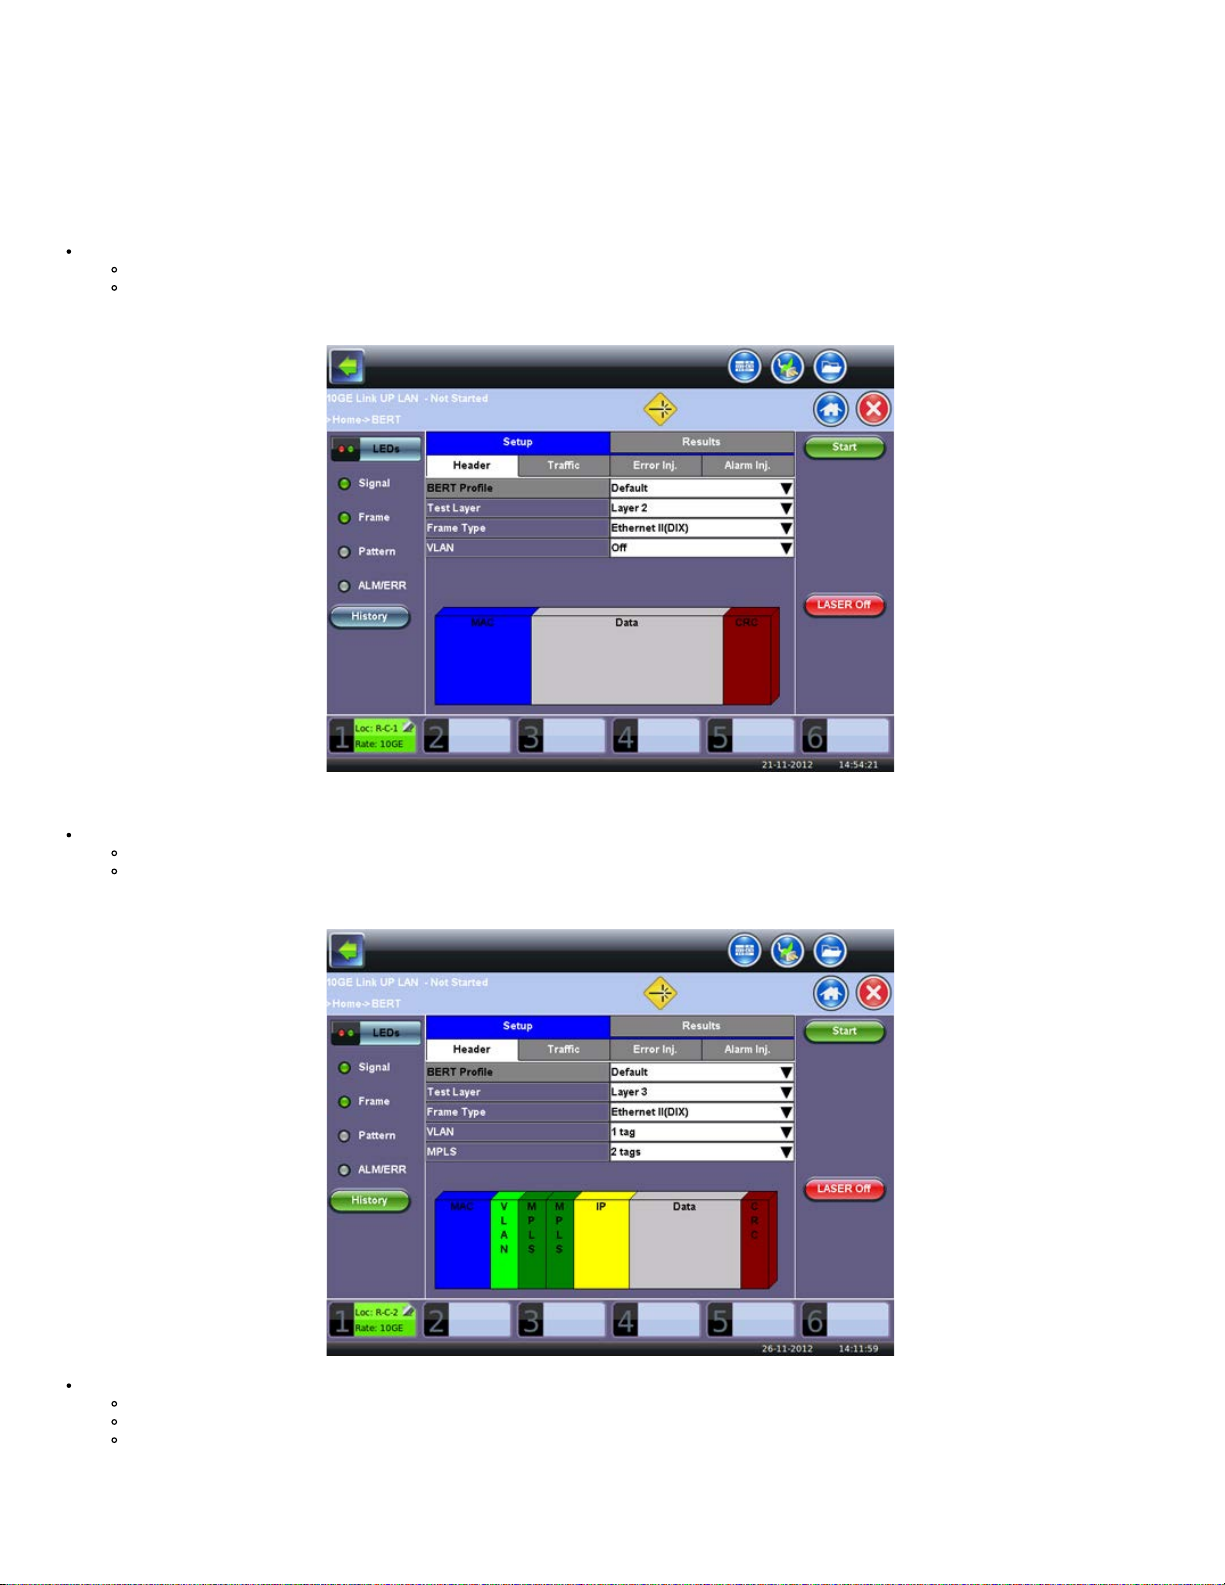
Layer 2:
Framed BERT: Test pattern is encapsulated into a valid Ethernet frame with SOF, Preamble, and CRC field
MAC Address: A default or user configured Media Access Control (MAC) address is added to the frame
BERT Setup - Header (Layer 2)
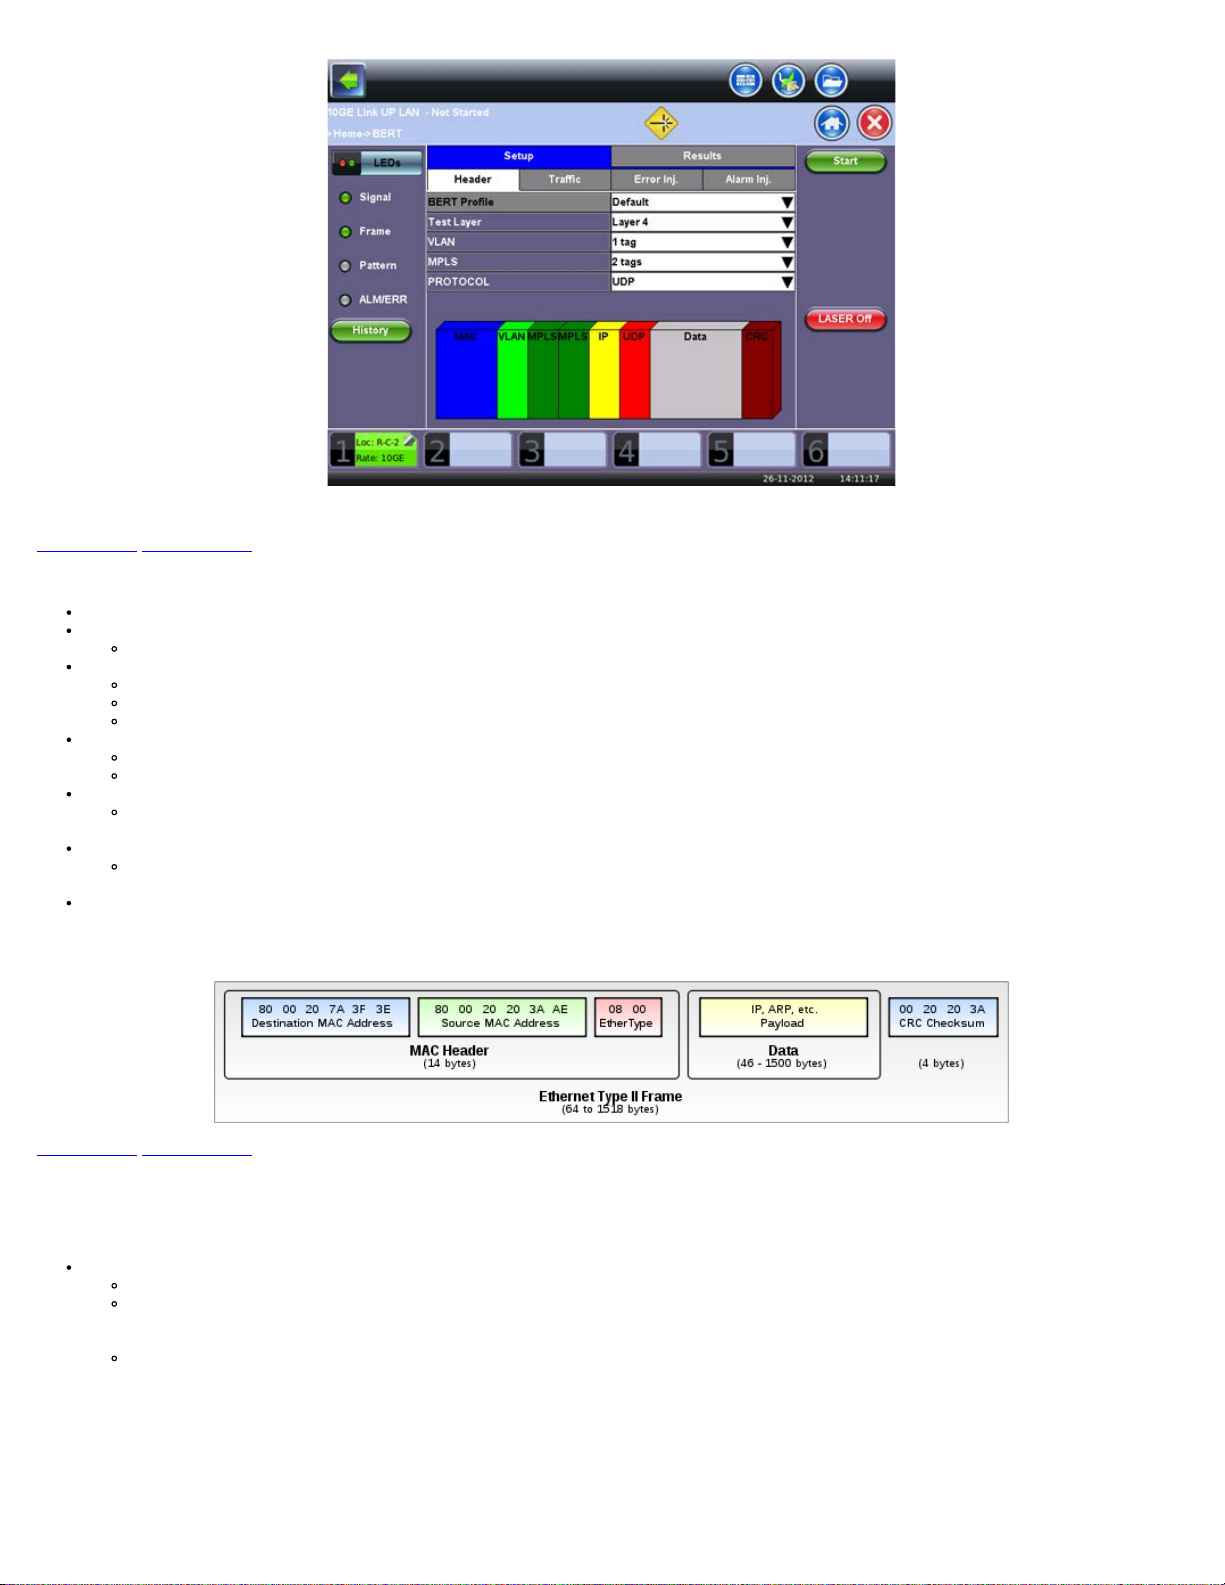
Layer 3: Framed BERT
MAC Address: A default or user configured Media Access Control (MAC) address is added to the frame
IP Address: A default or user configured IP address is added to the frame
BERT Setup - Header (Layer 3)
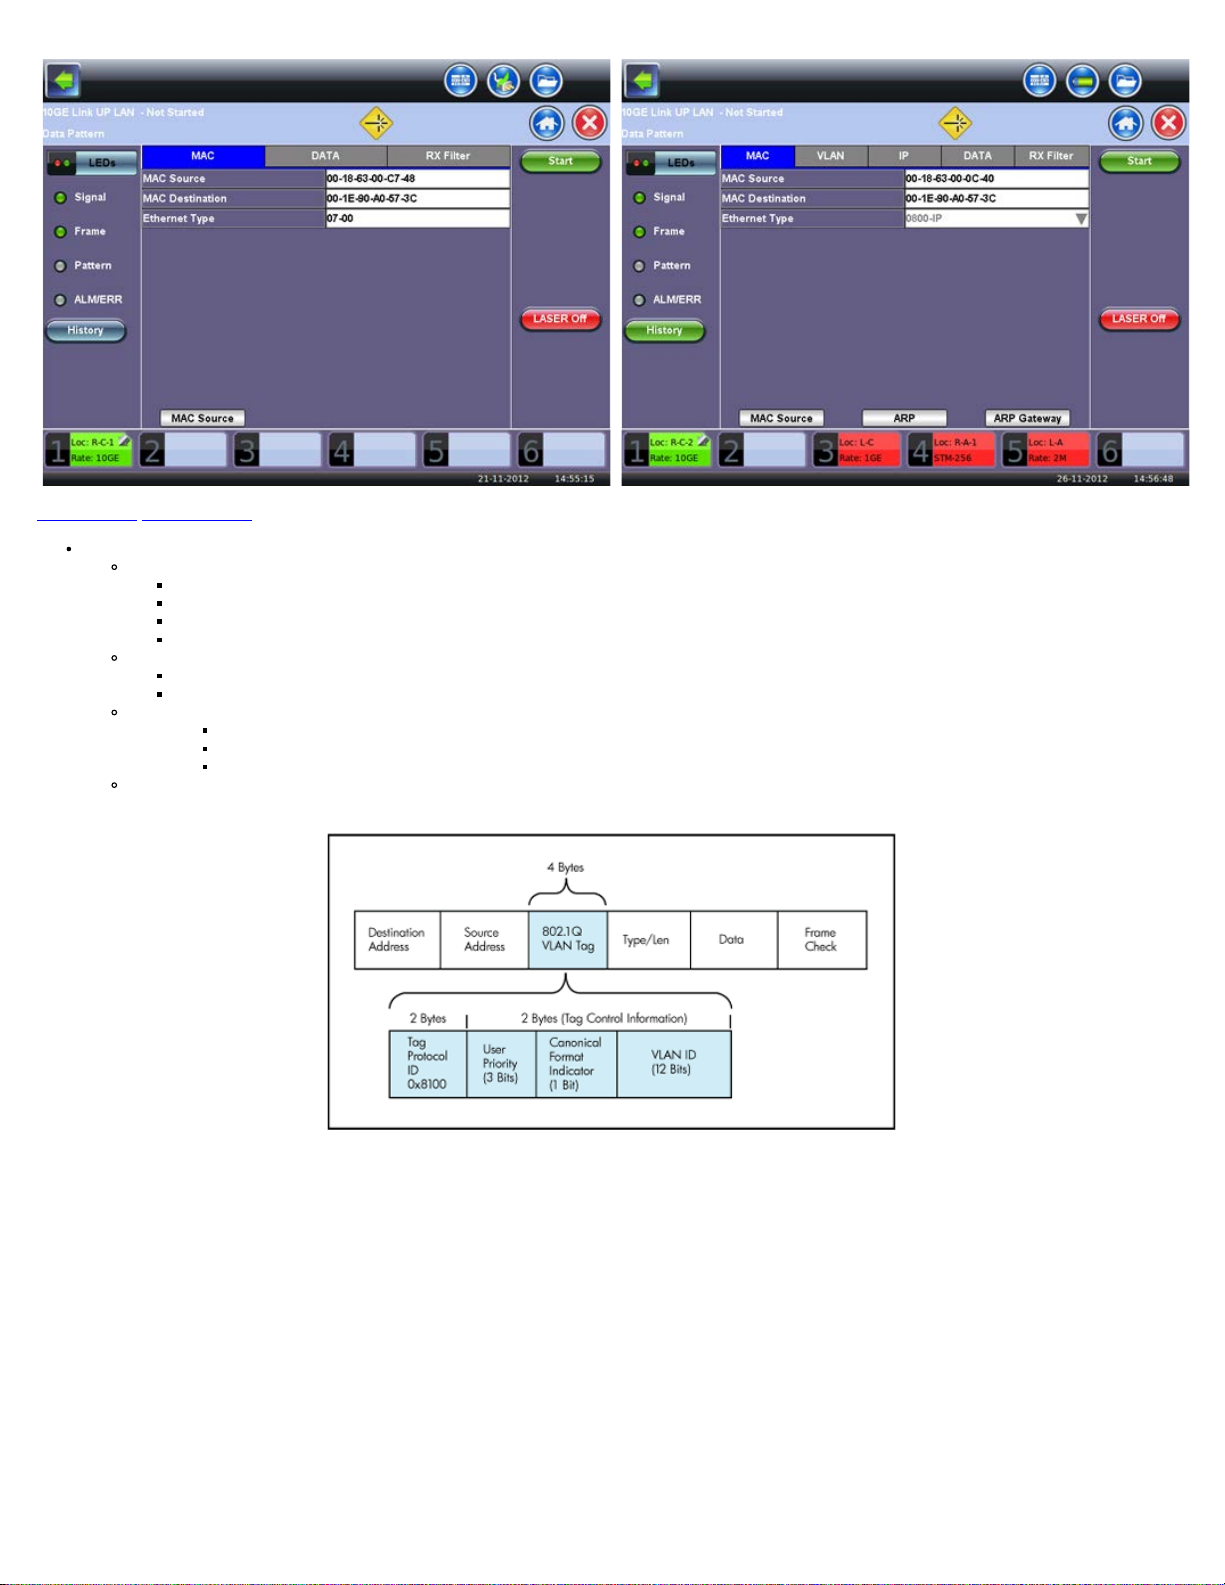
Layer 4: Framed BERT (same as Layer 2 & 3 Framed)
MAC Address: A default or user configured Media Access Control (MAC) address is added to the frame
IP Address: A default or user configured IP address is added to the frame
UDP Address: A user defined source and destination port address is added to the frame
BERT Setup - Header (Layer 4)
Page 41
UX400 10G e-Manual D07-00-058P RevA00
Page 41 of 209
Go back to top Go back to TOC
6.2.1.1 Header Settings
BERT Profile: Load a previously configured test profile or create a new profile from existing settings. Currently its set to "Default".
Test Layer: Select the test layer to perform the BERT
Options are Layer 2, Layer 3 and Layer 4
Frame Type:
Layer 2: 802.3 Raw (IEEE 802.3 frame without LLC) and Ethernet II (DIX) (named after DEC, Intel, and Xerox, this is the most common frame type today)
Layer 3: Ethernet II (DIX)
No Frame Type for Layer 4
MAC/IP: Tap the MAC and IP blocks on the Frame image to access the setup menus
Set the Source and Destination MAC address for Layer 2
Set the Source and Destination MAC and IP addresses for Layer 3 and 4
VLAN: Off, 1 tag, 2 tags, 3 tags
The user is able to configure up to 3 VLAN tags (VLAN stacking, for Q-in-Q applications)
Note: VLAN stacking is an option
MPLS: (For Layer 3 and 4 only) Off, 1 tag, 2 tags, 3 tags
The user is able to configure up to 3 MPLS tags
Note: MPLS tag configuration is only available when the MPLS option is purchased
PROTOCOL (Layer 4 only): UDP or TCP
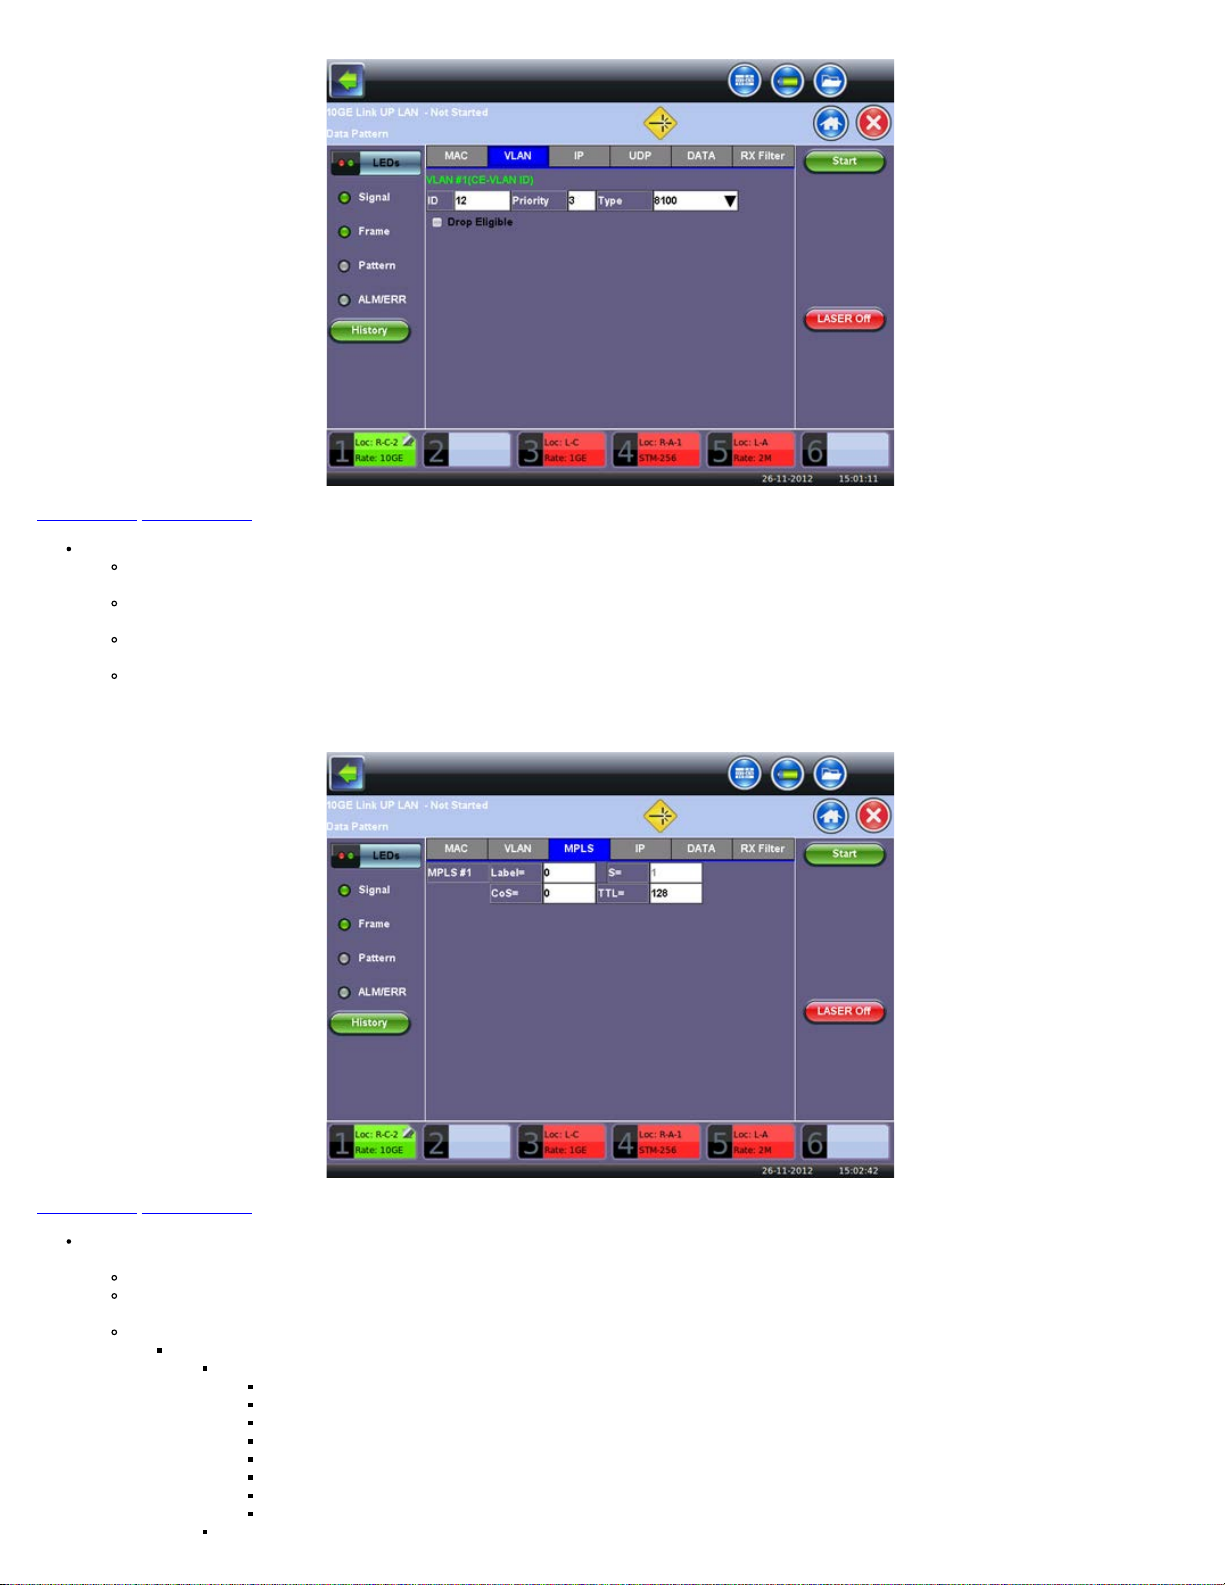
The most common Ethernet Frame format, Type II
Go back to top Go back to TOC
MAC, VLAN, MPLS, IP, and Test Pattern Configurations:
To configure the MAC addresses, IP addresses, VLAN tag(s), MPLS tag(s), and test pattern, tap on the frame image displayed on the screen. This brings up the
configuration screens for all the header fields.
MAC Header Tab:
MAC Source: Use the default source address of the test set or configure a new or different address.
MAC Destination: Configure the destination MAC address of the far -end partner test set or use the ARP or ARP GW keys to determine the MAC address of
the destination IP address (ARP) or the Gateway (ARP GW). Note that a valid IP connection needs to be up to use these functions. Refer to 9.1 IP in the
V300 Common Functions manual for details on IP connection.
Ethernet Type: For Layer 3 & 4 testing, the Ethertype is set to 0800-IP. For Layer 2, it can be typed in.
BERT Setup MAC Layer 2 BERT Setup MAC Layer 3 & 4
Page 42
Go back to top Go back to TOC
UX400 10G e-Manual D07-00-058P RevA00
Page 42 of 209
VLAN Tab: In the VLAN tab the following parameters are configured:
VLAN ID: Configurable in the range 1 to 4094.
VLAN ID is the identification of the VLAN, which is basically used by the standard 802.1Q.
It has 12 bits which allows the identification of 4096 (2^12) VLANs.
Of the 4096 possible VIDs, a VID of 0 is used to identify priority frames and value 4095 (FFF) is reserved.
Maximum possible VLAN configurations are therefore set to 4094.
VLAN Priority: Configurable in the range 0 to 6
Set by the Priority Code Point (PCP), a 3-bit field which refers to the IEEE 802.1p priority.
It indicates the frame priority level from 0 (lowest) to 7 (highest), which can be used to prioritize different classes of traffic (voice, video, data, etc.).
Type: The following selections are possible:
8100 (IEEE 802.1Q tagged frame)
88a8 (IEEE 802.1ad Provider Bridging)
User Defined
Drop Eligible: If enabled, drop eligibility flag will be set.
IEEE 802.1Q VLAN Tag in an Ethernet Frame
BERT Setup
- VLAN Tag configuration
Page 43
Go back to top Go back to TOC
UX400 10G e-Manual D07-00-058P RevA00
Page 43 of 209
MPLS Tab (Only for Layer 3 & 4): In the MPLS tab the following parameters are configured:
MPLS label: Configurable in the range 16 through 1,048,575 (labels 0 to 15 are reserved).
Note: Composed of 20 bits which allows for the creation of over one million labels.
CoS: Configurable in the range 0 to 6.
Note: This field is three bits in length and maps directly to IP Precedence TOS bits to provide Class of Service (COS).
S-bit: Configurable 0 or 1.
Note: The S field is one bit in length and is used for stacking labels. This is important as it is used to indicate the last label in the label stack.
TTL: Configurable in the range 0 to 255. The default setting is 128 hops.
Note: Used to decrement the time- to-live counter.
BERT Setup - MPLS configuration (Layer 3 & 4)
Go back to top Go back to TOC
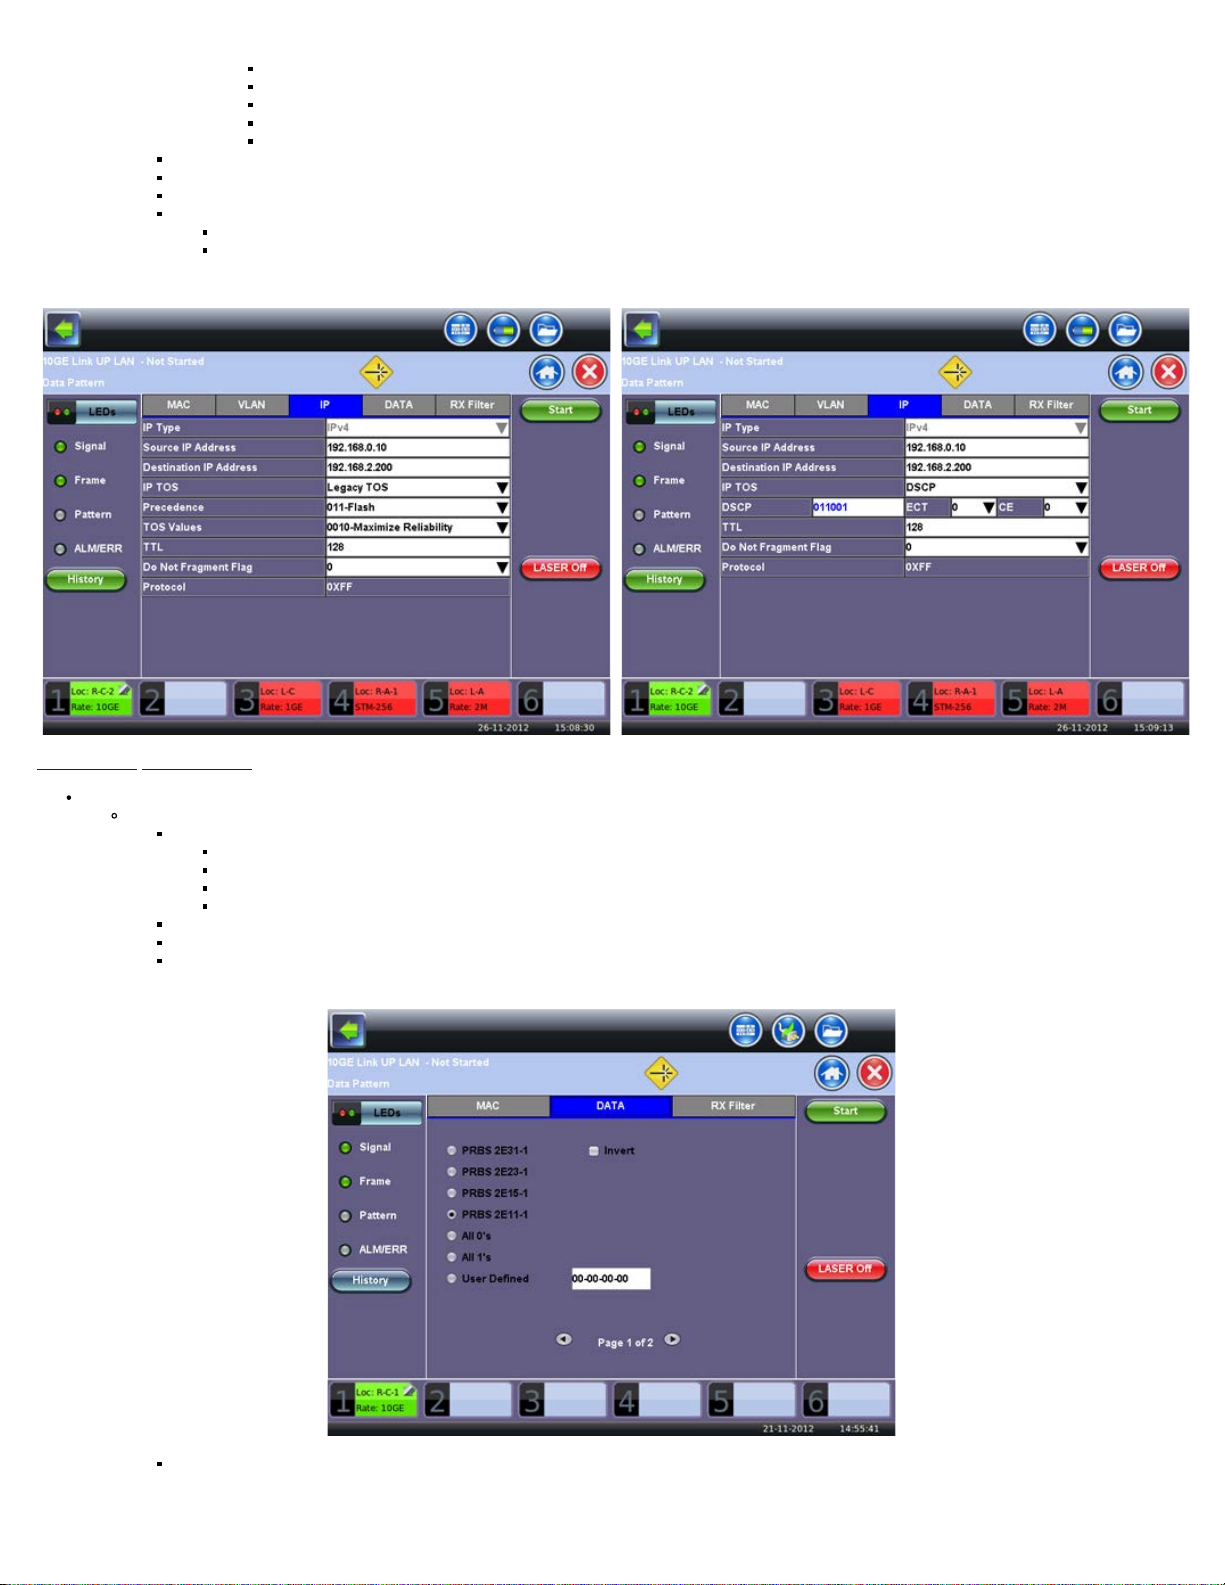
IP Tab (only for Layer 3 & 4): In the IP tab the user must configure the destination IP address and source address. The user may also configure the following IP
header fields:
IP Type: IPv4
IP Source and IP Destination: For IP Source, if the IP connection is up, refer to section 9.1 IP in the V300 Common Functions manual . The source
address is fixed to the IP address from the IP setup menu.
IP TOS (for Quality of Service testing): Legacy TOS or DSCP
Legacy TOS : The first three bits of the IP TOS field can be edited:
Precedence:
000 - Routine
001 - Priority
010 - Immediate
011 - Flash
100 - Flash Override
101 - Critical
110 - Internetwork Control
111 - Network Control
TOS Values:
Page 44
1000 - Minimize Delay
0100 - Maximize Throughput
UX400 10G e-Manual D07-00-058P RevA00
Page 44 of 209
0010 - Maximize Reliability
001 - Minimize Monetary Cost
DSCP (Differentiated Services Code Point): The first six bits of the IP TOS can be edited to provide more granular service classification.
Time To Live (TTL): Configurable in the range 0 to 255.
Do Not Fragment Flag: 0 or 1
Protocol field:
BERT Setup - IP Address Setting Layer 3 (IPv4 Legacy TOS) BERT Setup - IP Address Setting Layer 3 (IPv4 DSCP)
0000 - Normal Service
Layer 3: Preset to OXFF,
Layer 4: UDP-0x11 or TCP-0x06 (Defined on the Header Settings main screen)
Go back to top Go back to TOC
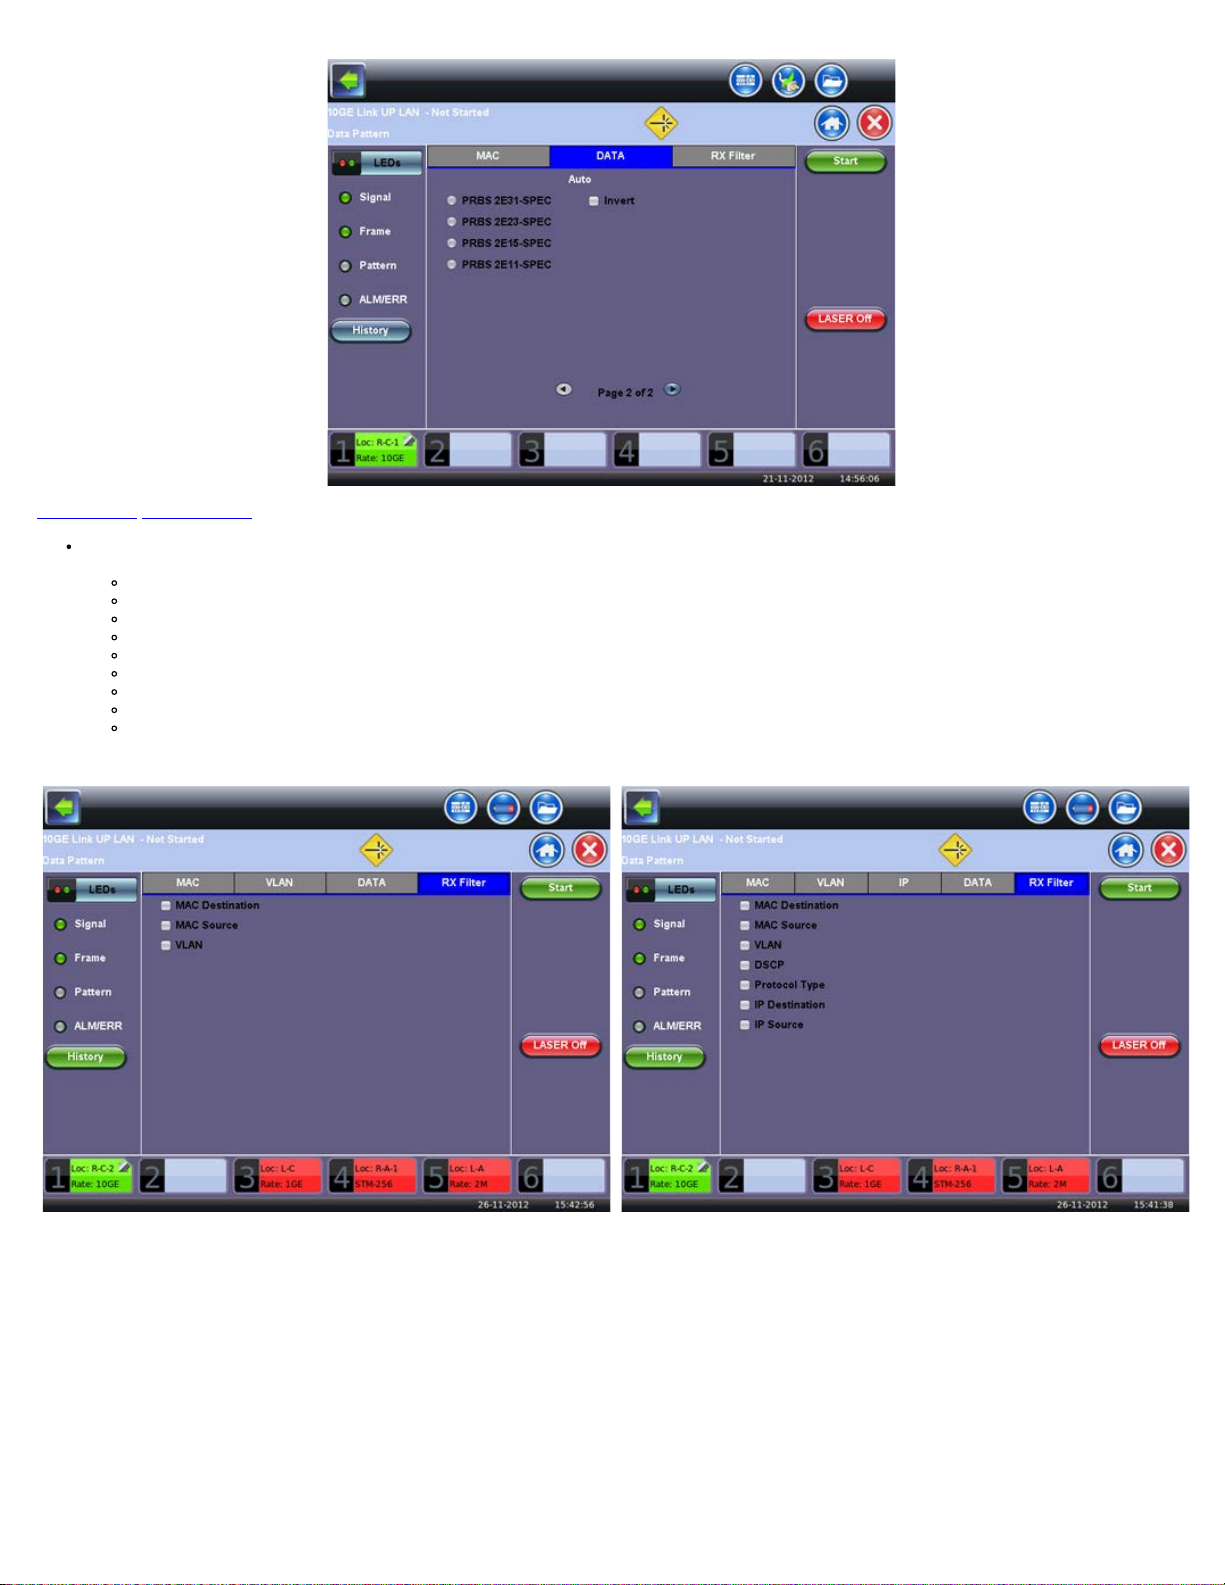
Data Tab: User selects a test pattern that will be encapsulated in the Ethernet frame payload (for framed mode).
Layer 2, 3, & 4 test patterns
PRBS:
2E31 -1 (147 483 647-bit pattern used for special measurement tasks, [e.g., delay measurements at higher bit rates])
2E23 -1 (8 388 607 bit pattern primarily intended for error and jitter measurements at bit rates of 34 368 and 139 264 kbps)
2E15 -1 (32 767 bit pattern primarily intended for error and jitter measurements at bit rates of 1544, 2048, 6312, 8448, 32 064 and 44 736 kbps)
2E11 -1 (2047 bit pattern primarily intended for error and jitter measurements on circuits operating at bit rates of 64 kbps and N x 64 kbps)
Fixed: All 0s or All 1s
User Defined pattern: Length depends on size of frame
Inversion: Normal or inverted
BERT Setup - Data selection - PRBS Patterns (Page 1)
Auto (Special Patterns): For special patterns, the most significant bit of the test pattern is populated first into the payload frame, as opposed to non-
special patterns, in which the least significant bit is populated first.
BERT Setup - Data selection - Special Patterns (Page 2)
Page 45
Go back to top Go back to TOC
UX400 10G e-Manual D07-00-058P RevA00
Page 45 of 209
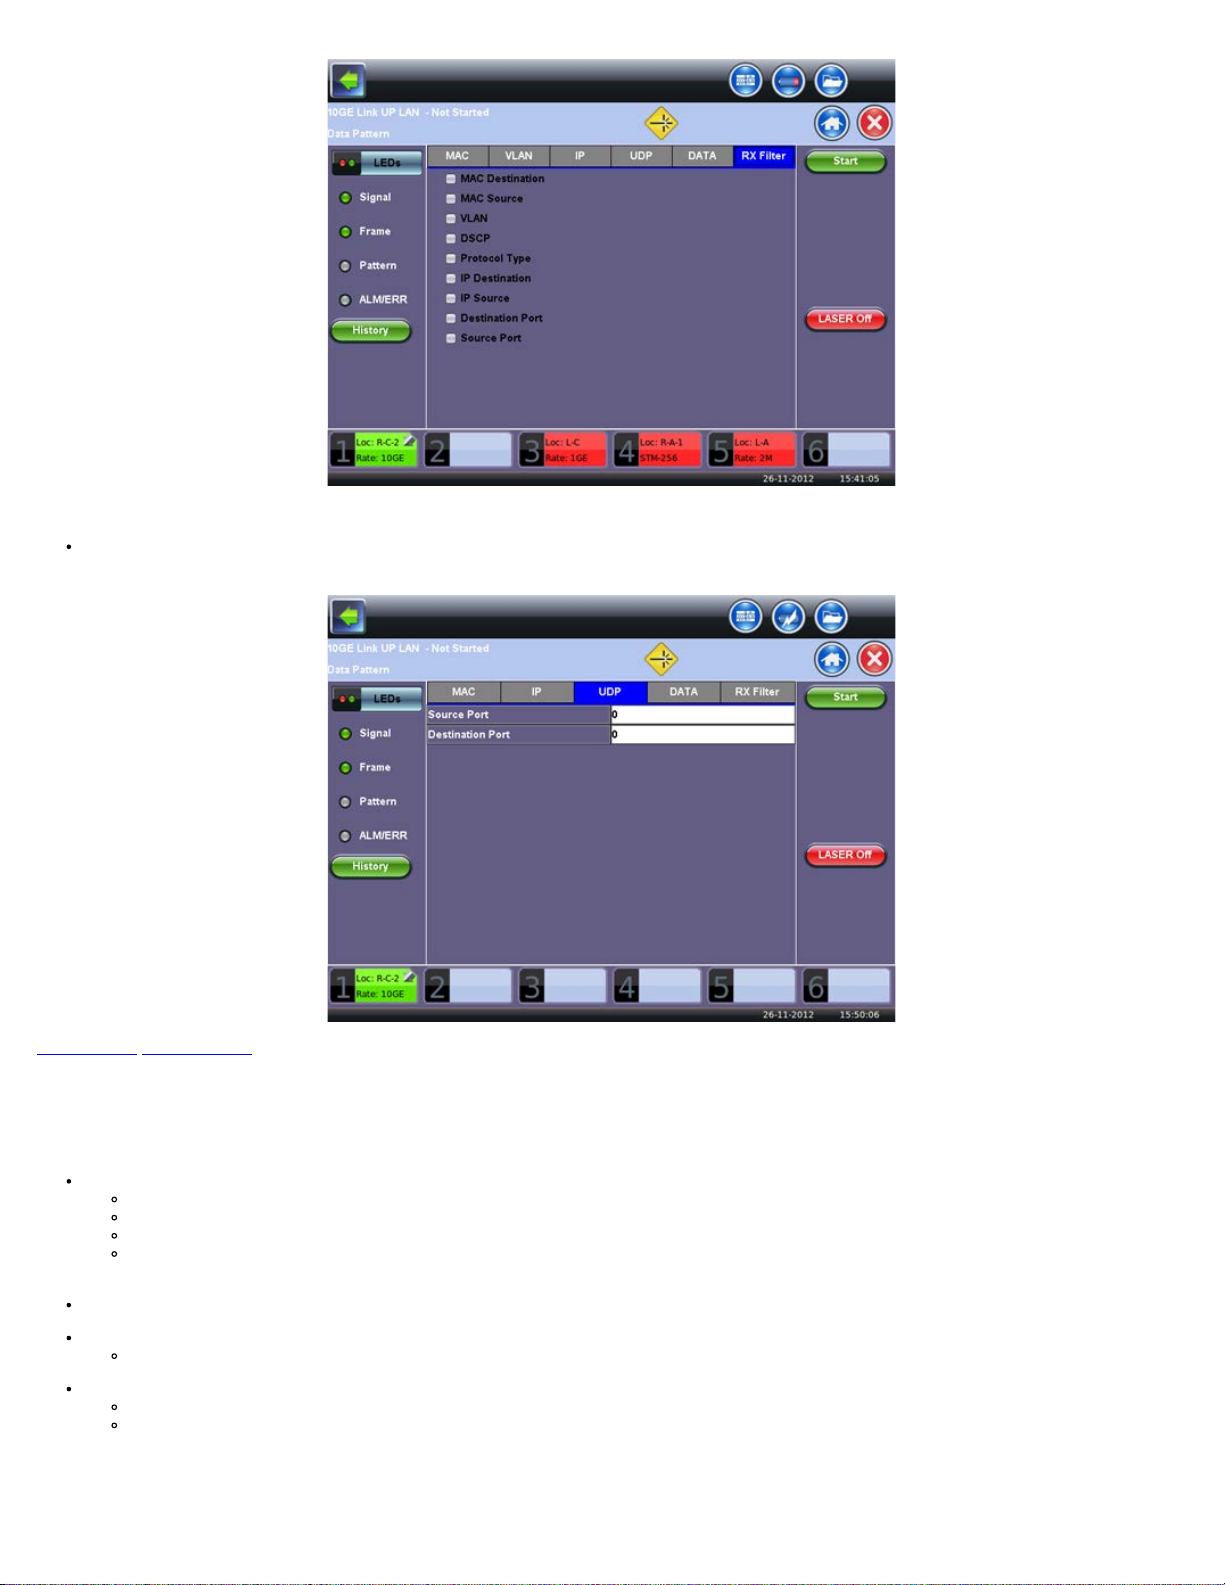
RX Filter Tab: Allows the user to filter incoming streams. When checked, the incoming traffic flows not matching these criteria will not be considered for these
results.
MAC Destination address
MAC Source address
VLAN
DSCP (for Layer 3 & 4)
Protocol Type (for Layer 3 & 4)
IP Destination (for Layer 3 & 4)
IP Source (for Layer 3 & 4)
Destination Port (for Layer 4)
Source Port (for Layer 4)
BERT Setup RX Filter (Layer 2) BERT Setup RX Filter (Layer 3)
BERT Setup
RX Filter (Layer 4)
Page 46
UX400 10G e-Manual D07-00-058P RevA00
Page 46 of 209
UDP/TCP (Layer 4 only): Input Source Port and Destination Port.
BERT Setup - UDP/TCP (Layer 4)
Go back to top Go back to TOC
6.2.1.2 Traffic Settings
Traffic tab:
The user configures the traffic profile for the stream, including traffic flow, frame size, frame type, and transmit rate.
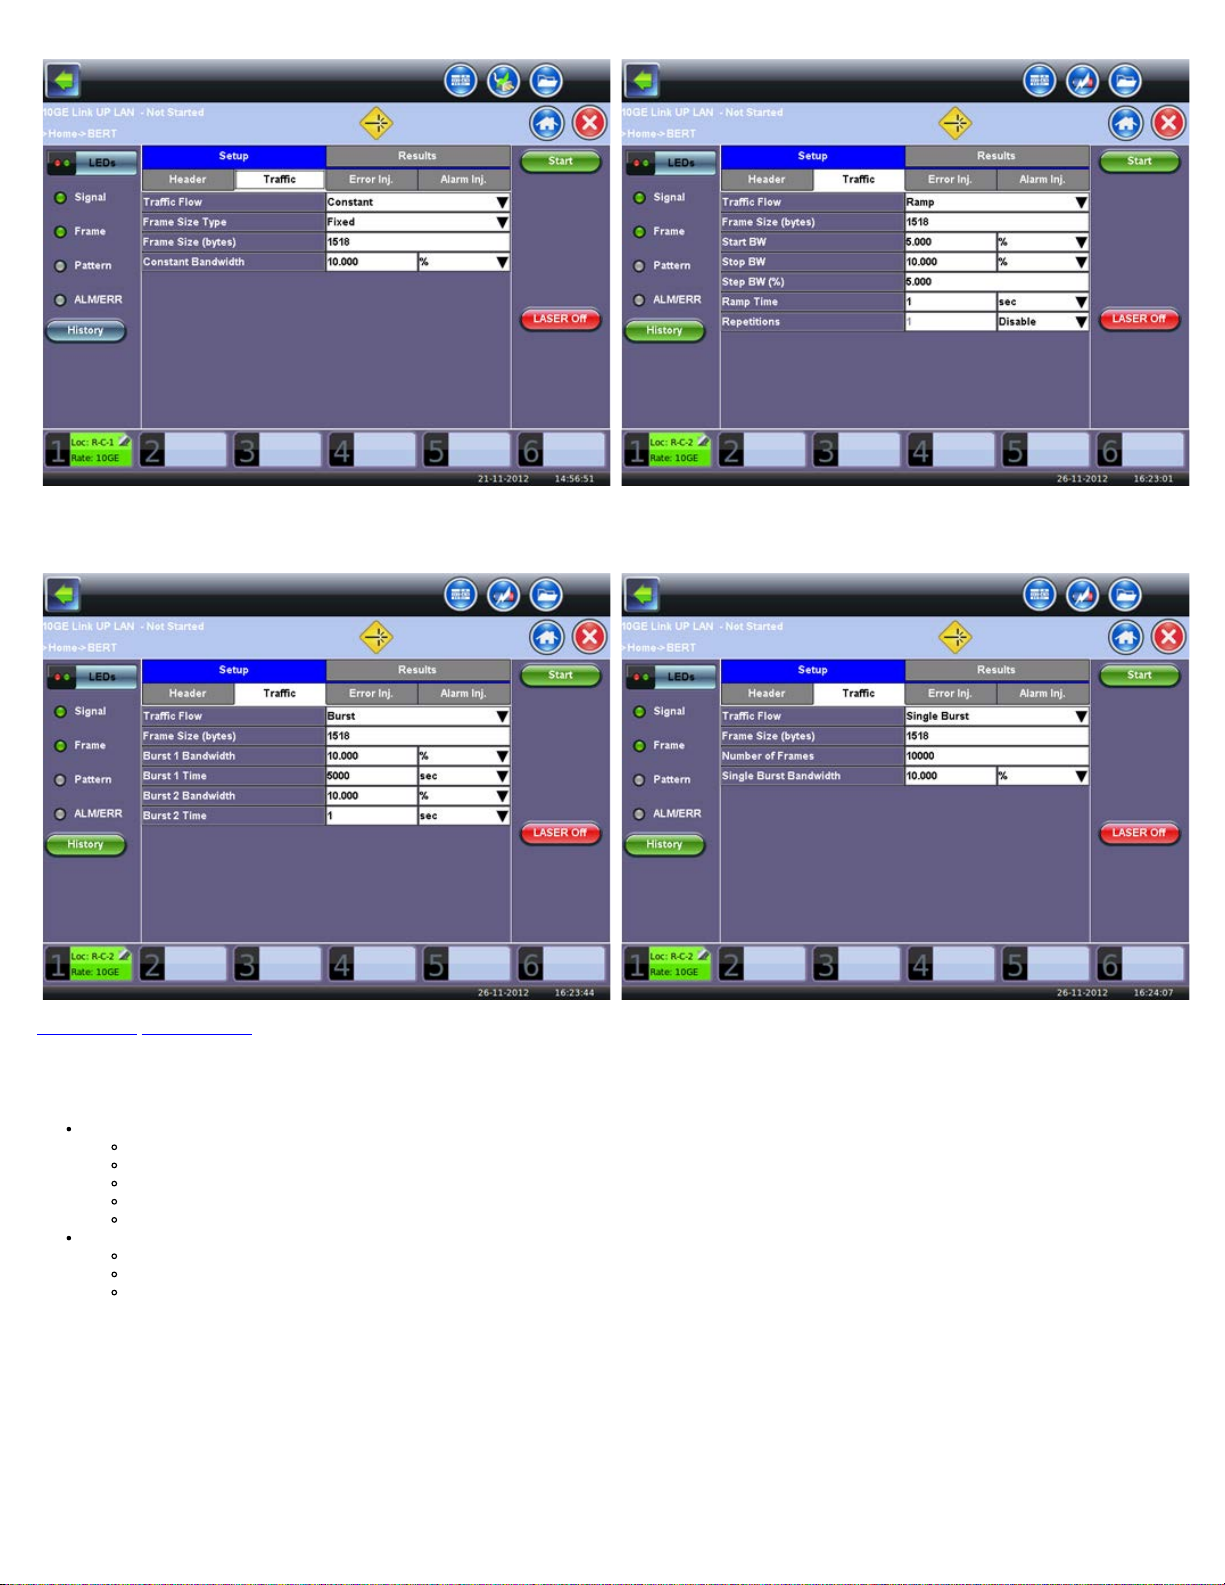
Traffic Flow: Select from the following traffic flows:
Constant: The selected frame is transmitted continuously according to the selected bandwidth %.
Ramp: The selected frame is transmitted at maximum bandwidth according to the selected duty cycle and burst period.
Burst: The selected frame is transmitted in a staircase profile according to user selectable step time, number of steps, and maximum bandwidth.
Single Burst: Configure the number of frames to be transmitted in the burst along with the bandwidth. For example, if 100000 frames are transmitted at
12.5% of bandwidth, on a 1Gbps line, 100000 frames will transmit at a rate of 125Mbps and then the burst will stop.
Frame Size Type: Fixed or Uniform min and max frame length values. Uniform traffic is traffic generated with a uniform distribution of frame lengths.
Frame Size (bytes):
Frame sizes can be from 64 bytes to 1518 bytes, in addition to jumbo frames up to 10000 bytes
BW (Transmit Bandwidth): Configure the transmit rate for the test
When traffic flow is equal to Burst, two burst bandwidths are configured with burst time
When traffic flow is equal to Ramp, starting and an ending bandwidth are configured along with the bandwidth step size and duration
BERT Setup - Constant Traffic BERT Setup - Ramp Traffic
Page 47
UX400 10G e-Manual D07-00-058P RevA00
Page 47 of 209
BERT Setup
Go back to top Go back to TOC
6.2.1.3 Error Injection
Error injection can be performed during testing. The error type and injection rate are configured in the Error Injection tab.
Error type:
CRC
PCS Errored Block
Bit
IP Checksum (Layer 3 & 4 only)
TCP/UDP Checksum (Layer 4 only)
Injection Flow: The error injection flow determines how the selected errors will be injected.
Single
Count: Configures the error count via a numeric keypad
Rate: 1E- 3, 5E-4, 2E- 4, 1E-4, 5E- 5, 2E-5, 1E- 5, 5E-6, 2E- 6, 1E-6, 5E- 7, 2E-7, 1E- 7, 5E-8, 2E- 8, 1E-8, 5E- 9, 2E-9, 1E- 9 or User Defined. The user may
configure the desired rate using the on screen keypad.
- Burst Traffic BERT Setup - Single Burst
BERT Setup - Error Injection Keypad
Page 48
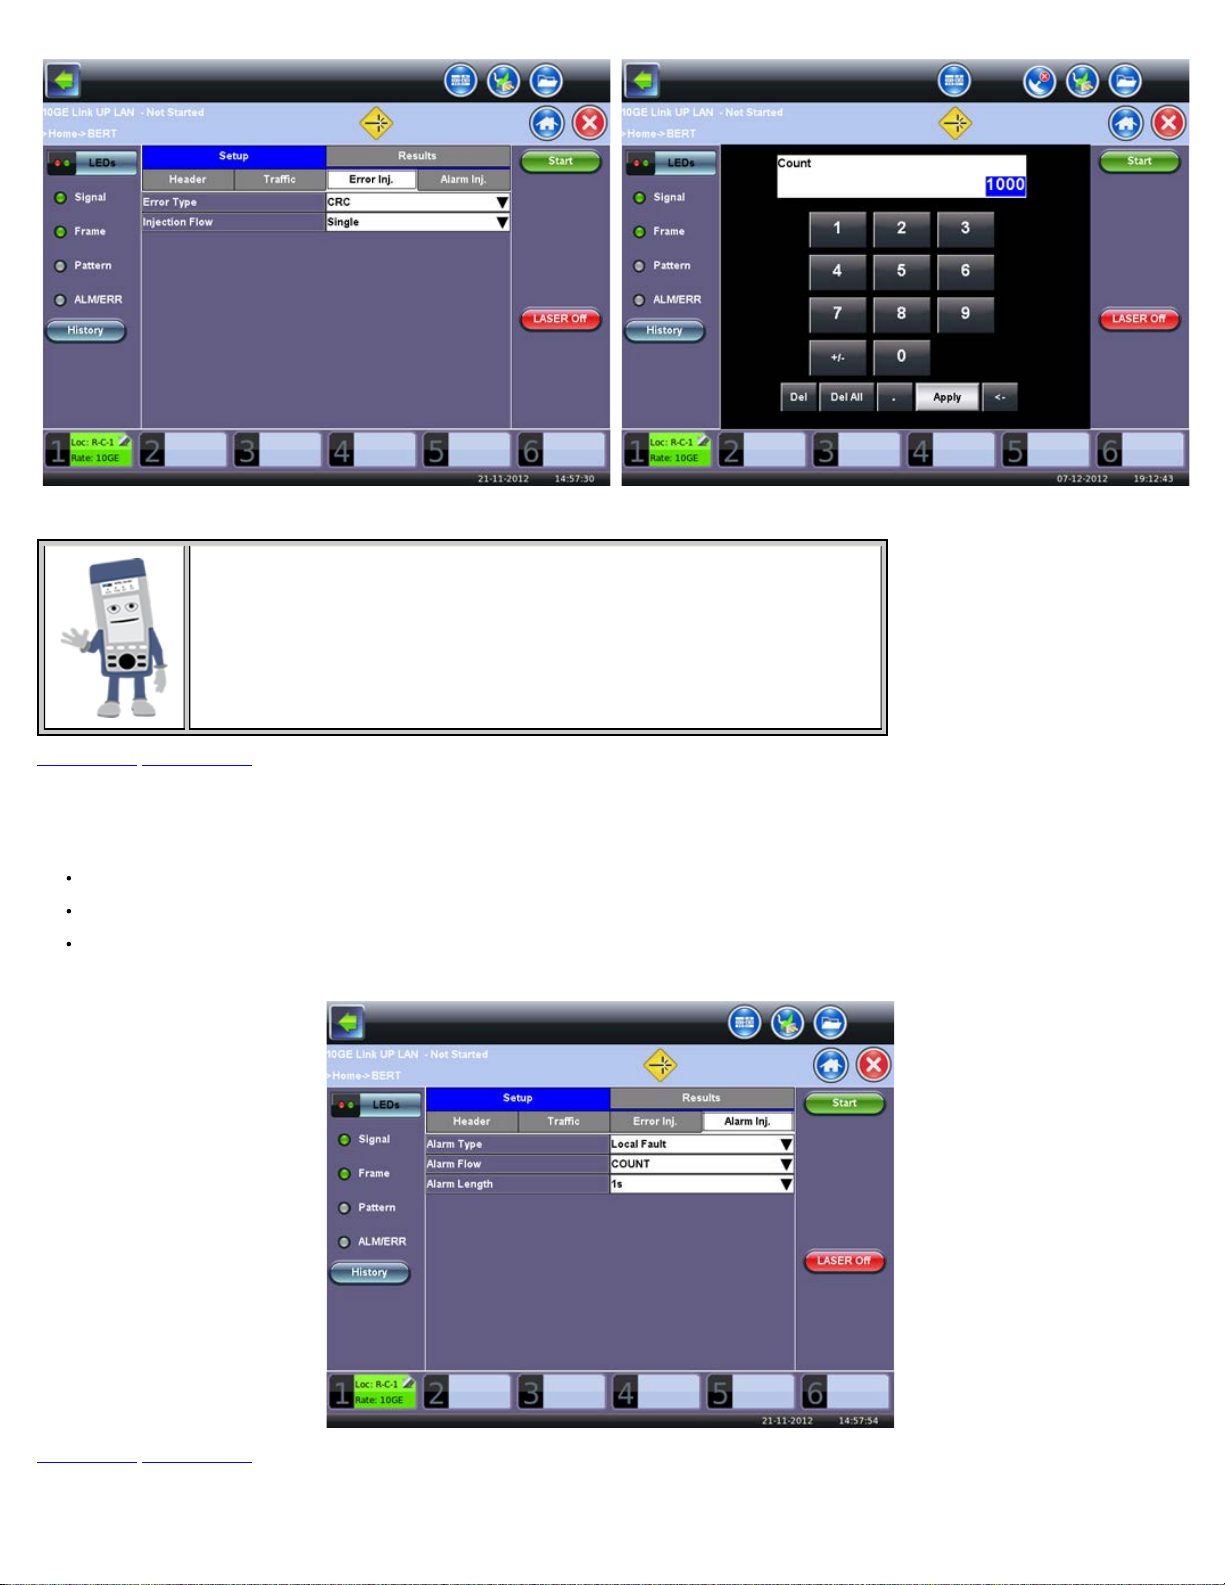
Error Injection
UX400 10G e-Manual D07-00-058P RevA00
Page 48 of 209
After pressing Start, error injection can be enabled by pressing the Error Inj. button on the right
side of the screen.
Go back to top Go back to TOC
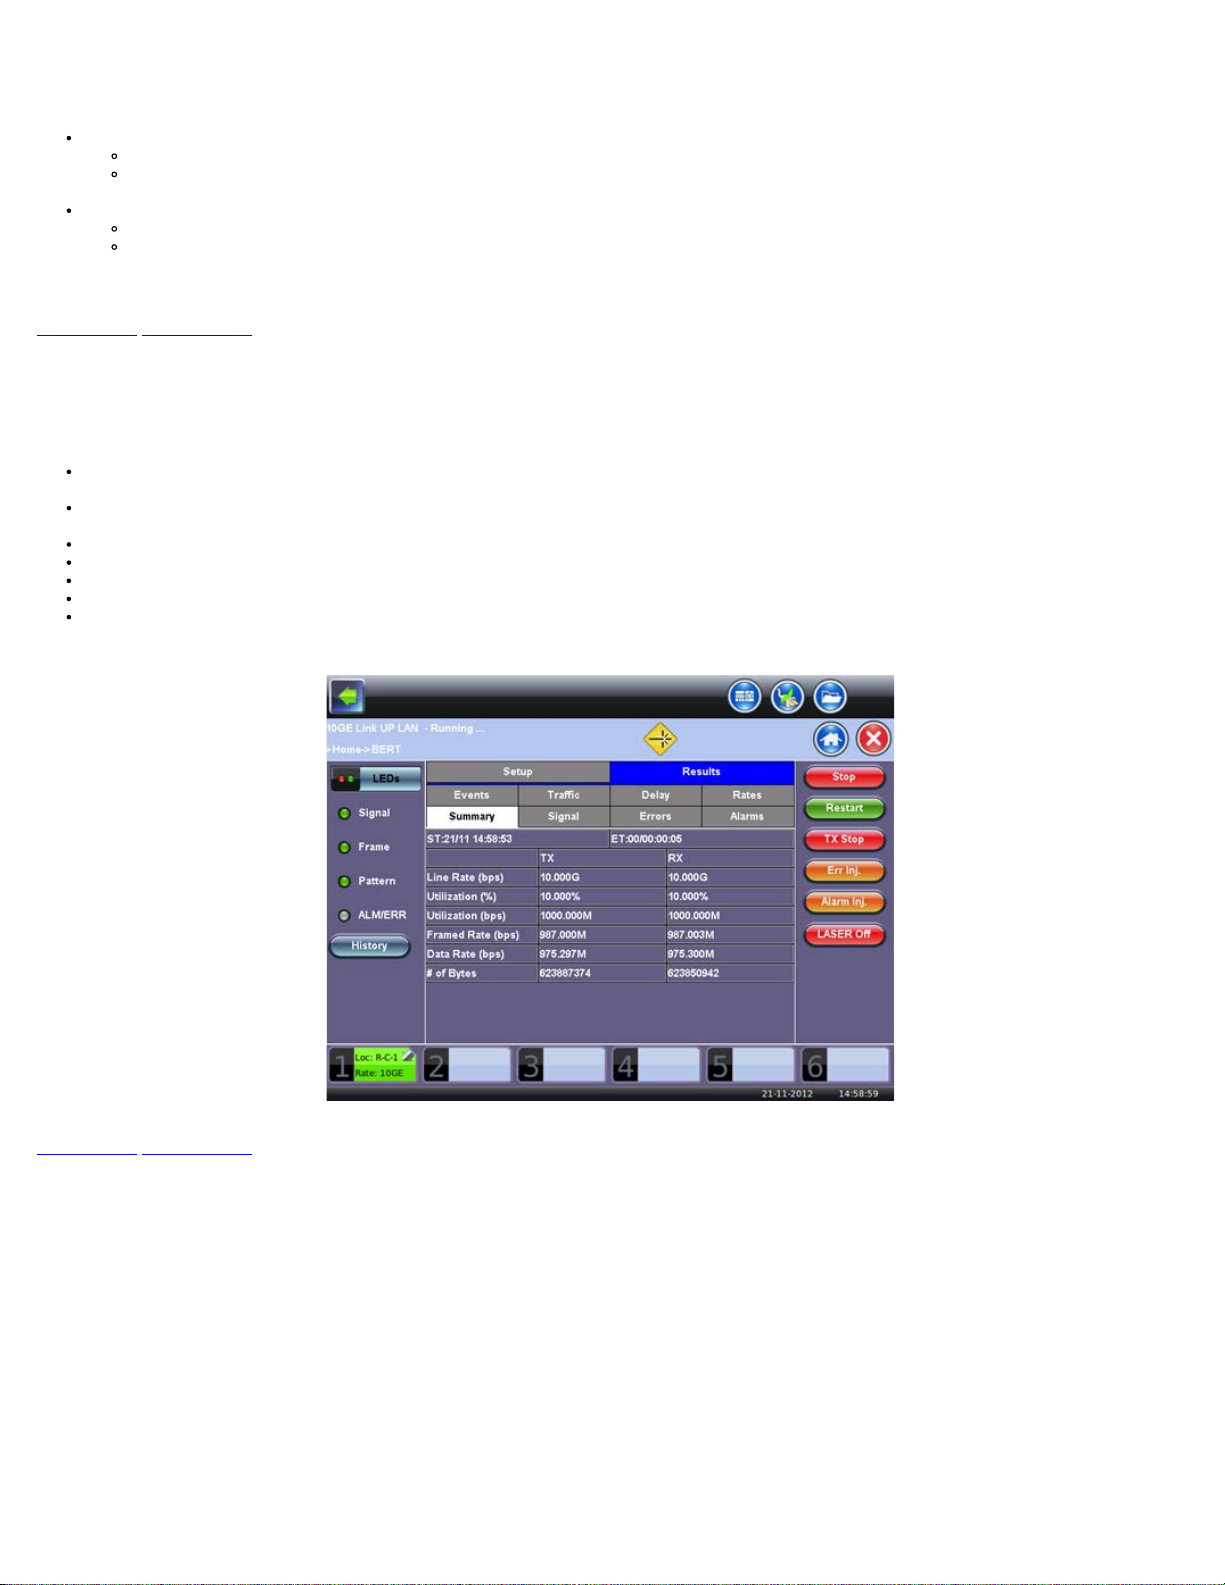
6.2.1.4 Alarm Injection Settings
Alarm injection can be performed during a test. The type of alarms and alarm injection are configured in the Alarm Injection tab. Once the test is running, alarm injection can
be performed by pressing the Alarm Inject button on the right side of the screen.
Alarm Type: Local Fault, Remote Fault, PCS-HI-BER, PCS-LOBL
Alarm Flow: The alarm flow determines how the selected alarms will be injected. A specific Count or Conitnue (continuous) can be selected.
Alarm Length: 1s, 10s, or 100s.
BERT Setup - Alarm Injection
Go back to top Go back to TOC
6.2.1.5 Starting/Stopping a BERT
Page 49
Once all configurations have been made, the user can start the BERT test (press the Start icon on the top right section of the screen). The following are three scenarios of
how to prepare and start the unit for BERT testing.
UX400 10G e-Manual D07-00-058P RevA00
Page 49 of 209
Note: If testing on the fiber ports, make sure the LASER is turned on before starting the test.
End-to-End Testing
Connect the UX400 to another unit that supports BERT testing.
After configuring test settings on both units, start the tests.
Far- End Unit in Manual Loopback Mode
If the far-end unit is already in a manual loopback mode, do not send a loop up command since it is not necessary.
Once the correct control settings are configured, the user can start the test.
The selected tests will run automatically. When all the tests are complete the test will stop automatically. If the BERT test suite needs to be stopped before they are done,
then simply press the Stop button, located in the actions drop-down menu. The status of each selected test can be seen in the Results tab.
Go back to top Go back to TOC
6.3.2 BERT Results
6.3.2.1 Summary
Summary tab: The following results including the Start (ST) and Elapsed (ET) times are displayed:
Line Rate (Mbps) : Negotiated rate of the interface (10M, 100M, or 1000M). This value is always fixed since it depends on the maximum capacity of the link under
test, hence the test interface that is configured.
Utilization: % of Line Rate. For example, if we transmit 100Mbps on a 1Gbps interface then the utilization value is 10% (or 100Mbps) of the total link capacity (or
Line Rate).
Utilization (bps)
Framed Rate: (Payload + MAC/IP Header + VLAN Tag + Type/Length + CRC) / (Payload + Total Overhead) * Line Rate % (in Mbps).
Data Rate: Payload / (Payload + Total Overhead) * Line Rate %.
Number of bytes
Pause Frames: Total number of transmitted and received ethernet pause flow-control frames.
BERT Results - Summary
Go back to top Go back to TOC
6.3.2.2 Signal
The Signal tab (fiber ports only) displays the optical level measured by the SFP transceiver.
BERT Results - Signal (Page 1) BERT Results - Signal (Page 2)
Page 50
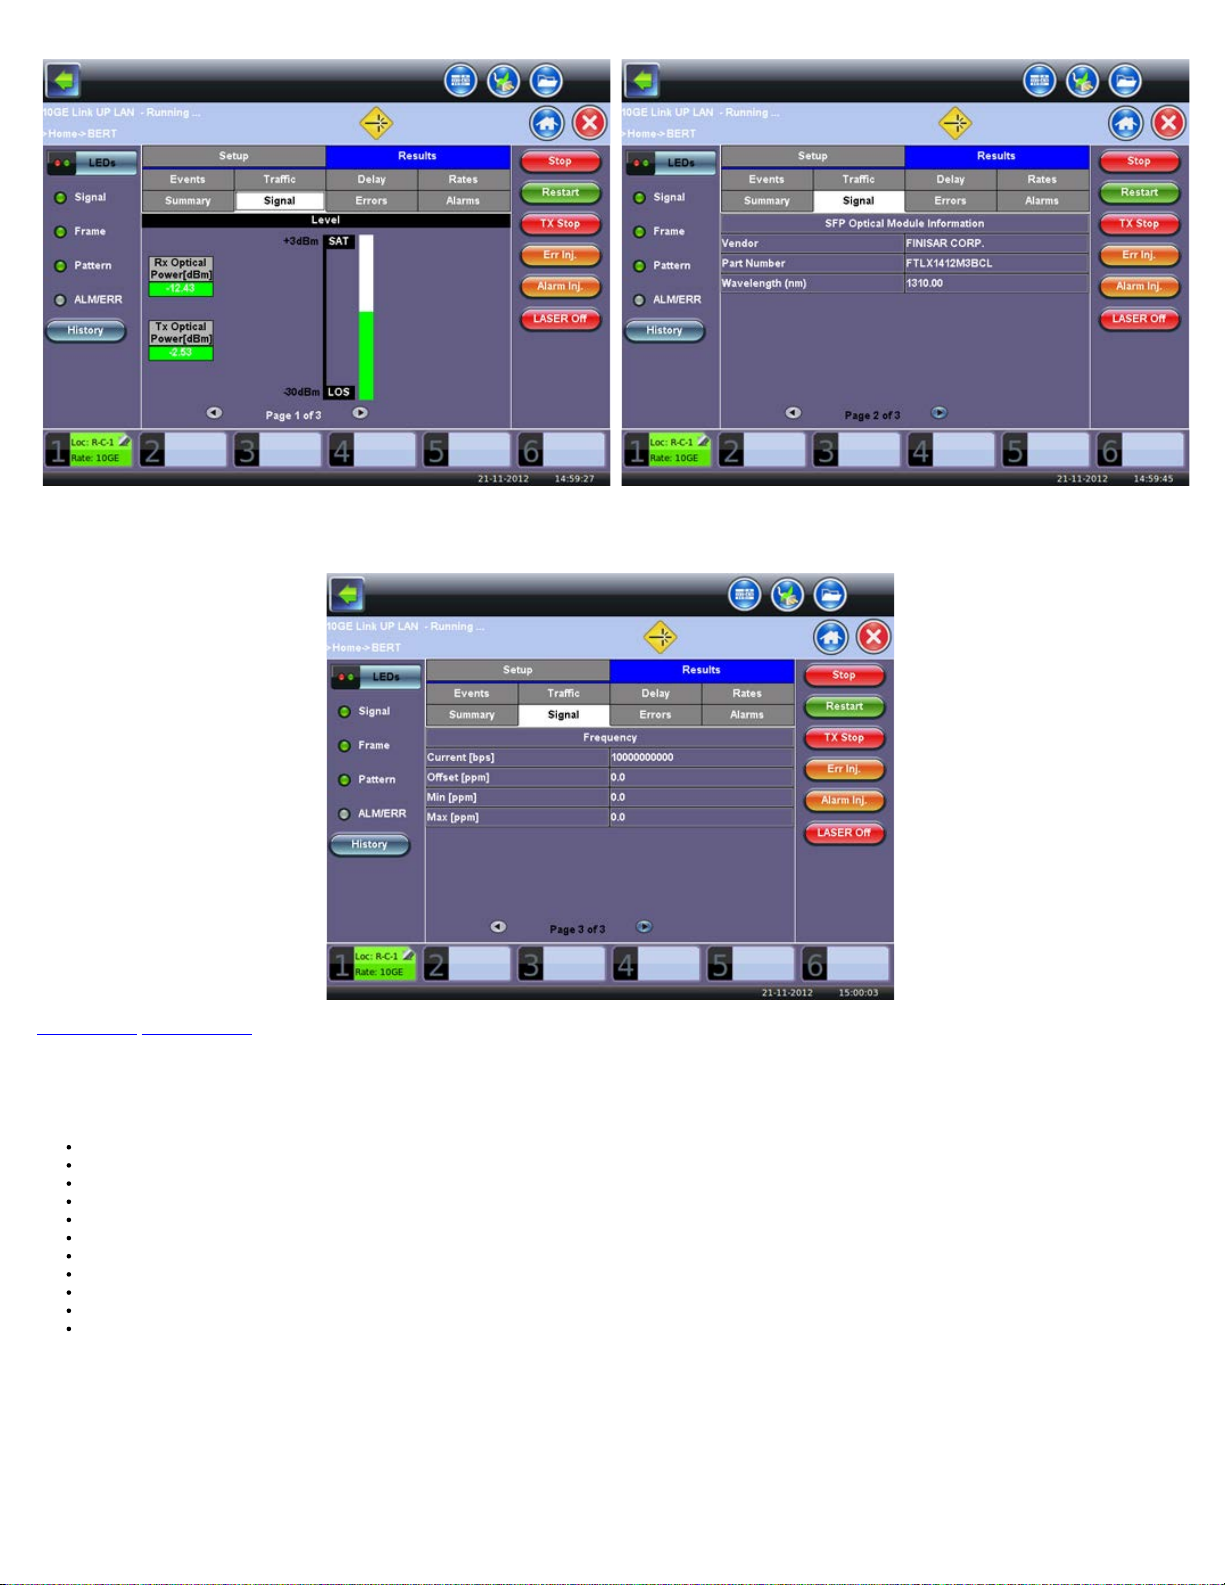
BERT Results - Signal (Page 3)
UX400 10G e-Manual D07-00-058P RevA00
Page 50 of 209
Go back to top Go back to TOC
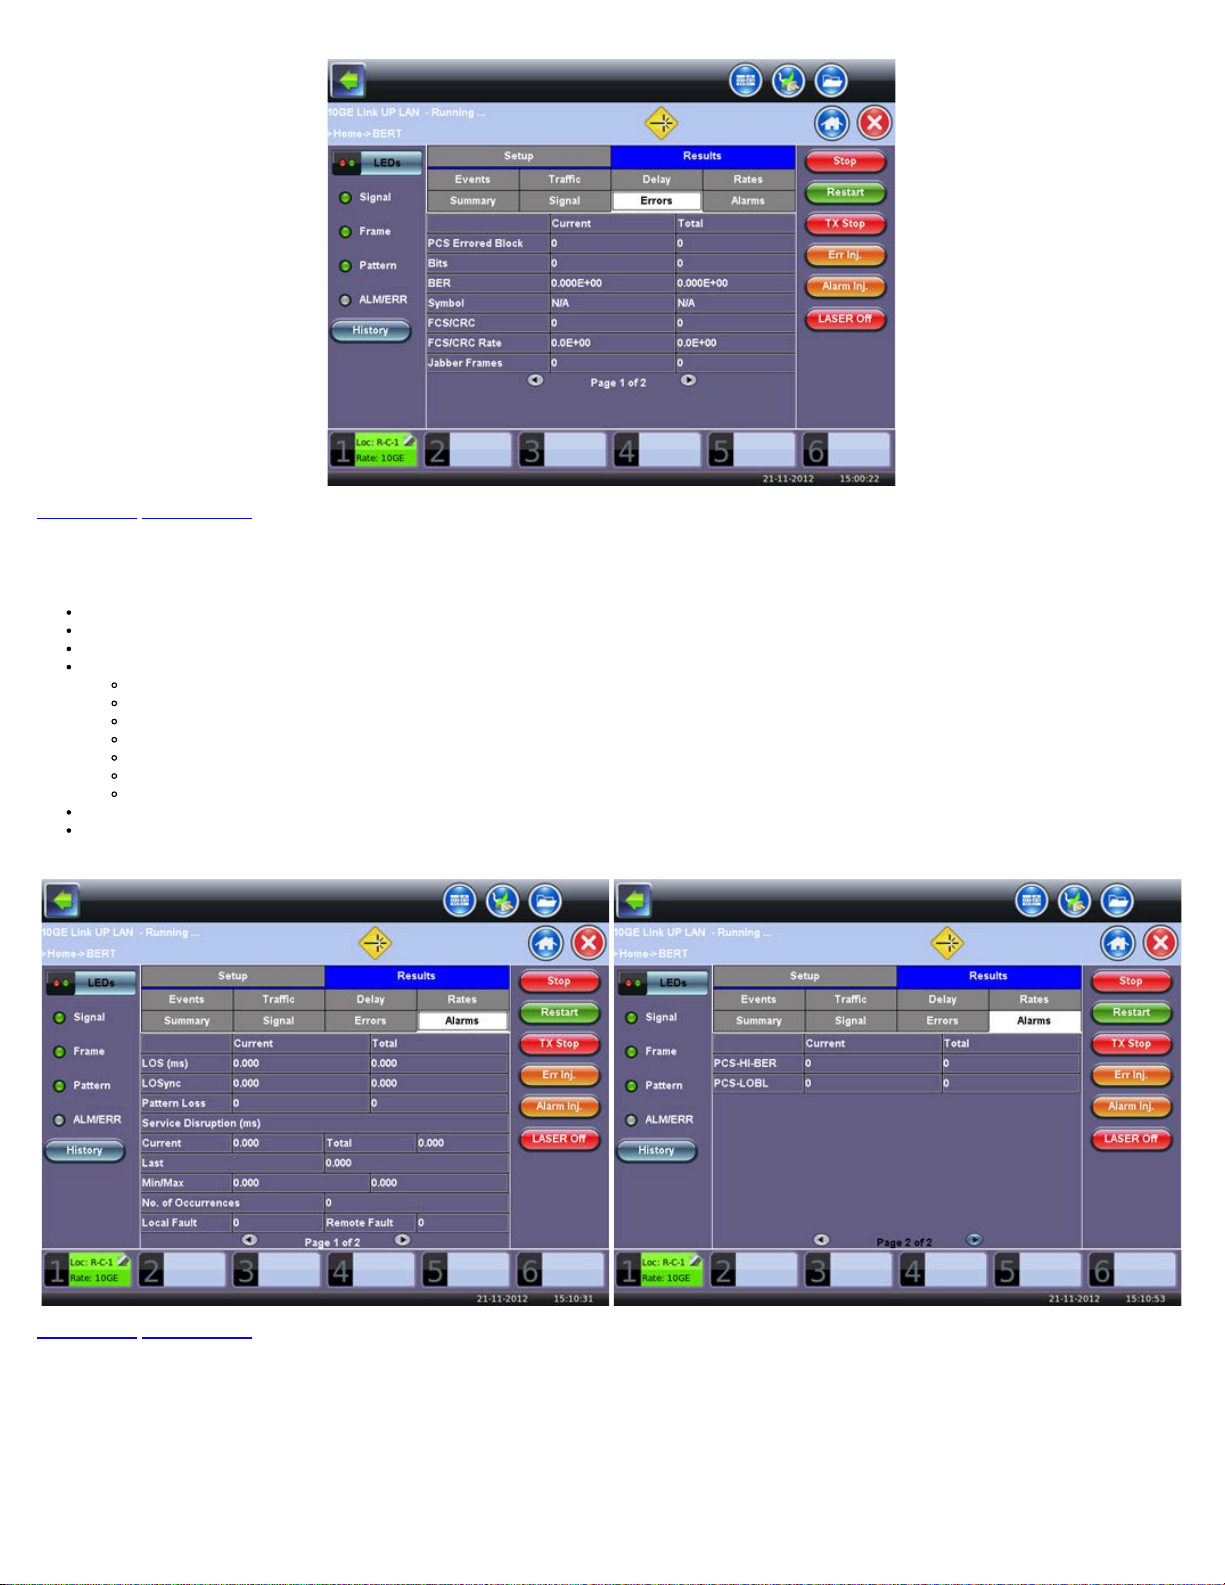
6.2.2.2 Errors
Errors tab: The following errors (Current and Total) are displayed:
PCS Errored Block
Bits: Indicates errors related to test pattern (Bit Error or LSS [Pattern Loss])
BER: Bit Error Ratio
Symbol: Declared when an invalid code-group in the transmission code is detected
FCS/CRC: Number of received frames with an invalid FCS
IP Checksum (Layer 3 & 4 only)
IP Checksum Rate (Layer 3 & 4 only)
TCP/UDP Checksum (Layer 4 only)
TCP/UDP Checksum Rate (Layer 4 only)
Jabber frames: Number of received frames larger than 1518 bytes containing an invalid FCS
Runt frames: Number of received frames smaller than 64 bytes containing an invalid FCS
BERT Results - Errors
Page 51
Go back to top Go back to TOC
UX400 10G e-Manual D07-00-058P RevA00
Page 51 of 209
6.2.2.3 Alarms
Alarms tab: The following Alarms (Current and Total) are displayed:
LOS (ms): Loss of Signal
LOSync: Loss synchronization
Pattern Loss: Indicates errors related to test pattern
Service disruption (ms) associated with loss of signal:
Current: Duration of the current service disruption
Total: Total accumulated duration of the service disruptions
Last
Min/Max: Minimum and maximum duration of the service disruption events
No. of Occurrences: Counter of service disruption events
Local Fault
Remote Fault
PCS-HI-BER: High bit error rate of sync header
PCS-LOBL: Loss of block lock
BERT Results - Alarms (Page 1) BERT Results - Alarms (Page 2)
Go back to top Go back to TOC
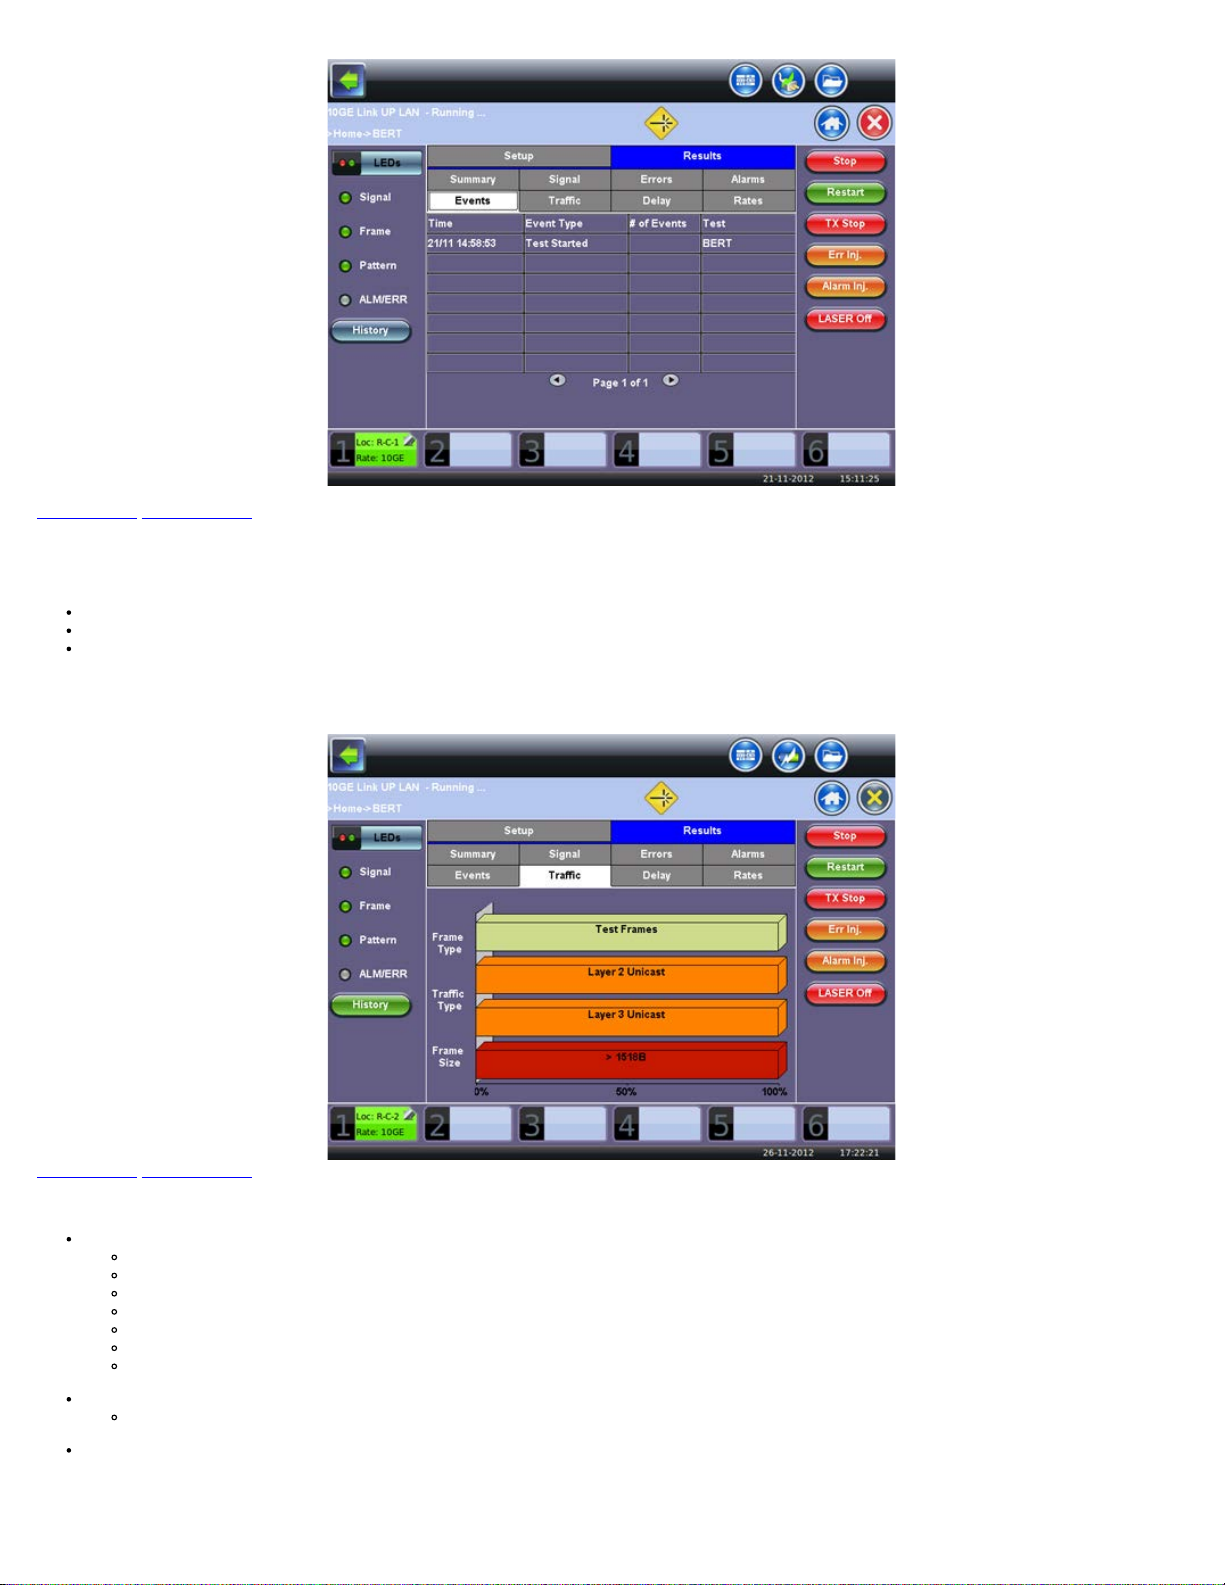
6.2.2.5 Events
Events tab: A time stamped record or log of anomalies, alarms, test status (start/stop) and test application are displayed.
BERT Results - Events
Page 52
Go back to top Go back to TOC
UX400 10G e-Manual D07-00-058P RevA00
Page 52 of 209
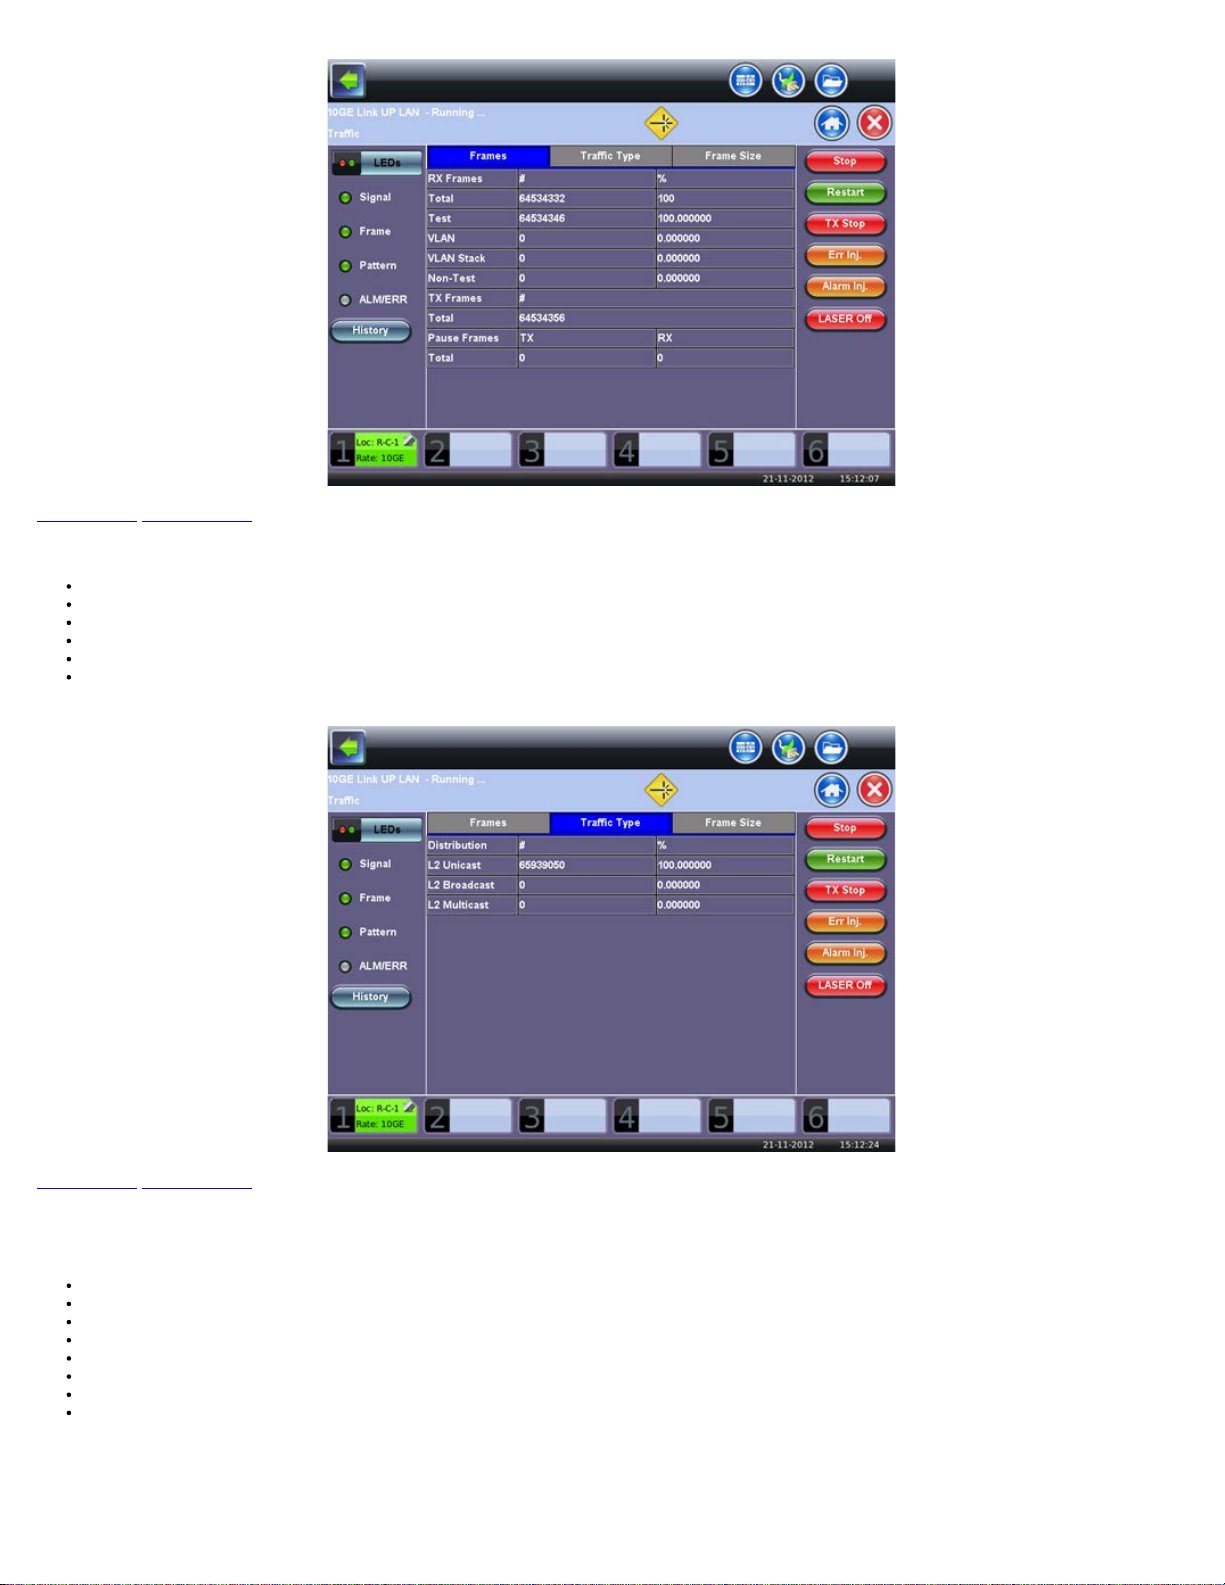
6.2.2.6 Traffic
Traffic tab: The following Traffic statistics are displayed:
Frame type: Test and non-test frames
Traffic type: Layer 2 and Layer 3 Unicast, Broadcast, and Multicast frame percentage
Frame size distribution
Tap on the graph for detailed screens.
BERT Results - Traffic
Go back to top Go back to TOC
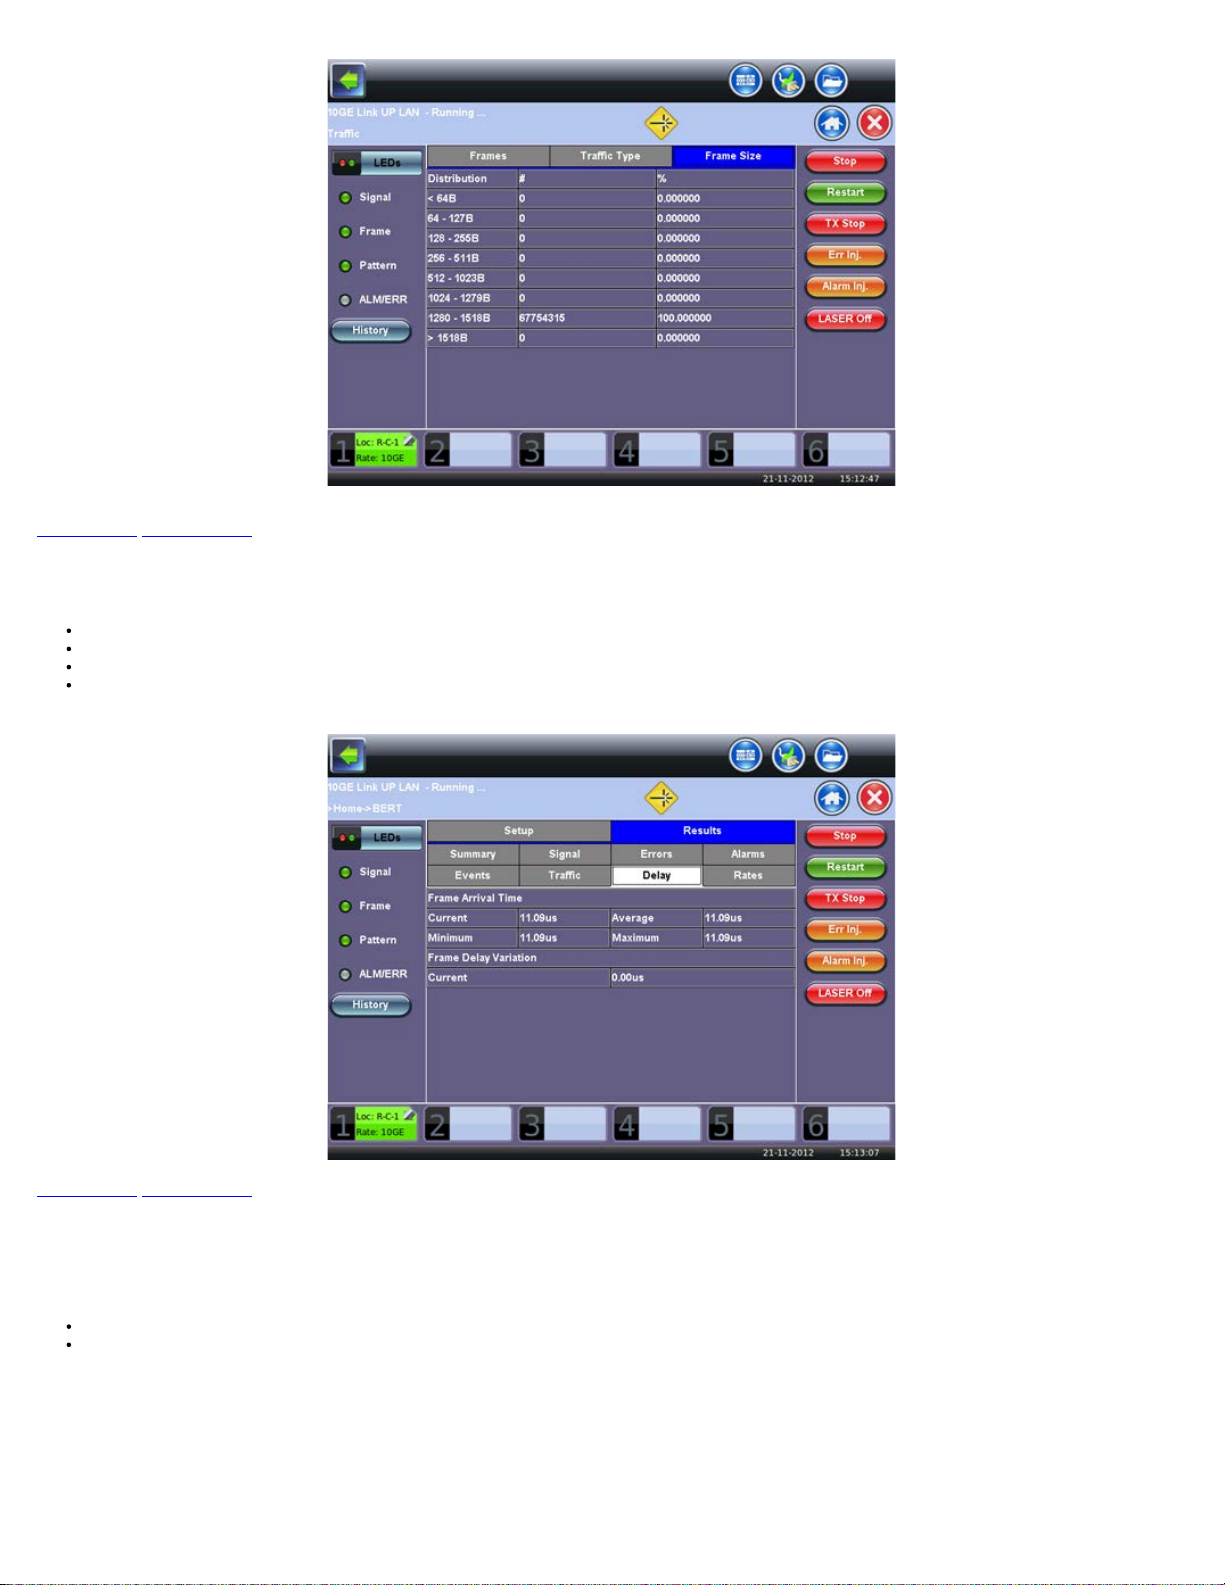
Frames: The following Frame distribution statistics are displayed in Count (#) and Percentage (%):
Received (RX) frames:
Total frames
Test frames
VLAN tagged frames
VLAN stacked frames
MPLS (Layer 3 and 4 only)
MPLS Stack (Layer 3 and 4 only)
Non-test frames
Transmitted (TX) frames:
Total frame - Total # frames transmitted
Pause frames: Total number of transmitted and received Ethernet pause flow-control frames
BERT Results - Frames
Page 53
Go back to top Go back to TOC
UX400 10G e-Manual D07-00-058P RevA00
Page 53 of 209
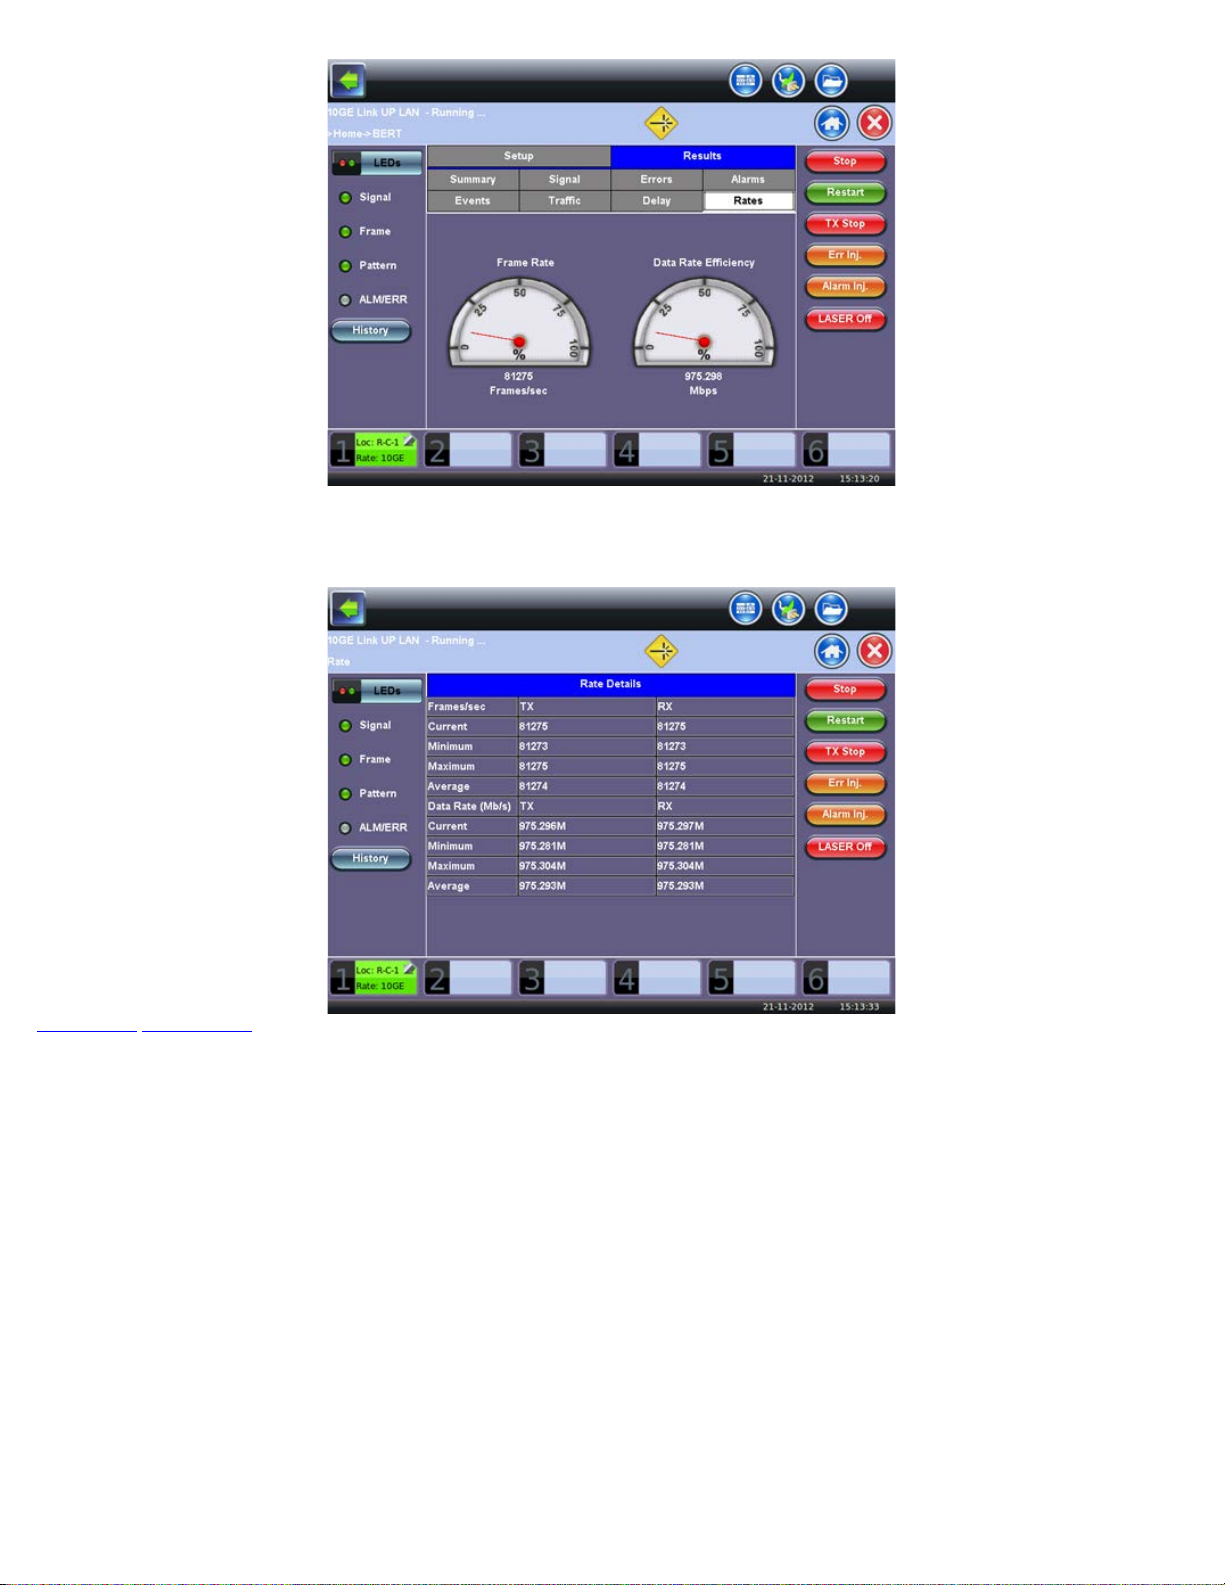
Traffic Type: The following Traffic distribution statistics are displayed in Count (#) and Percentage (%):
Layer 2 Unicast frames: Number of Unicast frames received without FCS errors.
Layer 2 Broadcast frames: Number of Broadcast frames received without FCS errors. Broadcast frames have a MAC address equal to FF- FF-FF-FF-FF-FF.
Layer 2 Multicast frames: Number of Multicast frames received without FCS errors.
Layer 3 Unicast (For Layer 3 & 4)
Layer 3 Broadcast (For Layer 3 & 4)
Layer 3 Multicast (For Layer 3 & 4)
BERT Results - Traffic Type
Go back to top Go back to TOC
Frame Size: The following Frame distribution statistics are displayed in Count (#) and Percentage (%):
64 bytes frames
64-127 byte frames
128-255 byte frames
256-511 byte frames
512-1023 byte frames
1024-1279 byte frames
1280-1518 byte frames
> 1518 byte frames - Jumbo frames
BERT Results - Frame Size
Page 54
Go back to top Go back to TOC
UX400 10G e-Manual D07-00-058P RevA00
Page 54 of 209
6.2.2.7 Delay
Delay measures the interpacket gap, start of the frame, and preamble duration. Frame arrival statistics are displayed in tabular format:
Current
Minimum
Maximum
Variation (Current) - Interframe delay variation
BERT Results - Delay
Go back to top Go back to TOC
6.2.2.8 Rates
Rate statistics are displayed in a graph format. Tap on either gauge to see rate details in table form. The table shows transmitted (Tx) and received (Rx) current, minimum,
maximum and average frame rates (FPS) and Data Rates (Mbps).
Frame Rate in Frames per second (FPS): Number of received frames (including bad frames, Broadcast frames and Multicast frames)
Data Rate Efficiency in Mbps: Received data rate expressed in Mbps
BERT Results - Rates
Page 55
BERT Results - Rate Details
UX400 10G e-Manual D07-00-058P RevA00
Page 55 of 209
Go back to top Go back to TOC
6.3.3 Saving BERT Results
Once the test has been stopped the results can be saved by pressing the Save key on the platform's keypad.
A window will open giving the option of naming the results file. Enter the desired name for the file and tap apply. The results will be saved.
BERT Results Save
Page 56
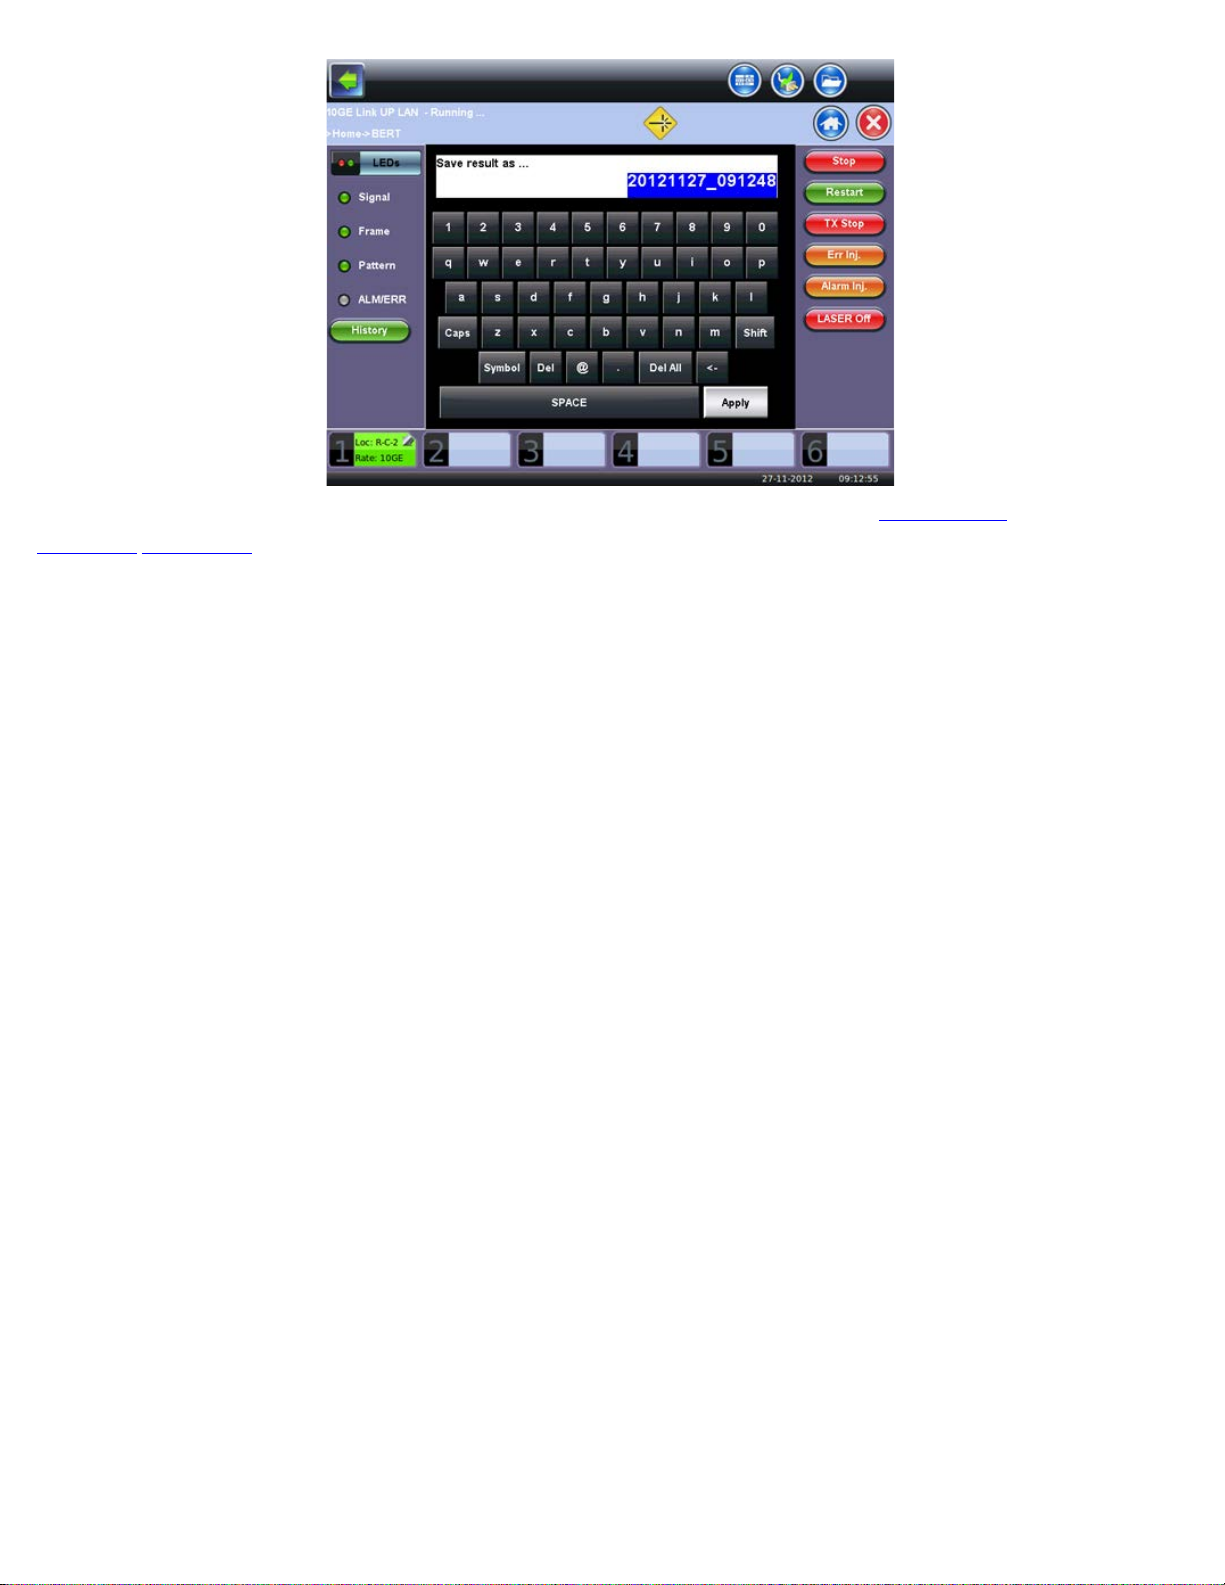
Once the results are saved, they can be viewed or renamed by going to Tools / System Settings screen> Files. Please see Chapter 5.3.3 Files section.
UX400 10G e-Manual D07-00-058P RevA00
Page 56 of 209
Go back to top Go back to TOC
Page 57
6.3 RFC2544
UX400 10G e-Manual D07-00-058P RevA00
Page 57 of 209
Overview:
RFC 2544 recommendations are well accepted in the test and measurement industry for network performance testing. The RFC 2544 test suite consists of and performs a
set of four automated tests (throughput, latency, frame loss, and burst or back-to-back) to qualify the performance of a network link under test. The tests are especially
popular for the verification of network links with certain service level agreements (SLA).
The following settings must be configured prior to RFC 2544 testing:
Test layer (Layer 2 & 3)
Frame header (MAC, VLAN, IP, UDP, and Data)
Test frames selection
Pass/fail thresholds (optional)
Throughput
Latency
Frame loss
Burst (back- to-back)
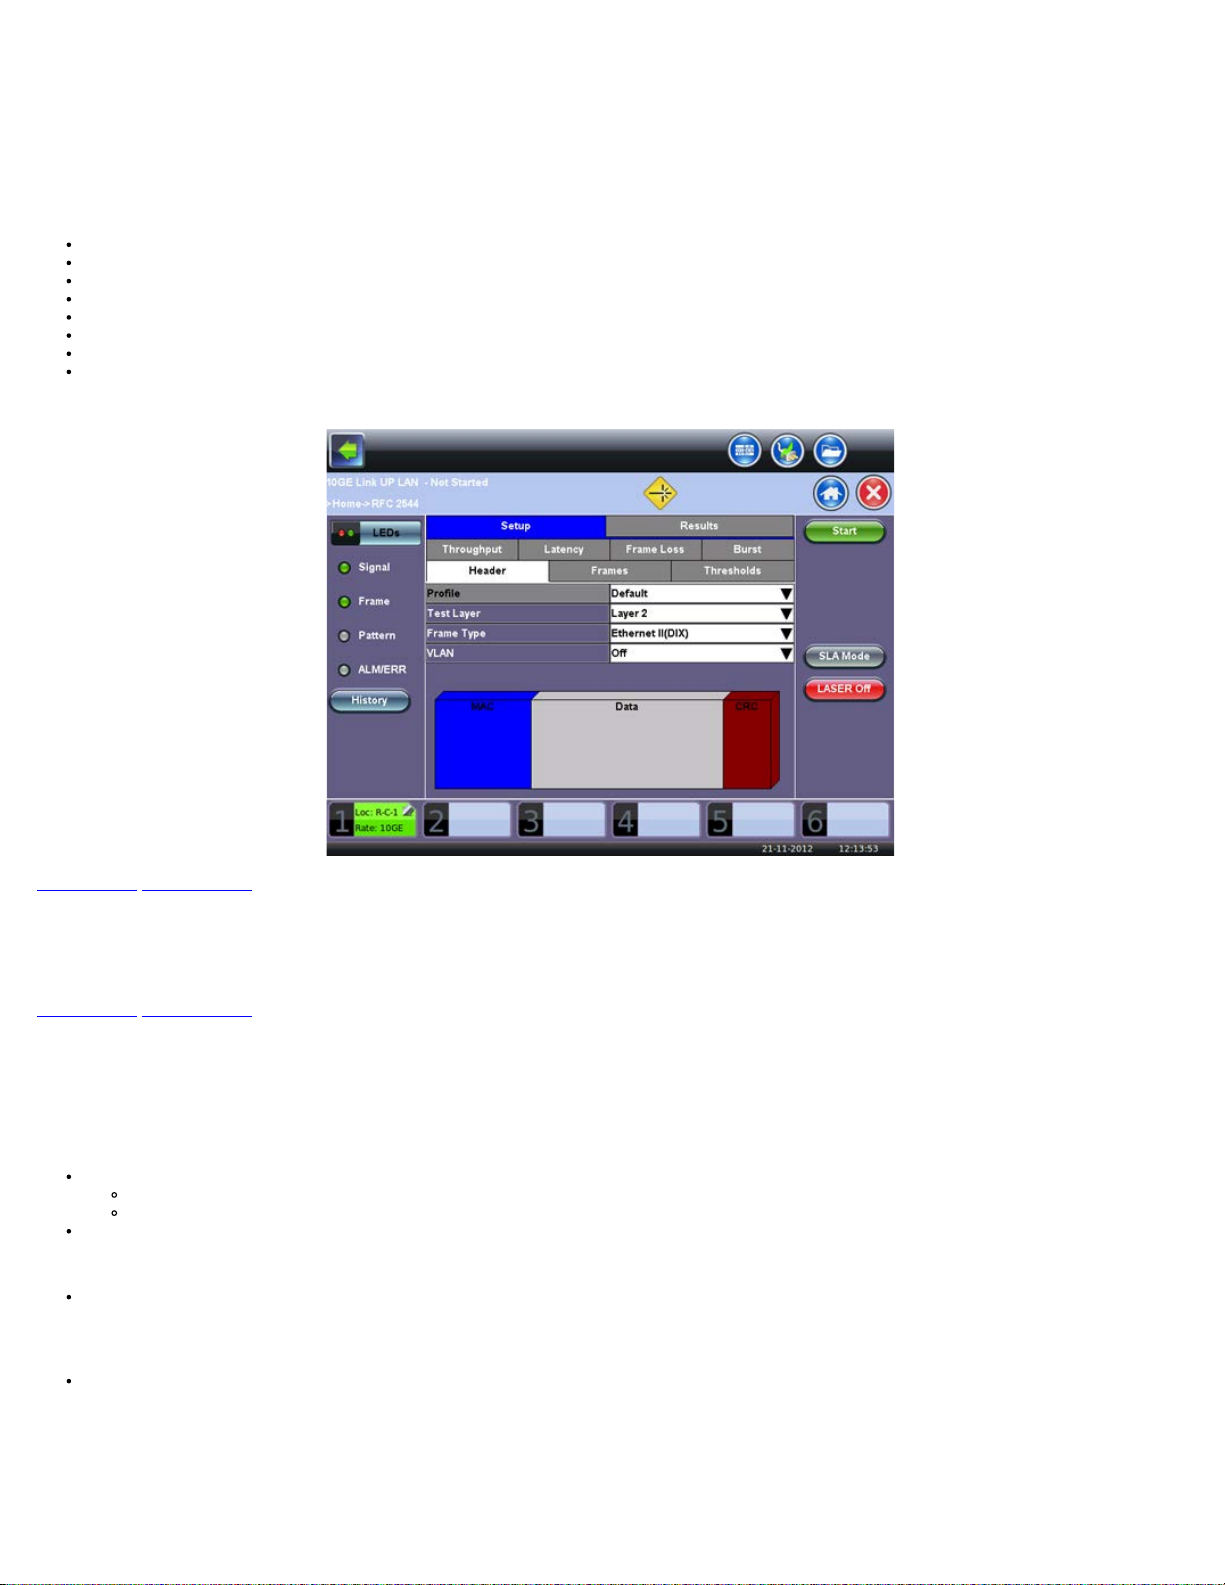
RFC2544 Header Setup (Layer 2)
Go back to top Go back to TOC
6.3.1 Setup
Unless otherwise noted, the Frame Header and related setups are identical to the setups described in the BERT Application. A summary of the RFC 2544 setup options are
outlined below.
Go back to top Go back to TOC
6.3.1.1 Header Settings
Profile: Load a previously configured test profile or create a new profile from existing settings. Currently its set to "Default".
Test Layer: Select the test layer to perform the test. Options are Layer 2, Layer 3 or Layer 4.
Frame Type: Select the Ethernet frame type for Layer 2 or Layer 3.
Layer 2:
Ethernet II (DIX) (named after DEC, Intel, and Xerox, this is the most common frame type today),
802.3 Raw (IEEE 802.3 frame without LLC) - Not available when Layer 3 is selected
Layer 3: Ethernet II (DIX)
VLAN: Off, 1 tag, 2 tags, 3 tags
Up to three VLAN tags (VLAN stacking for Q-in -Q applications) can be configured.
Note: VLAN stacking is an option.
MPLS (only for Layer 3 & 4): Off, 1 tag, 2 tags, 3 tags
Up to three MPLS tags can be configured.
Note: MPLS tag configuration is only available when the MPLS option is purchased.
PROTOCOL (Only for Layer 4): UDP or TCP
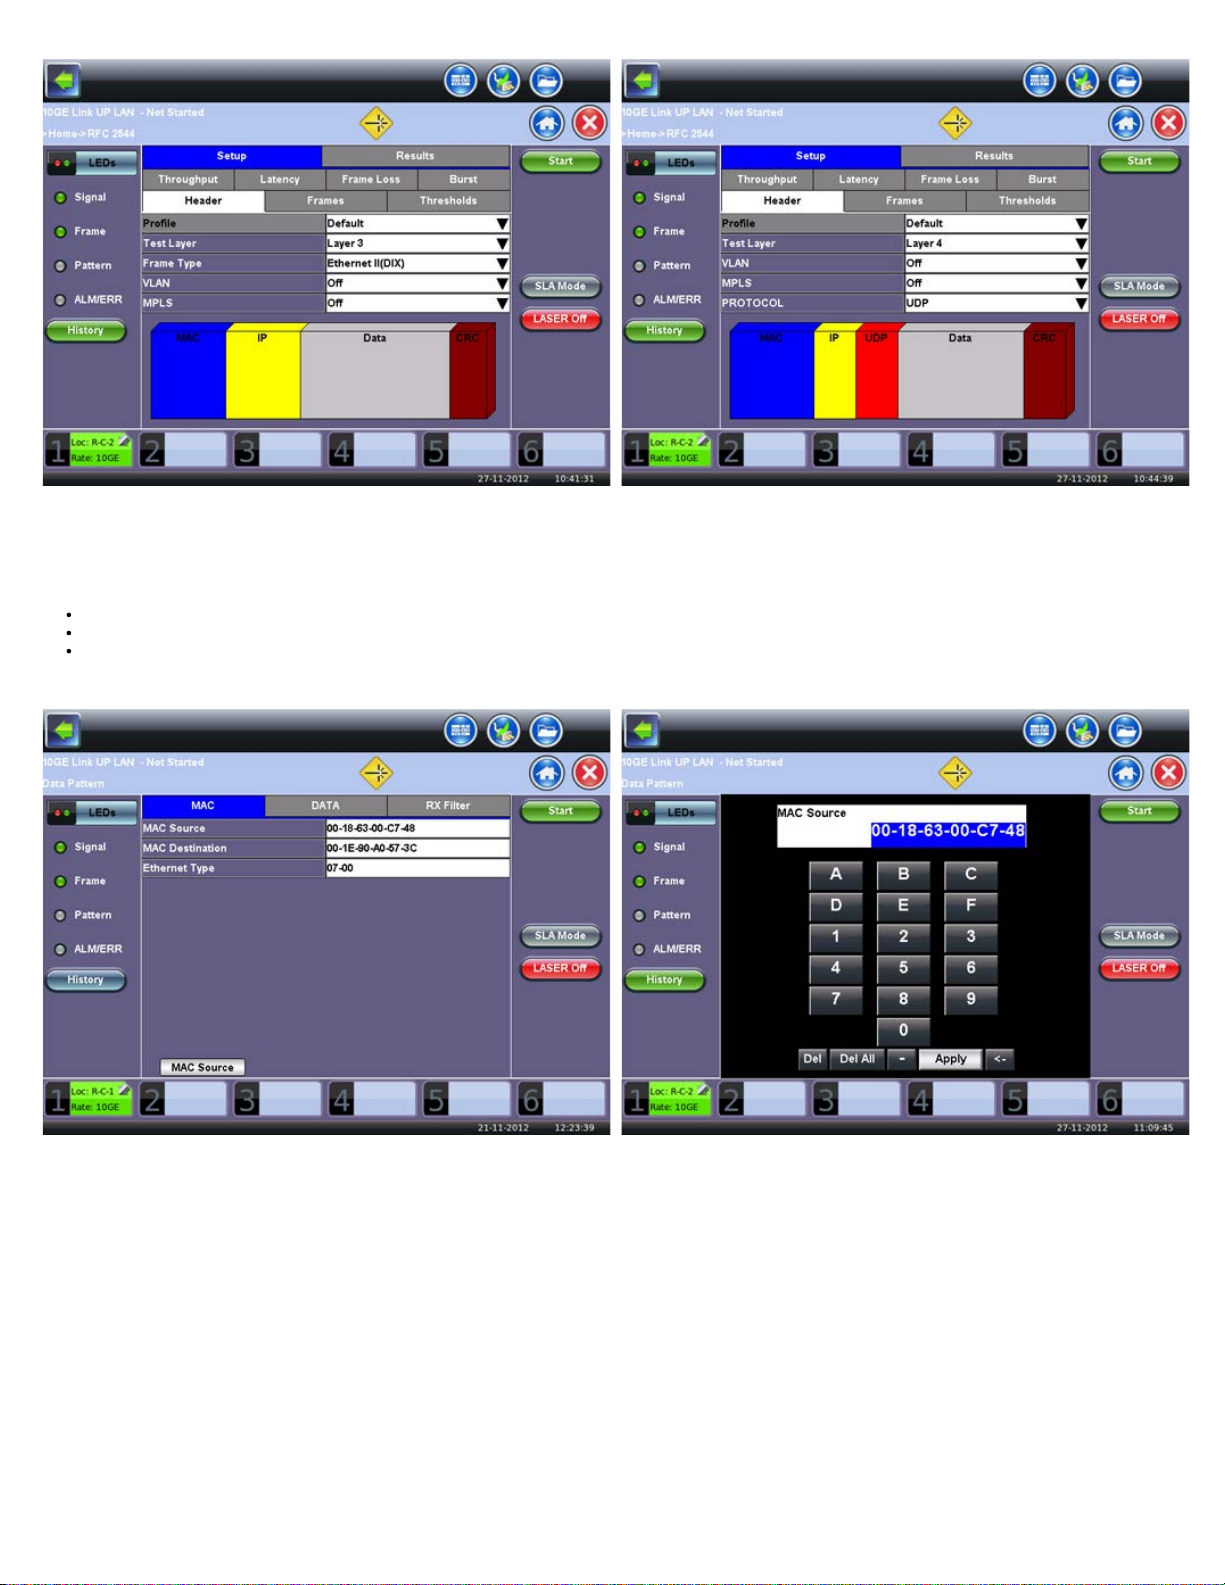
RFC2544 Header Setup Layer 3 RFC2544 Header Setup Layer 4
Page 58
Layer 2
UX400 10G e-Manual D07-00-058P RevA00
Page 58 of 209
The following can be configured for Layer 2:
MAC: Tap the MAC block on the Frame image to access the setup menu.
MAC Source: Use the default source address of the test set or configure a new or different address. See MAC address editing screen shot below.
MAC Destination: Configure the destination MAC address of the far -end partner test set. See MAC address editing screen shot below.
Ethernet Type: Can be configured for Layer 2
RFC2544 Setup MAC Layer 2 RFC2544 MAC Editing
Data: No payload selection is possible for Layer 2.
The payload area is populated with a VeEX signature field and other proprietary data.
RFC2544 Data Layer 2
Page 59
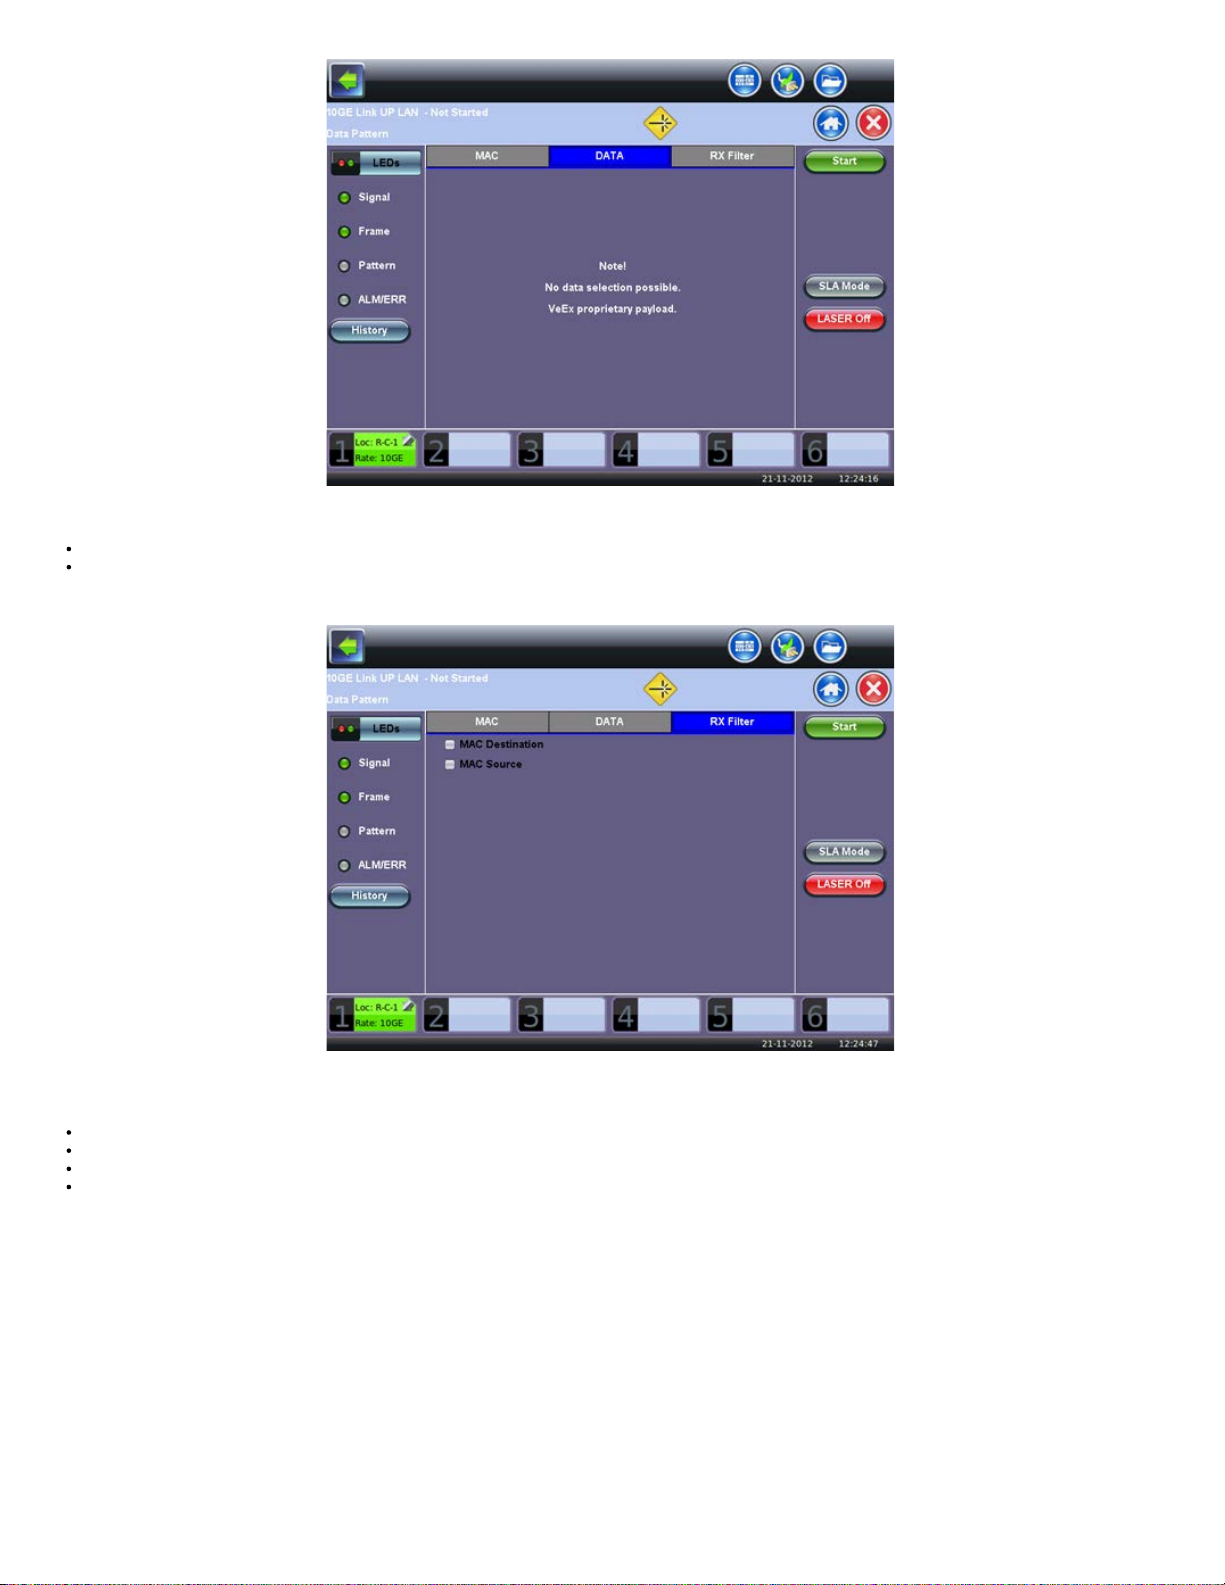
RX Filter: Allows to filter streams by:
UX400 10G e-Manual D07-00-058P RevA00
Page 59 of 209
MAC Destination address
MAC Source address
RFC2544 Setup RX Filter Layer 2
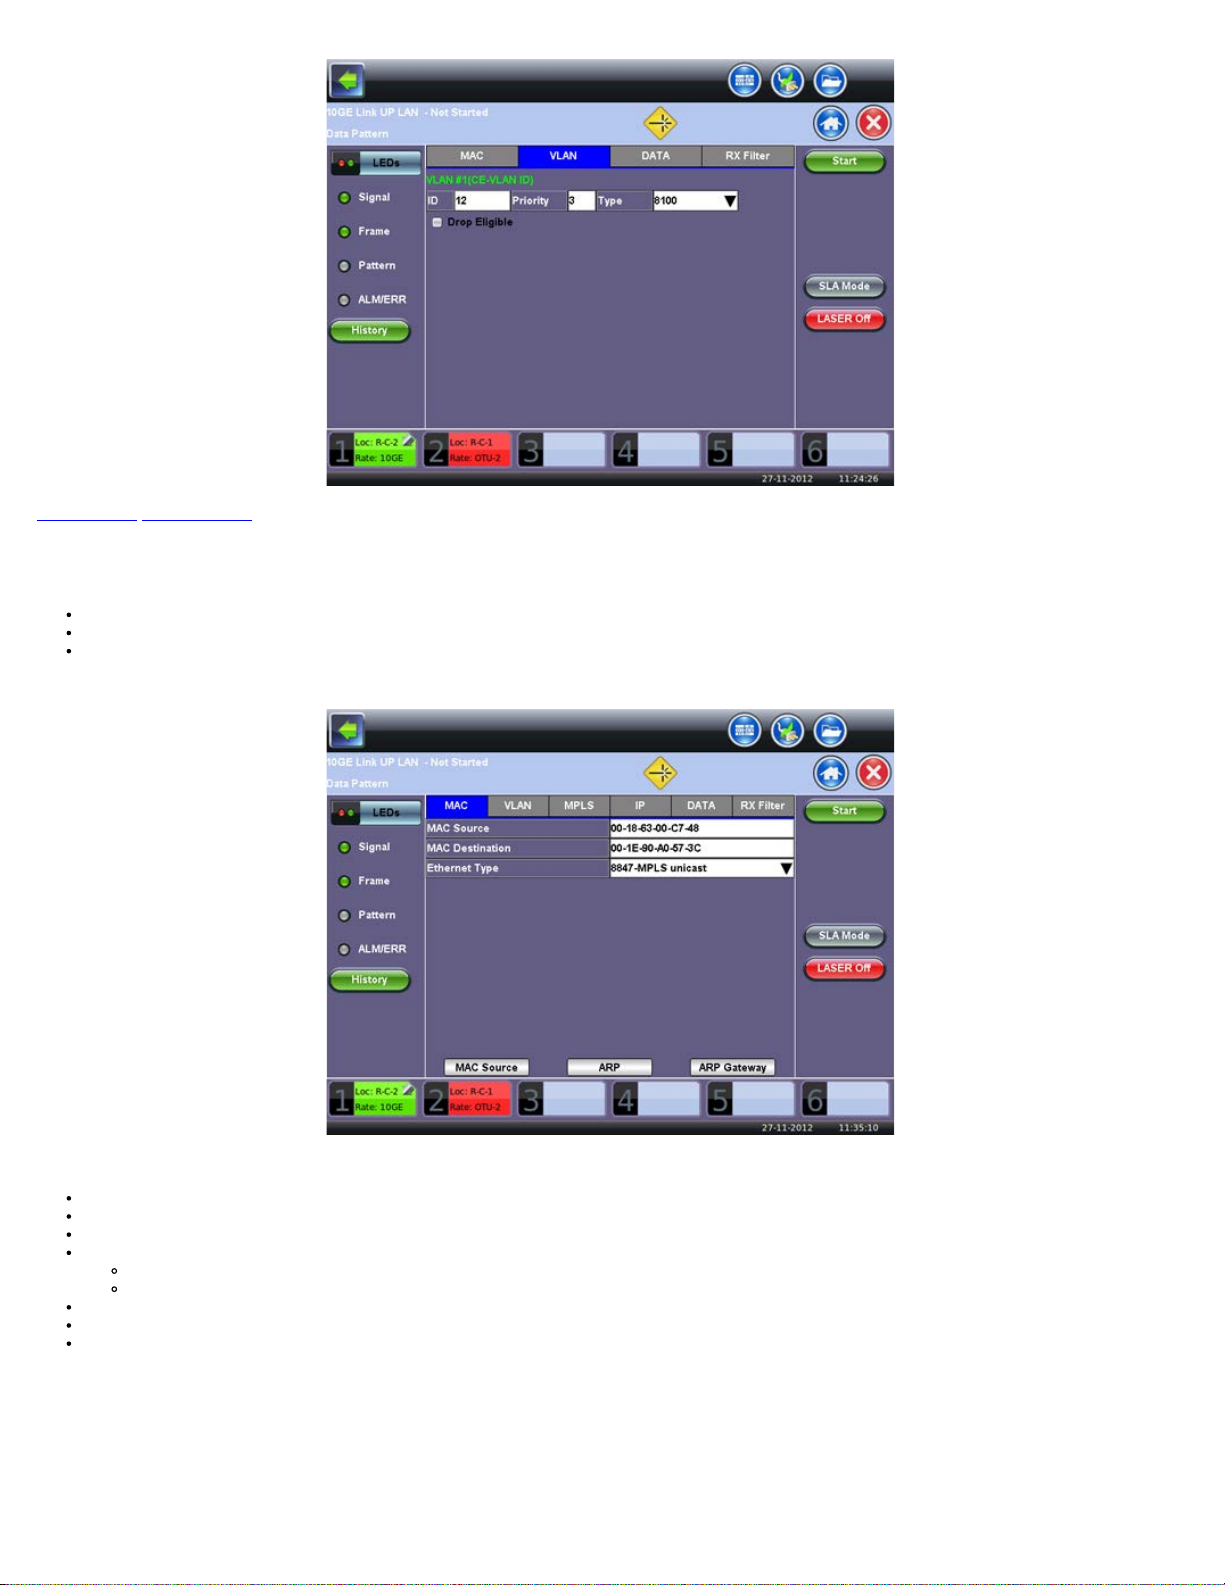
VLAN: If VLAN tag was selected on the setup main screen for Layer 2, then the VLAN Frame will be visible on the Frames figure. Tap on the VLAN frame to configure the
following:
VLAN ID
Priority
Tag Type (Ethernet Type): 8100, 88a8 or User Defined
Drop Eligible: If enabled, drop eligibility flag will be set.
RFC2544 Setup VLAN Layer 2
Page 60
Go back to top Go back to TOC
UX400 10G e-Manual D07-00-058P RevA00
Page 60 of 209
Layer 3
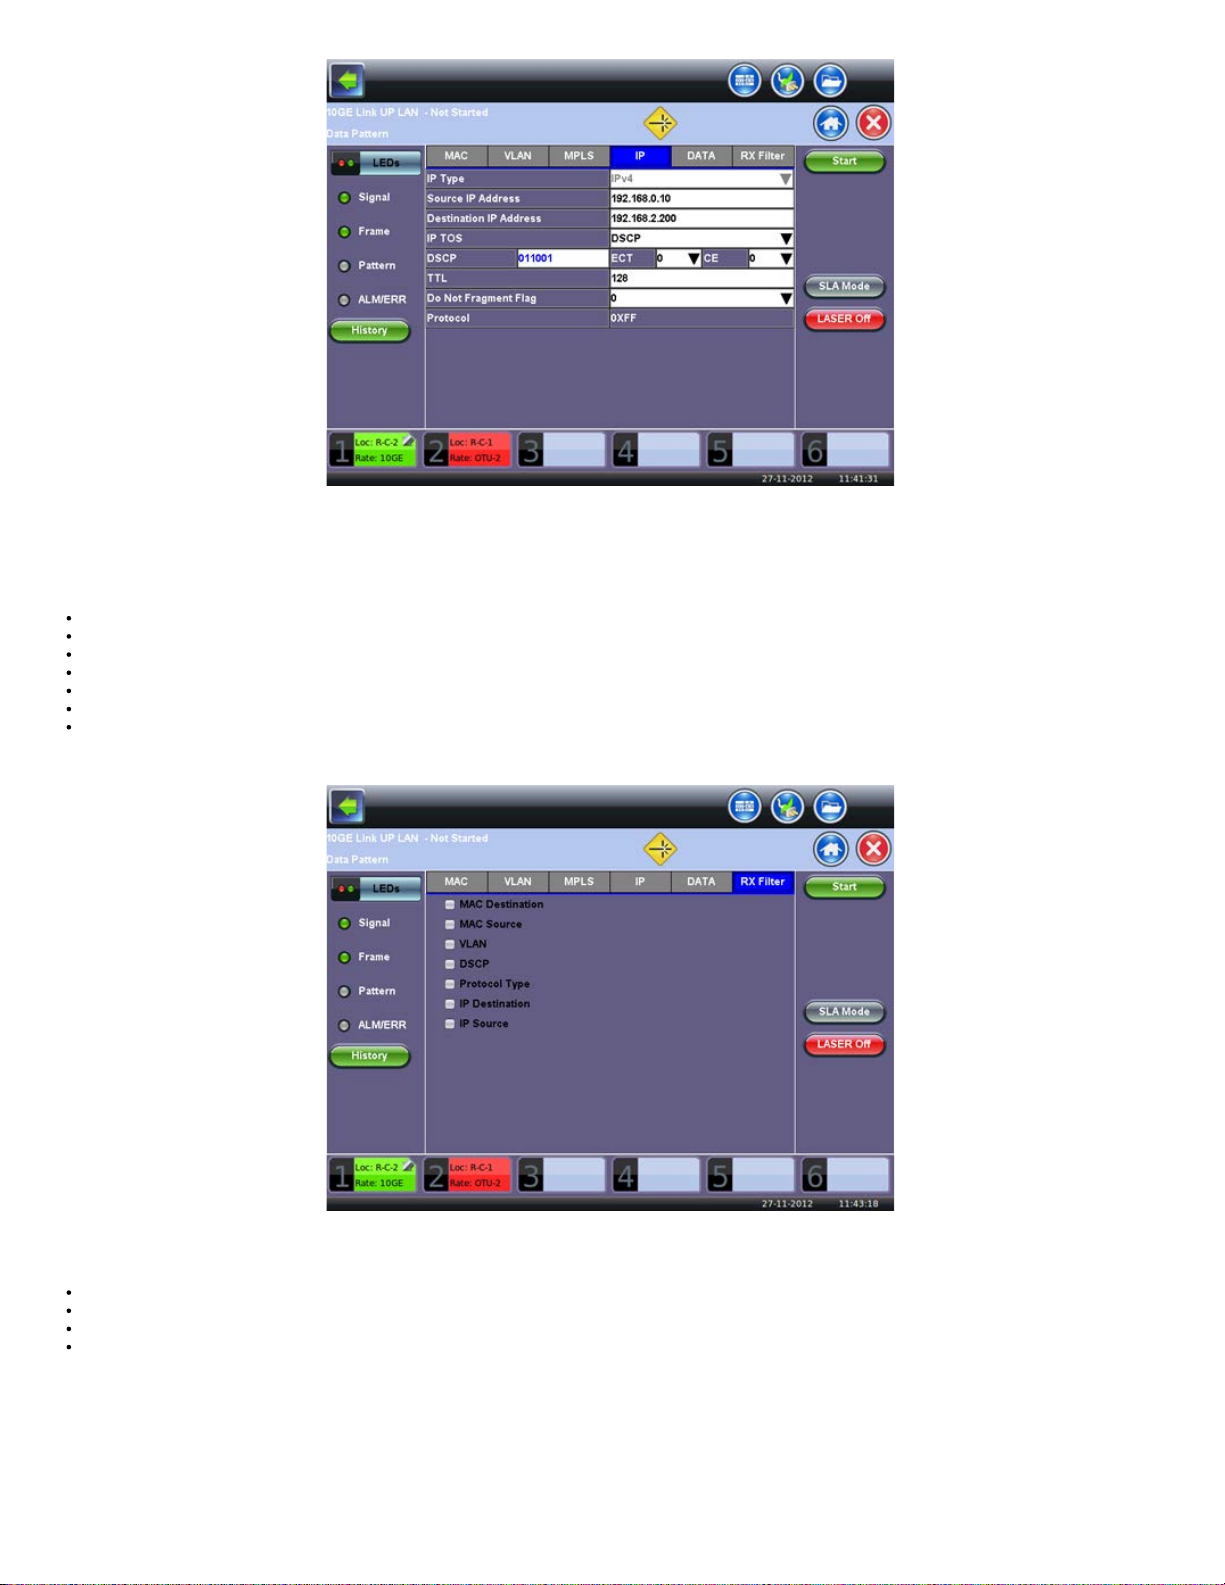
MAC/IP: Tap the MAC or IP block on the Frame image to access the setup menus.
MAC Source: Use the default source address of the test set or configure a new or different address. See MAC address editing screen shot above.
MAC Destination: Configure the destination MAC address of the far -end partner test set. See MAC address editing screen shot above.
Ethernet Type: 8847-MPLS unicast or 8848-MPLS multicast
RFC2544 Setup MAC Layer 3
IP: Configure the source and destination IP addresses. The following IP header fields can be configured:
IP Type: IPv4
Source IP Address
Destination IP Address
IP TOS (for quality of service testing): Legacy TOS, DSCP
If Legacy TOS is selected, then the parameters that can be configured are: Precedence and TOS Values
If DSCP is selected, then the parameters that can be configured are: DSCP, ECT and CE
TTL
Do Not Fragment Flag: 0, 1
Protocol: 0XFF
RFC2544 IP Configuration Layer 3
Page 61
Data: No payload selection is possible.
UX400 10G e-Manual D07-00-058P RevA00
Page 61 of 209
The payload area is populated with a VeEX signature field and other proprietary data.
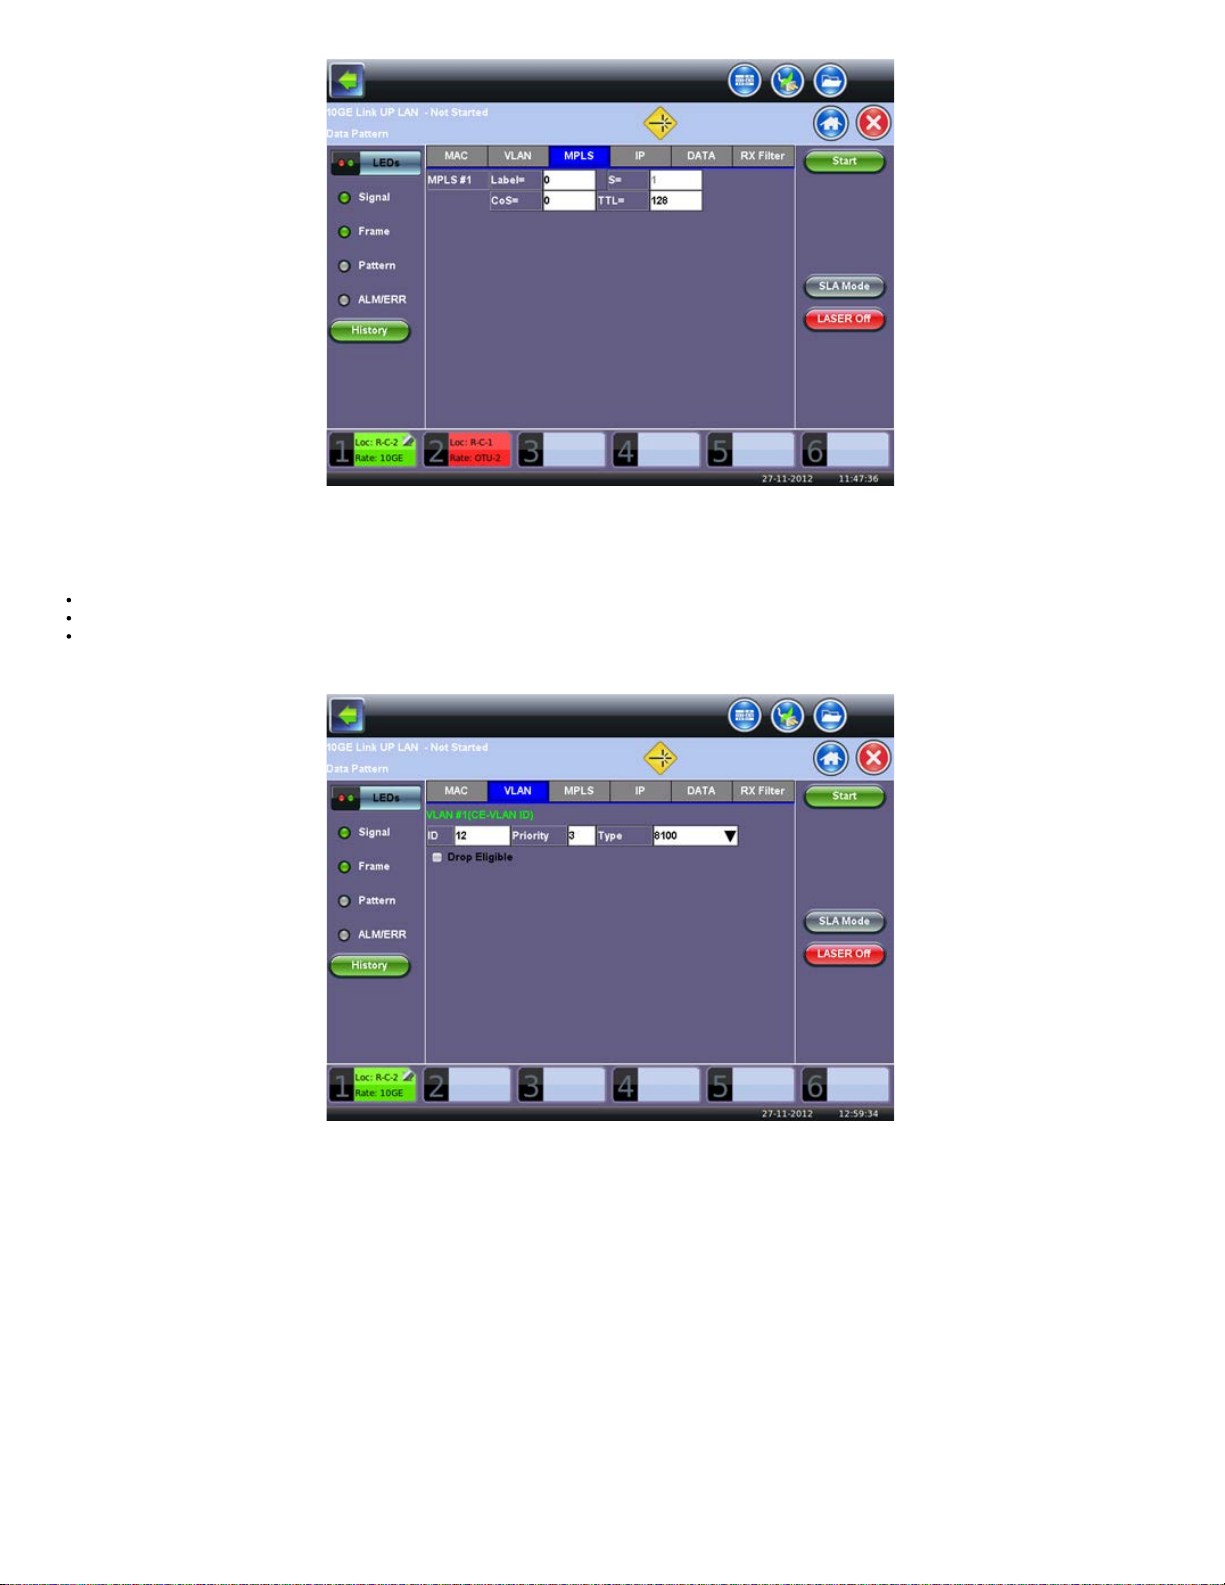
RX Filter Tab: Allows to filter streams by:
MAC Destination address
MAC Source address
VLAN
DSCP
Protocol Type
IP Destination
IP Source
RFC2544 RX Filter Layer 3
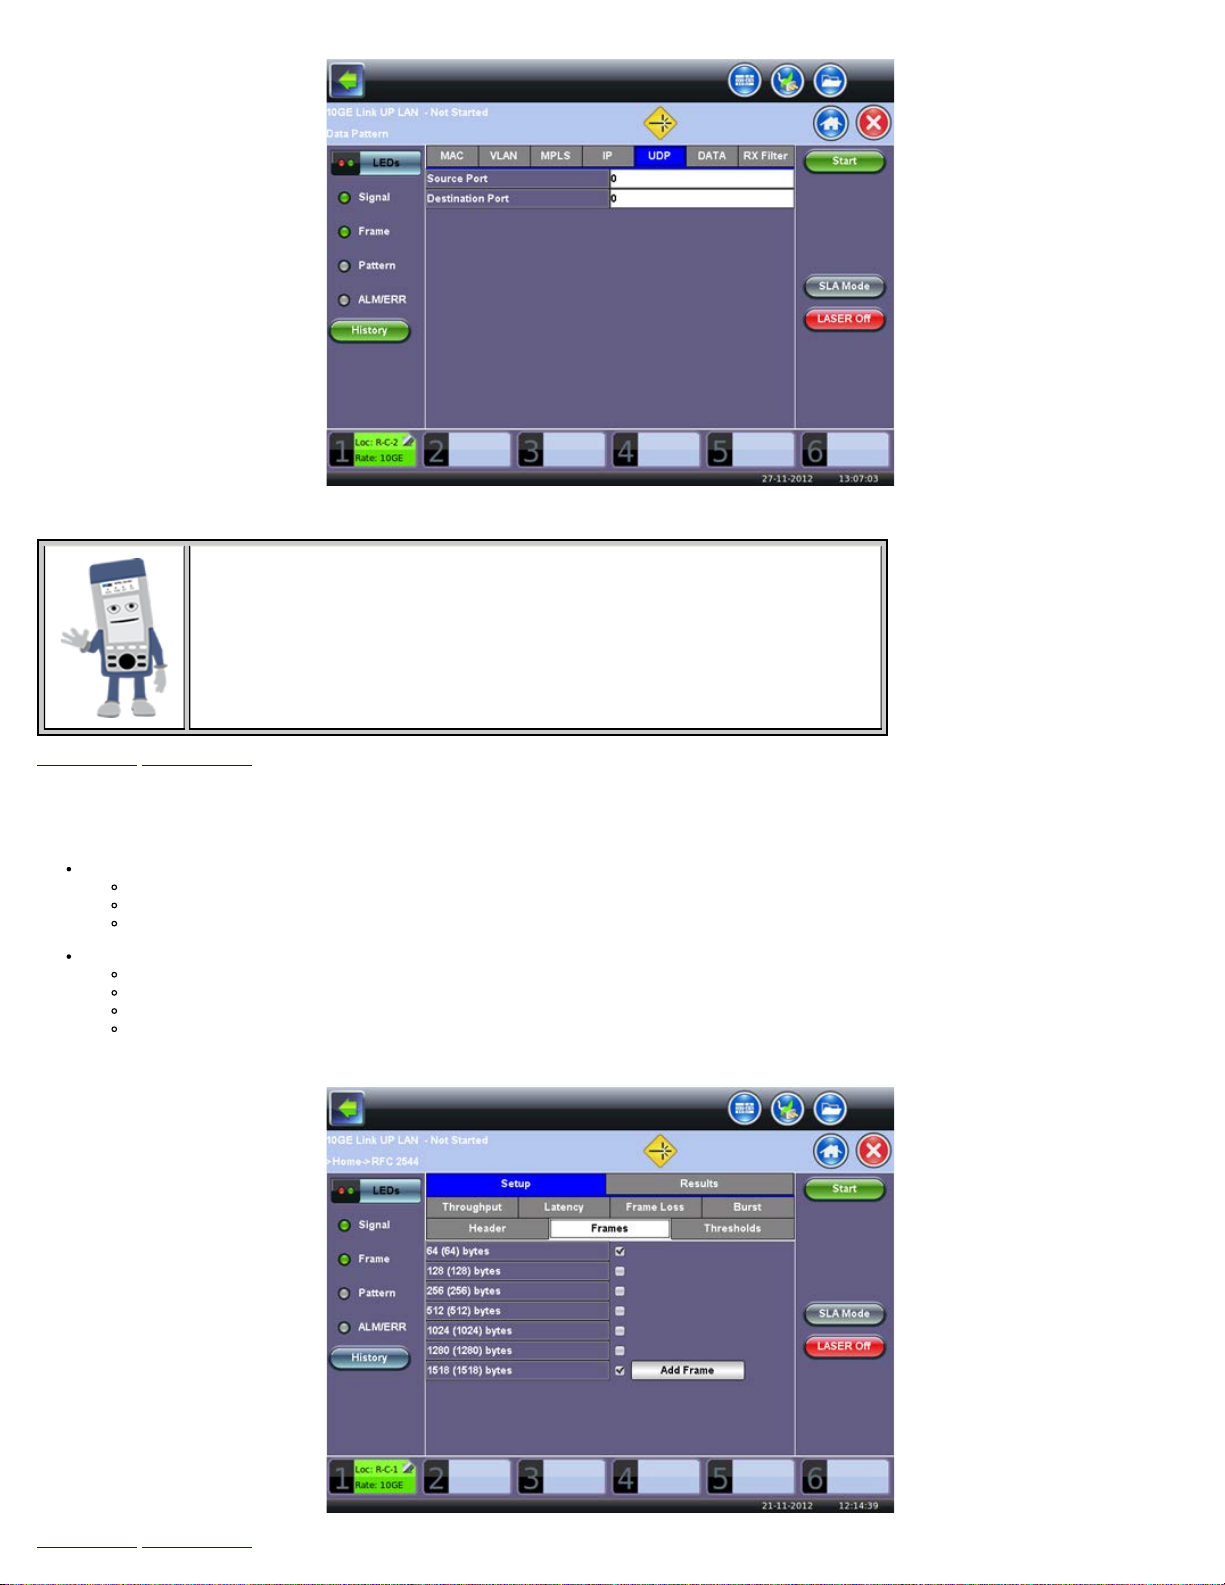
MPLS: If MPLS tag was selected on the setup main screen for Layer 3, then the MPLS Frame will be visible on the Frames figure. Tap on the MPLS frame to configure
the flollowing:
MPLS label
CoS priority settings
TTL
S-bit
RFC2544 Setup MPLS Layer 3
Page 62
UX400 10G e-Manual D07-00-058P RevA00
Page 62 of 209
VLAN: If
following:
VLAN tag was selected on the setup main screen for Layer 3, then the VLAN Frame will be visible on the Frames figure. Tap on the VLAN frame to configure the
VLAN ID
Priority
Tag Type (Ethernet Type)
RFC2544 VLAN Setup Layer 3
Note: Please refer to the BERT application for more details.
Layer 4: Same as Layer 3, except for following possible configurations:
UDP/ TCS: Source Port, Destination Port
RX Filter has filters for Destination Port and Source Port
RFC2544 UDP/TCS Layer 4
Page 63
UX400 10G e-Manual D07-00-058P RevA00
Page 63 of 209
RFC 2544 Header Setups
The MAC, VLAN, MPLS, and IP configuration procedures are the same as in BERT mode.
Please refer to the BERT Application section for details.
Go back to top Go back to TOC
6.3.1.2 Frames Settings
The following can be configured under the Frames tab of the RFC2544 Setup:
Preset Frames: Select from a list of recommended test frame sizes defined in RFC 2544:
Test frames are 64, 128, 256, 512, 1024, 1280, and 1518 bytes.
The default selected frame is 1518 bytes.
To select/deselect any of the recommended test frames, check the box to the right of the desired frame.
Add frame: Two additional user configurable test frames of any size ranging from 64 bytes to 9000 bytes can be added.
To add additional test frames, tap the Add Frame button.
Enter the frame size using the numeric keypad and click apply.
Press the back button to return to the frames screen.
The new custom frame size is displayed (it can be enabled or disabled as needed).
RFC2544 Frames Setup
Page 64
Go back to top Go back to TOC
UX400 10G e-Manual D07-00-058P RevA00
Page 64 of 209
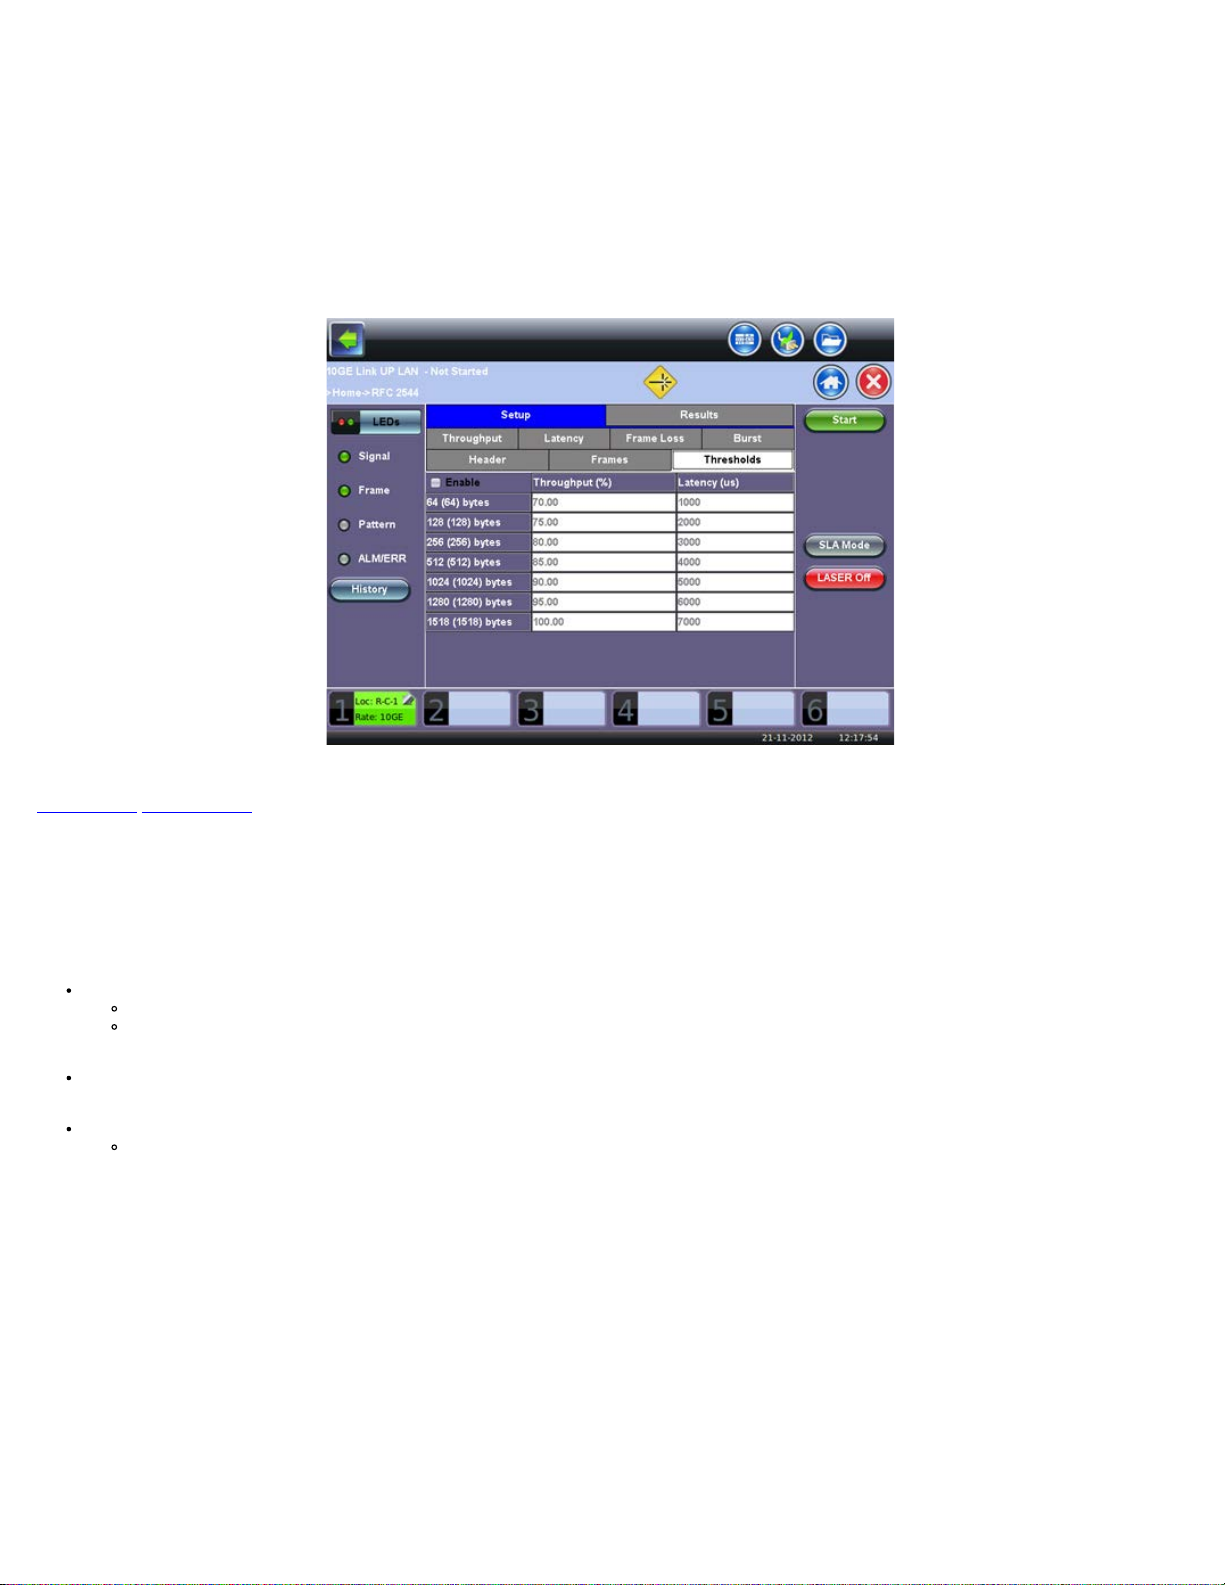
6.3.1.3 Threshold Settings
Threshold settings can be enabled or disabled for the throughput and latency tests.
When enabled, threshold settings can be configured for all of the test frames selected in the frame settings tab.
A Pass/Fail criteria will be applied when the threshold settings are enabled. For example, if the throughput threshold value for a 64 byte frame is configured for 80%, then a
Pass criteria is assigned if the throughput rate is 80% or better.
The threshold values for Throughput and Latency can be customized per user requirements. Tap on the selected value to edit.
RFC2544 Thresholds Setup
Go back to top Go back to TOC
6.3.1.4 Throughput, Latency, Frame Loss, and Burst Settings
The RFC 2544 test suite allows the user to run all four tests, one of the four tests, or a combination of any of the four tests. The user simply has to enable/disable which
tests to perform by checking/unchecking a selection box in the respective tab for each test. By default all four tests are enabled. Throughput test can not be disabled.
The following parameters must be configured before running the RFC 2544 conformance test suite.
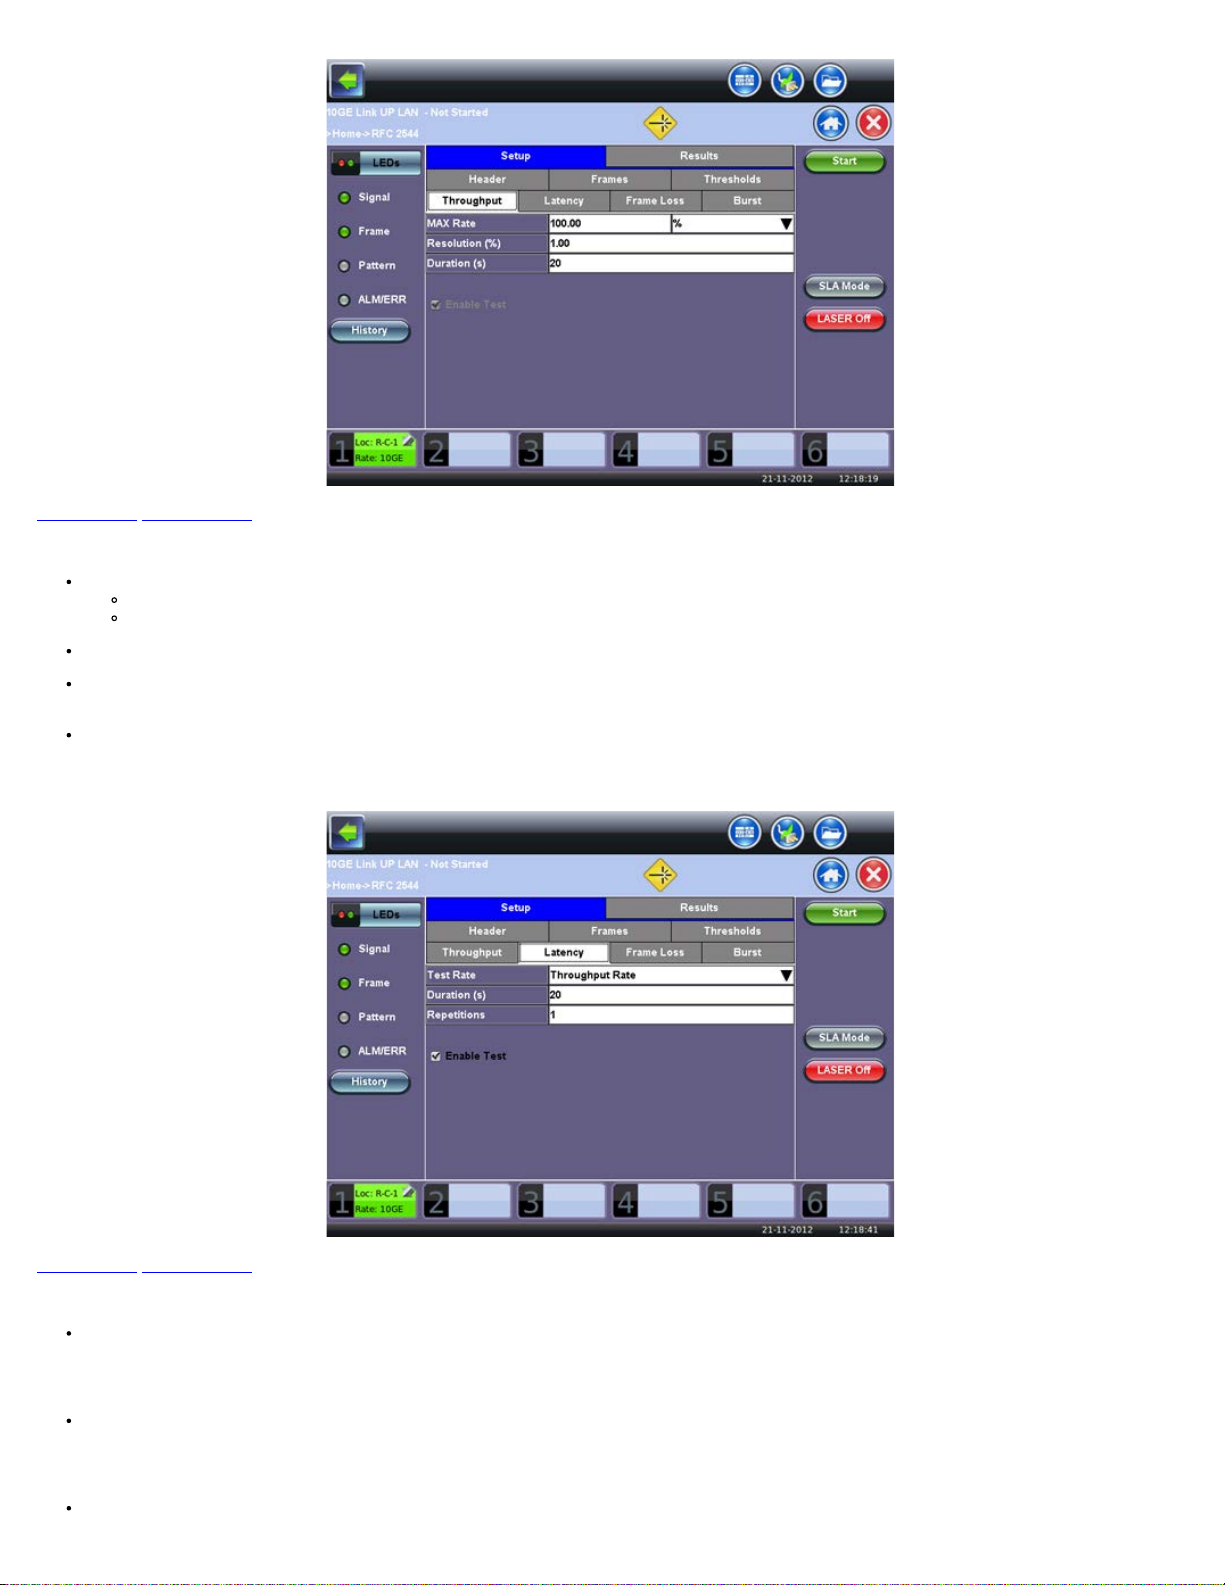
Throughput:
Max Rate: Up to 100% of the negotiated line rate. The default value is 100%.
This is the maximum transmit rate to perform the throughput test for each test frame size.
This rate may be configured as a % of the total line rate or in Mbps. For example the Max Rate is configured to be 90% and the negotiated line rate of the
link is 100Mbps, then the maximum transmit rate will be 90Mbps or 90% of the line rate.
Resolution: Input any value between 0.001% and 1%. The default value is 1%. Resolution refers to the resolution in searching for the throughput rate. If 1% is
selected, the throughput rate will be searched with ±1% accuracy.
Duration: 5 to 999 seconds. The default value is 20 seconds.
The duration is the amount of time the throughput test is run for, for each frame size at a given rate.
RFC2544 Throughput Settings
Page 65
Go back to top Go back to TOC
UX400 10G e-Manual D07-00-058P RevA00
Page 65 of 209
Latency: The following parameters can be configured:
Test Rate: Throughput Rate or Custom Rate. The default value is Throughput.
Throughput rate: Latency test will be performed at the Throughput rate found for each of the tested frame sizes.
Custom rate: A custom rate in % or Mbps can be configured.
Rate: Only available if Custom Rate is selected. Enter up to 100% of the negotiated line rate or enter the rate in Mbps.
Duration: 5 to 999 seconds. The default value is 20 seconds.
This is the amount of time that the latency test will be performed for each test frame size.
Repetitions: 1 to 100. The default value is 1.
This is the amount of times that the latency test will be repeated for each test frame size.
RFC2544 Latency Settings
Go back to top Go back to TOC
Frame Loss: The following parameters can be configured:
Max Rate: Up to 100% of the negotiated line rate. The default value is 100%.
This is the maximum transmit rate to perform the frame loss test for each test frame size. The user may configure this rate as a % of the total line rate or in Mbps.
For example if the user configures the Max Rate to be 90% and the negotiated line rate of the link is 100Mbps, then the maximum transmit rate will be 90Mbps or
90% of the line rate.
Step Size: 1 to 10%. The default value is 10%.
The step size is the rate % that the frame loss test will be reduced by in the event of any frame loss. For example if the Max Rate is 100Mbps (or 100%) and frames
are lost at this rate, then the transmit rate will be reduced to 90Mbps (or 90%). The frame loss test will now be performed at the new rate until there is zero frame
loss at two consecutive rate settings. This means that the test will have to be performed at 80% (assuming that there was zero frame loss at 90%).
Duration: Selectable in the range 5 to 999 seconds. The default value is 20 seconds.
The duration is the amount of time the throughput test is run for, for each frame size at a given rate.
Page 66
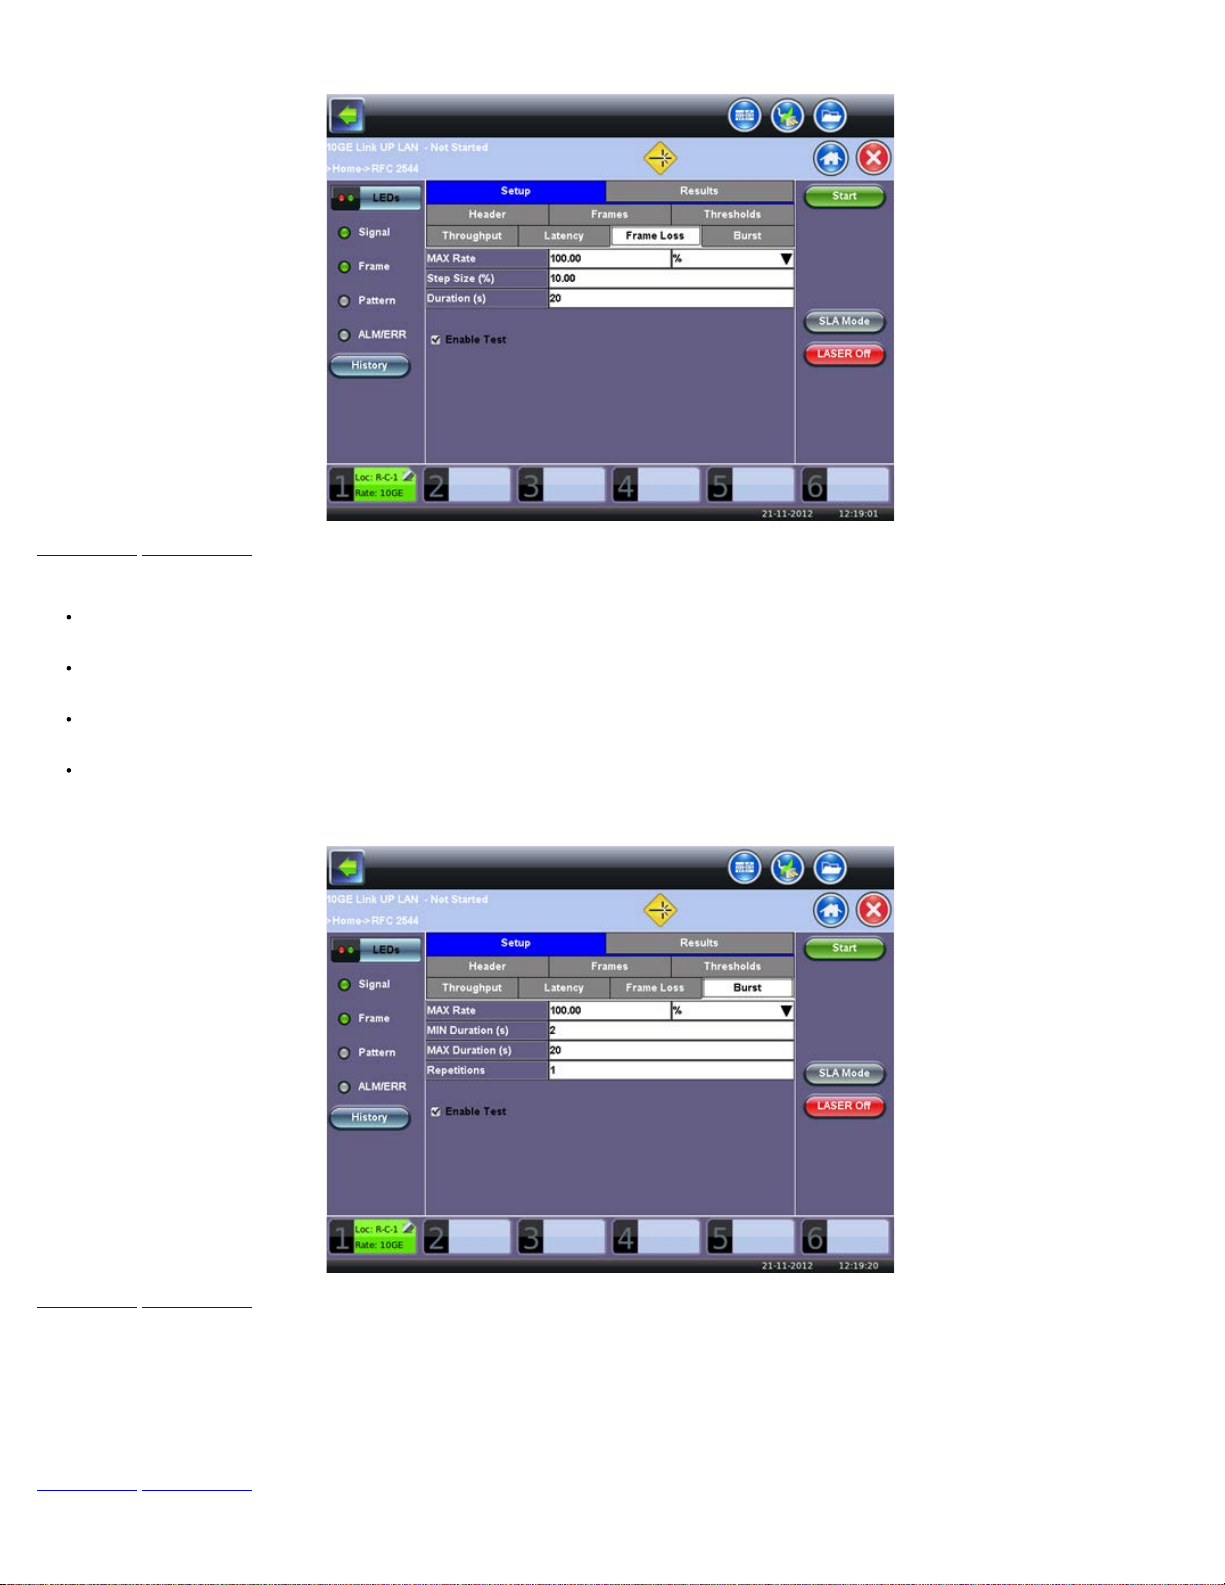
RFC2544 Frame Loss Settings
UX400 10G e-Manual D07-00-058P RevA00
Page 66 of 209
Go back to top Go back to TOC
Burst (Back- to-Back): The following parameters can be configured:
Max Rate: The default value is 100%.
In the burst test, frames are always transmitted at the maximum rate for a given minimum and maximum burst duration.
Minimum Duration: Selectable in the range 2 to 999 seconds. Default value is 2 seconds.
This is the duration of the first burst.
Maximum Duration: Selectable up to 999 seconds. The default value is 20 seconds.
This is the duration of the second burst, which must be greater than the minimum burst.
Repetitions: Selectable in the range 1 to 100. The default value is 1.
This is the amount of times that the burst test will be repeated for each test frame size.
RFC2544 Burst Settings
Go back to top Go back to TOC
6.3.1.5 Starting/Stopping a RFC 2544 Measurement
Once all configurations have been made, tap the Start button on the right section of the screen to start the measurements.
Note: If testing on the fiber ports, make sure the LASER is turned On before starting the test.
The selected tests will run automatically. When all the tests are complete the test will stop automatically. If the RFC 2544 test suite needs to be stopped before they are
done, then simply tap the Stop button. The status of each selected test can be seen in the Results tab.
Go back to top Go back to TOC
6.3.2 Results
Page 67
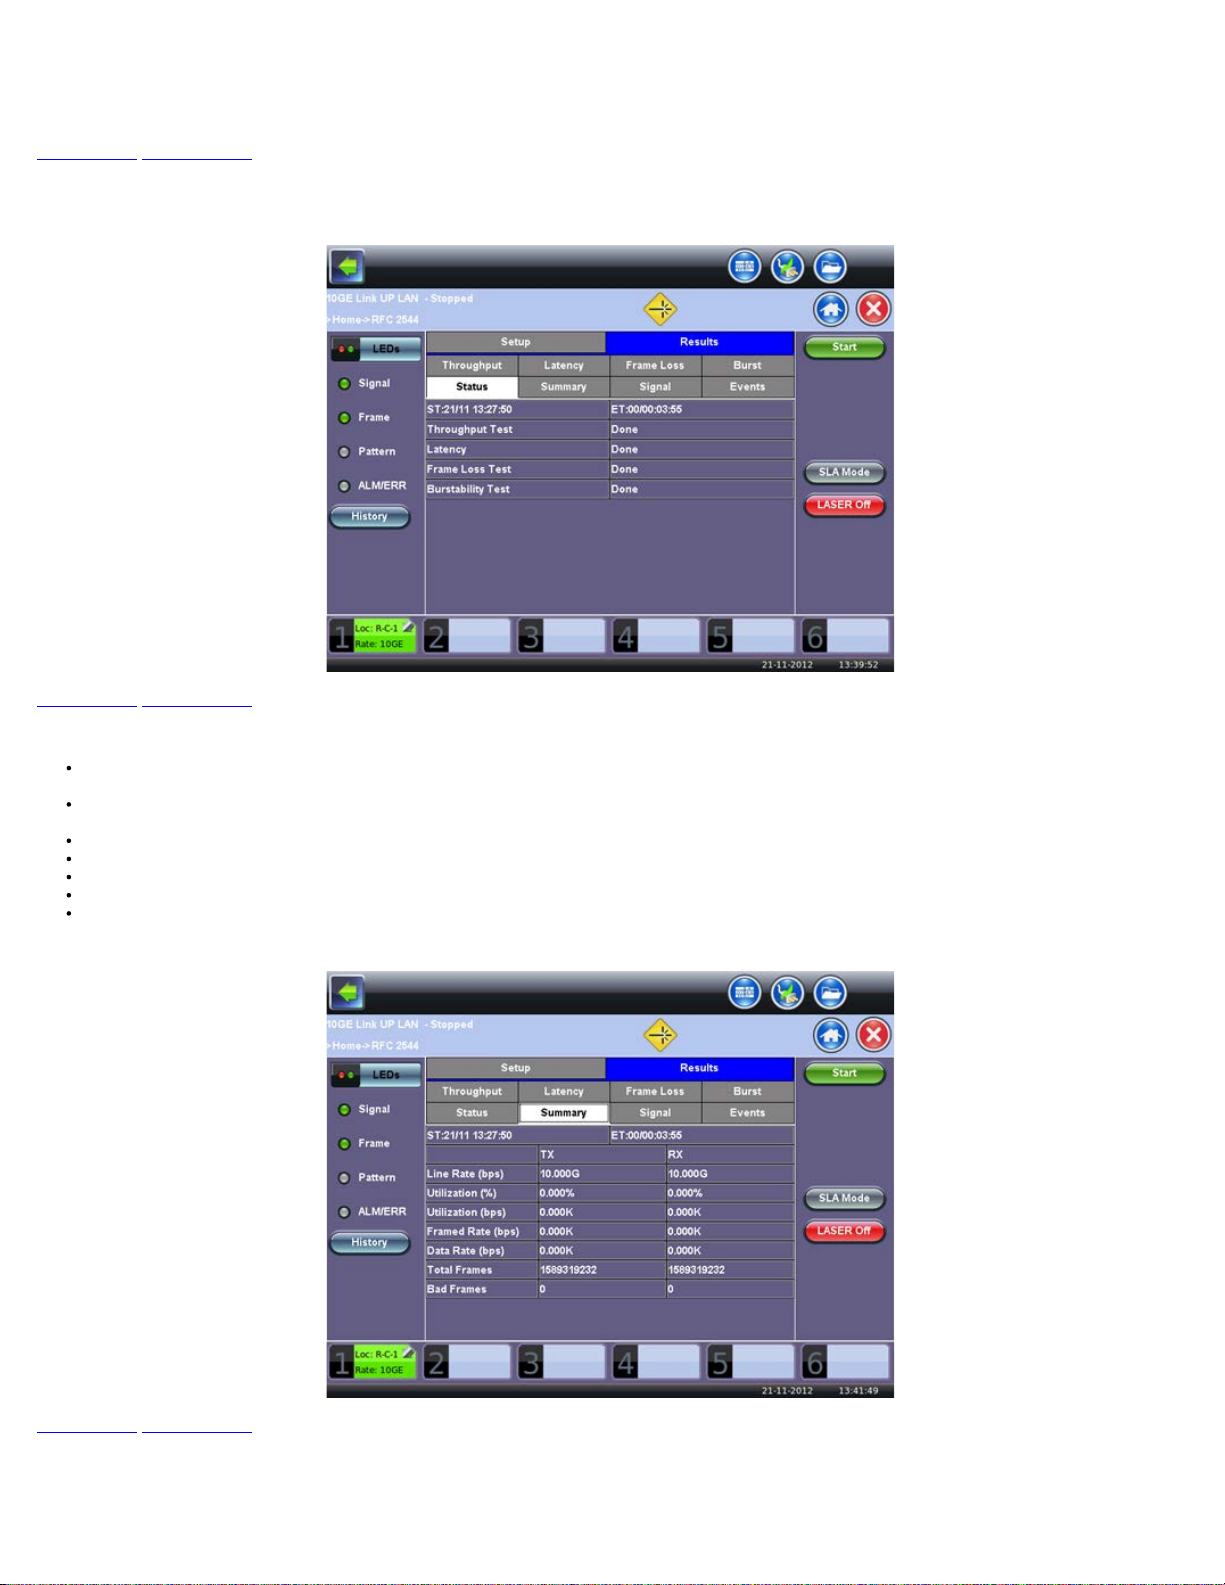
The progress and current result of the RFC 2544 can be viewed as the test is in progress.
Navigate the respective sub-tabs (throughput, latency, frame loss, or burst) to view the results for each test. For the burst test, the results can be viewed in summary table
UX400 10G e-Manual D07-00-058P RevA00
Page 67 of 209
format or test log format.
Go back to top Go back to TOC
6.3.2.1 Status: The status of each test is displayed including a stamped log of each test.
RFC2544 Results Status
Go back to top Go back to TOC
6.3.2.2 Summary: The following results including the Start (ST) and Elapsed (ET) times are displayed:
Line Rate (bps): Negotiated rate of the interface (10M, 100M, or 1000M). This value is always fixed since it depends on the maximum capacity of the link under test,
hence the test interface that is configured.
Utilization: % of Line Rate. For example, if we transmit 100Mbps on a 1Gbps interface then the utilization value is 10% (or 100Mbps) of the total link capacity (or
Line Rate).
Utilization (bps)
Framed Rate: (Payload + MAC/IP Header + VLAN Tag + Type/Length + CRC) / (Payload + Total Overhead) * Line Rate % (in Mbps).
Data Rate: Payload / (Payload + Total Overhead) * Line Rate %.
Total Frames
Bad Frames
RFC 2544 Results Summary
Go back to top Go back to TOC
6.3.2.3 Signal: The Signal tab displays the optical level measured by the SFP or XFP transceiver.
RFC2544 Results Signal Page 1
Page 68
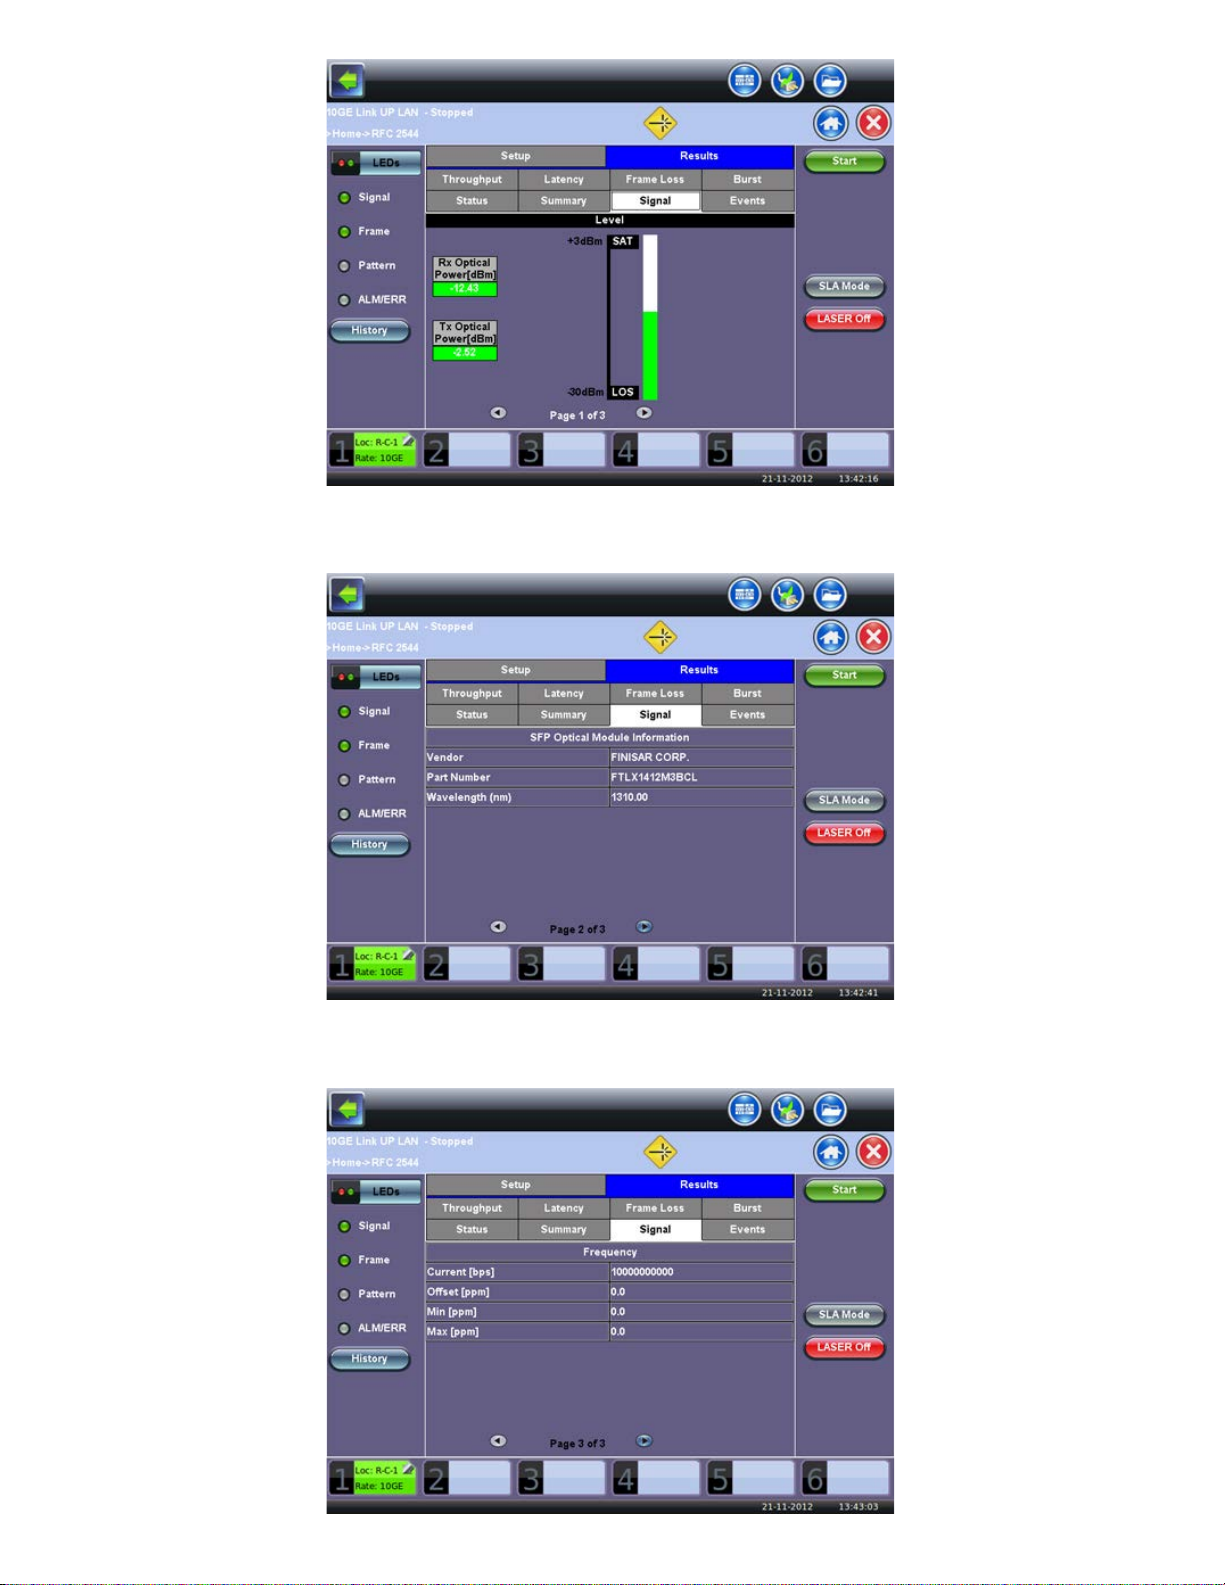
UX400 10G e-Manual D07-00-058P RevA00
Page 68 of 209
RFC2544 Results
RFC2544 Results
Signal Page 2
Signal Page 3
Page 69
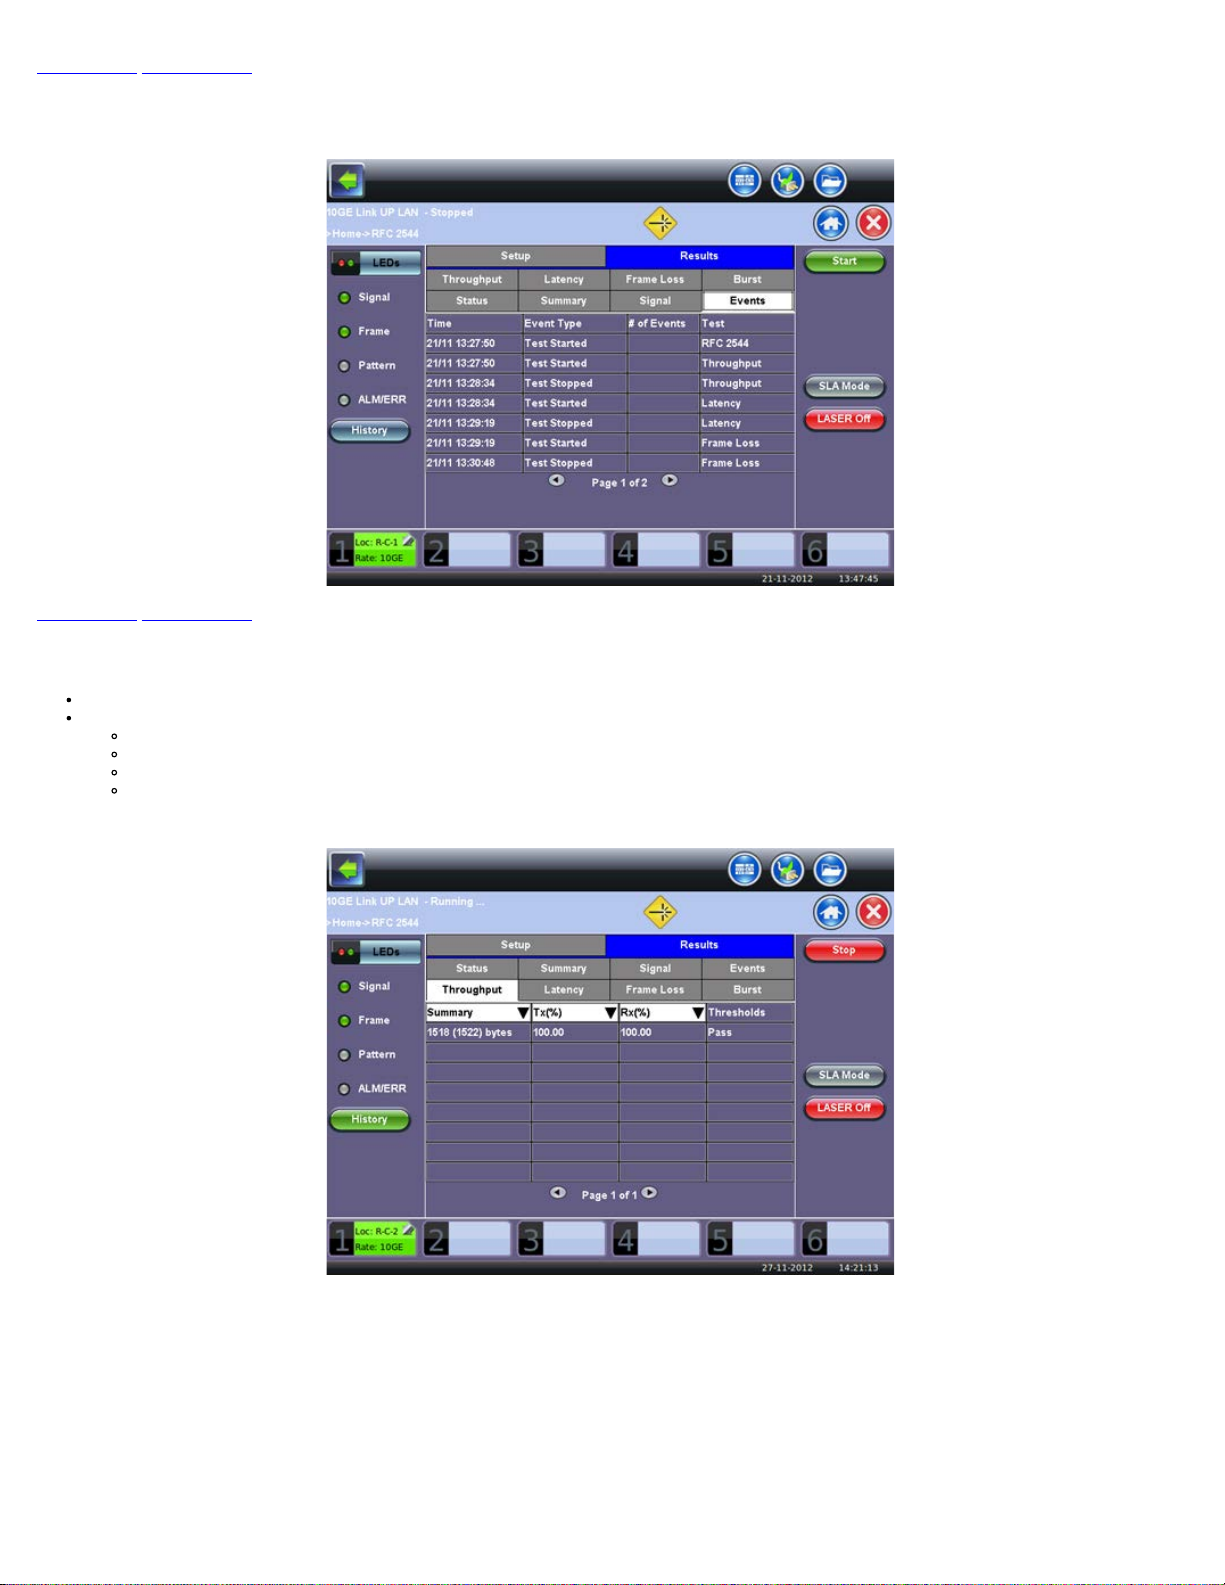
Go back to top Go back to TOC
6.3.2.4 Events: A time stamped log of each test is displayed.
UX400 10G e-Manual D07-00-058P RevA00
Page 69 of 209
RFC 2544 Results Events
Go back to top Go back to TOC
6.3.2.5 Throughput: The Throughput tab displays the maximum throughput rate of the link under test. Results are displayed in graphical and table formats. Use the drop -
down menu to change the display format.
Graphical: Throughput results are displayed in a bar graph form
Summary table and test log table display:
byte size
Tx(%): Percentage of test frames transmitted by the unit
Rx(%): Percentage of test frames received by the unit
P/F: Pass/Fail test status determined by test criteria set in the Threshold tab
RFC2544 Results Throughput Summary
RFC2544 Results
Throughput Tx Graphical
Page 70
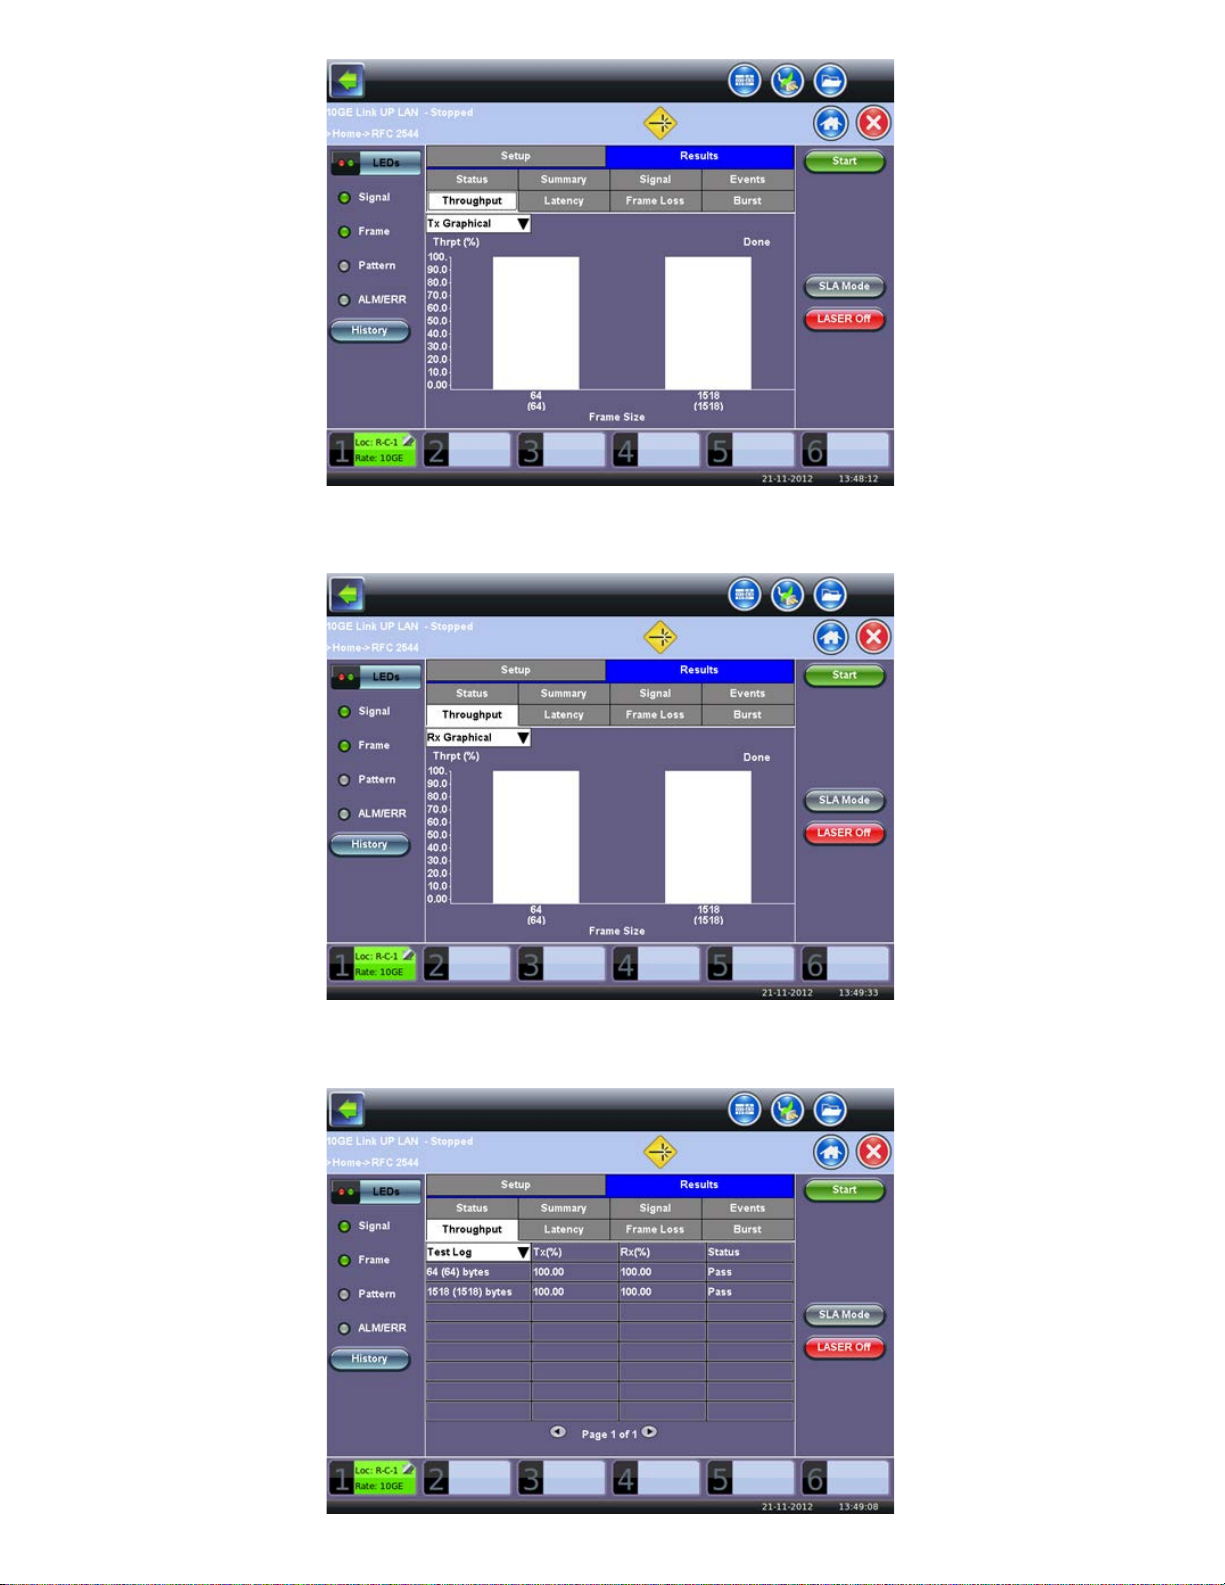
UX400 10G e-Manual D07-00-058P RevA00
Page 70 of 209
RFC2544 Results
RFC2544 Results
Throughput Rx Graphical
Throughput Test Log
Page 71
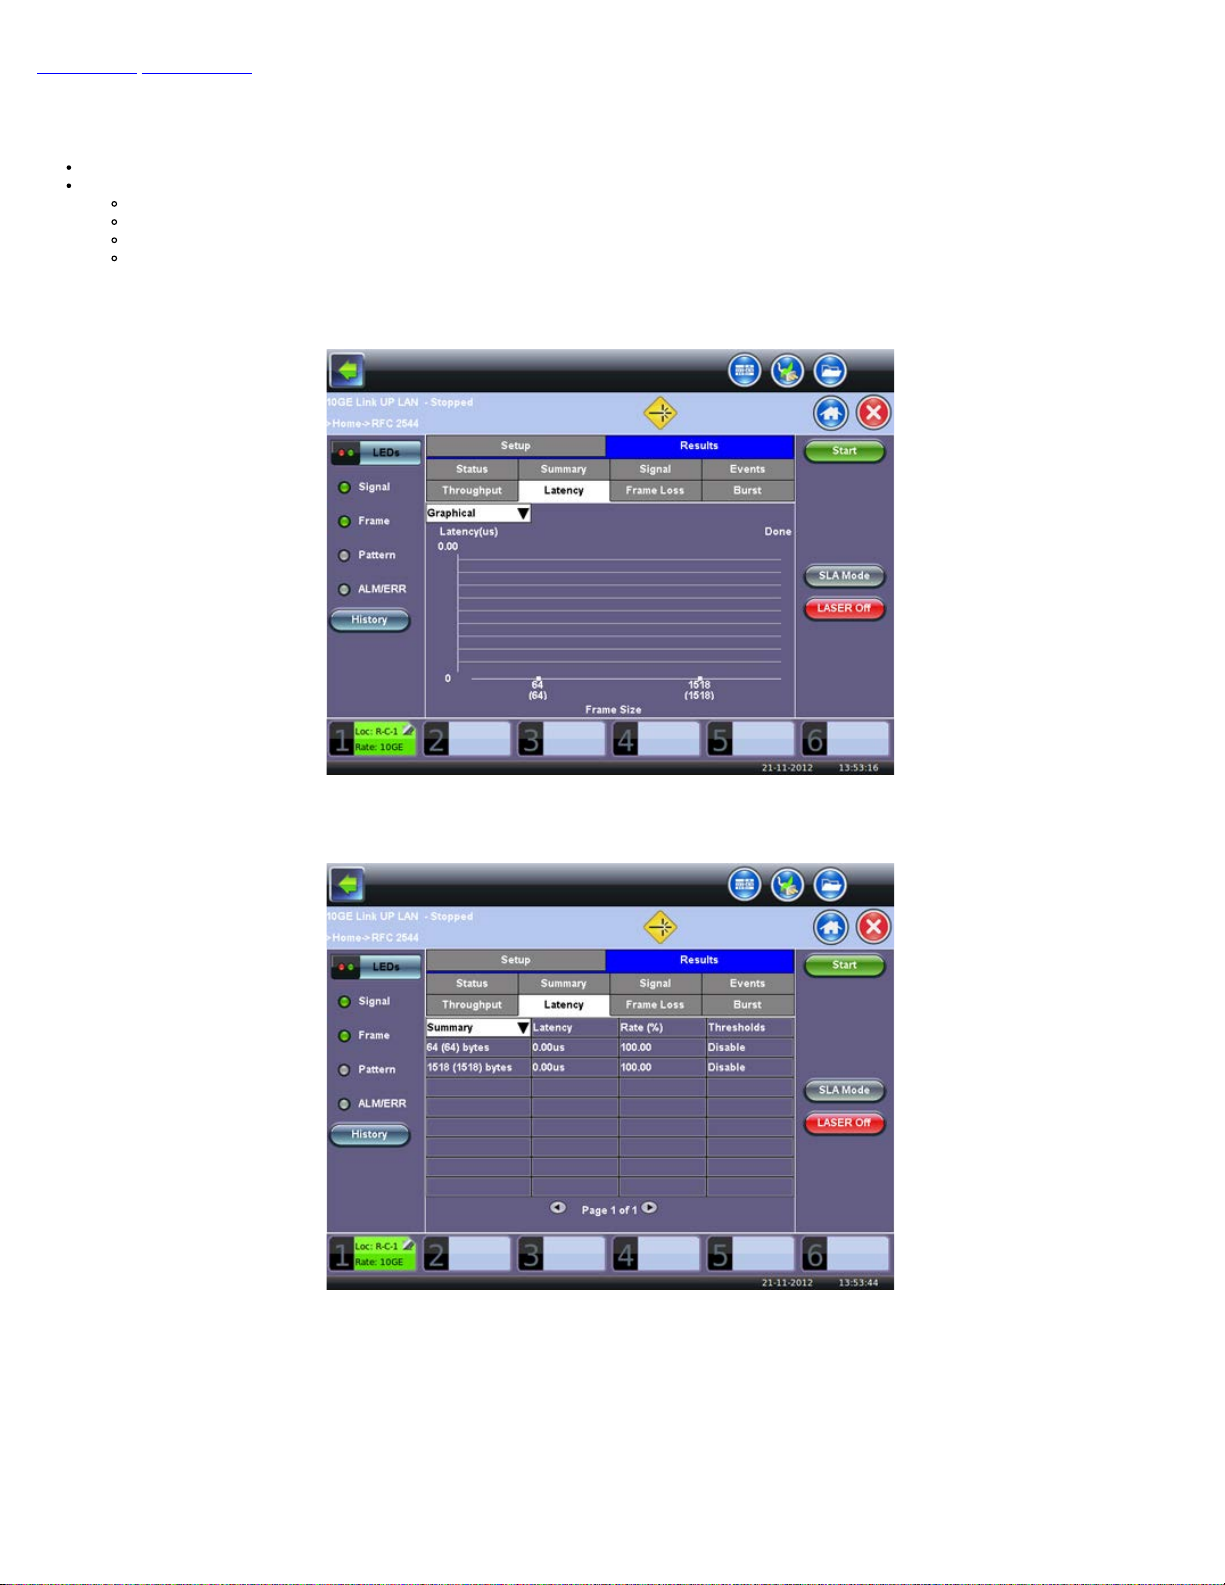
Go back to top Go back to TOC
6.3.2.6 Latency and Jitter
UX400 10G e-Manual D07-00-058P RevA00
Page 71 of 209
Latency and frame jitter measurements results are displayed under the Latency tab in the following formats:
Graphical: Latency results displayed in line graph form (Latency [us] vs Frame size [bytes]).
Summary and Test Log tables display:
byte size
Latency (us): Round trip delay latency.
Rate (%): Percentage of frames transmitted. Data rate used for latency test.
Pass/Fail test status.
Use the drop- down menu to select the Latency format.
RFC2544 Latency Results Graphical
RFC2544 Latency
RFC2544 Latency
Results Summary
Results Test Log
Page 72
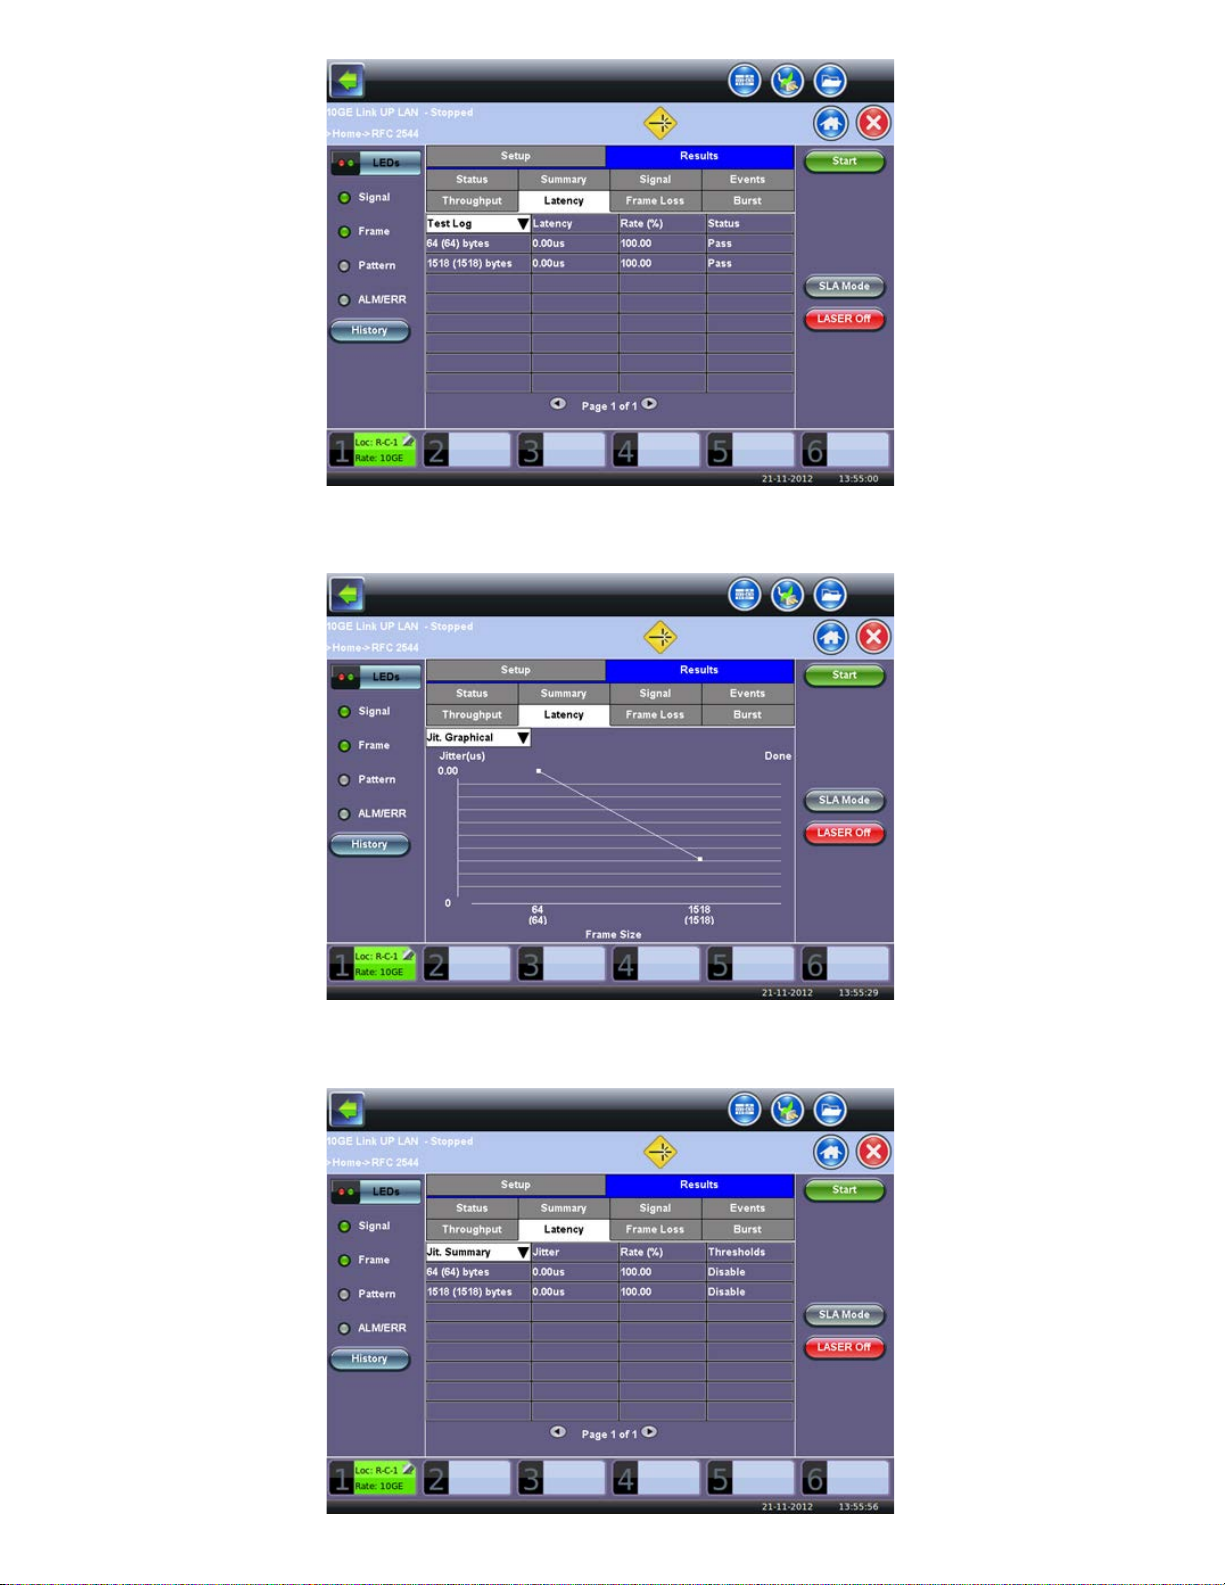
UX400 10G e-Manual D07-00-058P RevA00
Page 72 of 209
RFC2544 Jitter
RFC2544 Jitter
Results Graphical
Results Summary
Page 73
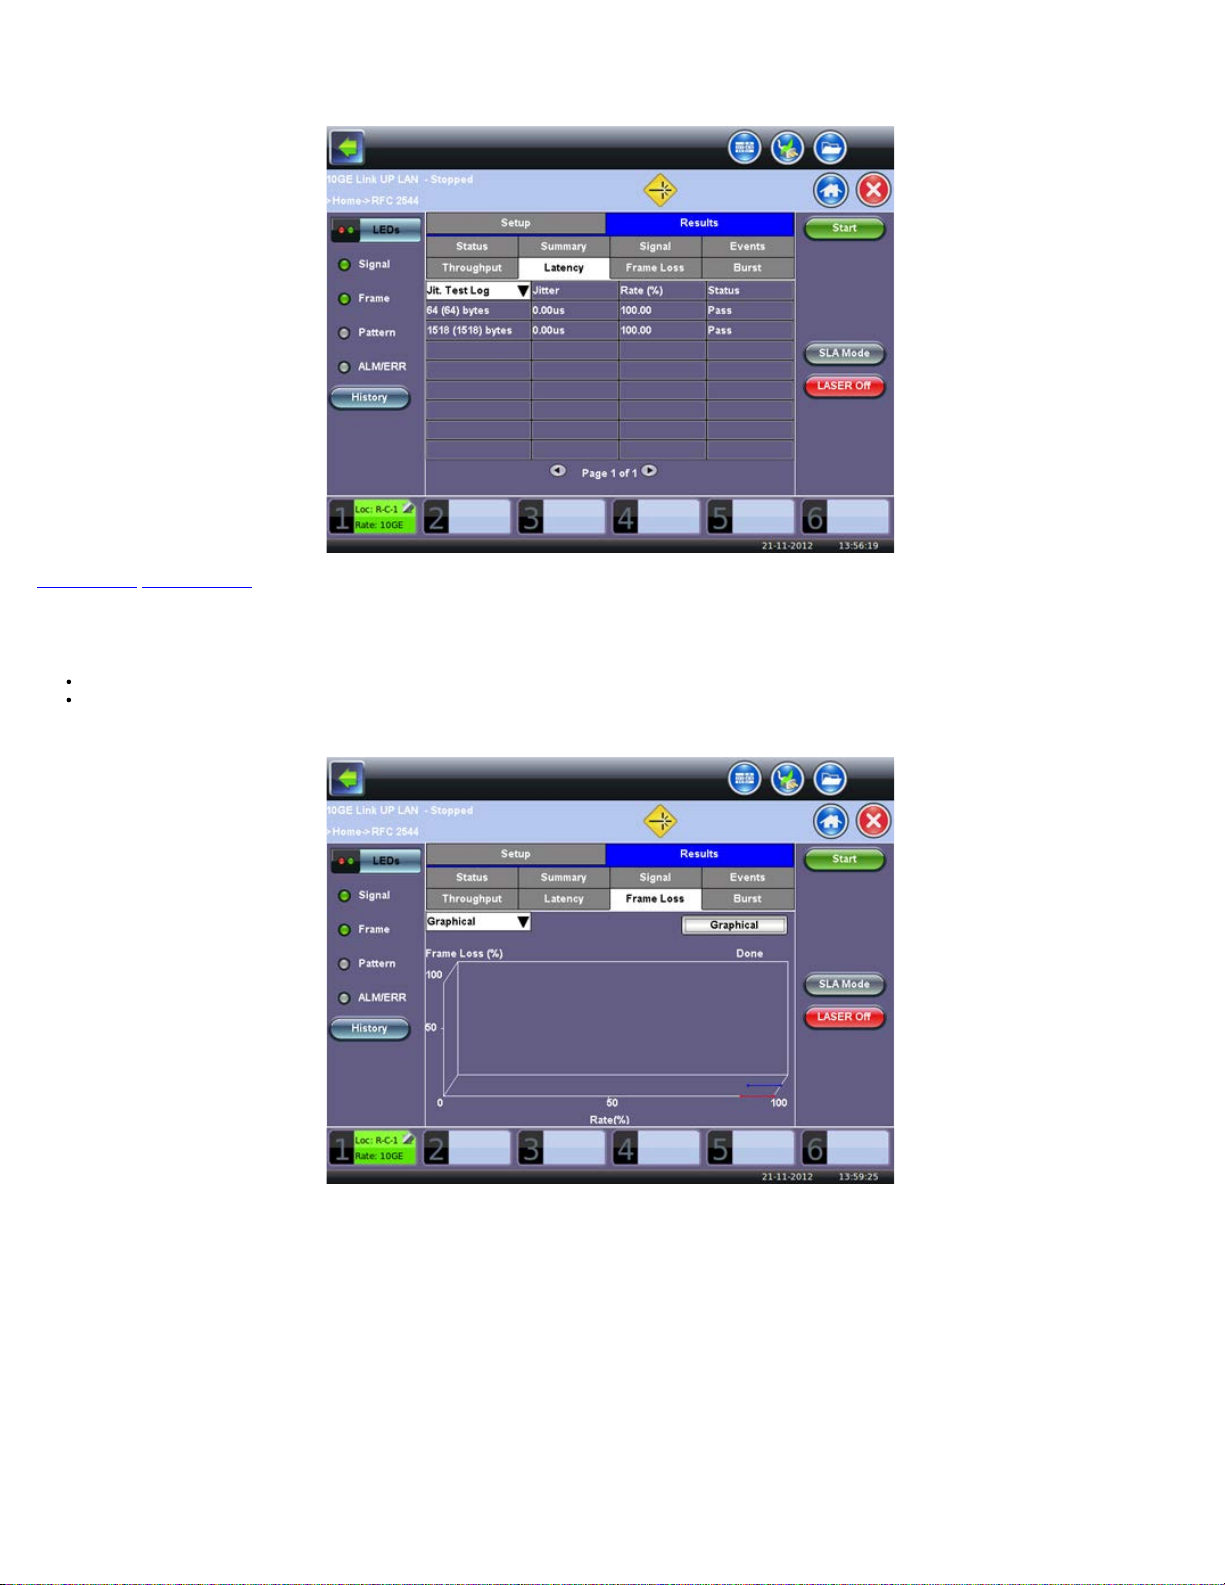
UX400 10G e-Manual D07-00-058P RevA00
Page 73 of 209
Go back to top Go back to TOC
6.3.2.7 Frame Loss
Frame loss displays the percentage of frames not received. Use the drop -down menu to select the Frame Loss format:
Summary and Test log tables display test frame length, byte size, frame loss (%) from received traffic, and rate (%) transmitted.
Graphical: Frame Loss displayed in line graph form (Frame size [bytes] vs Rate [%]). Tap on the Graphical Tab to see the legend.
RFC2544 Jitter Results Test Log
RFC2544 Results - Frame Loss Graphical
RFC2544 Results
- Graph Legend
Page 74
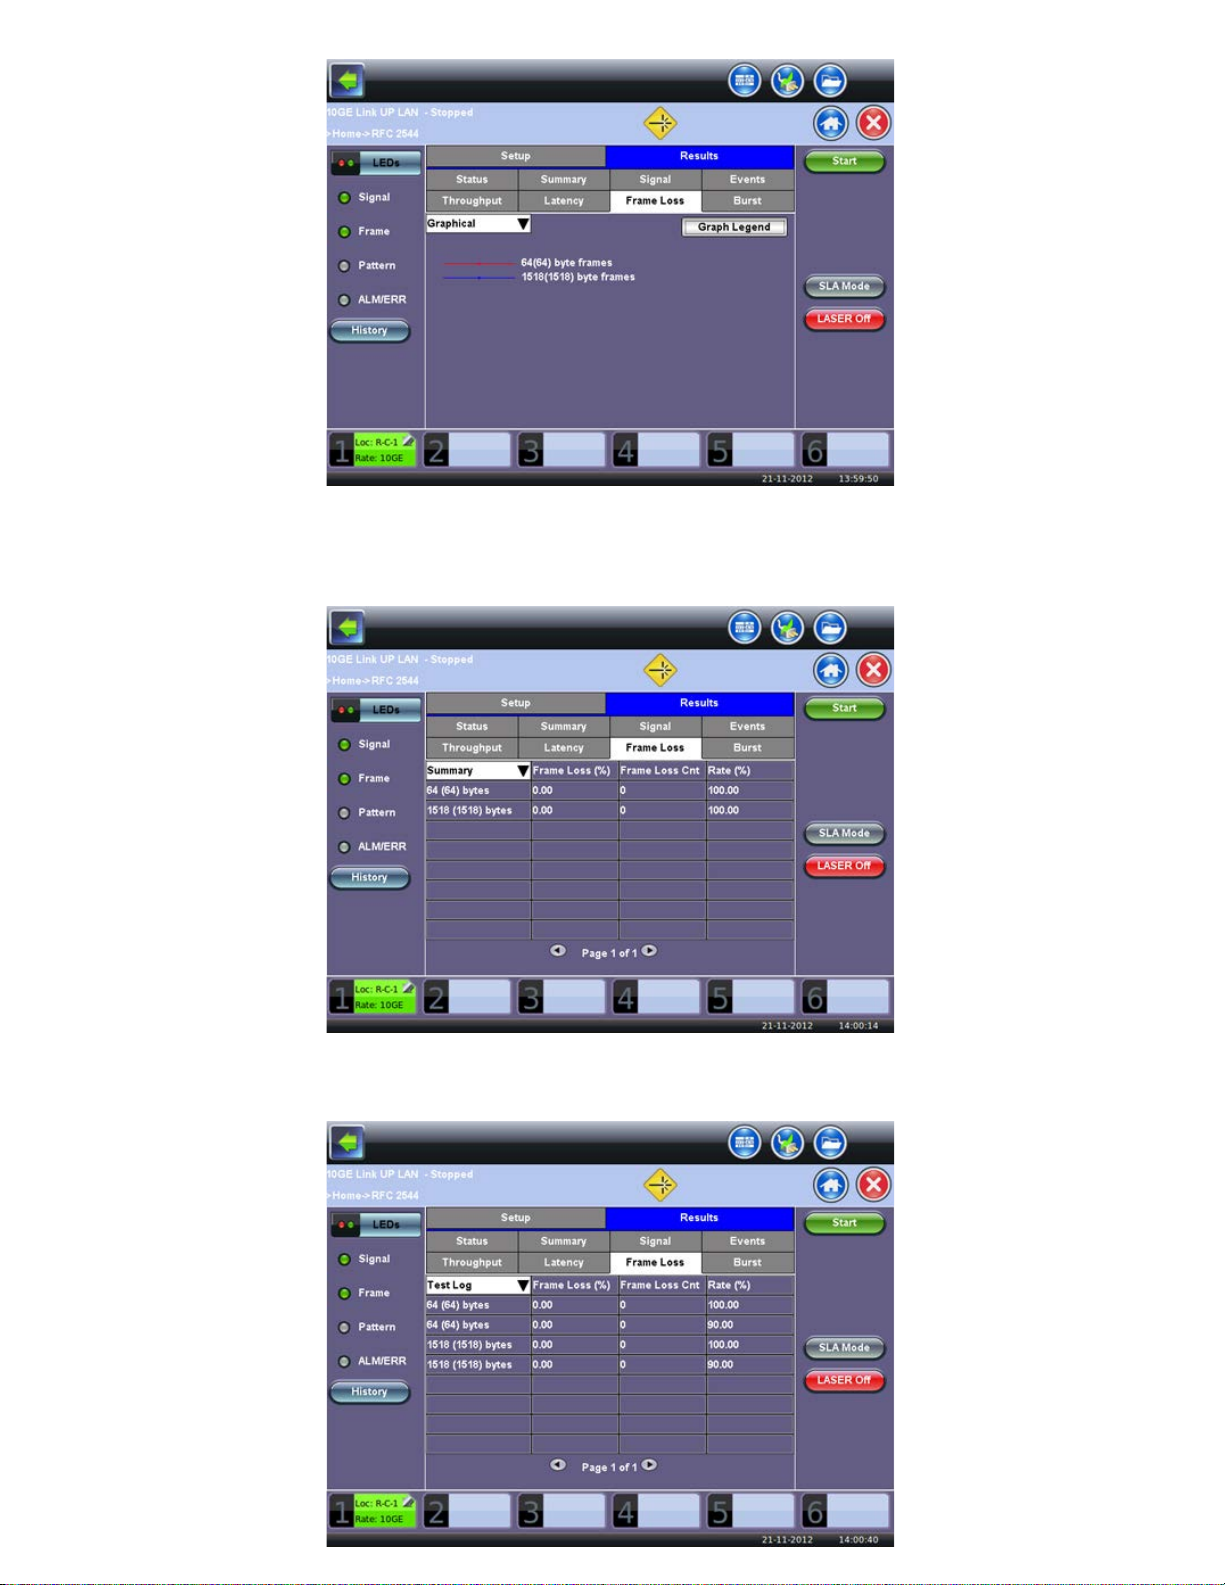
UX400 10G e-Manual D07-00-058P RevA00
Page 74 of 209
RFC2544 Results
RFC2544 Results
- Frame Loss Summary
- Frame Loss Test Log
Page 75
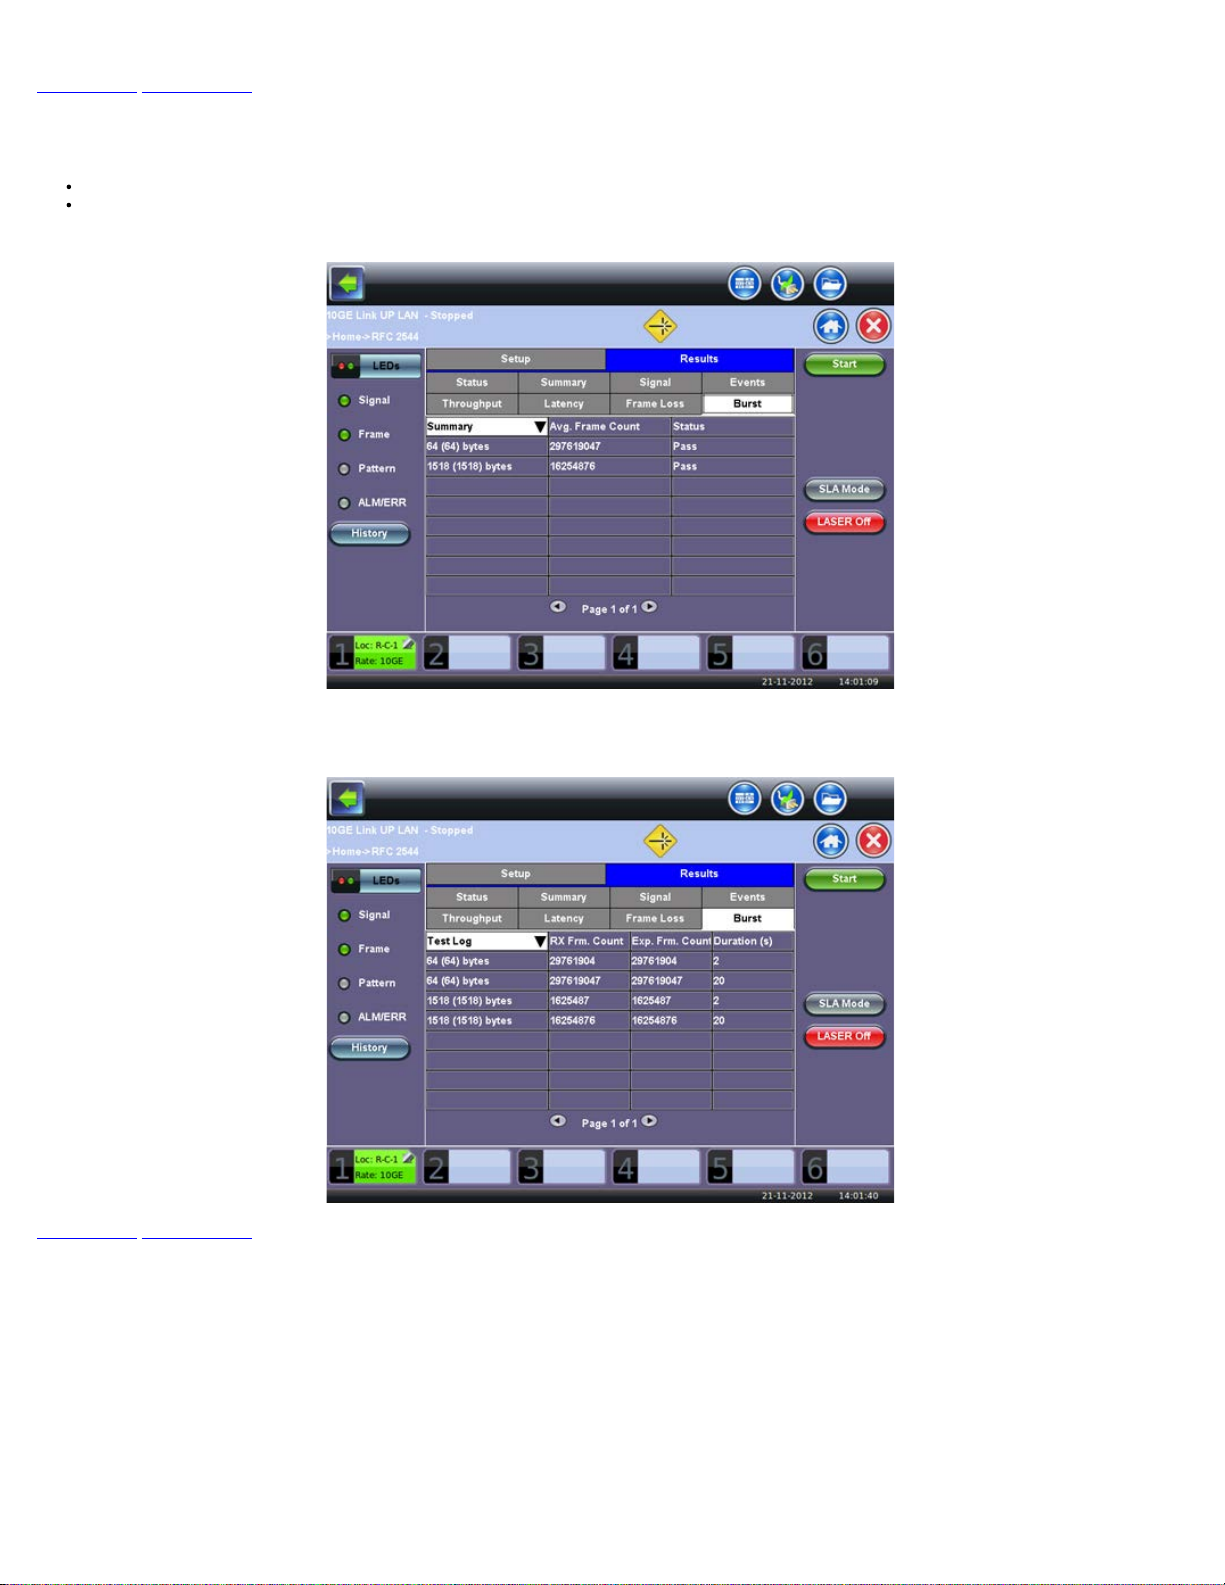
Go back to top Go back to TOC
UX400 10G e-Manual D07-00-058P RevA00
Page 75 of 209
6.3.2.8 Burst
Burstability (back-back) results are the number of frames successfully transmitted/received at the line rate. It is displayed in the following formats:
Summary table: Displays Average Frame Count received for each test frame length
Test log table: Displays Average Frame Count and Duration (seconds) for each test frame length
RFC2544 Results - Burst Summary
Go back to top Go back to TOC
6.3.3 Saving RFC 2544 Results
RFC2544 Results
- Burst Test Log
Once the test has been stopped the results can be saved by pressing the Save key on the platform's keypad.
A window will open giving the option of naming the results file. Enter the desired name for the file and tap apply. The results will be saved.
RFC2544 Results Save
Page 76
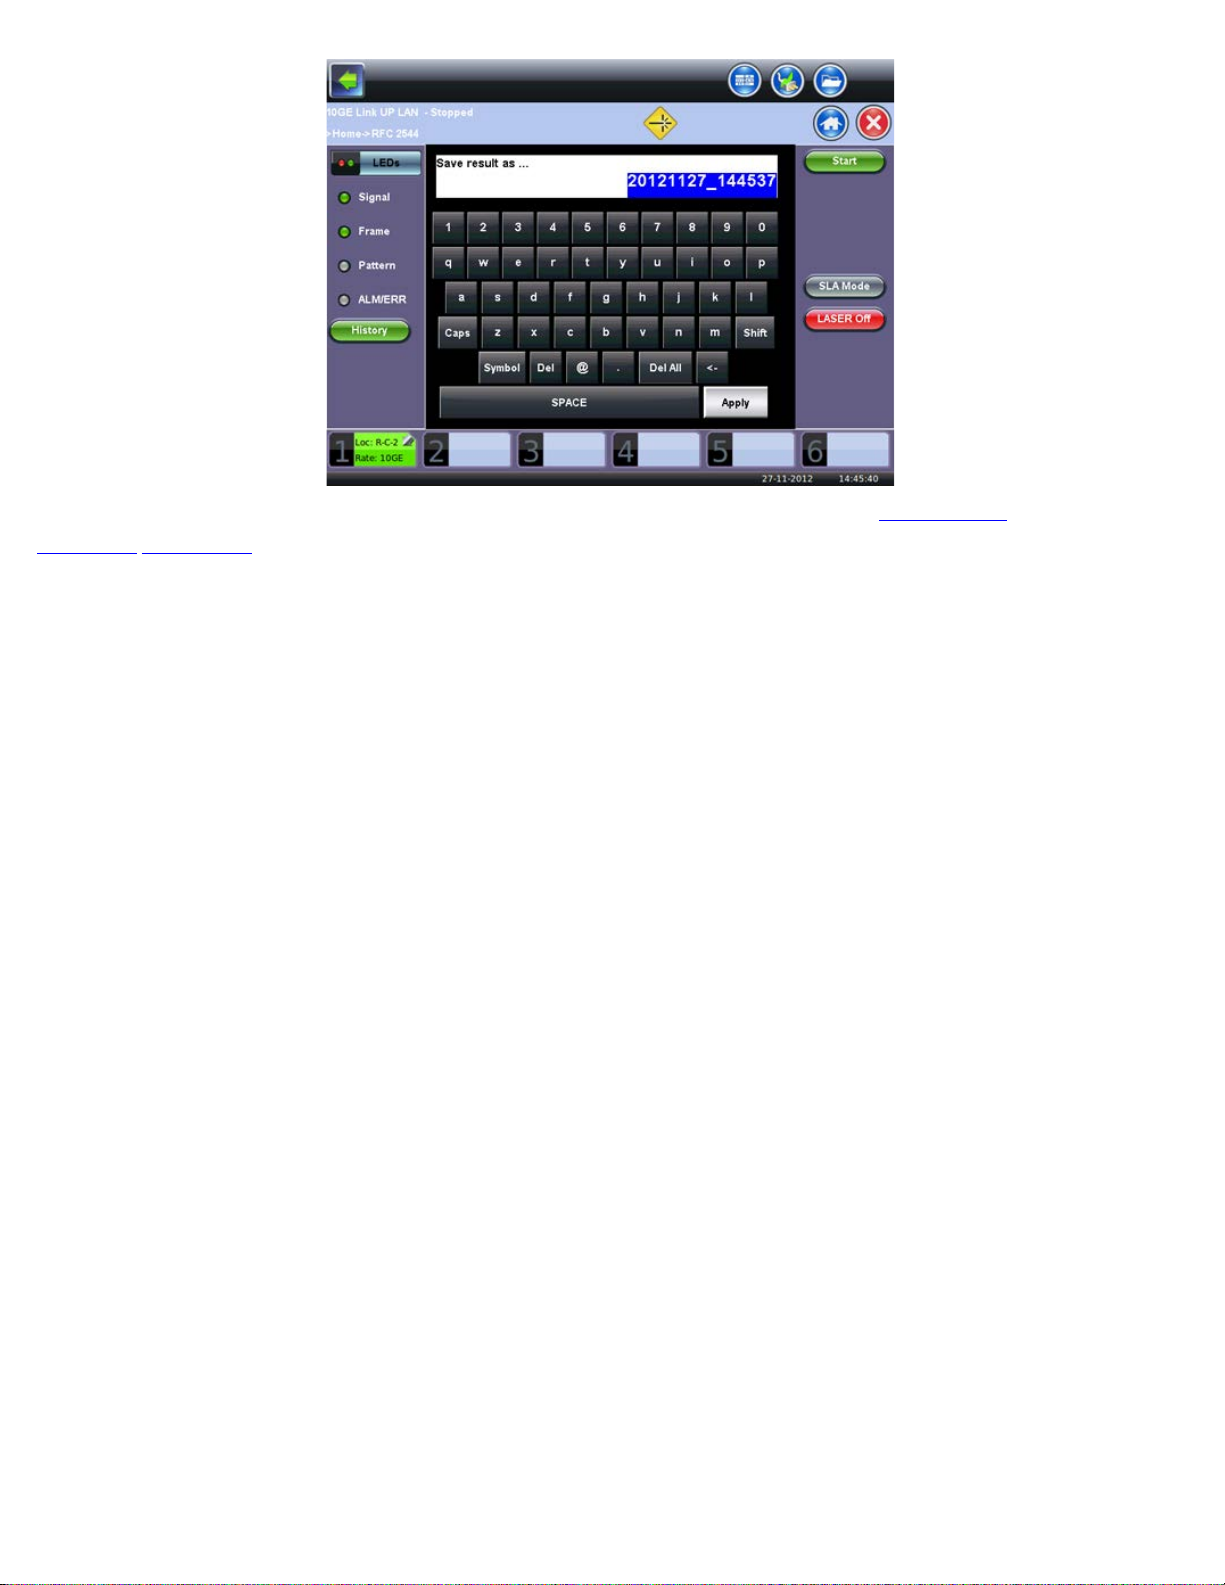
Once the results are saved, they can be viewed or renamed by going to Tools / System Settings screen> Files. Please see Chapter 5.3.3 Files section.
UX400 10G e-Manual D07-00-058P RevA00
Page 76 of 209
Go back to top Go back to TOC
Page 77
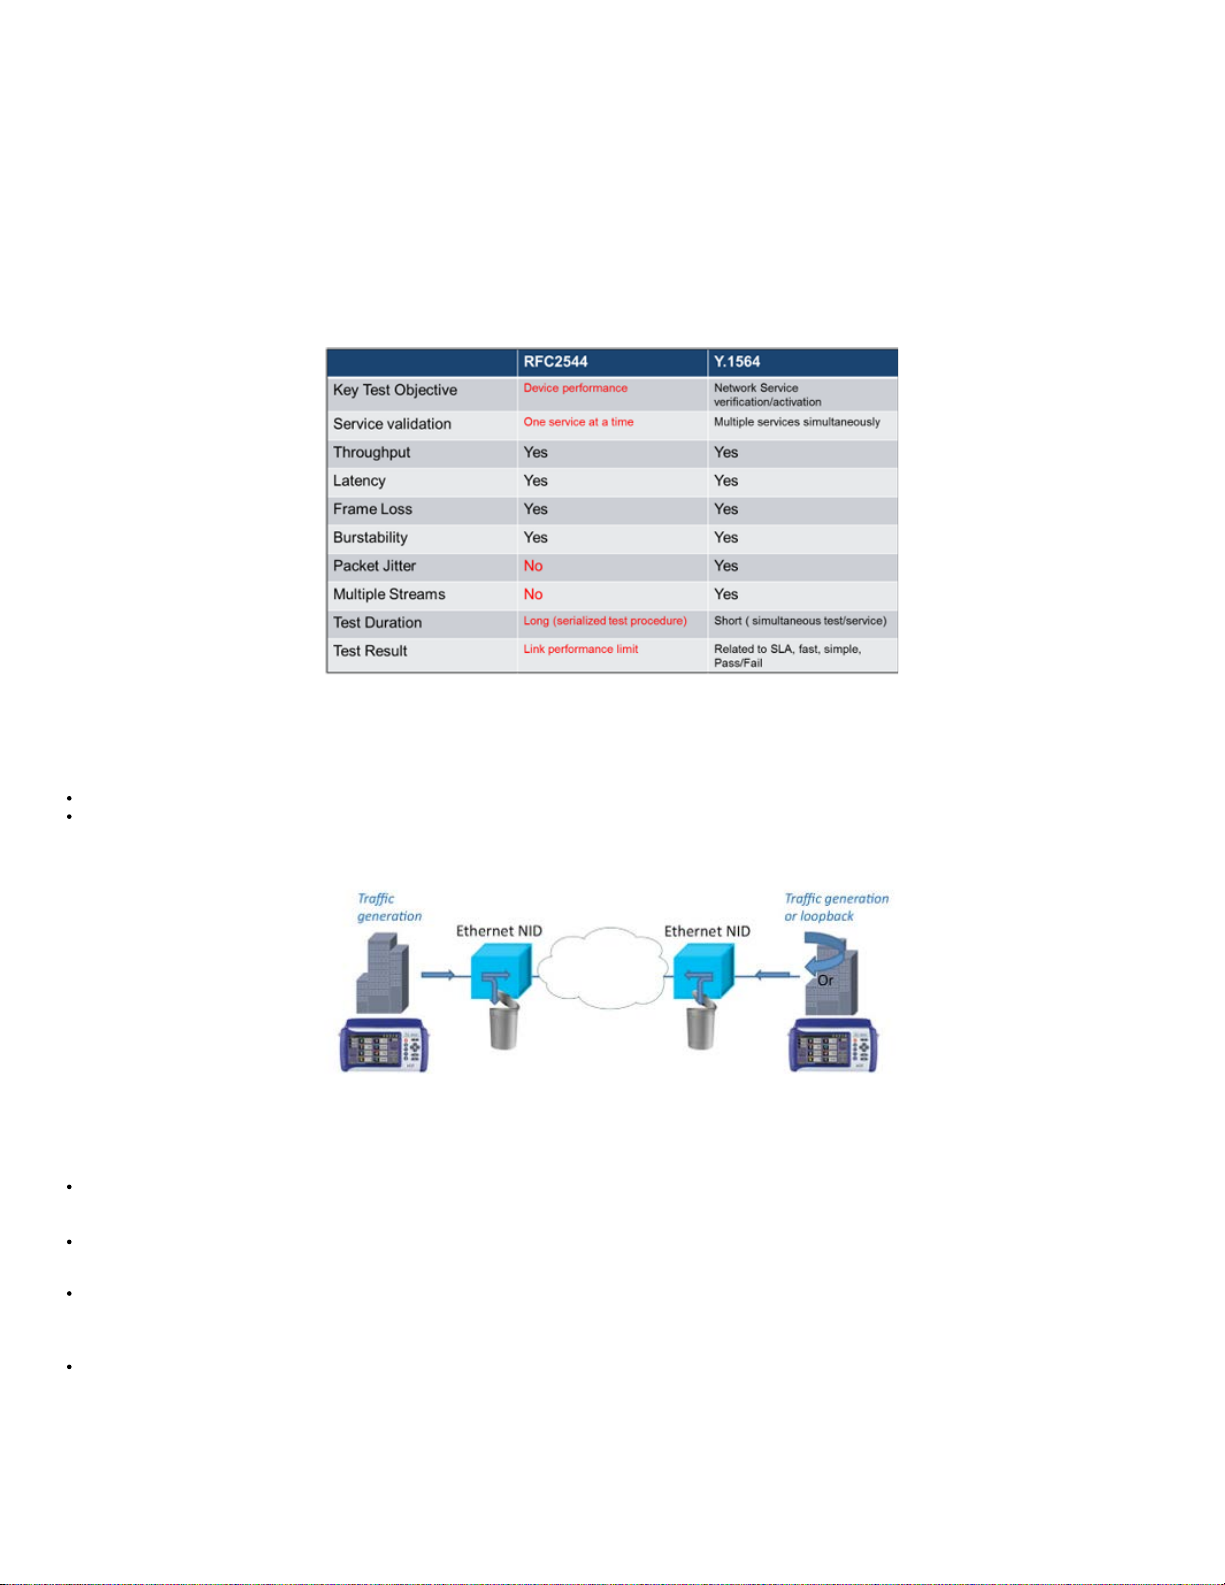
6.4 V-SAM
UX400 10G e-Manual D07-00-058P RevA00
Page 77 of 209
V-SAM (VeEX Service Activation Methodology) is an automated Ethernet service activation test feature conforming to the ITU-T Y.1564 standard, created to address and
solve the deficiencies of RFC 2544:
• RFC 2544 was limited to test at the maximum throughput line rate for a single service. SAM is able to run multiple services on a single 10/100/1000 or 10G
Ethernet line at a bandwidth ranging from 0 to the line rate, allowing for more realistic stream testing
• The Frame Delay Variation, also known as (packet) jitter was not included in RFC 2544. Jitter is a critical parameter for real time voice and video services.
It is now part of the SAM test suite.
• RFC 2544 validates the service parameters like frame loss, throughput and latency, one after the other, while SAM allows testing all the service critical
parameters simultaneously. This results in significant time saving compared to RFC 2544.
Comparison of RFC 2544 and Y.1564
Test Methodology
The purpose of the SAM test suite is to verify that the service is compliant to its Bandwidth Profile and Service Acceptance Criteria. The test is broken down into two
phases:
Phase 1: Service Configuration test: The services running on the same line are tested one by one to verify the correct service profile provisioning.
Phase 2: Service Performance test : The services running on the same line are tested simultaneously over an extended period of time, to verify network
robustness.
Test Application
Phase 1: Service Configuration Test
The service configuration test is broken down into three steps. The steps are tested individually for all the services delivered on the same line.
Step 1: Committed Information Rate (CIR) Test : Traffic is transmitted at the CIR for a short period of time and the received traffic is evaluated against the
Service Acceptance Criteria (FLR, FTD, FDV) measured simultaneously. The CIR test passes if the measurements on the received traffic stay below the
performance objectives.
Step 2: Excess Information Rate (EIR) Test: Traffic is transmitted at the CIR+EIR rate for a short period of time; the EIR test passes if the received traffic rate is
between the CIR (minus the margin allowed by the FLR) and CIR+EIR.
Step 3: Traffic Policing (Overshoot Test) : The purpose of the Traffic Policing Test is to ensure that when transmitting at a rate higher than the allowed CIR+EIR,
the excess traffic will be appropriately blocked to avoid interference with other services. For this test, traffic is transmitted at 25% higher than the CIR+EIR for a
short period of time. The test passes if the received traffic rate is at least at the CIR (minus the margin allowed by the FLR) but does not exceed the allowed
CIR+EIR.
At this time the Committed Burst Size (CBS) and Excess Burst Size (EBS) tests are considered experimental and not an integral part of the standard.
Service Bandwidth Profile
Page 78
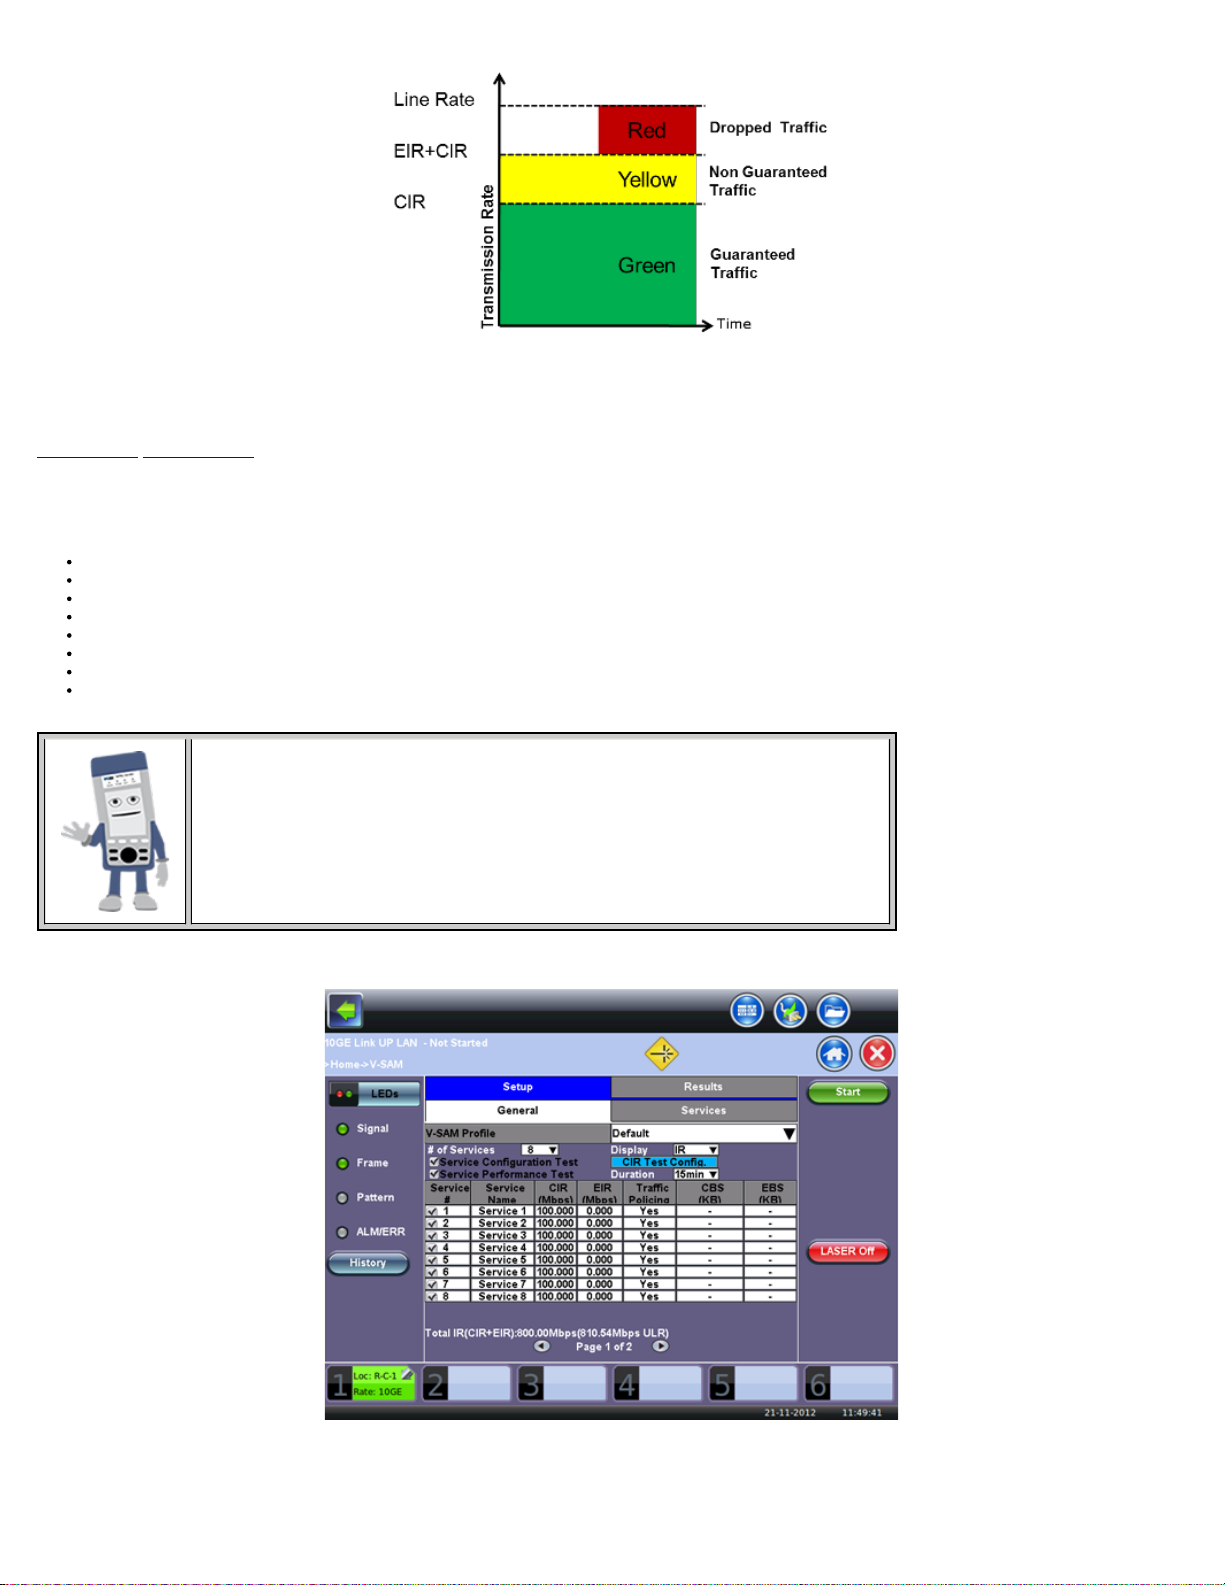
Phase 2: Service Performance Test
UX400 10G e-Manual D07-00-058P RevA00
Page 78 of 209
Services running on the same line are tested simultaneously over an extended period of time, to verify network robustness. Service Acceptance Criteria (SAC) including
Frame Transfer Delay (FTD), Frame Delay Variation (FDV), Frame Loss Ratio (FLR) and Availability (AVAIL) are verified for each service.
Go back to top Go back to TOC
6.4.1 V-SAM Setup
General (Page 1 and 2)
V-SAM Profile: Delete, Save, Save as..., Default, or Last Configuration.
# of Services: Select the number of services to run. Up to 10 services can be chosen for the 10 GE interface.
Display: IR or ULR
Service Configuration Test: Enable or Disable the configuration test.
Service Performance Test: Enable or Disable the performance test.
Service Configuration and Performance Tests can be enabled independently.
CIR Test Config: Tap on the box to configure the Committed Information Rate Test on another screen.
Duration: Select the Service Performance Test duration. Options are 15min, 30min, 1hr, 2hr, 24hr or user defined. If user -defined is selected, input a duration
between 1 -10000 min.
Enabling/Disabling Tests
A check next to the Service number in the Service Summary table indicates that the test for the
corresponding service is set to run. Tap on the box to remove the check and cancel the test for that
service.
V-SAM - Setup - General (Page 1)
V-SAM - Setup - General (Page 2)
Page 79
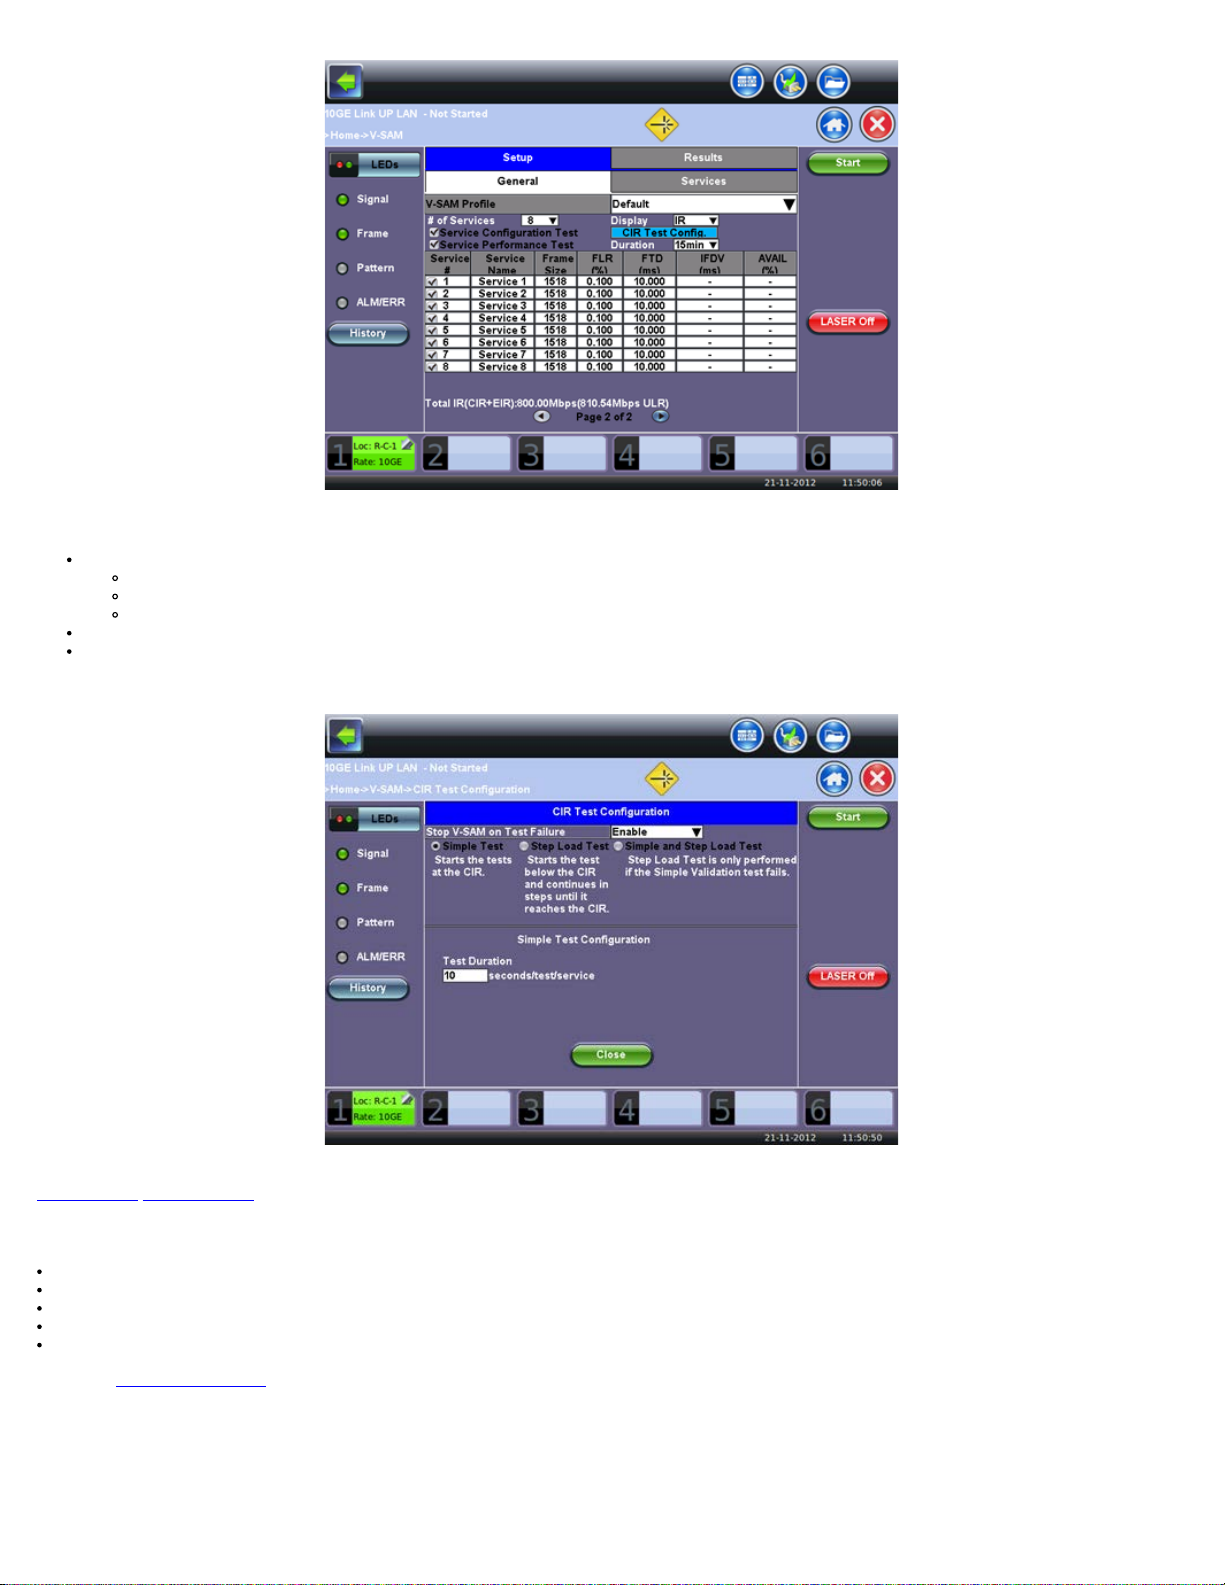
CIR Test Configuration
UX400 10G e-Manual D07-00-058P RevA00
Page 79 of 209
CIR Test Config.: Select Simple Test, Step Load Test, or Simple and Step.
Simple Test: Starts the tests at the CIR.
Step Load Test: Starts the test below the CIR and continues in steps until it reaches the CIR.
Simple and Step Load Test: Step Load Test performs only if the Simple Validation test fails.
Tap on the Test Duration box to input a test duration (test duration must be less than 999 sec).
Tap on the table to modify the CIR value percentage for each step.
CIR Test Config
Go back to top Go back to TOC
6.4.1.1 Header Settings
Service #: Select a service to configure
Service Name: Assign a name to the service if desired.
Frame Type: 802.3 Raw or Ethernet II (DIX)
Frame Size Type: A fixed frame size is chosen as default
Frame Size: Input a fixed frame size within the range of 64-10000 bytes.
Please see
6.3.1 RFC 2544 Setup and follow the setup procedure to configure the remaining Header Settings for V-SAM.
V-SAM Setup - Services - Header Settings
Page 80
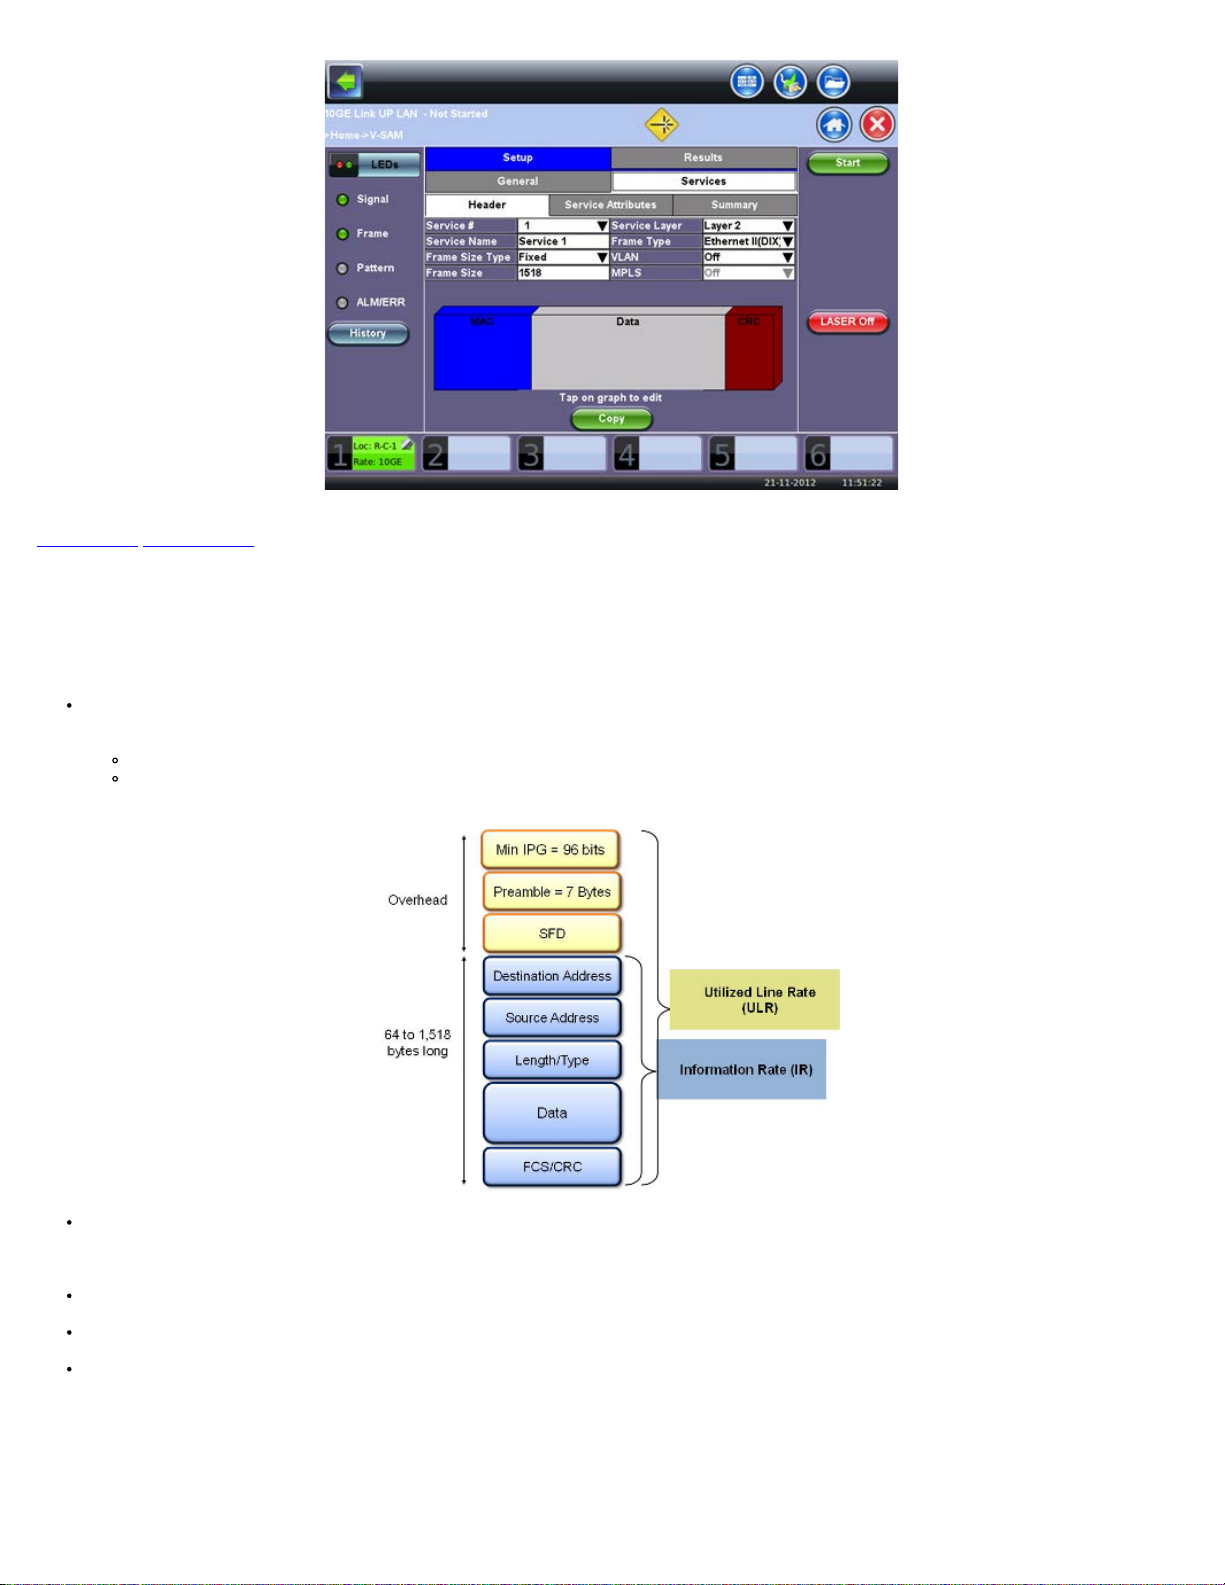
Go back to top Go back to TOC
UX400 10G e-Manual D07-00-058P RevA00
Page 80 of 209
6.4.1.2 Service Attributes
Bandwidth Profile Parameters
The Bandwidth Profile specifies how much traffic the customer is authorized to transmit and how the frames are prioritized within the network. In the Bandwidth table, the
user specifies the following bandwidth criteria:
CIR: Committed Information Rate. This is the guaranteed maximum rate at which the customer can send frames that are assured to be forwarded through the
network without being dropped. Tap on the box to enter a rate and choose between IR Mbps, IR Gbps , ULR Mbps or ULR Gbps. Allowed values range from
0.01Mbps to the line bandwidth.
Information Rate (IR): Measures the average Ethernet frame rate starting at the MAC address field and ending at the CRC.
Utilized Line Rate (ULR): Measures the average Ethernet frame rate starting with the overhead and ending at the CRC.
V-SAM Services - Header
Excess Information Rate (EIR): Maximum rate above the CIR at which the customer can send frames that will be forwarded on a best effort basis, but may be
dropped in the event of congestion within the network. The combined CIR and EIR must not exceed the line bandwidth. Traffic beyond CIR + EIR will be dropped
when it enters the carrier's network. Tap on the box to enter a rate. EIR is expressed in terms IR Mbps, IR Gbps, ULR Mbps or ULR Gbps . Select a term to
express EIR or select Disable to disable the test.
Traf. Policing: Enable or Disable the traffic policing test. For this test, traffic is transmitted at 25% higher than the CIR+EIR. The Policing test fails if the higher
traffic rate is allowed through the network.
Color Aware Service: Enable or Disable
Note: A VLAN Tag must be enabled for Color Aware Service to be enabled.
CBS and EBS are currently not supported with this release.
V-SAM Setup - Services - Service Attributes
Page 81
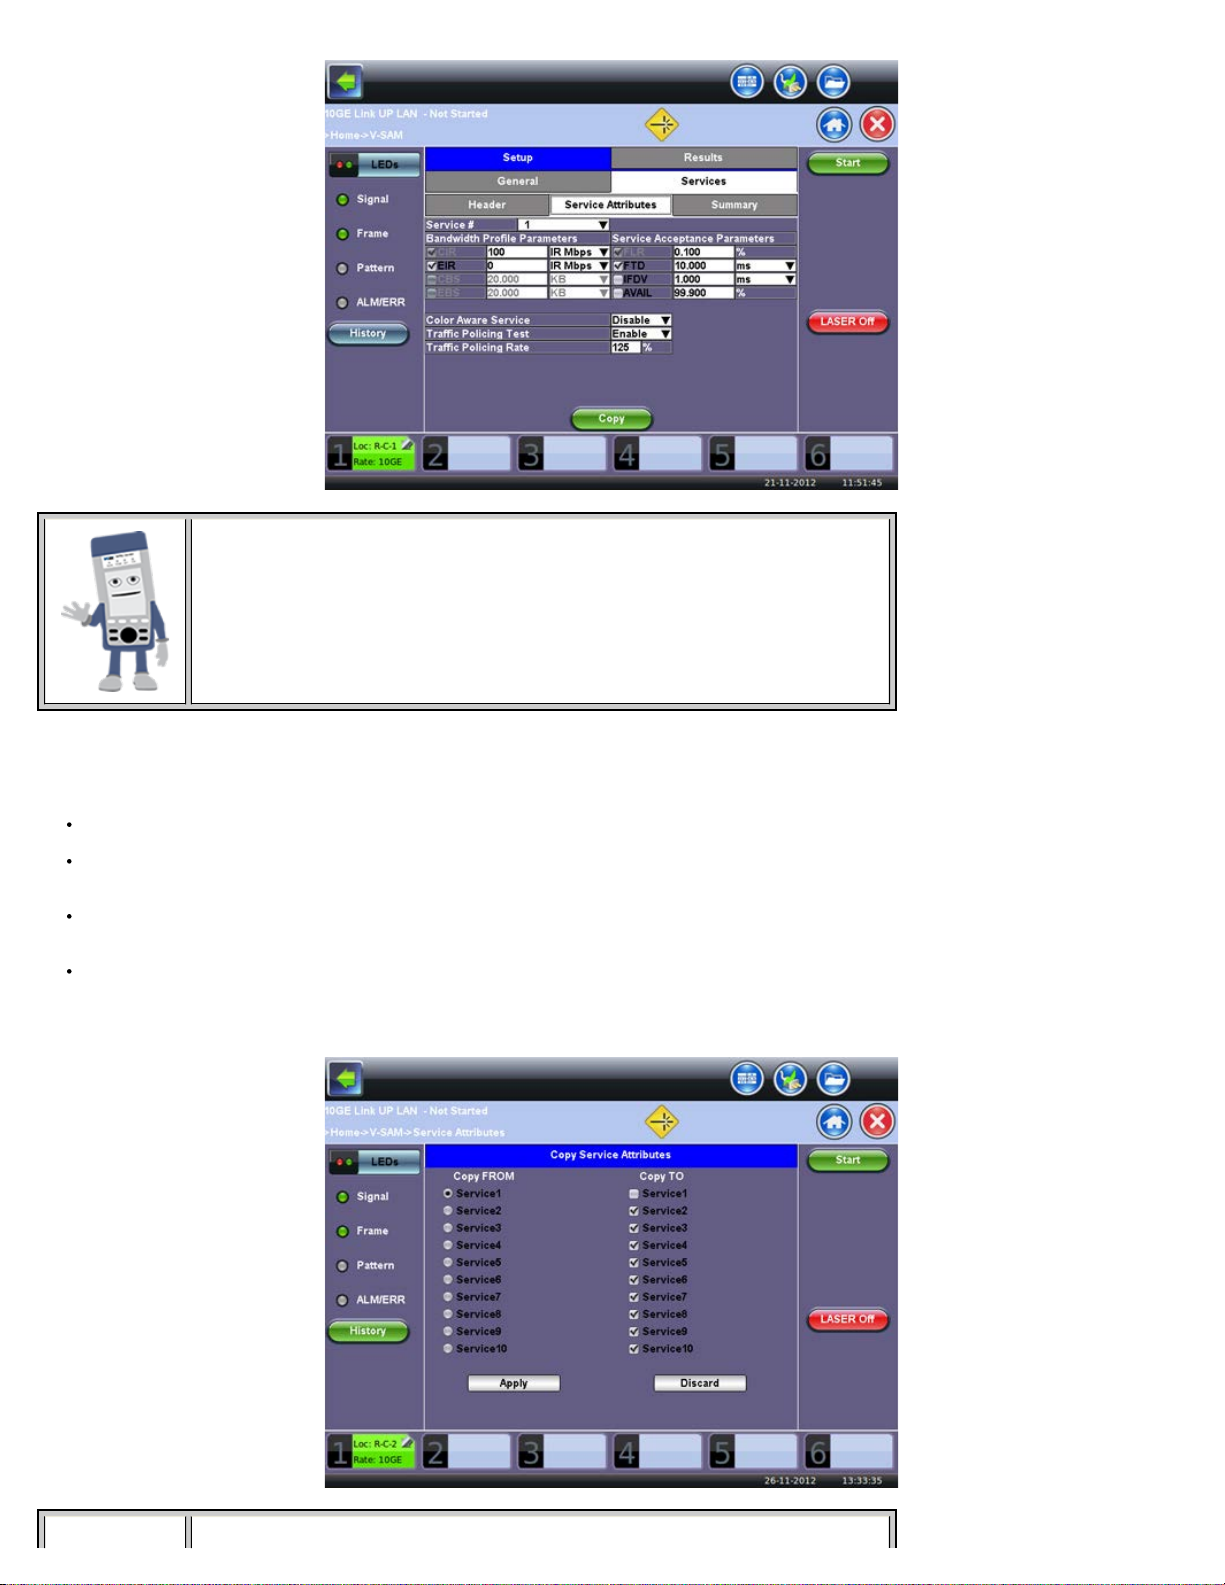
Enabling/Disabling Tests
UX400 10G e-Manual D07-00-058P RevA00
Page 81 of 209
A check next to the parameters in the Service Attributes table indicates that the test for the
corresponding service is set to run. Tap on the box to remove the check and cancel the test for that
service.
Service Acceptance Parameters
The user establishes Pass/Fail test criteria for the following Service Acceptance Criteria. Values define the minimum requirements to ensure that the service meets the
Service Level Agreement (SLA):
FLR: Maximum ratio of lost frames to the total transmitted frames allowed to still be compliant with the SLA. FLR is only guaranteed for traffic conforming to the
CIR. Enter a percentage from 0 -100.
FTD: Maximum transfer time that the frames can take to travel from source to destination, and still be compliant with the SLA. FTD is only guaranteed for traffic
conforming to the CIR. Values are measured in us, ms, or sec. Input a value within the digital range of .001-999 and 1 us- 999sec. The user can also choose to
Disable the FTD threshold evaluation. FTD will be measured anyway but the value will not contribute toward passing or failing the service.
IFDV: Maximum frame jitter allowed to still be compliant with the SLA. FDV is only guaranteed for traffic conforming to the CIR. Values are measured in us, ms, or
sec. Input a value within the digital range of .001 -999 and 1 us-999sec. The user can also choose to Disable the IFDV threshold evaluation. IFDV will be
measured anyway but the value will not contribute toward passing or failing the service.
AVAIL: Minimum percentage of service availability allowed to still be compliant with the SLA. The service becomes unavailable if more than 50% of the frames are
errored or missing in a one second interval. Availability is only guaranteed for traffic conforming to the CIR. Enter a percentage from 0-100. The user can also
choose to Disable the AVAIL threshold evaluation. AVAIL will be measured anyway but the value will not contribute toward passing or failing the service.
Copying Services
Page 82
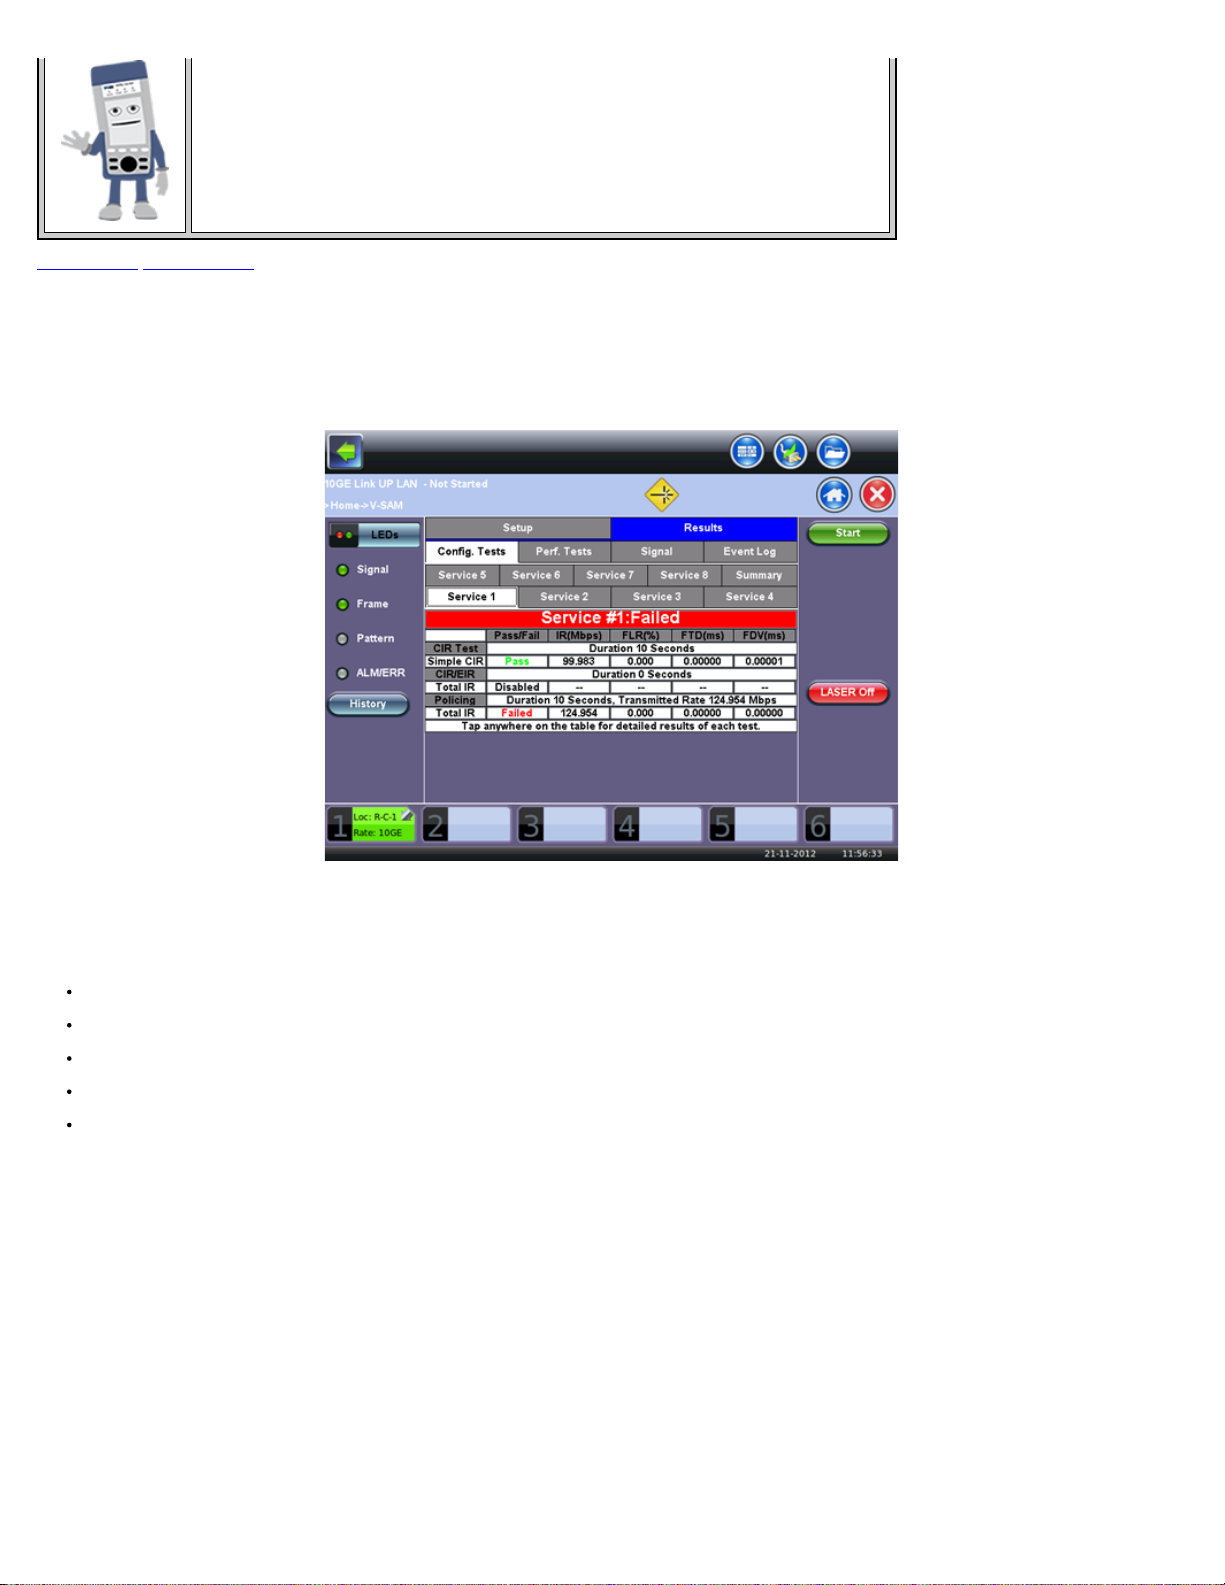
Copying Services
UX400 10G e-Manual D07-00-058P RevA00
Page 82 of 209
Tap on the Copy button on the bottom of the Header or Service Attributes tabs to copy frame
parameters specific to that tab to other services. For example, pressing Copy on the Header tab will
only transfer header parameters to other services.
Go back to top Go back to TOC
6.4.2 Results
Note: To run the test, make sure that traffic is being looped back at the far- end of the network under test.
6.4.2.1 Configuration Tests
Results - Config. Tests - Service 1
The Config. Tests tab lists the Pass/Fail status of each service and test.
Tapping on the table brings up a screen with CIR, CIR/EIR and Policing Test results for the chosen Service. CIR, CIR/EIR Test , and Policing tabs display min, mean,
and max values for IR Mbps, FTD, FDV, Frame Loss Count , and Frame Loss Ratio (%). If Step Load was selected for the CIR Test, these values will be displayed for
each step. If any measured values do not meet the service test parameters set in the Bandwidth and Threshold tabs, the test fails.
IR Mbps: Information Rate. Measures the average Ethernet frame rate starting at the MAC address field and ending at the CRC.
FTD: Measures the time that the frames can take to travel from source to destination.
FDV: Measures the frame jitter.
Frame Loss Count: Counts the number of lost frames.
Frame Loss Ratio: Ratio of lost frames to the total transmitted frames.
CIR Test: The test passes if all measured values are below the thresholds configured. If a threshold is disabled, it will not be evaluated towards pass/fail criteria.
CIR Test - Service 1
Page 83
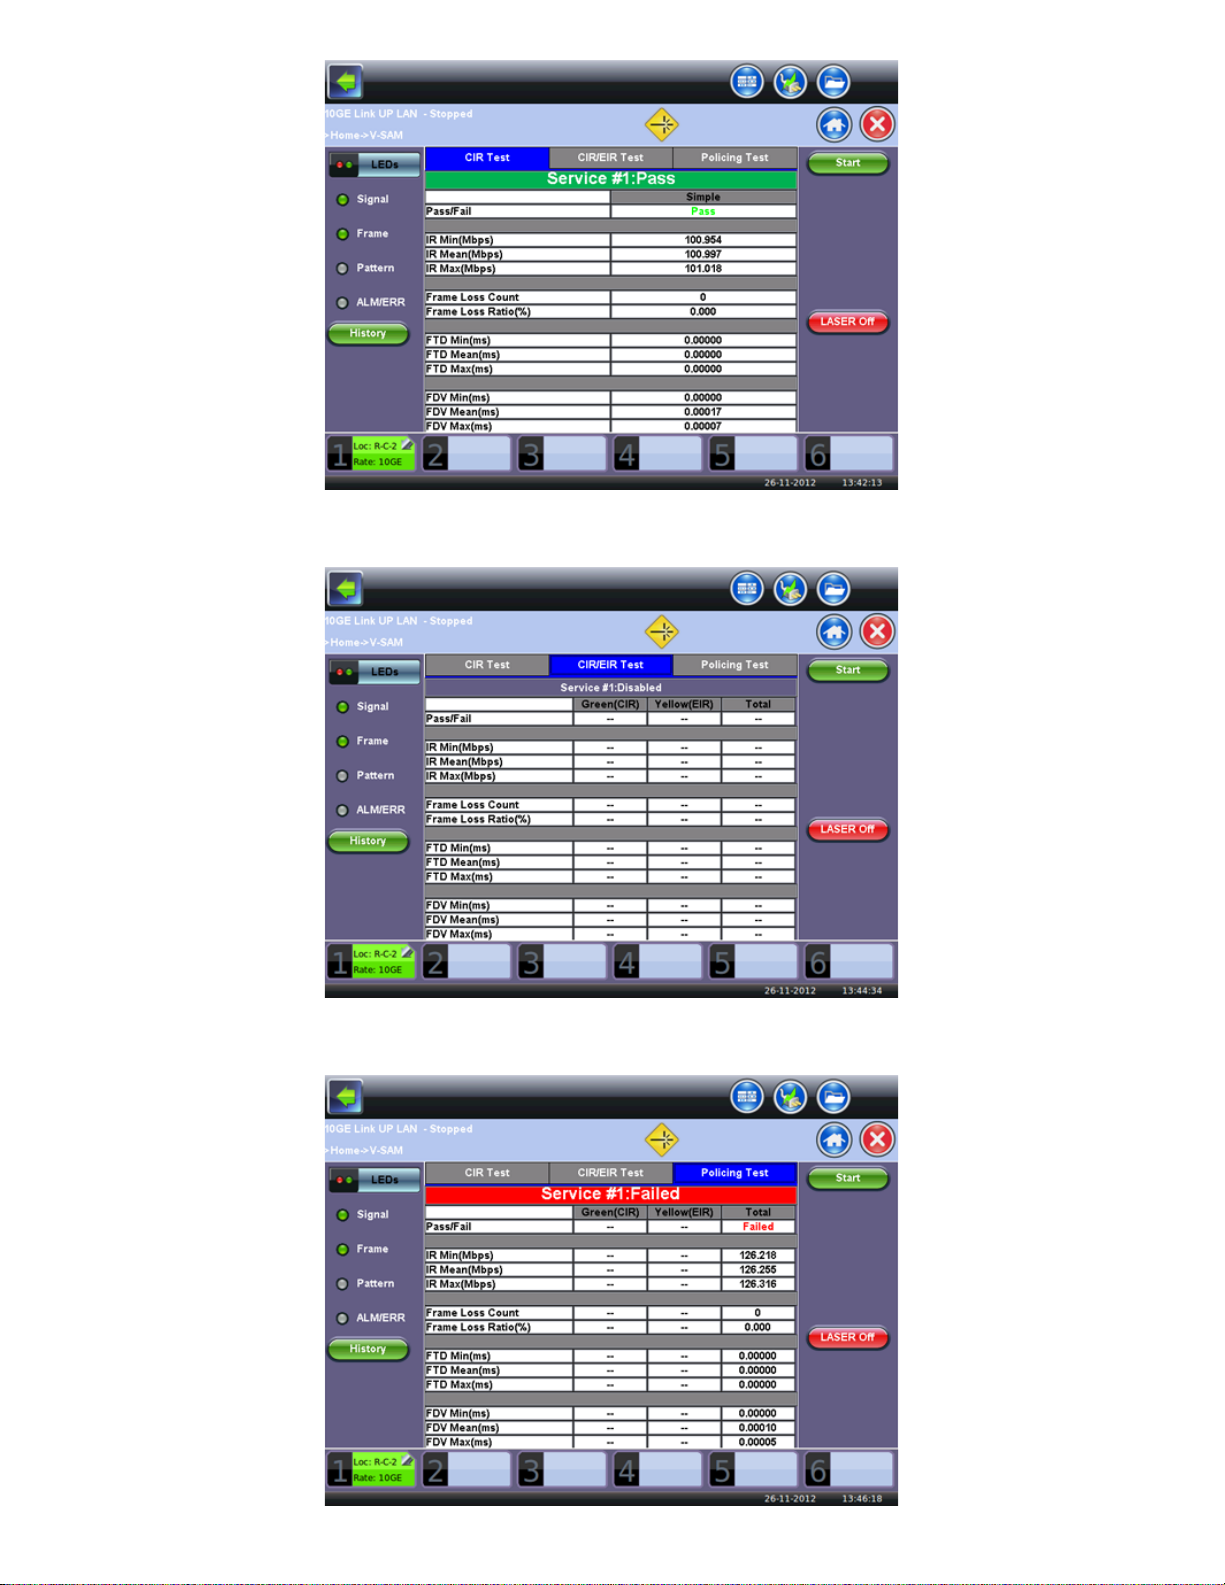
CIR/EIR test : The test passes if the received IR value is between the CIR (minus the margin allowed by the FLR) and CIR+EIR.
UX400 10G e-Manual D07-00-058P RevA00
Page 83 of 209
CIR/EIR Test - Service 1
Policing test : The test passes if the received traffic rate is at least at the CIR (minus the margin allowed by the FLR) but does not exceed the allowed CIR+EIR.
Policing Test - Service 1
Page 84
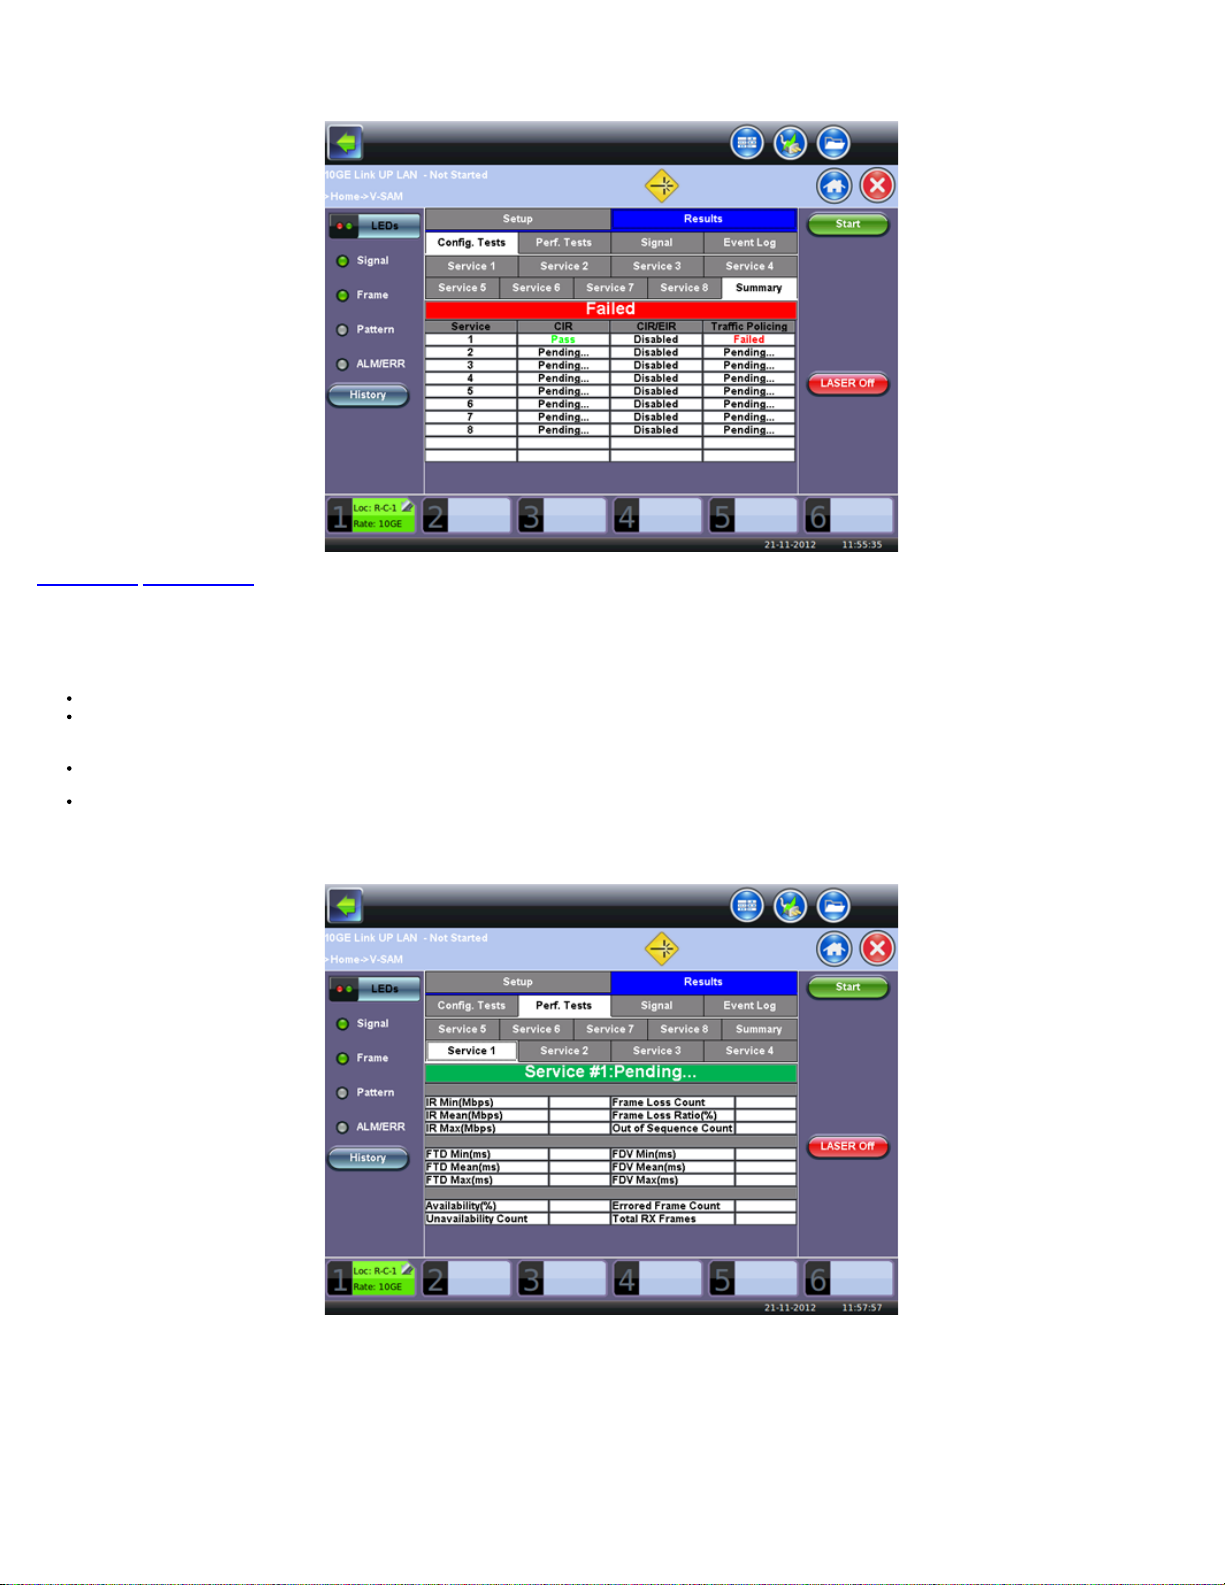
Summary: The Summary tab displays the status of each service and test as Pass, Failed, Pending, or Disabled.
UX400 10G e-Manual D07-00-058P RevA00
Page 84 of 209
Go back to top Go back to TOC
6.4.2.2 Performance Test
The Service # tabs display min, mean, and max values for IR Mbps, FTD, FDV, Frame Loss Count , Frame Loss Ratio (%), Availability, and Errored Frame Count.
Pass/Fail/Pending status of each test is displayed on the top of each table.
IR Mbps, FTD, FDV, Frame Loss Count, Frame Loss Ratio (%) definitions are listed in the Configuration Test section.
Availability: Minimum percentage of service availability allowed to still be compliant with the SLA. The service becomes unavailable if more than 50% of the
frames are errored or missing in a one second interval. Availability is only guaranteed for traffic conforming to the CIR.
Total RX Frames: Total number of frames received
Errored Frame Count: Number of frames with CRC or IP Checksum errors
Measured values that do not meet the service test parameters set in the Bandwidth and Threshold tabs cause the test to fail.
Results - Config. Tests - Summary
The Summary
Perf. Test - Service 1
tab displays the status of each service and test as Pass, Failed, Pending, or Disabled.
Perf. Tests - Summary
Page 85
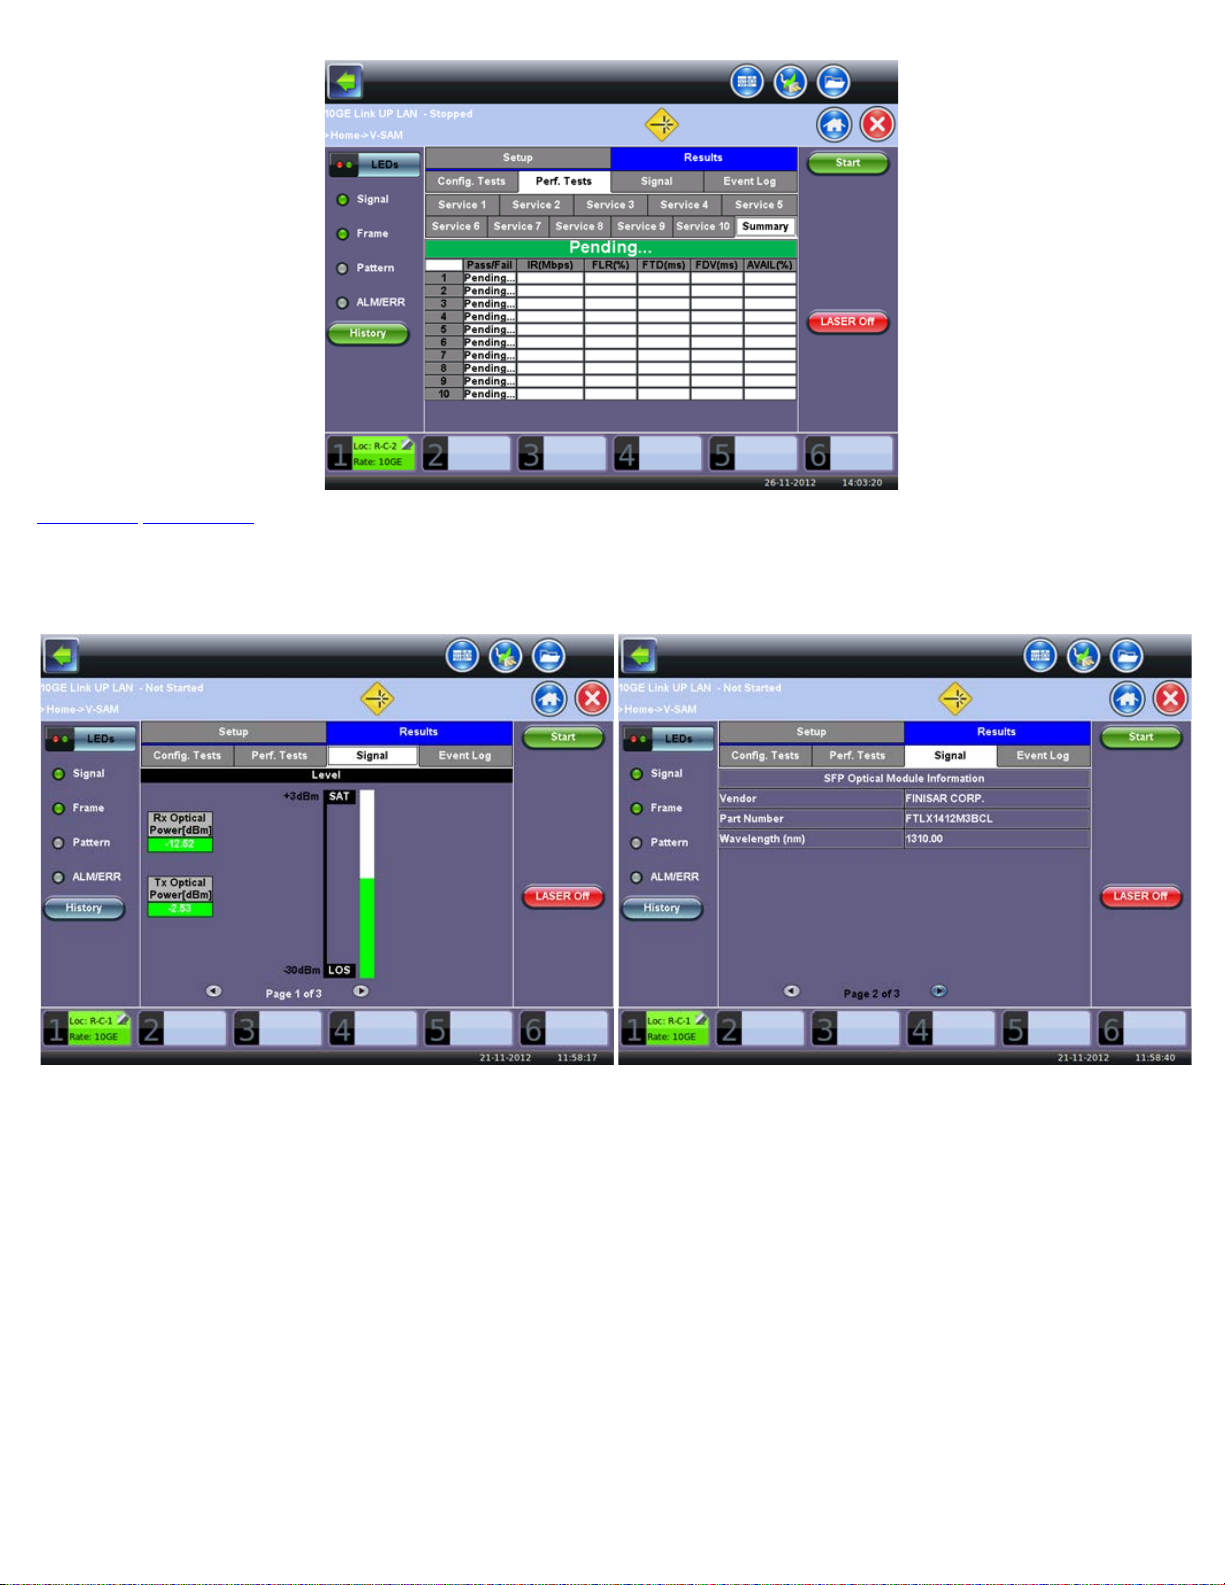
Go back to top Go back to TOC
UX400 10G e-Manual D07-00-058P RevA00
Page 85 of 209
6.4.2.3 Signal
The Signal tab displays the optical level measured by the SFP or XFP transceiver.
Signal Page 1 Signal Page 2
Signal Page
3
Page 86
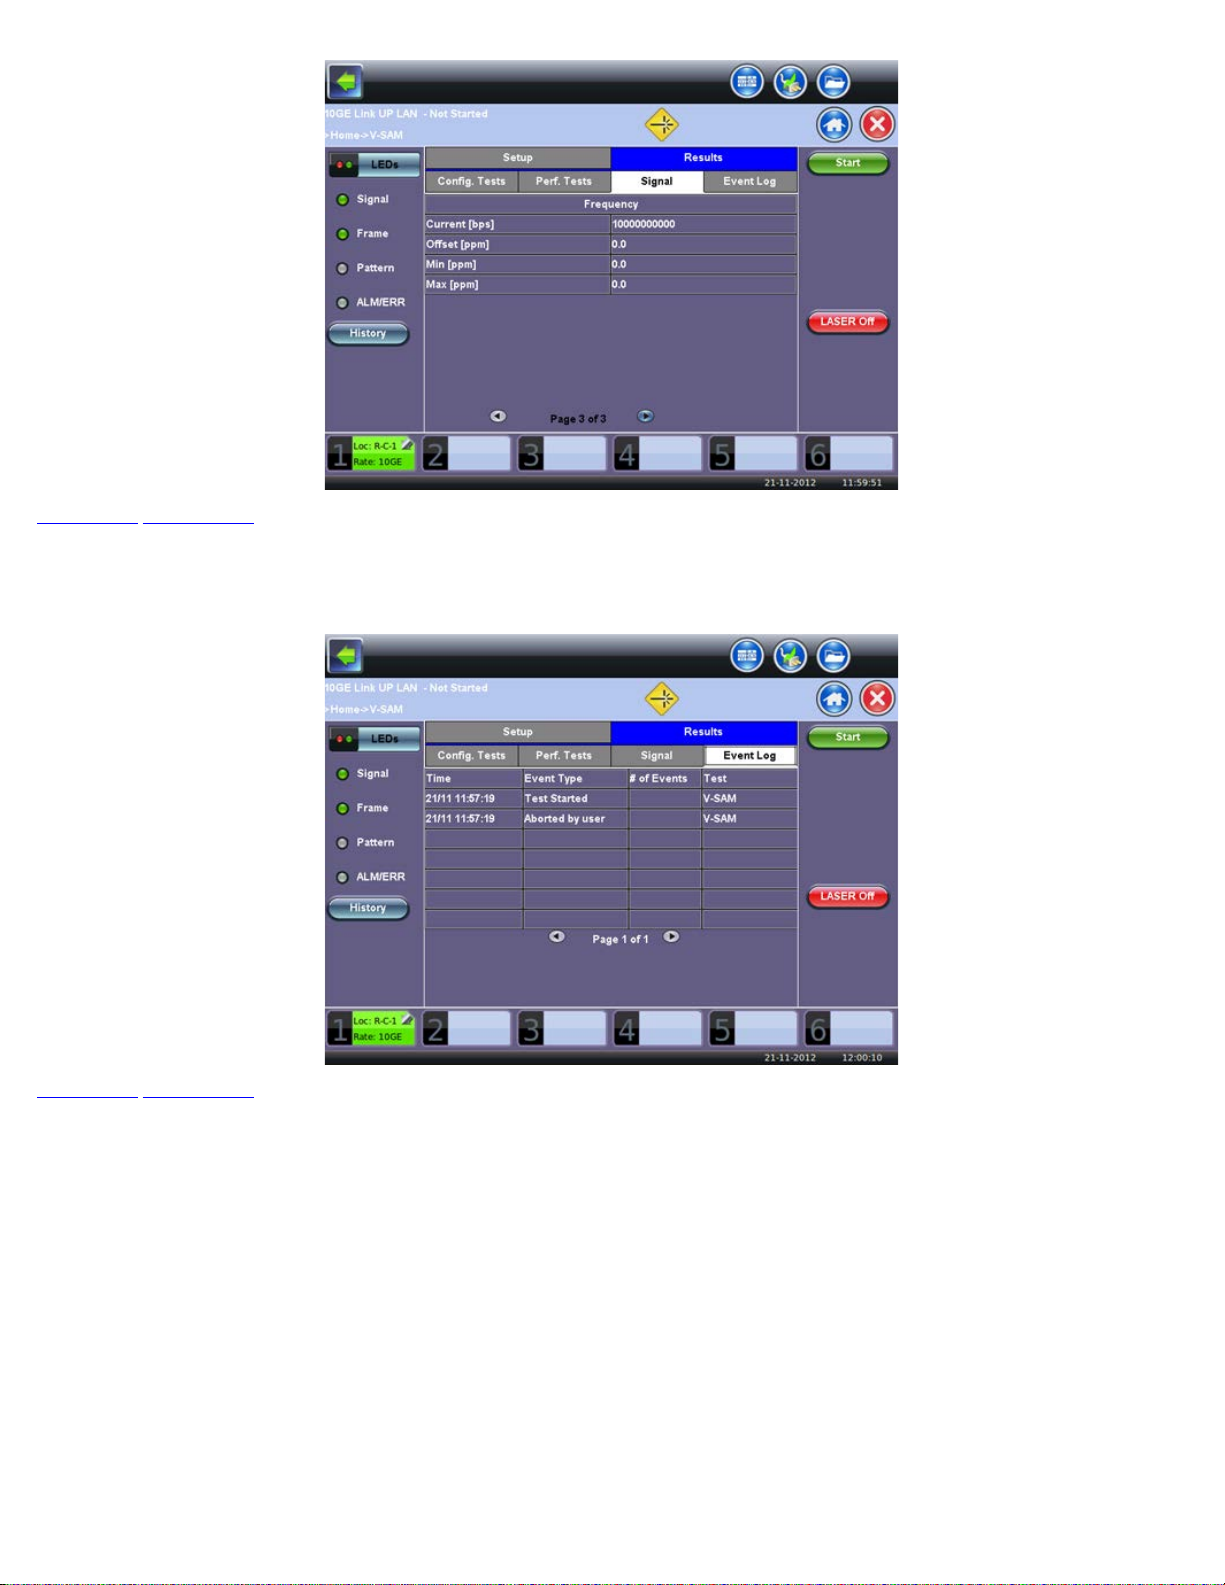
Go back to top Go back to TOC
UX400 10G e-Manual D07-00-058P RevA00
Page 86 of 209
6.4.2.4 Event Log
A time stamped record or log of test types and test statuses (start/stop).
Go back to top Go back to TOC
Event Log
Page 87
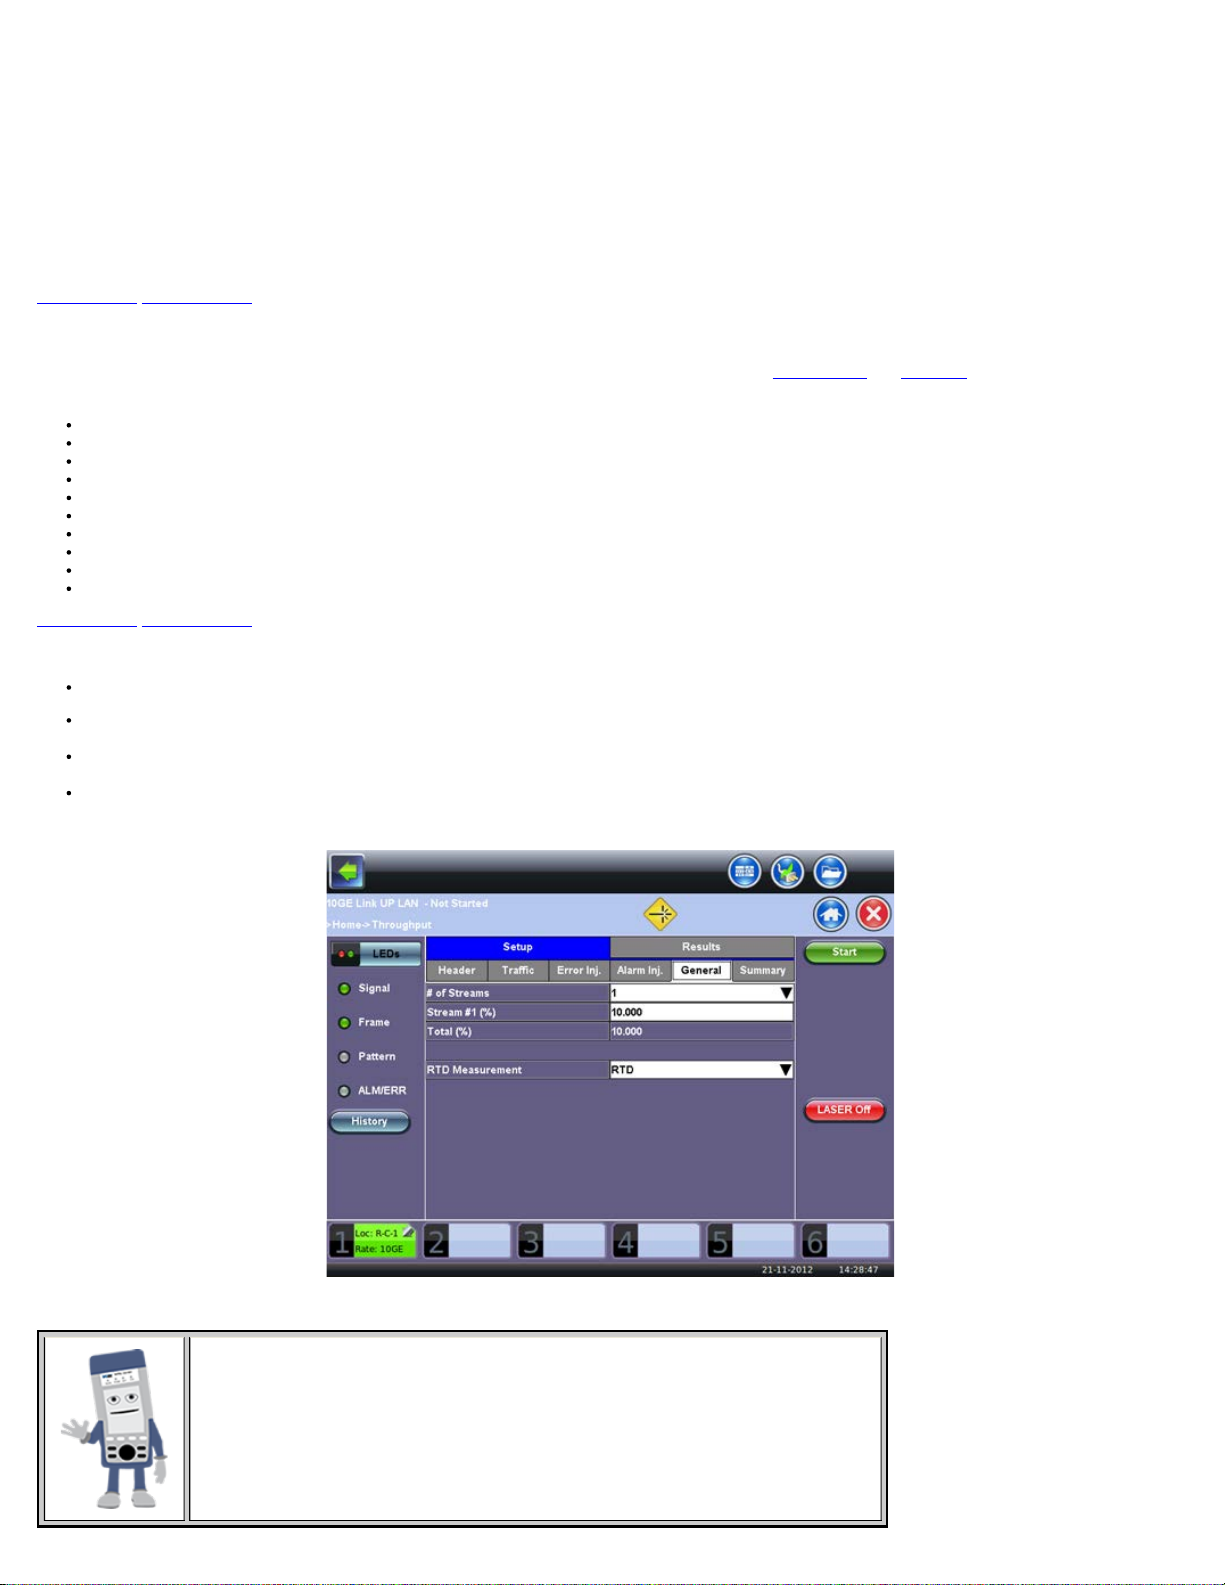
6.5 Throughput Testing
UX400 10G e-Manual D07-00-058P RevA00
Page 87 of 209
Overview:
The Throughput application performs the following measurements: Throughput performance, Frame Loss analysis, Delay analysis, Frame/Packet arrival analysis, received
Traffic Type analysis, and received Traffic Frame Size analysis. On the transmit side, the Throughput application currently allows only one stream with its MAC and IP
address, VLAN tags (up to 3), bandwidth/rate, frame size, and L2 and/or L3 quality of service (QoS) parameters. On the receiver end the traffic is analyzed on a per stream
basis as well as a global or aggregate measurement.
This application is very useful in verifying the transport of traffic with different prioritization settings across a network link. The test helps verify that the network can handle
high priority traffic and low priority traffic accordingly.
Go back to top Go back to TOC
6.5.1 Setup
Unless otherwise noted, the Frame Header and related setups are the same as the ones described in section
be configured prior to performing a Throughput test:
Number of streams (See General Settings below)
Bandwidth per stream (See General Settings below)
Test layer
Frame Type
VLAN tag(s)
MPLS tag(s)
Frame header per stream (if applicable)
Traffic profile per stream (if applicable)
Error injection per stream (if applicable)
Control settings of the far-end device(s) (if applicable)
Go back to top Go back to TOC
6.5.1.1 General Throughput Settings (Global Configuration)
# of Streams: Up to 10 streams are available.
Stream #: Allocated Bandwidth per Stream: The total bandwidth for all streams cannot exceed 100%.
Total (%): Sum of all stream rates in %.
RTD Measurement: Enable/disable the round trip delay measurement. It should only be enabled when running the test to a remote loopback.
Throughput General Setup
6.3 RFC 2544 and 6.2 BERT. The following parameters must
Multiple Streams
All streams are configured for the same test layer - if Layer 2 is selected, all streams will be Layer
2 traffic.
Page 88
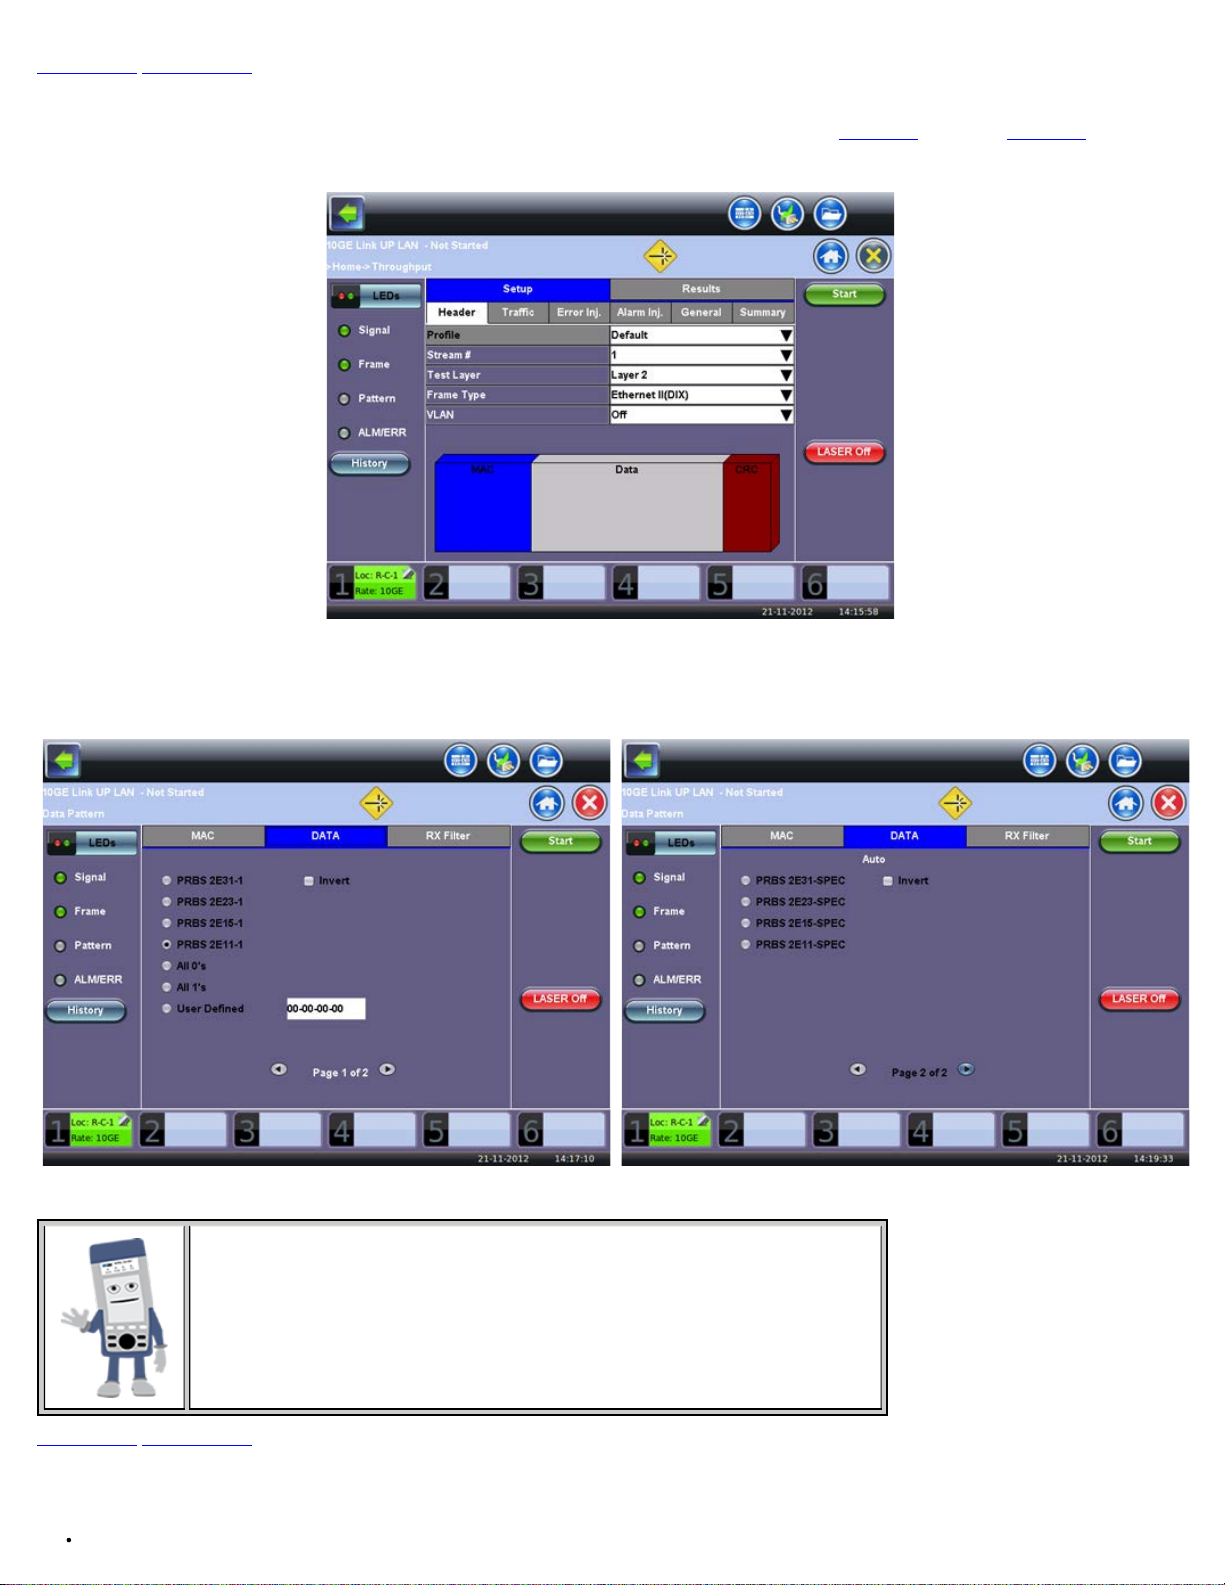
Go back to top Go back to TOC
6.5.1.2 Header Settings
Stream #: Select a stream number to configure
UX400 10G e-Manual D07-00-058P RevA00
Page 88 of 209
The configurable parameters and procedure for the Header settings in Layer 2, 3 and 4 are the same as for RFC2544 -
Throughput MAC Settings Layer 2
DATA:
The Data tab can be accessed by tapping the frames diagram on the Header settings screen.
Chapter 6.4 and BERT - Chapter 6.2.
Throughput DATA Setup Page 1 Throughput DATA Setup Page 2
Multiple Streams - MAC/IP Address Setup
If all of the streams are going to the same far-end unit, then the MAC/IP destination addresses
must be the same on all of the streams.
If any of the traffic streams are going to more than one far -end unit then ensure the correct MAC/IP
destination addresses are configured for the respective streams.
Go back to top Go back to TOC
6.5.1.3 Traffic Settings (Per Stream Configuration)
In the Traffic tab the user is able to configure the traffic profile per stream, including frame size selection, traffic type, and transmit rate.
Page 89
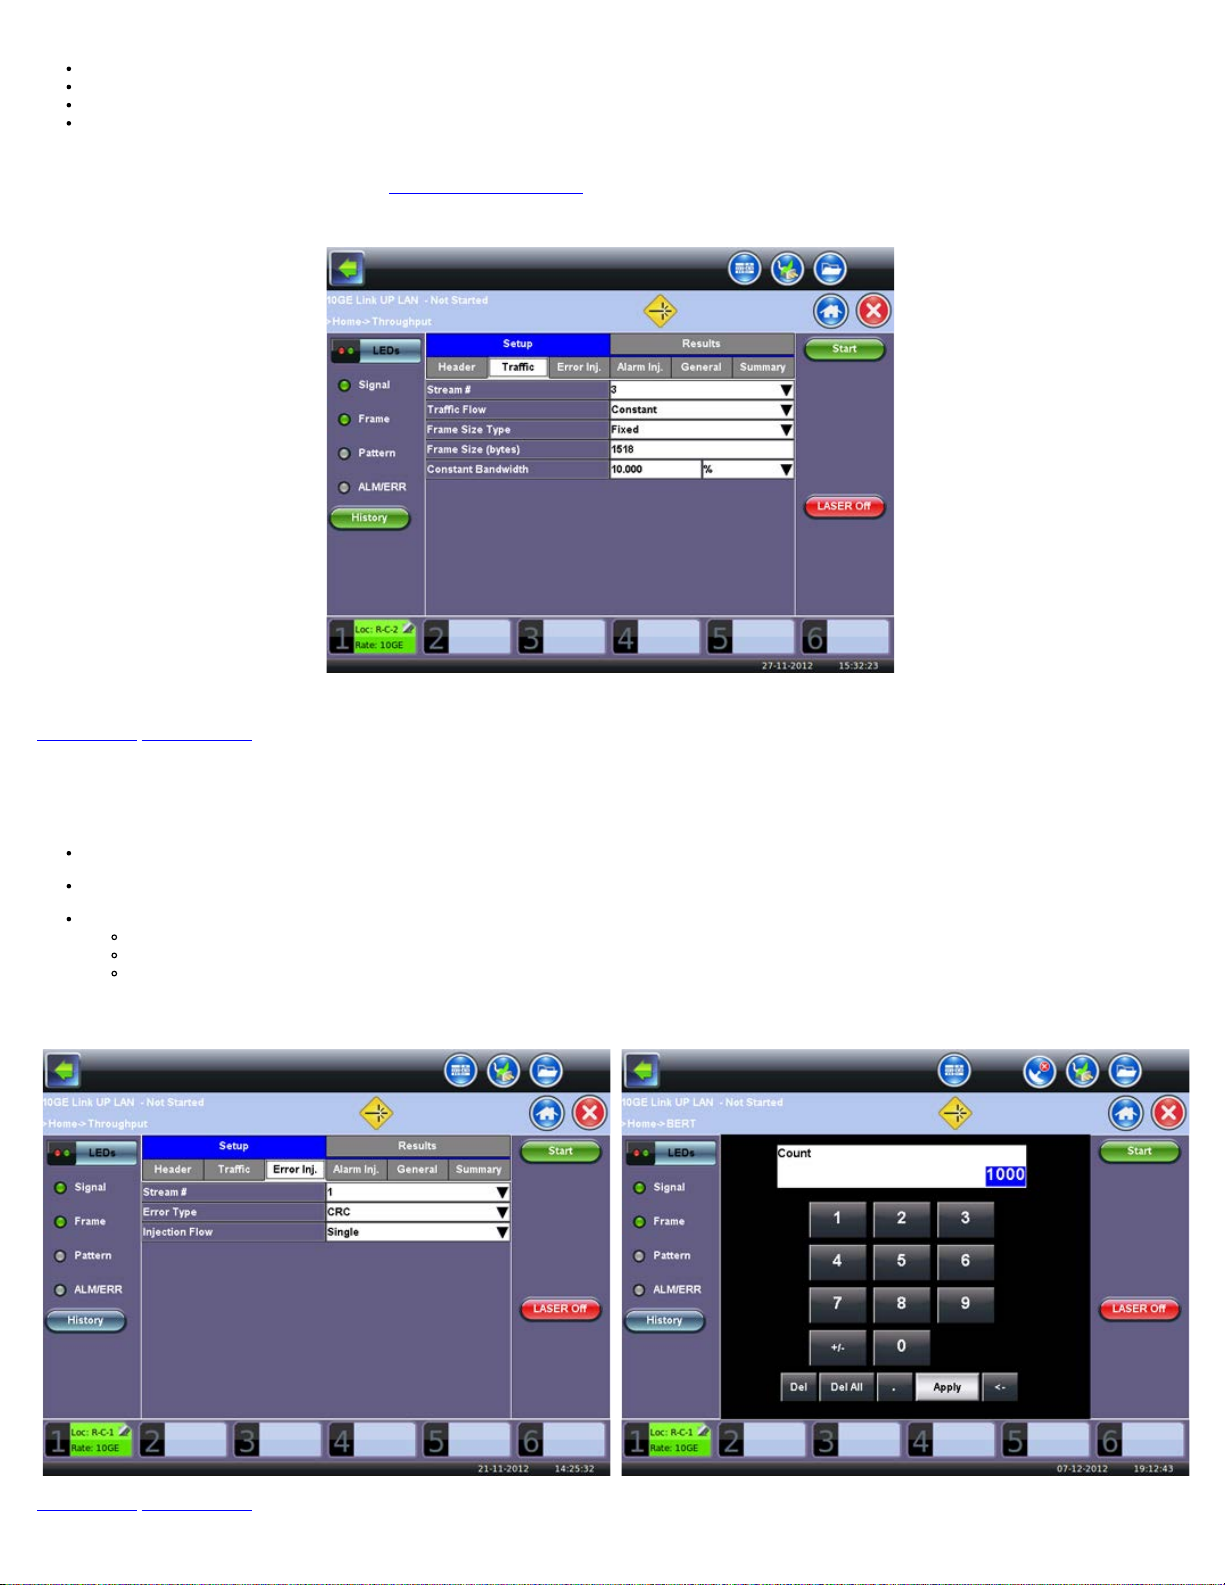
Traffic Flow: Only Constant is available
Frame Size (Type): Fixed
6.5.1.5 Alarm Injection Settings
UX400 10G e-Manual D07-00-058P RevA00
Page 89 of 209
Frame Size (bytes): Enter the frame size. Frame sizes can be from 64bytes to 1518bytes, in addition to jumbo frames up to 9k bytes.
Bandwidth: Configure the transmit rate for the stream
Note: The bandwidth allocation per stream is already configured in the General Settings tab, but can be modified in this screen as well.
For more information on Traffic Settings, please see
6.2.1.2 BERT Traffic Settings.
Throughput Traffic Settings
Go back to top Go back to TOC
6.5.1.4 Error Injection Settings (Per Stream Configuration)
Error injection can be performed during test. The type of errors and error injection are configured in the Error Injection tab. Once the test is running, error injection can be
performed by pressing the Error Inject button on the right side of the screen.
Stream #: Select the stream to configure.
Error type: Select from CRC or PCS Errored Block.
Injection Flow: The error injection flow determines how the selected errors will be injected.
Single
Count: Set a count using the numeric keypad.
Rate: 1E-3, 5E-4, 2E-4, 1E-4, 5E-5, 2E-5, 1E-5, 5E-6, 2E-6, 1E-6, 5E-7, 2E-7, 1E-7, 5E-8, 2E-8, 1E-8, 5E-9, 2E-9, 1E-9 or User Defined. The user may
configure the desired rate using the on screen keypad.
Throughput Error Injection Setup Keypad
Go back to top Go back to TOC
Page 90
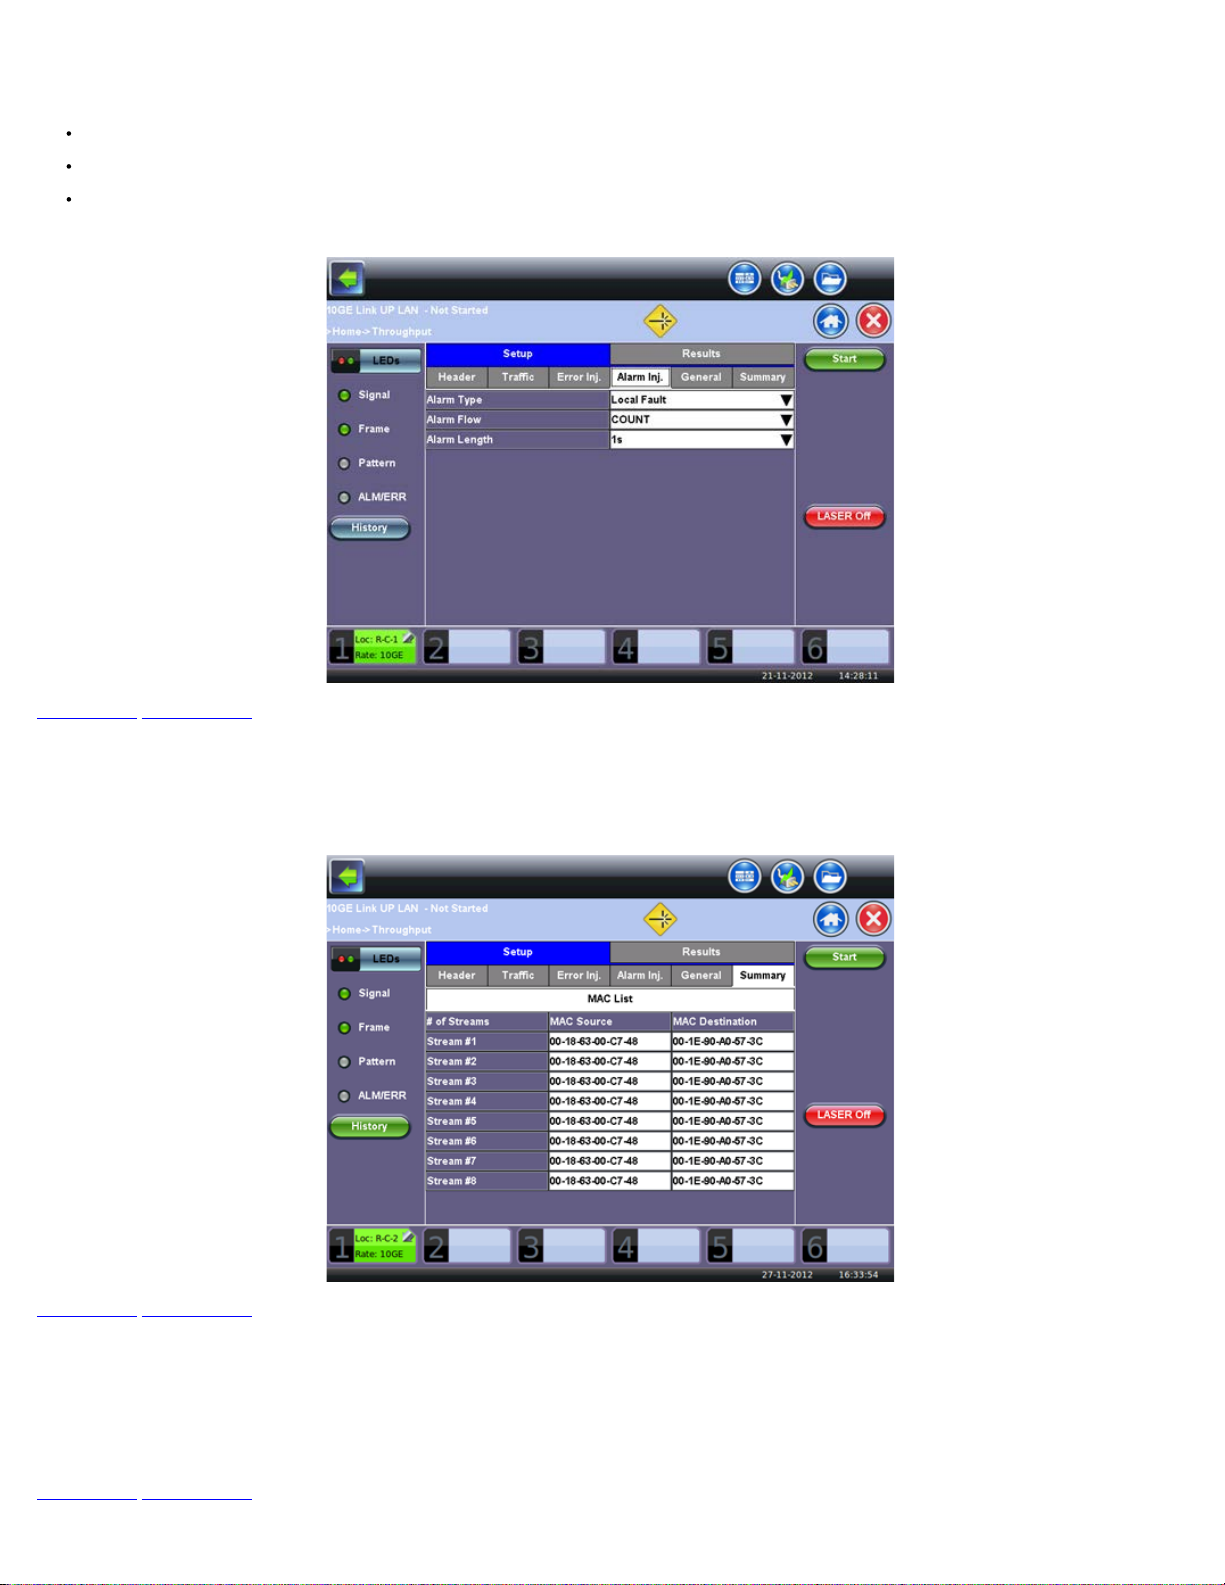
Alarm injection can be performed during test. The type of alarms and alarm injection are configured in the Alarm Injection tab. Once the test is running, alarm injection can
UX400 10G e-Manual D07-00-058P RevA00
Page 90 of 209
be performed by pressing the Alarm Inject button on the right side of the screen.
Alarm Type: Local Fault, Remote Fault, PCS-HI-BER, PCS-LOBL
Alarm Flow: The alarm flow determines how the selected alarms will be injected. A specific Count or Continue (continuous) can be selected.
Alarm Length: 1s, 10s, or 100s.
Throughput Alarm Injection Setup
Go back to top Go back to TOC
6.5.1.6 Summary
The summary screen lists the MAC source and MAC destination information of each stream. Tap on the appropriate box of each tab to reconfigure the source or
destination information if desired.
Throughput Setup Summary MAC List
Go back to top Go back to TOC
6.5.1.7 Starting/Stopping a Throughput Test
Once all configurations have been made, tap the Start button on the right section of the screen to start the measurements.
Note: If testing on the fiber ports, make sure the LASER is turned On before starting the test.
The selected tests will run automatically. When all the tests are complete the test will stop automatically. If the RFC 2544 test suite needs to be stopped before they are
done, then simply tap the Stop button. The status of each selected test can be seen in the Results tab.
Go back to top Go back to TOC
6.5.2 Throughput Results
Page 91
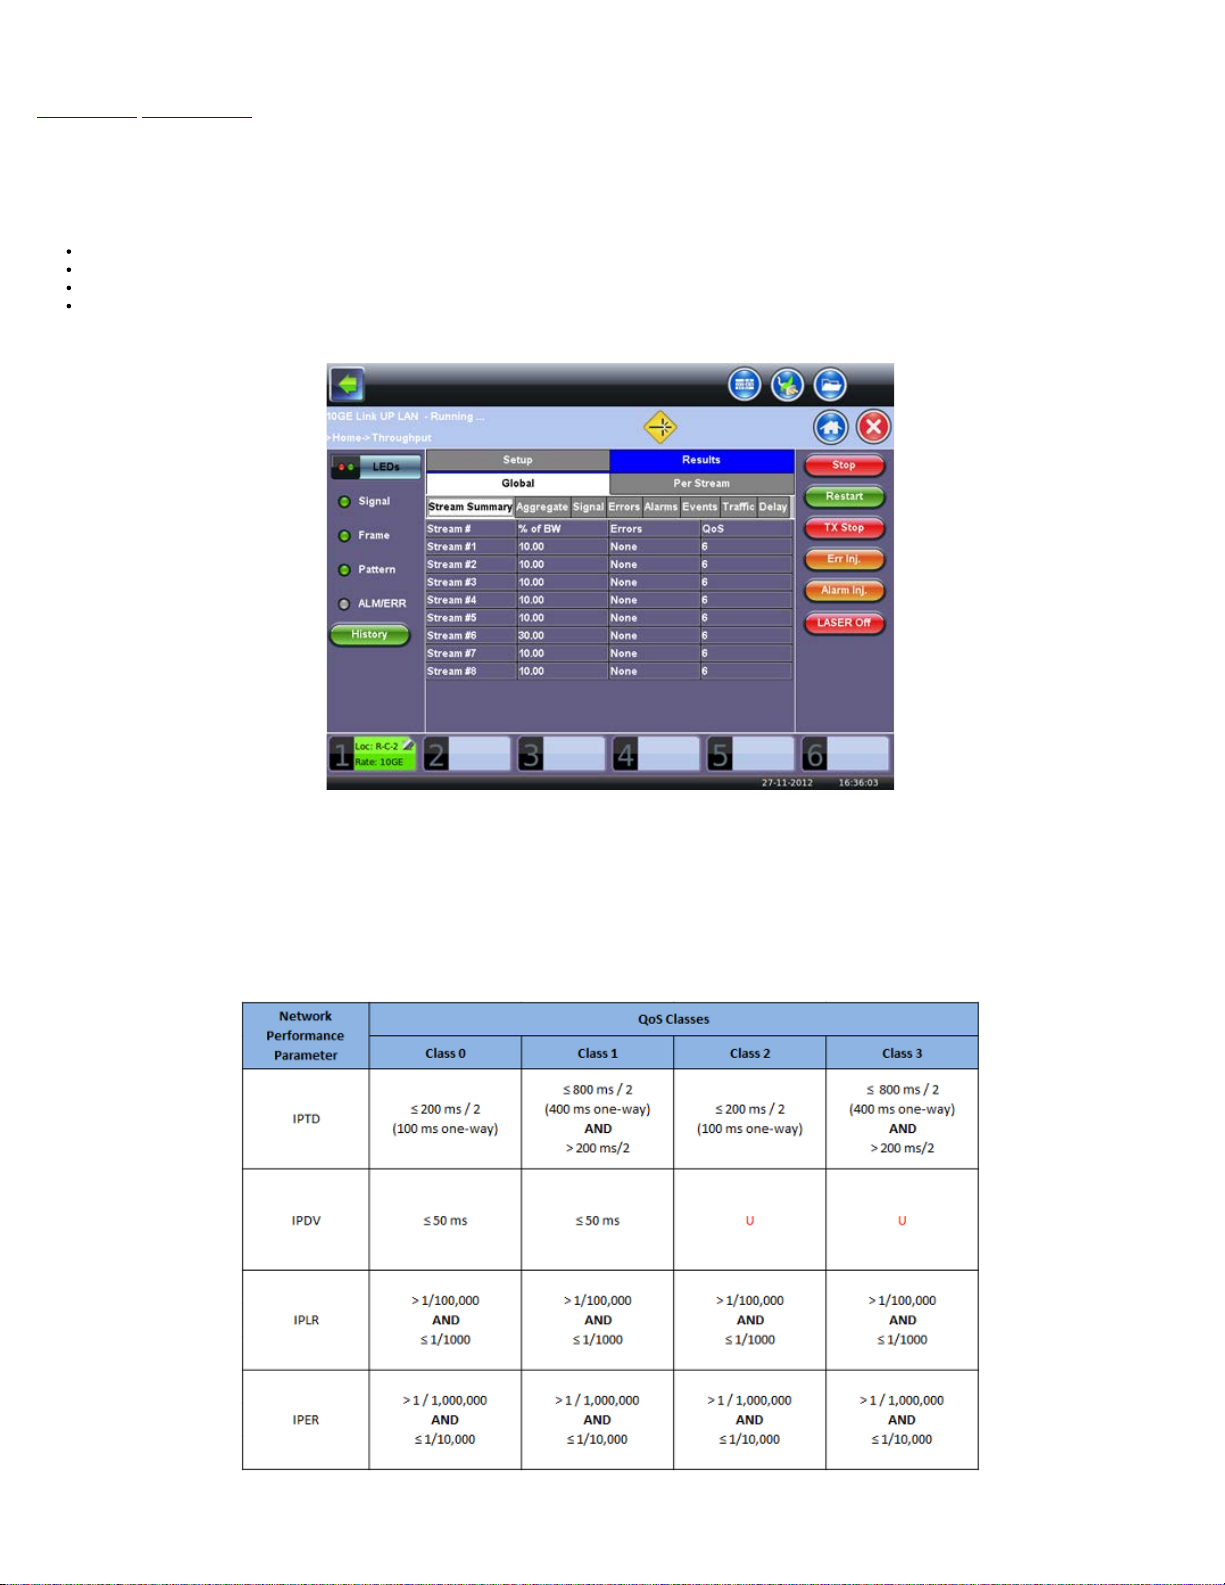
When the test is first started, the screen automatically changes to the Global/Aggregate results screen.
IP Network QoS Class Definitions and Network Performance Objectives
UX400 10G e-Manual D07-00-058P RevA00
Page 91 of 209
Go back to top Go back to TOC
6.5.2.1 Global Results
The Global results pages display measurements for all traffic streams as well as non test traffic.
The Global Stream Summary screen displays:
Stream number (#)
% of bandwidth per stream
Errors associated with the stream
Quality of Service (QoS) performance verification associated with each stream
Throughput Results - Global Stream Summary
QoS
QoS values are based on packet statistic thresholds for roundtrip delay, jitter, frame loss, and IP checksum from the ITU- T Y.1541 standard. Below is a list of IP network
QoS class definitions and network performance objectives from Y.1541.
"U" denotes "unspecified" or "unbounded" and signifies that no objective was established for this parameter and default Y.1541 objectives do not apply. Parameters
designated with "U" are occasionally inconsistent and poor.
IP Network QoS Class Definitions and Network Performance Objectives
(Classes 0 -3)
Page 92
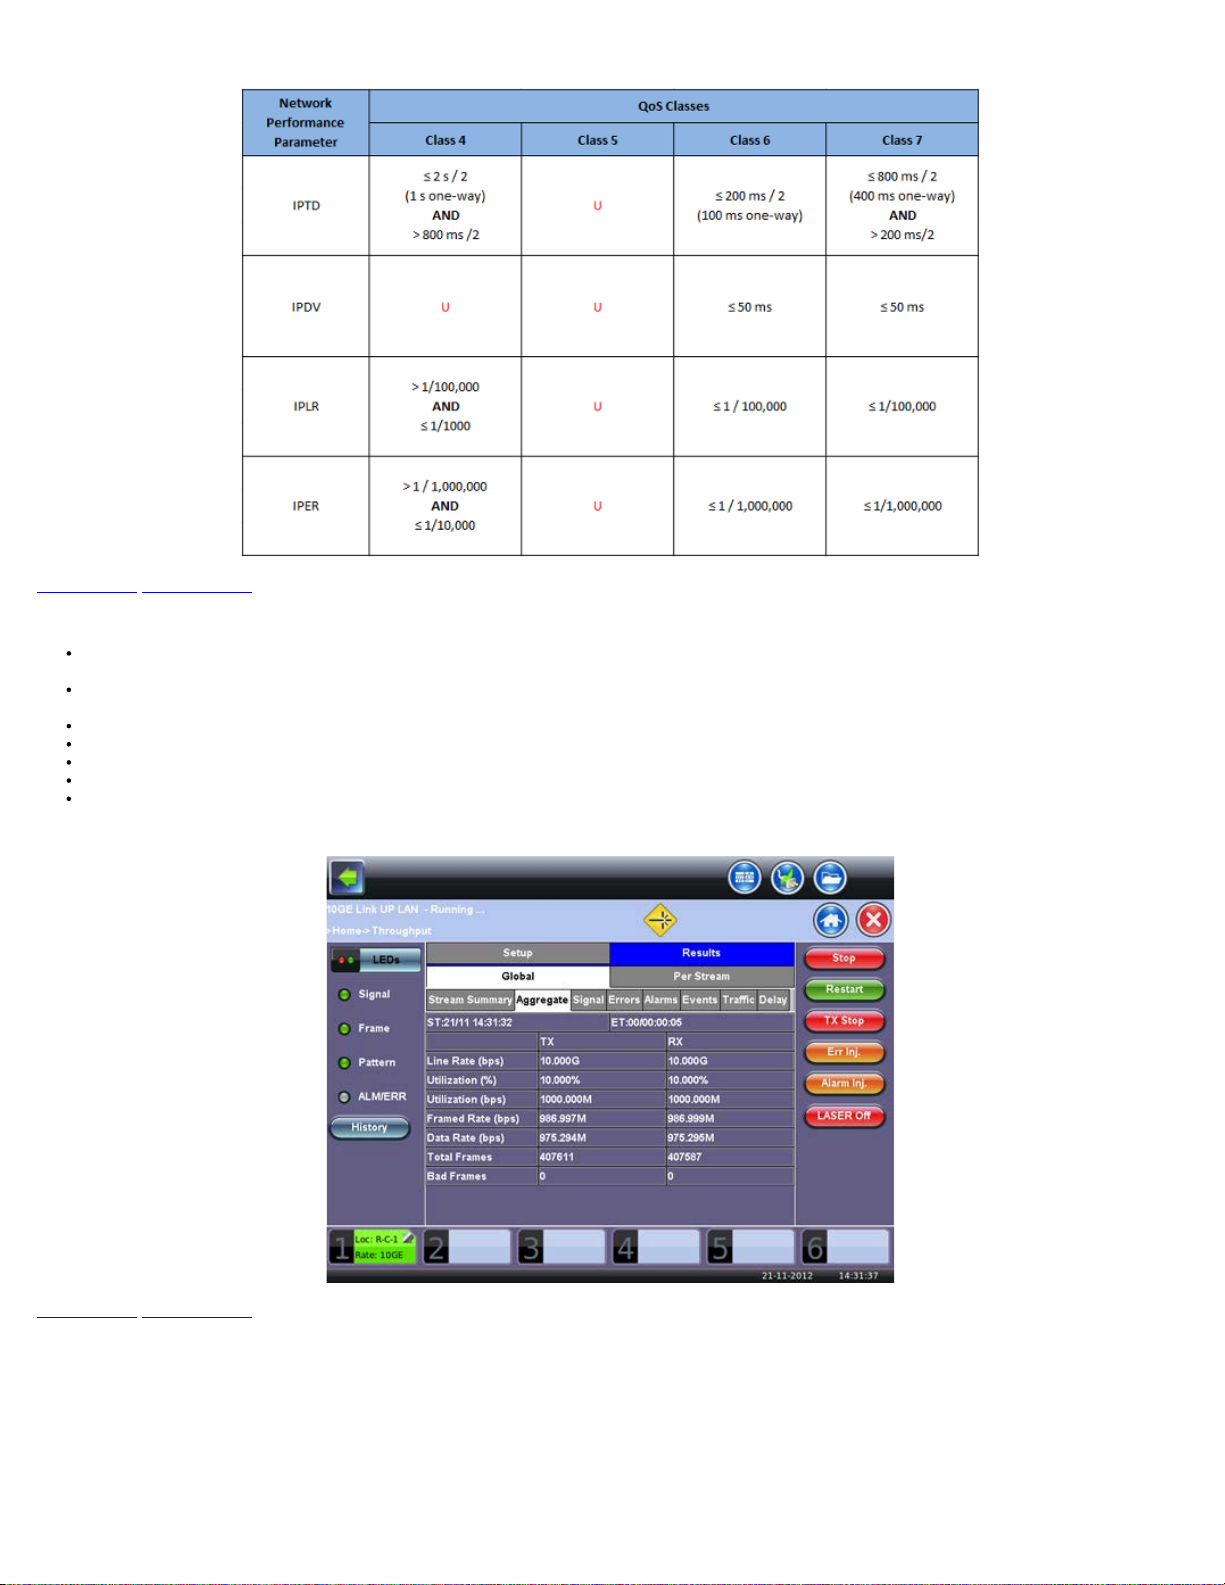
(Classes 4 -7)
UX400 10G e-Manual D07-00-058P RevA00
Page 92 of 209
Go back to top Go back to TOC
The Aggregate screen displays these parameters:
Line Rate (bps): Negotiated rate of the interface (10M, 100M, or 1000M). This value is always fixed since it depends on the maximum capacity of the link under test,
hence the test interface that is configured.
Utilization: % of Line Rate. For example, if we transmit 100Mbps on a 1Gbps interface then the utilization value is 10% (or 100Mbps) of the total link capacity (or
Line Rate).
Utilization (bps)
Framed Rate: (Payload + MAC/IP Header + VLAN Tag + Type/Length + CRC) / (Payload + Total Overhead) * Line Rate % (in Mbps).
Data Rate: Payload / (Payload + Total Overhead) * Line Rate %.
Total # of frames
Bad frames
Throughput Results - Global Aggregate
Go back to top Go back to TOC
The Global Signal screen (fiber ports only) displays the optical level measured by the SFP or XFP transceiver.
Throughput Results - Global Signal Page 1 Throughput Results - Global Signal Page 2
Page 93
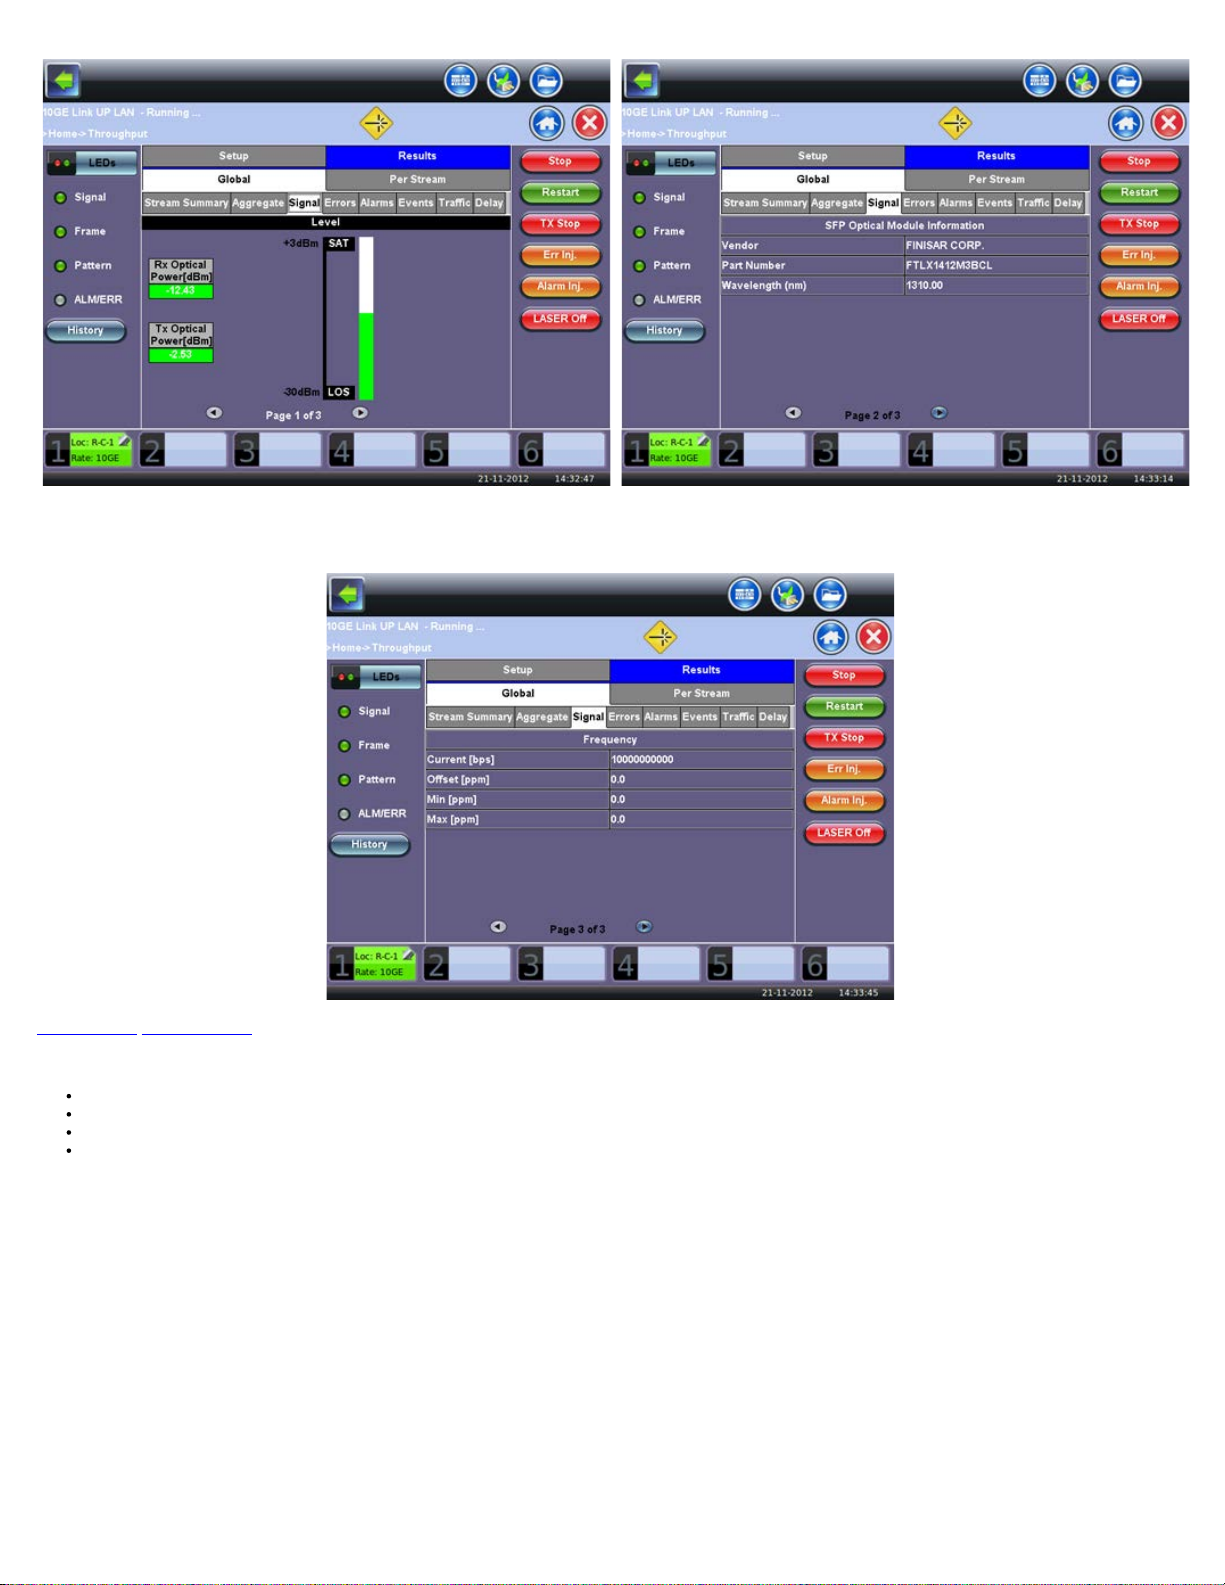
UX400 10G e-Manual D07-00-058P RevA00
Page 93 of 209
Throughput Results
Go back to top Go back to TOC
The Global Errors screen displays the Current and Total error count of all streams:
PCS Errored Block
FCS/CRC: Number of received frames with an invalid Frame Check Sequence (FCS)
Jabber frames: Number of received frames larger than 1518 bytes containing an invalid FCS
Runt frames: Number of received frames smaller than 64 bytes containing an invalid FCS
- Global Signal Page 3
Throughtput Results - Global Errors
Page 94
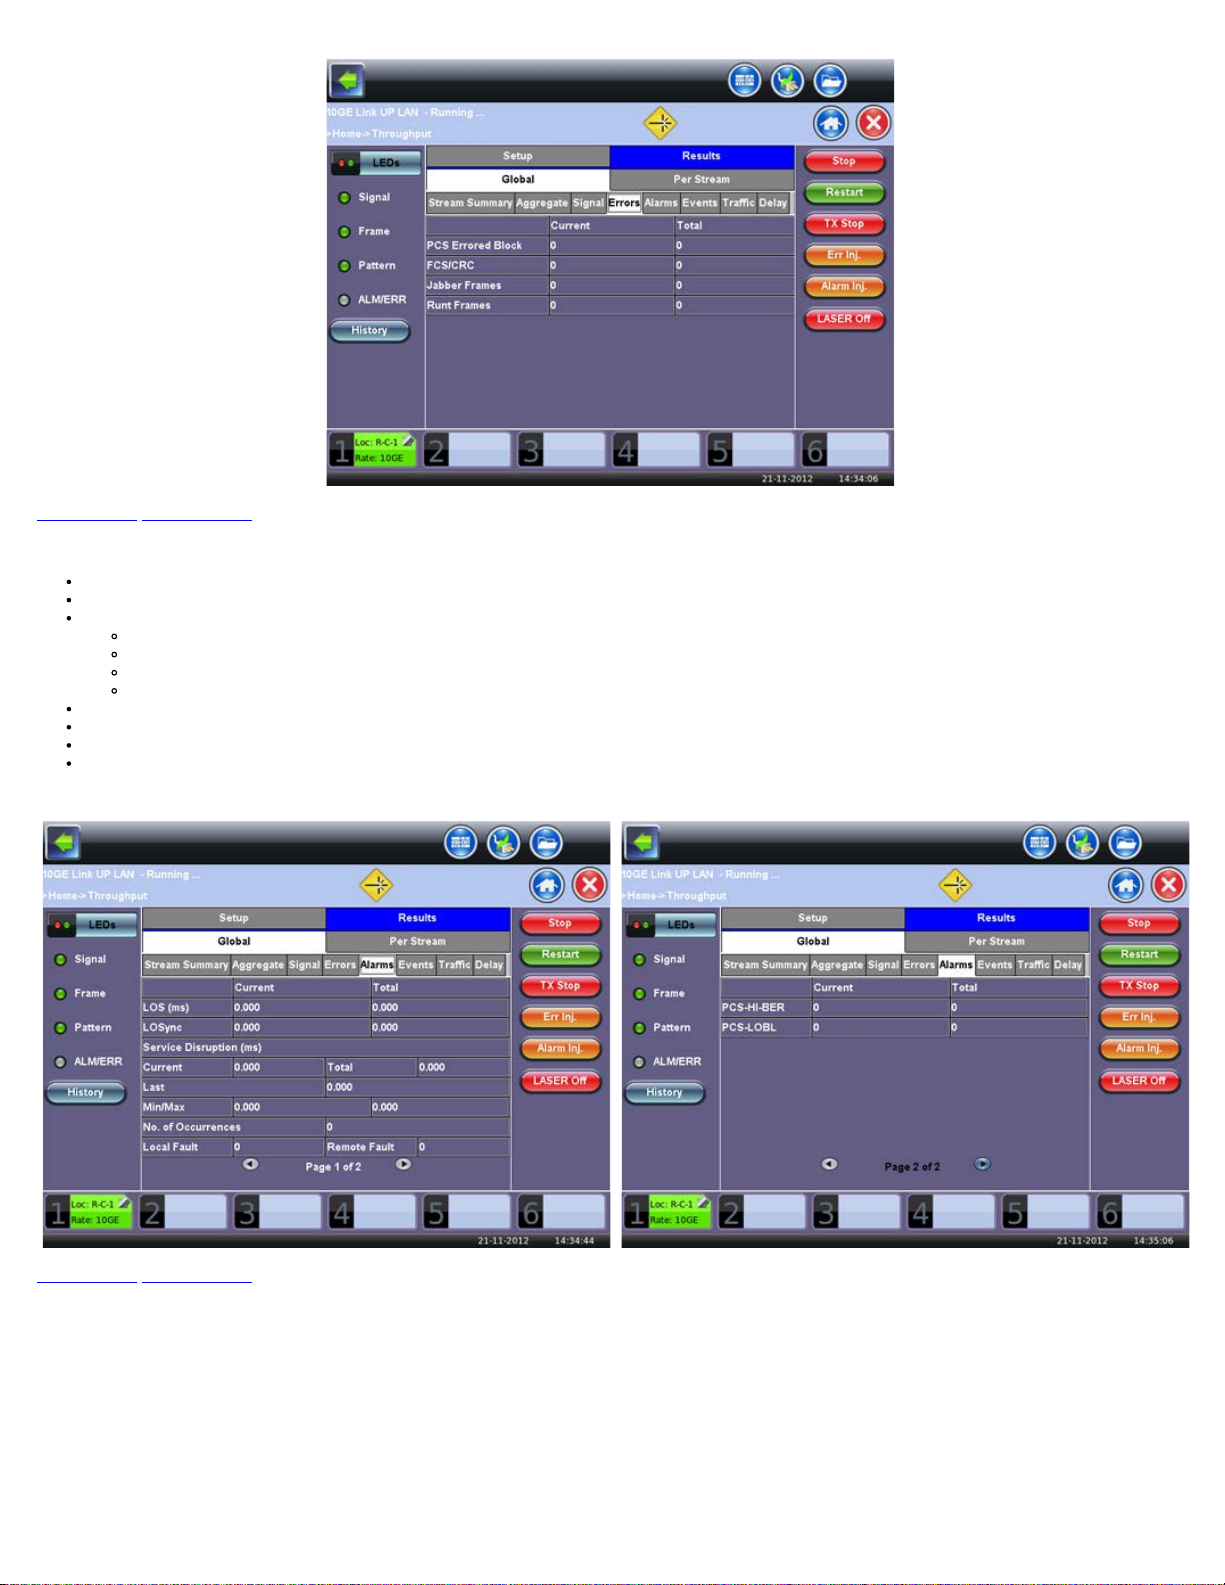
Go back to top Go back to TOC
UX400 10G e-Manual D07-00-058P RevA00
Page 94 of 209
The Global Alarms screen displays the Current and Total alarm count of all streams:
LOS (ms): Loss of Signal
Link Down (ms)
Service disruption associated with loss of signal:
Current: Duration of the current service disruption
Total: Total accumulated duration of the service disruptions
Min/Max: Minimum and maximum duration of the service disruption events
No. of Occurrences: Counter of service disruption events
Local Fault
Remote Fault
PCS-HI-BER
PCS-LOBL
Throughtput Results - Global Alarms Page 1 Throughtput Results - Global Alarms Page 2
Go back to top Go back to TOC
The Global Events screen displays the Time, Event Type, Number of Events, and Test Type .
Throughtput Results - Global Events
Page 95
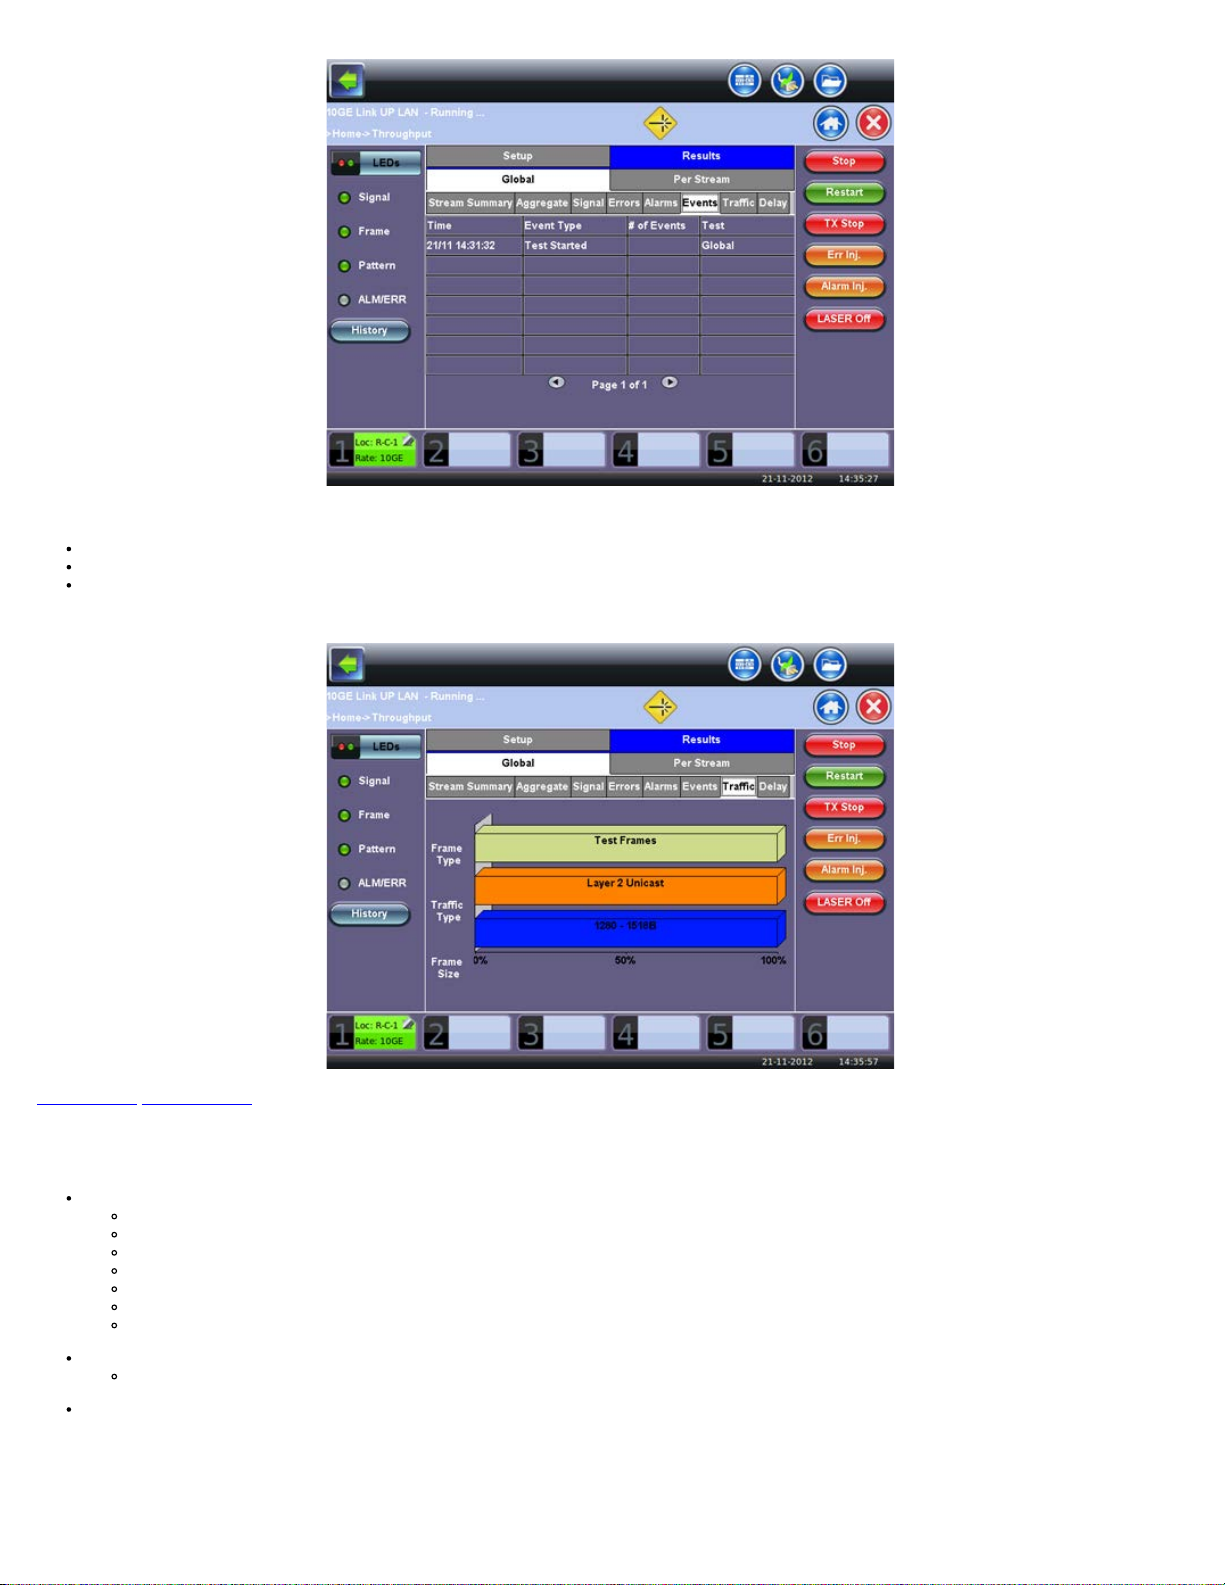
The Global Traffic screen displays:
UX400 10G e-Manual D07-00-058P RevA00
Page 95 of 209
Frame Type of all streams
Traffic Type of all streams
Frame size of all streams
Throughtput Results - Global Traffic
Go back to top Go back to TOC
Tap on the graph to view the details for Frames distribution, Traffic Type and Frame Size.
Frames: The following Frame distribution statistics are displayed in Count (#) and Percentage (%):
Received (RX) frames:
Total frames
Test frames
VLAN tagged frames
VLAN stacked frames
MPLS (Layer 3 and 4 only)
MPLS Stack (Layer 3 and 4 only)
Non-test frames
Transmitted (TX) frames:
Total frame - Total # frames transmitted
Pause frames: Total number of transmitted and received Ethernet pause flow-control frames
Throughput Results - Frames
Page 96
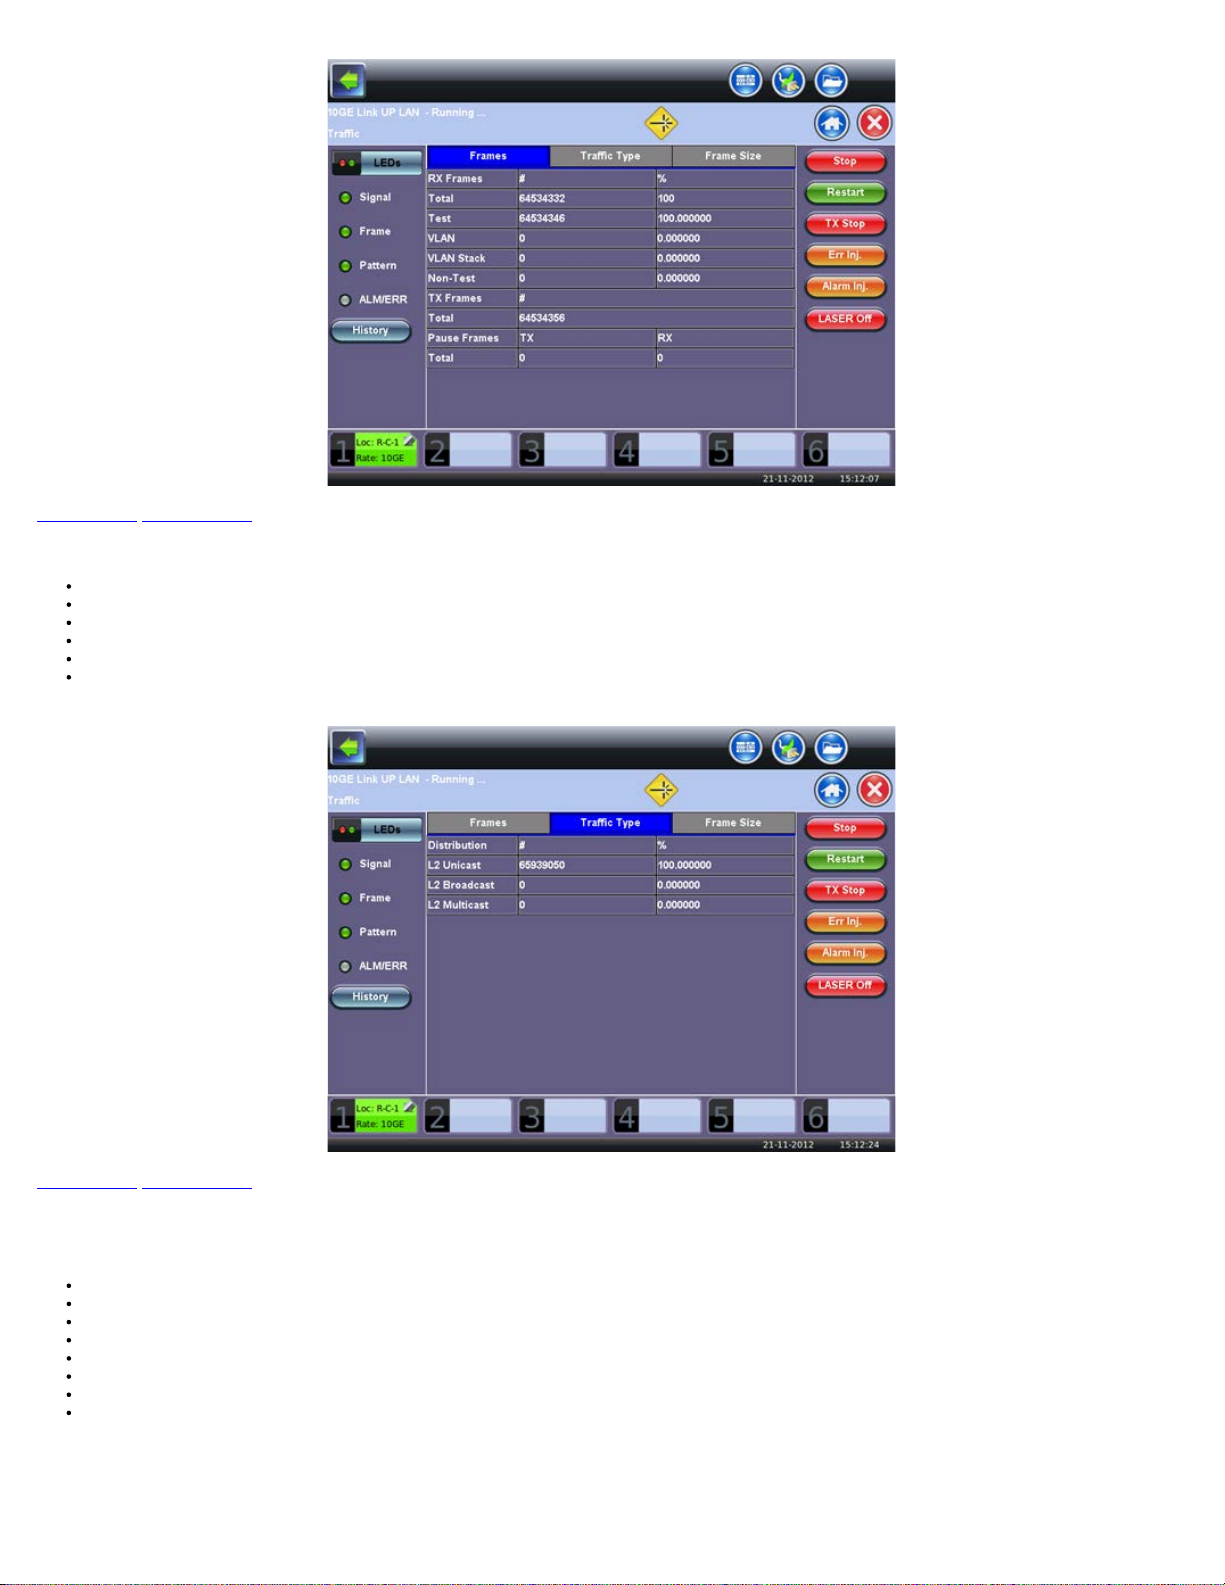
Go back to top Go back to TOC
UX400 10G e-Manual D07-00-058P RevA00
Page 96 of 209
Traffic Type: The following Traffic distribution statistics are displayed in Count (#) and Percentage (%):
Layer 2 Unicast frames: Number of Unicast frames received without FCS errors.
Layer 2 Broadcast frames: Number of Broadcast frames received without FCS errors. Broadcast frames have a MAC address equal to FF- FF-FF-FF-FF-FF.
Layer 2 Multicast frames: Number of Multicast frames received without FCS errors.
Layer 3 Unicast (For Layer 3 & 4)
Layer 3 Broadcast (For Layer 3 & 4)
Layer 3 Multicast (For Layer 3 & 4)
Throughput Results - Traffic Type
Go back to top Go back to TOC
Frame Size: The following Frame distribution statistics are displayed in Count (#) and Percentage (%):
64 bytes frames
64-127 byte frames
128-255 byte frames
256-511 byte frames
512-1023 byte frames
1024-1279 byte frames
1280-1518 byte frames
> 1518 byte frames - Jumbo frames
Throughput Results - Frame Size
Page 97
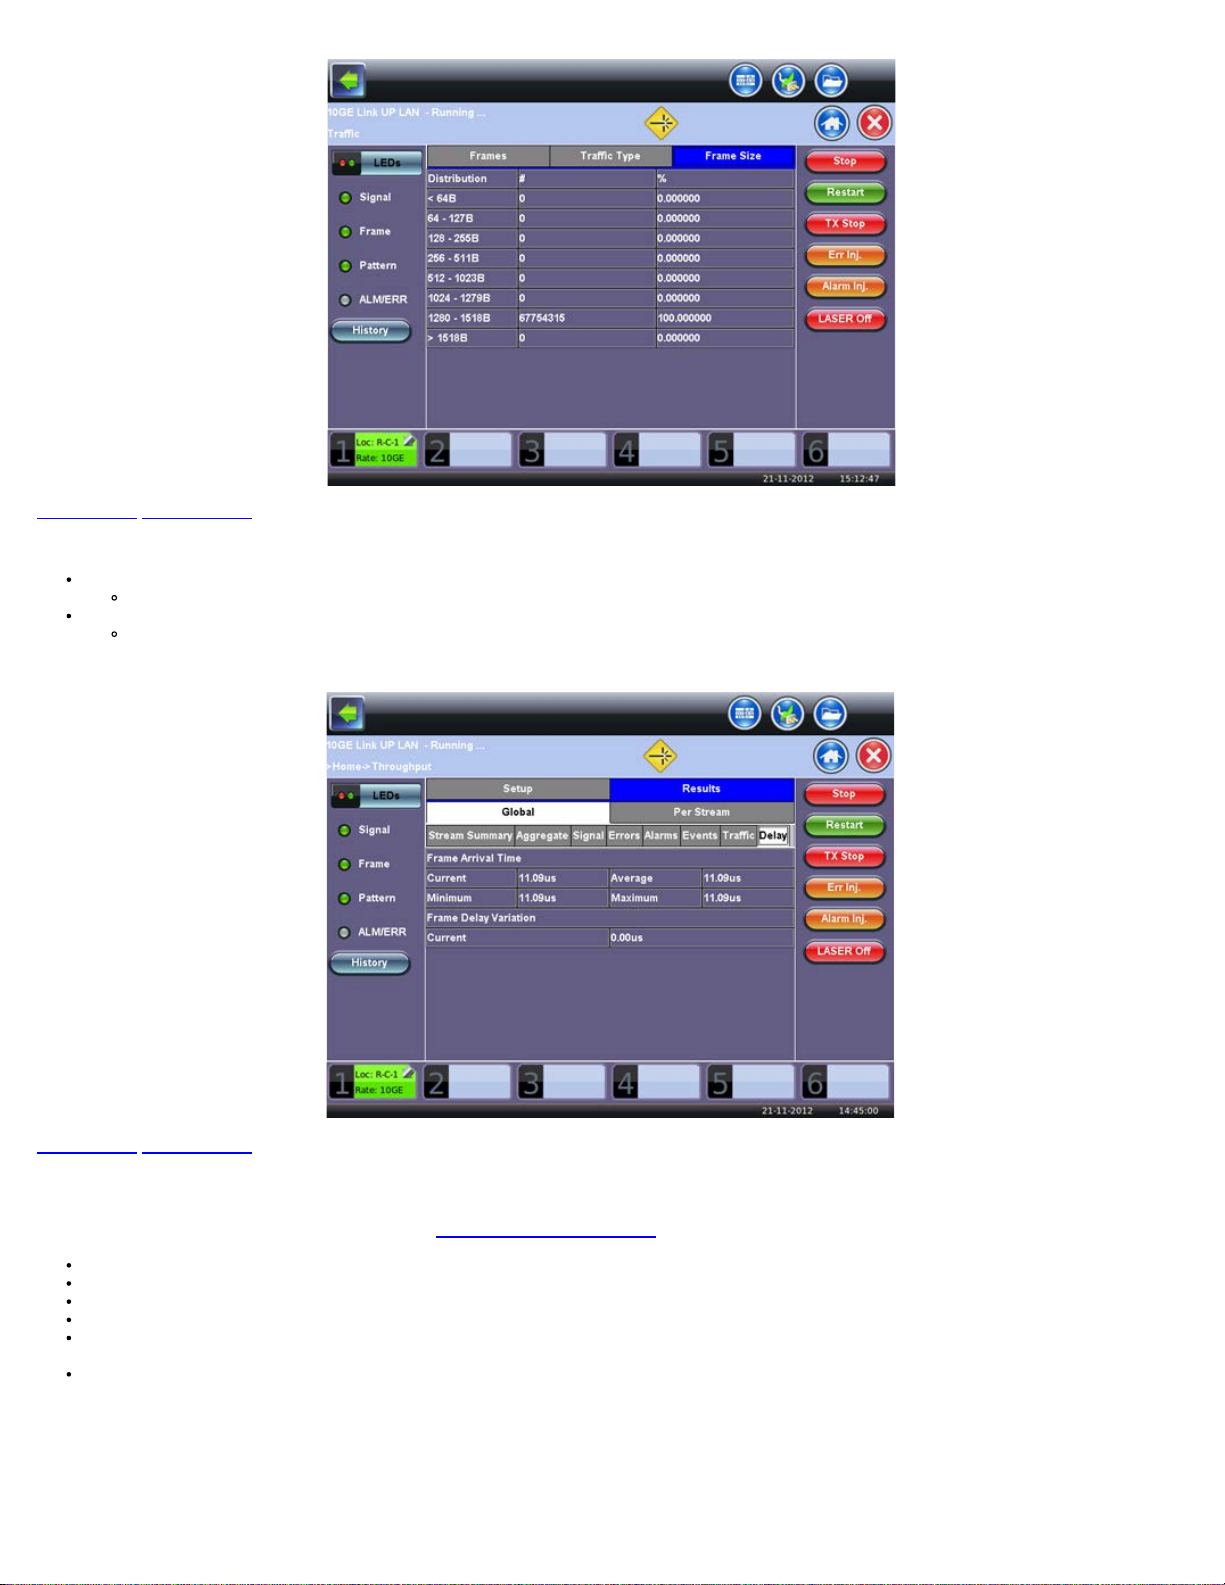
Go back to top Go back to TOC
UX400 10G e-Manual D07-00-058P RevA00
Page 97 of 209
The Global Delay tab: Delay measures the interpacket gap, start of the frame, and preamble duration. Frame arrival statistics are displayed in tabular format:
Frame Arrival Time:
Current, minimum, average, and maximum frame arrival time
Frame Delay Variation:
Current
Throughtput Results - Global Delay
Go back to top Go back to TOC
6.5.2.2 Per Stream Results
The Per Stream tab displays the same type of statistics as seen in Global Results, but for each stream. For descriptions of the parameters in each tab, with the exception
of Rates, please refer back to the corresponding section in
Summary: Framed rate, data rate, # of bytes, total # of frames associated with each stream.
Errors: Errors associated with each stream.
Events: Events associated with each stream.
Traffic: Traffic statistics associated with each stream.
Delay: Delay associated with each stream. Note that round trip delay measurements are only available in the per-stream results screen. Round trip delay
measurement requires a traffic loop at the far-end.
Rates: Rate information associated with each stream.
6.5.2.1 Global/Aggregate Results .
Throughtput Results - Per Stream Summary
Page 98
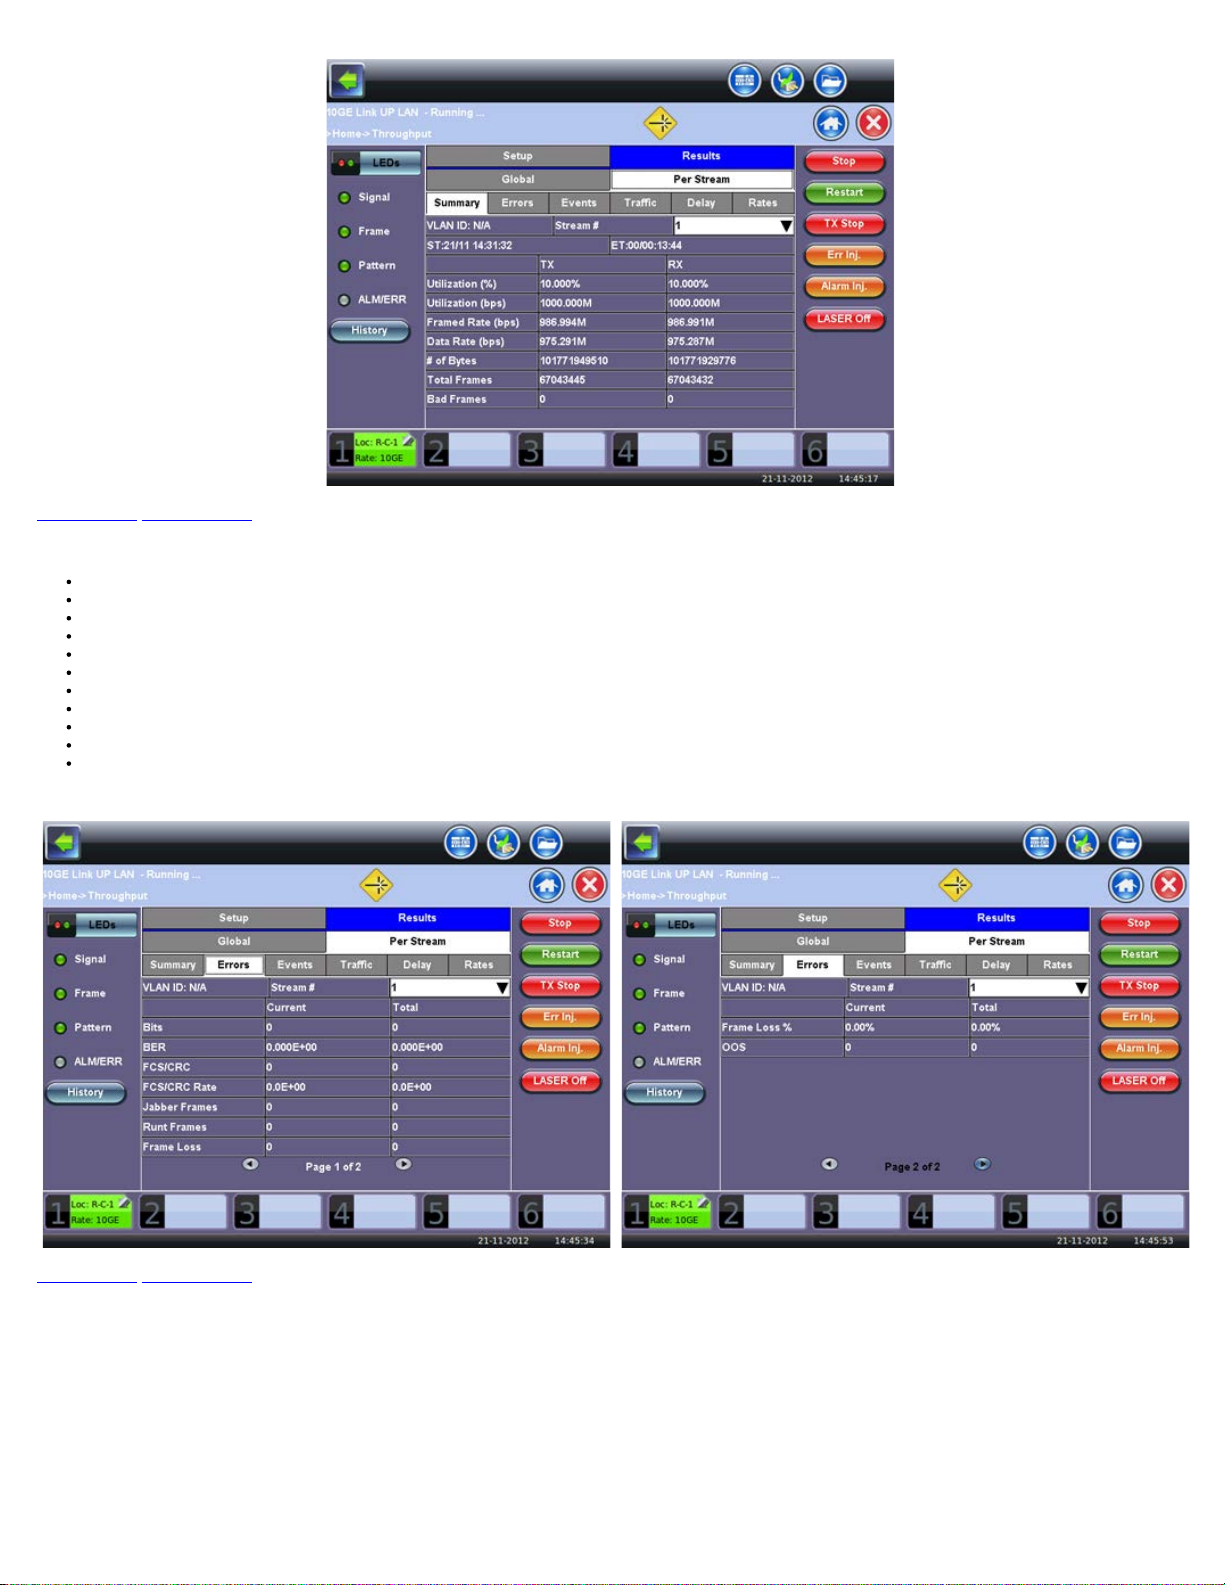
Go back to top Go back to TOC
UX400 10G e-Manual D07-00-058P RevA00
Page 98 of 209
The Per Stream Errors screen displays the Current and Total error count of each stream.
Bit: Indicates errors related to test pattern (Bit Error or LSS [Pattern Loss])
BER: Bit Error Ratio
FCS/CRC: Number of received frames with an invalid Frame Check Sequence (FCS)
FCS/CRC Rate
IP Checksum (Layer 3 and 4 only) : Invalid IP Frame Check sequence
TCP/UDP Checksum (Layer 4 only)
Jabber frames: Number of received frames larger than 1518 bytes containing an invalid FCS
Runt frames: Number of received frames smaller than 64 bytes containing an invalid FCS
Frame Loss
Frame Loss %
OOS
Throughtput Results - Per Stream Errors Page 1 Throughtput Results - Per Stream Errors Page 2
Go back to top Go back to TOC
The Per Stream Events screen displays a Date and Time stamped record of bit errors, alarms and other anomalies pertaining to each stream.
Throughtput Results - Per Stream Events
Page 99
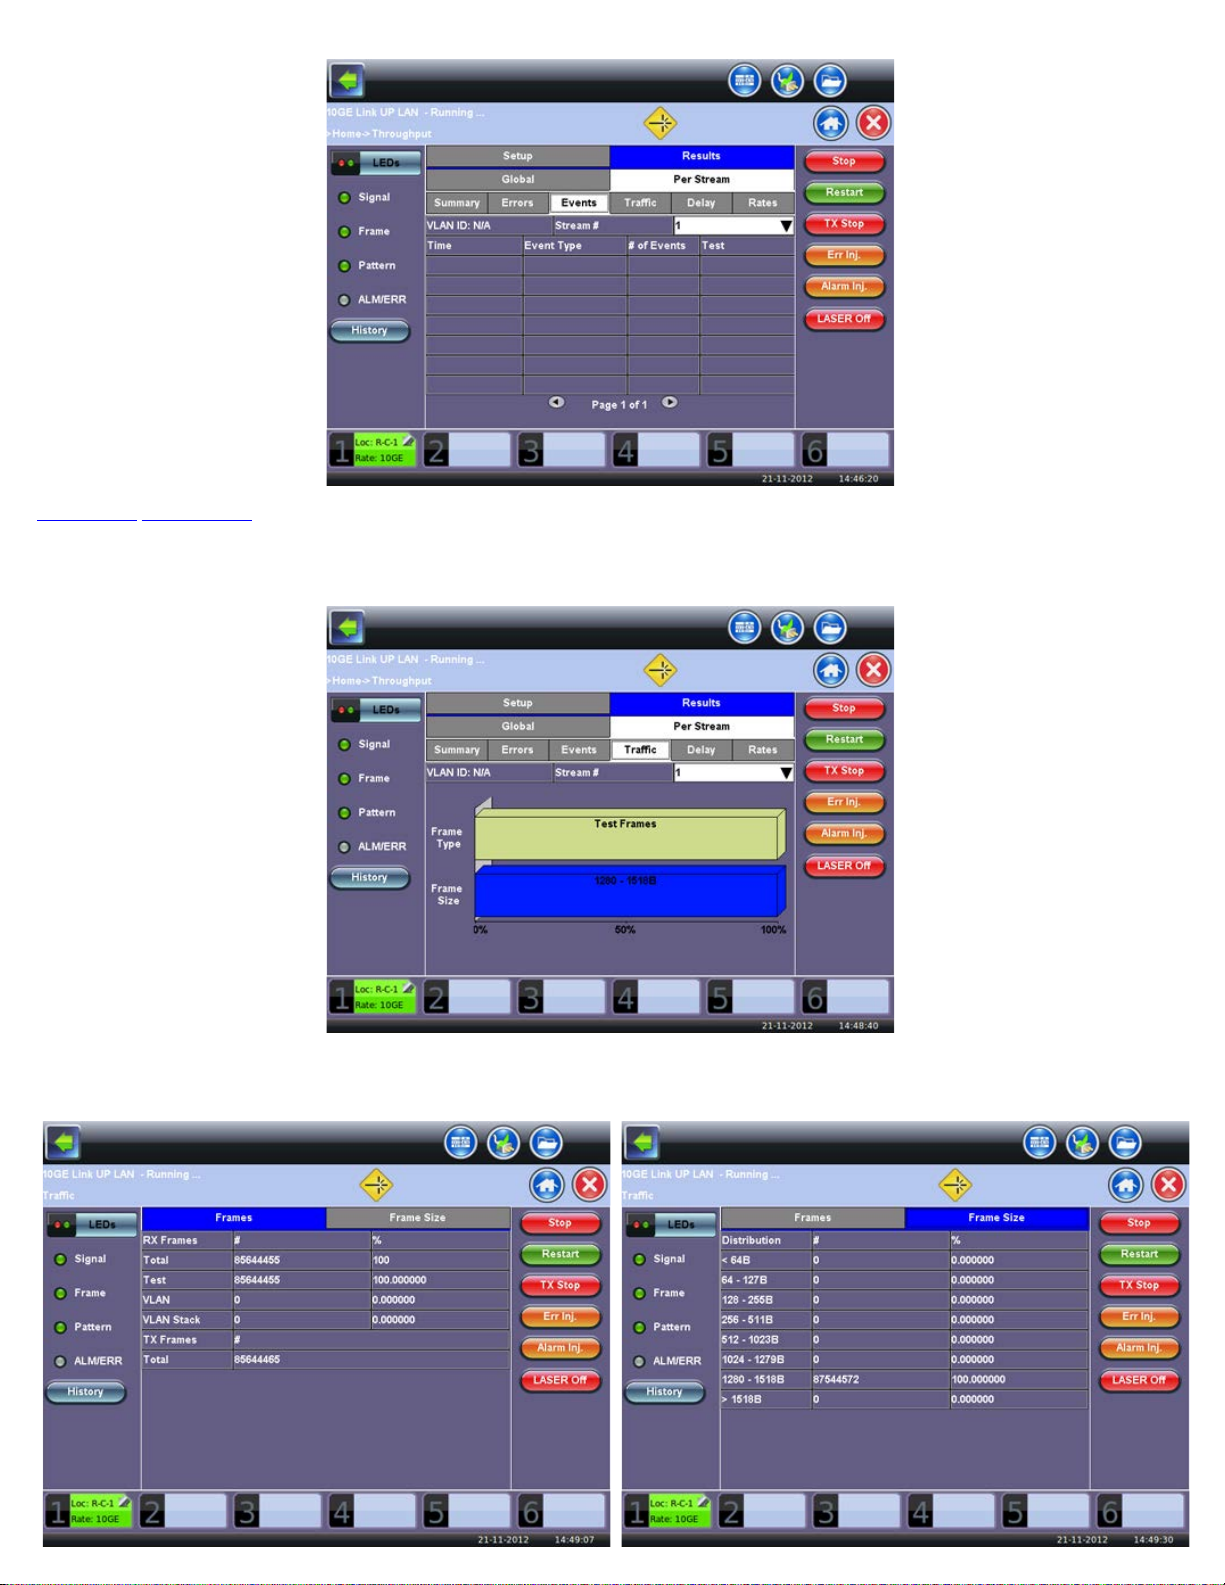
Go back to top Go back to TOC
UX400 10G e-Manual D07-00-058P RevA00
Page 99 of 209
The Per Stream Traffic screen displays the frame type and frame size distribution pertaining to each stream.
Throughtput Results - Per Stream Traffic
Tap on the graph to see details for Frames (RX and TX) and Frame Size distribution.
Throughtput Results - Per Stream Traffic Frames Throughtput Results - Per Stream Traffic Frame Size
Page 100
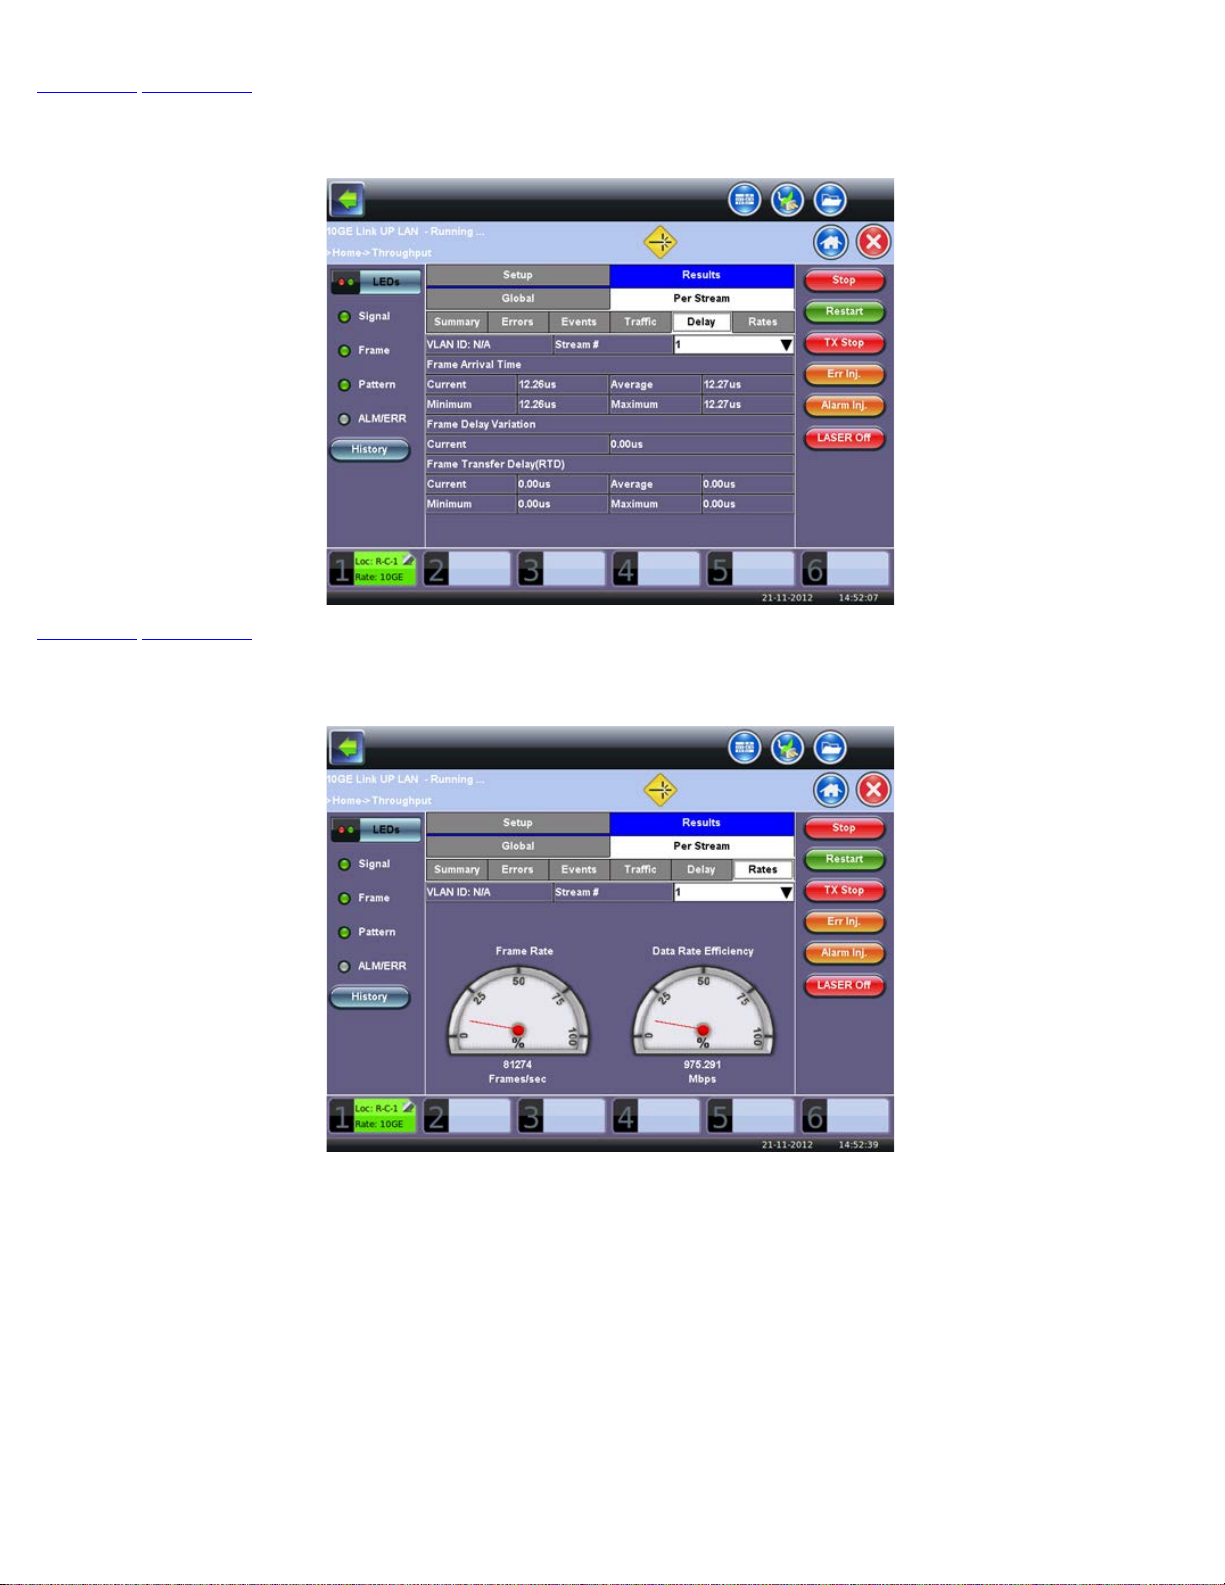
Go back to top Go back to TOC
UX400 10G e-Manual D07-00-058P RevA00
Page 100 of 209
The Per Stream Delay screen displays the frame delay information pertaining to each stream.
Throughtput Results - Per Stream Delay
Go back to top Go back to TOC
The Per Stream Rates screen displays the frame rate and data rate pertaining to each stream.
Tap on the graph to see Rate Details.
Throughtput Results - Per Stream Rates
Throughtput Results - Per Stream Rate Details
 Loading...