

Page 1
Vaisala Sigmet Interactive Radar
Information System IRIS™
In today’s business world, companies
and their high-tech products come
and go in the blink of an eye. That’s
why we are proud that IRIS™ is the
longest-selling software system for
weather radar – ever.
IRIS™ has been shipped as a product
for over 20 years.
IRIS™ makes any weather radar
better. Vaisala is totally focused on
providing the highest quality signal
and data processing solutions, and
the system support to make it all
work.
At each step, operators have concise
interactive menus to monitor and
manage the process. These menus
make it easy to trace data all the way
from the radar receiver to the end
user. An entire radar operational plan
from scanning to product distribution
can be designed in an hour and
implemented in seconds.
IRIS™ is the network...
IRISnet makes it work!
From software installation to
remote control and monitoring,
IRIS™ provides logical, easy-to-use
tools for secure “single-seat” radar
network management. The IRISnet
tool is the top-level management tool.
Color coded icons display radar and
analysis sites and show status at a
glance. Operators can point and click
to access the IRIS™ tools for any site
for conguration and management.
Open the utilities menu to perform
radar test and calibration. The IRIS™
menus can be “connected” to any
IRIS™ server node to control radar
scanning, product generation and
output.
www.vaisala.com
Benefits
Single-seat network
▪
administration, testing,
upgrade and maintenance- no
need to go to the radar.
Local and remote control with
▪
automatic fault alerts and
message logging.
Networked real-time display.
▪
Graphical utilities such as
▪
IRISnet for easy radar and
network monitoring and
maintenance.
Built-in simulators for testing
▪
and training.
Automatic operational mode
▪
switching in response to
changing weather conditions.
Comprehensive suite of output
▪
products based on volume
scanning and single sweep.
Composite for networked
▪
radars into selectable
projections and “virtual” radar
sites.
Ecient client-server network
▪
communications and scalable
data communications with
data compression.
Standard TCP/IP networking
▪
approach- no custom
communication protocols.
Support for a wide variety of
▪
standards-based peripherals
such as PostScript printers,
DAT tape drives and DVDs.
Optional 3D display shows the
▪
“big picture”.
Optional Real-time
▪
dual-Doppler.
Seamlessly reads all older IRIS™
▪
data files.
Page 2
Radar Analysis
Troubleshooting... no
problem with IRIS™
The automated monitoring in IRIS™
functions as a “watchdog” that
constantly monitors the health of
the system. This frees maintenance
personnel from having to make
constant checks of the system.
Should a problem occur, IRIS
may alert users and maintenance
technicians. The comprehensive
system maintenance tools in IRIS™
make it easy for maintenance
personnel to isolate and solve the
problem.
The Radar Status Menu collects all of
the hardware and software status,
as well as key controls, into a single
place – no need to page through
several menus to determine the
overall health of the system. Since it
is an IRIS™ client/server menu, you
can connect the Radar Status Menu
to view any system on the network.
Should a problem occur, the IRIS™
Watchdog process sends an alert
pop-up message with an audio “beep”
or even a voice synthesis message.
The BITEX utility is used to congure
what parameters are monitored and
the severity of the messages. To
assist with troubleshooting, faults are
logged on disk in the IRIS™ Message
log so that there is a record even if
the system were to lose power.
ANTENNA provides completely
independent radar and antenna
control or sun tracking.
The ASCOPE utility is Vaisala’s
acclaimed signal processor support
utility that provides complete
control and plotting for all signal
processor parameters. Advanced
features include FFT, random phase
and data recording and playback
of any data- even I and Q. Signal
simulator provides the ability to test
signal processor congurations and
algorithms on “real-world” signals.
TM
Radar process
The radar process provides
exibility for conguring and
optimizing complex automatic
scanning and signal processing
strategies.
A mix of TASKS are dened for an
active scan. Networked real time
display provides instant feedback
on the progress of a scan. You can
create and save an unlimited number
of schedules for different automatic
operational modes. The scanning
schedule can even be switched
automatically in response to
changing weather. This is particularly
useful for air terminal wind shear
detection.
Display
IRIS™ supports automatic or
interactive output to a variety of
devices. The Quick Look Window,
which is a 4th generation graphical
user inter-face design, is forecastertested and proven to be easy-to-use
with minimal training. Features such
as geographic cursor, home points,
interactive cross-section, forecast
projection and track/annotation make
the Quick Look Window a powerful
tool for forecasters and analysts.
What’s more, the Quick Look Window
can be exported over the network to
any workstation that is running Xeven PC’s running Windows or NT.
IRIS™ supports archive/playback on
DAT, DVD, as well as multi-GB hard
disk archive. System managers can
take advantage of output to other
networked systems in a variety of
formats including IRIS™ Native, JPEG,
GIF, TIF, BMP and PostScript. Color
postScript printers are supported.
These formats make it easy to have
automatic updates for web pages or
other external applications.
Product generation
The ingest les generated by the
radar process are the starting point
for the product generator. IRIS™
has the most comprehensive suite
of products available in the industry
today (see product summary page).
The product conguration and
product scheduler menus give
operators full control over the details
of the product generation and the
mix of products for each operational
mode. All products are made in the
original polar coordinates of the
radar data with correction for earth
curvature and full interpolation.
Resolution and map projection are
selectable.
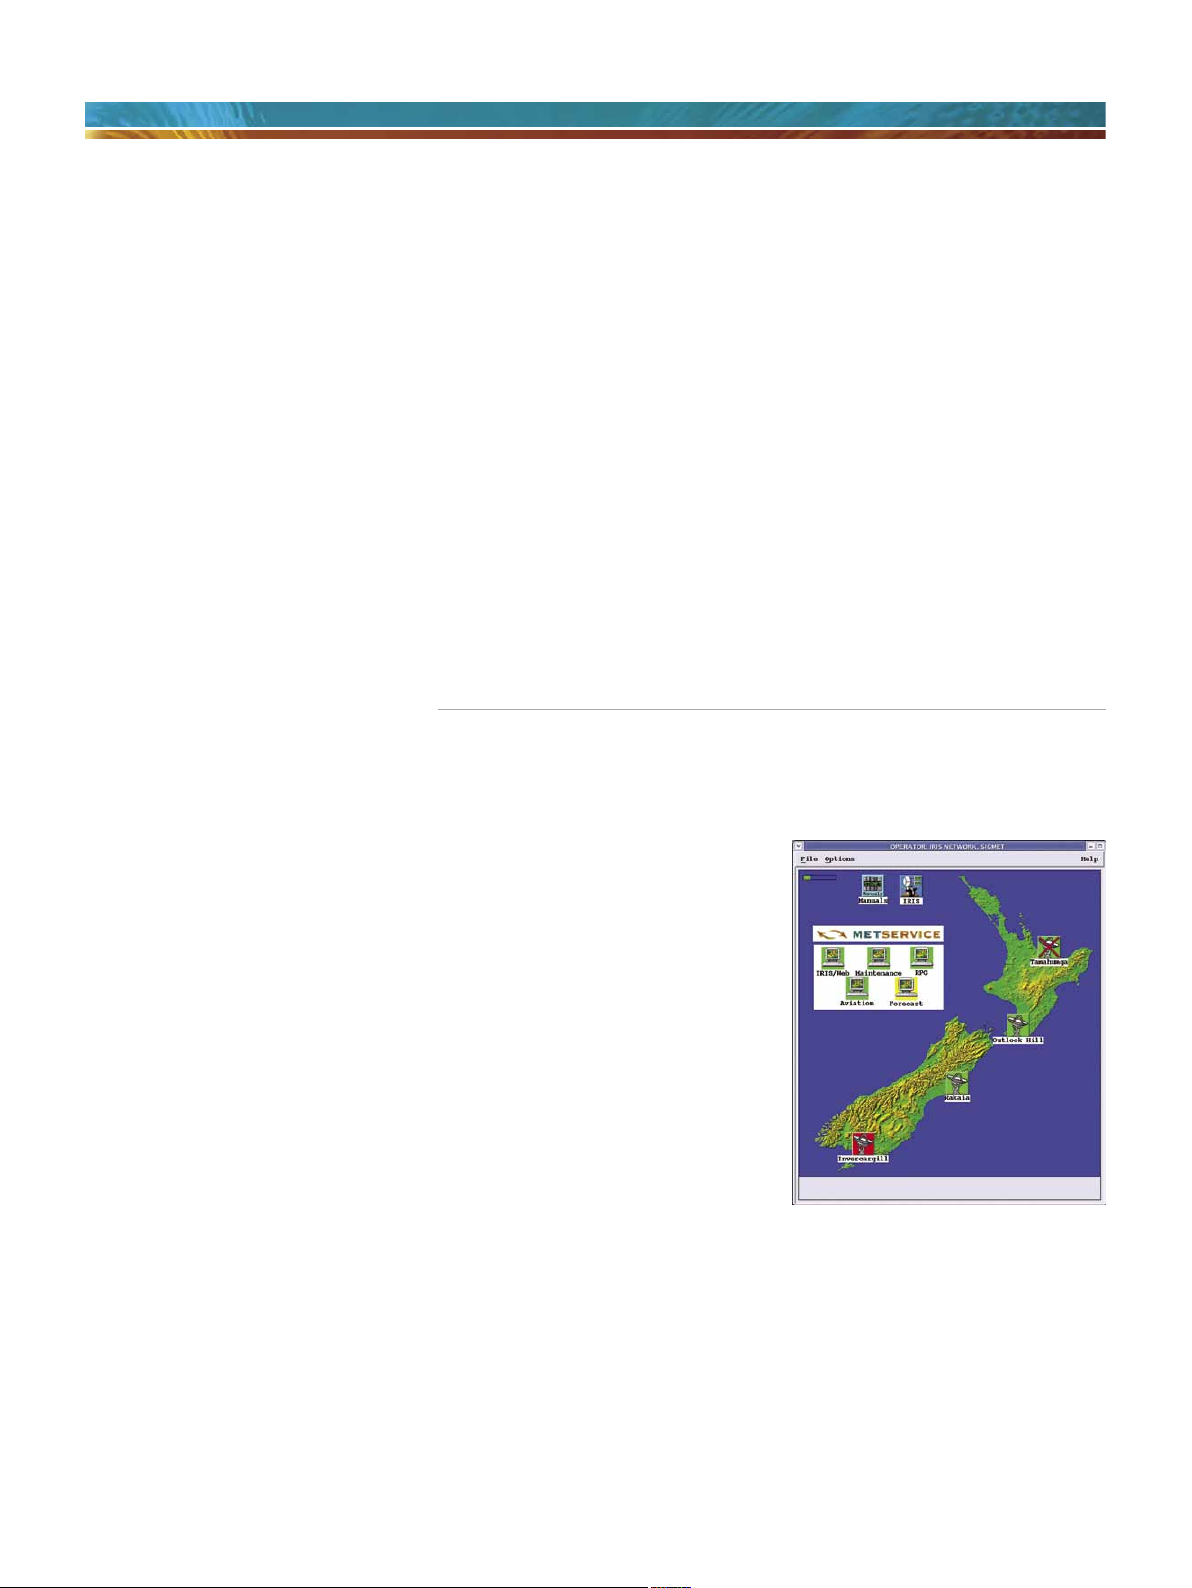
The IRISnet Network management tool
lets you see at a glance the status of all
radar & display systems. Operators can
travel the network with a few clicks of
their mouse.
Page 3

IRIS configuration
Technical data
IRIS™ Products (Ø FULL SET / ∆ BASIC SET)
BEAM Ø∆
Display of dBZ, V or W in AZ/EL space. Useful for beam pattern
measurement.
FCAST Ø∆
Array of displacement and intensity change vectors used for
projecting echoes forward in time in the Quick Look Window.
PPI Ø∆
Classical radar display at single elevation for dBZ, V, W.
IMAGE Ø∆
Based on the GIF format. Used for importing data. In particular it is
used for renderings from the optional IRIS/3D package.
RAW Ø∆
Compressed polar data with “housekeeping”. Used for data
transmission (sweep-by-sweep) and archiving (full volume).
RHI Ø∆
Range-height indicator for “nodding” antenna scanning.
RTI Ø∆
Range-time indicator.
USER Ø∆
An arbitrary format product that is created outside of IRIS™. Used
for input of satellite underlays.
WARN Ø∆
Centroid detection with warning message for “hit” protected areas.
Generates “pop-up” message with selectable beep/voice synthesis.
Can be displayed as colored “centroid” ellipses or overlaid on
other products. Used for making alerts for microburst, hail, flood,
lightning hazard, severe storm, etc.
Page 4

Technical data
TRACK Ø∆
Automatic tracking of centroids with forecasting. Alerts similar to
WARN with the addition of forecast alerts for protected areas.
XSECT Ø∆
Cross-section through arbitrary line for dBZ, V, W.
BASE Ø
Echo base height for a selectable dBZ contour.
CAPPI Ø
Constant altitude PPI of dBZ, V, W. Selectable as single-level or 3D
multi-level in true or pseudo CAPPI.
DWELL Ø
Time dwell of input product, e.g., a dwell of dBZ PPI’s shows tracks
as streaks. The effect is similar to opening the shutter of a camera
observing a moving object.
HMAX Ø
The height of the maximum dBZ.
MAX Ø
The maximum detected reflectivity over each pixel. Includes E-W
and N-S profiles of the maximum in side panel displays.
RAIN1 Ø
Hourly rainfall accumulation based on low-level pseudo CAPPI
or SRI input with selectable Z-R relationship. 15- and 30-minute
periods also.
RAINN Ø
Arbitrary N-hour rainfall accumulation derived from summing the
RAIN1 hourly products.
SRI Ø
Surface rainfall intensity with bright band and profile correction.
Output is for a selected reference height or follows digital terrain
map.
TOPS Ø
Height of a selectable dBZ contour.
VIL Ø
Vertically integrated liquid (or layer average reflectivity) for a
selectable top and bottom layer and Z-W relationship.
VVP Ø
Velocity volume processing wind profile including, wind speed,
direction, divergence, deformation, axis of dilatation, particle
vertical velocities and reflectivity versus height. Display is either
time-height cross-section or graphs.
WIND Ø
Based on the uniform wind assumption and the VVP, this product
shows estimated winds for a selected layer of the atmosphere.
Display is wind barbs that can be overlaid on other products.
Optional Products
CATCH
N-Hour Precipitation totals in subcatchment areas based on RAIN1
product. Histogram pop-up display.
GAGE
Raingage data display with histogram pop-up.
COMP
Compositing of products from multiple radars in a selectable
projection. This is usually done at a central site with distribution
back out to forecast sites. Products available for composite include
BASE, CAPPI, HMAX, PPI, RAIN1, SHEAR, SRI, TOPS, USER, VIL. and
WARN.
NDOP
Dual-Doppler wind fields based on radial wind inputs from two
Doppler radars.
SHEAR
Radial, azimuthal or elevational shear (separately or any
combination). Used for microburst and mesocyclone detection.
SLINE
For detection and forecasting of wind shear lines. Includes
automatic warning for hits or forecast hits on protected areas.
IRIS/3D
Manual and/or automatic 3D rendering of multi-level CAPPI
cube data with image zoom, tilt and rotate. 3D rendering done in
separate 3D engine workstation and 2D IMAGE versions sent back
to IRIS™.
IRIS/SATELLITE
Satellite underlays imported as USER products. Radar data can be
overlaid on top. Currently Vaisala supports MCIDAS format images.
HYDROCLASS
Hydrometeor particle identification and non-meteorological data
classification using the measurands of a dual-polarized radar.
IRIS/LIGHTING
Real-time ingesting and display of UALF flash lightning data
with polarity, cloud-to-cloud, cloud-to-ground, and peak current
information. The lighting information can be overlaid with other
IRIS products within the IRIS™ Quick Look Window.
For more information, visit
www.vaisala.com or contact
us at sales@vaisala.com
Ref. B210636EN-F ©Vaisala 2010
This material is subject to copyright protection, with all
copyrights retained by Vaisala and its individual partners. All
rights reserved. Any logos and/or product names are trademarks
of Vaisala or its individual partners. The reproduction, transfer,
distribution or storage of information contained in this brochure
in any form without the prior written consent of Vaisala is strictly
prohibited. All specifications — technical included — are subject
to change without notice.
 Loading...