

Page 1

vacon nx
ac drives
design guide
hybridization
®
Page 2

Page 3

vacon • 1
24-hour support +358 (0)201 212 575 • Email: service@vacon.com
TABLE OF CONTENTS
Document ID:DPD01887
Revision release date: 24.10.2016
1. BASICS ........................................................................................................................2
1.1 Power or energy storage....................................................................................................... 3
1.2 Battery current dimensioning............................................................................................... 5
2. BASIC TOPOLOGIES FOR CONNECTION....................................................................... 6
3. SPECIAL CHARACTERISTICS AFFECTING THE SELECTION ......................................... 8
3.1 Voltage window...................................................................................................................... 8
3.2 Galvanic isolation requirement........................................................................................... 11
3.3 Balance or maintenance charge......................................................................................... 14
3.4 System control principles ................................................................................................... 15
4. CHOOSING A CORRECT TOPOLOGY............................................................................ 17
4.1 Allowed topology configurations......................................................................................... 18
5. BASIC VARIANTS....................................................................................................... 19
5.1 Direct to DC ......................................................................................................................... 19
5.1.1 Control structure .................................................................................................. 20
5.2 DC to DC .............................................................................................................................. 22
5.2.1 Filter...................................................................................................................... 22
5.2.2 Control Structure.................................................................................................. 34
6. PRODUCT CONFIGURATION EXAMPLES.................................................................... 36
6.1 Scope of delivery ................................................................................................................. 36
6.1.1 Direct to DC........................................................................................................... 36
6.1.2 DC to DC ................................................................................................................ 37
6.2 Example configurations ...................................................................................................... 39
6.2.1 DC/DC for supply interruptions ............................................................................ 39
6.2.2 Direct DC for Grid Support.................................................................................... 40
7. SIZING OF THE SYSTEM AND PRODUCT .................................................................... 41
7.1 Direct to DC ......................................................................................................................... 41
7.2 DC/DC .................................................................................................................................. 42
8. INFORMATION TO ACQUIRE FROM CUSTOMERS ....................................................... 47
NOTE! You can download the English and French product manuals with applicable safety,
warning and caution information from
http://drives.danfoss.com/knowledge-center/technical-documentation/.
REMARQUE Vous pouvez télécharger les versions anglaise et française des manuels produit
contenant l’ensemble des informations de sécurité, avertissements et mises en garde
applicables sur le site http://drives.danfoss.com/knowledge-center/technical-documentation/
.
Page 4
1
vacon • 2 BASICS
Tel. +358 (0) 201 2121 • Fax +358 (0)201 212 285
1. BASICS
The basic idea is always to achieve energy and/or power management of Common Point of Coupling.
Typical use cases are
• time shift for production
• peak load shaving for distribution
• smoothen load for average energy
• backup power or black out start
• grid support
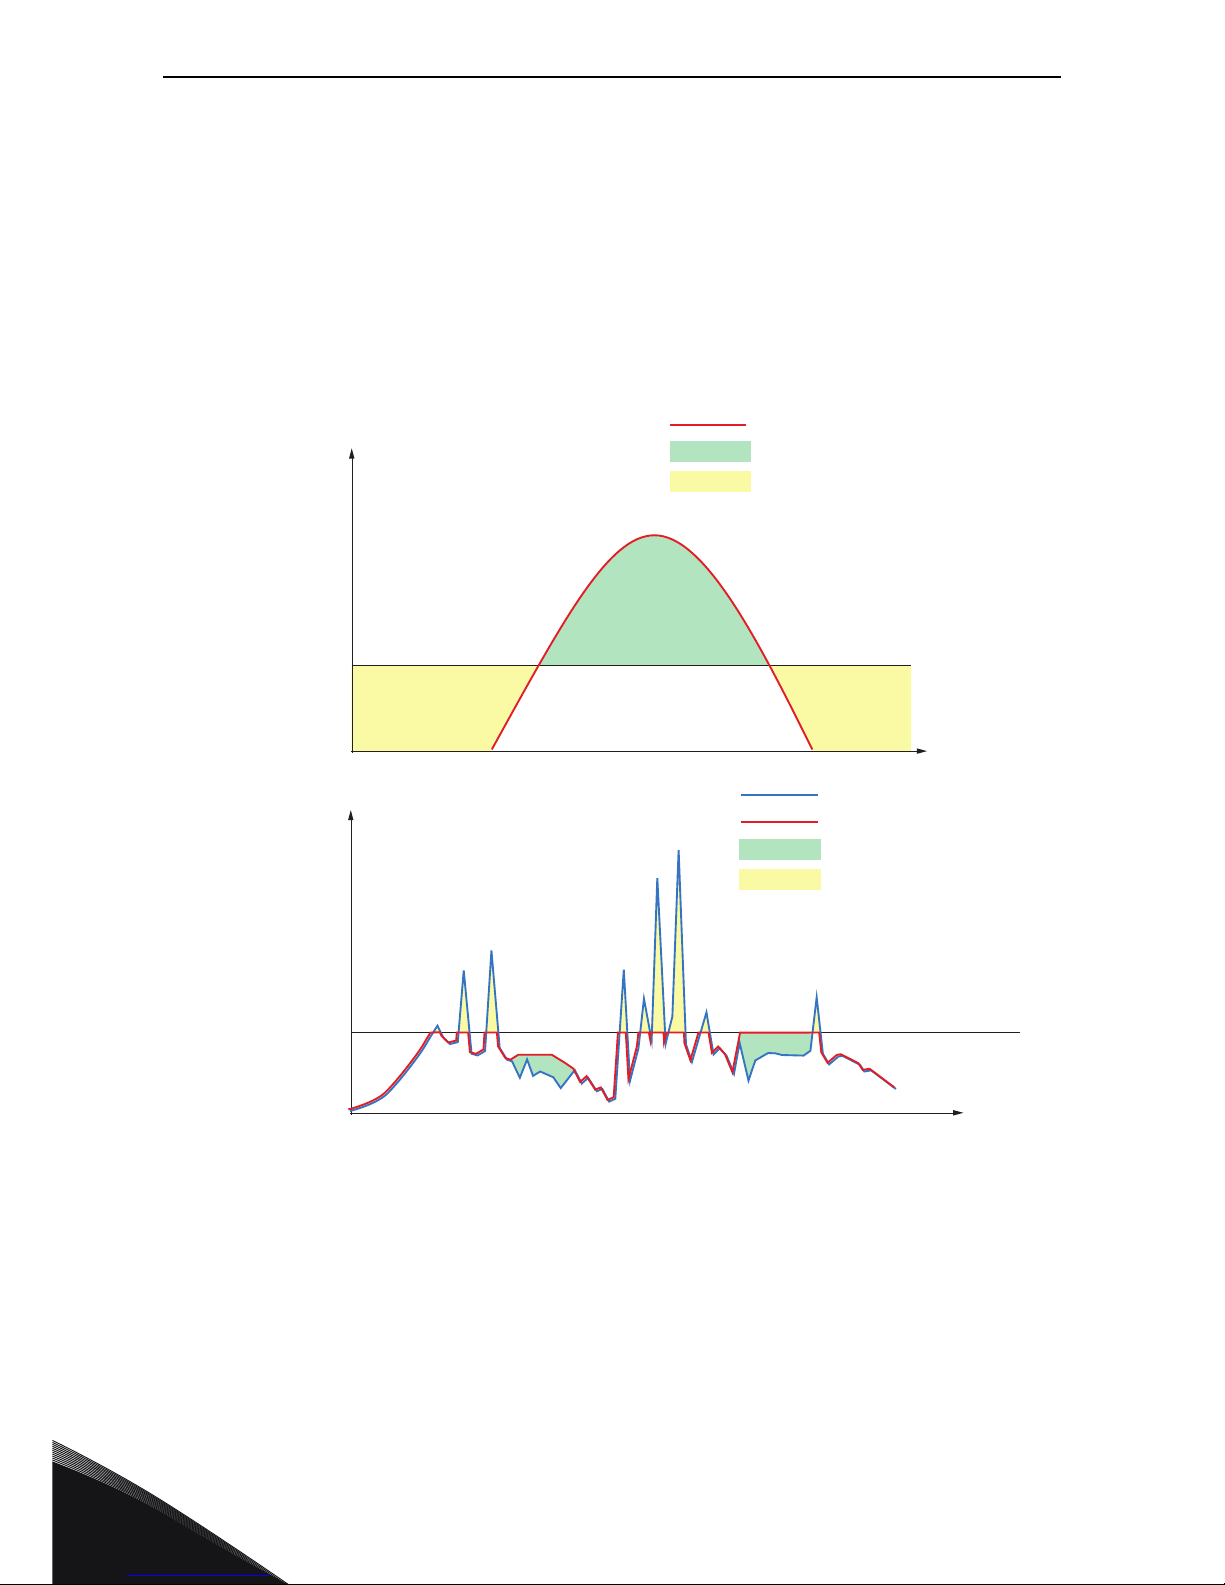
Figure 1. Power balancing
Energy Production
kW
Average Power
t
Charging
Discharging
Process Power
Grid Power
kW
Average Power
t
Charging
Discharging
Page 5
BASICS vacon • 3
24-hour support +358 (0)201 212 575 • Email: service@vacon.com
1
1.1 Power or energy storage
It is important to distinguish the system’s "nature", that is, whether it is a power application or an
energy application. Another relevant thing to note is the dynamic requirements of the application.
Determining the application:
• Energy vs. power (kW/kWh ratio)
• Dynamic requirements:
o Grid support functions (Harmonics, FRT)
o Bulk energy time shift
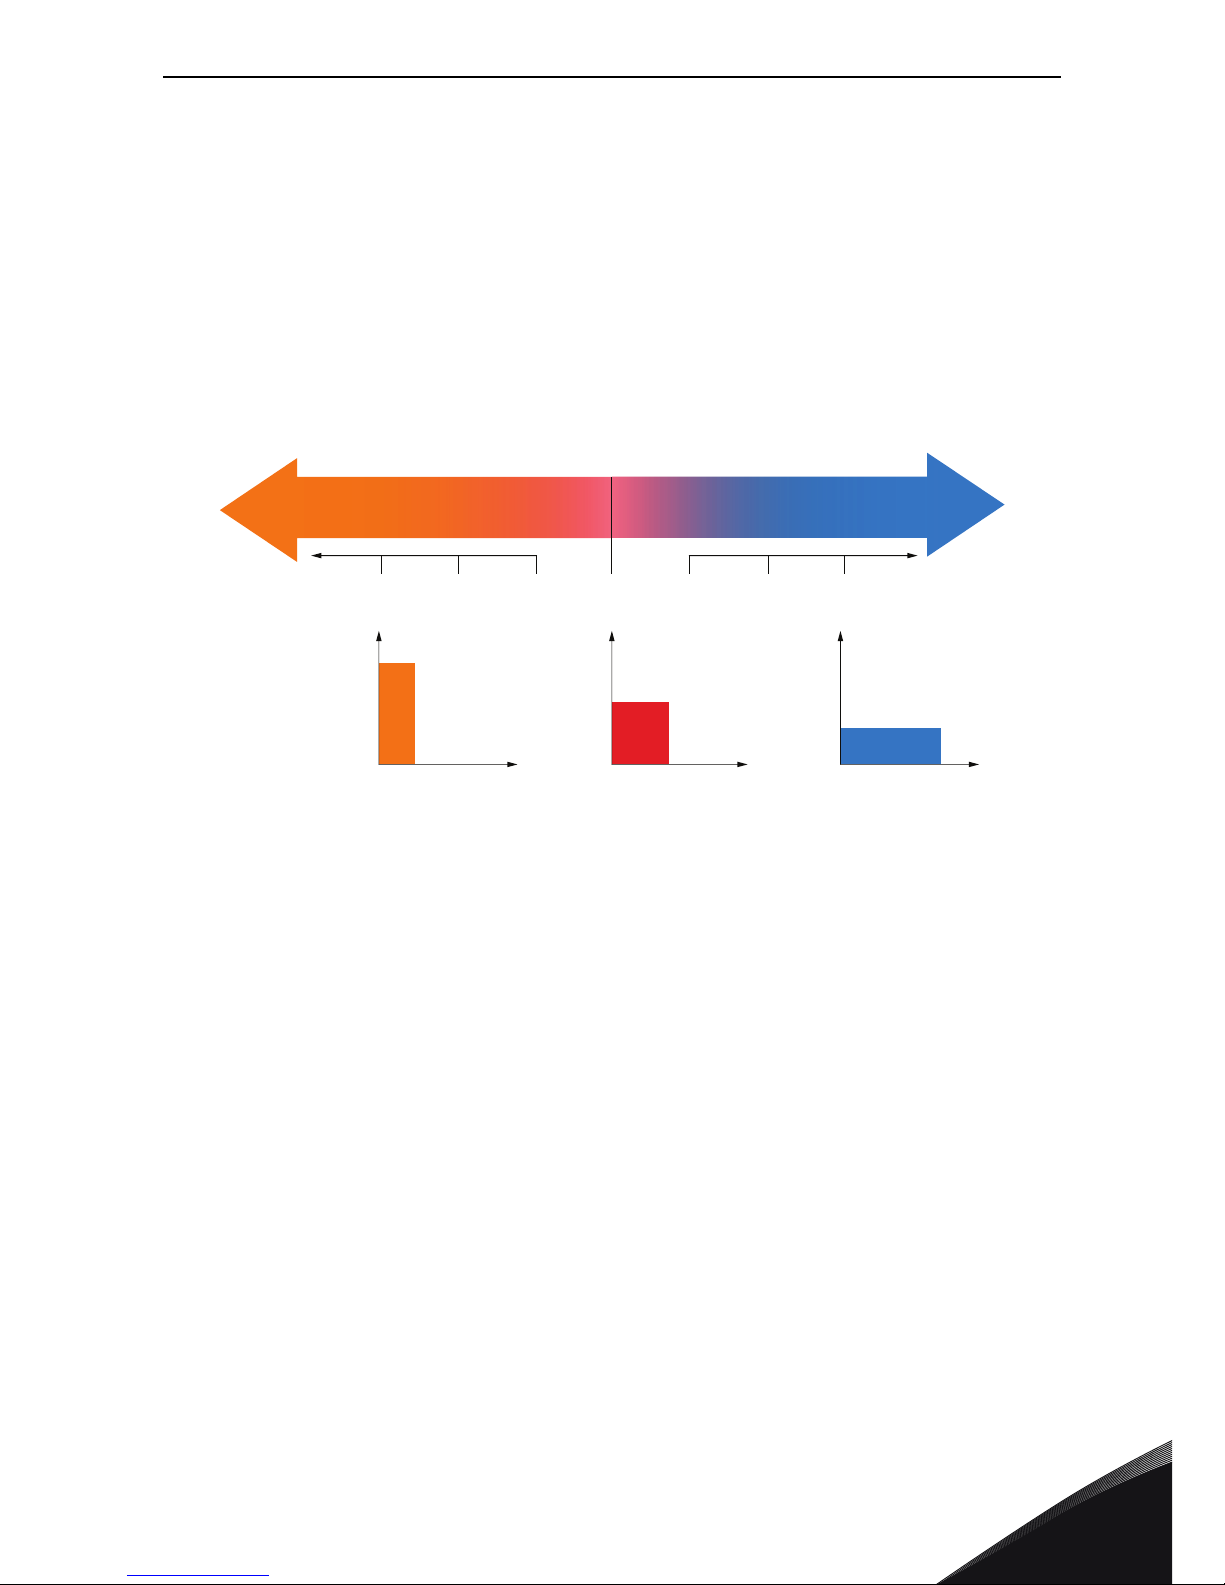
Figure 2. Power vs. energy
Time [h]
Power: Energy
MW: MWh
4:1 3:1 2:1 1:1
1:1 1:4
1:2 1:3 1:4
Time [h] Time [h]
Power [MW]
Power [MW]
Power [MW]
Power Applications Energy Applications
4:1
Page 6
1
vacon • 4 BASICS
Tel. +358 (0) 201 2121 • Fax +358 (0)201 212 285
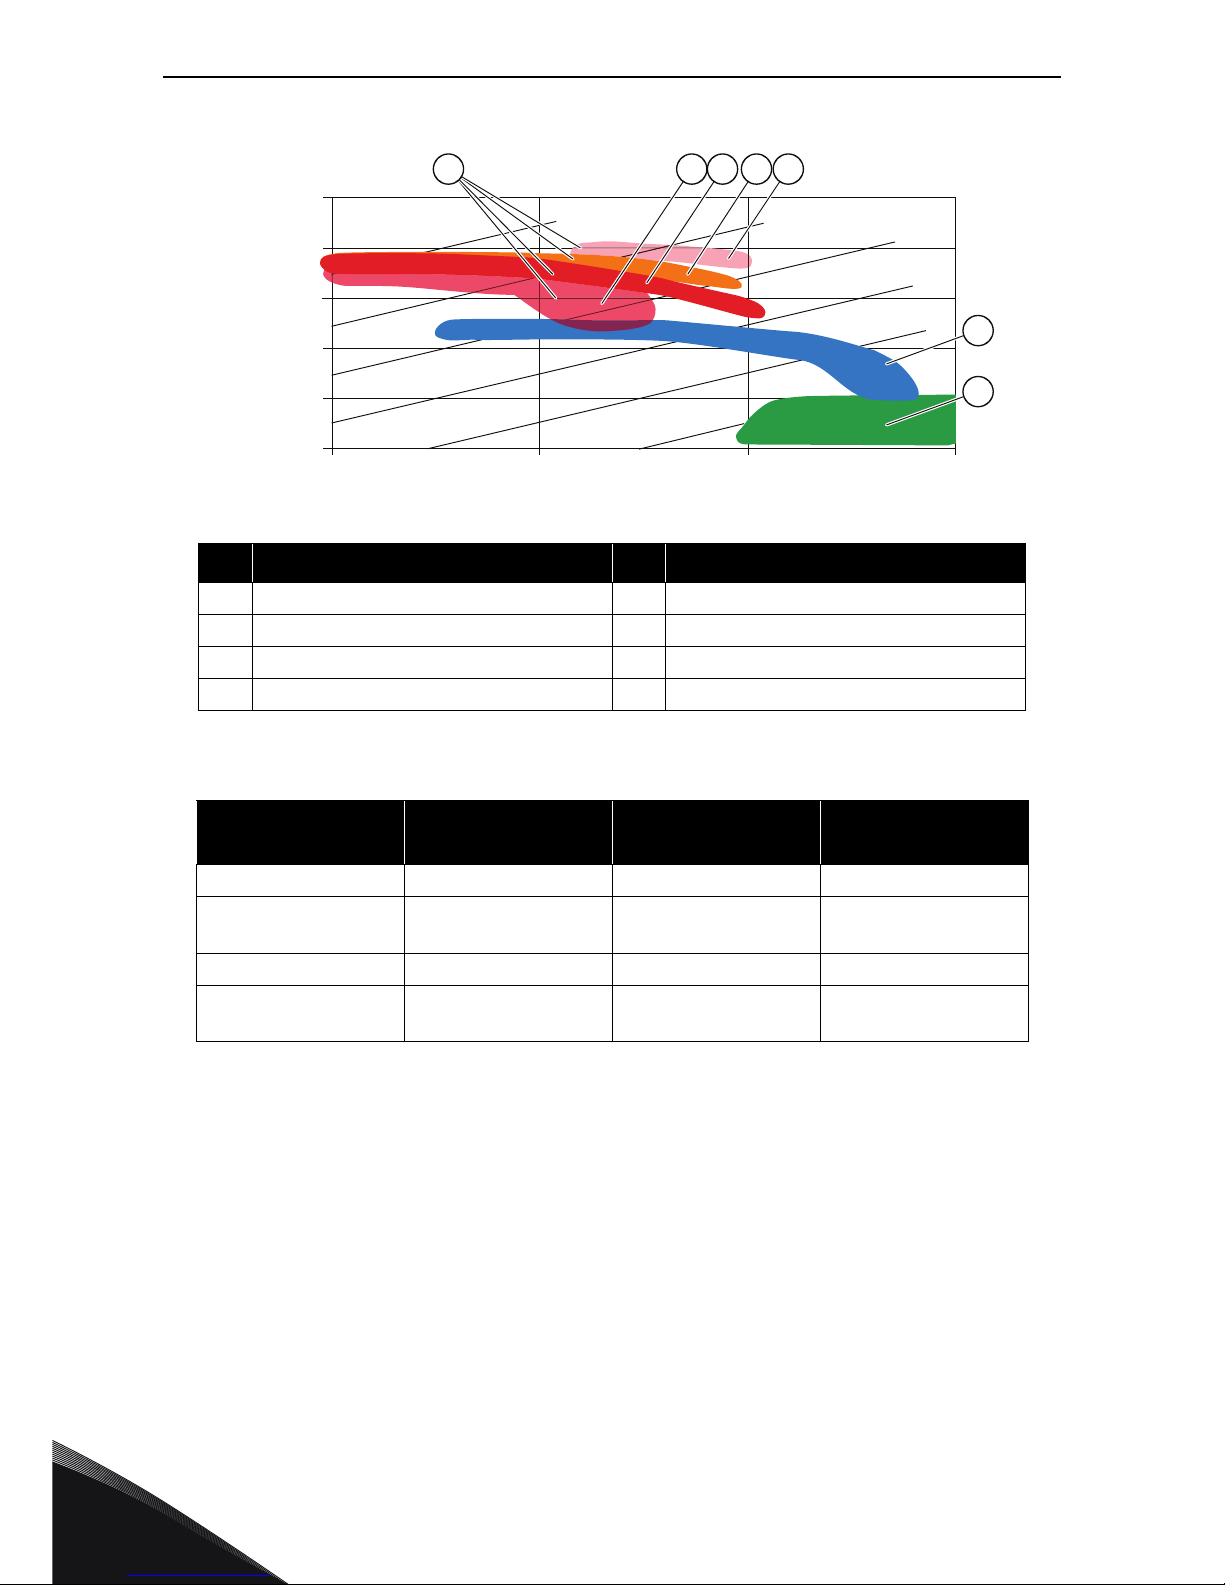
Figure 3. Comparision of battery systems
Table 1. Comparision of battery systems
# Reference # Reference
A Batteries E Li-ion
B Pb F Double layer capacitors
C NiCd G Electrolytic capacitors
DNiMH
Battery type
Energy density
Wh/kg
Power density W/kg
Service life in
cycles/years
Lead acid battery 30-50 150-300 300-1,000/3-5
Nickel-metal hybride
battery
60-80 200-300 >1,000/>5
Lithium-ion battery 90-150 500 -> 2,000 >2,000/5-10
Spercaps (double
layer capac.)
3-5 2,000-10,000 1,000,000/unlimited
BA C D E
F
G
100s
1,000s
1,000
100
10
1
0.1
0.01
10 100 1,000 10.000
10,000s
10s
1s
0.1s
Energy density in Wh/kg
Power density in W/kg
Page 7
BASICS vacon • 5
24-hour support +358 (0)201 212 575 • Email: service@vacon.com
1
© Electricity storage association
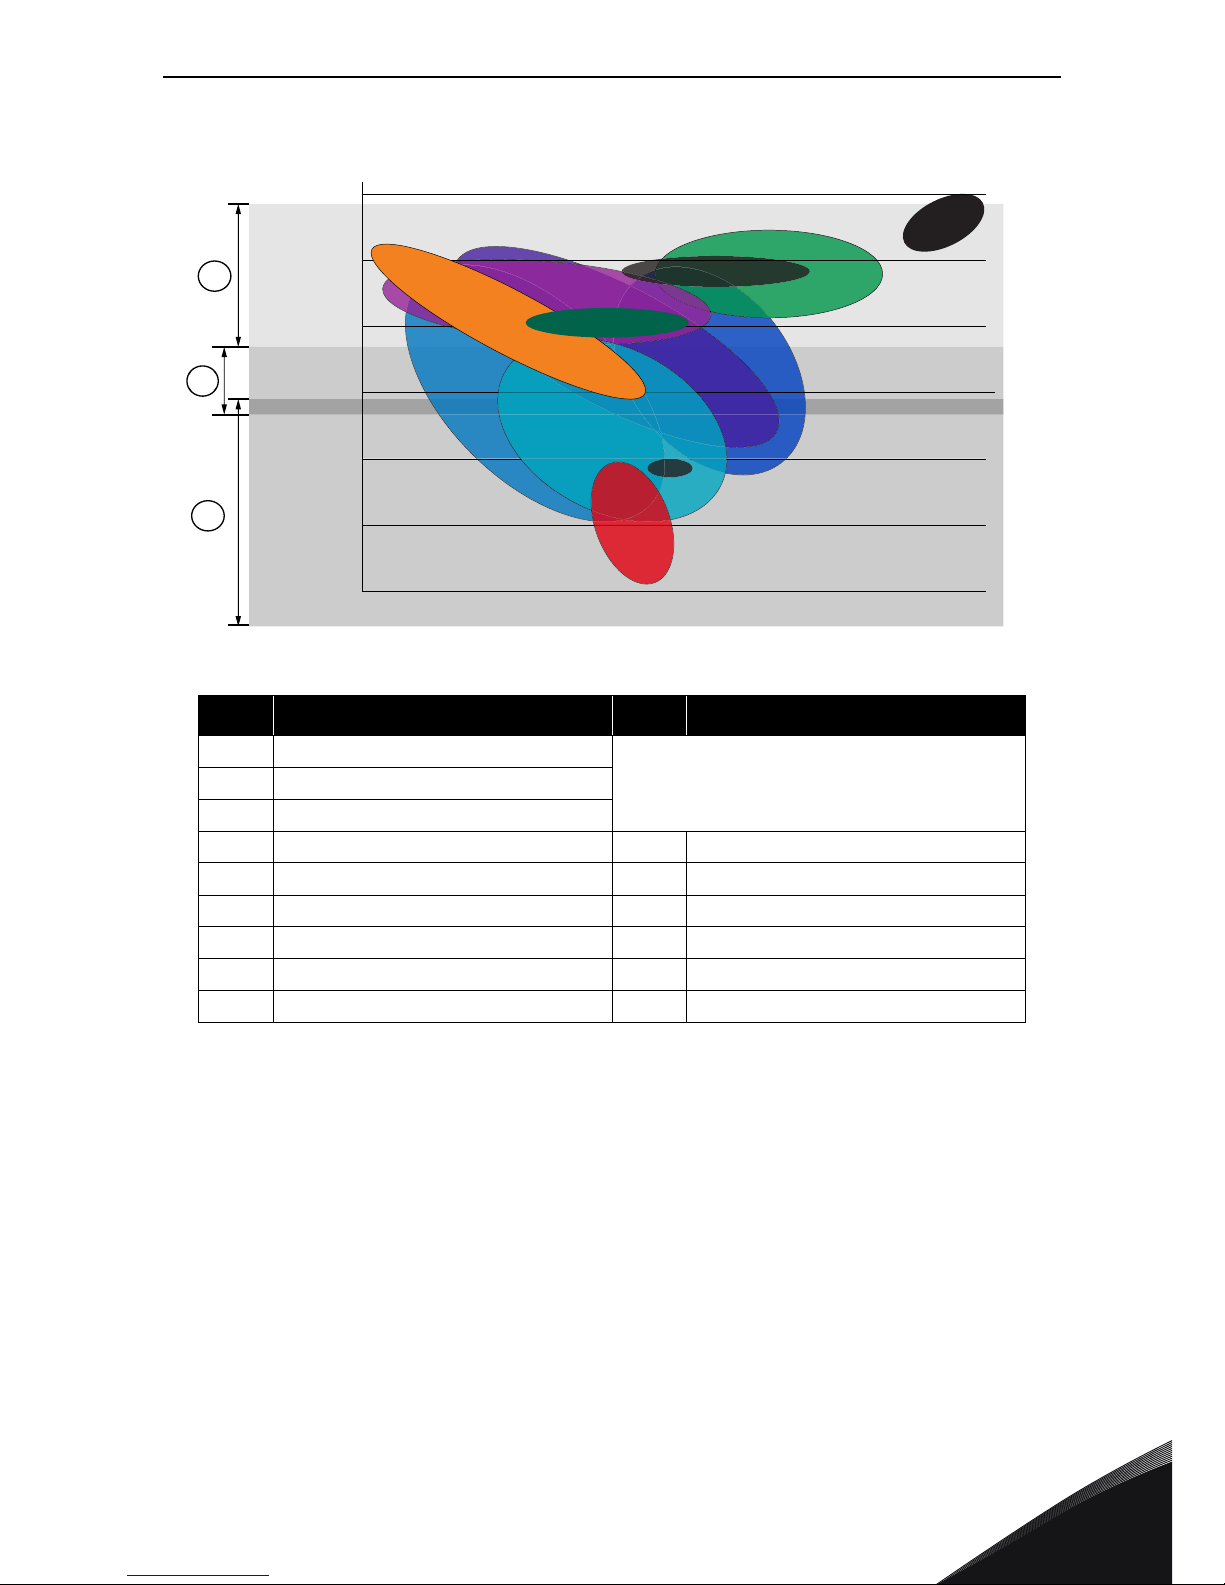
Figure 4. System ratings
1.2 Battery current dimensioning
In a battery, the nominal current is denoted with C. For example, a 10Ah 1C current would be 10A.
In some cases, the below rated currents are marked as 0.5C = C5. In that case, for example a 10Ah
rated current used with a 1A current would mean 0.1C or C1. In the same example, 2C would mean
20A.
# Reference # Reference
A Energy management
Dicharge timeBBridging power
CPower quality
CAES Compressed air Ni-Cd Nickel-cadmium
EDLC Dbl-layer capacitors Ni-MH Nickel-metal hybride
FW Flywheels PSH Pumped hydro
L/A Lead-acid VR Vanadium redox
Li-ion Lithium-ion Zn-Br Zinc-bromine
Na-S Sodium-sulfur
A
C
B
100
10
1
0.1
0.01
0.001
0.0001
0.001 0.01 0.1 1 10 100 1000 10,000
Ni-MH
VR
FW
Ni-CD
L/A
EDLC
Na-S
CAES
PHS
Discharge Time [hr]
Rated Power [MW]
Na-S
Li-ion
Zn-Br
Page 8
2
vacon • 6 BASIC TOPOLOGIES FOR CONNECTION
Tel. +358 (0) 201 2121 • Fax +358 (0)201 212 285
2. BASIC TOPOLOGIES FOR CONNECTION
The basic connections are divided into multible possibilities.
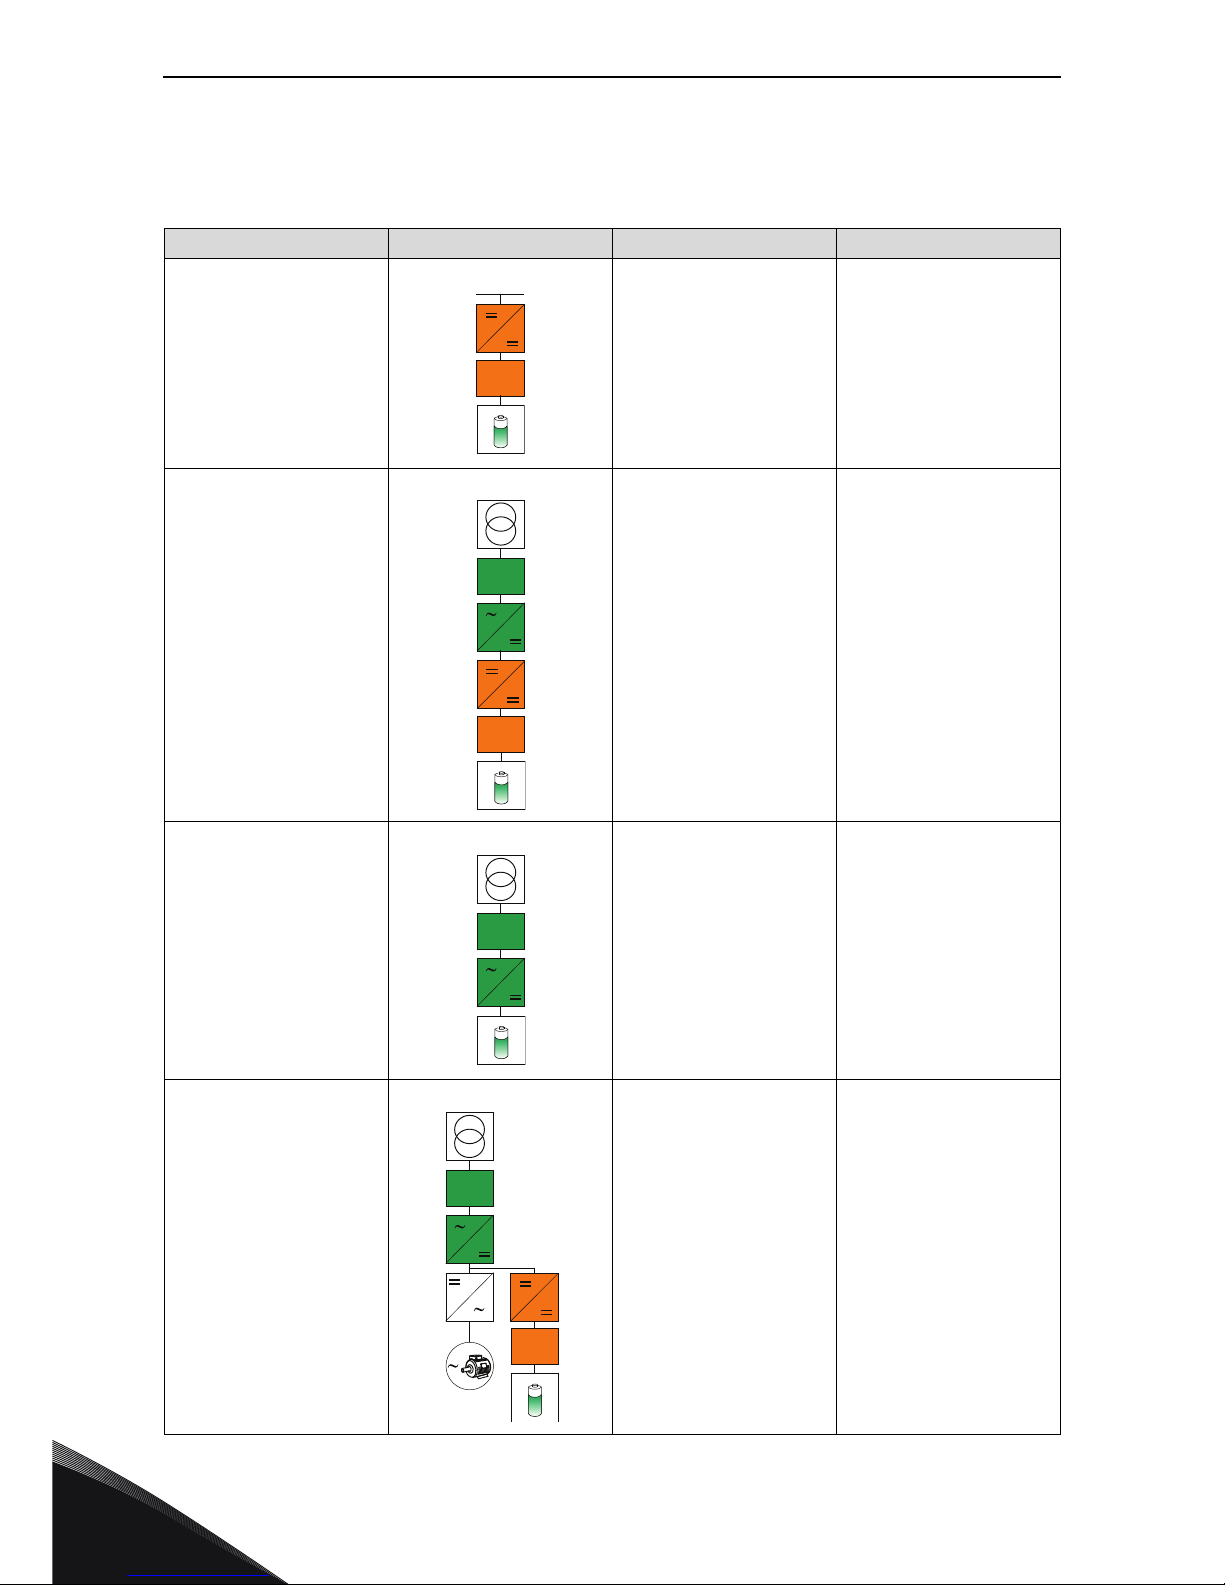
Table 2. Basic connections
Use case Topo logy Pros Cons
Common DC energy
storage connection
• No competitive
"technology" when
DC-grid connection needed
• Different storage
voltage/technology adaptations
Energy storage to ACgrid with combination of
DC/DC converter + grid
converter
• Different storage
voltage/technology adaptations
•Expansion easy
• Battery stack
replacing due to
ageing
•Large number of
components
• Lack of efficiency
•Size
Energy storage directly to
AC-grid with grid
converter
• Small number of
components
• Efficiency
•Size
• Power vs. energy
dimensioning is
independent from
each other
• Expansion difficult
• Battery stack
replacing due to
ageing
Energy storage close to
load and AC-grid with
DC/DC converter connected between DC-link
and storage
•Load power/
energy support
close the consumption
• Different storage
voltage/technology adaptations
•Expansion easy
• Battery stack
replacing due to
ageing
•Large number of
components
•Size
Filter
Filter
Filter
Filter
Filter
Filter
Page 9
BASIC TOPOLOGIES FOR CONNECTION vacon • 7
24-hour support +358 (0)201 212 575 • Email: service@vacon.com
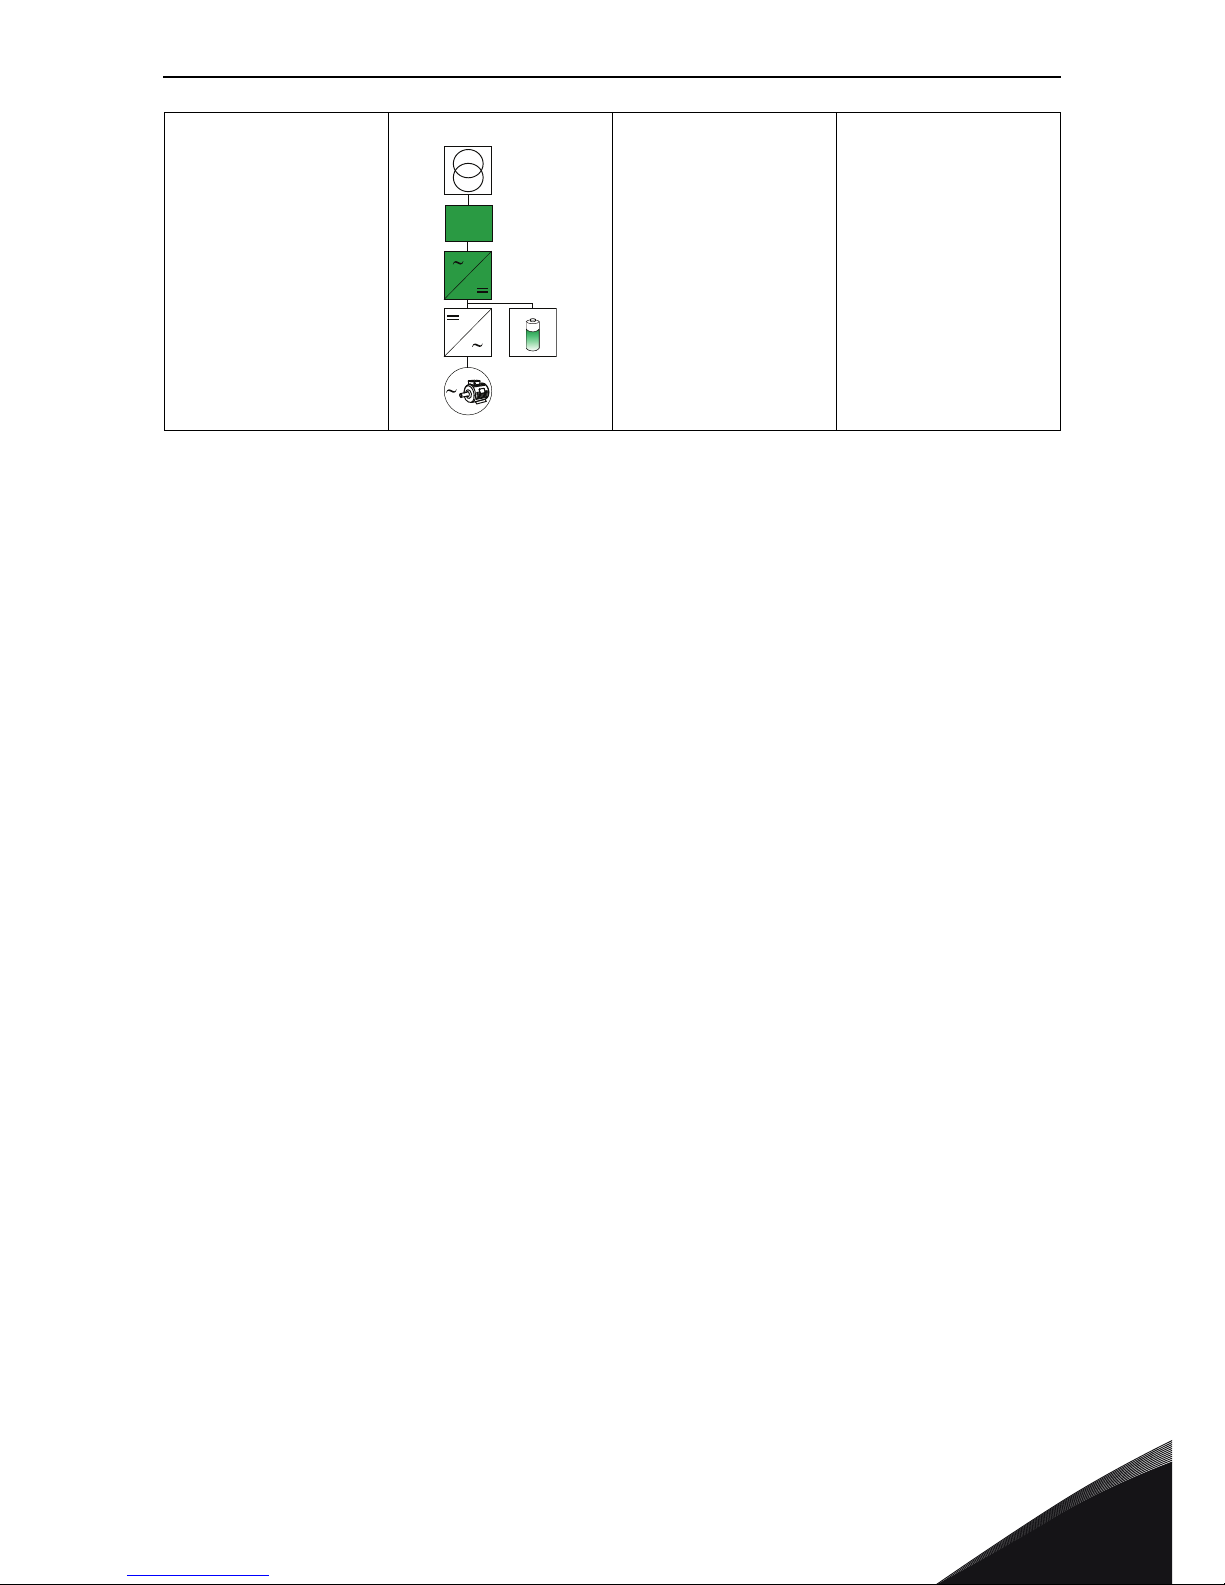
2
Energy storage close to
load and AC-grid with
direct DC-link connection
•Load power/
energy support
close the
consumption
• Large number of
components
• Efficiency
•Size
• Power vs. energy
dimensioning is
independent from
each other
•Voltage window
limiting the scope
only in range of
400 Vac using DC
range 600-1100
Vdc
• System expansion
later with
additional
batteries difficult
Filter
Page 10
3
vacon • 8 SPECIAL CHARACTERISTICS AFFECTING THE
Tel. +358 (0) 201 2121 • Fax +358 (0)201 212 285
3. SPECIAL CHARACTERISTICS AFFECTING THE
SELECTION
Different chemistry causes different behavior in cell voltage as a function of charge/discharge and
SOC (State of Charge). This creates "voltage window" requirement similar to the solar inverter.
Galvanic isolation requirement is different from many industrial drive application. This is due to the
fact that the battery system should not be predisposed for common mode voltage.
For the Battery Management System (BMS) to be able to reset the SOC calculation, it is necessary
to charge the battery to 100% SOC. This ensures that BMS is able to calculate SOC accurately and
maintain the battery in safe operating area. For this, a balance charger or a maintenance charger is
needed in some cases.
3.1 Voltage window
For both the DC/DC converter and the GTC (Grid Tie Converter) the first dimensioning question
comes from energy storage (battery) voltage dimensioning. It is important to define the “voltage
window" for empty and full battery cell voltage. Depending on battery chemistry the ratio can be full/
empty = 1,2… 2… (meaning, for example, full being 1000 Vdc, and empty being from 800 Vdc to 500
Vdc) and for super capacitors even bigger. Especially for GTC this is a limiting factor. The limitations
come from minimum tolerable DC-link voltage to maintain controllable grid voltage and from
maximum allowed voltage to maintain within design criterion of the hardware.
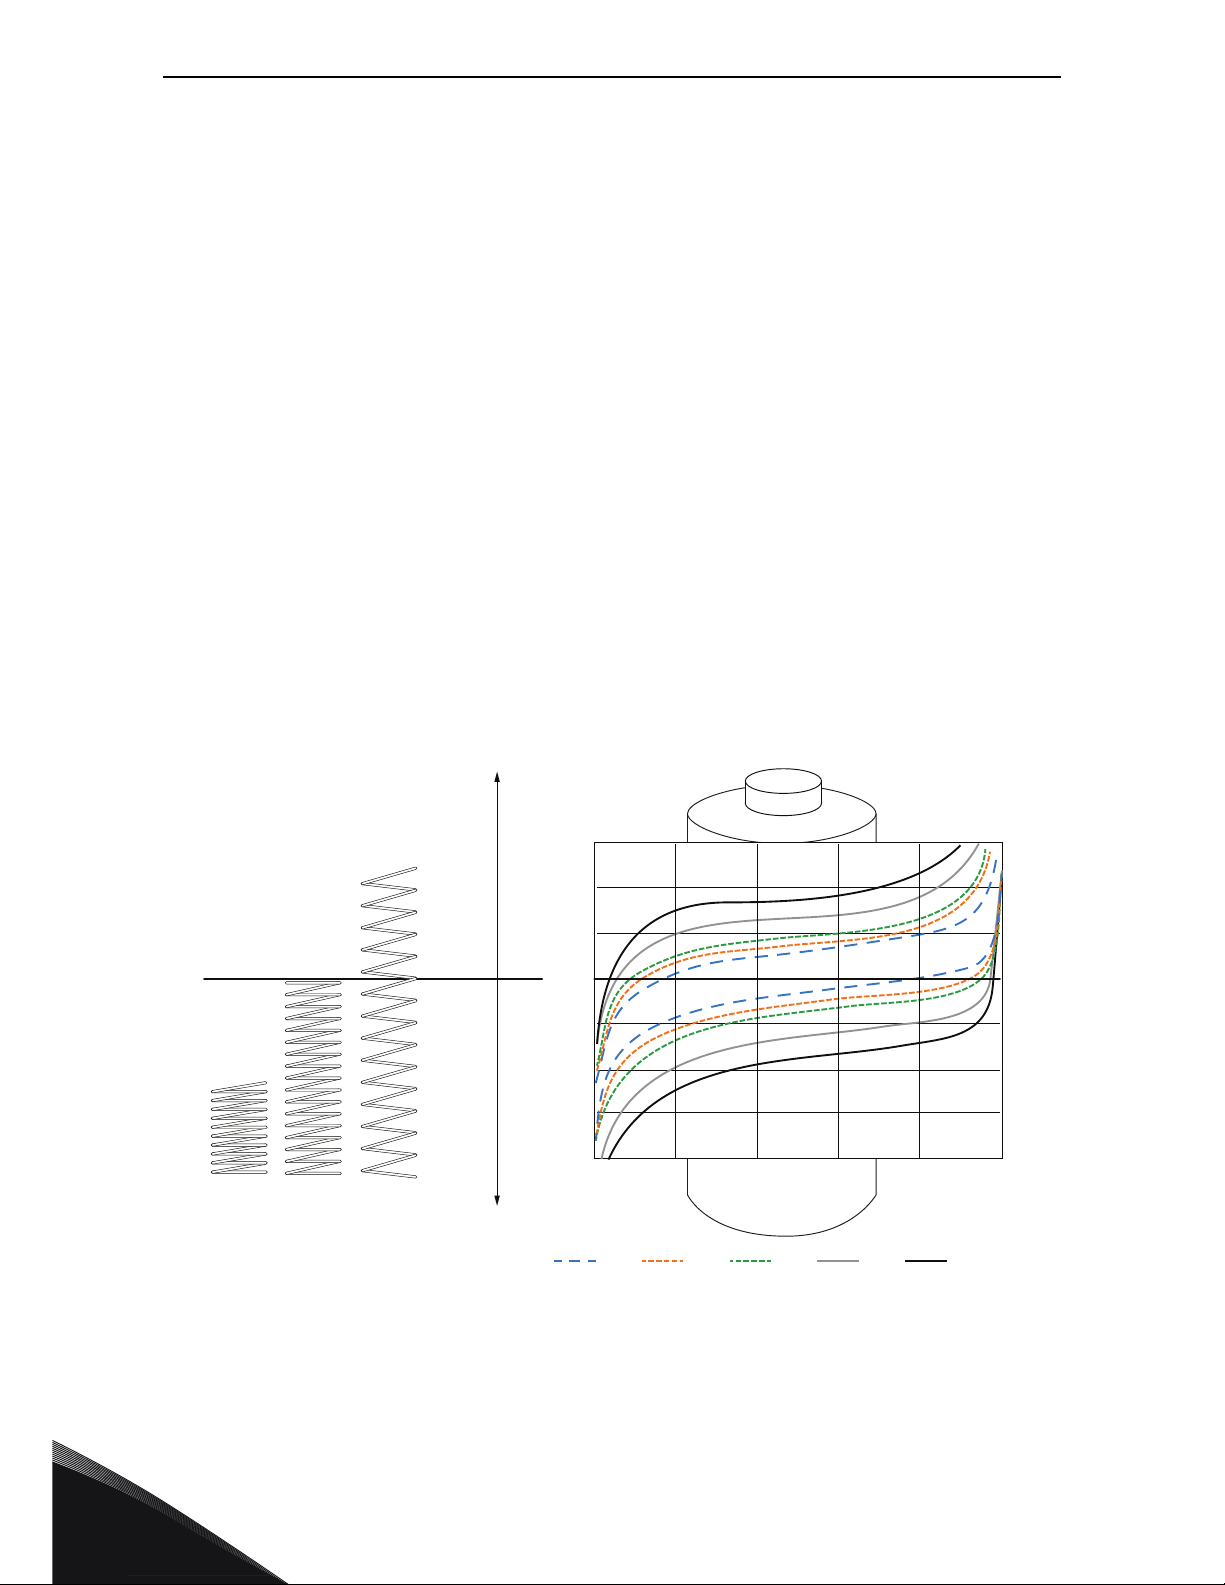
The behavior of voltage stretch in a battery can be illustrated with a spring being pulled or pushed.
Figure 5. Spring analogy of the battery voltage change
120
100
80
0
20 40 60 80 100
U
DC
[%]
SOC [%]
Charging of batteryDischarging of battery
1C 2C 3C 6C 9C
Page 11
SPECIAL CHARACTERISTICS AFFECTING THE SELECTION vacon • 9
24-hour support +358 (0)201 212 575 • Email: service@vacon.com
3
Figure 6. Battery voltage change as a function of State Of Charge (SOC)
The voltage window is important also from the process dynamics point of view. If we expect the
battery system to take energy (either discharge or charge), we create change in voltage of the
battery. The voltage controller needs to be capable to change the actual voltage of the battery in a
controlled way from full to empty value or from empty to full value. For example, if the battery is
wanted to be discharged in 30 s - 300V voltage window from 1000 Vdc - 700 Vdc it means roughly 10
V/s voltage change of rate. This is huge difference in comparison to for example case where
discharge time is longer, say 30 min resulting in 0,2 V/s. This way the SOC (State of Charge) behavior
is observed.
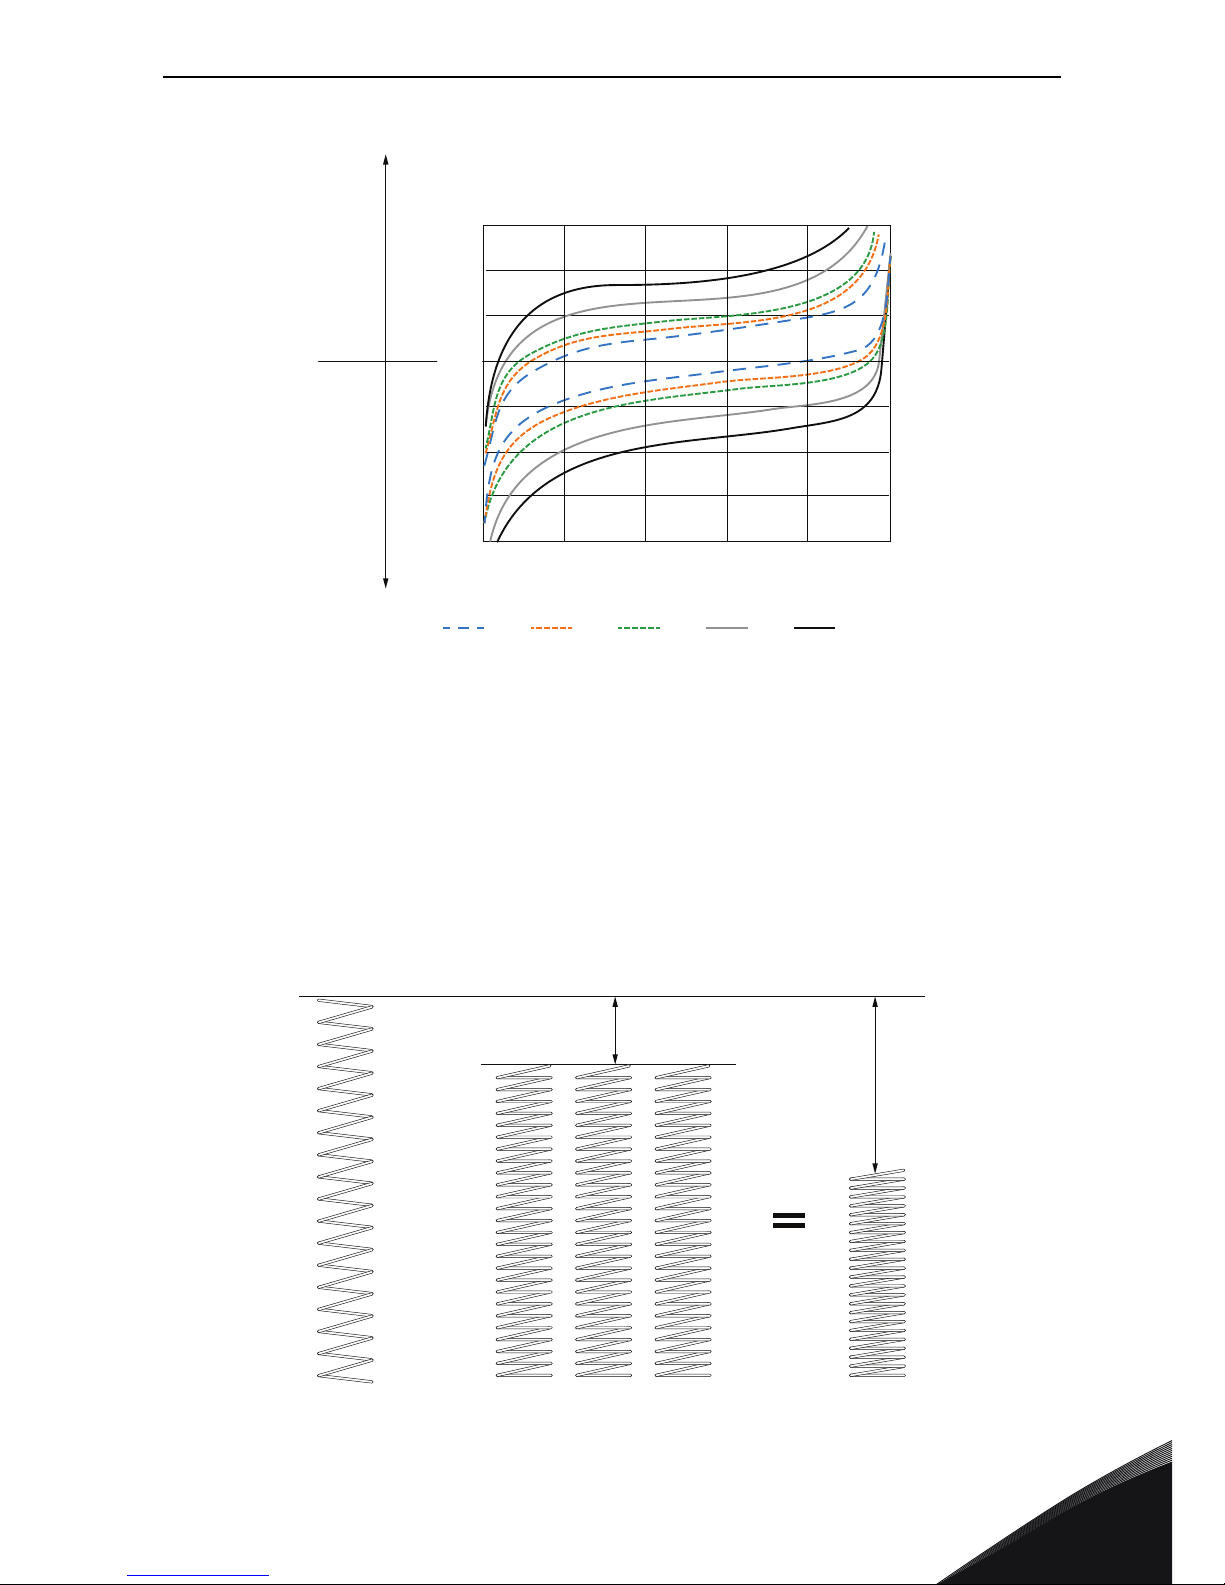
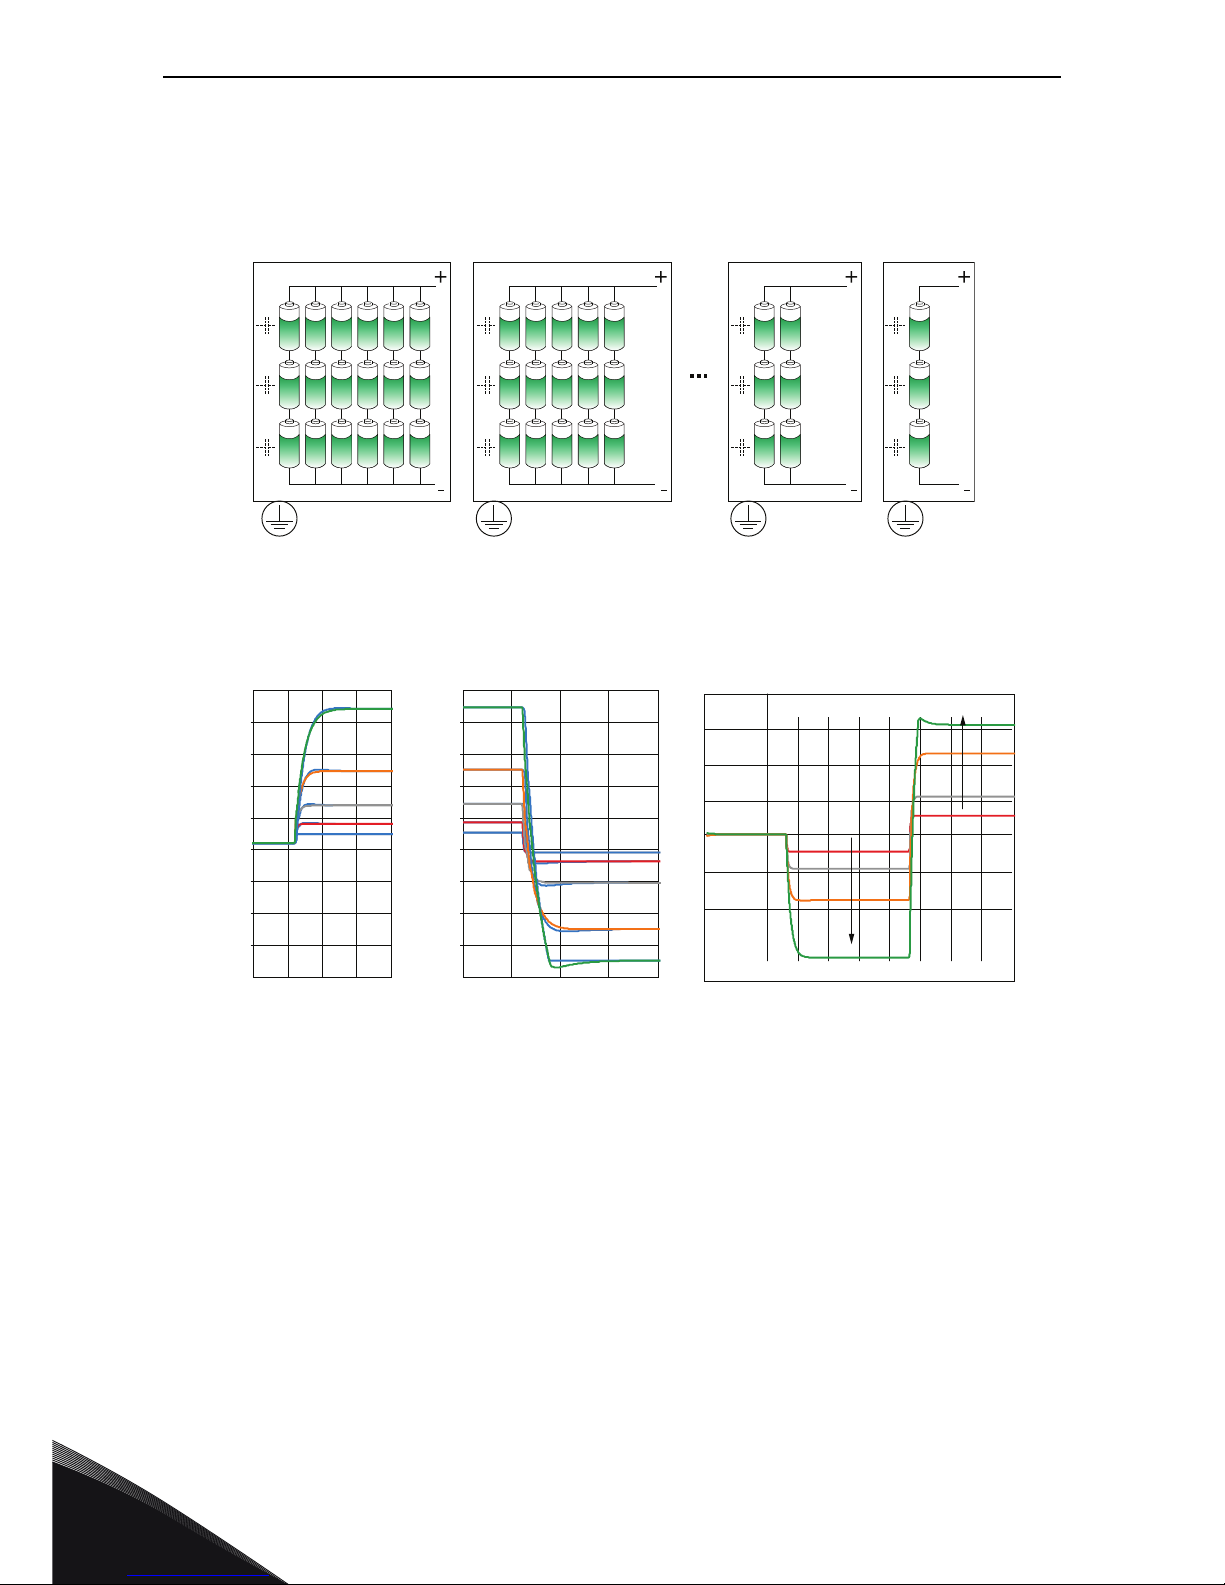
Below is a case where same sized of DC-power units are charged/discharged from the battery.
Figure 7. Battery string number effect on voltage change using the spring analogy
120
100
80
0
20 40 60 80 100
U
DC
[%]
SOC [%]
Charging of batteryDischarging of battery
1C 2C 3C 6C 9C
Page 12
3
vacon • 10 SPECIAL CHARACTERISTICS AFFECTING THE
Tel. +358 (0) 201 2121 • Fax +358 (0)201 212 285
The difference in the cases is that the battery size in energy is changed from 6 strings in parallel to
one string in parallel. This will lead in higher C-rates in the battery having smaller amount of strings
when the same amount of power is taken out of each battery setup (current going from 1C --> 6C).
The effect is visible in higher stretch of voltage levels needed in controlling the battery.
Figure 8. Number of batteries
Figure 9. Battery sizing effect on voltage change during equal power changes
The spring analogy works also when thinking of parallelizing of batteries (springs). The more you
have batteries (springs) in parallel, the less you need to use voltage stretch to gain the same
response.
123456 12345 12 1
120
100
80
120
100
80
8
6
4
2
0
-2
-4
-6
-8
0.2
0.25
0.2
0.35
0.4
0.6
0.65
0.7
0.75
0.8
0
0.1
0.2
0.7
0.5
0.4
0.3
0.8
0.9
1
0.6
tt t
increasing charge current
increasing load current
I [C-rating]U
DC
[%] U
DC
[%]
Page 13
SPECIAL CHARACTERISTICS AFFECTING THE SELECTION vacon • 11
24-hour support +358 (0)201 212 575 • Email: service@vacon.com
3
3.2 Galvanic isolation requirement
The pulse width modulation (PWM) produces common mode voltage. Because every phase (a, b and
c) can be connected only either to positive DC-bus (+U
dc
/2) or to negative DC-bus (-Udc/2), sum of
output voltages is always unequal to zero. The common mode voltage (CM-voltage) U
cm
can be
calculated as average of output voltages:
Table 3 presents all possible common mode voltages produced by different switching states. Used
reference point is in the middle of the DC-link.
Table 3. Common mode voltage as function of modulation sequence
Switching vector a b c
U
cm
U
1
+--
-U
dc
/6
U
2
++-
U
dc
/6
U
3
-+-
-U
dc
/6
U
4
-++
U
dc
/6
U
5
--+
-U
dc
/6
U
6
+-+
U
dc
/6
U
7
+++
U
dc
/2
U
8
---
-U
dc
/2
Page 14
3
vacon • 12 SPECIAL CHARACTERISTICS AFFECTING THE
Tel. +358 (0) 201 2121 • Fax +358 (0)201 212 285
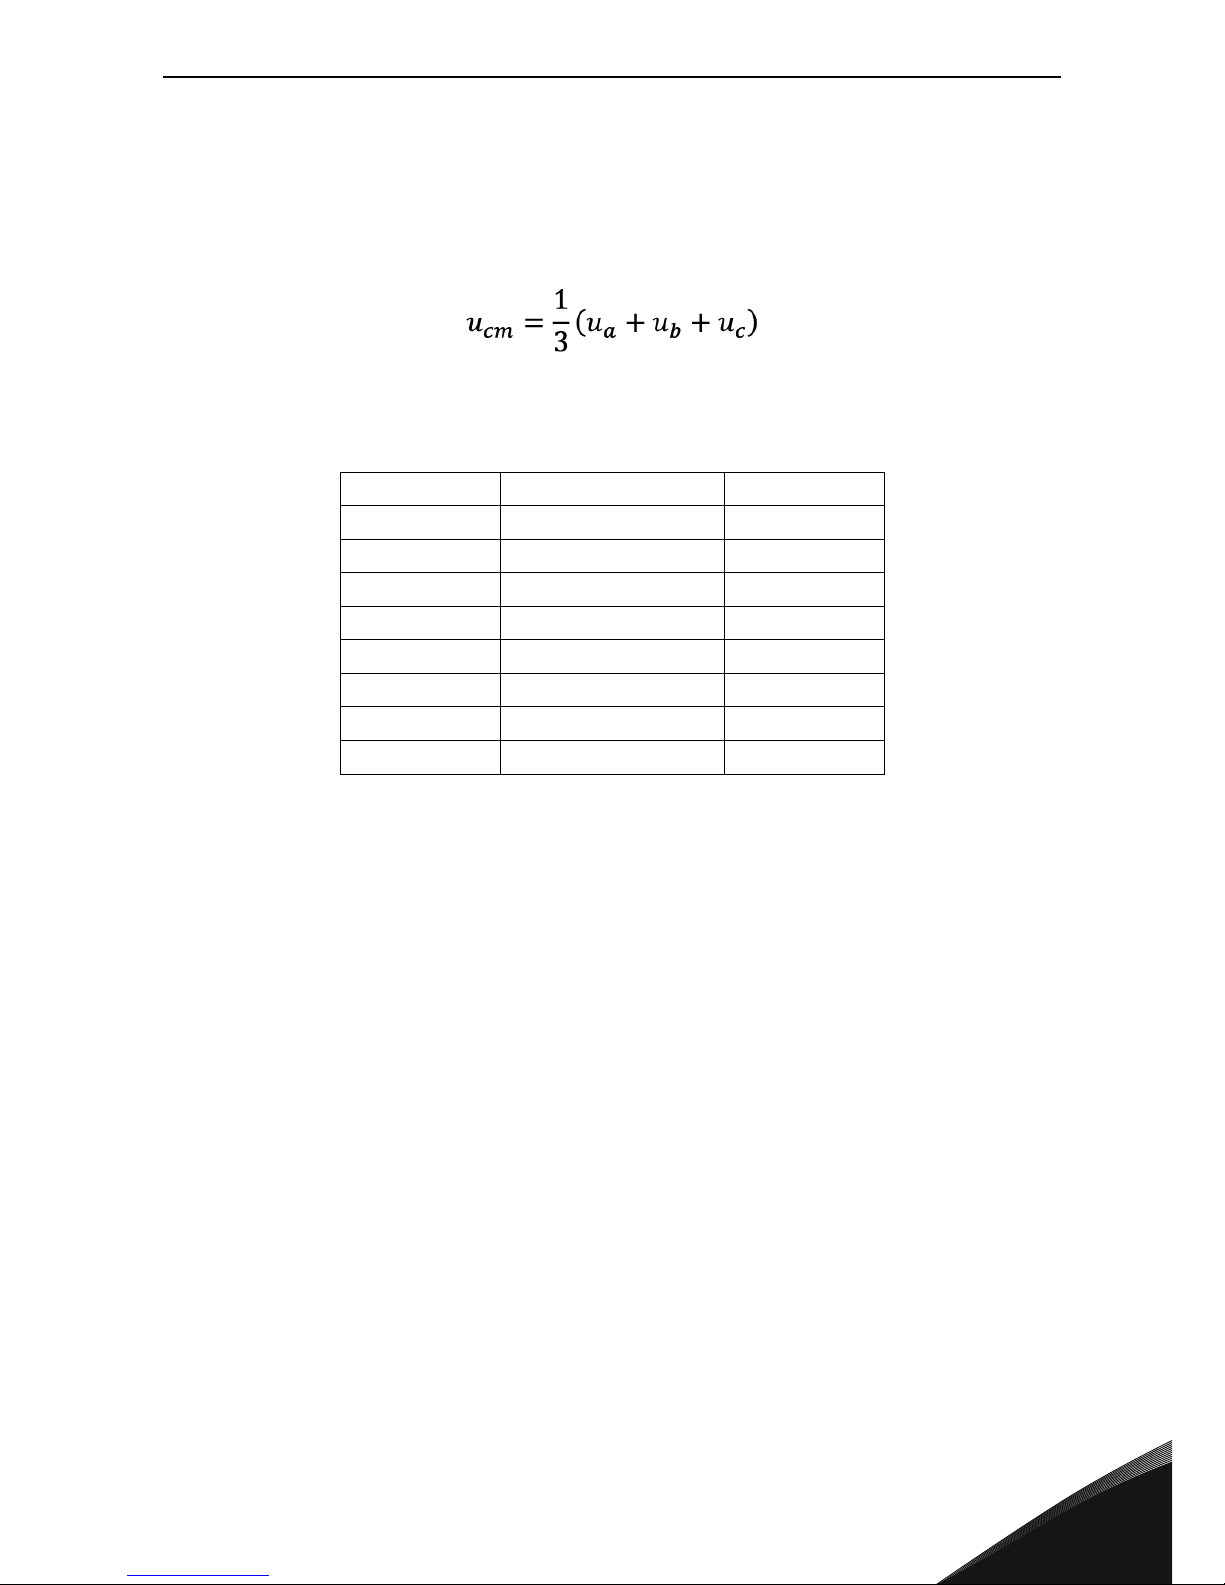
Figure 10. Simulated CM-voltage, Udc=1025V, fsw=5kHz.
Because of the common mode DC-link starts to jump compared to ground. Main frequency for this
jumping is switching frequency but also higher frequencies will be present. As an example, a typical
measured DC+ to ground voltage can be seen in Figure 11. A rule of thumb is that with a typical DClink voltage 1025V, the voltage spikes will be about 1.5kV.
# Curve info max min rms
......
U
DC
/2
171 171 171
----
U
DC
/6
512 512 512
___ CM voltage 512 -512 264
600
400
40 40.10 40.20 40.30 40.40 40.50
Time [ms]
40.60 40.70 40.80 40.90 41
200
0
-200
-400
-600
UDC/6 UDC/2 CM voltage
CM voltageU [V] Common mode
Page 15
SPECIAL CHARACTERISTICS AFFECTING THE SELECTION vacon • 13
24-hour support +358 (0)201 212 575 • Email: service@vacon.com
3
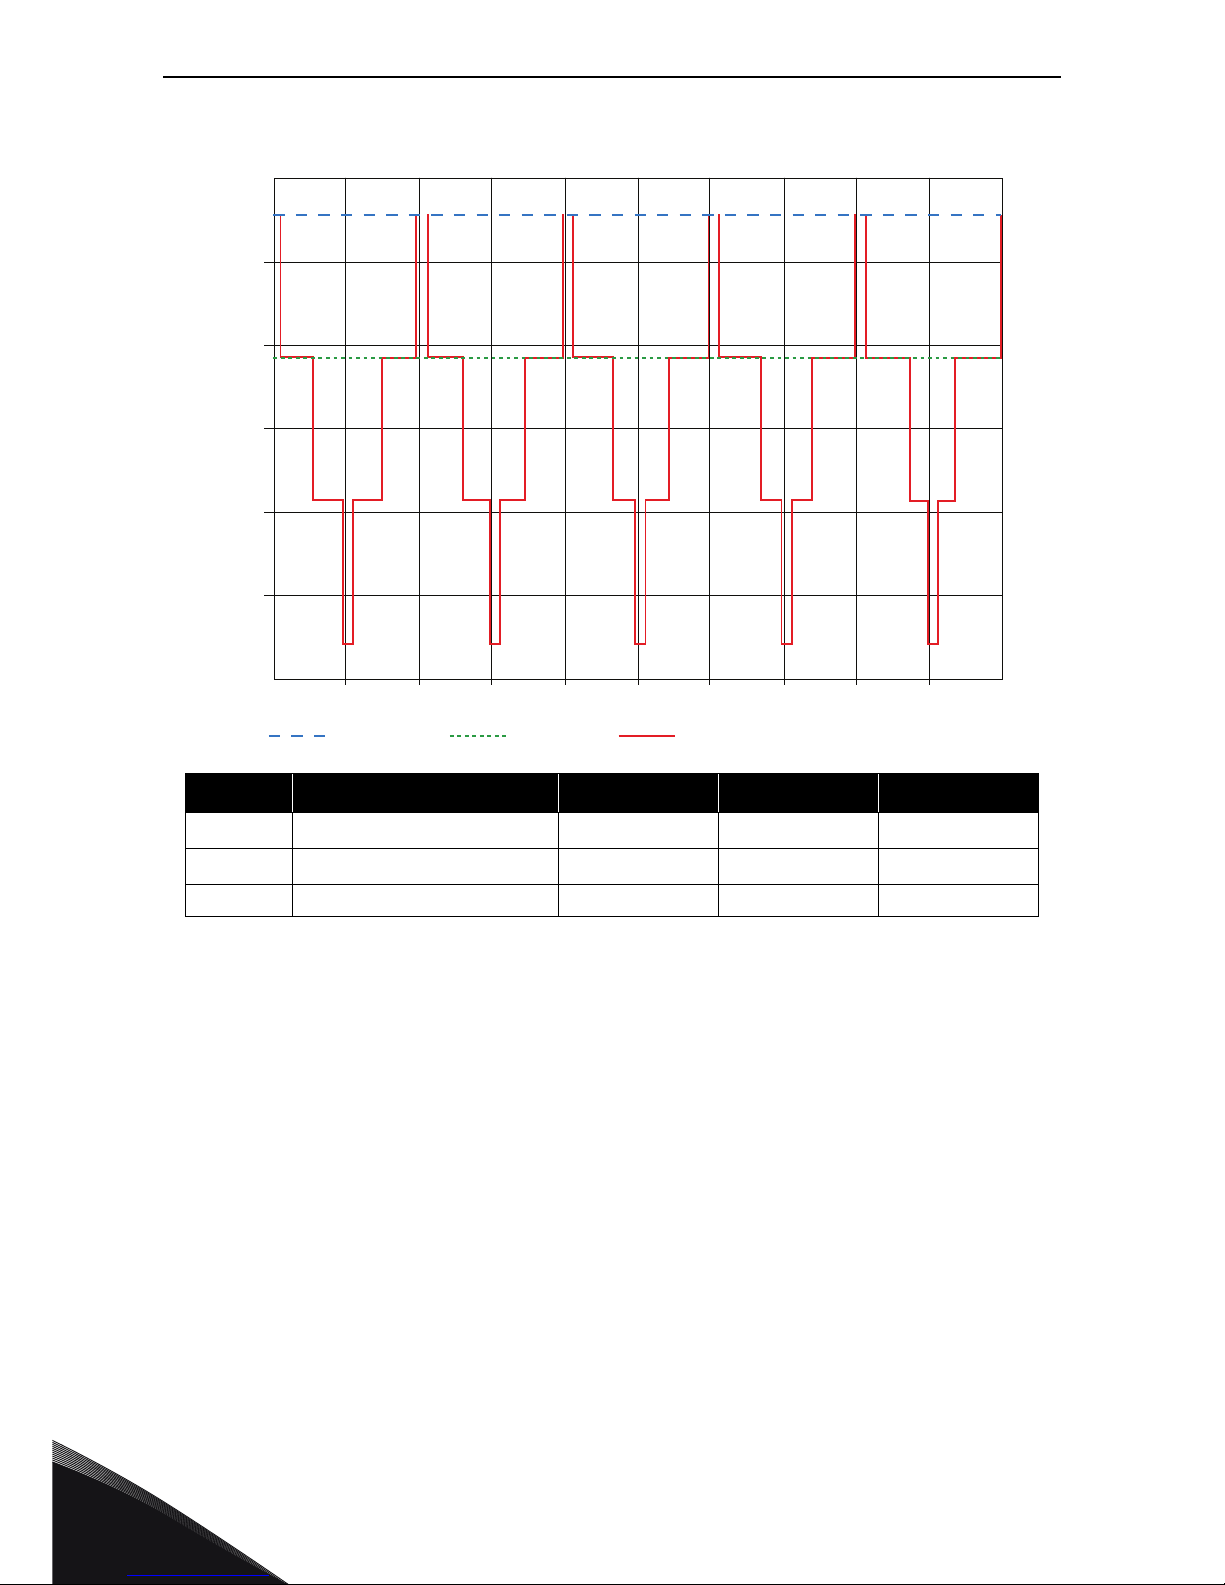
Figure 11. DC+ to ground voltage. On the left U
dc
= 1200 V, on the right 800 V.
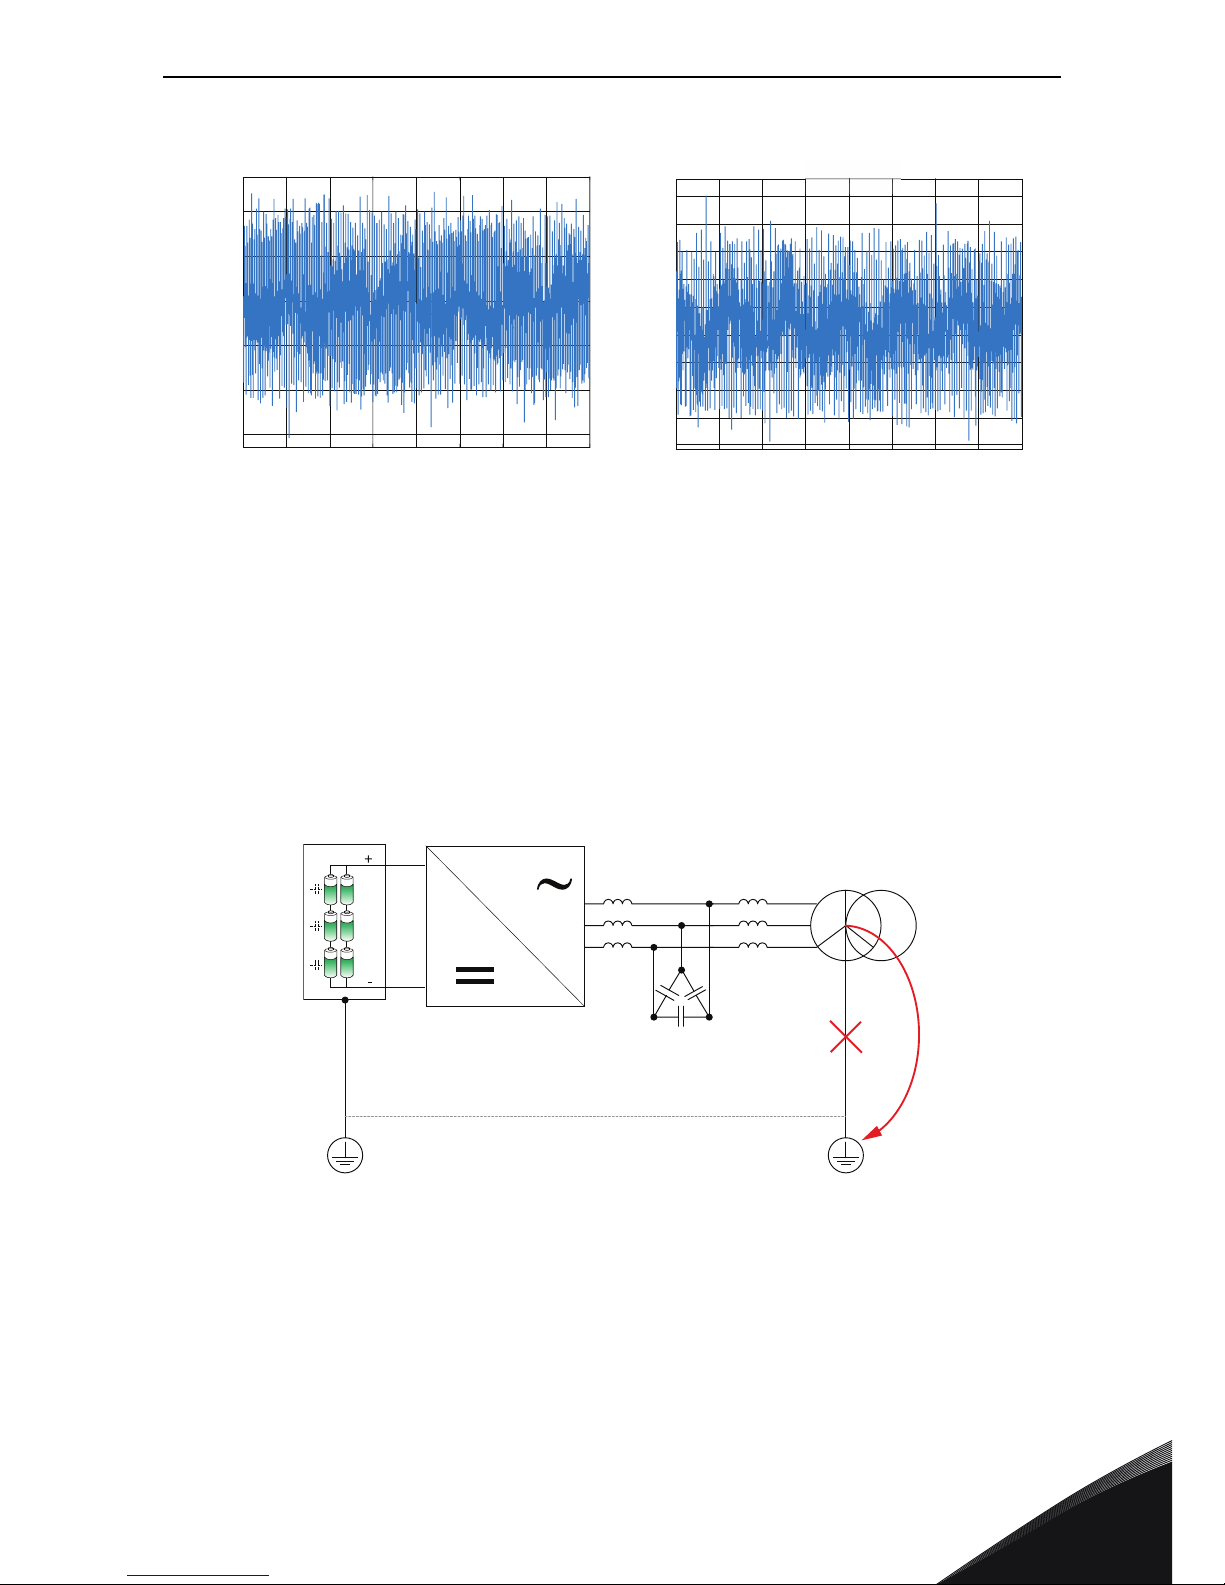
The battery system does not withstand unfiltered common mode voltage. Because PWM modulation
is a CM voltage source, the DC side of the energy storage system must be stabilized. This means
that there must be a flexible element in electrical system that is able to take this common mode
voltage fluctuation. This element is now a transformer star point (instead of a motor stator star
point) that shall not be grounded.
Figure 12. Transformer must be isolated from ground.
In the grid side filter, if LCL is used, the grounded capacitors cannot be kept connected to ground. If
transformer inductance is bigger or at least the same as proposed grid side inductance, it is
possible to use only an LC filter (sine) to avoid additional voltage drop in the grid side choke.
0
0.005
0.01
0.015
0.02
0.025
0.03
0.035
0.04
0
0.005
0.01
0.015
0.02
0.025
0.03
0.035
0.04
-1000
-500
0
500
1000
1500
Sampled waveform
time [s]
voltage [V] voltage [V]
time [s]
-600
-400
-200
0
200
400
600
800
1000
1200
Sampled waveform
CM
Transformer
LCL-filter
AFE
(Active Front End)
DC-link
Page 16

3
vacon • 14 SPECIAL CHARACTERISTICS AFFECTING THE
Tel. +358 (0) 201 2121 • Fax +358 (0)201 212 285
Figure 13. LCL ground capacitor must be disconnected
3.3 Balance or maintenance charge
The maximum voltage of the battery is needed only when charging the battery at the fullest level.
Current in that voltage is small. However, the time during which this voltage prevails can be
theoretically infinite if the battery is continuously kept 100% full (which is not advisable because of
the aging of the battery). When the charging is finished and even only little load is given to the
battery, the voltage decreases rapidly.
It is necessary (after a certain time or a number of battery charge/discharge cycles) to "reset the
trip meter" of the Battery Management System. Otherwise the state of charge calculations can
become misleading and result in poor behavior or even in exceeding the safe operation limits. The
only good way to "reset the trip meter" is to charge the battery to the full state where the Battery
Management System can safely tune its SOC value back to 100%.
Every cell must be charged extremely slowly so that the current of each cell goes as low as possible
(the cell reaches its full voltage). For a big battery system that has many cells in parallel and in
serial this is done from the same DC+ and DC- connections with the same Udc control. Do not start
to dismantle batteries to charge them individually. Because of the differences in cell level (for
example SOC, impedance) this means that some of the cells fill up sooner than others.
To avoid overcharging, the natural passive balancing of the battery system is needed. However, this
is a slow process and that is why the balancing charge needs to be slow with an accurately
controlled small current. It is difficult to say how accurate and small the current needs to be, but
the rule of thumb is that 0.01C is needed. If the device is not able to provide accurately such a
current, it is necessary to add a balance charger to the system. The battery manufacturer can also
be consulted about balance chargers.
-L1
-L2.1
-L2.2
-L2.3
-C1
-C2
HF
HF
-C3
U2 U1
V2
W2
V1
W1
-R1
-C1.1 -C1.2 -C4.1-C4.2
-C5.2
-R4
-R2
-C2.1 -C2.2 -C5.1
-R5
-C6.2
-R3
-C3.1 -C3.2 -C6.1
-R6
no HF
Page 17

SPECIAL CHARACTERISTICS AFFECTING THE SELECTION vacon • 15
24-hour support +358 (0)201 212 575 • Email: service@vacon.com
3
Figure 14. The need of a balance charger
A balance charger is basically the same as a bulk power device (grid converter or DC/DC converter)
but with a smaller rating to be able to reach a control accuracy of storage current of 0.01C.
3.4 System control principles
The energy storage systems are often incorporated with different layers of controls having different
responsibilities.
The Energy Management System optimizes the energy efficiency of the system. This can include
choosing and prioritization the usage of different energy sources. Normal time scales are from tens
of seconds to hours.
The Power Management System includes controlling of power balance in a system that has multiple
energy/power sources. Normal time scales are from grid cycle (20ms - 50Hz) to seconds.
The Power Conversion System of this list is the system relevant to the product. The PCS includes
Power Conversion Control and Power Conversion Hardware, which is the VACON® hardware. It is
to control power conversion between the energy storage and the system. Normal time scales are
from micro seconds to grid cycles.
The Storage System includes Battery Management System and the battery. Battery Management
System monitors the storage system as well as the storage cell level phenomena.
# Reference # Reference
A
Not possible to reach 100%
SOC with big current =
Balance charger?
B
Not safe to go empty SOC
with big current. BMS to tell
when stop discharging.
A
B
120
100
80
0
20 40 60 80 100
U
DC
[%]
SOC [%]
Charging of batteryDischarging of battery
1C 2C 3C 6C 9C
Page 18

3
vacon • 16 SPECIAL CHARACTERISTICS AFFECTING THE
Tel. +358 (0) 201 2121 • Fax +358 (0)201 212 285
Figure 15. Typical system layers
Energy Management System (EMS)
Power Management System (PMS)
Power Conversion System
Power Conversion
Hardware
Power Conversion Control
(PCC)
Battery Management
System
Battery
Storage System
Page 19

CHOOSING A CORRECT TOPOLOGY vacon • 17
24-hour support +358 (0)201 212 575 • Email: service@vacon.com
4
4. CHOOSING A CORRECT TOPOLOGY
Figure 16. Selection diagram
DC/DC
converter
DC/DC
converter
Connection to
AC or DC
Direct to
DC
Application
Control ref
P / Udc /Idc
Customer
primary
reference
Customer
system
tailoring
Control
modes
Island
AFE
uGrid
Voltage
window
AC
small large
Grid
Converter
needed in
all cases
Grid
Converter
needed in
all cases
DC
Filter
Filter
Filter
Filter
Filter
FilterFilter
For example
VACON®
Common
DC-buss
Page 20

4
vacon • 18 CHOOSING A CORRECT TOPOLOGY
Tel. +358 (0) 201 2121 • Fax +358 (0)201 212 285
4.1 Allowed topology configurations
In the following table, example of allowed and not allowed configurations are given.
These configurations are valid for both with DC/DC converter or with a direct battery connection into
the DC-link. Options shown below are DC/DC configurations A), B) and C) and Direct to DC
connection D). Note that the storage topology does not affect the allowed or not allowed topology of
the connection to the system. There might however be other limitations, for example voltage or
current ratings.
Figure 17. Options A, B, C, D
Table 4.
OK? Configuration Notes
No grounding
allowed in
transformer
No HF/EMC
capacitors in LCL
OK
OK, transformer has
enough inductance
to satisfy filtering
demand of grid
converter:
L
transformer
~
L
grid side choke
HF
HF
HF
HF
HF
HF
HF
HF
AB
CD
33
Options
A, B, C, D
33
HF
Options
A, B, C, D
33
Options
A, B, C, D
33
Options
A, B, C, D
Page 21

CHOOSING A CORRECT TOPOLOGY vacon • 19
24-hour support +358 (0)201 212 575 • Email: service@vacon.com
4
NOT OK
Separate DC
sources create
different output
voltage pattern
which creates
circulating current
Not OK if grid
selectivity is
needed, specially for
uGrid
Not OK if grid
selectivity is
needed, specially for
uGrid
33
33
Options
A, B, C, D
Options
A, B, C, D
33
33
Options
A, B, C, D
Options
A, B, C, D
33
Options
A, B, C, D
Options
A, B, C, D
3
3
3
3
Options
A, B, C, D
Options
A, B, C, D
Options
A, B, C, D
Options
A, B, C, D
3
3
3
3
Page 22

5
vacon • 19 BASIC VARIANTS
Tel. +358 (0) 201 2121 • Fax +358 (0)201 212 285
5. BASIC VARIANTS
5.1 Direct to DC
Figure 18. Direct to DC
230 V Unit 500 V Unit 690 V Unit Vac
Supply voltage max 240 500 690 Vac
Supply voltage min 208 380 Vac
Over voltage instantly 437 911 1200 Vdc
Over voltage U2t trip - - 1100 Vdc
DC high ready (Stop) 382 797 1099 Vdc
Normal Max 324 675 931 Vdc
Normal Min 280 513 708 Vdc
DC low run (Def.estim.) 242 475 656 Vdc
DC low ready (Stop) 239 436 602 Vdc
DC low running min 225 410 567 Vdc
Under voltage instantly 183 333 461 Vdc
# Reference # Reference
A
Maximum tolerable U
DC
voltage for AFE
operation
B
Minimum tolerable U
DC
voltage for AFE to
stay in grid with cos
ᵩ=1
A
B
Filter
Filter
voltage
drop
Transformer
voltage ratio
and drop
0
20 40 60 80 100
1C
2C
3C
6C
9C
u
INU
u
AFE
AFE DC
Grid converter
INU AC
AFE AC
SOC/%
Rectifying
DC/AC and
AFE control
marginal
u
GRID
Grid AC
+ Tolerance
1 pu
- Tolerance
Grid nominal
value and
voltage
tolerances
Page 23

BASIC VARIANTS vacon • 20
24-hour support +358 (0)201 212 575 • Email: service@vacon.com
5
5.1.1 Control structure
The power control is as presented below when the battery is directly on DC-link.
Figure 19. DC-link power control
Direct to DC can be used on a system where peak power shaving is desired and grid power sources’
power sharing is done mainly through active power drooping. In such system, the power and grid
frequency behave as shown in the picture below.
Figure 20. Behavior of system power and grid frequency
Grid Converter operation:
• uGrid-operation mode
o Power control possible when operating parallel with other power sources.
•Reference is base current reference (+/-).
•If the device is operating in island mode, the power reference changes the
frequency.
o Grid frequency variations will affect what will be actual power to the grid.
•Operates like a normal generator.
•Power reference is several times faster than a normal diesel generator.
•Frequency drop in a grid will increase Grid Converter power output without power
reference.
- Useful in situations where PMS is not fast enough or is unable to control.
o Upper system needs to give charging and discharging limit to the drive
o Upper system needs to give minimum and maximum voltage limits to the drive (DC-Link
voltage).
U4U3
D7
C
T2
T1
Q1U5Q3
Filter
Source
DC
Grid
Discharge
Power Frequency
Generator Motoring
Average
Charge
Page 24

5
vacon • 21 BASIC VARIANTS
Tel. +358 (0) 201 2121 • Fax +358 (0)201 212 285
•AFE-operation mode
o Power control possible trough DC voltage reference. Needs controller if customer input
is power reference (instead of DC voltage reference).
o Cannot make or maintain grid by itself, needs existing grid
• Island-operation mode
o Power control not possible, drive will give to the grid what the grid needs.
o Cannot operate parallel with other power sources.
o Makes a grid but cannot synchronize to the existing one.
When doing maintenance charging with the aim of a 100% full battery, charging must be done with
DC reference (possibly with a charging current limit).
Page 25

BASIC VARIANTS vacon • 22
24-hour support +358 (0)201 212 575 • Email: service@vacon.com
5
5.2 DC to DC
Figure 21. DC to DC
5.2.1 Filter
The filter topologies in focus are:
1. Interleaved
Figure 22. Interleaved filter topology
# Reference # Reference
A
Maximum full battery U
Battery
voltage for
fixed AFE reference voltage operation
B
Minimum tolerable U
Battery
voltage for
DC/DC & filter current ripple
B
A
Filter
Filter
voltage
drop
0
20 40 60
80 100
1C
2C
3C
6C
9C
u
INU
u
AFE
AFE DC
Grid converter
INU AC AFE AC
SOC/%
Rectifying
DC/AC and
AFE control
marginal
Battery DC
L
L
L
HF
HF
Page 26

5
vacon • 23 BASIC VARIANTS
Tel. +358 (0) 201 2121 • Fax +358 (0)201 212 285
2. Independent output control (not yet supported)
Figure 23. Independent output control
Interleaving is a method to cancel partially or completely certain harmonics from the spectrum.
With a standard 3-phase inverter unit, a natural way is to have a 120 degree phase shift with each
triangle carrier. The result is that the maximum peak to peak ripple is reduced to one third of the
individual phase current ripple. Thus, while the sum current is multiplied by factor of three, the
maximum relative output current ripple is reduced to 1/9. The equivalent switching frequency in the
output is three times the switching frequency.
Figure 24. Example simulation with interleaved control and d = 1/2: leg currents and sum current.
I = 100 A/leg, L = 2050 uH, Udc = 1025V
Curve info rms max min peak to peak
I 1 100.3 113.0 87.0 25.9
I 2 100.3 113.0 87.0 25.9
I 3 100.3 113.0 87.0 25.9
I Battery 300.0 304.6 295.4 9.1
HF
HF
350
I [A]
Time [ms]
I
1
I
3
I
2
I Battery
Currents Interleaved
300
250
200
150
100
50
40 40.10 40.20 40.30 40.40 40.50 40.60 40.70 40.80 40.90 41
Page 27

BASIC VARIANTS vacon • 24
24-hour support +358 (0)201 212 575 • Email: service@vacon.com
5
Figure 25. Example simulation with traditional control and d=1/2: leg currents and sum current.
I = 100A/leg, L= 2050 uH, Udc = 1025V
The ripple current for the filter choke can be calculated as follows:
It is important to note that the ripple depends on duty cycle which is defined as follows:
Curve info rms max min pk2pk
I 1 100.2 112.6 87.4 25.2
I 2 100.2 112.6 87.4 25.2
I 3 100.2 112.6 87.4 25.2
I Battery 300.7 337.9 262.1 75.7
350
I [A]
Time [ms]
Currents Interleaved
300
250
200
150
100
50
40 40.10 40.20 40.30 40.40 40.50 40.60 40.70 40.80 40.90 41
I1=I2=I3 TraditionalI Battery
Page 28

5
vacon • 25 BASIC VARIANTS
Tel. +358 (0) 201 2121 • Fax +358 (0)201 212 285
The maximum value for the ripple of the choke is obtained when d = 1/2
For the output current ripple there are three segments. When d < 1/3, two switches are always at
low state and one switch is either low or high. When 1/3 < d < 2/3, one switch is low, one high and
one is either low or high. And when d > 2/3, two switches are always high and one either low or high.
With d = 1/3 and d = 2/3, output ripple is in theory cancelled. In practice simultaneous switching
prohibit causes some ripple. Disabling simultaneous switching prohibit logic will reduce fluctuation
near d = 2/3 and d = 1/3 considerably.
The maximum value is obtained with three different duty cycles:
Page 29

BASIC VARIANTS vacon • 26
24-hour support +358 (0)201 212 575 • Email: service@vacon.com
5
Figure 26. Peak-to-peak ripple current as function of duty cycle. Scaled values can be converted to real
values by multiplying Udc/(fsw*L)
Interleaved switching helps to reduce the output ripple, but does not affect the single choke ripple.
The choke losses are thus relatively big, when compared to e.g. active front end (AFE). To keep the
losses reasonable, it is recommended to have peak-to-peak ripple one fourth of the nominal choke
current. Thus the proposed formula to calculate the required inductance is:
Using the above filter dimensioning, the relative output ripple is:
Example with a ~ 3% peak-to-peak: The ripple current is a triangle wave and the RMS value is peakto-peak divided by 2 , i.e. 0,8% RMS.
A more general formula for inductance calculation is:
This can be used for example with powder core chokes which tolerate more ripple. With liquid
cooling peak-to-peak ripple can be approximately 35-45% of the nominal current. A bigger ripple in
the choke also directly increases the output side ripple which in this case would be approximately
4-5% peak-to-peak.
0 0.1 0.2 0.3 0.4 0.5 0.6 0.7 0.8 0.9 1
0
0.05
0.1
0.15
0.2
0.25
Ripple current: Choke I
L,pp
(blue) / Output I
Out,pp
(black)
Duty cycle
3
Page 30

5
vacon • 27 BASIC VARIANTS
Tel. +358 (0) 201 2121 • Fax +358 (0)201 212 285
In most cases, a duty cycle d = 0,5 should be used in calculations. This will guarantee that worst case
ripple is taken into consideration. For example, if the application operates with duty cycles 0.7-0.9,
it could be possible to decrease the inductance, and in that way increase the choke ripple (see
Figure 27 below). However, this would also increase the output ripple, and it might not be
acceptable. On the other hand, if output ripple is not important, duty cycle optimization can lead to
significant savings.
Figure 27. Always consider possible duty cycle window
A big DC-link voltage requires more inductance. If the DC/DC converter is sometimes used to boost
DC-link higher than nominal, it must be noted that ripple increases.
In order to minimize size (inductance) of the filter choke switching frequency and current, ripple
should be as high as possible. An optimal design is a compromise between these and power losses.
When the design is ready, switching frequency decrease is not allowed, otherwise ripple will
increase and this can cause temperature problems. In an LCL-filter structure, a smaller switching
frequency can also cause resonances.
The inductance of a traditional laminated iron core choke usually remains constant (L
NOM
) up to
saturation point (I
NOM, PEAK
in Figure 28 below). After saturation point, the inductance starts to
decrease. If overload ability is needed, ripple increases in saturation region and must be considered
in the design. The inductance of a powder core choke behaves differently. Usually inductance as a
function of current decreases continuously which means that with small currents the inductance is
bigger. This is an advantage because ripple with partial loads will be smaller. On the other hand, it
must be verified that the core is not going to saturation too fast, if overload ability is needed. How
big the initial inductance is depends on choke design but typical values range approximately from
20% to 50% over nominal.
0 0.1 0.2 0.3 0.4 0.5 0.6 0.7 0.8 0.9 1
0
0.05
0.1
0.15
0.2
0.25
Ripple current: Choke I
L,pp
(blue) / Output I
Out,pp
(black)
Duty cycle
Page 31

BASIC VARIANTS vacon • 28
24-hour support +358 (0)201 212 575 • Email: service@vacon.com
5
Figure 28. Inductance as function of current (relative values).
The typical tolerance for inductance is ±10%. Also smaller tolerance can be achieved, if needed. In
the DC/DC converter, inductance tolerance does not affect the current balance between legs like in
standard AC applications. Because of tolerance, switching frequency is not totally eliminated from
the output current. This will increase the ripple and can cause some resonance issues with optional
filtering capacitors. Tolerances also increase/decrease individual peak-to-peak ripple currents of
chokes (Figure 29 and Figure 30). Temperature tolerances are not typically a concern with the above
mentioned choke types if all chokes are of the same temperature.
L [H]
I [A]
Powder 1
Powder 2
Laminated iron
L
NOM
L
SAT
I
NOM, RMSINOM, PEAK
L
MAX, PEAK
Page 32

5
vacon • 29 BASIC VARIANTS
Tel. +358 (0) 201 2121 • Fax +358 (0)201 212 285
Figure 29. Example simulation with interleaved control and d = 1/2: leg currents and sum current.
I = 100 A/leg, L = 2050 uH, Udc = 1025V. Leg U has 20% less inductance.
Curve info rms max min peak to peak
I 1 100.4 116.0 83.9 32.1
I 2 100.3 113.0 87.0 26.0
I 3 100.3 113.0 87.0 26.0
I Batteri 300.0 307.6 292.4 15.2
350
I [A]
Time [ms]
I
1
I
3
I
2
I Battery
Currents Interleaved
300
250
200
150
100
50
40 40.10 40.20 40.30 40.40 40.50 40.60 40.70 40.80 40.90 41
Page 33

BASIC VARIANTS vacon • 30
24-hour support +358 (0)201 212 575 • Email: service@vacon.com
5
Figure 30. Example simulation with interleaved control and d = 1/2: leg currents and sum current.
I = 100 A/leg, L = 2050 uH, Udc = 1025V. Leg U has 20% less and leg W 20% more inductance.
Curve info rms max min peak to peak
I 1 100.4 116.0 84.0 32.0
I 2 100.3 113.0 87.0 25.9
I 3 100.2 110.9 89.1 21.8
I Battery 300.0 308.4 291.6 16.9
350
I [A]
Time [ms]
I
1
I
3
I
2
I Battery
Currents Interleaved
300
250
200
150
100
50
40 40.10 40.20 40.30 40.40 40.50 40.60 40.70 40.80 40.90 41
Page 34

5
vacon • 31 BASIC VARIANTS
Tel. +358 (0) 201 2121 • Fax +358 (0)201 212 285
The filter consists of three separate chokes, one for each leg (Figure 31). It is not possible to use a
traditional 3-phase choke because the current is DC (common mode) and the magnetic flux does
not have a natural return path in the core structure. There would be only a very small inductance
generated by stray flux and this kind of situation can lead to a burnt filter. That is why a 3 x 1-phase
structure is necessary. In addition, the stray capacitance should be small. Foil winding with many
overlapping turns is not recommended. One way to minimize the stray capacitance is to use wire
winding in one layer.
Figure 31. Simple filter consist of three separate chokes.
The target is that the filtering could be done with chokes only. That is a simple solution, and one
benefit of not having capacitors is that switching the battery/supercapacitor is possible without any
current spikes. When IGBTs are disabled, the connection requires only that the DC-link is higher or
equal. If the output current ripple requirement is low and the required inductance would lead to an
impractical design, one possibility is to use an optional filtering capacitor (Figure 32). The best case
would be to add one more choke to form an LCL-filter structure (Figure 33). Without interleaving,
an LCL-filter is recommended, otherwise ripple will be big (nine times bigger).
Figure 32. Optional capacitor (C) connected to filter output.
DC+
DC-
Battery
C
DC
L
1
DC+
DC-
Battery
C
DC
L
1
Page 35

BASIC VARIANTS vacon • 32
24-hour support +358 (0)201 212 575 • Email: service@vacon.com
5
Figure 33. LCL-filter structure is best possible solution if output ripple is critical.
The optional capacitor forms an LCL-circuit with the cables and the battery. It is important to know
the cable/battery impedance/inductance in order to evaluate possible resonances and calculate a
safe capacitance value. The impedance of the battery seems to depend on many things so this is not
an easy task. The resonance frequency for the LCL-circuit can be calculated as:
Note that the inductance of the converter side choke is one third because of the parallel connection.
In addition, there can be resonance can happen between L1 and C or L2 and C:
All these resonance frequencies must be well below the switching frequency. In standard inverter
applications, the LCL-circuit resonance frequency is usually one third of the switching frequency.
Because equivalent switching frequency at output is three times bigger, in theory it would be
possible to use higher resonance frequencies. But as explained earlier, the switching frequency is
not totally eliminated at output because of non-idealities in the control and chokes.
Because battery properties are usually not well known, it is recommended to dimension the
optional capacitor as follows:
DC+
DC-
BatteryC
C
DC
L
1
L
2
Page 36

5
vacon • 33 BASIC VARIANTS
Tel. +358 (0) 201 2121 • Fax +358 (0)201 212 285
This will give some idea what could be expected to work, but because the battery properties are not
taken into account in the design, it is not possible to guarantee a safe operation. If the filter does
not operate as expected, the capacitance value can be increased for example by adding another
capacitor in parallel. Without interleaving, the capacitor must be a lot bigger (for example ten times
bigger) if the target is to be in the same level as with the interleaving control and chokes only. Note,
however, that this especially depends a lot on the battery.
With a real LCL-filter structure, dependence of the battery properties is minimized and the design
is more robust against resonances. The requirements for an additional battery side choke are quite
simple because the ripple is very small. The voltage rating of the filter capacitor should be similar
to the DC/DC converter DC-link capacitors.
The proposed rule to dimension an LCL filter is based on a safe resonance frequency. In this case
it is estimated that half of the switching frequency would be small enough with interleaving. In
addition, the battery side choke L2 is determined as 1/6 of L1 which corresponds to the typical
inductance ratio of chokes in standard inverter applications. With these assumptions, the required
capacitance (minimum value) can be calculated as:
Without testing, the interleaving capacitor must be bigger. At least double the size is recommended.
Crucial tests to verify filter applicability are:
1. Thermal tests: The worst case scenario for the filter in a thermal point of view is an
operation point where continuous current is maximum, DC-link voltage as high as
possible and duty cycle d = 1/2. At this point current ripple is the biggest.
2. Current tests: The worst operation point for current (both choke and output) is same as
in the thermal tests. With interleaving, the output performance can be verified also with
other peak and valley points of the duty cycle curve. If a capacitor is used, also the
capacitor current should be measured.
3. Voltage tests: The voltage at the battery terminals should be measured. If the cable to
the battery is long, the voltage at the filter output can also be measured. The voltage
against ground is also interesting.
Page 37

BASIC VARIANTS vacon • 34
24-hour support +358 (0)201 212 575 • Email: service@vacon.com
5
5.2.2 Control Structure
The figure below presents power control when the DC/DC converter is between DC-Link and the
battery.
Figure 34. Power control example
DC to DC can be used on a system where peak power shaving is desired, and grid power sources’
power sharing is done mainly through active power drooping. In such system, the power and grid
frequency behave as shown in the picture below (Figure 35).
Figure 35. Behavior of system power and grid frequency
Grid Converter operation.
• Power control possible when operating parallel with other power sources.
o Reference is base current reference (+/-).
o If the device is operating in island mode, the power reference changes the
frequency.
• Grid frequency variations will affect what will be actual power to the grid.
o Operates like a normal generator.
o Power reference is several times faster than a normal diesel generator.
o Frequency drop in a grid will increase grid converter power output without power refer-
ence.
•Useful in situations here PMS is not fast enough or is unable to control.
•Upper system needs to give charging and discharging limit to the DC/DC converter.
• Upper system needs to give minimum and maximum voltage limits to the DC/DC converter.
o Grid Converter needs also under voltage limit because battery voltage can come directly
to DC-Link trough DC/DC converter, if DC-Link voltage goes below battery voltage.
U2U3
C
DC-Link
DC/DC
Converter
T2
Q1
U1
L
L
L
Filter
Source
DC
Grid
Discharge
Power
Frequency
Generator Motoring
Average
Charge
Page 38

5
vacon • 35 BASIC VARIANTS
Tel. +358 (0) 201 2121 • Fax +358 (0)201 212 285
• Charging can be achieved by upper system control or simply by Value ID Control functions.
Charging will start automatically when the DC/DC converter overvoltage limit is reached
even without charging reference.
• When the grid converter power flow is parallel to the grid, the DC-Link voltage will go down
until it reaches the DC/DC converter undervoltage level, where the voltage remains until the
DC/DC converter discharging current limit is reached.
Figure 36. Charging and discharging
•AFE-operation mode.
o Not practical. Could be possible when DC/DC operated with under voltage control with a
drooping. But DC reference changes makes steep power changes.
• Island-operation mode
o Power control not possible, drive will give to the grid what the grid needs.
o Cannot operate parallel with other power sources.
o Makes a grid but cannot synchronize to an existing one.
DC OV Level
uG OV Level
uG UV Level
DC UV Level
Discharging
Controlled charg i ng poss ib le
Current limit charging
Page 39

PRODUCT CONFIGURATION EXAMPLES vacon • 36
24-hour support +358 (0)201 212 575 • Email: service@vacon.com
6
6. PRODUCT CONFIGURATION EXAMPLES
6.1 Scope of delivery
VACON delivers energy storage related power conversion equipment. The DC/DC converter
includes power conversion hardware and power conversion control related software.
VACON does not deliver energy management systems, power management systems, or battery
management systems.
Figure 37. Vacon offering considering system level.
6.1.1 Direct to DC
The scope of delivery of VACON includes the typical VACON offering from power modules to system
drive or other suitable switchgear.
The simplest delivery includes power modules, LCL filters, NXP controls with an application and a
license. All the rest is handled by the system integrator.
NOTE! The selection of available power modules can be seen in a separate chart.
Energy Management System (EMS)
Power Management System (PMS)
Battery Management
System
Battery
Storage System
nergy Management System (EMS
)
ower Management System (PMS
)
attery Managemen
t
System
Batter
y
Storage Syste
m
Power Conversion System
Power Conversion
Hardware
Power Conversion Control
(PCC)
Page 40

6
vacon • 37 PRODUCT CONFIGURATION EXAMPLES
Tel. +358 (0) 201 2121 • Fax +358 (0)201 212 285
The line measurement board D7 is instructed to be included in the delivery.
Figure 38. Scope of delivery
In tailored customer projects, the scope of delivery may be a switchgear including power modules,
LCLs, NXP controls with an application and a license, but also breakers, fuses, DC pre-charging
components and other possible control circuit.
Figure 39. Scope of delivery
6.1.2 DC to DC
The scope of delivery of VACON includes the typical VACON offering from power modules to system
drive or other suitable switchgear.
The simplest delivery includes power modules, NXP controls with an application and a license.
Deliveries of single phase chokes are not preferred to be handled by VACON as the dimensioning
varies case by case. Still, delivery of chokes is negotiable. All the rest is handled by the system
integrator.
NOTE! The selection of available power modules can be seen in a separate chart.
-L1
-L2.1
-L2.2
-L2.3
-C1
-C2
HF
-C3
U2 U1
V2
W2
V1
W1
-R1
-C1.1-C1.2 -C4.1-C4.2
-C5.2
-R4
-R2
-C2.1-C2.2 -C5.1
-R5
-C6.2
-R3
-C3.1-C3.2 -C6.1
-R6
NXP/NXI HW
Customer/
Danfoss
Danfoss
Application
SW License
LCL or
Sine Filter
no HF
Page 41

PRODUCT CONFIGURATION EXAMPLES vacon • 38
24-hour support +358 (0)201 212 575 • Email: service@vacon.com
6
Figure 40. Scope of delivery
In tailored customer projects, the scope of delivery may be a switchgear including power modules,
chokes, NXP controls with an application and a license but also breakers, fuses, DC pre-charging
components and other possible control circuit.
Figure 41. Scope of delivery
NXP/NXI HW
Customer/
Danfoss
Danfoss
Filter
Application
SW License
Single Phase Choke
Page 42

6
vacon • 39 PRODUCT CONFIGURATION EXAMPLES
Tel. +358 (0) 201 2121 • Fax +358 (0)201 212 285
6.2 Example configurations
6.2.1 DC/DC for supply interruptions
The DC/DC converter can be used to prevent grid voltage drops to interrupt essential drives to stop
for undervoltage. The DC/DC converter is connected to the AC drive's DC-terminals and used to feed
power during the grid voltage drops. Essential motors can run and ride through the voltage drops
without interruption.
Figure 42. Failure ride through with undervoltage control
The DC/DC converter can be used to support the grid by equalizing the power peaks and producing
the power if the main grid voltage drops. The DC/DC converter is connected to the grid converter
and power can run in both directions by charging and discharging the batteries.
Figure 43. Peak shaving of AC-grid
SUPPLY
3
L
L
-L2
-F2
-F1
-L1
-U1
NXP
-M1
-U2
DC/DC
-B1
SUPPLY
LCL
L
-L2
-F2
M
-F1
Q0
-L1
-U1
NXA
-U2
DC/DC
-B1
Page 43

PRODUCT CONFIGURATION EXAMPLES vacon • 40
24-hour support +358 (0)201 212 575 • Email: service@vacon.com
6
6.2.2 Direct DC for Grid Support
In case the battery voltage window is favorable, the batteries can be connected directly into the DC.
The same usage case of power balancing of the grid also applies here. In below an example of case
where connection to the grid transformer is 440Vac and the battery voltage window is set to be 7501100Vdc.
Figure 44. Peak shaving of higher power and high energy AC grid
INCOMING 3PH, AC SUPPLY INCOMING 3PH, AC SUPPLY
3
2
2
3
QA1
2000A, 3P, LSI, 65kA
MAIN
BREAKER
-FC1.1-FC1.3
-RF4
1030A
LCL FILTER
-TB1
NXA10306
AFE UNIT
-FC2
OEVA
SWITCH
-TB1
NXA10306
AFE UNIT
-RF4
1030A
LCL FILTER
-FC1.1-FC1.3 -FC1.1-FC1.3 -FC1.1-FC1.3
QA1
2000A, 3P, LSI, 65kA
MAIN
BREAKER
3
33
3
33
I>
I>
I>>I>>
3
I>
I>
I>>I>>
3
33
-RF4
1030A
LCL FILTER
-TB1
NXA10306
AFE UNIT
-TB1
NXA10306
AFE UNIT
-RF4
1030A
LCL FILTER
3
3
2
2
-FC2
OEVA
SWITCH
OUTGOING DC SUPPLY
2
2
-FC2
OEVA
SWITCH
2
2
-FC2
OEVA
SWITCH
Page 44

7
vacon • 41 SIZING OF THE SYSTEM AND PRODUCT
Tel. +358 (0) 201 2121 • Fax +358 (0)201 212 285
7. SIZING OF THE SYSTEM AND PRODUCT
The basic principles that have an effect on the power unit selection are described in this chapter.
7.1 Direct to DC
The energy storage voltage window sets up the guideline for the voltage class selection. The
maximum voltage sets the requirement for using either 500 V class or 690 V class units. The value
of DC High Ready (Stop) should be taken into account when choosing the appropriate unit with
adequate maximum voltage. If the storage maximum voltage stays below 800 Vdc, it is possible to
use 500 V class units. If it goes above 800 Vdc but stays below 1100 Vdc, the 690 V unit is applicable.
NX8 voltage class liquid cooled units can be used up to 1200 Vdc link voltage.
The minimum voltage of the energy storage is crucial in current dimensioning of the unit size. An
easy rule of thumb is that output voltage of grid converter is
The gain 1.56 is not accurate and depending for example on voltage drop in filters and grid state.
Theoretically the gain can vary from 1.41 to 1.89. However 1.56 is a good starting point.
Now if the customer has indicated the needed power P, the corresponding current I
ac
for calculated
voltage U
ac
can be calculated with:
The selection is made by choosing an appropriate current size from the VACON products with the
above defined voltage class based on the maximum storage voltage level. The output voltage is
needed for the transformer dimensioning.
230 V Unit 500 V Unit 690 V Unit Vac/Vdc
Supply voltage max 240 500 690 Vac
Supply voltage min 208 380 525 Vac
Over voltage instantly 437 911 1200 Vdc
Over voltage U2t trip - - 1100 Vdc
DC High Ready (Stop) 382 797 1099 Vdc
Normal Max 324 675 931 Vdc
Normal Min 280 513 708 Vdc
DC Low Run (Def.Estim.) 242 475 656 Vdc
DC Low Ready (Stop) 239 436 602 Vdc
DC Low Running Min 225 410 567 Vdc
Under voltage instantly 183 333 461 Vdc
Page 45

SIZING OF THE SYSTEM AND PRODUCT vacon • 42
24-hour support +358 (0)201 212 575 • Email: service@vacon.com
7
7. 2 DC /D C
The current capability of the DC/DC converter is limited by two constraints. The first constraint is
the current rating defined in the rating plate of the power converter that defines the operating area
in which the CE and UL certification is valid.
Figure 45. Vacon power converter ratings plate and their corresponding values in DC/DC converter
circuit diagram.
The second constraint is the thermal limits of the power converter. There are two parts which are
thermally stressed in the DC/DC application:
• The DC link busbars DC+ and DC- which are dimensioned according to I 1 of the DC/DC
converter.
• The IGBT switches in the DC/DC converter due to high switching frequency.
There is a software current limiter in the DC/DC converter to ensure these constraints are not
violated. The combined effect of the constraints thus becomes dependent on the voltage levels on
the storage side and the converter DC-link according to the figure below. Formulas in the graph
show how to calculate the output current I
3
based on the current I1 which is denoted as I
NOM
in the
ratings tables of the DC/DC converter.
DC+
DC-
I1
I1
I4
I2
I3
Battery
C
DC
L
1
Page 46

7
vacon • 43 SIZING OF THE SYSTEM AND PRODUCT
Tel. +358 (0) 201 2121 • Fax +358 (0)201 212 285
Figure 46. Current capability of a DC/DC converter
NOTE! I
NOM
= I1~1.2*I
2
An example curve in above shows the combined current limit line for the DC/DC converter
depending on the ratio of storage voltage and converter DC-link voltage. The nominal current of a
DC/DC converter is defined as I 1 in the DC/DC converter rating plate which is approximately
1.2*I 2 depending on the frame size. The value of I
MAX
and I
1min
vary depending on voltage class and
switching frequency of the DC/DC converter. These values are higher when the switching frequency
is decreased to 4 kHz and higher also for the NX5 voltage class units. In addition, the 1min limit
applies only to frame sizes FI9-FI14.
NOTE! The nominal current of the DC/DC converter is not the same as the inverter current rating.
You may roughly calculate the DC/DC converter current rating by multiplying the inverter current
rating by 1.2. To have an overview, see the following table where the DC/DC converter current
ratings for NX6 are given.
1
1.1
1.2
1.3
1.4
1.5
1.6
1.7
1.8
1.9
0 0.1 0.2 0.3 0.4 0.5 0.6 0.7 0.8 0.9 1
Iout
Iout 1min
U
BATTERY/UDC
I
OUT
/ I
NOM
Page 47

SIZING OF THE SYSTEM AND PRODUCT vacon • 44
24-hour support +358 (0)201 212 575 • Email: service@vacon.com
7
Table 5. DC/DC converter current ratings for NX6
Air cooled NX6 drives
1025 VDC link voltage 1100 VDC 1025 VDC 931 VDC
I
nom
I
1min
I
max
I
max
I
max
Unit type Frame
IDC nomi-
nal (A)
PDC nom
(KW)
I
1min
5kHz (A)
I
1min
3.6kHz (A)
I
out
5kHz (A)
I
out
3.6kHz (A)
I
out
5kHz (A)
I
out
3.6kHz (A)
I
out
5kHz (A)
I
out
3.6kHz (A)
NXI00106A0TOCSSA FI6/IP21 11.1 11 14.6 18.3 14.6 18.3 14.6 18.3
NXI00136A0TOCSSA FI6/IP21 14.6 15 19 23.7 19 23.7 19 23.7
NXI00186A0TOCSSA FI6/IP21 20.3 21 26.3 32.9 26.3 32.9 26.3 32.9
NXI00226A0TOCSSA FI6/IP21 25 25 32 40 32 40 32 40
NXI00276A0TOCSSA FI6/IP21 31 32 39 49 39 49 39 49
NXI00346A0TOCSSA FI6/IP21 39 40 49 60 49 60 49 60
NXI00416A0TOCSSA FI7/IP21 47 48 60 73 60 73 60 73
NXI00526A0TOCSSA FI7/IP21 60 61 56 75 61 80 69 91
NXI00626A0TOCSSA FI8/IP100 71 73 90 108 90 108 90 108
NXI00806A0TOCSSA FI8/IP100 92 95 91 143 117 143 117 143
NXI01006A0TOCSSA FI8/IP100 117 119 122 167 133 180 146 180
NXI01256AOTOISF FI9/IP100 146 149 188 250 183 228 183 228 183 228
NXI01446AOTOISF FI9/IP100 168 172 216 288 210 263 210 263 210 263
NXI01706AOTOISF FI9/IP100 198 203 255 340 231 309 248 311 248 311
NXI02086AOTOISF FI9/IP100 245 251 312 416 231 309 248 325 264 345
NXI02616AOTOISF FI10/IP100 308 315 392 522 382 477 382 477 382 477
NXI03256AOTOISF FI10/IP100 383 393 488 650 450 594 475 594 475 594
NXI03856AOTOISF FI10/IP100 454 465 578 770 450 600 490 640 530 680
NXI04166AOTOISF FI10/IP100 490 503 624 832 450 600 490 640 530 680
NXI04606AOTOISF FI12/IP100 548 562 690 920 673 841 673 841 673 841
NXI05026AOTOISF FI12/IP100 598 613 753 1004 734 918 734 918 734 918
NXI05906AOTOISF FI12/IP100 703 721 885 1180 863 1079 863 1079 863 1079
NXI06506AOTOISF FI12/IP100 775 794 975 1300 870 1150 951 1189 1030 1189
NXI07506AOTOISF FI12/IP100 894 916 1125 1500 870 1150 977 1200 1030 1300
NXI08206AOTOISF FI12/IP100 977 1002 1230 1640 870 1150 977 1200 1030 1300
Page 48

7
vacon • 45 SIZING OF THE SYSTEM AND PRODUCT
Tel. +358 (0) 201 2121 • Fax +358 (0)201 212 285
Air cooled NX6 drives
1025 VDC link voltage 1100 VDC 1025 VDC 931 VDC
I
nom
I
1min
I
max
I
max
I
max
Unit type Frame
IDC nomi-
nal (A)
PDC nom
(KW)
I
1min
5kHz (A)
I
1min
3.6kHz (A)
I
out
5kHz (A)
I
out
3.6kHz (A)
I
out
5kHz (A)
I
out
3.6kHz (A)
I
out
5kHz (A)
I
out
3.6kHz (A)
NXI09206AOTOISF FI13/IP100 1102 1130 1380 1840 1275 1683 1346 1683 1346 1683
NXI10306AOTOISF FI13/IP100 1234 1265 1545 2060 1275 1645 1414 1780 1448 1884
NXI11806AOTOISF FI13/IP100 1414 1449 1770 2360 1275 1645 1414 1780 1448 1884
NXI15006AOTOISF FI14/IP100 1797 1842 2250 3000 2196 2745 2196 2745 2196 2745
NXI19006AOTOISF FI14/IP100 2276 2333 2850 3800 2568 3477 2696 3477 2781 3477
NXI22506AOTOISF FI14/IP100 2696 2763 3375 4500 2568 3290 2696 3474 2896 3733
Page 49

SIZING OF THE SYSTEM AND PRODUCT vacon • 46
24-hour support +358 (0)201 212 575 • Email: service@vacon.com
7
A dedicated tool is available to help in the selection of a correct power unit based on either power
or current profile. Examples of dimensioning based on storage power and current profiles are
displayed in figures below.
The intermediate steps between I
NOM
and I
MAX
can be calculated with the formulas given in the
previous figure. The shape of the output current curve is due to the limitation of the I
1
in the rating
plate and the relation between input and output current of the DC/DC converter. The plateau part
of the curve is due to thermal performance of the DC/DC converter. Current capability of the DC/DC
converter may seem complicated but it simply yields a constant power capability up to the point I
MAX
where current cannot be increased anymore. The relation between current and power can be
examined in the following graphs. Constant power is available as long as the voltage is sufficiently
high.
Figure 47. Power unit selection tool example based on storage current profile
Figure 48. Power unit selection tool example based on storage current profile
Based on the cases in figures above it is advantageous to limit the power at low battery voltage to
limit the current to a reasonable value. This helps to allow the use of a smaller frame size. Filter
size is also proportional to current. Therefore, high energy storage voltage is preferred from the
DC/DC converter sizing perspective.
Select: Define Storage Power
Storage
g
voltage
g
range
Storage
g
Power
Profile
Storage
g
Current
Profile
[Vdc] [kW] [Adc]
max voltage
700 350 500
g
nom voltage
375 300 800
g
min voltage
150 81 540
DC-link voltage
750 Vdc Class_5
g
DC-link power
343.0 kW
DC-link current
457 Adc dc-link
Storage output current
800 Adc storage
e
r
Energy storage system parameters
7
dcCas
s
_
4
DC/DC Converter design parameters
e
0
0
50
5
0
300
350
350
400
0
0
450
100 200 300 400 500 600 700 800 900
Power [kW]
Voltage [Vdc]
Storage Power Profile
Storage Profile
NXI04605A0T0ISFA1A20000
00
NXI03855A0T0ISFA1A20000
00
00800
smaller device @3.6kHz
0
0
100
0
0
200
0
0
700
0
0
800
800
900
900
1000
100 200 300 400 500 600 700 800 900
Voltage [Vdc]
Storage Current Profile
Storage profile
NXI04605A0T0ISFA1A200000
0
NXI03855A0T0ISFA1A200000
0
7
00800
smaller device @3.6kHz
Power [kW]
Select: Define Storage Current
Storage
voltage
g
range
Storage
Current
Profile
Storage
Power
Profile
[Vdc] [Adc] [kW]
max voltage
700 335 235
g
nom voltage
375 400 150
min voltage
150 400 60
DC-link voltage
750 Vdc Class_5
DC-link power
229.8 kW
DC-link current
306 Adc dc-link
Storage output current
400 Adc storage
Energy storage system parameters
V
_
DC/DC Converter design parameters
0
50
200
250
300
100 200 300 400 500 600 700 800 900
Voltage [Vdc]
Storage Power Profile
Storage Profile
NXI03005A0T0ISFA1A20000
00
NXI02615A0T0ISFA1A20000
00
00800
smaller device @3.6kHz
0
100
200
300
400
500
600
100 200 300 400 500 600 700 800 900
2
0
Voltage [Vdc]
Storage Current Profile
Storage profile
NXI03005A0T0ISFA1A200000
0
NXI02615A0T0ISFA1A200000
0
7
00800
smaller device @3.6kHz
Power [kW]
Power [kW]
Page 50

8
vacon • 47 INFORMATION TO ACQUIRE FROM CUSTOMERS
Tel. +358 (0) 201 2121 • Fax +358 (0)201 212 285
8. INFORMATION TO ACQUIRE FROM CUSTOMERS
It is important to find enablers and limiting factors of the customer system. The following list is, in
priority order, the information to be acquired from customer system to continue the discussion of
the offering.
1. Single line diagram
2. Short description of usage case / mission profile / wanted behavior
3. Battery (storage) information
•Voltage window [U
Bat,min
, U
Bat,nom
, U
Bat,max
]
• Power or current requirement at those voltage points [U
Bat,min
, U
Bat,nom
, U
Bat,max
]
• Balance/Maintenance charger?
4. Grid information
• Grid code demands?
5. Preferred topology if any (and why)
6. System control overview
Page 51

Document ID:
DPD01887A
Rev. A
Vacon Ltd
Member of the Danfoss Group
Runsorintie 7
65380 Vaasa
Finland
www.danfoss.com
 Loading...