

Universal Enterprise ADL7103 Installation Manual

ADL 7103
Automotive
Scope / GMM / OBD II Code Reader
Copyright © 2005 UEi
T
o receive a FREE catalog of
our complete line of diagnostic equipment,
call our UEi sales of
1-800-547-5740
Find more test instrument
information on the
internet at
or
email info@ueitest.com.
www.ueitest.com
fice at
ADL7103-MAN 1/05
User’
s Man
ual

Menu Overview
DANGER
When measuring signals greater than
150V Peak on inputs CH A and/or CH
B, make certain that both the OBD II
and USB cab les are not connected to
the instrument. Activating inputs CH
A and/or CH B with the USB or OBD II
t o gether on high vo l t age could result
in instrument damage, serious injury
or death.
CAUTION
W hen ha nding any ex t r e m e ly high
vo l t age si gna ls , e. g. the s ig na ls
g e ne ra t e d f r om t he s pa rk p lug s,
NEVER PUT ANY TEST LEADS (Either
the Red or Ye l l ow test leads Or the
S e c o n d a ry i gni tion pr obe l ead Or
Power Cable from Cigarett e Lighte r)
CONNECTED TO THE SCOPE IN THE
AR EAS NEA R THOSE STRO N G
SI GN AL S . I f so , the sco pe c an be
damaged or worked improperly.
MAIN MENU
COMPONENT TESTS
SCOPE
GRAPHING MULTIMETER
OBD II CODE READER
VEHICLE DATA
INSTRUMENT SETUP
GRAPHING MULTIMETER MENU
VOLT DC, AC
OHM/DIODE/CONTINUITY
RPM
FREQUENCY
DUTY CYCLE
PULSE WIDTH
DWELL
IGNITION PEAK VOLTS
IGNITION BURN VOLTS
IGNITION BURN TIME
INJECTOR PEAK VOLTS
INJECTOR ON TIME
AMP DC, AC
TEMPERATURE C F
LIVE
INSTRUMENT SETUP MENU
FILTER MENU
INPUT A : OFF
INPUT B : OFF
LANGUAGE MENU
LANGUAGE : ENGLISH
DISPLAY OPTIONS
FILTER
AUTO POWER OFF
LANGUAGE
VERSION INFORMATION
SCOPE CALIBRATION
COMPONENT TESTS MENU
SENSORS
ACTUATORS
ELECTRICAL
IGNITION
(or DIESEL)
VEHICLE DATA MENU
CYLINDERS
CYCLES : 4
BATTERY : 12 V
IGNITION : CONV
IGNITION MENU
CONV (default)
DIS
DIESEL
DISPLAY OPTIONS MENU
AUTO POWER OFF MENU
AUTO POWER OFF : ON
AUTO POWER OFF TIME : 30 min
: 4
USER LAST SETUP : OFF
CONTRAST : 4
GRATICULE : ON
HORIZ TRIG POS : 10 %
ACQUIRE MODE : PEAK DETECT
SENSOR TESTS MENU
ABS Sensor (Mag)
O2S Sensor (Zirc)
Dual O2Sensor
ECT Sensor
Fuel Temp Sensor
IAT Sensor
Knock Sensor
TPS Sensor
CKP Magnetic
CKP Hall
CKP Optical
CMP Magnetic
CMP Hall
CMP Optical
VSS Magnetic
VSS Optical
MAP Analog
MAP Digital
MAF Analog
MAF Digi Slow
MAF Digi Fast
MAF Karman-Vrtx
EGR (DPFE)
ACTUATOR TESTS MENU
Injector PFI/MFI
Injector TBI
Injector PNP
Injector Bosch
Mixture Cntl Sol
EGR Cntl Sol
IAC Motor
IAC Solenoid
Trans Shift Sol
Turbo Boost Sol
Diesel Glow Plug
ELECTRICAL TESTS MENU
Power Circuit
V Ref Circuit
Ground Circuit
Alternator Output
Alternator Field VR
Alternator Diode
Audio System
DC Switch Circuits
DIESEL MENU
DIESEL INJECTOR
ADVANCE
IGNITION TESTS MENU
PIP/ SPOUT
DI Primary
DI Secondary
DIS Primary
DIS Secondary
Contents
Menu Overview
1. Introduction
1.1 Comparing Scan Tools, DSO’s and DMM’s 1- 1
1.2 Vehicle Service Manuals 1- 2
2. Safety Information
3. Automotive Electronic Signals
3.1 Primary Signal Types Found in Modern Vehicles 3- 1
3.2 Critical Characteristics of Automotive Electronic Signals 3- 2
3.3 The Golden Rule of Electronic System Diagnosis 3- 2
3.4 Signal Probing with an Oscilloscope 3- 2
4. Getting Started
4.1 Product Description 4- 1
4.2 Quick Tour 4- 2
4.3 Front Panel Controls 4- 6
4.4 Measurement Connections 4- 7
4.5 Grounding Guidelines 4- 8
4.6 Display 4- 9
4.7 SCOPE Mode 4-15
4.8 GMM (GRAPHING MULTIMETER) Mode 4-16
4.9 OBD II Code Reader Mode 4-17
5. Instrument Operation
5.1 Instrument Test Modes 5- 1
5.2
SCOPE Displays
5.3 GMM Displays 5- 7
5.4 Dual Input Scope Operation 5-13
5.5 Changing the Vehicle Data and Instrument Setup 5-13
5.6 Freezing, Saving, and Recalling Screens 5-17
5.7 Glitch Snare Operation 5-18
5.8 Tips for Noise Management 5-19
5.9 OBD II Code Reader Mode 5-20
Appendix: About OBD II System
6. Automotive Diagnostics & Applications
6.1 Component Tests 6- 1
6.2 Sensor Tests 6- 1
6.3 Actuator Tests 6-32
6.4 Electrical Tests 6-48
6.5 Ignition Tests 6-57
6.6 Diesel Tests 6-68
7. Maintenance
8. Specifications
Glossary
Menu Overview
5- 1
5-24
1. INTRODUCTION
Vehicle manufacturers have helped you locate drivability problems by designing Electronic Control Units with trouble
code generating capabilities. ECU ’s aren’t perfect and occasionally don ’t detect every event (most transients and
intermittent events). On-board diagnostic systems are engineered with fairly wide set limits for sensors, actuators,
connectors and terminals. When a component exceeds its limit consistently a trouble code is generated. To keep
warranty costs in line tolerances are not set to catch all transients even though they can cause some of your worst
drivability problems.
Therefore repair technicians are finding more and more uses for a Digital Storage Oscilloscope (DSO) and Digital
Multi Meters (DMM). A DSO can capture a live “signature” of a circuit and store it for later analysis or comparison
against known-good waveforms – an invaluable resource for detecting marginal components. A GMM (Graphing
Multi Meter) give s you advanced multimeter capabilities coupled with the visual power of tren d g raphin g a nd
waveform display.
This meter – a combination DSO, GMM and OBD II code reader – represent the most powerful and versatile tool
available for troubleshooting automotive electronics since we can track down elusive no-code drivability problems as
well as diagnose OBD II sensors and components.
1.1 COMPARING SCAN TOOLS, DSO’s AND DMM’s
All of these tools have unique capabilities, and today ’s vehicles demand that automotive technicians are able to use
all three tools to correctly diagnose various drivability problems. DSO ’s alone cannot replace DMM ’s or scan tools,
yet DMM’s and scan tools cannot replace DSO’s.
For example, when anti-lock brakes on a car are sometimes erratic, you might first perform a road test to verify that
the ABS light does not come on. When you get back to the shop, you plug in your scan tool and find no trouble
codes.
Because you still have your DMM, you follow the manufacturer ’s instructions and look at the output voltage from
each whe el speed sensor. They all appear to b e in tole rance, a nd the manuf acture fault tree recommends you
replace the ABS computer. Unfortunately, the ABS computer on the vehicle in embedded in the master cylinder, so
you must replace everything. The worst thing is the problem still exists even after you complete all of the work.
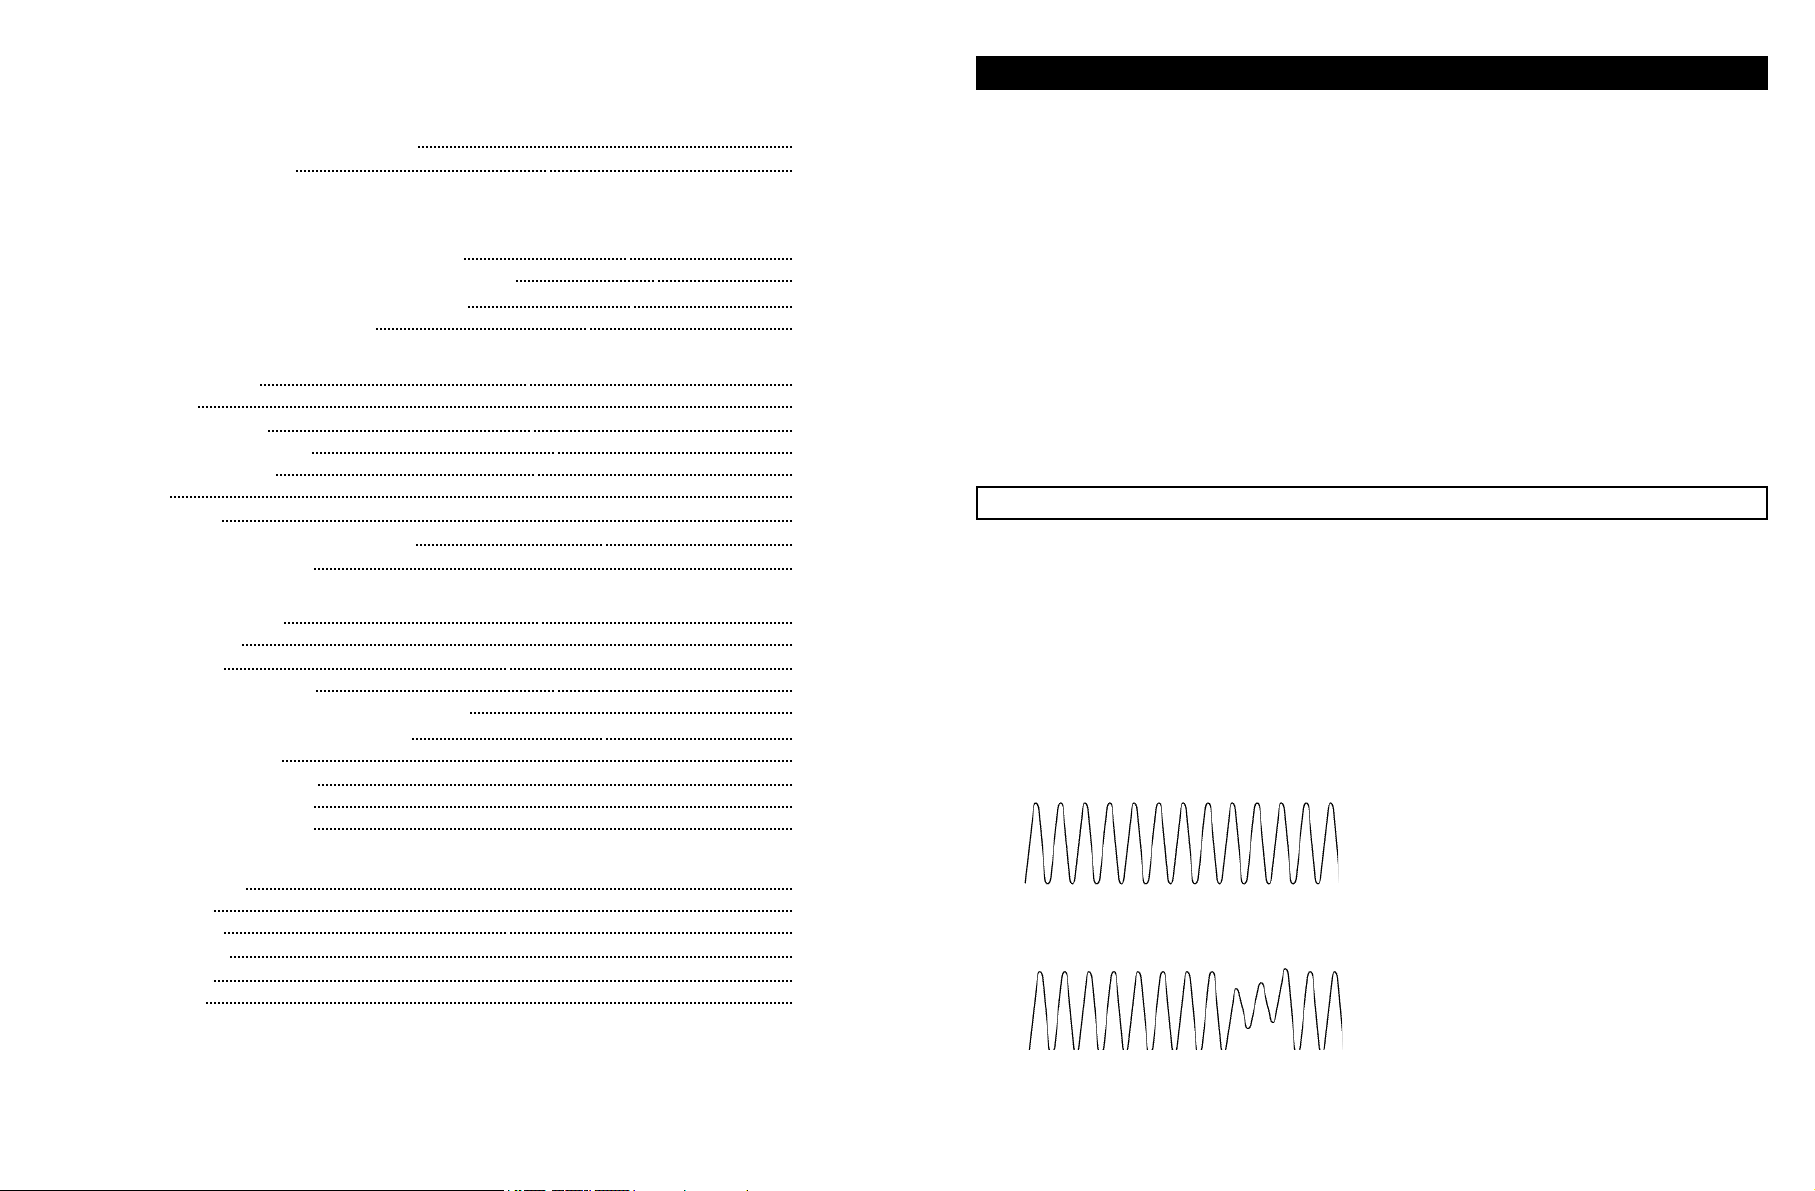
Normal ABS Signal
Most of the signal shown above is visible to scan tools, DSO’s and DMM’s.
Faulty ABS Signal
However, the faults shown above are not visible to scan tools and DMM’s. They are only visible to DSO’s.
1-1
If you had a DSO, you could look at the output signal from each of the wheel speed sensors. From this you would
have discovered that the left rear wheel speed sensor had some very fast aberrations that caused the ABS computer
t
o act strange. You replace the left r ear wheel speed sensor and cure the problem. The scan tool missed this
problem becau se no trouble co des w ere set, and the co mpu ter comm unication bus w as to o slow to pick up the
spike s. Th e DMM misse d this problem because it avera ge d the sensor sig nals an d could not see the fast
aberrations.
Scan tools and DMM ’s sample very slow when compared to a DSO. DSO ’s are typically more that a few hundred
thousand times faster than scan tools and more than 1,000 times faster than DMM’s.
There are many examples of vehicle signals that DMM ’s and scan tools are unable to see. There are many vehicle
problems that can occur that require a DSO, or combination of a DSO, DMM and OBD II code reader to diagnose
accurately.
1.2 VEHICLE SERVICE MANUALS
Th is in st rument tells how to hook up it to th e selecte d vehicle components to be tested. However, it is stron gly
recommended that you con sult the manufacturer’s service manual for your vehicle before a ny t est or repair
procedures are performed in order to get the color of the wire or the PCM’s pin number from a wiring diagram.
Fo r availability of these service man uals, co nta ct your local ca r dealership, auto parts store, o r bookst ore, The
following companies publish valuable repair manuals:
Mitchell International
14145 Danielson Street
Poway, CA 92064
Tel : 888-724-6742
Haynes Publications
861 Lawrence Drive
Newbury Park, CA 91320
Tel : 1-800-442-9637
Motor Publications
5600 Crooks Road, Suite 200
Troy, MI 48098
Tel : 1-800-426-6867
Helm Inc.
14310 Hamilton Avenue
Highland Park, MI 48203
Tel : 1-800-782-4356
1-2
2. SAFETY INFORMATION
WARNING
READ “SAFETY INFORMATION” BEFORE USING THIS MANUAL.
This instrument is designed to be used by properly trained, skilled professional automotive technicians.
It is assumed that the user has a thorough understanding of vehicle systems before using this instrument.
To use this instrument safely, it is essential that operating and servicing personnel follow both generally accepted
safety procedures and the safety precautions specified in this manual.
A DANGER identifies an imminently hazardous situation which, if not avoided, will result in death or serious injury to
the user or the bystanders.
A WARNING identifies conditions and actions that pose hazard(s) to the user or the bystanders.
A CAUTION identifies conditions and actions that may damage the instrument or the vehicle.
Th e term “Isolated (or Electrically flo ating)” is u sed in this manual to indica te a measurement in which the COM
terminal of this instrument is connected to a voltage different from earth ground. The term “Grounded” is used when
the COM terminal is connected to an earth ground potential. The COM terminal of this instrument is rated up to 300
V rms above earth ground for the safety of isolated measurements.
Using Your Instrument Safely
Follow safe servicing practices as described in your vehicle service manual. To use this instrument safely, follow the
safety guidelines below :
DANGER
Use this instrument only in WELL VENTILATED service areas that provide at least four changes of air per hour.
Engines produce carbon monoxide, an odorless, colorless and poisonous gas that causes lower reaction time and
can result in death or serious injury. Route the engine exhaust outside with an approved extraction system while
performing tests with the engine running.
Set the parking brake and block the wheels, especially the wheels on front-wheel drive vehicles, before testing or
repairing the vehicle because the parking brake does not hold the drive wheels.
Be sure there is adequate clearance between any moving components when testing. Moving components and
belts ca n CATCH lo ose clothing , parts of your body or the instrument and cause serious damage or personal
injury.
Always wear approved sa fety eye protection when t esting or repairing ve hicles. Objects can be propelle d by
whirling engine components can cause serious injury.
When handling any signals higher than 150 V peak, don’t electrically activate BOTH CH A and/or CH B terminal(s)
AND USB and/or OBD II terminal(s) together at a time. If they are electrically activated simultaneously, a death or
a serious personal injury could be resulted in.
2-1

Avoid Fires:
Do not position head directly over carburetor or throttle body. Do not pour gasoline down carburetor or throttle
body when cranking or running engine. Engine backfire can occur when air cleaner is out of normal position.
Do not use fuel injector cleaning solvents or carburetor sprays when performing diagnostic testing.
The instrument has internal arcing or sparking parts. Do not expose the instrument to flammable vapors.
Do not smoke, strike a match, place metal tools on battery, or cause a spark in the vicinity of the battery. Battery
gases can ignite.
Keep a fire extinguisher rated for gasoline, chemical, and electrical fires in work area. Fires can lead to serious
injury or death.
WARNING
Avoid Electrical Shock:
Make sure that the vehicle to be tested is at a safe potential before making any measurement connections.
Connect the COM input of the instrument to vehicle ground before clamping the standard SECONDARY PICKUP
(supplied) on the ignition wires. This ground connection is required IN ADDITION TO the normal measurement
ground connections.
Do not touch ignition coils, coil terminals, and spark plugs while operating. They emit high voltages.
Do not puncture an ignition wire to connect the instrument, unless specifically instructed by vehicle manufacturer.
Be sure the ignition is in the OFF position, headlights and other accessories are off, and doors are closed before
disconnecting the battery cables. This also prevents damage to on-board computer systems.
Disconnect the live test lead before disconnecting the common test lead.
Do not perform internal service or adjustment of this instrument unless you are qualified to do so.
Avoid Burns:
Do not touch hot exhaust systems, manifolds, engines, radiators, sample probe, etc.
Do not remove radiator cap unless engine is cold. Pressurized engine coolant may be hot.
Wear gloves when handling hot engine components.
Use a suitable battery carrier when transporting batteries.
CAUTION
Disconnect circuit p ower and discharge all high voltage capacitors before connecting the inst rum ent to make
resistance, continuity, or diodes measurements.
Do n ot rely on questionable, erratic, or obviously erroneo us te st inf ormations or result s. Make su re that all
connections and data entry information are correct and that the test procedure was taken correctly. Do not use
suspicious test information or results for diagnostics.
IF the ground of the instrument is connected to a voltage higher than 42 V peak (30 V rms);
Use only the standard test leads set supplied with the instrument.
Do not use conventional exposed metal BNC or BANANA PLUG connectors.
Use only one ground connection to the instrument (GROUND LEAD of the CH A’s shielded test lead).
Remove all probes and test leads that are not in use.
Connect the power adapter to the AC outlet before connecting it to the instrument.
Follow the general safety guidelines below;
Avoid working alone.
Inspect the test leads for damaged insulation or exposed metal. Che ck test lead continuity. Replace damaged
leads before use.
Do not use the instrument if it looks damaged.
Select the proper function and range for your measurement.
When using the probes, keep your fingers away from probe contacts.
Keep your fingers behind the finger guards on the probes.
2-2
2-3
3. AUTOMOTIVE ELECTRONIC SIGNALS
3.1 PRIMARY SIGNAL TYPES FOUND IN MODERN VEHICLES
Once you become familiar with basic vehicle waveforms it will not matter how new or old the vehicle is, or even who
manufactured the vehicle. You will be able to recognize signals that do not look right.
Direct Current (DC) Signals
The types of sensors or devices in a vehicle that produce DC signals are:
Power Supplies - Battery voltage or sensor reference voltages created by the PCM.
Analog senso r signals - engine coolant tempe rat ure, fuel temperature, intake air temp erature, throt tle position,
EGR pressure and valve position, oxygen, vane and hot wire mass airflow sensors, vacuum and throttle switches
and GM, Chrysler and Asian manifold absolute pressure (MAP) sensors.
Alternating Current (AC) Signals
The types of sensors or devices in a vehicle that produce AC signals are:
Vehicle speed sensors (VSS)
Antilock brake system wheel speed sensors (ABS wheel speed sensors)
Magnetic camshaft (CMP) and crankshaft (CKP) position sensors
Engine vacuum balance viewed from an analog MAP sensor signal
Knock sensors (KS)
Frequency Modulated Signals
The types of sensors or devices in a vehicle that produce Frequency Modulated signals are:
Digital mass airflow (MAF) sensors
Ford’s digital MAP sensors
Optical vehicle speed sensors (VSS)
Hall Effect vehicle speed sensors (VSS)
Optical camshaft (CMP) and crankshaft (CKP) position sensors
Hall Effect camshaft (CMP) and crankshaft (CKP) position sensors
Pulse Width Modulated Signals
The types of circuits of devices in a vehicle that produce Pulse Width Modulated signals are:
Ignition coil primary
Electronic spark timing circuits
EGR, purge, turbo boost, and other control solenoids
Fuel injectors
Idle air control motors and solenoids
Serial Data (Multiplexed) Signals
The types of circuits or devices in a vehicle that produce Serial Data signals are:
Powertrain control modules (PCM)
Body control modules (BCM)
ABS control modules
Other control modules with self diagnostics or other serial data / communications capability
3-1

3.2 CRITICAL CHARACTERISTICS OF AUTOMOTIVE ELECTRONIC SIGNALS
O
nly 5 critical chara cteristics (or information types) given from the Automotive electronic signals a re important
because the vehicle’s PCM considers them important.
Amplitude - The voltage of the electronic signal at a certain point in time.
Frequency - The time between events, or cycles, of th e electronic sign al, usually given in cycles per second
(Hertz).
Shape - The signature of the electronic signal, with its unique curves, contours, and corners.
Duty Cycle - The on-time, or relative pulse width of the electronic signal.
Pattern - The repeated patterns within the signal that make up specific messages, like synchronous pulses that
t
ell the PCM that cylinder # 1 is at TDC (Top Dead Center), o r a repeated pattern in the serial data
stream that tells the scan tool the coolant temperature is 212 F (or 100 C), etc.
3.3 THE GOLDEN RULE OF ELECTRONIC SYSTEM DIAGNOSIS
For t he ve hic le’s comp ut er sy stem to functio n properly, it mus t se nd and re ceiv e s ignals wi th the critical
characteristics it was designed to communicate with.
Each of the primary types of electronic signals use the critical characteristics to establish electronic communication.
Th ey each use different combinations of the critical characteristics to communicate. Here’s a list o f which critical
characteristics each of the primary signal types uses to communicate:
Direct Current signals use Amplitude only.
Alternating Current signals use Amplitude, Frequency, and Shape.
Frequency Modulated signals use Amplitude, Frequency, and Shape.
Pulse Width Modulated signals use Amplitude, Frequency, Shape, and Duty Cycle.
Serial Data signals use Amplitude, Frequency, Shape, Duty Cycle, and Pattern.
To minimize this possible interference with the oscilloscope, keep these tips and suggestions in mind:
Most interference will be picked up by the oscilloscope test leads.
Route the test leads away from all ignition wires and components whenever possible.
Use the shortest test leads possible, since other test leads may act as an antenna and increase the potential for
in terference, especially at higher freq uency leve ls that are found when probing near the vehicle’s on-board
computer.
With the potential for RF interference in the engine compartment, if possible, use the vehicle chassis as ground
when connecting the oscilloscope test leads. In some cases the engine block can actually act as an antenna for
the RF signals.
Th e t est le ads are a very importa nt part of any oscillosco pe . Substituting other lea ds in bo th le ng th and
capability may alter the signals on your display.
The oscilloscope can also pick up interference like the test leads.
Because the oscilloscope circuits are so sensitive, and therefore powerful, do not place the oscilloscope directly
on ignition wires or near high energy ignition components, like coil packs.
If you are using the AC or DC charger/adaptor to power the oscilloscope, keep the external power leads far
away from the engine and ignition if possible.
The list will help to give you a better understanding of which signal types use which critical characteristics to do their
electronic communication. The above rules work very well and hold up in most cases, but there are exceptions to its
rules. Not many, but a few.
It may come as no surprise to some that serial data signals are the most complex signals in the vehicle. They use all
5 critical characteristics to communicate with. Thus, they take a special analyzer to decode them - one very familiar
to most technicians - the scan tool.
3.4 SIGNAL PROBING WITH AN OSCILLOSCOPE
Th e e ngine compartment of a ru nning vehicle is a very unfriend ly environment for a utomotive sig nals to live.
Temperature extremes, dirt and corrosion, and electrical leaks, or noises from the high voltage pulses generated
from a t ypical ignition system can produce interference that can co ntribute significa ntly to the cause of many
driveability problems.
When you are probing components, sensors and circuits, be aware that the electrical noises from today’s high output
ignition systems can produce an RF energy that is similar to a radio station. Since oscilloscopes are so sensitive,
this interference can actually override the signals you are trying t o capture and give yo u a false reading on the
display.
3-2
3-3
4. GETTING STARTED
4.1 PRODUCT DESCRIPTION
This instrument is a battery-operated 2-channel lab scope, advanced true rms graphing multimeter (GMM), and OBD
II Code Reader designed expressly for use in the automotive service market. The main purpose of this instrument is
to provide advanced troubleshooting capabilities for automotive service technicians in an easy-to-operate format.
This instrument offers the following features:
A 25 Mega-sample/Second (one channel minimum) sample rate for rapid data updates.
Lab scope signal patterns.
True RMS Graphing Multimeter (GMM) measurements and graphs.
OBD II Code Reader function.
A unique “ Glitch Snare” m ode which captures, d isplays and optionally save s abnormal signal patterns in the
Scope mode of the COMPONENT TESTS only when they occur.
Preset tests that enable the user to check the majority of automotive sensors, actuators and systems easily and
quickly.
P
owerful built-in reference information for each preset test which includes a test procedure sh owing h ow to
connect to the circuit, a normal reference signal pattern, theory of operation and troubleshooting tips.
Menu-driven interf ace has automa tic co nfigu rations f or most of non-pre set tests, s o you will fin d that the
instrument is easy-to-use.
The Secondary Ignition Single function displays the waveform along with the spark voltage, RPM, burn time and
burn voltage.
The Diesel function allows you to set injection pump timing and RPM using the optional Diesel accessories.
USB interface supports updates for code and data.
Even though this instrument is designed to configure itself to almost any test, it is very important that you continue
through this manual and carefully read and understand the capabilities of this instrument before attempting actual
measurements.
4-1
4.2 QUICK TOUR
Powering the Instrument
Press the POWER key to turn the instrument on. The instrument beeps once and turns on.
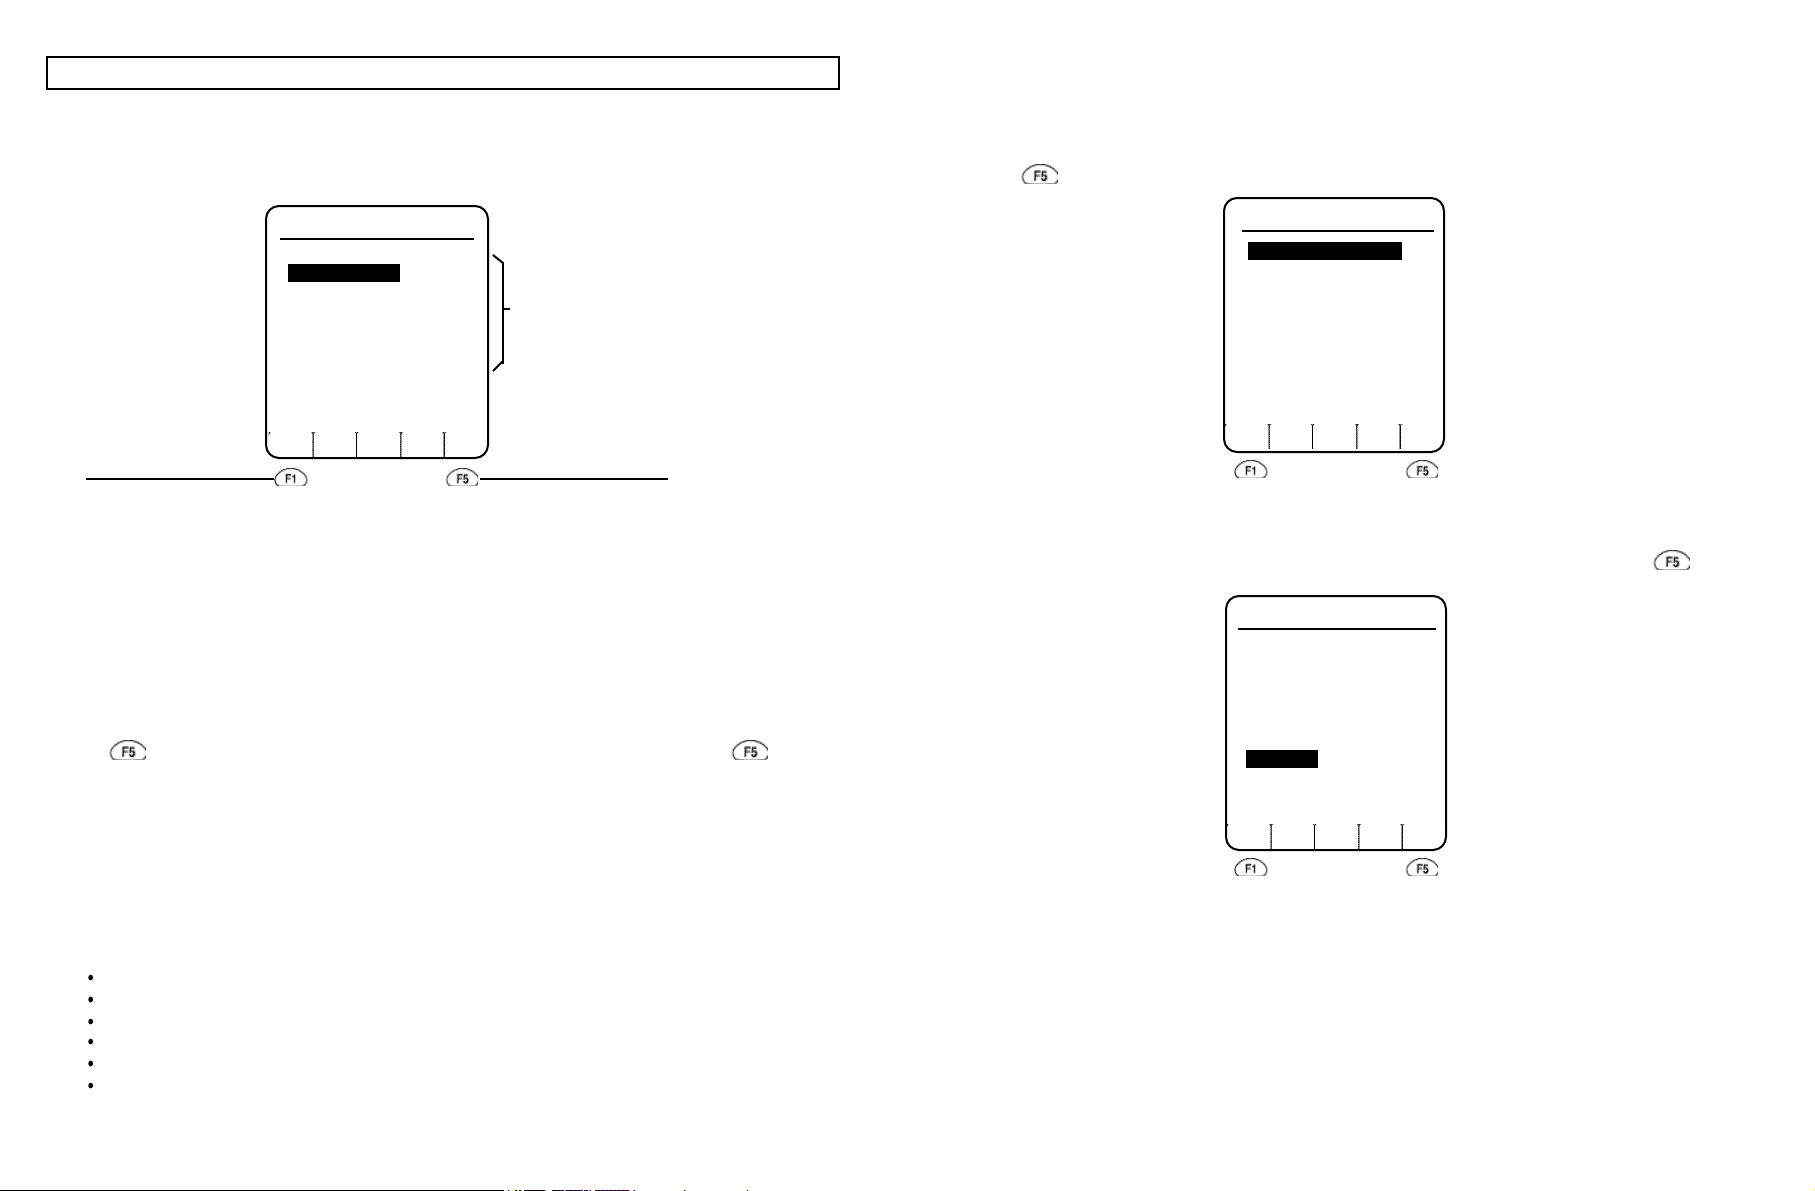
At power on, the instrument displays the VEHICLE DATA menu as shown in Figure 1.
The fastest way to set up the instrument to test most automotive devices (sensors, actuators...)
and circuits
is
to choose from one of the built in COMPONENT TESTS. Each test places the instrument in a configuration best
suited to display signals for the chosen device or circuit.
Press a Four Way arrow ke y to position the HIGHLIGHT B AR o ver the C OMPONENT TESTS menu choice and
press to select.
VEHICLE DATA MENU
Press the F1 key to
accept the displayed
settings.
CYLINDERS : 4
CYCLES
: 4
BATTERY : 12 V
IGNITION : CONV
OK SELECT
Figure 1. Vehicle Data Menu at Power-On
Default settings:
You can change the
settings to match with
the vehicle under test.
Press the F5 key to
change the highlighted
selection.
Changing the Power-On Display
Use “Instrument Setup” menu option to change the Power-On display from VEHICLE DATA MENU(default) to the
user’s last display.
Resetting the Instrument
If you want to restore the instrument settings as delivered from the factory, do the following:
1.
Turn the instrument off by pressing the POWER key.
2. Keep depressed while you turn the instrument on by pressing the POWER key. Release . You will
hear a double beep to indicate that the Master Reset has been executed.
MAIN MENU
COMPONENT TESTS
SCOPE
GRAPHING MULTIMETER
OBD II CODE READER
VEHICLE DATA
INSTRUMENT SETUP
BACK SELECT
Figure 2. Main Menu
From the resulting COMPONENT TESTS menu, select IGNITION from the test group. Then, press to select.
COMPONENT TESTS MENU
SENSORS
ACTUATORS
ELECTRICAL
IGNITION
NOTE
The Master Reset clears all memory data.
Performing a Navigation Exercise
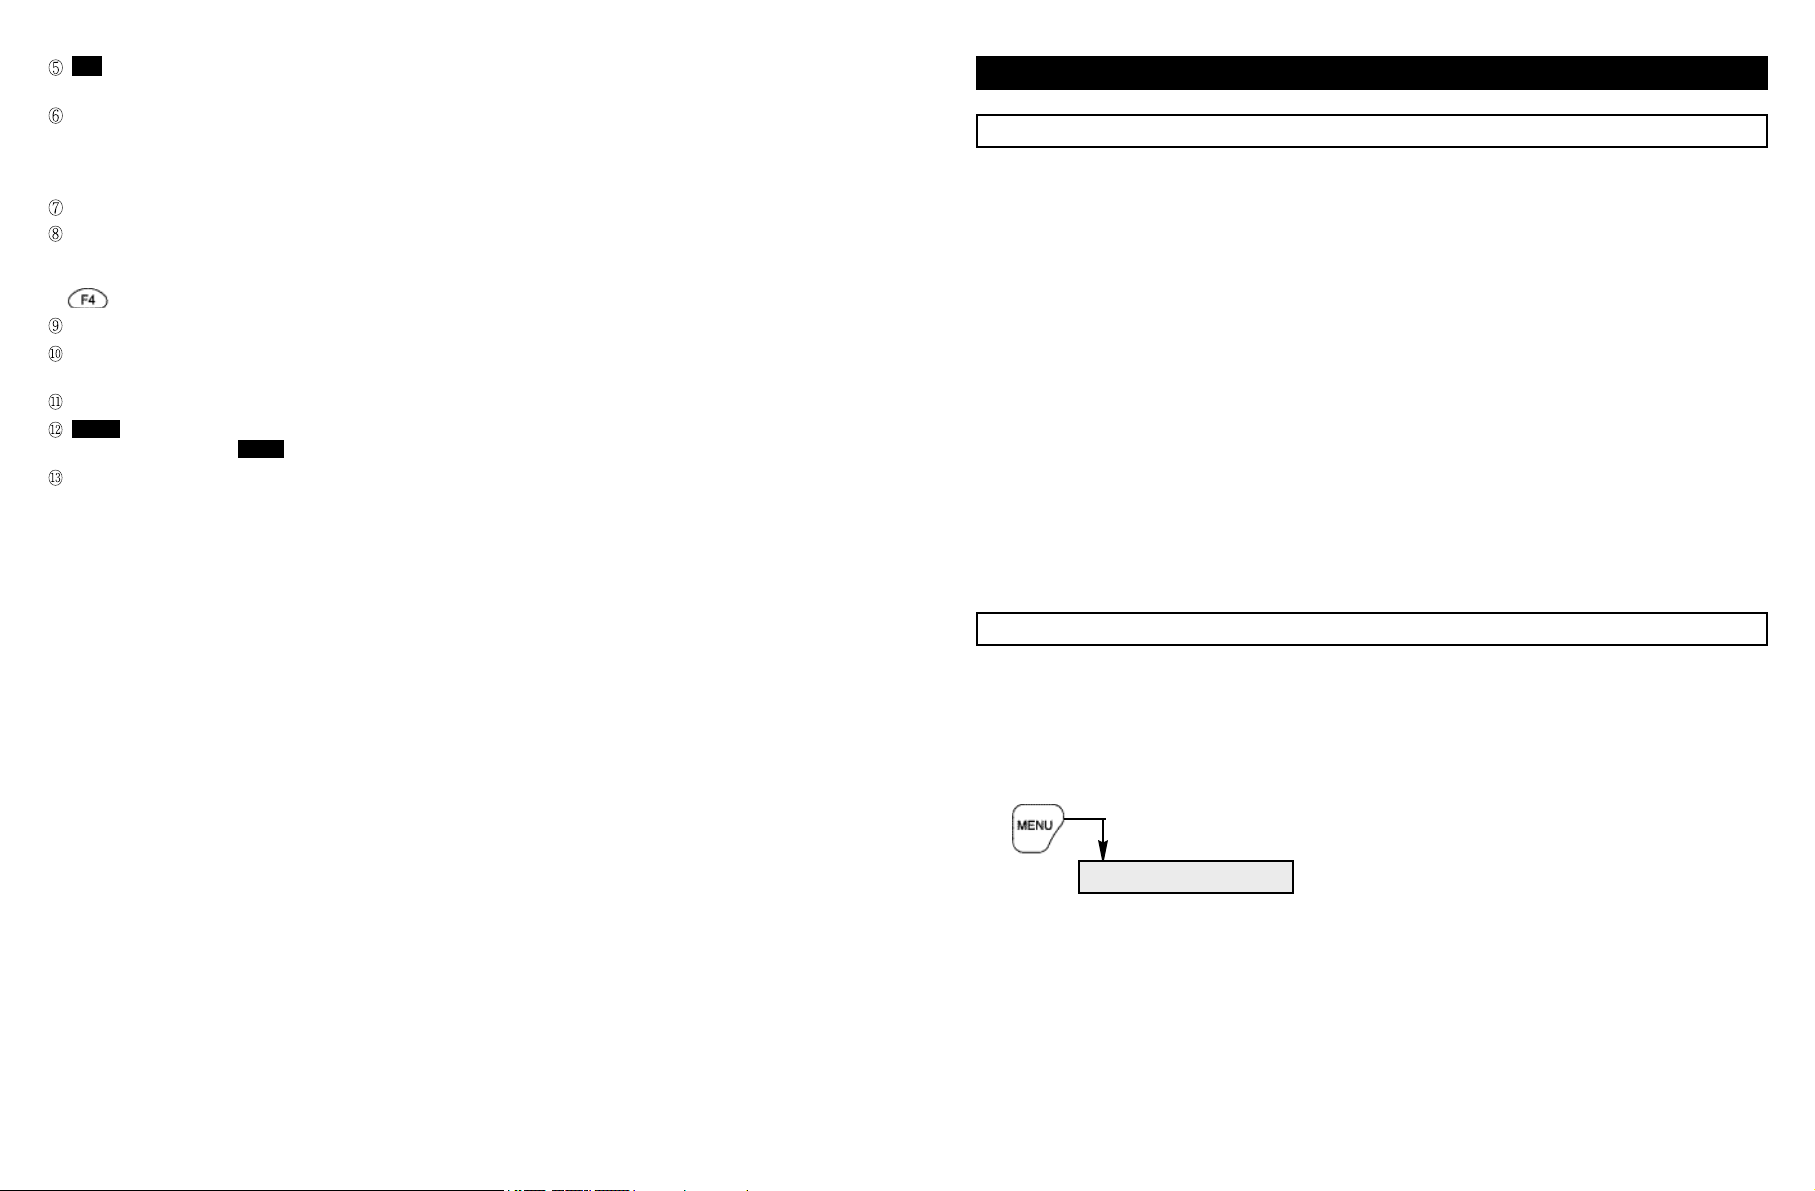
To display the MAIN MENU while a measurement display is active, press the MENU key to display the MAIN MENU
as shown in Figure 2. This menu lists all of the tests, displays and setups available:
COMPONENT TESTS
SCOPE
GRAPHING MULTIMETER
OBD II CODE READER
VEHICLE DATA
INSTRUMENT SETUP
4-2
BACK SELECT
Figure 2. Selecting IGNITION Menu
4-3
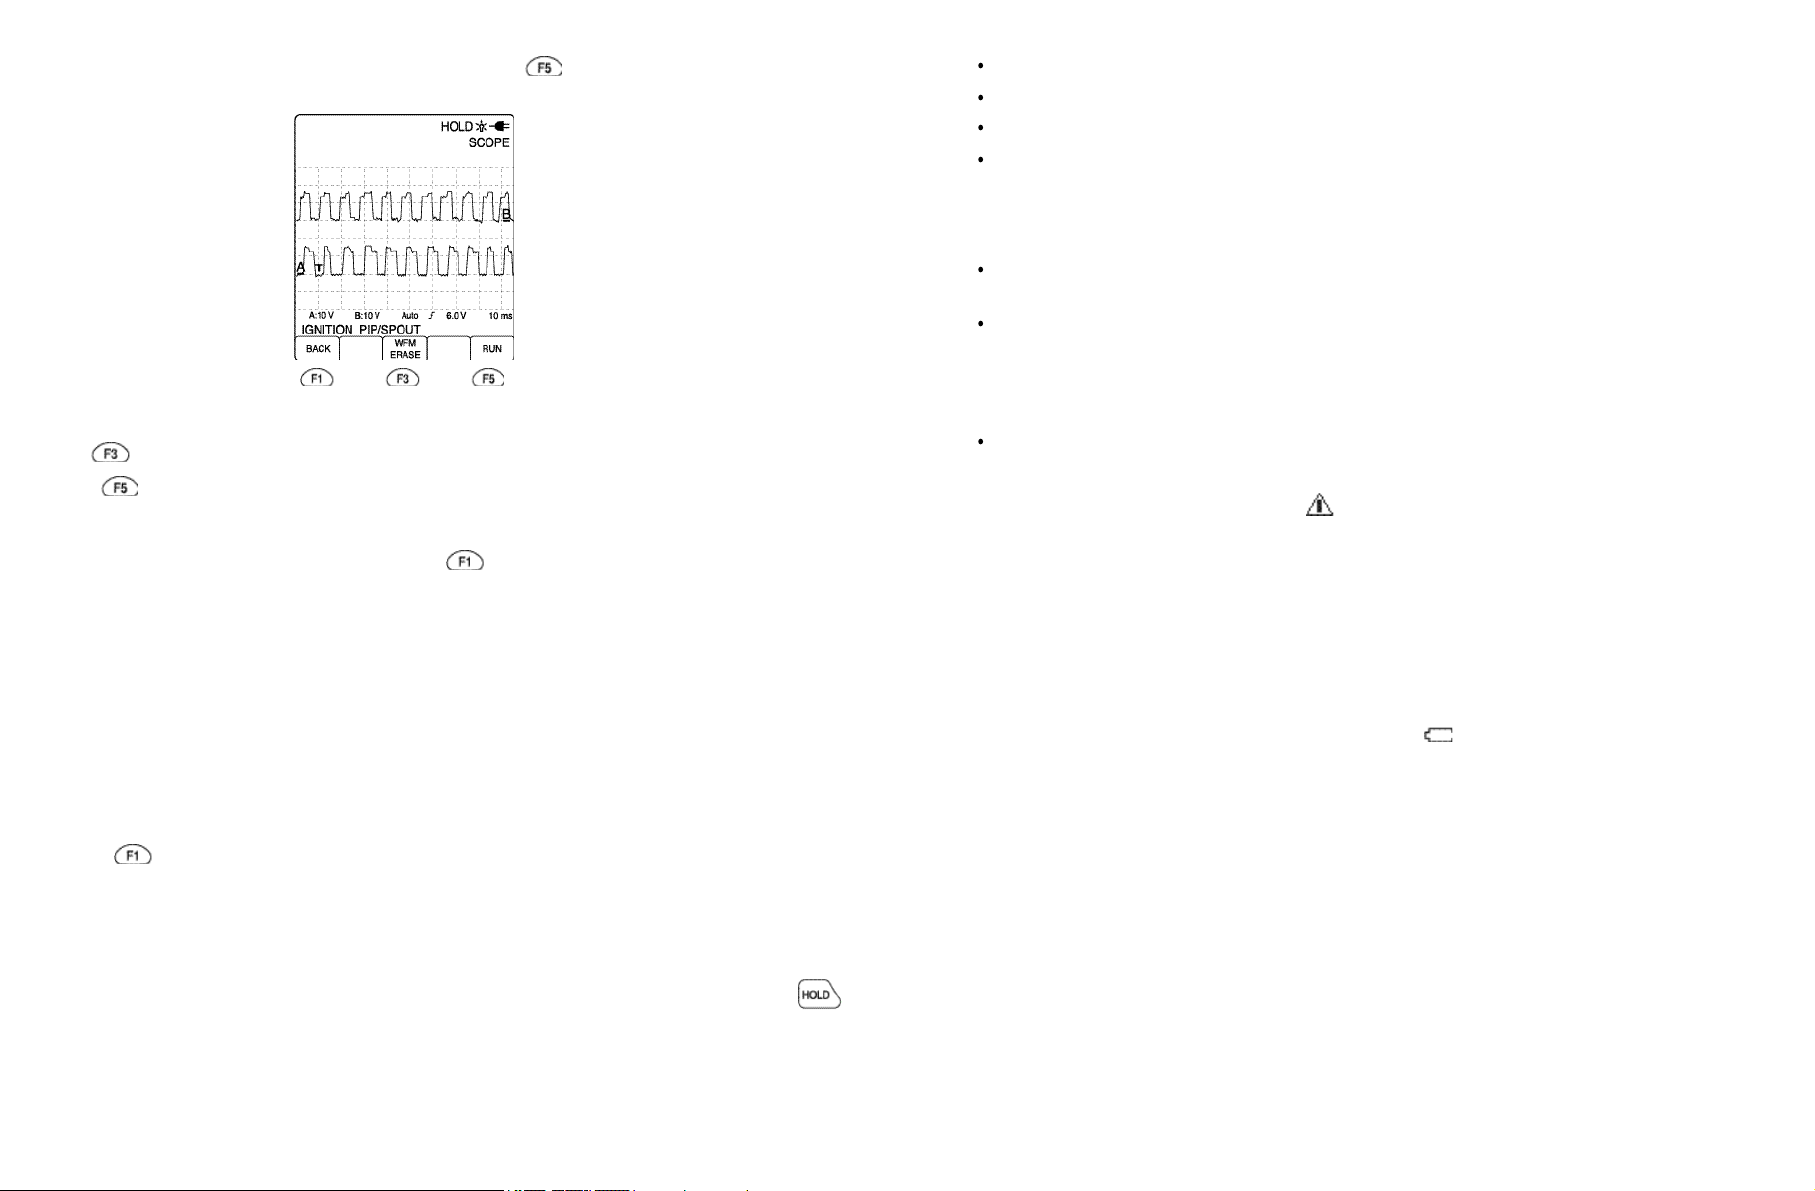
Next, press the Four Way arrow keys to highlight PIP/SPOUT. Press to select. Now, the instrument is ready
to test the input signal(s).
Figure 3. Example of Result Display
Press to remove the Reference Waveform(s).
Press to enter t he scope into t he test mode and continue t o d isplay t he Refere nce Wave form (s) f or
comparison to a live waveform(s).
For this demonstration, view the following reference information specific to the test selected. Reference information
is available at any time by pressing the HELP key. Press when finished viewing each area under the HELP
menu.
Test Procedure - Tells how to hook up the scope, and what accessories to use. Describes how to stimulate the
sensor or operate the circuit to obtain a diagnostic waveform.
Reference Waveform (REF WFM)
- Shows a typical good or normal signal pattern. Describes significant waveform
features or variations.
Theory of Operation - Explains what the sensor or circuit does and the important signals involved.
Troubleshooting Tips - Tells the symptoms caused by the defective component and how to fix up the problems.
Function Information - Explains about the particular function keys that can be used for the selected test for certain
COMPONENTS.
Pressing moves back through the previous displays to return to active tests or to test selected menus.
After you choose a preset test, you may change most instrument settings to get a better look at the signal. You can
even change to different display modes, moving between Scope mode and GMM mode as needed, by pressing the
GMM MODE function key in the Scope display or the SCOPE MODE function key in the GMM display.
You can hold the information in memo ry at a ny time b y pressing th e HOLD key to freeze the display. N otice that
SAVE, RECALL, and CLEAR function key labe l is displayed above the Function key on the bottom display after
is pressed.
Press the SAVE key to save the present screen in the next memory location.
Press the RECALL key to recall the screen last saved in memory.
Press the CLEAR key to clear all the memory locations.
Press the BACK key to resume measuring or to return to the previous display.
Power Sources and Charging the Battery
The instrument can be powered from any of the following sources:
Internal Battery Pack
This is a rechargeable Ni-MH Battery Pack already installed.
Power Adapter
The Power Adapter / Battery Charger powers the instrument from a standard AC outlet and charges the installed
Ni-MH Battery Pack.
The instrument can be used during battery charging. Verify that your local line voltage is appropriate before using
the Power Adapter to power the instrument.
Charging Adapter (Optional)
This adapter charges the instrument’s Ni-MH Battery Pack from a standard 12 V DC cigarette lighter outlet
WARNING
TO AVOID ELECTRICAL SHOCK, USE A BATTERY CHARGER THAT IS
AUTHORIZED FOR USE WITH THE AUTOMOTIVE SCOPE.
USE the following procedure to charge the battery pack and to power the instrument:
1. Connect the Power Adapter / Battery Charger to line voltage.
2. Insert the Power Adapter’s low voltage plug into the Power Adapter connector of the instrument. You can now use
the instrument while the Ni-MH batteries are being charged slowly. If the instrument is turned off, the batteries are
charged more quickly.
During operation, when the batteries are low, a battery symbol appears on the top right of the display. When
this occurs, replace or recharge the internal battery pack immediately.
3. The Power Adapter uses a trickle charging method for the batteries, so no damage can occur even if you leave it
charging for long periods.
Typically a 8 hour recharge during instrument working and a 4 hour recharge during instrument off provides the
instrument with the maximum use of 4 hours.
Auto-Power-Off
When o pe rated on batteries (no adapter co nnec ted), the inst rum ent c onserve s powe r by turnin g itse lf off
automatically, if you have not pressed a key for 30 minutes or if the battery level is too low. The instrument turns
back on if the POWER key is pressed.
The Auto Power-off feature is disabled automatically in the GMM mode.
You can adjust the Auto-Power-Off time between 5 minutes and 120 minutes to use “Instrument Setup” menu option.
4-4
4-5
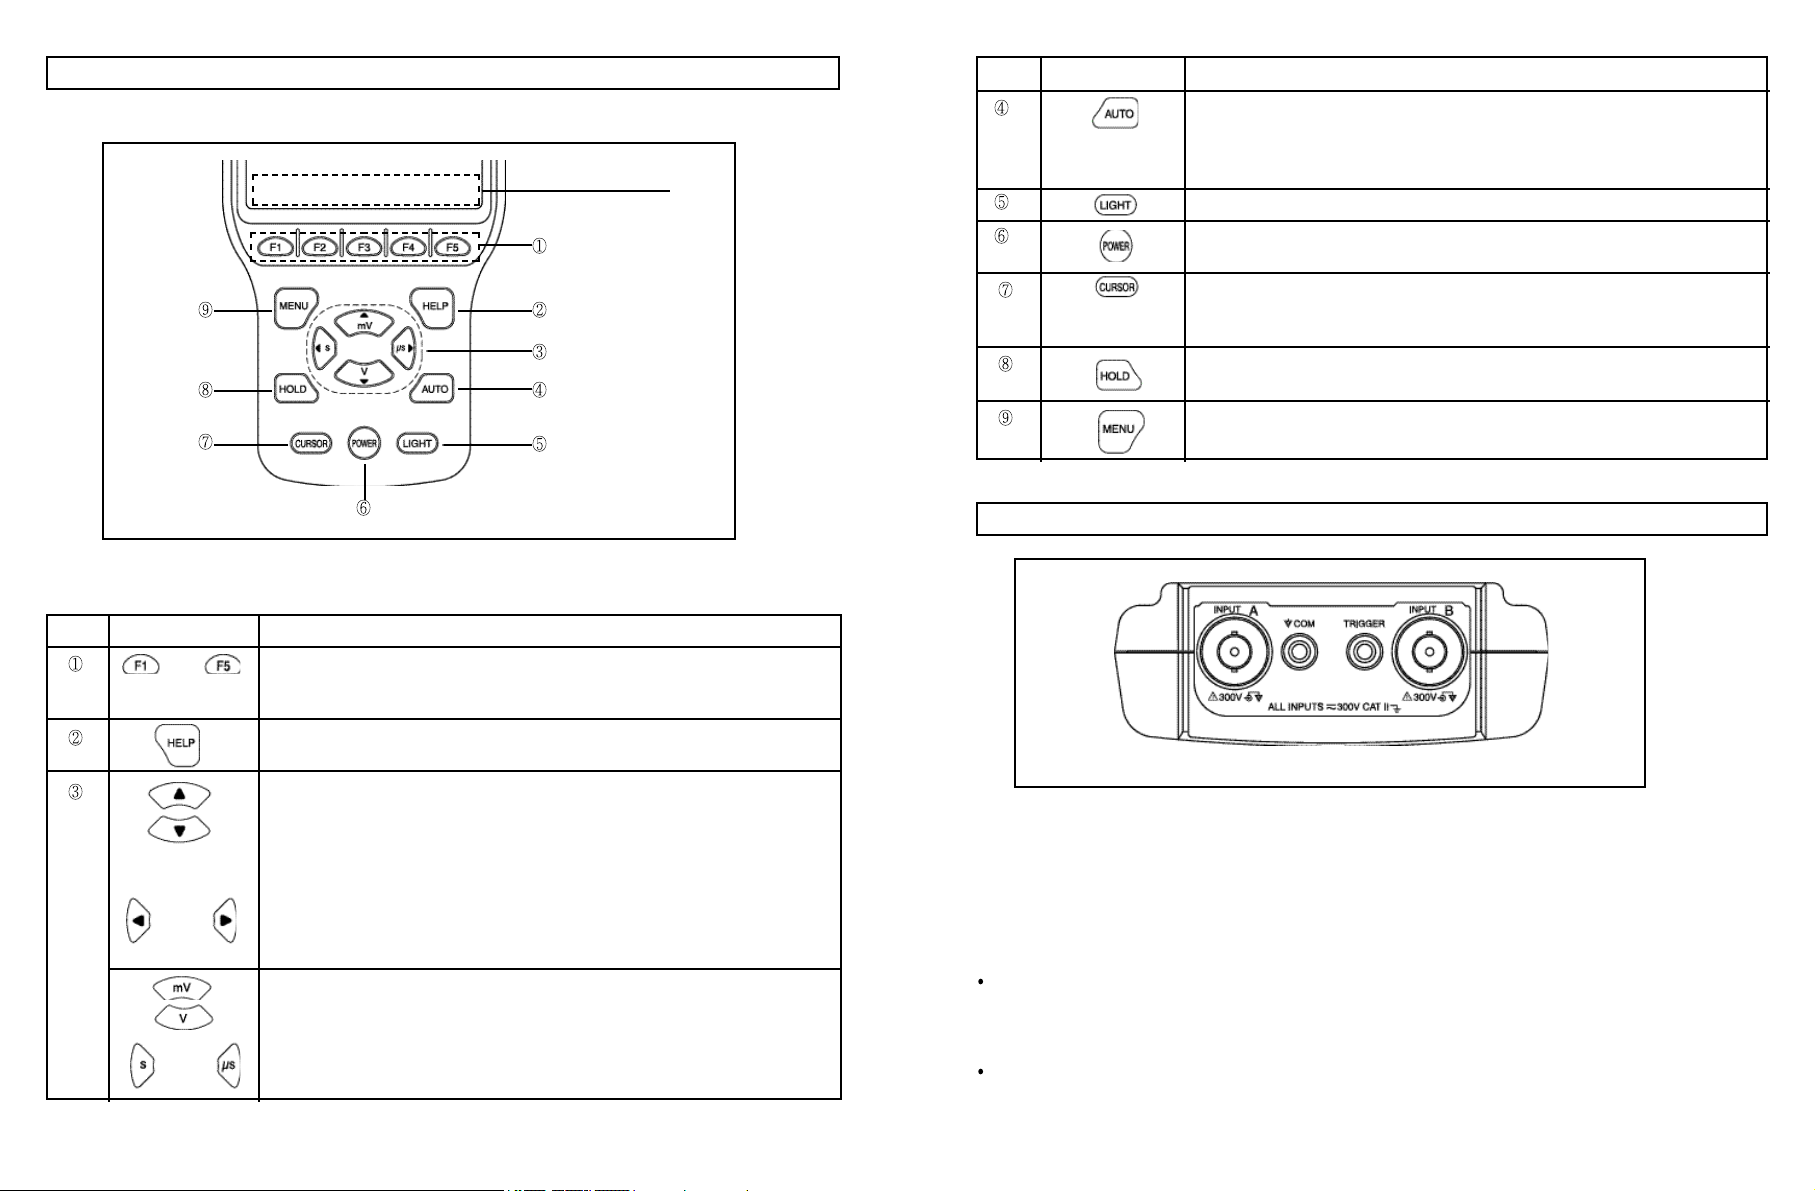
4.3 FRONT PANEL CONTROLS
Key Control Overview
Display area for the
Function Key Labels
ITEM KEYS DESCRIPTION
Sets automatic ranging on and off (toggle).
When on , t he top righ t d isplay shows A UTO. Whe n t his f unction is se t on, it
searches for the best range and time ba se settings and once f ound it t racks the
signal. When this function is off, you should manually control ranging.
Turns the LCD Backlight on and off.
Turns the power on and off (toggle). When you turn the power on, previous settings
are activated.
Allows you to use cursors for measurements on waveforms. A cursor is a vertical
line or a horizontal line that you can move over the waveform like a ruler to measure
values at specific points.
Freezes the display (HOLD is displayed at the top right). Also displays a menu to
save or recall screens or to clear the memory.
Takes you back to the main navigation menu.
Figure 4. Key Control Overview
Key Descriptions
ITEM KEYS DESCRIPTION
to These are the Function keys.
The function assigned to each key is indicated by the Function Key Label displayed
above the key on the bottom display.
Displays information about the highlighted menu choice during menu selection.
Displays information about the function keys when a selected test is running.
Performs one of the following actions:
• Moves up and down through menu choices.
• Moves a waveform up and down.
• Moves a voltage cursor up and down.
• Adjusts the trigger level when you are in the SCOPE mode.
Performs one of the following actions:
• Moves a waveform right and left.
• Moves a time cursor left and right.
Ranges amplitude up and down for both channels (CH A & CH B).
Ranges Time Bass up and down for both channels (CH A & CH B).
4.4 MEASUREMENT CONNECTIONS
Figure 5. Measurement Connections
INPUT A (Red)
INPUT A is used for all single channel measurements, sometimes combined with use of the other inputs, Various
test leads and adapters are required depending on the type of measurement selected.
INPUT B (Yellow)
INPUT B is used in conjunction with INPUT A.
In COMPONENT TEST mode,
for DUAL O2 SENSOR measurements.
for PIP/SPOUT measurements.
for ADVANCE measurements.
In SCOPE mode you can use the instrument as a dual trace oscilloscope with INPUT A and INPUT B connected.
4-6
4-7
COM, TRIGGER
Used as external trigger for probes with dual banana plugs, such as the RPM Inductive Pickup.
TRIGGER (as single input)
Used in SCOPE mode to trigger (or start) acquisitions from an external source.
COM (as single input)
Used for safety grounding when the Capacitive Secondary Pickup is connected to the ignition system.
WARNING
T O A VO ID ELE CTR ICAL SHO CK , CO NNECT THE C OM I N PUT OF THE
INSTRUMENT TO VEHICLE GROUND BEFORE CLAMPING THE CAPACITIVE
SECONDARY PICKUP(SUPPLIED) ON THE IGNITION WIRES.
THIS GROUND CONNECTION IS REQUIRED IN ADDITION TO THE NORMAL
MEASUREMENT GROUND CONNECTIONS.
For other tests, the COM input should not be connected to engine ground when the probes have their own ground
connection at the probe end. See the GROUNDING GUIDELINES.
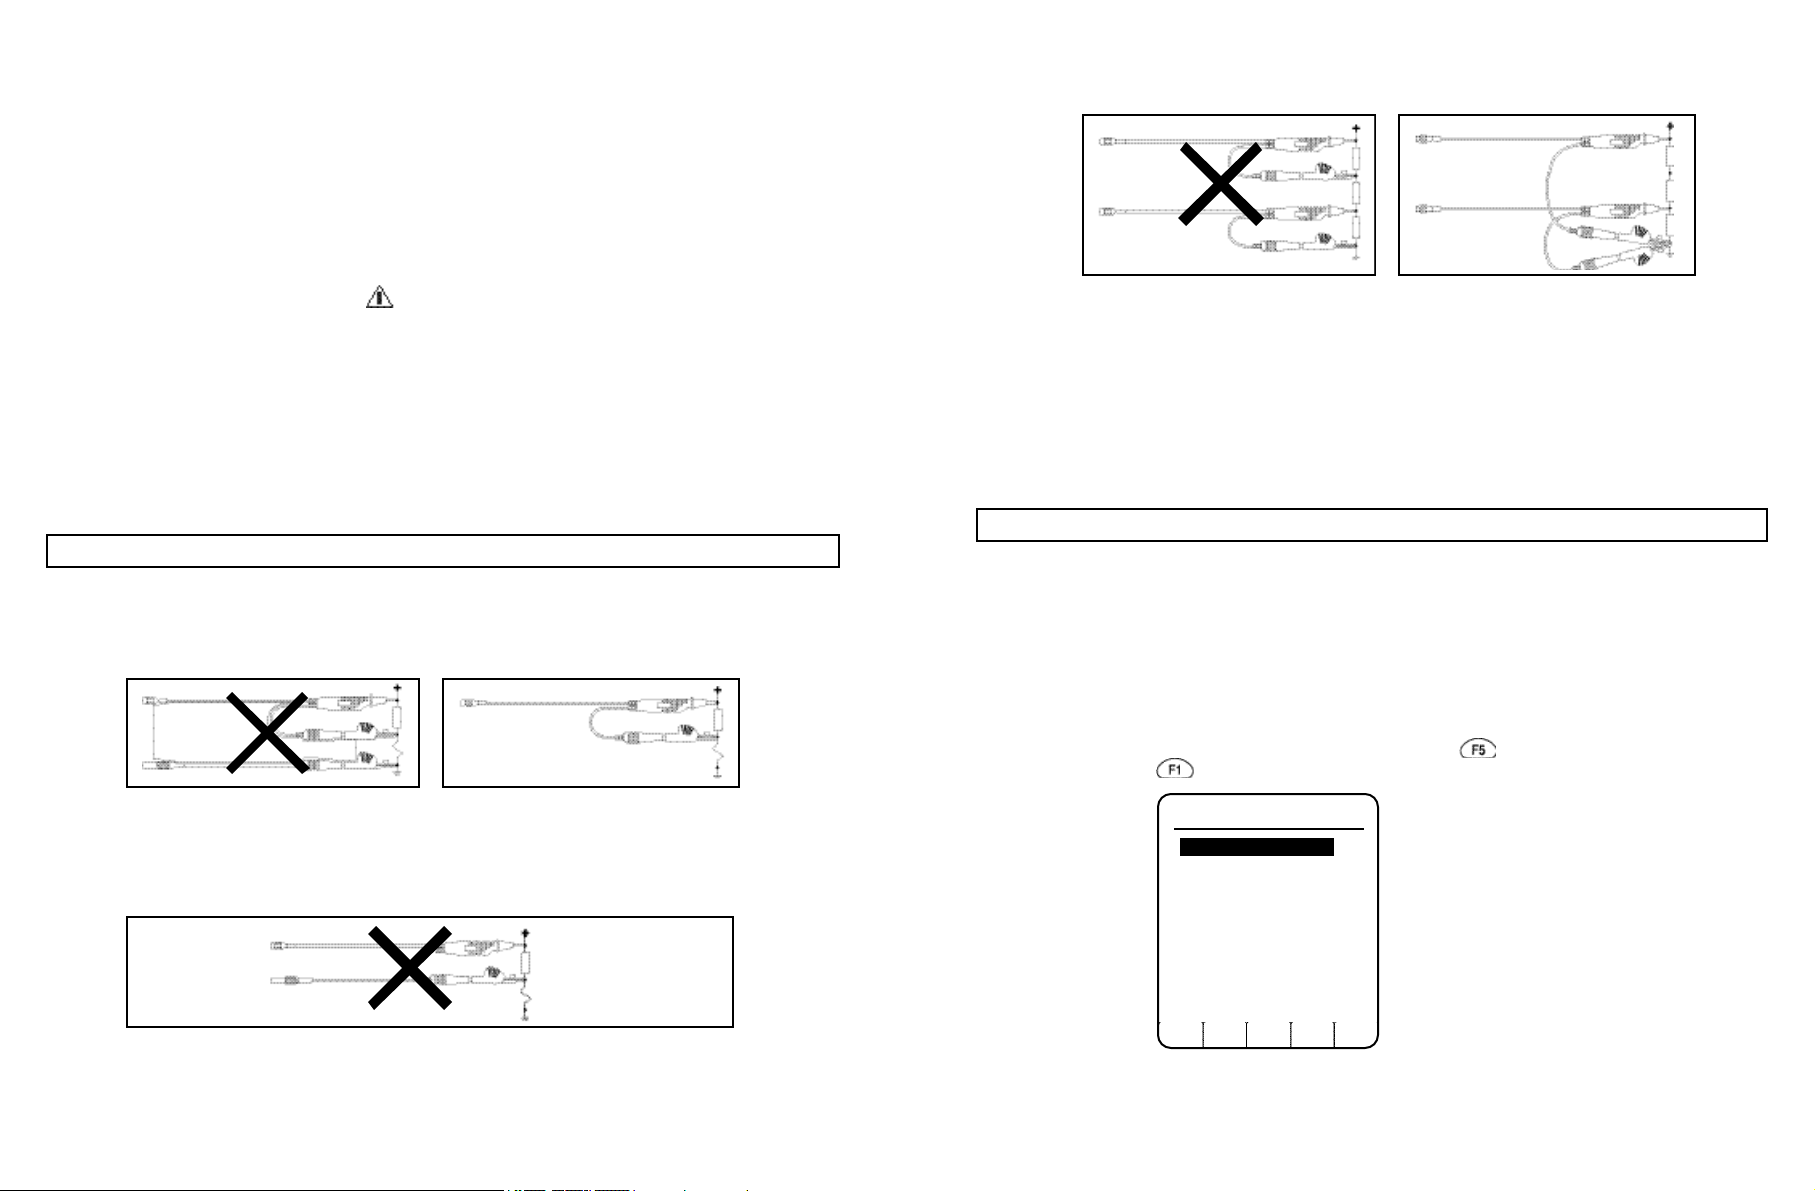
4.5 GROUNDING GUIDELINES
Incorrect grounding can cause various problems:
1. A ground loop can be created when you use two ground leads connected to different ground potentials. This can
cause excessive current through the grounding leads.
INPUT A
COM
(Incorrect Grounding)
Ground Loop b y Double Gr o unding on
Different Grounds
2. Excessive noise shown on the measured signal.
INPUT A
COM
INPUT A
(Correct Grounding)
Shield of Test Lead Connected to Ground
3. Measurement faults or short circuit with the DUAL INPUT SCOPE mode. This occurs when you perform floating
measurements with grounding at different points.
INPUT A
INPUT B
(Incorrect Grounding)
S hort Circuit by Grounding on Dif feren t
INPUT A
INPUT B
(Correct Grounding)
Grounding at One Point
Potentials
Instrument Grounding for Measurements on the Ignition System
Fo r the in strume nt sa fety, connect the COM input to engine ground b efore you perform measurements on the
ignition system with the Capacitive Secondary Pickup.
To prevent ground loops, connect all ground leads to the SAME engine ground.
4.6 DISPLAY
The instrument presents “live” measurement data in the form of Scope and GMM displays. Temporary displays are
used to display frozen and saved measurement data.
Menus are provided as a means of choosing instrument ’s measurement configuration. To display the MAIN MENU
while a measurement display is active, press the MENU key at any time.
Menu Display
When you press MENU key, the instrument displays the MAIN MENU. To select a menu option, use the Four Way
arrow keys to move the highlight bar to the desired item. Then press . To exit the MAIN MENU and return to
the previous setup, press . During menu selection, the bottom part of the screen is used to display the function
key menu.
MAIN MENU
COMPONENT TESTS
SCOPE
GRAPHING MULTIMETER
OBD II CODE READER
VEHICLE DATA
INSTRUMENT SETUP
4-8
(Incorrect Grounding)
Noise Pickup on Unshielded Ground Lead
BACK SELECT
4-9
COMPONENT TESTS
Leads to a series of predefined setups to test most common sensors and circuits.
SCOPE
Use Single Input Scope mode if you want to measure a single signal, INPUT B is turned off. Use Dual Input Scope
mode if you want to simultaneously measure two waveforms - one on INPUT A and the other on INPUT B.
GRAPHING MULTIMETER
INPUT A is used for all GMM(Graphing Multimeter) tests. The probes and test leads to be used depend upon the
type of test performed.
OBD II CODE READER
The OBD II cable input is located on the right side of the housing. Connect the standard OBD II cable supplied to
the vehicle’s sixteen-pin DLC (Data Link Connector).
VEHICLE DATA
Set the vehicle data to match the vehicle under test. If they do not match, you could get incorrect test results and
may not be able to select all available tests for this vehicle. This menu appears at power-on as the start-up display
due to its importance.
INSTRUMENT SETUP
Use this menu option to set the following:
Optimal settings for display.
Filter function enabled and disabled.
Auto-Power-Off enabled and disabled and adjusting the Auto-Power-Off time.
Language for menus and HELP text.
Version Information of current software.
Scope Calibration when using the scope in abnormal operating environments.
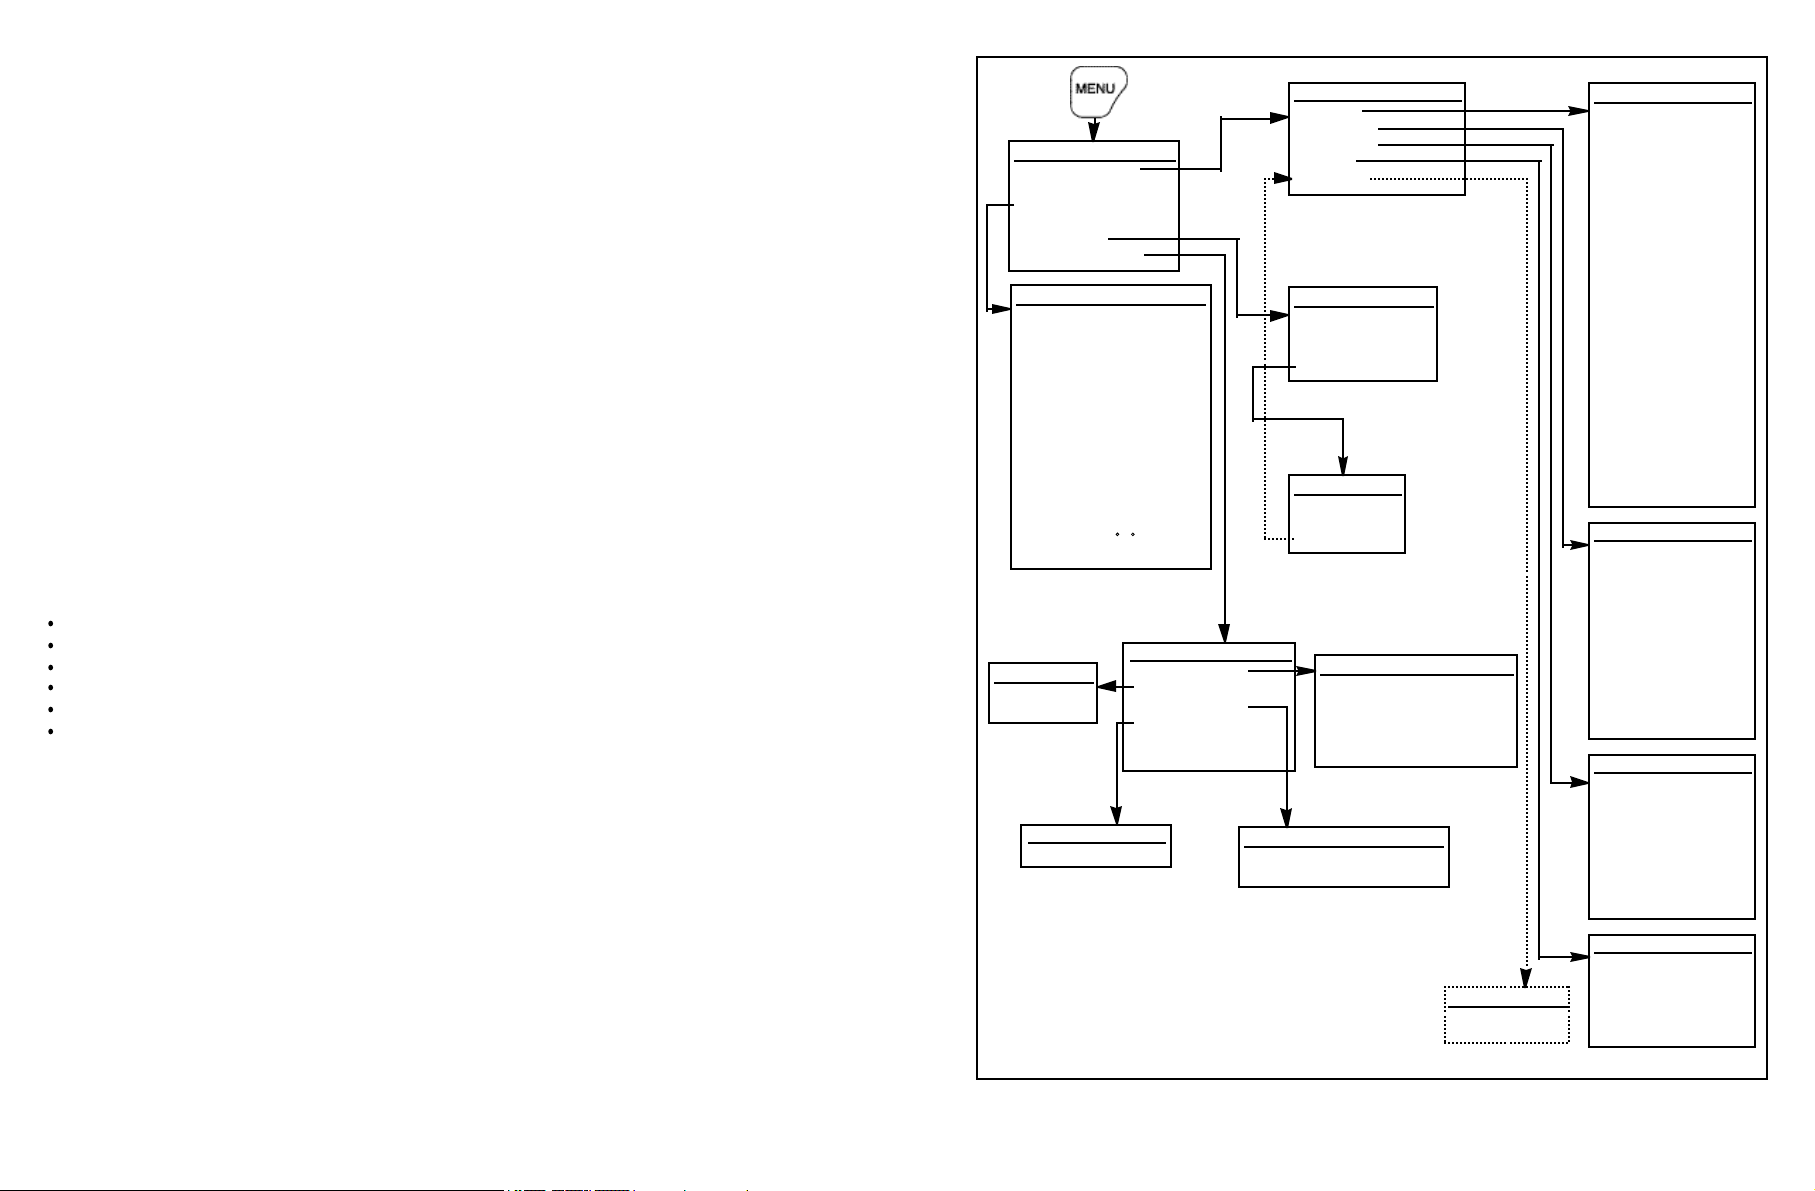
Menu Overview
Figure 6. shows an overview of available test functions, displays and setups from the MENU key. The MAIN MENU
choices represent categories of applications that are listed in sub-menus as shown in the following figure.
MAIN MENU
COMPONENT TESTS
SCOPE
GRAPHING MULTIMETER
OBD II CODE READER
VEHICLE DATA
INSTRUMENT SETUP
GRAPHING MULTIMETER MENU
VOLT DC, AC
OHM/DIODE/CONTINUITY
RPM
FREQUENCY
DUTY CYCLE
PULSE WIDTH
DWELL
IGNITION PEAK VOLTS
IGNITION BURN VOLTS
IGNITION BURN TIME
INJECTOR PEAK VOLTS
INJECTOR ON TIME
AMP DC, AC
TEMPERATURE C F
LIVE
IN STR UMENT SETUP MENU
FILTER MENU
INPUT A : OFF
INPUT B : OFF
LANGUAGE MENU
LANGUAGE : ENGLISH
DISPLAY OPTIONS
FILTER
AUTO POWER OFF
LANGUAGE
VERSION INFORMATION
SCOPE CALIBRATION
COMPONENT TESTS MENU
SENSORS
ACTUATORS
ELECTRICAL
IGNITION
(or DIESEL)
VEHICLE DATA MENU
CYLINDERS
CYCLES : 4
BATTERY : 12 V
IGNITION : CONV
IGNITION MENU
CONV (default)
DIS
DIESEL
DISPLAY OPTIONS MENU
AUTO POWER OFF MENU
AUTO POWER OFF : ON
AUTO POWER OFF TIME : 30 min
: 4
USER LAST SETUP : OFF
CONTRAST : 4
GRATICULE : ON
HORIZ TRIG POS : 10 %
ACQUIRE MODE : PEAK DETECT
SENSOR TESTS MENU
ABS Sensor (Mag)
O2S Sensor (Zirc)
Dual O2Sensor
ECT Sensor
Fuel Temp Sensor
IAT Sensor
Knock Sensor
TPS Sensor
CKP Magnetic
CKP Hall
CKP Optical
CMP Magnetic
CMP Hall
CMP Optical
VSS Magnetic
VSS Optical
MAP Analog
MAP Digital
MAF Analog
MAF Digi Slow
MAF Digi Fast
MAF Karman-Vrtx
EGR (DPFE)
ACTUATOR TESTS MENU
Injector PFI/MFI
Injector TBI
Injector PNP
Injector Bosch
Mixture Cntl Sol
EGR Cntl Sol
IAC Motor
IAC Solenoid
Trans Shift Sol
Turbo Boost Sol
Diesel Glow Plug
ELECTRICAL TESTS MENU
Power Circuit
V Ref Circuit
Ground Circuit
Alternator Output
Alternator Field VR
Alternator Diode
Audio System
DC Switch Circuits
4-10
DIESEL MENU
DIESEL INJECTOR
ADVANCE
Figure 6. Automotive Test Functions & Setups Overview
IGNITION TESTS MENU
PIP/ SPOUT
DI Primary
DI Secondary
DIS Primary
DIS Secondary
4-11
Getting Reference Information for the Selected Test
Reference information is available at any time by pressing the HELP key.
Press when finished viewing each area under the HELP menu.
HELP MENU
TEST PROCEDURE
REFERENCE WAVEFORM
THEORY OF OPERATION
TROUBLESHOOTING TIPS
FUNCTION INFORMATION
BACK SELECT
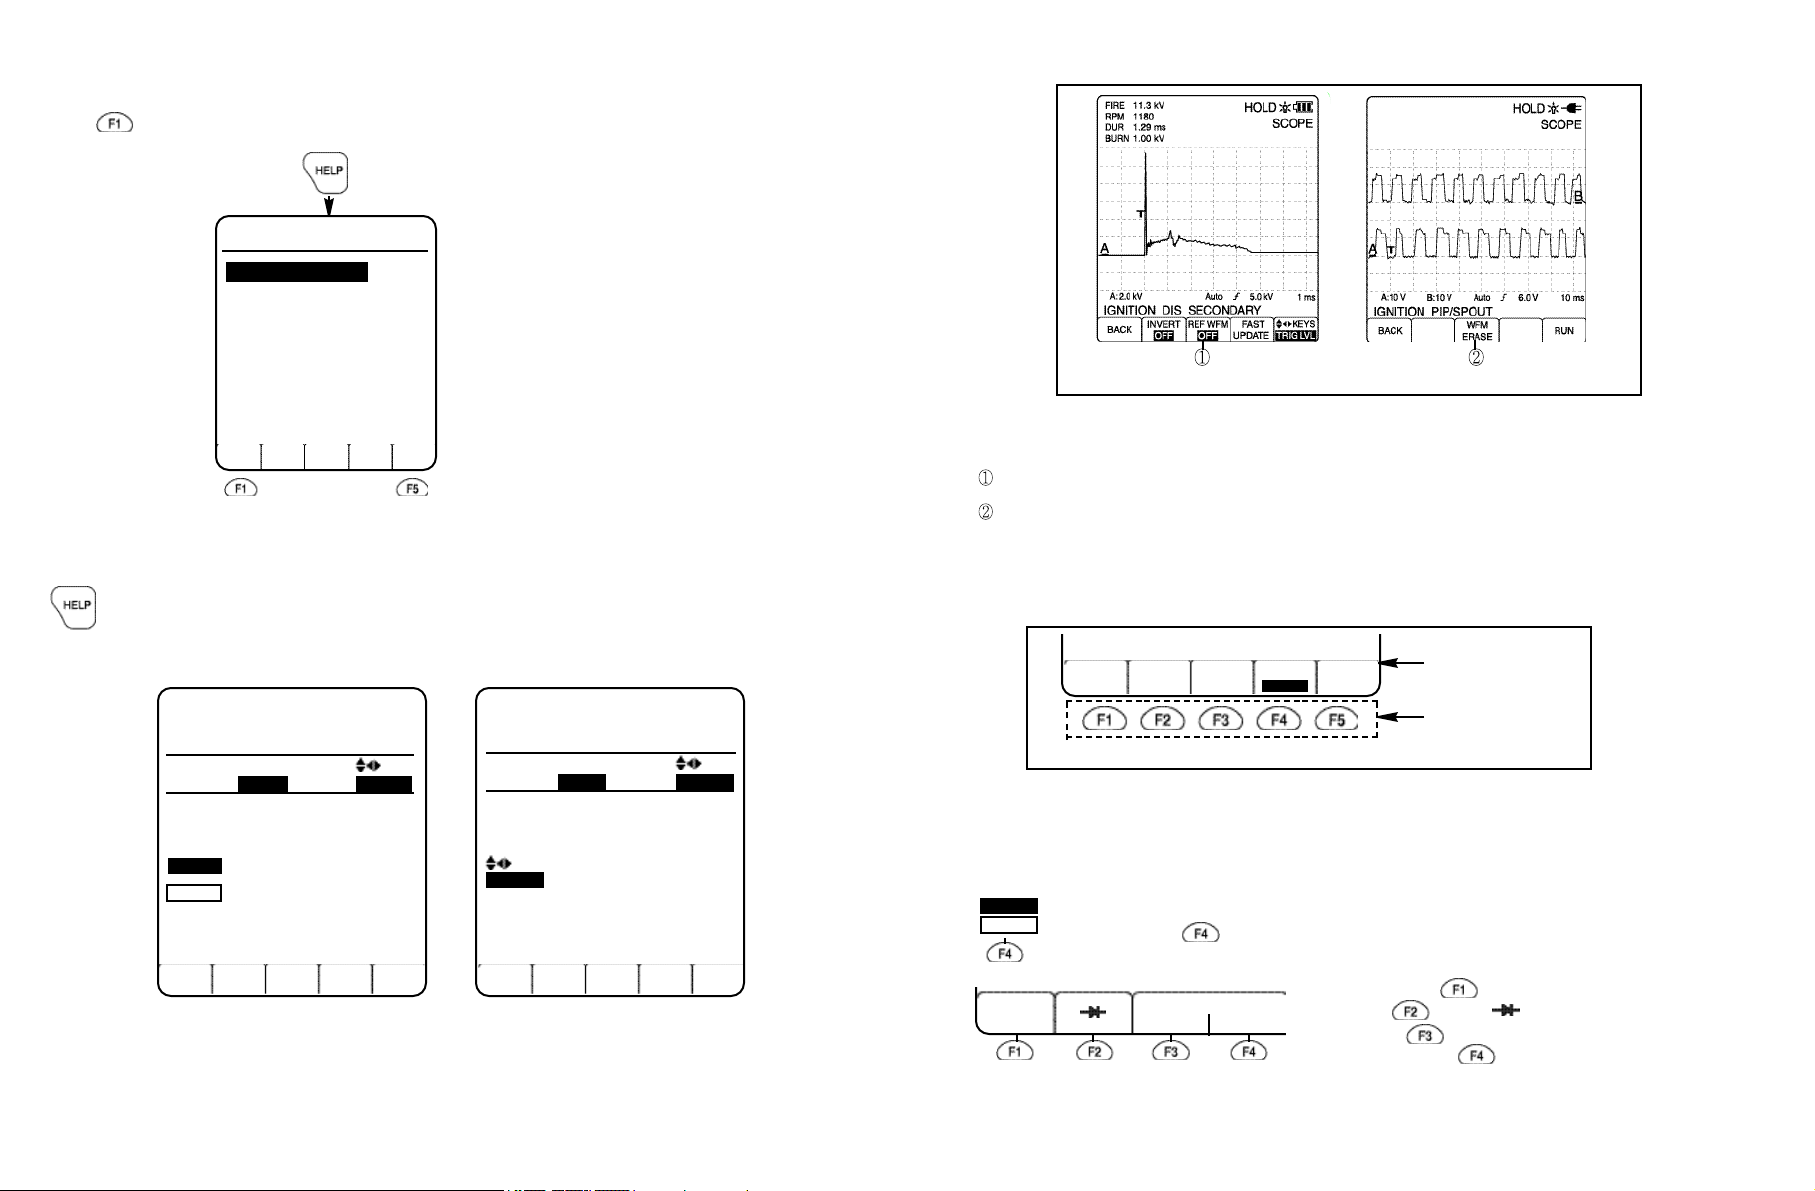
Screen Displays
Figure 8. Single and Dual Input scope in COMPONENT TESTS
Use Dual Input Scope mode if you want to sim ultaneously measure two waveforms - one on INPUT A and the other
on INPUT B.
Use SINGLE INPUT SCOPE mode if you want to measure a single signal, INPUT B is turned off.
Use DUAL INPUT SCOPE mode if you want to simultaneously measure two signals.
Getting Information About the Function Keys During a Running Test
When you press this key during a running test, you get information about the function keys that can be used
for the test.
For example,
DI Primary
Function Info
VEHICLE
DATA
VEHICLE
DATA
CYLINDER
SINGLE
PARADE
BACK
CYLINDER
SINGLE TRIG LVL
Giv es a list of options to d efin e
the type of vehicle under test.
S INGLE -d i sp l a ys th e i gniti o n
pattern of one single cylinder.
P AR AD E-di sp lays t h e ig n iti o n
patte rn of al l cyl in ders in fi rin g
order.
FAST
UPDATE
Page 1 of 2
Function Info
KEYS
PAGE
DOWN
VEHICLE
DATA
FAST
UPDATE
TRIG LVL
BACK
Figure 7. Information About the Function keys
DI Primary
CYLINDER
SINGLE TRIG LVL
Turns all readings off to make the
me a sur em ent f a ste r and m ore
reliable.
You can adjust trigger level for a
KEYS
stab le d ispla y b y using the fou r
way arrow keys.
FAST
UPDATE
PAGE
UP
Page 2 of 2
KEYS
4-12
Using the Function keys
Fo r each test, one or more Function Key Labels are displaye d, depending on the sub-select ions po ssible. The
Labels indicate what the keys do when you press them. (See the following example.)
IGNITION DI SECONDARY
VEHICLE WFM CYLINDER
BACK RUN
DATA ERASE PARADE
Function Key Labels
Function keys
Figure 8. Function Key Labels for SECONDARY IGNITION
Pressing a function key that has no label has no effect.
The same Function Key Label can appear in several tests and it performs a similar function.
Examples of Function Key Labels
CYLINDER
PARADE
SINGLE
OHM
Two separate functions can be allowed to the same function key.
You can use the function key to toggle between the functions.
When you press , you can select between PARADE and SINGLE cylinder test.
CONTINUTY
OPEN
CLOSE
When you press , OHM becomes the active function. When
you press , Diode ( ) becomes the active function. When
you press , OP EN CO NTINU ITY b ecomes th e active
function. P ressing , CLOSE CONTINUITY be comes t he
active function.
4-13
KEYS
RANGE A
MOVE A
TRIG LVL
KEYS
CURSOR 1
CURSOR 2
REPEAT
TEST
INVERT
OFF
ON
The KEYS icon indicates that you can use the Four Way arrow keys to change Volt & Time
ranges, to move the waveform position, and to adjust the trigger level for either INPUT A or INPUT B.
And also you can use the Four Way arrow keys to adjust the sensitivity level in the COMPONENT
TEST (IGNITION mode).
Press to toggle among RANGE A,MOVE A , and TRIG LVL for INPUT A, or among
RANGE B , MOVE B , and TRIG LVL for INPUT B.
The icon indicates that you can use the Four Way arrow keys to move CURSOR 1 (if
CURSOR 1
is highlighted) or move CURSOR 2 (if CURSOR 2 is highlighted). Press the function key to toggle
between CURSOR 1 and CURSOR 2.
This Label is displayed for SINGLE DISPLAY tests, for example the knock sensor test. To repeat the
test, press the function key, then perform the required action. The knock sensor test is a single shot
measurement, which means that the signal from the knock sensor is displayed only once. To get a new
test result, you have to press the key and then tap the engine block or the sensor again. You
may have to readjust the vertical RANGE to get an optimal waveform.
To change to the opposite polarity. Puts the waveform display upside down.
4.7 SCOPE MODE
SCOPE mode provides a display of signal patterns from
either CH A or CH B over times ranging from 1 µs to 50
seconds per division, and for voltage ranges from 50 mV
to 300 V full scale.
The display m ay be triggered at all tim e se tt ings, and
trigg er slop e and level m ay be adjusted as needed. The
scope display is defaulted in Glitch Detect mode to display
even the narrowest glitches.
The SINGLE INPUT SCOPE mode (Com ponent Test s
onl y) pro vi des fo r th e d i spla y o f up to f o u r m e t e r
measurements above the waveform viewing area.
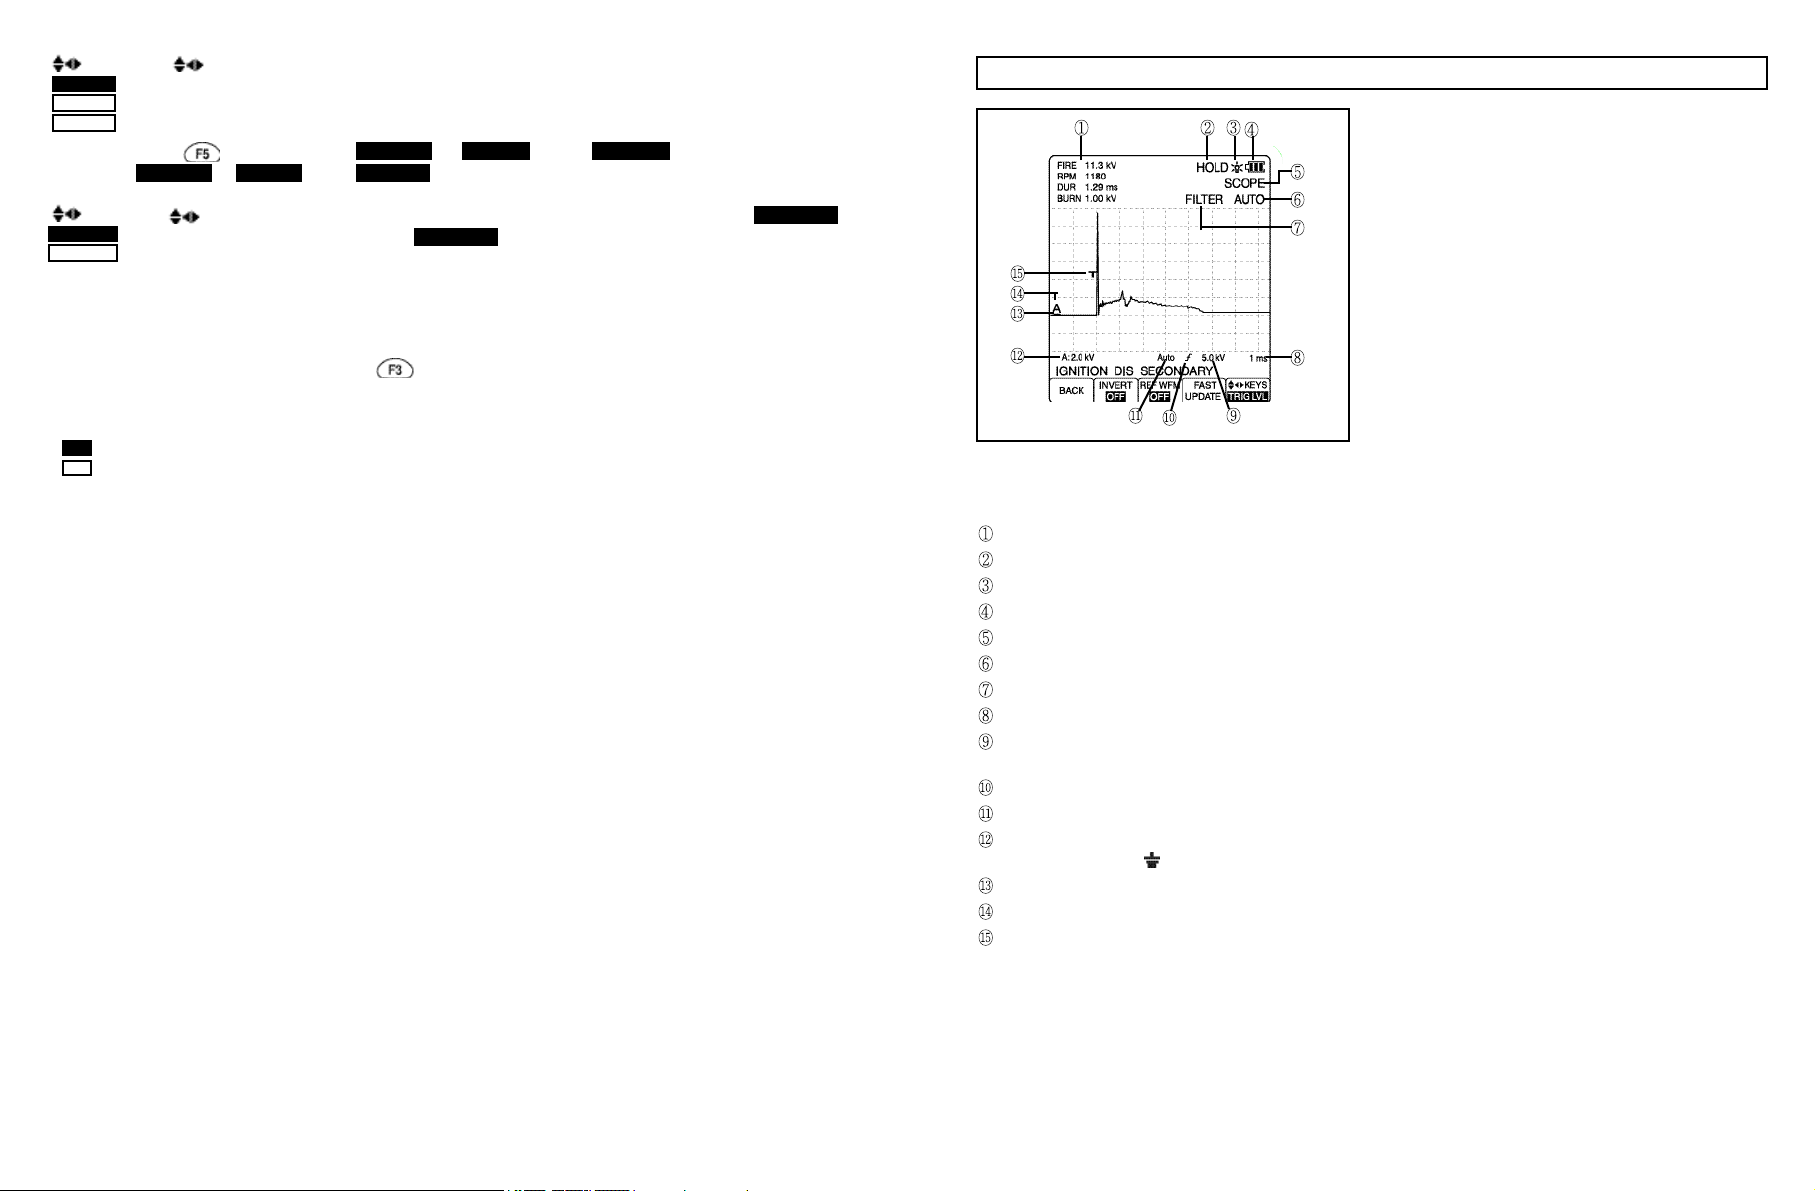
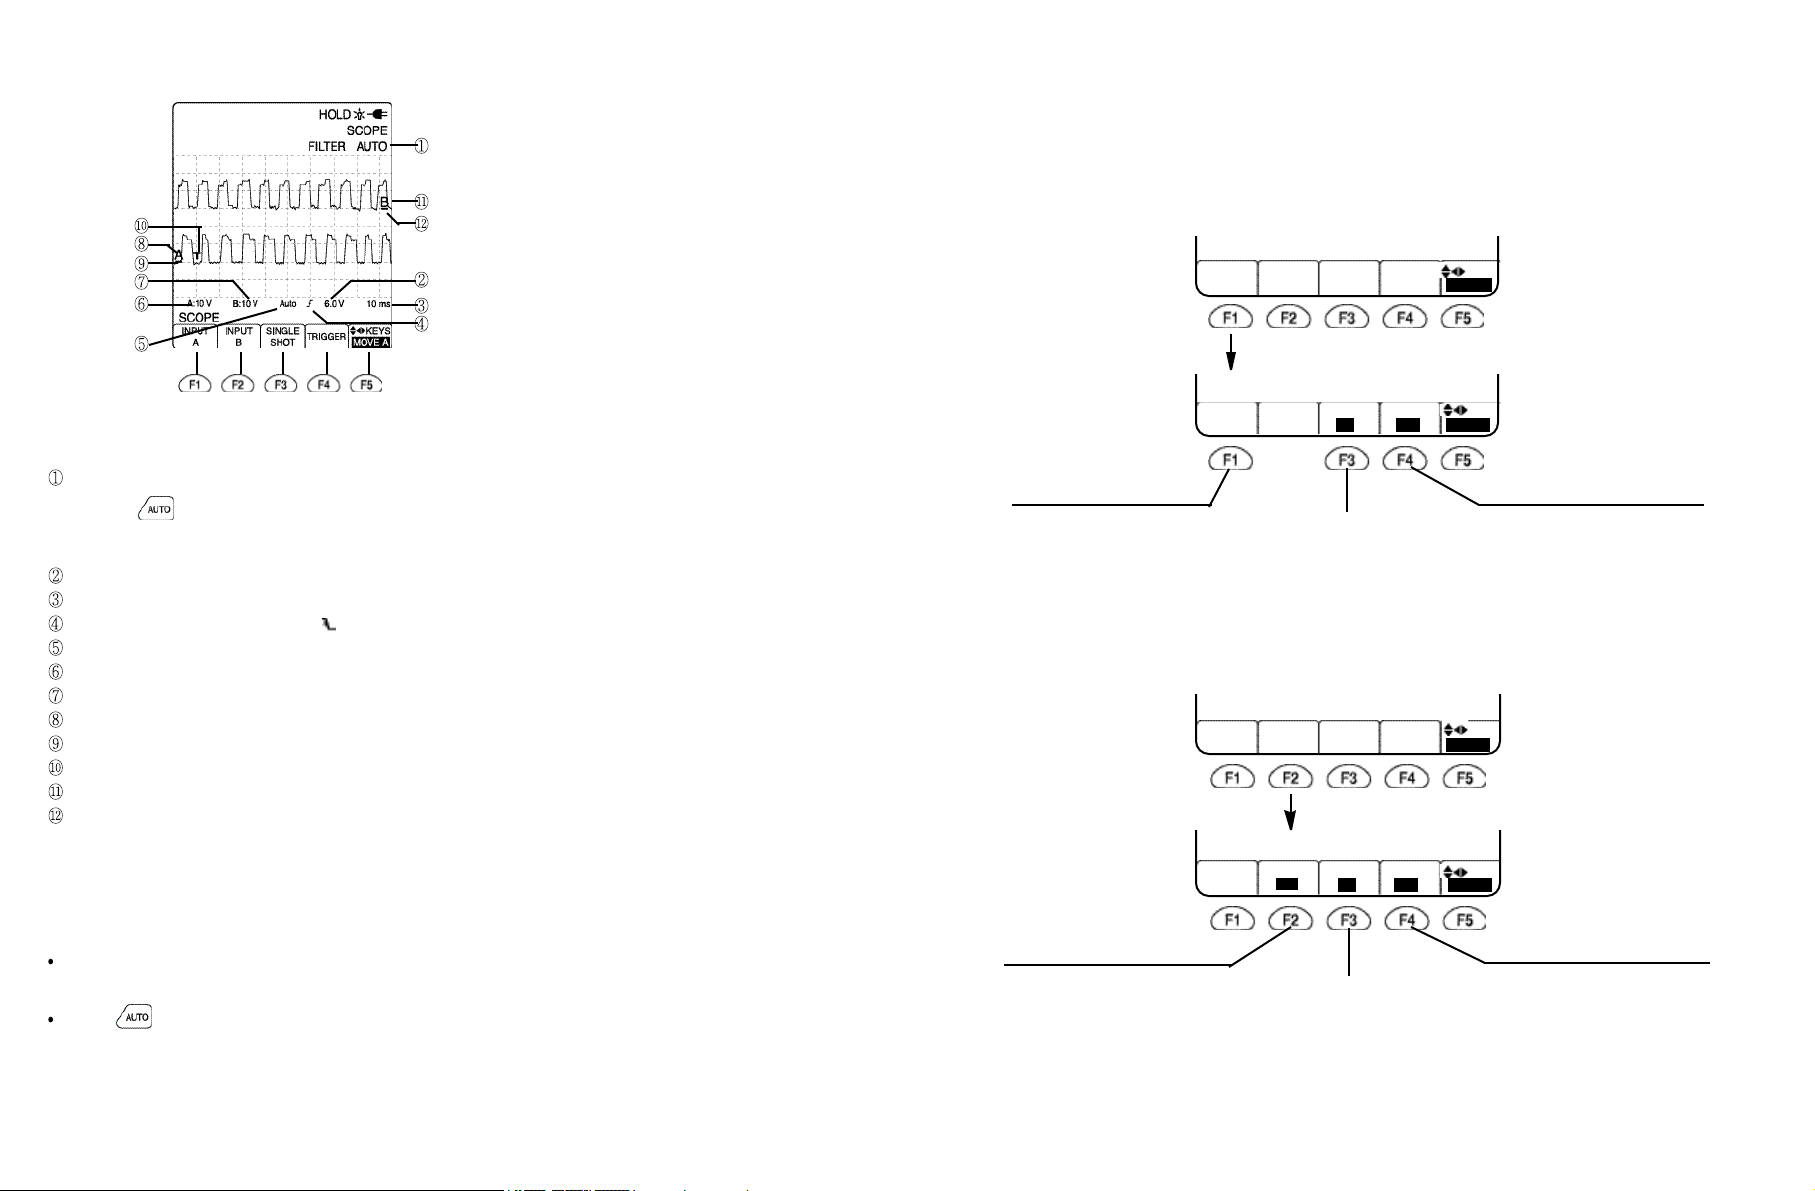
Figure 9. Scope Mode Indicators
GMM
MODE
SCOPE
MODE
GLITCH
SNARE
This Label is displayed in the Scope test mode of the COMPONENT TESTS only.
To change from Scope test mode to GMM test mode, press the function key.
This Label is displayed in the GMM test mode of the COMPONENT TESTS only.
To change from GMM test mode to Scope test mode, press the function key.
This Label is displayed in the Scope test of the COMPONENT TESTS only.
To capture, display, and optionally save abnormal signal patterns when they occur, press the function
key.
Indicate meter measurement function.
Indicate HOLD function enabled.
Backlit indicator.
Low battery indicator.
Indicate SCOPE mode.
Indicate AUTORANGING mode.
Indicate FILTER function enabled.
Indicate time base per division.
Indicate trigger level voltage.
Blank if DC, ~ if AC.
Indicate trigger slope (rising or falling).
Indicate AUTO triggered.
Indicate voltage per division and coupling.
Blank if DC, ~ if AC, if GND.
Indicate signal source channel.
Indicate INPUT A zero level.
Indicate trigger location.
4-14
4-15
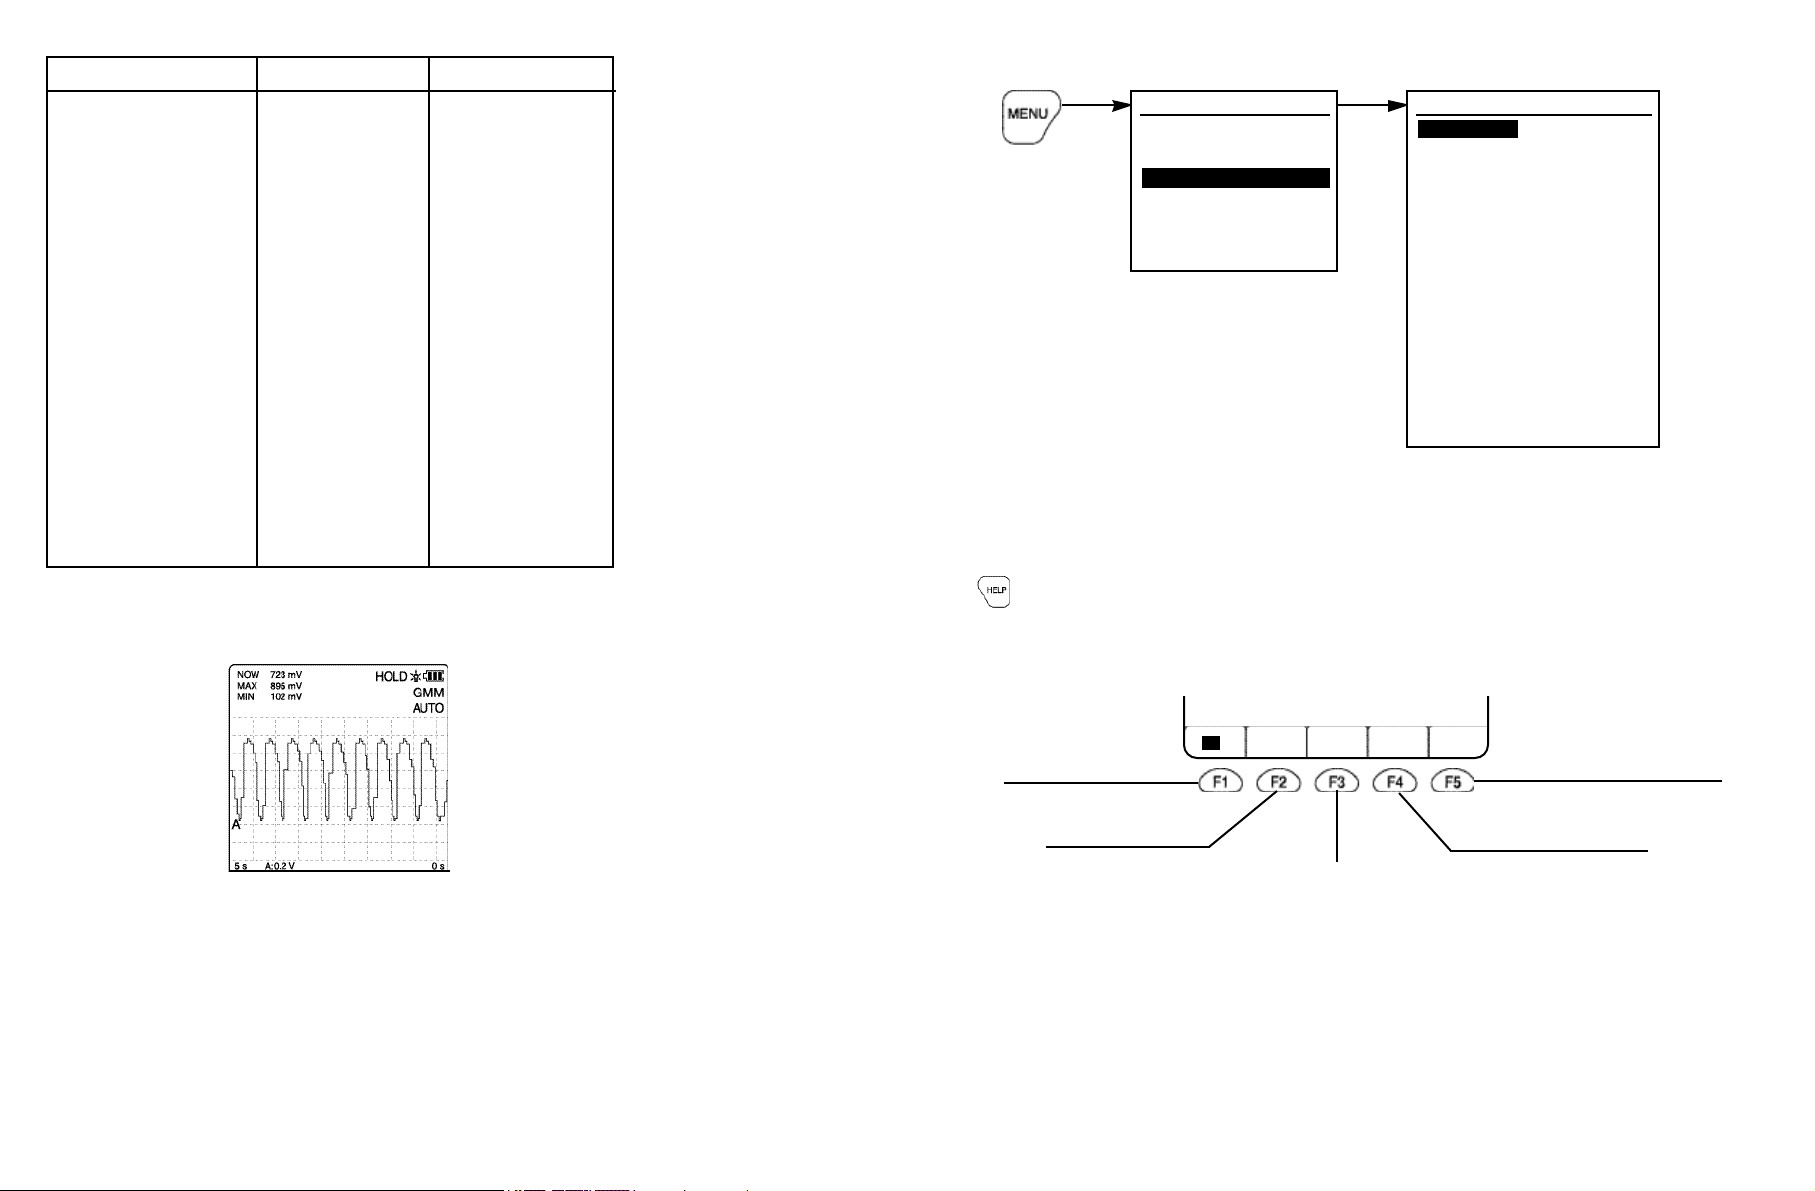
4.8 GMM (GRAPHING MULTIMETER) MODE
4.9 OBD II CODE READER MODE
GMM mode plots the results of signal measurements such
as freq uency as t he values change with time. The time
range in GMM mode may be set manually from 5 seconds
to 24 hours per display.
Ranges for the vertica l sca le may also be set m anually
,
and the available range depends upon the measurement
being displayed.
Where possible, measurements plotted in GMM mode are
performed on a cycle-by-cycle basis, resulting in extremely
fast response.
This mode is very suitable to find faults in slowly changing
processes.
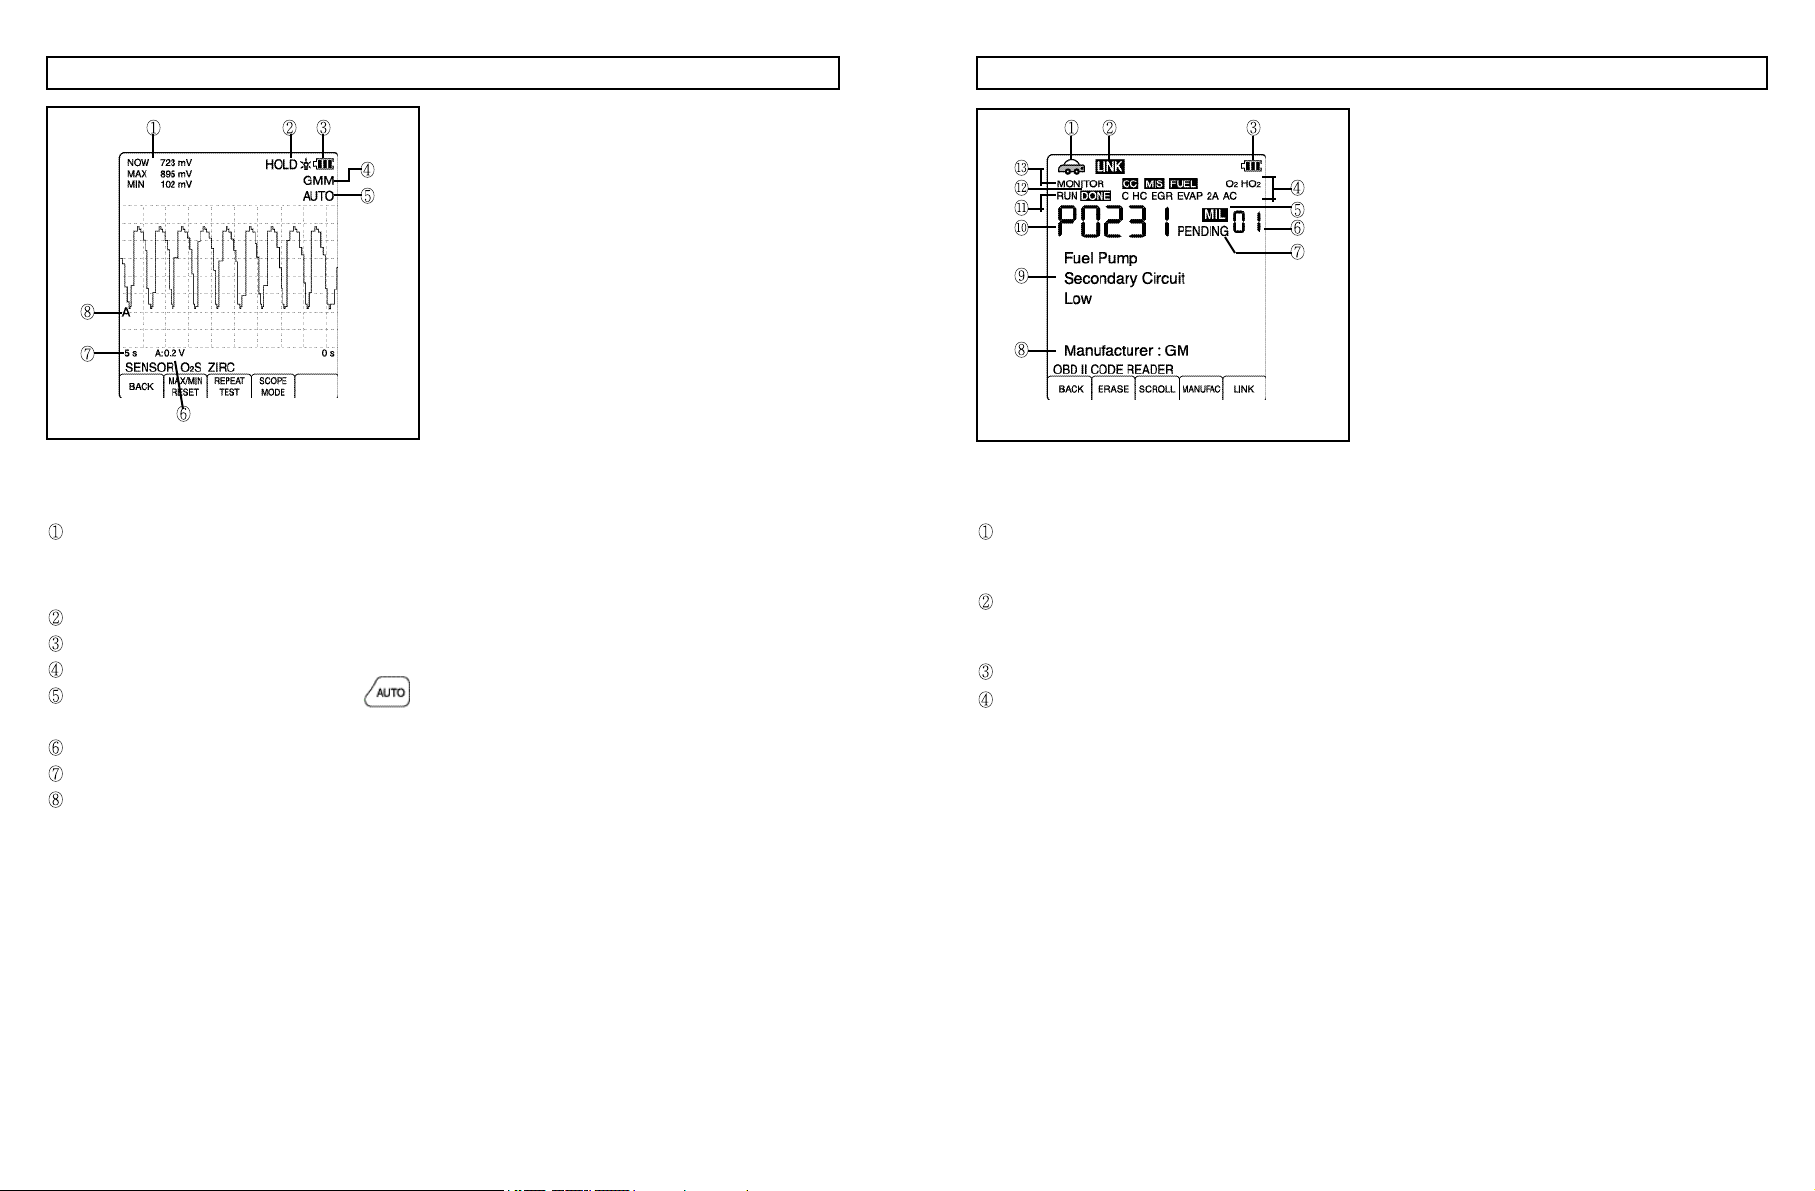
Figure 10. GMM Mode Indicators
Indicate meter measurement functions.
NOW: Most recent meter reading.
MAX: Maximum value since last reset.
MIN: Minimum value since last reset.
Indicate HOLD function enabled.
Low battery indicator.
Indicate GMM mode.
Indicate AUTORANGING mode. Pressing sets automatic ranging on. Using the Four Way arrow keys for
ranging turns automatic ranging off and extinguishes AUTO.
Indicate voltage per division.
Indicate time per display.
Indicate signal source channel.
4-16
OBD II Code Reader mode is designed t o ret rieve the
Diagnost ic Tro u b le Code s (DTC’ s) f rom the ve h icle
Powertrain Co nt rol Mod ule (PC M) and t o provid e an
indication of I/M Readiness Monitor status.
This mode is useful to check what code may be causing
the malfunction indicator lamp (MIL) to light, or to verif y
that test results from the scope or GMM are reflecting the
same problem.
This als o wil l dis play t he re a diness status o f certa in
emissions test monitors.
Figure 11. OBD II Code Reader Mode Indicators
Vehicle icon - Indicates whether or not the instrument ( in the Code Reader mode) is being properly powered
through the vehicle ’s Data Link Connector (DLC). A visible icon indicates that the instrument is being powered
through the vehicle’s DLC connector.
Link icon - Indicates whether or not the instrument (in the Code Reader mode) is communicating (linked) with the
vehicle’s on-board computer. When visible, the instrument is communicating (linked) with the PCM. If the Link
icon is not visible, the instrument is not linked to the PCM.
Battery icon - Low battery indicator of the instrument.
Monitor icons - Indicates which Monitors a re sup ported by t he vehicle under t est, and whe ther or n ot t he
associated Monitor has run its diagnostic testing. When a Monitor icon is
Solid, it indicates that the associated
Monitor has completed it’s diagnostic te sting. When a Monitor icon is F l a s h i n g, it indicates that th e veh icle
supports the associated Monitor, but the Monitor has not yet run its diagnostic testing. On OBD II systems, a
maximum of eleven Monitors are utilized. Not all Monitors are supported by all vehicles.
When the instrument is linked to a vehicle, only the icons for Monitors that are supported by the vehicle under
test are visible on the display.
Following is a list of Monitor icons and their associated Monitors:
CC - Comprehensive Component Monitor
MIS - Misfire Monitor
FUEL -
Fuel System Monitor
O
2 - Oxygen Sensor Monitor
HO2 - Oxygen Sensor Heater Monitor
C - Catalyst Monitor
HC - Heated Catalyst Monitor
EGR - Exhaust Gas Recirculation (EGR) Monitor
EVAP - Evaporative System Monitor
2A - Secondary Air System Monitor
AC - Air Conditioning System Refrigerant (R-12) Monitor
4-17
MIL - Indicates the status of the Malfunction Indicator Lamp (MIL).
This icon is visible only when a DTC has commanded the MIL to illuminate on the vehicle’s dash.
Code Number Sequence - The instrument assigns a sequence number to each DTC that is present in the PCM ’s
memory, in a scending order, starting with “ 01”. This h elps keep track of the number of D TC’s present in the
PCM’s memory. C ode number “01” will always be the h ig hest priority code, and the code for which “Freeze
Frame” data has been stored.
Pending icon - Indicates if the currently displayed DTC is a Pending Code.
Vehicle M anufacturer Displa y Area - Displays the name of the vehicle manufa cturer, whose Manuf actu rer
Specific DTC Definition or Generic DTC Definition will be displayed along with the associated DTC, if a fault will
be detected. “Generic” or a manufacturer among GM, Ford, Chrysler, Toyota, and Honda can be selected by the
key.
DTC Definition Display Area - Displays the DTC Definition per the currently displayed DTC.
DTC Display Area - Displays the Diagnostic Trouble Code (DTC) number.
Each particular fault is assigned a Code Number that is specific to that fault.
RUN - Indicates the Monitor RUN status of all the Monitors that apply to the vehicle under test.
DONE - When visible, indicates that all the Monitors that apply to the vehicle under test have run and completed
their Diagnostic Testing, DONE is visible only when all supported Monitors have completed their testing.
MONITOR - Identifies the Monitor icon area.
NOTE: Items 11 t hrough 13 are associated with I/M Readiness Monitor Status. Some state s req uire that all
vehicle monitors have run and completed their diagnostic testing before a vehicles emissions test (smog check)
can be performed.
5. INSTRUMENT OPERATION
5.1 INSTRUMENT TEST MODES
From the MAIN MENU, you can choose 4 independent instrument test modes:
• COMPONENT TESTS
• SCOPE
• GRAPHING MULTIMETER
• OBD II CODE READER
The fastest way to set up the instrument to test most devices and circuits is to choose from one of the built in
COMPO NENT TESTS. These tests p rese t th e inst rument to eit he r Sin gle or Dual In put S cop e mode. Most
instrument settings may be adjusted manually once you have chosen a Component Test, enabling you to fine tune
settings to get a better look at the sig nal. Cha nges yo u make t o settin gs specif ic to a Compon ent Test are
temporary, and are restored to their preset values each time another test is chosen. When configured for a specific
Component Test, the instrument displays the reference waveform and data as well as the name of the test on the
bottom display along with the Function Key Labels specific to the test chosen.
If you prefer total control over your instrument configuration , choose SCOPE test mode from the MAIN MENU.
Settings for SCOPE are separately preserved and restored each time you choose SCOPE from the MAIN MENU.
Th es e settings are not affected when yo u choose a Compon ent Test. This is also true f or t he G
MULTIMETER test mode, so in effect they are “custom” setups.
RAP HING
5.2 SCOPE DISPLAYS
4-18
Using Single and Dual Input Scope Mode
The instrument can be configured to show scope displays for either CH A or CH B signals: In DUAL INPUT SCOPE
mode, both CH A and CH B may be displayed at the same time.
Use SINGLE INPUT SCOPE mode if you want to measure a single signal, INPUT B is turned off.
Use DUAL INPUT SCOPE mode if you want to simultaneously measure two signals.
SCOPE
5-1
Function keys and Result Screen
Figure 12. Scope Display
SCOPE displays are defaulted in “Glitch Detection” mode. This means that all signals are sampled at the full sample
rat e of the inst rument and the minimum and maximum excu rsions are always shown on the d isplay, even if the
horizontal time setting is too slow to show each individual sample interval. In this mode, every noise spike of 40 ns
and wider will be displayed.
INPUT A Control Functions
When you are in SCOPE, you can control the INPUT A functions as follows:
SCOPE
INPUT INPUT SINGLE KEYS
A B SHOT
TRIGGER
MOVE A
SCOPE INPUT A
BACK
COUPLING
INVERT KEYS
D C OFF MOVE A
Automatic ranging and signal tracking is on.
Pressing sets automatic ranging and signal tracking on and off.
AUTO is displayed when auto ranging is active. Manually selecting the range will cause the AUTO indication to
turn off.
Trigger level voltage of INPUT A.
Time base range.
Trigger icon. Indicates trigger slope ( indicated negative slope).
Auto triggered.
INPUT A range setting.
INPUT B range setting.
Indicates signal source channel A.
INPUT A zero level.
Indicates trigger location.
Indicates signal source channel B.
INPUT B zero level.
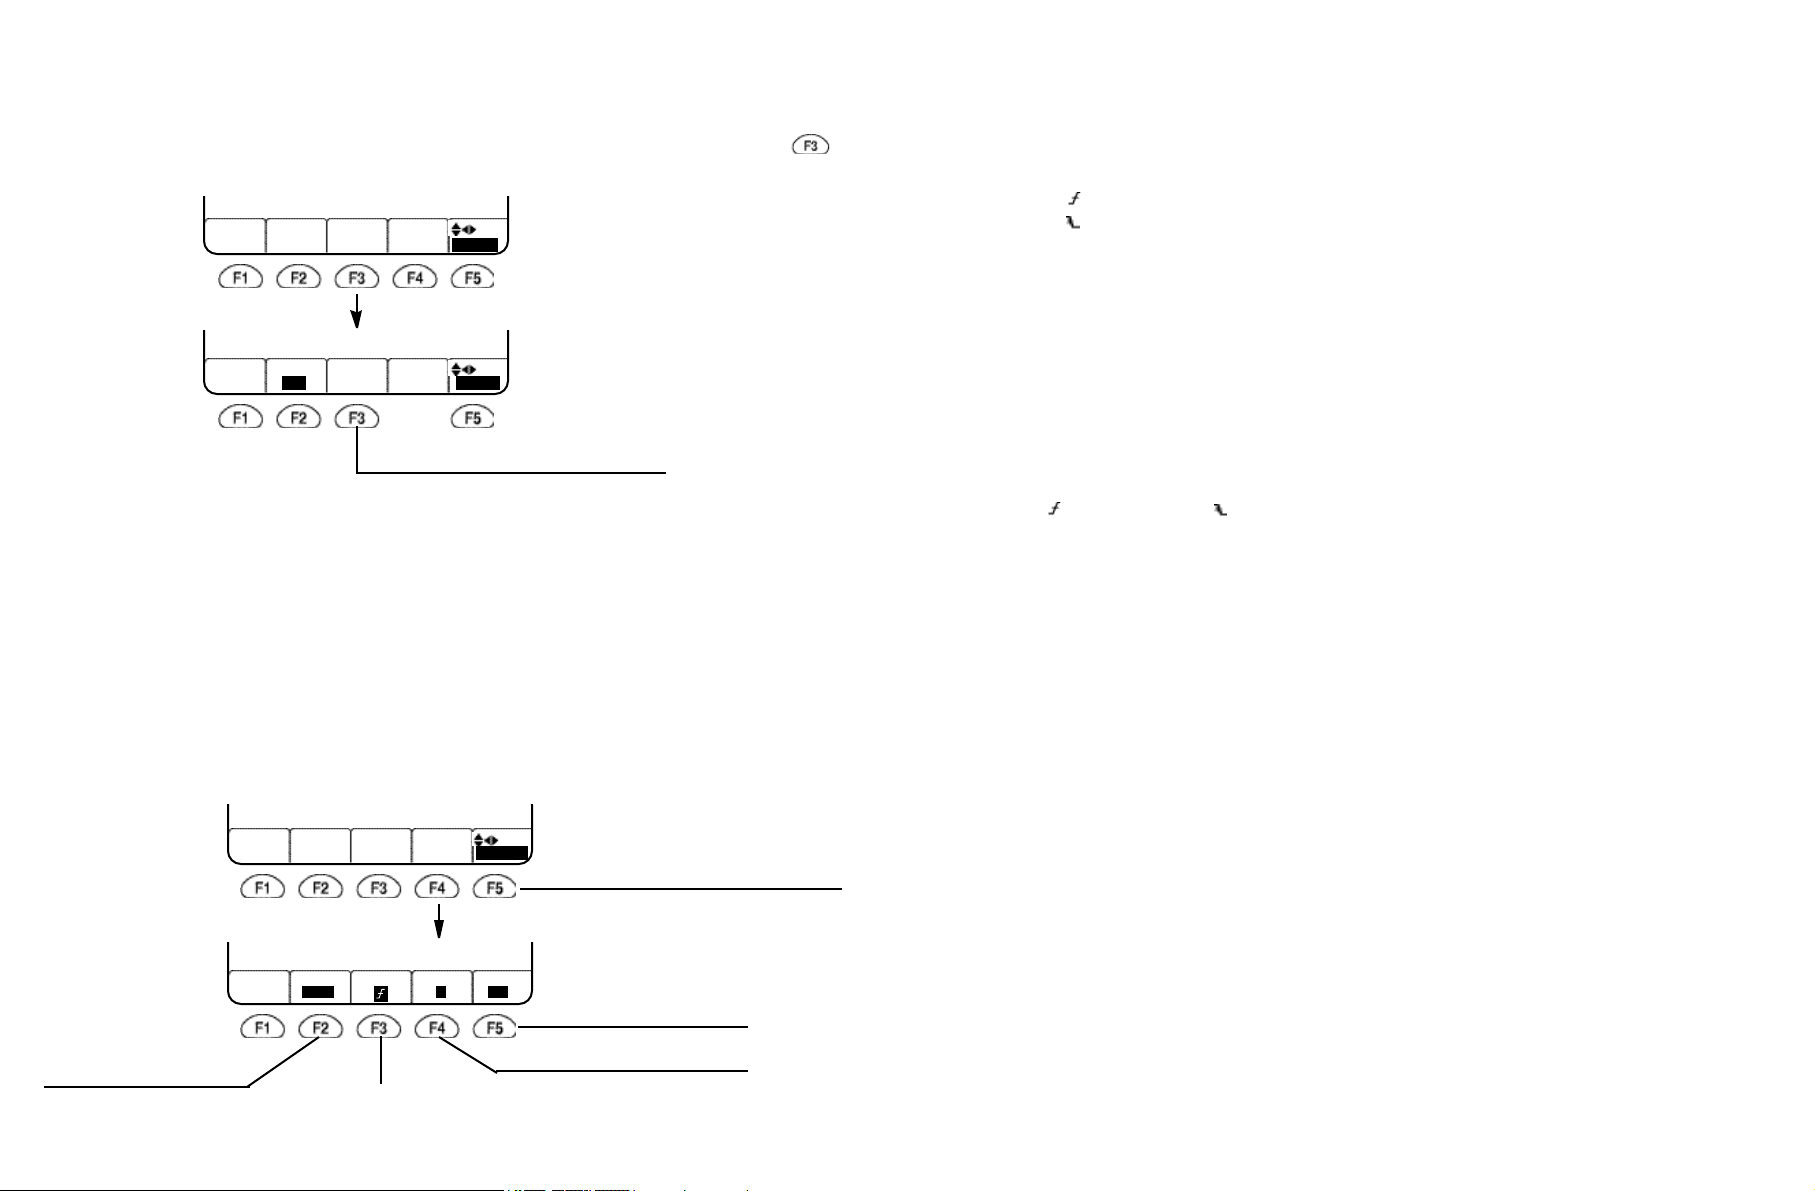
Making an Easy Setup
When you enter th e scope mode, the instrument automatically optimizes vertical r ange, time base, and t rigger
settings to create a stable display. (Autoranging is default)
When you press one of the Voltage and Time control keys, the instrument switches to manual control of range
and trigger settings.
Press to toggle between automatic and manual control of range and trigger settings. Use this key if you
cannot get a stable display using manual control.
Press t o return to the
previous menu.
Press to invert the INPUT A
signal waveform.
Press to select DC, AC or GROUND coupling.
DC Coupling allows you to measure and display both the DC and AC components of a signal. AC Coupling blocks
the DC component and passes the AC component only. GND grounds the input of the instrument internally.
INPUT B Control Functions
When you are in SCOPE, you can control the INPUT B functions as follows:
SCOPE
INPUT INPUT SINGLE KEYS
A B SHOT MOVE A
TRIGGER
SCOPE INPUT B
DISPLAY COUPLING INVERT KEYS
BACK
OFF D C OFF MOVE B
Press to invert the INPUT B
Press to turn INPUT B on or off.
signal waveform.
Press to select DC, AC, or GROUND coupling.
When you entered SINGLE DISPLAY, INPUT B is turned off by default, but you can turn it on by pressing F2.
5-2
5-3
Single-Shot Function
Normally the sco pe m od e automa tically repeats t he measure ments t o a cquire wave form s by th e recu rrent
acquisition mode.
SINGLE-SHOT allows you to perform single acquisition to snap events that occur only once. REPEAT TEST ( )
is used to start a next single acquisition.
SCOPE
INPUT INPUT SINGLE KEYS
A B SHOT MOVE A
TRIGGER
SCOPE SINGLE SHOT
BACK
SINGLE REPEAT KEYS
OFF TEST MOVE A
Press to repeat a single-shot acquisition.
AUTO versus NORMAL acquisitions
If you select AUTO, the instrument always performs acquisitions, i.e., it always displays the signals on the input. If
NORMAL is selected, a trigger is always needed to start an acquisition.
TRIGGER SLOPE
If you select , trigger occurs at a rising(positive) edge of the signal.
If you select , trigger occurs at a falling(negative) edge of the signal.
TRIGGER SOURCE
If you select TRIGGE R SOURCE A (default), a cq uisitio ns start when the signal on INPUT A fulf ills the selected
trigger conditions.
If you select TRIGGER SOURCE TRIG, the previous rule is valid for the signal on the TRIGGER input.
TRIGGER LEVEL
This function allows you to set the level that the signal must cross to trigger acquisitions.
Normally, after you enter SINGLE or DUAL INPUT SCOPE mode, the AUTO RANGE function automatically sets
and maintains an optimal trigger level as the signal changes.
Trigger Control Functions
TRIGGER is a set of conditions that determine whether and when acquisitions start. The following will determine the
trigger conditions:
• Select INPUT A or TRIGGER as the TRIGGER SOURCE input.
• Use AUTO or NORMAL acquisitions.
• Select trigger to occur on a positive or negative SLOPE of the signal.
• SET the trigger LEVEL.
If you change the trigger level, the AUTO RANGE function is turned off.
When you are in SCOPE, you can control the trigger functions as follows:
SCOPE
INPUT INPUT SINGLE KEYS
A B SHOT TRIG LVL
TRIGGER
Press to select the trigger level adjustment.
SCOPE TRIGGER
MODE SLOPE SOURCE COUPLING
BACK
AUTO A DC
Press to select DC or AC.
Press to select AUTO or
NORMAL acquisitions.
Press to select the trigger source.
Press to select the trigger slope.
5-4
Move the trigger level icon (or icon) to the desired level by using
¡ã and ¡å keys.
HORIZONTAL TRIGGER POSITION (HORIZ TRIG POS)
Y
ou can use the INSTRUMENT S ETUP menu to se t the H orizontal Tr igge r Position (Horiz Tr ig Po s) to t hree
different horizontal locations on the display, depending on whether you want to see conditions that led up to the
trigger event, or those following it.
• 10 % Trigger located close to left edge of display.
• 50 % Trigger located at center display.
• 90 % Trigger located close to right edge of display.
Use 10 % Trigger to show events which happen after the trigger.
Use 90 % Trigger to show events leading up to the trigger.
Noise Filter Function
There are cases where you may want to filter out noises in order to see a better signal. This can be especially true
when ignition noise is present. The instrument provide s a noise filter for e ach input ch annel which reduces the
bandwidth from it s norm al 5 MHz t o 2 KHz. Y ou can enable or d isable CH A Filter o r CH B Filter usin g t he
INSTRUMENT SETUP menu. When enabled, the FILTER indicator appears on the screen.
5-5
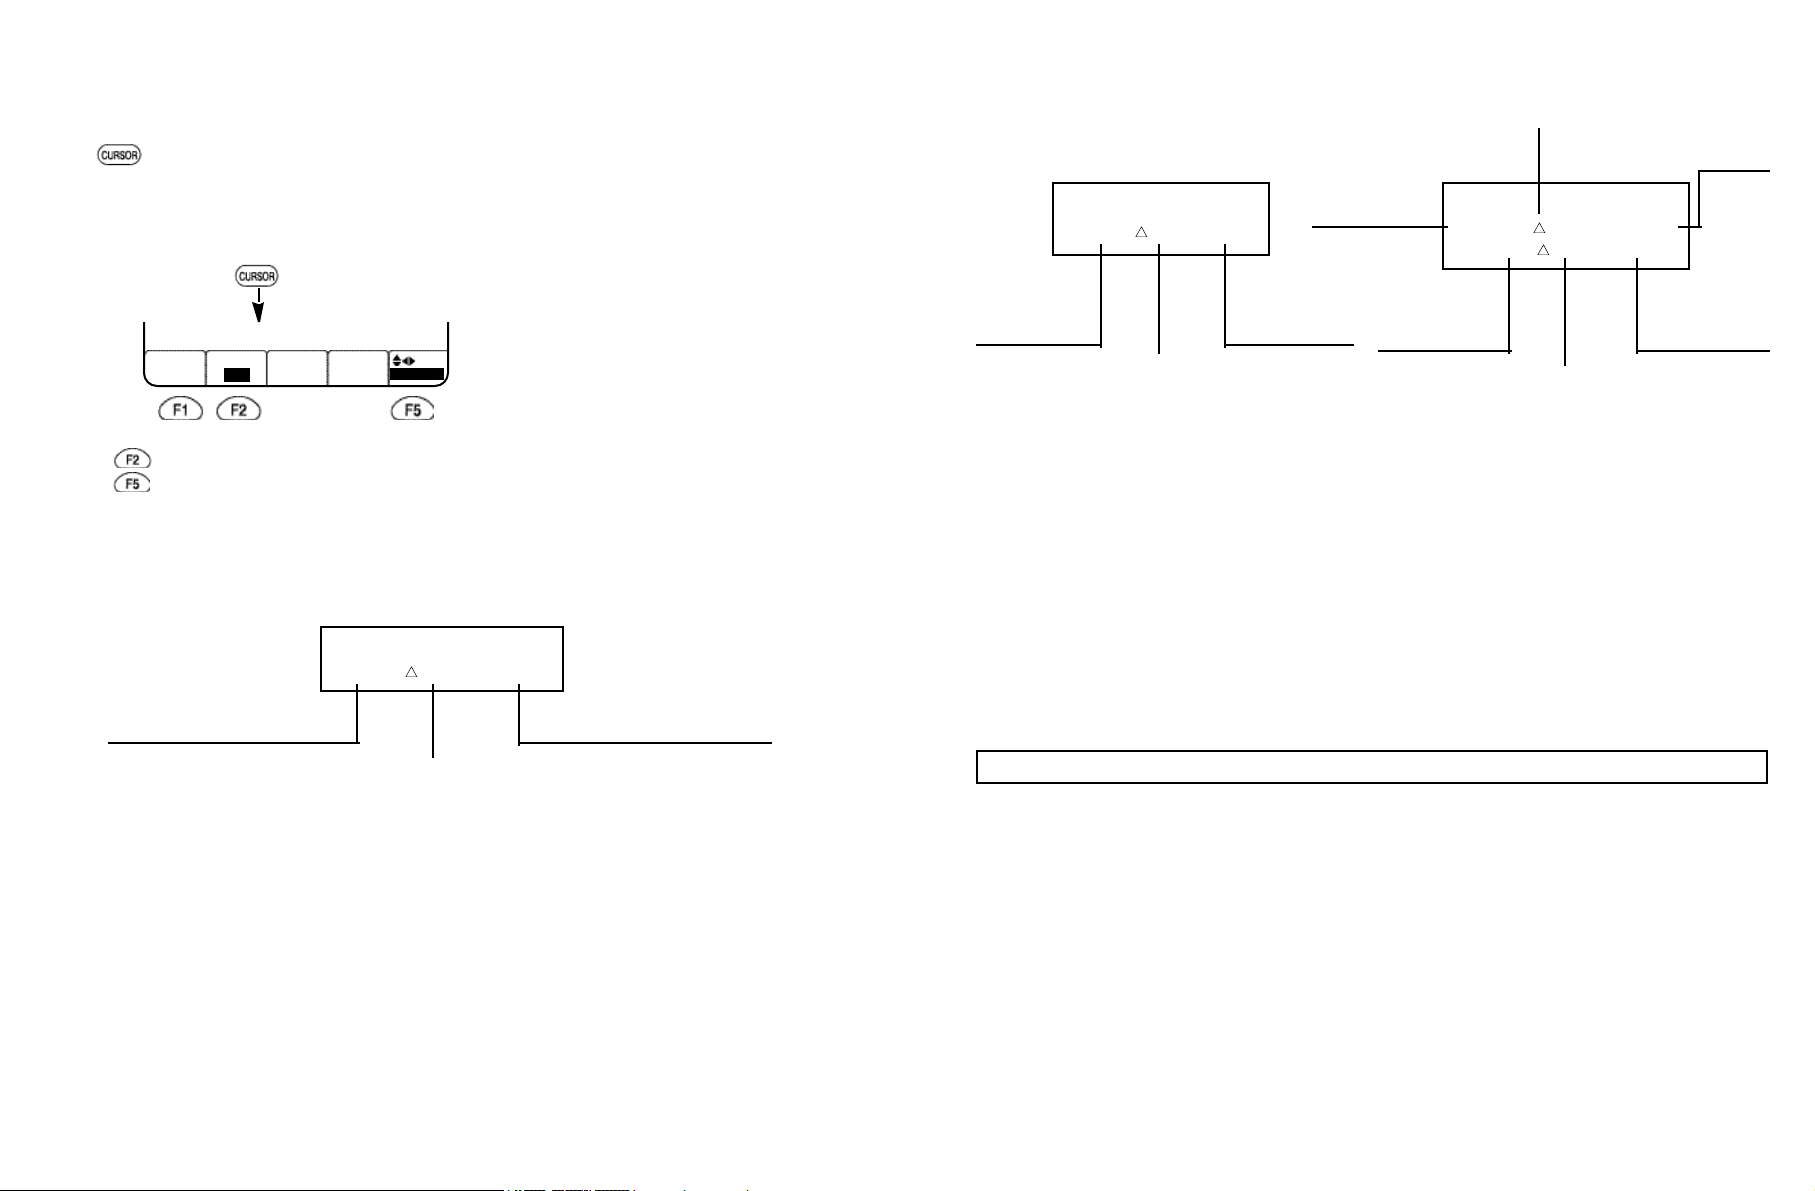
Cursor Key Function
A cursor is a vertical line or a horizontal line placed over the displayed waveform to measure values at certain points.
The instrument can measure signal details by using Cursors. This function is not possible for all tests.
Press to display the Function key Menu for cursor operation.
If cursor operation is not possible for the actual measurement, the instrument beeps to alert you.
Two cursors (vertical lines) appear on the display.
The left cursor is named CURSOR 1, the right CURSOR 2.
CURSORS
CURSOR KEYS
BACK
TIME CURSOR 1
For VOLTS CURSORS,
VOLTS 1 DELTA VOLTS 2
2.4 V 7.2 V 9.8 V
Sa mple v alu e a t
VOLTS CURSOR 1
p osi ti on on t he
waveform.
Volts difference between CURSOR 1
and CURSOR 2 positions.
Vo lts d if fe r en ce b etw een C URSO R 1 a nd
CURSOR 2 positions on the INPUT A waveform.
Sa mp l e v a lue at
CURSOR 1 position
on th e I NPUT A
waveform.
Sa mple va lue a t
VOLTS CURS O R
2 posit io n o n t he
waveform.
VOLTS 1 DELTA VOLTS 2
A: 130 mV 520 mV 650 mV
B: 24.0 mV 74 mV 98.0 mV
Sa mple value at
CURSOR 1 position
o n t he I NPUT B
waveform.
Volts difference between CURSOR 1
an d CUR SOR 2 pos it i on on t he
INPUT B waveform.
Sa mp l e v a lue at
CURSOR 2 position
on th e I NPUT A
waveform.
Sa mp l e v a lue at
CURSOR 2 position
on th e I NPUT B
waveform.
•
Press to set TIME cursor or VOLTS cursor or cursor OFF.
• Press to select the cursor you want to move (1 or 2).
• Use the Four Way arrow keys to move the cursors.
The top display shows readings related to values at the cursor positions.
For TIME cursors,
TIME 1 DELTA TIME 2
20.4 ms 48.1 ms 68.5 ms
Sample va lue at TIME CURSOR
1 position on the waveform(s).
Sample value at TIME CURSOR 2
position on the waveform(s).
Time difference between TIME CURSOR 1
and TIME CURSOR 2 positions.
Reading Test Results on the SCOPE (Component Tests only) Display
Mea surement results can be displayed as numeric values (referred to as readings) and w aveform. The t ypes of
readings depend on the test taking place.
For example, during a O 2S SENSOR (Zirc) test, MAXIMUM and MINIMUM values are displayed as readings and
during a DUAL O2 SENSOR test MAXIMUM and MINIMUM values of the signals from the oxygen sensor before and
after the catalytic converter are displayed as readings. During a DI SECONDARY test, SPARK VOLTAGE, RPM,
BURN TIME, and BURN VOLTAGE are displayed as readings.
The values you see on the display most often depend on the vehicle under test. Refer to the Service Manual of the
vehicle manufacturer.
In Chapter 6 “Automotive Diagnostics & Applications” you can find typical results of certain applications.
5.3 GMM DISPLAYS
The instrument performs cycle by cycle measurements of a variety of signal characteristics in Real Time and plots
them as t hey cha nge with tim e as a graph. The instru ment also performs certain o ther measu remen ts o n a
continuous basis, delivering the results for graphing 20 times per second. You can also plot the input signal directly
(as in SCOPE mode) by choosing LIVE.
The GMM display includes a meter reading showing the current value of the graphed parameter. This reading is an
average over many result values. In some cases, measurements are the maximum or minimum of a series of signal
values over the most recent 1 second interval.
Th e following tab le shows m easurements which can be plotted in GMM displays and the type o f graphing a nd
readout.
5-6
5-7
Code
DC VOLT
AC VOLT
AC+DC VOLT
OHM
DIODE
CONTINUITY
RPM
FREQUENCY
DUTY CYCLE
PULSE WIDTH
DWELL
IGNITION PEAK VOLTS
IGNITION BURN VOLTS
IGNITION BURN TIME
INJECTOR PEAK VOLTS
INJECTOR ON TIME
TEMPERATURE
LIVE
Measurement
DC Average
AC Average
AC+DC Average
Ohms
Diode drop
Continuity
RPM
Frequency
Duty Cycle
Pulse Width
Dwell
Ignition Peak Volts
Ignition Burn Volts
Ignition Burn Time
Injector Peak Volts
Injector On Time
Temperature °C, °F
Live
Graphing Type
Continuous
Continuous
Continuous
Continuous
Continuous
Continuous
Cycle by Cycle
Cycle by Cycle
Cycle by Cycle
Cycle by Cycle
Cycle by Cycle
Cycle by Cycle
Cycle by Cycle
Cycle by Cycle
Cycle by Cycle
Cycle by Cycle
Continuous
Direct input samples
Using Graphing Multimeter (GMM)
MAIN MENU
COMPONENT TESTS
SCOPE
GRAPHING MULTIMETER
OBD II CODE READER
VEHICLE DATA
INSTRUMENT SETUP
GRAPHING MULTIMETER MENU
VOLT DC, AC
OHM / DIODE / CONTINUITY
RPM
FREQUENCY
DUTY CYCLE
PULSE WIDTH
DWELL
IGNITION PEAK VOLTS
IGNITION BURN VOLTS
IGNITION BURN TIME
INJECTOR PEAK VOLTS
INJECTOR ON TIME
AMP DC, AC
TEMPERATURE °C, °F
LIVE
Making Connections
INPUT A is used for all GMM tests except the RPM measurement. The probes and test leads to be used depend on
the type of test performed. When you select certain GMM tests, a connection help screen will guide you by pressing
. This tells you which probe or test lead to use and where to connect it.
Vertical and Horizontal Scaling
Figure 13. Changing Vertical and Horizontal Ranges
The vertical and horizontal ranges in GMM displays are manually adjustable by using the Four Way arrow keys.
The vertical ranges available in GMM displays vary with the measurement being graphed, and generally cover the
possible output range of the measurement.
The time ranges available for GMM displays range from 5 sec. to 24 hrs. per display.
Auto-Power-Off will not occur du ring the GMM mode, b ut t o graph for periods of 5 min a nd longer, operate the
instrument from external power because operating endurance on internal power is limited to about 4 hours with fresh
batteries.
5-8
Function Key Labels for Each Test
Testing Volt DC, AC
GMM VOLT
Press to measure DC
DC AC AC+DC
MAX/MIN REPEAT
RESET TEST
voltage.
Press to measure AC
true rms voltage.
Press to reset maximum
and minimum.
Press to measure AC+DC true rms voltage.
You can stop graphing by pressing HOLD key on the instrument.
Press to start plotting a new
graph as new samples are
acquired.
5-9
Testing Resistance, Diode, and Continuity
Use this menu option to test resistance, diode forward voltage, and the continuity of wiring and connections. Connect
the test lead tip and test lead ground across the object to be tested.
GMM OHM
Press to measure
OHM
CONTINUTY
OPEN CLOSE
resistance.
Press to test diodes.
Press to test continuity of wiring and
connections.
If you select OPEN, the instrument beeps
when the tested connection is open.
If you select CLOSE, it beeps when the
tested connection is closed.
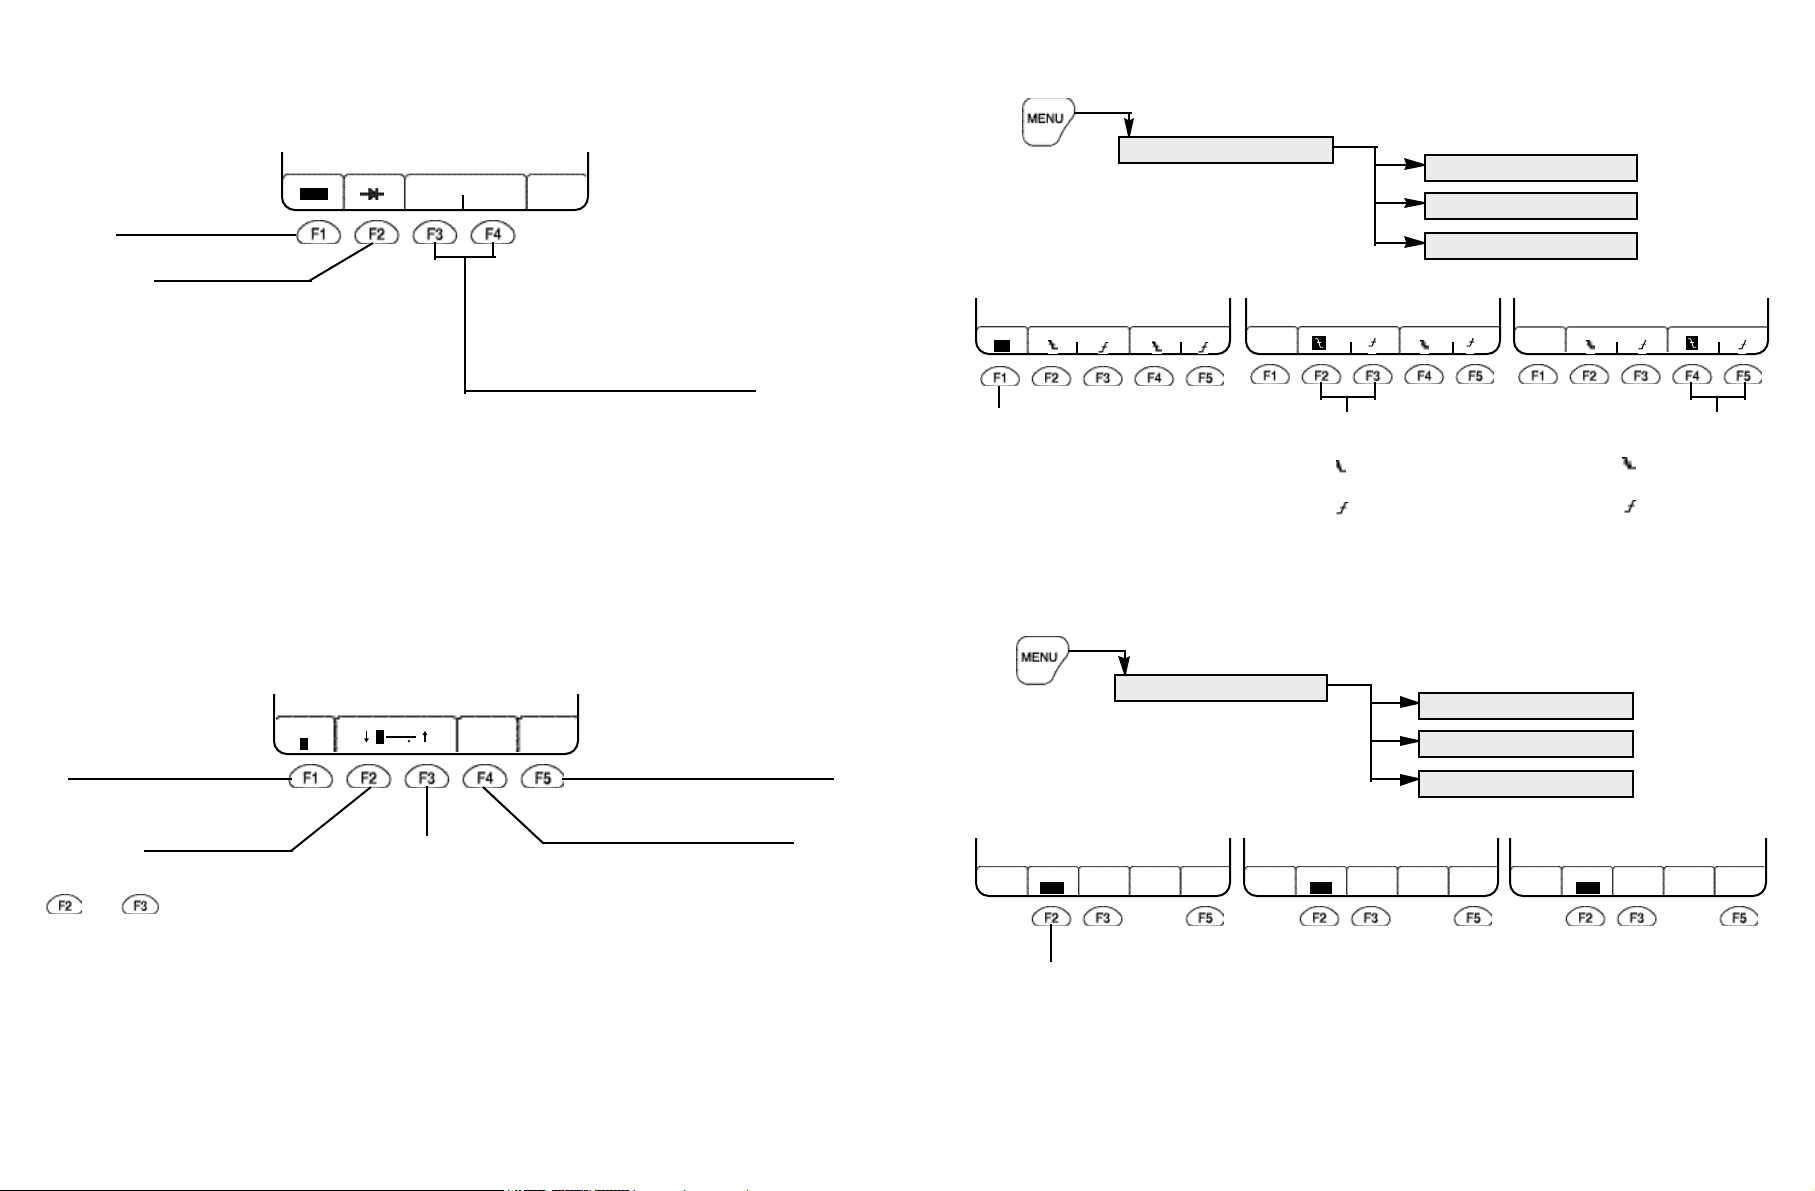
Testing Frequency, Duty Cycle, or Pulse Width
GRAPHING MULTIMETER
GMM FREQUENCY
Hz
% ms
GMM DUTY CYCLE
Hz
% ms
FREQUENCY
DUTY CYCLE
PULSE WIDTH
GMM PULSE WIDTH
Hz
% ms
OFL is displayed when the resistance is outside the instrument ’s maximum range. This occurs when the resistance
of the sensor is too high or the connection to the sensor is interrupted or open.
To test a diode, the instrument sends a small current through the diode to test the voltage across it. Depending on
the type of diode, this voltage should be in the range from 300 to 600 mV. A diode that has an internal short will
display about 0 V. OFL
is displayed when the diode is defective or when it is connected in reverse. If you are not
certain about the polarity of the diode, try the reverse connection. If this also displays OFL , the diode is defective. A
good diode must display OFL when connected in reverse.
Measuring RPM
The instrument automatically scales and displays the waveform on the screen. Connect the Inductive Pickup to the
COM/TRIGGER input terminals and clamp the pickup probe on the spark plug wire close to the spark plug.
GMM RPM
Press to adjust the built-in
4 step trigger levels.
Default is Level 2.
RPM TRIG n DEFAULT REPEAT
2 720 SETUP TEST
1
Press to start plotting a new graph
as new samples are acquired.
Press to restore the d efault value
Press to decrease.
Press to increase.
settings stored in VEHICLE DATA.
and keys are used to set the number of Spark Signal Pulses to the instrument per 720 (two crank shaft
revolutions). n = 1, 2, 3, 4, 5, 6, 8, 10, or 12
Press to test the signal
frequency in Hz.
P ress t o test the dut y cycle of the
signal.
If you select , the duty cycle of the
negative-going pulse is displayed.
If you select , the duty cycle of the
positive-going pulse is displayed.
Testing Secondary Ignition Peak Volts, Burn Volts, and Burn Time
GRAPHING MULTIMETER
IGNITION PEAK VOLTS
IGNITION BURN VOLTS
IGNITION BURN TIME
GMM IGNITION PEAK VOLTS
INVERT REPEAT MAX/MIN
OFF TEST RESET
GMM IGNITION BURN VOLTS
INVERT REPEAT MAX/MIN
OFF TEST RESET
P ress t o inver t th e displaye d ignition
waveform.
Press to test the pulse width of the
signal.
If you select , th e w idth o f th e
negative-going pulse is displayed.
If you select , th e w idth o f th e
positive-going pulse is displayed.
GMM IGNITION BURN TIME
INVERT REPEAT MAX/MIN
OFF TEST RESET
5-10
5-11
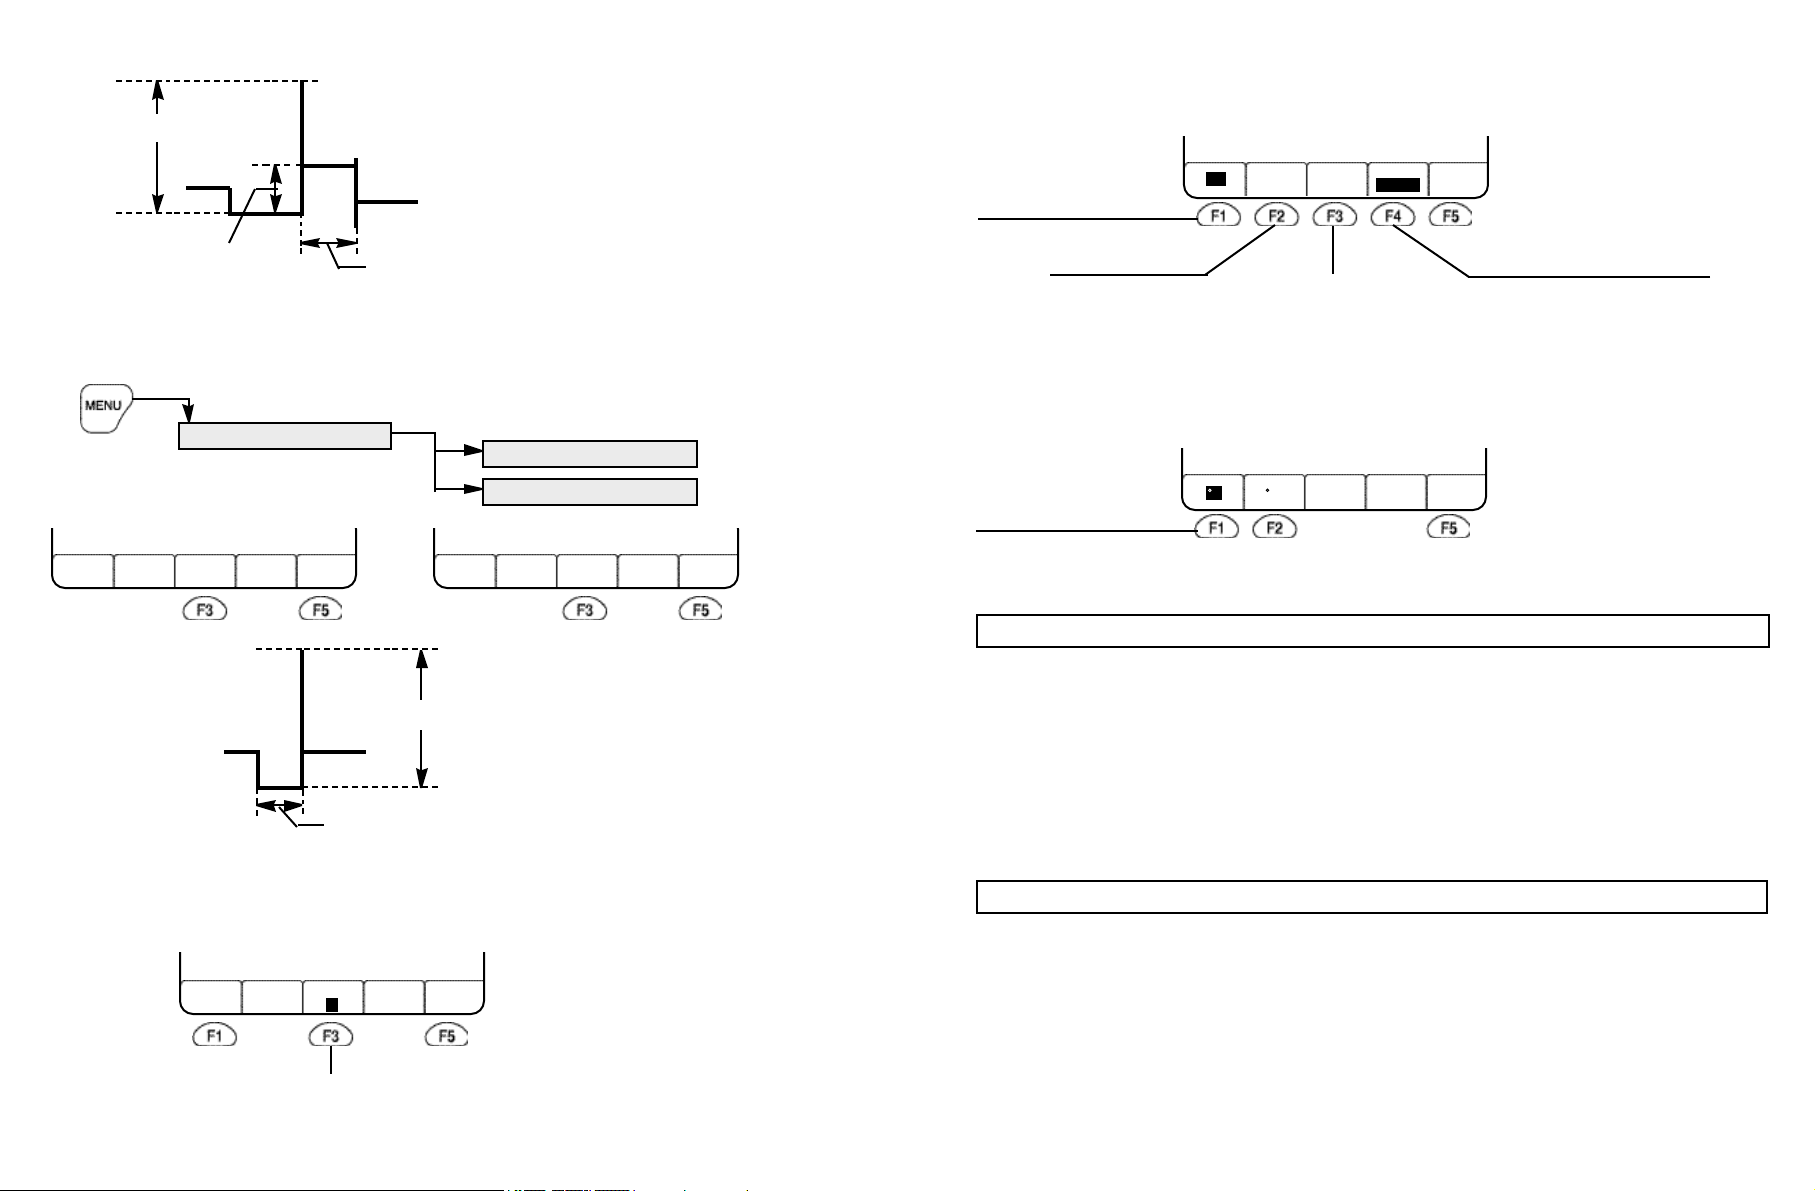
SINGLE cylinder waveform
SPARK VOLTAGE
BURN VOLTAGE
BURN TIME
Testing Current
Use this menu option to test current with a current probe. (optional accessory)
GMM AMPERES
DC AC AC+DC
RANGE REPEAT
10 mV/A TEST
Press to measure DC current.
P re ss to m e a su re
AC true rms current.
Press to select between
10 mV/A, and 100 mV/A.
Press to measure AC+DC
true rms current.
Testing Injector Peak Volts and On Time
GRAPHING MULTIMETER
INJECTOR PEAK VOLTS
INJECTOR ON TIME
GMM INJECTOR PEAK VOLTS
REPEAT MAX/MIN
TEST RESET
GMM INJECTOR ON TIME
REPEAT MAX/MIN
TEST RESET
PEAK VOLTS
INJECTION PULSE WIDTH (ON TIME)
Testing Dwell
The test is done with the shielded test lead on INPUT A connected to the primary side of the ignition coil.
GMM DWELL
VEHICLE DWELL MAX/MIN
DATA % RESET
Don’t forget to set the Current Probe to zero before using it for measurements.
Testing Temperature
Use this menu option to test temperature with a temperature probe. (optional accessory)
P ress to se lec t b et w ee n
measuring degrees Celsius
GMM TEMPERATURE
C F
REPEAT
TEST
and degrees Fahrenheit.
5.4 DUAL INPUT SCOPE OPERATION
Dual Input Scope
Use the scope function if you want to simultaneously m easure two w aveforms - one on INPUT A and th e other on
INPUT B.
Using Single and Dual Input Scope
Use SINGLE INPUT SCOPE if you want to use a single signal, INPUT B is turned off.
Use DUAL INPUT SCOPE if you want to simultaneously measure two signals.
5.5 CHANGING THE VEHICLE DATA & INSTRUMENT SETUP
There are two groups of setups in the Main Menu.
VEHICLE DATA : Use this menu option to enter the correct vehicle data, such as the number of cylinders or cycles
on the vehicle under test.
5-12
Press to select b etween rea dings in % ,
degrees ( ) crankshaft rotation, or in ms.
5-13
 Loading...