

Page 1
User’s Manual
UTS1000B/T Series Spectrum Analyzer
Page 2

User’s Manual UTS1000B/T Series
Preface
Thank you for purchasing this brand new product. In order to use this product safely and correctly, please read
this manual thoroughly, especially the safety notes.
After reading this manual, it is recommended to keep the manual at an easily accessible place, preferably close
to the device, for future reference.
Copyright Information
Copyright is owned by Uni-Trend Technology (China) Co., Ltd.
UNI-T products are protected by patent rights in China and other countries, including issued and pending
patents. Uni-Trend reserves the rights to any product specification and pricing changes.
Uni-Trend Technology (China) Co., Ltd. all rights reserved. Trend reserves all rights. Information in this
manual supersedes all previously published versions. No part of this manual may be copied, extracted or
translated by any means without the prior permission of Uni-Trend.
UNI-T is the registered trademark of Uni-Trend Technology (China) Co., Ltd.
Instruments.uni-trend.com 2 / 76
Page 3

User’s Manual UTS1000B/T Series
Warranty Service
The instrument has a warranty period of one year from the date of purchase. If the original purchaser sells or
transfers the product to a third party within one year from the date of purchase of the product, the warranty
period of one year shall be from the date of the original purchase from UNI-T or an authorized UNl-T distributor.
Accessories and fuses, etc. are not included in this warranty.
If the product is proved to be defective within the warranty period, UNI-T reserves the rights to either repair the
defective product without charging of parts and labor, or exchange the defected product to a working equivalent
product (determined by UNI-T). Replacement parts, modules and products may be brand new, or perform at the
same specifications as brand new products. All original parts, modules, or products which were defective
become the property of UNI-T.
The "customer" refers to the individual or entity that is declared in the guarantee. In order to obtain the warranty
service, “customer “must inform the defects within the applicable warranty period to UNI-T, and perform
appropriate arrangements for the warranty service.
The customer shall be responsible for packing and shipping the defective products to the individual or entity that
is declared in the guarantee. In order obtain the warranty service, customer must inform the defects within the
applicable warranty period to UNI-T, and perform appropriate arrangements for the warranty service. The
customer shall be responsible for packing and shipping the defective products to the designated maintenance
center of UNI-T, pay the shipping cost, and provide a copy of the purchase receipt of the original purchaser. If
the products is shipped domestically to the purchase receipt of the original purchaser. If the product is shipped
to the location of the UNI-T service center, UNI-T shall pay the return shipping fee. If the product is sent to any
other location, the customer shall be responsible for all shipping, duties, taxes, and any other expenses.
The warranty is inapplicable to any defects, failures or damages caused by accident, normal wear of components,
use beyond specified scope or improper use of product, or improper or insufficient maintenance. UNI-T is not
obliged to provide the services below as prescribed by the warranty:
a) Repair damage caused by installation, repair or maintenance of personnel other than service
representatives of UNI-T;
b) Repair damage caused by improper use or connection to incompatible equipment;
c) Repair any damages or failures caused by using power source not provided by UNI-T;
d) Repair products that have been changed or integrated with other products (if such change or integration
increases time or difficulty of repair).
The warranty is formulated by UNI-T for this product, replacing any other express or implied warranties. UNI-T
and its distributors refuse to give any implied warranty for marketability or applicability for special purpose. For
violation of the warranty, repair or replacement of defective products is the only and all remedial measure UNI-T
provides for customers.
No matter whether UNI-T and its distributors are informed of any possible indirect, special, occasional or
inevitable damage in advance, they assume no responsibility for such damage.
Instruments.uni-trend.com 3 / 76
Page 4

User’s Manual UTS1000B/T Series
1. Overview
Overview of UTS1000B/T
Overview of Front Panel
User Interface
Overview of Rear Panel
This chapter is to introduce the main functions and features of UTS1000B/T spectrum analyzer, and brief
introduce the front and rear panel keys and symbols.
Instruments.uni-trend.com 4 / 76
Page 5

User’s Manual UTS1000B/T Series
Overview of UTS1000B/T
UTS1000B/T is a swept spectrum analyzer with frequency range of 9kHz to 3.2GHz. It can be used as the main
equipment to set up automatic control system. This instrument can also meet different test and application
needs in the functional/terminal/QA test systems required in the electronics manufacturing industry.
Main Function and Feature
The main functions and features of UTS1000B/T spectrum analyzer as follows:
High sensitivity measurement
Frequency range 9kHz-3.2GHz
Display average noise level lower to -161dBm/Hz
Phase noise lower to -98dBc/Hz(1 GHz,10 kHz offset)
Frequency range of tracking source 100 kHz~3.2 GHz
Accuracy of frequency meter reach to 1Hz
The minimum resolution bandwidth is 1Hz
Limiting value setup of Pass/fall, it can determine trace signal by pass/fall test
Four trace lines display in the same time
USB/LAN interface, remote control the instrument by SCPI command
10.1 inch 1280×800 high capacitance touch screen
Instruments.uni-trend.com 5 / 76
Page 6
User’s Manual UTS1000B/T Series
Overview of Front Panel
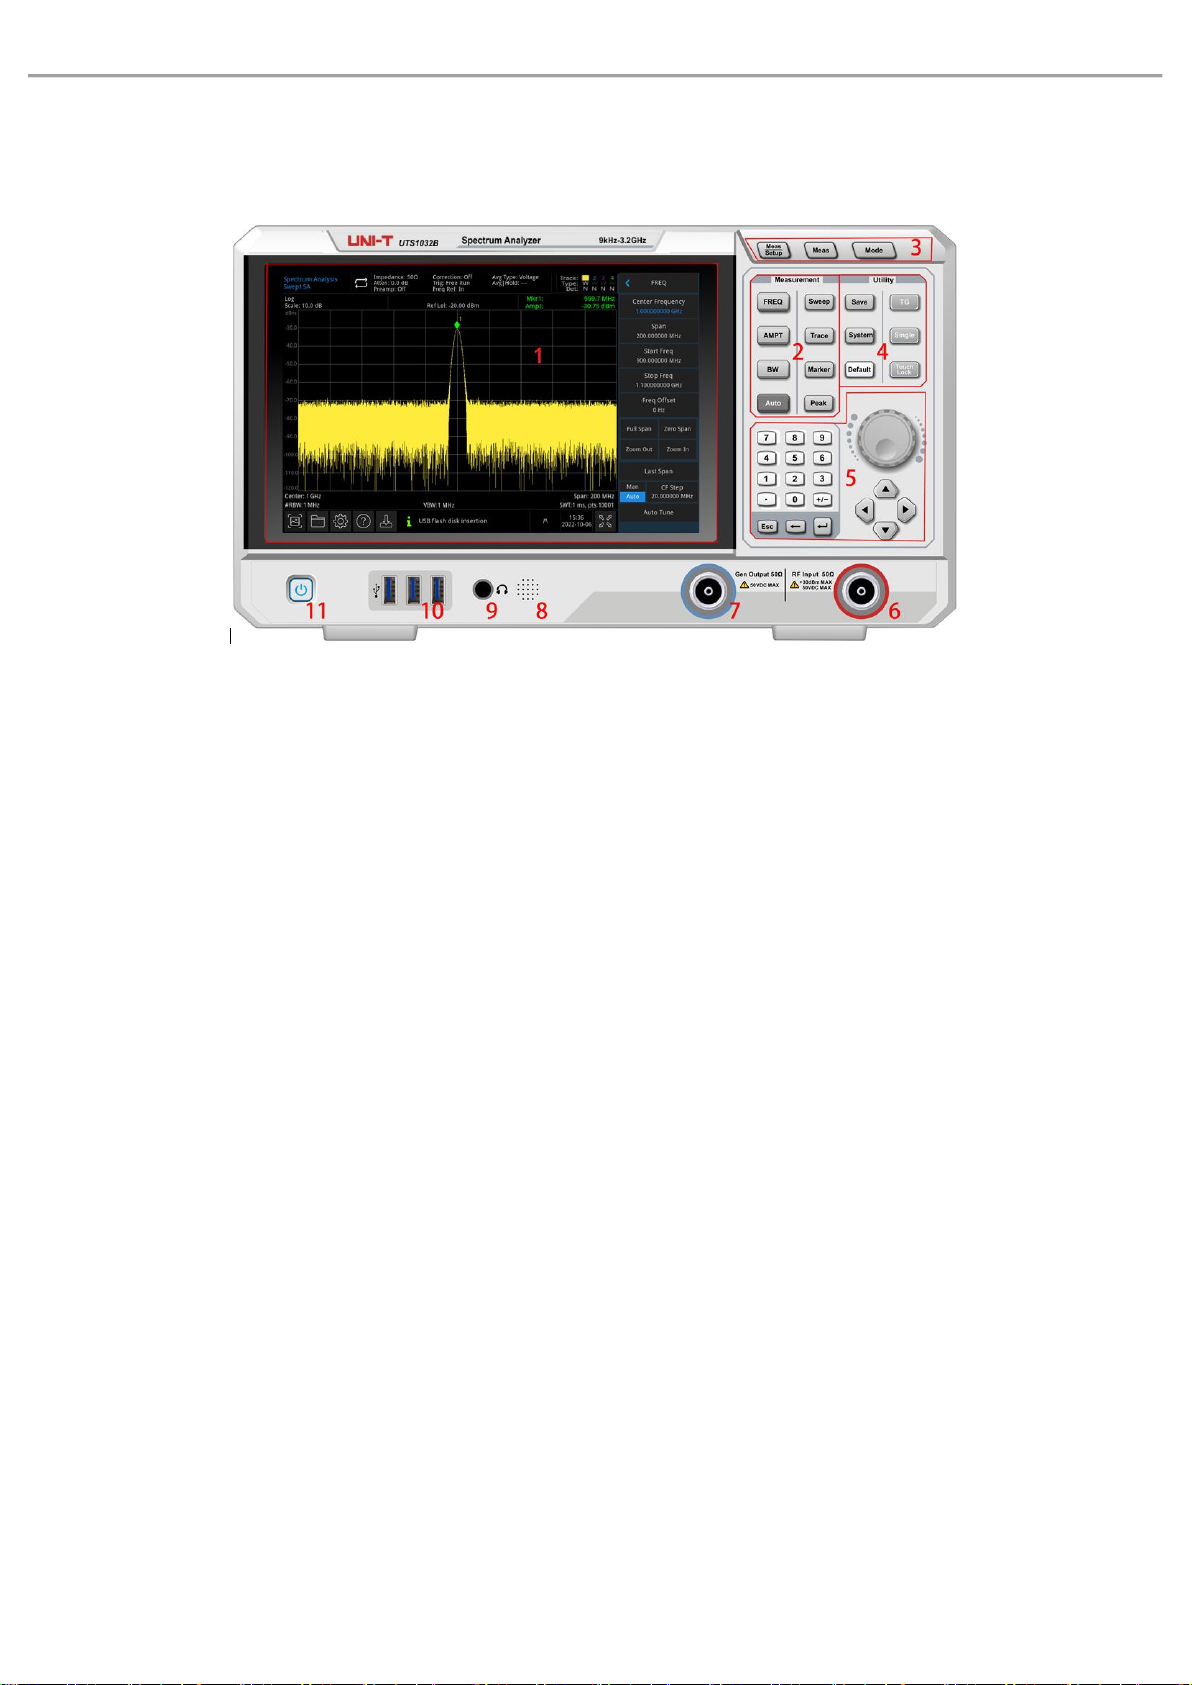
Figure 1-1 Front Panel
1. Display Screen: display area, touch screen.
2. Measurement: the main functions to active spectrum analyzer, including:
FREQ: press this key to enable center frequency function and enter the frequency setup menu
AMPT: press this key to enable reference level function and enter amplitude setup menu
BW: press this key to enable resolution bandwidth function and enter control bandwidth, visualize
proportions menu
Auto: searching signal automatically and place the signal at the center of the screen
Sweep: set up sweep time, select sweep, trigger and demodulation type
Trace: set up trace line, demodulation mode and trace line operation
Marker: this maker key is to select marked number, type, attribute, tag function, and list and to control
the display of these markers.
Peak: place a marker at the amplitude peak value of signal and control this marked point to perform its
function
3. Advanced Functional Key: to active the advanced measurement of spectrum analyzer, these function
includes:
Meas Setup: set average/hold time, average type, display line and limiting value
Meas: access to the menu of functions for measuring transmitter power, such as adjacent channel
power, occupied bandwidth, and harmonic distortion
Mode: advanced measurement
4. Utility Key: the main functions to active spectrum analyzer, including:
Instruments.uni-trend.com 6 / 76
Page 7
User’s Manual UTS1000B/T Series
Save: press this key to enter save interface, the types of files the instrument can save include state,
trace line + state, measurement data, limit, correction and export.
System: access to the system menu and set up the relevant parameters.
Default: press it to reset the setting to the default.
TG: the relevant setting of tracking source output terminal. Such as signal amplitude, amplitude
offset of tracking source. This key will light up when the trace source output is working.
Single: press this key to perform single sweep. press it again to change it to continuous sweep.
Touch/Lock: touch switch, press this key will indicate red light.
5. Data Controller: direction key, rotary knob and numeric key, to adjust the parameter, such as
center frequency, start frequency, resolution bandwidth and make position.
Note
Esc Key: If the instrument is in remote control mode, press this key to return to local mode.
6. RF input 50Ω: this port is used to connect the external input signal, the input impedance is 50Ω
(N-Female connector).
Warning
It is forbidden to load the input port with a signal that does not meet the rated value, and ensure that the
probe or other connected accessories are effectively grounded to avoid equipment damage or abnormal
function. RF IN port can only withstand an input signal power of no more than +30dBm or a DC voltage
input of 50V.
7. Gen Output 50Ω(Tracking Source): This N- Female connector is used to as the source output of the
built-in tracking generator. The input impedance is 50Ω.
Warning
It is forbidden to load input signals on the output port to avoid damage or abnormal function.
8. Loudspeaker: display analog demodulation signal and warning tone.
9. Headphone Jack: 3.5 mm.
10. USB Interface: to connect external USB, keyboard and mouse.
11. ON/OFF Switch: short press to active the spectrum analyzer. In on-state, short press ON/OFF switch will
change the state to standby mode, all function will also be off.
Instruments.uni-trend.com 7 / 76
Page 8
User’s Manual UTS1000B/T Series
User Interface
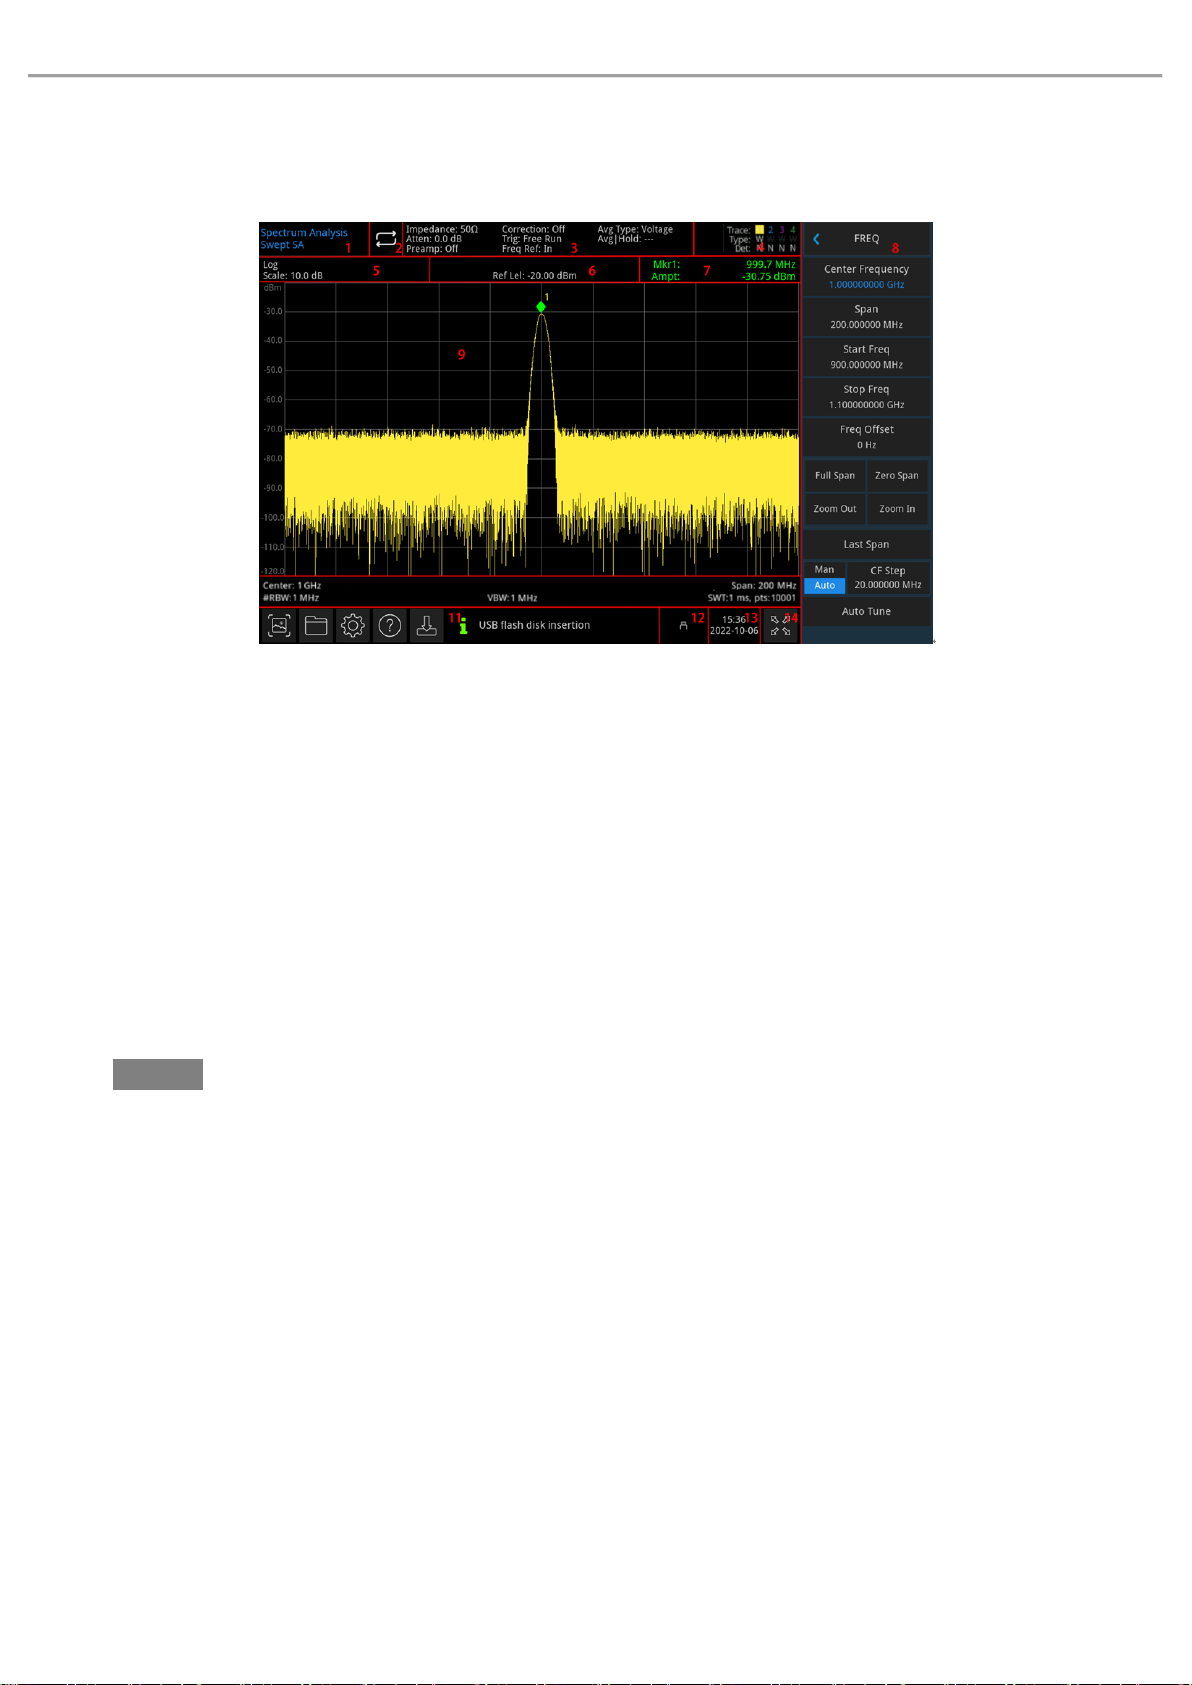
Figure 1-2 User Interface
1. Working mode: RF analysis, vector signal analysis, EMI, analog demodulation.
2. Sweep/Measuring: Single / continuous sweep, tap the screen symbol to quick step through the mode.
3. Measuring bar: Display the measurement information which includes input impedance, input
attenuation, presetting, correction, trigger type, reference frequency, average type, and average/hold.
Touch screen sign to quick switch these mode.
4. Trace Indicator: Display the trace line and detector message which includes number of trace line, trace
type and detector type.
Note
The first line is display the number of trace line, color of number and trace should be the same. The second
line is display the corresponding trace type which includes W (Clear/Write), A (Average), M (Max Hold), m (Min
Hold). The third line is display detector type which including S (sample), P (Peak), p (Negative), N (Normal), A
(Average), and f (trace operation). Detection types are displayed in white letters.
Tap screen sign to quick switch different modes, different letter presents different mode:
Letter in highlight white color, it presents the trace is being update;
Letter in grey color, it presents the trace is not update;
Letter in grey color with strikethrough, it presents the trace will not be update and display;
Letter in white color with strikethrough, it presents the trace is being update but no display; this
case is useful for trace mathematical operation.
Instruments.uni-trend.com 8 / 76
Page 9
User’s Manual UTS1000B/T Series
5. Display Scale: Scale value, scale type (logarithm, linear), scale value in linear mode cannot
change.
6. Reference Level: Reference level value, reference level offset value.
7. Result of Cursor Measurement: Display the current result of cursor measurement which is
frequency, amplitude. Display time in zero span mode.
8. Panel Menu: Menu and function of hard key, which includes frequency, amplitude, bandwidth, trace
and marker.
9. Lattice Display Area: Trace display, marker point, video triggering level, display line, threshold line,
cursor table, peak list.
10. Data display: Center Frequency value, span, start frequency, stop frequency, frequency offset, RBW,
VBW, sweep time and points.
11. Function Setting: quick screenshot, file system, setup system, help system and file storage .
Quick Screenshot : screenshot will save in the default file; if there has an external storage, it is
preferentially saved to external storage.
File System : user can use file system to save the correction, limiting value, measuring result,
screenshot, trace, state or other file into internal or external storage, and it can be recall.
System information : view the basic information and option.
Help System : Help guides.
File Storage : Import or export state, trace + state, measuring data, limiting value and correction.
System Log Dialog Box: Click blank space on the right of file storage to enter system log to check the
operation log, alarm and hint information.
12. Connection Type: Display connecting state of mouse, USB and screen lock.
13. Date and Time: Display the date and time.
14. Full Screen Switch: Open full screen display, the screen is stretched horizontally and the right
button is automatically hidden.
Instruments.uni-trend.com 9 / 76
Page 10
User’s Manual UTS1000B/T Series
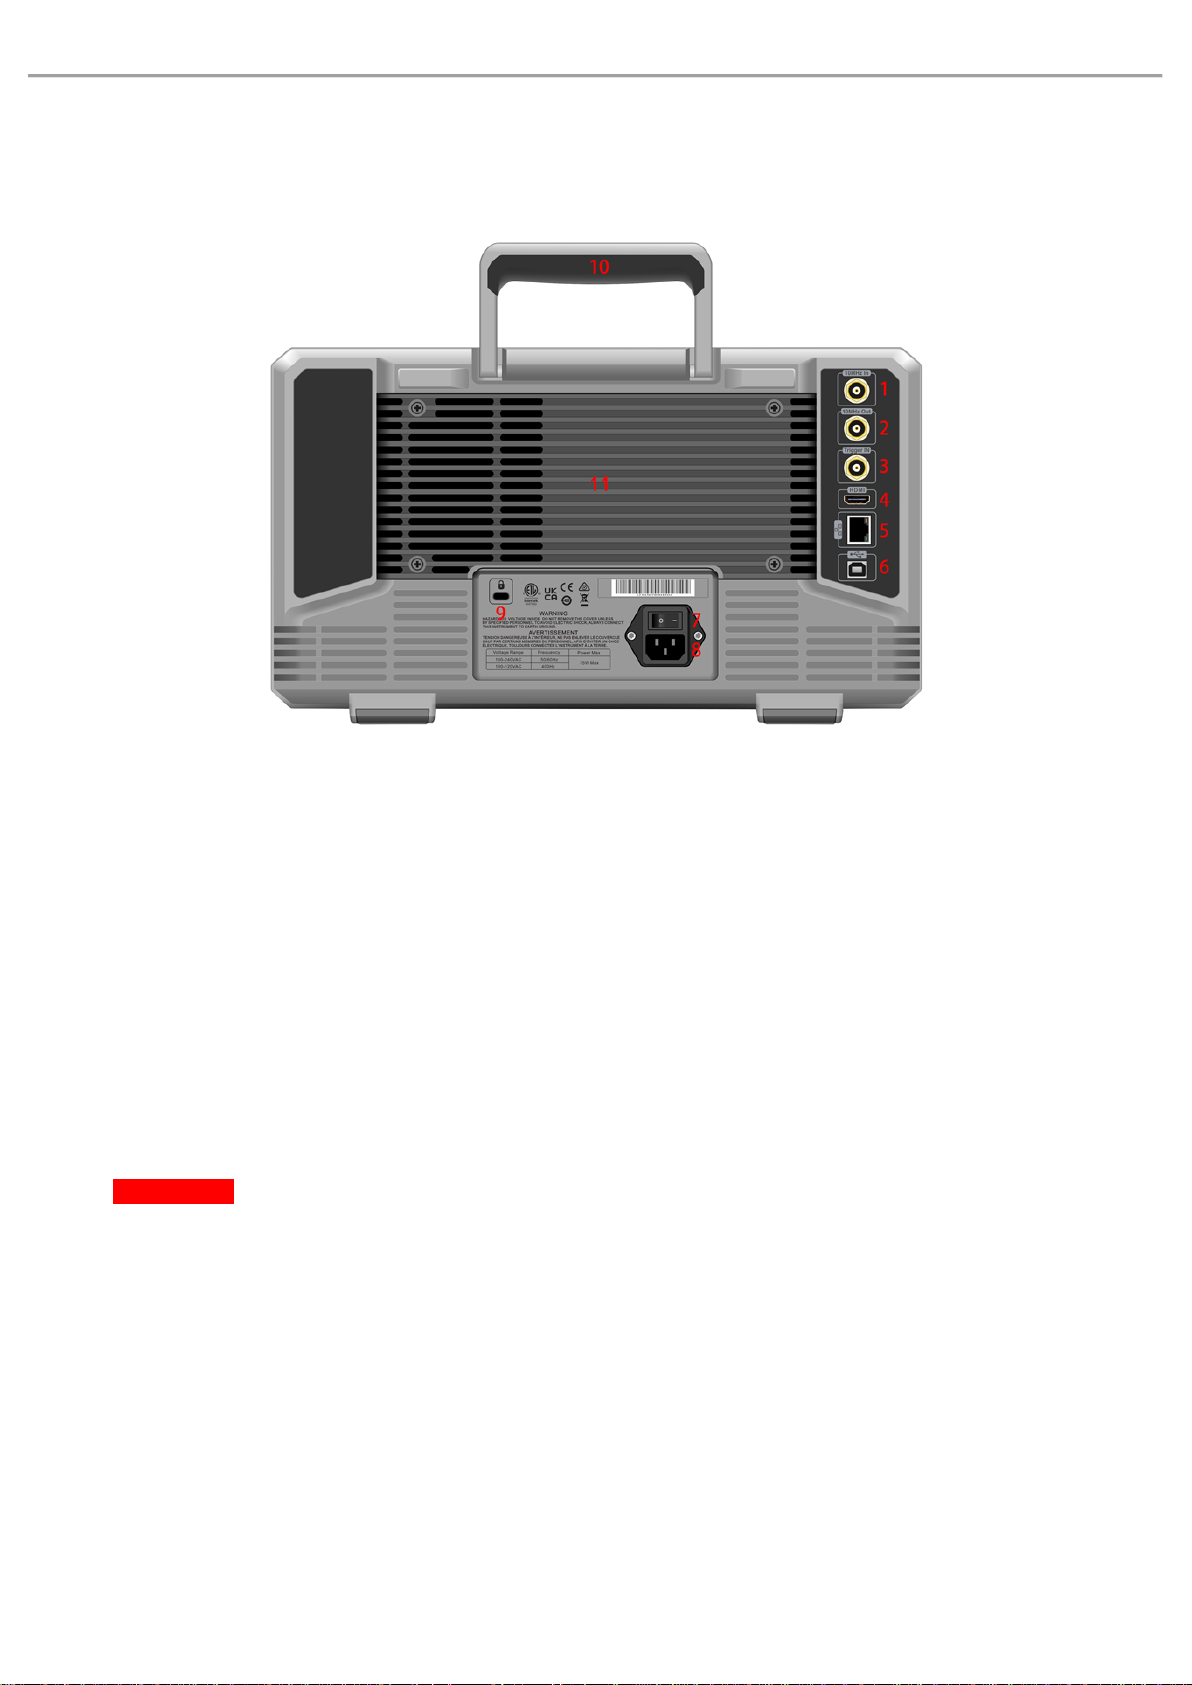
Overview of Rear Panel
Figure 1-3 Rear Panel
1. 10MHz Reference Input: Spectrum analyzer can use internal reference source or as an external
reference source.
If the instrument detects that the [REF IN 10MHz] connector is receiving a 10MHz clock signal from an
external source, the signal is automatically used as the external reference source. The user interface
status displays "Freq Ref: Ext". When the external reference source is lost, exceeded or not connected,
the instrument reference source is automatically switched to the internal reference and the
measuring bar on the screen will show "Freq Ref: In".
Warning
It is forbidden to load the input port with a signal that does not meet the rated value, and ensure that the
probe or other connected accessories are effectively grounded to avoid equipment damage or abnormal
function.
2. 10MHz Reference Output: Spectrum analyzer can use internal reference source or as an external
reference source.
If the instrument uses an internal reference source, [REF OUT 10 MHz] connector can output
Instruments.uni-trend.com 10 / 76
Page 11

User’s Manual UTS1000B/T Series
10MHz clock signal generated by the instrument’s internal reference source, w hich can be used
to synchronize other devices.
Warning
It is forbidden to load input signals on the output port to avoid damage or abnormal function.
3. Trigger IN: If spectrum analyzer uses an external trigger, the connector receives the rising of falling
edge of an external trigger signal. The external trigger signal is feed in spectrum analyzer by BNC cable.
Warning
It is forbidden to load the input port with a signal that does not meet the rated value, and ensure that the
probe or other connected accessories are effectively grounded to avoid equipment damage or abnormal
function.
4. HDMI Interface: HDMI video signal output interface.
5. LAN Interface: TCP/IP port for remote control connecting.
6. USB Device Interface: Spectrum analyzer can use this interface to connect a PC, which can
be remote control by the software on the computer.
7. Power Switch: AC power switch, when the switch is enabled, the spectrum analyzer enters
standby mode and the indicator on the front panel lights up.
8. Power Interface: Power input power.
9. Burglar-proof Lock: Protect the instrument away from thief.
10. Handle: Easy to move the spectrum analyzer.
11. Dustproof Cover: Take off dustproof cover and then to clean the dust.
Instruments.uni-trend.com 11 / 76
Page 12

User’s Manual UTS1000B/T Series
2. User Guide
Inspect Product and Packing List
Safety Instruction
Environmental Requirements
Connecting Power Supply
Electrostatic Protection
Preparation Work
Usage Tip
Touch Operation
Remote Control
Help Information
Operating Mode
This chapter is to introduce the safety instructions and basic information about the use of spectrum
analyzer.
Instruments.uni-trend.com 12 / 76
Page 13
User’s Manual UTS1000B/T Series
Warning
Please follow the following guidelines to avoid possible electric shock and risk to personal
safety.
Users must follow the following conventional safety precautions in operation, service and
maintenance of this device. UNI-T will not be liable for any personal safety and property loss
caused by the user’s failure to follow the following safety precautions. This device is designed
for professional users and responsible organizations for measurement purposes.
Do not use this device in any way not specified by the manufacturer. This device is only for
indoor use unless otherwise specified in the product manual.
Warning
“Warning” indicates the presence of a hazard. It reminds users to pay attention to a certain
operation process, operation method or similar. Personal injury or death may occur if the
rules in the “Warning” statement are not properly executed or observed. Do not proceed to
the next step until you fully understand and meet the conditions stated in the “Warning”
statement.
Caution
“Caution” indicates the presence of a hazard. It reminds users to pay attention to a certain
operation process, operation method or similar. Product damage or loss of important data
may occur if the rules in the “Caution” statement are not properly executed or observed. Do
not proceed to the next step until you fully understand and meet the conditions stated in the
“Caution” statement.
Note
“Note” indicates important information. It reminds users to pay attention to procedures,
methods and conditions, etc. The contents of the “Note” should be highlighted if necessary.
Inspect Product and Packing List
When you received the instrument, please inspect the packaging and packing list as follows,
Inspect whether the packaging box is broken or scratched caused by external force, and
further check whether the instrument appearance is damaged. If you have any questions
about the product or other problems, please contact with distributor or the local office.
Take out the goods carefully and check with the packing list.
Safety Instruction
This chapter contains information and warnings that must be observed. To ensure that the instrument is
operating under the safety conditions. In addition to the safety precautions indicated in this chapter, you
must also follow accepted safety procedures.
Safety Precautions
Safety Statements
Instruments.uni-trend.com 13 / 76
Page 14
User’s Manual UTS1000B/T Series
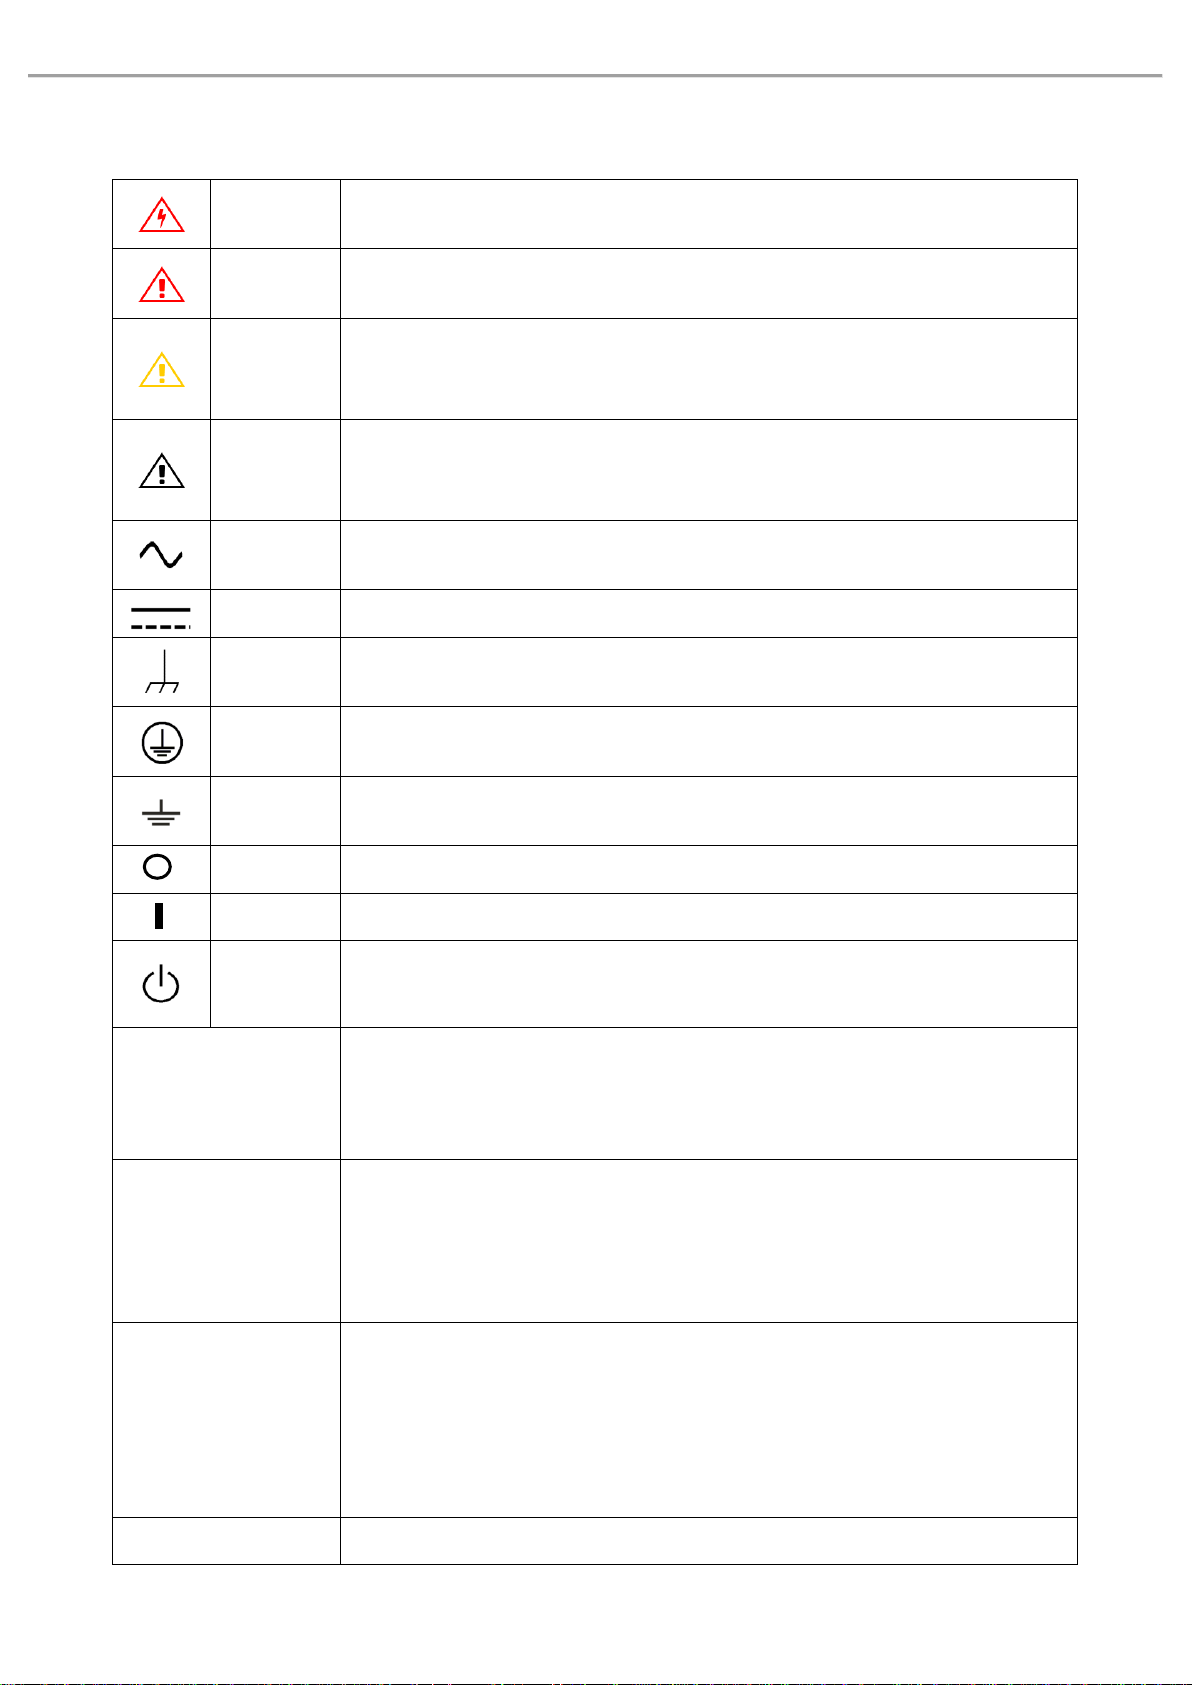
Danger
It indicates possible danger of electric shock, which may cause personal injury
or death.
Warning
It indicates that you should be careful to avoid personal injury or product
damage.
Caution
It indicates possible danger, which may cause damage to this device or other
equipment if you fail to follow a certain procedure or condition. If the “Caution”
sign is present, all conditions must be met before you proceed to operation.
Note
It indicates potential problems, which may cause failure of this device if you fail
to follow a certain procedure or condition. If the “Note” sign is present, all
conditions must be met before this device will function properly.
AC
Alternating current of device. Please check the region’s voltage range.
DC
Direct current of device. Please check the region’s voltage range.
Grounding
Frame and chassis grounding terminal.
Grounding
Protective grounding terminal.
Grounding
Measuring grounding terminal.
OFF
Main power off.
ON
Main power on.
Power
Supply
Standby power supply: when the power switch is turned off, this device is not
completely disconnected from the AC power supply.
CAT I
Secondary electrical circuit connected to wall sockets through transformers or
similar equipment, such as electronic instruments and electronic equipment;
electronic equipment with protective measures, and any high-voltage and
low-voltage circuits, such as the copier in the office.
CAT II
CATII: Primary electrical circuit of the electrical equipment connected to the
indoor socket via the power cord, such as mobile tools, home appliances, etc.
Household appliances, portable tools (e.g. electric drill), household sockets,
sockets more than 10 meters away from CAT III circuit or sockets more than 20
meters away from CAT IV circuit.
CAT III
Primary circuit of large equipment directly connected to the distribution board
and circuit between the distribution board and the socket (three-phase
distributor circuit includes a single commercial lighting circuit). Fixed
equipment, such as multi-phase motor and multi-phase fuse box; lighting
equipment and lines inside large buildings; machine tools and power
distribution boards at industrial sites (workshops).
CAT IV
Three-phase public power unit and outdoor power supply line equipment.
Safety Signs
Instruments.uni-trend.com 14 / 76
Page 15
User’s Manual UTS1000B/T Series
Equipment designed to “initial connection”, such as power distribution system
of power station, power instrument, front-end overload protection, and any
outdoor transmission line.
Certificatio
n
CE indicates a registered trademark of EU.
Certificatio
n
UKCA indicates a registered trademark of United Kingdom.
Certificatio
n
Conforms to UL STD 61010-1, 61010-2-030, Certified to CSA STD C22.2 No.
61010-1, 61010-2-030.
Waste
Do not place equipment and its accessories in the trash. Items must be properly
disposed of in accordance with local regulations.
EEUP
This environment-friendly use period (EFUP) mark indicates that dangerous or
toxic substances will not leak or cause damage within this indicated time
period. The environment-friendly use period of this product is 40 years, during
which it can be used safely. Upon expiration of this period, it should enter the
recycling system.
Warning
Preparation
before use
Please connect this device to AC power supply with the power cable provided;
The AC input voltage of the line reaches the rated value of this device. See the product
manual for specific rated value.
The line voltage switch of this device matches the line voltage;
The line voltage of the line fuse of this device is correct.
Do not used to measure MAINS CIRCUIT.
Check all
terminal rated
values
Please check all rated values and marking instructions on the product to avoid fire and
impact of excessive current. Please consult the product manual for detailed rated
values before connection.
Use the power
cord properly
You can only use the special power cord for the instrument approved by the local and
state standards. Please check whether the insulation layer of the cord is damaged or
the cord is exposed, and test whether the cord is conductive. If the cord is damaged,
Safety Requirements
Instruments.uni-trend.com 15 / 76
Page 16

User’s Manual UTS1000B/T Series
please replace it before using the instrument.
Instrument
grounding
To avoid electric shock, the grounding conductor must be connected to the ground.
This product is grounded through the grounding conductor of the power supply. Please
be sure to ground this product before it is powered on.
AC power
supply
Please use the AC power supply specified for this device. Please use the power cord
approved by your country and confirm that the insulation layer is not damaged.
Electrostatic
prevention
This device may be damaged by static electricity, so it should be tested in the
anti-static area if possible. Before the power cable is connected to this device, the
internal and external conductors should be grounded briefly to release static
electricity. The protection grade of this device is 4KV for contact discharge and 8KV
for air discharge.
Measurement
accessories
Measurement accessories are of lower class, which are definitely not applicable to
main power supply measurement, CAT II, CAT III or CAT IV circuit measurement.
Probe assemblies and accessories within the scope of IEC 61010-031, and current
sensors within the scope of IEC 61010-2-032 shall meet the requirements thereof.
Use the input /
output port of
this device
properly
Please use the input / output ports provided by this device in a properly manner. Do not
load any input signal at the output port of this device. Do not load any signal that does
not reach the rated value at the input port of this device. The probe or other
connection accessories should be effectively grounded to avoid product damage or
abnormal function. Please refer to the product manual for the rated value of the input /
output port of this device.
Power fuse
Please use power fuse of specified specification. If the fuse needs to be replaced, it
must be replaced with another one that meets the specified specifications by the
maintenance personnel authorized by UNI-T.
Disassembly
and cleaning
There are no components available to operators inside. Do not remove the protective
cover.
Maintenance must be carried out by qualified personnel.
Instruments.uni-trend.com 16 / 76
Page 17
User’s Manual UTS1000B/T Series
Service
environment
This device should be used indoors in a clean and dry environment with ambient
temperature from 0 ℃ to 40 ℃.
Do not use this device in explosive, dusty or humid air.
Do not operate
in humid
environment
Do not use this device in a humid environment to avoid the risk of internal short circuit
or electric shock.
Do not operate
in flammable
and explosive
environment
Do not use this device in a flammable and explosive environment to avoid product
damage or personal injury.
Caution
Abnormity
If this device may be faulty, please contact the authorized maintenance personnel of
UNI-T for testing. Any maintenance, adjustment or parts replacement must be done by
the relevant personnel of UNI-T.
Cooling
Do not block the ventilation holes at the side and back of this device;
Do not allow any external objects to enter this device via ventilation holes;
Please ensure adequate ventilation, and leave a gap of at least 15 cm on both sides,
front and back of this device.
Safe
transportation
Please transport this device safely to prevent it from sliding, which may damage the
buttons, knobs or interfaces on the instrument panel.
Proper
ventilation
Poor ventilation will cause the device temperature to rise, thus causing damage to this
device. Please keep proper ventilation during use, and regularly check the vents and
fans.
Keep clean and
dry
Please take actions to avoid dust or moisture in the air affecting the performance of
this device. Please keep the product surface clean and dry.
Note
Calibration
The recommended calibration period is one year. Calibration should only be carried out
by qualified personnel.
Instruments.uni-trend.com 17 / 76
Page 18
User’s Manual UTS1000B/T Series
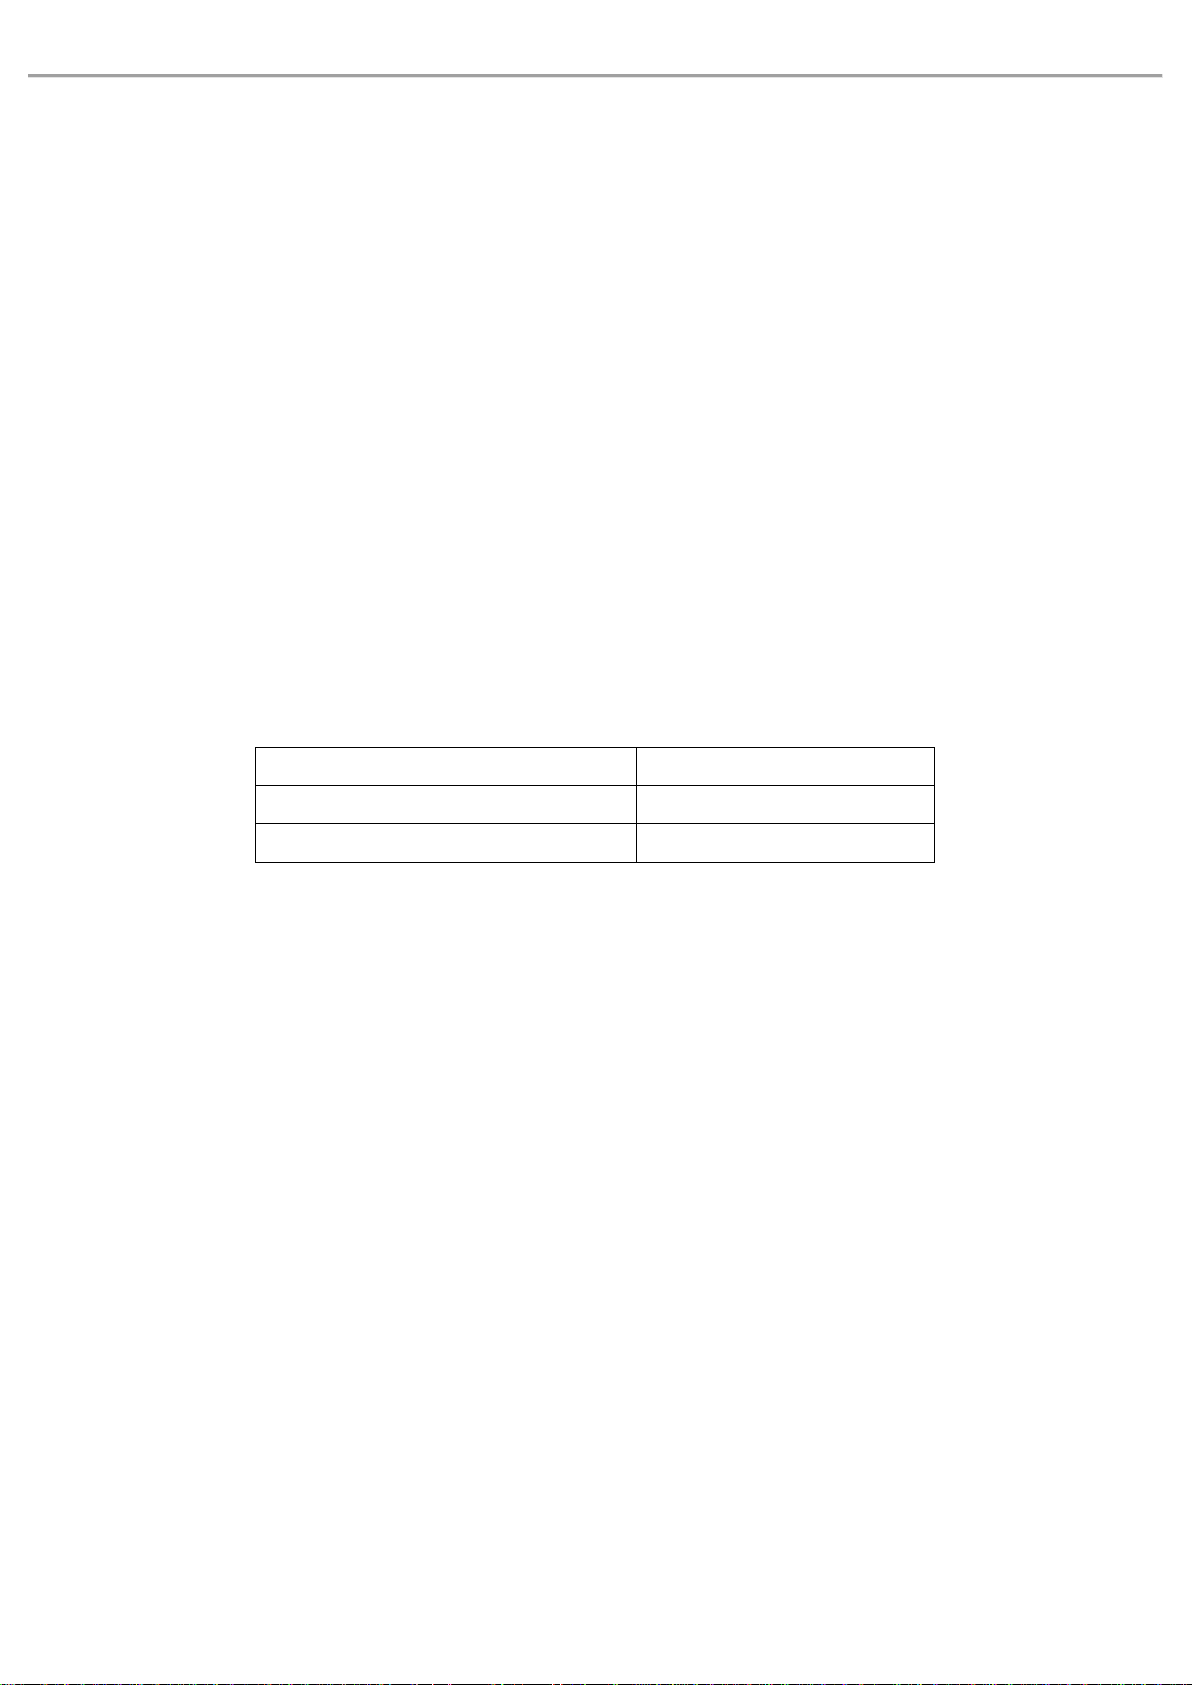
Voltage Range
Frequency
100-240VAC (Fluctuations±10%)
50/60Hz
100-120VAC (Fluctuations±10%)
400Hz
Environmental Requirements
This instrument is suitable for the following envir onment:
Indoor use.
Pollution degree 2
In operating: altitude lower to 3000 meter;in non-operating: altitude lower to 15000 meter.
Operating temperature 0℃ to﹢ 40 ℃; Storage temperature -20℃ to +70℃ (unless otherwise
specified).
In operating, humidity temperature below to +35℃, ≤90% relative humidity;
In non-operating, humidity temperature +35℃ to +40℃, ≤60% relative humidity.
There are ventilation opening on the rear panel and side panel of the instrument. So please keep the air
flowing through the vents of the instrument housing. To prevent excessive dust from blocking the vents,
please clean the instrument housing regularly. The housing is not waterproof, please disconnect the power
supply first and then wipe the housing with a dry cloth or a slightly moistened soft cloth.
Connecting Power Supply
The specification of AC power supply that can input
Please use the attached power lead to connect to the power port.
Connecting to service cable
This instrument is a Class I safety product. The supplied power lead has good performance in terms of case
ground. This spectrum analyzer is equipped with a three-prong power cable that meets international safety
standards. It provides good case grounding performance for the specification of your country or region.
Please install AC power cable as follows:
• ensure the power cable is in a good condition.
• leave enough space for connecting the power cord.
• Plug the attached three-prong power cable into a well-grounded power socket.
Electrostatic Protection
Electrostatic discharge may cause damage to component. Components can be damaged invisibly by
electrostatic discharge during transportation, storage and use.
The following measure can reduce the damage of electrostatic discharge,
• Testing in antistatic area as far as possible;
• Before connecting the power cable to the instrument, inner and outer conductors of the instrument
should be briefly grounded to discharge static electricity;
• Ensure all the instruments are properly grounded to prevent the accumulation of static.
Instruments.uni-trend.com 18 / 76
Page 19
User’s Manual UTS1000B/T Series
Preparation Work
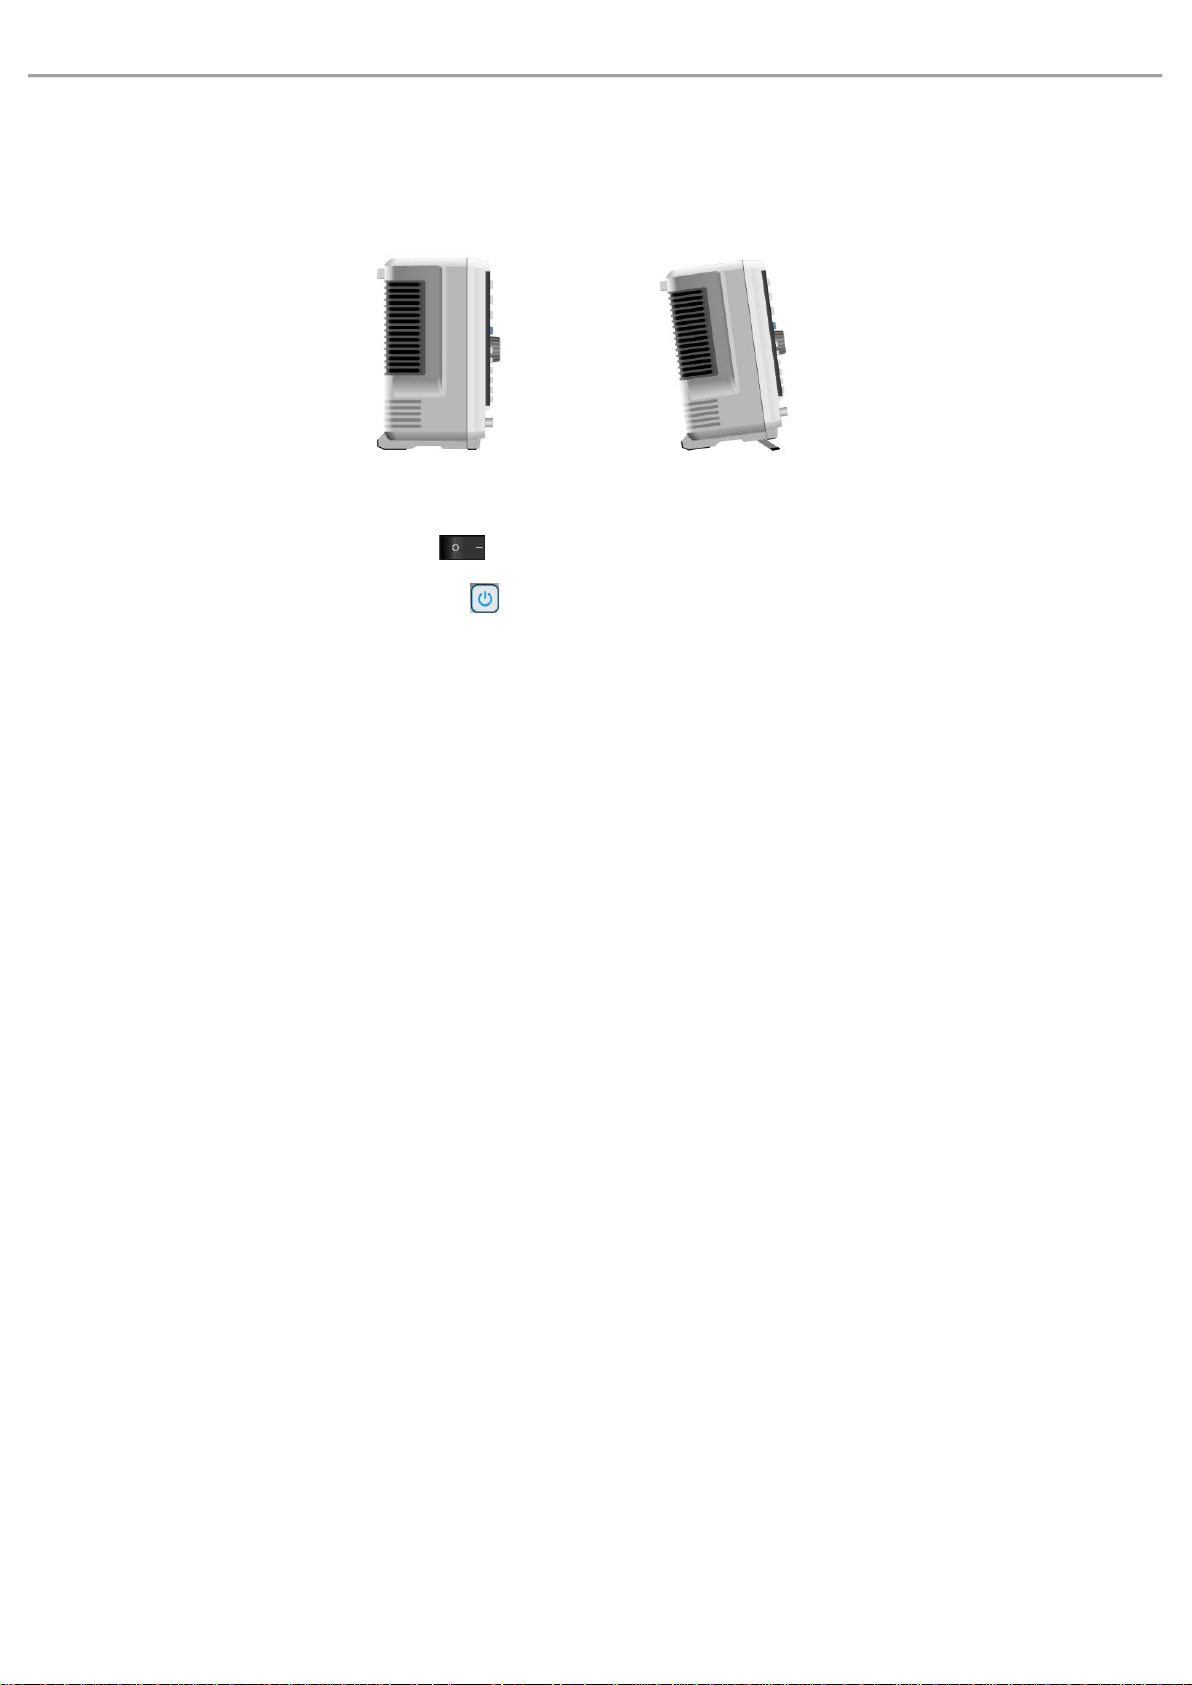
1. Connecting the power cable and insert the power plug into protective grounding outlet; use the tilt
adjustment bracket as needed for your viewing angle.
Figure 2-1 Tilt adjustment
2. Press the switch on the rear panel , the spectrum analyzer will enter standby mode.
3. Press the switch on the front panel , indicator lights up green, and then the spectrum analyzer is
powered on.
It takes about 30 seconds to initialize the boot, and then the spectrum analyzer enters the system
default menu mode. In order to make this spectrum analyzer perform better, it is recommended that
warm up the spectrum analyzer for 45 minutes after power on.
Usage Tip
Use External Reference Signal
If user want to use an external signal source 10 MHz as reference, please connect signal source to the
10MHz In port on the rear panel. The measuring bar on the top of the screen will indicate Freq Ref: Ext.
Activate the Option
If user want to activate the option, user need to input secret key of the option. Please contact UNI-T office
to purchase it.
Refer to the following steps to activate the option you have purchased.
1. Save the secret key into USB and then insert it to spectrum analyzer;
2. Press [System] key > System Information > add token;
3. Select purchased secret key and then press [ENTER] to confirm.
Touch Operation
Spectrum analyzer has 10.1 inch multipoint touch screen for various gesture operating, which includes,
Tap the top right on the screen to enter the main menu
Slide up/down, left/right in waveform area to change the center frequency of X axis or reference level
of Y axis
Zoom two points in waveform area to change the span of X axis
Tap parameter or menu on the screen to select and edit it
Instruments.uni-trend.com 19 / 76
Page 20

User’s Manual UTS1000B/T Series
Turn on and move the cursor
Use auxiliary quick key to perform common operation
Use [Touch/Lock] to turn on/off touch screen function.
Remote Control
The UTS1000B/T series spectrum analyzers support communication with computers via USB and LAN
interfaces. Through these interfaces, users can combine the corresponding programming language or
NI-VISA, using the SCPI (Standard Commands for Programmable Instruments) command to remotely
program and control the instrument, as well as interoperate with other programmable instruments that
support the SCPI command set.
For more information about the installation, remote control and programming, please refer to office site
http:// www.uni-trend.com UTS1000B/T Series Programming Manual
Help Information
The spectrum analyzer's built-in help system provides help information for each function button and menu
control key on the front panel.
● Touch the left of the screen “ ”, help dialog box will pop out on the center of the screen. Tap support
function to get more detailed help description.
● After help information displayed on the center of the screen, tap “×” or other key to close the dialog box.
Operating Mode
Spectrum analyzer provides various operating mode, use Mode key to select it,
Spectral analysis, refer to chapter 4
Vector signal analysis
EMI
Analog demodulation
Mode preset
Vector signal analysis, analog demodulation and EMI are the option, which should purchase to activate it.
The function of the front panel button may be different in different operating modes.
Mode preset: Different operating modes have their own independent reset modes.
Instruments.uni-trend.com 20 / 76
Page 21

User’s Manual UTS1000B/T Series
3. Function and Application
Basic Measurement
Measurement of Multiple Signal
Measurement of Low Level Signal
Measurement of Frequency Shift of Signal Source
Measurement of Signal Distortion
Measurement of Phase Noise
View Catalogue and Save File
This chapter is to introduce the main function and basic measurement of spectrum analyzer. Refer to
Overall of Front/Rear Panel for more information about the panel.
Instruments.uni-trend.com 21 / 76
Page 22
User’s Manual UTS1000B/T Series
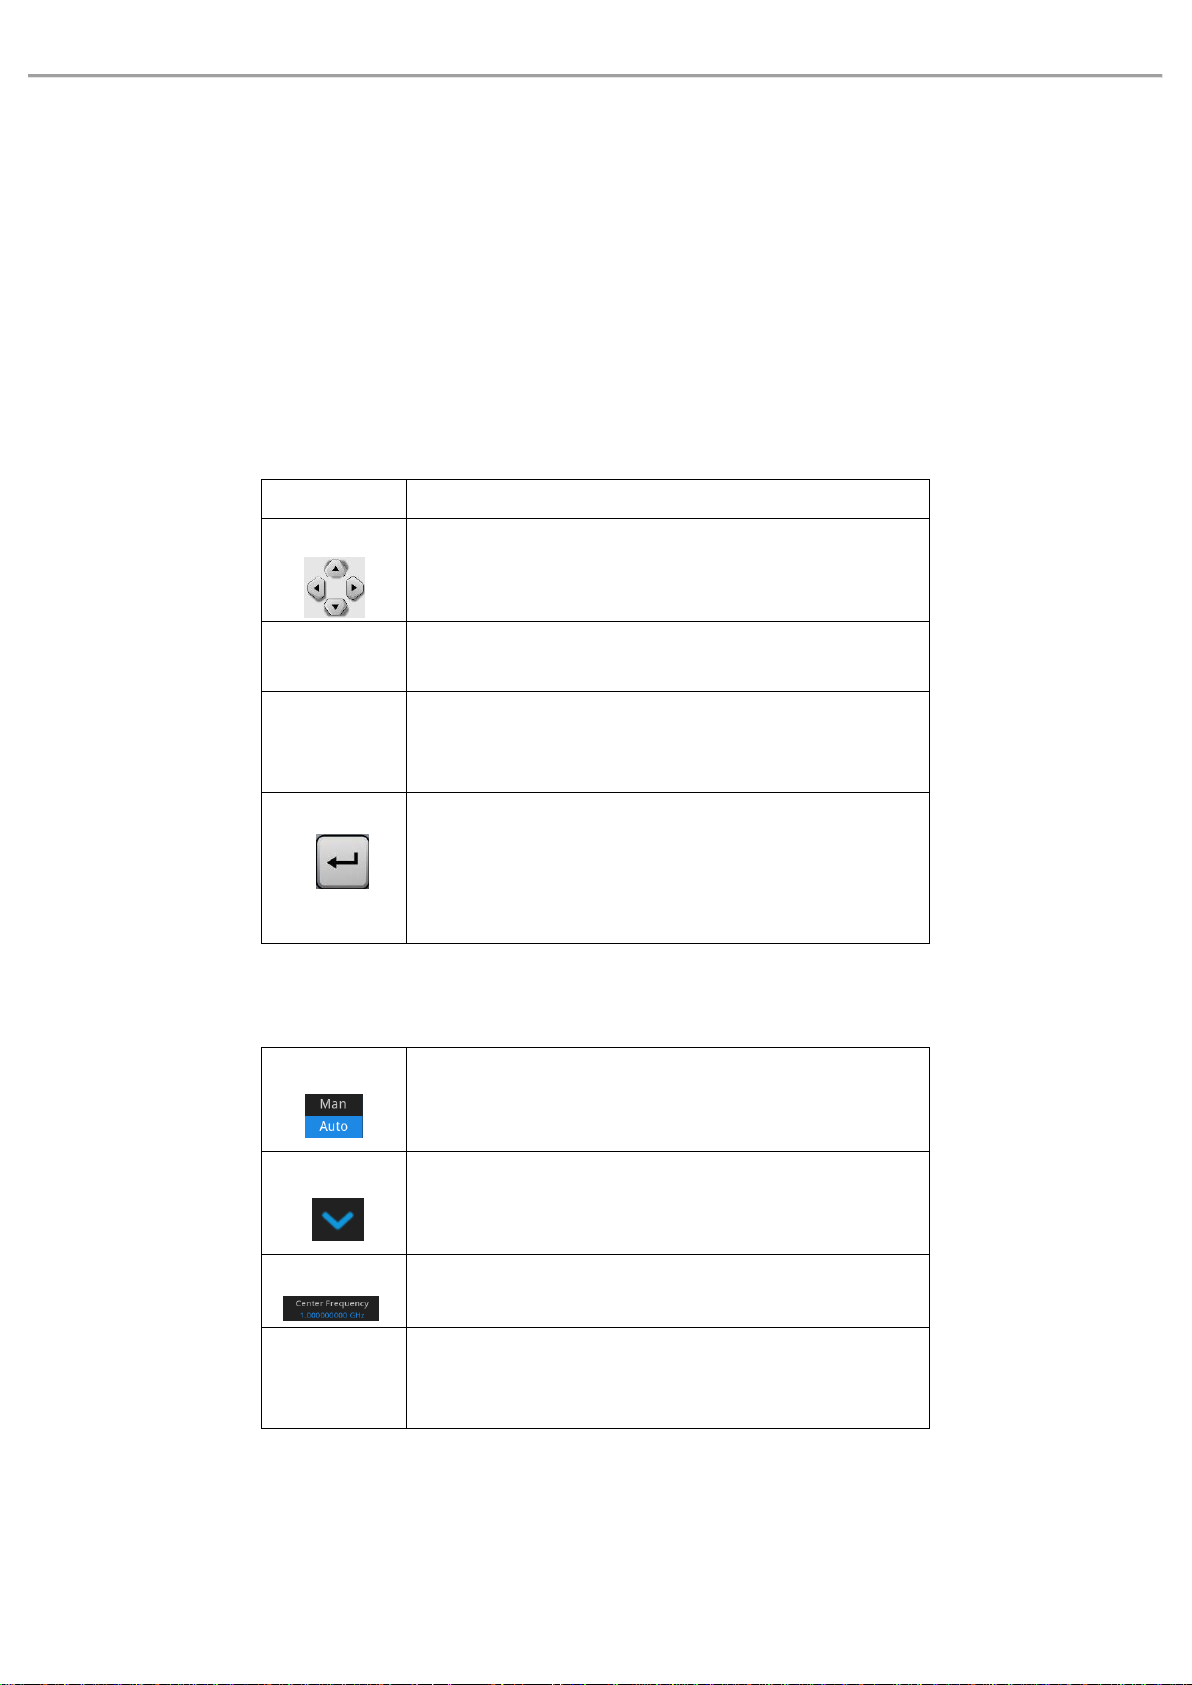
Rotary Knob
Increase or decrease the current numerical value
Direction Key
Increase or decrease the current numerical value
Numeric Key
Input numerical value and confirm (select a virtual key unit or
[Enter] key)
Virtual key
Touch panel menu to pop out dialog box, and then touch virtual
key to input numerical value and confirm (select a virtual key
“ENTER” or [Enter] key)
Enter Key
If input numerical value without unit or user want to use the
default unit to be the unit for this numerical value, press [Enter]
key as the termination key for this numerical value.
Switch
Press this panel menu to switch two modes of parameter
Sub-menu
Press this panel menu to enter sub-menu
Selection
Tap menu selection to change data, the selected menu will be
highlight
Correction
Double click the parameter that need to change to pop out the
modification menu, or select the data menu that need to change
and then press Enter key to modify it
Basic Measurement
In this manual, key marked with [ ], such as [FREQ], [AMPT] and [Marker] are physical keys on the front
panel. In most cases, press one of this hard key to enter a function menu, this menu will display on the right
of the screen, such as center frequency and reference level. And these are called panel menus.
Key on Front Panel
This section is to introduce how to use the basic function.
Input Data
There are common ways to input and edit data
Use Panel Menu
Press panel menu (vertical permutation on the right of the screen) to enter the
corresponding function item, the following are examples of panel menu
Rest Spectrum Analyzer
Instruments.uni-trend.com 22 / 76
Reset is for recall preset, set the system setting return to the specified state, here are four reset types,
Page 23
User’s Manual UTS1000B/T Series
Press [System]> Restore Defaults to select reset type.
Select Setup, system setting of spectrum analyzer will return to the default.
Select Data, all the saved data will be deleted.
Select All,all the setting of spectrum analyzer will return to the default, delete all data.
Observe Signal
See the following steps to observe a simple signal.
1. Press [Default] to reset the spectrum analyzer to the factory setting.
2. Connect 10MHz OUT port on the rear panel to RF IN port on the front panel.
Set Reference Level and Center Frequency
1. Press [AMPT]>20dBm to set the reference level to 20dBm.
2. Press [FRQE]>Center Frequency>50MHz to set the center frequency to 50MHz.
Set Span
Press [FRQE]>Span>100MHz to set span to 100MHz.
Note
Changing the reference level will change the amplitude value of the top grid line. Changing the center
frequency will change the horizontal position of the signal on the screen. Increasing the span will increase
the range of frequency that can be displayed horizontally on the screen.
Read Frequency and Amplitude Value
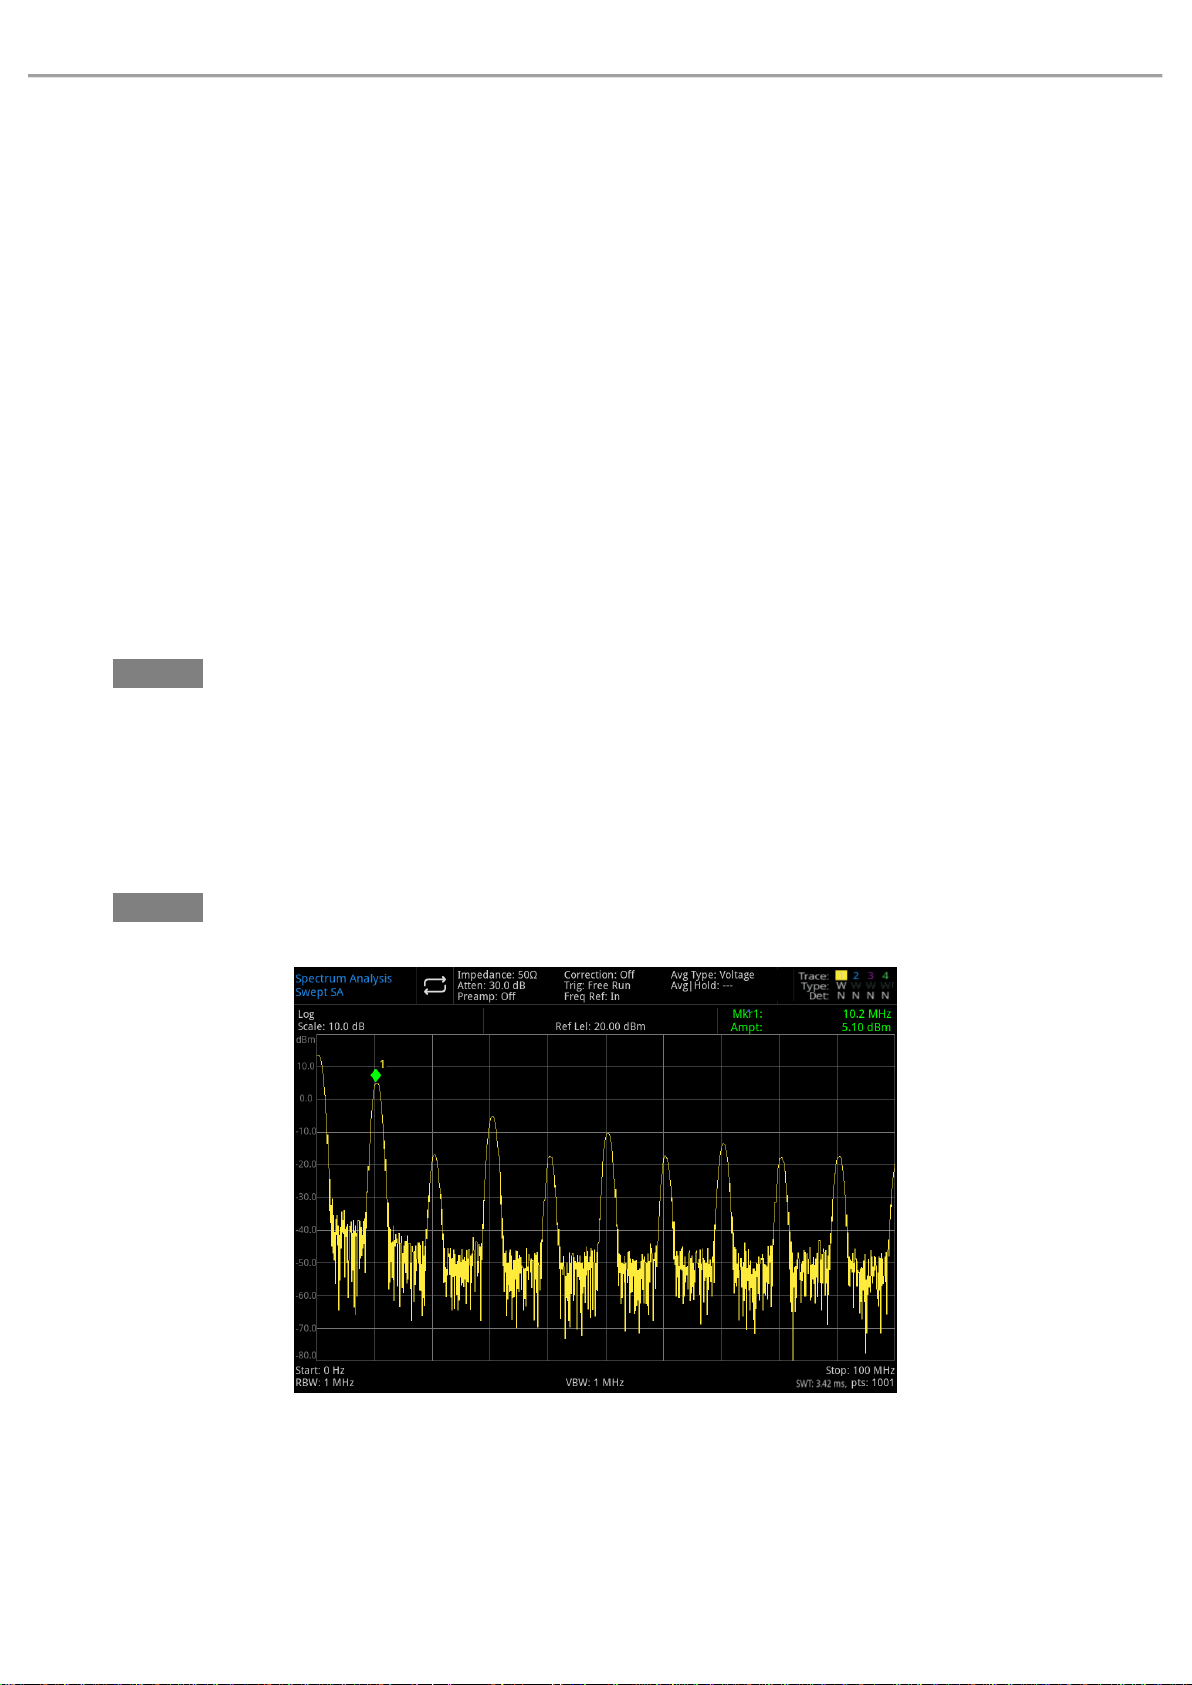
1. Press [Peak] to place a marker at 10MHz peak (the default: marker 1 ).
Note
Frequency and amplitude value of this mark will displayed on functional area on the top right of the screen.
Figure 3-1 Read Frequency and Amplitude
Use rotary knob, direction key or [Peak] on the panel menu to move the marker
Change Reference Level
1. Press [AMPT], please note that the reference level(Ref Level)is at the activation function area.
Instruments.uni-trend.com 23 / 76
Page 24

User’s Manual UTS1000B/T Series
2. Press [Marker]> Marker→> Ref Lvl
Notice: Changing the reference level will change the amplitude value of the top grid line.
Measurement of Multiple Signal
This chapter will describe how to measure different kinds of multiple signal.
Use Difference Value△ marker on the Same Screen to Compare Signal
With this spectrum analyzer, user can easily compare the signal differences between frequency and
amplitude. Difference value△ marker function allows user to compare two signals on the same screen.
In this example, the harmonic components of the 10 MHz reference signal provided on the rear panel of
the spectrum analyzer are used to measure the difference in frequency and amplitude between the two
signals on the same screen. Difference value△ marker is used to show the differences.
1. Reboot the spectrum analyzer;
Press [Default]> to reset
2. Connect 10MHz OUT port on the rear panel to RF IN port on the front panel
3. Set the center reference, span and reference level for check input signal and other harmonic wave
of 10MHz;
Press [FREQ]>Center Frequency>50MHz
Press [FREQ]>Span>100MHz
Press [AMPT]>Ref Level>20dBm
4. Place a marker at the maximum peak(10MHz):
Press [Peak] next peak on the left and next peak on the right to move marker from pe ak to peak.
Marker should at 10MHz reference signal.
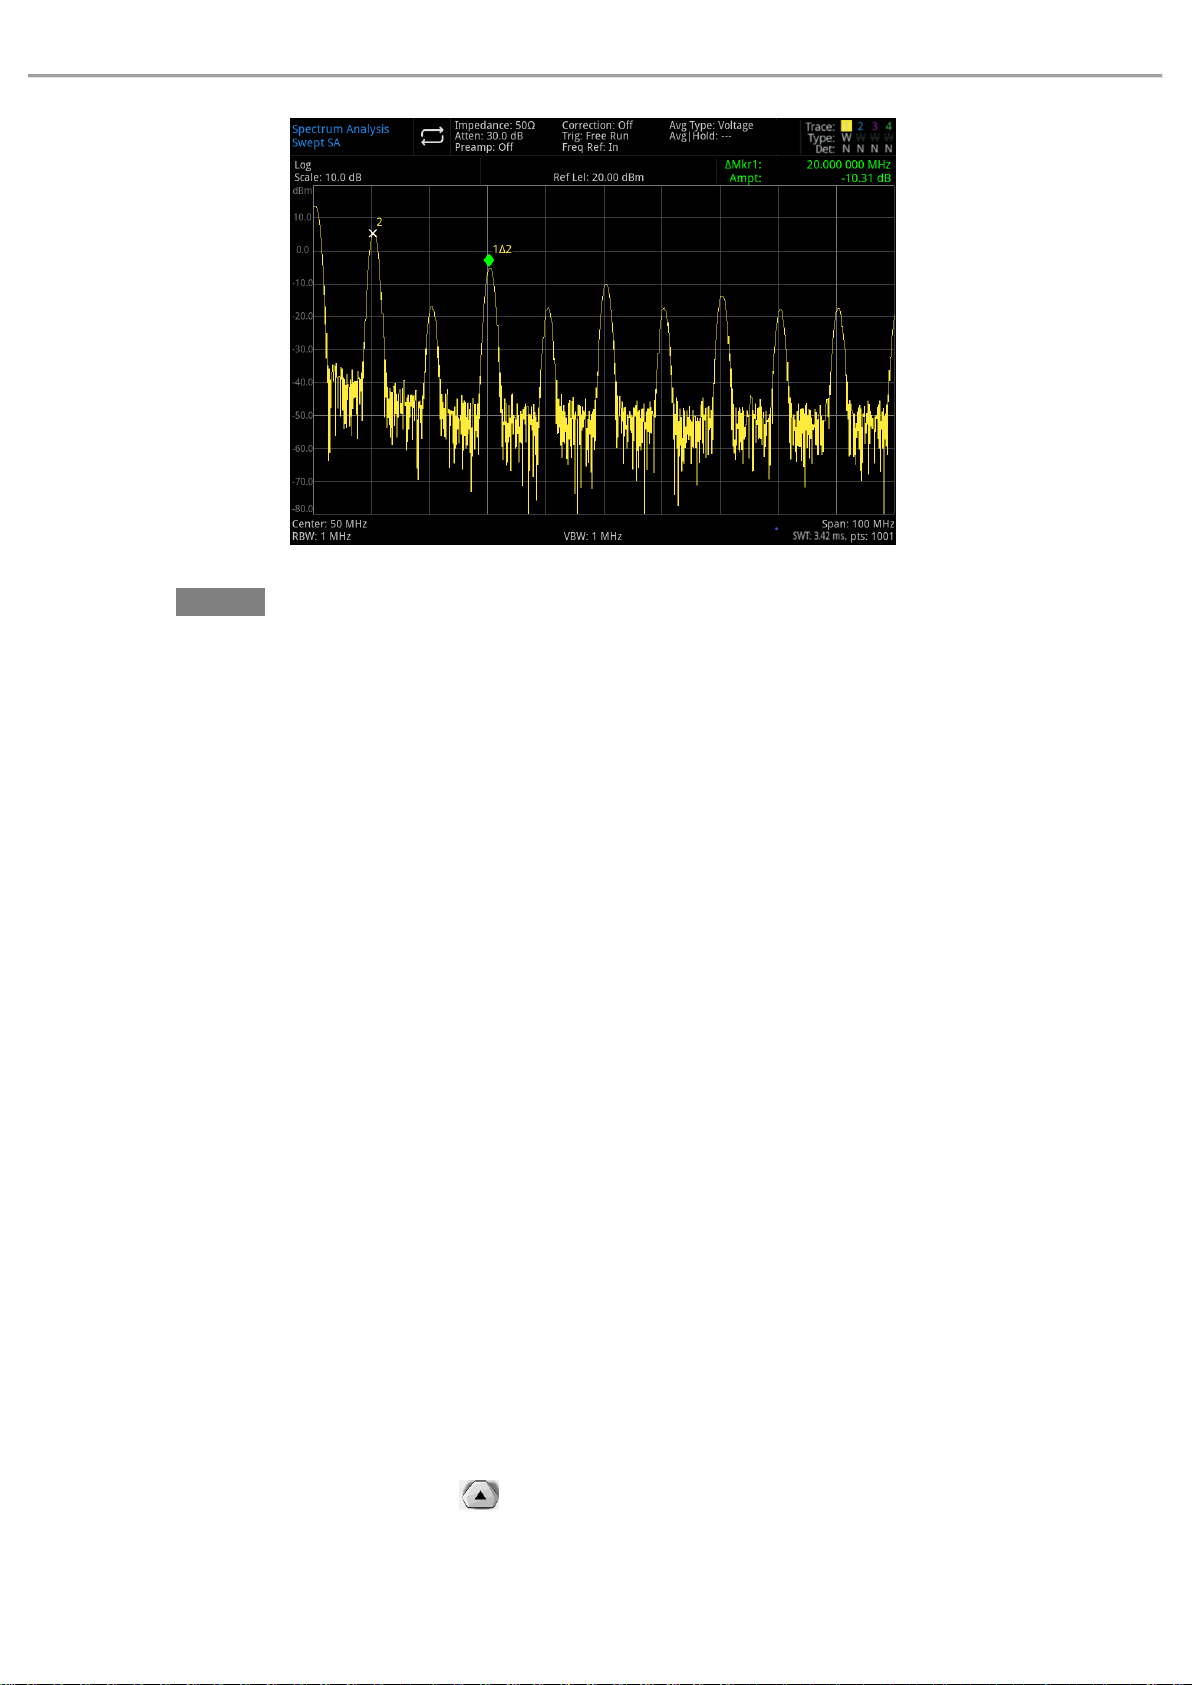
5. Lock a marker and activate the second marker:
Press [Marker]>Marker Mode>Delta△
The marker with a label “× “which presents this is a reference signal.
6. Use rotary knob or [Peak] key to move marker 1△2 to other signal peak:
Press [Peak]> Next PK or
Press [Peak]>Next PK Left or Next PK Right
Or press [Marker]>Marker△ Frequency>Rotate the Rotary Knob to Next PK
The difference of amplitude and frequency between the two markers are displayed on the
screen.
Instruments.uni-trend.com 24 / 76
Page 25
User’s Manual UTS1000B/T Series
Figure 3-2 Marker Mode Difference Value△ on the Same Screen to Compare Signal
Note
Turn on the frequency meter to increase the resolution of marker reading.
Use Difference Value△ Marker on the Different Screen to Compare Signal
With difference value marker function, user can easily measure the difference of amplitude and
frequency between the two signals on the different screen. (This feature is suited for harmonic
distortion measurement.)
In this example, use 10MHz signal to measure the difference in frequency and amplitude between the
two signals, one of the signal is displayed on the screen, another signal is not on the screen.
Difference value△ marker is used to show the differences.
1. Reset the spectrum analyzer:
Press [Default]> Reset
2. Connect 10MHz OUT port on the rear panel to RF IN port on the front panel
3. Set the center frequency, span and reference level for check input signal and other harmonic wave
of 10MHz;
Press [FREQ]>Center Frequency>50MHz
Press [FREQ]>Span>100MHz
Press [AMPT]>Ref Level>20dBm
4. Place a marker at 10MHz peak and set stepped center frequency as the frequency value(10MHz)of
marker:
Press [Peak]>Marker→> CF Step
5. Turn on difference value△ marker function:
Press [Marker]>Marker Mode>Delta △
6. Use center frequency to increase 10MHz:
Press [FREQ]>Center Frequency,
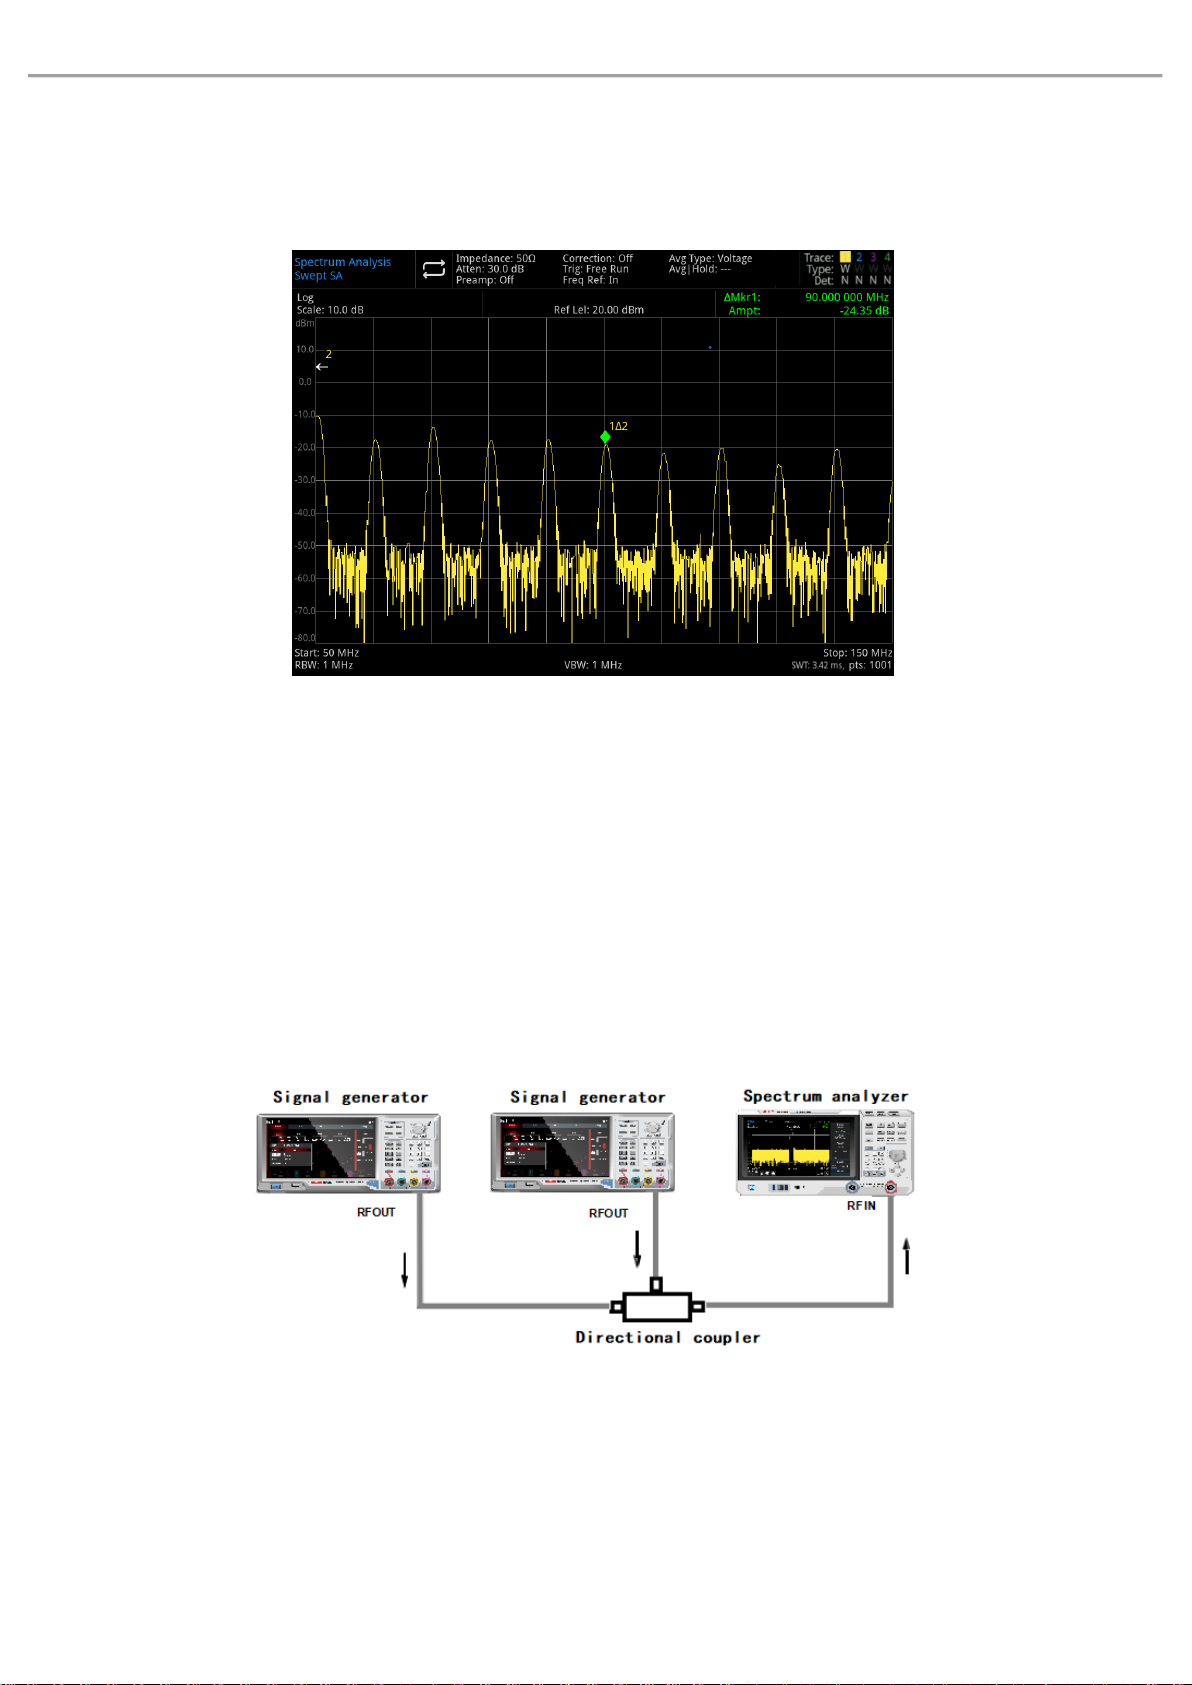
At this point, the first marker moves to the left side of the screen which is located at the first
Instruments.uni-trend.com 25 / 76
Page 26
User’s Manual UTS1000B/T Series
signal peak(10MHz). Until the center frequency becomes 100MHz, frequency of △Mkr1 is 90MHz,
which is marker 100MHz harmonic component. The annotation of △Mkr1 will show the amplitude and
frequency difference of 10MHz signal peak and 100MHz signal peak.
Figure 3-3 Difference Value Marker of Reference Signal Out of Screen
7. Turn off Marker: Press [Marker]>All Markers Off or [Marker]>Marker Mode>Close
Distinguish Signals of the Same Amplitude
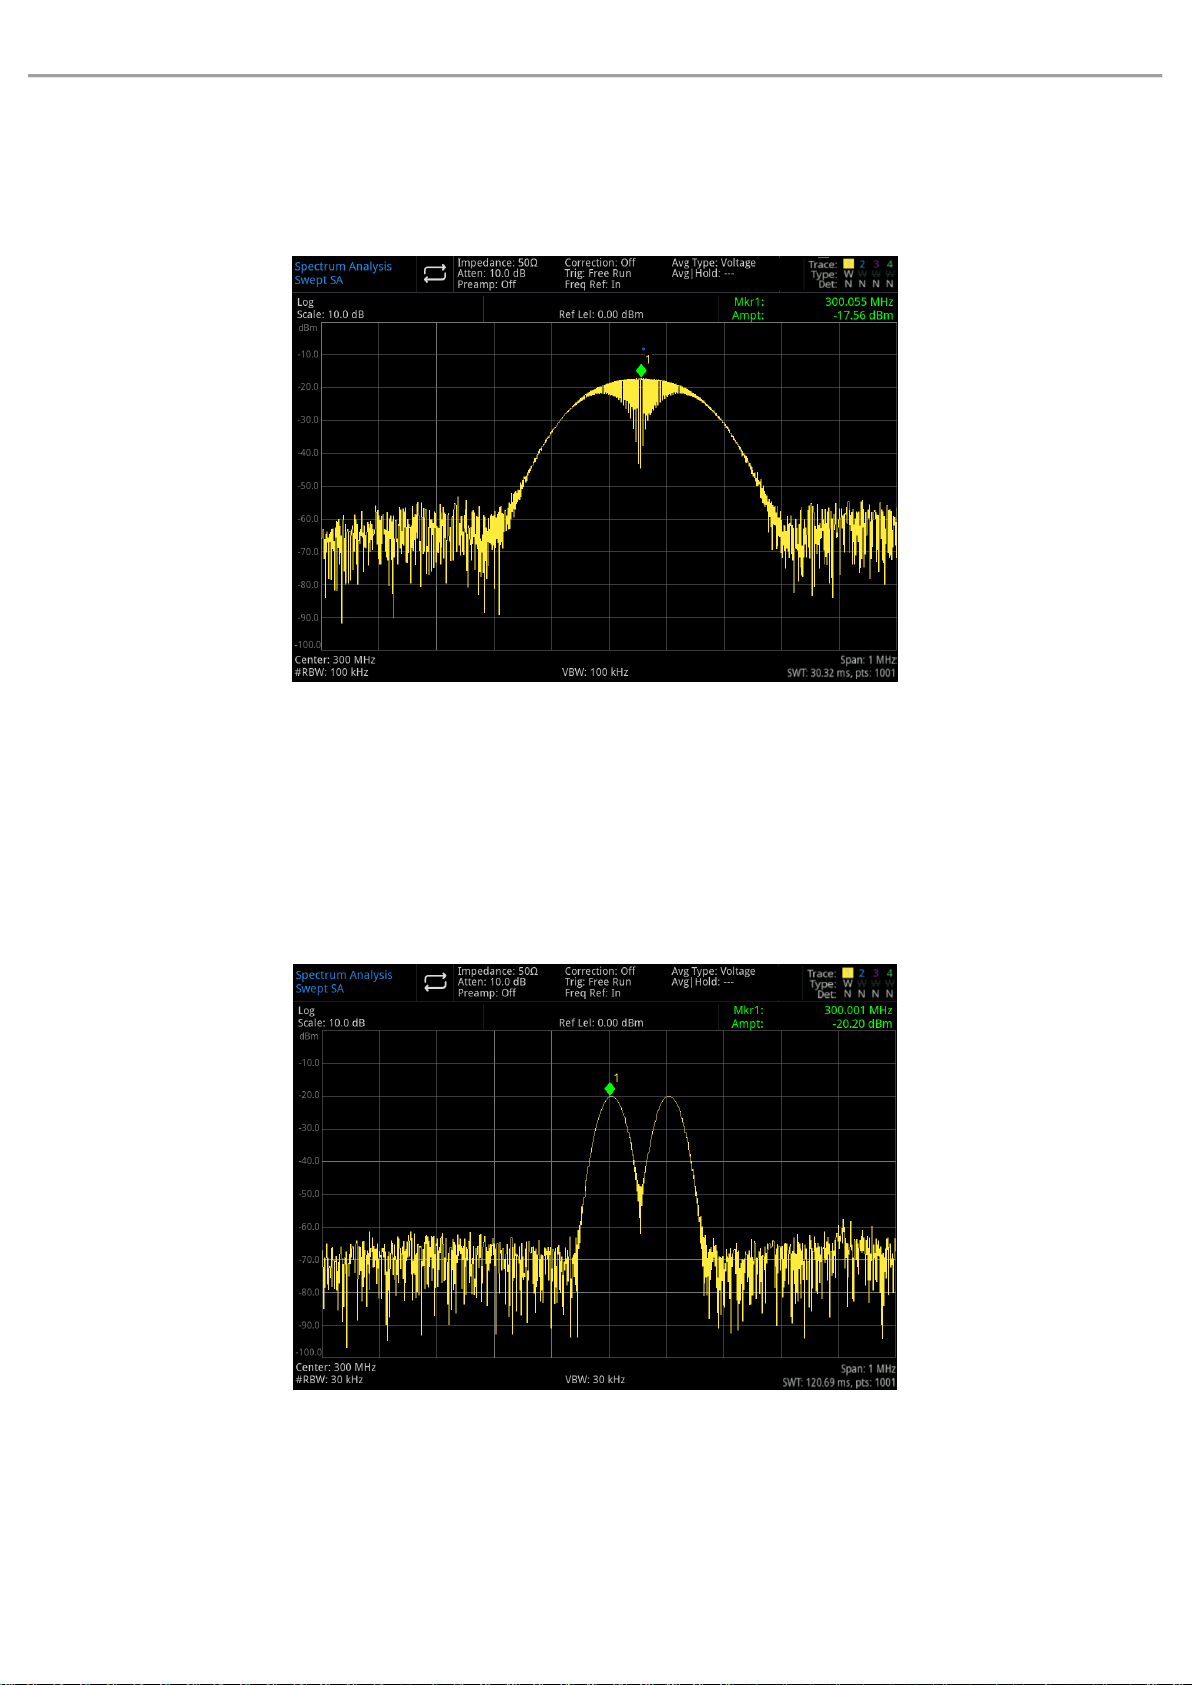
This example shows that reduce the resolution bandwidth and video bandwidth to distinguish the
two signals with the same amplitude, frequency space 100 kHz.
Please note that for resolution signal, the final selected resolution bandwidth value is equal to the
frequency difference between the two input signals, while the video bandwidth is slightly narrower
than the resolution bandwidth.
Figure 3-4: Instrument Setting for Acquire Two Channel’s Signal
1. As shown in Figure 3-4, connect two signal sources to RF IN port via directional coupler.
2. Set the frequency of one of signal source to 300MHz and the frequency of another signal source to
300.1MHz, amplitude of the two signal sources to -20dBm, and turn on the signal output.
3. Set the spectrum analyzer to observe signal:
Instruments.uni-trend.com 26 / 76
Page 27
User’s Manual UTS1000B/T Series
Press [Default]>Reset
Press [FREQ]>Center Frequency>300MHz, Span>1MHz
Press [BW]>100kHz
A single envelope signal can be seen at this point.
Figure 3-5 Undistinguished Two Equal-Amplitude Signals
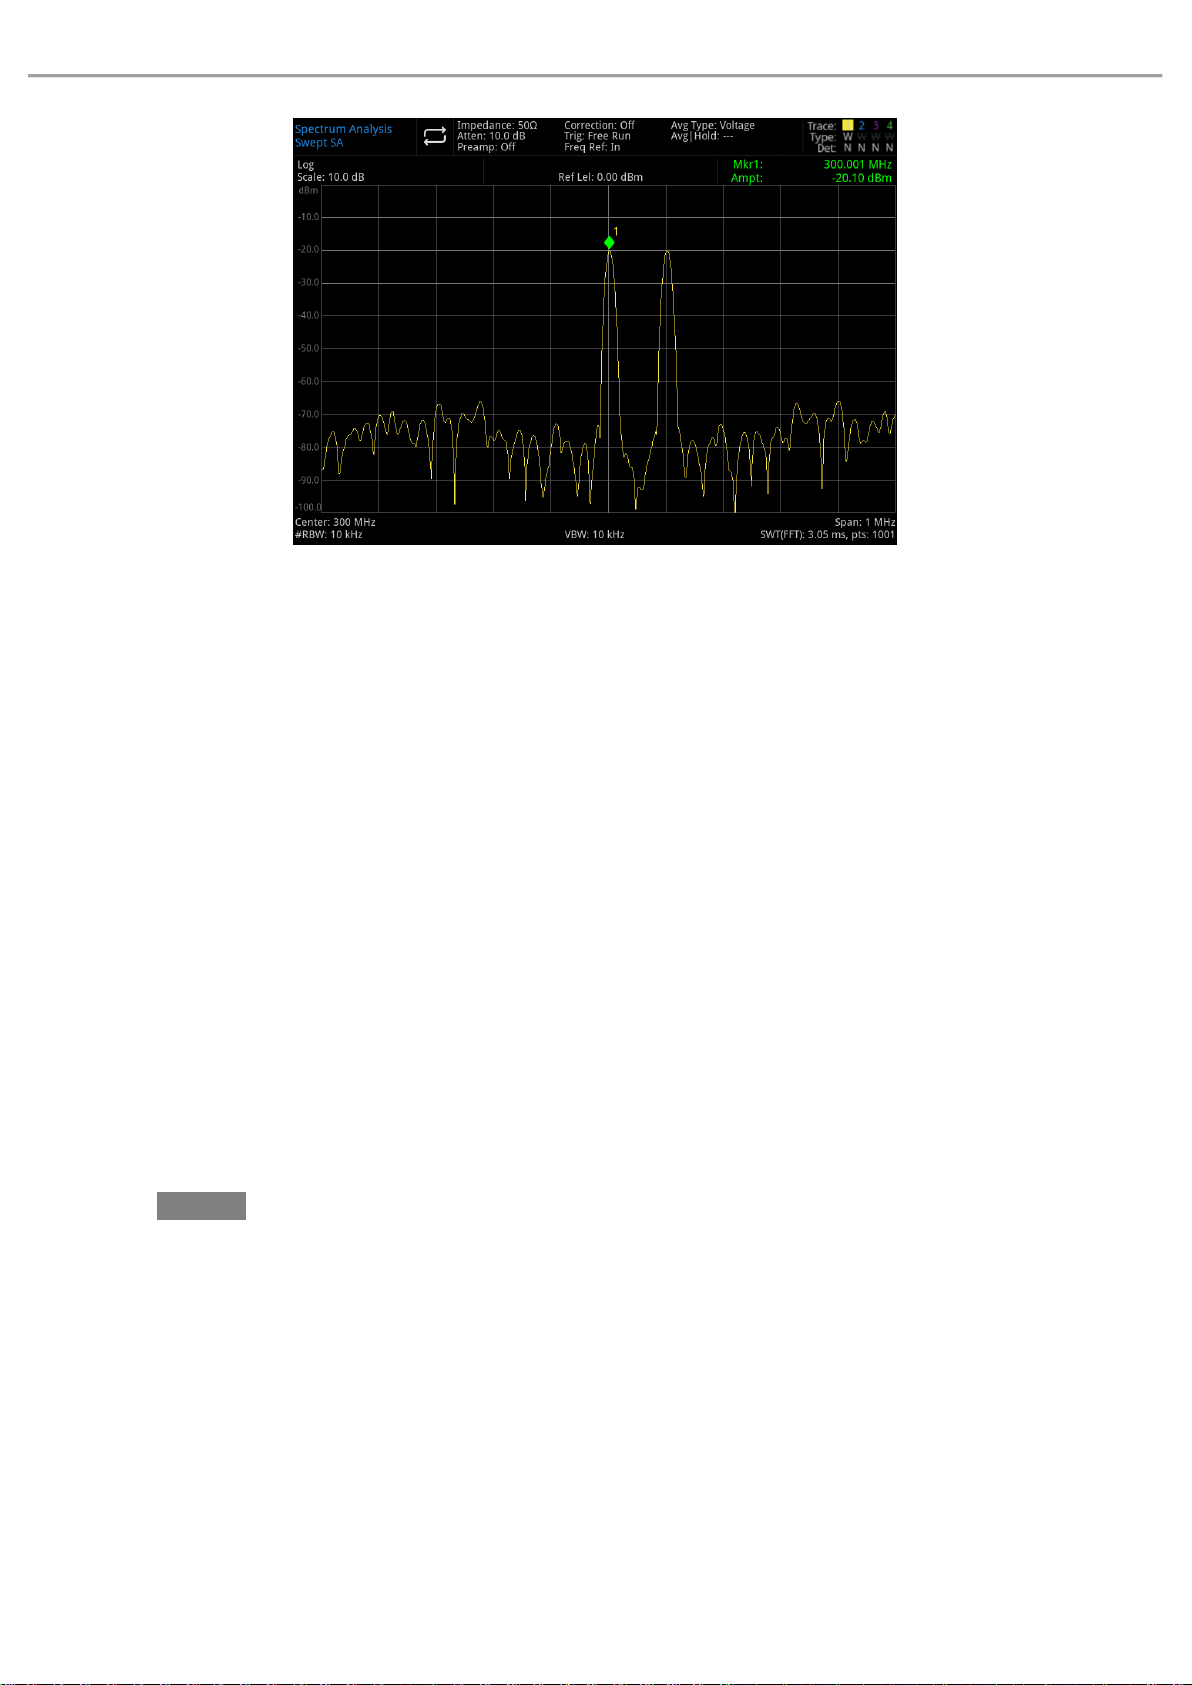
4. Adjust the resolution bandwidth(RBW)to 30kHz to make its lower or equal to the frequency space of
two input signal:
Press [BW]>RBW>300 kHz
Refer to Figure 3-6, two signal peaks can be seen at this point. Use rotary knob or direction key on
the front panel to further decrease the resolution bandwidth, so that to better distinguish the two
signals.
Figure 3-6 Distinguished Two Equal-Amplitude Signal(1)
Instruments.uni-trend.com 27 / 76
Page 28
User’s Manual UTS1000B/T Series
Figure 3-7 Distinguished Two Equal-Amplitude Signal(2)
When the resolution is decreased, the sweep time will increased and the displayed signal will be
smoother at the same time. For the fastest measurement, use the maximum resolution bandwidth as
much as possible. In factory setting, resolution bandwidth and sweep span is coupling.
Distinguish the Small Signal from the Big Signal
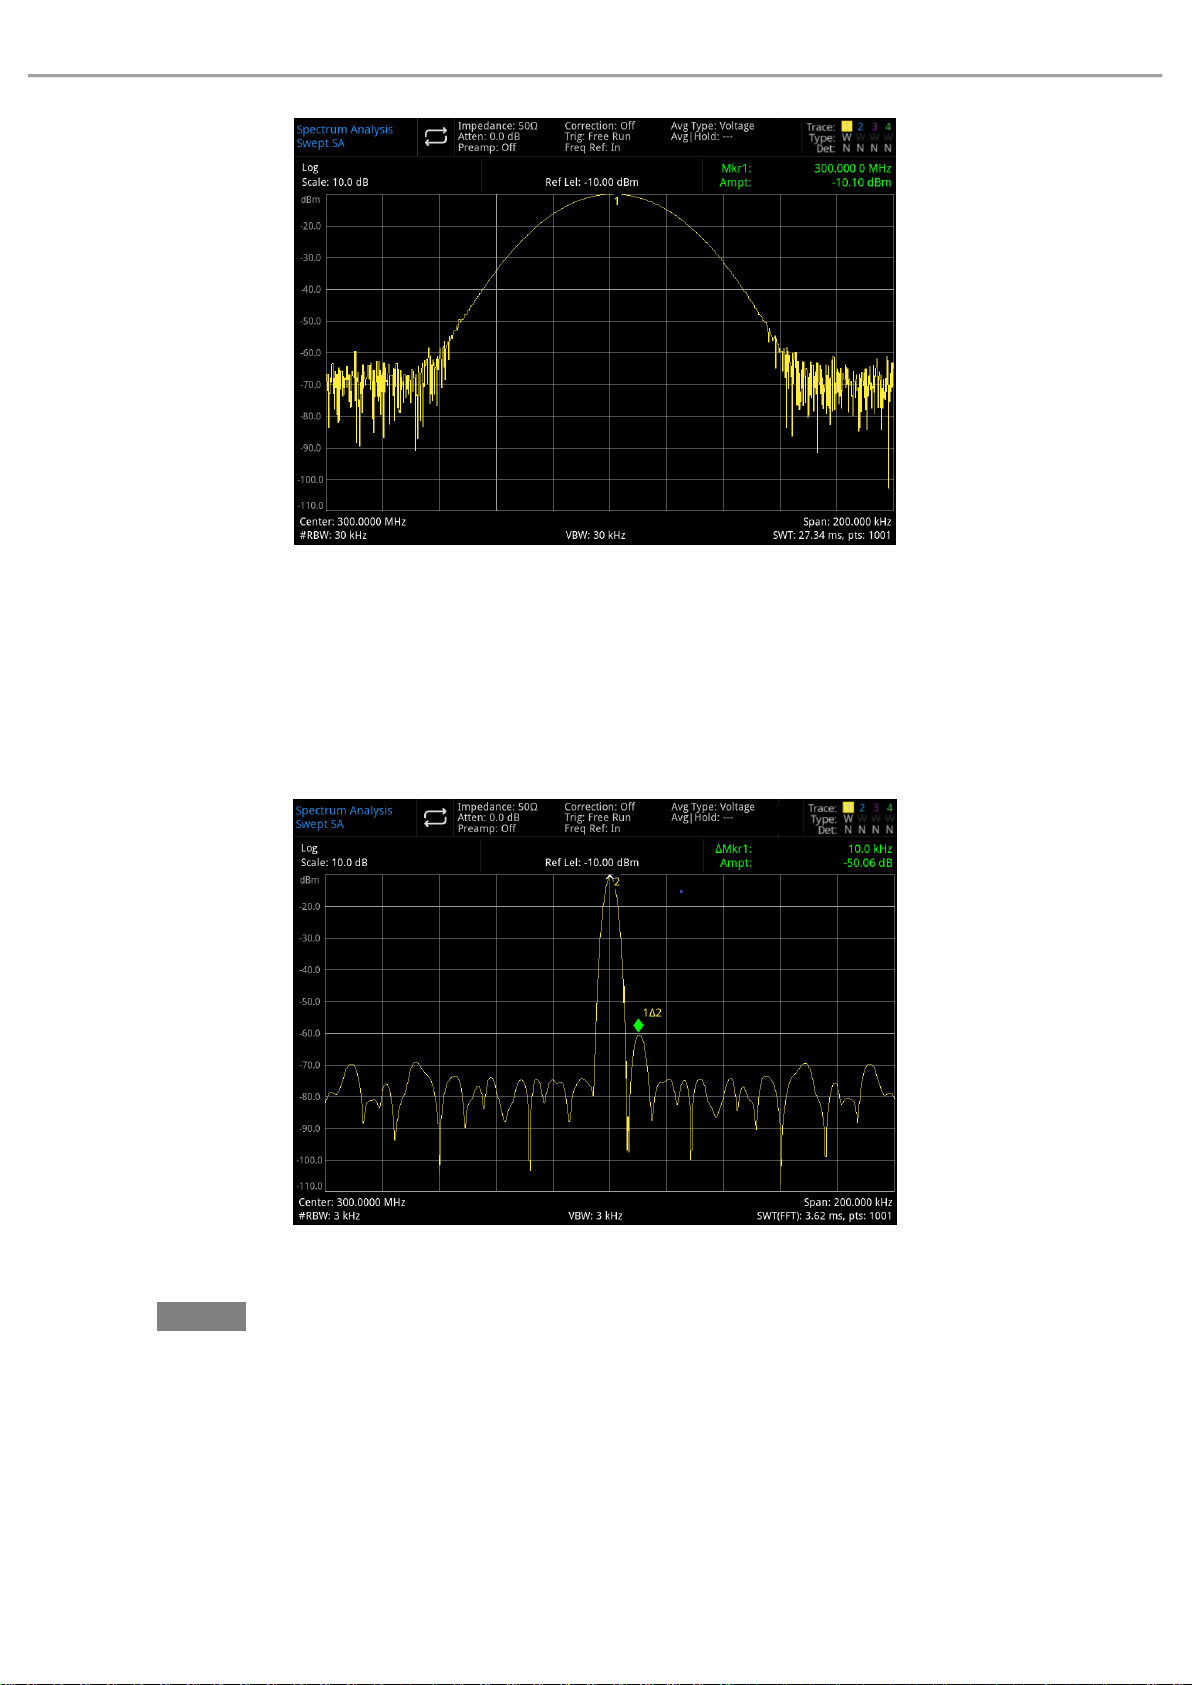
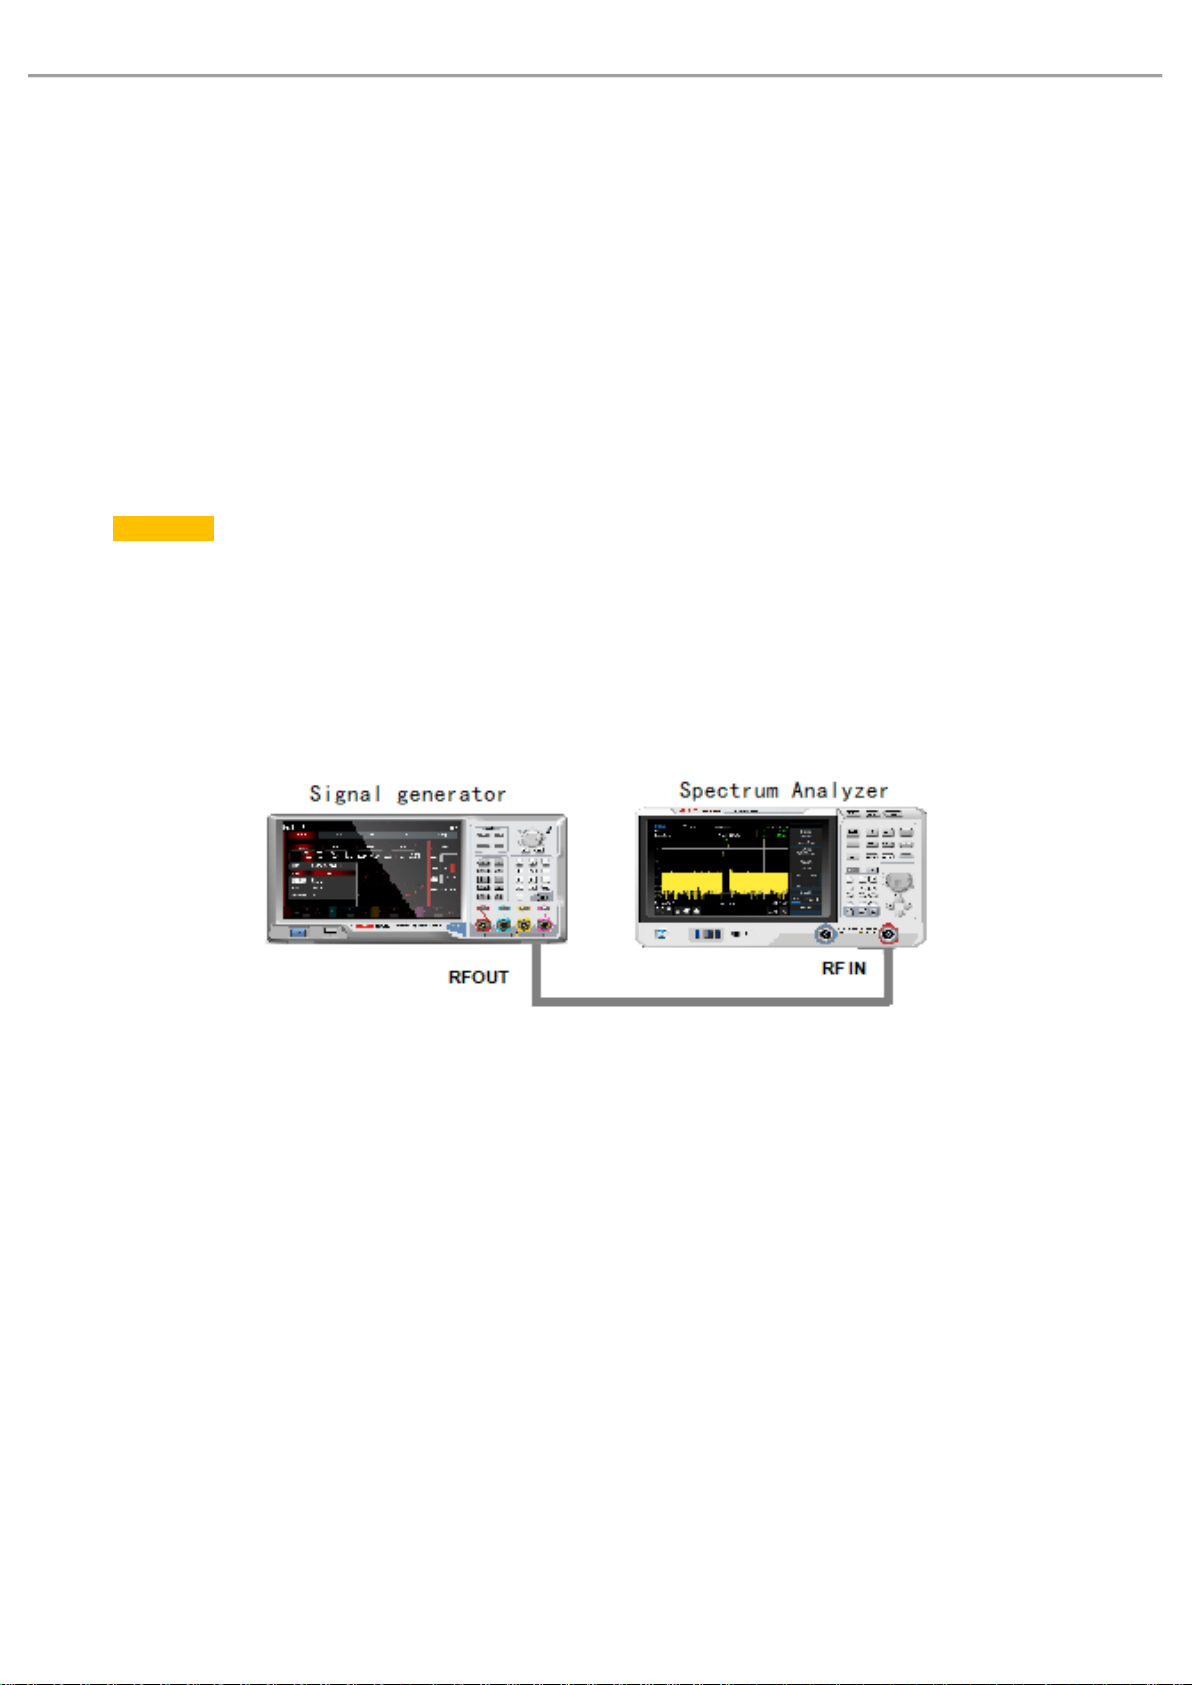
This example shows that use a narrow resolution bandwidth to distinguish two signal with frequency
difference 10 kHz, amplitude difference 50dBm.
1. As shown in Figure 3-4, connect two signal sources to input port of the spectrum analyzer.
2. Set the frequency and amplitude of one signal source to 300Mz, -10dBm, another signal source is set
to 300.01MHz,-60dBm and turn on signal output.
3. Follow the steps to set spectrum analyzer:
Press [Default]>Reset
Press [FREQ]>Center Frequency>300>MHz、Span>200>kHz
Press [BW]>30>kHz
4. Set 300MHz signal as the reference level:
Press [Peak]>Marker→>Ref Lvl
Note
UTS1000B/T’s filter has 4:8:1 shape factor. With a resolution bandwidth of 30 kHz, its 60dB
bandwidth is 144 kHz. Half of this bandwidth (77 kHz) is greater than the frequency difference
of two signals (10 kHz), so the two input signals cannot be distinguished.
Instruments.uni-trend.com 28 / 76
Page 29
User’s Manual UTS1000B/T Series
Figure 3-8: Fail to Distinguish Small Signal from Big Signal
5. Reduce the resolution bandwidth to check the hidden small signal:
Press [BW]>3 kHz
Press [Peak]
Press [Marker]>Marker Mode>Delta △
Press [Marker]>Marker Frequency>10 kHz
Figure 3-9: Distinguish Small Signal from Big Signal
Note
UTS1000B/T’s filter has 4:8:1 shape factor. With a resolution bandwidth of 3 kHz, its 60dB
bandwidth is 14.4 kHz. Half of this bandwidth (7.2 kHz) is narrow than the freq uency difference
of two signals (10 kHz), so the two input signals can be distinguished.
Instruments.uni-trend.com 29 / 76
Page 30
User’s Manual UTS1000B/T Series
Measurement of Low Level Signal
This chapter will describe how to measure the low level signal and how to distinguish it from noise in the
same spectrum. The main method to measure the low signal as follows.
Reduce Input Loss
The spectrum analyzer's ability to measure low level signal is limited by the noise it generates internally.
Input attenuator will affect the level when it passes through a spectrum analyzer, if a signal is much closed
to ground noise, reduce input loss to distinguish the signal from noise.
Caution
RF IN port on the front panel can only withstand an input signal power of no more than +30dBm or a DC
voltage input of 50V. Otherwise, it may cause damage to interior circuit.
1. Press [Default]>Reset to reset spectrum analyzer.
2. Set the frequency and amplitude of signal source to 300MHz, -80dBm, connect RF OUT port of signal
generator to RF IN port of spectrum analyzer and turn on signal output.
Figure 3-10 Instrument Setting for Acquire Single Signal
3. Set the center frequency, sweep span and reference level:
Press [FREQ]>Center Frequency>300MHz,Span>5MHz
Press [AMPT]>Ref Level> -40dBm
4. Move all the required peak (this example is 300MHz) to the center of the screen:
Press [Peak]>Marker→>CF
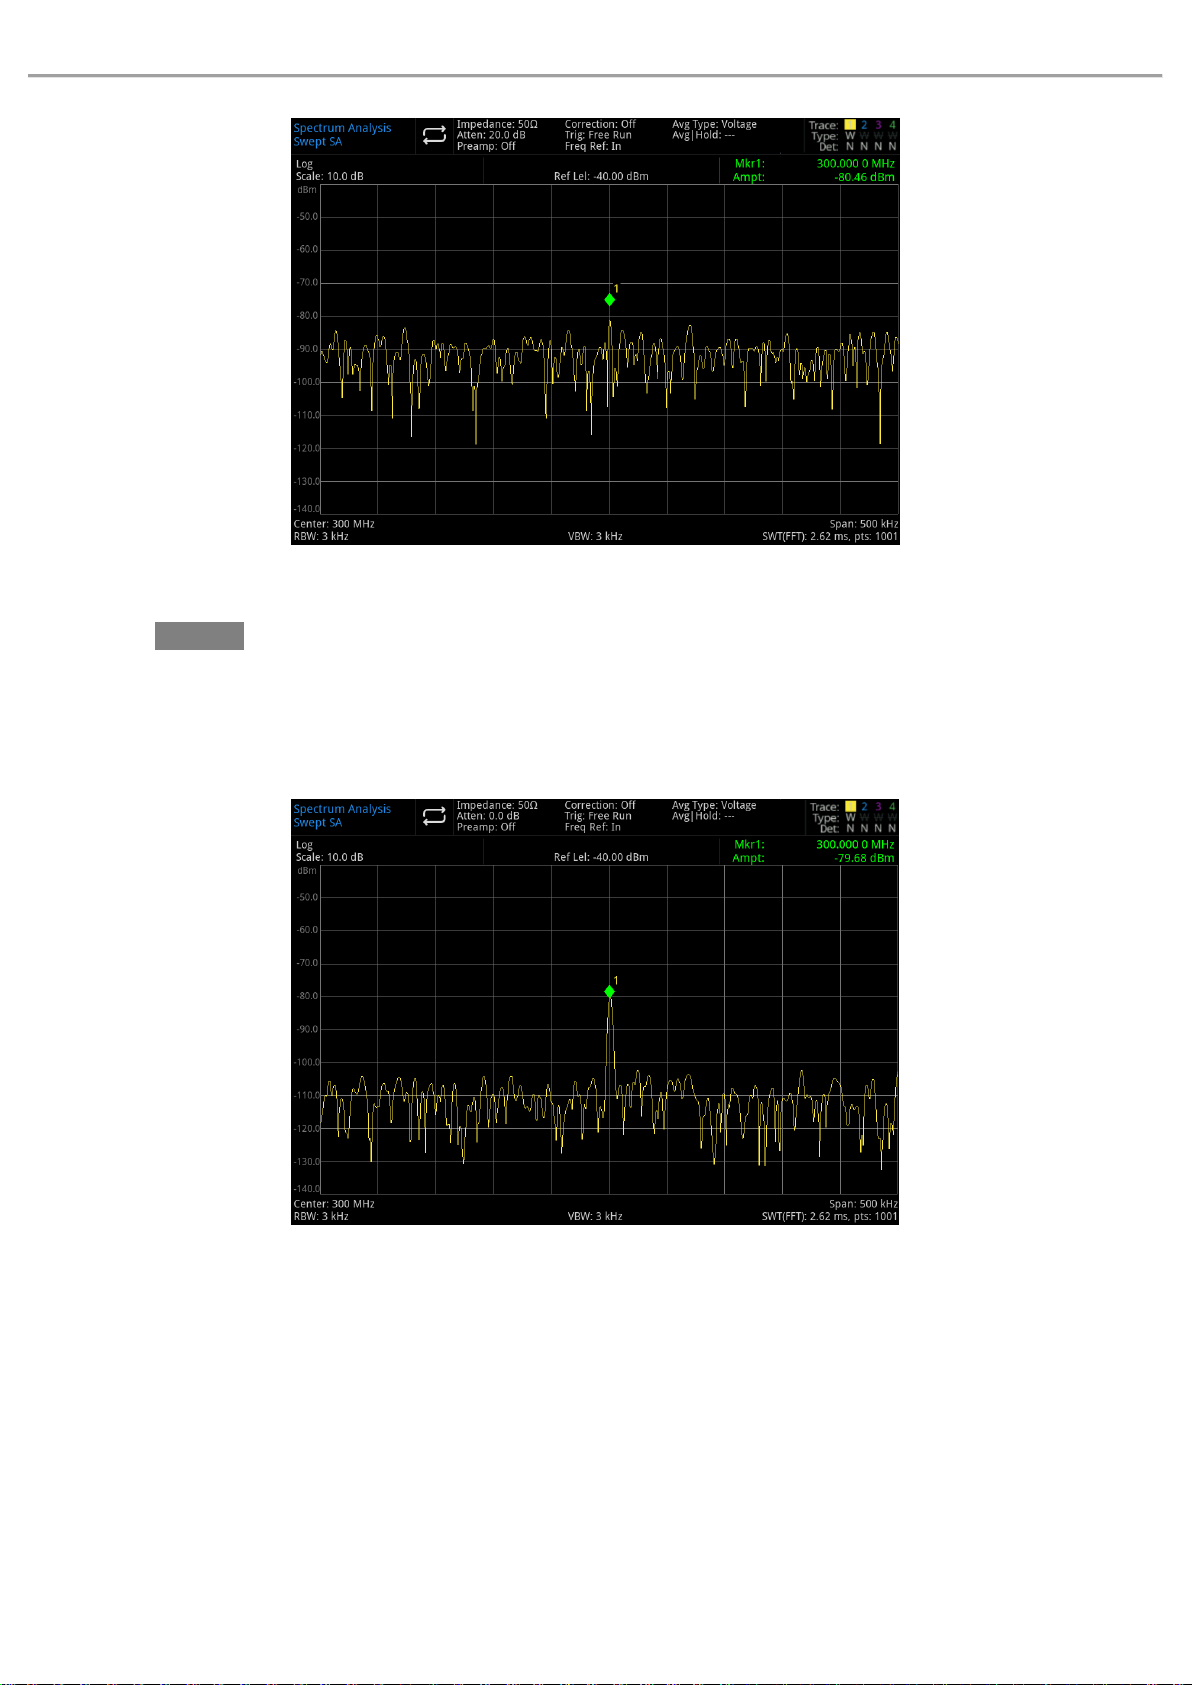
5. Decrease the sweep span to 500kHz(as shown in Figure 3-11);
Press [FREQ]>Span>500>kHz
6. Set attenuation to 20dB:
Press [AMPT]>Attenuation>20>dB
Instruments.uni-trend.com 30 / 76
Page 31
User’s Manual UTS1000B/T Series
Figure 3-11 A Signal Close to Ground Noise
Note
Increase attenuation value to make ground noise close to signal level.
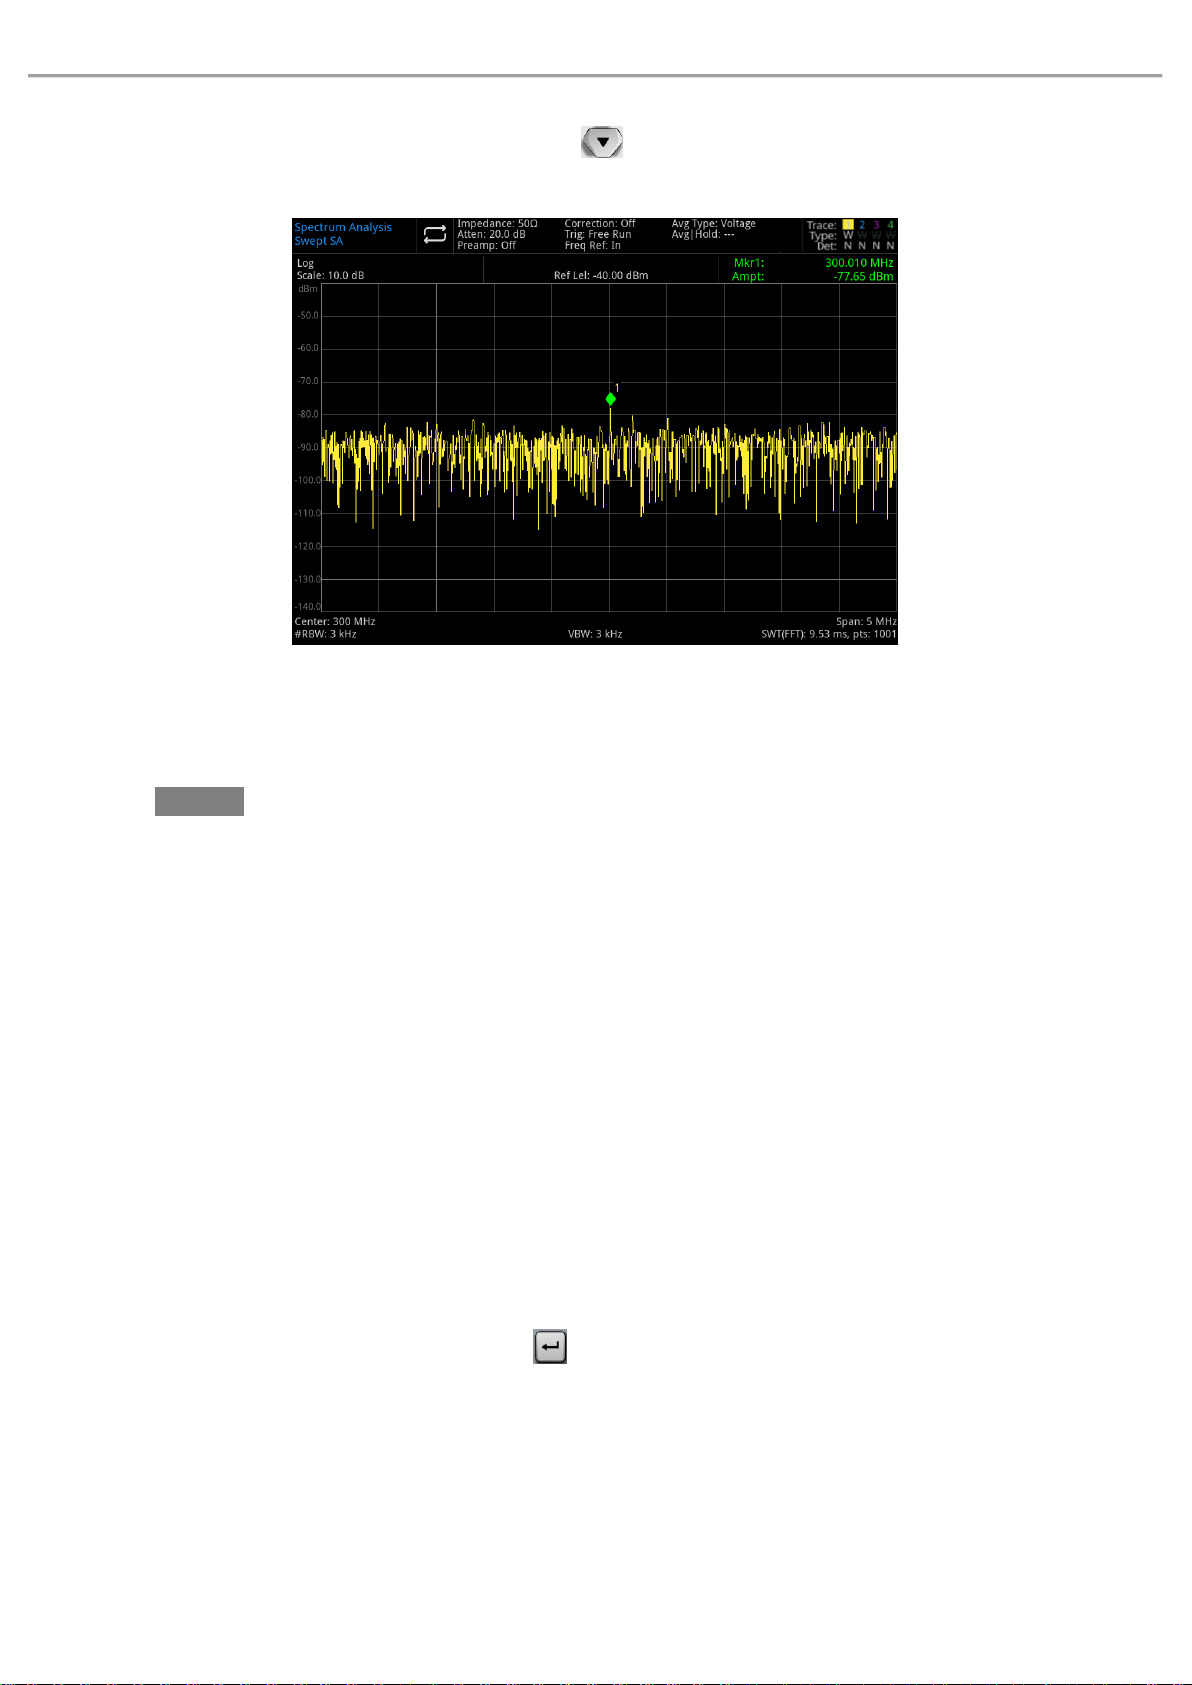
7. Reduce attenuation to 0dB to observe signal more clearly:
Press [AMPT]>Attenuation>0>dB
Figure 3-12 Measuring Small Signal with 0dB Attenuation
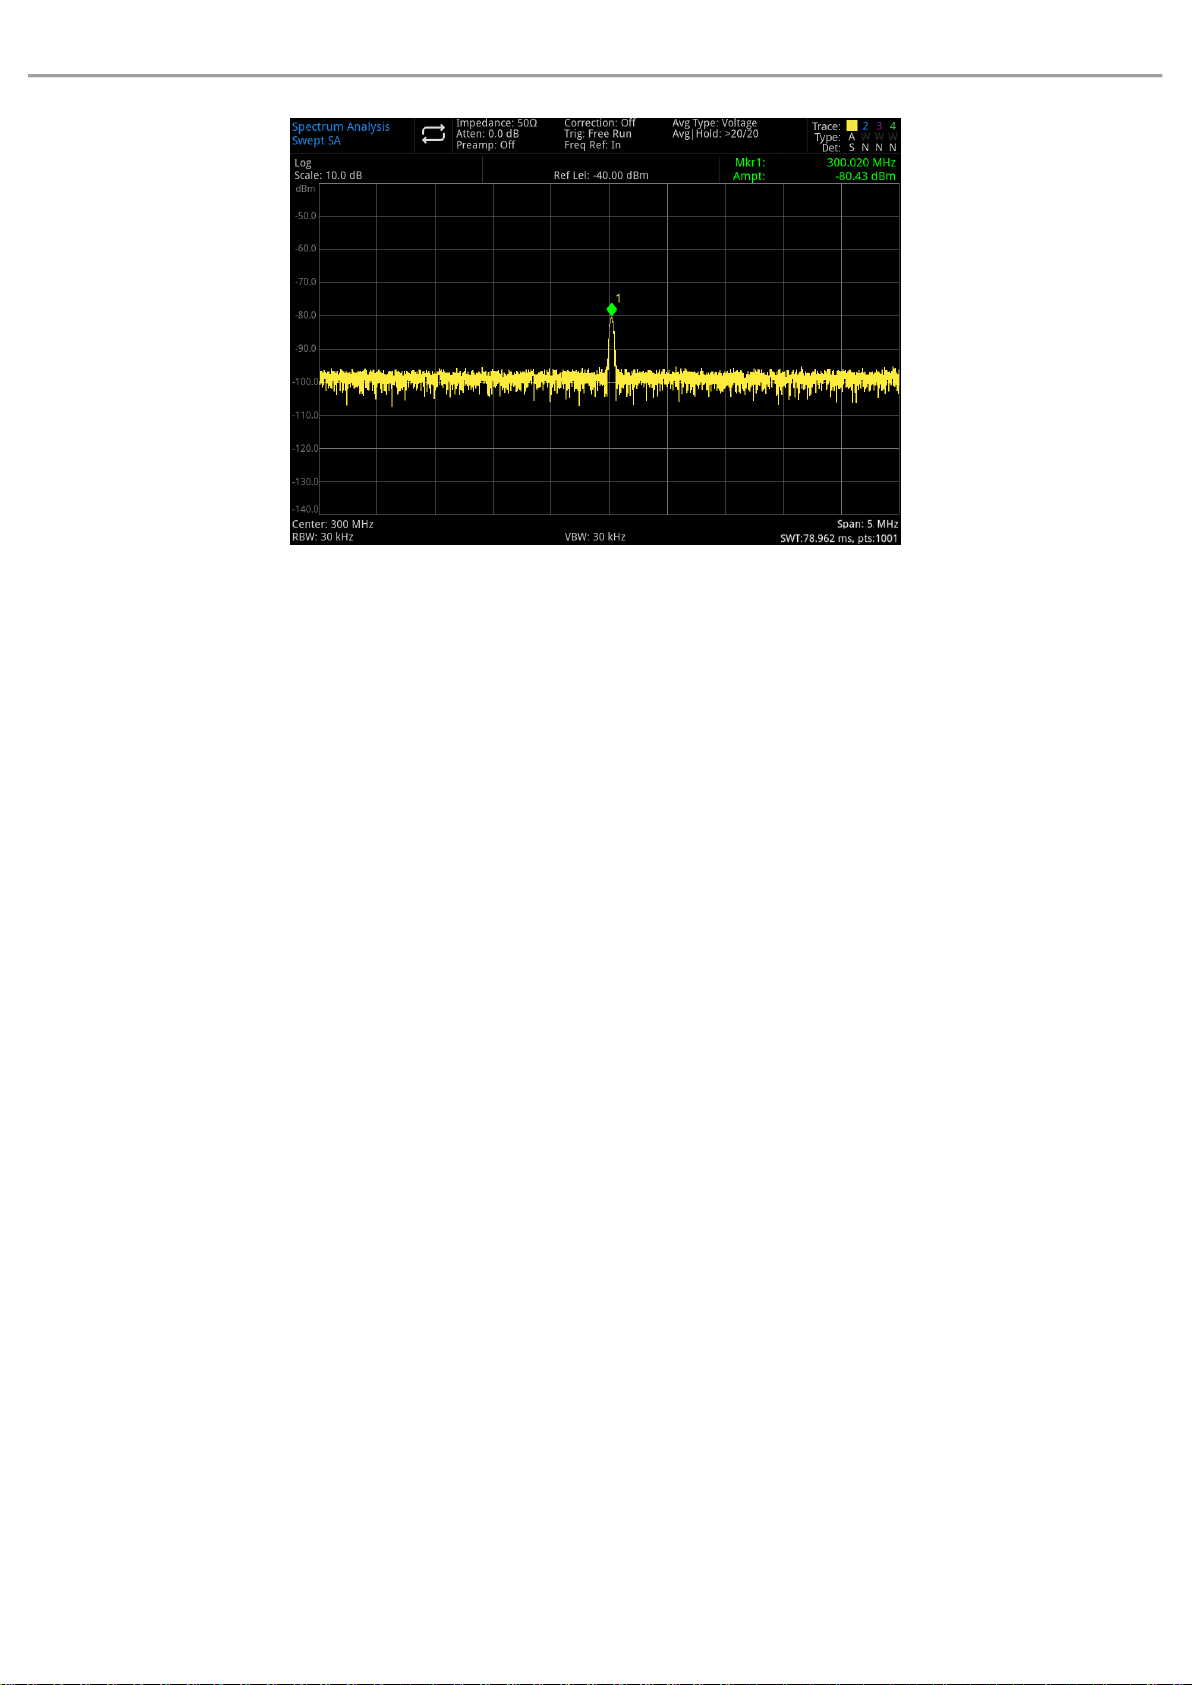
Reduce Resolution Bandwidth
Resolution bandwidth will affect internal noise level, however, waveform continuous signal will not affect by
resolution bandwidth. Reduce resolution bandwidth to 10 times, ground noise will decrease 10dB
accordingly.
1. Refer to “Reduce Input Loss” in this section and follow the steps to perform it.
2. Reduce the resolution bandwidth:
Instruments.uni-trend.com 31 / 76
Page 32
User’s Manual UTS1000B/T Series
Press [BW] to select the resolution bandwidth
As the noise level is reduced, the low signal level will become clearer at this point.
Figure 3-13 Reduce Resolution Bandwidth
Please note that there is a sign”#” at the bottom left of the screen, it presents resolution bandwidth
has no coupling. It’s manual adjustment.
Note
User can use up/down direction key with 1-3-10 sequence to change the resolution bandwidth. RBW
lower to 1 kHz is the resolution bandwidth of digital filter, the filter’s rectangle coefficient (specific
value of filter 60dB bandwidth and 3dB bandwidth) is 4.8:1. RBW greater or equal to 1 kHz, the filter’s
rectangle coefficient is 5:1. The maximum value of RBW is 1MHz, the minimum is 1Hz.
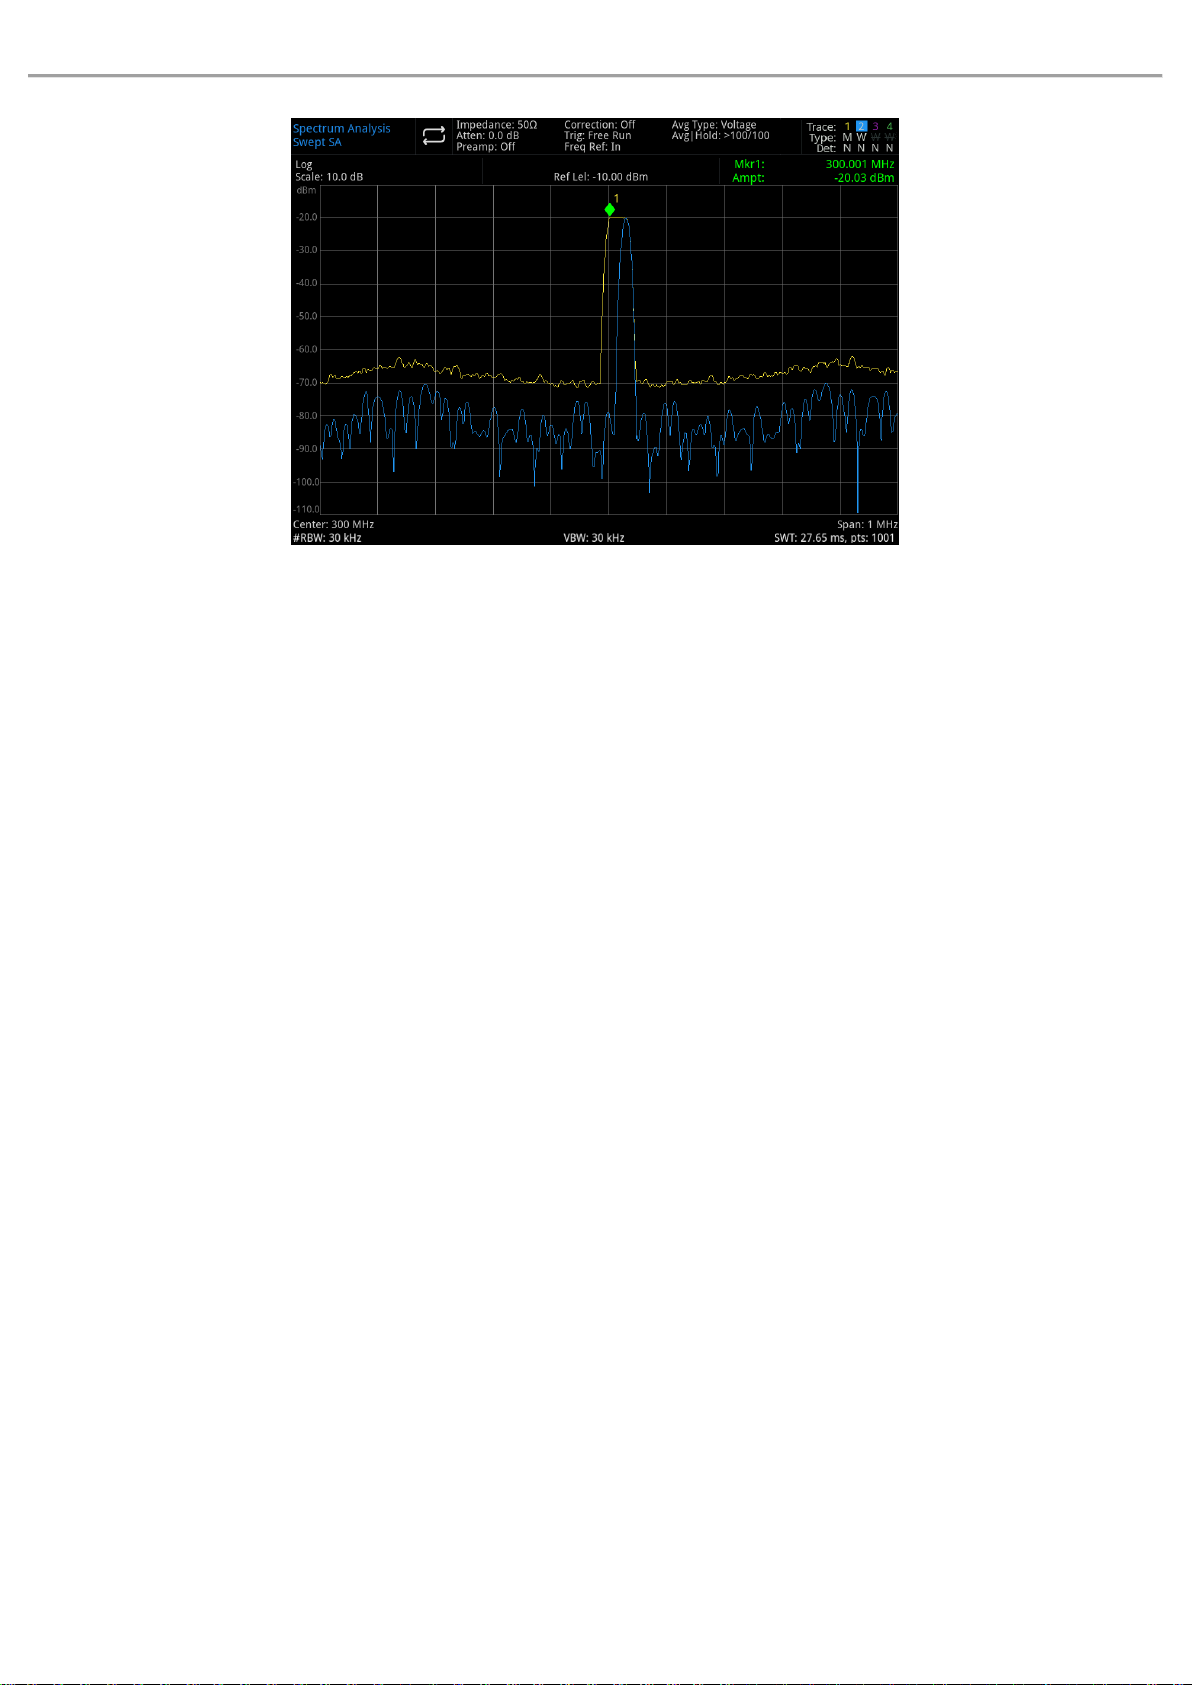
Trace Averaging
Trace averaging is a digital process that adds the current value of each trace point to the previous average
and then took the average. Select the averaging, if the spectrum analyzer is automatic coupling, change the
detection mode to sampling mode, it can make the displayed noise level be smooth.
1. Refer to “Reduce Input Loss” in this section and follow the steps to perform it.
2. Turn on average function:
Press [Trace]>Trace Type>Average
3. Set the average count to 20:
Press [Meas/Setup]>Avg|Hold Number>20>
As the averaging to make trace become smooth, so the low signal can be more clear (as shown in Figure
3-14).
Instruments.uni-trend.com 32 / 76
Page 33
User’s Manual UTS1000B/T Series
Figure 3-14 Trace Averaging
Track Signal Drift
This chapter will describe how to measure and track signal drift.
Measurement of Frequency Shift of Signal Source
This spectrum analyzer can measure the stability of a signal. Use the maximum hold function to display
and keep the maximum amplitude level and frequency shift of an input signal trace.
1. Connect signal generator to RF IN port of the spectrum analyzer.
2. Set the frequency and amplitude of signal to 300MHz,-20dBm.
3. Set the center frequency, sweep span and reference level:
Press [Default]>Reset
Press [FREQ]>Center Frequency>300MHz,Span>1MHz
Press [AMPT]>Ref Level> -10dBm
4. Place a marker at signal peak and turn on search continuous peak function:
Press [Peak]
5. Use the maximum hold to measure signal drift:
Press [Trace]>Trace Type>Max Hold
When the signal is changing, the maximum hold function is to remain the maximum respond of input
signal. Trace mode is displayed in the annotation on the right of the screen, which includes trace, trace
type and detector.
6. Activate and update trace 2 and then select continuous sweep:
Press [Trace]>Select Trace>Trace 2
Press Trace Type>Clear/Write
Trace 1 stay at the max hold mode to display signal drift.
7. Change the frequency of signal source slowly.
Instruments.uni-trend.com 33 / 76
Page 34
User’s Manual UTS1000B/T Series
Figure 3-15 Maximum Hold and Update to Observe Signal Drift
Measurement of Signal Distortion
This chapter will describe how to recognize and measure signal distortion.
Recognize the Distortion Generated by Spectrum Analyzer
A high level input signal may cause the spectrum analyzer to generate a distortion signal, and this distortion
signal will mask the true distortion to be measured on the input signal. User can trace and radio frequency
attenuator to identify the signal. If it presents, that is generated by the instrument internally.
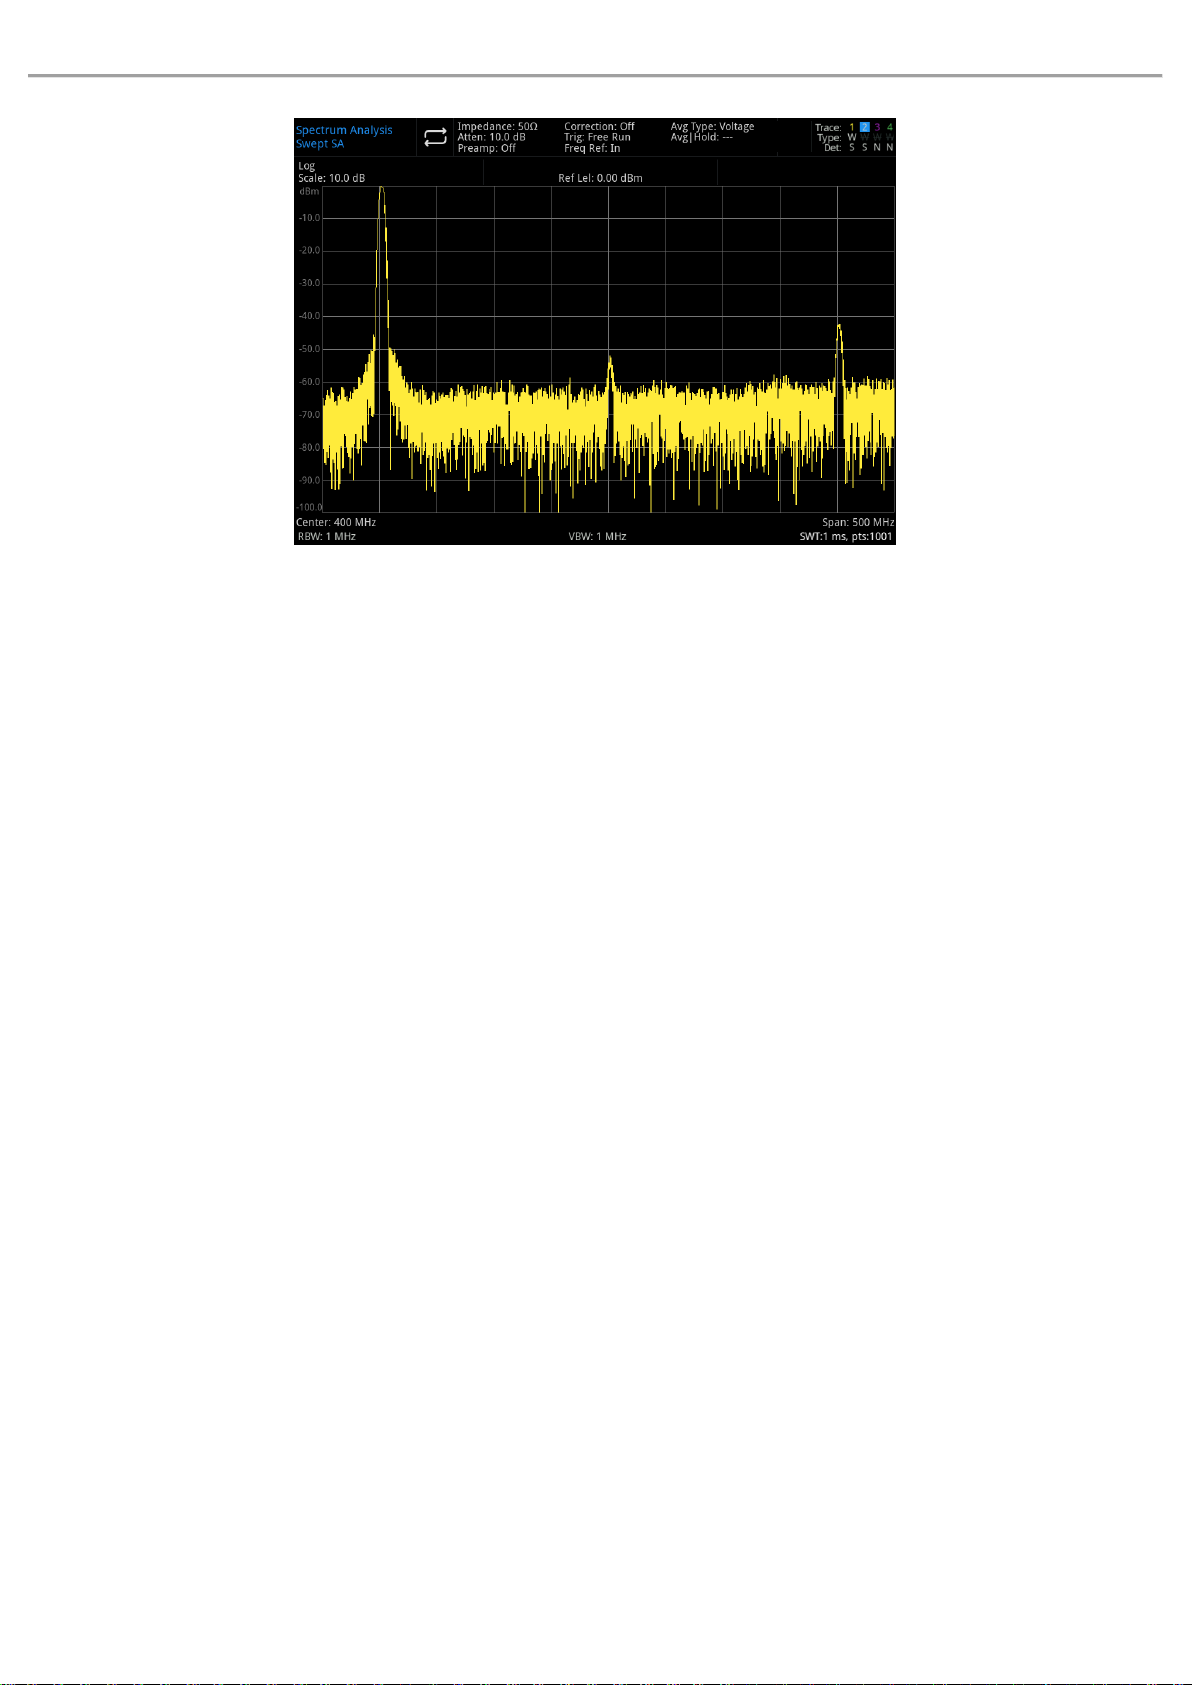
In this example, we use the output signal from a signal generator as a source to identify if the harmonic
distortion component is generated by the spectrum analyzer.
1. Connect the signal source to RF IN port of spectrum analyzer.
2. Set the frequency and amplitude of signal source to: 200MHz, 0dBm
3. Set the center frequency and sweep span:
Press [Default]>Reset
Press [FREQ]>Center Frequency>400MHz,Span>500MHz
Instruments.uni-trend.com 34 / 76
Page 35
User’s Manual UTS1000B/T Series
Figure 3-16 Harmonic Distortion
The harmonic distortion component is generated by this signal at the input mixer of the spectrum
analyzer (lined up sequentially with the original 200MHz signal at 200MHz intervals).
4. Change the center frequency to the frequency value of first harmonic:
Press [Peak]>Next PK
Press [Marker]>Marker→>CF
5. Set sweep span to 50MHz, and redisplay the signal at the center of the screen:
Press [FREQ]>Span>50MHz
Press [Peak]>Marker→>CF
6. Set the attenuation to 0dB
Press [AMPT]>Attenuation>0dB
7. To recognize whether the harmonic wave component is generated by spectrum analyzer, display input
signal at trace 2 firstly:
Press [Trace]>Select Trace>Trace2
Press [Trace]>Trace Type>Clear/Write
Press [Trace]>Update>On
Press [Trace]>Display>On
8. Refresh trace 2 (sweep two times at least) and save the data of trace 2. After that, place a marker at
harmonic component of trace 2:
Press [Trace]>Update>Off
Press [Peak]
Press [Marker]>Marker Mode>Delta △
The spectrum analyzer shows the stored waveform data of trace 2 and being measured data of trace 1.
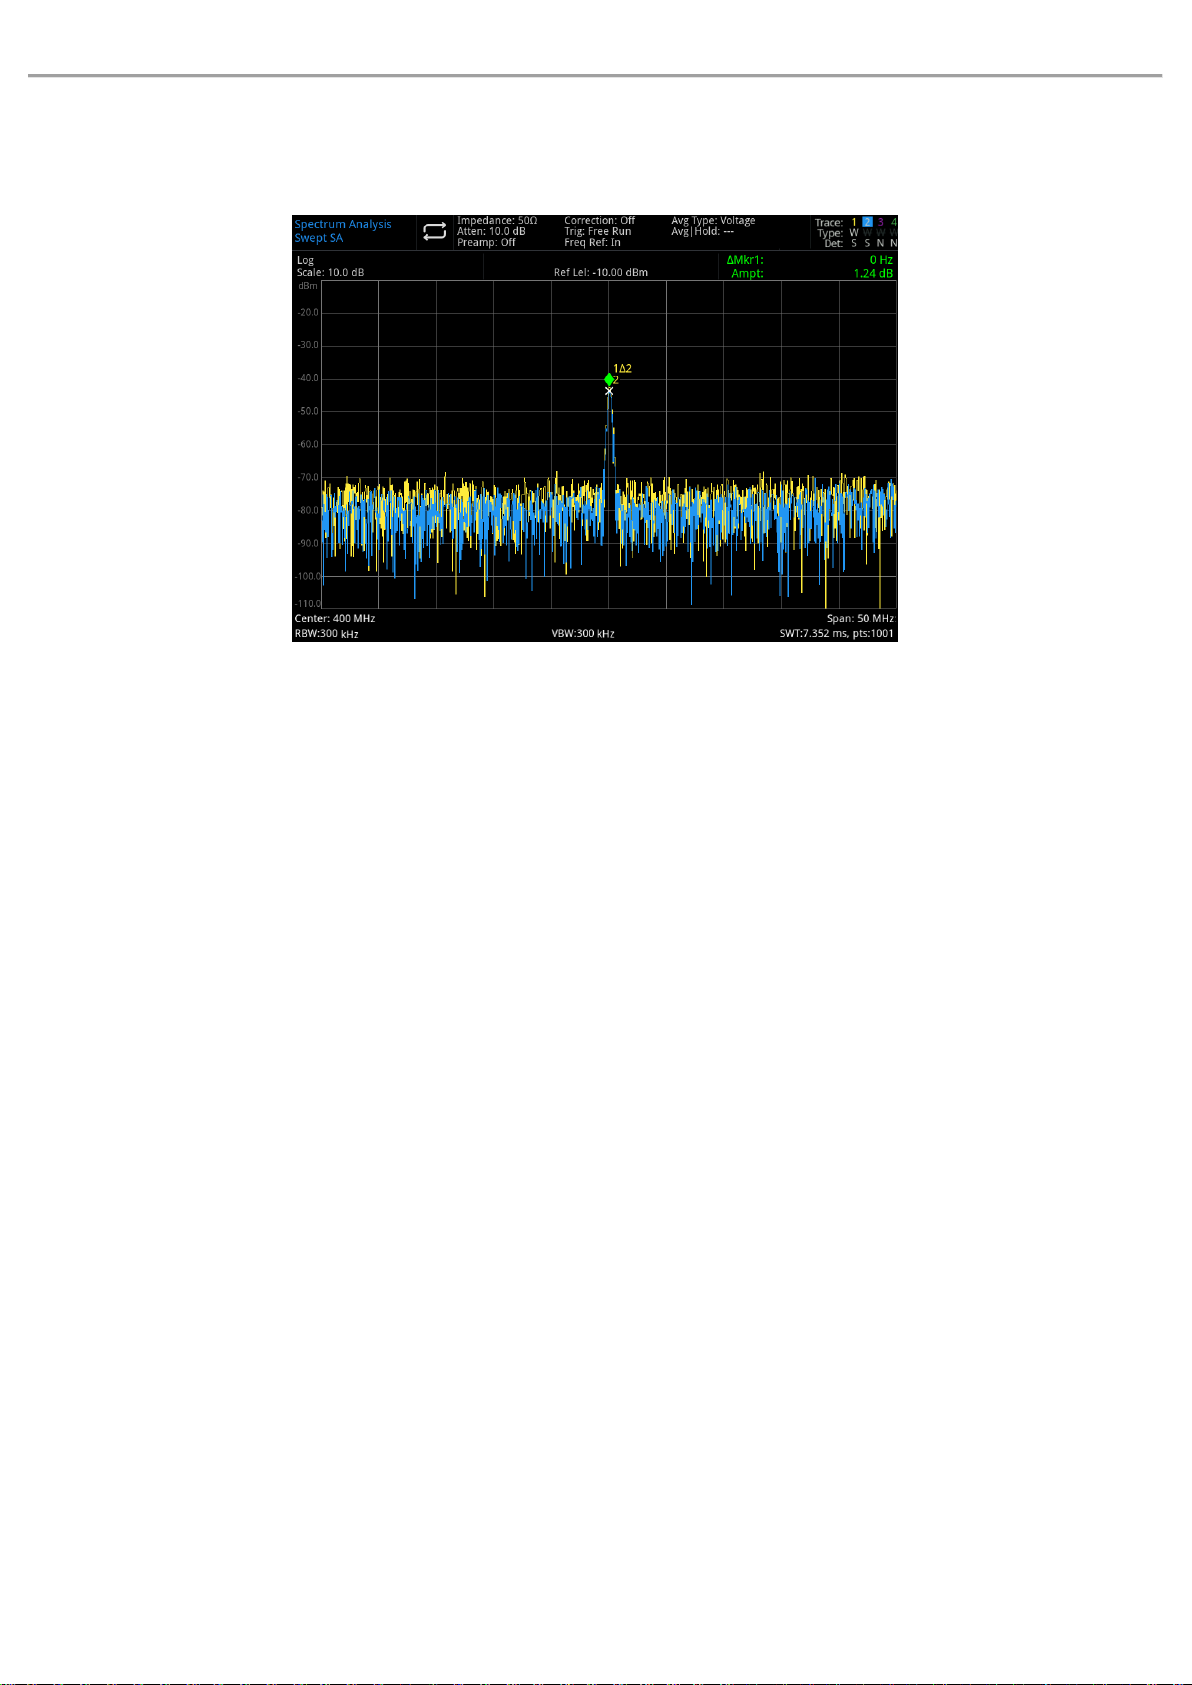
The reading of △Mkr1 is the amplitude difference between the reference marker and the activated
marker.
9. Increase radio frequency attenuation to 10dB:
Press [AMPT]>Attenuation>10dB
Please note that the reading of △Mkr1, this reading is amplitude difference of the same harmonic
distortion component at the input attenuation is set to 0dB and 10dB.
Instruments.uni-trend.com 35 / 76
Page 36
User’s Manual UTS1000B/T Series
In the change of input attenuation, the absolute amplitude of △Mkr1 is about ≥1dB, it can be assumed
that at least part of this harmonic distortion component is generated by the spectrum analyzer (as shown
in Figure 3-17). The input attenuation should be adjusted up in this case.
Figure 3-17 Component of Harmonic Distortion
The reading of amplitude difference of △Mkr1 is affected by the following factors:
1. Increasing the input attenuation will deteriorate the signal-to-noise ratio, and that causes the reading of
△Mkr1 to positive.
2. Losses in the internal circuitry of the spectrum analyzer for harmonics will cause △Mkr1 to read
negative.
A large reading of △Mkr1 indicates a significant test error. It can be minimized by input the attenuation.
Third-Order Intercept Distortion
Measurement of two-tone third-order intermodulation distortion is common in communication systems.
When two signals are input to a nonlinear system, they may interact with each other to produce a third
intermodulation component (TOI) adjacent to the original signal in the spectrum. These distortions are
generated by system component such as the amplifier and mixer.
To quickly set up TOI measurement, see “Third-Order Intercept” for more details.
This example describes how to use a marker to measure the third-order intermodulation distortion of an
instrument. The frequency of the two signal sources used are 299.95 MHz and 300.05MHz.
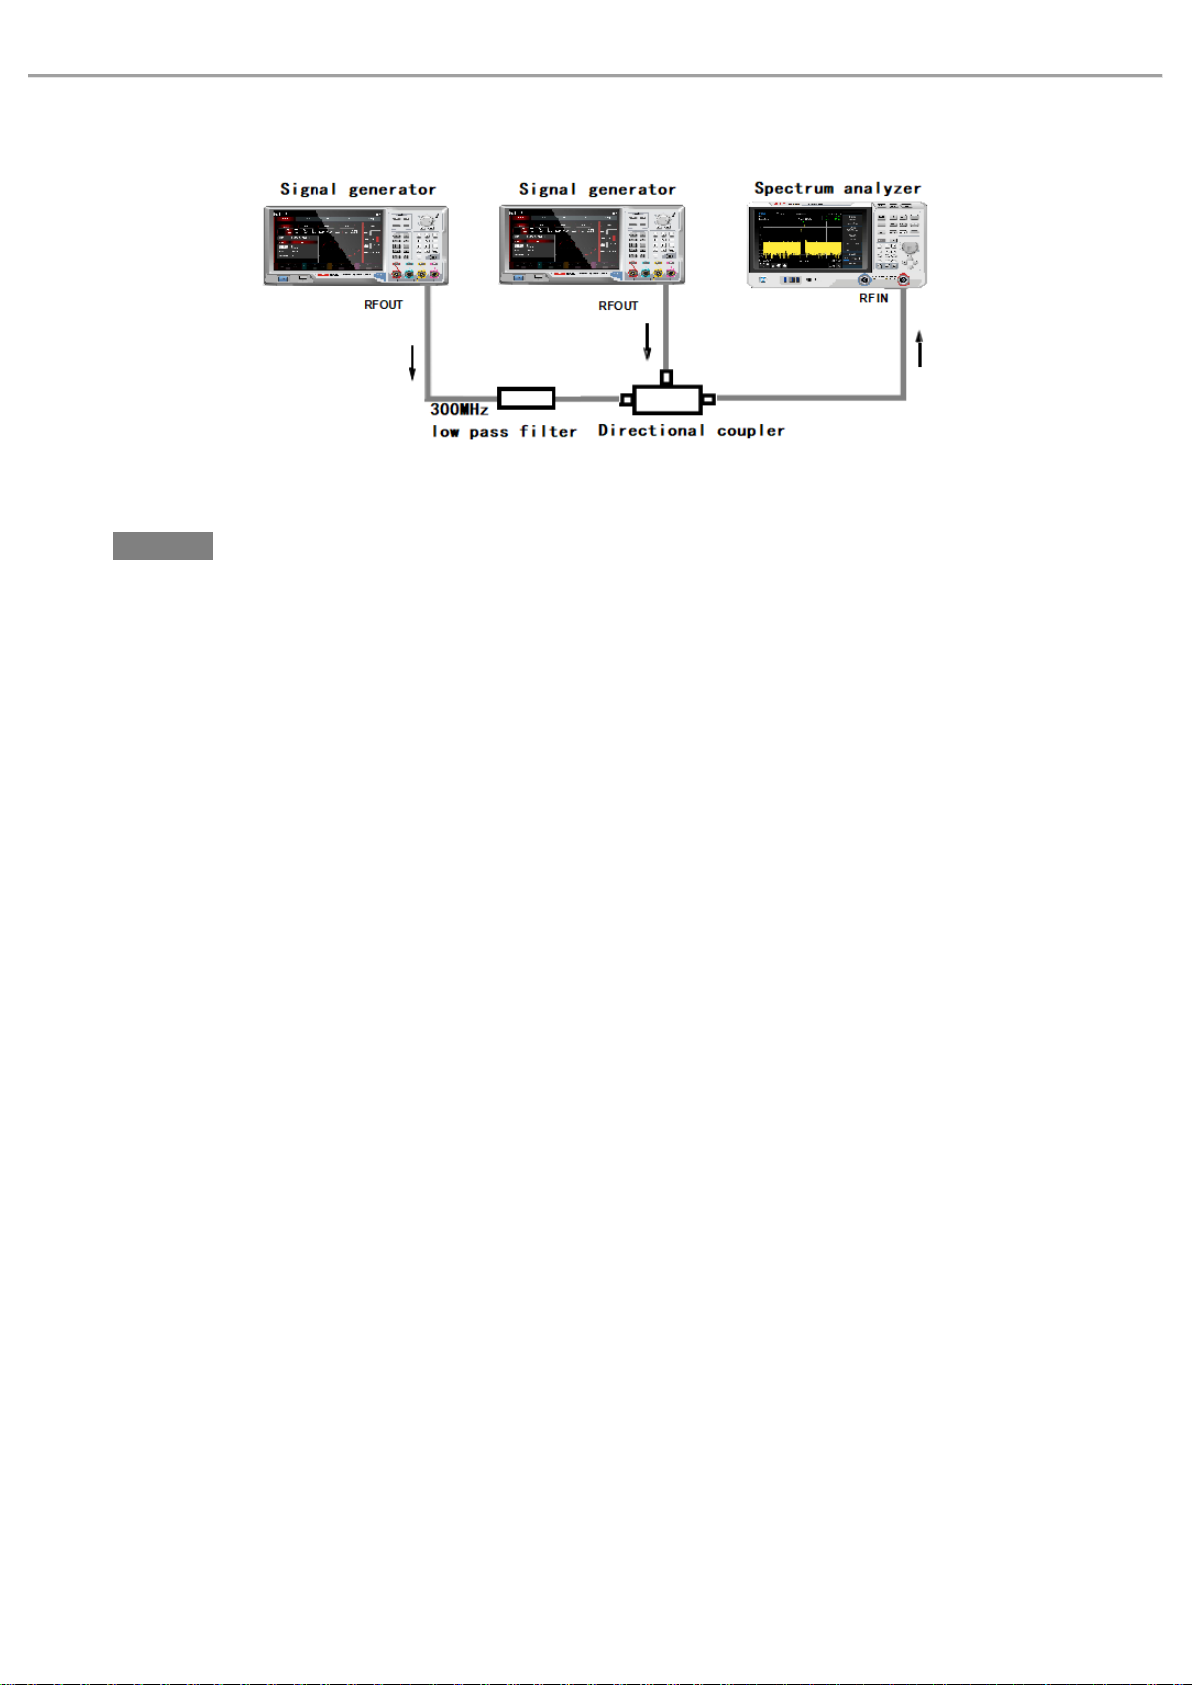
1. As shown in Figure 3-18 to connect an instrument. Connect the input port of the spectrum
analyzer via low pass filter and directional coupler, the output of the directional coupler is
two-tone signal source with low intermodulation distortion.
Although the distortion performance with this connection is better than the spectrum analyzer,
but the TOI for measuring the signal source/spectrum analyzer combination is still useful.
After the TOI performance of the signal source/spectrum analyzer combination has been
calibrated, the instrument under test (DUT) (e.g., amplifier) is inserted between the output of the
directional coupler and the input of the spectrum analyzer.
Instruments.uni-trend.com 36 / 76
Page 37
User’s Manual UTS1000B/T Series
Figure 3-18 Instrument Setting of Third-Order Intercept Signal
Note
Directional coupler must have high degree of isolation between the two inputs so that the two source
signals will not cross modulate.
2. Set the frequency of a signal source (signal generator) to 299.95MHz, the frequency of the other
signal source to 300.05MHz, so the frequency spacing is 100kHz. The amplitudes of the two sources
are set to the same value (in this case, -5dbm).
3. Set the center frequency and sweep span of the spectrum analyzer:
Press [Default]>Reset
Press [FREQ]>Center Frequency>300>MHz,Span>500kHz
4. Reduce the resolution bandwidth until the distortion product can be seen:
Press [BW]>Rotate the Rotary Knob
5. Move signal to reference level:
Press [Peak]>Marker→>→Ref Level
6. Decrease the resolution bandwidth until the distortion can be seen:
Press [BW]>Rotate the Rotary Knob
7. Activate the second marker and use next peak to move it to the peak of distortion signal:
Press [Marker]>Marker Mode>Delta△
Press [Peak]>Next PK
8. Measure another distortion signal:
Press [Marker]>Marker Mode>Normal
Press [Peak]>Next PK
9. Measure the difference between the measured signal and the second distortion signal:
Press [Marker]>Marker Mode>Delta△
Press [Peak]>Next PK
Instruments.uni-trend.com 37 / 76
Page 38
User’s Manual UTS1000B/T Series
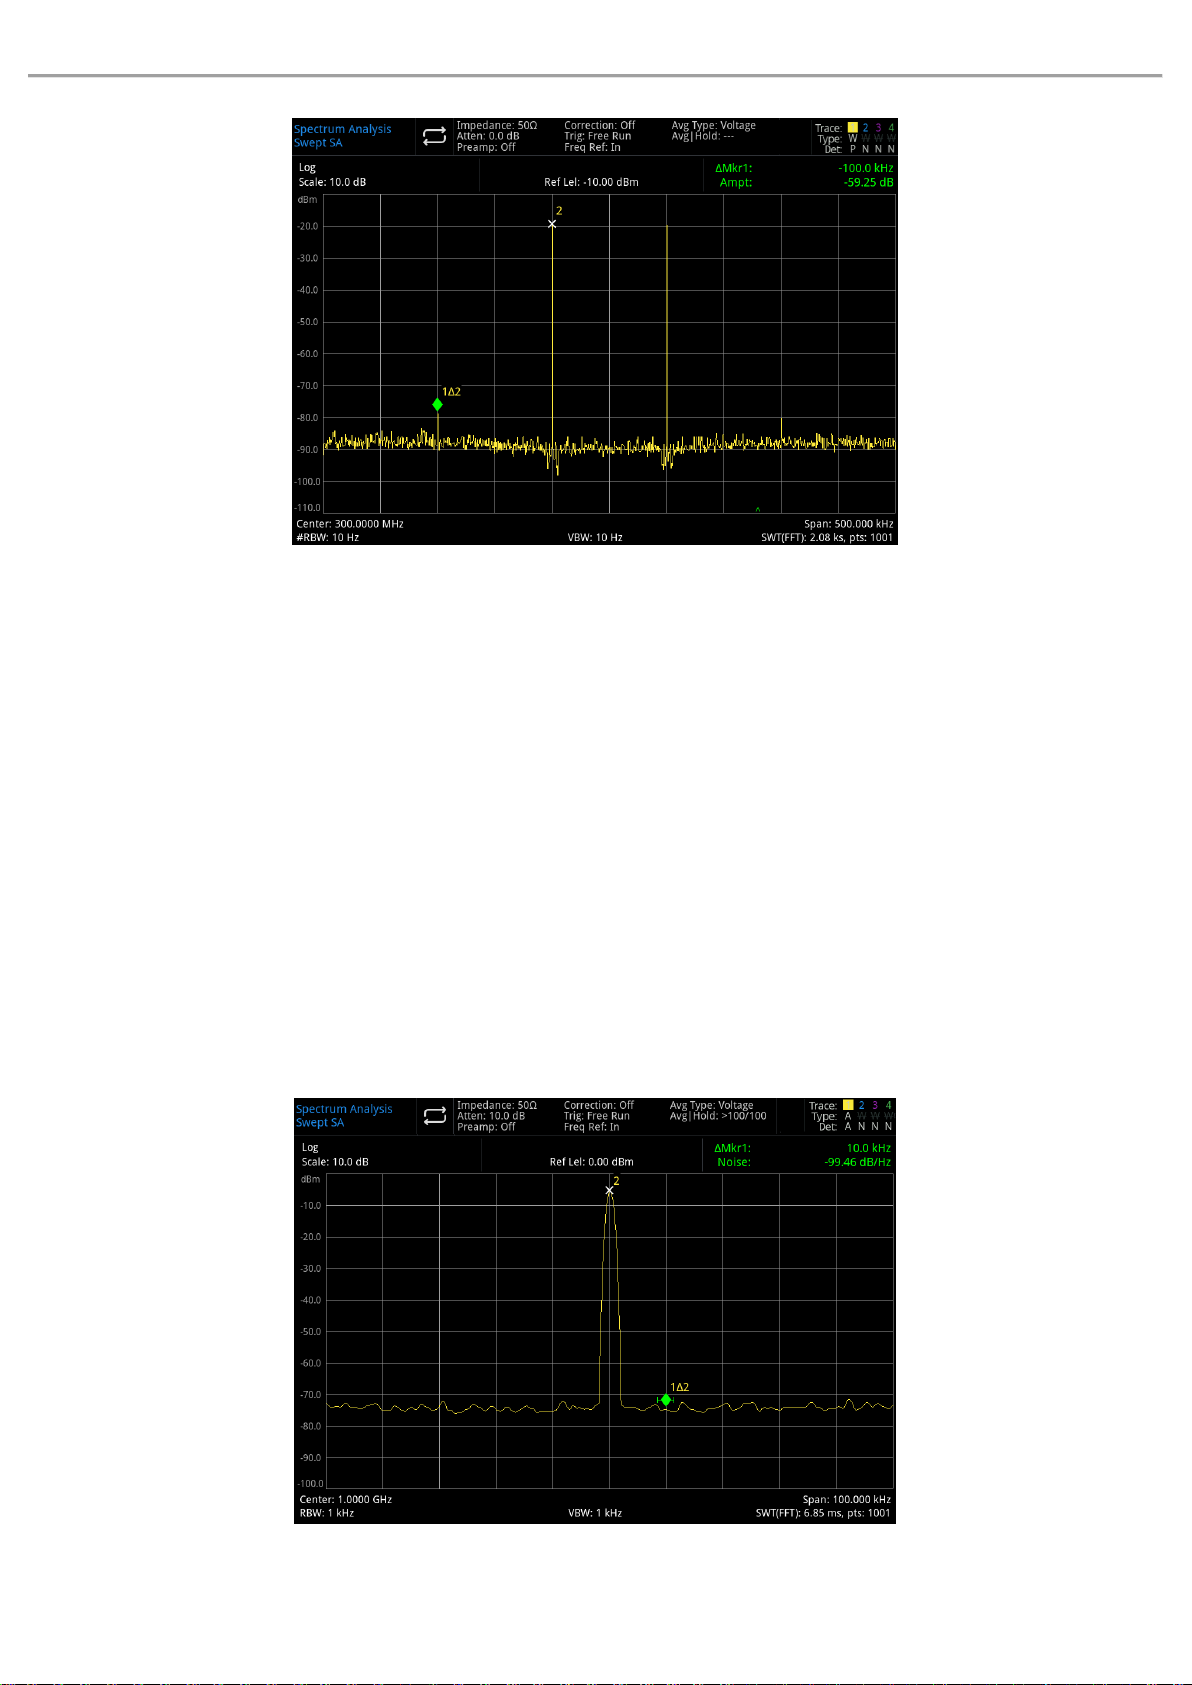
Figure 3-19 Measuring Distortion Product
Measurement of Phase Noise
Measuring the phase noise is to measure the stability in the frequency domain. Specify the phase noise as
the sideband power with respect to the output frequency of fundamental RF, measured at each offset of
the carrier frequency and normalized to 1 Hz in measurement bandwidth.
1 Press [Default] to restore the spectrum analyzer;
2 Use a cable to connect the output port of signal generator to RF IN port of the spectrum analyzer;
3 Press [FREQ] >Center frequency >1 GHz,Sweep width >100 kHz;
4 Press [Trace] >Trace type>Trace average;Detection>Average;
5 Press [Peak] to put a marker on the peak of signal;
6 Press [Marker]>Marker mode >Difference△;Marker△Frequency>10kHz;
7 Open marker function >mark noise,as shown in Figure 3-20:
Instruments.uni-trend.com 38 / 76
Page 39
User’s Manual UTS1000B/T Series
Figure 3-20 Phase Noise
Check Catalogue and Save File
The spectrum analyzer saves and acquires data in a similar way to a personal computer: both have internal
memory and a USB drive. The spectrum analyzer allows you to view and save files on the internal memory or
on a USB. This chapter will show you how to save files and find catalogue.
Find File in Catalogue
Tap the corresponding icon on the left of the screen to find file in the catalogue.
The spectrum analyzer contains six kinds of files:
State file is to save the setting information of the spectrum analyzer. The file suffix is .state.
Trace file is to save the trace information. The file suffix is .trace.
Screenshot file is to save screen capture. The file suffix is .png.
Limit value file is to ensure that trace whether is out of the preset range. The file suffix is .limit.
Correction file is amplitude correction for compensating the gain and loss of the external device. The
file suffix is .corr.
Measuring data is to save the information of trace, peak list or marker list. The file suffix is .csv.
Create New File
Create a new file
1. Press >LocalDisk>UTS1032B to select a catalogue which need to create a file;
2. Tap “New folder” to create a new file.
Multiple Select(On/Off)
1. Press >LocalDisk>UTS1032B or select the catalogue in USB;
2. Turn on “Multi Select” menu;
3. Select the multiple file or tick √ box on the front of the file name to complete multiple selection.
Copy File
If you need to copy files from the internal memory to a USB flash drive, please refer to the following steps:
1. Press >LocalDisk>UTS1032B to select file or folder;
2. Connect U flash disk to USB interface on the instrument;
3. After select the file, tap “Copy” on the screen;
4. Select the catalogue which you want to copy and tap “paste” to complete copy and paste.
Move File
Instruments.uni-trend.com 39 / 76
Page 40
User’s Manual UTS1000B/T Series
If you need to move file or folder from catalogue or move it from the internal memory to a USB flash drive,
please refer to the following steps:
1. Press >LocalDisk>UTS1032B to select file or folder;
2. After select the file, tap “Move” on the screen, the system automatically pops up a dialog box;
3. If you want to move the file to USB, please plug USB at first, and then select the required USB from the
LocalDisk drop-down menu in the dialog box.
4. Select the catalogue which you want to move and click √ in the dialog box to complete the move.
Note
Please do not disconnect USB when moving and saving files to external storage (USB), to prevent data loss
and file corruption.
Delete File
1. Press >LocalDisk>UTS1032B to select file or fold which need to be delete;
2. Tap “Delete” option to delete the selected file;
3. If you want to delete multiple files, tap “MultiSelect” to tick the box in front of the file name, and then tap
“ Delete” to remove multiple files.
Load File
1. Press >LocalDisk>UTS1032B to select file.
2. Tap “Load” to loading the data of the corresponding file which includes state, trace, screen and limit.
Rename File
Change the name of file or folder.
1. Press >LocalDisk>UTS1032B to select the file or folder which you want to rename;
2. Select “Rename” to change the name of file or folder.
Save/Recall File
Import and export the file by the state type (state, trace + state, measurement data, limit and correction)
If there has an external storage, it is preferentially saved to external storage.
See “File Storage(Save)” for more details
Instruments.uni-trend.com 40 / 76
Page 41

User’s Manual UTS1000B/T Series
4. Key Function
Frequency(FREQ)
Amplitude(AMPT)
Bandwidth(BW)
Autotune (Auto)
Sweep
Trace
Marker
Peak
File Storage(Save)
System Setup
Default Setup
Tracking Source(TG)
Single
Touch/Lock Screen
Meas/Setup
Measurement(Meas)
Mode
Note
Key function in this chapter is for sweep mode of the spectrum analyzer.
Instruments.uni-trend.com 41 / 76
Page 42

User’s Manual UTS1000B/T Series
FREQ
Press [FREQ] key to activate the center frequency function and enter the frequency menu. The
numerical value of center frequency, sweep span, start frequency and stop frequency are displayed at
the bottom of the screen.
Center Frequency: This function can set a specific frequency value at the center of the screen and
respectively display the center frequency and sweep span values at the left and right side on the bottom of
the screen. Use numeric key, direction key or touch panel menu to change center frequency.
Note
Under the premise of constant sweep span to change the center frequency, it will automatically modify
the start and stop frequency.
Changing the center frequency which is frequency shifting the current channel, the adjustable range is
limited by the frequency range listed in the technical specifications of the spectrum analyzer.
In zero span, start frequency, stop frequency and center frequency are the same.
Span: This function is to input range value of sweep span. Use numeric key, direction key or touch panel
menu to change sweep span. The sweep span will be changed symmetrically according to the center
frequency. The reading of sweep span is the total displayed frequency range. To determine the sweep span
for each horizontal scale division, the above sweep span should be divided by 10.
Note
Under the premise of constant sweep span to change the width sweep, it will automatically modify the
start and stop frequency.
In zero span, the minimum sweep span can set to 100Hz. When the sweep span is set to the maximum,
the spectrum analyzer enters full span mode.
Changing sweep span to 0Hz by manual setting or press zero span menu to enter zero span mode.
Changing the sweep span in non-zero span mode, if the stepped center frequency and RBW are
automatic, it will be modified automatically. The modification of RBW will cause the change of VBW (in
automatic).
A change in one of three sweep span, RBW and VBW will cause a change of sweep time.
Start/Stop Freq: Start frequency is on the left side of the screen, the right side is stop frequency. After the
frequency setting, it will display at the bottom of the screen, replacing the original displayed center
frequency and sweep span. Use numeric key, rotary knob, direction key or touch panel menu to change the
start frequency.
Note
Changing the start/stop frequency will cause the change of sweep span and center frequency, and the
change of sweep span will affect the parameter of other system.
In zero span mode, if start frequency, center frequency and stop frequency are the same, it will be
modified together.
Freq Offset: Set a frequency offset to explain the frequency conversion between the device under test and
the import of spectrum analyzer. Use numeric key, rotary knob, direction key or touch panel menu to
Instruments.uni-trend.com 42 / 76
Page 43

User’s Manual UTS1000B/T Series
change the frequency offset.
Note
This parameter will not affect the hardware setting of spectrum analyzer, only change the display value
of the center frequency, start and stop frequency.
Set the frequency shift to 0Hz to eliminate the frequency offset.
Full Span: Change the sweep span to display full frequency range.
Zero Span: Set the sweep span to zero. This mode displays the envelope of the time domain signal (the
X-axis is displayed in time unit). Like an oscilloscope.
Note
In zero span, it displays the time-domain characteristic of fixed frequency component of the signal. There
are many differences from the non-zero span mode.
The following function are not invalid in zero span mode:
Marker in [Marker] menu(except ->ref level);
Sweep time and sweep mode in [Sweep].
Zoom Out : Set the sweep span to double of the current sweep span, for observing more signals.
Zoom In: Set the sweep span to a half of the current sweep span, for observing the details of signal.
Last Span: Set the sweep span as the last modified sweep span.
CF Step: Set the stepped frequency will cause the change of center frequency, start and stop frequency.
Use numeric key, rotary knob, direction key or touch panel menu to change the stepped frequency.
Auto Tune: Quick to find the signal that is most likely to be interest and place it optimally on the display.
AMPT
Press [AMPT] key to enable reference level and enter amplitude setting menu.
Ref Level: Set reference level, press [AMPT] key to enable this function. Reference level is the power
or voltage value on the top grid of the screen (Unit is the selected amplitude unit). Use numeric key,
rotary knob, direction key or touch panel menu to change the reference level.
Note
Reference level is the important parameter of spectrum analyzer, it presents the upper limit of
dynamic range of the spectrum analyzer at the current. When the energy of the signal to be measured
exceeds the reference level, it may cause non-linear distortion or even overload alarms. The nature of
the signal to be measured should be understood and carefully select reference level, in order to
perform the best measurement effect and protect the spectrum analyzer.
Attenuation(Auto/Man): Set RF front-end attenuator so that signal can pass through the mixer with low
distortion (small signals with low noise). Input attenuation can be switched between automatic and manual.
When auto is selected, the input attenuation value is linked to the reference level. When manual is selected,
Instruments.uni-trend.com 43 / 76
Page 44

User’s Manual UTS1000B/T Series
the user can change the input attenuation value via the numeric key, rotary knobs, direction key or touch
panel menu.
Note
When the maximum mixer level and reference level are determined, the minimum of input attenuation
of the spectrum analyzer should meet the formula: Reference Level ≤ Input Attenuation-
Pre-amplification -10dBm.
Preamplifier: The switch that controls the internal preamplifier of the instrument. Turn on to produce a gain
to compensate for the preamplifier, so that the amplitude value read out is the actual value of the input
signal. When the pre-preamplifier is turned on, the measurement bar area of the screen displays Preamp:
on.
Scale/Div: Sets the logarithmic value corresponding to a grid in the vertical direction of the screen. The
scale function is only available when the scale type is logarithmic. User can change the scale value by using
the numeric key, rotary knobs, direction key or touch panel menu.
Scale: When the scale type is set to logarithmic, the logarithmic value corresponding to a grid in the vertical
direction of the screen can be used. When linear is selected, the vertical grid becomes a linear scale with
the default amplitude in volts V. The grid line at the top of the screen is the set reference level, while the
grid line at the bottom is the zero level. Each grid is a tenth of the reference level in volts V.
Y Axis Unit: Change the amplitude unit which can be both used in logarithmic and linear mode. Optional unit:
dBm, dBmV, dBμV, V and W. The default is dBm.
Ref Level Offset: When there is gain or loss between the device under test and the import of spectrum
analyzer, an offset value is added to the reference level to compensate for the resulting gain or loss. This
value does not change the position of the trace and modifies the reference level and the amplitude reading
of the cursor.
Impedance: Set the input impedance when converting voltage to power. The default input impedance is
50Ω. If the input impedance of the DUT to the spectrum analyzer is 75Ω, then need to use a 75Ω to 50Ω
adapter to connect the DUT to the spectrum analyzer and set the input impedance to 75Ω.
Correction: Enter the amplitude correction to set the compensation of the gain or loss of external devices,
such as antennas and cables. When the correction is turned on, the trace and the corresponding
measurements are corrected.
1. Select: Spectrum analyzer provides 10 correction factors and each factor can edit independent.
2. Correction(On/Off): The switch of correction, the default is off.
3. Close all: Close all the correction has been turned on.
4. Edit Correction:
Instruments.uni-trend.com 44 / 76
Page 45

User’s Manual UTS1000B/T Series
Select
Provide 10 correction factors to save,
the default: correction 1
Go To row
Select number of revised row
Insert row
Add revised point
Delete row
Delete select row at the current
Delete Correction
Delete Corrected data at the current
5. Delete All: Remove all the saved revised data.
BW
Press [BW] key to enable the resolution bandwidth function, enter panel menu to control the
resolution bandwidth and video bandwidth.
RBW(Auto/Man): Set the resolution bandwidth to distinguish two signals with similar frequency. In manual
mode, the user can change the resolution bandwidth value within the range 1Hz to 1MHz by using the
numeric key, rotary knob, direction key or touch panel menu.
Below to 1kHz, the optional bandwidth value are 1Hz, 3Hz, 10Hz, 30Hz, 100Hz or 300Hz. If the input value is
not one of these values, then select an available bandwidth value which closest to the input value. As the
resolution bandwidth decreases, the system corrects the sweep time to maintain the calibration of the
amplitude. The resolution bandwidth is also related to the sweep span, when the sweep span is reduced,
the resolution bandwidth is also reduced.
In auto-coupling mode, the video bandwidth changes along with the resolution bandwidth, thus the ratio of
the resolution bandwidth and the video bandwidth stay constant.
If the video bandwidth and resolution bandwidth are not coupled, a "#" mark will appear in the bottom left
corner of the screen next to "RBW". Press auto key to re-couple.
VBW(Auto/Man): Set the video bandwidth to filter out ambient noise. In manual mode, user can change the
instrument's video bandwidth value from 1 Hz to 1 MHz by using the numeric key, rotary knob, direction key
or touch panel menu. If the input value is not an available bandwidth value, then select an available
bandwidth value which closest to the input value. As the video bandwidth decreases, the system increases
the sweep time to maintain calibration of the amplitude.
When the video bandwidth and resolution bandwidth are not coupled, a "#" mark will appear at the bottom
of the screen next to "VBW". Press auto key to re-couple.
VBW: 3dB RBW: Select the ratio of video bandwidth to resolution bandwidth. If the signal is similar to the
noise level and the signal response displayed on the screen is blurred, the ratio can be set to less than 1 to
reduce the noise. When reset with [Default], the ratio is set to 1.000. User can change the ratio by using the
numeric key, rotary knob, direction key or touch panel menu.
RBW Filter Type: The UTS1000B/T series supports two types of filters, Gaussian and flat top window.
Gaussian window is a kind of exponential window. The main flap is wide, so the frequency resolution is
low; no negative side flap, the first side flap attenuated to 55dB. Gaussian window is often used to
Instruments.uni-trend.com 45 / 76
Page 46

User’s Manual UTS1000B/T Series
truncate some non-periodic signals, such as exponential decay signal.
The flat top window behaves in the frequency domain with very small passband fluctuations as its
name suggests.
Auto
Press [Auto] key to enable auto tune function to check input signal, the steps as follows,
1. Performing peak search in full span
2. Operating Marker>Center Frequency
3. Operating Marker >Reference level
4. Set the sweep span to 1MHz, other setting is for observing signals.
Note
Valid frequency range of auto tune is 10MHz to 3GHz. It can automatically detect the minimum amplitude of
the signal at -65dBm.
Sweep
Press [Sweep] key to enter the following panel menu to select the sweep and trigger mode.
Sweep Time(Auto/Man): Select the sweep time of display sweep span (or the time used by the spectrum
analyzer for the full screen scan when the sweep span is zero). Decreasing the sweep time will increase the
sweep frequency. In manual mode, user can change the sweep time value by using the numeric key, rotary
knob, direction key or touch panel menu.
1. Sweep span is not zero:
When the sweep time is auto, the spectrum analyzer selects an optimal (minimum) sweep time for the
current setting. This selection is influenced by the following factors.
1. The maximum tuning frequency of the spectrum analyzer
2. The selected video bandwidth filter and resolution
3. The maximum sampling rate of the analog-digital converter
4. Sweeping Points
5. Scale of the amplitude (logarithmic or linear)
6. Mode of the detector
User can select a sweep time that is less than the auto-coupling value; however, this may cause some
measurement errors. The minimum sweep time is 1ms.
2. Sweep span is zero:
The minimum sweep time is determined by the maximum sampling rate of the analog-digital converter and
the sweeping points.
The minimum sweep time is 1us. The maximum scan time is 4000s.
Sweeping Type Rule(Normal/Accuracy): The sweep modes are divided into common sweeping and precise
sweeping.
Common sweeping can get faster scanning speed, and precise sweeping is for high accuracy
measurement.
Instruments.uni-trend.com 46 / 76
Page 47

User’s Manual UTS1000B/T Series
Sweep(Single/Cont): Set the sweep mode to single and continuous, the default is continuous. The
corresponding status at the top of the screen corresponding to the selected mode.
Cont: Set sweep mode to continuous sweep, the icon indicates continuous. The system automatically
sends the trigger initialization signal and enters the trigger condition judgment directly after each sweep.
Single: Set sweep mode to single sweep, the icon indicates single window. Single backlight lights up
after clicking "Single Window".
If the system is currently in single sweep mode and not in a measurement state, press “single” and perform
the sweep when the trigger condition is met.
If the system is currently in single sweep mode and in the measurement state, press the "single" key and
then perform the sweep and measurement when the trigger conditions are met.
Sweep Mode(Auto/Man): Automatic, sweep frequency and FFT mode
1. Auto: The spectrum analyzer automatically selects the sweep mode or FFT mode according to the
current resolution bandwidth, in order to achieve the fastest sweeping speed. When RBW is greater than
or equal to 1kHz, sweep mode is automatically selected; when RBW is less than 1kHz, FFT mode is
automatically selected.
2. Swept: Performed in a point-by-point sweep mode, it is suitable for large RBW.
3. FFT: Performed in parallel sweep mode, it is suitable for small RBW.
When TG is turned on, due to its frequency continuous output characteristics, it will be forced to switch
to sweep mode.
Points: Set the count obtained for each scan, which is the number of points of the current trace. User can
change the point value by using the numeric key or touch panel menu.
1. As the number of sweep points increases, the frequency resolution of the marker point increases, but the
sweep speed decreases along with it.
2. Due to the limitation of interval time of minimum sweep point, the sweep time may become longer when
sweep count increasing.
3. Changing the sweep count will affect several parameters of the system, so the system will be rescanned
and measured.
Demod: Set the demodulation type to "AM" or "FM" or turn off the demodulation function. The default is "Off".
1. When AM (or FM) demodulation is turned on, the system will automatically turn on a cursor, locate it to the
center frequency, and perform AM (or FM) demodulation for that frequency point.
2. The machine is equipped with headphone jack, which can output the demodulation signal in audio mode
through headphone. The audio frequency indicates the frequency of the modulating signal, and the audio
strength indicates the amplitude of the modulating signal.
Instruments.uni-trend.com 47 / 76
Page 48

User’s Manual UTS1000B/T Series
Trigger Type: Freedom trigger, external trigger and video trigger
1. Free Run: The trigger signal can be generated continuously at any time as long as the trigger conditions
are met. No need to set trigger condition, after sweep each frame will sweep the next frame
automatically.
2. Video: When the voltage of the detected video signal exceeds the setup video trigger level, a trigger
signal is generated.
Trigger Level: When the video trigger is selected, the trigger level line and the value of trigger level are
displayed on the screen. User can change the trigger level by using the numeric key, rotary knob,
direction key or touch panel menu.
3. External: Input an external signal via connector【TRIGGER IN】 on the rear panel, a trigger signal is
generated when the signal meets the trigger edge conditions.
Trigger Edge(Rising/Falling): Set the trigger edge for external trigger to be the rising or falling edge of
the pulse, a trigger signal is generated when the signal meets the trigger edge conditions.
Trigger Delay: Set trigger delay time
Trace
Press [Trace] key to enter menu which can select and control trace information and detector. Each
trace consists of a series of data points with amplitude information. With each sweeping, the
spectrum analyzer will refresh information for every valid trace.
Select Trace: Select the required trace, there are 4 traces.
Trace Type: Set the type of the current selected trace. The system will display the scan data after taking
the corresponding calculation method according to the selected trace type. The trace types include refresh,
trace averaging, maximum hold, and minimum hold. Each type has a corresponding parameter on the upper
right side of the screen.
1. Clear/Write
Take the real-time data after sweeping of each point of the trace.
2. Average
Each point of the trace displays the result of averaging the data after multiple sweeps. As the time of
average sweep increases, the waveform becomes smoother.
3. Max Hold
Each point of the trace keeps displaying the maximum value in multiple sweeps, and updates the data
display when a new maximum value is generated.
4. Min Hold
Each point of the trace keeps displaying the minimum value in multiple sweeps, and updates the data
display when a new minimum value is generated.
Detector: Set the detection mode of the current measurement and apply the detection mode to the current
trace. Optional detector types includes sampling, peak, negative peak, normal detection, and average.
1. Sample
For each point on the trace, the sampling shows the transient energy corresponding to a fixed time point
(usually the first sampling point in this time period) in the corresponding time interval. Sampling applies
Instruments.uni-trend.com 48 / 76
Page 49

User’s Manual UTS1000B/T Series
to noisy or noise-like signals.
2. Peak
For each point on the trace, peak detection shows the maximum value of the sampled data within the
corresponding time interval.
3. Negative
For each point on the trace, negative peak detection shows the minimum value of the sampled data
within the corresponding time interval.
4. Normal
Normal detection selects the maximum and minimum values of the sampled data segment in turn to
display, that is, for every odd number point on the trace line, the minimum value of the sampled data will
be displayed. For every even number point on the trace line, the maximum value of the sampled data will
be displayed.
The range of amplitude variation can be observed intuitively by using normal detection.
5. Average
For each data point, detector will take average value by sampling data in the time interval. The average
effect is different for different data types. The average type can set by [Meas/Setup] key.
Update(On/Off): When the refresh is enabled, remove all the stored data in the selected trace and
continuously displays any signals in sweep time. When the refresh is disabled, hold and display the
amplitude data of the selected trace. The trace register will not refreshed with the sweep.
Display(On/Off): Set the switch of the selected trace.
Math Function: Performs mathematical operations between traces or traces and a specified offset.
1. Off: Turn off the mathematical operation.
2. Power(A-B): Calculating the power difference of operands A and B and stored it in the target trace.
During the sweep, the following calculation is performed for each point:
A/10
Trace=10log(10
-10
B/10
).
In the above formula, the parameter unit is the decibel value of logarithmic power. If the value of A point
is the maximum trace value, then the difference result is also the maximum trace value; If the difference
result is less than or equal to 0, the result is the minimum trace value.
3. Power(A+B): Calculating the power sum of operands A and B and stored it the target trace. During the
sweep, the following calculation is performed for each point:
A/10
Trace=10log(10
+10
B/10
).
In the above formula, the parameter unit is the decibel value of logarithmic power. If the value of A or B
point is the maximum trace value, then the sum result is also the maximum trace value.
4. Log(A-B+Offset): With the logarithmic difference function, the operand A is subtracted the operand B
and add the offset, and then store the result in the target trace. During the sweep, the following
calculation is performed for each point:
Trace=A-B+offset
In the above formula, the unit of trace data is dBm.
5. Log(A+Offset): calculating the sum of operand A and offset and store the result in the target trace.
During the sweep, the following calculation is performed for each point:
Trace=A+offset
Instruments.uni-trend.com 49 / 76
Page 50
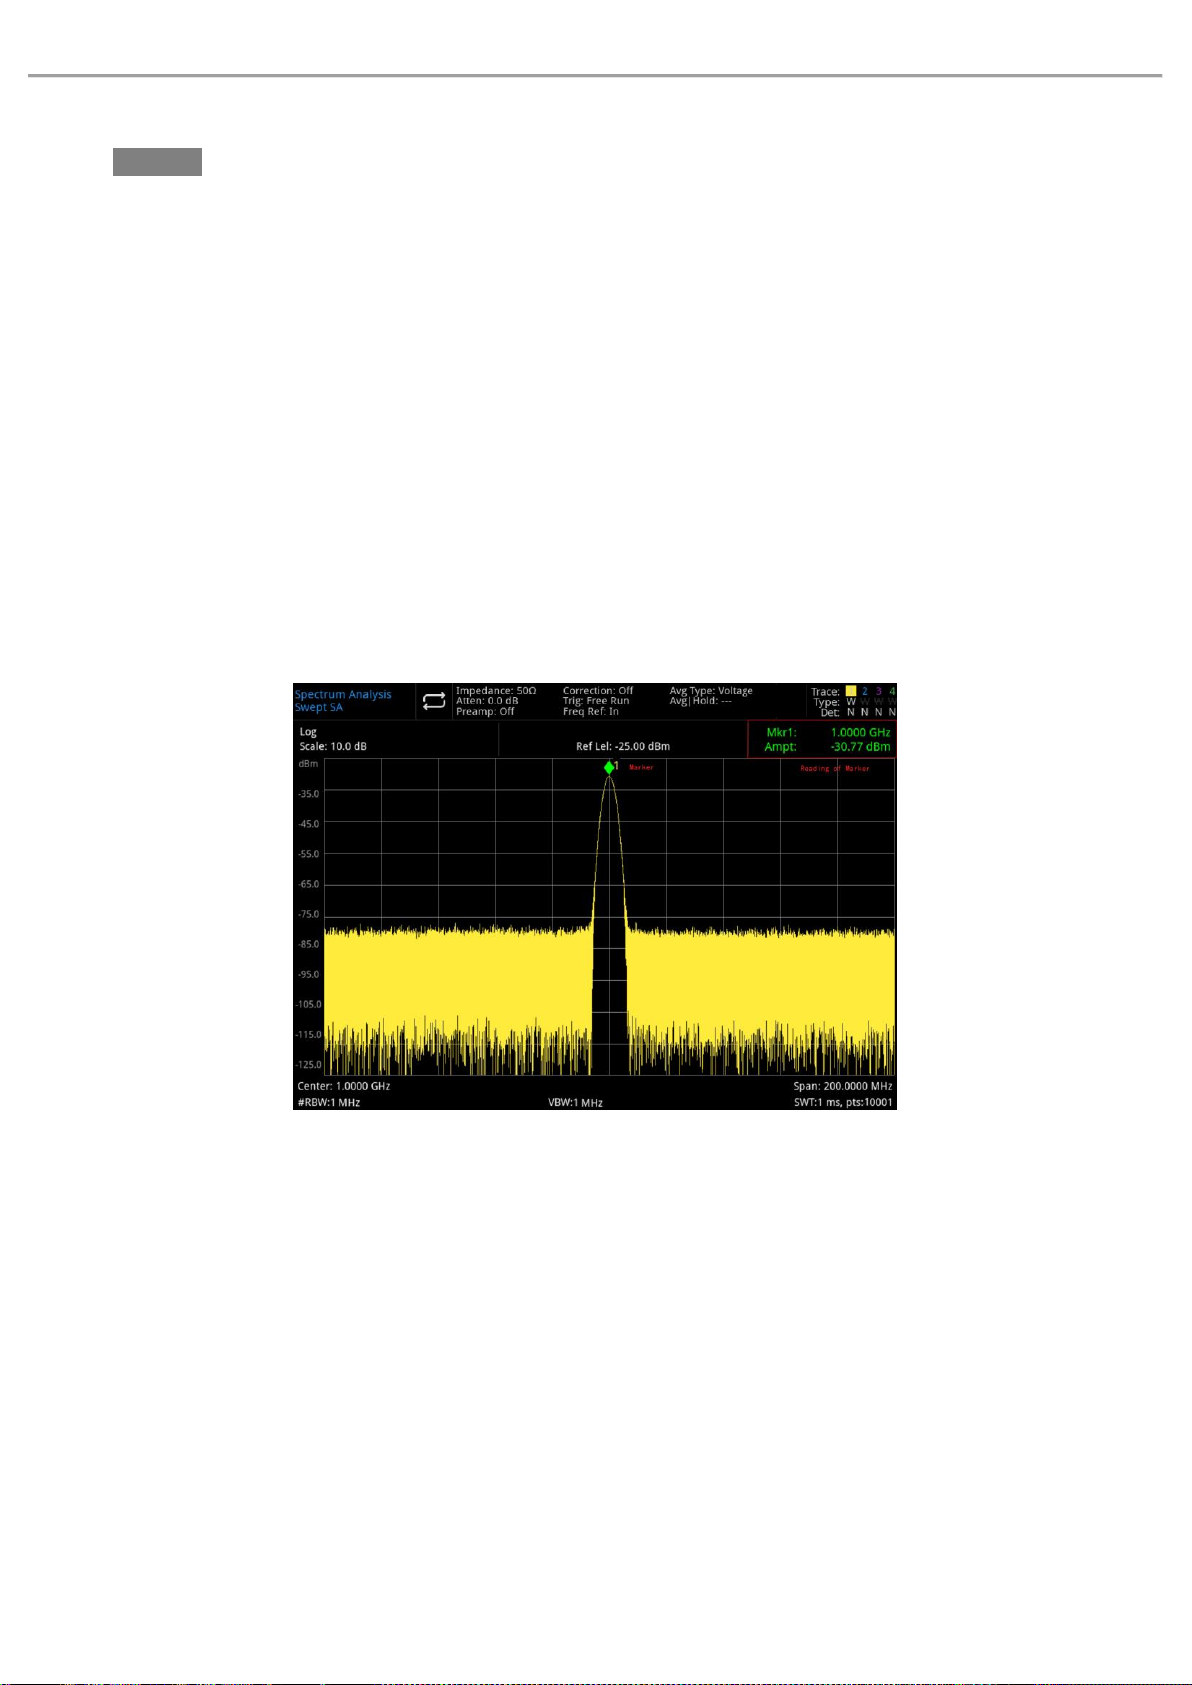
User’s Manual UTS1000B/T Series
In the above formula, the unit of trace data is dBm.
Note
Trace arithmetic functions are mutually exclusive, when an arithmetic function is applied to a trace, it will
turn off the last selected arithmetic function.
Operand A: Set operation trace 1 in the operation function. Trace 1, trace 2, trace 3, trace 4 are available for
selection.
Operand B: Set operation trace 2 in the operation function. Trace 1, trace 2, trace 3, trace 4 are available for
selection.
Offset: Set logarithmic offset in the operation function, unit is dB. User can change the offset by using the
numeric key, rotary knobs, direction key or touch panel menu.
Marker
Press [Marker] key to access marker menu to select type and amount of marker. Marker is a rhombic
icon, as shown in the Figure 4-1.
Figure 4-1 Reading of Marker Cursor
It can display 10 markers on the screen at the time, but each time can only control one or a pair of
markers.
Select Marker: Select one of the ten cursors. The default is signed as marker 1. After selecting the cursor, it
can set parameters such as the cursor type, the marked trace, and the reading mode. The currently open
cursor will be marked on the trace selected by "Mark Trace", the current parameter area and upper right
corner of the screen will display the current active cursor reading at the marker.
Marker Mode:
1. Normal: For measuring X (frequency or time) and Y (amplitude) values in a point of trace. After selecting
normal, a cursor identified by the current cursor number will appear on the trace, such as “1”, pay
attention to the following points in using:
Instruments.uni-trend.com 50 / 76
Page 51

User’s Manual UTS1000B/T Series
If no activated cursor at the current, then activate a cursor at the center frequency of the current trace.
The reading of the current cursor will display on the upper right of the screen.
The resolution of X-axis (time or frequency) reading is related to the sweep span, which can be reduced
to achieve higher reading resolution.
2. Delta△:
Used to measure the difference between "reference point" and a "point on the trace": X (frequency or time)
and Y (amplitude) values.
After selecting "Difference", a pair of cursors will appear on the trace: the reference cursor (marked with
"×") and the difference cursor (marked with "△")
3. Fixed: After selecting "fixed" cursor, set the X and Y values of the cursor directly or indirectly, their
positions remain unchanged. Y value does not change with the trace. The fixed cursor is generally used
as the reference cursor of the difference cursor, and the fixed cursor is marked with "×".
4. Close: Turn off the selected cursor, the cursor information displayed on the screen and the related
function will also be closed.
Mark Trace: Select the trace marked by the current cursor as Trace 1, Trace 2, Trace 3, Trace 4.
Mark Frequency: Mark the frequency point on the trace. User can change the frequency value by using
the numeric key, rotary knob, direction key or touch panel menu.
Relative To: For measuring the difference between two cursors and the two cursor can be marked on
the different trace at the same time.
Properties: Scale selection, manual/automatic switch and mark line switch of X-axis.
1. X-Axis Scale: optional frequency, period, time, inverse time. The marker point reading changes the
reading unit according to the X-axis scale.
Frequency: When this type of reading is selected, “Normal” and “Fixed “cursor shows the absolute
frequency.
“Difference” cursor shows the frequency difference of difference cursor with respect to the reference
cursor. In non-zero span mode, the default reading method is “Frequency”.
Period: When this type of reading is selected, “Normal” and “Fixed “cursor shows the reciprocal of the
cursor frequency.
“Difference” cursor shows the reciprocal of the frequency difference. When the frequency difference is
zero, then the reciprocal will be infinite and the reading show as “---”.
Time: When this type of reading is selected, “Normal” and “Fixed “cursor shows the time difference
between the cursor and sweep start.
“Difference” cursor shows the sweep time difference between the difference cursor and reference
Instruments.uni-trend.com 51 / 76
Page 52

User’s Manual UTS1000B/T Series
cursor. In zero span mode, the default reading method is “Time”.
Inverse Time: When this type of reading is selected, it shows the reciprocal of the sweep time
difference between the difference cursor and reference cursor. When the time difference is zero, then
the reciprocal will be infinite and the reading show as “---”.
2. X-Axis Scale (Man/Auto): When X-axis scale is automatic, the sweep span is in zero span mode, and
marker reading will change to “Time” automatically.
3. Lines (Off/On): turn on/off the mark line.
When the mark line is turned on, the crossover line is displayed at the amplitude point indicated by the
cursor, and the width of the horizontal line and the height of the vertical line are consistent with the
length and height of the grid in the waveform display area.
If the cursor is not in the visible area, then extend the mark line to the display area. This function is useful
for cursors outside the display area, the cursor extension line indicates the amplitude of the cursor, for
observing the comparison.
Marker Function: Mark noise, power in-band and density in-band, N dB bandwidth point and frequency
meter, frequency meter thresholds.
1. Mark Noise: Performing mark noise for the selected cursor, and then reads the normalized noise power
density value at the cursor.
If the current selected cursor is off in the Marker menu, press "Mark Noise" is automatically turned on to
the "Normal" type. Then measuring the average noise level of frequency point at the cursor and
normalized to the 1Hz bandwidth. Meanwhile, compensating for different detection methods and trace
types. When using "RMS average" or "sampling" method, the noise cursor measurement is more accurate.
2. Band Power: In non-zero span mode, calculating the total power of the signal in a certain bandwidth. In
zero span mode, calculating the average power in a certain time range.
3. Band Density: In non-zero span mode, the density in-band is the total power in the bandwidth to be
measured divided by the measurement bandwidth. In zero span mode, the density in-band is the
measured power in-band divided by Bn (Bn refers to the noise bandwidth of the RBW filter).
4. N dB(on /off): Turn on the N dB bandwidth measurement function, or set the value of N dB. N dB
bandwidth refers to the frequency difference between two points where the current cursor frequency
point is down (N<0) or up (N>0) of N dB amplitude to the left and right. User can change the value of N by
using the numeric key, rotary knob, direction key or touch panel menu.
5. Counter(on/off): Turn on the frequency counting function of the cursor. The cursor displays the precise
frequency of the frequency point with the maximum energy. Enable the frequency meter will affect the
scanning speed.
6. Counter Gate: Set the count time of the frequency meter.
Instruments.uni-trend.com 52 / 76
Page 53

User’s Manual UTS1000B/T Series
All Markers Off: Close all the marker point.
Marker->: Use the value of the current cursor to set other system parameters of the spectrum analyzer
(such as center frequency, reference level, etc.). If no cursor is available at the current, press Marker menu
to activate a cursor automatically.
1. ->CF: Set the center frequency of the spectrum analyzer to the frequency of the current cursor.
When “Normal” cursor is selected, the center frequency is set to the frequency of the cursor.
When “Difference” cursor is selected, the center frequency is set to the frequency of the difference
cursor.
In zero span mode, this function is not work.
2. ->CF Step: Set the stepped center frequency of the spectrum analyzer to the frequency of the current
cursor.
When “Normal” cursor is selected, the stepped center frequency is set to the frequency of the cursor.
When “Difference” cursor is selected, the stepped center frequency is set to the frequency difference
between the difference cursor and the reference cursor.
In zero span mode, this function is not work.
3. ->Start: Set the start frequency of the spectrum analyzer to the frequency of the current cursor.
When “Normal” cursor is selected, the start frequency is set to the frequency of the cursor.
When “Difference” cursor is selected, the start frequency is set to the frequency of the difference
cursor.
In zero span mode, this function is not work.
4. ->Stop: Set the stop frequency of the spectrum analyzer to the frequency of the cursor.
When “Normal” cursor is selected, the stop frequency is set to the frequency of the current cursor.
When “Difference” cursor is selected, the stop frequency is set to the frequency of the difference
cursor.
In zero span mode, this function is not work.
5. ->Ref Lvl: Set the reference level of the spectrum analyzer to the amplitude of the valid marker, and
move the marker point to the reference level (top of the grid).
When “Normal” cursor is selected, set the marker amplitude of the spectrum analyzer to the amplitude
of the current reference level.
When “Difference” cursor is selected, set reference level to the amplitude difference between
markers.
Marker Table: Turn on/off marker Table
When the marker Table is opened, all open cursors are displayed as a Table in the window of the split
screen. The display includes cursor number, marker mode, marked trace number, X-axis scale type, X-axis
reading and amplitude. The cursor table can be used to view the measurement values of multiple
measurement points.
Instruments.uni-trend.com 53 / 76
Page 54
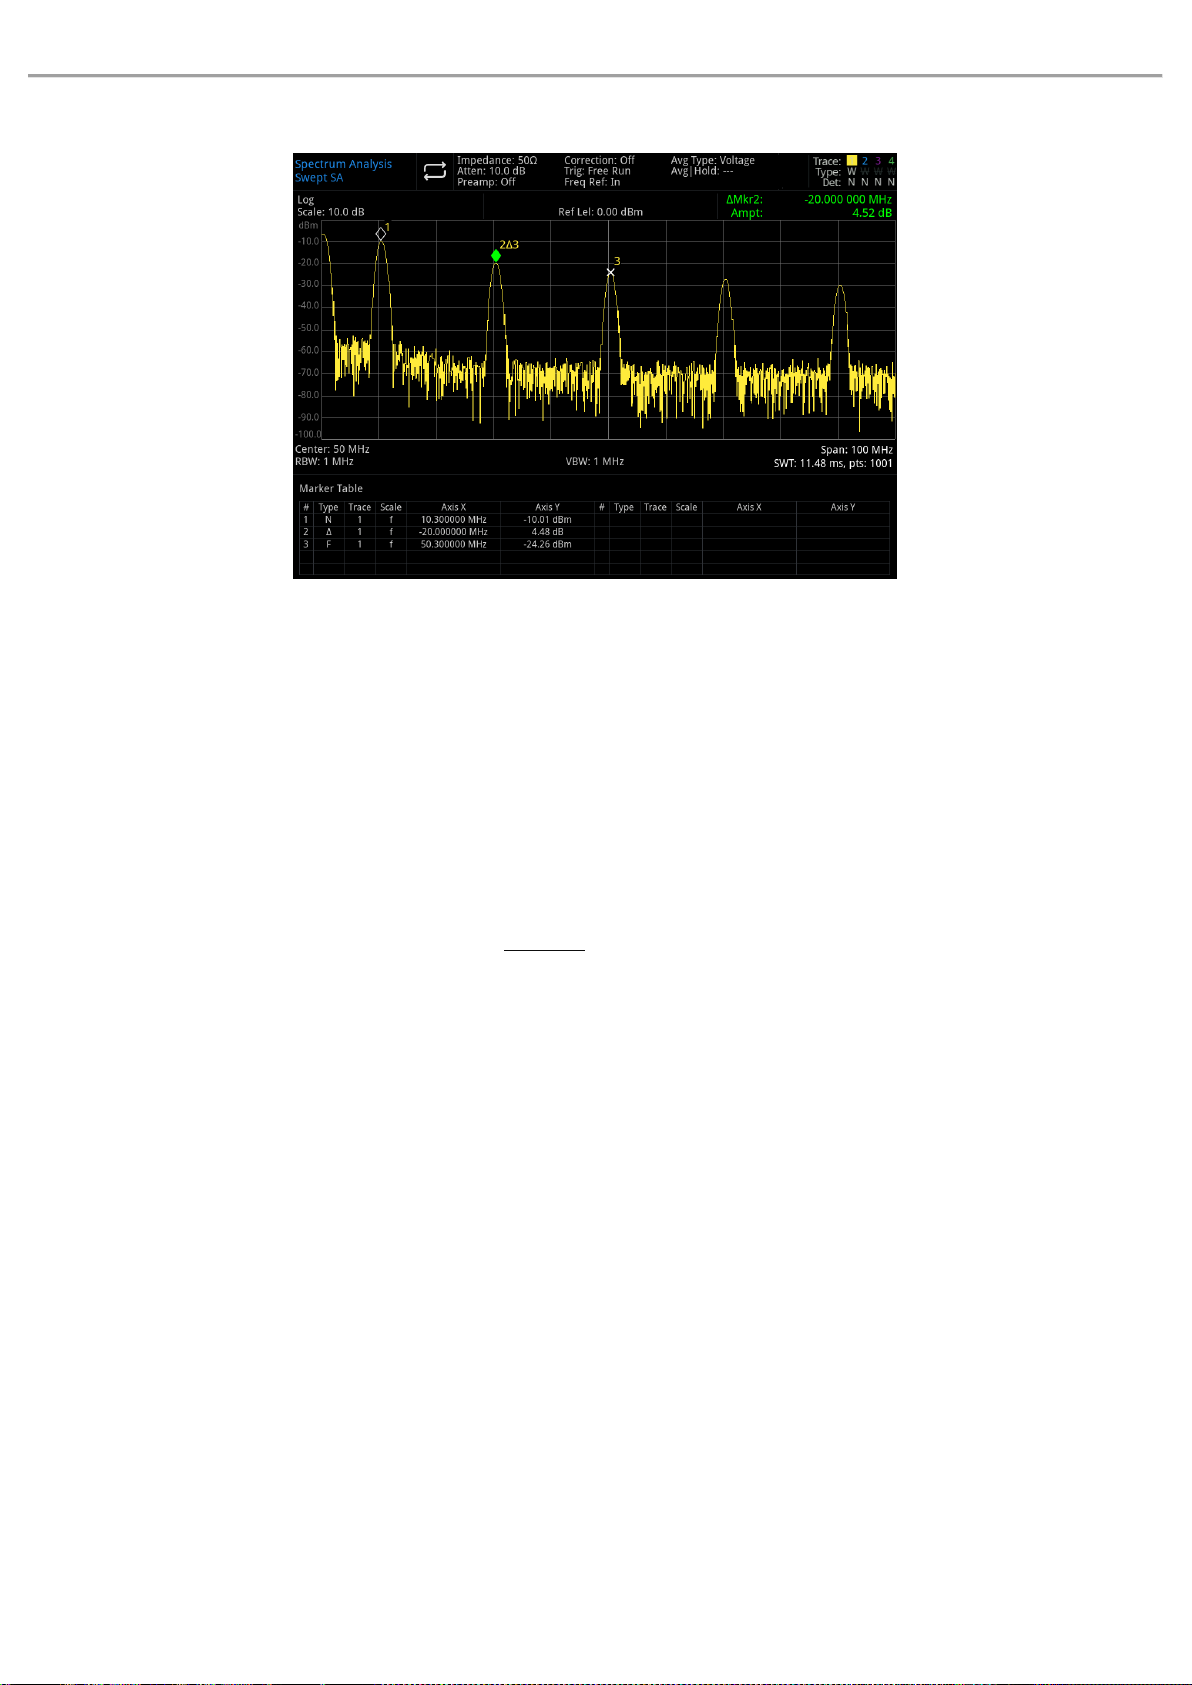
User’s Manual UTS1000B/T Series
Figure 4-2 Marker List
Peak
Press [Peak] key to access peak search menu and perform a peak search function.
Marker Frequency: The frequency point of the marker on the trace. User can change the frequency value by
using the numeric key, rotary knob, direction key or touch panel menu.
Marker->: [Marker] key in the panel menu “Marker->”.
PK Search: Use the normal cursor mode to search for the highest amplitude in the trace and display the
frequency and amplitude value, then press peak search to perform it one time.
Next PK: Find the peak on the trace that is second only to the amplitude to the current peak and meets the
search criteria, and mark it with the cursor. Without this peak, the marker will not move.
Next PK Left: Find the current peak on the left side and search the close peak that meet the search criteria
on the trace, and mark it with the cursor.
Next PK Right: Find the current peak on the right side and search the close peak that meet the search
criteria on the trace, and mark it with the cursor.
Min Pk: Find the minimum amplitude value on the trace and mark by the cursor.
Pk-Pk Search: Perform peak search and minimum search at the same time, the result of peak search
marked with the reference cursor, the result of minimum search marked with the difference cursor.
Instruments.uni-trend.com 54 / 76
Page 55
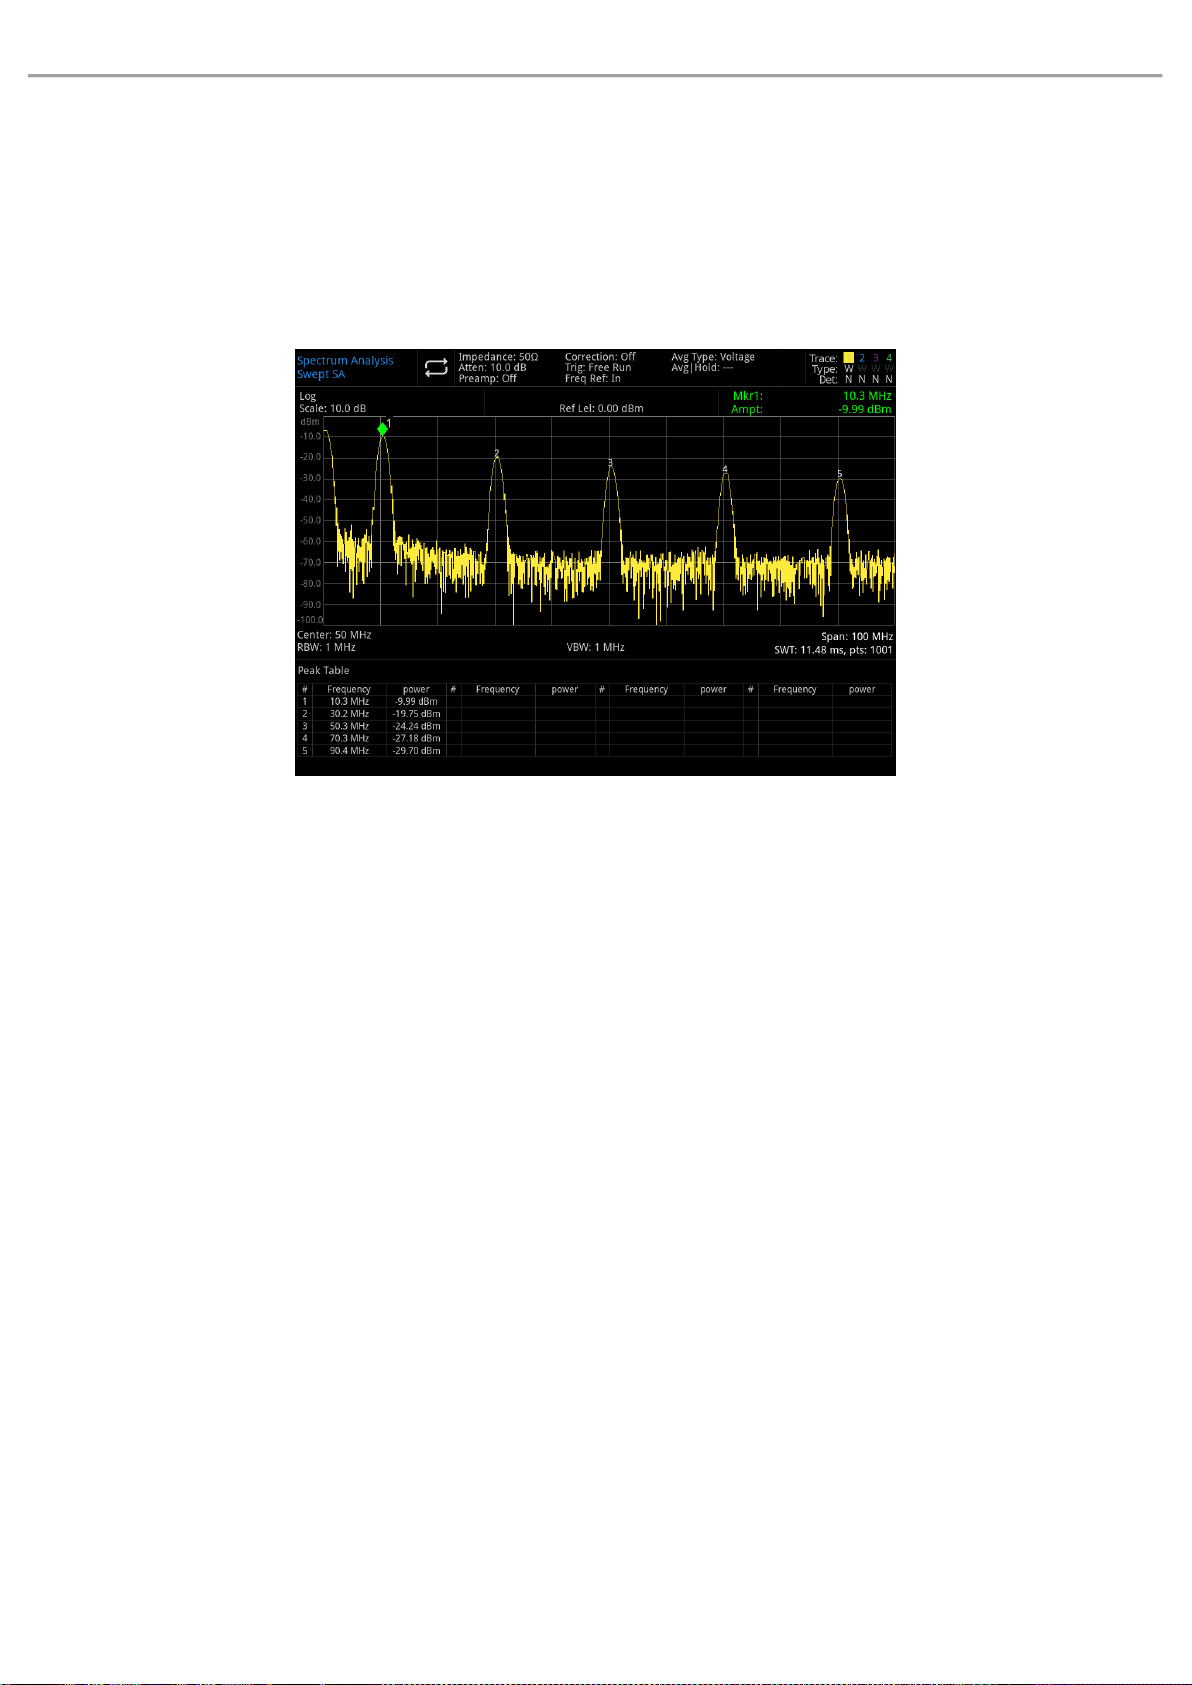
User’s Manual UTS1000B/T Series
Continue Peak Search(On/Off): Turn on/off continuous peak search, the default setting is off. When
continuous peak search is turned on, the spectrum analyzer automatically performs a peak search after
each sweep, which is used to track the measuring signal.
Peak Table(On/Off): Turn on/off peak Table, the default setting is off.
Turn on peak Table, a list of peaks that meet the search parameters (display frequency and amplitude) is
displayed below the split screen window. Display 20 peaks at most that meet the criteria.
Figure 4-3 Peak List
Search Criteria: Threshold line, peak threshold and peak offset.
1. Threshold Line(On/Off): Set whether to display the peak threshold and peak offset indicator line. The
default setting is off.
2. Threshold(Man/Auto): Specify the minimum of peak amplitude by manual or auto. Only peak greater
than the peak threshold can be judged as the peak. User can change the threshold by using the number
key, rotary knob, direction key or touch panel menu.
3. Excursion(Man/Auto): Specify the difference between the peak and the minimum amplitude of the left
and right side. The peak can be judged as the peak only the difference value is greater than the peak
offset. User can change the threshold by using the number key, rotary knob, direction key or touch panel
menu.
Save
Press [Save] key to access save menu, the types of files that can be saved in the instrument are state,
trace + state, measurement data, limit, correction and Save. Long press this key to screenshot.
State: Press State panel menu to access state save menu. Save the state into the instrument.
1. Press Save key, the instrument will save the current state by the default file name or the input file name.
2. After the state file is selected, press Recall key to read the current state file.
Trace + State: Press Trace + State panel menu to access trace and state save menu. Save the instrument
state and selected trace to a file.
Instruments.uni-trend.com 55 / 76
Page 56

User’s Manual UTS1000B/T Series
Trace Selection: there are six traces for selection.
1. Press Save key, the instrument will save the current state and trace by the default file name or the input
file name.
2. After the trace and state file is selected, press Recall key to read the current trace and state files.
Measurement Data: Press Measurement Data panel menu to access measurement data save menu. The
selected measurement data type (such as trace, measurement result, peak list or cursor list) can be saved
into the specified file. The instrument will save the corresponding data in csv (data separated by comma)
format for data analysis by using Excel software.
Trace Selection: there are six traces for selection.
Data type: trace, peak list and marker list.
1. Press Save key, the instrument will save the current selected type of measurement data by the default file
name or the input file name.
2. After the measurement data file is selected, press Recall key to read the current measurement data file.
Limit: Press Limit panel menu to access limit save menu. Save the limit line to a file.
Limit Selection: there are four limit data.
1. Press Save key, the instrument will save the current limit by the default file name or the input file name.
2. After the limit file is selected, press Recall key to read the current limit file.
Correction: Press Correction panel menu to access correction save menu. Save the selected correction
data to a file.
Correction Selection: there are 10 correction data.
1. Press Save key, the instrument will save the current corrected data by the default file name or the input
file name.
2. After the correction file is selected, press Recall key to read the current correction file.
Save: export he current selected file.
Recall: import the current selected file.(This key is hidden when no file is selected).
System
Press [System] key to enter the setting menu, it can access the system information, basic setting and
network setting of the spectrum analyzer.
Information: enter system information panel menu to check basic and option information.
1. Basic Information: manufacturer, product model, serial number, medium frequency hardware version
number, radio frequency hardware version number, medium frequency logical version number, radio
frequency logical version number, etc.
2. Option Information: check version number and state of the option.
Setting: enter the setting menu to set up the basic and network setting.
1. General
Instruments.uni-trend.com 56 / 76
Page 57

User’s Manual UTS1000B/T Series
Language: Chinese, English.
Clock Format: 12-hour and 24-hour.
Date/Time: touch this area to pop out the setting dialog box, swipe the numeric up and down to modify it.
After the setting, touch “√” to confirm it and close the setting dialog box.
Picture Format: set the format of screenshot, it has bmp and png for selection.
Power On: set the system parameter settings that are loaded after power on, it has default, last and
preset for selection.
Backlight: swipe the scroll bar to change the backlight of the screen.
Volume: swipe the scroll bar to change the sound.
HDMI Output: HD multimedia interface, touch “□” to tick it, it indicates the interface is turned on.
Screenshot Inverse: Set the inverse color of screenshot.
User Preset: When the power-on parameter is set to preset, this configuration file will use to set the
parameter when the instrument is turned on.
Shutdown Confirmation: after the shutdown confirmation box is selected, a confirmation dialog box will
pop out.
2. Network
Adapter: that is LAN switch, touch “□”to tick it, it indicates the interface is enabled.
DHCP: touch “□” to tick it, it indicates automatic acquire the network configuration. If no tick it, it
indicates manual setting.
IPv4 Address: the format of IP address is nnn.nnn.nnn.nnn, the first nnn range is 1 to 223, and the other
three nnn range is 0 to 255. It is recommended to consult network administrator for an available IP
address.
IP Mask: the format of subnet mask is nnn.nnn.nnn.nnn, nnn range is 0 to 255. It is recommended to
consult network administrator for an available subnet mask address.
Gateway: the format of gateway is nnn.nnn.nnn.nnn, the first nnn range is 1 to 255, and the other three
nnn range is 0 to 255. It is recommended to consult network administrator for an available gateway
address.
MAC Address: physical address to confirm the location of a network device which is also called hardware
address, the length is 48bits (6 bytes). It consists of hexadecimal digits, including the first 24 digits and
the last 24 digits, in the format of XX-XX-XX-XX-XX-XX. The first 24 bits are called organization-unique
identifiers, while the last 24 bits are assigned by the manufacturer and called extended identifiers.
Restore Defaults: enter restore default menu to perform this function.
1.Setup: Restore the system setting, the system setting of the spectrum analyzer will restore to the default
state.
2. Data:Clear data, all the stored data of the spectrum analyzer will be delete.
3. All:Restore all the setting, all the setting of the spectrum analyzer will restore to the default state.
Instruments.uni-trend.com 57 / 76
Page 58
User’s Manual UTS1000B/T Series
Belongs to the Menu
Parameter Name
Default Value
FREQ
Start Freq
10MHz
FREQ
Stop Freq
3.2GHz(biggest Freq)
FREQ
Freq Offset
0Hz
AMPT
Ref Level
0dBm
AMPT
Attenuation
Auto/10dB
AMPT
Preamplifier
Off
AMPT
Ref Level Offset
0dB
AMPT
Impedance
50Ω
BW
RBW
Auto/1MHz
BW
VBW
Auto/1MHz
Sweep
Sweep Time
Auto/21ms
Sweep
Sweep Mode
Auto/Swept
Sweep
Points
1001
Sweep
Trigger Type
Free Run
Trace
Select Trace
1
Trace
Trace Type
Clear/Write
Trace
Detector
Normal
Trace
Update
On
Trace
Display
On
Meas
Meas Type
Swept SA
Meas/Setup
Avg|Hold Number
100
Meas/Setup
Avg Type
Voltage
Default
Press [Default] key to provide a convenient start environment for measurement.
Press [Default]>restore to the factory setting,
1. Reset spectrum analyzer to Spectrum Analyzer (SA) mode.
2. Enter frequency menu.
3. Set the default parameter for some environment.
4. Perform processor test but not affect the correction data.
5. Delete the input and output caches and all trace data.
6. The amplitude values of traces 2, 3, 4 are not displayed.
7. The amplitude correction factor is turned off but remains in the spectrum analyzer's memory.
8. The limit line test is turned off but the list of limit line remains in the spectrum analyzer's memory.
9. The state is directly set to 0.
The default values of key parameters after reset are as follows:
Instruments.uni-trend.com 58 / 76
Page 59

User’s Manual UTS1000B/T Series
TG
Press [TG] key to enter tracking source panel menu.
Tracking source(on/off): Turn on/off tracking source.
After the tracking source is turned on, [TG] key indicator on the front panel will light up, and the [Gen
Output 50ω] connector on the front panel will output a signal with the same frequency as the current sweep
signal. The power of the signal can be set through the menu.
Amplitude: Set the output power of the tracking source signal. User can change the amplitude value by
using the number key, rotary knob, direction key or touch the panel menu.
Deviation: When there is a gain or loss between the output of the tracking source and an external device,
this parameter is used to set the output power offset of the tracing source to display the actual power value
of the system. User can change the offset by using the number key, rotary knob, direction key or touch the
panel menu.
Normalization: turn on/off normalization. If the operation of saving the reference trace has not performed
before turning on normalization, the spectrum will automatically save the reference trace when the current
sweep frequency finished. During the saving of reference trace, prompt message will display on the
interface. When the normalization is enabled, the corresponding value of the reference trace is subtracted
from the data after each sweep.
Reference level value: When the normalization is enabled, adjusting reference level value to change the
vertical position of trace on the screen. The changing of this parameter will not affect the reference level
value of the spectrum. User can change the reference level value by using numeric key, rotary knob,
direction key or touch panel.
Reference trace: turn on/off the reference trace display.
Note
This parameter does not change the actual output power of the tracking source, but only changes the
power reading of the tracking source. The offset value can be positive or negative. A positive value
corresponds to an external output gain, and a negative value corresponds to an external output loss.
Single
[Single] key which is the quick key of sweep mode. See Chapter 4 “Sweep” for more details.
Touch/Lock
[Touch/Lock] key, if indicator turns red, it presents the touch function is locked. If the indicator off, it
presents the touch function is enabled.
Meas/Setup
Press [Meas/Setup] key to open the parameter setting panel menu corresponding to the measurement
selected by the current [Meas] function key. It includes the following setting.
Avg|Hold Number: Set the average time of trace. User can change the average time by using the numeric
key, rotary knob, direction key or touch the panel menu. Multiple averaging can reduce the influence of
Instruments.uni-trend.com 59 / 76
Page 60

User’s Manual UTS1000B/T Series
noise or other random signals, thus highlight the stable signal characteristics in the signal. The higher the
average time, the smoother the trace.
Avg Type:
1. Log-Pwr averaging is to average the logarithmic amplitude values (in dB) of the signal envelope measured
within a signal collection unit; the average detection type will change to video detection.
For random noise, logarithmic averaging = power averaging - 2.5 dB = voltage averaging - 1.45. Therefore,
it reduces the displayed level of the noise (not the true level of the noise) and it is suitable for observing
low-energy narrowband signals, especially those close to the noise.
2. Power averaging is to average the power of the signal (the square of the amplitude); the average
detection type will change to RMS (power) detection. Power averaging is true power for noise. Power
averaging is most suitable for measuring the real-time power of complex signals.
3. Voltage averaging is to average the voltage values of the signal envelope measured in a signal collection
unit; the average detection type will changed to voltage detection. The voltage averaging is still a linear
display, which is suitable for observing the rise and fall of AM signals or pulse modulated signals (e.g.,
radar, TDMA transmitter).
Display Line(On/Off): Set the display line level to change the display position. The display line is a reference
horizontal line with an amplitude value equal to the set value, and the corresponding amplitude unit is the
same as the Y-axis unit. User can change the display line level by using the numeric key, rotary knob,
direction key or touch the panel menu.
Note
The display line is a reference horizontal line with an amplitude value equal to the set value, and the
corresponding amplitude unit is the same as the Y-axis unit.
If the display line is outside the visible range, it is displayed at the top or bottom of the grid and indicated by
direction.
Limits: Set the parameter of limit. Press [Default] key to turn off the limit value measurement function, but
the limit value data is retained.
1. Select: select the current limit line, 4 limits can be selected, the default limit is 1.
2. Limit(On/Off): Turn on/off the limit value line display. When the limit line is opened, the measurement
interface displays the limit line, and the corresponding trace line will test according to the current limit
line. Each limit line is shown in a different color.
3. Test Trace: set the trace for the current limit line test. The default trace is 1.
4. Margin(On/Off): Turn on/off margin display. When the margin is opened, the margin line is displayed on
the measurement interface. When it off, the margin is invalid.
5. Type(Upper/Lower): Select the type of the current limit line as Upper or Lower. If the trace amplitude is
greater than the upper limit amplitude or smaller than the lower limit amplitude, then the test is failed.
6. Edit limit: Press this key to enter the edit menu and open the limit line edit window. The current limit line
is turned on, the peak table is turned off, and the trace corresponding to the limit line is turned on. This
menu contains as follows,
Select: Select the limit line to be edit. The default limit value is 1.
Instruments.uni-trend.com 60 / 76
Page 61

User’s Manual UTS1000B/T Series
Go To Row: Select the row of the limit value table.
Freq: Edit the frequency of the current point. User can change the display line level by using the
numeric key, rotary knob, direction key or touch the panel menu.
Ampt: Edit the current amplitude of the current point. User can change the display line level by using
the numeric key, rotary knob, direction key or touch the panel menu.
X Ofs: Set the frequency offset of the current limit value line.
Y Ofs: Set the amplitude offset of the current limit value line.
Apply Offsets: X offset and Y offset data to each point of the current limit line, and then reset the X
offset and Y offset to 0.
Insert Row: Insert an editing point.
Delete Row: Delete the current selected.
Delete Limit: Delete the current value line, the data of the current value line will be delete.
Hints: Touch a point in the trace display window on the screen to edit the current data point of the limit line.
Or drag the point to adjust the position of the current editing point, that is, to change the frequency and
amplitude value of the current point.
7. Test Limit(On/Off): Turn on/off the current limit test.
8. Copy From Limit: Copy the limit line from the selected limit line.
9. Build From Trace: build the limit line from the selected trace.
10. Delete All Limits: after delete all limit lines, the data of all limit lines are cleared and restore to factory
setting.
Meas Preset: Reset all parameters of the current measuring mode to factory setting.
Meas
Press [Meas] key to perform the measurement of channel power,time domain power, occupied width,
third-order intercept, adjacent channel power, spectrum monitor, carrier to noise ratio and harmonic
component. See chapter 5 One-key Measurement for more details.
Mode
Mode includes spectrum analysis, vector signal analysis, EMI and analog demodulation; there are options
that need to be activated separately. Please download the required instruction from the official website.
Instruments.uni-trend.com 61 / 76
Page 62
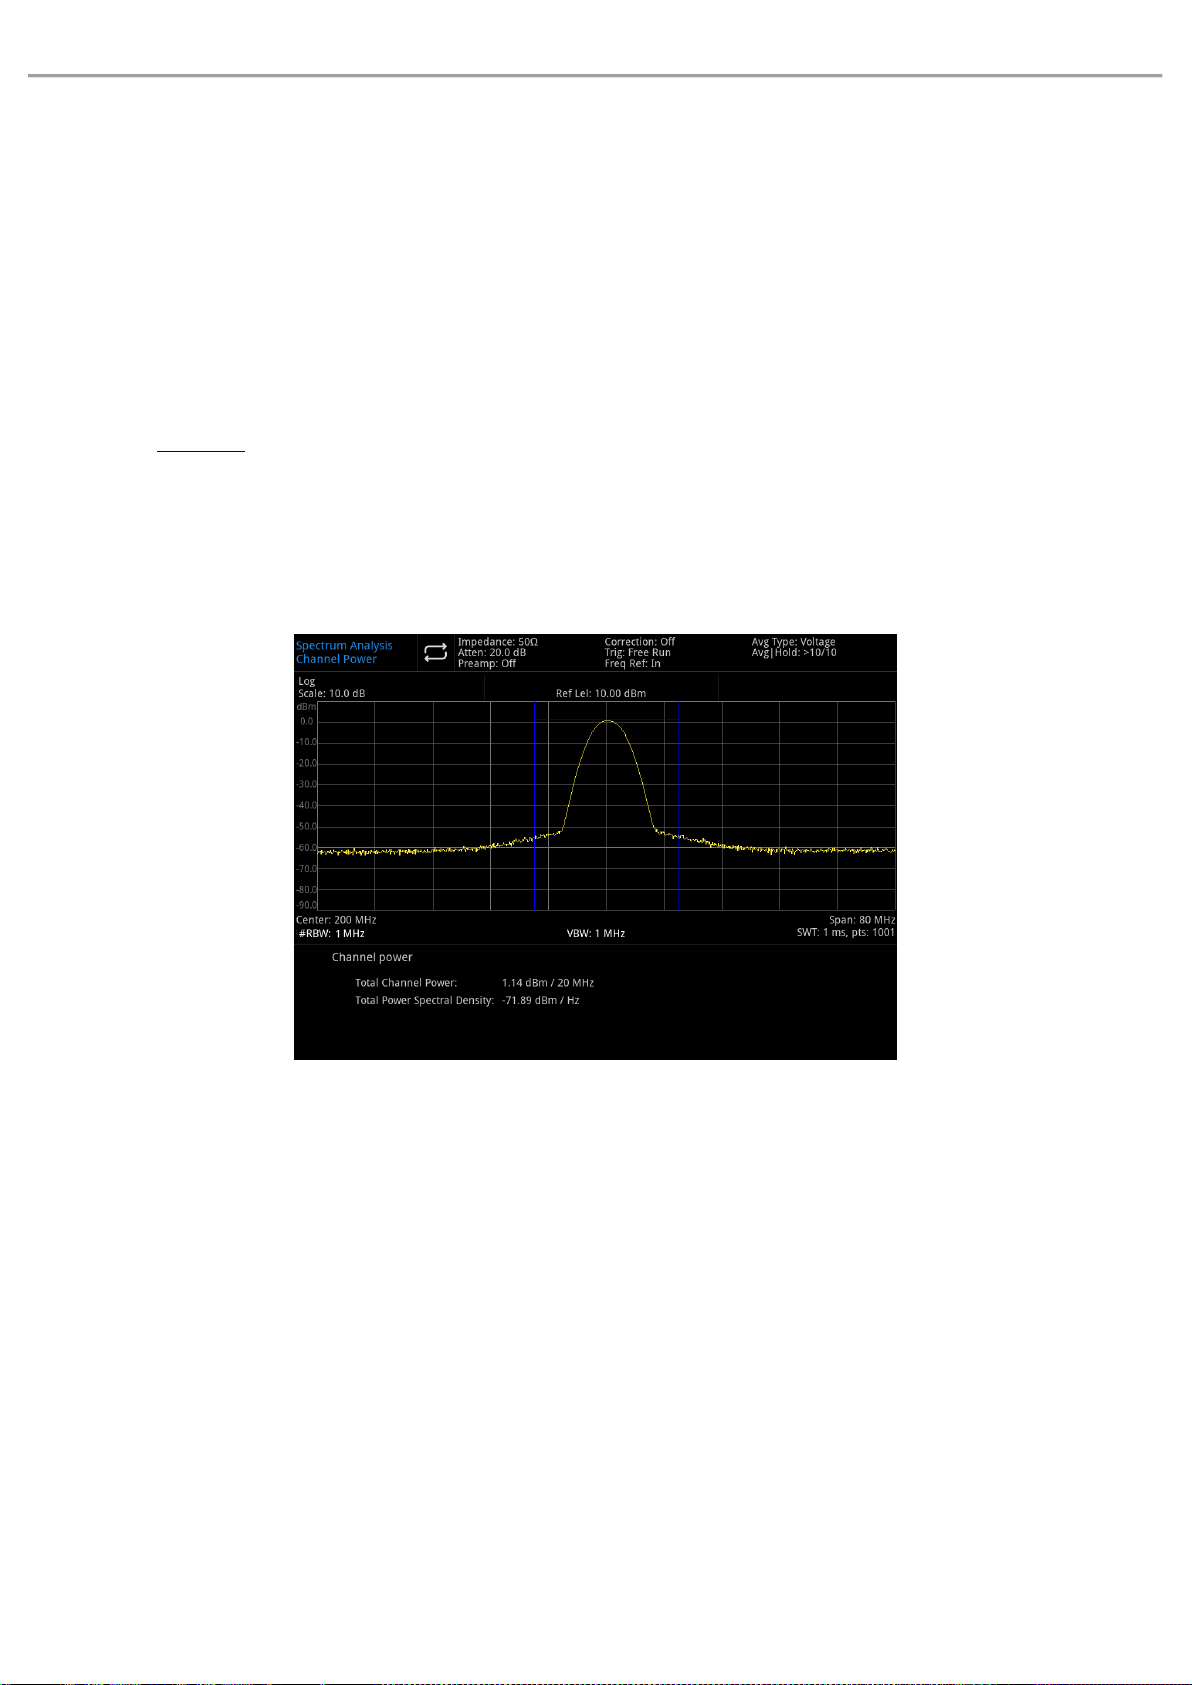
User’s Manual UTS1000B/T Series
5. One-key Measurement
This chapter is to introduce how to use [Meas] key on the front panel (spectrum analysis mode).
Spectrum Sweeping
Press [Meas] > Swept SA
There are sweep analysis (frequency domain), FFT analysis (frequency domain), or zero span analysis (time
domain) for measurement. After spectrum sweeping is selected, the advanced measurement function is
disabled by default.
See “Chapter 4” for more details.
Press [Meas/Setup] key to set the parameter of spectrum analysis. This key can also set the measuring
setting for other one-key measurement.
Channel Power
Figure 5-1 Channel Power
Power and power spectral density are measured in the channel bandwidth specified by the user. A pair of
vertical lines on the display indicate the boundary of the channel bandwidth. The center frequency,
reference level and channel bandwidth need to be set.
Press [Meas] >Channel Power to enter the following panel menu.
Meas/Setup
Avg|Hold Num(On/Off): Press average time (on) to specify the average number of sweep to calculating the
measurement results. Sweep time range is from 1 to 999. User can change the average time by using the
numeric key, rotary knob, direction key, or touch the panel menu. Measured average result will be displayed
after the sweeping. Select (off) to turn off this measuring average function.
Avg Mode(Exponential/Repeat): Switch between exponential and repetition average mode. When the
specified average time of sweep is reached, this average mode is used to determine the average operation
Instruments.uni-trend.com 62 / 76
Page 63
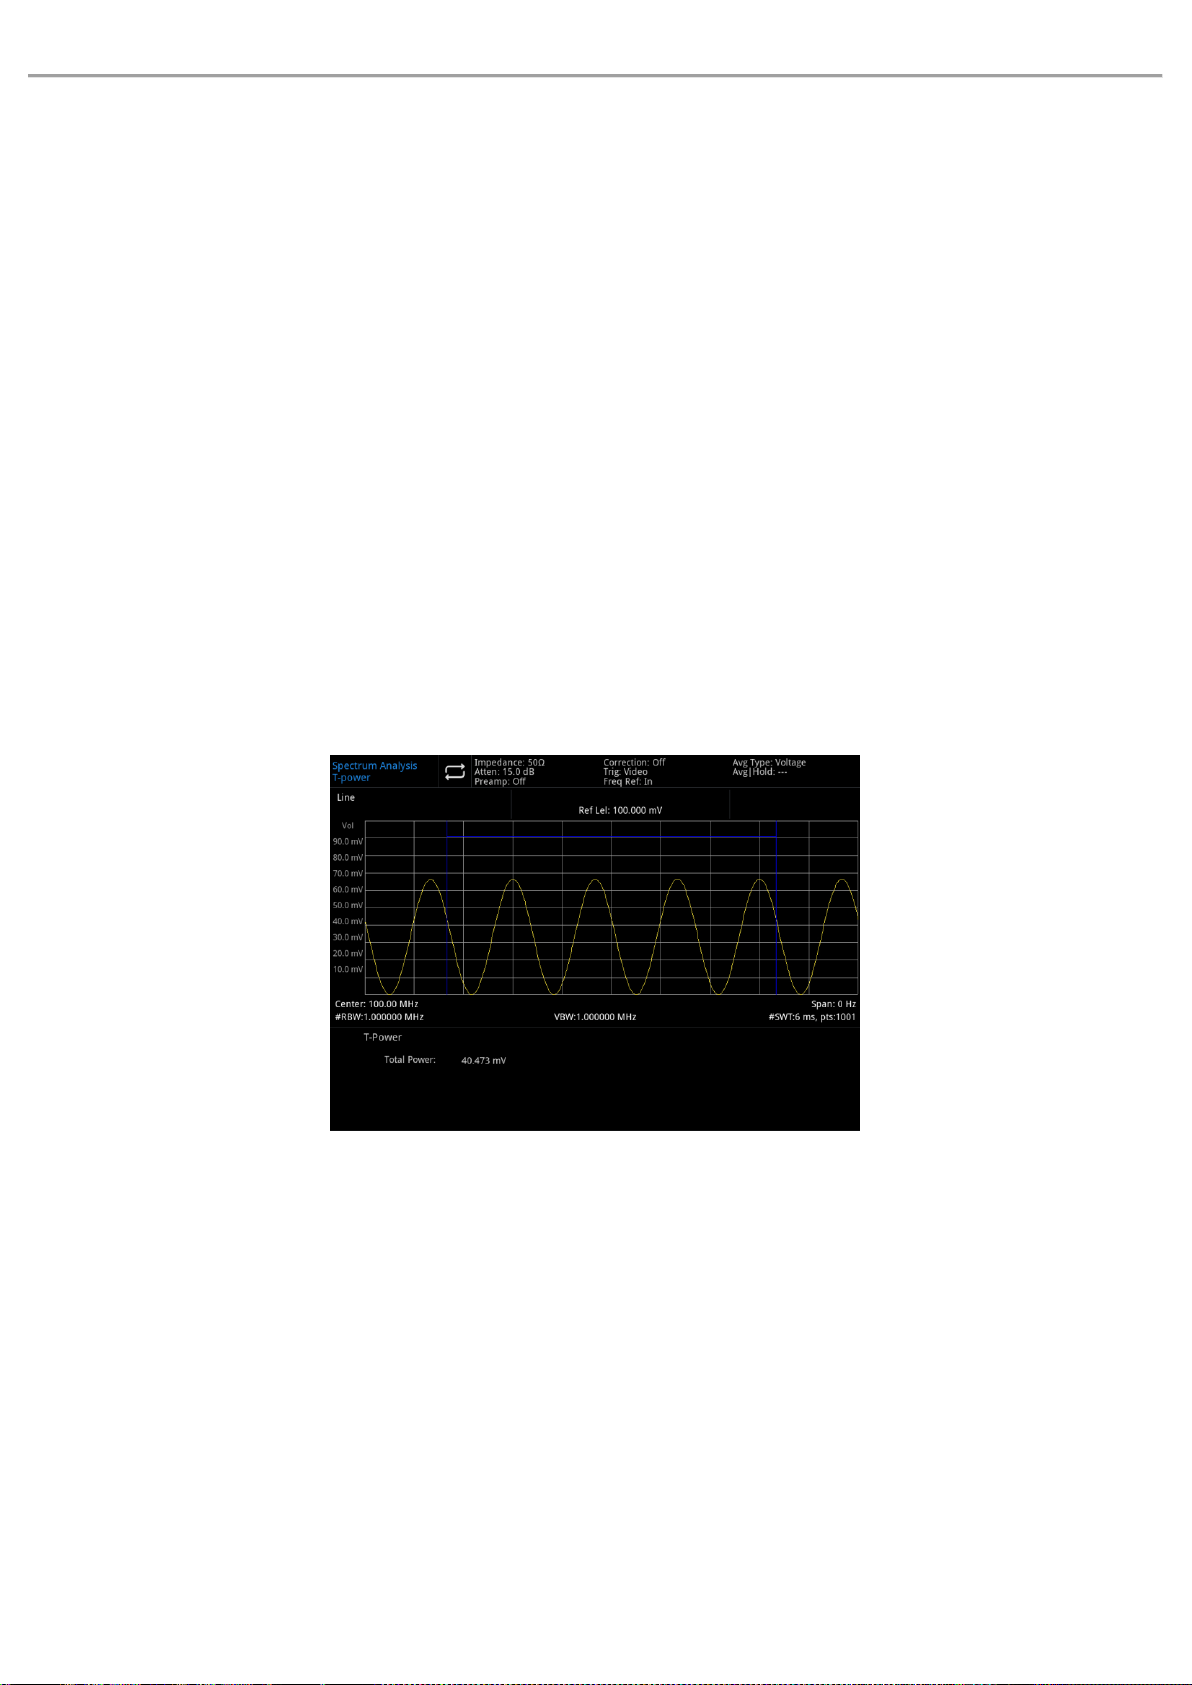
User’s Manual UTS1000B/T Series
mode of the spectrum analyzer.
When the exponential average mode is selected, after a specified average time is reached, each channel
trace data is weighted exponentially, added to the previous average value and then take the average. In the
exponential average mode, the weight of the new data is larger than that of the old data, which is conducive
to track signals that change slowly. Measured average result will be displayed after the sweeping.
When the repetition average mode is selected, after a specified average time is reached, all the previous
data will be delete and restart the sweeping.
Integ BW: Used to specify the range of integrals to calculating the power in a channel. For example, set the
bandwidth of the main channel. Notice that the integral bandwidth is displayed in a blue box on the screen.
In this case, the sweep span should be set between 1 and 10 times of the integral bandwidth. User can
change the integral bandwidth by using the numeric key, rotary knob, direction key, or touch the panel
menu.
Meas Preset: Reset all parameters of the current measuring mode to factory setting.
Time Domain Power
Figure 5-2 Time Domain Power
Press [Meas] >T-power, system will enter zero span mode and calculating the power in time domain. The
setting menu as follows.
Meas/Setup:
Avg|Hold Num(On/Off): Press average time (on) to specify the average number of sweep to calculating the
measurement results. Sweep time range is from 1 to 999. User can change the average time by using the
numeric key, rotary knob, direction key, or touch the panel menu. Measured average result will be displayed
after the sweeping. Select (off) to turn off this measuring average function.
Avg Mode(Exponential/Repeat): Switch between exponential and repetition average mode. When the
specified average time of sweep is reached, this average mode is used to determine the average operation
mode of the spectrum analyzer.
Instruments.uni-trend.com 63 / 76
Page 64
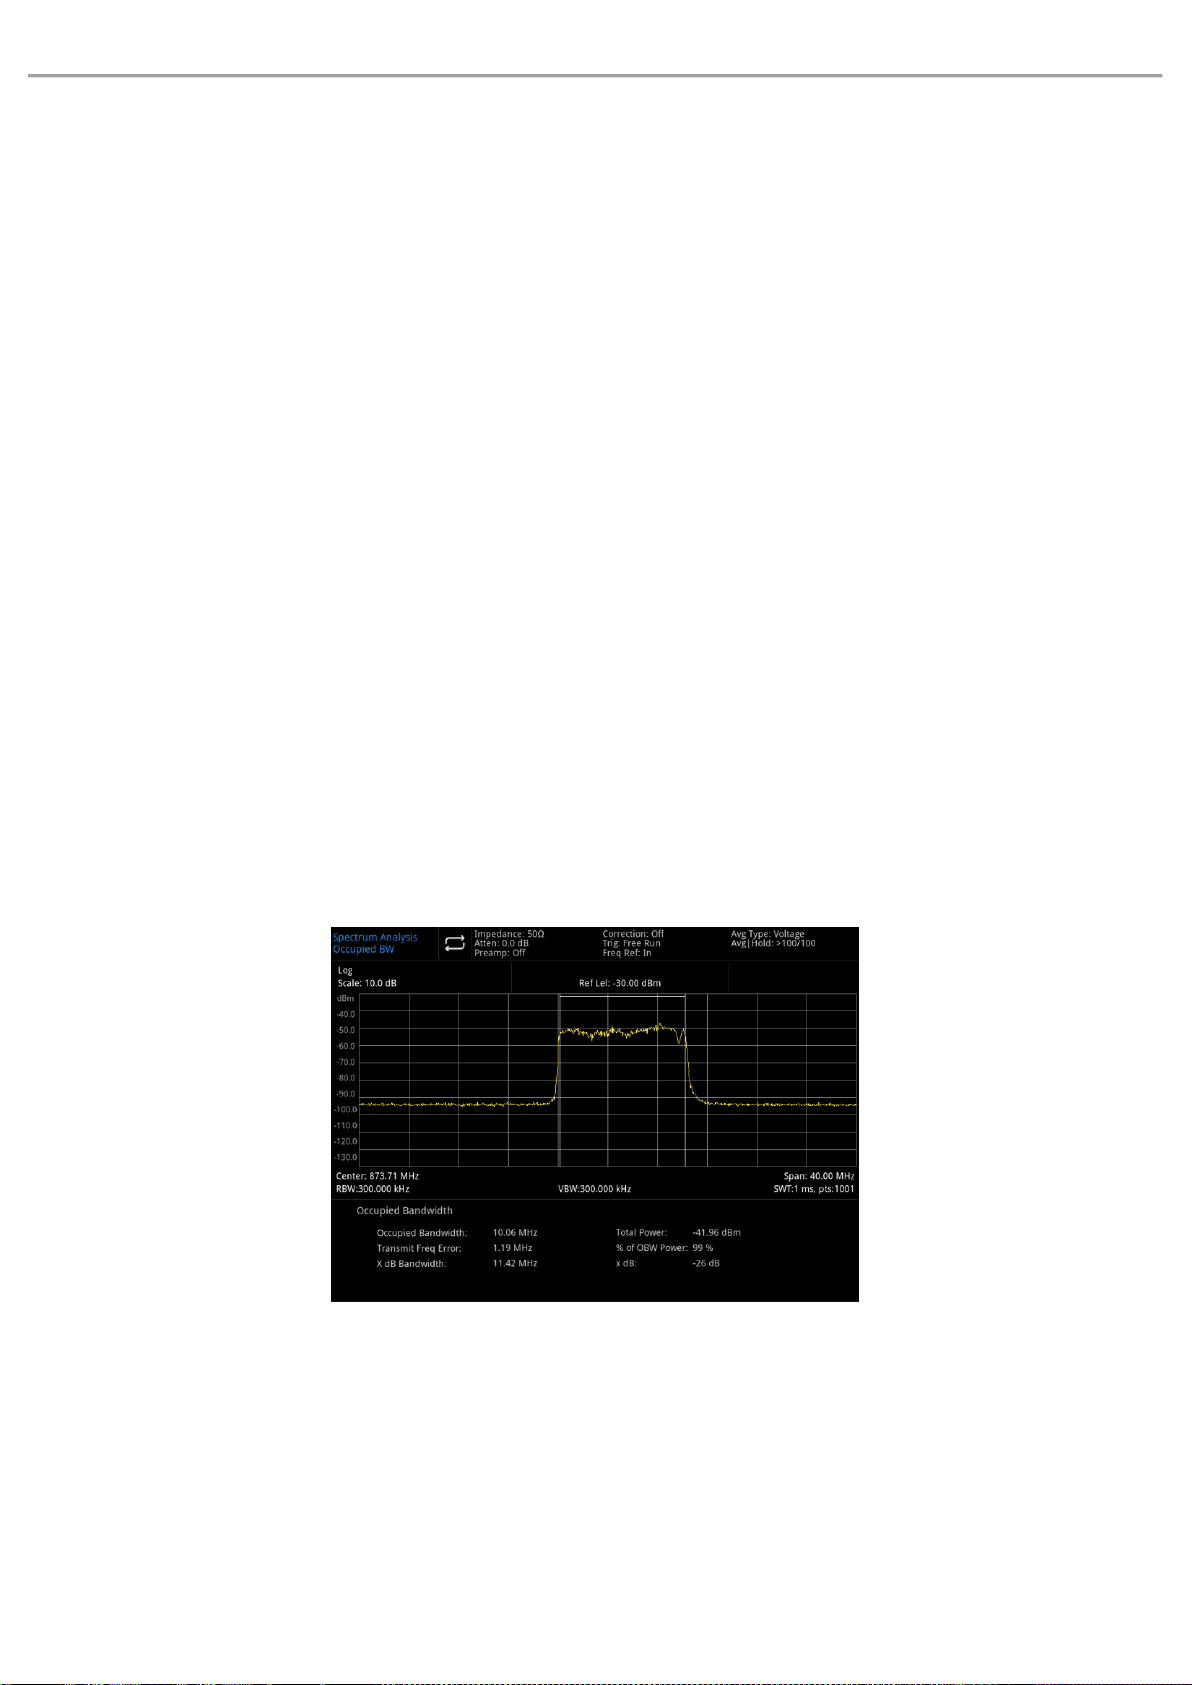
User’s Manual UTS1000B/T Series
When the exponential average mode is selected, after a specified average time is reached, each channel
trace data is weighted exponentially, added to the previous average value and then take the average. In the
exponential average mode, the weight of the new data is larger than that of the old data, which is conducive
to track signals that change slowly. Measured average result will be displayed after the sweeping.
When the repetition average mode is selected, after a specified average time is reached, all the previous
data will be delete and restart the sweeping.
Avg Type: Log-Pwr averaging is to average the logarithmic amplitude values (in dB) of the signal envelope
measured within a signal collection unit, the average detection type will change to video detection. Power
averaging is to average the power of the signal (the square of the amplitude),the average detection type will
change to RMS (power) detection.Voltage averaging is to average the voltage values of the signal envelope
measured in a signal collection unit, the average detection type will changed to voltage detection, The
voltage averaging is still a linear display.
Start Time: Set the left boundary of the time domain power measurement in units of time. The time domain
power measurement data are calculated from the start line to the end line. The default value is 0. User can
change the left boundary by using the numeric key, rotary knob, direction key, or touch the panel menu.
Stop Time: Set the right boundary of the time domain power measurement in units of time. The time
domain power measurement data are calculated from the start line to the end line. The default value is 0.
User can change the left boundary by using the numeric key, rotary knob, direction key, or touch the panel
menu.
Meas Preset: Reset all parameters of the current measuring mode to factory setting.
Occupied Bandwidth
Figure 5-3 Occupied Bandwidth
The power of the spectrum shown on the screen will be calculated at first, and two marks are placed on the
spectrum.
The percentage of the power between the two frequency indicated by the mark is specified by the user. The
default percentage for testing is 99%. The power-bandwidth program calculates the power sum of all
signals on the trace at first.
For 99% of the occupied power bandwidth, the markers are placed at the two frequency on the left and
right, and the power between the two frequency accounts for 99% of the total spectrum power. The
Instruments.uni-trend.com 64 / 76
Page 65

User’s Manual UTS1000B/T Series
remaining 1% of the power is evenly distributed outside the marker. The frequency difference between the
two markers are 99% power bandwidth and displayed on the screen.
The occupied bandwidth function can also be used to indicate the frequency difference between the center
frequency of the spectrum analyzer and the center frequency of the channel. If the two boundary frequency
of occupied bandwidth are expressed as F1 and F2 respectively, the transmitting frequency error is defined
as the difference between (F1+F2) /2 and the center frequency of the spectrum analyzer.
Occupied bandwidth can be measured in single sweep mode or continuous sweep mode. User must set the
center frequency, reference level and channel interval.
Press [Meas] >Occupied BW to enter the following panel menu.
Meas/Setup:
Avg|Hold Num(On/Off): Press average time (on) to specify the average number of sweep to calculating the
measurement results. Sweep time range is from 1 to 999. User can change the average time by using the
numeric key, rotary knob, direction key, or touch the panel menu. Measured average result will be displayed
after the sweeping. Select (off) to turn off this measuring average function.
Avg Mode(Exponential/Repeat): Switch between exponential and repetition average mode. When the
specified average time of sweep is reached, this average mode is used to determine the average operation
mode of the spectrum analyzer.
When the exponential average mode is selected, after a specified average time is reached, each channel
trace data is weighted exponentially, added to the previous average value and then take the average. In the
exponential average mode, the weight of the new data is larger than that of the old data, which is conducive
to track signals that change slowly. Measured average result will be displayed after the sweeping.
When the repetition average mode is selected, after a specified average time is reached, all the previous
data will be delete and restart the sweeping.
Avg Type: Log-Pwr averaging is to average the logarithmic amplitude values (in dB) of the signal envelope
measured within a signal collection unit, the average detection type will change to video detection. Power
averaging is to average the power of the signal (the square of the amplitude),the average detection type will
change to RMS (power) detection.Voltage averaging is to average the voltage values of the signal envelope
measured in a signal collection unit, the average detection type will changed to voltage detection, The
voltage averaging is still a linear display.
%of OBW Power: It can be used to change the percentage of signal power used in determining occupied
bandwidth. User can change the percentage by using the numeric key, rotary knob, direction key, or touch
the panel menu.
x dB: the number of dB that defines the highest point (P1) in the signal, for measuring the transmit
bandwidth, the transmit bandwidth should within the span of OBW. This function is independent of the
calculation of OBW.
Instruments.uni-trend.com 65 / 76
Page 66
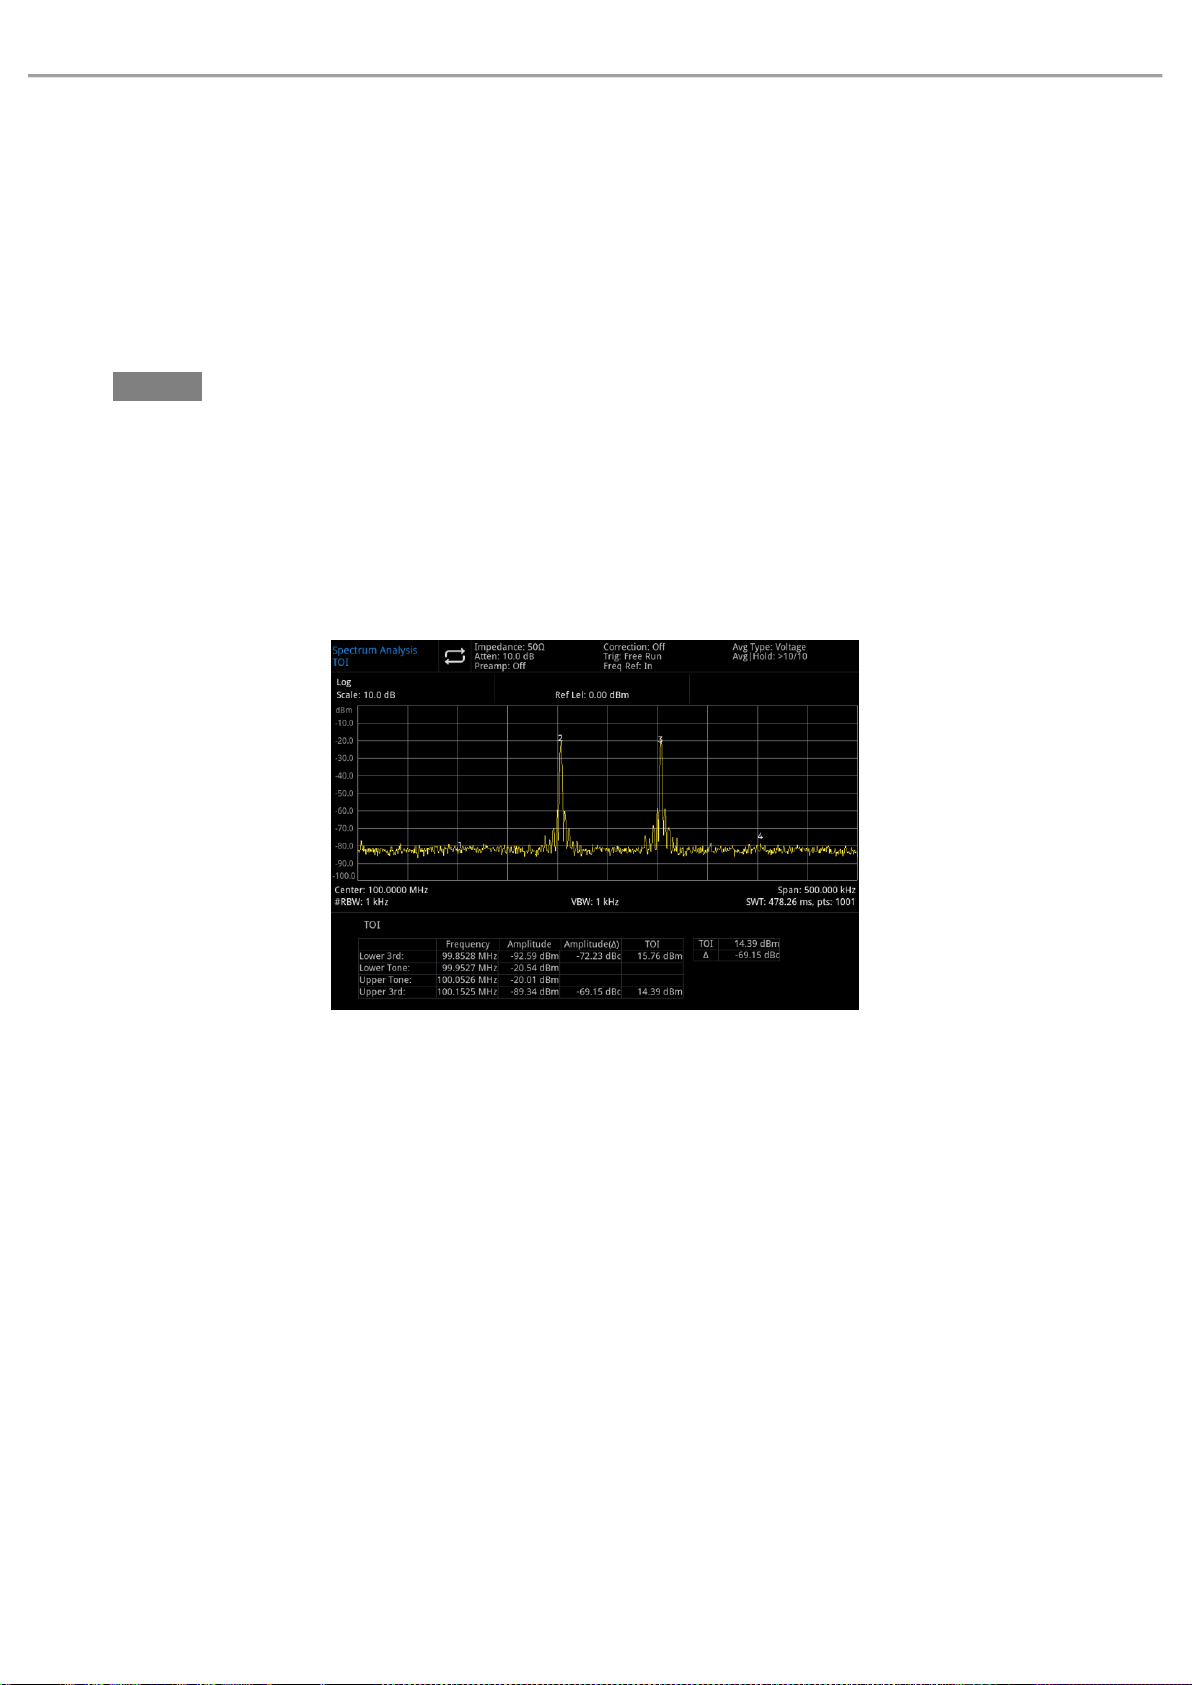
User’s Manual UTS1000B/T Series
The calculated result of xdB bandwidth is also called transmit bandwidth (EBW). A direction marker (F1 and
F2) is placed at each of the two frequency of the left and right side of the highest point (P1). The amplitude
of the two frequency is lower to dB number of the highest point(P1), it should be the same with the dB
value specified by the user. Calculating the total power between the two markers.
The frequency F1 and F2 are defined as the farthest frequency of xdB which higher and lower P1. The
transmission bandwidth is the difference between F2-F1, the range is from -100.0 dB to -0.1dB. Users can
change the xdB by using the numeric key, rotary knob, direction key, or touch the panel menu.
Note
The asterisk next to the xdB bandwidth value indicates that the result was not obtained under optimal
setting of the spectrum analyzer. If your primary concern is transmit bandwidth, select maximum hold.
Then Press [Trace]>Detector>Peak Detection. The obtained peak data will ensure the accuracy of the
transmission bandwidth measurement.
Meas Preset: Reset all parameters of the current measuring mode to factory setting.
Third-order Intercept
Figure 5-4 TOI
Third-order intermodulation (TOI) measurement is used to calculate and display the output cutoff (IP3), and
placed direction marker on a trace to indicate the direction of the measured signal and third-order product.
Press [Meas] > TOI to enter the following panel menu.
Meas/Setup:
Avg|Hold Num(On/Off): Press average time (on) to specify the average number of sweep to calculating the
measurement results. Sweep time range is from 1 to 999. User can change the average time by using the
numeric key, rotary knob, direction key, or touch the panel menu. Measured average result will be displayed
after the sweeping. Select (off) to turn off this measuring average function.
Avg Mode(Exponential/Repeat): Switch between exponential and repetition average mode. When the
specified average time of sweep is reached, this average mode is used to determine the average operation
mode of the spectrum analyzer.
Instruments.uni-trend.com 66 / 76
Page 67
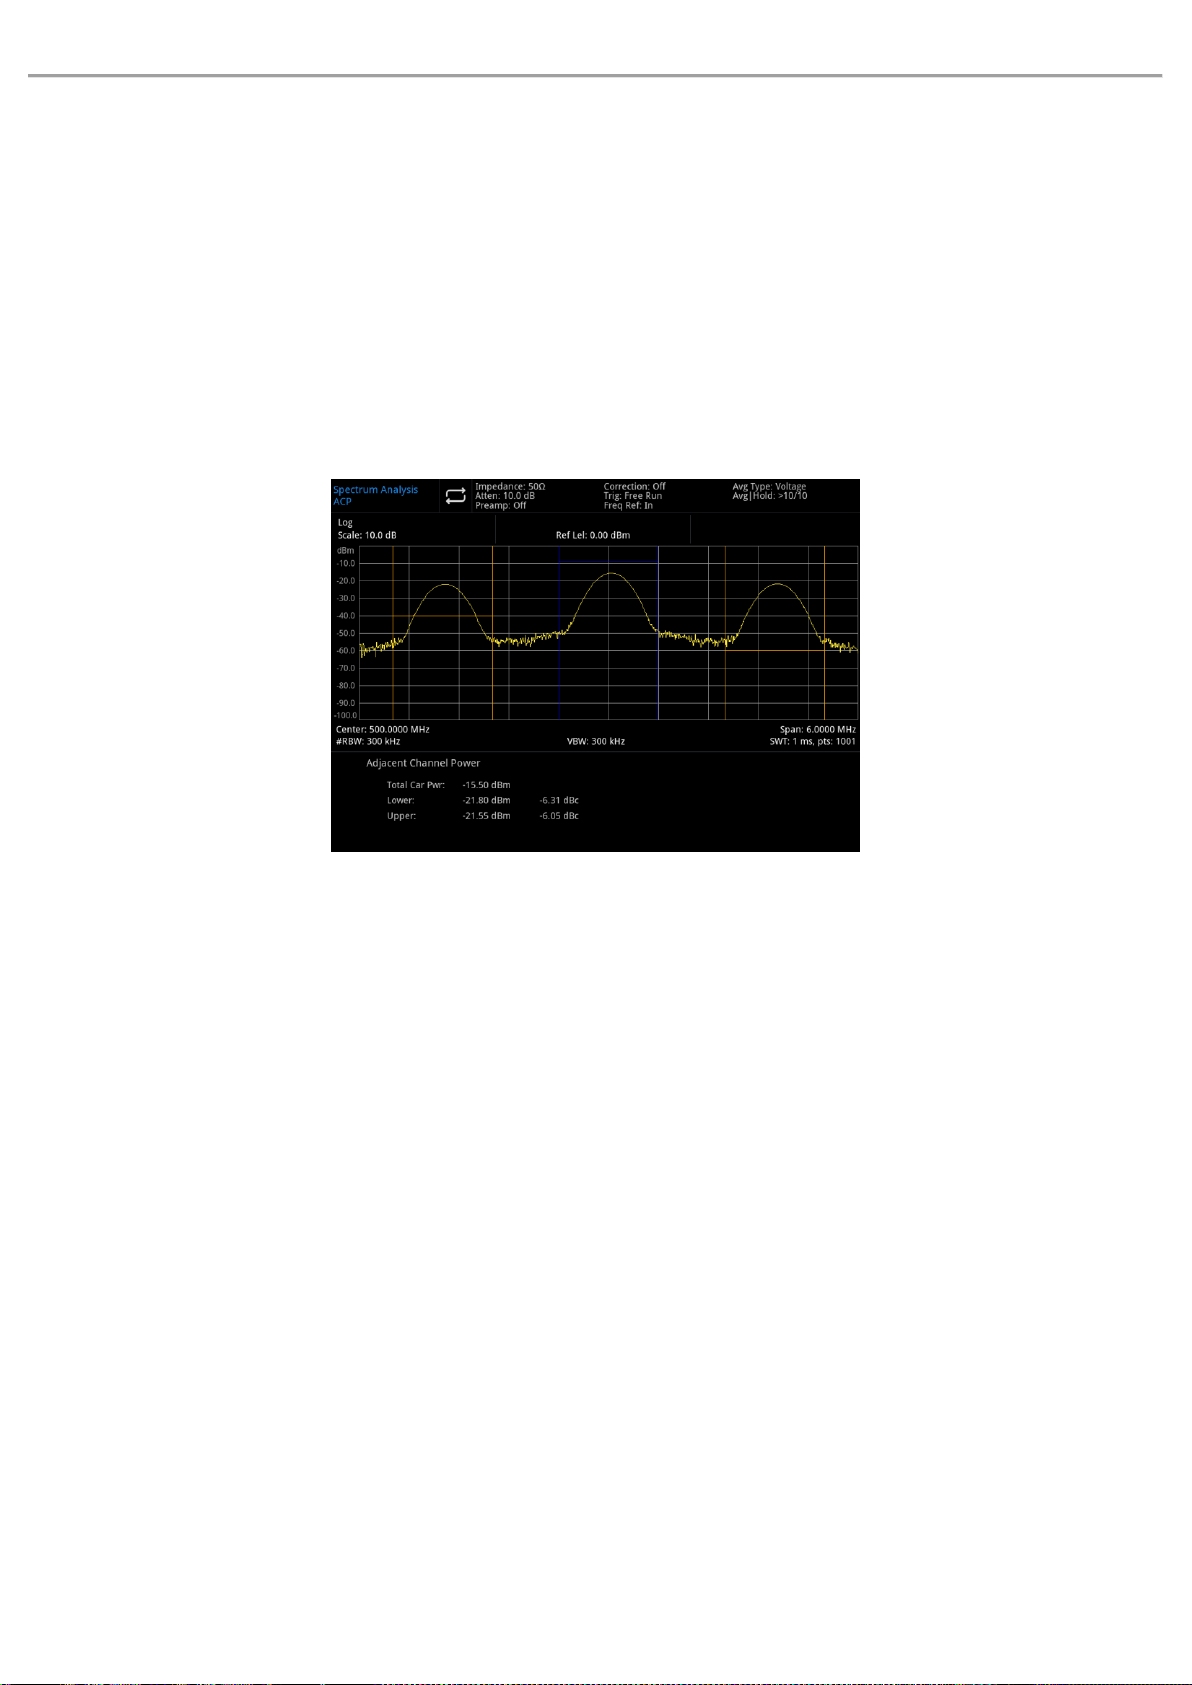
User’s Manual UTS1000B/T Series
When the exponential average mode is selected, after a specified average time is reached, each channel
trace data is weighted exponentially, added to the previous average value and then take the average. In the
exponential average mode, the weight of the new data is larger than that of the old data, which is conducive
to track signals that change slowly. Measured average result will be displayed after the sweeping.
When the repetition average mode is selected, after a specified average time is reached, all the previous
data will be delete and restart the sweeping.
Meas Preset: Reset all parameters of the current measuring mode to factory setting.
Adjacent Channel Power
Figure 5-5 Measurement of Adjacent Channel Power
Measuring the main channel power, the power of previous channel and the last channel.
Set a main channel and adjacent channel on the left and right side, the main channel is centered on the
central frequency point, and the left and right adjacent channels are symmetric with respect to the main
channel.
Channel parameter can be changed by setting the bandwidth of the main channel and the adjacent channel,
and the adjacent channel spacing (the distance between the adjacent channel and the main channel).
Press [Meas] > ACP to enter the following panel menu.
Meas/Setup:
Avg|Hold Num(On/Off): Press average time (on) to specify the average number of sweep to calculating the
measurement results. Sweep time range is from 1 to 999. User can change the average time by using the
numeric key, rotary knob, direction key, or touch the panel menu. Measured average result will be displayed
after the sweeping. Select (off) to turn off this measuring average function.
Avg Mode(Exponential/Repeat): Switch between exponential and repetition average mode. When the
specified average time of sweep is reached, this average mode is used to determine the average operation
mode of the spectrum analyzer.
When the exponential average mode is selected, after a specified average time is reached, each channel
Instruments.uni-trend.com 67 / 76
Page 68
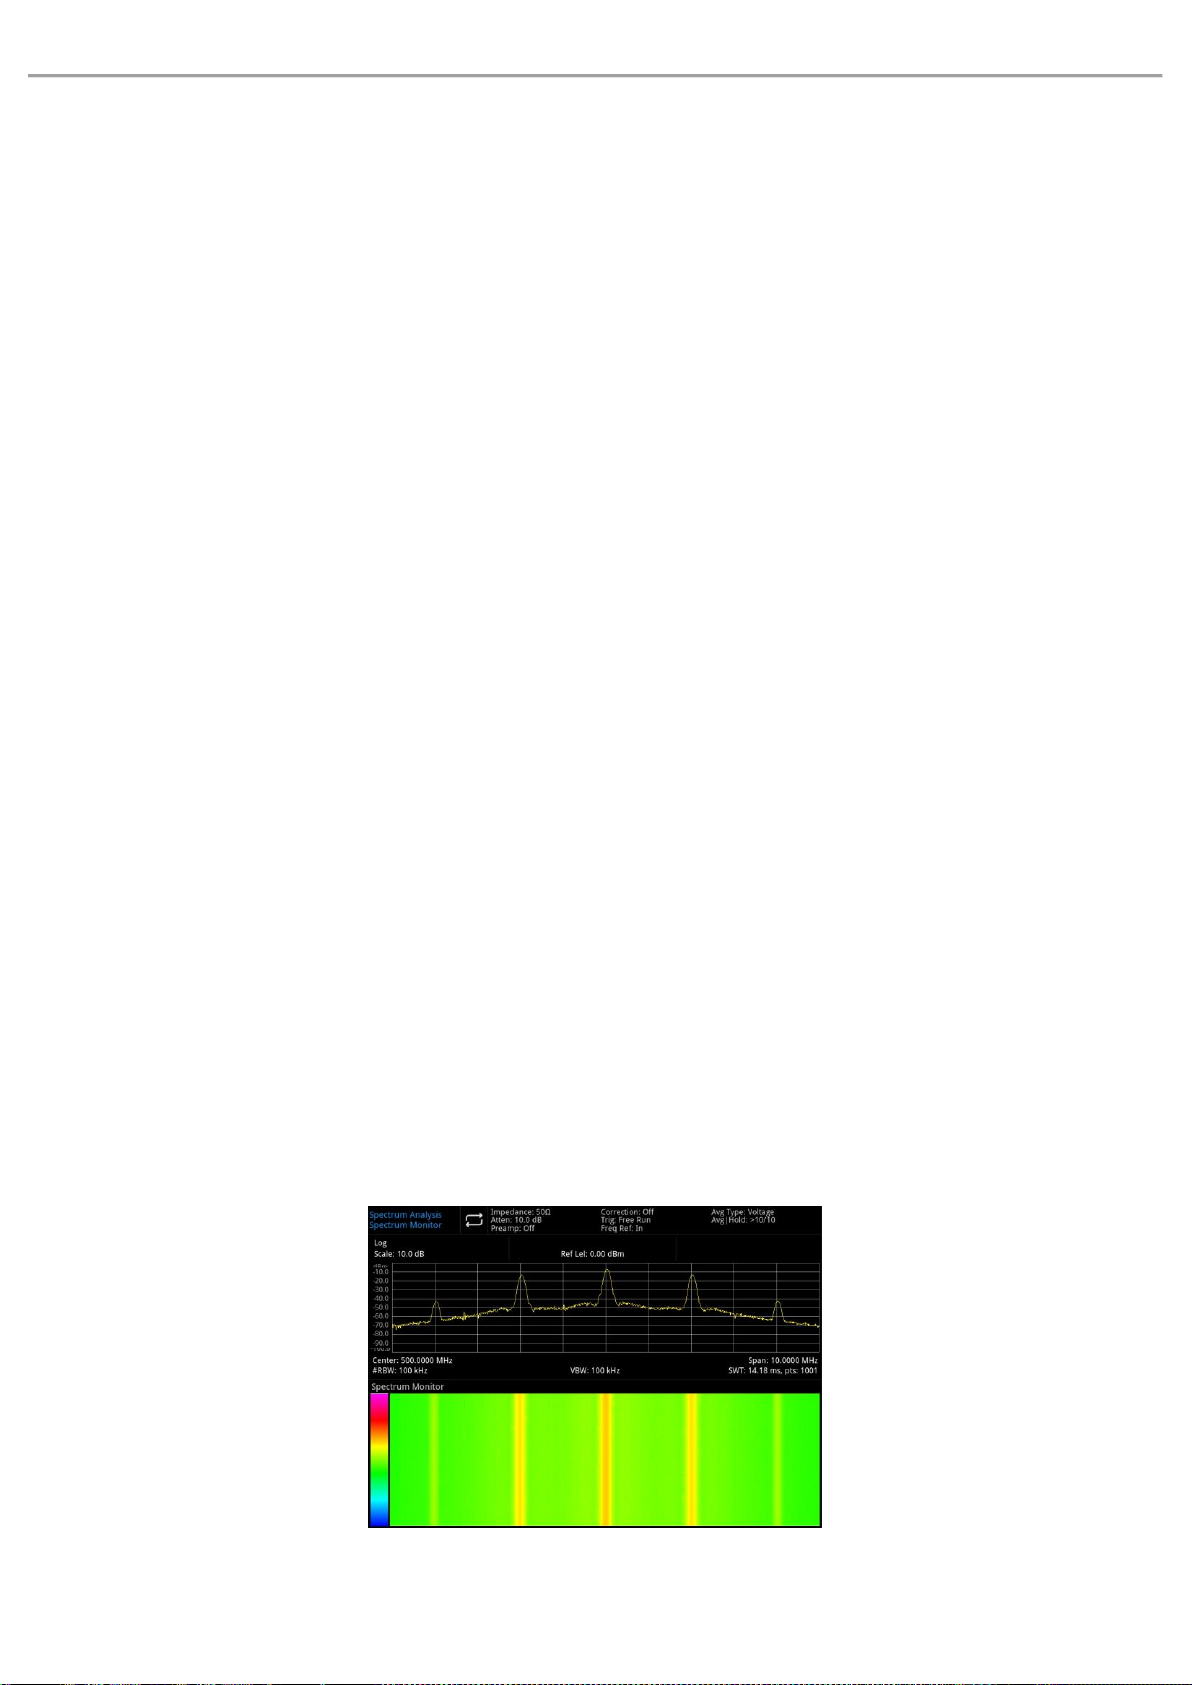
User’s Manual UTS1000B/T Series
trace data is weighted exponentially, added to the previous average value and then take the average. In the
exponential average mode, the weight of the new data is larger than that of the old data, which is conducive
to track signals that change slowly. Measured average result will be displayed after the sweeping.
When the repetition average mode is selected, after a specified average time is reached, all the previous
data will be delete and restart the sweeping.
Avg Type: Log-Pwr averaging is to average the logarithmic amplitude values (in dB) of the signal envelope
measured within a signal collection unit, the average detection type will change to video detection. Power
averaging is to average the power of the signal (the square of the amplitude),the average detection type will
change to RMS (power) detection.Voltage averaging is to average the voltage values of the signal envelope
measured in a signal collection unit, the average detection type will changed to voltage detection, The
voltage averaging is still a linear display.
Noise BW: Set the bandwidth of the main channel. The power is integral within the bandwidth of the main
channel (default value: 2MHz). User can change the carrier bandwidth by using the numeric key, rotary knob,
direction key, or touch the panel menu.
Integ BW: Set the frequency bandwidth of the adjacent channel. The adjacent channel bandwidth is linked
with the frequency bandwidth. Users can change the adjacent channel bandwidth by the numeric key,
rotary knob, direction key, or touch the panel menu.
Offset Freq: The center frequency spacing between the main channel and the adjacent channel. Adjusting
the channel spacing will adjust the distance among the previous channel, the next channel and the main
channel at the same time. Users can change the adjacent channel spacing by the numeric key, rotary knob,
direction key, or touch the panel menu.
Offset Side: Specifies which offset side to measure.NEG,Negative (lower) sideband only.POS,Positive
(upper) sideband only.Both,Both of the negative (lower) and positive (upper) sidebands.
Meas Preset: Reset all parameters of the current measuring mode to factory setting.
Spectrum Monitor
Figure 5-6 Spectrum Monitoring
Instruments.uni-trend.com 68 / 76
Page 69
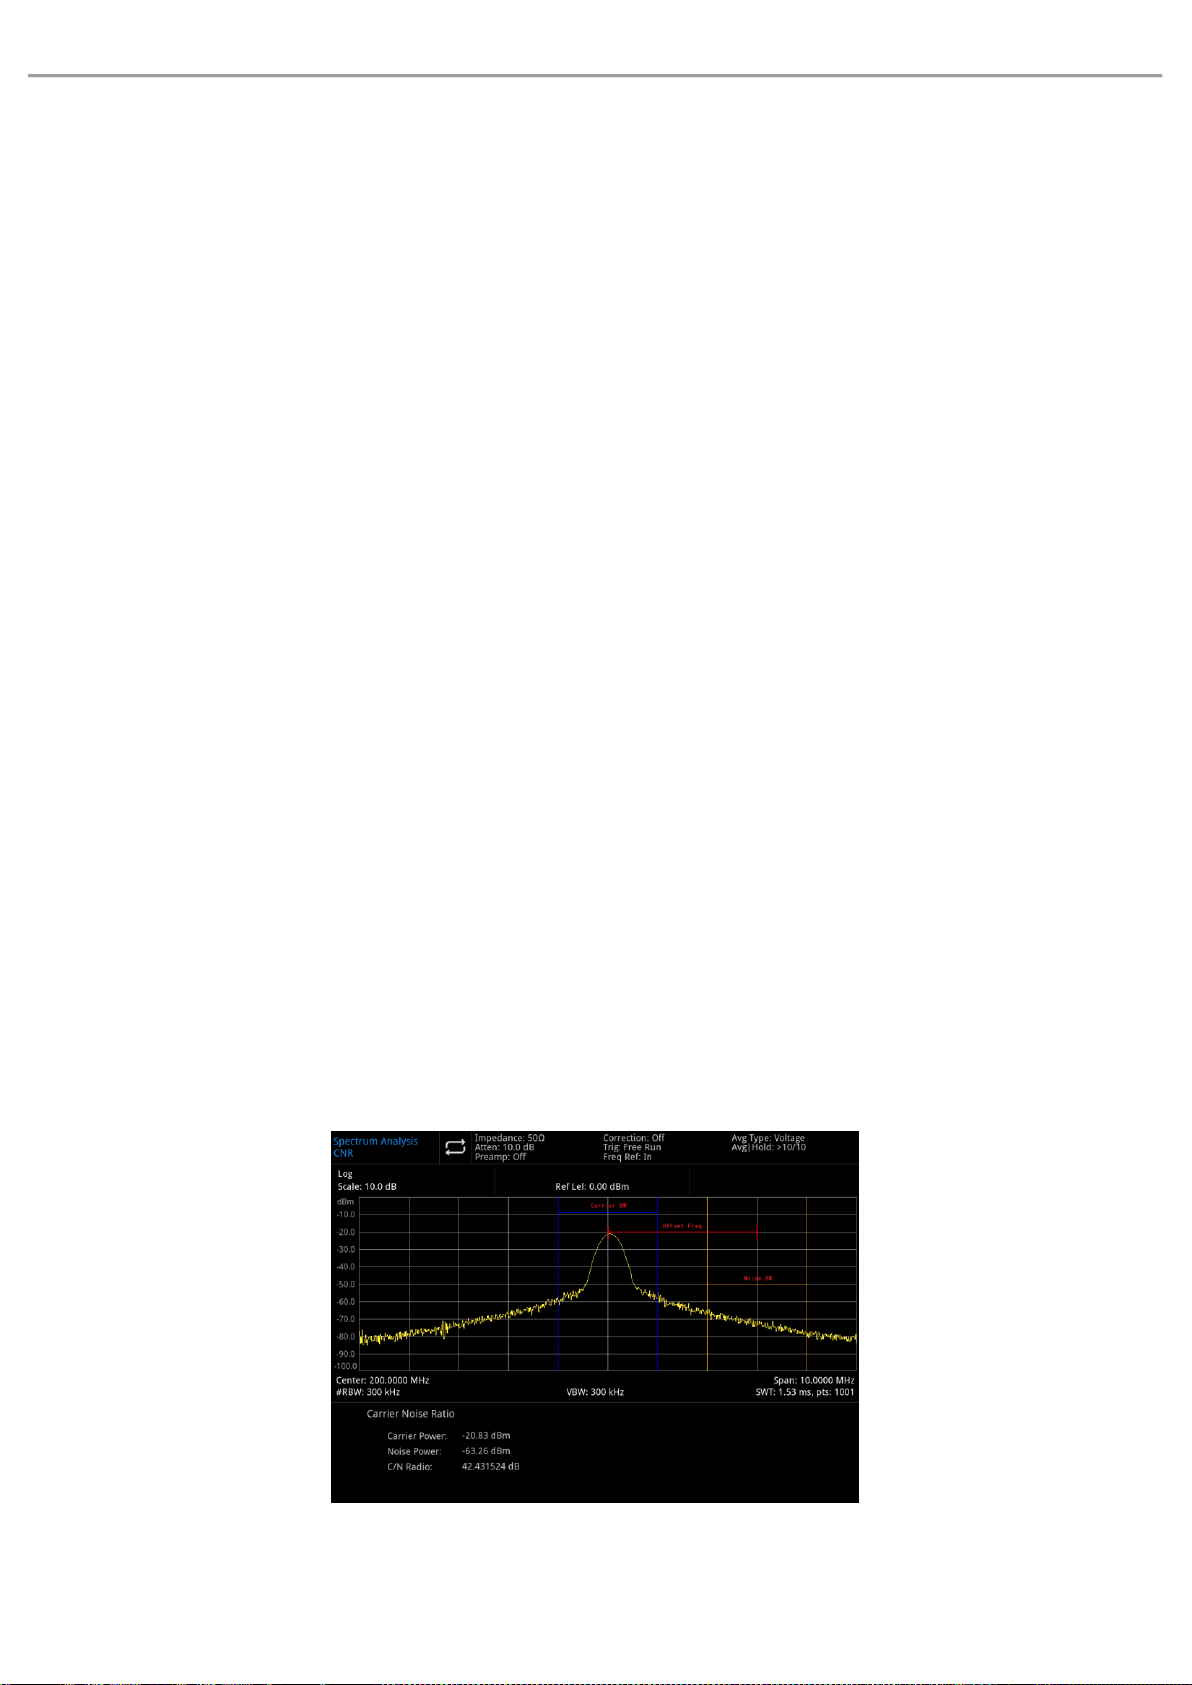
User’s Manual UTS1000B/T Series
Horizontal axis is frequency, vertical axis is time, and color presents the energy size of spectrum.
It is used to detect the intermittent occurrence of the spectrum, and the spectrum monitoring can observe
the change of the signal in a period of time.
Press [Meas] >Spectrum Monitor to enter the following panel menu.
Meas/Setup:
Avg|Hold Num(On/Off): Press average time (on) to specify the average number of sweep to calculating the
measurement results. Sweep time range is from 1 to 999. User can change the average time by using the
numeric key, rotary knob, direction key, or touch the panel menu. Measured average result will be displayed
after the sweeping. Select (off) to turn off this measuring average function.
Avg Mode(Exponential/Repeat): Switch between exponential and repetition average mode. When the
specified average time of sweep is reached, this average mode is used to determine the average operation
mode of the spectrum analyzer.
When the exponential average mode is selected, after a specified average time is reached, each channel
trace data is weighted exponentially, added to the previous average value and then take the average. In the
exponential average mode, the weight of the new data is larger than that of the old data, which is conducive
to track signals that change slowly. Measured average result will be displayed after the sweeping.
When the repetition average mode is selected, after a specified average time is reached, all the previous
data will be delete and restart the sweeping.
Avg Type: Log-Pwr averaging is to average the logarithmic amplitude values (in dB) of the signal envelope
measured within a signal collection unit, the average detection type will change to video detection. Power
averaging is to average the power of the signal (the square of the amplitude),the average detection type will
change to RMS (power) detection.Voltage averaging is to average the voltage values of the signal envelope
measured in a signal collection unit, the average detection type will changed to voltage detection, The
voltage averaging is still a linear display.
Meas Preset: Reset all parameters of the current measuring mode to factory setting.
Carrier to Noise Ratio
Figure 5-7 Measurement of Carrier-to-Noise Ratio
Instruments.uni-trend.com 69 / 76
Page 70

User’s Manual UTS1000B/T Series
Measurement of Carrier-to-Noise Ratio: carrier power, noise power and carrier-to-noise-ratio.
Search for the maximum positive peak f1 as the carrier within the screen range, calculating the power
within the carrier bandwidth centered at f1, take it as the carrier power. Set frequency offset to make no
carrier signal in the noise bandwidth.
Calculating the power within the noise bandwidth centered on f1 + frequency offset, take it as noise power.
Divide the carrier power by the noise power, the result is the carrier-to-noise ratio.
Press [Meas] >CNR to enter the following panel menu.
Meas/Setup:
Avg|Hold Num(On/Off): Press average time (on) to specify the average number of sweep to calculating the
measurement results. Sweep time range is from 1 to 999. User can change the average time by using the
numeric key, rotary knob, direction key, or touch the panel menu. Measured average result will be displayed
after the sweeping. Select (off) to turn off this measuring average function.
Avg Mode(Exponential/Repeat): Switch between exponential and repetition average mode. When the
specified average time of sweep is reached, this average mode is used to determine the average operation
mode of the spectrum analyzer.
When the exponential average mode is selected, after a specified average time is reached, each channel
trace data is weighted exponentially, added to the previous average value and then take the average. In the
exponential average mode, the weight of the new data is larger than that of the old data, which is conducive
to track signals that change slowly. Measured average result will be displayed after the sweeping.
When the repetition average mode is selected, after a specified average time is reached, all the previous
data will be delete and restart the sweeping.
Avg Type: Log-Pwr averaging is to average the logarithmic amplitude values (in dB) of the signal envelope
measured within a signal collection unit, the average detection type will change to video detection. Power
averaging is to average the power of the signal (the square of the amplitude),the average detection type will
change to RMS (power) detection.Voltage averaging is to average the voltage values of the signal envelope
measured in a signal collection unit, the average detection type will changed to voltage detection, The
voltage averaging is still a linear display.
Carrier BW: Set the bandwidth of the carrier to be measured. The carrier bandwidth is linked with sweep
width, noise bandwidth and frequency offset. User can change the carrier bandwidth by using the numeric
key, rotary knob, direction key, or touch the panel menu.
Noise BW: Set the bandwidth of the noise to be measured. The noise bandwidth is linked with sweep width,
noise bandwidth and frequency offset. User can change the noise bandwidth by using the numeric key,
rotary knob, direction key, or touch the panel menu.
Offset Freq: Set the difference between the center frequency of carrier and the noise. The frequency offset
is linked with the sweep, carrier bandwidth and noise bandwidth. Users can change the frequency offset by
using the numeric key, rotary knob, direction key, or touch the panel menu.
Instruments.uni-trend.com 70 / 76
Page 71
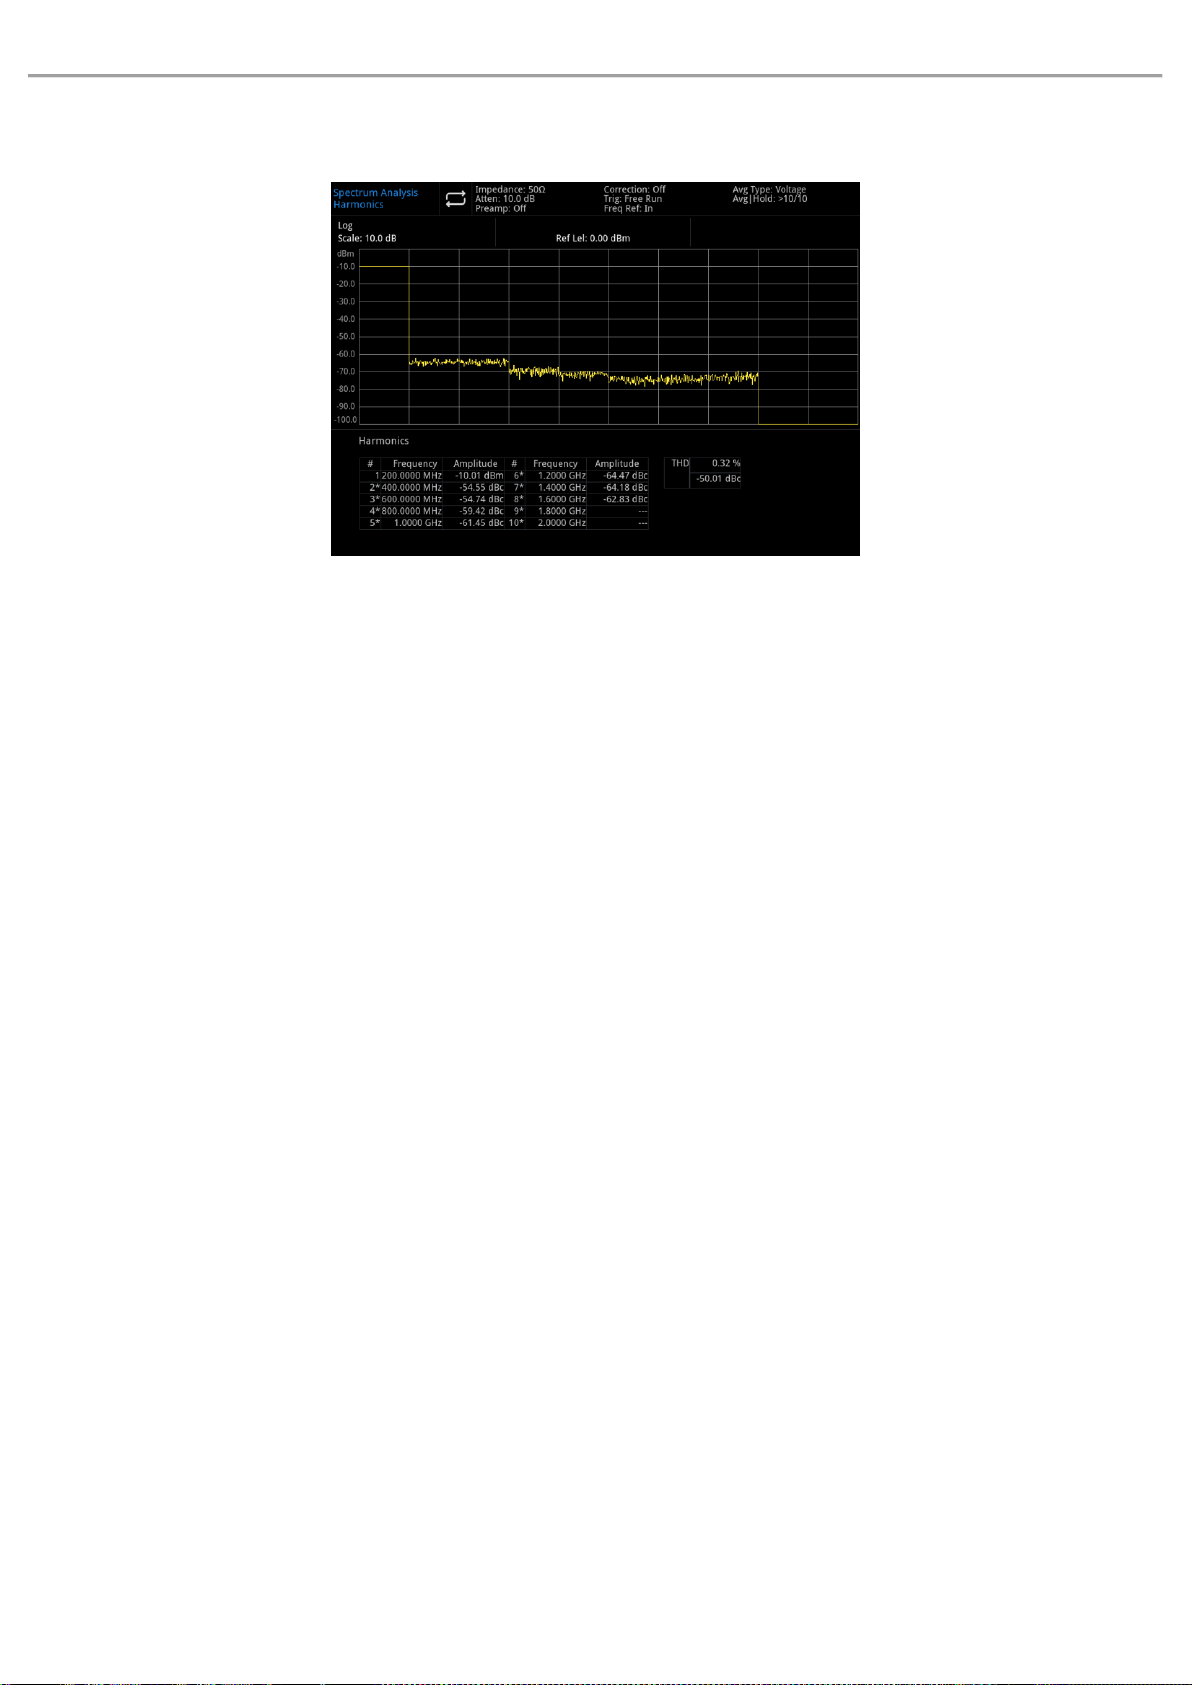
User’s Manual UTS1000B/T Series
Meas Preset: Reset all parameters of the current measuring mode to factory setting.
Harmonics
Figure 5-8 Harmonic Measurement
Harmonic Measurement: The amplitude of each sub-harmonic and the total harmonic distortion of the
carrier signal, which can be measured up to 10 harmonics.
THD is the total harmonic distortion.
The harmonic analysis waveform is displayed as zero-sweep waveform of each harmonic, and all keys under
the [FREQ] menu are blocked.
Press [Meas] >Harmonics to enter the following panel menu.
Meas/Setup:
Avg|Hold Num(On/Off): Press average time (on) to specify the average number of sweep to calculating the
measurement results. Sweep time range is from 1 to 999. User can change the average time by using the
numeric key, rotary knob, direction key, or touch the panel menu. Measured average result will be displayed
after the sweeping. Select (off) to turn off this measuring average function.
Avg Mode(Exponential/Repeat): Switch between exponential and repetition average mode. When the
specified average time of sweep is reached, this average mode is used to determine the average operation
mode of the spectrum analyzer.
When the exponential average mode is selected, after a specified average time is reached, each channel
trace data is weighted exponentially, added to the previous average value and then take the average. In the
exponential average mode, the weight of the new data is larger than that of the old data, which is conducive
to track signals that change slowly. Measured average result will be displayed after the sweeping.
When the repetition average mode is selected, after a specified average time is reached, all the previous
data will be delete and restart the sweeping.
Avg Type: Log-Pwr averaging is to average the logarithmic amplitude values (in dB) of the signal envelope
measured within a signal collection unit, the average detection type will change to video detection. Power
averaging is to average the power of the signal (the square of the amplitude),the average detection type will
change to RMS (power) detection.Voltage averaging is to average the voltage values of the signal envelope
measured in a signal collection unit, the average detection type will changed to voltage detection, The
voltage averaging is still a linear display.
Instruments.uni-trend.com 71 / 76
Page 72
User’s Manual UTS1000B/T Series
Name
Minimum
Maximum
Center Frequency
50Hz
3.209999950GHz
Span
Zero span
Full span
Start Freq
0Hz
3.209999900GHz
Stop Freq
100Hz
3.21GHz
Freq Offset
-100GHz
100GHz
CF Step
1Hz
3.21GHz
Ref Level
-100 dBm
30 dBm
Attenuation
0 dB
51 dB
Scale/Div
0.1dB
20dB
Ref Level Offset
-327.6dB
327.6dB
RBW
1Hz
1MHz
VBW
1Hz
1MHz
VBW:3dB RBW
0.000001
1000000
Sweep Time
1 ms
4 ks
Points
1
10001
Trace Operation Offset
-100dB
100dB
Mark Frequency
0Hz
3.21GHz
Mark △Frequency
-3.21GHz
3.21GHz
Fundamental: Set the frequency of the measured carrier signal.
User can change the frequency of basic harmonic by using the numeric key, rotary knob, direction key, or
touch the panel menu. By default, other harmonic measurements will be test at multiples of the specified
fundamental frequency.
Harmonics: Set the harmonic time of the measured carrier to calculate the total harmonic. User can
change the harmonic time by using the numeric key, rotary knob, direction key, or touch the panel menu.
Dwell Time: Sets the dwell time for the specified harmonic. In zero-span, the auto mode strikes a balance
between measurement speed and accuracy; increasing the dwell time will reduce measurement speed
while increasing accuracy. User can change the dwell time by using the numeric key, rotary knob, direction
key, or touch the panel menu.
Meas Preset: Reset all parameters of the current measuring mode to factory setting.
6. System Prompt and Troubleshooting
System Prompt
All the operating mode parameter setting are invalid, use the default value.
Instruments.uni-trend.com 72 / 76
Page 73
User’s Manual UTS1000B/T Series
Band Span
0Hz
6.42GHz
Band Left
-3.21GHz
3.21GHz
Band Right
-3.21GHz
3.21GHz
N dB
-140dB
-0.01dB
Peak Threshold
-200dBm
30dBm
Peak Excursion
0dBm
100dBm
Avg|Hold Number
1
999
Display Line
-200dBm
30dBm
Integ BW
100Hz
3.2GHz
Start Time
0s
10ms
Stop Time
0s
10ms
%OBW Power
10%
99.99%
x dB
-100dB
-0.1dB
Noise BW
(ACP)
100Hz
3.21GHz
Integral BW
(ACP)
100Hz
3.21GHz
Offset Freq
(ACP)
0Hz
1.604999950GHz
Carrier BW
(CNR)
100Hz
3.209999800GHz
Noise BW
(CNR)
100Hz
1.804999950GHz
Offset Freq
(CNR)
100Hz
1.804999950GHz
Fundamental
100Hz
1.600000000GHz
Harmonics
2
10
Troubleshooting
This chapter lists the possible faults and troubleshooting methods of the spectrum analyzer.
Please follow the corresponding steps to handle it, if these methods is not work, please contact UNI-T and
provide your machine.
Device information (acquisition method: [System] >Information)
1. After press the power soft switch, the spectrum analyzer still display a blank screen, and nothing is
displayed.
a. Check whether the power connector is properly connected and the power switch is turned on.
b. Check whether the power supply meets the requirements.
Instruments.uni-trend.com 73 / 76
Page 74

User’s Manual UTS1000B/T Series
c. Check whether the fuse of the machine is installed or blown.
2. Press the power switch, if the spectrum analyzer still display blank screen and nothing is displayed.
a. Check the fan. If the fan rotates but the screen is off, the cable to the screen may be loose.
b. Check the fan. If the fan does not rotate and the screen is off, it presents the instrument is not
enabled.
c. In case of the above faults, do not disassemble the instrument by yourself. Please contact UNI-T
immediately.
3. Spectral line is not updated for a long time.
a. Check whether the current trace is in update state or multiple averaging state.
b. Check whether the current is meet the restriction conditions. Check the restriction settings and
whether there are restriction signals.
c. In case of the above faults, do not disassemble the instrument by yourself. Please contact UNI-T
immediately.
d. Check whether the current mode is in the single sweep state.
e. Check whether the current sweep time is too long.
f. Check whether the demodulation time of the demodulation listening function is too long.
g. Check whether the EMI measurement mode is not sweeping.
4. The measurement results are incorrect or not accurate enough.
Users can obtain detailed descriptions of technical index from the back of this manual to calculate system
errors and check measurement results and accuracy problems. To achieve the performance listed in this
manual, you need:
a. Check whether external device is properly connected and work.
b. Have a certain understanding of the measured signal and set appropriate parameters for the
instrument.
c. Measurement should be performed under certain conditions, such as preheating for a period of time
after starting up, specific working environment temperature, etc.
d. Calibrate the instrument regularly to compensate for measurement errors caused by instrument aging.
If you need calibrate the instrument after the guarantee calibration period. Please contact UNI-T company
or obtain paid service from authorized measurement institutions.
Instruments.uni-trend.com 74 / 76
Page 75

User’s Manual UTS1000B/T Series
7 Appendix
Maintenance and Cleaning
(1) General Maintenance
Keep the instrument away from the direct sunlight.
Caution
Keep sprays, liquids and solvents away from the instrument or probe to avoid damaging the instrument
or probe.
(2) Cleaning
Check the instrument frequently according to the operating condition. Follow these steps to c clean the
external surface of the instrument:
a. Please use a soft cloth to wipe the dust outside the instrument.
b. When cleaning the LCD screen, please pay attention and protect the transparent LCD screen.
c. When cleaning the dust screen, use a screwdriver to remove the screws of the dust cover and then
remove the dust screen. After cleaning, install the dust screen in sequence.
d. Please disconnect the power supply, then wipe the instrument with a damp but not dripping soft
cloth. Do not use any abrasive chemical cleaning agent on the instrument or probes.
Warning
Please confirm that the instrument is completely dry before use, to avoid electrical shorts or even
personal injury caused by moisture.
Warranty Overview
UNI-T (UNI-TREND TECHNOLOGY (CHINA) CO., LTD.) ensures the production and sale of products, from
authorized dealer’s delivery date of one year, without any defects in materials and workmanship. If the
product is proven to be defective within this period, UNI-T will repair or replace the product in accordance
with the detailed provisions of the warranty.
To arrange for repair or acquire warranty form, please contact the nearest UNI-T sales and repair
department.
In addition to permit provided by this summary or other applicable insurance guarantee, UNI-T does not
provide any other explicit or implied guarantee, including but not limited to the product trading and special
purpose for any implied warranties.
In any case, UNI-T does not bear any responsibility for indirect, special, or consequential loss.
Contact Us
If the use of this product has caused any inconvenience, if you in mainland China you can contact UNI-T
company directly.
Instruments.uni-trend.com 75 / 76
Page 76

User’s Manual UTS1000B/T Series
Service support: 8am to 5.30pm (UTC+8), Monday to Friday or via email. Our email address is
[email protected]
For product support outside mainland China, please contact your local UNI-T distributor or sales center.
Many UNI-T products have the option of extending the warranty and calibration period, please contact your
local UNI-T dealer or sales center.
To obtain the address list of our service centers, please visit our website at
URL: http://www.uni-trend.com
Instruments.uni-trend.com 76 / 76
 Loading...