

Page 1

USER’S MANUAL
V7 / V9
750 50 0042 03
Page 2

Page 3

www.trimos.com
Dear customer, congratulations for choosing a TRIMOS measuring instrument. For more
than 40 years, our products have built up an excellent reputation in terms of quality, accuracy
and longevity. For full satisfaction with the present product, we recommend to read this
user’s manual carefully.
750 50 0042 03 Version 1.4 / 2018-04
Valid for firmware package 1.20/2.36/3.27
TRIMOS ® - All modification rights reserved
TRIMOS SA
Av. de Longemalle 5
CH - 1020 Renens
T. + 41 21 633 01 01
F. + 41 21 633 01 02
1
Page 4

CONTENTS
1. Safety Regulations .............................................................................................................. 5
1.1 Important Information ................................................................................................ 5
1.2 Security Symbols ........................................................................................................ 5
1.3 General Warnings ....................................................................................................... 5
2. Instrument Description ...................................................................................................... 6
2.1 V7 ................................................................................................................................ 6
2.2 V9 ................................................................................................................................ 8
3. Setting up .......................................................................................................................... 10
3.1 Packing List .............................................................................................................. 10
3.2 Setting-up ................................................................................................................. 11
4. Getting Started.................................................................................................................. 13
4.1 Start-up ..................................................................................................................... 13
4.2 Displacement Modes: Manual/Motorized ............................................................... 13
4.3 Reference and Probe Constant ............................................................................... 15
5. Display structure............................................................................................................... 17
5.1 Display Modes ......................................................................................................... 17
5.2 Function Menus ........................................................................................................ 17
6. Main Measurement Functions ......................................................................................... 18
6.1 Height Measurements .............................................................................................. 18
6.2 Diameter and Centreline Measurement ................................................................... 19
6.3 Min, Max and Delta Modes ..................................................................................... 21
7. Additional Functions ......................................................................................................... 23
7.1 Zero Setting of the Display ...................................................................................... 23
7.2 References and Preset ............................................................................................. 23
7.3 Selection of the Measuring Unit .............................................................................. 24
7.4 Resolution ................................................................................................................. 25
7.5 Buffer Management .................................................................................................. 25
7.6 Probe Constant ........................................................................................................ 27
7.7 Difference Between the Last 2 Measurements........................................................ 28
7.8 Operations Between Selected Values of the Buffer ................................................ 28
7.9 Average of the Last 2 Measurements ...................................................................... 30
7.10 Distance and Centreline Measurement ................................................................... 31
7.11 Angle (and cone) Measurements ............................................................................. 32
7.12 Tolerance Limits ....................................................................................................... 34
7.13 Display Modes of the Height Measurements .......................................................... 35
7.14 Probe Holder Change .............................................................................................. 36
7.15 Shrinking Factor ....................................................................................................... 37
7.16 Inversion of the Measuring Direction ....................................................................... 38
8. Perpendicularity Measurements ..................................................................................... 39
8.1 With Test Indicator ................................................................................................... 39
8.2 With Electronic Probe ............................................................................................... 39
9. 2-Coordinate Measurements (2D) .................................................................................. 44
9.1 Getting Started ......................................................................................................... 44
9.2 Acquisition of Points ................................................................................................ 45
9.3 Display Management ............................................................................................... 46
User's Manual
750 50 0042 03 2
Page 5

V7 / V9
9.4 Transformations of the Axis System ........................................................................ 47
9.5 Measurements and Analyses ................................................................................... 49
9.6 Editing, Adding and Deleting Points ........................................................................ 51
9.7 Quit the 2D mode ..................................................................................................... 53
10. Measurement sequences ................................................................................................ 54
10.1 Start .......................................................................................................................... 54
10.2 Programming a Sequence ........................................................................................ 55
10.3 Running a Sequence ................................................................................................ 57
10.4 Special Features of the Programming Mode ........................................................... 58
10.5 Quit the Measurement Sequence Mode ................................................................. 58
11. Statistical Analysis of Results ......................................................................................... 59
11.1 Start .......................................................................................................................... 59
11.2 Batch Analysis .......................................................................................................... 59
11.3 Quit the Statistic Analysis Mode ............................................................................. 62
12. Sending Data and Printing .............................................................................................. 63
12.1 Connectors............................................................................................................... 63
12.2 Configuring the Printing and the Data Transfer ....................................................... 63
12.3 Data Transfer via USB B ........................................................................................... 64
12.4 Data Transfer via RS232 ........................................................................................... 65
12.5 Data Transfer to a USB Printer ................................................................................. 66
13. Configuration .................................................................................................................... 68
13.1 Page 1 ....................................................................................................................... 68
13.2 Page 2 ....................................................................................................................... 68
13.3 Page 3 ....................................................................................................................... 69
13.4 Page 4 ....................................................................................................................... 69
13.5 Page 5 ....................................................................................................................... 70
13.6 Page 6 ....................................................................................................................... 70
14. Adjustments ...................................................................................................................... 71
14.1 Configuration diameter measurements "SMART REVERSE" .................................... 71
14.2 Adjustment of Floating Probe Suspension Balancing ............................................. 72
14.3 Air Cushion ............................................................................................................... 73
14.4 Standby Mode .......................................................................................................... 73
14.5 Resetting of the Instrument ...................................................................................... 73
14.6 Cleaning ................................................................................................................... 73
15. After Sales Service ........................................................................................................... 74
15.1 Replacement of Battery Block .................................................................................. 74
15.2 Replacement of Clock Back-up Battery ................................................................... 74
15.3 Recycling of Electronic Components ...................................................................... 75
15.4 Complaints / Repairs ................................................................................................ 75
15.5 Agents ...................................................................................................................... 75
16. Technical Specifications .................................................................................................. 76
16.1 V7 .............................................................................................................................. 76
16.2 V9 .............................................................................................................................. 78
17. Declaration of Conformity ................................................................................................ 80
750 50 0042 03 3
Page 6

User's Manual
750 50 0042 03 4
Page 7
V7 / V9
Protection against electrostatic interferences:
order to prevent this type of damages, avoid any contact with the connector pins.
Do not expose the instrument, its components and accessories to rain or any
and the instrument openings.
In case of problems with the instrument or any of its parts (no display,
disconnect the power supply. Please contact your local TRIMOS agent.
This is a high accuracy instrument. Particular care should be taken during its entire
- Respect the advised environmental conditions.
1. SAFETY REGULATIONS
1.1 Important Information
In order to prevent any damages due to wrong manipulation, please carefully read the
following instructions. TRIMOS will not accept any responsibility in case of damages caused
by inadequate use not in line with the present manual.
1.2 Security Symbols
The following security symbols are used in this manual:
General warning, utilisation advice
Risk of electric shock
Electrostatic protection
1.3 General Warnings
Static electricity can damage the electronic components of the instrument. In
In order to prevent any changes of the instrument performance or any accident,
the instrument should never be dismantled.
If, for any reason, the electronic unit has to be opened, only authorized personnel
are allowed to do so.
projection of fluids. Avoid penetration of foreign substances into the connectors
Do not cover or wrap the display unit during use. The unit must be kept well
ventilated to avoid any overheating.
overheating, abnormal smell...), immediately switch off the instrument and
operational lifetime. Pay special attention to the following specific points :
- Use the instrument on a stable, smooth and clean surface plate.
- Avoid any shock to prevent the instrument from losing some or all of its
performing characteristics.
- Use the instrument in a vibration free area.
750 50 0042 03 5
- Avoid exposure to direct sunlight and excessive humidity.
- Avoid proximity of heating or air conditioning systems.
Page 8
2.1.2
8
10
7 5 4 3 2 1 6
9
11
12
24
25
26
21
22
23
2.1.3
2.1.1
31
36
37
38
32
33
34
35
2. INSTRUMENT DESCRIPTION
2.1 V7
User's Manual
750 50 0042 03 6
Page 9

V7 / V9
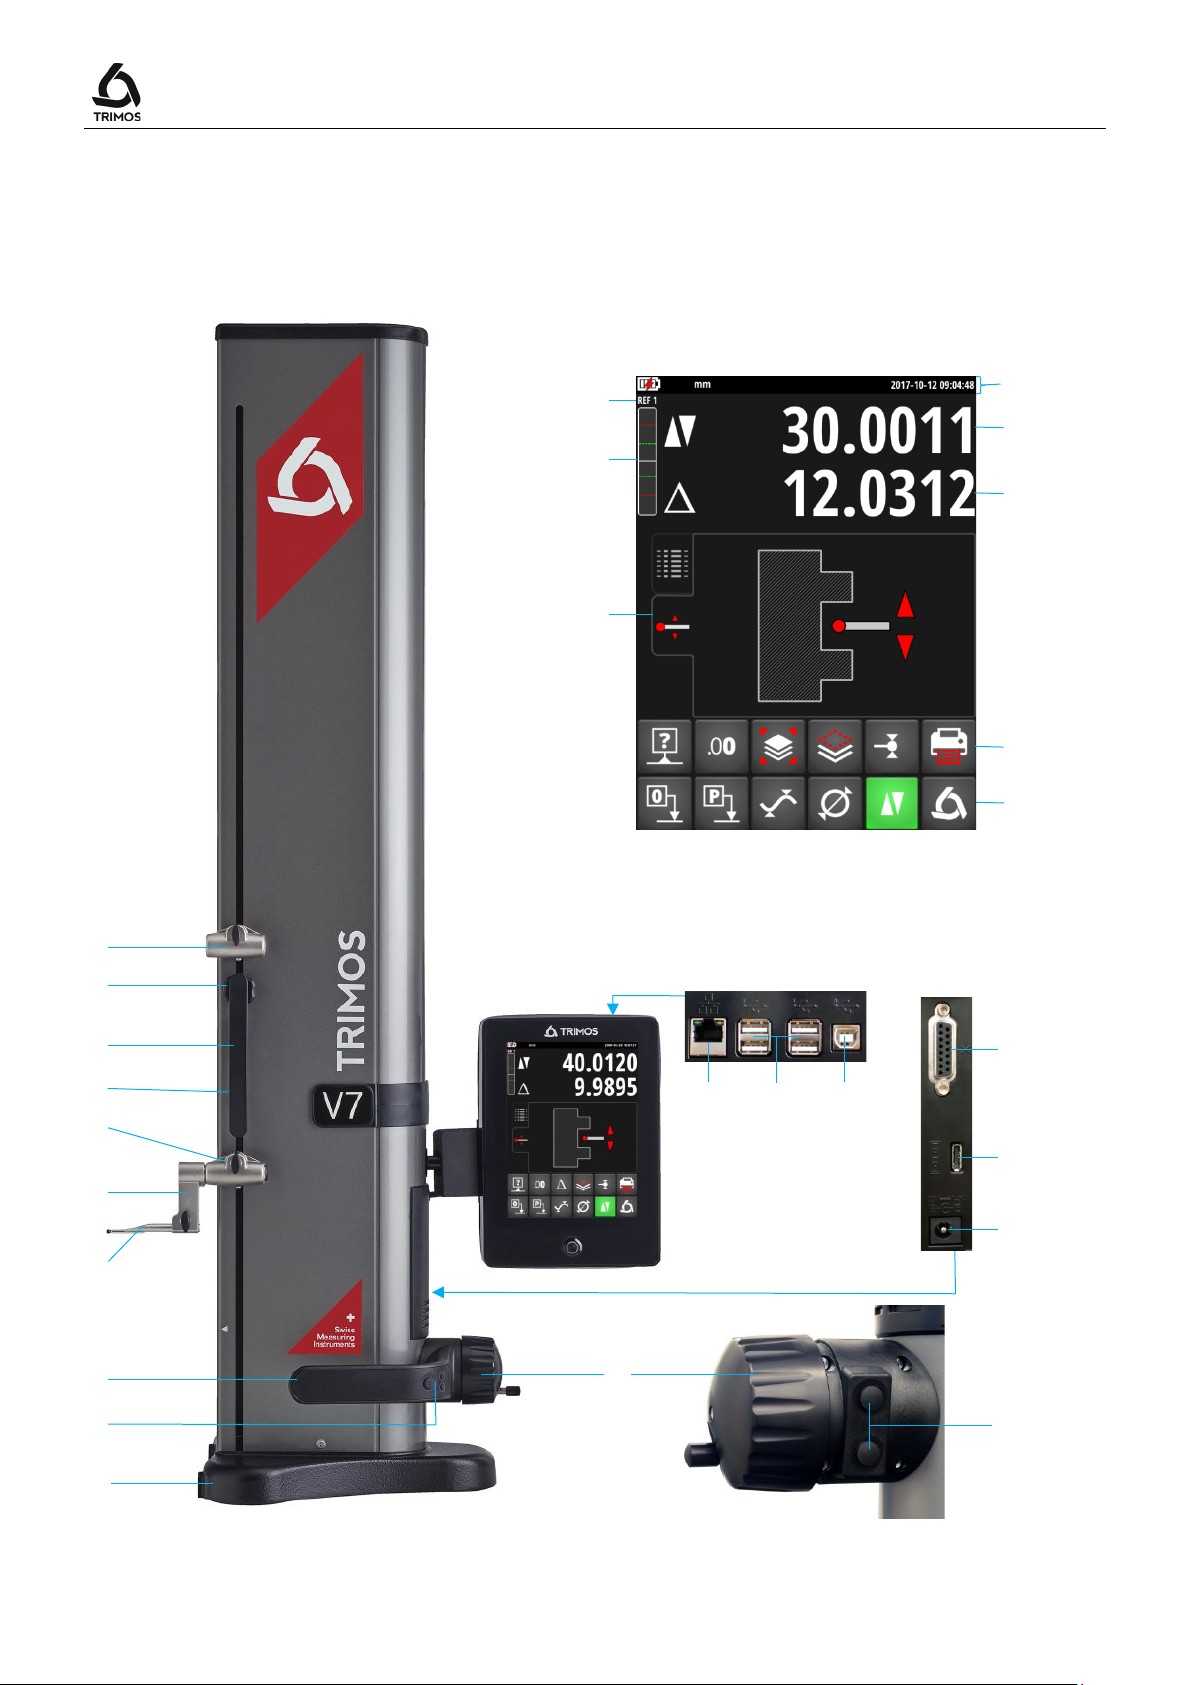
2.1.1 Instrument
1. Upper probe holder
2. Screw for the adjustment of the floating probe suspension
3. Handle for carriage displacement
4. Transport safety screw for locking of probe suspension (chromium plated)
5. Lower probe holder
6. Insert holder
7. Measuring insert
8. Operating handle for the displacement of the instrument
9. Button for activation of air cushion and programmable functions keys (§ 13.3)
10. Base with air cushion system for instrument displacement
11. Handwheel for carriage displacement / Activation of manual/motorised movement
12. Buttons for motorised displacement
2.1.2 Interfaces/Connectors
21. RJ45 connector
22. USB-A connectors (4x)
23. USB-B connector
24. Connector for electronic perpendicularity probe
25. Connector for RS232 communication (on lower right side of height gauge)
26. AC adapter connection (on lower right side of height gauge)
2.1.3 Display
31. Status symbols (battery level, units, active functions, date and time)
32. 1st display line
33. 2nd display line
34. Menu line with scrolling functions
35. Menu line with fixed functions
36. Current reference
37. Probing indicator
38. Selection tabs of the measurement display mode
750 50 0042 03 7
Page 10
7 9 5
4 3 2
1
6
8
10
11
24
25
26
21
22
23
2.2.3
2.2.2
2.2.1
31
36
37
38
32
33
34
35
2.2 V9
User's Manual
750 50 0042 03 8
Page 11

V7 / V9
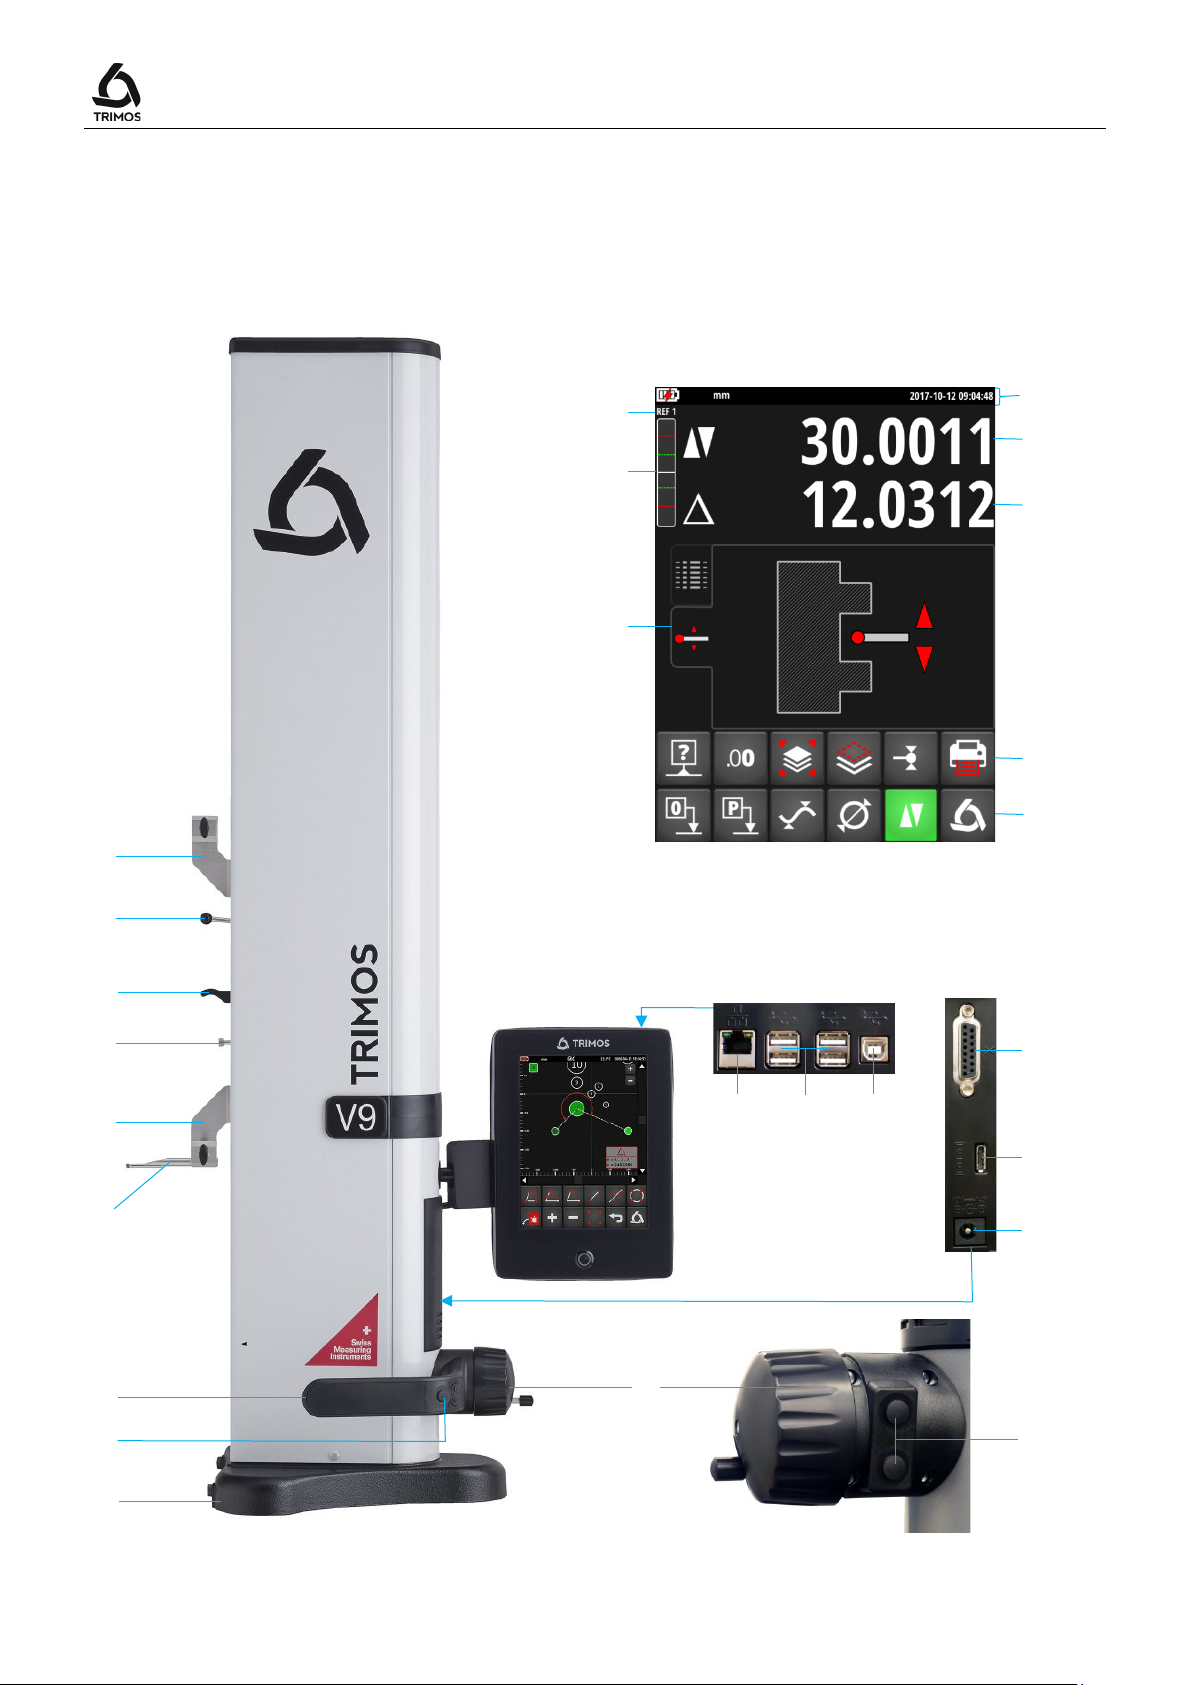
2.2.1 Instrument
1. Upper probe holder
2. Lever for the adjustment of the floating probe suspension
3. Handle for carriage displacement
4. Transport safety screw for locking of probe suspension (chromium plated)
5. Lower probe holder
6. Measuring insert
7. Operating handle for the displacement of the instrument
8. Button for activation of air cushion and programmable functions keys (§ 13.3)
9. Base with air cushion system for instrument displacement
10. Handwheel for carriage displacement / Activation of manual/motorised movement
11. Buttons for motorised displacement
2.2.2 Interfaces/Connectors
21. RJ45 connector
22. USB-A connectors (4x)
23. USB-B connector
24. Connector for electronic perpendicularity probe
25. Connector for RS232 communication (on lower right side of height gauge)
26. AC adapter connection (on lower right side of height gauge)
2.2.3 Display
31. Status symbols (battery level, units, active functions, date and time)
32. 1st display line
33. 2nd display line
34. Menu line with scrolling functions
35. Menu line with fixed functions
36. Current reference
37. Probing indicator
38. Selection tabs of the measurement display mode
750 50 0042 03 9
Page 12
While unpacking, carry the instrument by lifting if by its displacement handle and
Condensation can affect sensitive parts of the instrument.
3. SETTING UP
3.1 Packing List
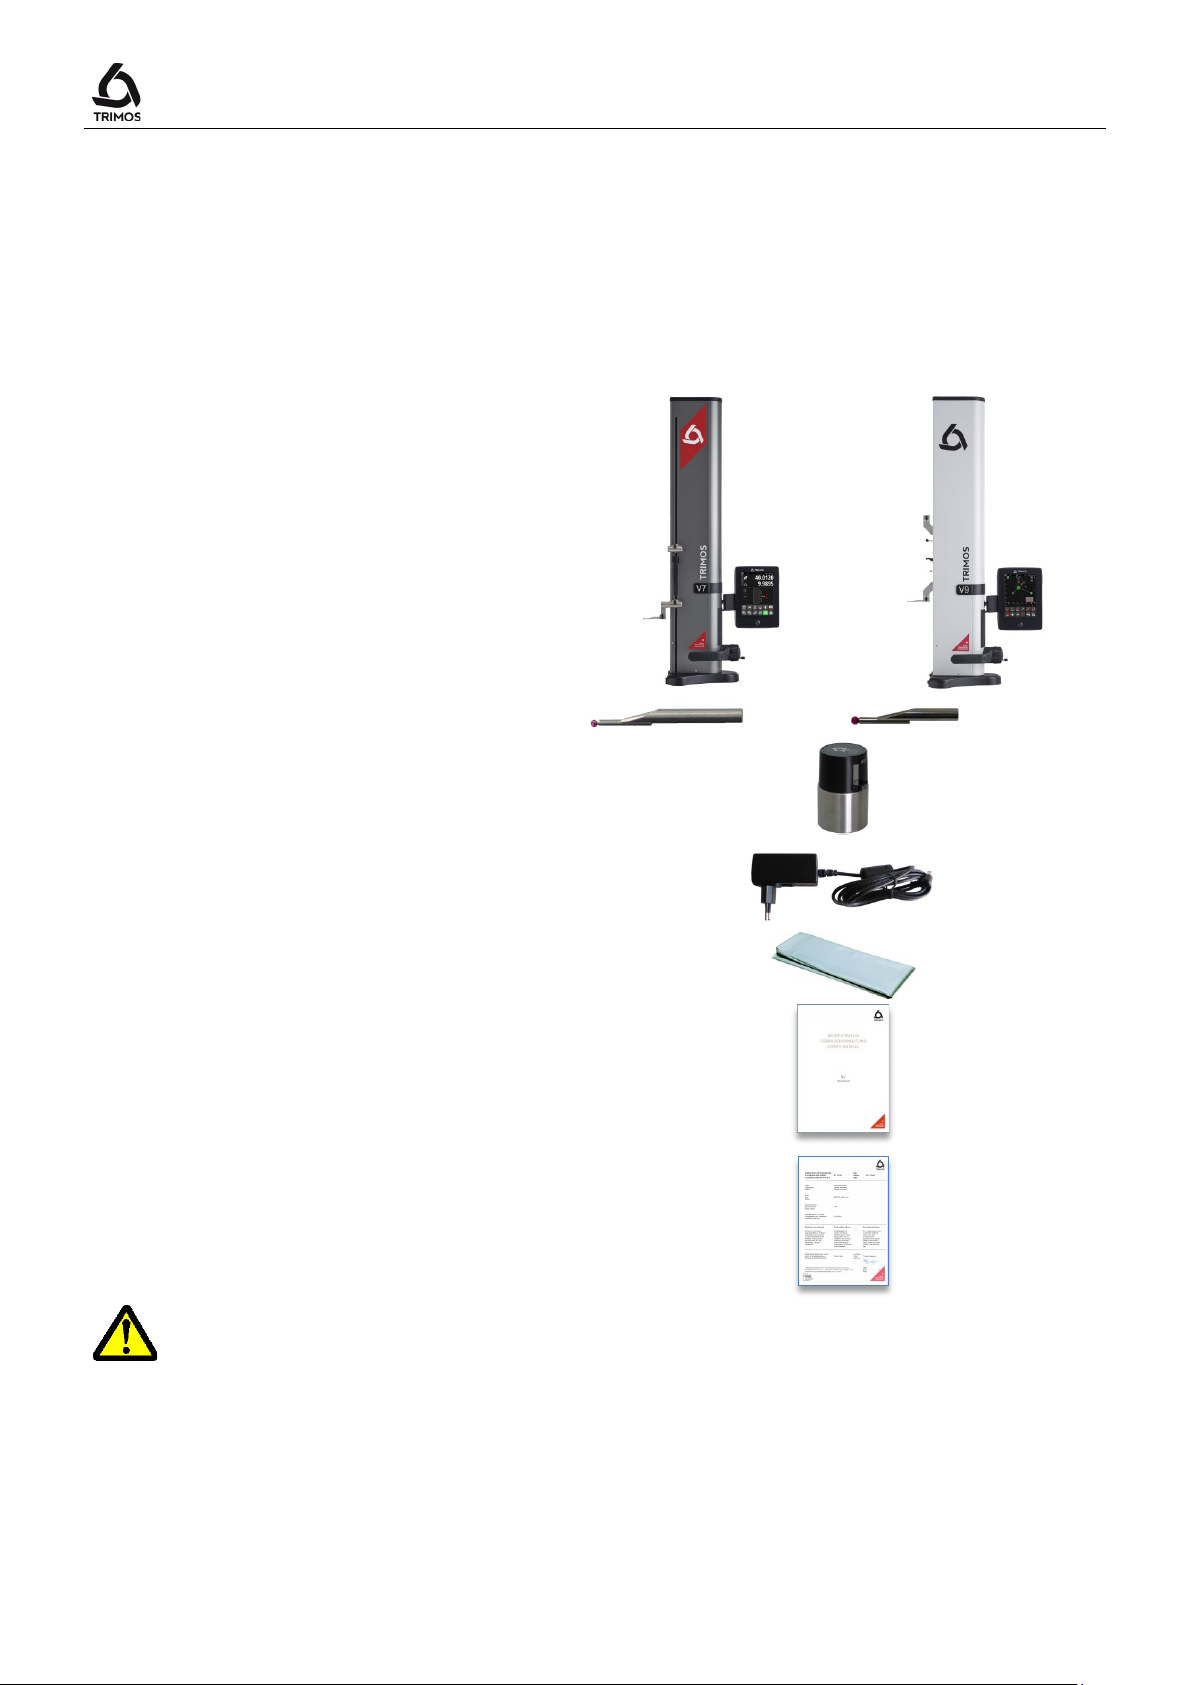
The standard packing of the instrument includes the following elements:
User's Manual
1. Instrument with display unit and
connection cable (HDMI)
2. Measuring insert
3. Setting gauge
4. Charging unit
V7 V9
5. Protection cover
6. User's manual
7. Calibration certificate
body. In NO case should the instrument be carried by the handle for carriage
displacement (3). Keep the original packaging for future transportation.
If the instrument has been stored at a temperature below 5°C, wait a few hours
before unpacking to prevent the instrument parts from condensation.
750 50 0042 03 10
Page 13
V7 / V9
The straight connector shall be connected to the display unit and the right-
Static electricity can damage the electronic components of the instrument. In
pins.
3.2 Setting-up
After unpacking, prepare the instrument as follows:
1. Clean the pads positioned underneath the base
using a clean cloth, slightly dampened with alcohol.
2. Position the instrument with care on a clean
measuring plate.
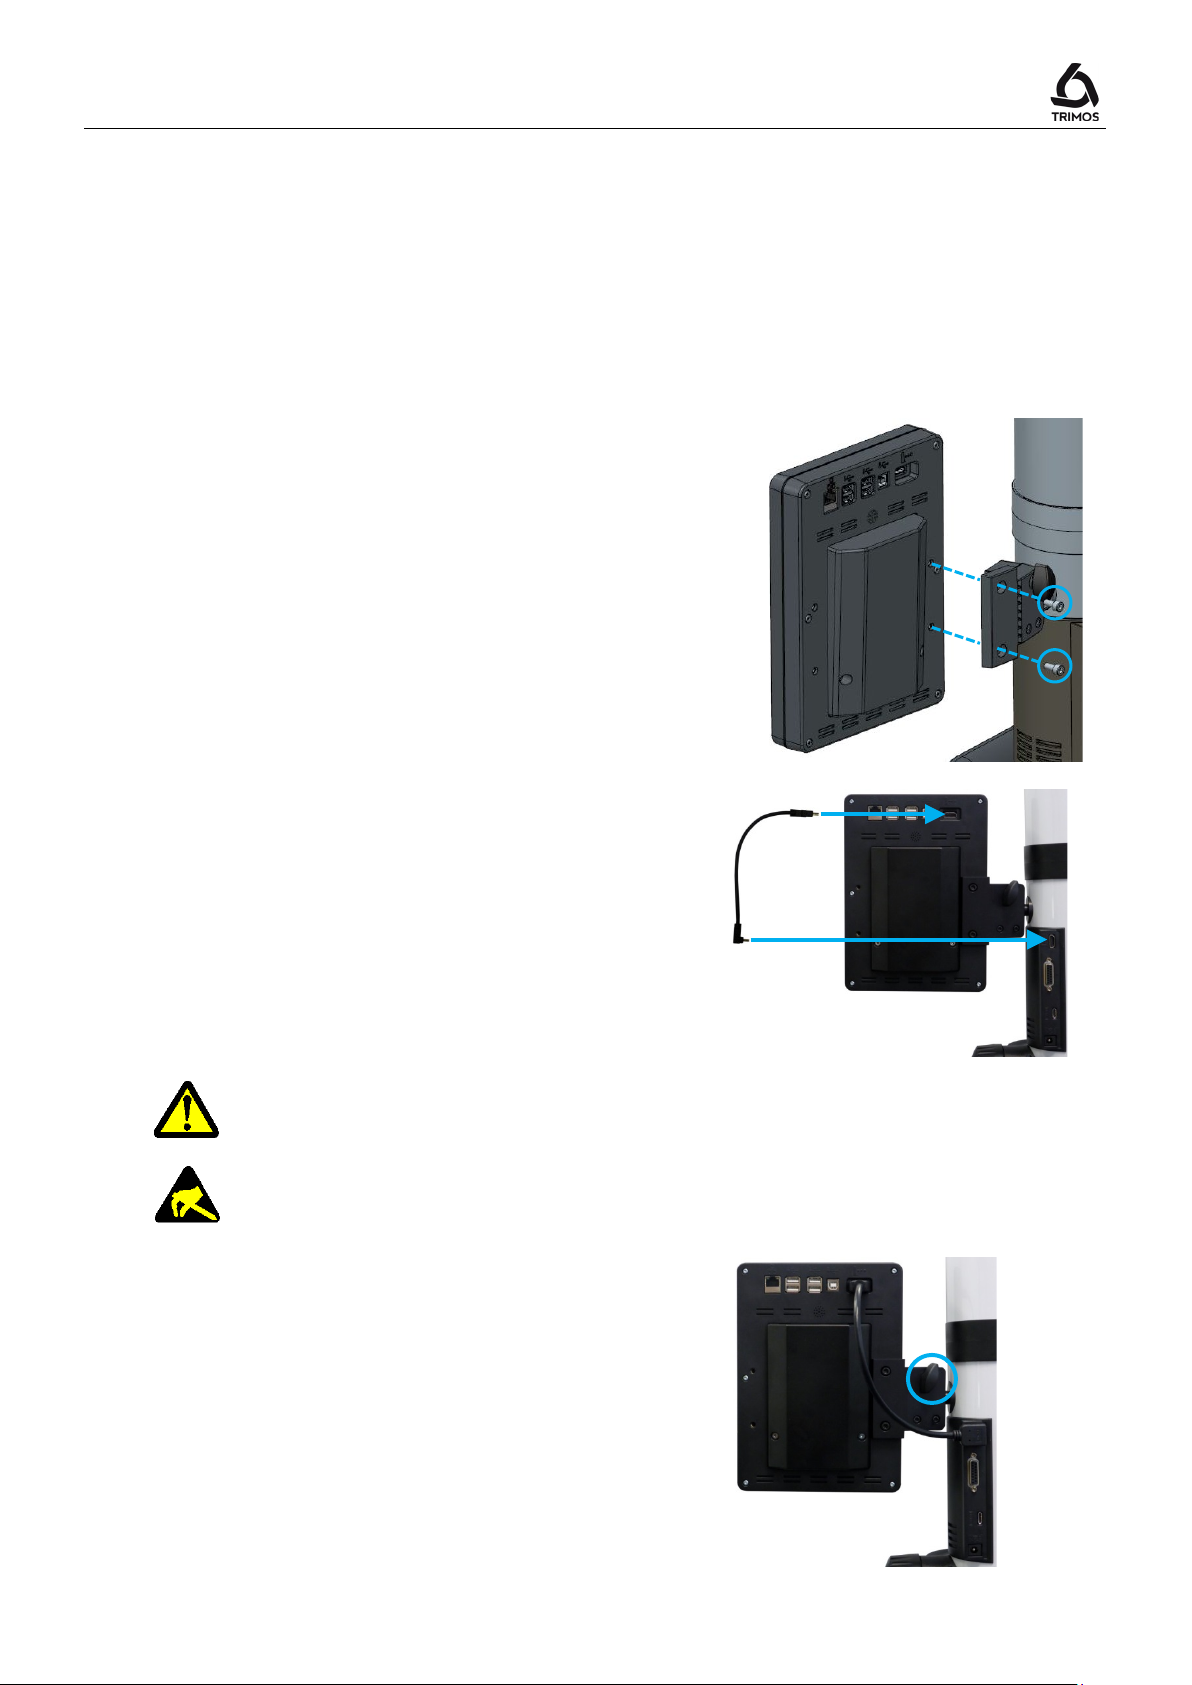
3. Mount the display unit on its support using the 2
screws.
4. Connect the HDMI cable between the instrument
and the display unit.
angle connector to the instrument.
order to prevent this type of damages, avoid any contact with the connector
5. The locking knob behind the support allows the
adjustment of the display unit position.
750 50 0042 03 11
Page 14
Only use the charging unit supplied with the instrument to load the batteries. Empty
battery pack is fully charged. The instrument becomes operational immediately after
Incorrect loading of the battery can result in a decrease of capacity, overheating, or
to use and operating conditions.
V7
V9
V7
V9
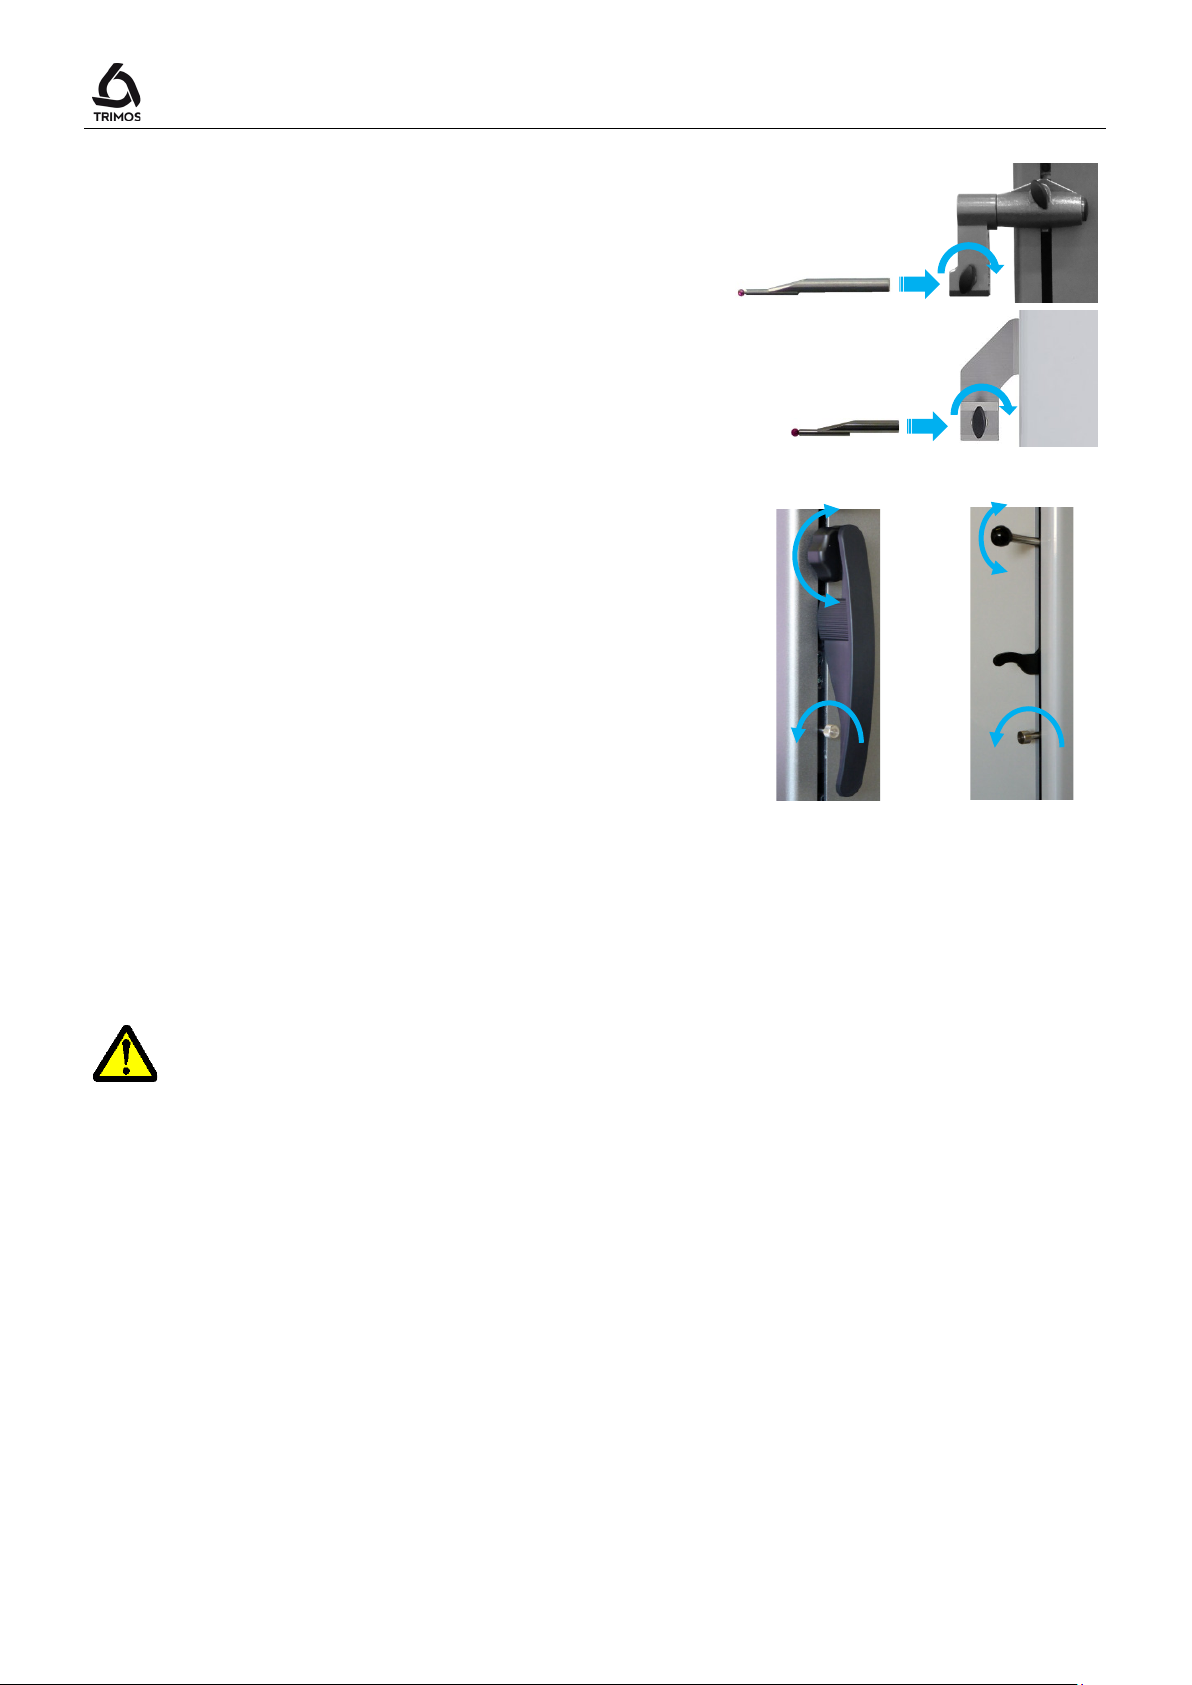
6. Slide the measuring insert into the holder and lock
it, using the knob. Take care to position the
eccentric probes correctly.
7. Release the transport safety screw.
8. Check / adjust the floating probe suspension
balancing (§ 14.2).
User's Manual
9. If the instrument does not switch on or in case of
low battery level, proceed to a full loading of the
batteries (plug in the charging unit to the
instrument).
batteries are fully loaded in about 12 hours. It is not necessary to wait until the
having connected the charging unit.
It is not dangerous to leave the charging unit connected. Permanently plugged-in
instruments automatically switch to trickle charge mode.
The batteries are of Lithium-ion type. An excessive room temperature can affect the
battery capacity and therefore the instrument autonomy. It is not recommended to
load the battery in case of room temperature superior to 40C°.
even an explosion and cause important damages.
The battery can be loaded and unloaded 300 times before a significant reduction of
their capacity. The number of loading cycles and the autonomy can vary according
750 50 0042 03 12
Page 15
V7 / V9
Activation of
mode
Activation of
manual
4. GETTING STARTED
4.1 Start-up
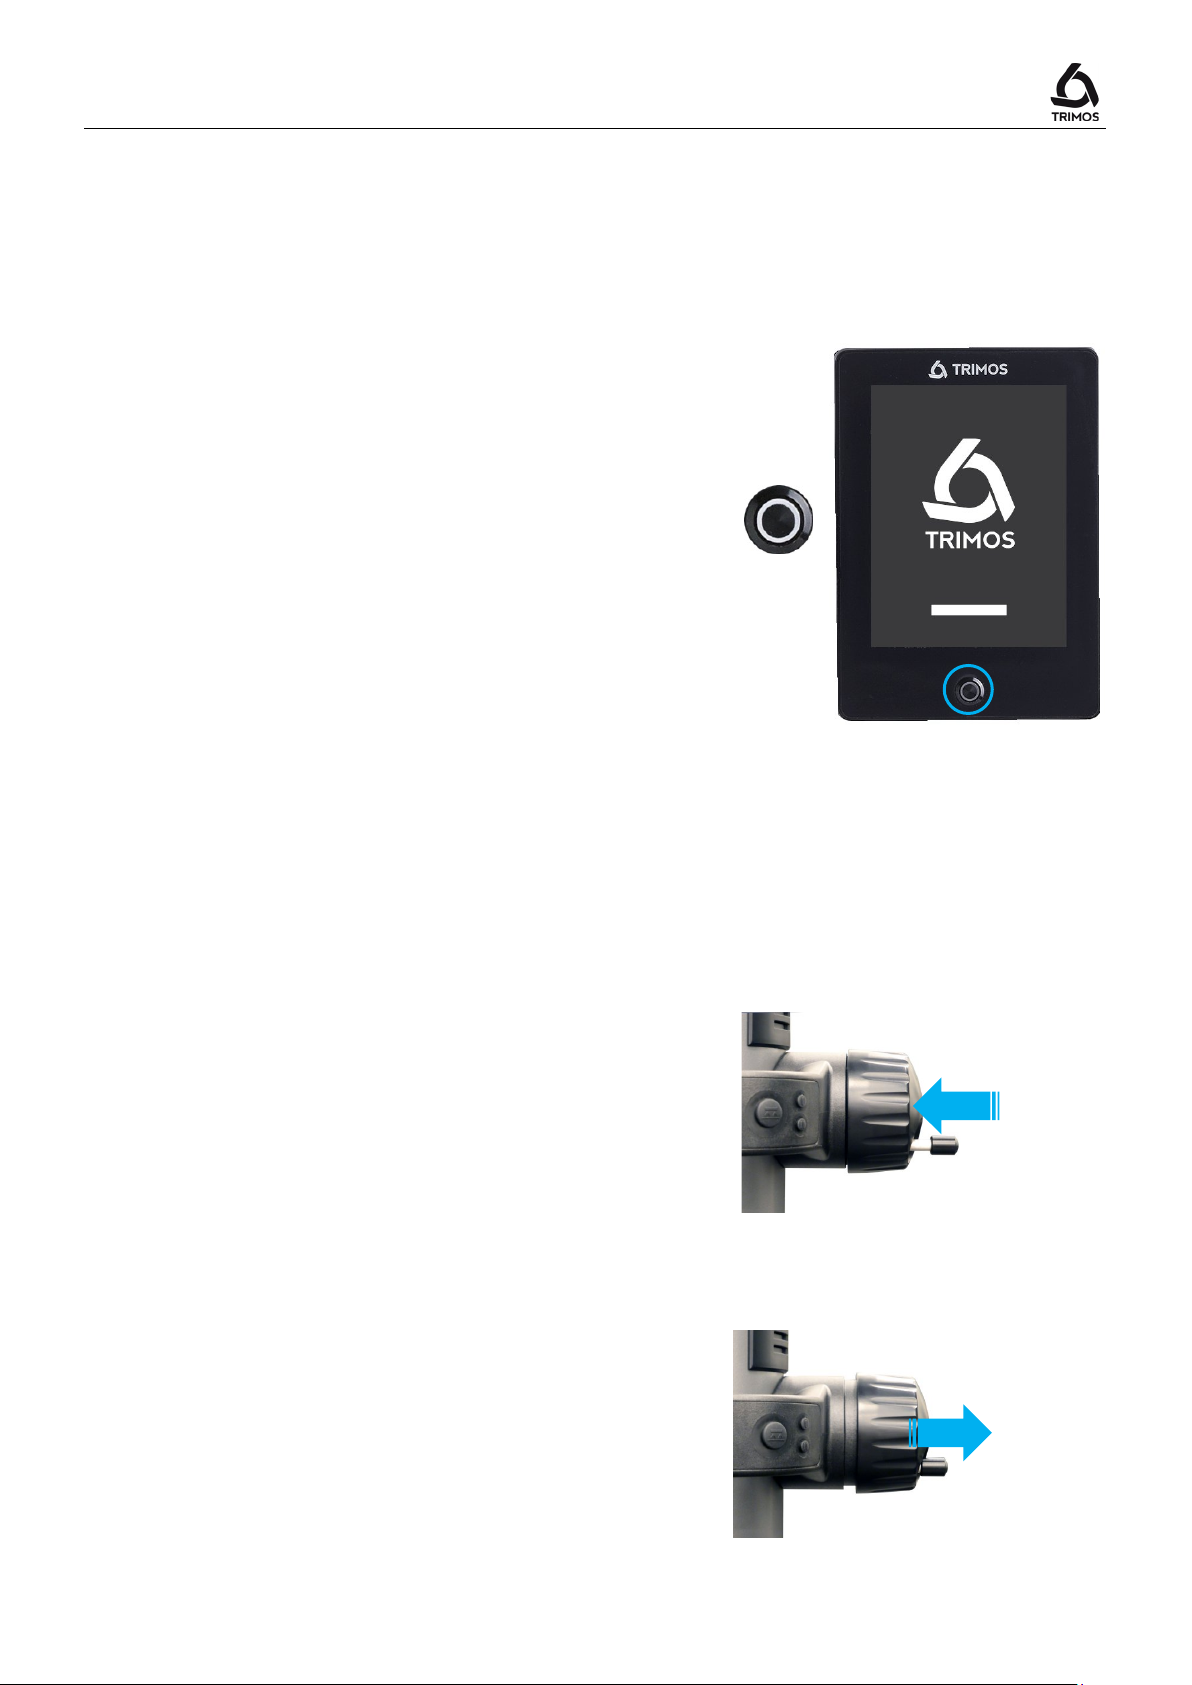
Switch on the instrument by pressing the On/Off button
for 2 seconds.
> 2s
4.2 Displacement Modes: Manual/Motorized
V7 & V9 instruments can be used in manual or motorized mode.
4.2.1 Manual Displacement Mode
The manual displacement of the carriage is carried out
with the help of the handle.
4.2.2 Motorized Displacement Mode
Pull the handle outwards to work in motorized mode. In
this mode, the rotating handle can be tucked inside for
ergonomic reasons.
When The motorisation is switched on, the "motor"
symbol is displayed on the top of the screen.
mode
motorised
750 50 0042 03 13
Page 16
Button for upward
Button for downward
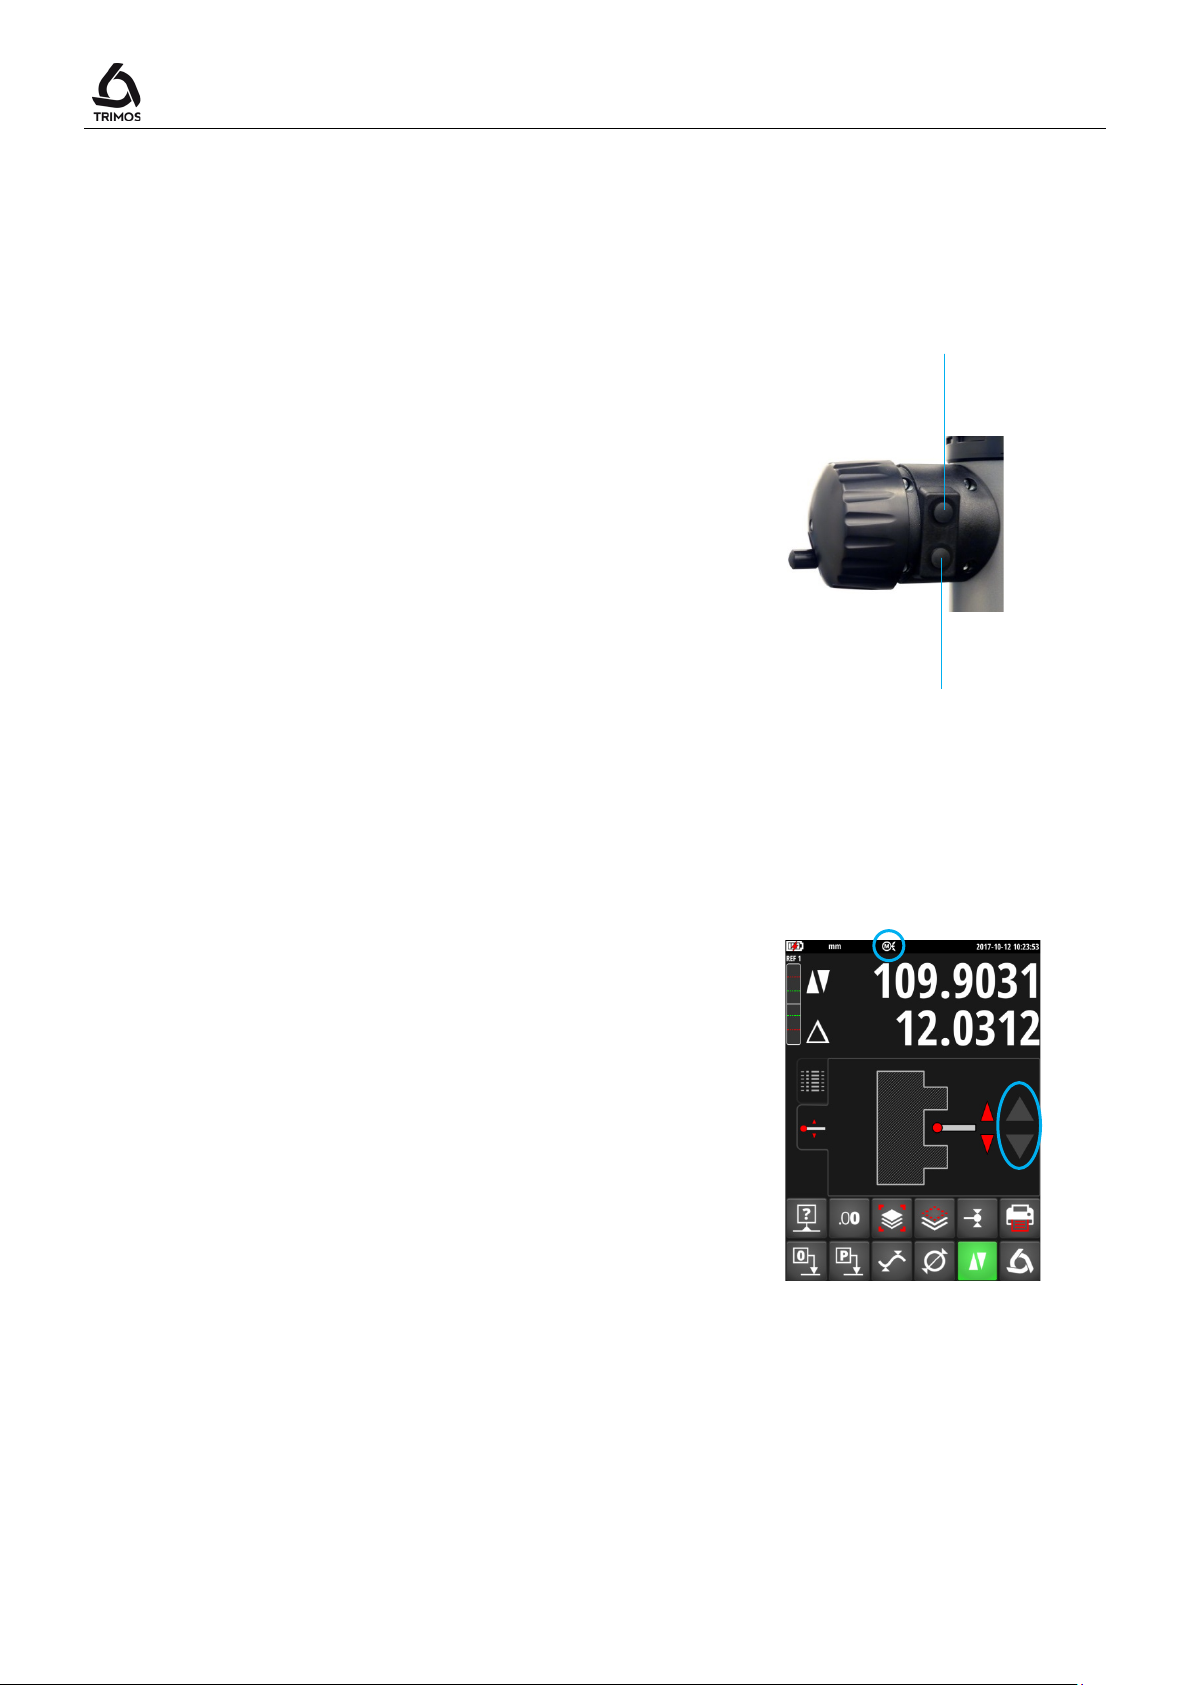
Motorised displacement is carried out with the help of 2
buttons placed behind the handwheel or in some cases
the touchscreen.
Rapid Displacement
A prolonged press on one of the buttons causes a rapid
movement in the chosen direction. The carriage will
continue its displacement as long as the pressure is
maintained.
Slow Displacement (Probing)
A short pressure causes a continuous displacement in
probing speed, i.e. speed used for measuring. As soon
as the probe gets in touch with a surface, a
measurement is made.
Release of Probe
When the probe is in contact with the part (after
probing), a short pressure on the button for the opposite
direction allows to release the probe (ca. 0.5 mm).
Movement Stop
While displacing in low speed mode, a short pressure on
the button for the same direction as that of the
displacement will stop the movement.
User's Manual
displacement
displacement
When the graphic display mode is selected, the
displacement is carried out with the help of 2 grey
arrows to the right of the screen.
Its usage is identical to the one described above in case
of buttons.
750 50 0042 03 14
Page 17
V7 / V9
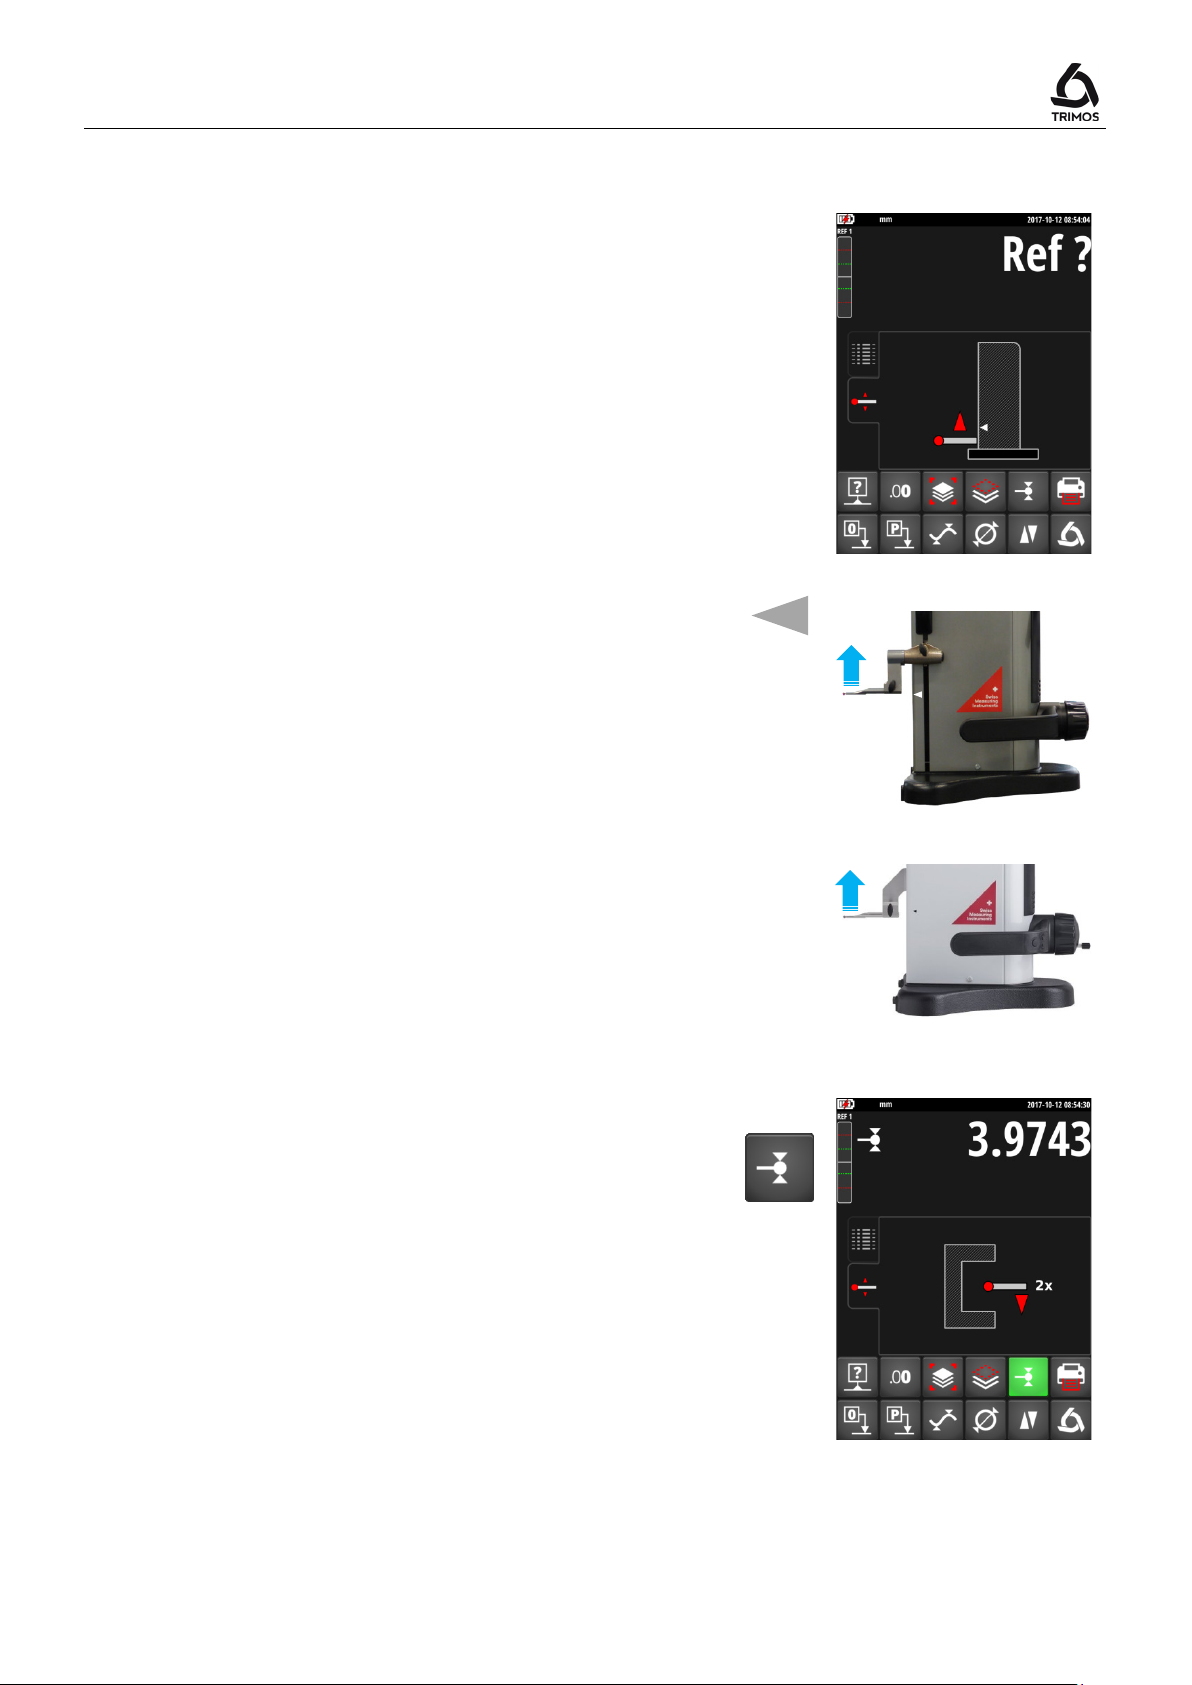
up, the display will ask for the reference
the carriage upwards). An acoustic signal will confirm
This procedure may be interrupted by pressing on the
measurement button. The latest probe constant value
4.3 Reference and Probe Constant
1. After startingposition. Move the measuring carriage slowly across
the mark indicating the reference position with the
help of the handle for carriage displacement (the
acquisition of reference is carried out by displacing
that the reference has been detected.
Note:
This procedure is carried out automatically in
motorised mode. Next, the measuring insert will
come and position itself at the upper level of the
setting gauge (see below).
2. The instrument is now asking for the probe constant.
This function compensates the dimension and the
bending of the measuring insert when probing
downwards and upwards (reversed surfaces,
diameters). The last stored probe constant value will
be displayed.
Note:
constant recording button or on any other mode of
measured is then recorded.
750 50 0042 03 15
Page 18
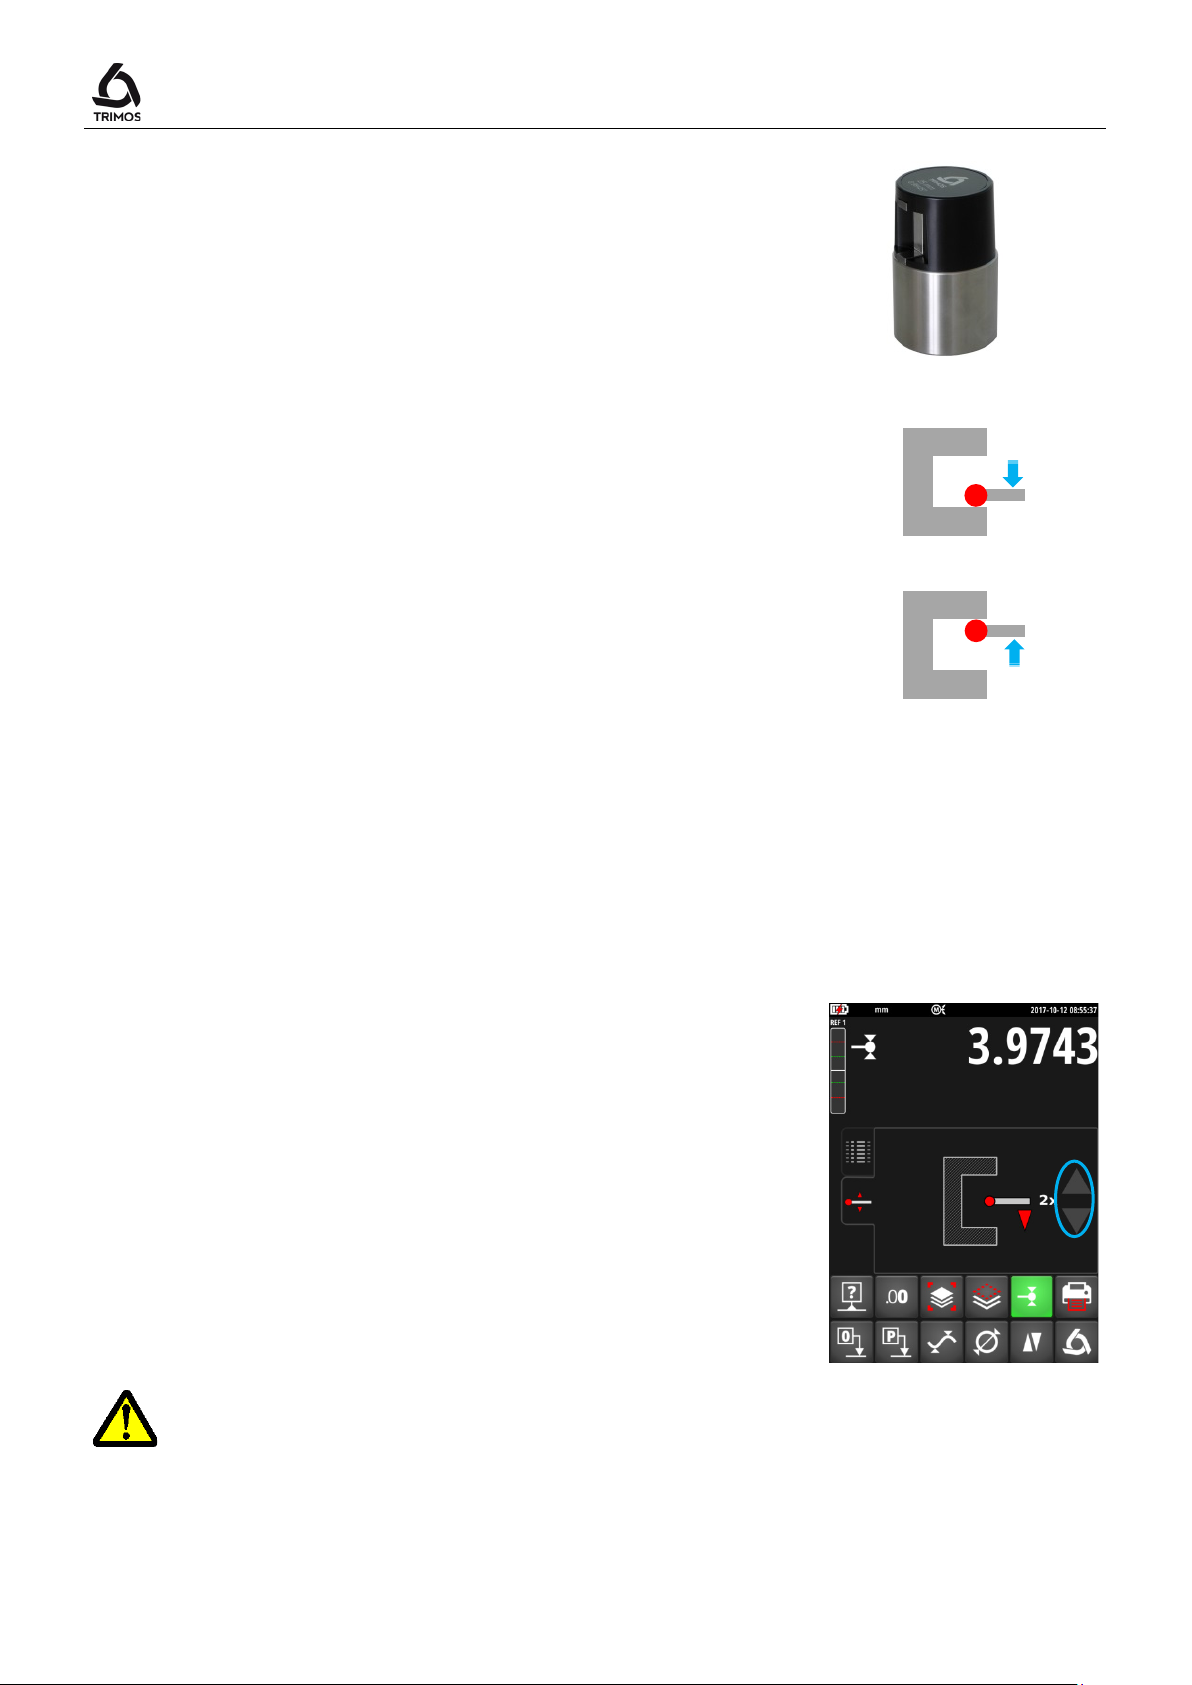
Use the setting gauge supplied with the instrument to
The screen will display the setting gauge value during
The probe constant needs to be checked and stored again after each measuring
User's Manual
3.
carry out this operation.
Note:
A different setting gauge may be used. In this case,
its dimension must be configured in the set-up menu
(§ 13.2).
4. Move the measuring insert downwards (use the
handwheel for the displacement of the measuring
carriage) until it touches the surface and an acoustic
signal confirms the measurement (=probing).
5. Without moving any part (instrument and gauge),
move the measuring insert towards the top and
perform the same sequence on the upper surface of
the setting gauge.
6. Repeat the sequences 4 and 5 one more time. This
allows establishing the probe constant more
precisely.
2x
7.
the latest probing, as well as that of the new probe
constant. The instrument is then ready to be used.
In motorised mode, this procedure can be carried out
automatically by pressing one of the grey arrows on the
right of the screen.
insert change, after change of its position in the holder, after each adjustment of
the measuring force or adjustment of the floating probe suspension.
750 50 0042 03 16
Page 19
V7 / V9
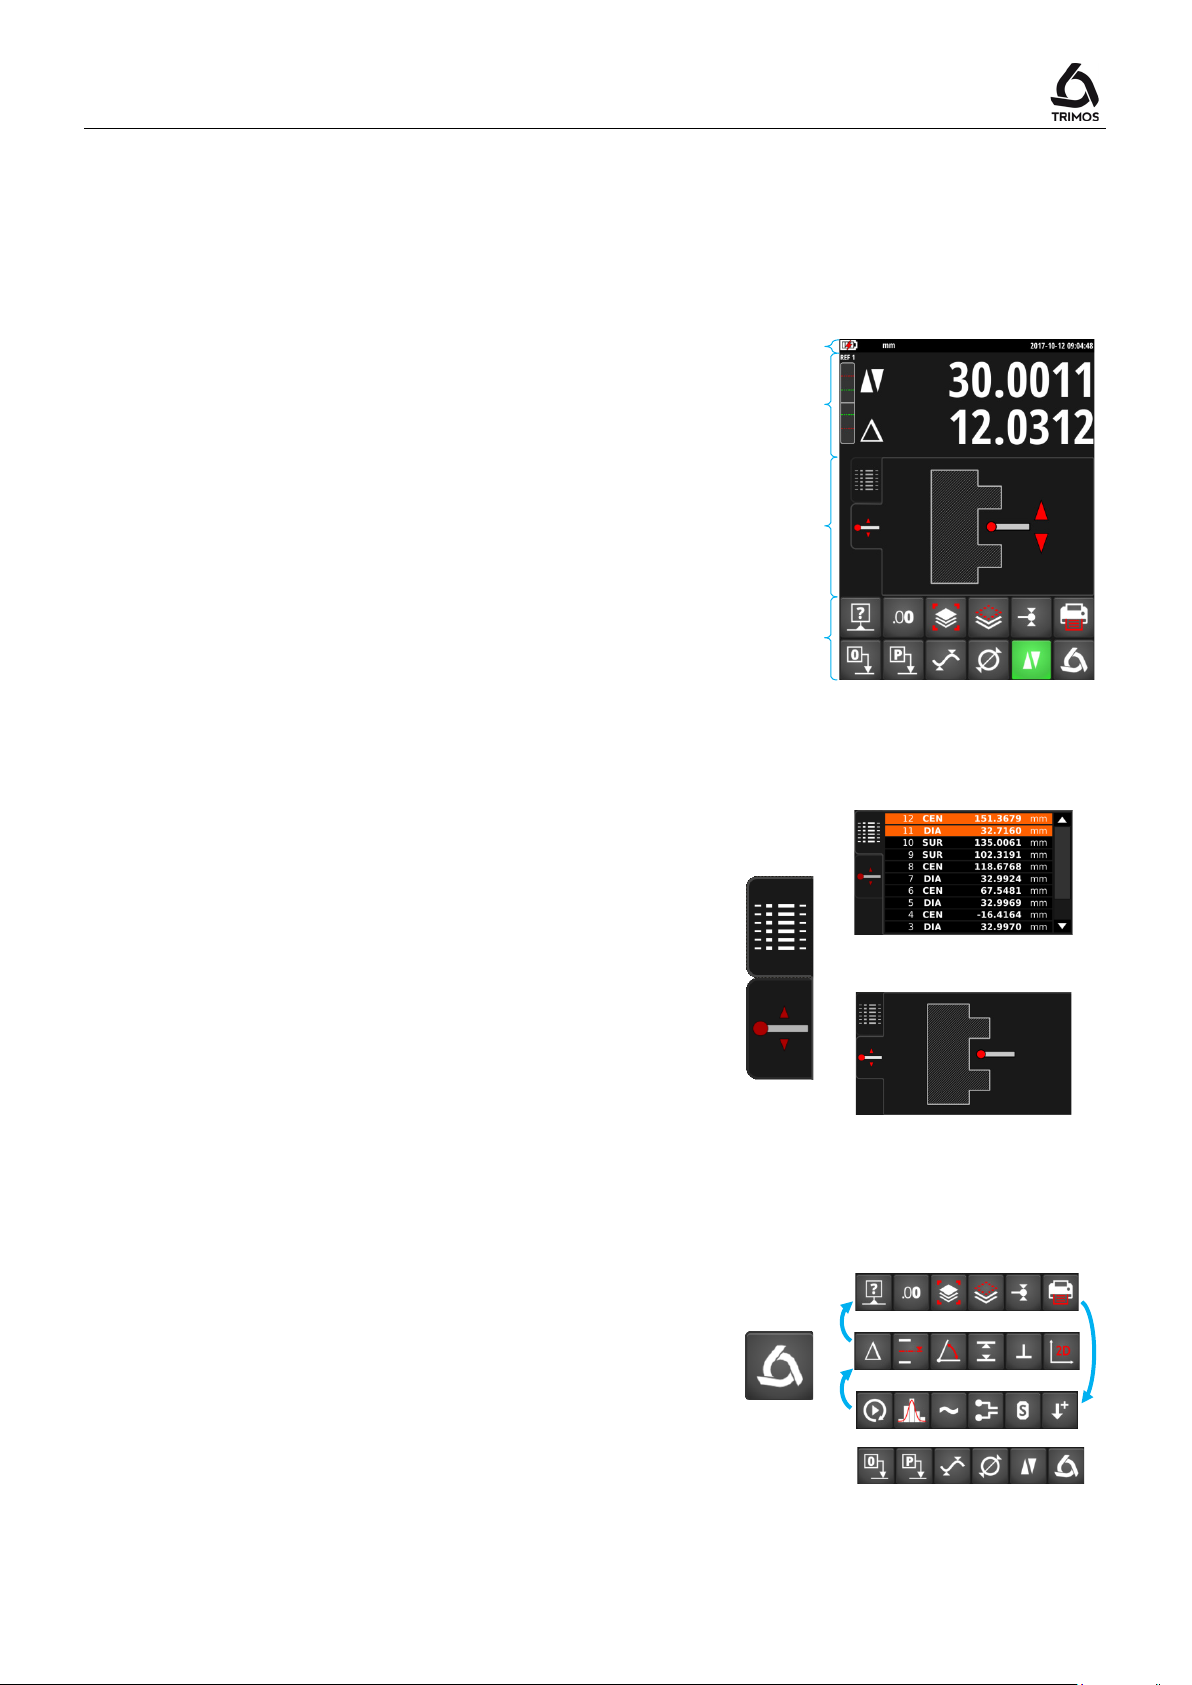
The display has 4 main areas:
the screen.
Graphic help
Logo
Function
menus
Display
modes
Measured
values
Status bar
5. DISPLAY STRUCTURE
Status bar
Working parameters
Measured values
These show the units measured and the position of
the carriage
Display modes
These display the results history (buffer) or a
customised graphic help.
Function menus
Functions are placed in 2 rows in the lower part of
5.1 Display Modes
By clicking on one of the tabs alongside, the user can
select between the following display modes:
Display the measurement history (buffer)
Graphic help to guide the user while taking
measurements.
5.2 Function Menus
The lower functions menu line is the main line. It is static.
The upper function line is scrolling. A press on the
key scrolls the other function lines.
Buffer
750 50 0042 03 17
Page 20
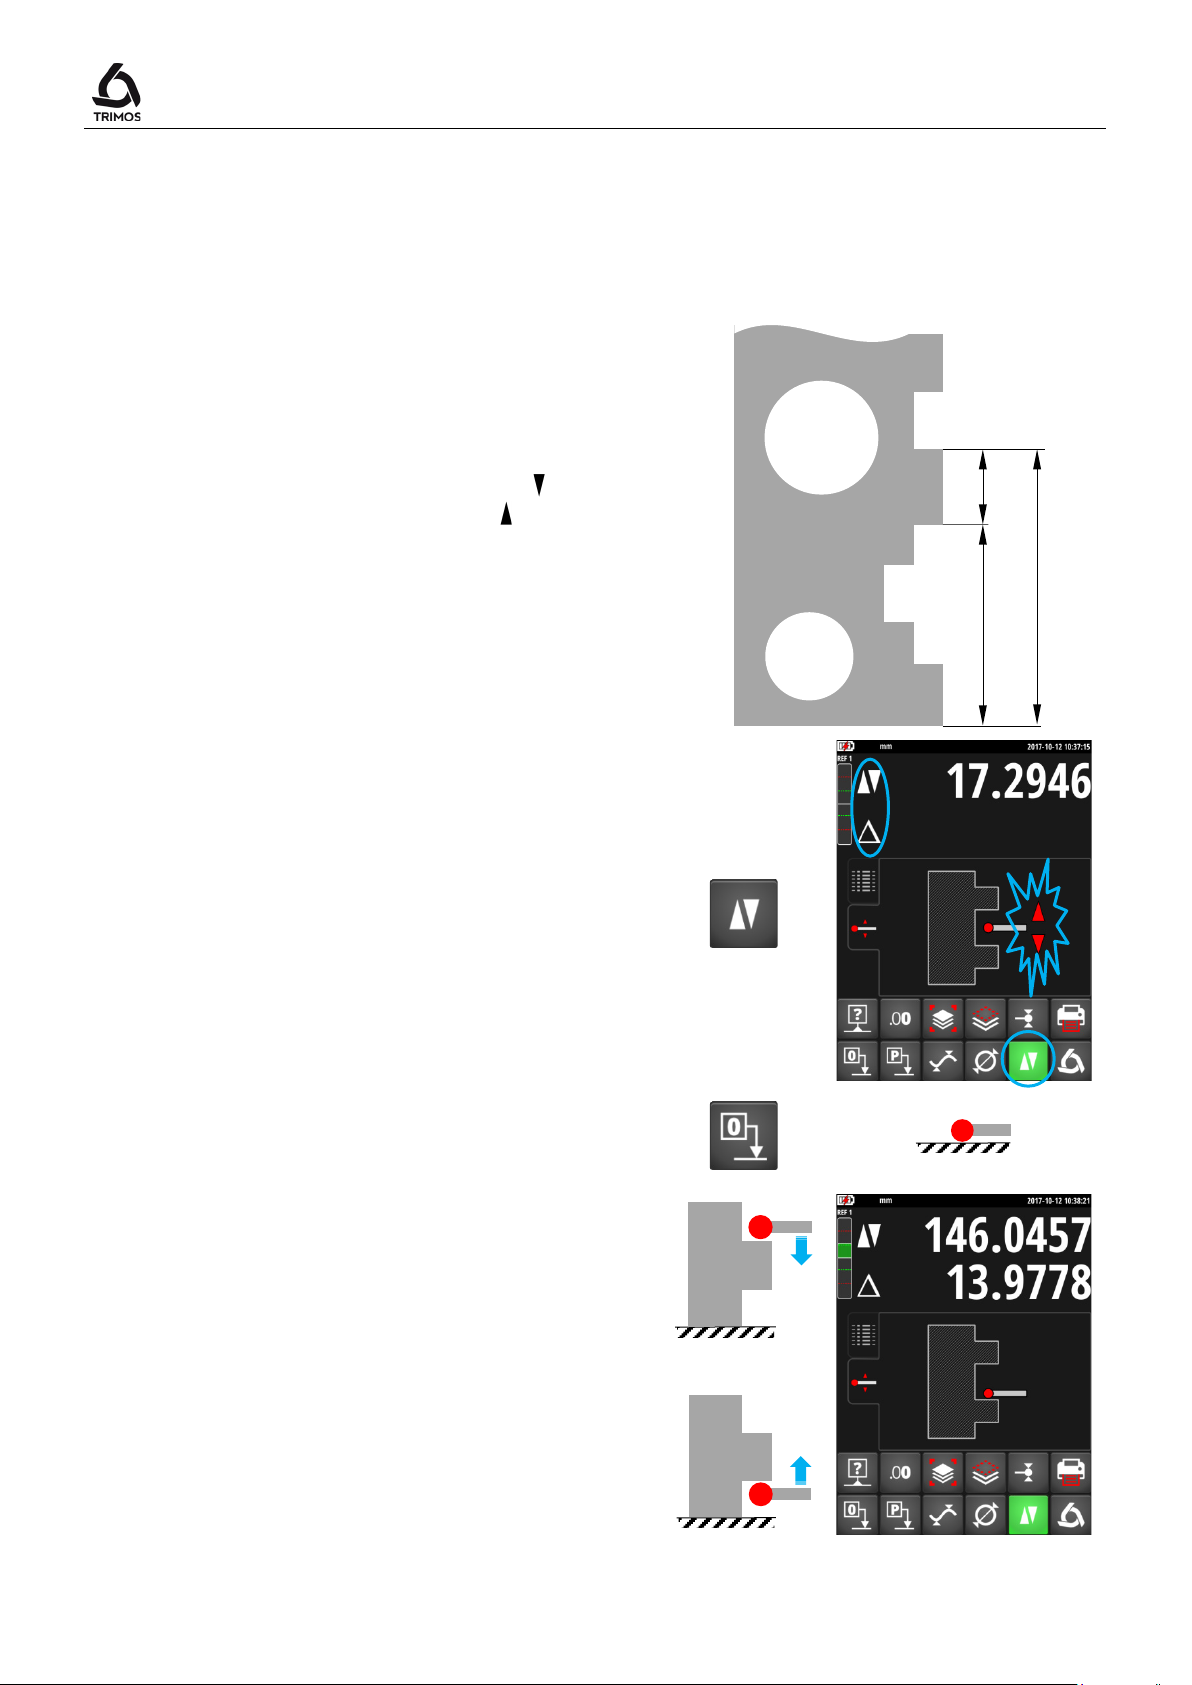
H1
H2
H12
6. MAIN MEASUREMENT FUNCTIONS
6.1 Height Measurements
H1 = Height measurement downwards ( )
User's Manual
H2 = Height measurement upwards ( )
H12 = Chain dimensions
1. On starting-up, the instrument is in height
measurement mode. If the instrument is not in
this mode, select height measurement mode.
2. Set the display at zero or at a preset value with
the measuring insert probing a reference
surface (see § 7.1 and § 7.2).
3. Probe the surface to be measured downwards
or upwards. The probing indicator will display
the progression of the measuring force
application. When the right force is reached,
an acoustic signal will confirm the
measurement.
Note:
The first line of the display indicates the height
measured. The second line indicates the
distance from the former height measurement
(chain of dimensions).
750 50 0042 03 18
Page 21
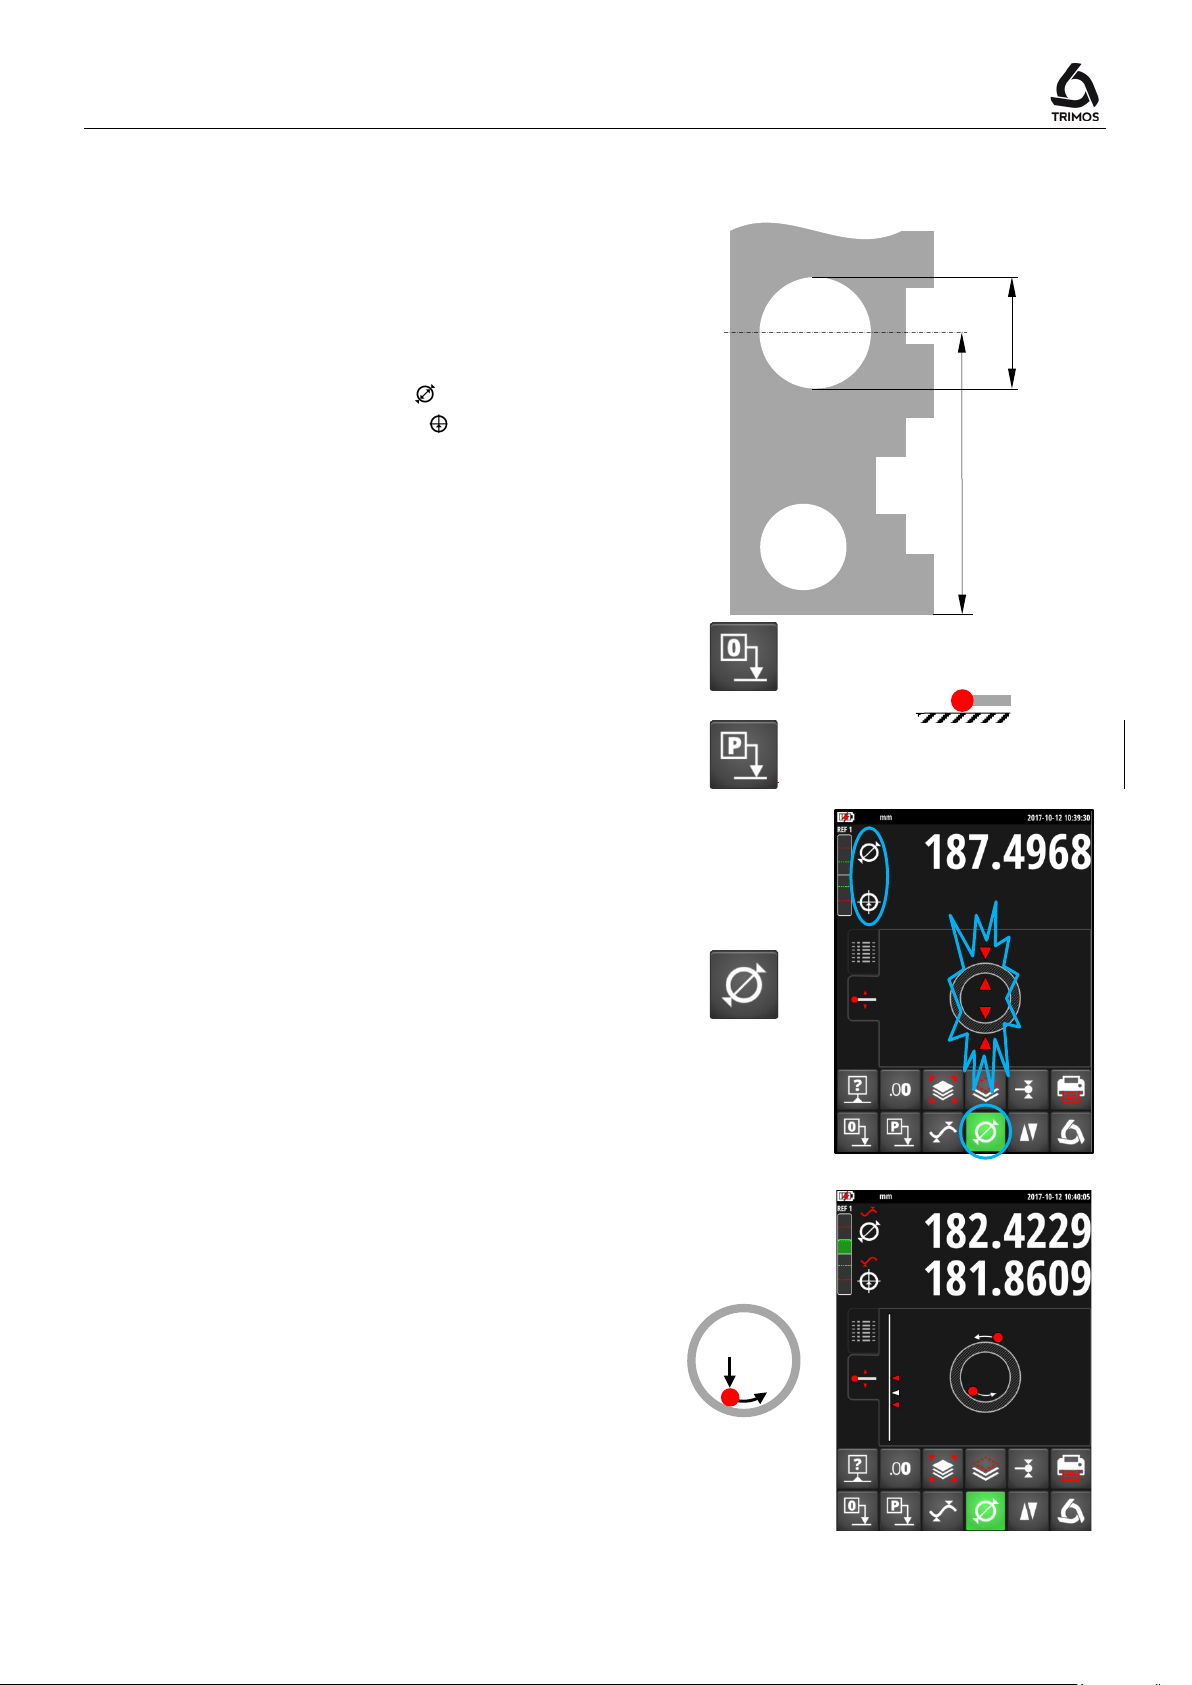
V7 / V9
Set the display at zero or at a preset value with
D
C
6.2 Diameter and Centreline Measurement
D = Diameter measurement ( )
C = Centreline measurement ( )
1.
the measuring insert probing a reference
surface (see § 7.1 and § 7.2).
2. Select the diameter / centreline mode by
pressing the key shown alongside.
Internal diameter
3a. Position the measuring insert into the bore and
probe a point near the reversal point (1). Move
the instrument (or the part) laterally to
determine the reversal point (2). It is
automatically stored.
750 50 0042 03 19
Page 22
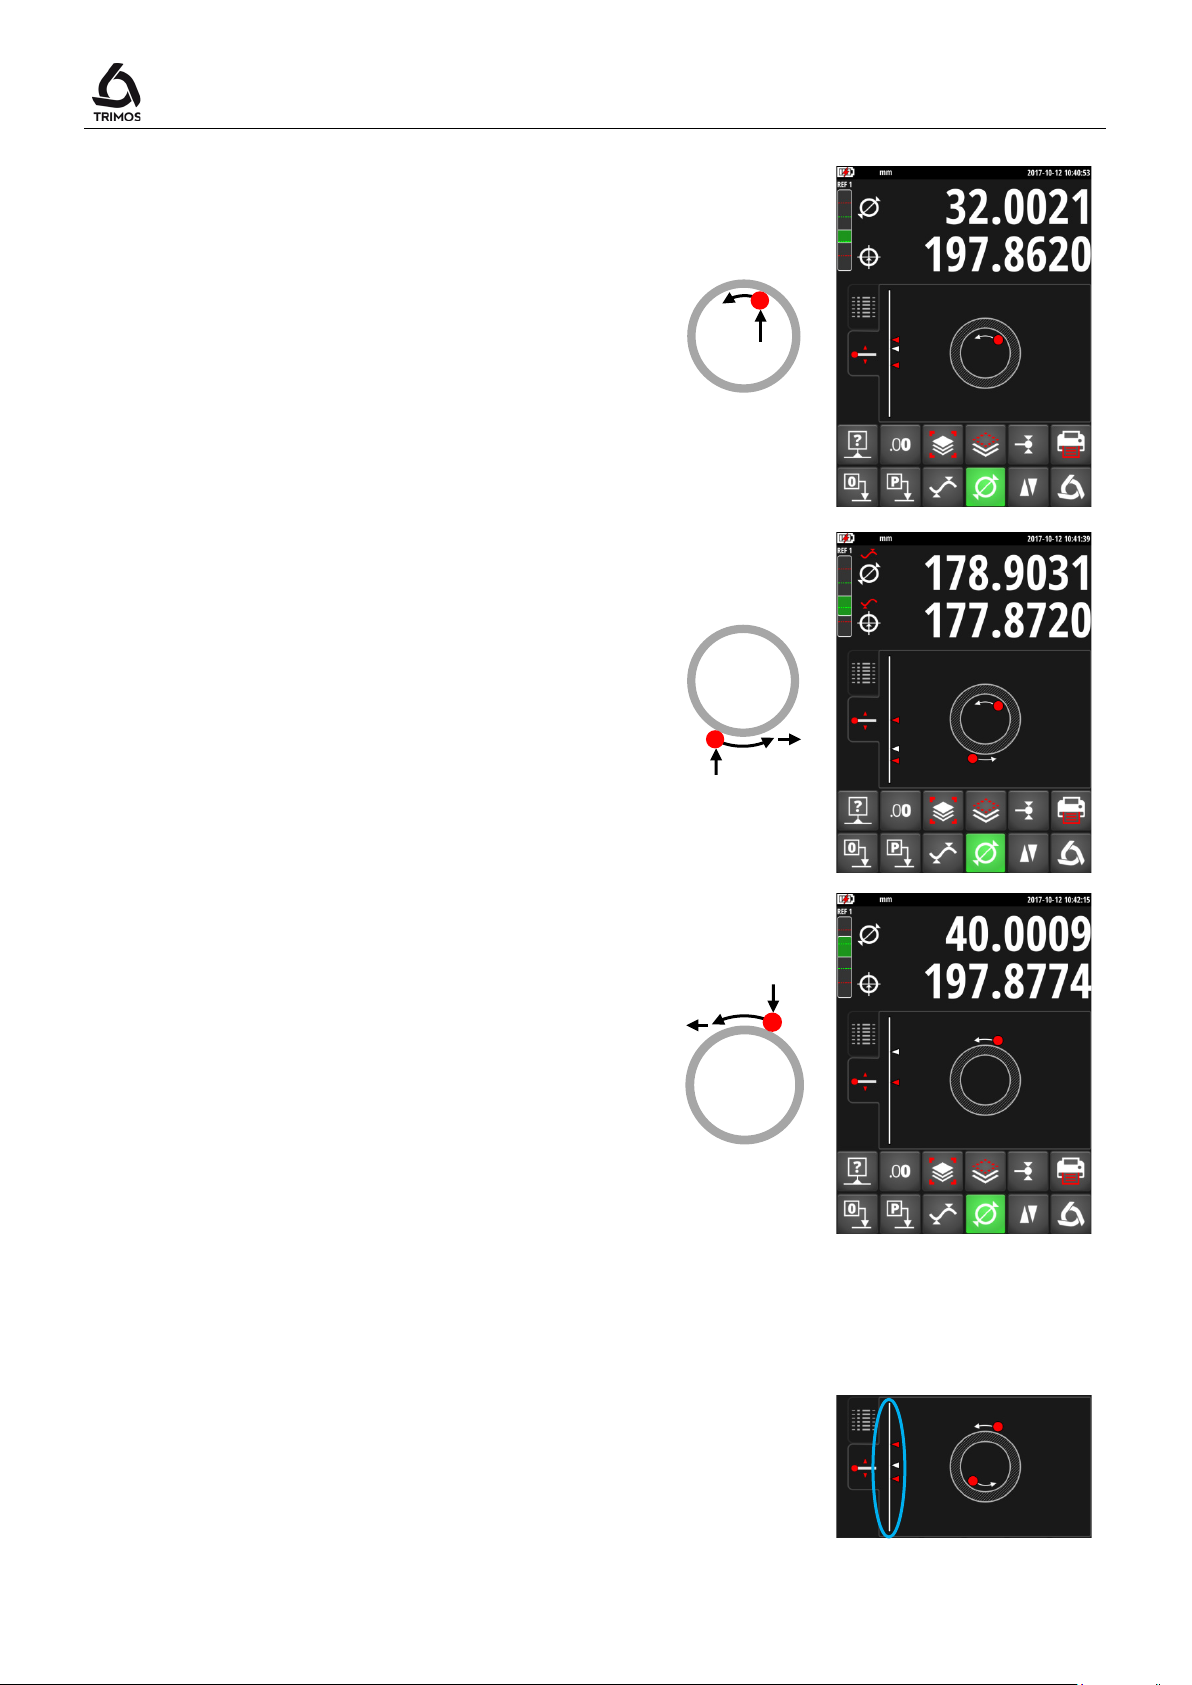
5. When the measuring insert is removed, the
measurement.
In "Graphical help" display mode, an indicator helps
3
4
3 1 2
6 4 5
4a. Probe a point near the reversal point on the
side opposite the diameter (3). Move the
instrument (or the part) laterally to determine
the reversal point (4). Diameter and centreline
values are displayed on the 1st and 2nd lines of
the display respectively.
External diameter
3b. Set the measuring insert off centre on the
lower shaft profile as near as possible to the
reversal point (1). Move the instrument (or the
part) laterally to determine the reversal point
(2). It is automatically stored.
Remove the measuring insert slowly to the
side, off centre (3).
User's Manual
4b. Probe a point near the reversal point on the
side opposite the diameter (4). Move the
instrument (or the part) laterally to determine
the reversal point (5). Remove the measuring
insert to the side, off centre (6). Diameter and
centreline values are displayed on the 1st and
2nd lines of the display respectively.
display remains frozen on the diameter and
centreline values.
Restart with point 3a or 3b for a new
Note:
in searching the reversal point. The diameter mode
can also be configured (§ 14.1).
750 50 0042 03 20
Page 23
V7 / V9
Min, Max
Delta
Min
Max
Delta
Min, Max
Delta
Max
Delta
Min
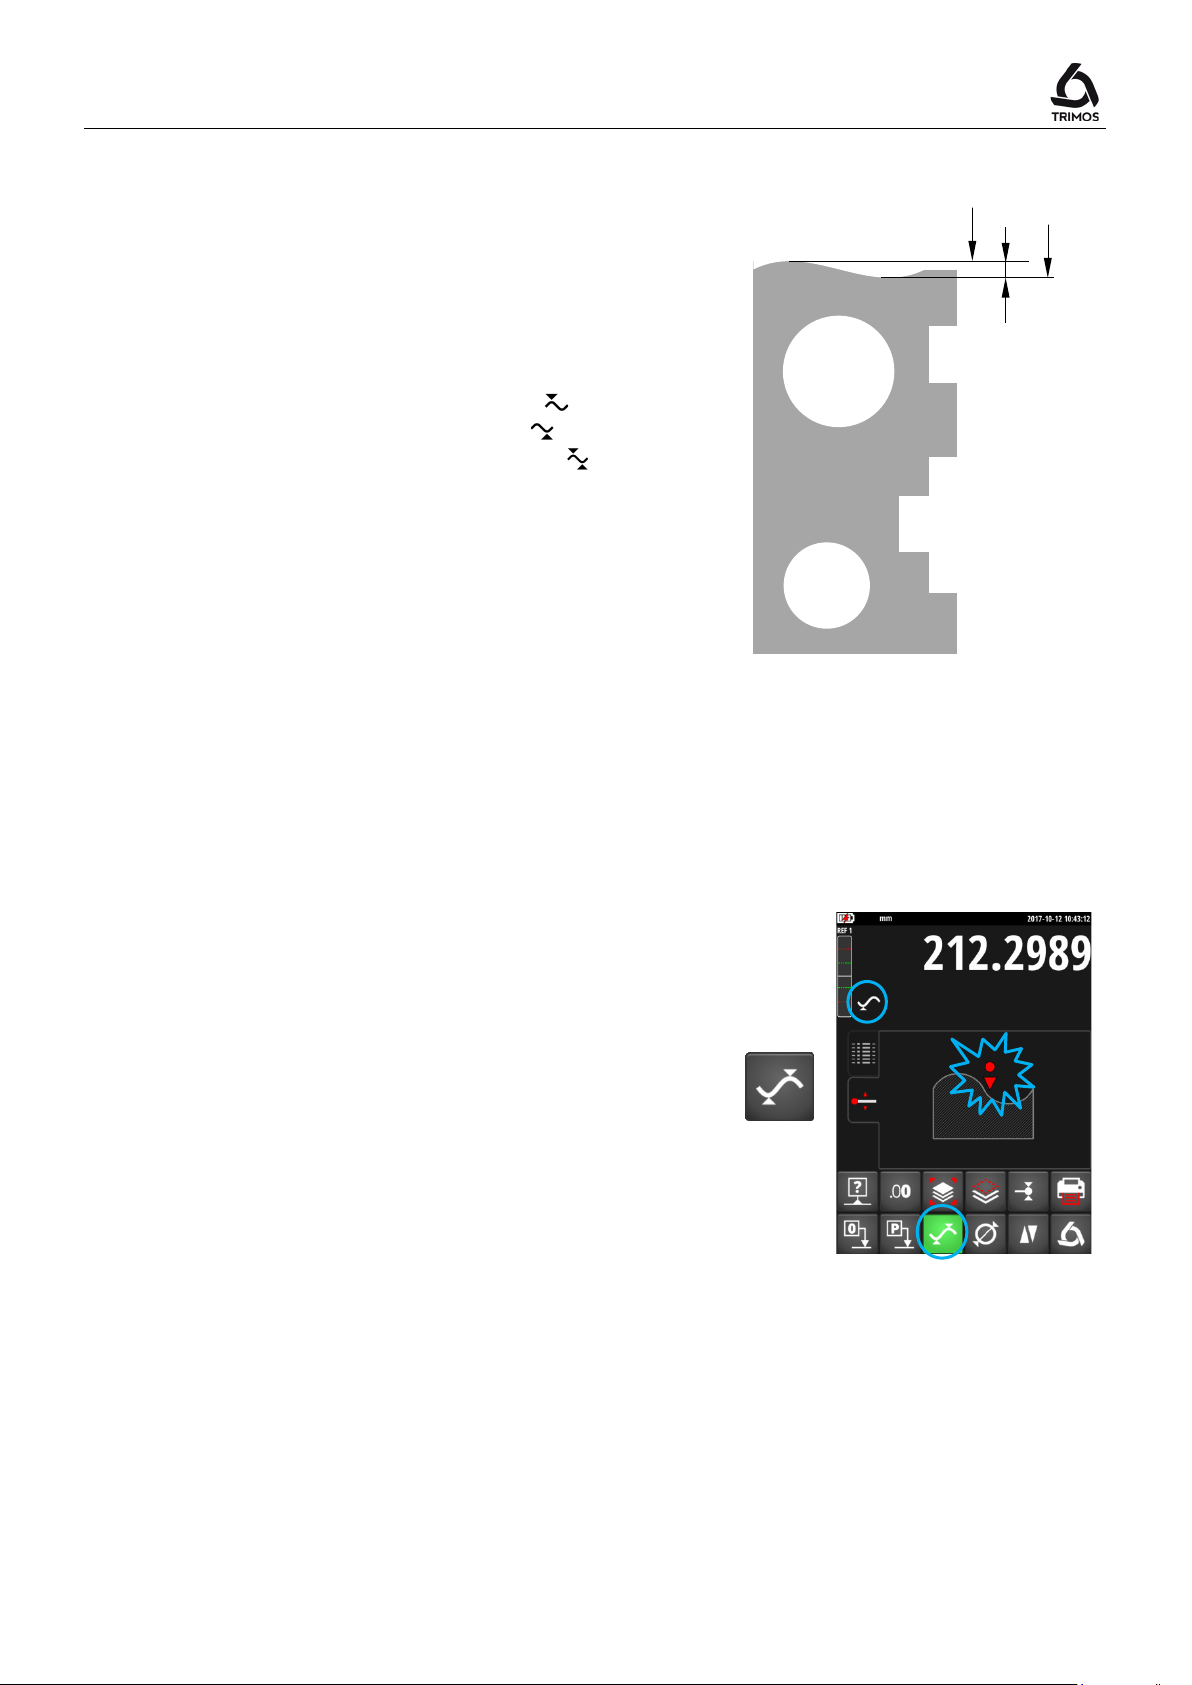
6.3 Min, Max and Delta Modes
Max = Measurement of maximum value ( )
Min = Measurement of minimum value ( )
Delta = Difference between Max and Min ( )
Measurements in
and
modes have
always to be taken with the probe being in contact with
the surface.
It allows to determine the following values:
: Minimum value of the measured surface
: Maximum value of the measured surface
: Difference between the maximum and minimum
value
To select the
or
measuring mode, press
the key shown alongside. By pressing the same key
several times, the required mode will be displayed.
Note:
In manual mode, the difference between the Min and the
Max should not exceed ± 1 mm. When motorisation is
activated, a closed-loop control is used to monitor the
surface over the entire measuring range of the instrument.
750 50 0042 03 21
Page 24
Min
Max
Probe the surface to be measured and displace the
Delta
2. Probe the surface to be measured and move the
Zero
values of Min and Max.
viewing the position of the measuring insert in relation to
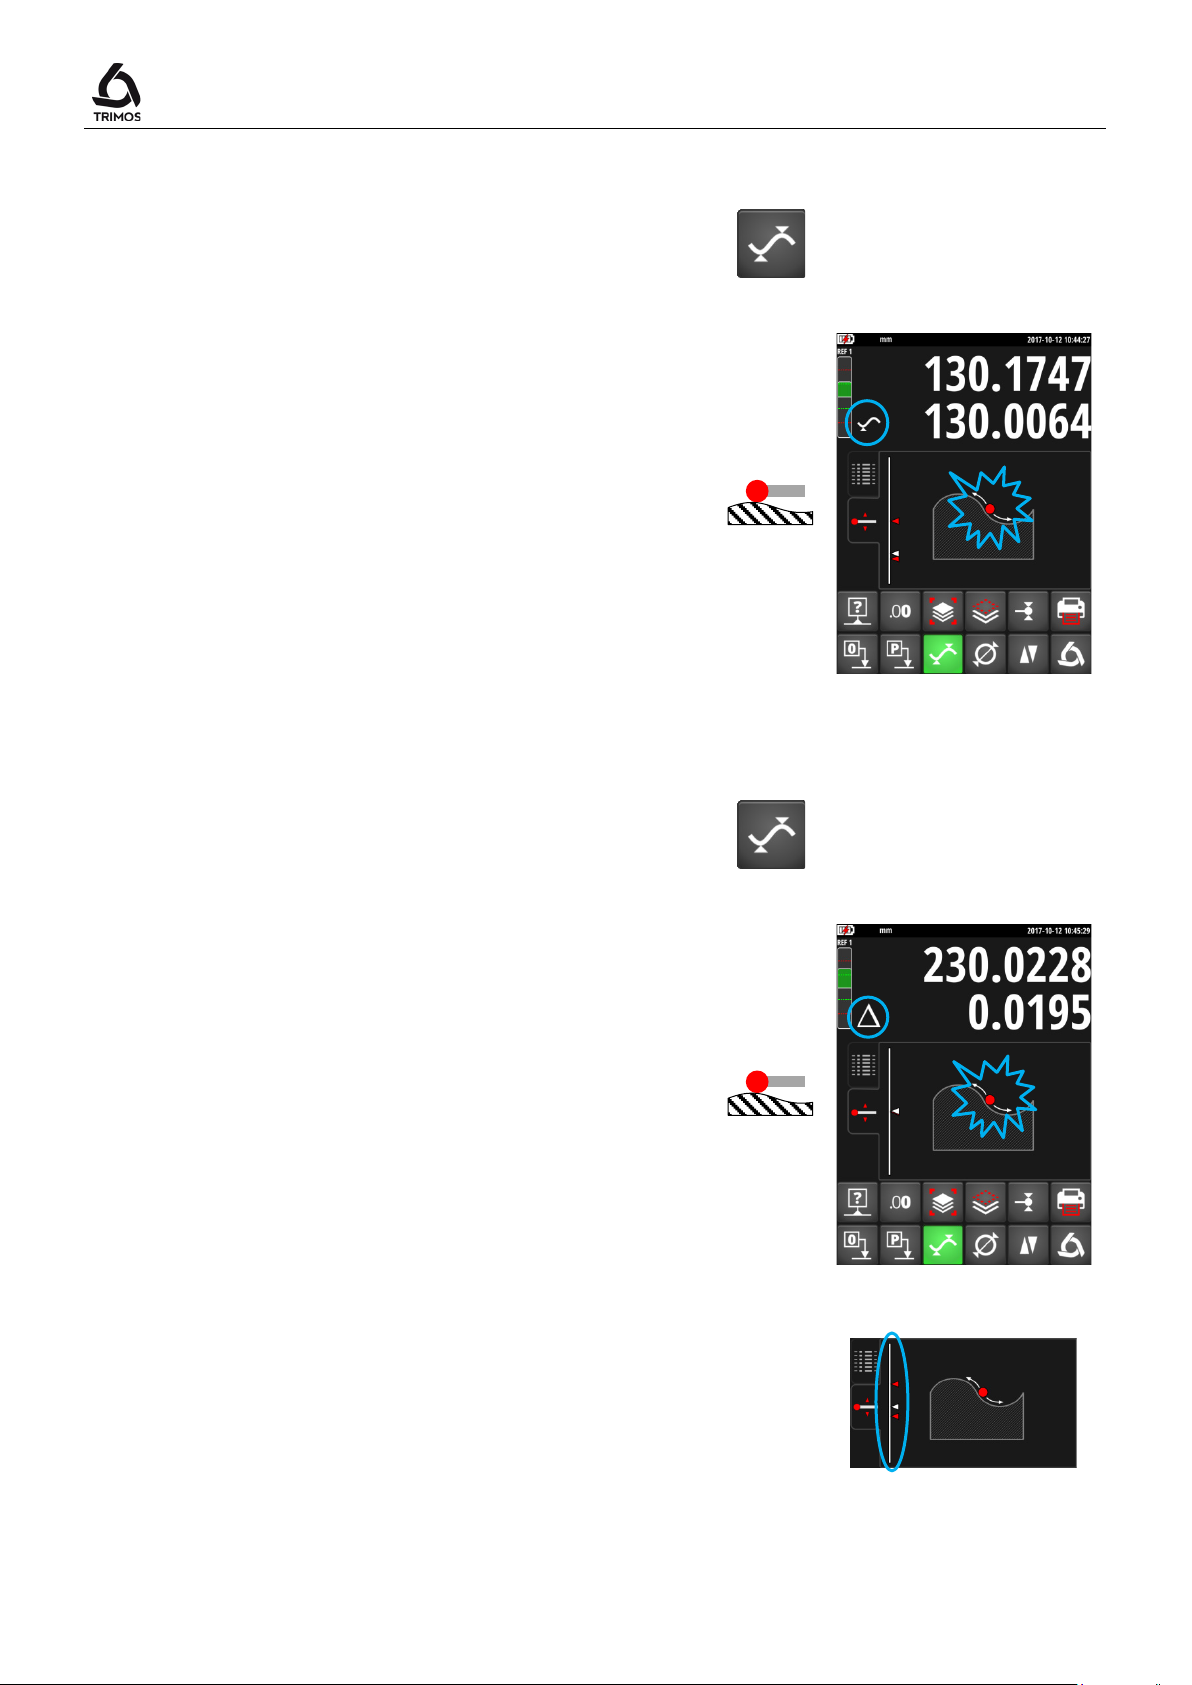
6.3.1 Measuring in Min or Max Mode
User's Manual
1. Select
indicator shows the activated mode.
2.
insert or the part along the portion to be analysed.
The upper line of the display shows the current
position, the lower line shows the extreme position
of minimum or maximum reached respectively.
Note:
While probing, a zero setting or a preset will
reinitialise the display on the minimum or maximum
value measured.
or
function. The corresponding
6.3.2 Measuring in Delta Mode
1. Select
shows the activated mode.
insert or the part along the portion to be analysed.
The upper line shows the current position of the
probe and the bottom line the difference between
the 2 extreme positions.
Note 1:
By pressing the
reset and the display will show zero.
Note 2:
After releasing the insert from the surface, the value
of Delta is sent to the buffer together with the
In "Graphical help" display mode, an indicator helps in
the scanned extreme points.
function. The corresponding indicator
key, the Delta mode will be
750 50 0042 03 22
Page 25
V7 / V9
de a zero setting will be done on the last
By pressing the
Preset
key, a previously defined value will
current position of the probe.
7. ADDITIONAL FUNCTIONS
7.1 Zero Setting of the Display
In height measuring mode a zero setting will be done on
the last surface measured by pressing the zero setting
key.
In diameter / centreline mode a zero setting will be done
on the last centreline distance measured.
In Min or Max mo
Min or Max value measured.
By pressing the key longer than 2 seconds, the preset
value of the current reference will be displayed,
disregarding the last probing step.
> 2 s
7.2 References and Preset
7.2.1 Selection of References
The use of references allows simultaneous measurement
starting from different points of origin (=references).
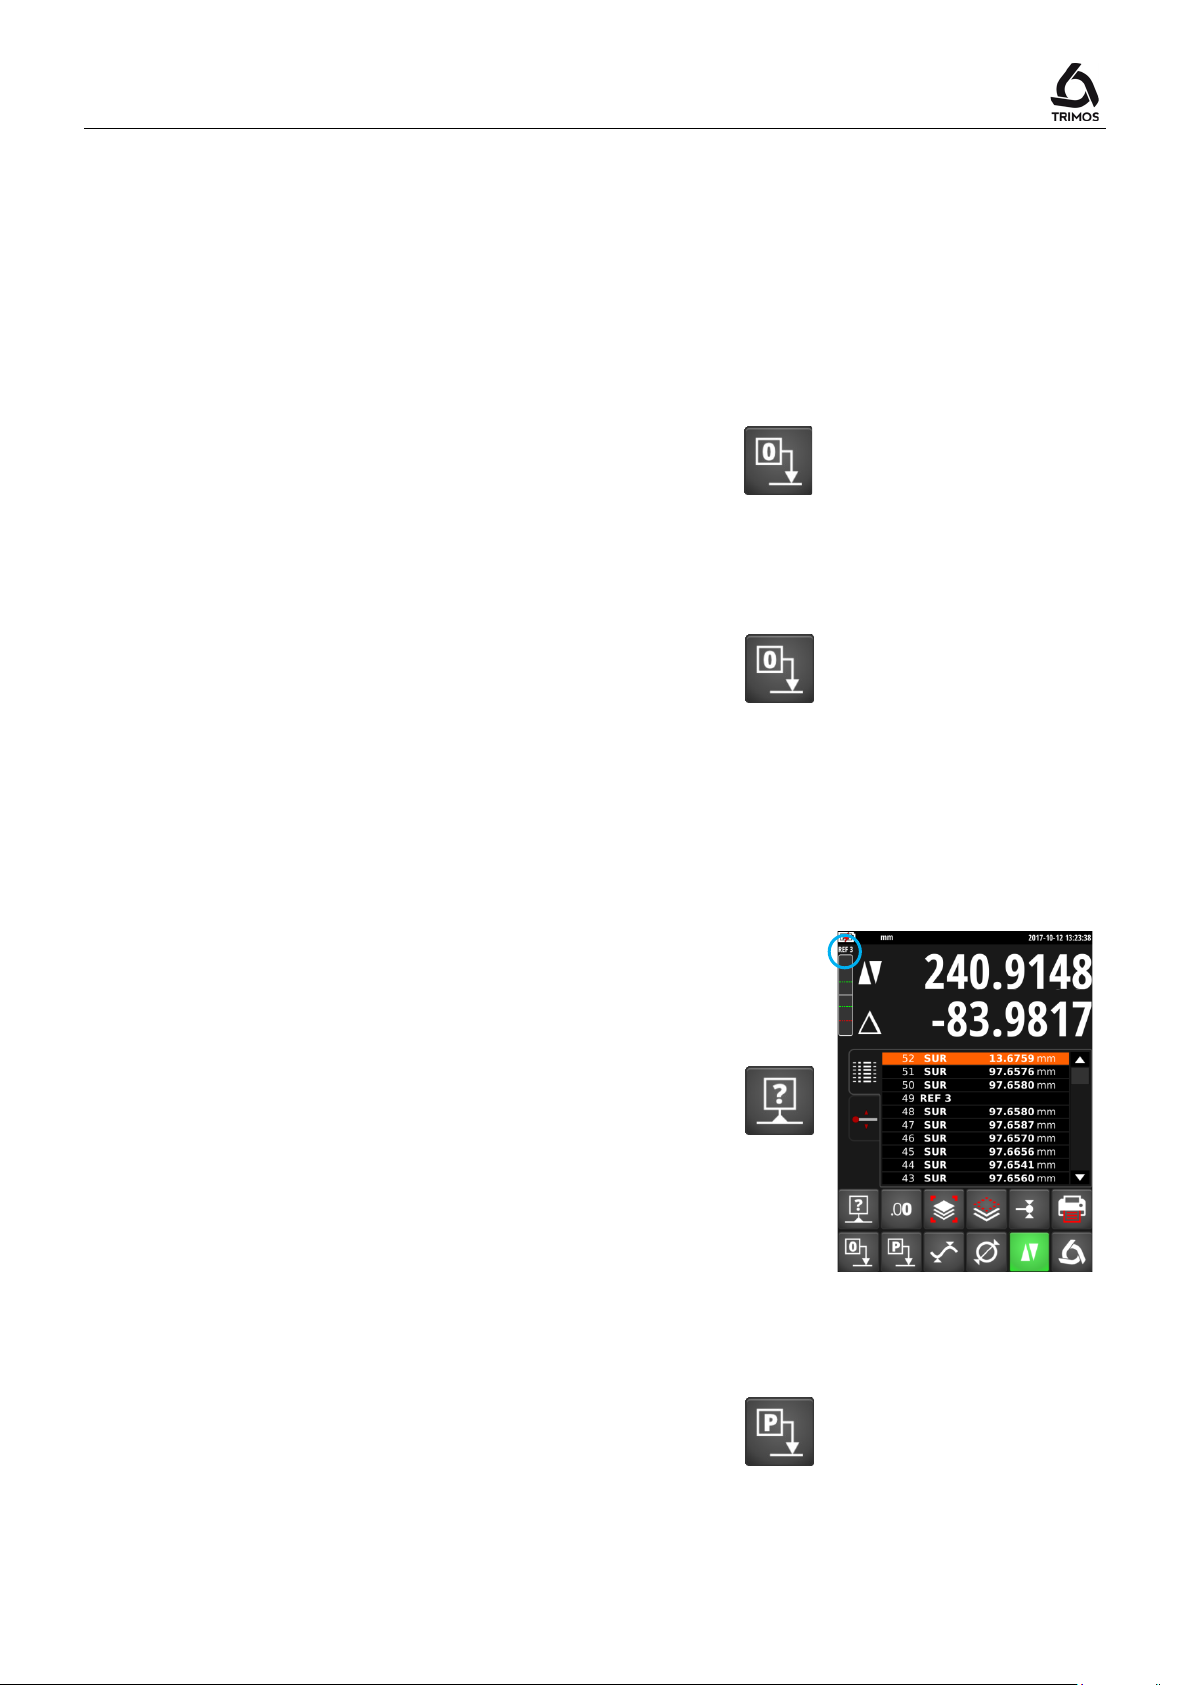
The current reference is mentioned at the top left hand
side of the display. To go to the next reference, press the
key shown alongside.
7.2.2 Predefined Value - Preset
be taken into consideration for height measurements,
centreline distances or Min / Max values.
In direct mode (see § 7.13), the preset is executed at the
750 50 0042 03 23
Page 26
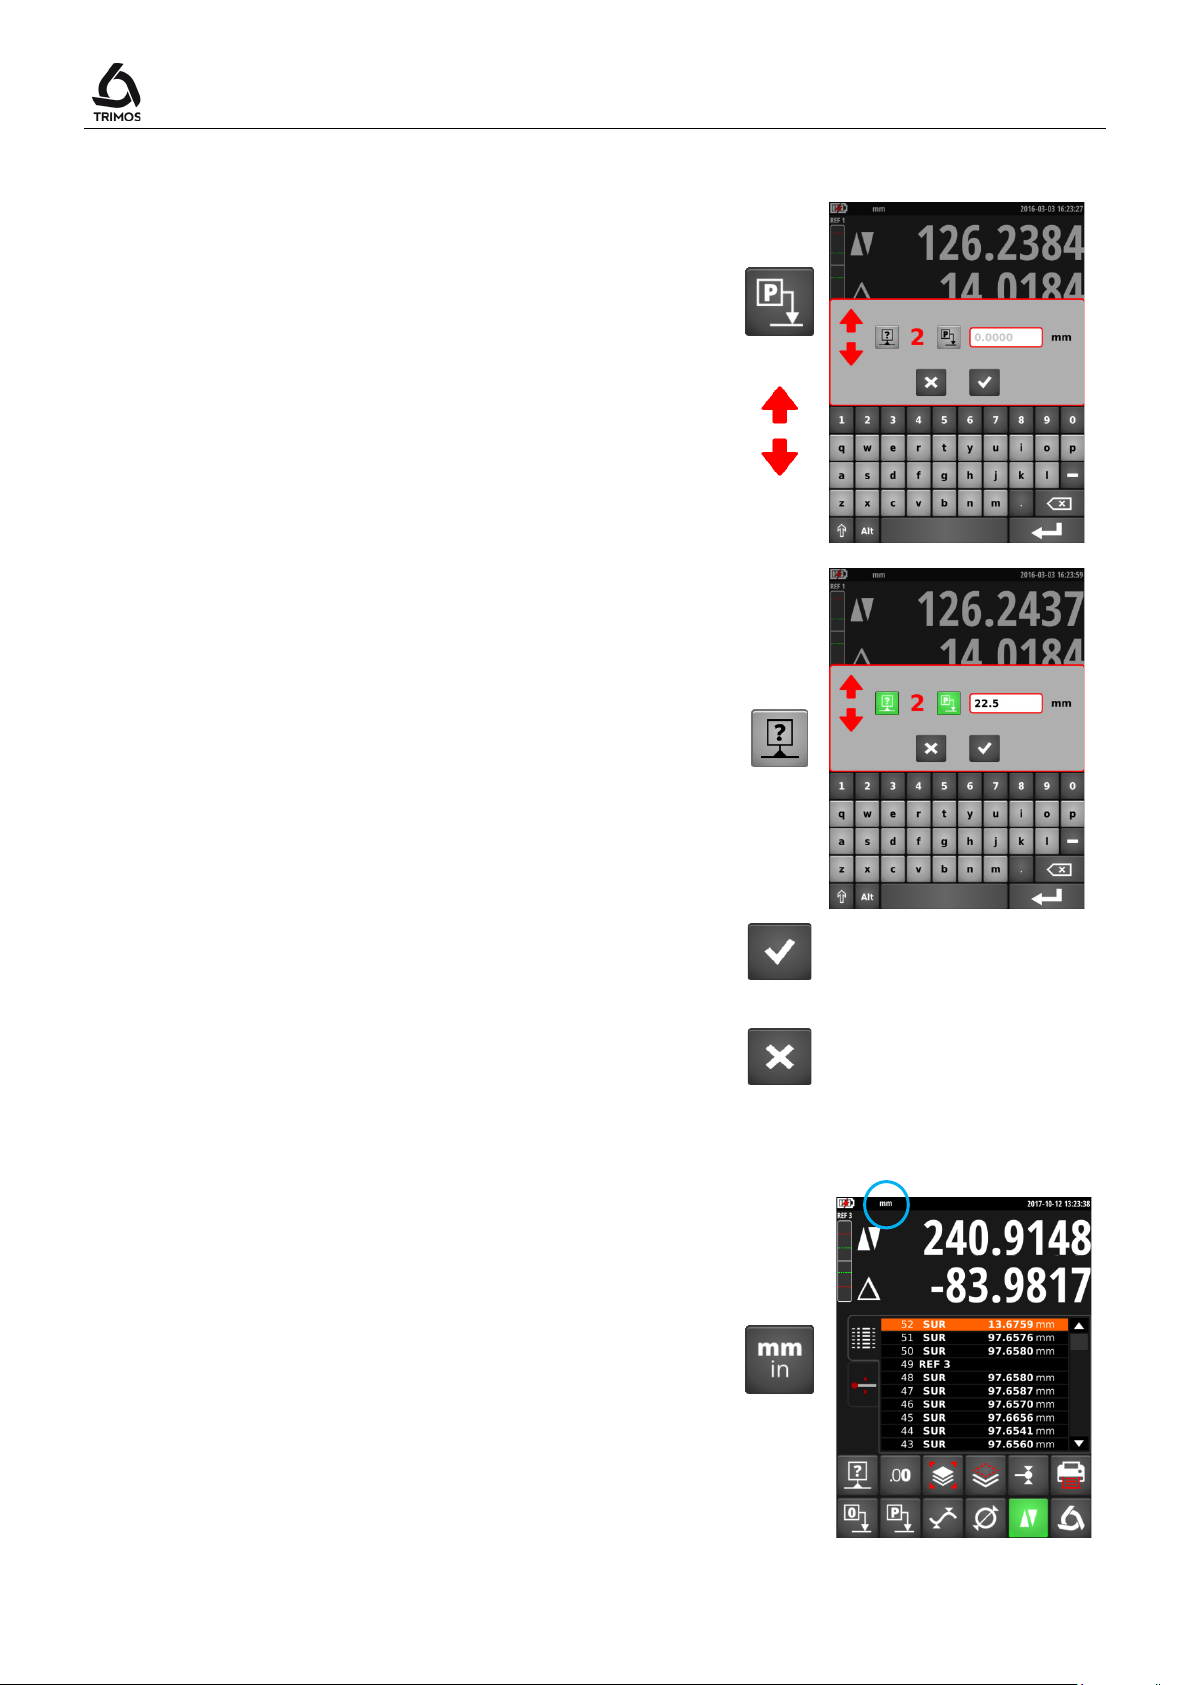
It is possible to activate the 9 references independently. A
Preset
Cancel
Cancel
7.2.3 Activation of References and Preset
User's Manual
preset value can be programmed for each of them.
In order to display the corresponding menu, press on the
key for over 2 seconds. It is then possible to scroll
through the references using the red arrows.
To activate a reference, press the key shown alongside. It
turns green indicating that the reference is active.
Now it is possible to enter a preset value using the
numeric keys of the displayed keyboard.
> 2 s
To end, validate with the OK key.
To exit without saving the changes, press the
7.3 Selection of the Measuring Unit
Measurements can be performed either in mm or in inch.
The current unit is displayed at the left side of the status
bar.
The unit change is made in the configuration menu (§
13.2).
key.
OK
750 50 0042 03 24
Page 27
V7 / V9
this, select the lines to be deleted on the touchscreen and
7.4 Resolution
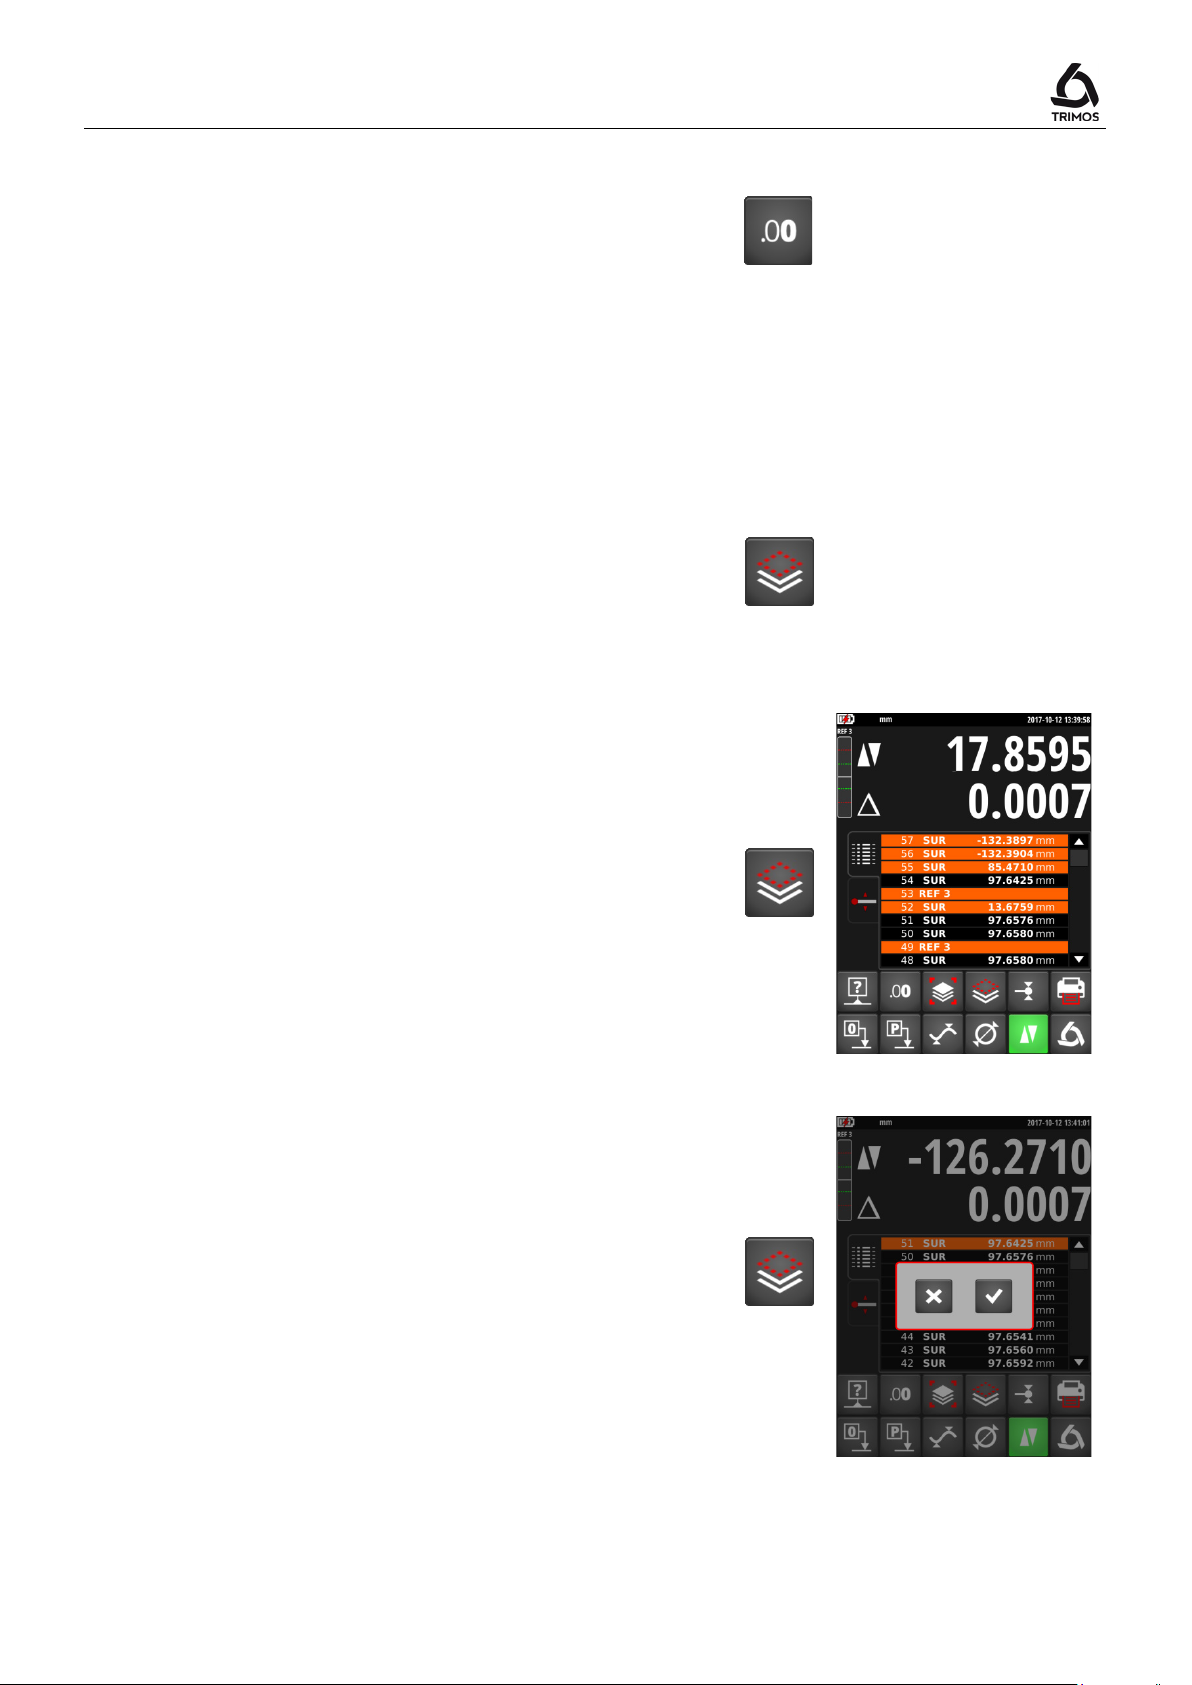
To modify the display resolution, press the key shown
alongside.
7.5 Buffer Management
Each measurement is stored in the buffer. It can contain 9999 values.
7.5.1 Deleting Values from the Buffer
Deleting the last value from the buffer
To delete the last value from the buffer, press the key
shown alongside.
Deleting specific lines from the buffer
It is possible to delete specific lines from the buffer To do
press the delete key.
Deleting the buffer completely
To delete the buffer completely, press the same key for 2
seconds and then confirm the choice.
> 2 s
750 50 0042 03 25
Page 28
.buf
It is possible to load a buffer file from the USB key. Select
7.5.2 Backing up the Buffer
Saving values from the buffer
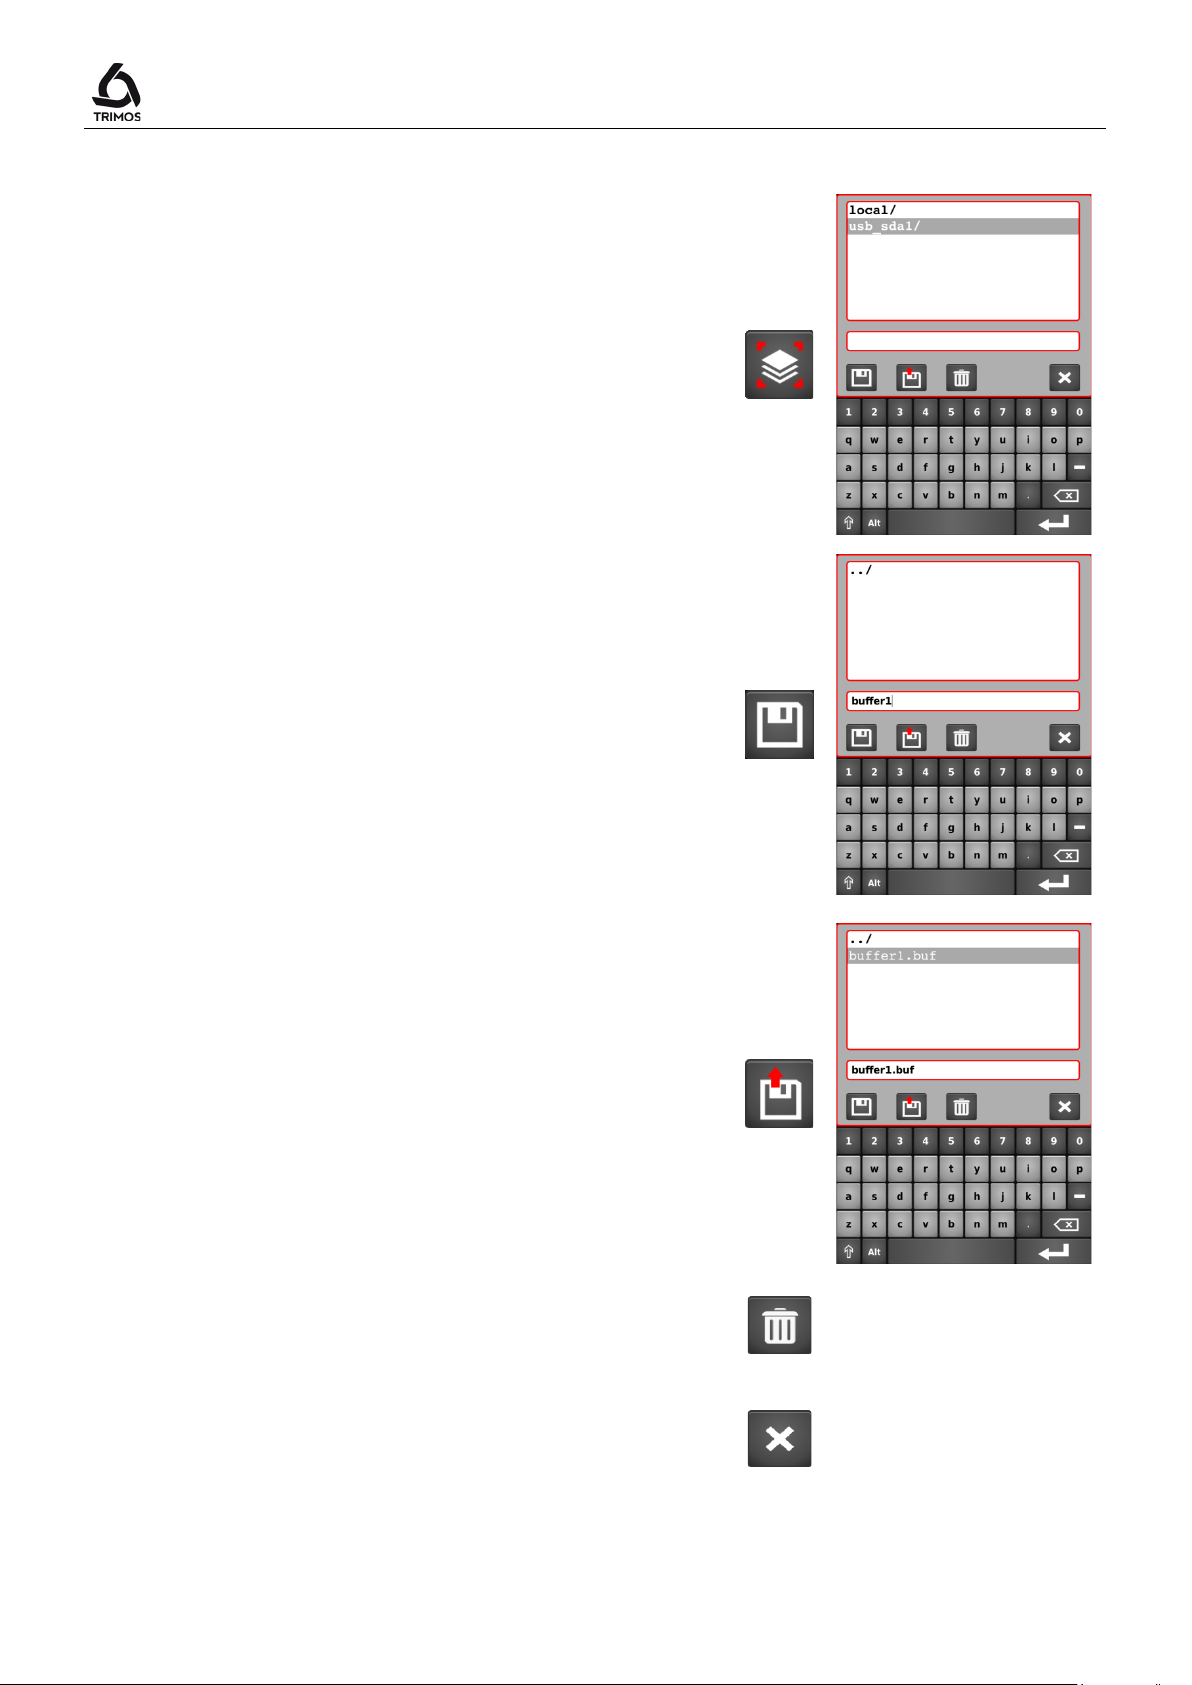
The buffer can be exported to a USB key. To do this,
press the symbol shown alongside and connect the USB
key to one of the ports of the display. The drive appears
on the screen.
Now select the directory where the buffer data must be
stored and enter a file name.
Save with the backup key.
Note:
The data is backed up as a file with
are separated by a semi-colon ";". This file can be easily
edited with an Excel type spreadsheet.
If a file with the same name already exists, it will be
overwritten.
extension. Values
User's Manual
Loading a buffer file
a file and press the load key.Function key.
The current values in the buffer will be replaced by those
of the selected file.
To delete a file, use the key alongside.
To exit the backup menu, press the Cancel key.
750 50 0042 03 26
Page 29
V7 / V9
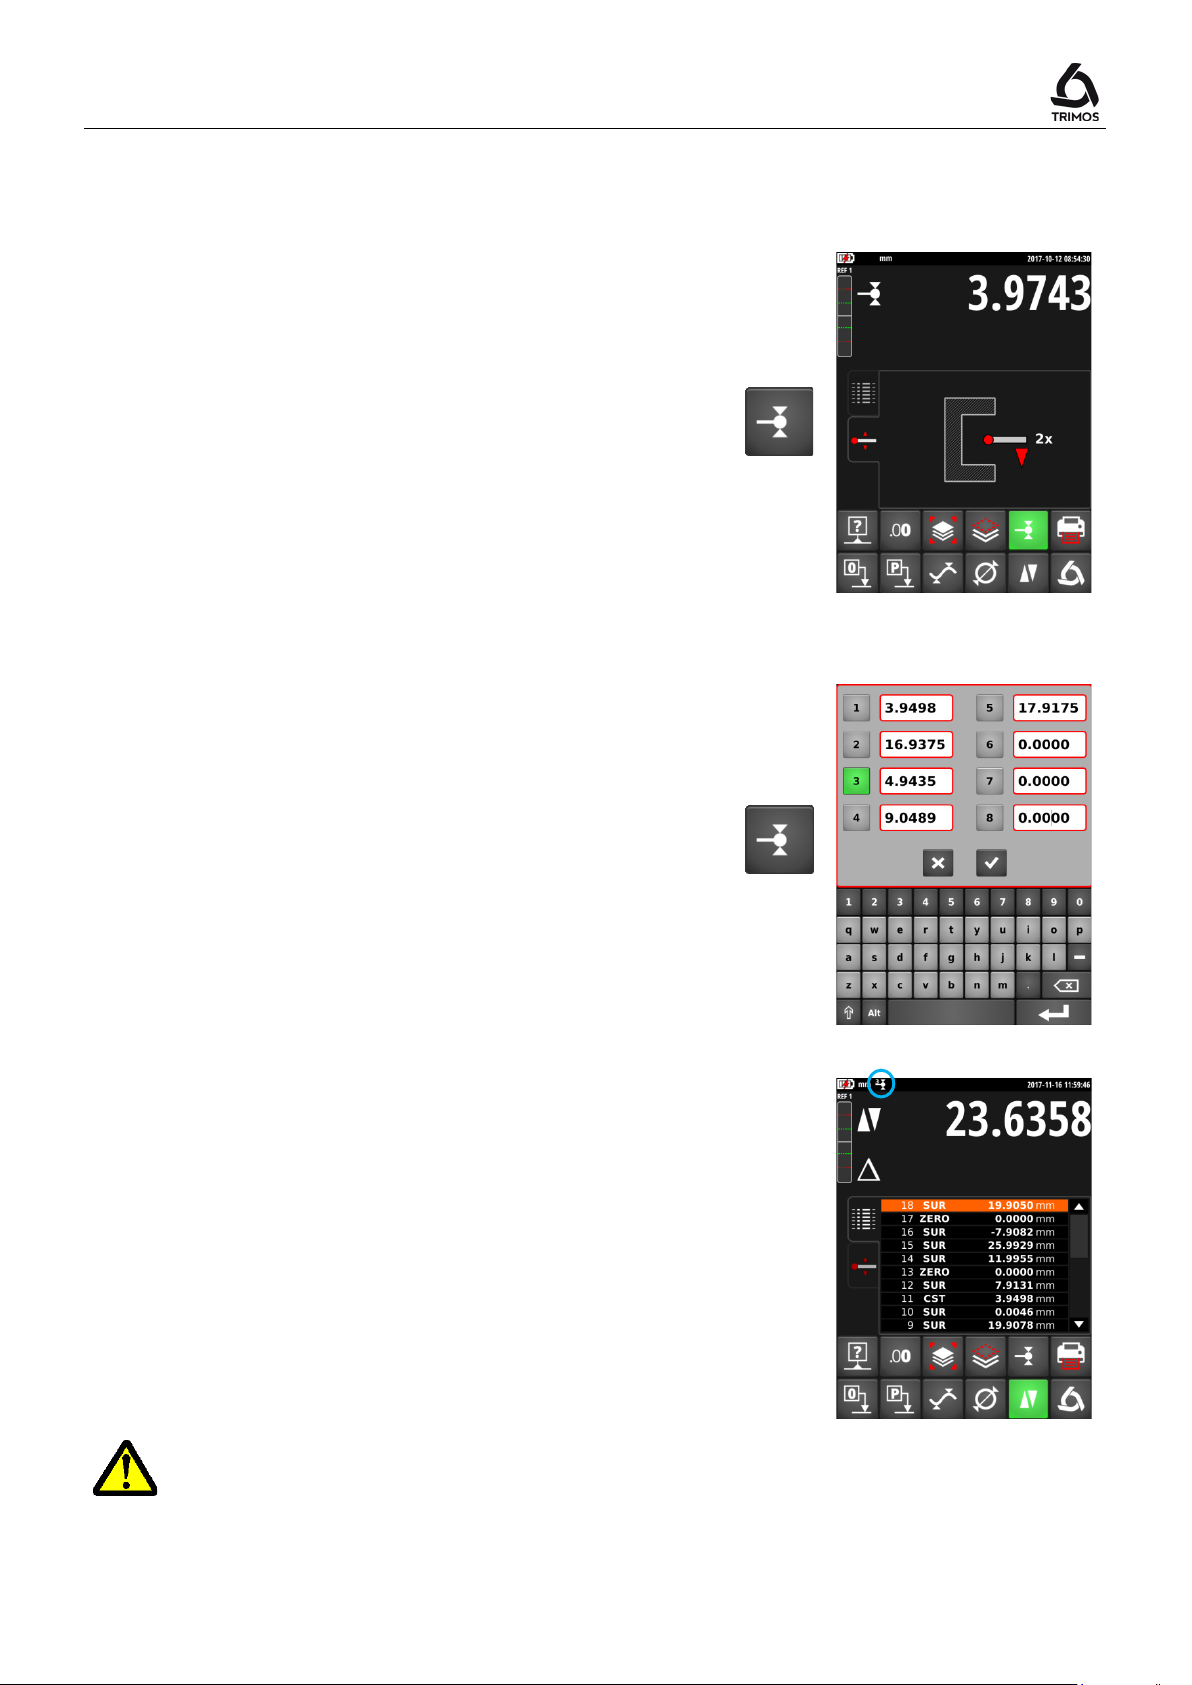
To check and memorise the probe constant, press the key
The current constant value is shown on the first line of the
7.6 Probe Constant
7.6.1 Recording of the Probe Constant
shown alongside and follow the same sequence as for
"Setting into operation" (§ 4.3, points 2 to 7).
Note:
display by pressing this key once. A second pressure
interrupts the acquisition of constant and brings the
instrument back into height measuring mode.
7.6.2 Probe Constant Library
8 probe constants can be stored.
To access the list, press the probe constant key for 2
seconds.
To select the constant to use, press the number from 1 to
8. The active constant is marked in green.
It is also possible to manually change the value of each
probe constant.
When another constant than the No. 1 is activated, a
symbol is displayed in the status bar.
To define a new value of the active constant, follow the
same procedure as when starting (§ 4.3, points 2 to 7).
> 2 s
The constant is an essential element during bidirectional measurements. Great
caution is essential while interpreting the measurements results when this value is
entered manually.
750 50 0042 03 27
Page 30
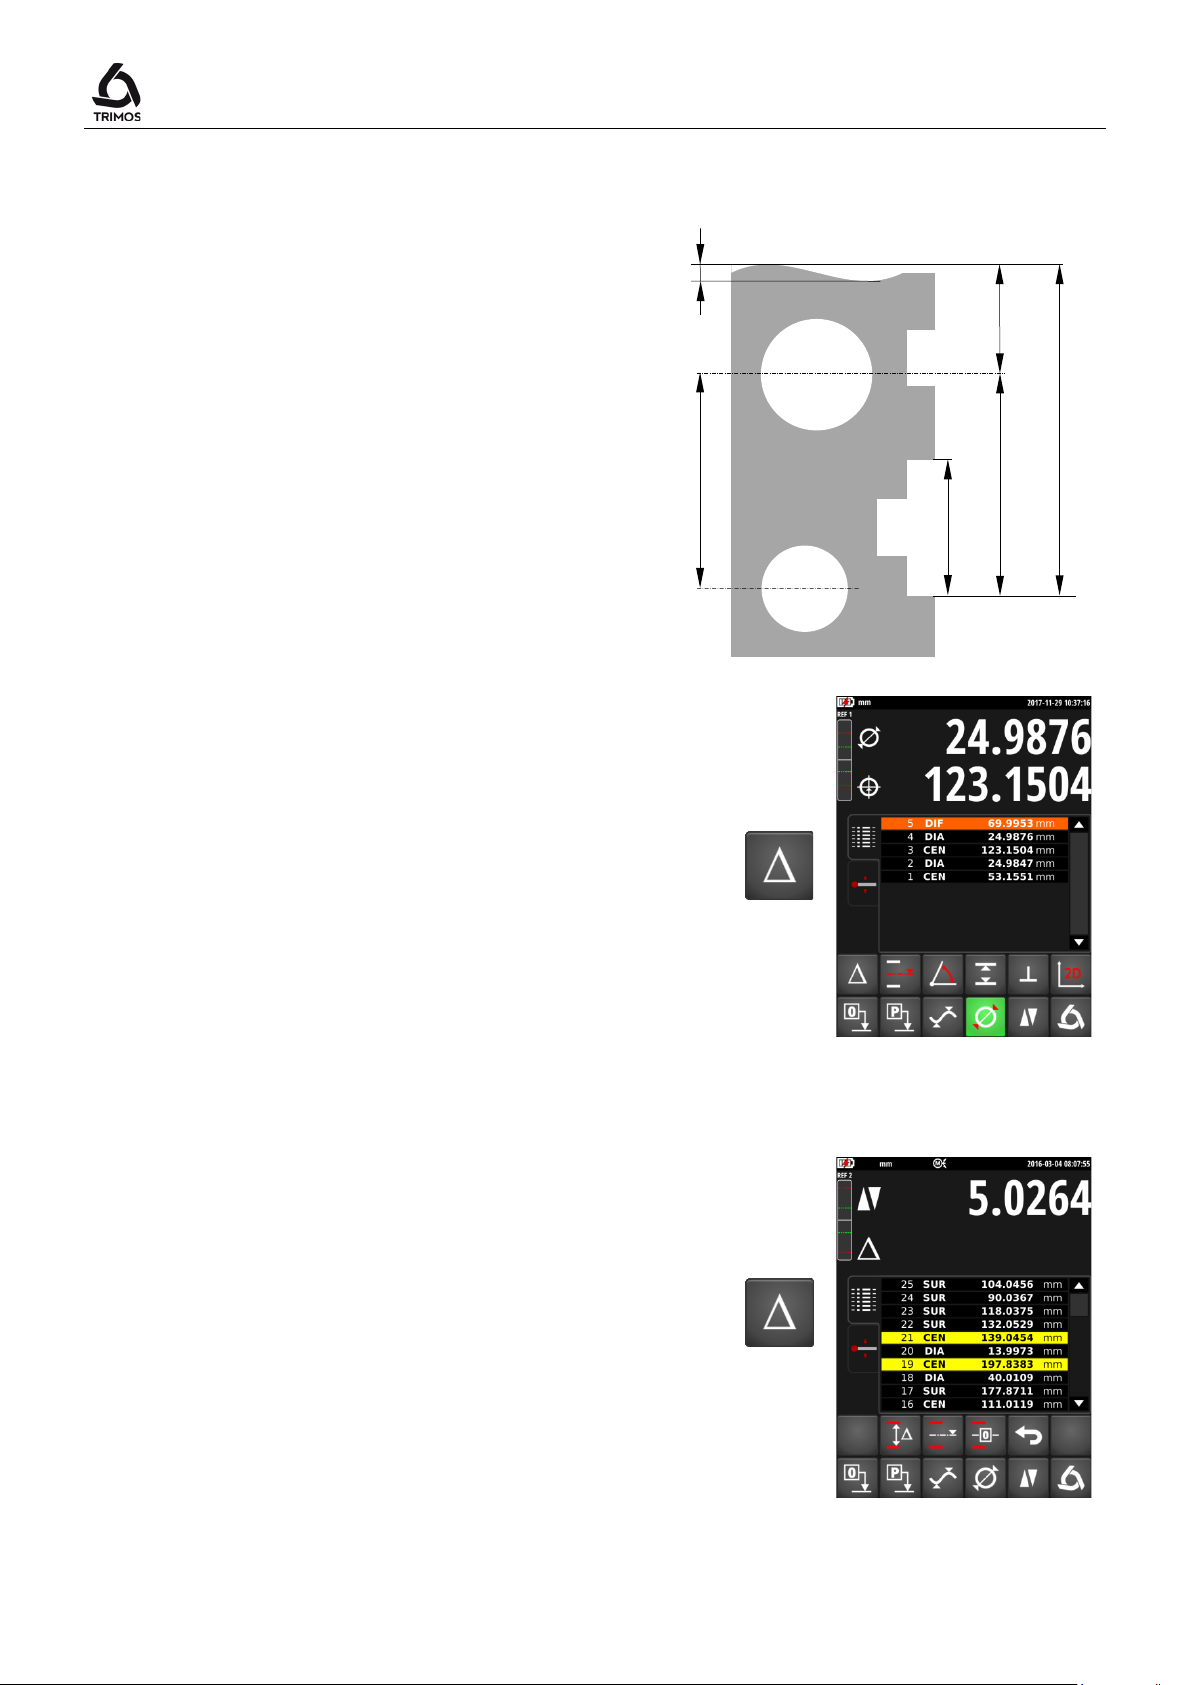
the buffer. These various measurements can be combined
values in the buffer and select one of
D1
D2
D12
D3
D23
D13
7.7 Difference Between the Last 2 Measurements
Distances:
D1 = Between 2 centrelines
D2 = Between 2 heights
D3 = Between 2 values Min-Min, Min-Max or
Max-Max
D12 = Between centreline and height
D13 = Between centreline and Min or Max
D23 = Between height and Min or Max
User's Manual
By pressing the difference key, the distance between the
2 last height measurements, centreline measurements,
Min or Max measurements is determined and displayed in
with each other.
7.8 Operations Between Selected Values of the Buffer
By pressing the difference key for 2 seconds, the
calculation menu is displayed.
Just select at least 2
the calculation functions described below.
> 2 s
750 50 0042 03 28
Page 31
V7 / V9
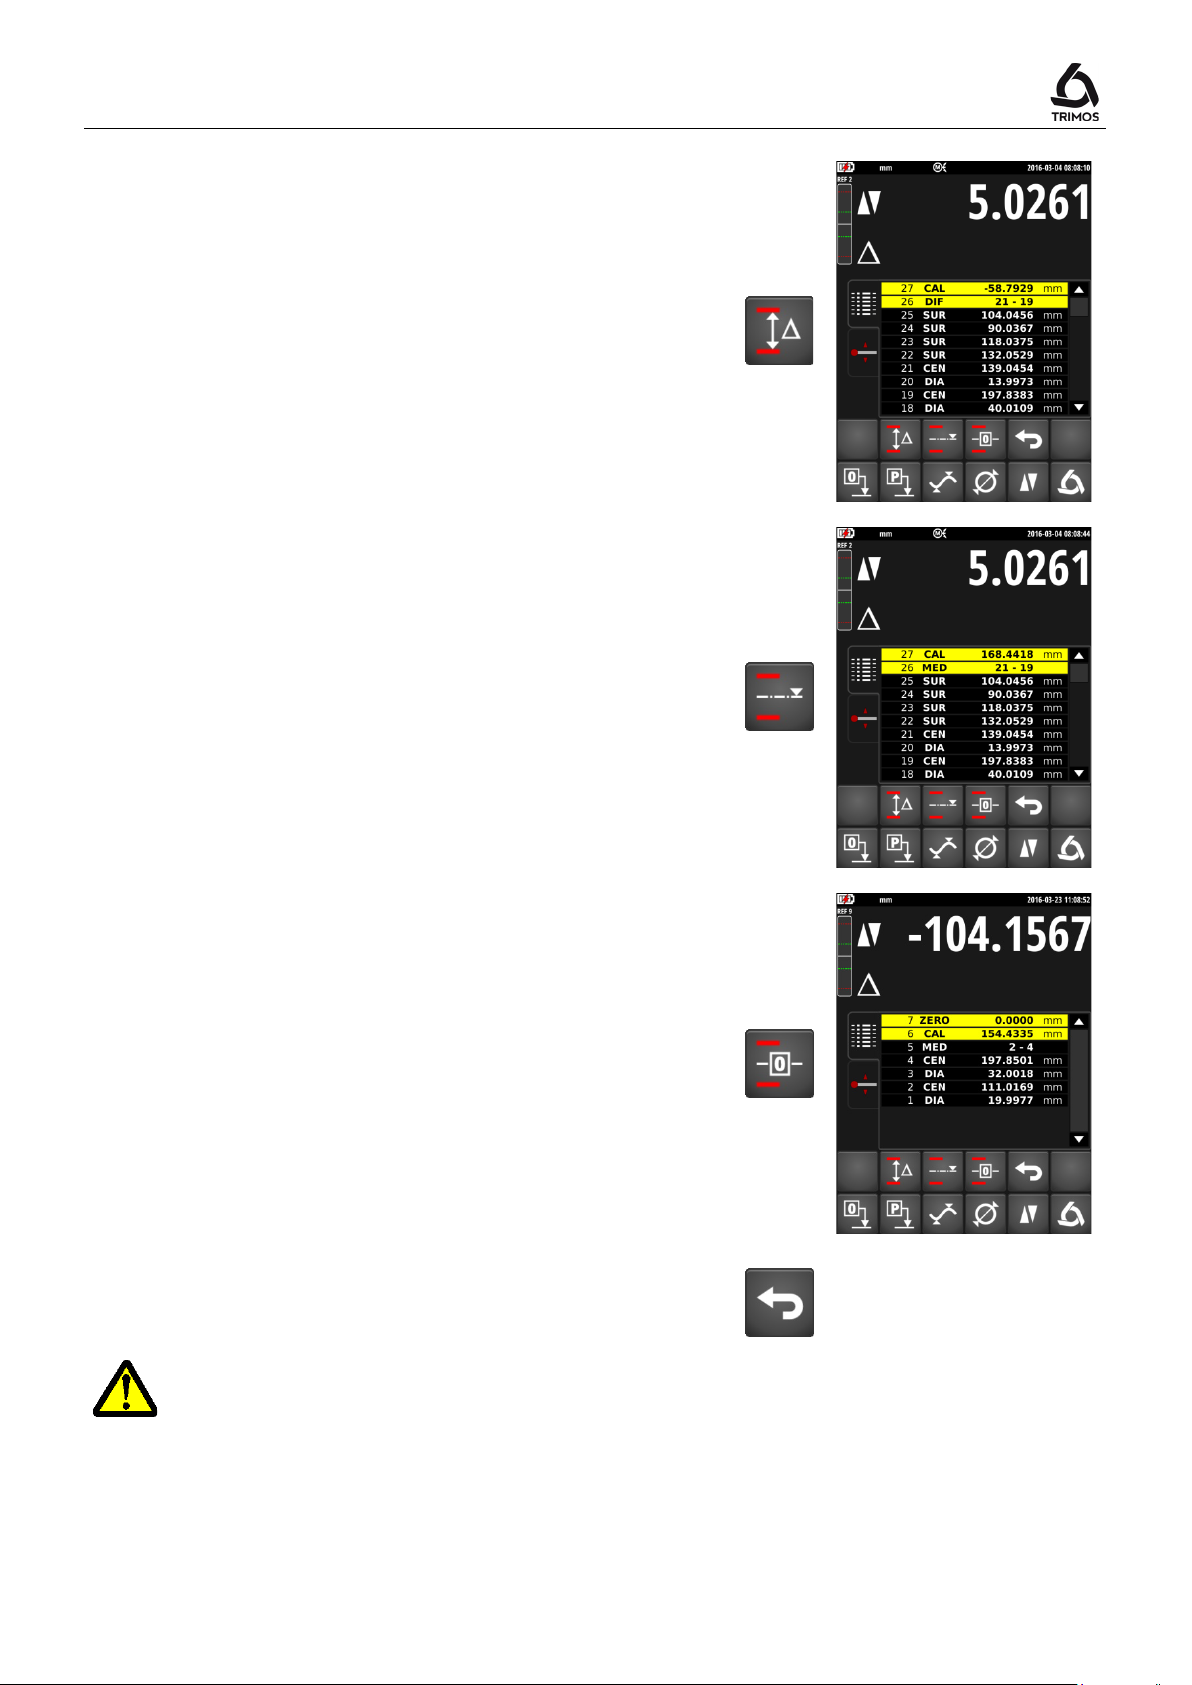
During calculations, the instrument considers all the significant numbers at its
disposal (=maximum resolution). When maximum resolution is not used, the result of
Same calculation with resolution = 0.001: 10.005 – 5.005 => Displayed value: 5.001!
Difference between the 2 extreme peak values
This function calculates the difference between the 2
extreme peak values of measurements selected from the
buffer.
Average between selected values
The average between 2 or more measurements selected
from the buffer is calculated and displayed with this
function.
Zero setting on the average of selected values
This function enables zero setting on the average of 2 or
more measurements selected from the buffer.
To exit the calculation mode, press the key shown
alongside:
this difference can be apart by a digit in relation to the subtraction of the displayed
values (rounding-off errors)
Example: Max. resolution = 0.0001: 10.0054 – 5.0045 => Displayed value: 5.0009
750 50 0042 03 29
Page 32
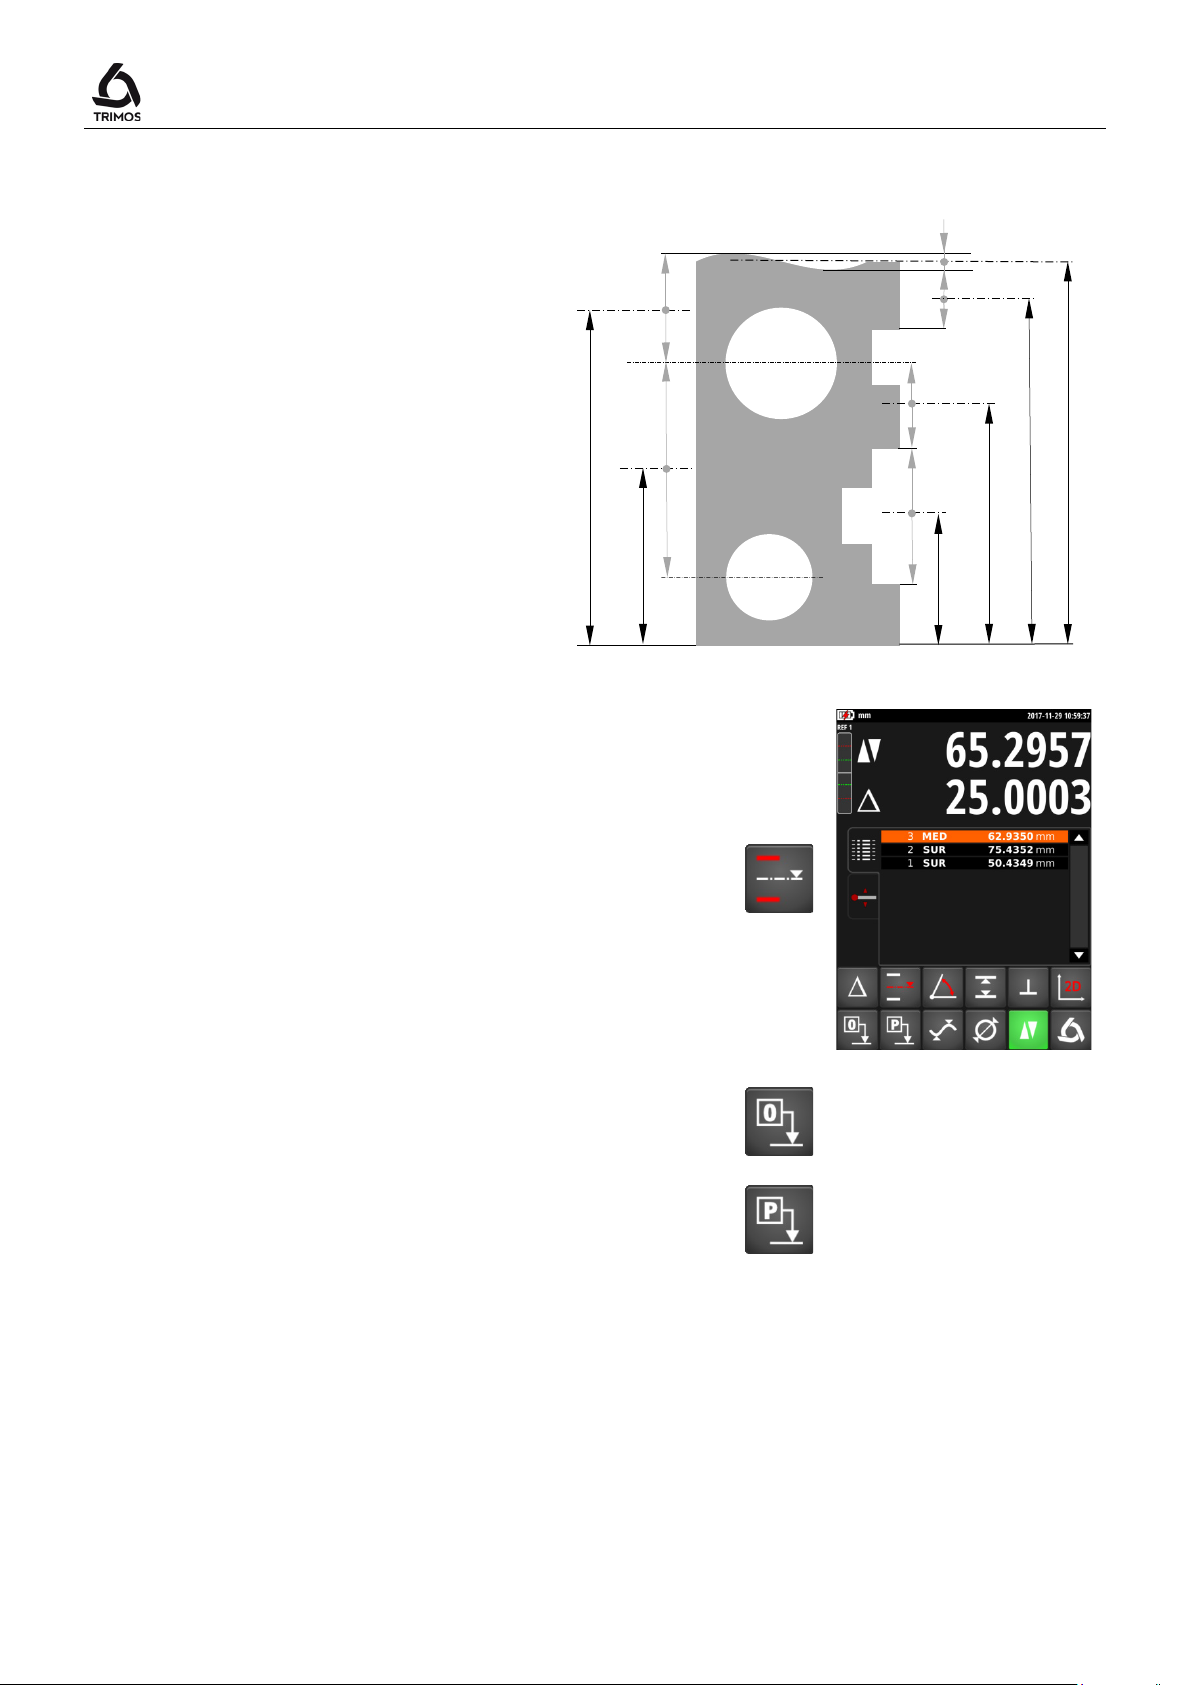
M1
M2
M3
M12
M23
M13
7.9 Average of the Last 2 Measurements
Averages:
M1 = Between 2 centrelines
M2 = Between 2 heights
M3 = Between Min et Max
M12 = Between centreline and height
M13 = Between centreline and Min or Max
M23 = Between height and Min or Max
User's Manual
By pressing this key, the average between the 2 last
height measurements, centreline measurements, Min or
Max measurements is determined. These various
measurements can be combined with each other.
Note:
After calculating an average value, it is possible to assign
a zero value or Preset value to the calculated position.
or
750 50 0042 03 30
Page 33
V7 / V9
Zero
Preset
C1
C3
D3
D1
C2
D2
D13
C13
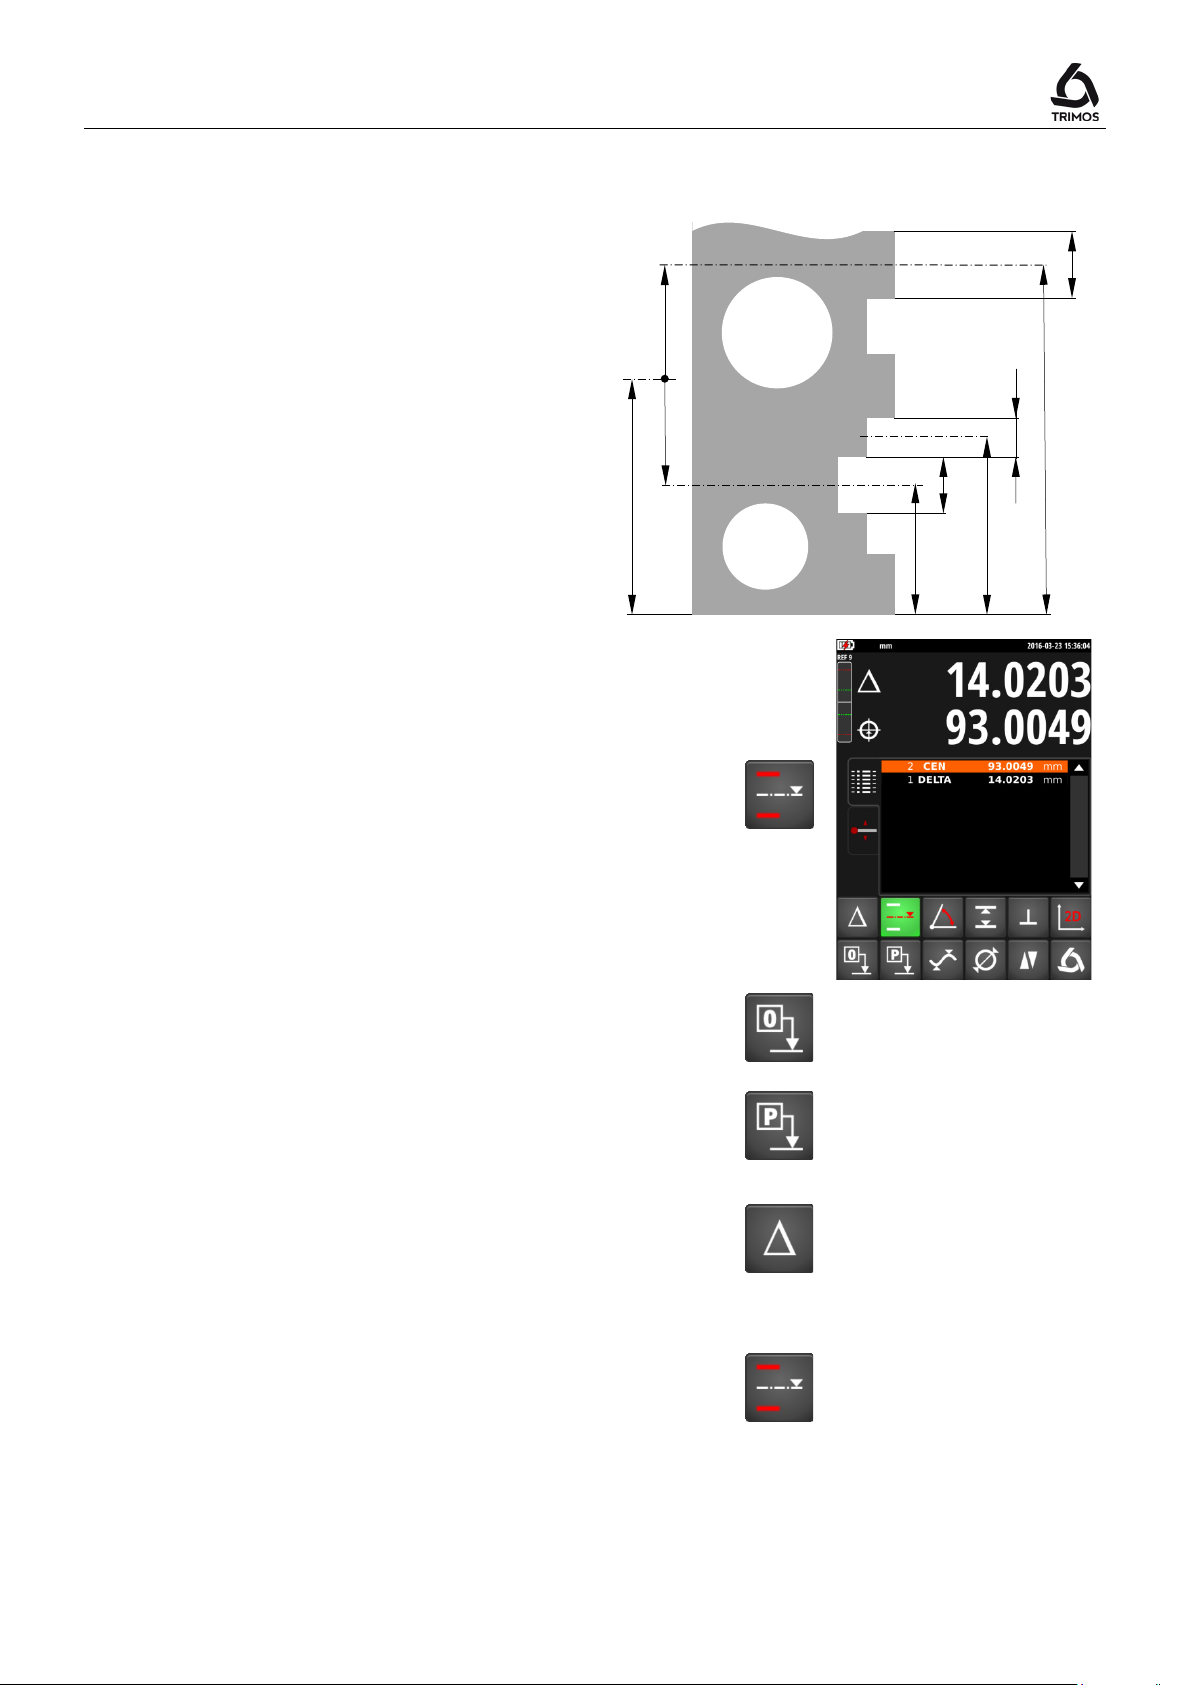
7.10 Distance and Centreline Measurement
D1 = Internal distance
C1 = Centreline corresponding to D1
D2 = Distance between 2 sides of same
direction
C2 = Centreline corresponding to D2
D3 = External distance
C3 = Centreline corresponding to D3
D13 = Distance between 2 centrelines
C13 = Average between 2 centrelines
This function measures the centreline distances and
distances between 2 surfaces that are not diameters. To
activate it, press the key shown alongside for 2 seconds.
Probe the 1st surface, then the 2nd. When the measuring
force is released after the 2nd measurement, the distance
and centreline values are frozen on the 1st and 2nd lines of
the display respectively.
Zero or Preset on centreline
It is possible to assign a
or
value to the
measured centreline distance.
Difference between 2 centrelines
By pressing the difference key, the distance between the
2 last centrelines is determined and displayed in the buffer
(DIF).
> 2 s
or
Average of the centrelines
By pressing this key, the average of the 2 last centrelines
is determined and displayed in the buffer (MED).
Quit
To quit this mode, select any other measuring function
750 50 0042 03 31
Page 34
t while maintaining the distance
measurement using the support part as shown on the
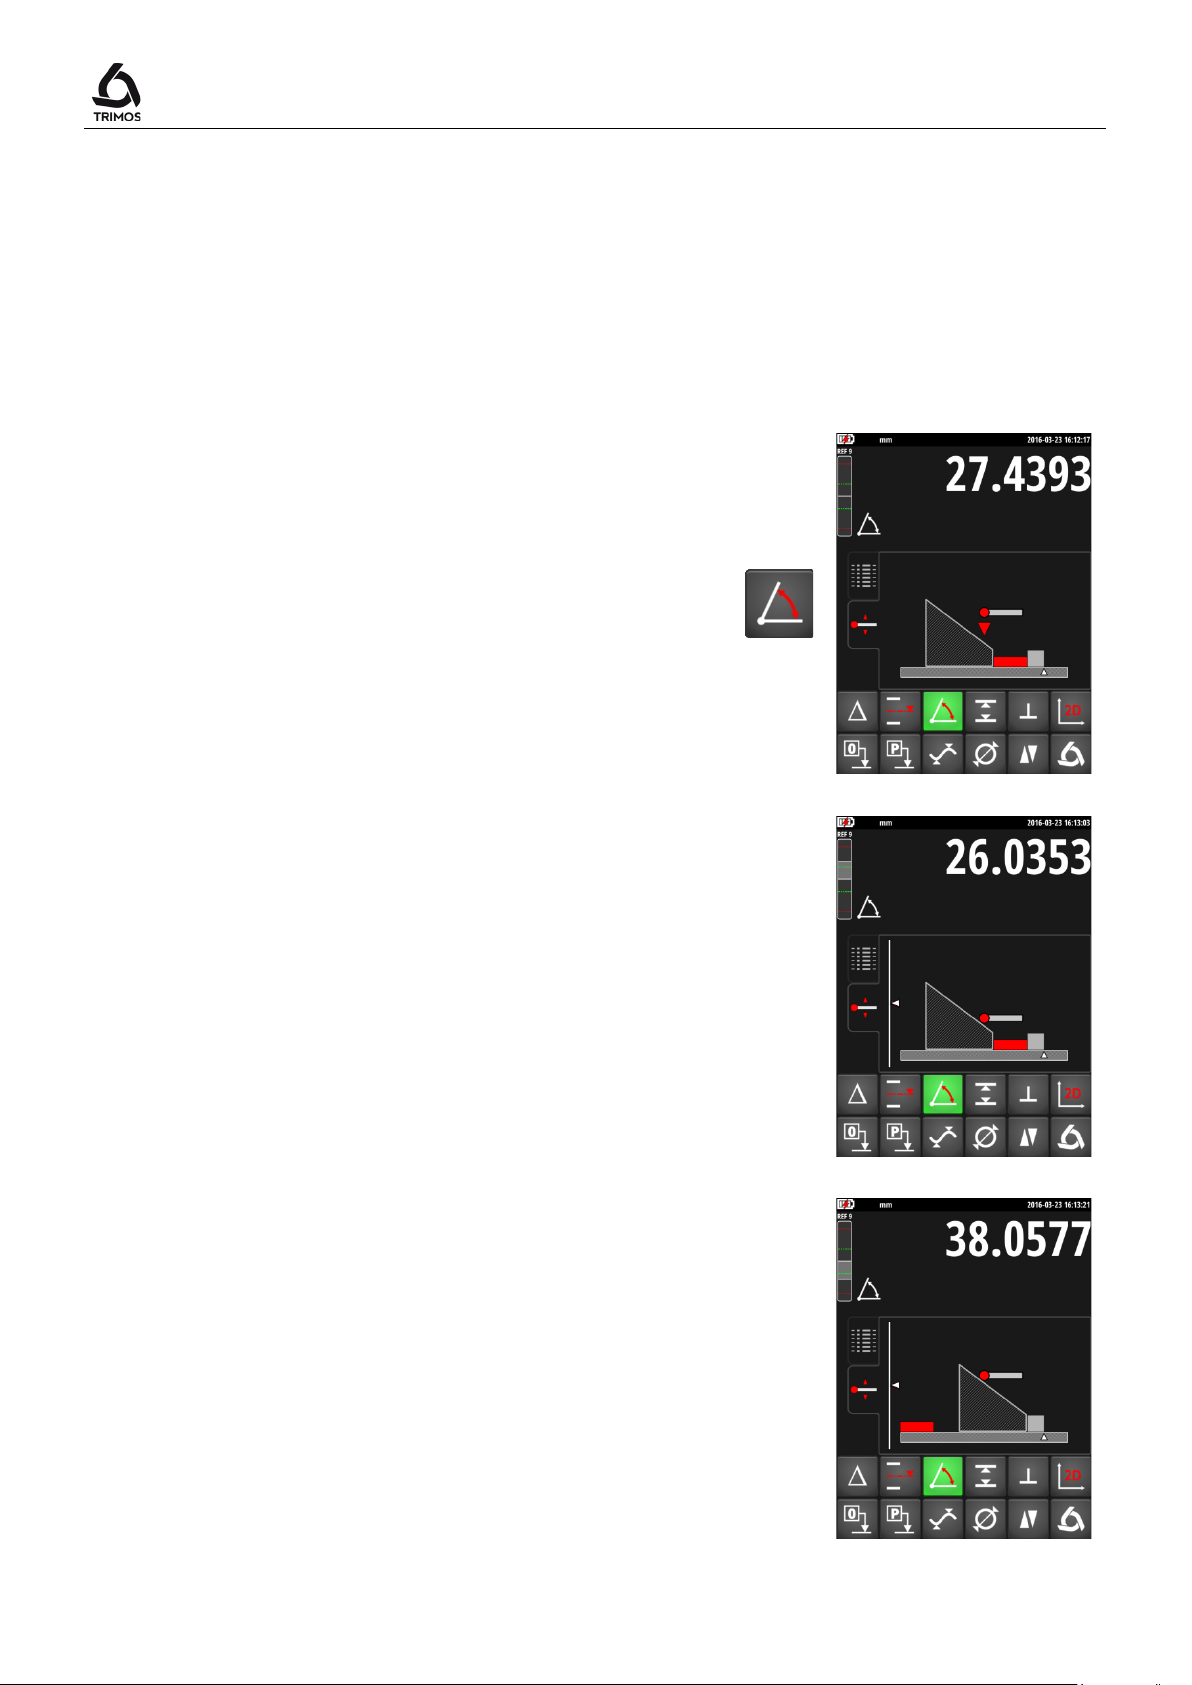
7.11 Angle (and cone) Measurements
This function measures the angle of a side or of a cone in
relation to the measuring table. For this measurement, a
support part and a gauge block are required.
1. Call the angle measurement function by pressing on
the key shown alongside:
User's Manual
2. Take the first measurement with the support part (in
grey) placed against the base of the probe and the
gauge block (in red).
For the cone measurement, search the reversal point
by moving the instrument (or the part) perpendicular
to the axis of the inser
between the instrument and the constant part.
3. Withdraw the gauge block and take the second
screen. For the cone measurement, search the
reversal point by moving the instrument (or the part)
perpendicular to the axis of the insert while
maintaining the distance between the instrument and
the constant part.
750 50 0042 03 32
Page 35
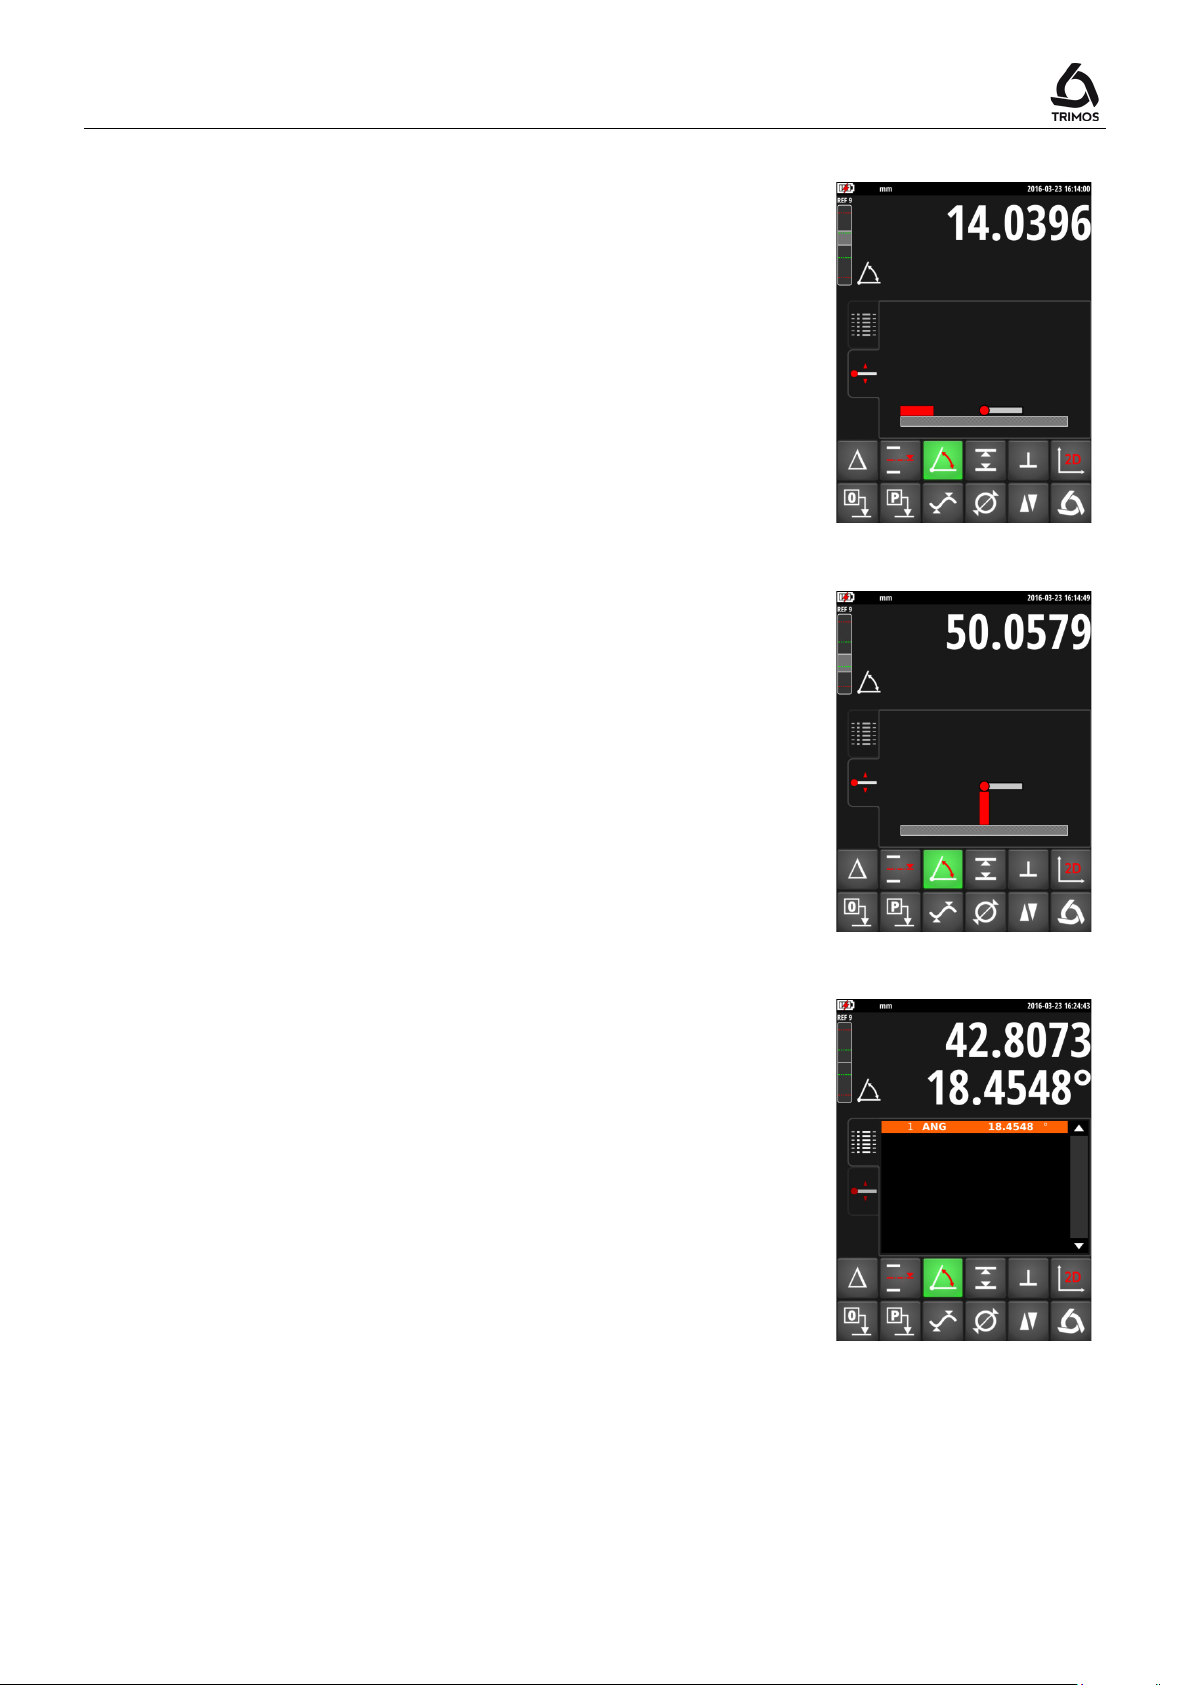
V7 / V9
4. Perform a probing measurement on the measuring
table.
5. Measure the gauge block.
Note:
Dimension of the gauge block can be recorded in the
instrument parameters (see § 13.2). This
measurement step and the previous one are then
deleted.
6. Value of the angle is displayed and stored in the
buffer. A new angle measurement can now be taken.
Note: Angles can be displayed in 3 different units:
1. Decimal degrees (x.x°)
2. Degrees, minutes, seconds (x° x' x")
3. Radians (rad)
To change the angle unit, see § 13.2.
750 50 0042 03 33
Page 36
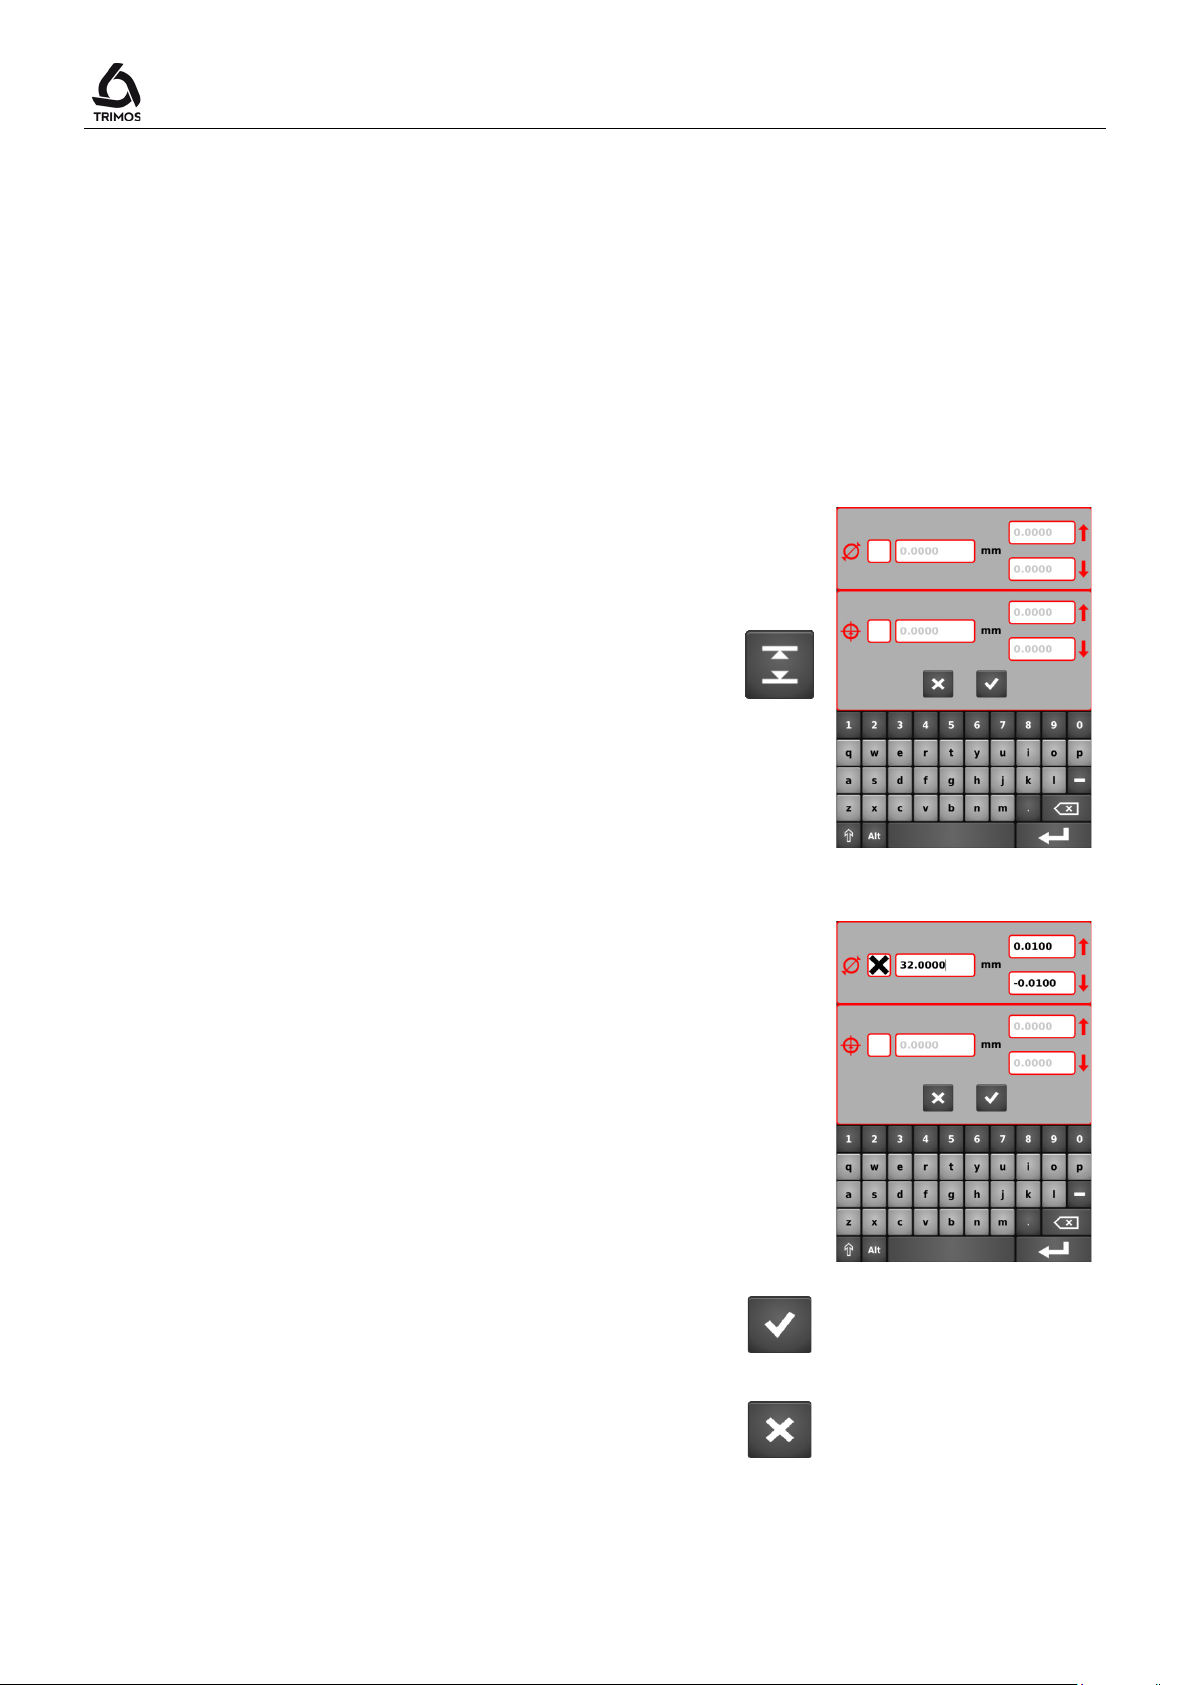
This mode is used to measure parts in series and compare
respected.
Cancel
7.12 Tolerance Limits
a height, diameter and/or a centreline as well as a Min or
Max with pre-programmed permitted dimensions. Colours
in the buffer indicate whether or not the tolerances are
7.12.1 Programming the Tolerances
1. In order to store the dimensions with their tolerances,
press the key shown alongside for 2 seconds. The
menu corresponding to the active measurement mode
is displayed (illustration given alongside for
diameter/centreline).
Note:
If the probe is a mode other than height,
diameter/centreline or Min/Max, this menu will not
display.
User's Manual
> 2 s
2. Activate the extent of tolerance by clicking in the box
on the right side of the corresponding symbol and
enter the base dimension as well as its tolerances
using numeric keys.
3. To end, validate with the OK key.
To exit without saving the changes, press the
key.
750 50 0042 03 34
OK
Cancel
Page 37
V7 / V9
Tol
"Standard" display
"standard" mode.
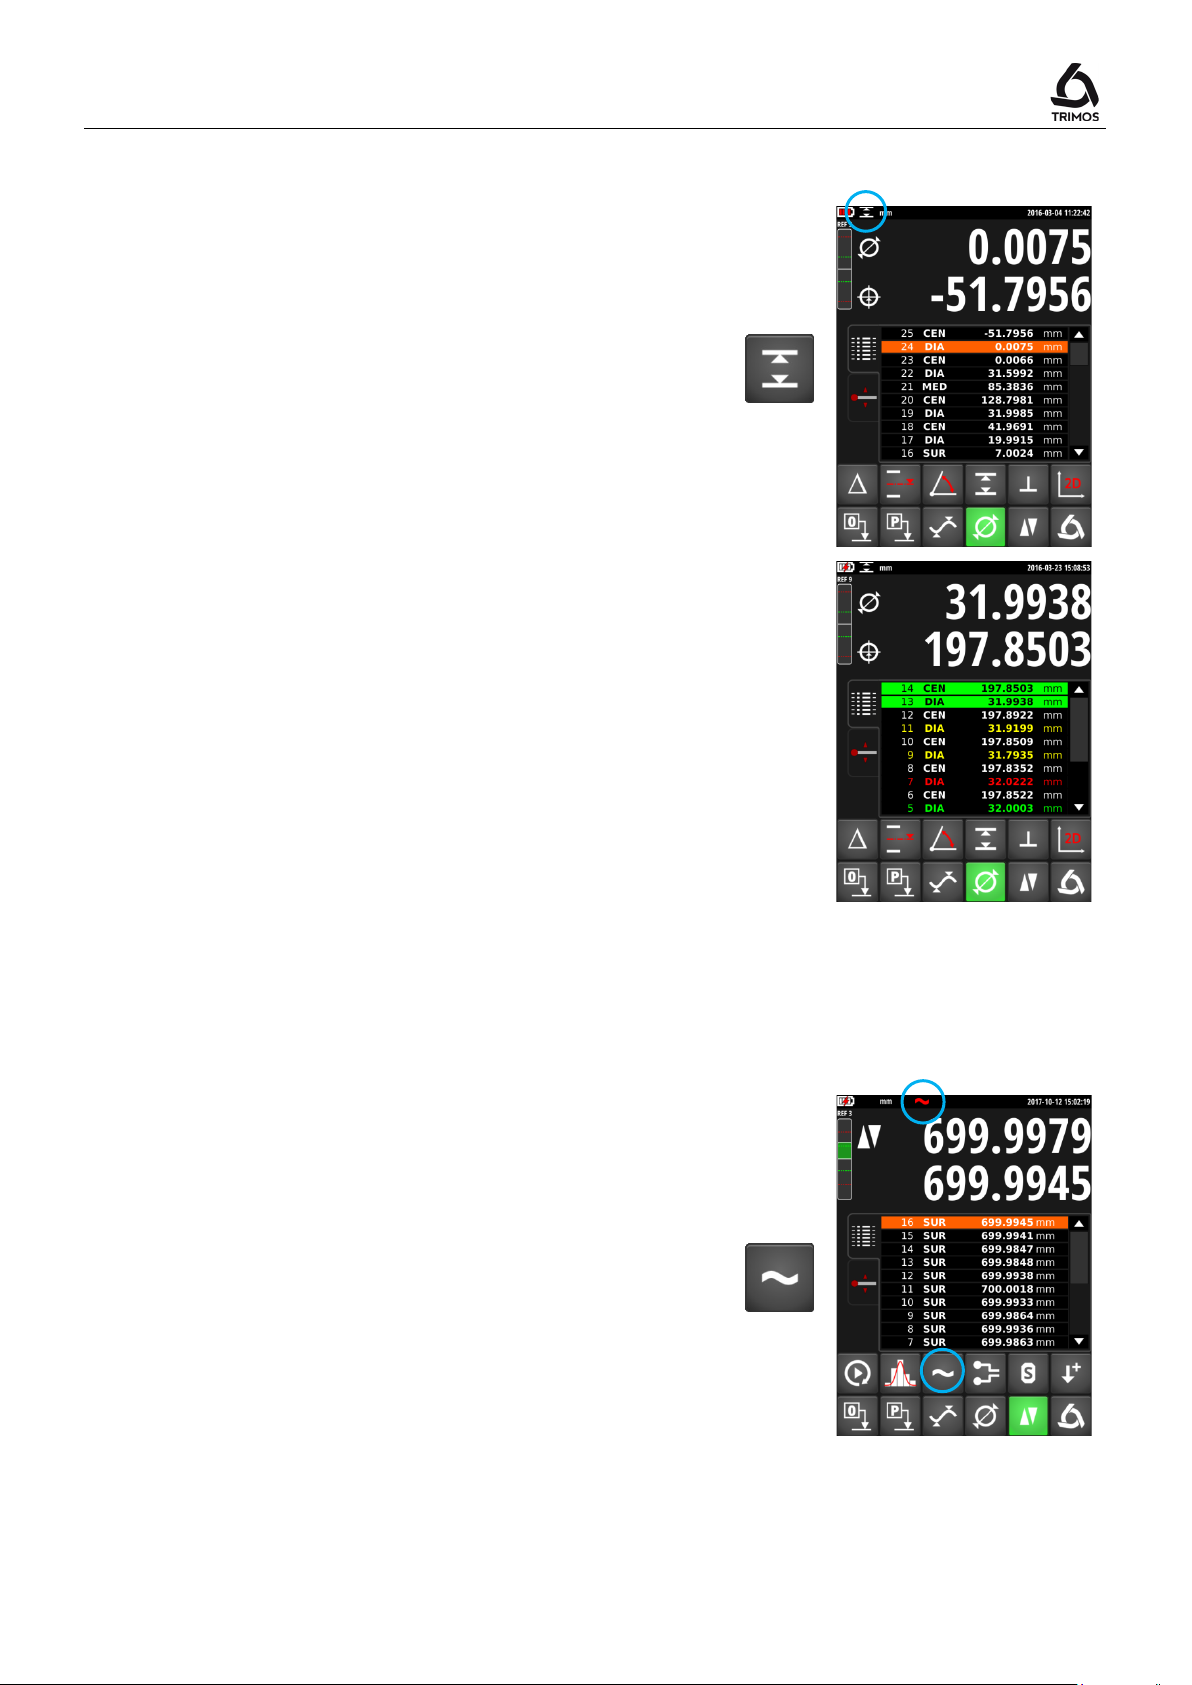
7.12.2 Using the Tolerance Limits
1. Activate the tolerance mode by pressing the
key.
The function symbol is then displayed in the status bar.
2. For each height, diameter or centreline measurement
for which tolerances have been activated, the
corresponding buffer line is displayed in a colour
corresponding to the result.
Green: Within tolerance limits
Yellow: Outside tolerance limits, reworking possible
Red: Outside tolerance limits, reworking not
possible
7.13 Display Modes of the Height Measurements
When taking a height measurement, the upper line
remains frozen at the measured value. The lower line
shows the distance from the measurement of the previous
height (chain dimension). When the measuring force is
released, this value is replaced by that of the last
measurement.
"Direct" display
When taking a height measurement, the upper line is not
frozen and directly reacts to the part's height variations.
The lower line indicates the frozen value of the last
measurement.
Activate the "direct" display mode by pressing the key
shown alongside. The "direct" display symbol is then
displayed in the status bar. Do the same to return to
Display in direct mode
750 50 0042 03 35
Page 38
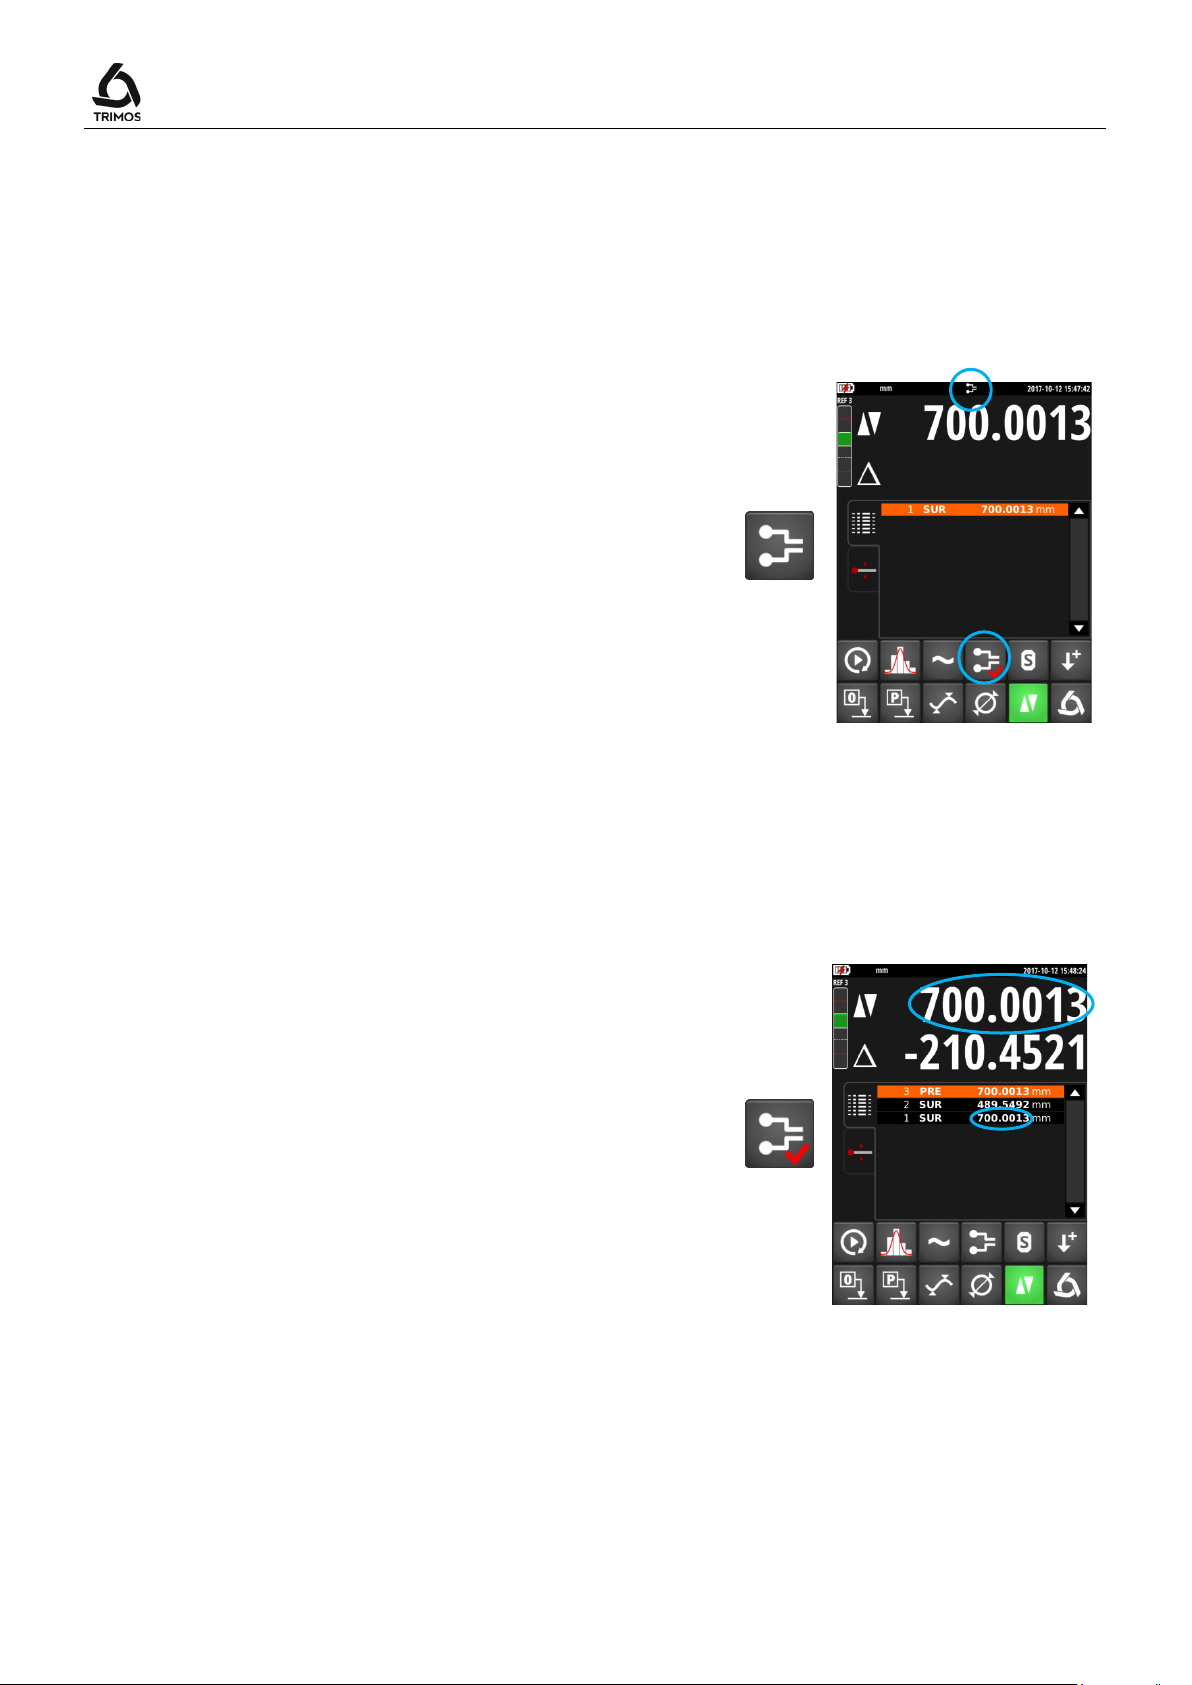
7.14 Probe Holder Change
User's Manual
This function allows to pass from one probe holder to the
other while keeping the same origin.
Procedure:
1. Before taking out the insert probe a reference surface
of centreline and activate the probe holder change
mode.
The button changes its appearance and the probe
change symbol blinks in the status bar.
2. Mount the probe on the other probe holder.
3. Probe the same surface again, or reference centreline.
4. Press the key again. The display stores the last value
and the measurements can continue.
Note:
In the case where the reference is a centreline distance,
the program requires a new measurement of the probe
constant before probing the new reference point.
750 50 0042 03 36
Page 39
V7 / V9
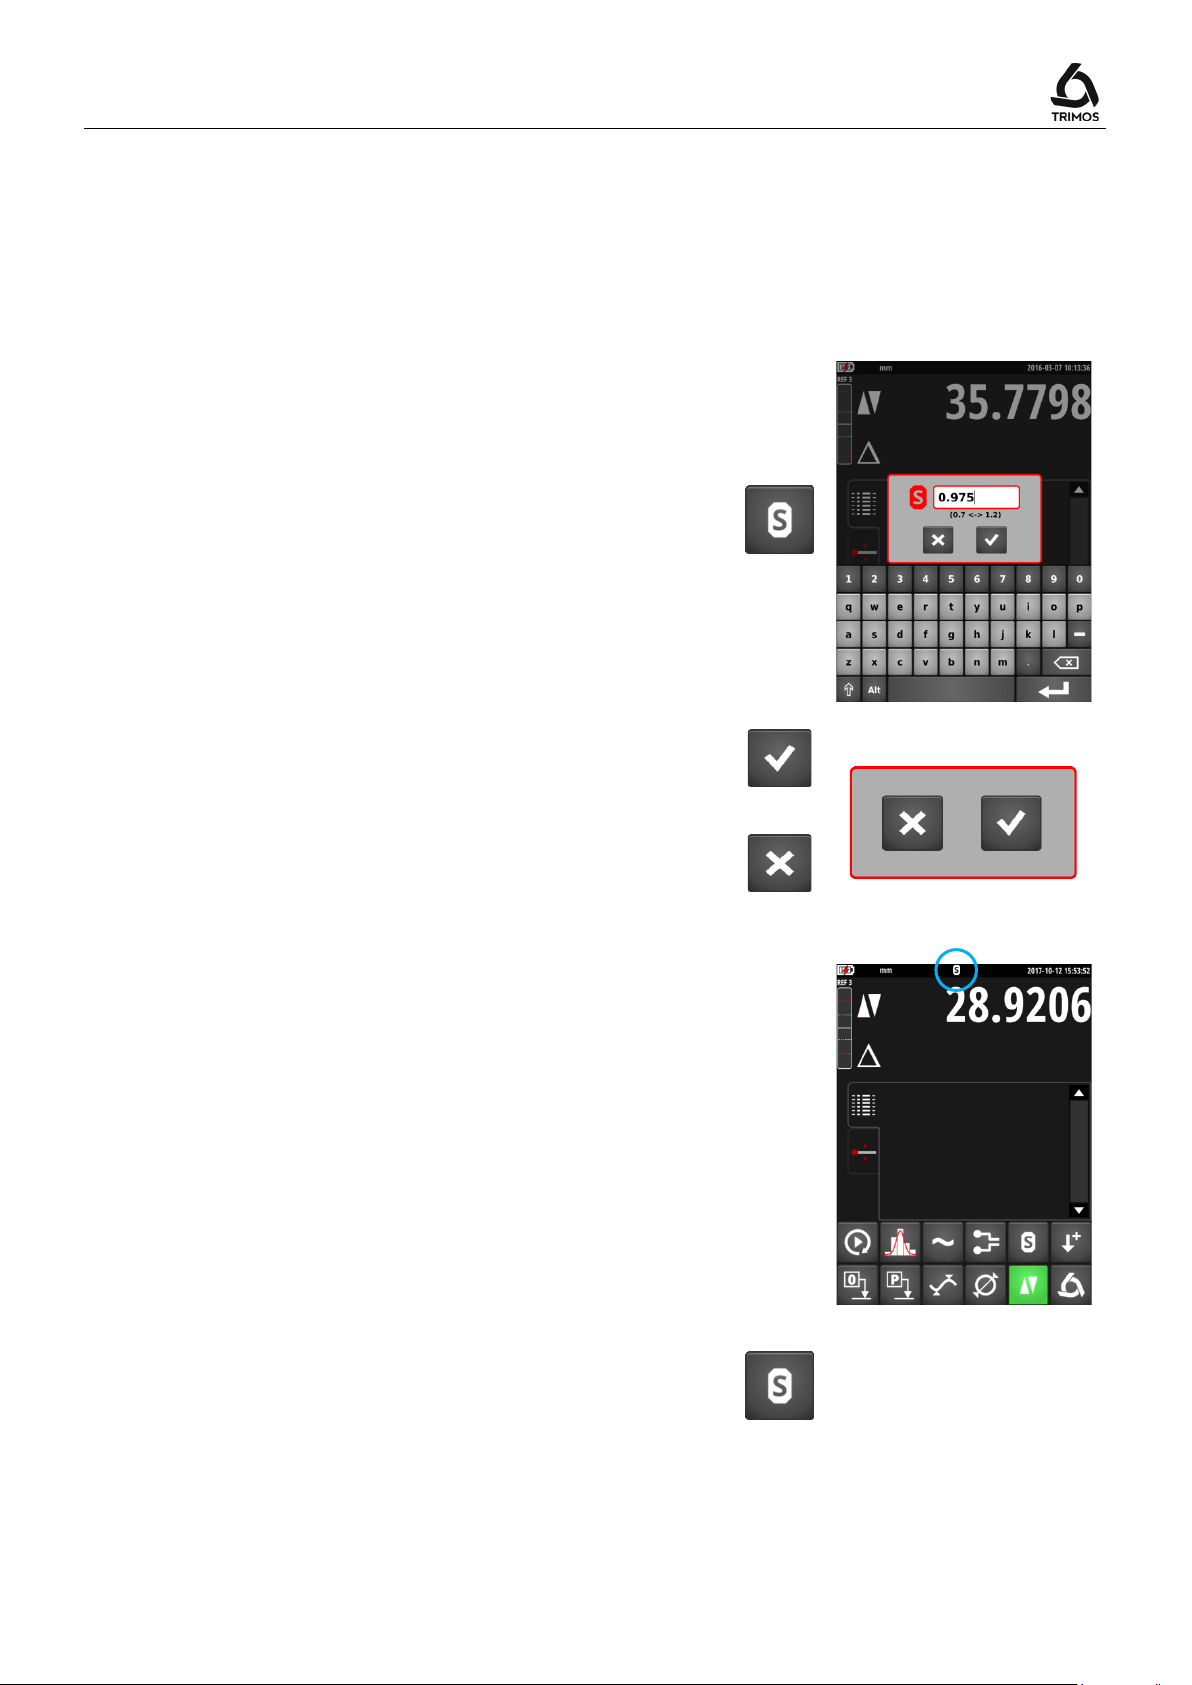
7.15 Shrinking Factor
A shrinking factor can be entered here, for example for
measuring injection moulds. This function allows in
general "distending" or "shrinking" the measuring system
by a defined factor.
1. To enter a shrinking factor, press the key shown
alongside for 2 seconds. Enter the desired factor
(value between 0.7 and 1.2).
> 2 s
2. Validate with the OK key.
To exit without saving the changes, press the Cancel
key.
When the shrinking factor is different from 1, the following
symbol appears at the top of the main display.
OK
Cancel
When a value other than 1 is recorded, the shrinkage
factor function can be activated/deactivated just by
pressing the key shown alongside.
750 50 0042 03 37
Page 40
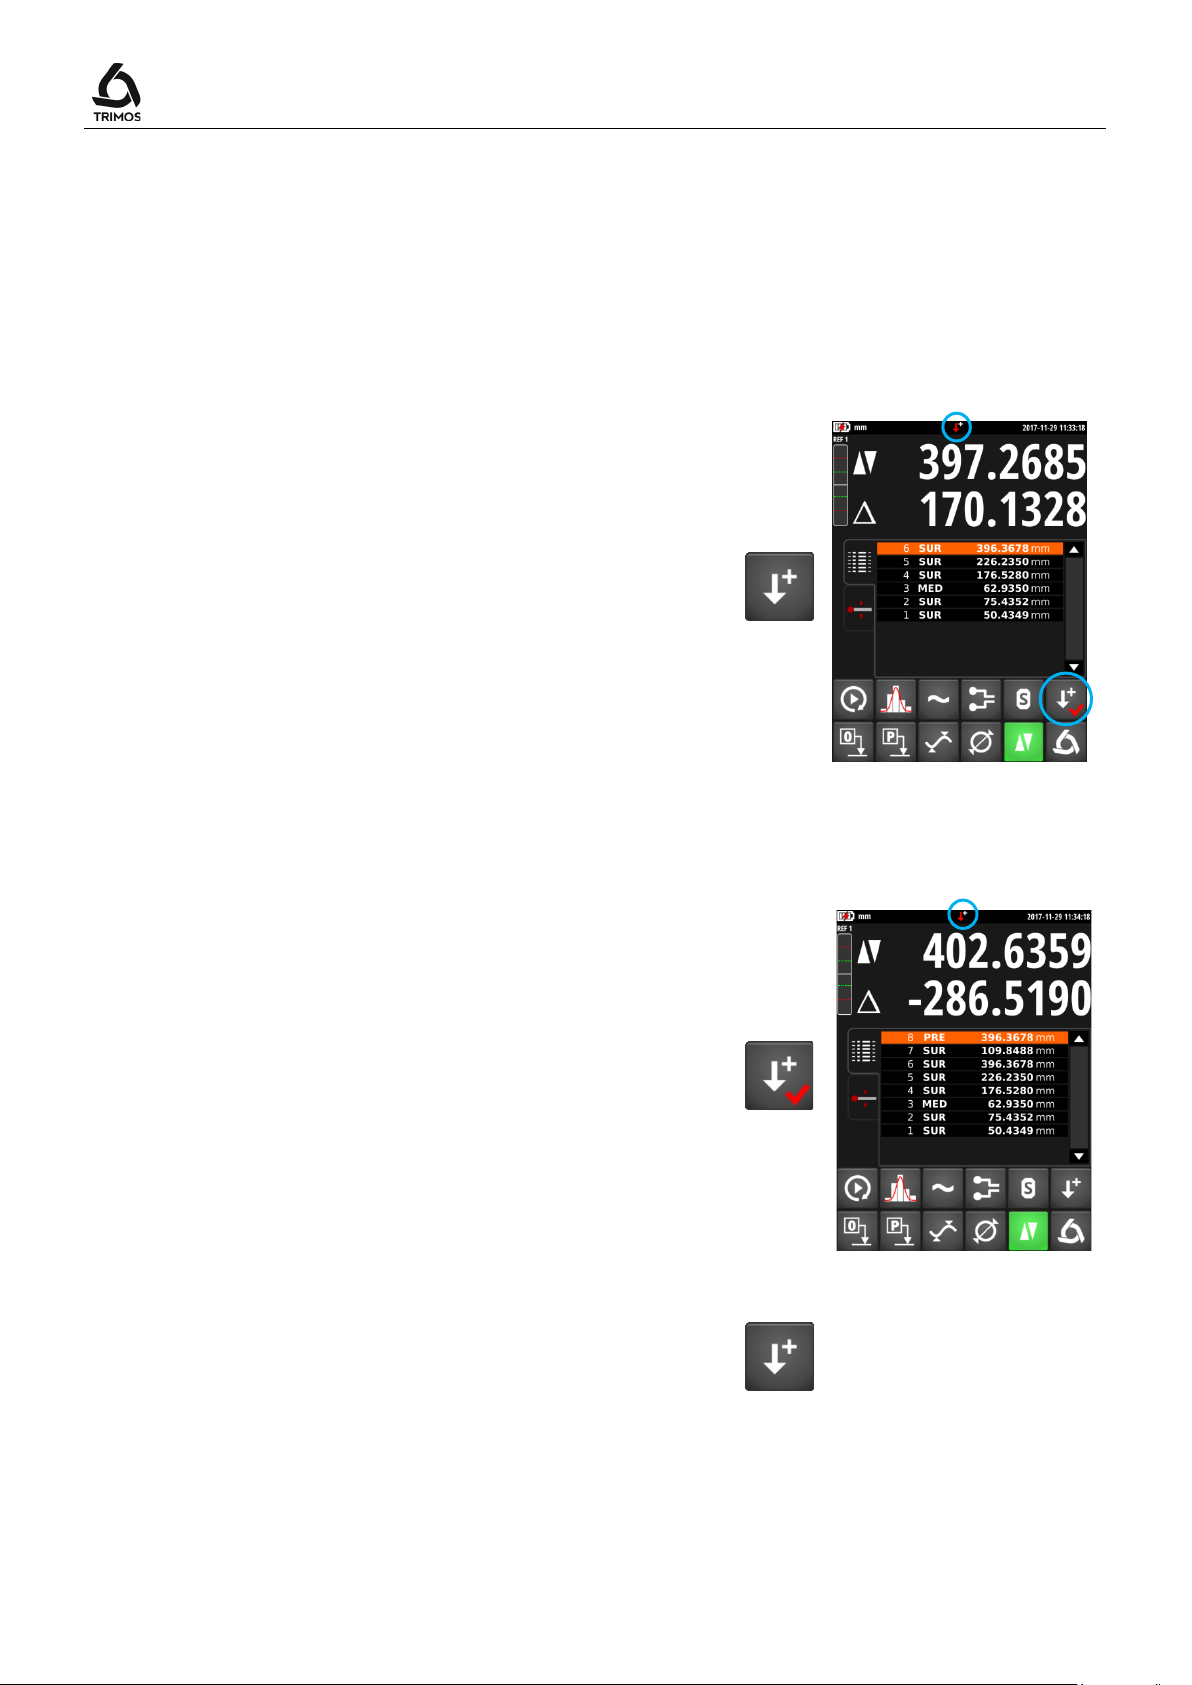
7.16 Inversion of the Measuring Direction
It is possible to invert the measuring direction to obtain
positive measuring values downwards. This function is
mainly used when the part to be measured is higher than
the measuring range of the instrument.
Procedure:
1. When the limit of the measuring range is close, probe
a reference surface or a centerline distance and
activate the function of measuring direction inversion.
The button changes appearance and the
corresponding symbol flashes in the status bar.
User's Manual
2. Turn the part and probe the same surface or centreline
again.
3. Again press on the measuring direction inversion
button. Now the instrument measures positive values
downwards and measurements can continue to be
taken.
Exit
Quit the function of inversion of the measuring direction
by pressing once again the key.
750 50 0042 03 38
Page 41
V7 / V9
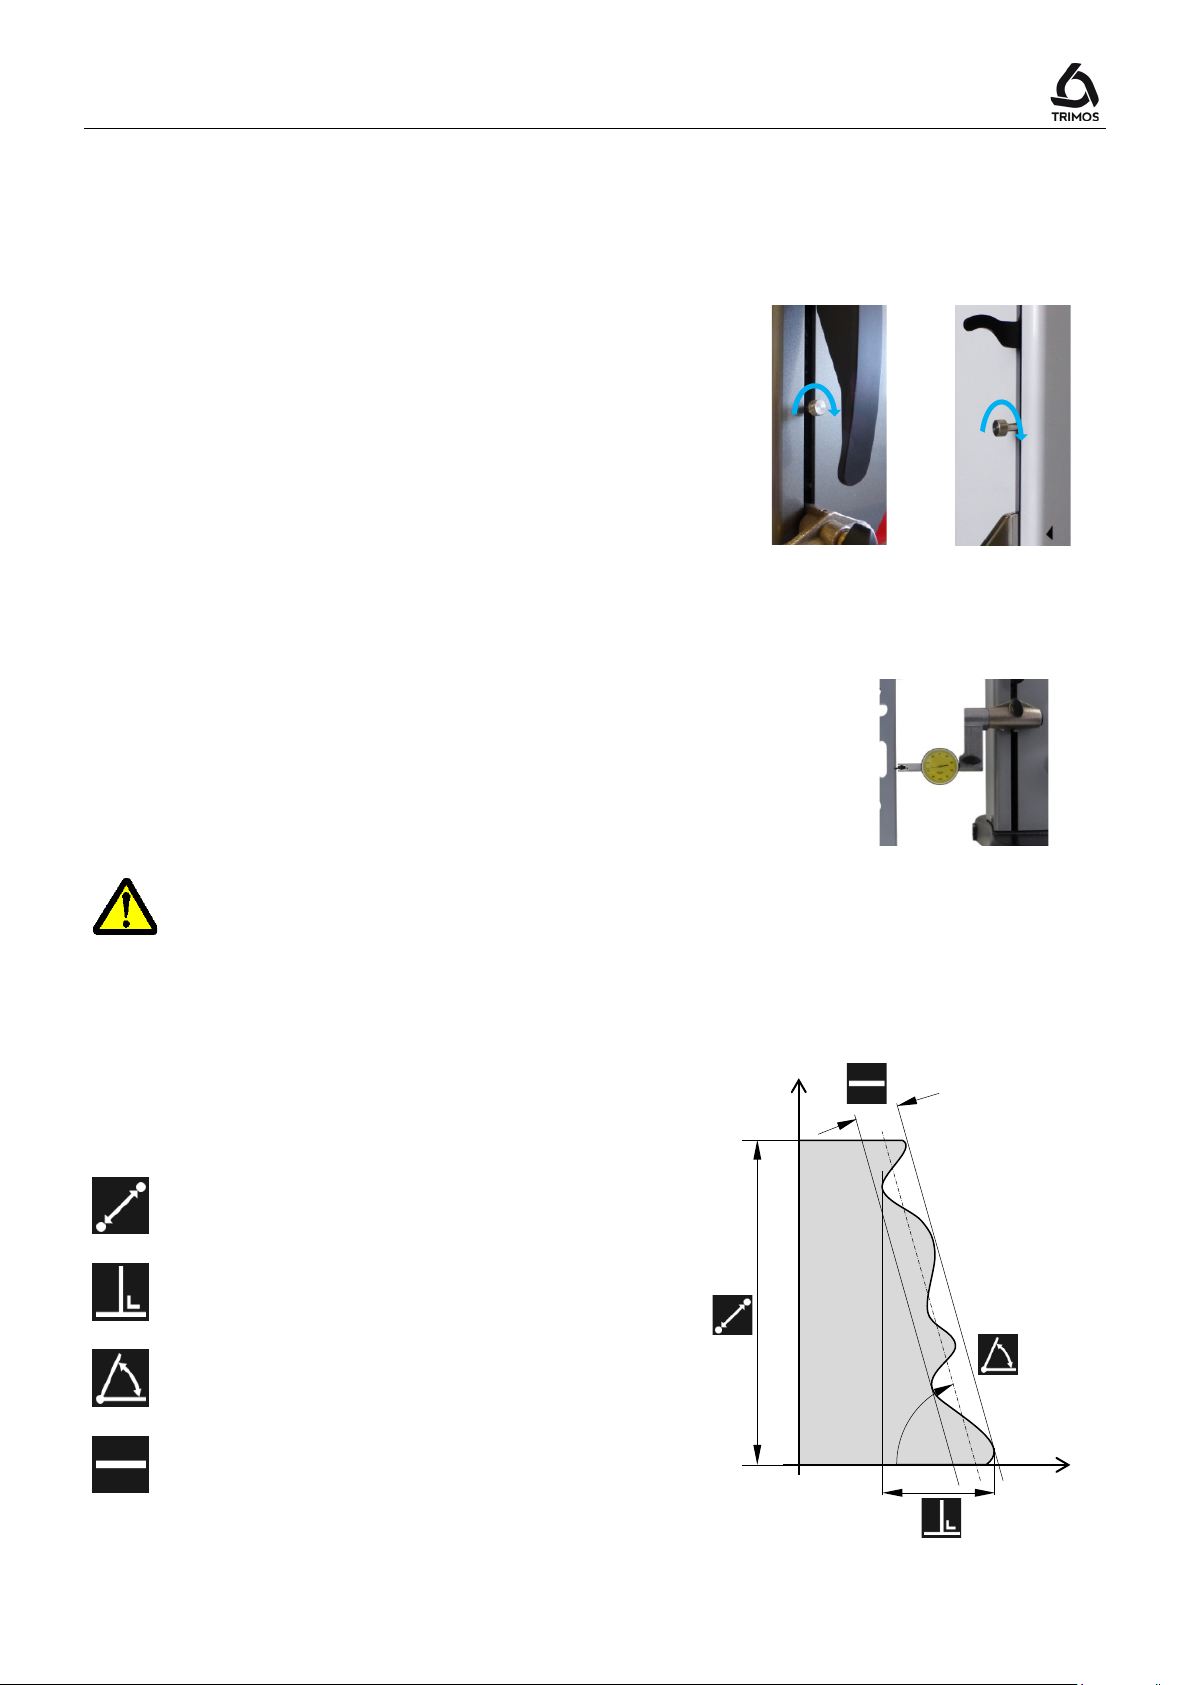
1. Place a test indicator in the probe holder.
V7
V9
Z
X
8. PERPENDICULARITY MEASUREMENTS
Before taking any perpendicularity measurements, the
carriage must be blocked.
8.1 With Test Indicator
2. Lightly press the lever of the indicator against the side
to be measured and set the zero.
3. Move the instrument's carriage vertically to check the
perpendicularity of the side.
To get optimum measuring precision, the instrument base must be completely
parallel to the side to be measured.
8.2 With Electronic Probe
The perpendicularity measurement is given with the
help of 4 values represented in the diagram alongside:
Distance
Perpendicularity
Inclination
750 50 0042 03 39
Rectitude
Page 42
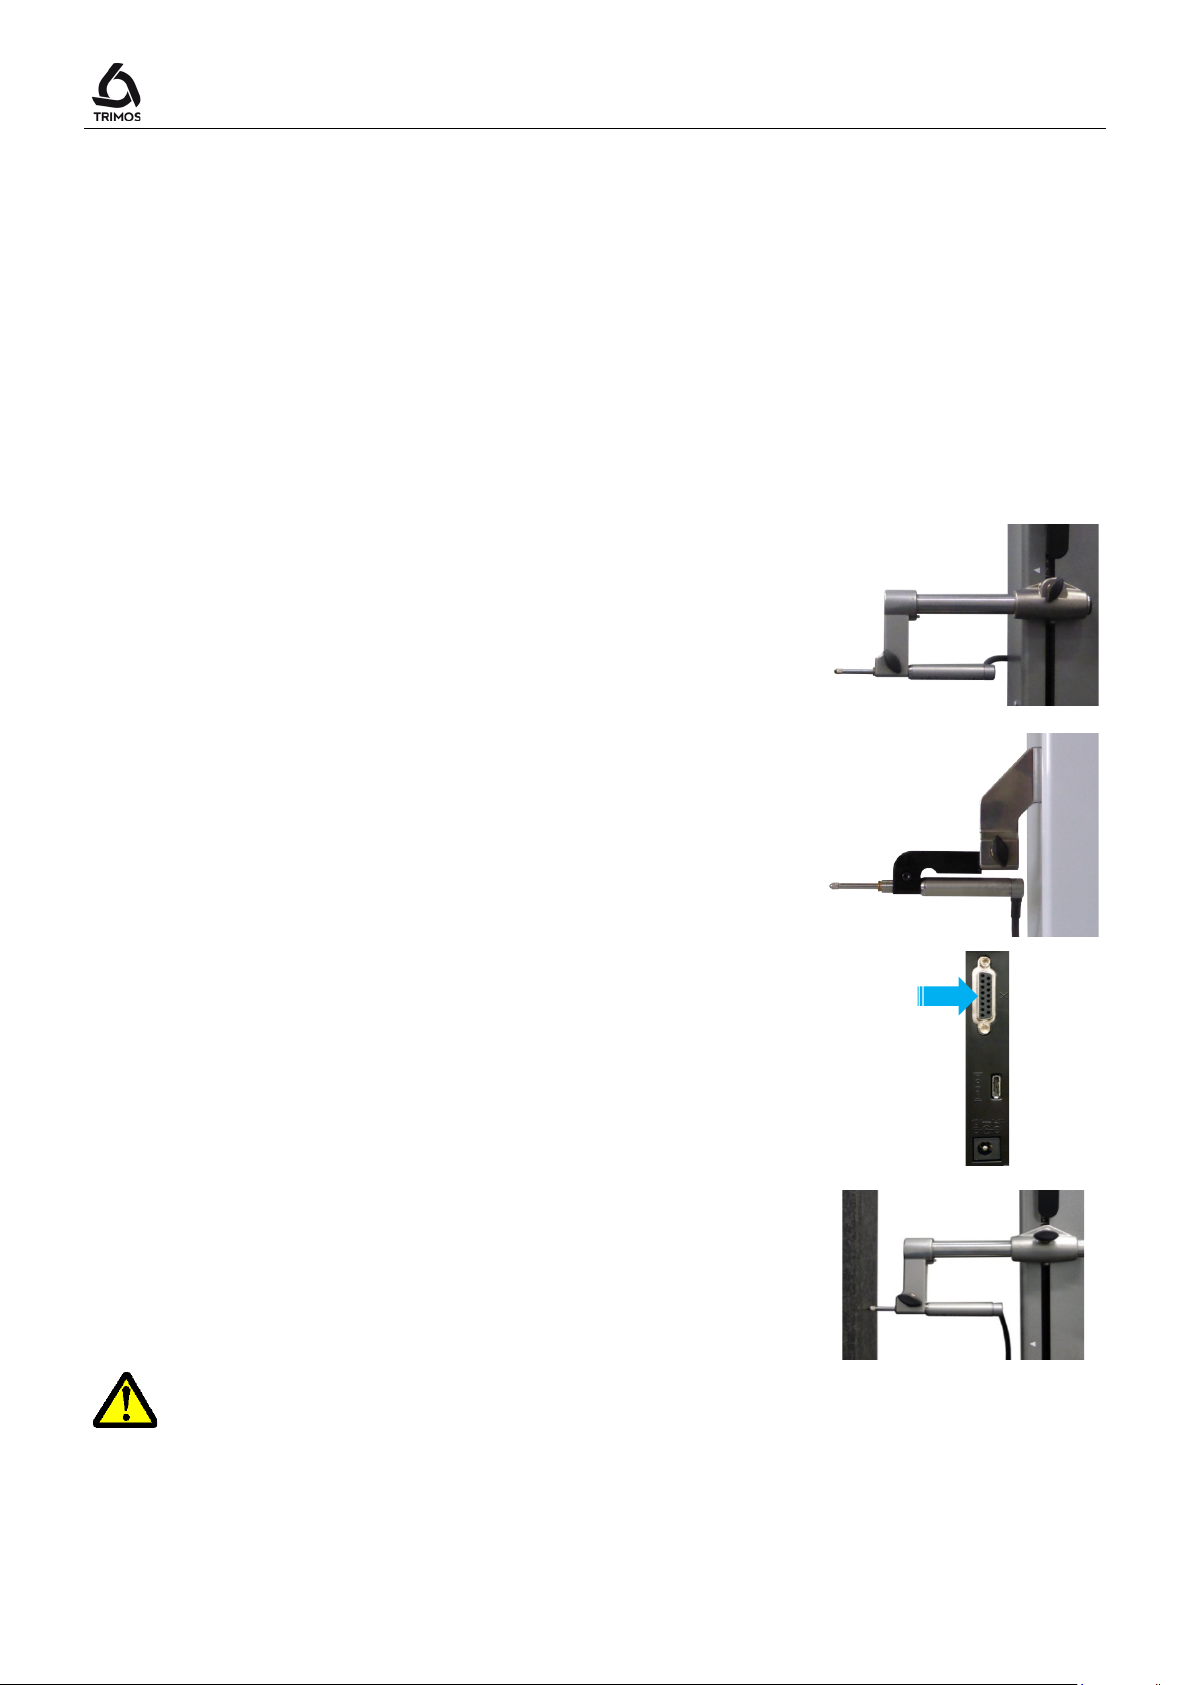
To get optimum measuring precision, the instrument base must be completely
holder.
The required accessories are:
Perpendicularity probe
V7-400, V7-700, V9-400 and V9-700: TA-MS-101 (ref. 276 940001 001)
V7-1100 and V9-1100: TA-MS-102 (ref. 276 940001 002)
V7-1800: TA-MS-104 (ref. 609 02 021)
Holder for perpendicularity probe
V7: TA-MS-104 (ref. 609 02 021)
V9: TA-IH-136 (ref. 612 11 073)
Procedure:
V7
1. Mount the electronic perpendicularity probe in its
holder.
V9
User's Manual
2. Connect the perpendicularity probe to the column
3. Place the part to be measured against the probe such
that the entire portion to be measured is in contact
with it. Bring the carriage to its starting position.
parallel to the side to be measured.
Pay attention that the cable of the probe does not create any stress on the probe
750 50 0042 03 40
Page 43
V7 / V9
Start
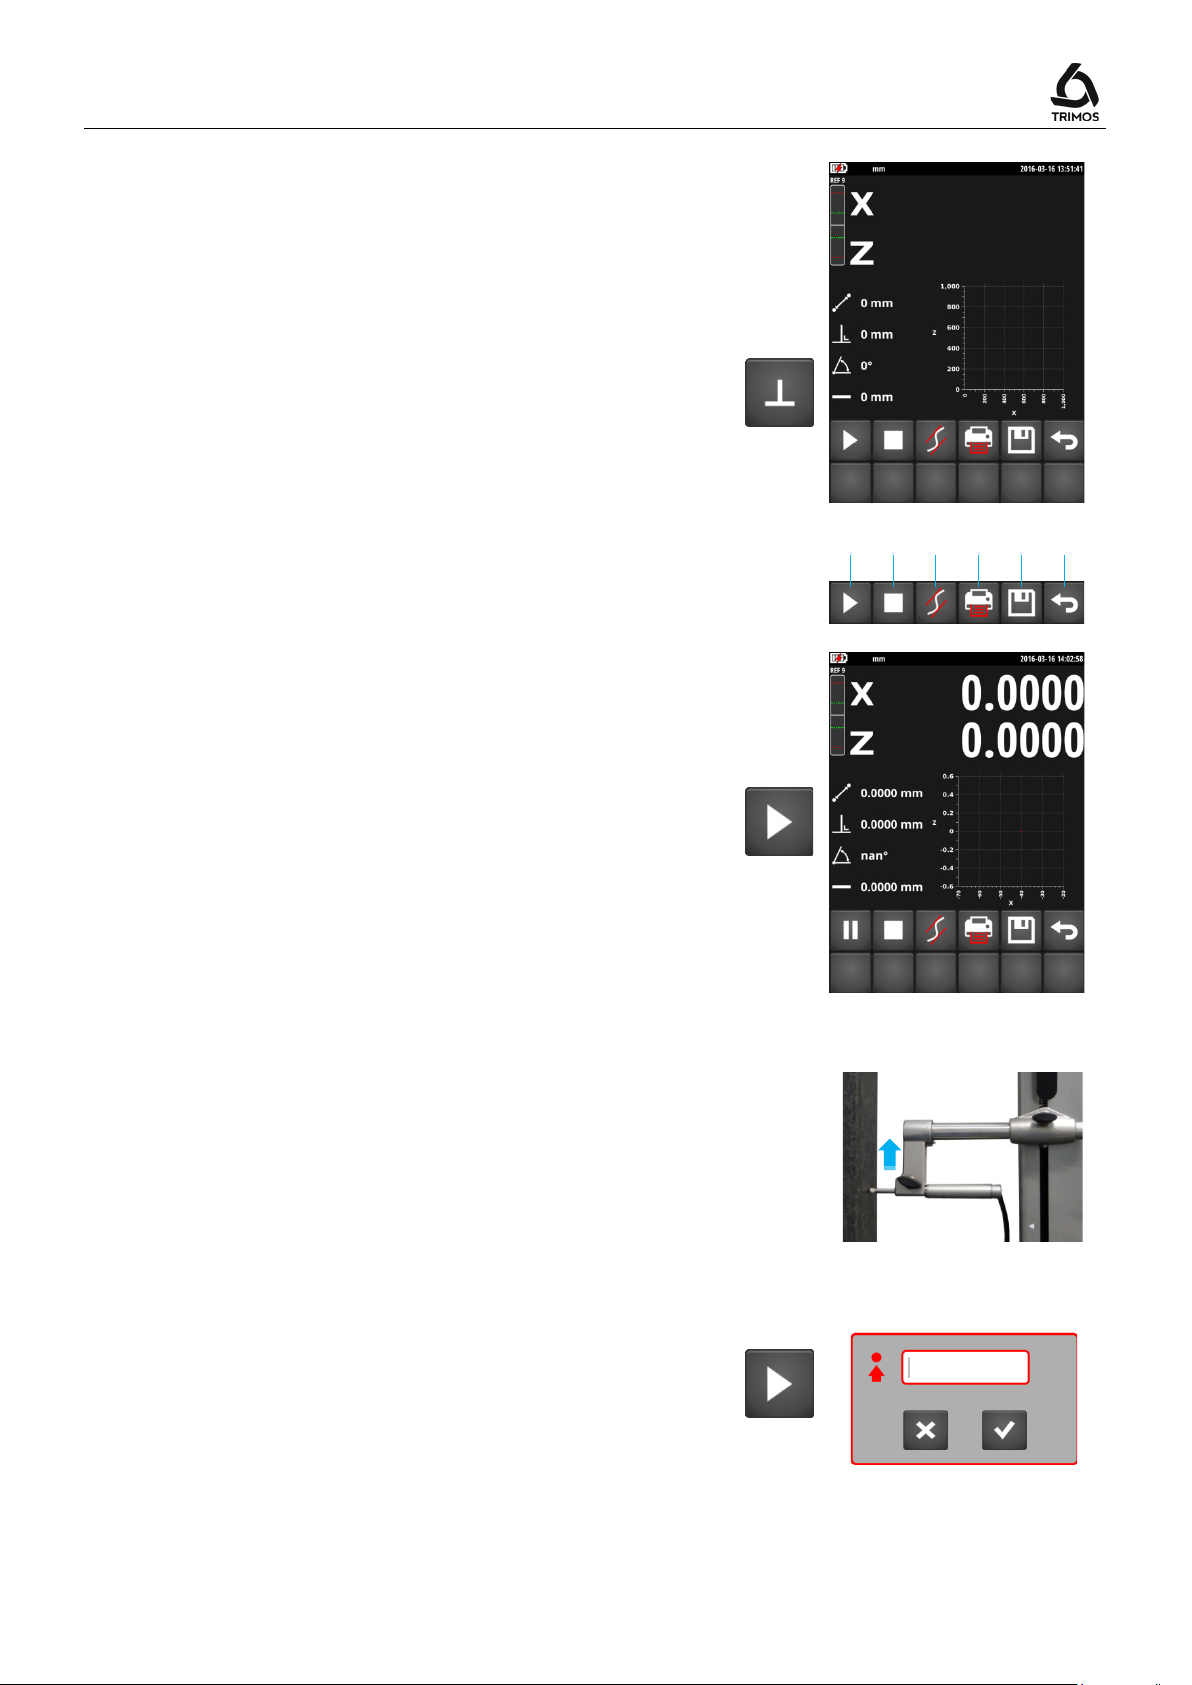
The probe measurement (X) appears on the first line of
6. Slowly move the probe along the side to be measured.
Start
Start
a b c d e
f
4. Call the perpendicularity measurement function by
pressing on the key shown alongside.
The following menu is displayed:
a) Start/Pause
b) Stop
c) Display trend curves
d) Print data
e) Save data
f) Exit
5. To start the perpendicularity measurement, press the
key.
the display. The measured height (Z) is displayed on
the second line. These two values are initialised to 0 at
start-up.
While moving, the X (horizontal axis) and Z (vertical
axis) values as well as the perpendicularity curve and
its parameters (distance, perpendicularity, inclination
and rectitude) are directly displayed.
Note 1:
In motorised mode, the carriage will start moving
immediately after having pressed the
key.
Note 2:
In motorized mode it is possible to move the probe
from a predefined distance. To do this, press the
key for 2 seconds and enter the desired distance
(positive value = upward movement, negative value =
downward movement).
The move starts directly after confirmation.
> 2s
750 50 0042 03 41
Page 44
Stop
Stop
Pause
User's Manual
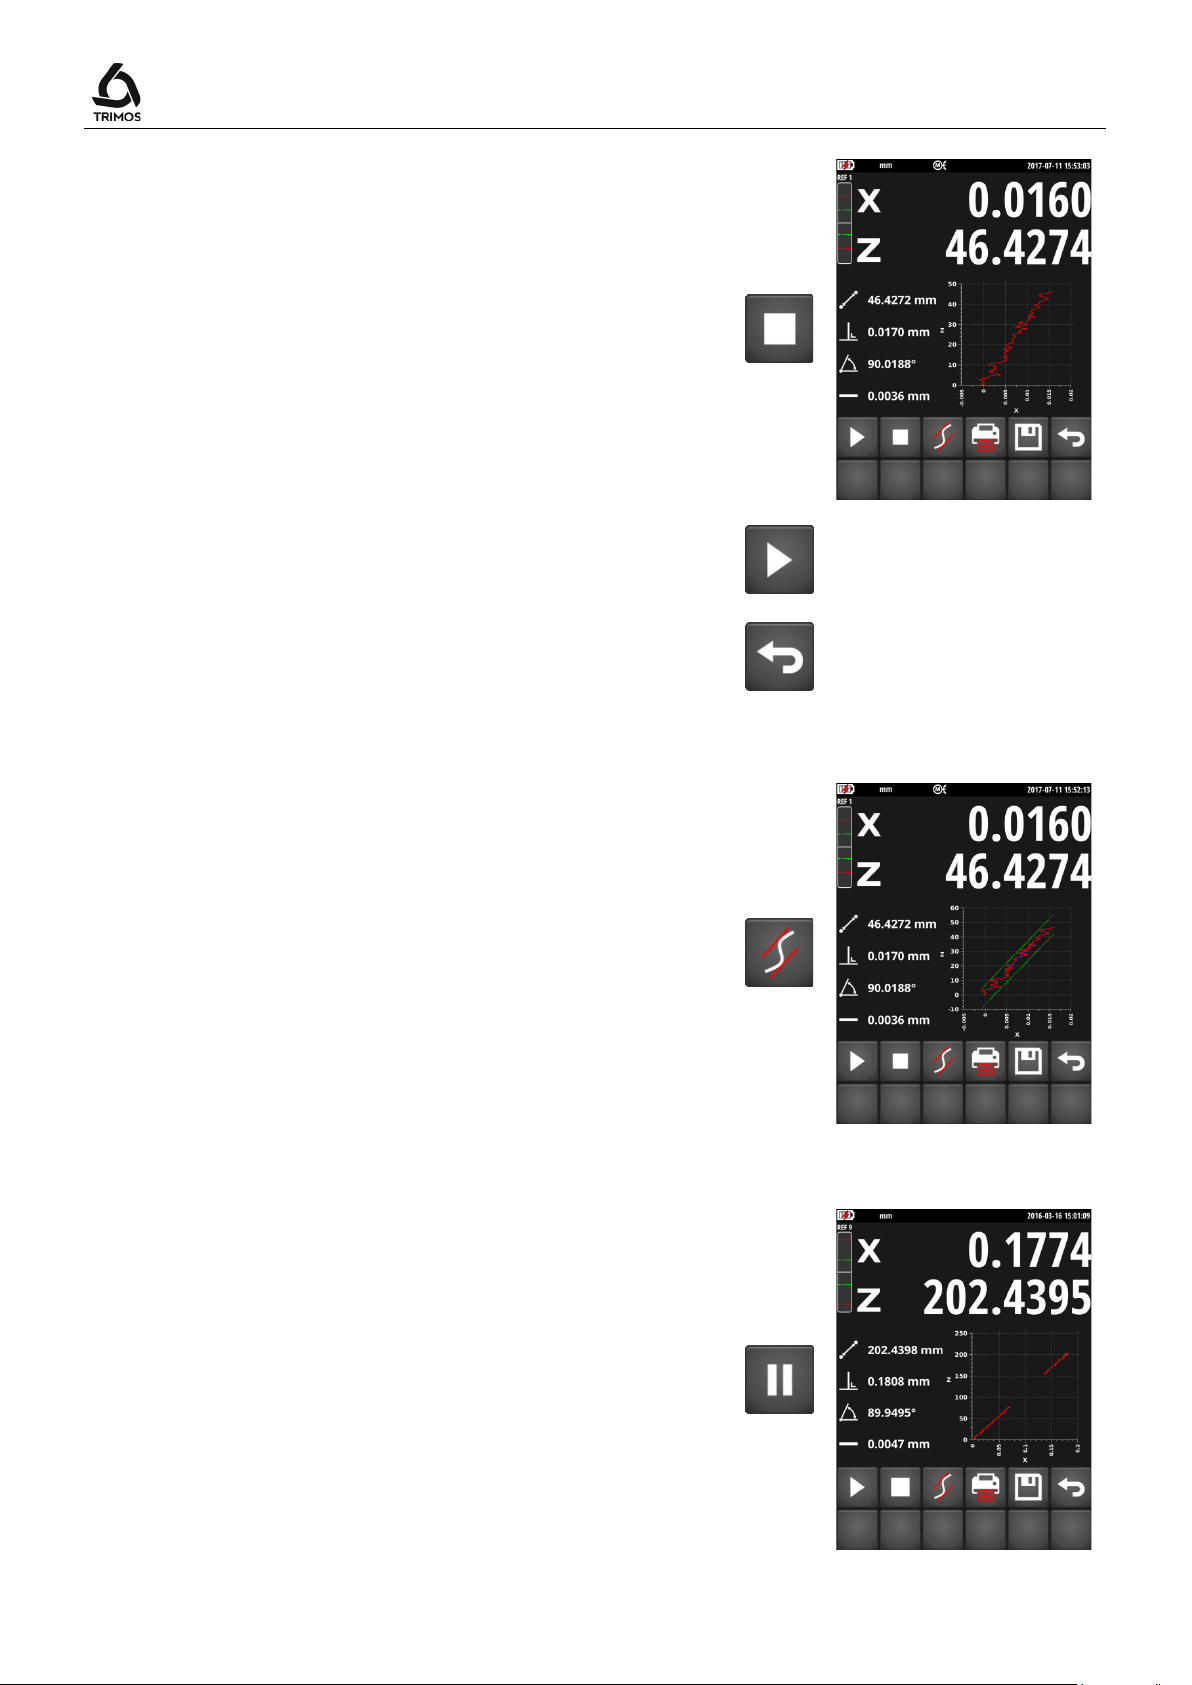
7. When displacement ends, press on the
display freezes and shows the perpendicularity (X) on
the first line of the display and the distance (Z) on the
second line.
Note:
In motorised mode, the carriage will stop moving as
soon as the
To perform another perpendicularity measurement, go
back to point 5.
To exit the perpendicularity measurement, press Exit.
key will be pressed.
key. The
8.2.1 Graphical Display of the Limit Values
The function shown alongside displays the rectitude
(green lines) and inclination (blue line) limits.
8.2.2 Pause Function
If the side to be measured has obstacles or cannot be
measured in a single pass, it is possible to temporarily
interrupt the measurement. To do this press the
button. The probe can then be moved to the point at
which the measurement must be taken again. To restart
the measurement, again press the Pause button.
Note:
While moving the probe in "Pause" mode, ensure that the
instrument and the part are completely immobile.
750 50 0042 03 42
Page 45
V7 / V9
Serial printing and PC
12.
.perp
.png
>2 s
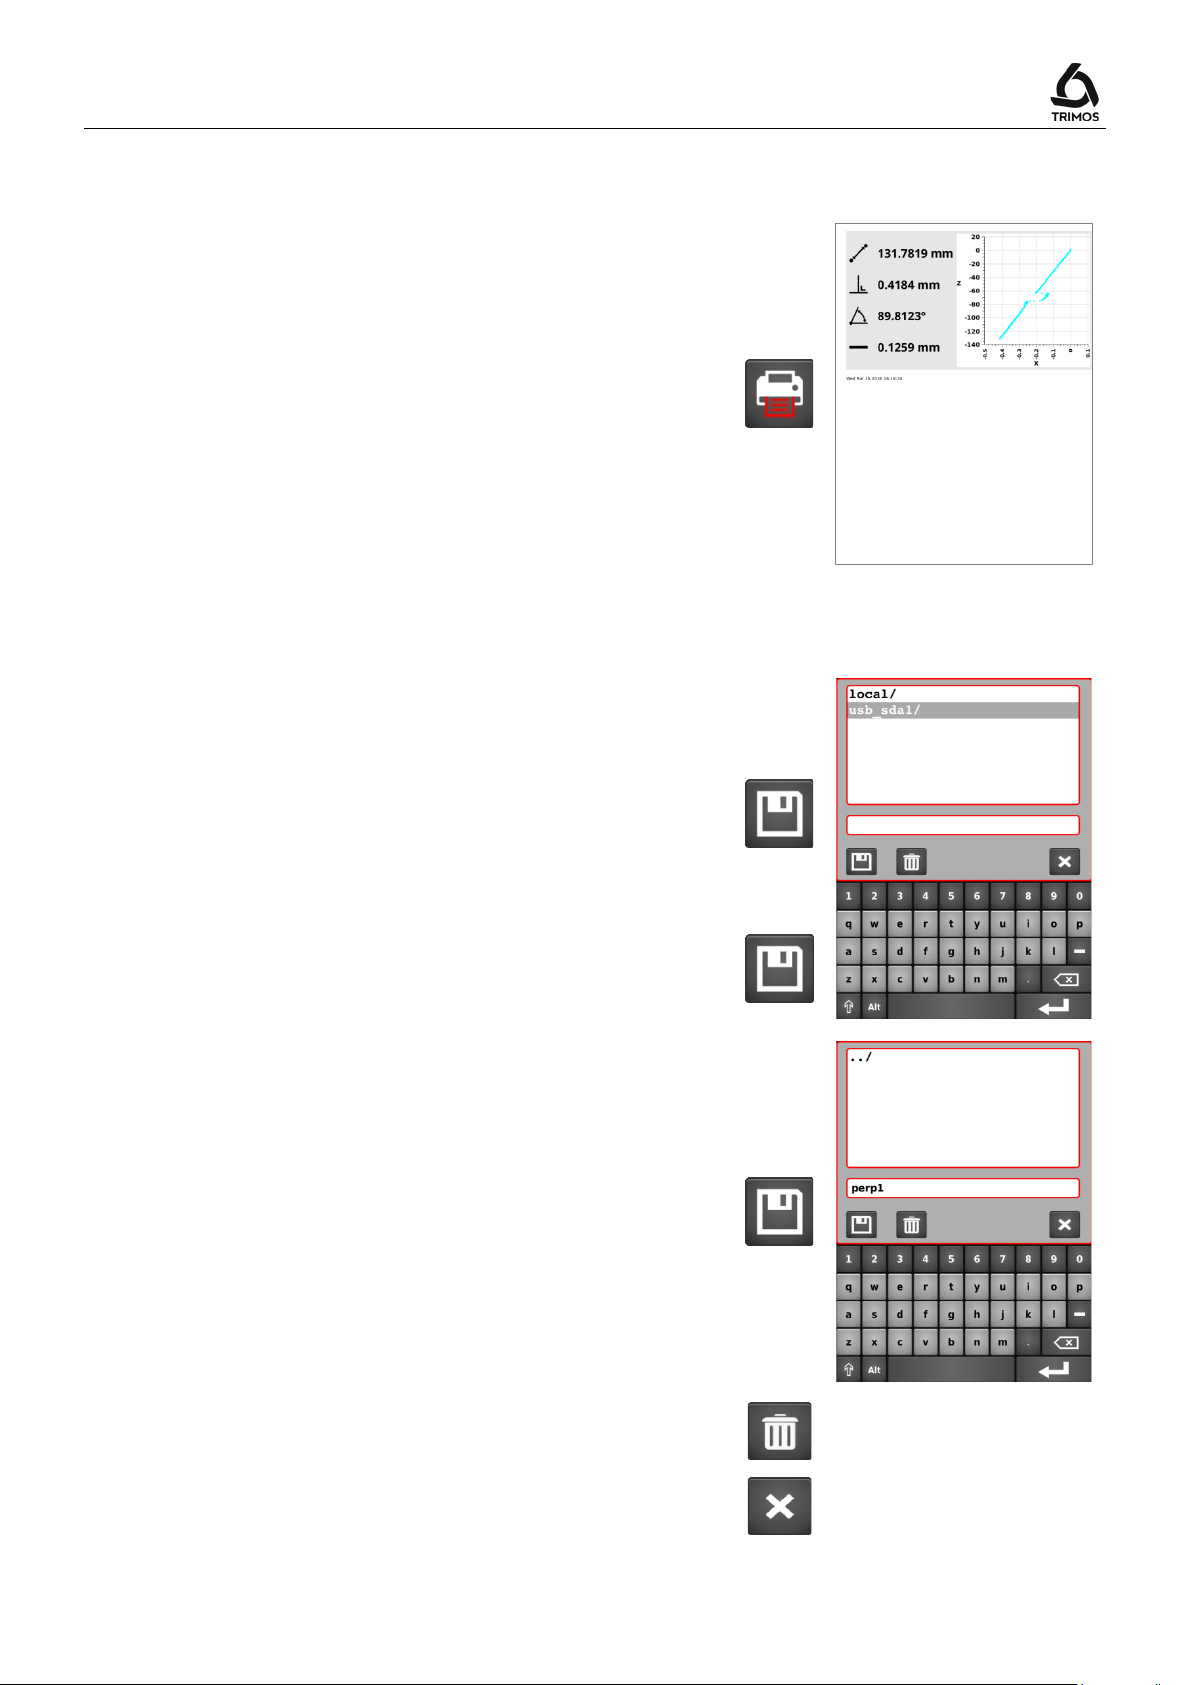
8.2.3 Printing the Perpendicularity Curve
When serial and PC printing is enabled, the X and Z
values are sent simultaneously via the USB and RS232
ports each time the Print key is pressed. When automatic
transfer of data is enabled, X and Z values are sent in
series throughout the measurement.
USB printer
When the USB printer is selected, the perpendicularity
curve can be printed on a USB printer by pressing the
Print button.
For more details on data transfer configuration, refer to §
8.2.4 Saving the perpendicularity curve
The perpendicularity file can be saved in 2 ways:
1. Save the measured points as a file with extension
. This file can be easily edited with an Excel
spreadsheet. The values are separated by a semicolon
";":
=> Simple press on the save key.
2. Saving the perpendicularity curve as a
=> Long press the save key.
Insert a USB stick into one of the ports on the display.
Now select the directory where the perpendicularity file
must be stored and enter a file name.
Save with the following key.
Note:
If a file with the same name already exists, it will be
overwritten.
file:
To delete a file, use the key alongside.
To exit without saving, press the Cancel key.
750 50 0042 03 43
Page 46
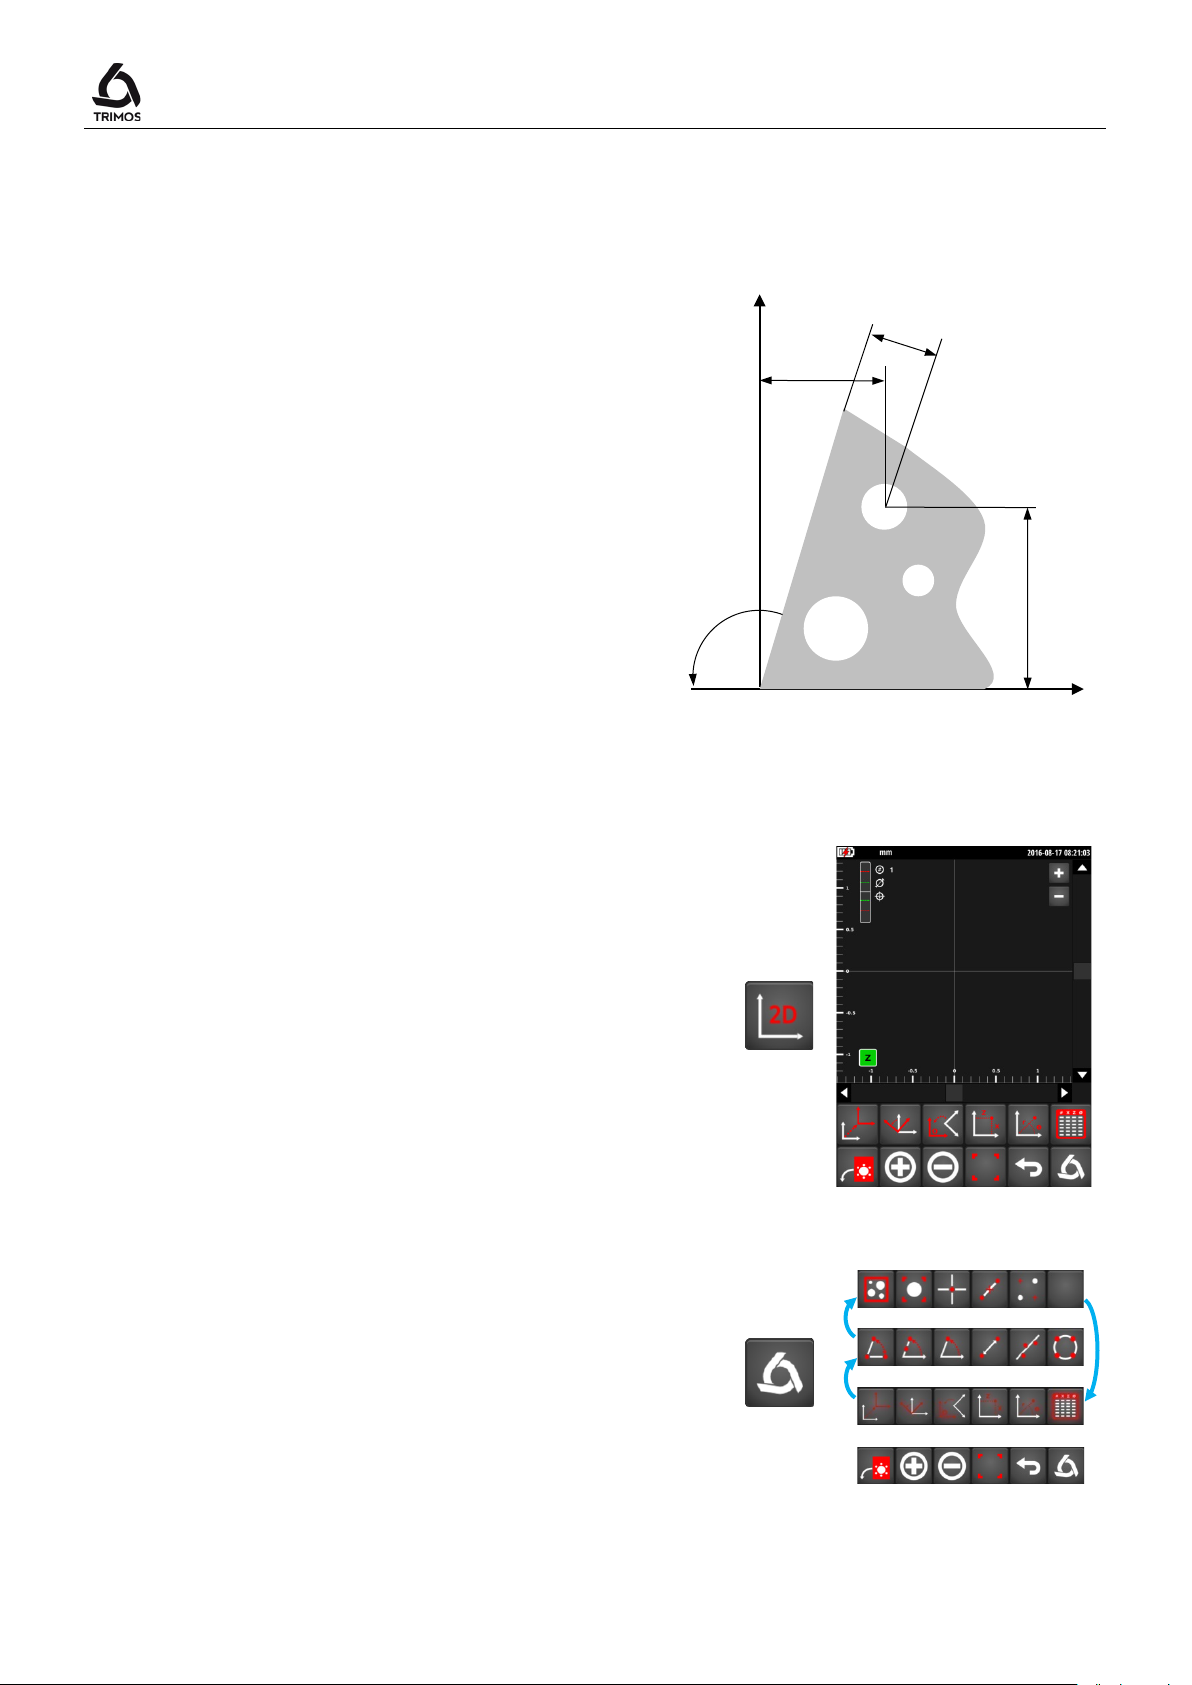
This function offers 2D measurements of bores or
considered for calculations.
Logo
X
Z
Xm
Xc
Zc=Zm
α
9. 2-COORDINATE MEASUREMENTS (2D)
shafts placed on one surface. The position is
determined in the drawing of the measured parts
based on a Cartesian or Polar reference system
along with their diameters.
Between the measurements along the Z-axis and
those along the X-axis, the part is tilted in an anticlockwise direction, seen from the instrument. The
angle of inclination is between 45° and 135°.
In the diagram alongside, Zm and Xm respectively
represent the values measured before and after the
tilting. Zc and Xc represent the values returned in a
90° Cartesian system. These are the values
User's Manual
9.1 Getting Started
To begin a 2-coordinate measurement, press the 2D
button from the main menu. The following screen is
displayed.
Note:
The bores should already have been numbered, the
inclination angle determined and the required reference
positions acquired.
The lower functions menu line is the main line. It is static.
The upper function line is scrolling. A press on the
key scrolls the other function lines.
750 50 0042 03 44
Page 47
V7 / V9
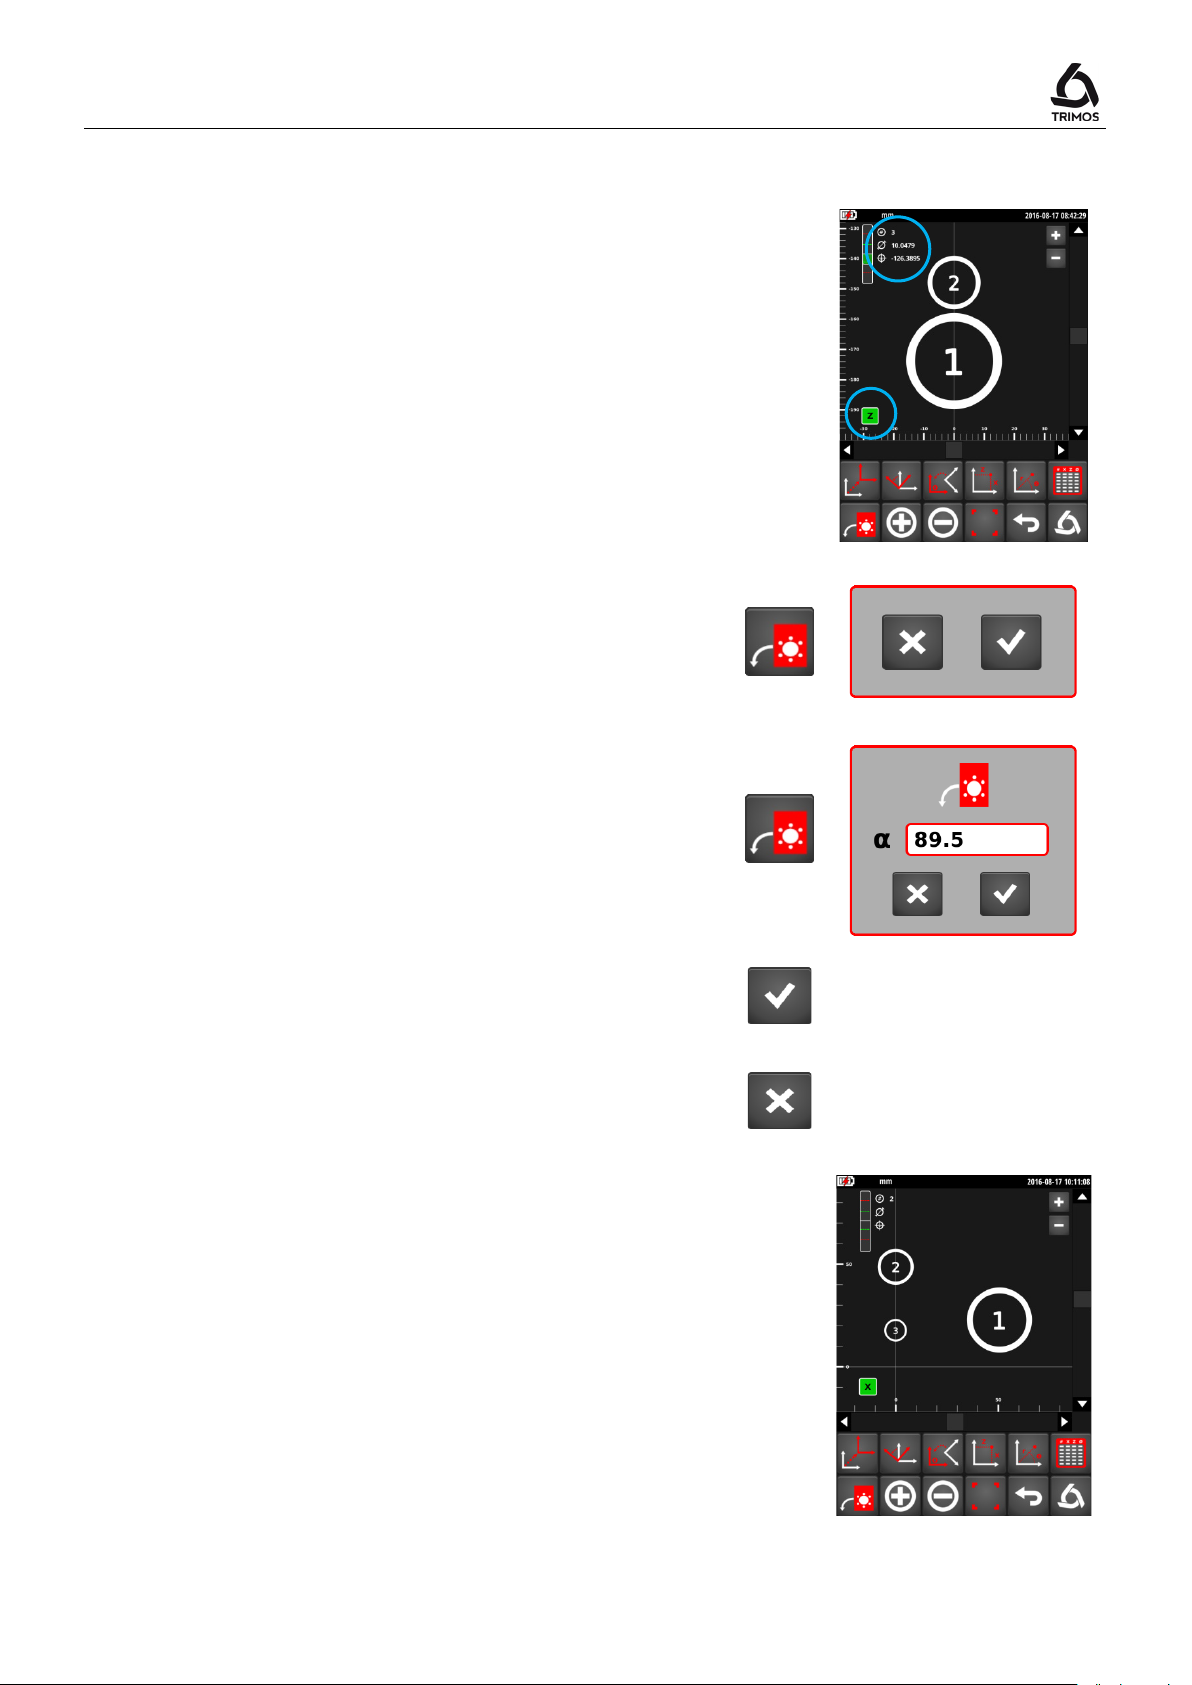
its diameter and centreline are displayed on the top left of
, enter the bores in the same
9.2 Acquisition of Points
Acquisition along Z-axis
Directly after starting-up, measure the bores in the order
of numbering according to the diameter and centreline
measurement procedure.
All the bores are displayed along the Z-axis. Its symbol is
displayed in green to the bottom left of the axes system.
During measurement, the number of the bore as well as
the display.
Tilting the part at 90°
After measurements along the Z-axis are completed,
press on the tilting key. A short press on this key implies a
90° tilt.
Tilting the part at an angle other than 90°
When the desired angle of tilting is other than 90°, press
the same key for 2 seconds. It is possible to assign a
value between 45° and 135°.
Validate the inclination with the OK key.
To cancel the inclination, press the Cancel key.
Acquisition along X-axis
When the part has been tilted
order as was done along the Z-axis. The position of the
bores on the screen is updated after each measurement.
During acquisition, the X symbol is displayed in green to
the bottom left of the axes system.
>2 s
OK
Cancel
750 50 0042 03 45
Page 48
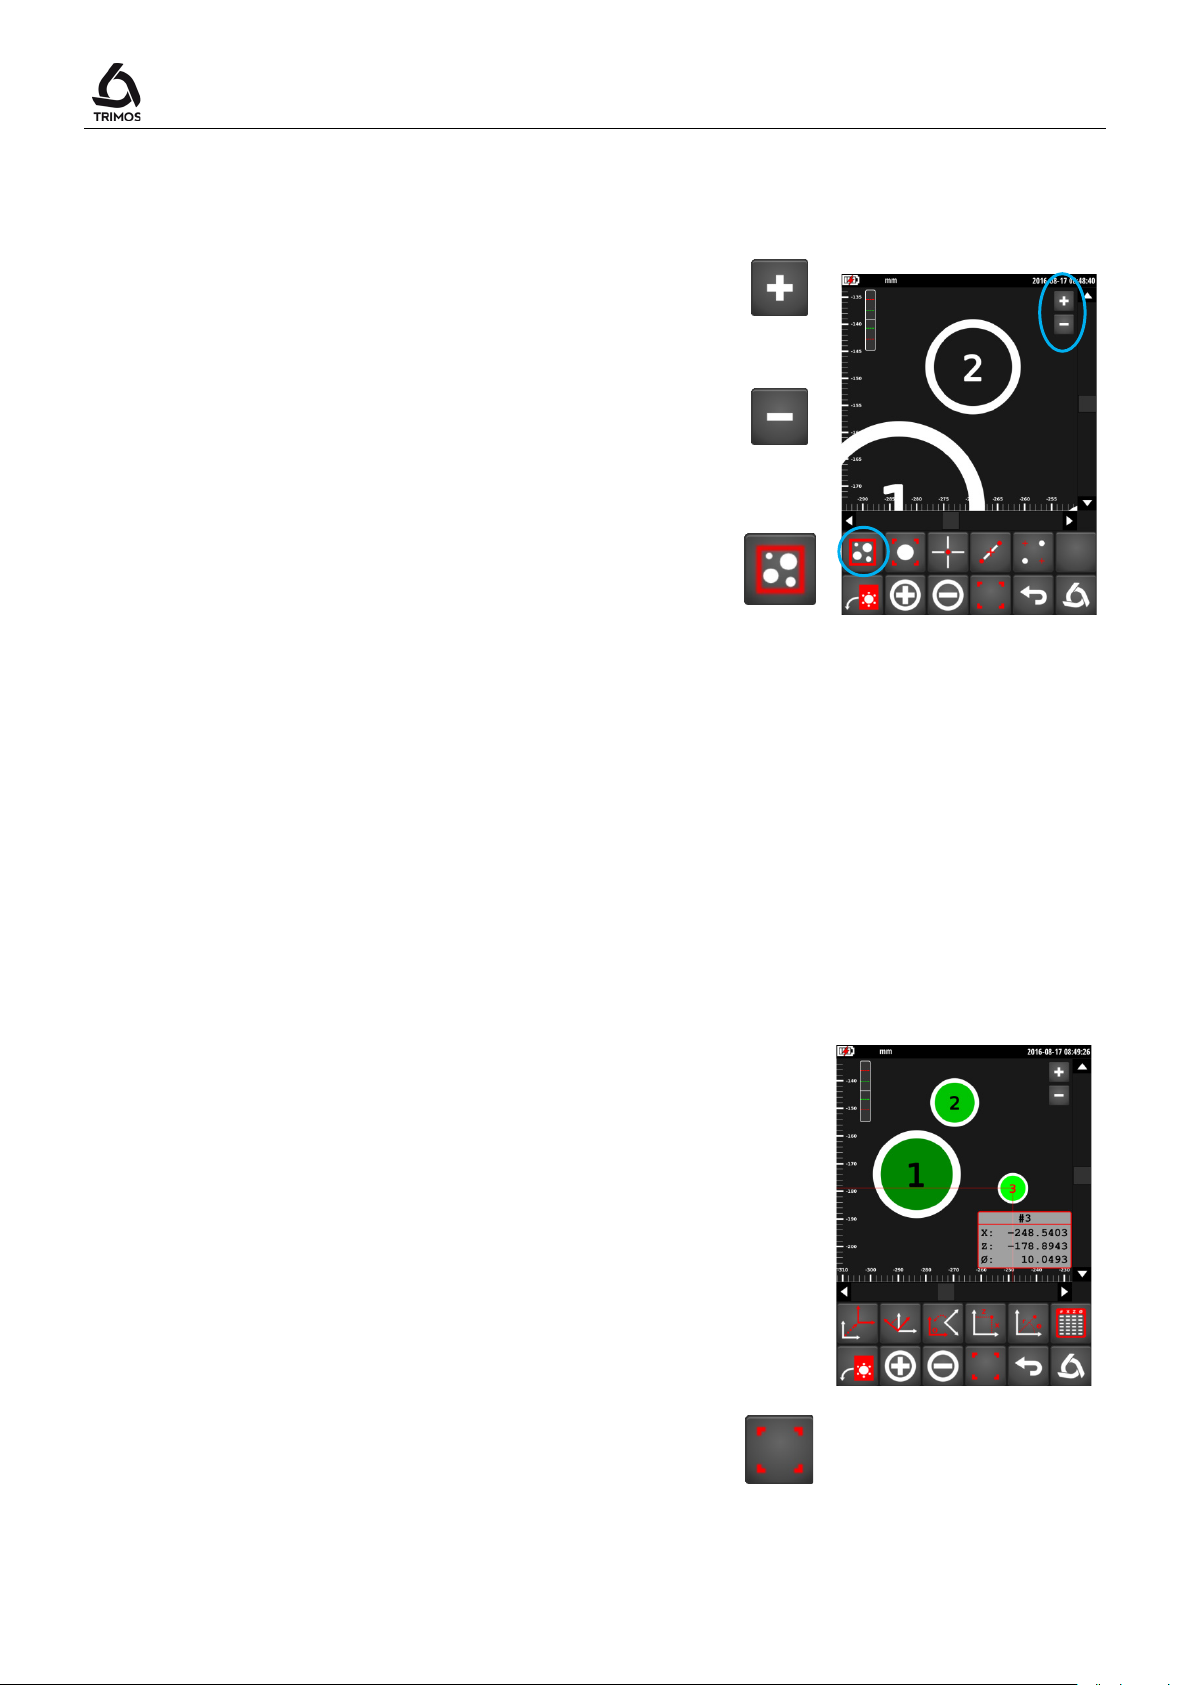
touchscreen. The selected bores are marked in green. The
green. Coordinates and diameter of the last selected bore
9.3 Display Management
9.3.1 Zoom
User's Manual
The buttons located on the top right hand side of the axis
system are used for zooming in and zooming out.
The following function is used to redefine all the bores on
the screen.
9.3.2 Displacement Within the Plane
There are 2 possibilities of moving within the plane:
1. With the help of scrollbars located at the bottom and
to the right of the axes system.
2. By sliding one's finger on the screen in the desired
direction.
Zoom
in
Zoom
out
9.3.3 Selection of Bores
Each bore can be selected by pressing on the
first selected bore is displayed in the darkest green; in
contrast, the last selected bore is displayed in the lightest
are displayed along with their projections on the 2 axes.
To deselect all the bores, press the key shown alongside:
750 50 0042 03 46
Page 49
V7 / V9
O
x
O
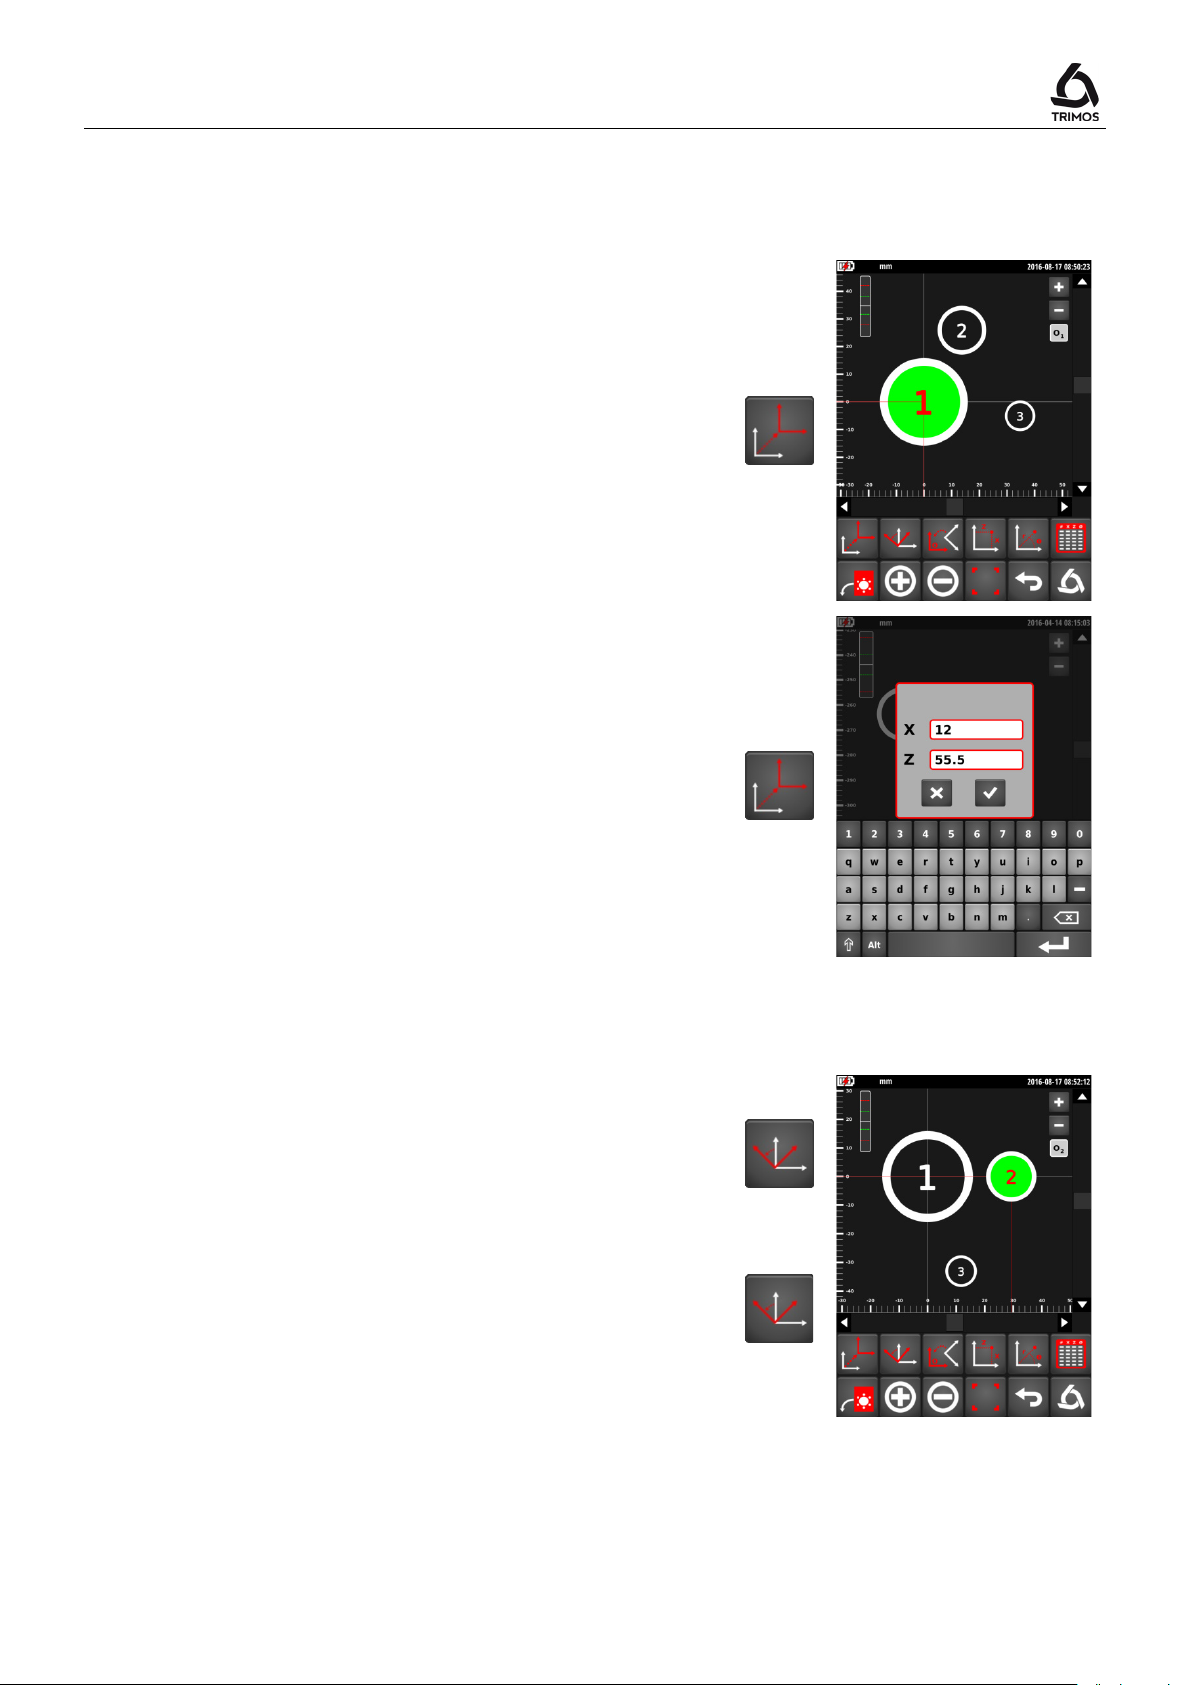
9.4 Transformations of the Axis System
9.4.1 Translation of the System of Coordinates
Translation of the origin to the centre of a bore
1. Select the bore
2. Press the translation key
Note:
Each change in the axis system is marked by a
located under the zoom buttons. The index number of the
represents the number of transformations made.
symbol
Translation of the origin to the X and Z coordinates
1. Deselect all the bores
2. Press the translation key
3. Enter coordinates of the new axis system
4. Confirm with the OK key
9.4.2 Alignment / Rotation of the System of Coordinates
Alignment of X-axis on 1 bore centre
1. Select the bore
2. Press the translation key
Alignment of Z-axis on 1 bore centre
1. Select the bore
2. Press the translation key for 2 seconds
>2 s
750 50 0042 03 47
Page 50
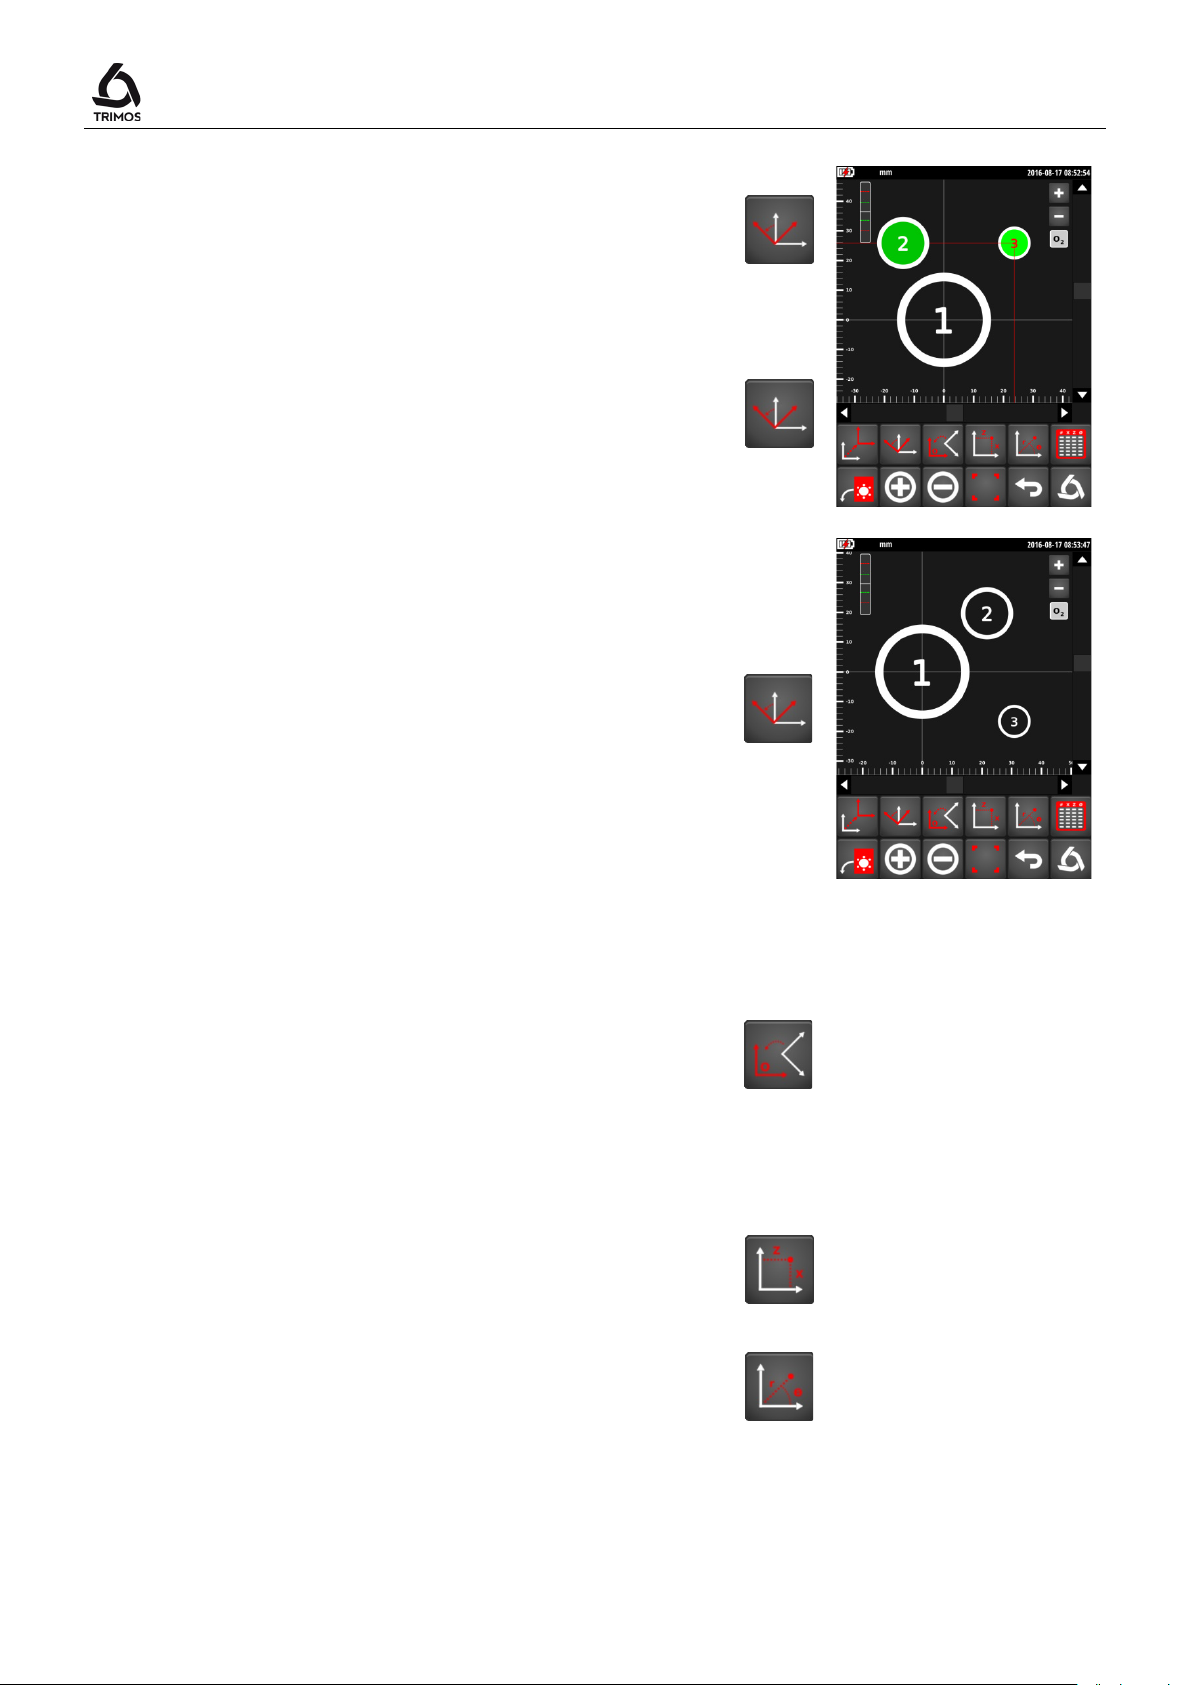
Alignment of X-axis on 2 bore centres
1. Select the 2 bores with which the X-axis should be
aligned
2. Press the rotation key
Alignment of Z-axis on 2 bore centres
1. Select the 2 bores with which the X-axis should be
aligned
2. Press the rotation key for 2 seconds
Rotation of plane along a given angle
1. Deselect all the bores
2. Press the rotation key
3. Enter the desired rotation angle
4. Confirm with the OK key
User's Manual
>2 s
9.4.3 Return to the Original System
To go back from a transformation, press the key shown
alongside:
To return to the original system, press the same key for 2
seconds.
9.4.4 Cartesian or Polar Coordinate System
Coordinates of points can be displayed based on a
Cartesian (default system) or polar axis system. To
change from one mode to another, press the
corresponding key:
Cartesian
Polar
750 50 0042 03 48
Page 51
V7 / V9
9.5 Measurements and Analyses
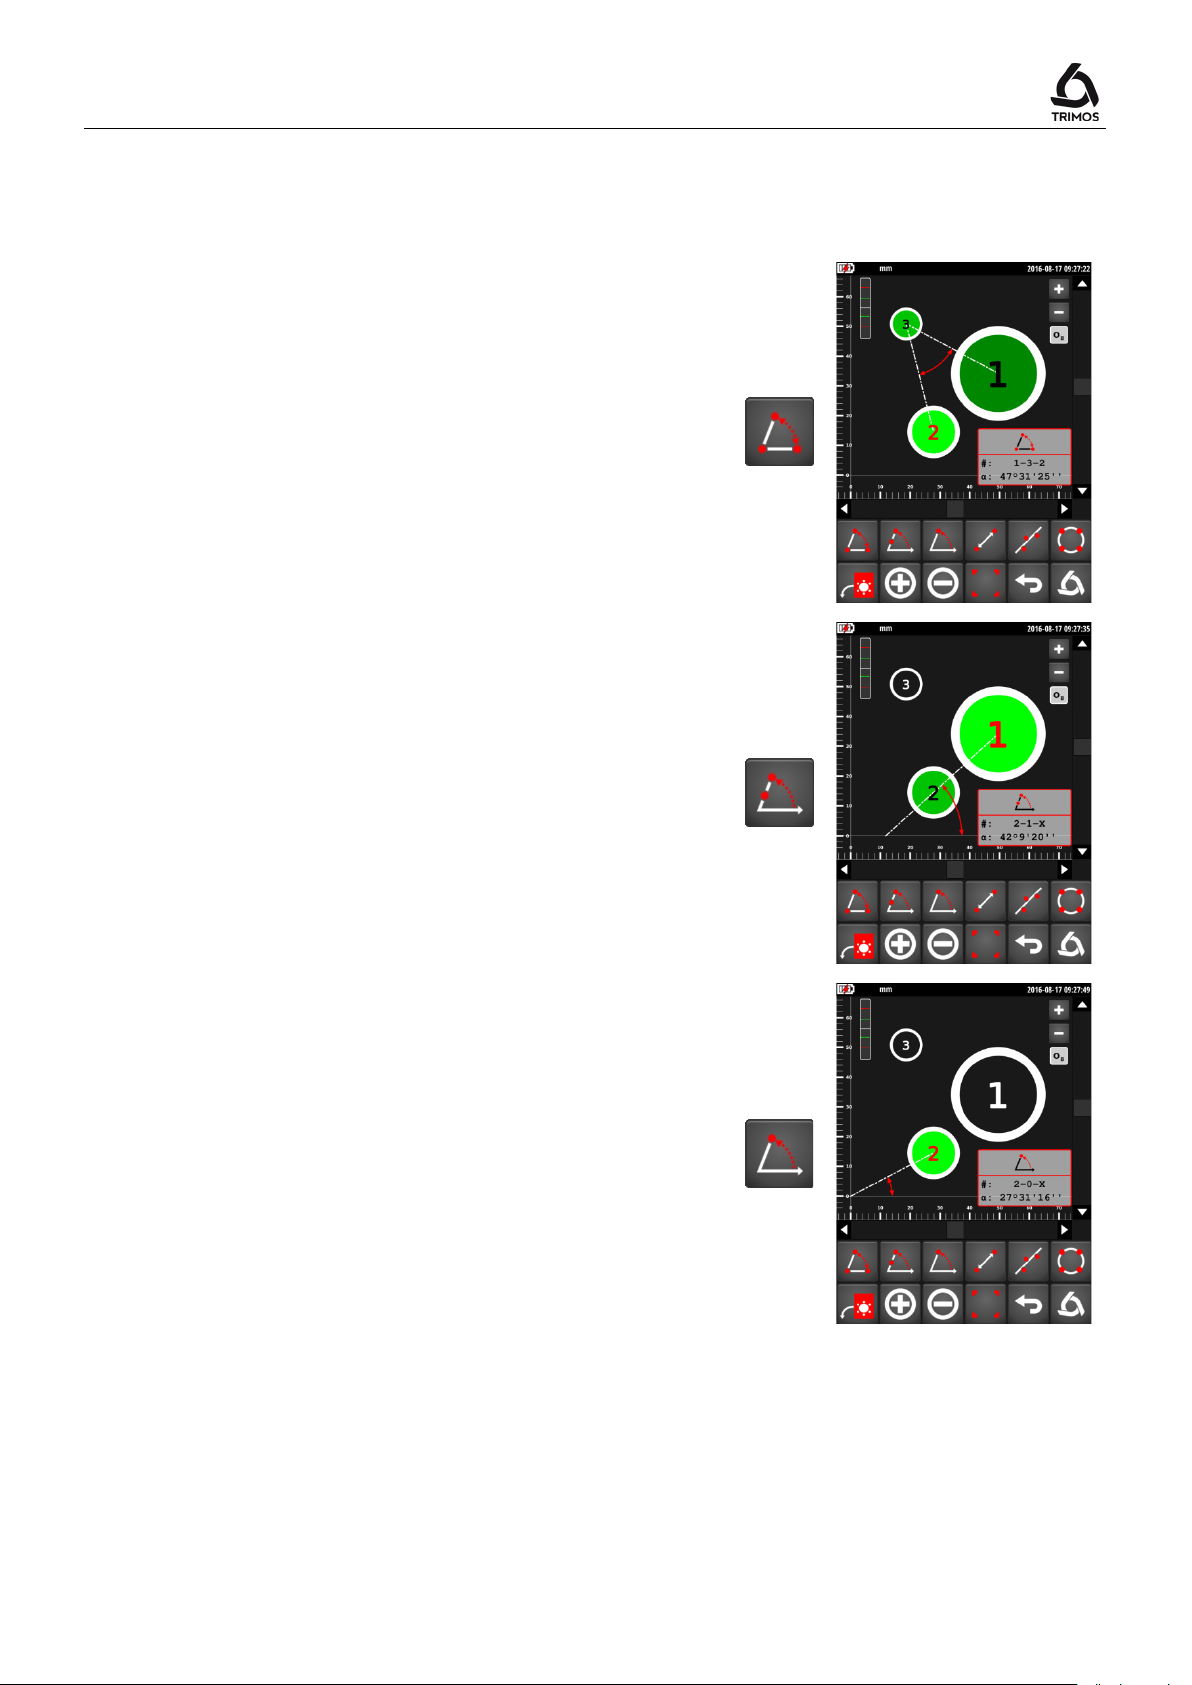
9.5.1 Measurements of Angles
Angle between 3 points
1. Select the 3 bores (in the order desired!)
2. Press the 3-point angle key
3. The angle is displayed on the screen
#: No. of points
L: Angle
Angle between 2 points and the X-axis
1. Select 2 bores (in the order desired!)
2. Press the 2-point angle key
3. The angle is displayed on the screen
#: No. of points
L: Angle
Angle between 1 point, the origin and the X-axis
1. Select a bore
2. Press the 1-point angle key
3. The angle is displayed on the screen
#: No. of points
L: Angle
Note:
For each function above, the explementary angle can be
displayed by pressing on the correspondent function key
for 2 seconds.
750 50 0042 03 49
> 2 s
Page 52
α
>2 s
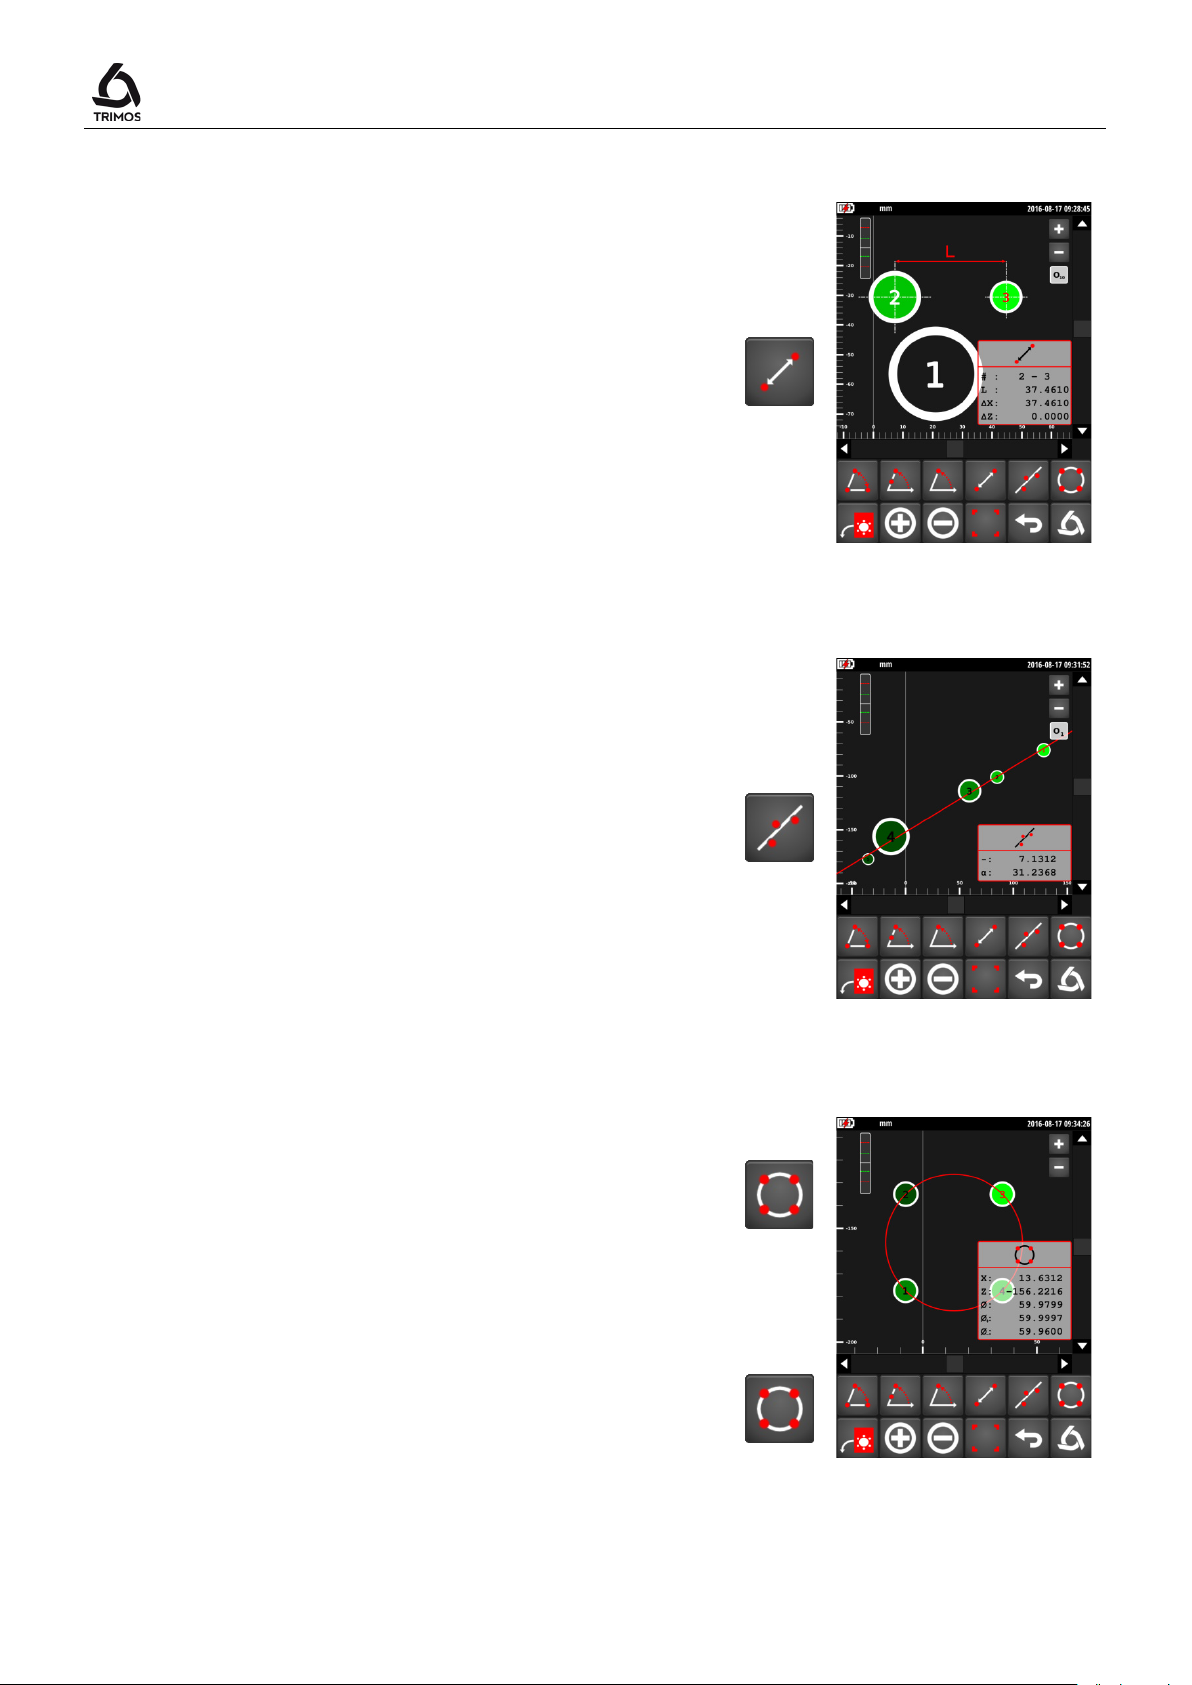
9.5.2 Distance Between 2 Points
1. Select 2 bores
2. Press the distance measurement key
3. Distance between the two points is displayed on the
screen
#: No. of points
L: Straight line distance
∆X: Distance projected on X
∆Z: Distance projected on Z
9.5.3 Alignment of Points
User's Manual
1. Select the points whose alignment must be measured
2. Press the alignment key
3. Alignment of the points is displayed:
−: Rectitude
: Regression line angle
9.5.4 Regression Circle (PCD)
1. Select points of the regression circle
2. Press the PCD key
3. The PCD is displayed:
X: X coordinate of the centre
Z: Z coordinate of the centre
Ø: Diameter of the regression circle
Ø+ : Maximum diameter
Ø- : Minimum diameter
By pressing on the same button during more than 2
seconds, a construction point is created at the centre of
the PCD.
750 50 0042 03 50
Page 53
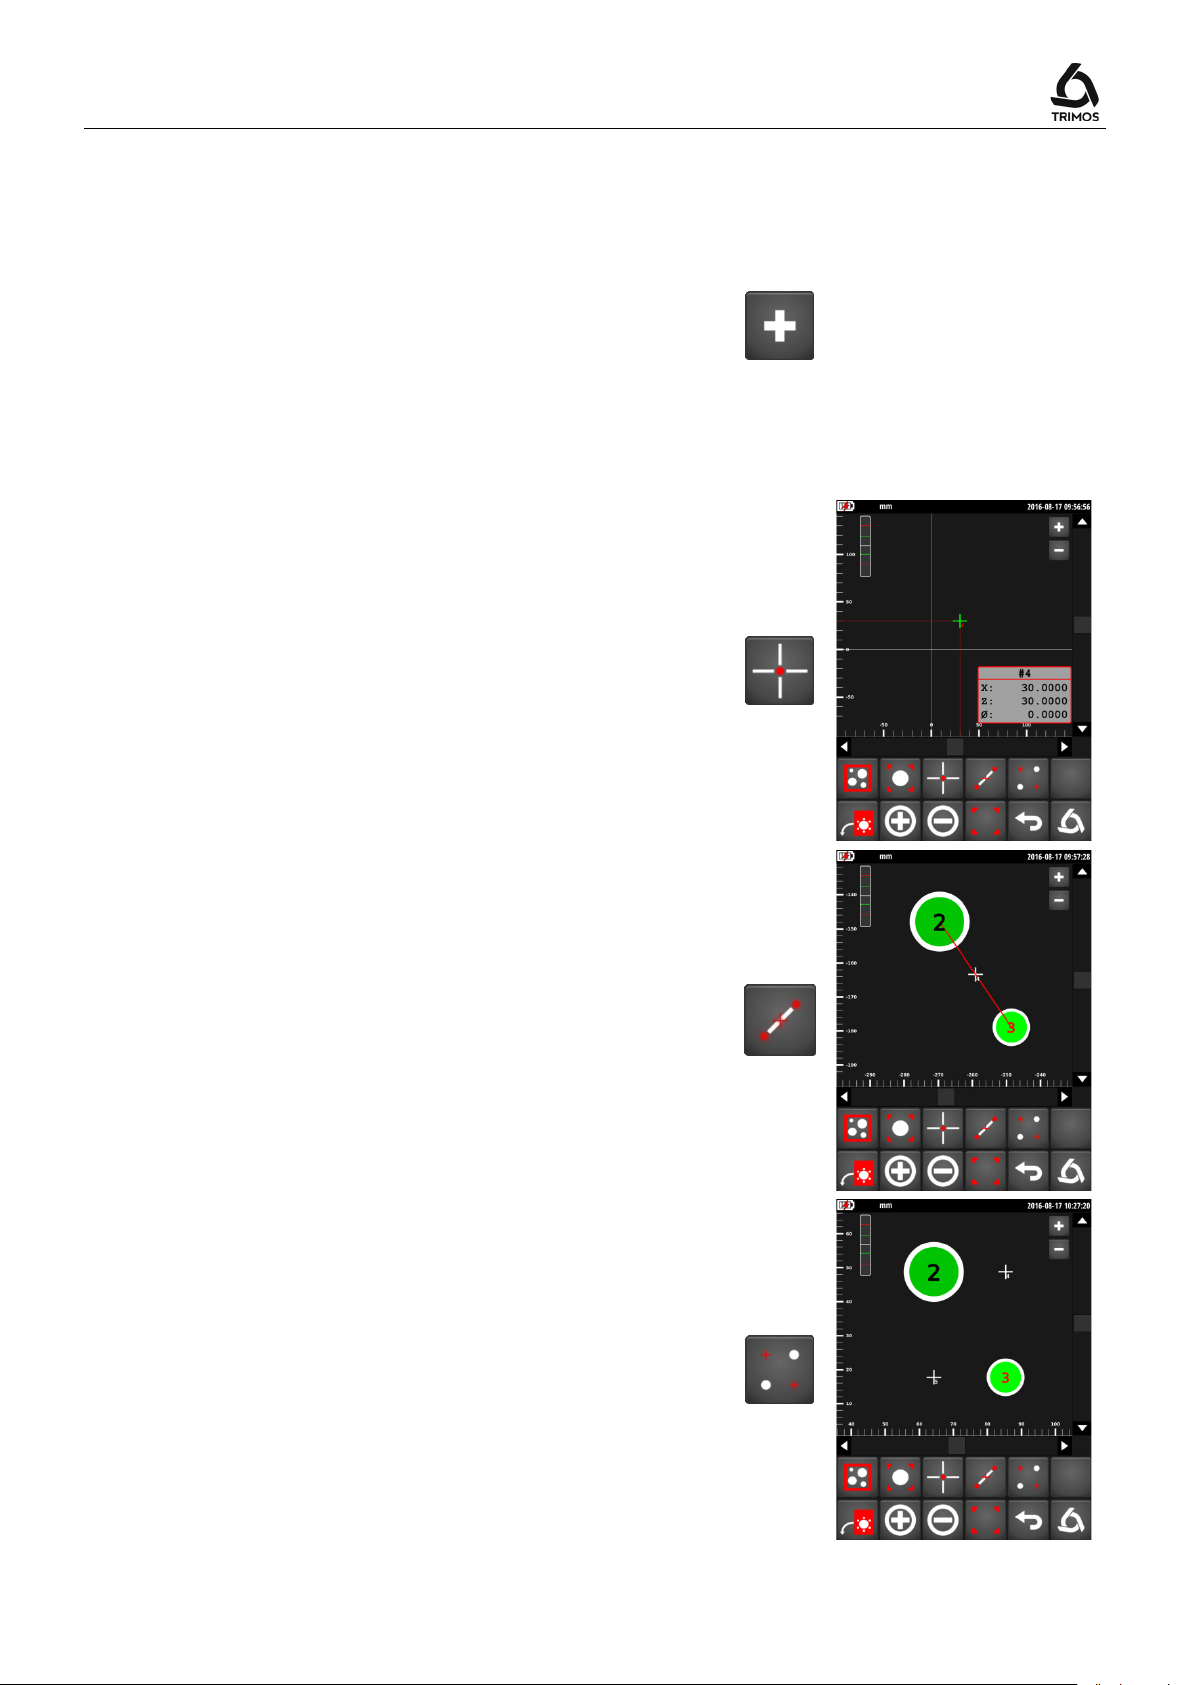
V7 / V9
New points are acquired in the same manner as described
in § 9.2.
If the point does not contain diameter, it is represented by
9.6 Editing, Adding and Deleting Points
9.6.1 Adding a Measured Point
To add one or more points press the key shown
alongside. The Z symbol is displayed in green to the
bottom left of the axes system.
9.6.2 Adding a Construction Point
Single construction point
It is possible to add a construction point through its
coordinates. It can also be assigned a number and a
diameter. To do this, press the key shown alongside and
enter the requested numeric values.
a cross, else as a standard bore.
Median construction point
To add a median construction point, select the 2 bores
between which this point must be located and press the
key shown alongside.
Orthogonal projection points
This function helps to create 2 orthogonal projection
points in relation to 2 selected bores.
To do this, select 2 bores and press the key shown
alongside:
750 50 0042 03 51
Page 54
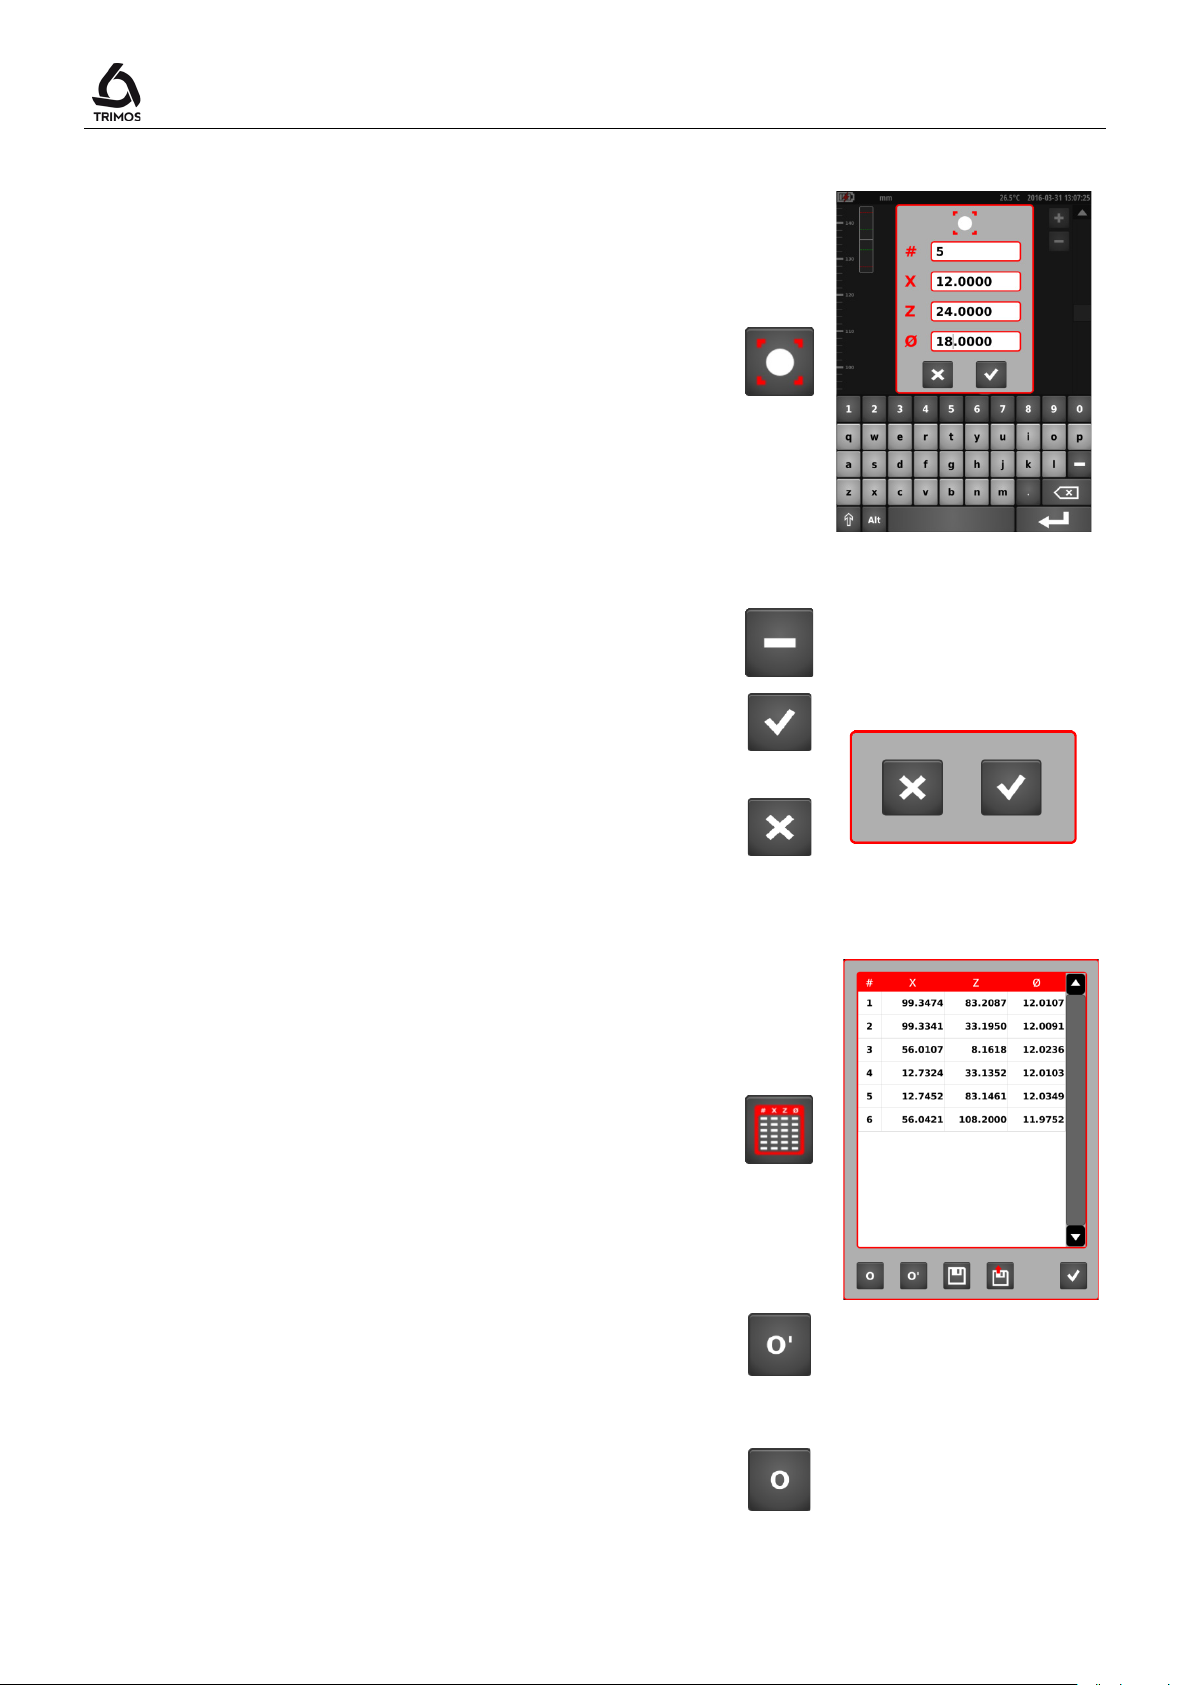
Coordinates of the bores are displayed by default based
9.6.3 Editing a Point
The function shown alongside helps in editing the last
selected point, i.e. it can modify its no., its coordinates
and its diameter.
9.6.4 Deleting a Point
User's Manual
To delete one or more points, select the point(s) to be
deleted and press the key shown alongside.
Validate with the OK key or cancel with the Cancel key.
9.6.5 Table of Points
Displaying the points
Coordinates of the points can be displayed. To do this,
press the key shown alongside.
OK
Cancel
Displaying points before and after transformation
on the last transformation of the system of axes. These
points can also be displayed based on the original
system of axes by pressing the O key. To return to the
last reference, press the O' key.
750 50 0042 03 52
Current
system
Original
system
Page 55
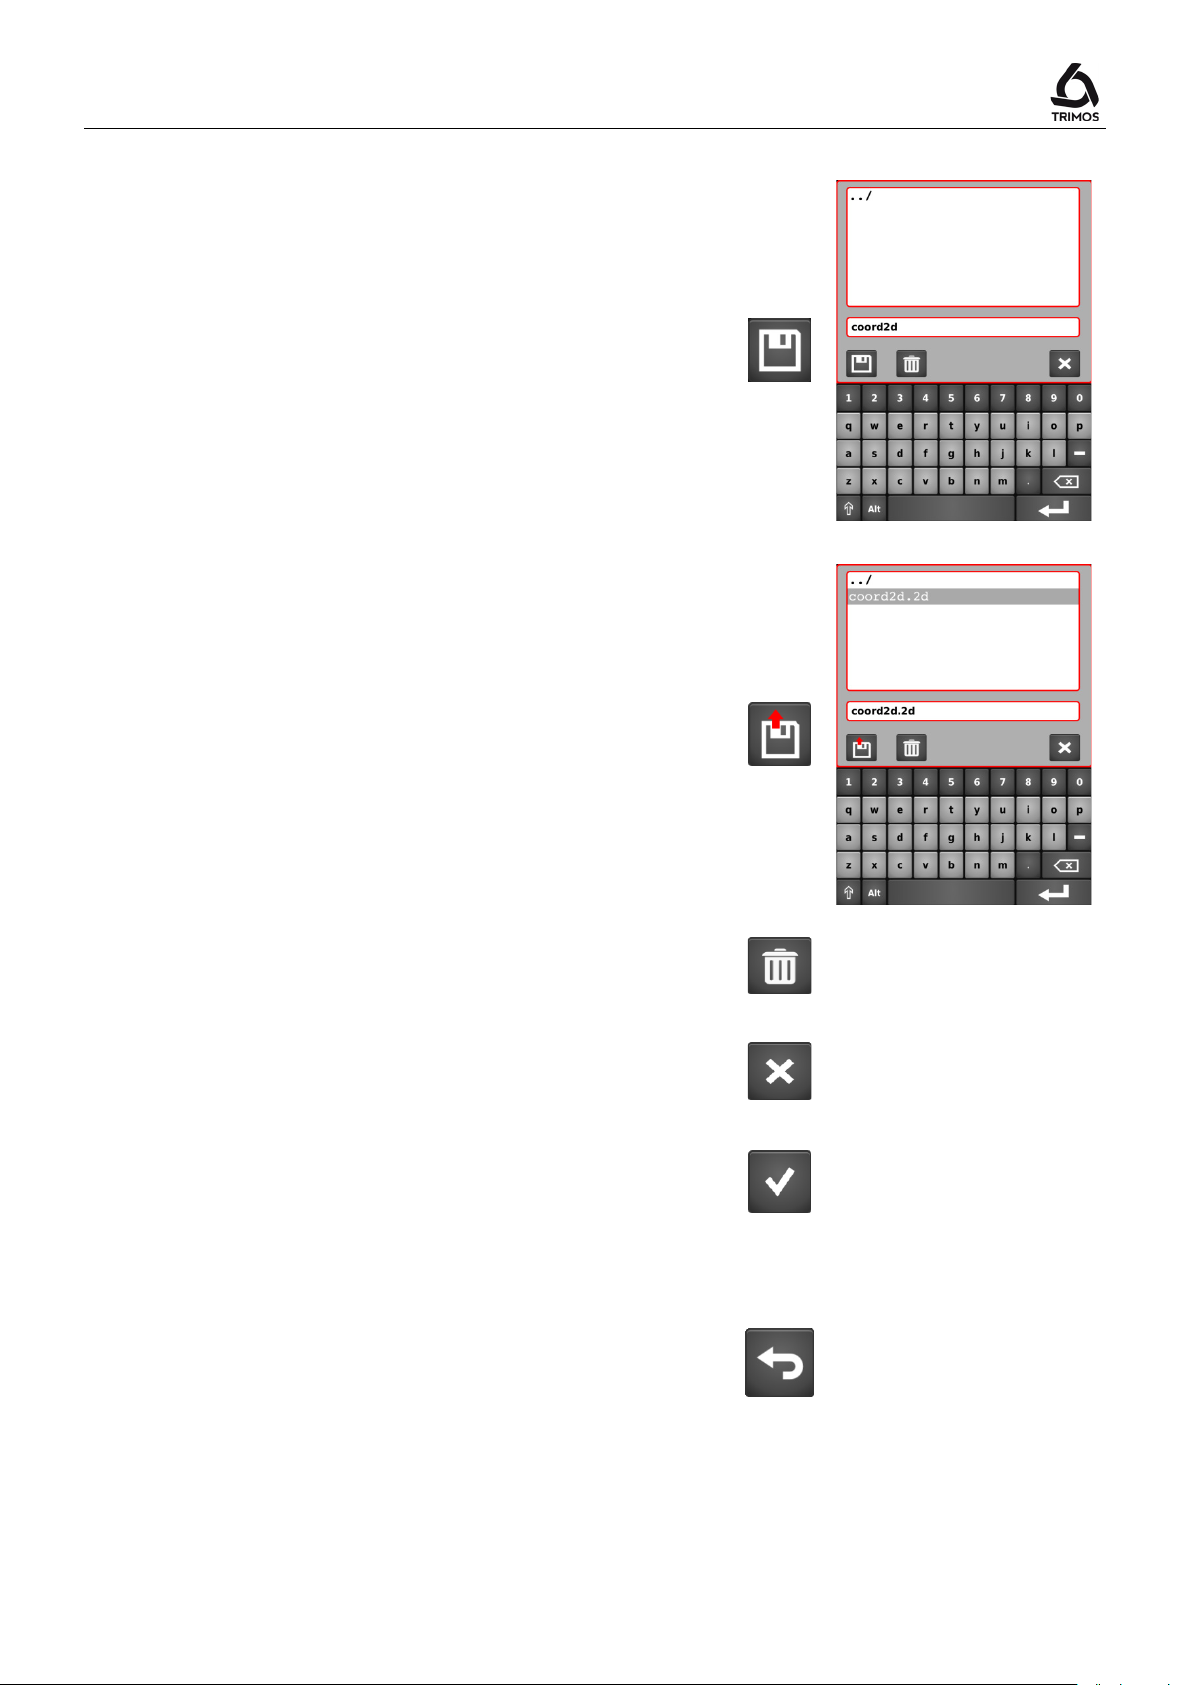
V7 / V9
Backing up the data
.2d
overwritten.
Coordinates of the bores can be backed up in a USB key.
To do this, press the symbol shown alongside and
connect the USB key to one of the ports of the display.
Now select the directory where the perpendicularity file
must be stored and enter a file name. Save with the same
key.
Note:
The data is backed up as a file with
are separated by a semi-colon ";". This file can be easily
edited with an Excel type spreadsheet.
If a file with the same name already exists, it will be
extension. Values
Loading points from a file
It is possible to load a 2D coordinate file from the USB
key. Select a file and press the load key.Function key.
The current values in the plane will be replaced by those
of the selected file.
To delete a file, use the key alongside.
To exit the backup/load menu, press the Cancel key.
To exit the table of points, press the key shown alongside:
9.7 Quit the 2D mode
To quit the 2D mode, press the following key.
750 50 0042 03 53
Page 56
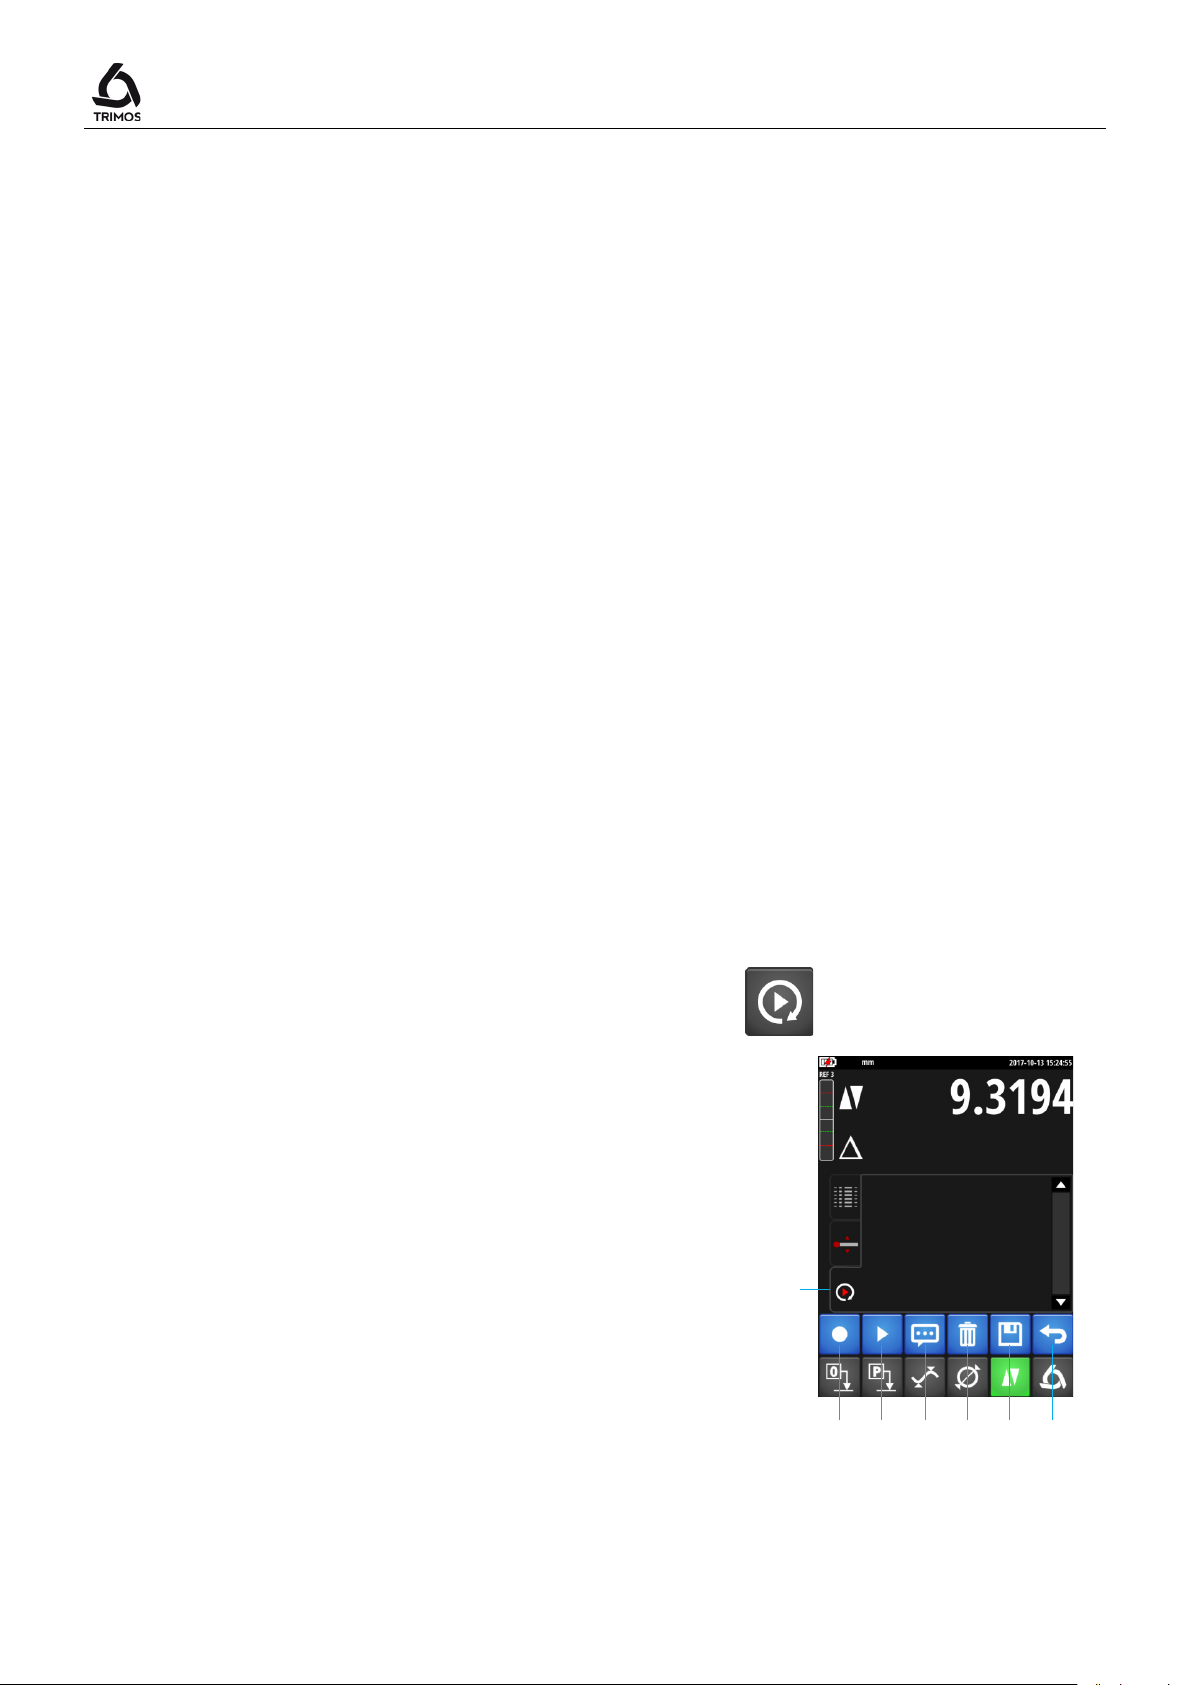
A measurement sequence is a series of programmed
1 2 3
4 5 6
7
10. MEASUREMENT SEQUENCES
actions that allow the measurement of parts in series.
Heights, diameters and centerline distances can be
toleranced. The operating principle is as follows:
Programming
The first part is measured normally (heights, diameters,
centerline distances, reference points, etc ...). All these
actions are stored.
Execution
The following parts of the same series are then measured
in the programmed order. The instrument tells the user
what function to perform.
Batch Management
The results of the measurements of a sequence can be
recorded in a batch. This grouping allows the statistical
analysis of the batch (§ 11).
User's Manual
10.1 Start
The measurement sequence menu opens by pressing the
following symbol:
A drop-down menu with a blue background appears with
the functions specific to the programming mode.
Furthermore, an additional display mode with the steps of
the program (1) is added to the two existing modes
(Buffer and graphic help):
The functions available are:
1.Program step list
2. Starting the teach mode
3. Replay of a measurement sequence
4. Add a comment
5. Delete a step from the program
6. Save a program
7. Exit programming mode
750 50 0042 03 54
Page 57
V7 / V9
1 2 3
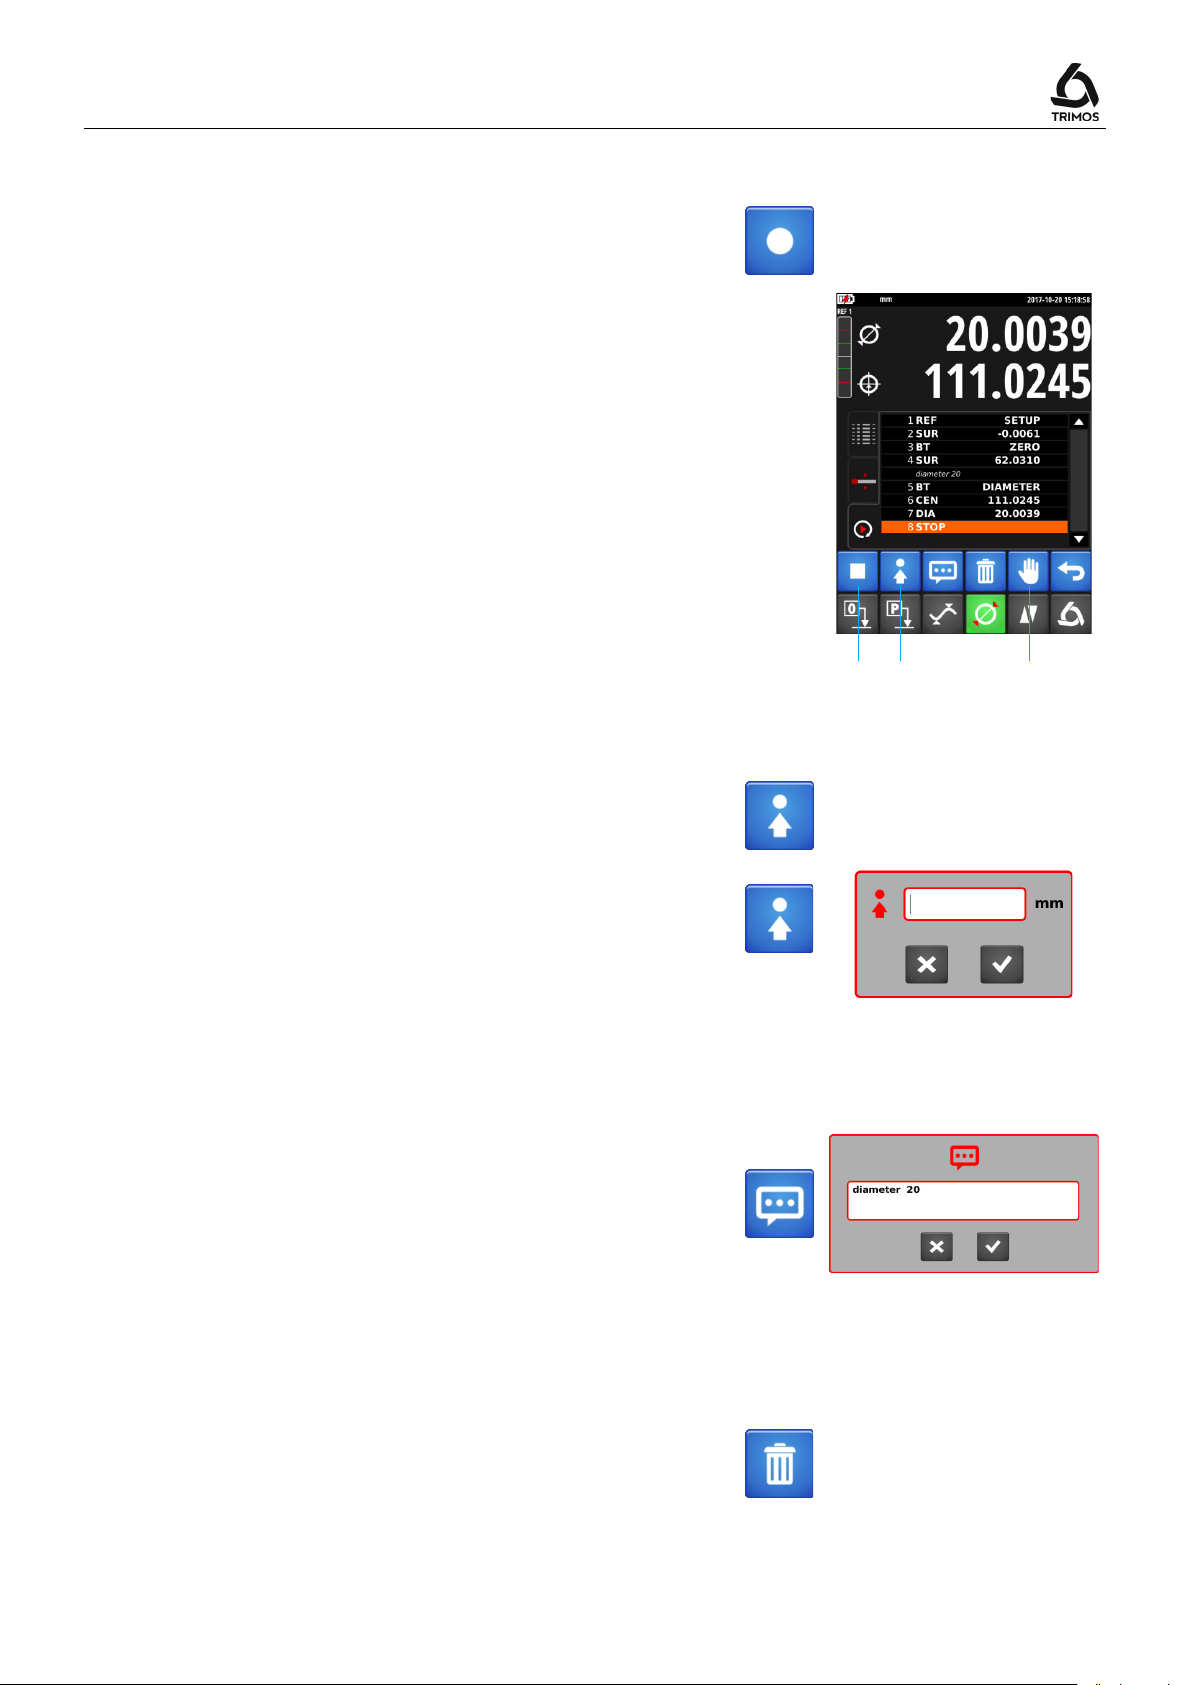
10.2 Programming a Sequence
Programming a new measurement sequence starts with
pressing the next button.
Then just make the measurements exactly as if the
instrument was used normally. Each action is stored and
displayed as a program step.
In programming mode the menu displays new functions:
1. Stop - terminate programming
2. Position - Sends the carriage to a target position
3. Pause - Temporarily stops the program (eg to allow
part positioning)
10.2.1 Moving to a Target Position
This function sets the current position as "target". When
running the program in motorized mode, the instrument
will move to this position.
By pressing the same key for 2 seconds, it is possible to
manually enter the position at which the probe is to be
positioned.
10.2.2 Comments
Each program step can be commented to guide the user
in the measurements to be made.
1. Select a line in the programming buffer before which a
comment is to be inserted.
2. Press the key opposite and enter the comment (up to
50 characters).
3. After confirmation, the comment appears above the
selected line.
10.2.3 Deleting a Step from the Sequence
At any time a program line can be erased. To do this,
select the line to be displayed and press the following
button.
>2 s
750 50 0042 03 55
Page 58
Play
A tolerance can be assigned to each measurement made
described in chapter 7.12.
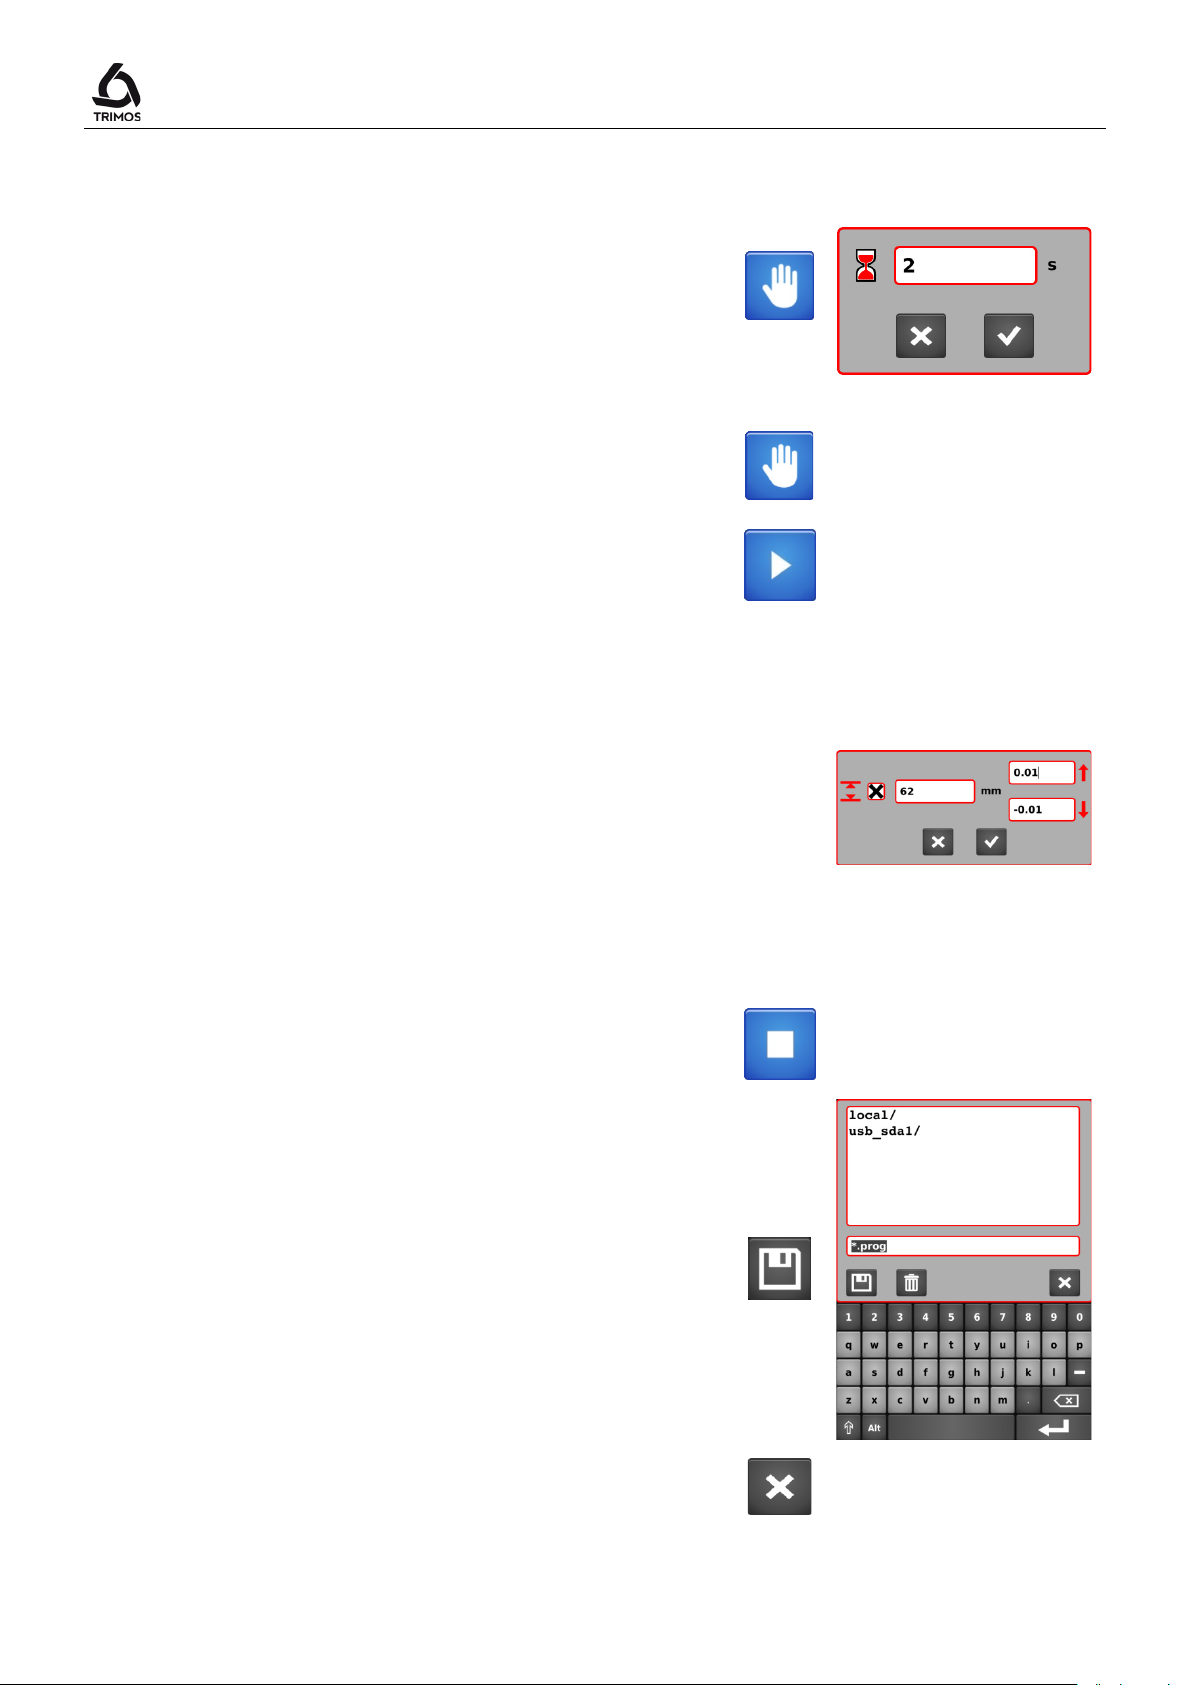
10.2.4 Waiting Time and Hold-Point
Standard waiting time between measurements
When executing a sequence in motorized mode, the
movement pauses between measurements. This waiting
time can be set by pressing the next key for 2 seconds.
The time entered is valid for the entire program as well as
for future programs.
Hold-point
The following function inserts a hold-point in a sequence.
A hold-point allows you to temporarily stop the program
to move the part for example.
To continue, press the
key.
10.2.5 Tolerances
>2 s
User's Manual
in programming mode (heights, diameters, min, max). To
do this, double-click on the line concerned to open the
tolerance menu.
By activating the checkbox it is possible to enter a
nominal value and its tolerances. When the sequence is
executed, the values will be displayed in colour as
10.2.6 End of Programming
To complete the programming, press the following
button.
A backup menu is displayed. To save the sequence, enter
a location (local or USB) and a program name, then
confirm with the save key.
To exit without saving the sequence, press the following
key.
750 50 0042 03 56
Page 59
V7 / V9
Start
1
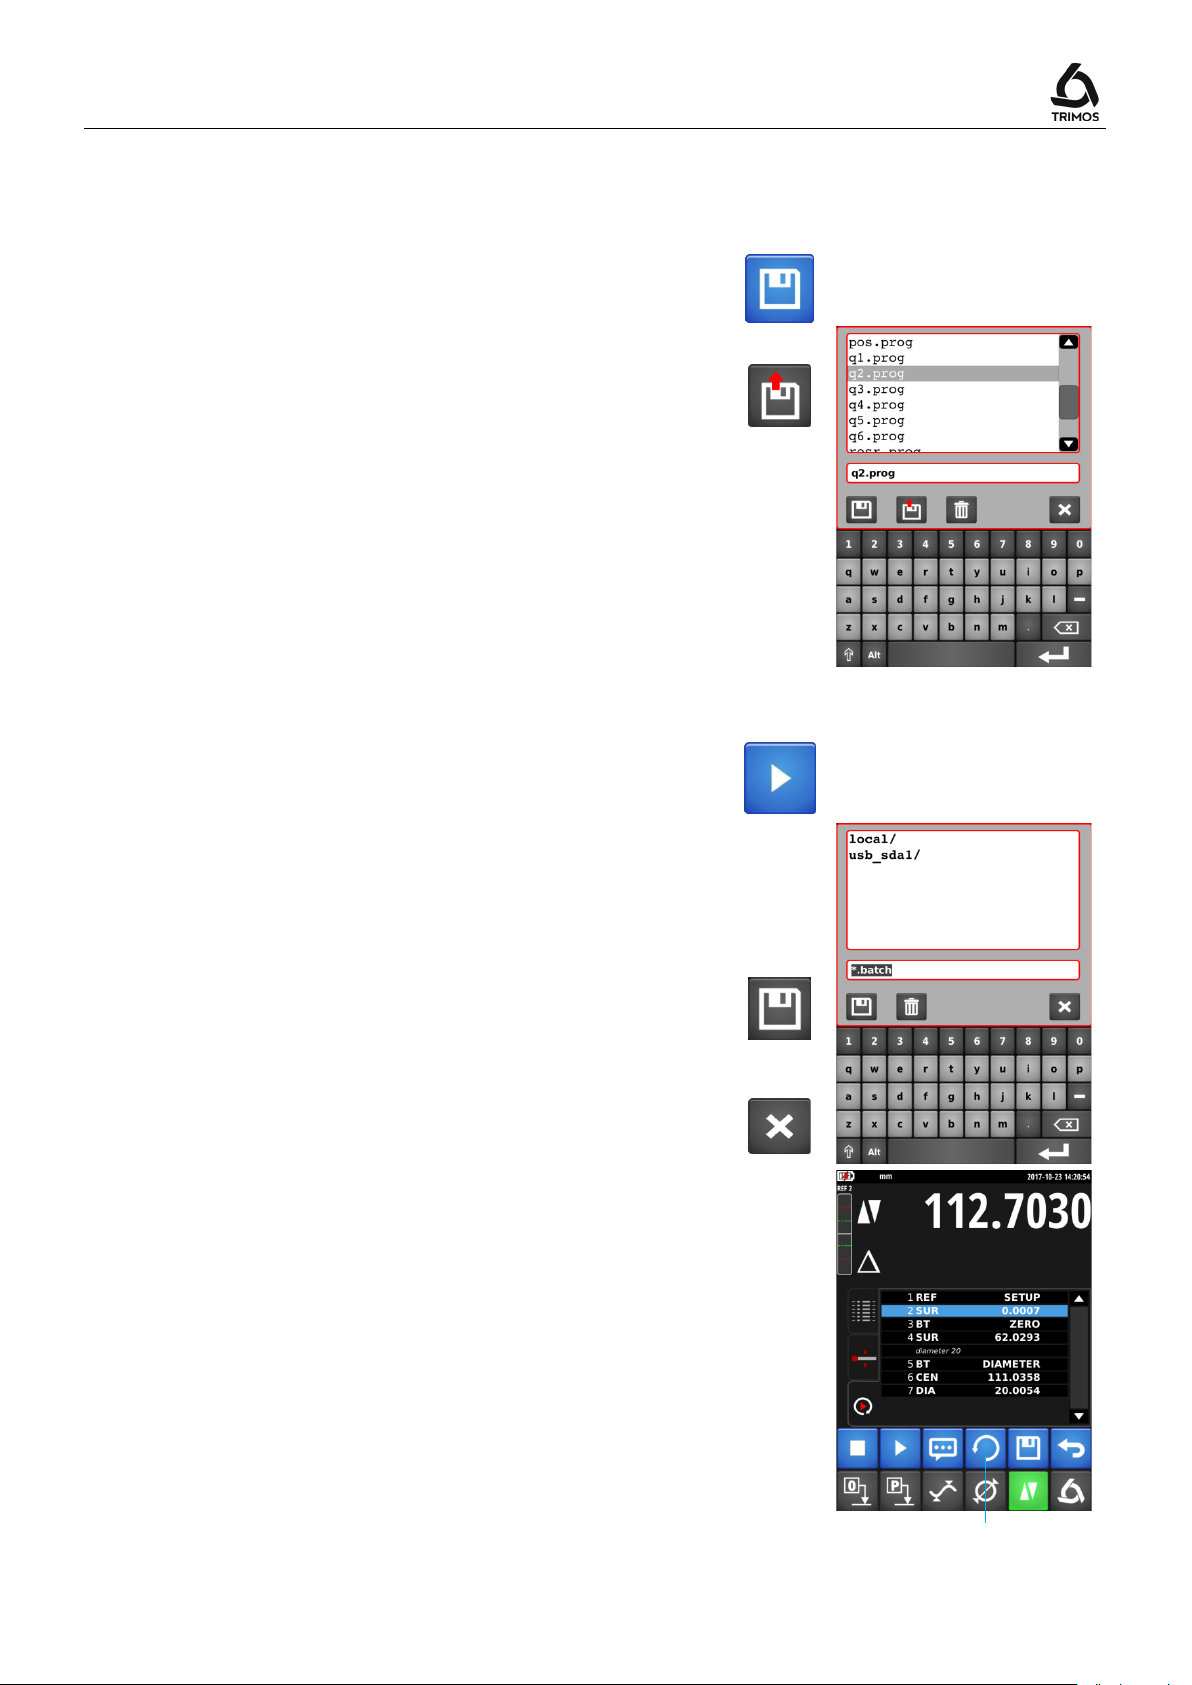
10.3 Running a Sequence
10.3.1 Loading
To load a previously recorded sequence, press the next
key.
Select the sequence to execute in the list and confirm
with the load key.
Note:
If a sequence has just been created, this step can be
ignored. Skip directly to startup (below).
10.3.2 Start
The execution of a measurement sequence starts by
pressing the
The program asks whether the measurement results
should be saved in a batch (.batch file) so that they can
be analyzed later in the statistics menu.
If yes:
Enter a file name or select an existing file, ensuring that it
contains only results from the same program.
If not:
Exit the menu by pressing the cancel key.
key.
The sequence starts immediately.
The current step is indicated in blue in the buffer.
Just follow each step. In motorized mode the instrument
moves alone.
In run mode the menu displays a new function:
1. Go back one step
750 50 0042 03 57
Page 60
Cancel
Start
Preset
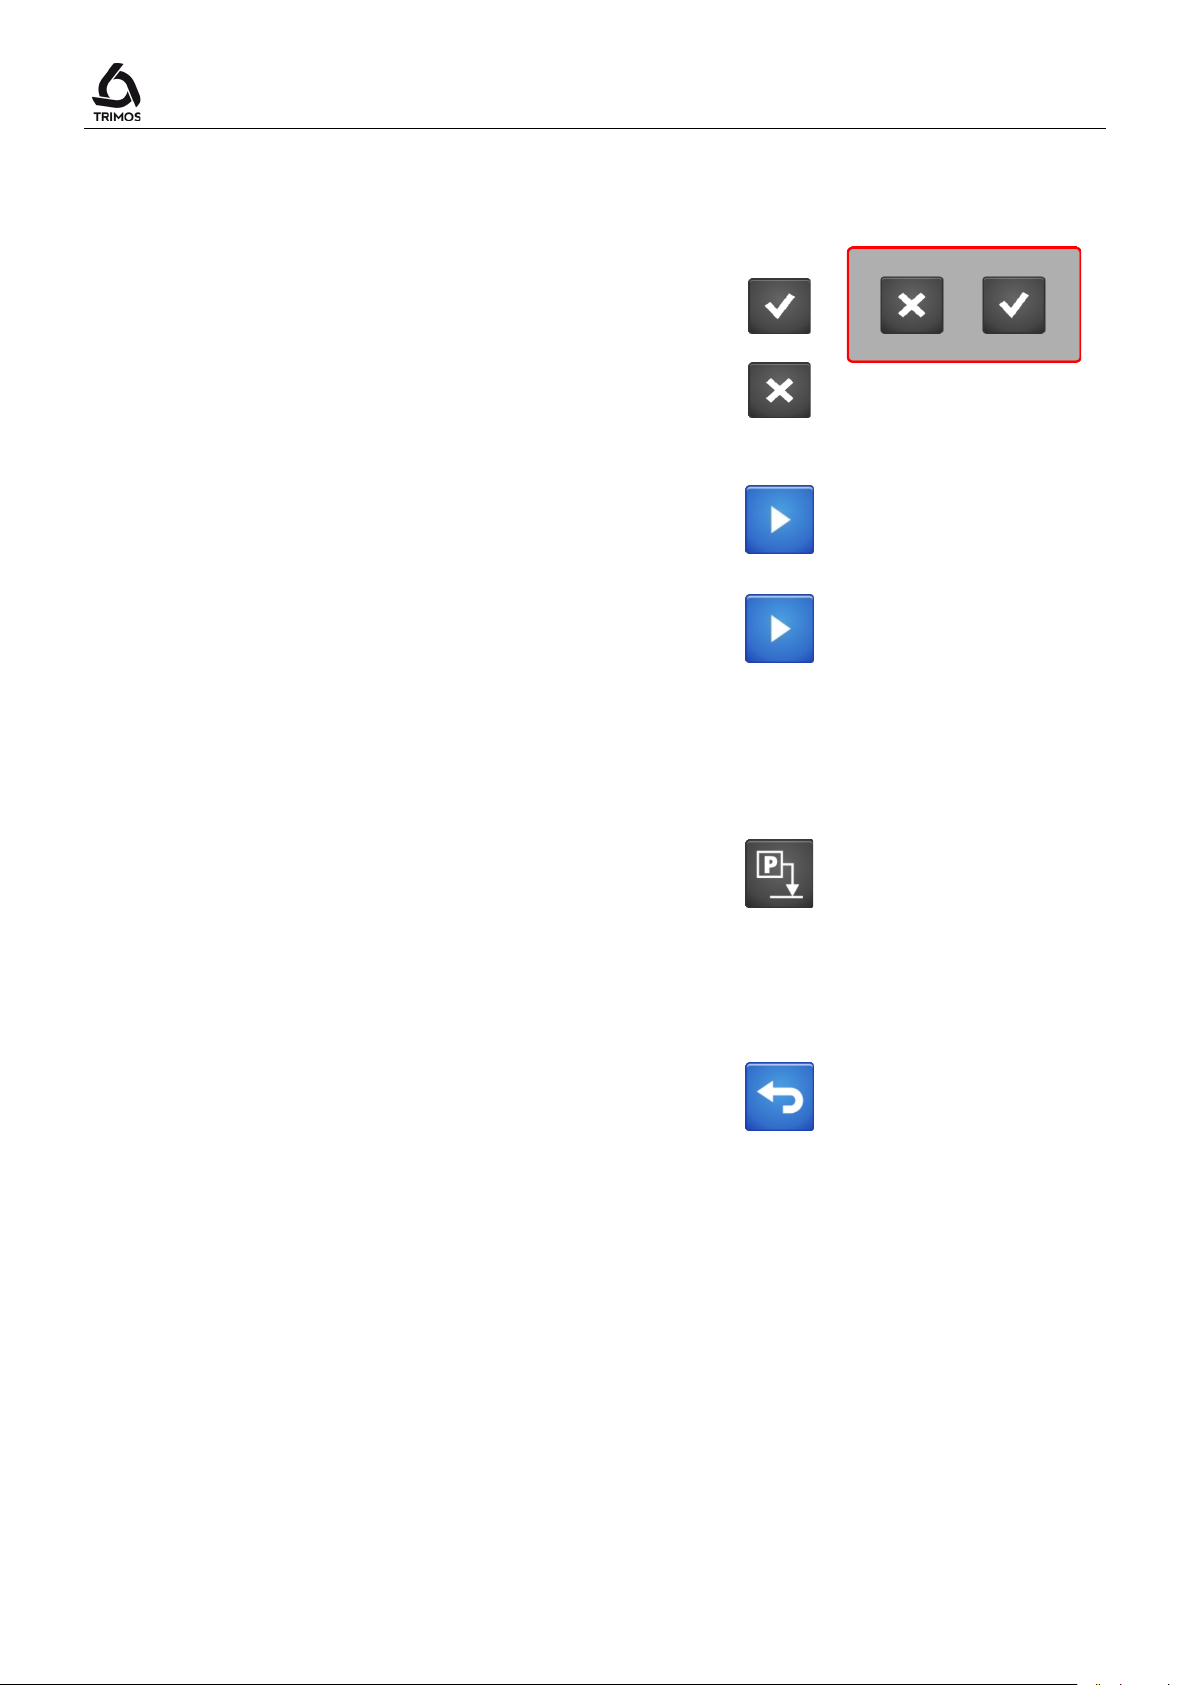
10.3.3 End of Measurement Cycle
User's Manual
At the end of the sequence it is asked to validate or not
the results.
Pressing the OK key saves the results in the active batch.
Pressing the
button does not save the results.
10.3.4 New Measurement
A new measurement cycle is restarted by pressing the
key.
It is also possible to repeat the measurements without
confirmation between each cycle. To do this, press the
Start key for 2 seconds.
If a batch was saved at startup, the measurements will be
saved each cycle.
>2 s
10.4 Special Features of the Programming Mode
When programming a measurement sequence, a long
press on the
value of the last probing to the next reference.
button automatically assigns the
>2 s
10.5 Quit the Measurement Sequence Mode
To exit the measurement sequence mode press the
following key.
750 50 0042 03 58
Page 61
V7 / V9
1 2 3
4 5 6
11. STATISTICAL ANALYSIS OF RESULTS
11.1 Start
Statistical analysis is based on the results of a batch
recorded during a measurement sequence.
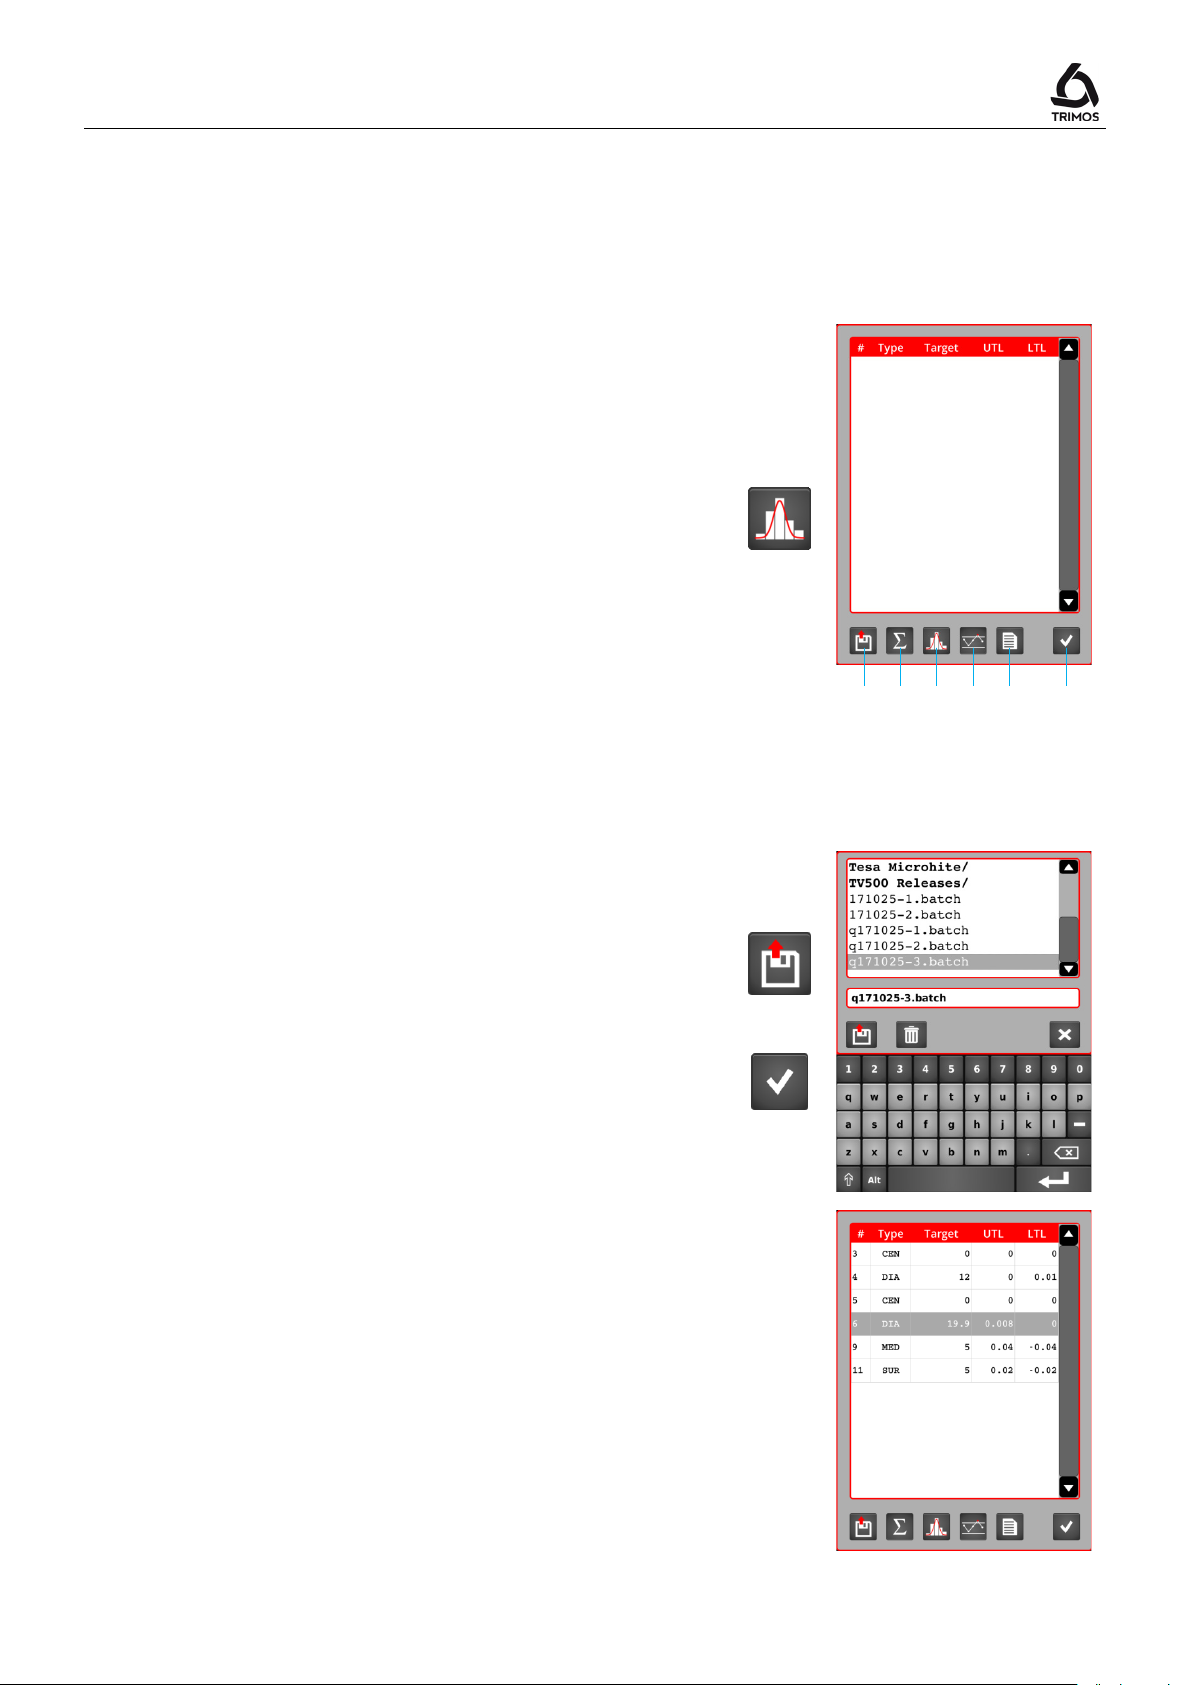
To analyse a batch, call the statistical analysis menu by
pressing the following button.
The functions available are:
1. Opening a batch
2. Statistical values
3. Histogram
4. Control card
5. Export results in .csv format
6. Exit
11.2 Batch Analysis
11.2.1 Open a Batch
Open the list of batches (files with extension .batch) and
select the one to be analysed and confirm.
Each batch can only contain the results of one program.
A batch is composed of the different nominal values
defined by the sequence (visible in the list opposite).
At each nominal value correspond as many results as the
sequence has been executed.
750 50 0042 03 59
Page 62
N
R
X
N
Xi
N
i∑=1
N
XXi
N
i∑=
−
1
2
)(
Cp
σ
6
LTLUTL −
User's Manual
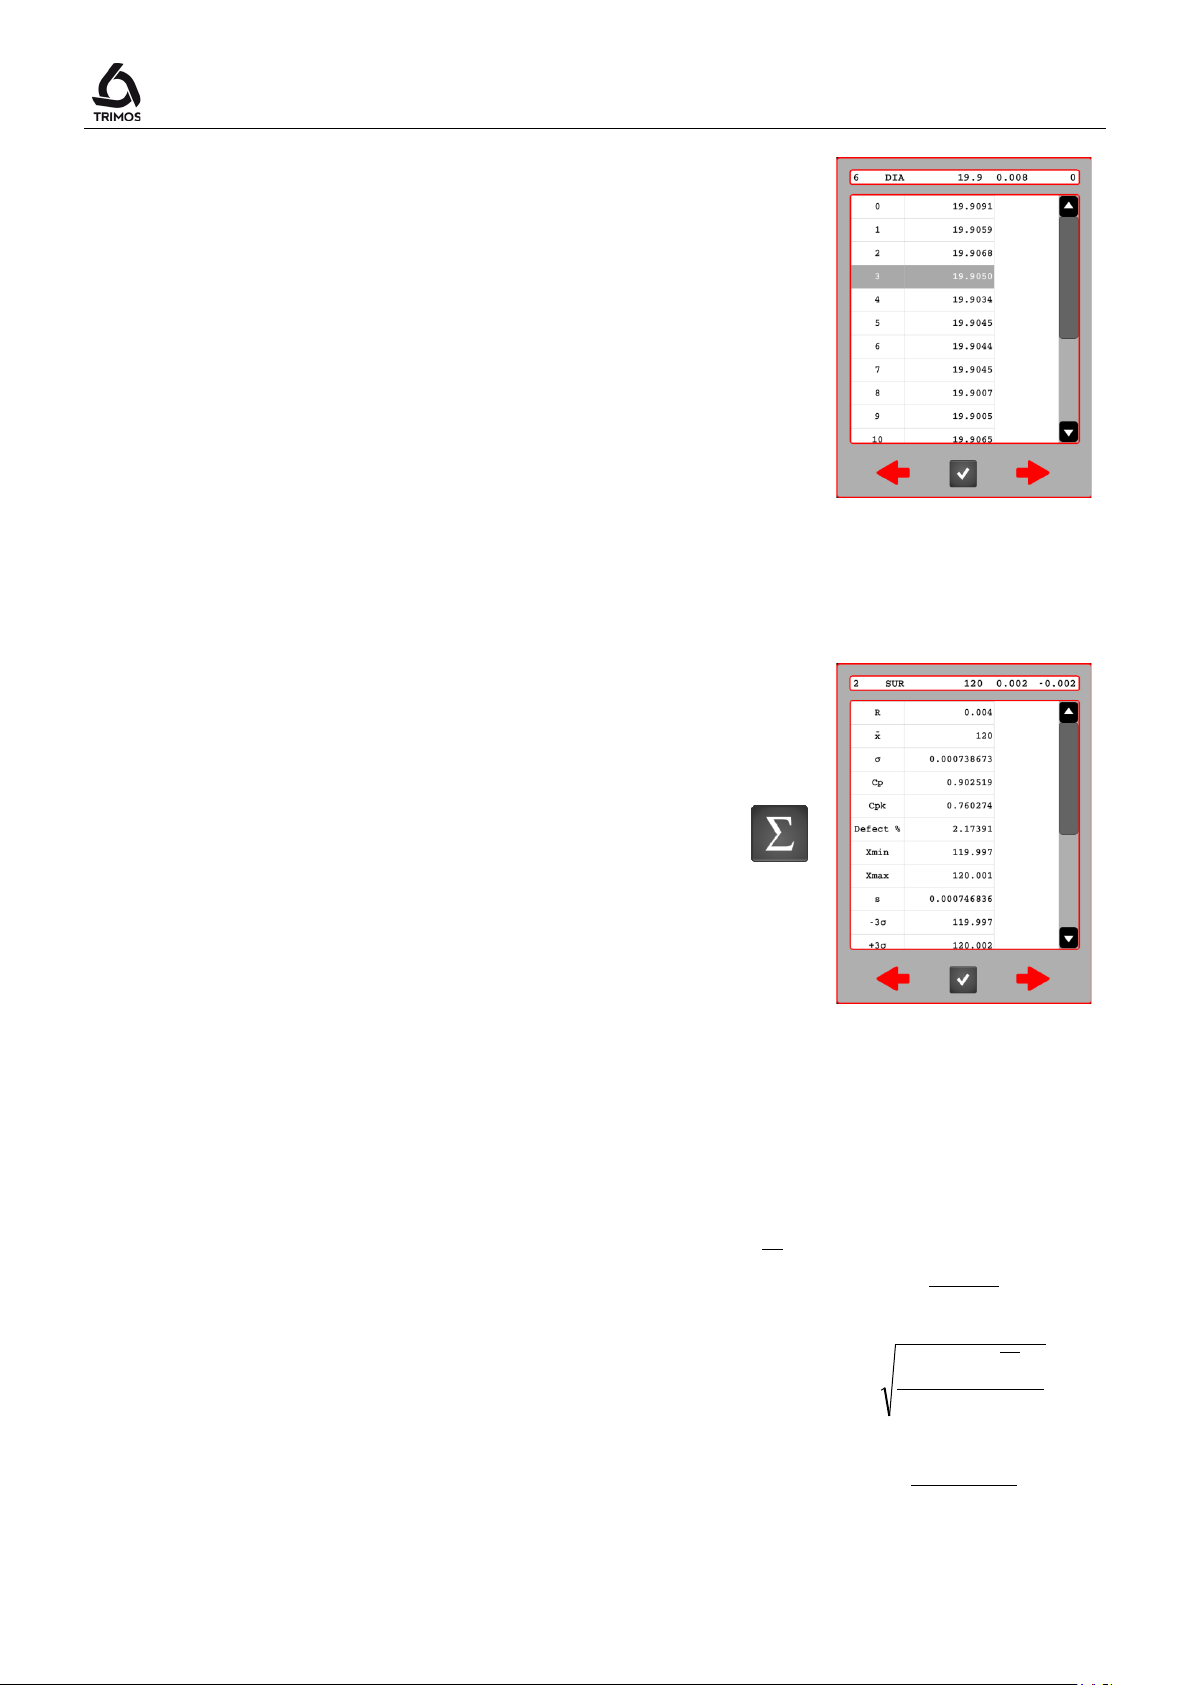
By double clicking on a batch line (nominal value), it is
possible to view the results of all recorded measurements.
11.2.2 Statistical Values
The statistical values are displayed for each nominal value
of the batch. These are displayed as page header with
their tolerance (UTL & LTL).
To navigate between the nominal values, use the red
arrows.
The statistical values based on the results of each
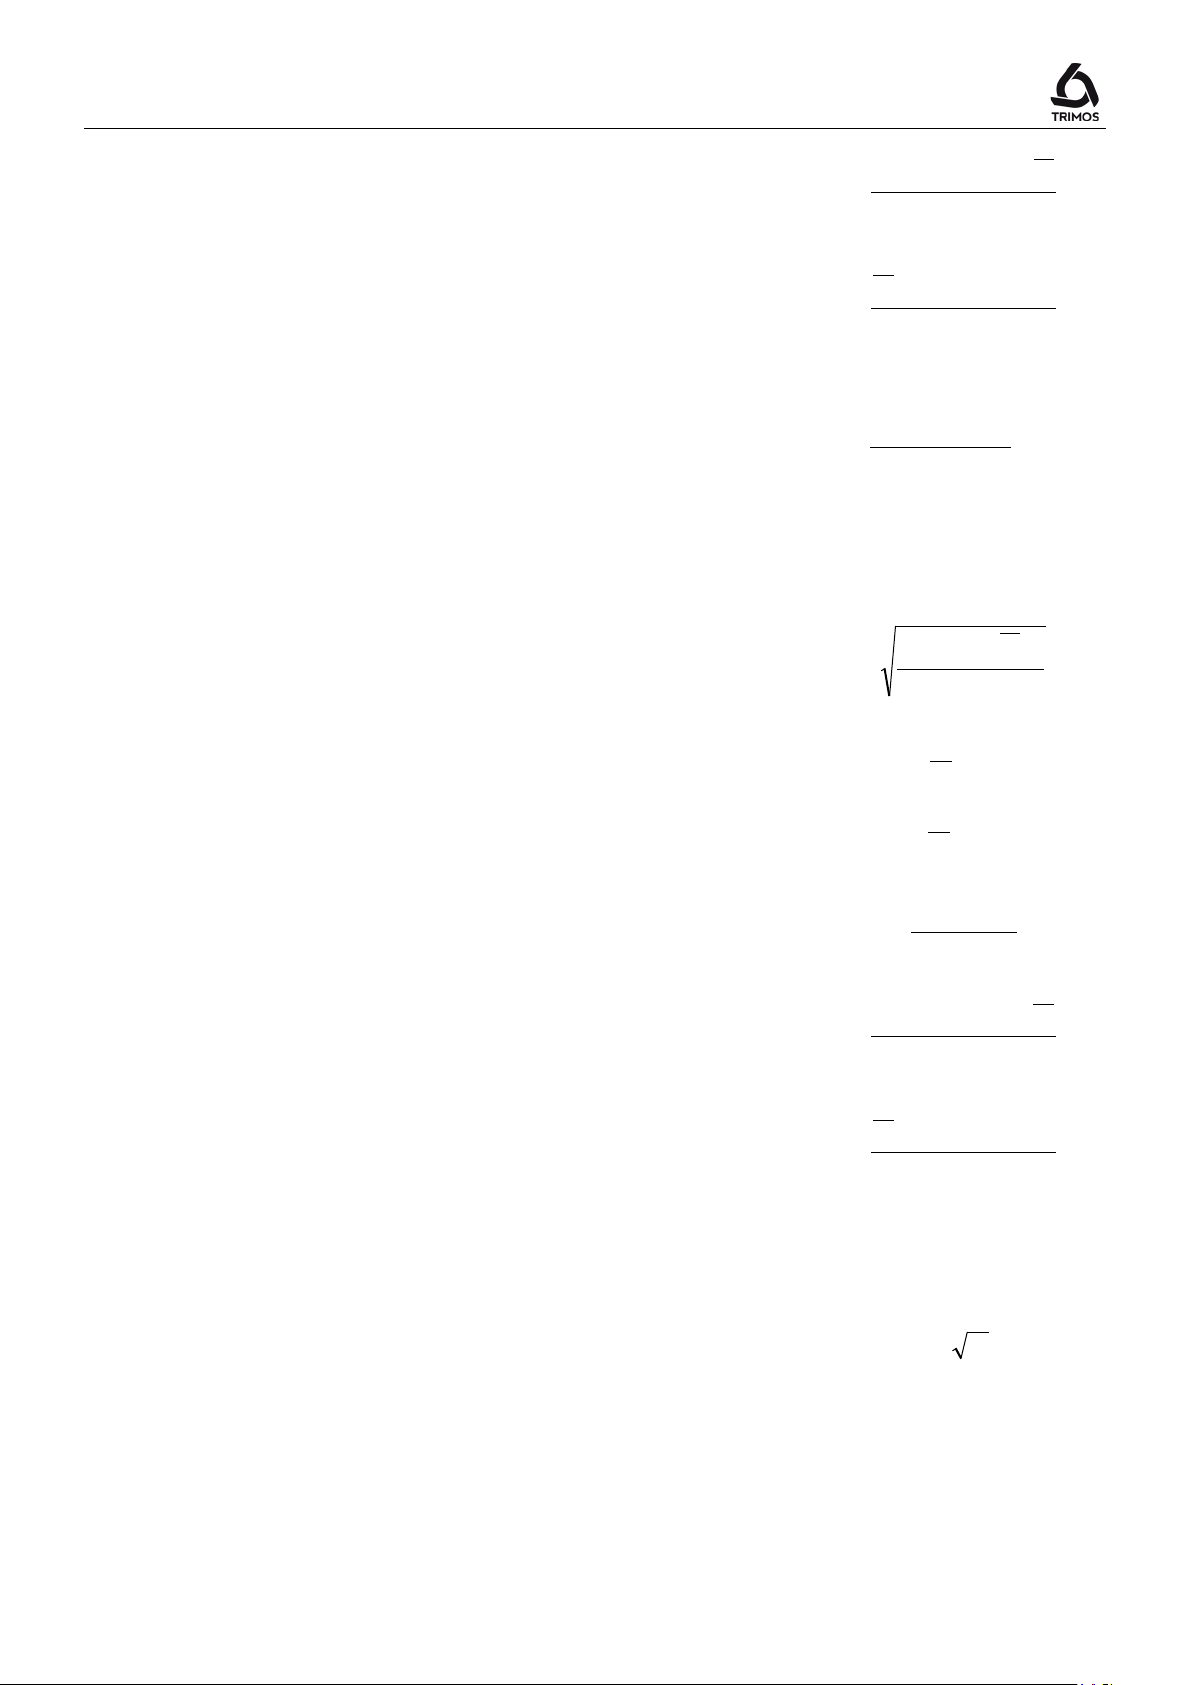
nominal value are as follows:
Number of memorized results
Range
Arithmetic mean value
Standard deviation
Process capability
Xmax – Xmin
σ
750 50 0042 03 60
Page 63
V7 / V9
Cpk
σ
3
)( XUTLNOM −+
σ
3
)(
LTLNOM
X
+−
100
)()(
x
N
NGNG ++−
1
)(
1
2
−
−
∑
=
N
XXi
N
i
X
X
s
LTLUTL6−
s
XUTLNOM
3
)( −+
s
LTLNOMX
3
)( +−
N
Process center capability index
ou
Percentage of faulty parts
Minimum value stored
Maximum value stored
Standard deviation (based on a sample)
Lower control or influence limit
Upper control or influence limit
Machine capability
% Def
Xmin
Xmax
s
-3σ
+3σ
Cm
– 3σ
+ 3σ
Machine process capability index
Number of value below the lower tolerance limit
Number of values above the upper tolerance limit
Number of classes of the histogram
Class width of the histogram
Cmk
ou
-NG
+NG
NClass
≈
WClass
750 50 0042 03 61
Page 64
a directory and
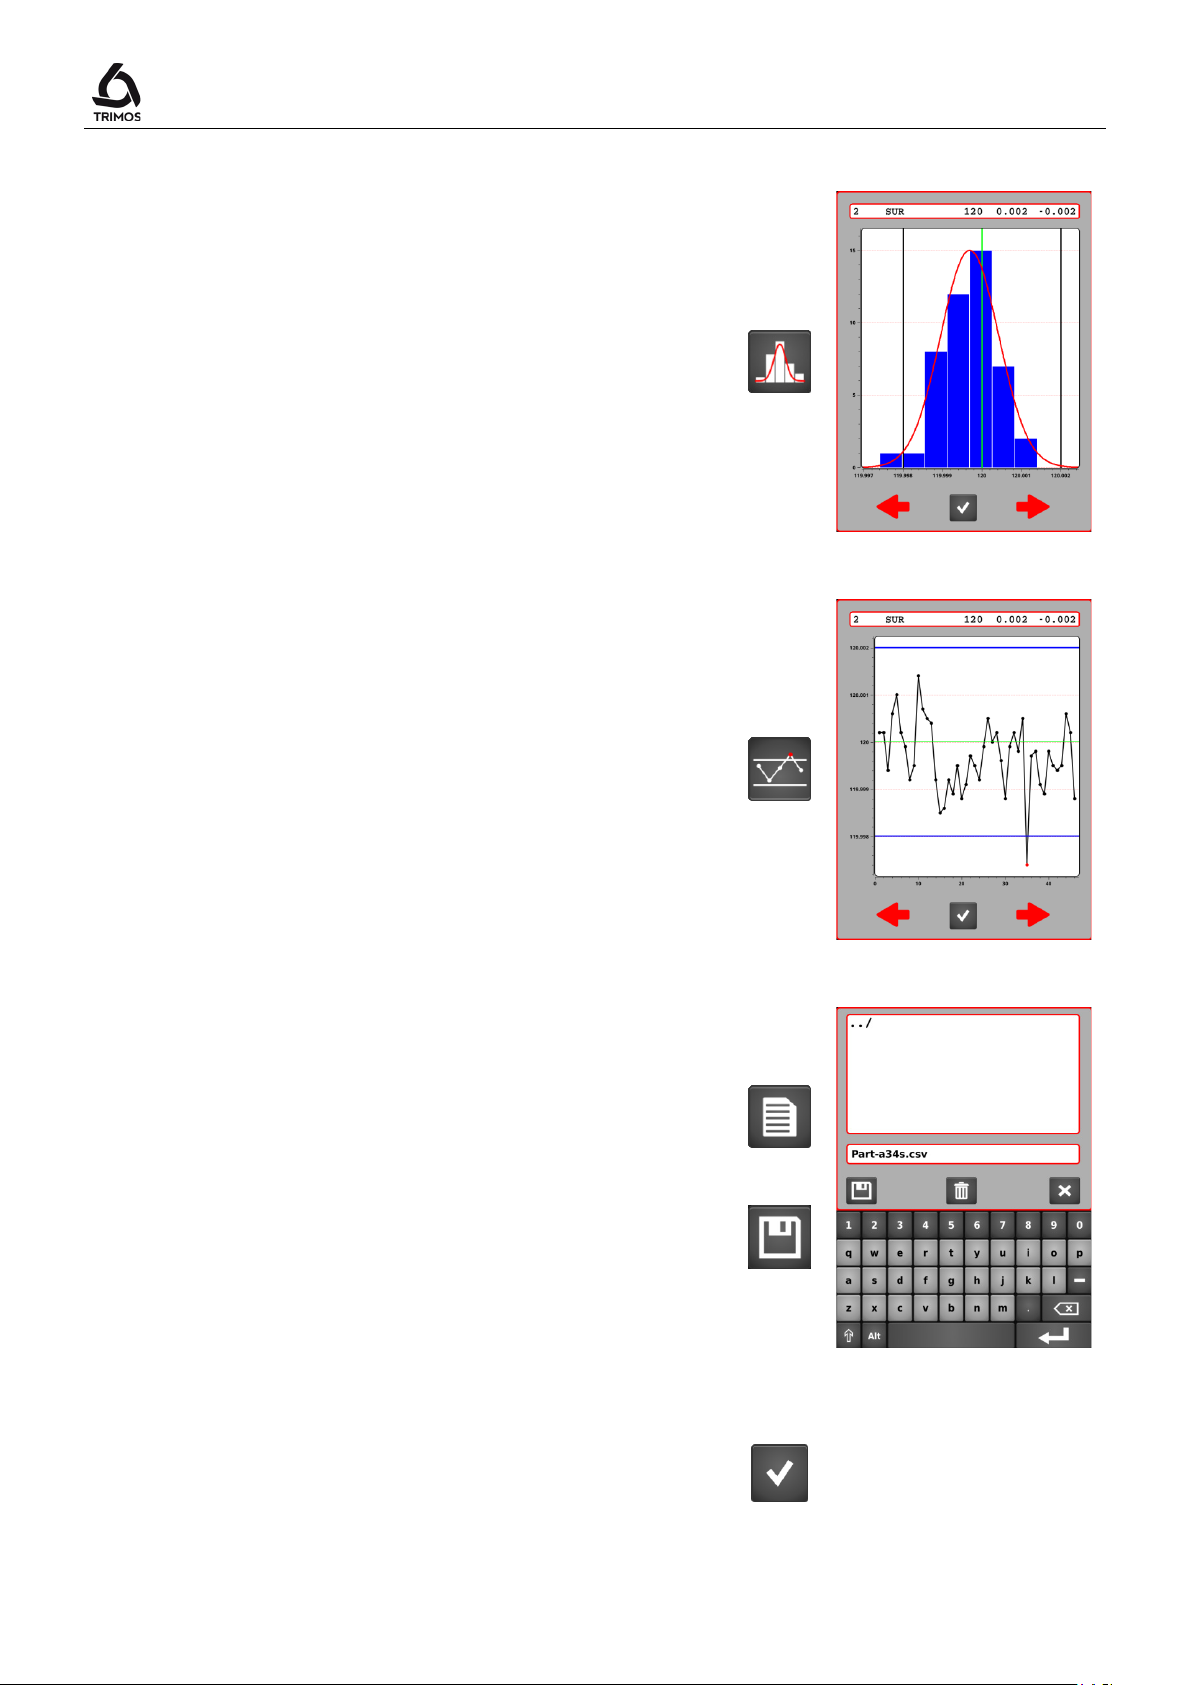
11.2.3 Histogram
Presentation of the results by nominal value in the form of
a histogram.
It is admitted that the values are distributed according to
the normal law. This allows the drawing of the probability
density curve (also called Gauss curve).
11.2.4 Control Chart
User's Manual
The control chart represents the evolution of the results
according to the nominal value and its tolerances.
11.2.5 Exporting results in .csv format
It is possible to export a batch in .csv format.
To do this open the following menu, select
enter a file name.
Confirm with the save key.
11.3 Quit the Statistic Analysis Mode
To exit the statistics mode press the following key from
the start menu.
750 50 0042 03 62
Page 65
V7 / V9
1. Activation/selection of the USB printer (for configuring
Data transfer
key
Data transfer
key
1 2
3
4
5
6
7
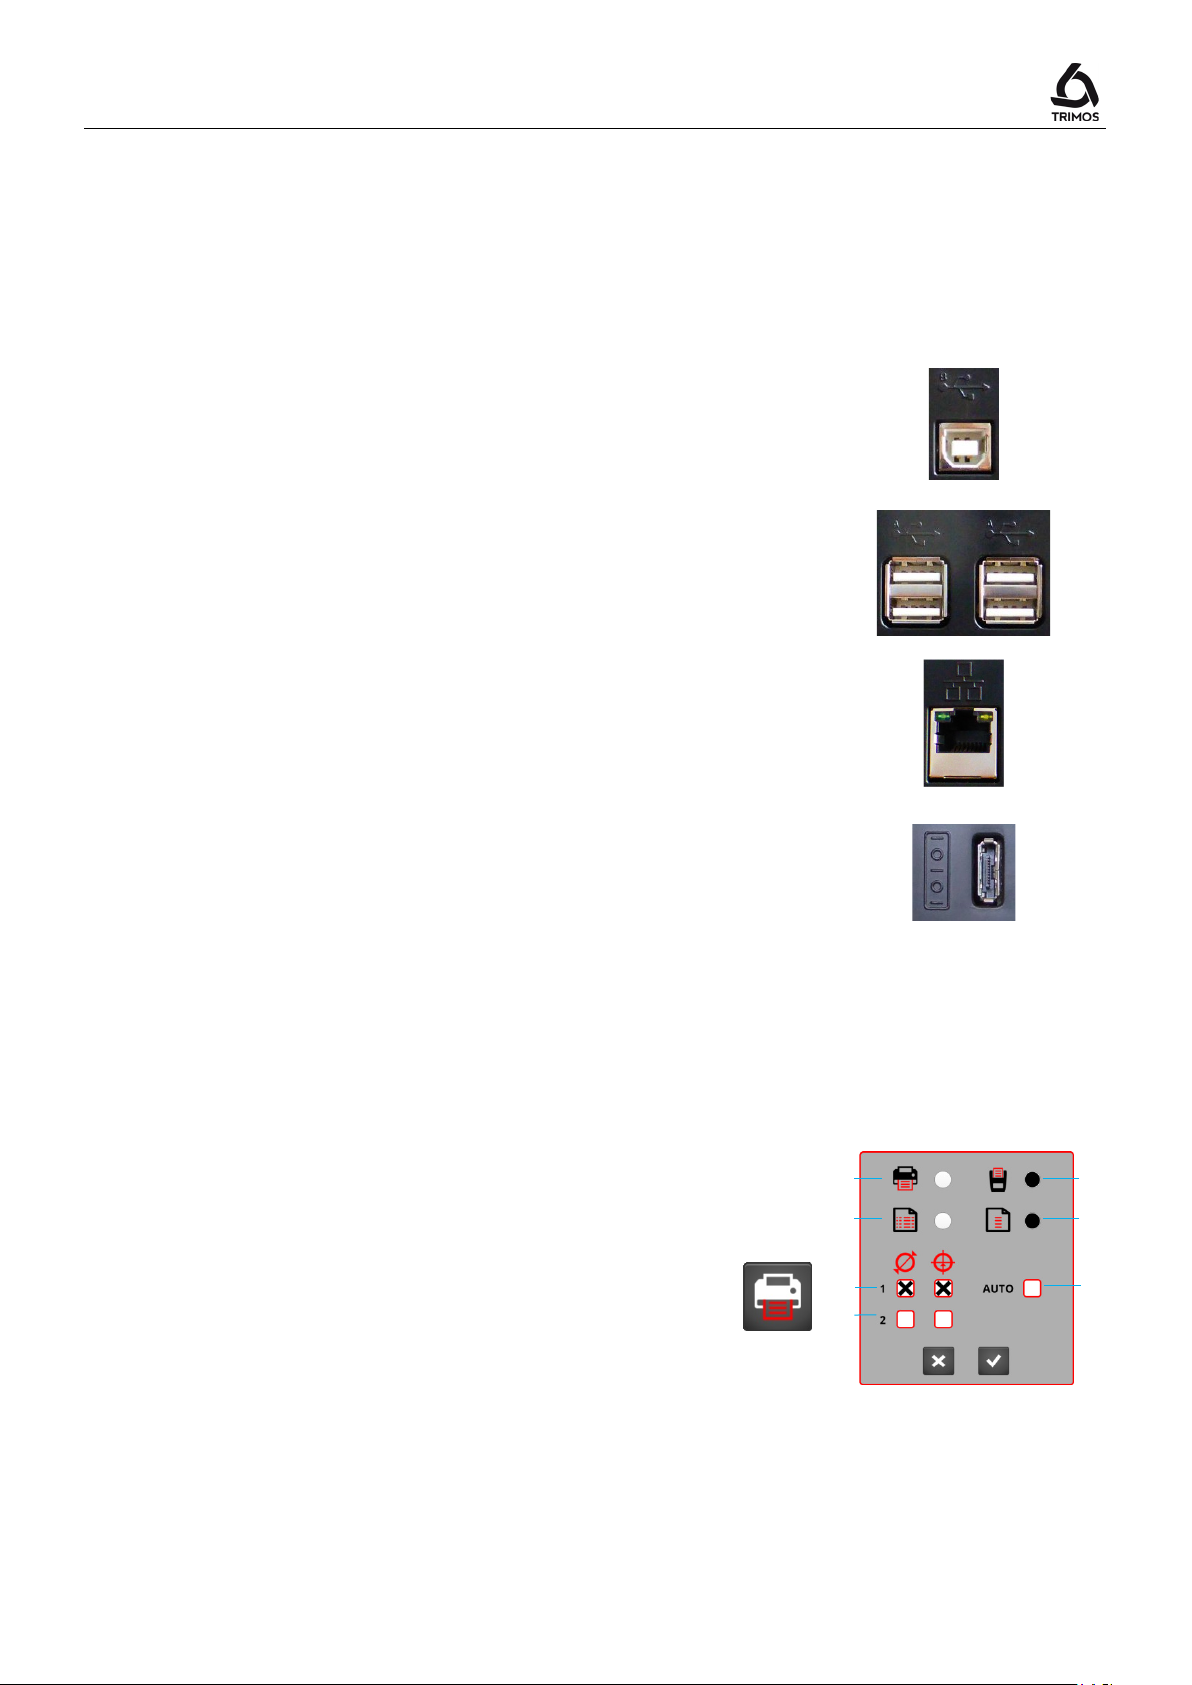
12. SENDING DATA AND PRINTING
12.1 Connectors
The instrument offers the following communication ports:
1 x USB B
This connector is placed at the back of the display unit. It
allows connection to a PC for the transmission of data.
4 x USB A
These connectors are placed at the back of the display
unit. They allow connection to peripherals such as USB
key or USB printer.
1 x RJ45 Ethernet
This connector is placed at the back of the display unit. It
allows the configuration of USB printers.
1 x RS232
This connector is placed at the back of the height gauge.
It allows a classic connection with external devices
equipped with RS232 interfaces, such as printer or PC.
12.2 Configuring the Printing and the Data Transfer
the printer, refer to § 12.5.1)
2. Activation of serial printing and PC (Simultaneous
transfer on the RS232 and USB B ports)
3. Data transfer with line no., function and unit
4. Data transfer with numeric value only
5. Diameter and centreline distances:
Select the value (s) to be sent when the
is pressed for the first time.
6. Diameter and centreline distances:
Select the value (s) to be sent when the
is pressed for the second time.
>2 s
Factory configuration of
the printing
750 50 0042 03 63
Page 66
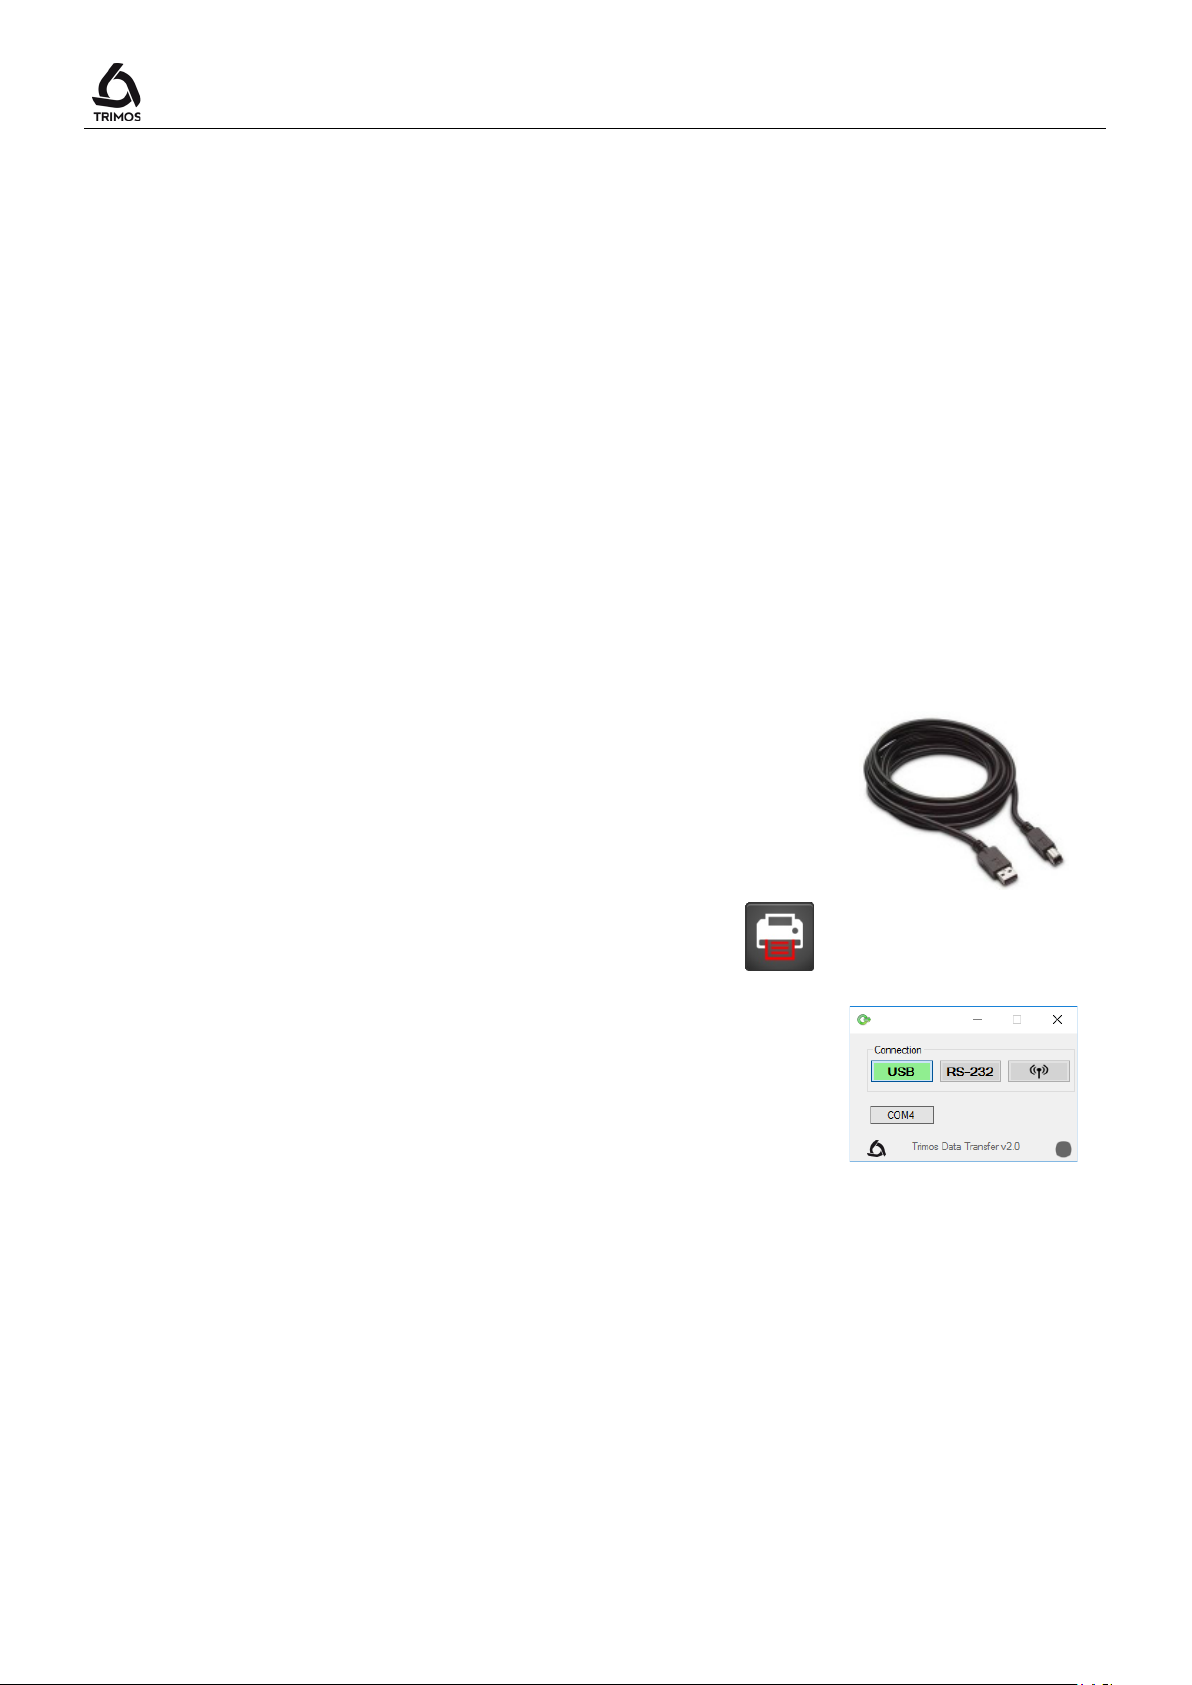
7. Box checked: Automatic transfer of data after each
AUTO
is checked, only the value (s) selected for
Data transfer key
Data transfer key.
probe.
Note:
When
the first press of the
option is not available for transfer to a USB printer.
is active. This
12.3 Data Transfer via USB B
Connection to a PC
A USB A-B cable is required for the connection to a PC,
as well as the TrimosDataTransfer communication
software.
Cable
USB A-B connection cable: TA-EL-013 (ref. 332 02 0001)
Software
The TrimosDataTransfer software is freely available on
www.trimos.com, in the corresponding product section.
Data transfer procedure
1. Start TrimosDataTransfer
2. Connect the instrument to the PC with TA-EL-013
cable and wait for the connection to be established
3. Click on the application to which the data has to be
transferred.
4. Press
place having the focus. The data can also be sent
automatically after each probing (§ 12.2).
Format
Numerical value (as on display) in ASCII characters.
In diameter/centreline mode, if 2 values are sent
simultaneously, they are separated by a LF (Line Feed).
The value is displayed at the
User's Manual
750 50 0042 03 64
Page 67
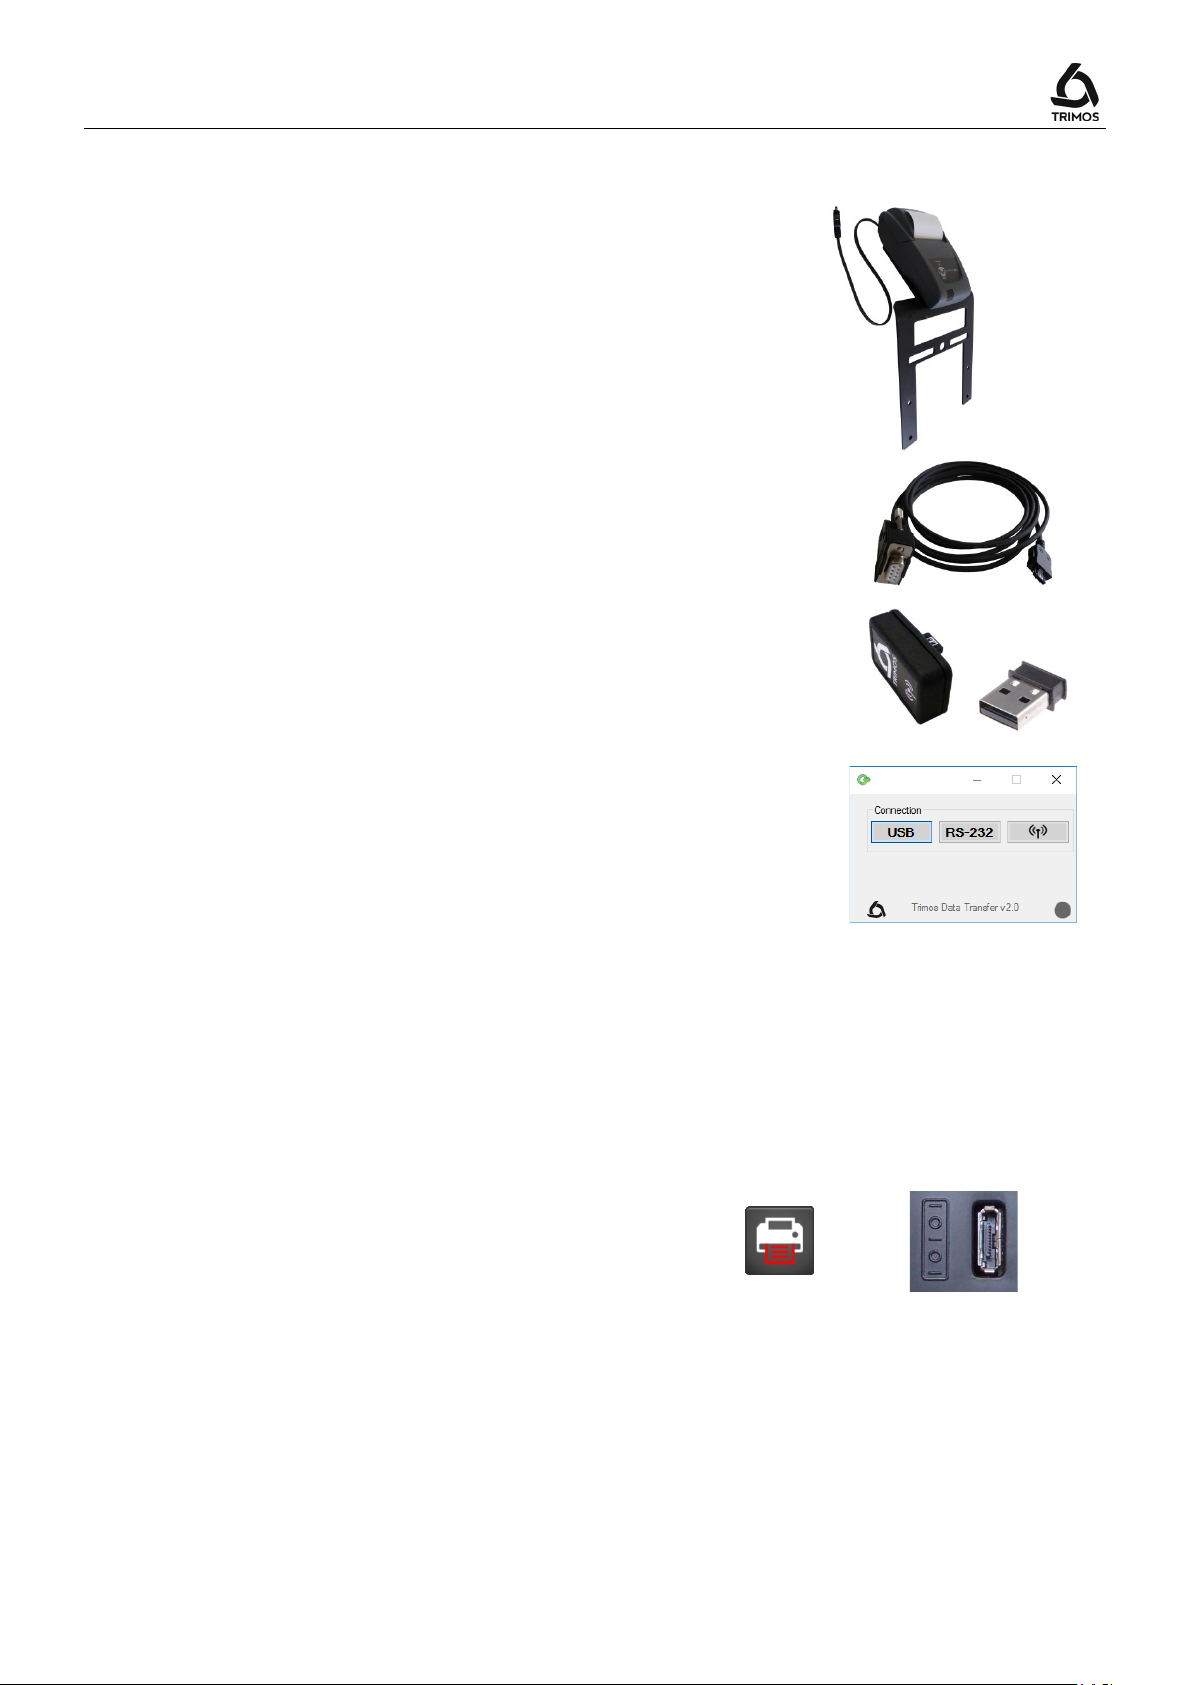
V7 / V9
Data transfer procedure
Transmission).
12.4 Data Transfer via RS232
Connection to a serial printer
Printer TA-EL-033 (Ref. 756 0020).
The RS232 cable, the charger and a support to fix the
printer to the instrument are included.
Connection to a PC with RS232 cable
Cable TA-EL-112
Wireless connection to a PC
Wireless data transmission system TA-EL-022
Software
The TrimosDataTransfer software is available free of
charge at www.trimos.com in the relevant product
section.
Any other RS232 communication software (Vmux,
Hyperterminal, WinWedge etc.) can be used.
1. Connect the printer, the RS232 cable or Wireless
Transmission System to the serial port of the instrument.
2. Start and configure the communication software.
3. Press the Data Send Key. The data can also be sent
automatically after each probing (§ 12.2).
Data transmission (according to Opto-RS)
- Speed: 4800 baud
- ASCII code: 7 bits
- Parity: pair
- Stop bits: 1
- Handshake: without
Format
The format of the value sent corresponds to the numeric
value of the display in ASCII characters.
In diameter / centerline mode, if 2 values are sent
simultaneously, they are separated by an EOT (End Of
750 50 0042 03 65
Page 68
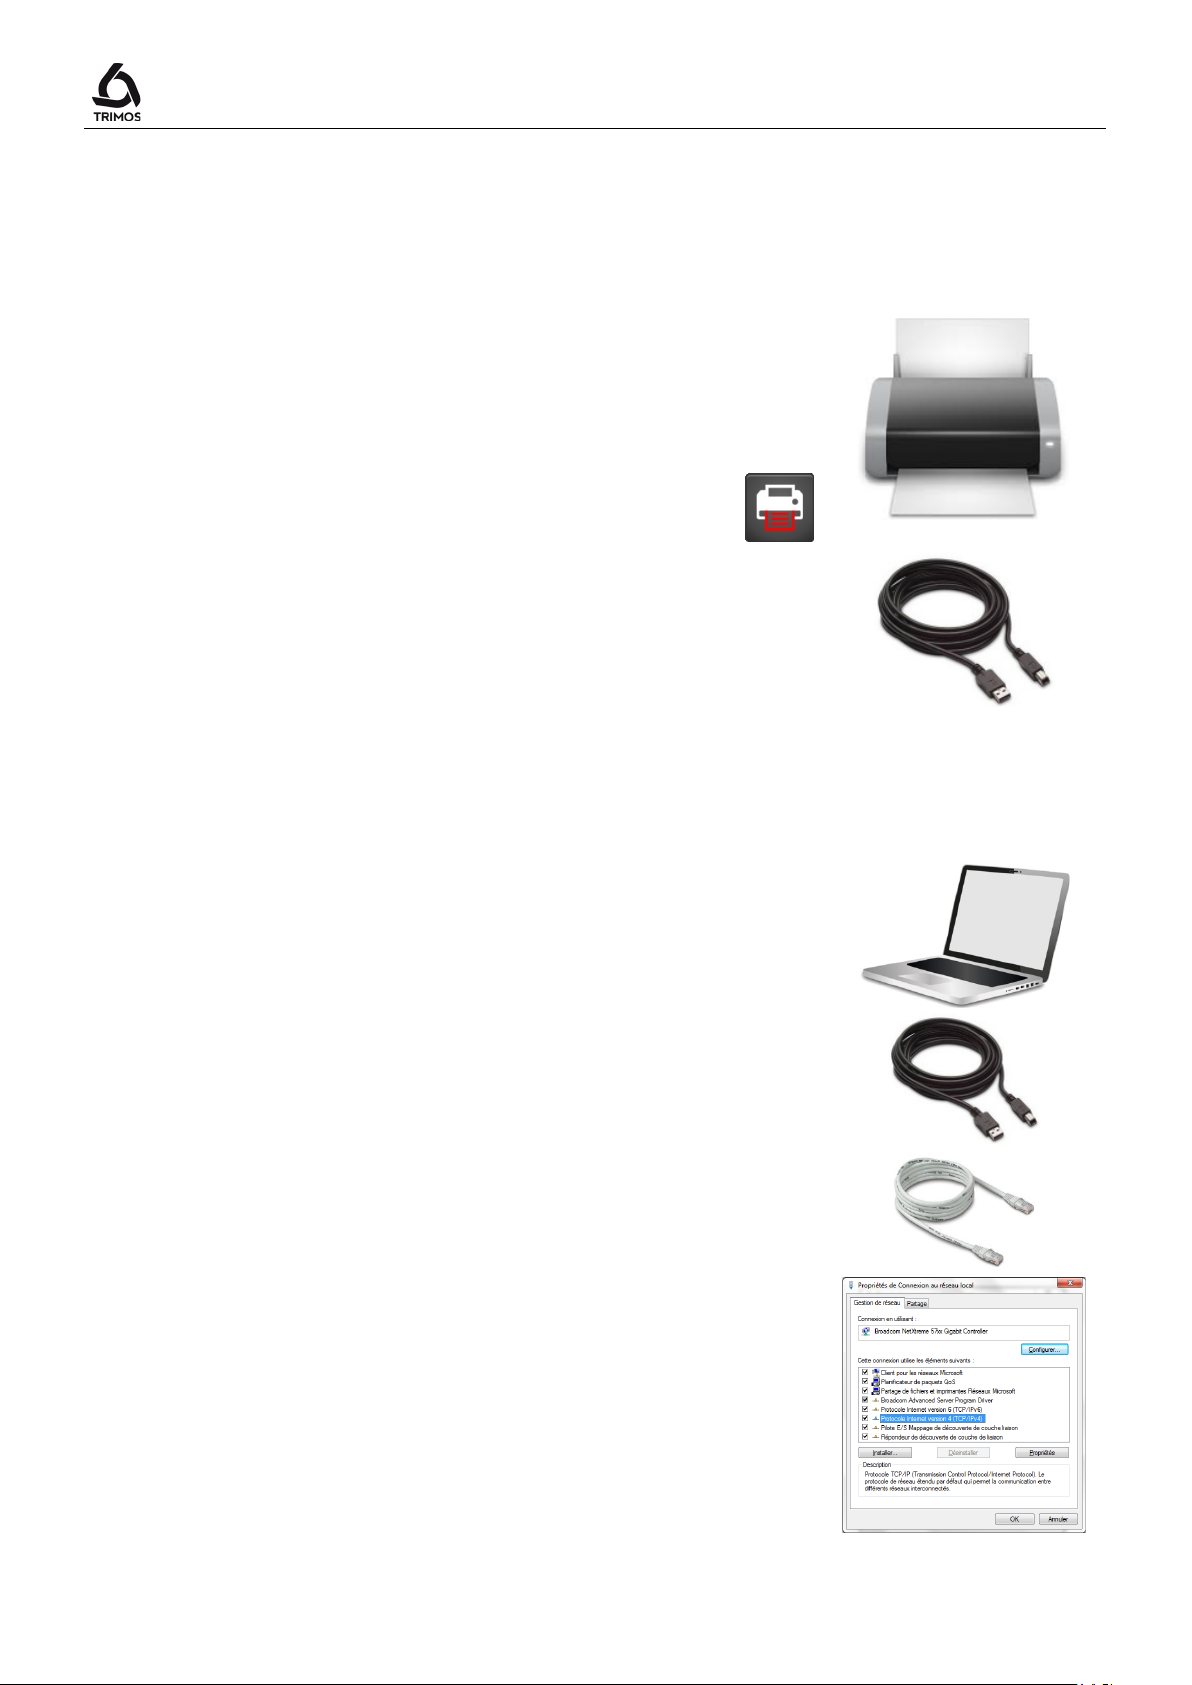
Connection to a USB printer allows printing the buffer, the
Data transfer key
Internet" then "Network Centre and sharing" and finally
12.5 Data Transfer to a USB Printer
12.5.1 Data Transfer to a USB Printer
Connection to a USB printer
perpendicularity curve or the table of coordinates of a 2D
measurement.
Cable
USB A-B connection cable: TA-EL-013 (ref. 332 02 0001)
Configuration
Before printing, it is necessary to configure the
communication between the instrument and the printer.
The procedure is described in § 12.5.2.
Data transfer procedure
1. Connect the printer to the instrument with the help of
the TA-EL-013 cable.
2. Press
.
User's Manual
12.5.2 Configuration of the Printer
Majority of USB printers can be configured with a PC in
accordance with the procedure given below.
1. Start the printer and the instrument. Connect the
printer to a USB A port of the instrument with a USB AB cable (TA-EL-013).
2. Connect the instrument to a PC (of which you must be
the administrator) with the help of A RJ45 Ethernet
cable.
3. In the configuration panel, select "Network and
"Modify the mapping parameters".
In "Connection to the local network", open
"Parameters" and select "Internet Protocol version 4
(TCP/IPv4)".
750 50 0042 03 66
Page 69
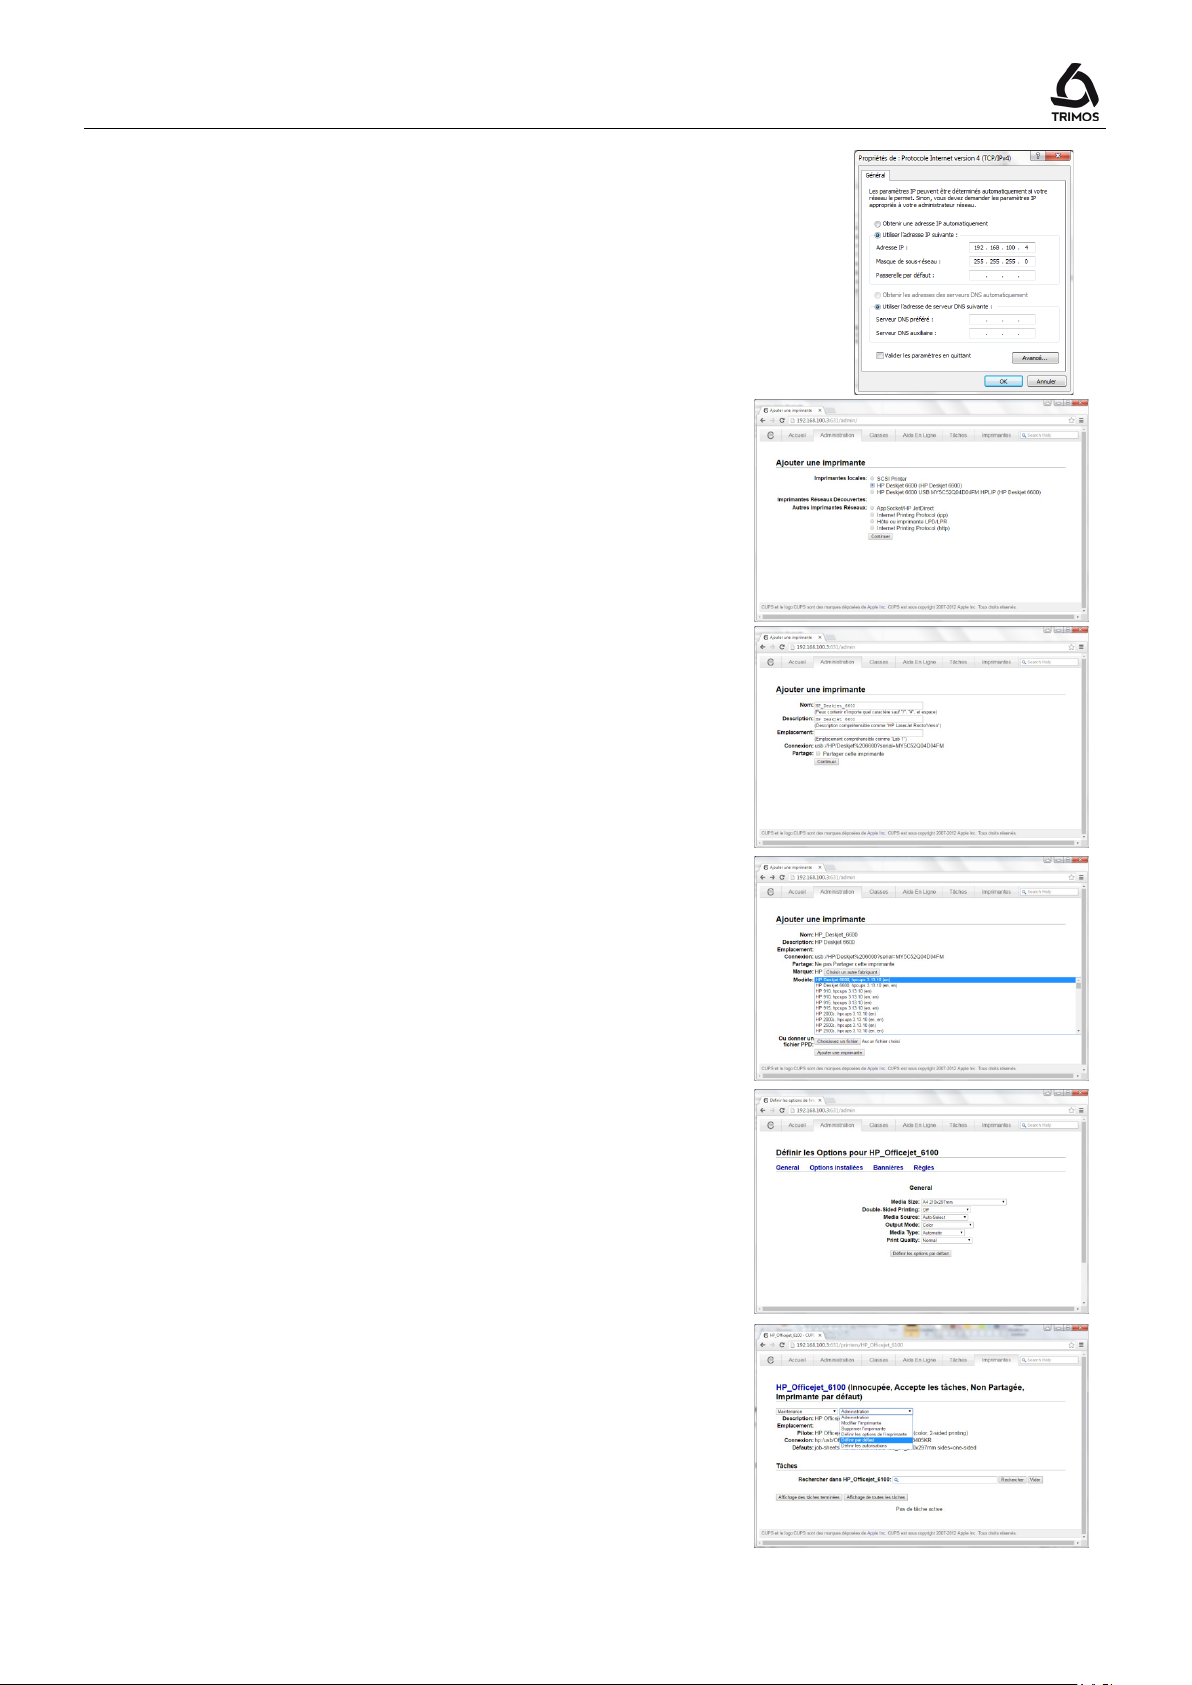
V7 / V9
192.168.100.4
192.168.100.3:631
If the connected printer does not show in this list, click
4. In "Properties", select "Use the IP address as given
alongside".
Enter the IP address:
the Tab key.
Confirm with OK and close
5. Open a Web browser and then enter the IP address of
the instrument.
In the "Administration" tab, click on "Add a printer".
Select the printer in the list then click on "Continue".
then confirm with
.
6. On the next page, click on "Continue".
7. Select a printer in the "Model" list.
on "Choose another manufacturer" and select another
make. Select the make or "Generic" if the connected
printer does not match any proposed make. Click on
"Continue" to confirm.
Continue by clicking on "Add a printer".
8. Define the default print parameters then end by
clicking on "Define the default options".
9. In the "Printers" tab, select "Define by default".
10. Select the printer in the print configuration menu of
the instrument (§ 12.2).
The printer can now be used.
750 50 0042 03 67
Page 70
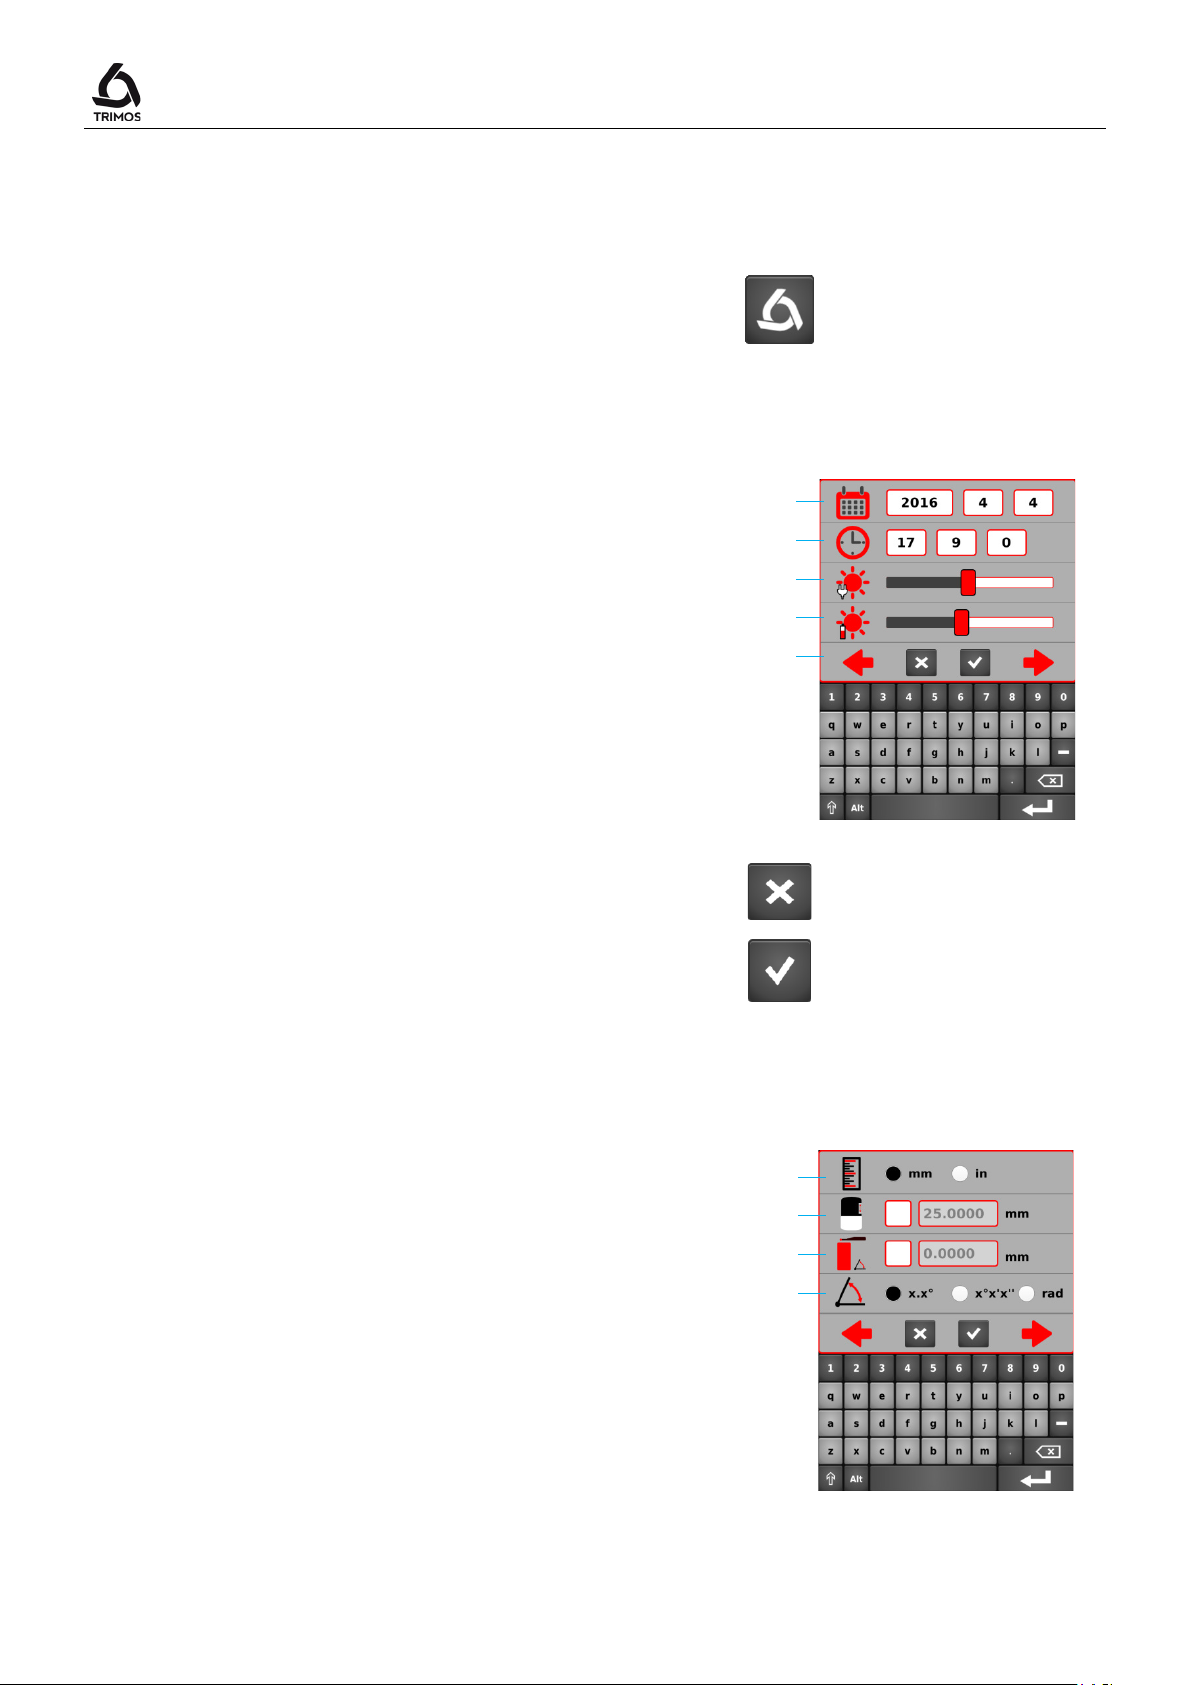
Logo
>2 s
6. Unit selection
mm
or
inch
.
1 2 3 4 5 6 7 8 9
13. CONFIGURATION
User's Manual
The configuration menu opens with a long press on the
key.
13.1 Page 1
1. Date: Year / Month / Day
2. Time: Hours / Minutes / Seconds
3. Brightness of the screen when the charger is
connected
4. Brightness of the screen when the instrument is
running on batteries
5. Red arrows: Browse between pages of the
configuration menu. Pressing on any of these arrows
validates the changes made on the page.
To exit the menu without saving the changes, press the
Cancel key.
To exit the menu after saving the changes, press the key
shown alongside.
13.2 Page 2
7. Size of setting gauge. To enter another size, click on
the checkbox and enter the desired value. A zero or a
negative value (=taking the probe constant on a gauge
block) is possible.
8. Size of the wedge for angle measurements (see §
7.11). For a shortened measurement procedure, click
on the checkbox and enter the dimension of the
wedge.
9. Angle measurement unit: Decimal degrees / Degrees,
minutes, seconds / Radians
750 50 0042 03 68
Page 71
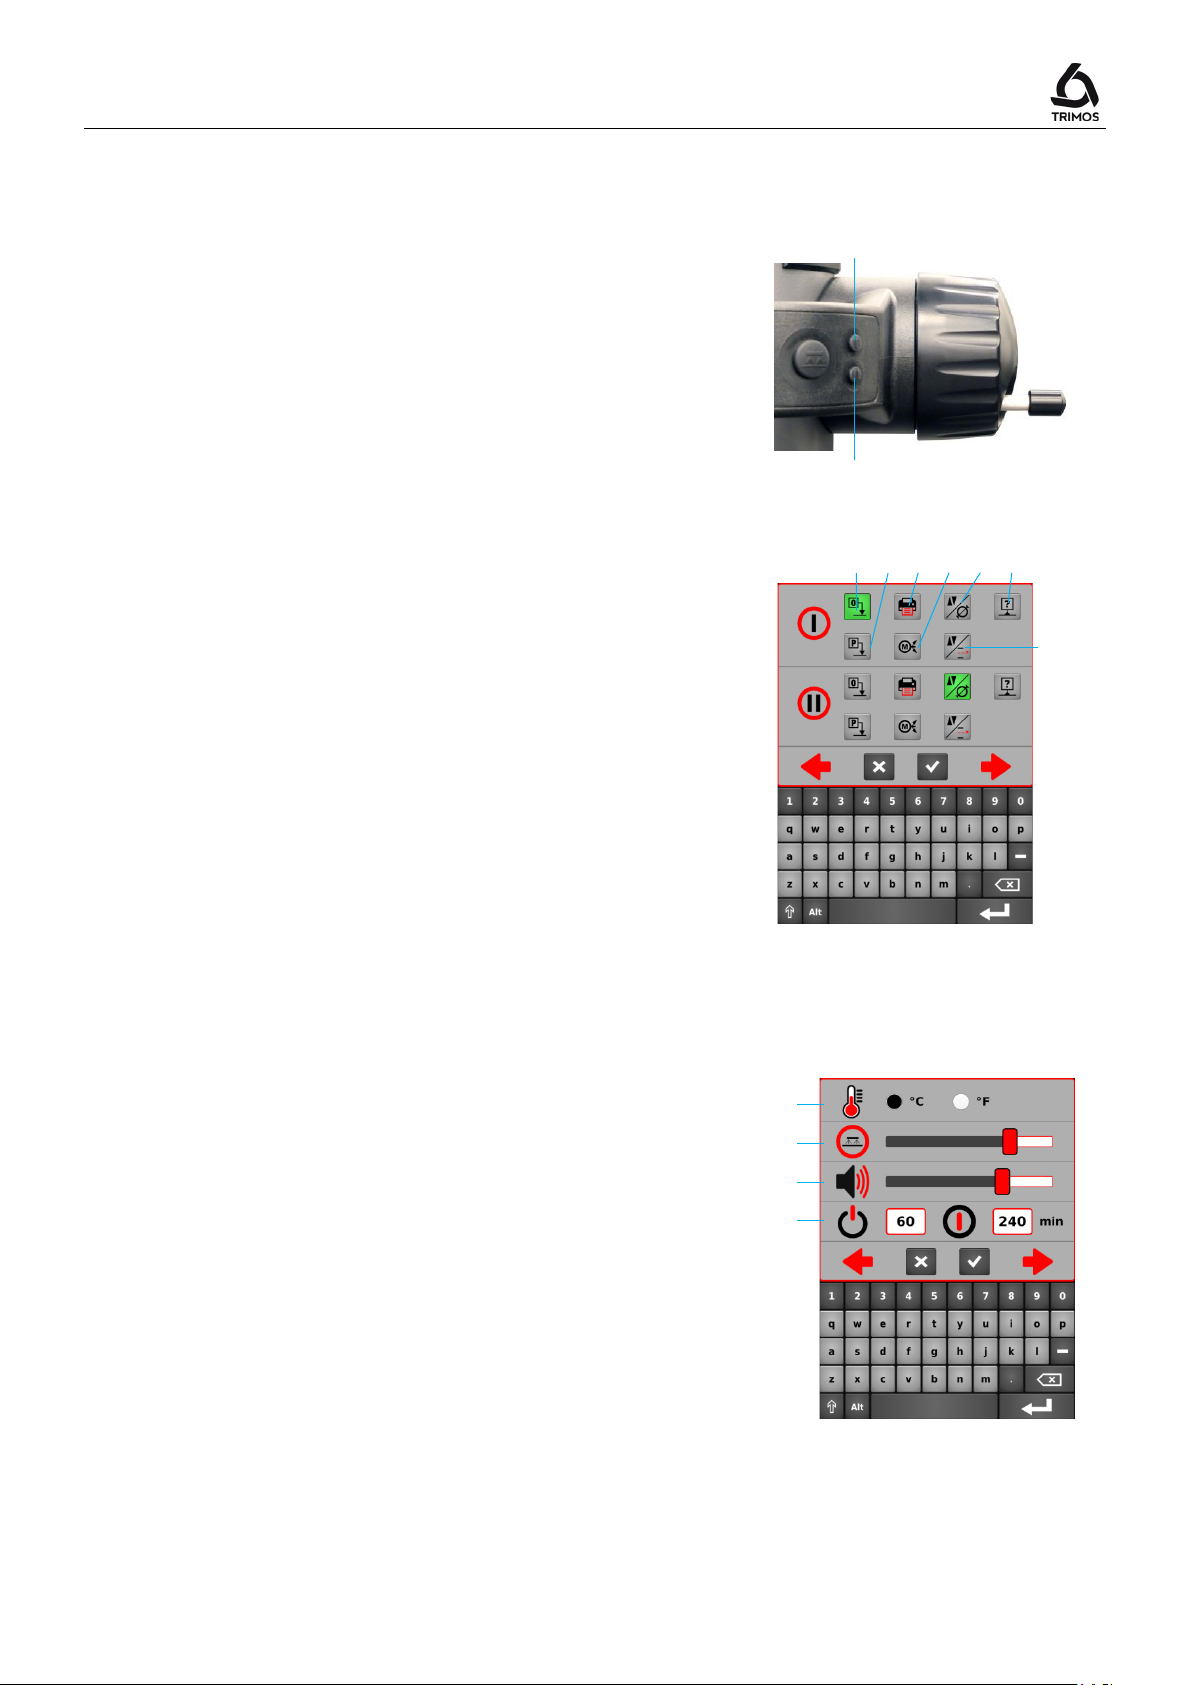
V7 / V9
10
11
12
13
14
15
16
I
II
17
18
19
20
13.3 Page 3
The buttons I and II of the displacement handle can be
programmed with various measuring functions.
10. Zero setting (§ 7.1)
11. Preset (§ 7.2.2)
12. Sending data and printing (§ 12)
13. Button I: Motorised movement upwards
Button II: Motorised movement downwards
14. Height / Diameter and centreline measurement
(§ 6.1 & 6.2)
15. Selection of references (§ 7.2.1)
16. Distance and Centreline Measurement (§ 7.10)
Select the function to be assigned to each button.
13.4 Page 4
17. Select the temperature unit °C or °F
18. Air cushion adjustment: Press the air cushion button
and simultaneously adjust its pressure with the
cursor.
19. Adjust the acoustic signal level: Set the intensity of
the volume with the cursor.
20. Standby mode / Complete stop: Enter the number of
minutes after which the instrument should enter into
standby mode, or switch-off completely.
750 50 0042 03 69
Page 72
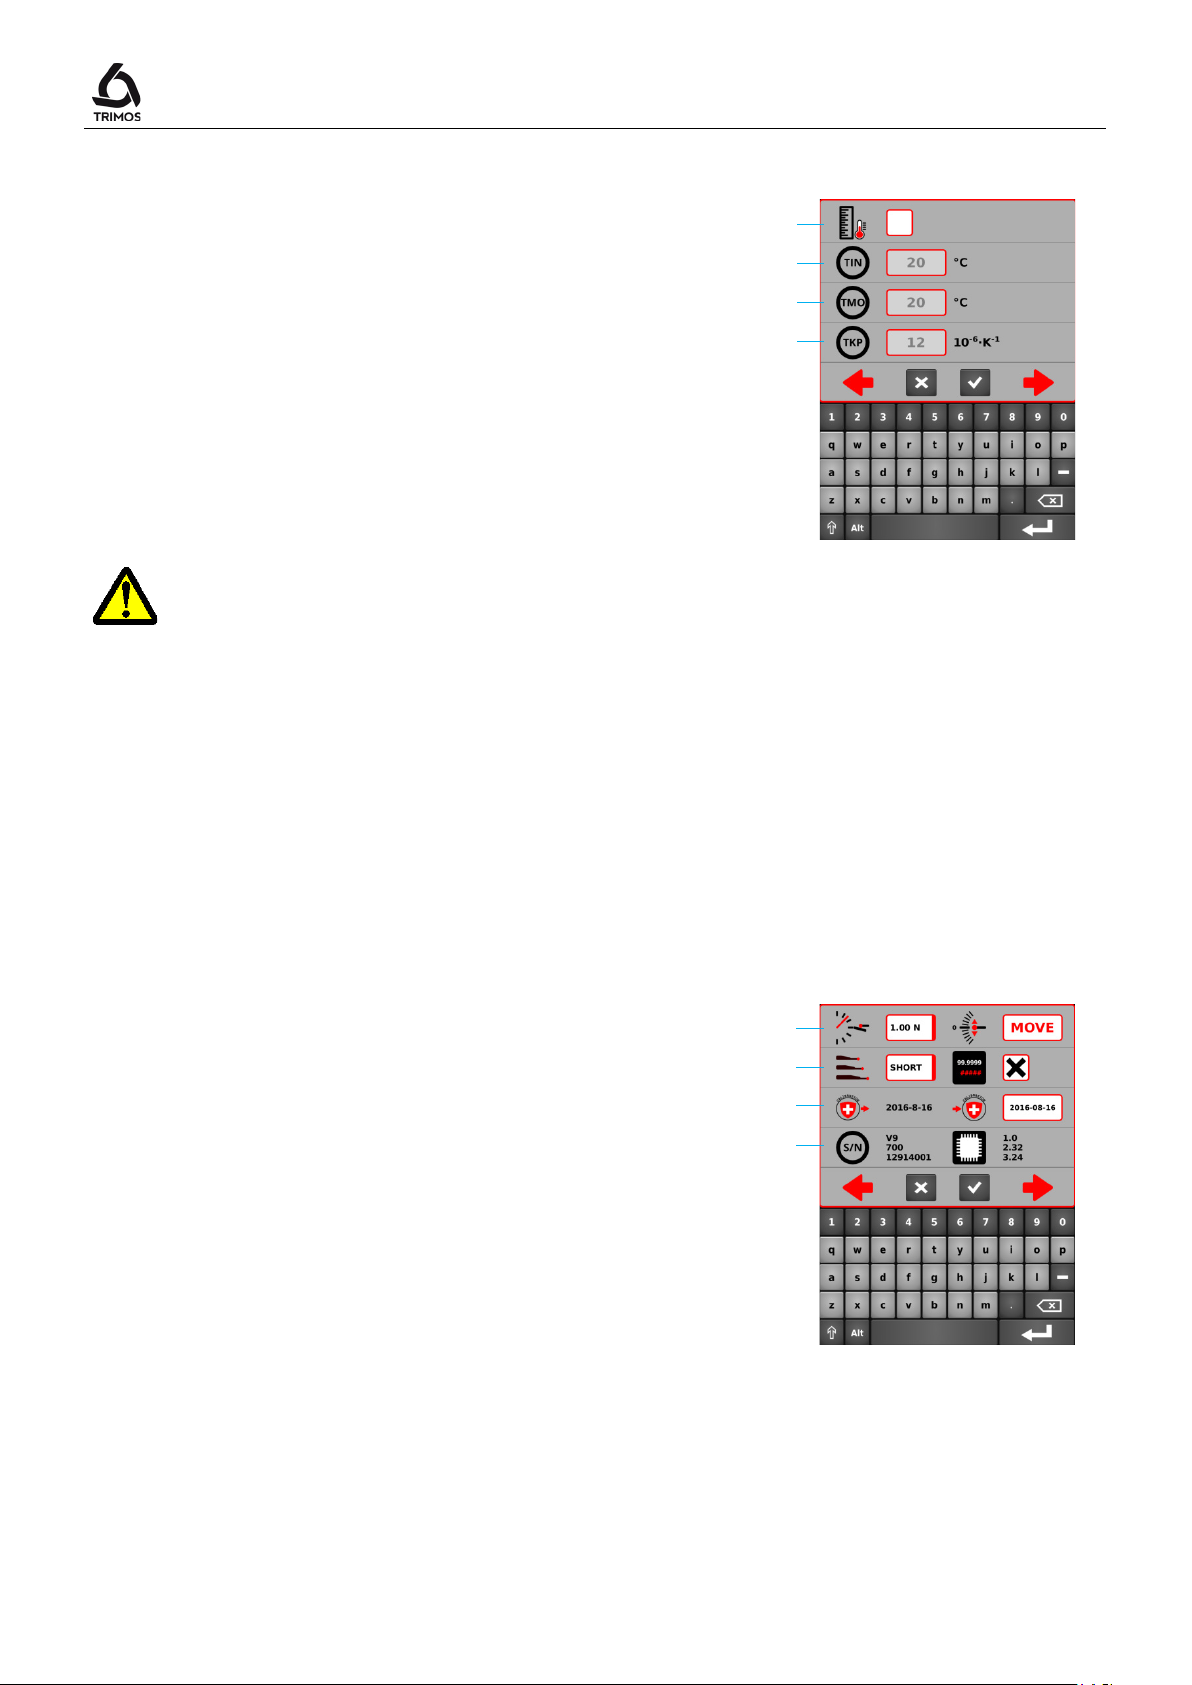
When this function is activated, the measured value is
25. Measuring force and carriage balancing:
Probing sensitivity can be adjusted, depending on the
manually. There is no function linked to this date, only
21
22
23
24
25
26
27
28
13.5 Page 5
21. Activation of manual temperature compensation.
compensated according to the instrument and part
temperatures and their expansion coefficient. The
displayed value is brought to a temperature of 20 °C
(68 °F).
22. Instrument temperature
23. Part temperature
User's Manual
24. Expansion coefficient of the part
When temperature compensation is activated, a symbol appears in the status bar of
the main screen. This function can result in large measurement deviations. It should
therefore be used with the greatest care!
The temperature values must be ebtered in degree Celsuis (°C).
13.6 Page 6
The measuring force can be adjusted by clicking on
the list and selecting the desired force. To adjust the
balancing of the carriage, refer to § 14.1 .
26. Probing sensitivity and 2nd line of the display:
type of insert used :
- SHORT: For short and stiff inserts
- MEDIUM: For medium long
- LONG: For long and less rigid inserts
Note:
Probing filters "MEDIUM" and "LONG" reduce the
probing robustness. Precision and repeatability can
differ from specifications according to the user.
In height measuring mode, the 2nd line of the display
can be hidden. To do this, uncheck the check box.
27. Date of last and next calibration:
The date of the next calibration can be entered
user information.
28. Model, type, serial no. and firmware version
750 50 0042 03 70
Page 73
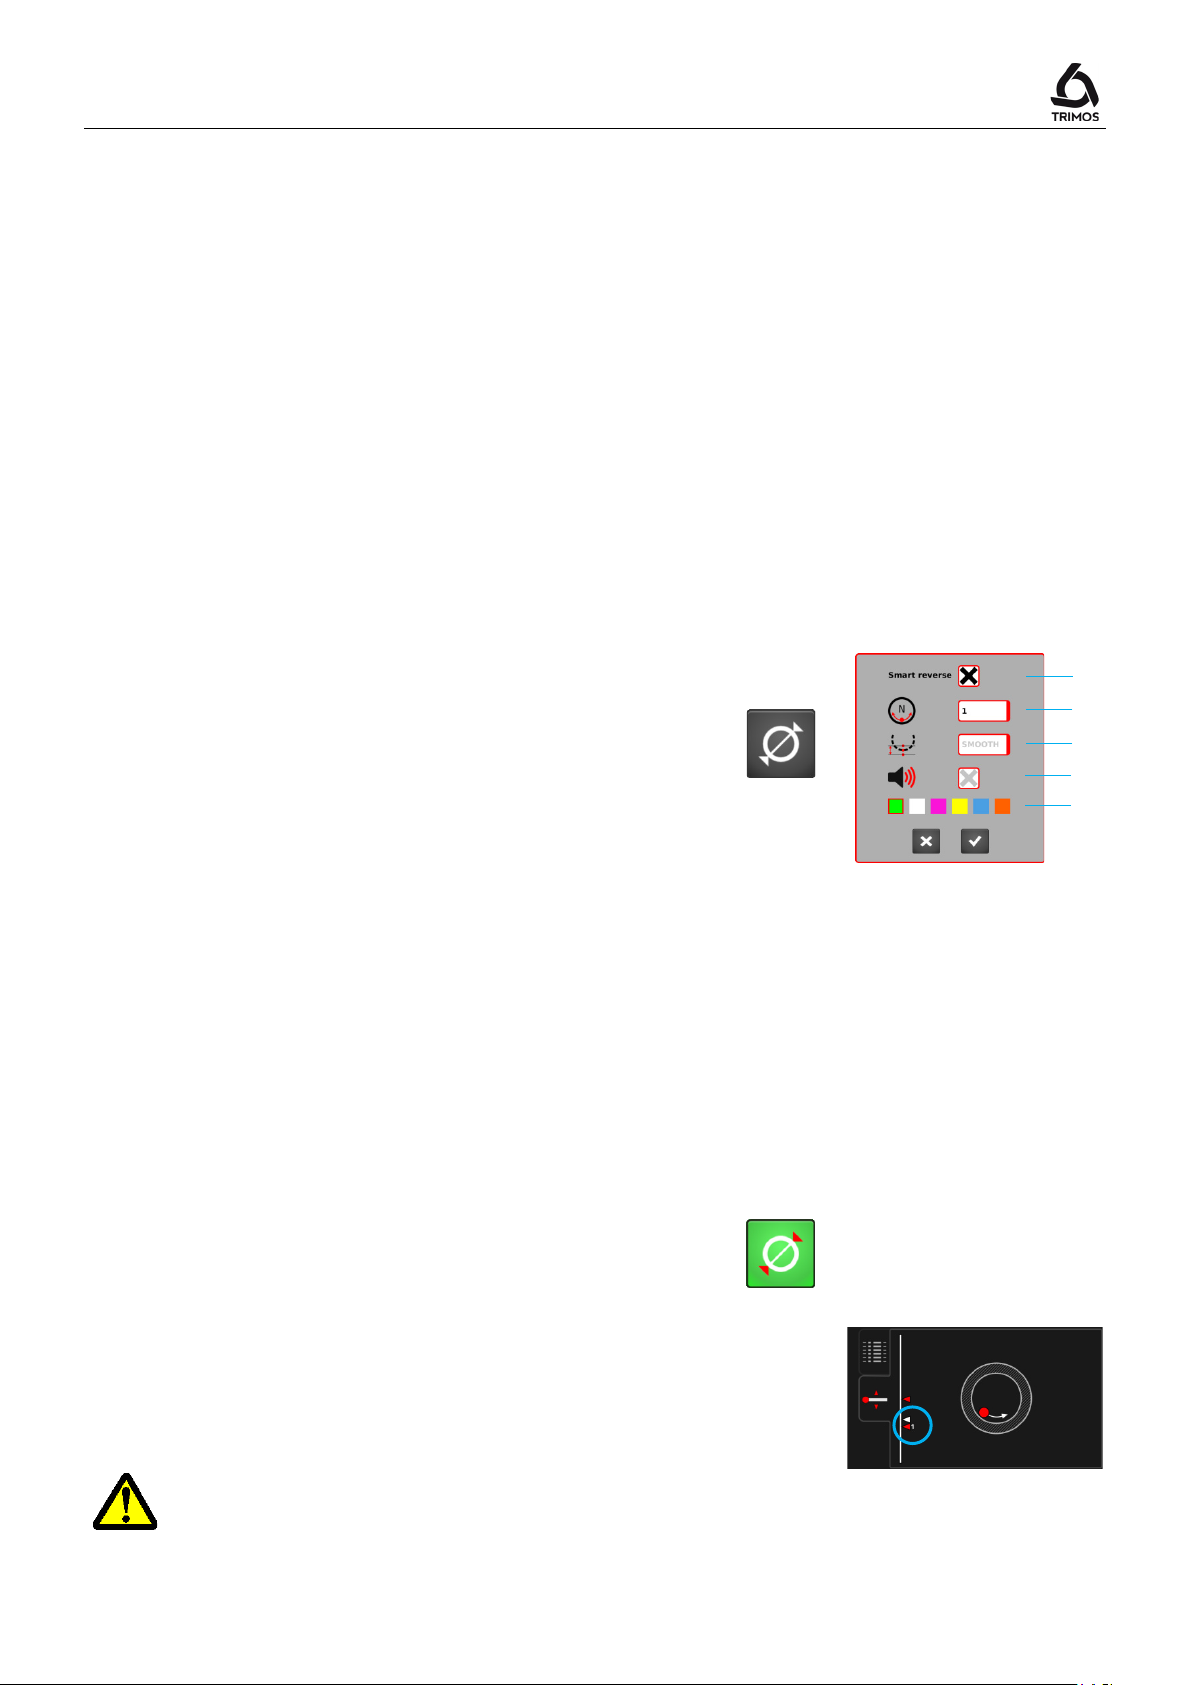
V7 / V9
The Smart Reverse function facilitates the measurement
It is possible to set this function by pressing the diameter
Smart Reverse
1 3 4
2
5
14. ADJUSTMENTS
14.1 Configuration diameter measurements "SMART REVERSE"
of diameter and makes it more efficient and playful. By
activating this function, the user is visually warned by a
colour "flash" on the screen as well as by a specific
acoustic signal that the reversal point has been reached.
key for 2 seconds:
1. Activation box for the
2. Number of passes required to validate the reversal
point.
function.
3. Surface quality of the measured diameter. This
function makes it possible, during several passes of
the reversal point, to ensure that this has been
reached. This parameter analyses the difference
between the extreme values of the reversal point and
compares them to validate the measurement.
- ROUGH: Raw surfaces rapidly measured
- MEDIUM: Machined surfaces normally measured
- SMOOTH: Polished surfaces delicately measured
4. Beep indicating the detection of the reversal point
Note:
Parameters 3 and 4 are only accessible when the
number of passes of the reversal point (defined in
point 2) is greater than 1.
5. Colour of the flash on the screen when detecting the
reversal point.
Note 1:
In diameter mode, when the Smart Reverse function is
activated, the symbol of the diameter function is
changed (red arrows).
> 2s
Note 2:
When the graphical help is displayed, the number of
detected reversal points is displayed next to the probe
indicator.
In Smart Reverse mode, the diameter measurement must start at the bottom. This is
valid for internal and external measurements.
750 50 0042 03 71
Page 74
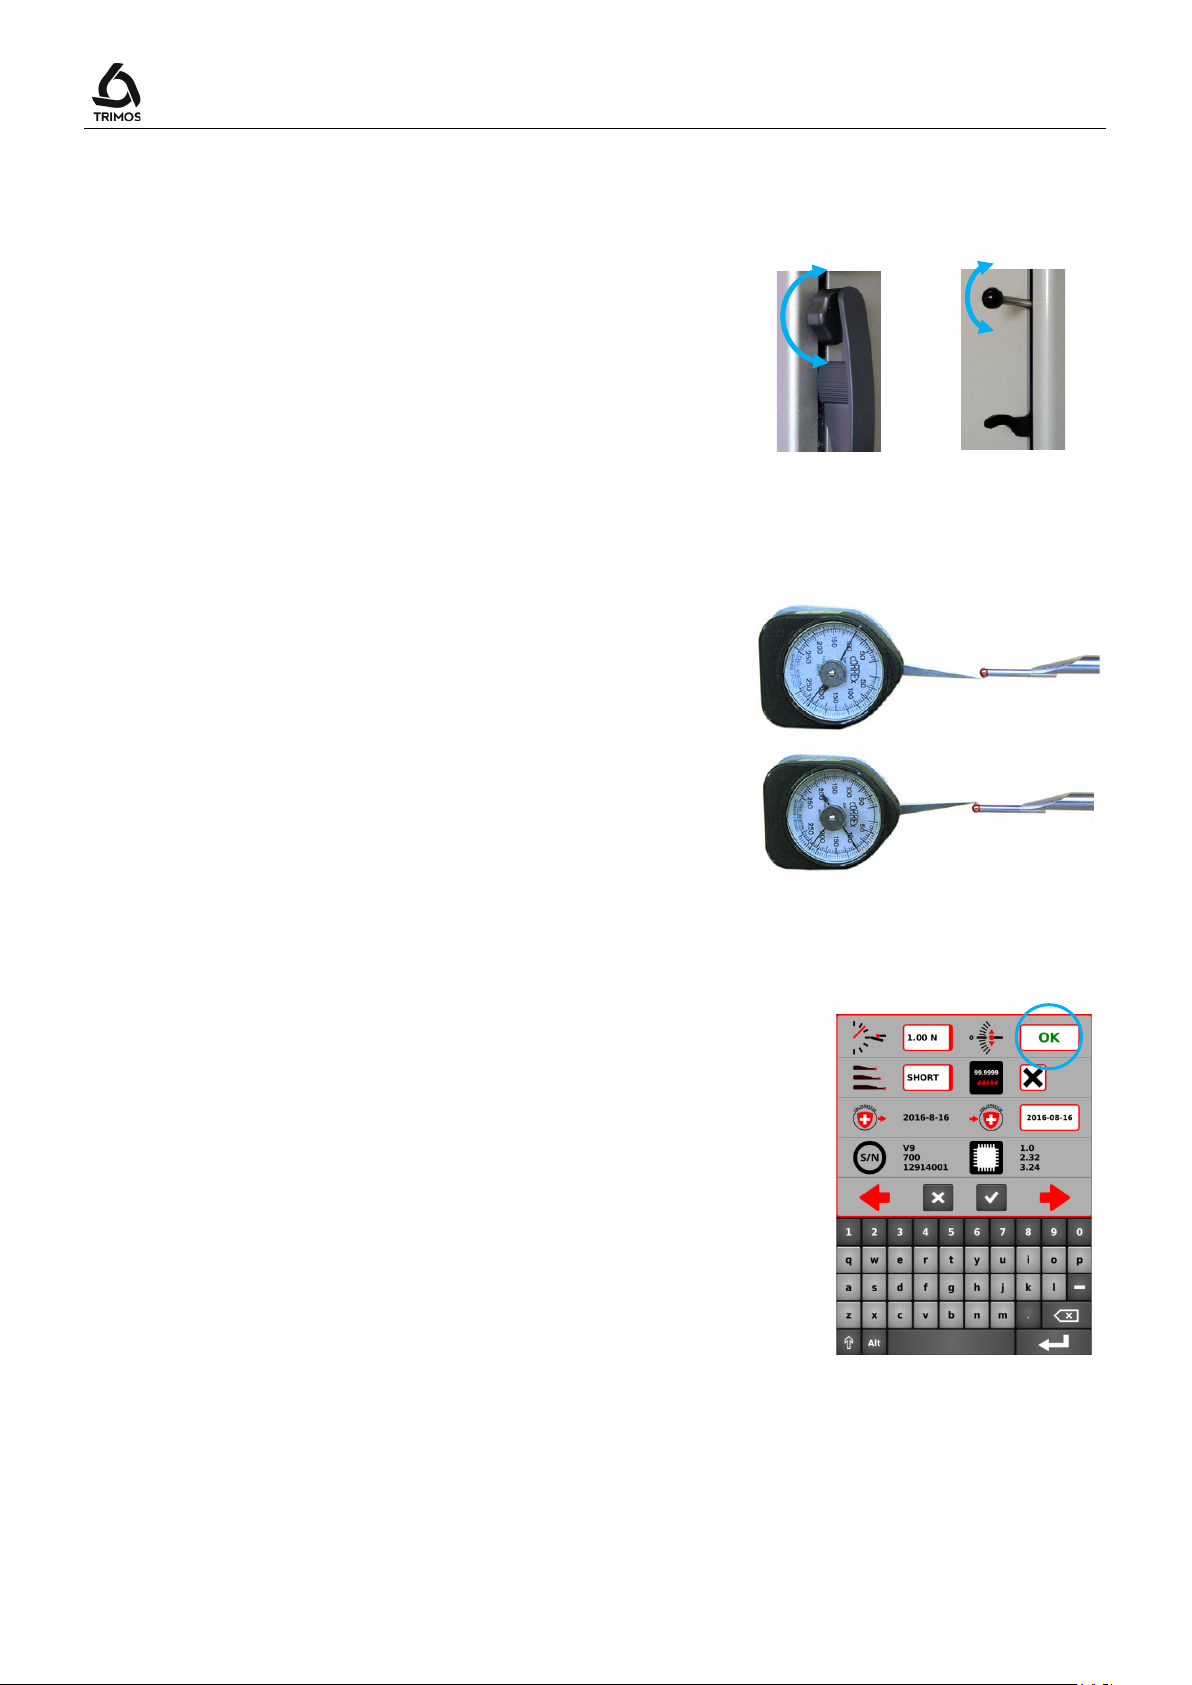
V7
V9
14.2 Adjustment of Floating Probe Suspension Balancing
In order to guarantee a constant measuring force in both
directions (upwards and downwards), it is necessary to
adjust the balancing of the floating probe suspension
according to the probe in use.
The adjustment Wheel (V7) or lever (V9) of the floating
suspension (1) allows compensating the weight of the
User's Manual
probe in use.
14.2.1 With Lever Dynamometer
A lever dynamometer is the most exact method of
checking the floating suspension balancing.
1. Press the key on the dynamometer until the acoustic
signal is heard and read the displayed force.
2. Now, repeat the operation in the other measurement
direction and compare the results.
3. Adjust the balancing if required.
14.2.2 With Function Integrated in the Instrument
The instrument offers a balancing help function.
1. Enter the configuration menu and scroll to balancing
adjustment.
2. Pull the dual carriage downwards until stop and
release so that it returns to its balance position. The
corresponding field must display OK. Else, adjust the
balancing.
3. Do the same by pushing the dual carriage upwards.
750 50 0042 03 72
Page 75
V7 / V9
When using the air cushion displacement for measurement procedures, all
A single press on the On/Off button will put the
battery, and 0.5 Hz if the charging unit is connected.
14.3 Air Cushion
The use of the air cushion facilitates the displacement of
the instrument on the granite plate. The activation of the
air cushion lifts the instrument at some µm. The air
cushion is not only used for the displacement of the
instrument in general but also when performing
measurements (e.g. diameters). The main application is
found particularly in industrial fields with large heavy
parts. Small parts can be moved without activating the air
cushion. This allows to significantly increase the
autonomy of the instrument.
The air cushion force can be adjusted in the set-up menu
(§ 13.4). It should be set on the minimum value allowing a
comfortable displacement of the instrument.
functions e.g. zero or preset setting of the display should be done with air cushion
to take into consideration the lifting amount of the instrument.
14.4 Standby Mode
instrument in standby mode.
When the instrument is in standby mode, the On/Off
button flashes at a frequency of 1 Hz if it works on
14.5 Resetting of the Instrument
To reinitialise the instrument if the application is blocked,
press the start-up button for 8 seconds. The instrument
switches-off and can be restarted normally.
> 8s
14.6 Cleaning
The plastic parts, the display unit as well as the painted parts of the instrument should be
cleaned using a slightly dampened (watered) fabric. Clean the air cushion pads using a clean
fabric, slightly dampened with alcohol.
The use of solvents such as acetone, white spirit, trichloethylene, petrol or
others for cleaning must absolutely be avoided!
750 50 0042 03 73
Page 76
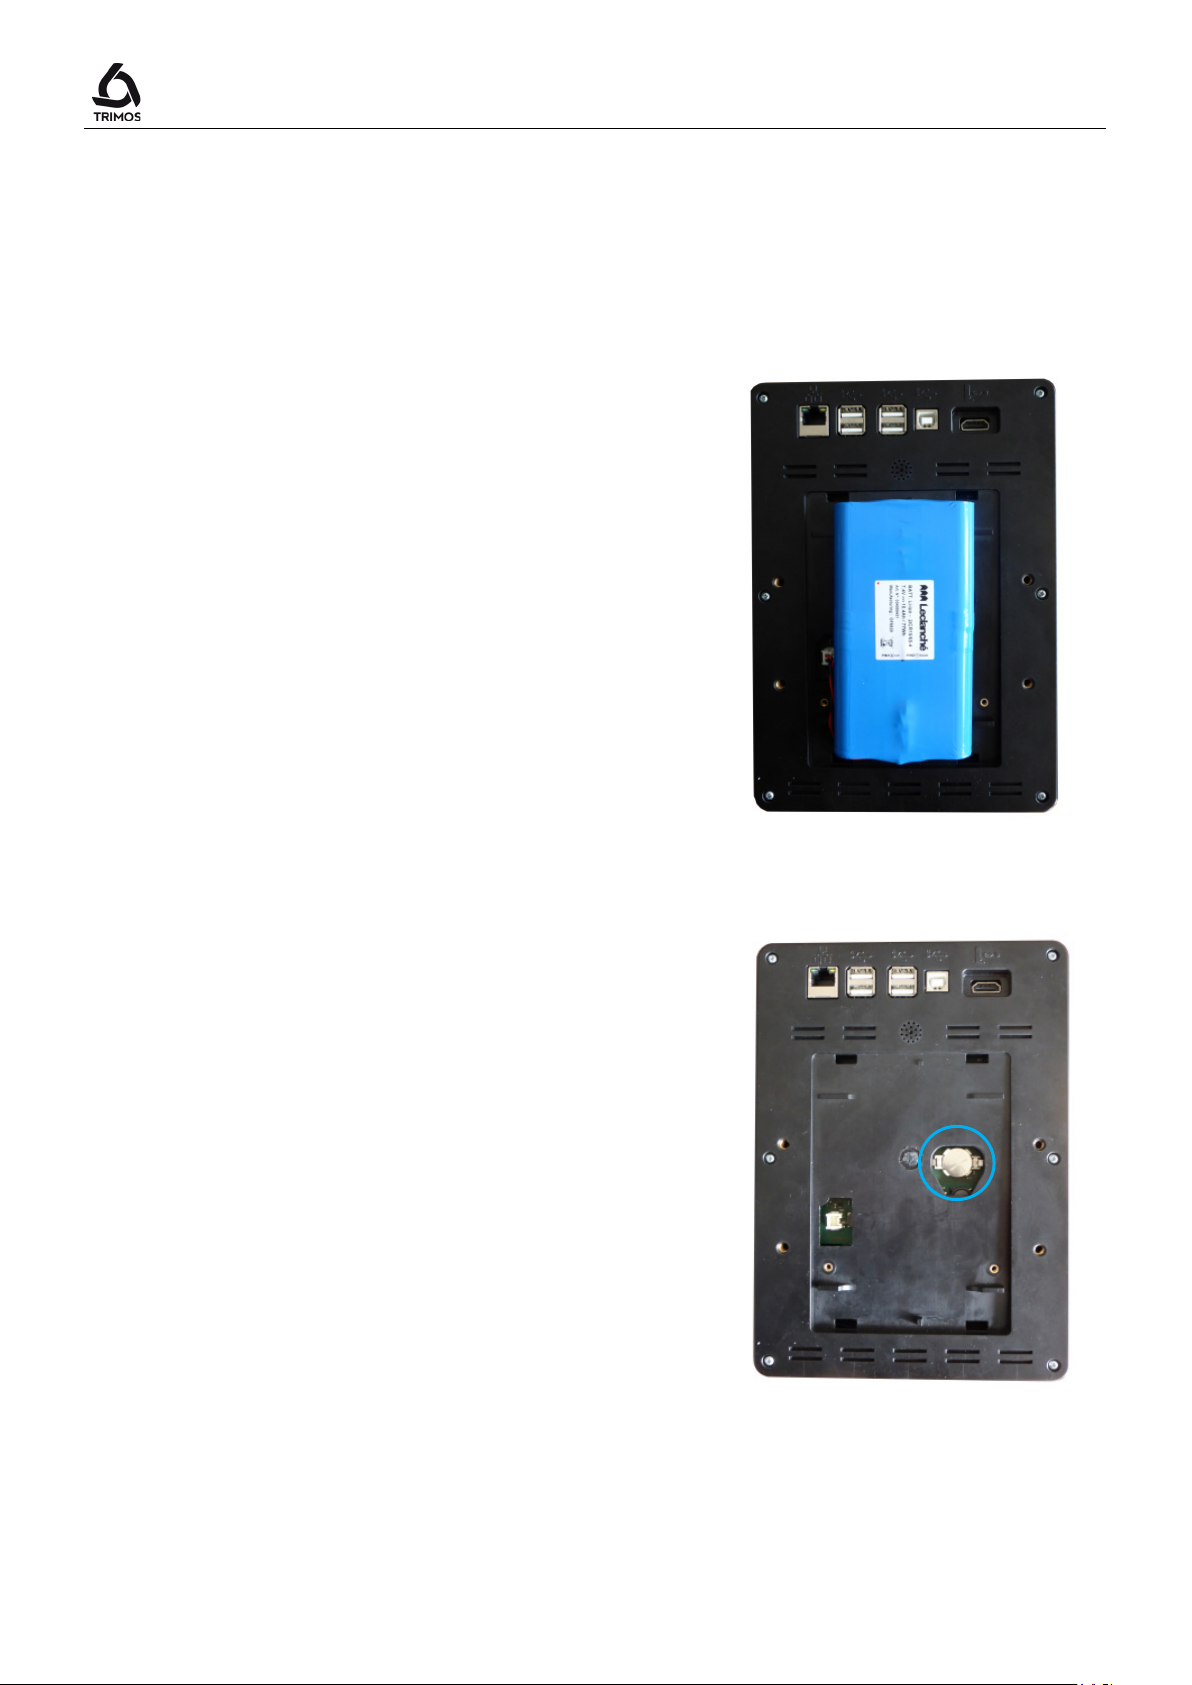
15. AFTER SALES SERVICE
15.1 Replacement of Battery Block
When the instrument autonomy is not sufficient any more,
the battery block must be replaced :
1. Get a battery block from your TRIMOS agent
(TRIMOS ref.: 3704 0022).
2. Open the lid at the back of the display.
3. Remove the old battery block and replace it by the
new one (pay attention to the connector polarity).
4. Close the lid tightly.
5. Load the new batteries.
User's Manual
15.2 Replacement of Clock Back-up Battery
If the instrument stops showing date and time after it is
switched off, replace the back-up battery:
1. Get a new Lithium 3V 125-140 mAh type CR1632
button battery (ref. TRIMOS: 3705 0005)
2. Open the lid at the back of the display.
3. Remove the old button battery and replace it
4. Close the lid tightly.
750 50 0042 03 74
Page 77
V7 / V9
Disposal of Waste Electrical and Electronic Equipment (WEEE) applicable
This symbol, found on the product or its packaging, indicates that it should not be
your local authorities or your TRIMOS supplier.
15.3 Recycling of Electronic Components
throughout the European Union and other European countries with separate
collection programs
treated as household waste. It should be handed over to an official collection
point for the recycling of electrical and electronic equipment. A correct recycling
of this product will help to preserve the environment and the natural resources.
For more detailed information about the recycling of this product, please contact
15.4 Complaints / Repairs
In case of problems, please contact your local TRIMOS agent.
For any transport, use the original packing or an adequate one.
15.5 Agents
You can find the official TRIMOS agents list on the website www.trimos.com.
750 50 0042 03 75
Page 78
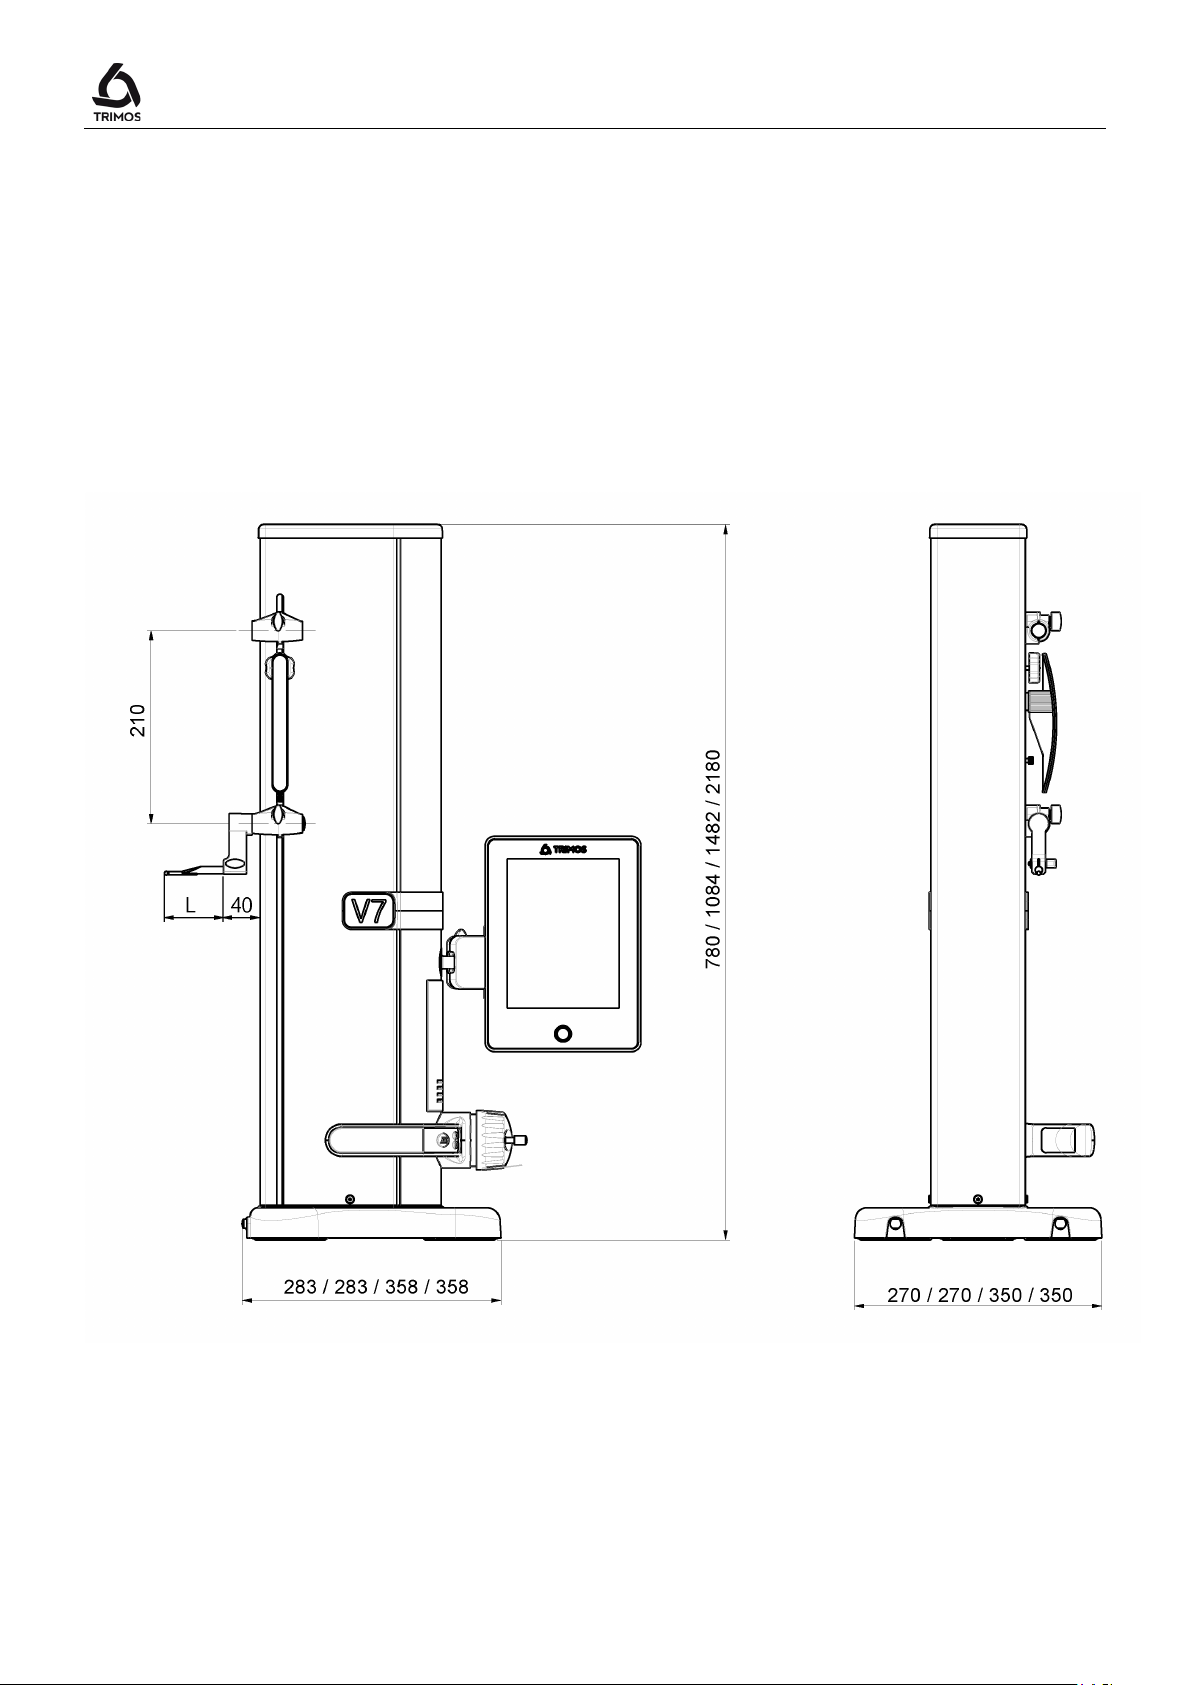
16. TECHNICAL SPECIFICATIONS
16.1 V7
User's Manual
L: depends on the measuring insert used
750 50 0042 03 76
Page 79
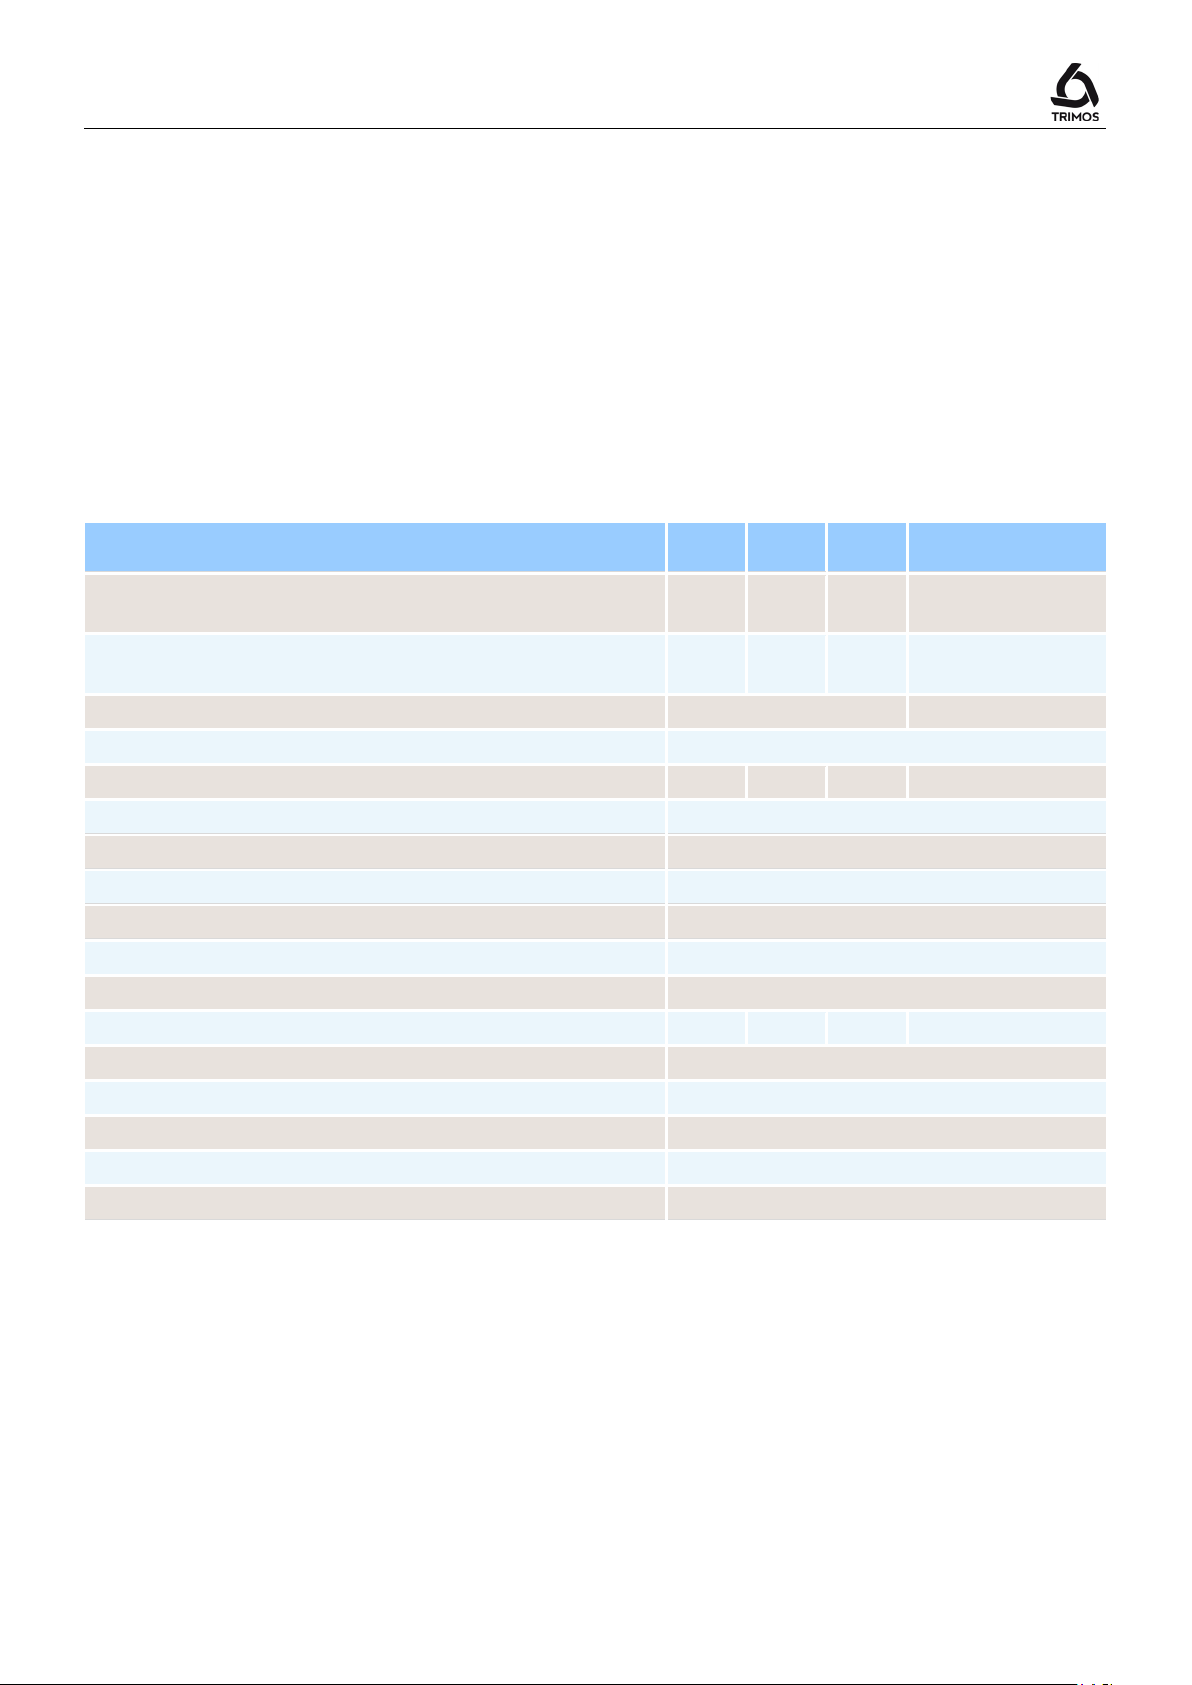
V7 / V9
407
(16)
711
(28)
1110
(44)
1810
(71)
719
(28)
1023
(40)
1422
(56)
2122
(83)
2 + L(mm)/400
2.5 + L(mm)/300
1 (Ø: 2)
Max deviation from perpendicularity, S
µm
5 8 11
25
0.0001 (0.00001)
0.75 ÷ 1.5
12
USB / RS232
Air cushion
Yes
IP40
Weight kg
22
25
34
41
400
Max. manual displacement speed m/s
1000
Storage temperature °C
-10 ÷ +40
5 ÷ 75 % (without condensation)
V7 400 700 1100 1800
Measuring range mm (in)
Application range mm (in)
Max. permissible errors, B
Repeatability, R
µm
MPE
µm
MPE
MPE
Max. resolution mm (in)
Measuring force N
Autonomy h
Data output
Protection grade of measuring system (CEI 60529)
Max. weight of measuring insert & holder g
Operational temperature °C +10 ÷ +40
Relative humidity (operation and storage) HR
The above values have been determined according to ISO 13225 with the standard probe (TA-MI-101).
is defined as twice the standard deviation (2s) over 20 measurements.
R
MPE
750 50 0042 03 77
Page 80
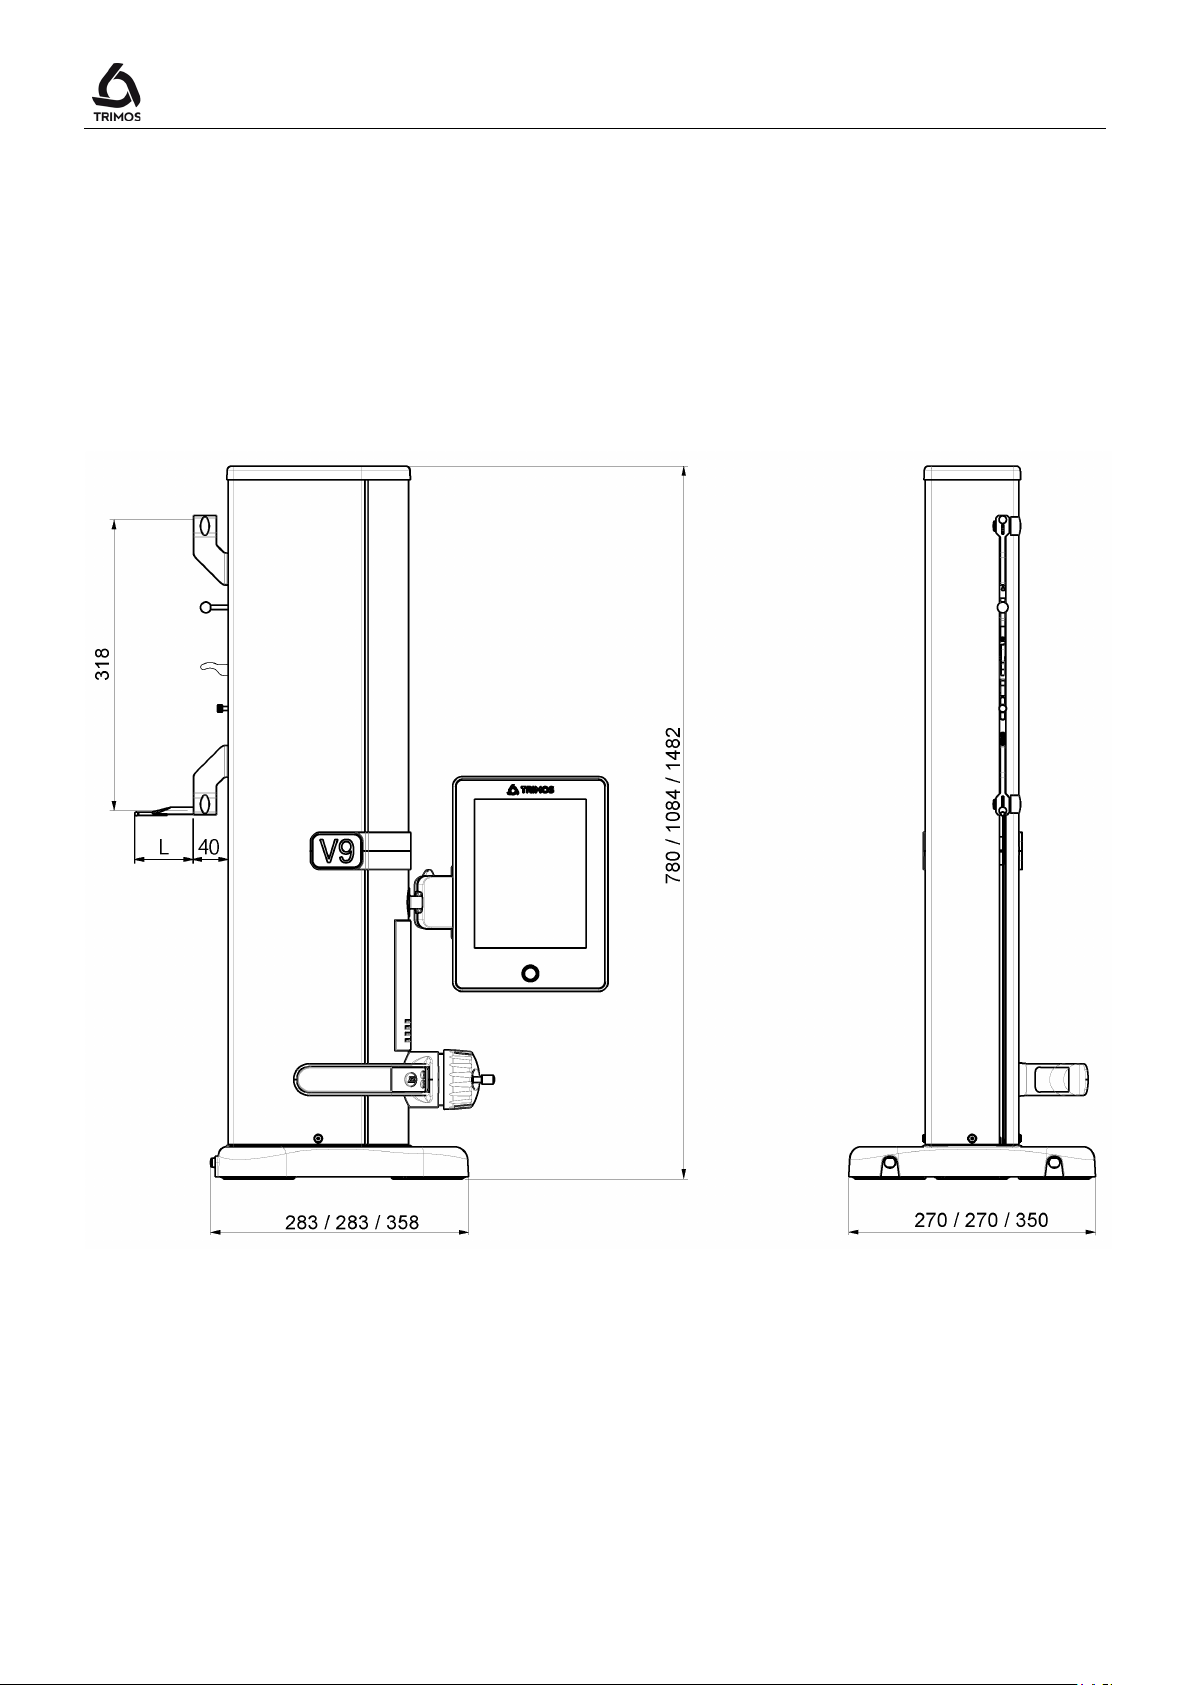
16.2 V9
User's Manual
L: depends on the measuring insert used
750 50 0042 03 78
Page 81
V7 / V9
406 (16)
710 (28)
1109 (43)
724 (28)
1028 (40)
1427 (56)
1.2 + L(mm)/1000
Repeatability, R
µm
0.4 (Ø: 1)
5 8 11
0.0001 (0.00001)
0.75 ÷ 1.5
12
Data output
USB / RS232
Yes
Protection grade of measuring system (CEI 60529)
IP40
22
25
34
Max. weight of measuring insert & holder g
150
1000
Operational temperature °C
+10 ÷ +40
Storage temperature °C
-10 ÷ +40
5 ÷ 75 % (without condensation)
V9 400 700 1100
Measuring range mm (in)
Application range mm (in)
Max. permissible errors, B
MPE
Max deviation from perpendicularity, S
µm
MPE
µm
MPE
Max. resolution mm (in)
Measuring force N
Autonomy h
Air cushion
Weight kg
Max. manual displacement speed m/s
Relative humidity (operation and storage) HR
The above values have been determined according to ISO 13225 with the standard probe (TA-MI-119).
is defined as twice the standard deviation (2s) over 20 measurements.
R
MPE
.
750 50 0042 03 79
Page 82
17. DECLARATION OF CONFORMITY
DECLARATION DE CONFORMITE
KONFORMITÄTSERKLÄRUNG
DECLARATION OF CONFORMITY
TRIMOS déclare que les instruments de mesure
TRIMOS erklärt, dass die Messgeräte
TRIMOS declares that the measuring instruments
V7 & V9
sont conformes aux directives suivantes :
mit folgenden Richtlinien übereinstimmen :
conforms with the following directives :
CEM / EMV / EMC : EN 61326-1:2013
IEC 61326-1:2012 (ed2.0)
FCC 47, part 15, Class B
Sécurité / Sicherheit / Safety : IEC 61010-1
User's Manual
Patrice Kemper, CEO
Renens, 2016-04-14
TRIMOS SA
Av. de Longemalle 5
CH - 1020 Renens
T. + 41 21 633 01 01
F. + 41 21 633 01 02
www.trimos.com
750 50 0042 03 80
 Loading...