

Page 1

User Guide
Network Management System
tpNMS
1910012005 REV 1.1.0
March 2017
Page 2

COPYRIGHT & TRADEMARKS
Specifications are subject to change without notice. is a registered trademark
of TP-Link Technologies Co., Ltd. Other brands and product names are trademarks or
registered trademarks of their respective holders.
No part of the specifications may be reproduced in any form or by any means or used to
make any derivative such as translation, transformation, or adaptation without permission
from TP-Link Technologies Co., Ltd. Copyright © 2017 TP-Link Technologies Co., Ltd. All
rights reserved.
http://www.tp-link.com
Intended Readers
This Guide is intended for network managers familiar with IT concepts and network
terminologies.
Conventions
Some models featured in this guide may be unavailable in your country or region. For local
sales information, visit
When using this guide, please notice that features of the Pharos Control may vary slightly
depending on the software version you have. All screenshots, images, parameters and
descriptions documented in this guide are used for demonstration only.
The information in this document is subject to change without notice. Every effort has
been made in the preparation of this document to ensure accuracy of the contents, but
all statements, information, and recommendations in this document do not constitute
the warranty of any kind, express or implied. Users must take full responsibility for their
application of any products.
http://www.tp-link.com
.
Page 3

Content
1 Quick Start ............................................................................................................... 8
1.1 Prepare for Installation .............................................................................................................. 9
1.1.1 Computer Requirements .................................................................................................. 9
1.1.2 Compatible Devices ........................................................................................................... 9
1.1.3 Installation Topology ......................................................................................................... 9
1.2 Download and Install tpNMS ................................................................................................. 12
1.3 Log in to the Application ........................................................................................................ 12
1.3.1 Launch the tpNMS ............................................................................................................12
1.3.2 Fix the Launch Problems ................................................................................................13
1.3.3 Log in to tpNMS .................................................................................................................16
1.4 Change Your Password and Email ...................................................................................... 18
1.5 Set the Email Server for Alarm Notifications .................................................................. 18
2 Monitor Network ..................................................................................................20
2.1 Customize the Widgets on the Home Screen ................................................................ 21
2.2 View the Widgets ...................................................................................................................... 23
3 Discover and Manage Resources ...................................................................25
3.1 Discover Devices on Your Network ................................................................................... 26
3.1.1 Schedule a Discovery Job .............................................................................................26
3.1.2 Manage Discovery Templates .....................................................................................31
3.2 View and Manage Devices .................................................................................................... 33
3.2.1 View the Device List .........................................................................................................33
3.2.2 Remove a Device ...............................................................................................................34
3.2.3 Synchronize a Device ......................................................................................................35
3.2.4 Log in to a Device ..............................................................................................................35
3.2.5 Ping or Traceroute a Device .........................................................................................36
3.2.6 Reboot a Device ................................................................................................................37
3.2.7 Access Config ....................................................................................................................37
Page 4

3.3 Import Devices .......................................................................................................................... 39
3.4 Add Devices into Groups ....................................................................................................... 40
3.4.1 View Groups ........................................................................................................................40
3.4.2 Add Devices to Static Group ........................................................................................41
3.4.3 Add Devices to Dynamic Group ..................................................................................42
3.4.4 Delete Groups.....................................................................................................................42
3.5 View and Manage Links on Your Network ....................................................................... 42
3.5.1 View Links on Your Network .........................................................................................42
3.5.2 Discover Links on Your Network .................................................................................43
3.5.3 Add a Link .............................................................................................................................44
3.6 Manage Maps and Topologies ............................................................................................. 45
3.6.1 View the Maps in the Map List ......................................................................................46
3.6.2 Add a Map ............................................................................................................................46
3.6.3 Add a Device .......................................................................................................................46
3.6.4 Add a Link .............................................................................................................................47
3.6.5 Delete a Device, Link or Map ........................................................................................48
3.6.6 Refresh the Topology ......................................................................................................48
3.6.7 Auto-Refresh.......................................................................................................................48
4 Monitor Devices and Network ..........................................................................49
4.1 Monitor the Top 10 Devices ................................................................................................. 50
4.2 Monitor the Top 10 Interfaces ............................................................................................. 51
4.3 Specify the Device Monitor .................................................................................................. 54
4.4 Manage and View Dashboard .............................................................................................. 60
4.4.1 Create or Modify a Dashboard View ..........................................................................60
4.4.2 Launch a Dashboard View .............................................................................................63
4.4.3 Display the Dashboard View .........................................................................................64
5 Manage Alarms and Traps ................................................................................. 65
5.1 View and Manage Traps Sent from Devices ................................................................... 66
Page 5

5.1.1 View the Traps ....................................................................................................................66
5.1.2 Delete the Traps ................................................................................................................66
5.1.3 Export the Traps ................................................................................................................66
5.2 View and Manage Alarm Configurations .......................................................................... 66
5.2.1 View and Manage Current Alarm Configurations..................................................68
5.2.2 Add a New Alarm Configuration ..................................................................................69
5.2.3 Modify Current Alarm Configurations .......................................................................71
5.3 View and Manage Alarms ....................................................................................................... 74
5.3.1 View and Manage Current Alarms ..............................................................................74
5.3.2 View and Manage History Alarms ...............................................................................77
5.4 View and Manage Remote Notice Profiles ...................................................................... 78
5.4.1 View and Manage the Recipients ................................................................................78
5.4.2 View and Manage the Notice Rules ............................................................................80
6 Manage the Configuration and Firmware Files ...........................................86
6.1 Back Up Device Configurations .......................................................................................... 87
6.1.1 Add or Modify a Backup Schedule..............................................................................87
6.1.2 Execute a Backup Schedule ..........................................................................................89
6.1.3 View the Execution Result of a Backup Schedule .................................................90
6.1.4 Remove a Backup Schedule .........................................................................................91
6.2 Restore Device Configurations ........................................................................................... 92
6.2.1 Import a Configuration File ............................................................................................92
6.2.2 Modify a Configuration File ............................................................................................93
6.2.3 Remove a Configuration File .........................................................................................94
6.2.4 Add a Restore Schedule .................................................................................................95
6.3 Upgrade Device Firmwares ................................................................................................... 97
6.3.1 Import a Firmware File .....................................................................................................97
6.3.2 Remove a Firmware File ..................................................................................................98
6.3.3 Add a Firmware Upgrade Schedule ............................................................................99
6.4 View and Manage Schedules .............................................................................................. 100
Page 6

6.4.1 View the Execution Status of the Schedules ....................................................... 101
6.4.2 Edit a Schedule ............................................................................................................... 101
6.4.3 Remove a Schedule ....................................................................................................... 103
6.4.4 Execute a Schedule ...................................................................................................... 103
6.5 Example: Backup Configuration File for a Device ....................................................... 104
6.6 Example: Upgrade Firmware for Several Devices ......................................................111
7 View and Manage Tasks ...................................................................................114
7.1 View and Manage the Tasks ...............................................................................................115
7.1.1 View the Tasks ................................................................................................................ 115
7.1.2 Enable/Disable the Tasks ............................................................................................ 116
7.1.3 Delete the Tasks ............................................................................................................. 116
8 Manage Users .....................................................................................................117
8.1 View and Manage Roles........................................................................................................118
8.1.1 View Roles ......................................................................................................................... 118
8.1.2 Add a Role ......................................................................................................................... 119
8.1.3 Modify a Role....................................................................................................................120
8.1.4 Delete a Role .................................................................................................................... 121
8.2 View and Manage Users .......................................................................................................121
8.2.1 View Users ........................................................................................................................ 122
8.2.2 Add a User ......................................................................................................................... 122
8.2.3 Modify a User ................................................................................................................... 123
8.2.4 Delete a User .................................................................................................................... 124
8.3 View and Log off Users ......................................................................................................... 124
9 System and Global Settings ............................................................................126
9.1 Device Count ............................................................................................................................ 127
9.2 Configure Email Server ......................................................................................................... 127
9.3 Configure Idle Timeout ......................................................................................................... 128
9.4 Configure Auto Refresh Interval .......................................................................................129
Page 7

9.5 Configure Data Retention .................................................................................................... 129
9.6 Icons in the Upper-Right Region .......................................................................................130
9.6.1 Notification Messages ................................................................................................. 130
9.6.2 Current Alarms ................................................................................................................ 131
9.6.3 System Information ....................................................................................................... 131
9.6.4 Current Account ............................................................................................................. 132
9.6.5 Log out ............................................................................................................................... 132
Page 8

1
Quick Start
The tpNMS (TP-Link Network Management System) is a centralized management
software that allows you to discover, monitor and configure your TP-Link Managed
Switches using a web browser. Follow the steps below to complete the basic
settings of the tpNMS.
Prepare for Installation
1.
Download and Install tpNMS
2.
Log in to the Application
3.
Change Your Password and Email
4.
Set the Email Server for Alarm Notifications
5.
Page 9

1.1 Prepare for Installation
You can install the tpNMS to centrally manage the switches in the LAN or in
different network segments.
• Computer Requirements
• Compatible Devices
• Installation Topology
1.1.1 Computer Requirements
CPU: Duel Core 2.8GHz or above
·
RAM: 4GB RAM (32-bit OS) or 8GB RAM (64-bit OS)
·
HD Space: 20GB or above
·
Operating System
·
Web Browser
·
24 (or above), or Microsoft Internet Explorer 8-11.
Note:
We recommend you deploy the tpNMS on a 64-bit operating system to guarantee
the software stability.
: Microsoft Windows XP/Vista/7/8/10
: Mozilla Firefox 32 (or above), Google Chrome 37 (or above), Opera
1.1.2 Compatible Devices
TP-Link 2/3/5/T series switches.
1.1.3 Installation Topology
You can deploy tpNMS to manage devices in three types of network topologies.
In the Same LAN
·
If you want to manage the compatible switches in the same LAN with the tpNMS
host, refer to the following network topology.
9
Page 10
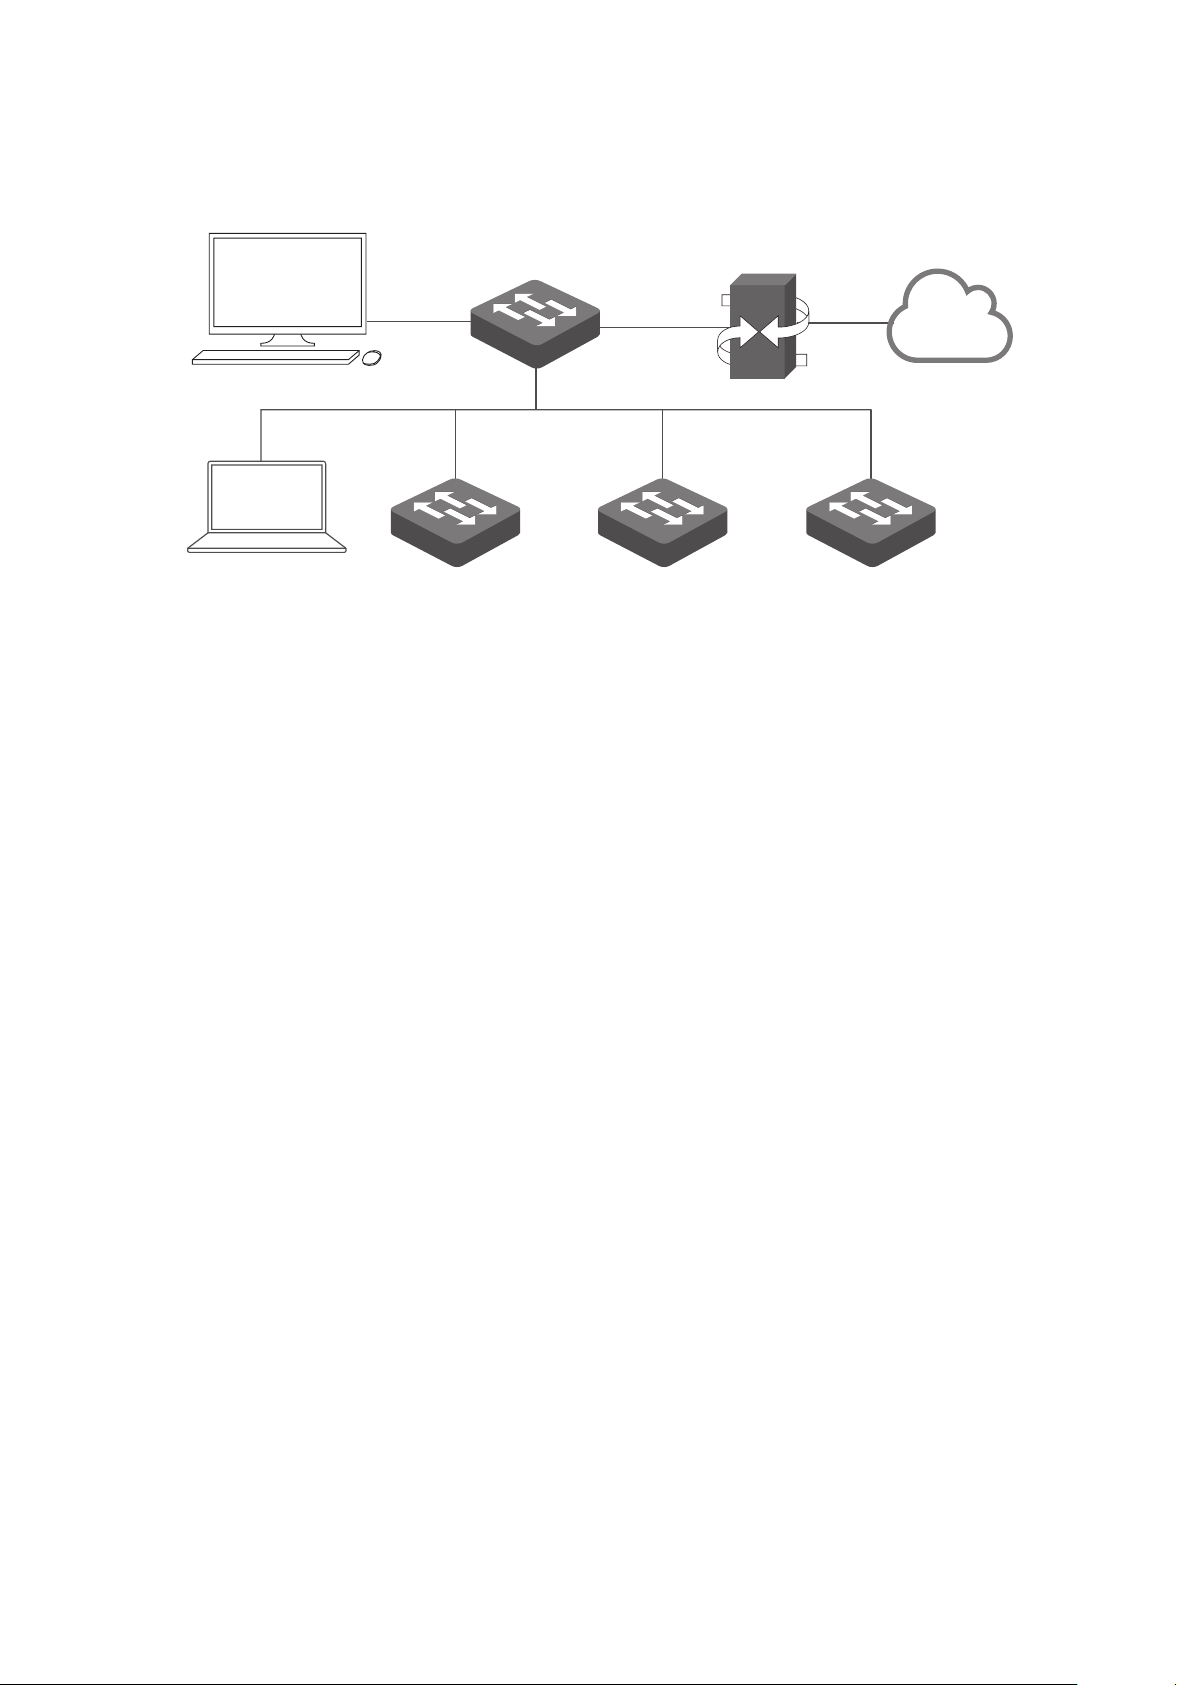
Figure 1-1 Topology of the same LAN
Host A (tpNMS Host)
IP: 192.168.0.100
tpNMS
Switch
Host B
IP: 192.168.0.200
2/3/5/T Series Switch
Router (Gateway)
LAN IP:192.168.0.1
2/3/5/T Series Switch
2/3/5/T Series Switch
Internet
In the LAN, only one host needs to install tpNMS. The host is called as tpNMS Host.
And the other hosts in the same LAN can access the tpNMS Host to manage the
network. In this topology, you can visit tpNMS interface from Host B by entering
“192.168.0.100: 8888” in a web browser. It’s recommended to set a static IP
address to the tpNMS Host for the convenient login to the tpNMS interface.
Note:
The tpNMS must be running all the time when you manage the network.
In Different Network Segments
·
If the tpNMS Host needs to manage switches in different network segments, refer
to the following topology. \
10
Page 11
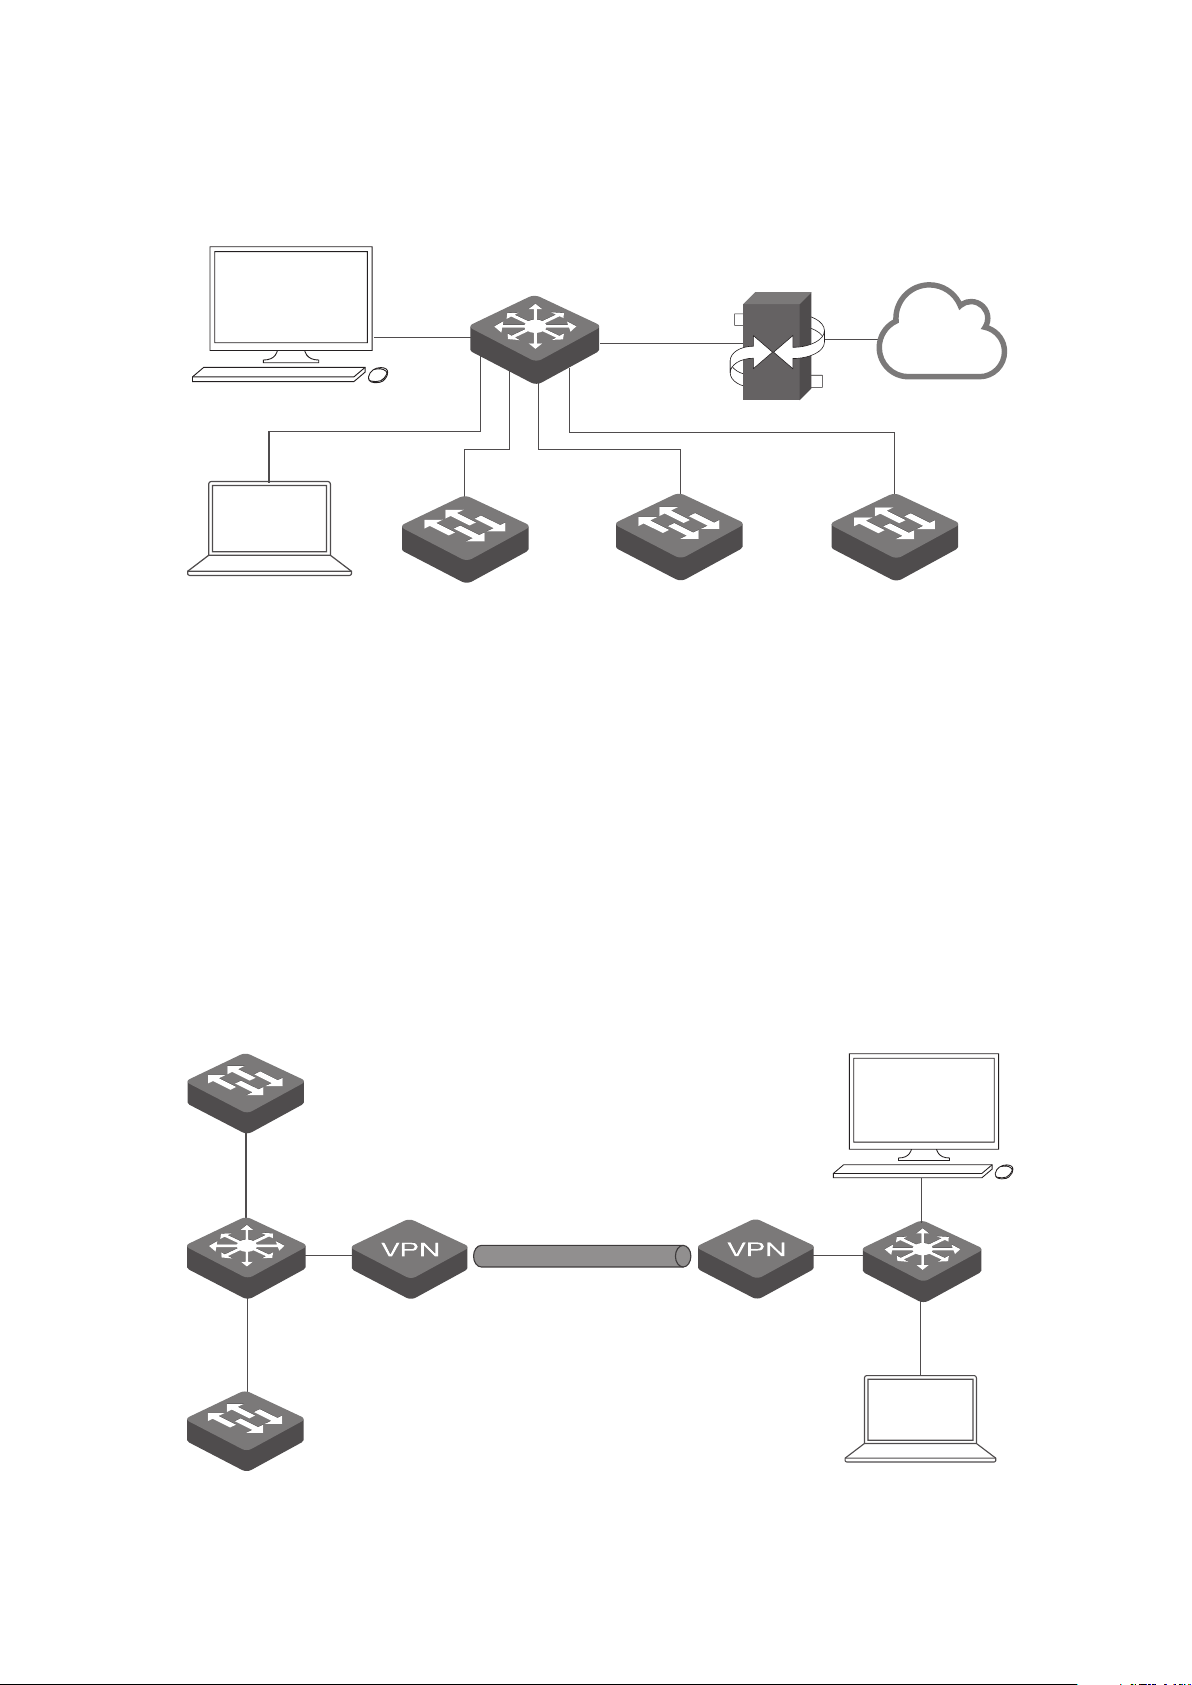
Figure 1-2 Topology with different subnets
Host A (tpNMS Host)
L2+/L3 Switch
IP: 192.168.0.100
tpNMS
L2+/L3 Switch
Router (Gateway)
LAN IP:192.168.0.1
Internet
Host B
IP: 192.168.1.200
2/3/5/T Series Switch
IP: 192.168.2.200
2/3/5/T Series Switch
IP: 192.168.3.200
2/3/5/T Series Switch
IP: 192.168.4.200
The tpNMS Host and the switches are connected to different ports on the L2+/L3
switch. The tpNMS Host and the switches can access each other via the routing
interfaces configured on the L2+/L3 switch. To ensure the switches can be
discovered by the tpNMS Host and be managed, configure the switches to send
SNMP traps to the IP address of the tpNMS host.
Over VPN Tunnel
·
The tpNMS Host can manage the switches over the VPN tunnel, referring to the
following topology.
Figure 1-3 Topology over VPN tunnel
2/3/5/T Series Switch
IP: 192.168.3.200
Host A (tpNMS Host)
IP: 192.168.0.100
tpNMS
L2+/L3 Switch
2/3/5/T Series Switch
IP: 192.168.2.200
VPN Tunnel
Host B
IP: 192.168.1.200
11
Page 12
After the VPN tunnel is established, the tpNMS can manage the switches on the
other side of the tunnel remotely.
1.2 Download and Install tpNMS
Get the installation file of tpNMS from our website www.tplink.com/en in this
directory For Business > Switches > Accessories, or click this link. Then follow the
on-screen instructions to properly install the tpNMS software. After successful
installation, a shortcut icon of the tpNMS will be created on the tpNMS host’s
desktop.
1.3 Log in to the Application
Launch the software on the tpNMS Host and follow the instructions to complete
the basic configurations, and then you can log in to the management interface.
• Launch the tpNMS
• Fix the Launch Problems
• Log in to tpNMS
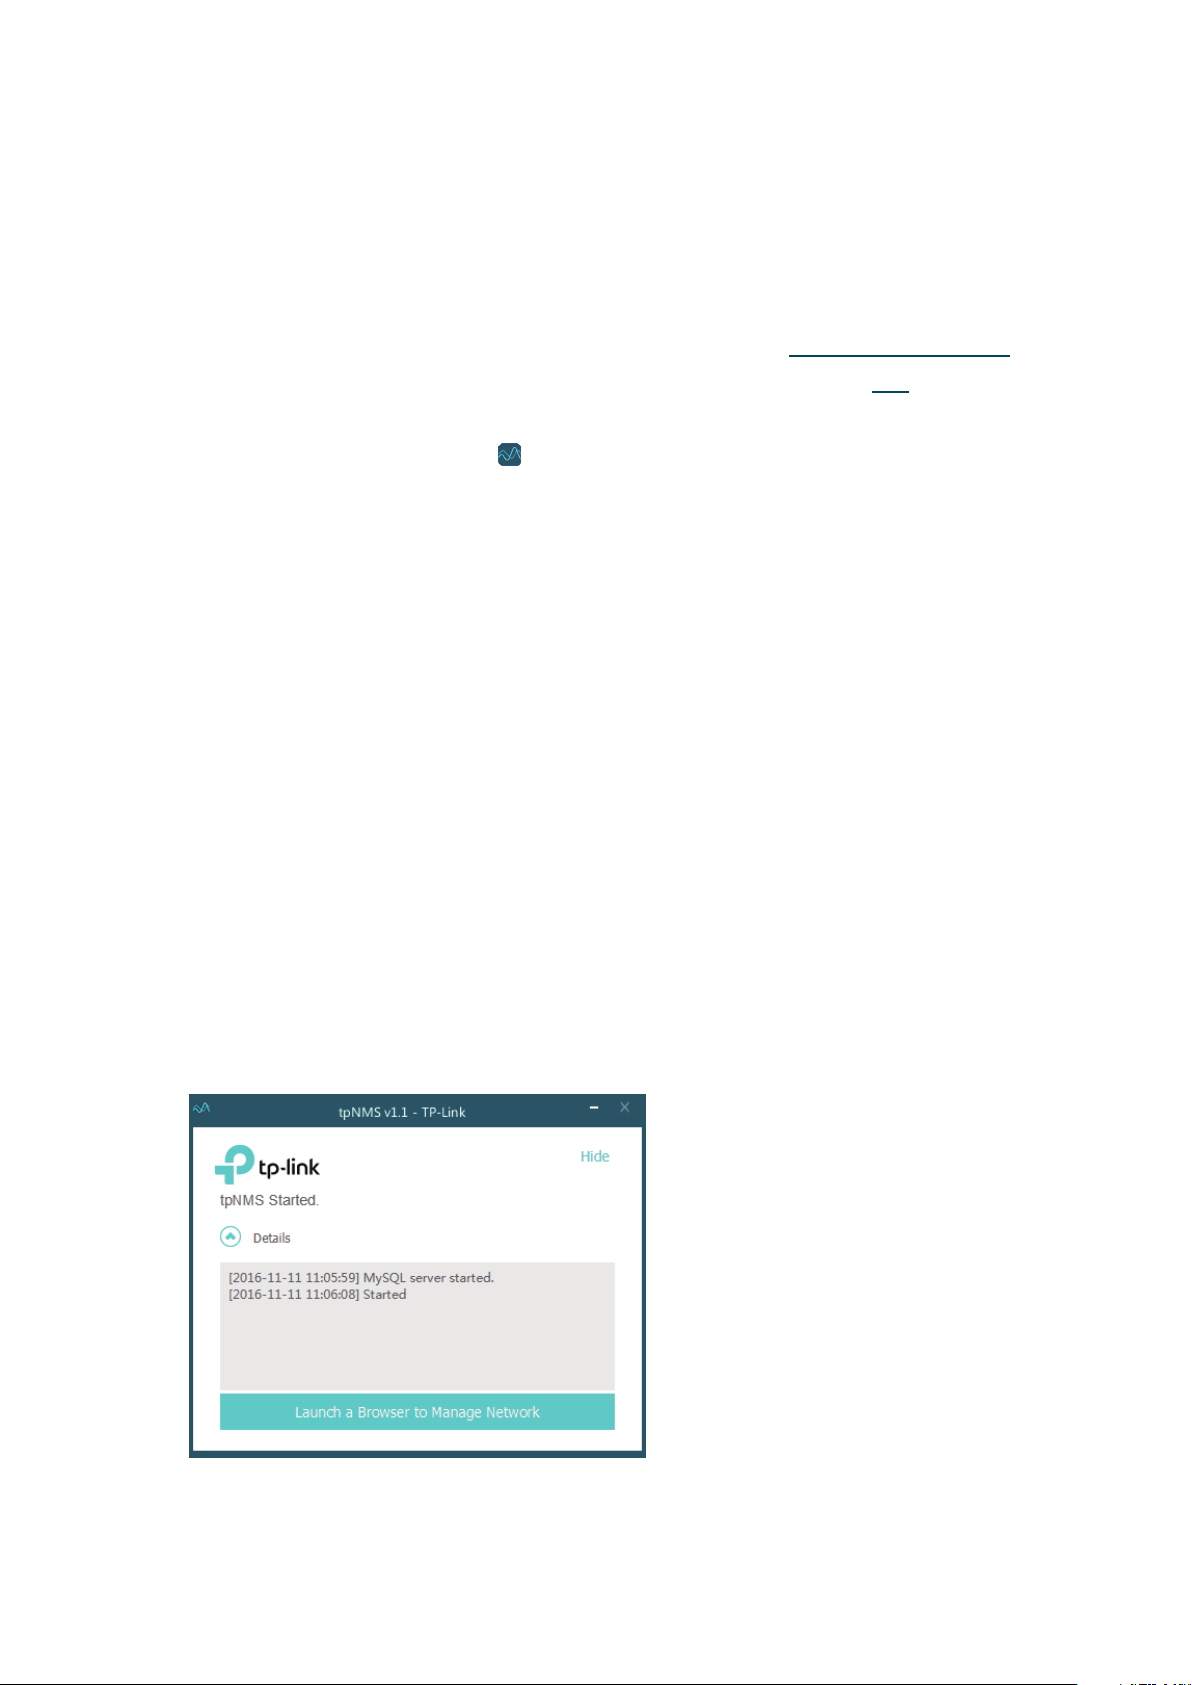
1.3.1 Launch the tpNMS
Launch the tpNMS and the following window will pop up. You can click Hide to hide
this window but do not close it. After a while, your web browser will automatically
open.
Figure 1-4 Launch window
12
Page 13
Note:
·
If your browser does not open, please click Launch a Browser to Manage
Network.
·
If it opens but prompts a problem with the website's security certicate, please
Continue to this website
click
·
If the port 69, 162 and 1099 are already used by other processes, tpNMS will fail
to initialize. Please kill the tasks occupying these ports and click Retry to launch
tpNMS again.
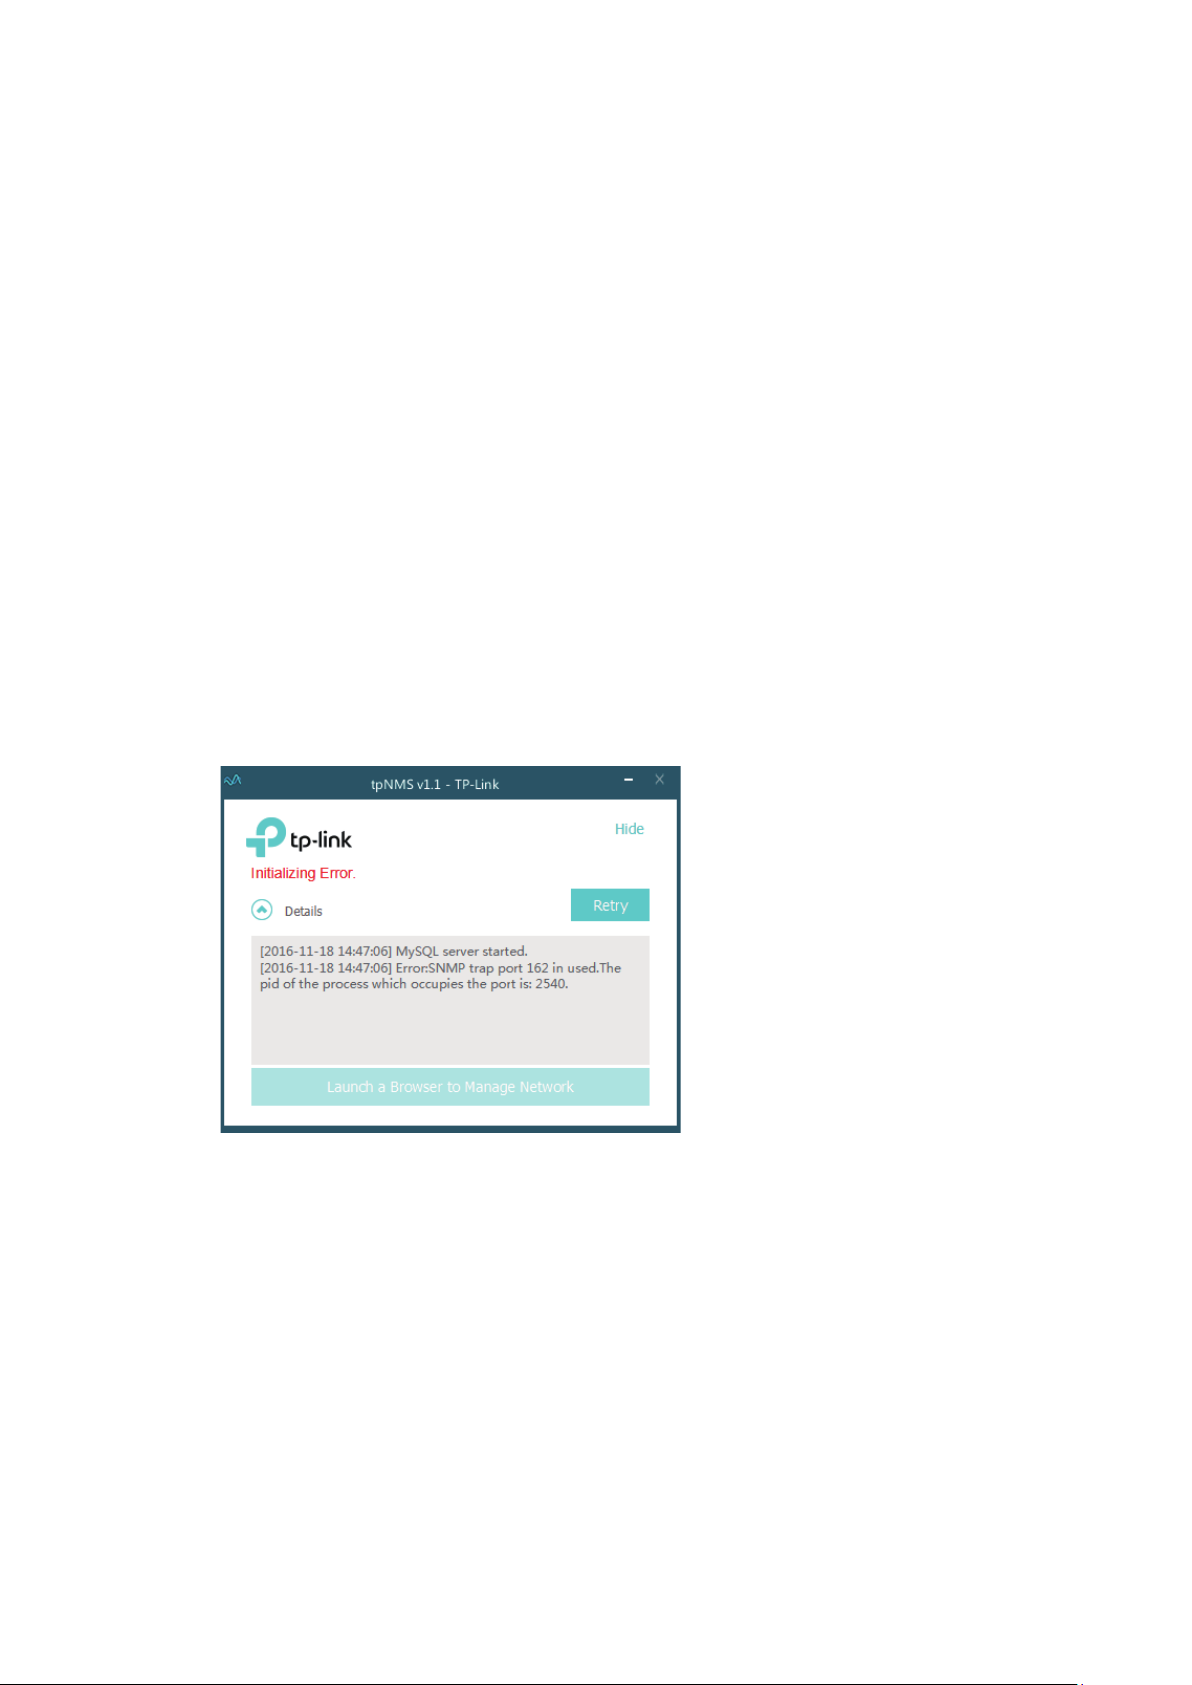
1.3.2 Fix the Launch Problems
tpNMS will use several ports in its launch process, which include but are not limited
to: 69, 162 and 1099. If any of these ports is occupied by the other processes,
tpNMS will fail to initialize. The conflicting port and the PID of the process using this
port will be displayed in the launch window. Please kill the process with this PID and
click Retry to launch the tpNMS again.
1. For example, the tpNMS encounters with a port conflict in initialization.
.
Figure 1-5 Initializing error
We can see that the conict port is 162 and the process with PID 2540 is occupying this
port.
13
Page 14
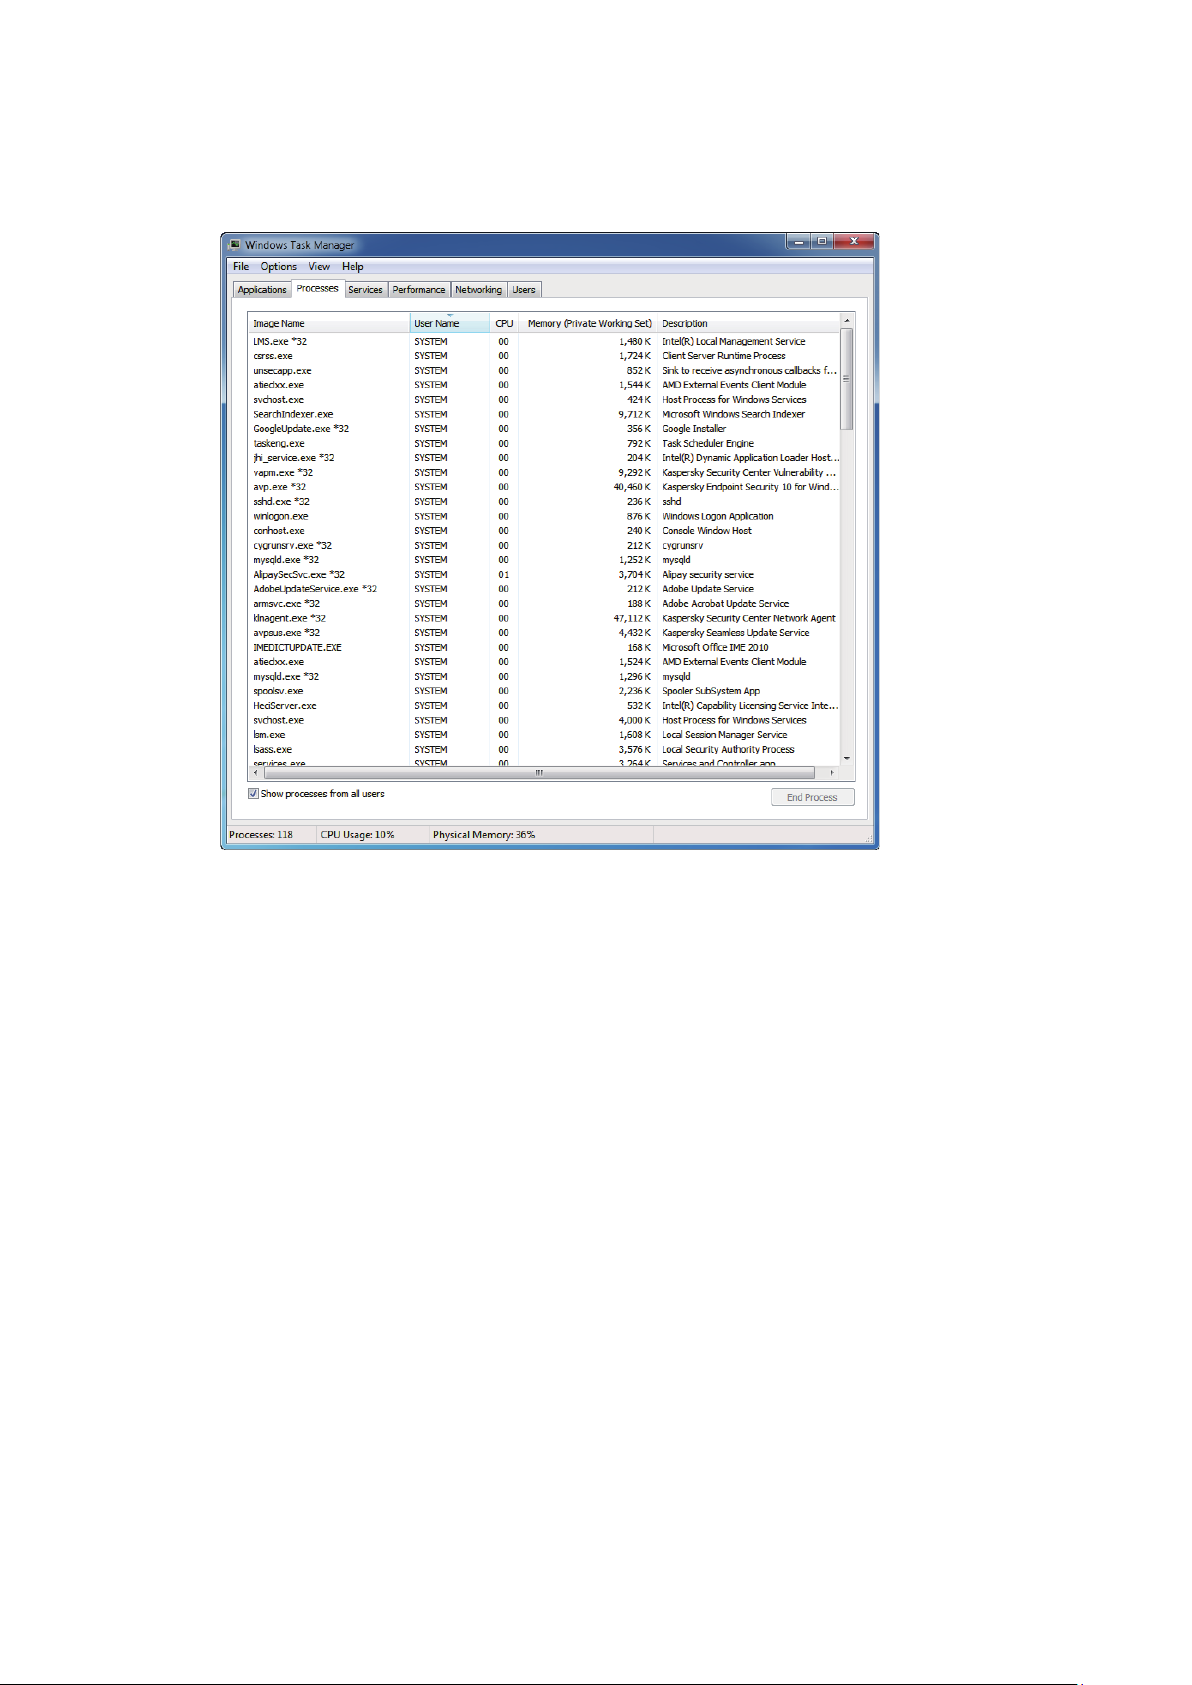
2. Open the
Figure 1-6 Windows task manager
Processes
tab in the
Windows Task Manager
.
14
Page 15
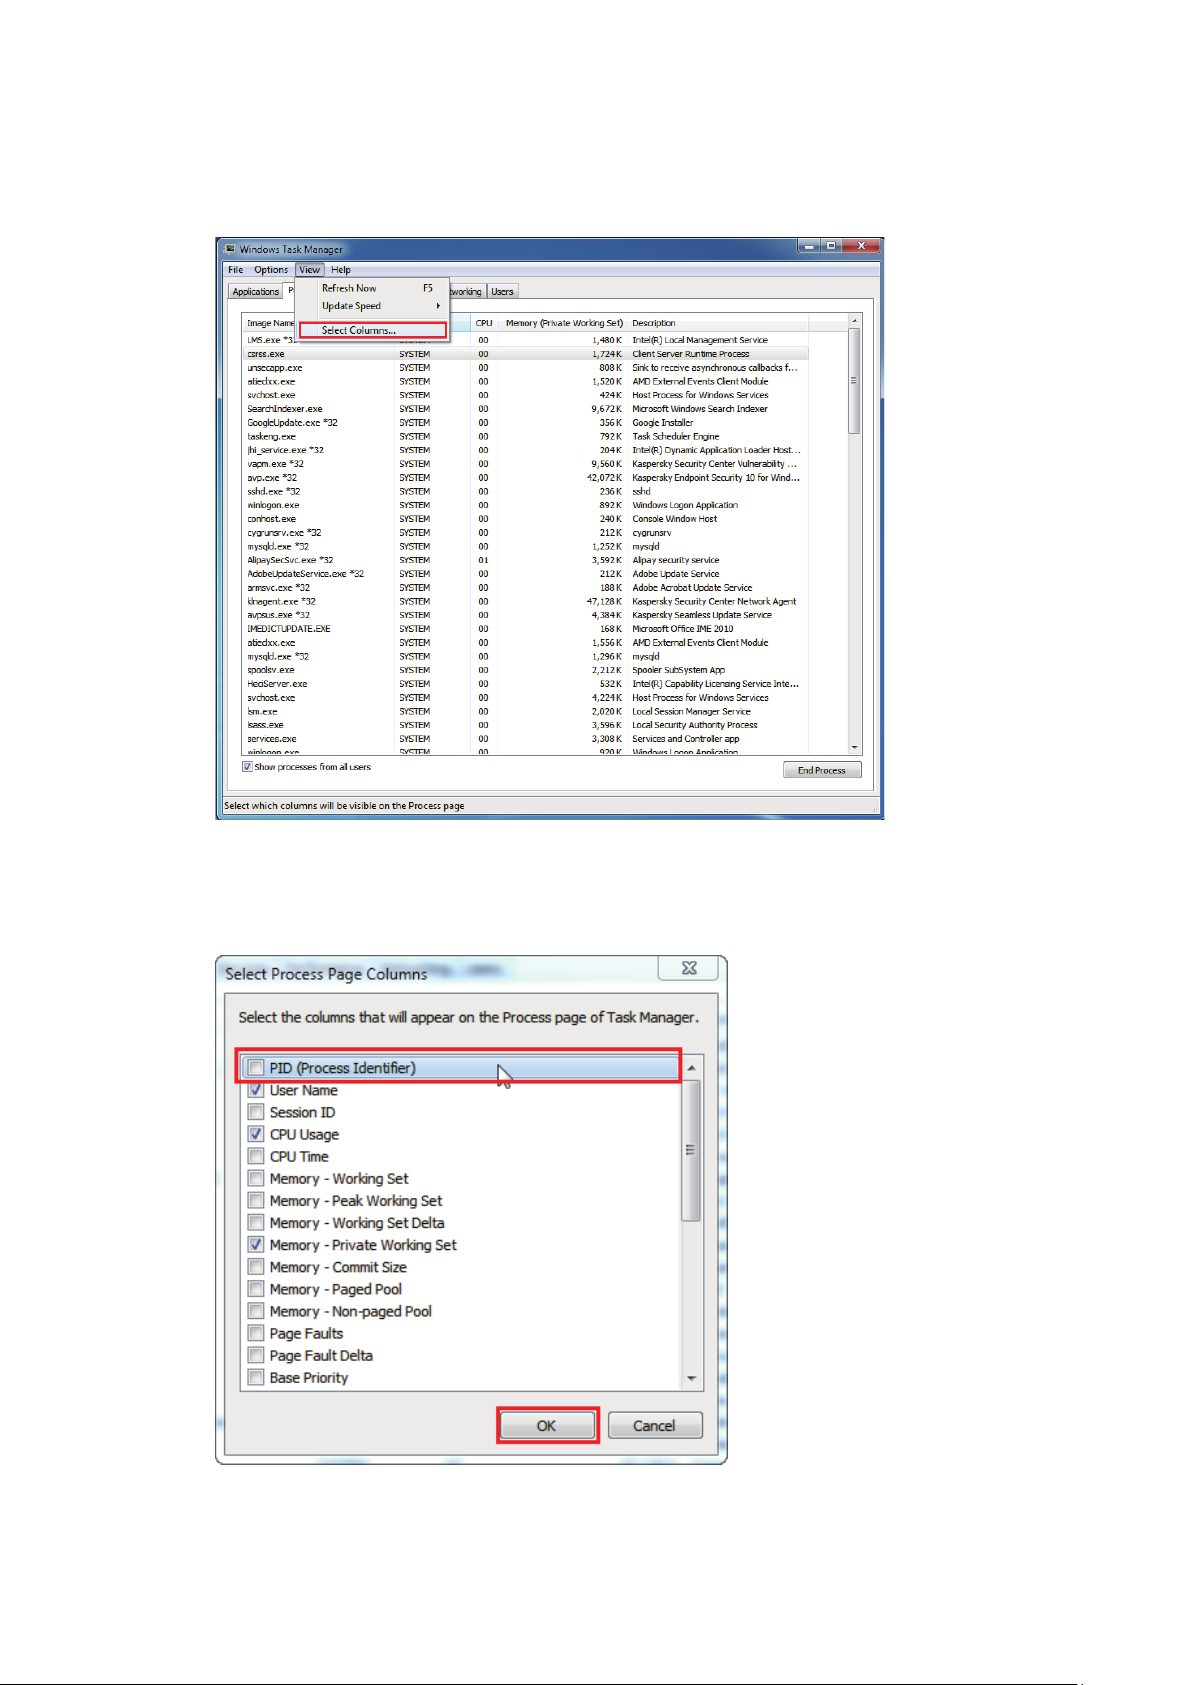
3. Click
Figure 1-7 Select columns
View
and select
Select Columns...
.
In the pop-up window, select the PID (Process Identication) and click OK.
Figure 1-8 Show the PID column
15
Page 16
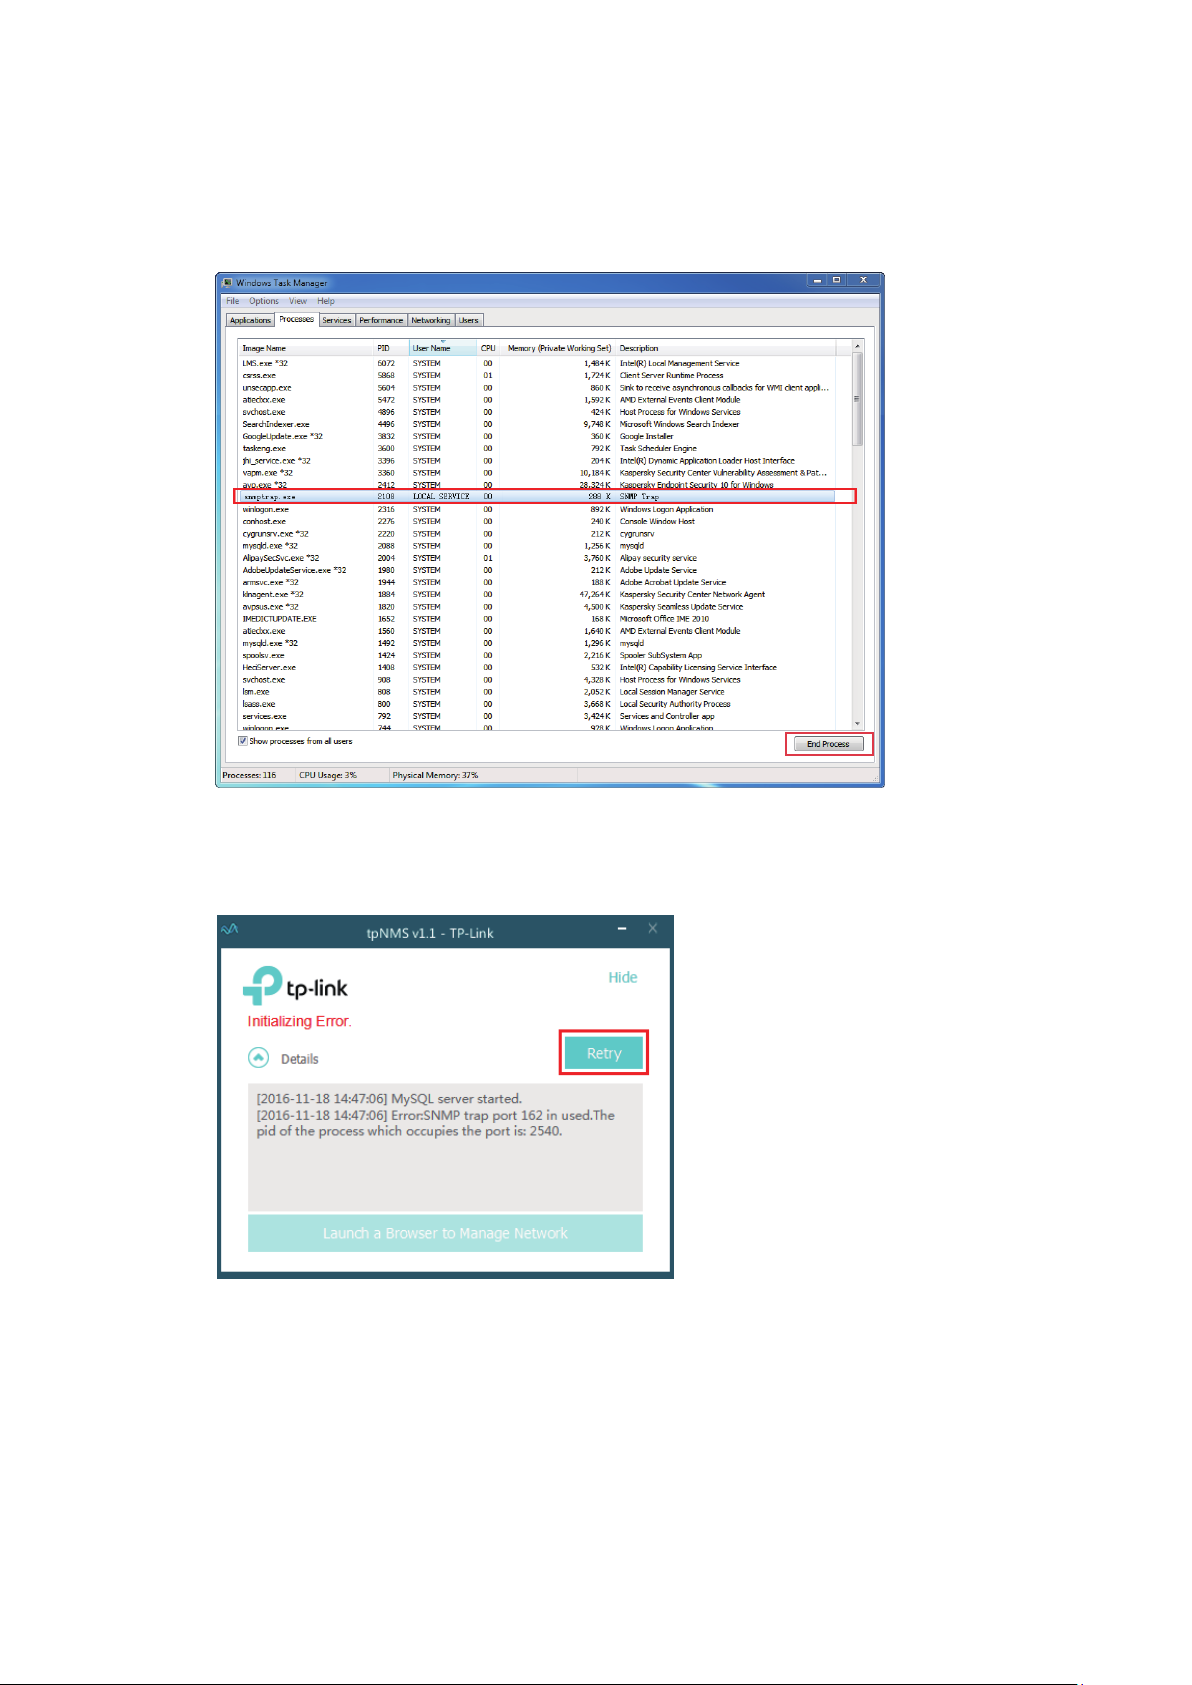
4. Kill the process that occupying the conflict port. Click the process with the specified PID
and click the
Figure 1-9 Kill the conflicting process
End Process
.
5. Click
Figure 1-10 Launch tpNMS again
to launch tpNMS again.
Retry
1.3.3 Log in to tpNMS
tpNMS uses a browser-server architecture. Administrators and other types of
users can access tpNMS from any accessible host in the network. Before you log
in to tpNMS, please make sure that tpNMS host has a static IP address.
16
Page 17
Note:
Since tpNMS supports multiple users’ operations at the same time, we recommend
that dierent users coordinate their application activities. Thus the modications
on the screen made by one user are not inadvertently changed by another user.
1. Open a browser and connect to tpNMS through the static IP address of the tpNMS host
and the port 8843.
To connect to tpNMS from the tpNMS host, enter the URL
·
https://127.0.0.1:8843/.
To connect to tpNMS from a remote computer, replace 127.0.0.1 with the
·
IP address of the tpNMS host. For example, enter https://1.1.1.100:8843/,
in which 1.1.1.100 is the IP address of the tpNMS host and 8843 is the port
number for the tpNMS server.
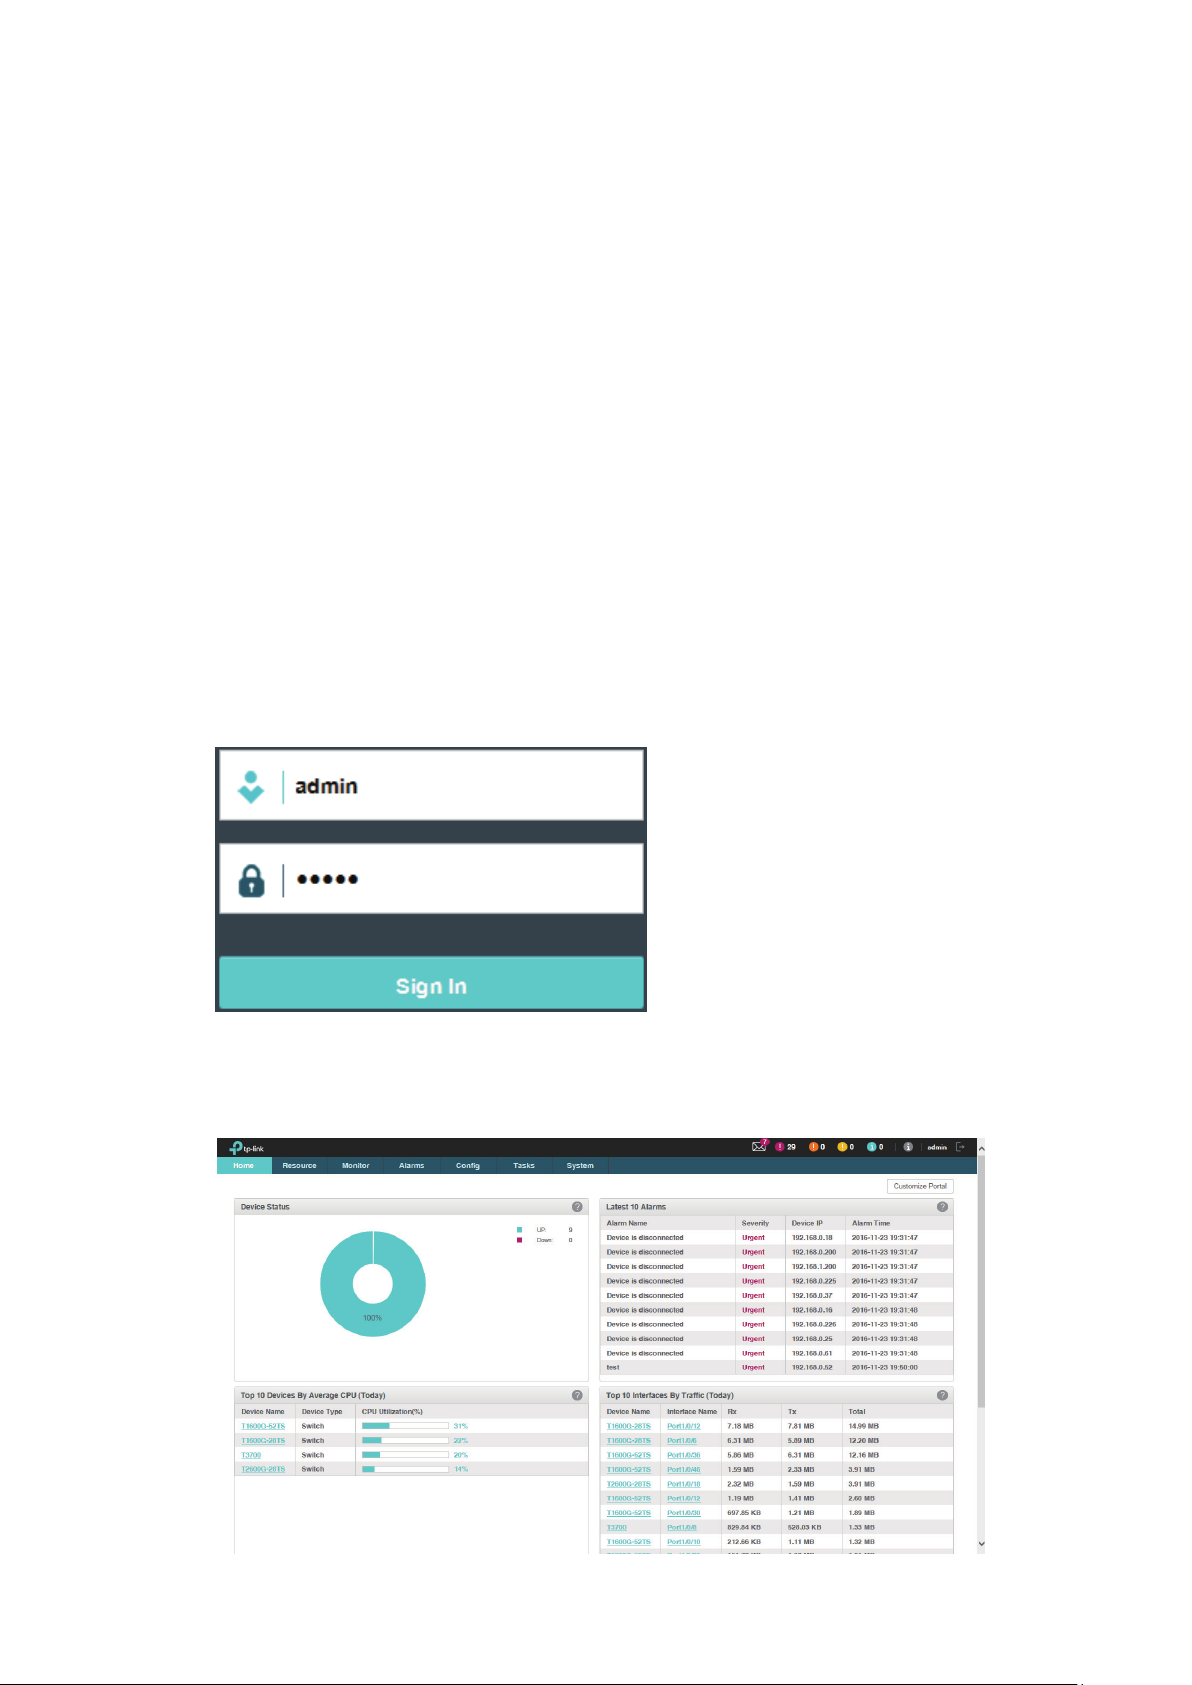
2. After you connect to tpNMS, enter the default account and password (both are
in the Login screen to sign in.
Figure 1-11 Login window
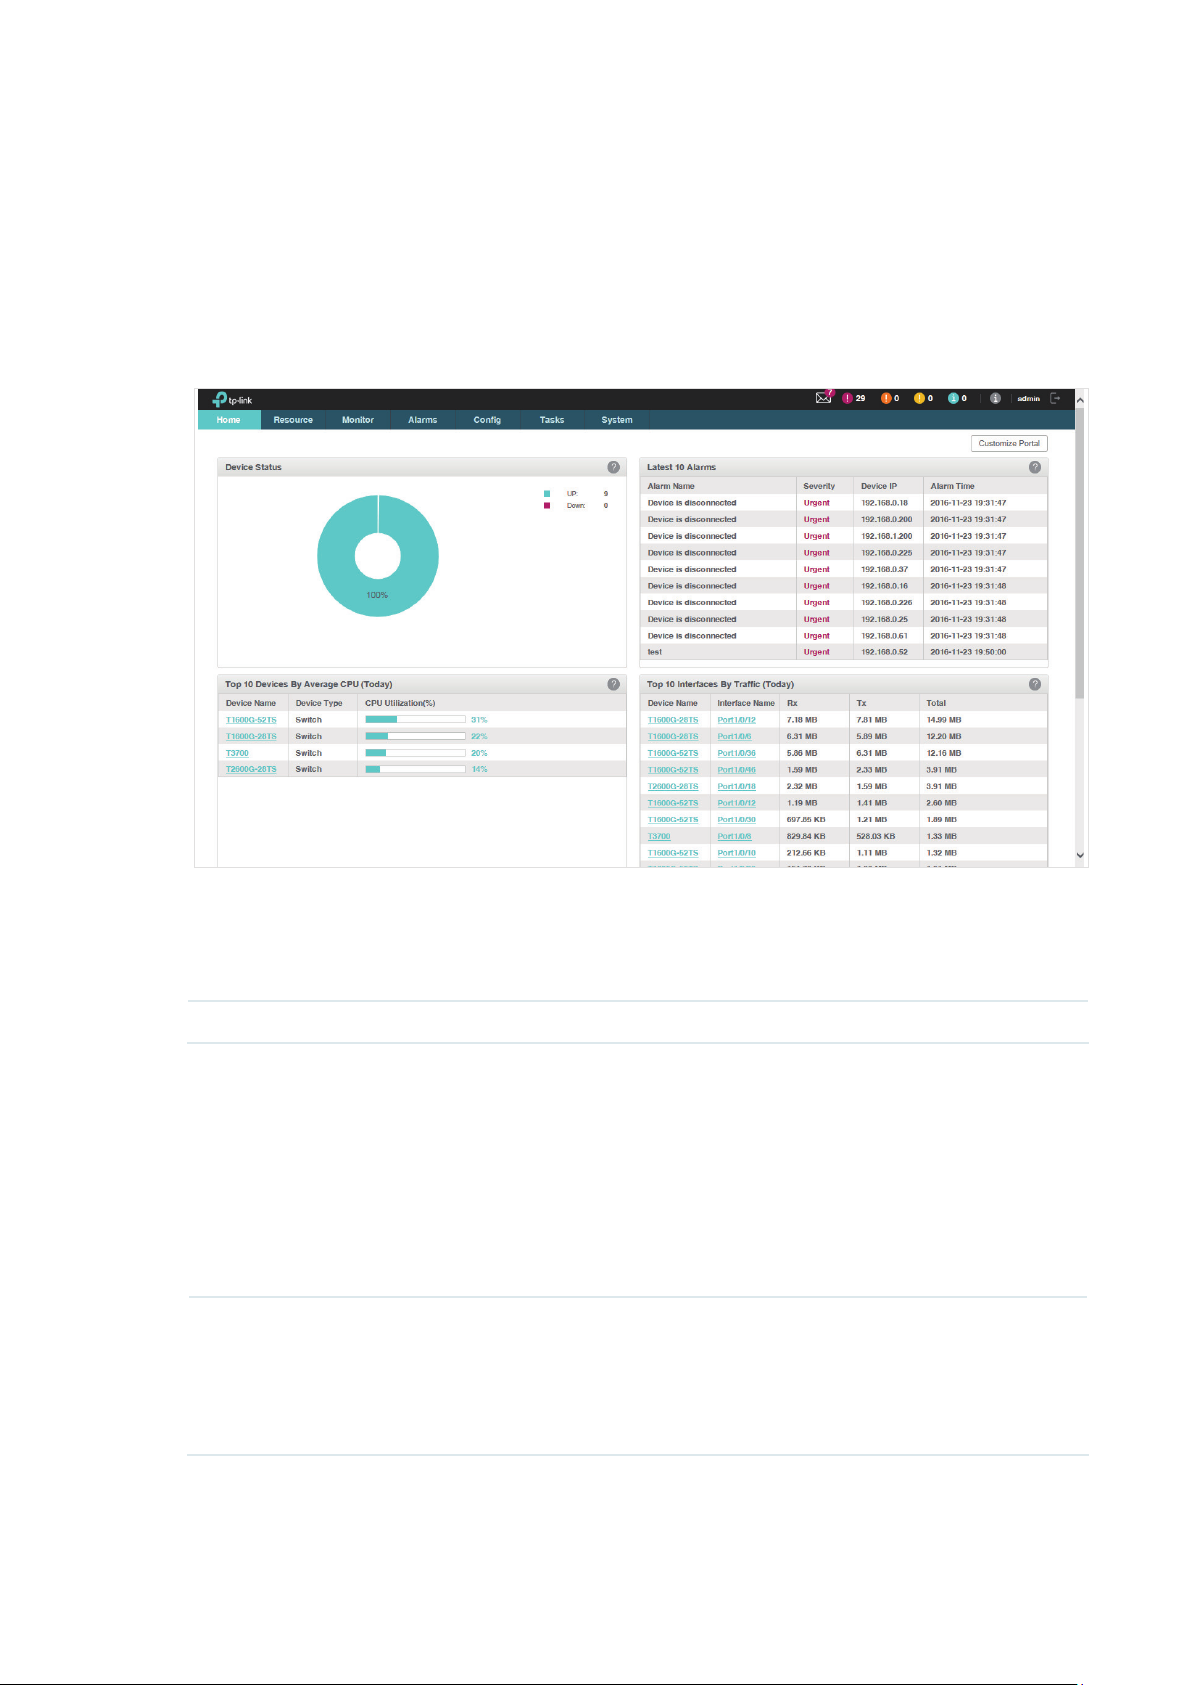
3. The Home screen displays as below.
Figure 1-12 Home page
admin
)
17
Page 18
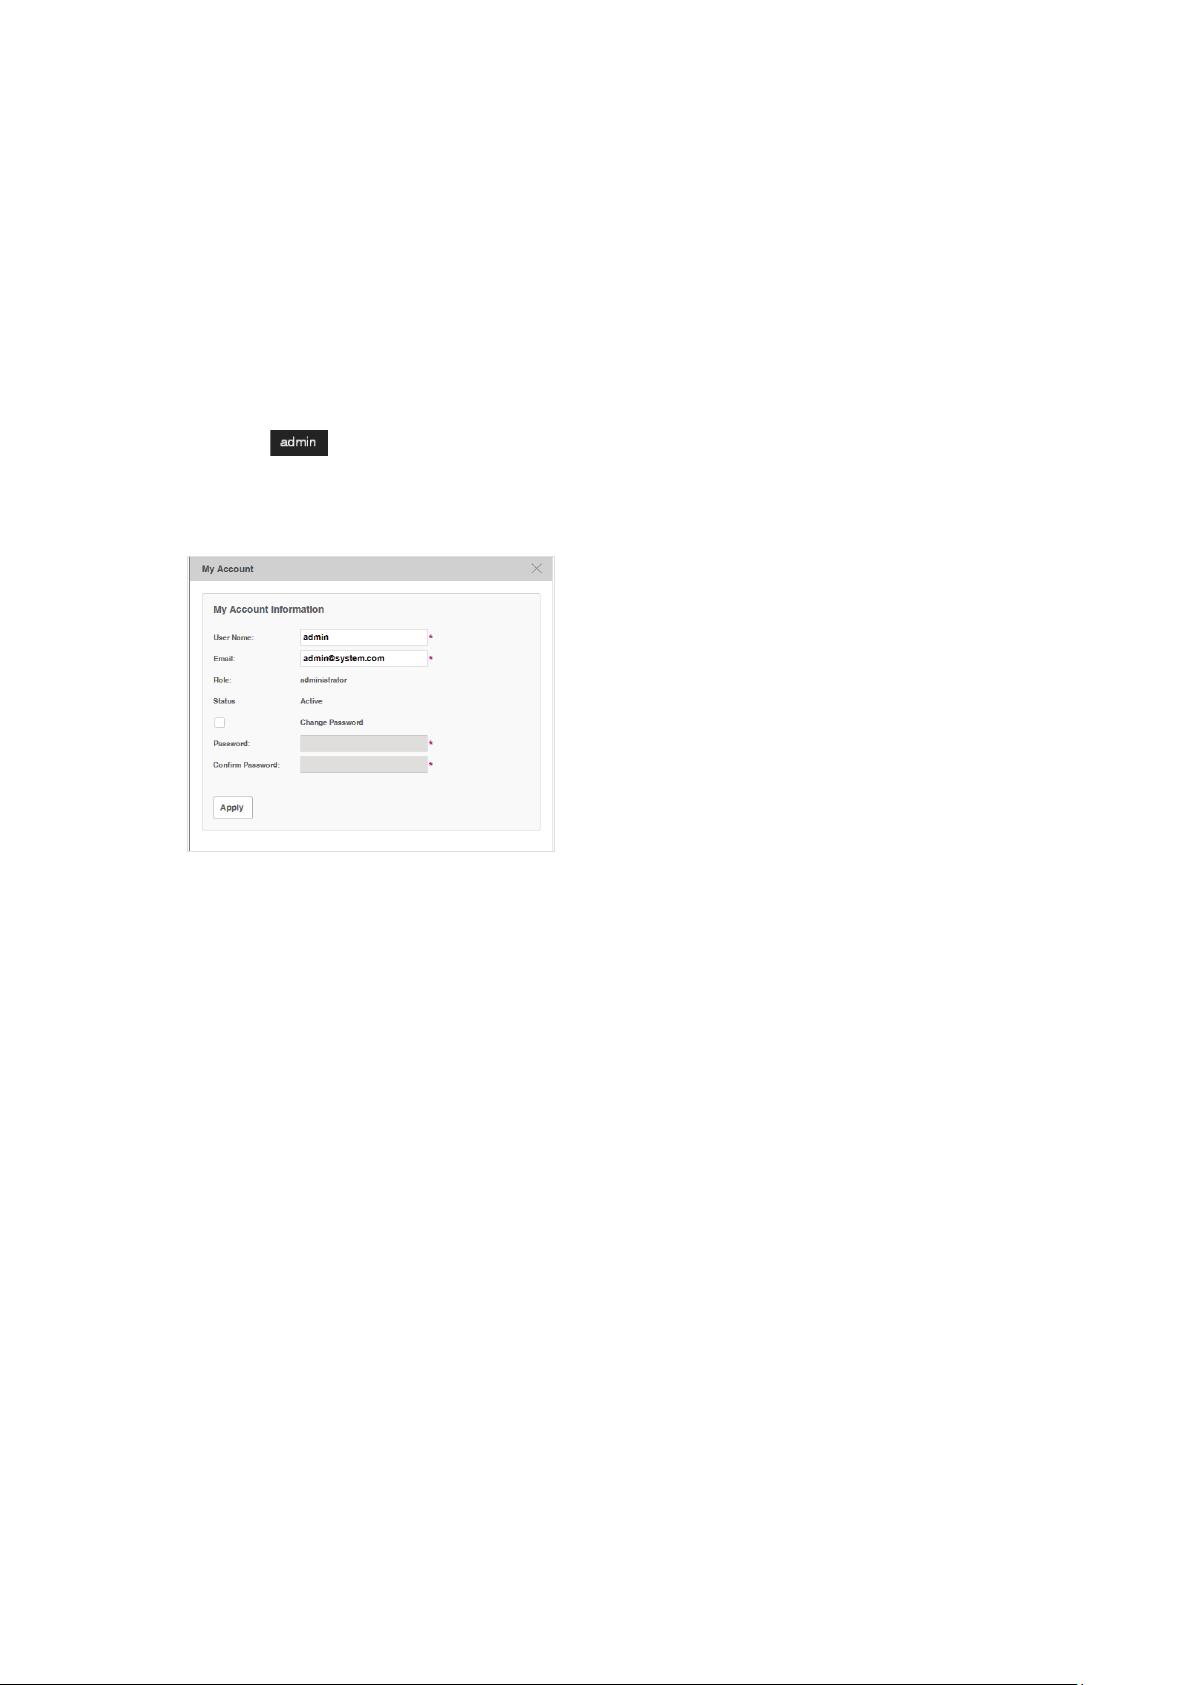
1.4 Change Your Password and Email
It is suggested to change the admin user’s default password for safety
considerations. tpNMS defines three types of roles: administrator, operator and
observer. Only administrators have the authority to modify the user’s user name,
password and email.
Following the steps below to modify your password and email address.
1. Click
will pop up.
Figure 1-13 Modify account information
2. Modify the Email address of the
3. Select the
confirm.
in the top right corner of the page and the following My Account window
Change Password
admin
check box. Enter the new password and re-enter to
user.
4. Click
Apply
to save your changes.
1.5 Set the Email Server for Alarm Notifications
Before tpNMS can send alarm notifications, you should configure the email server
settings. Only an administrator role user can configure the alarm email server
settings.
18
Page 19
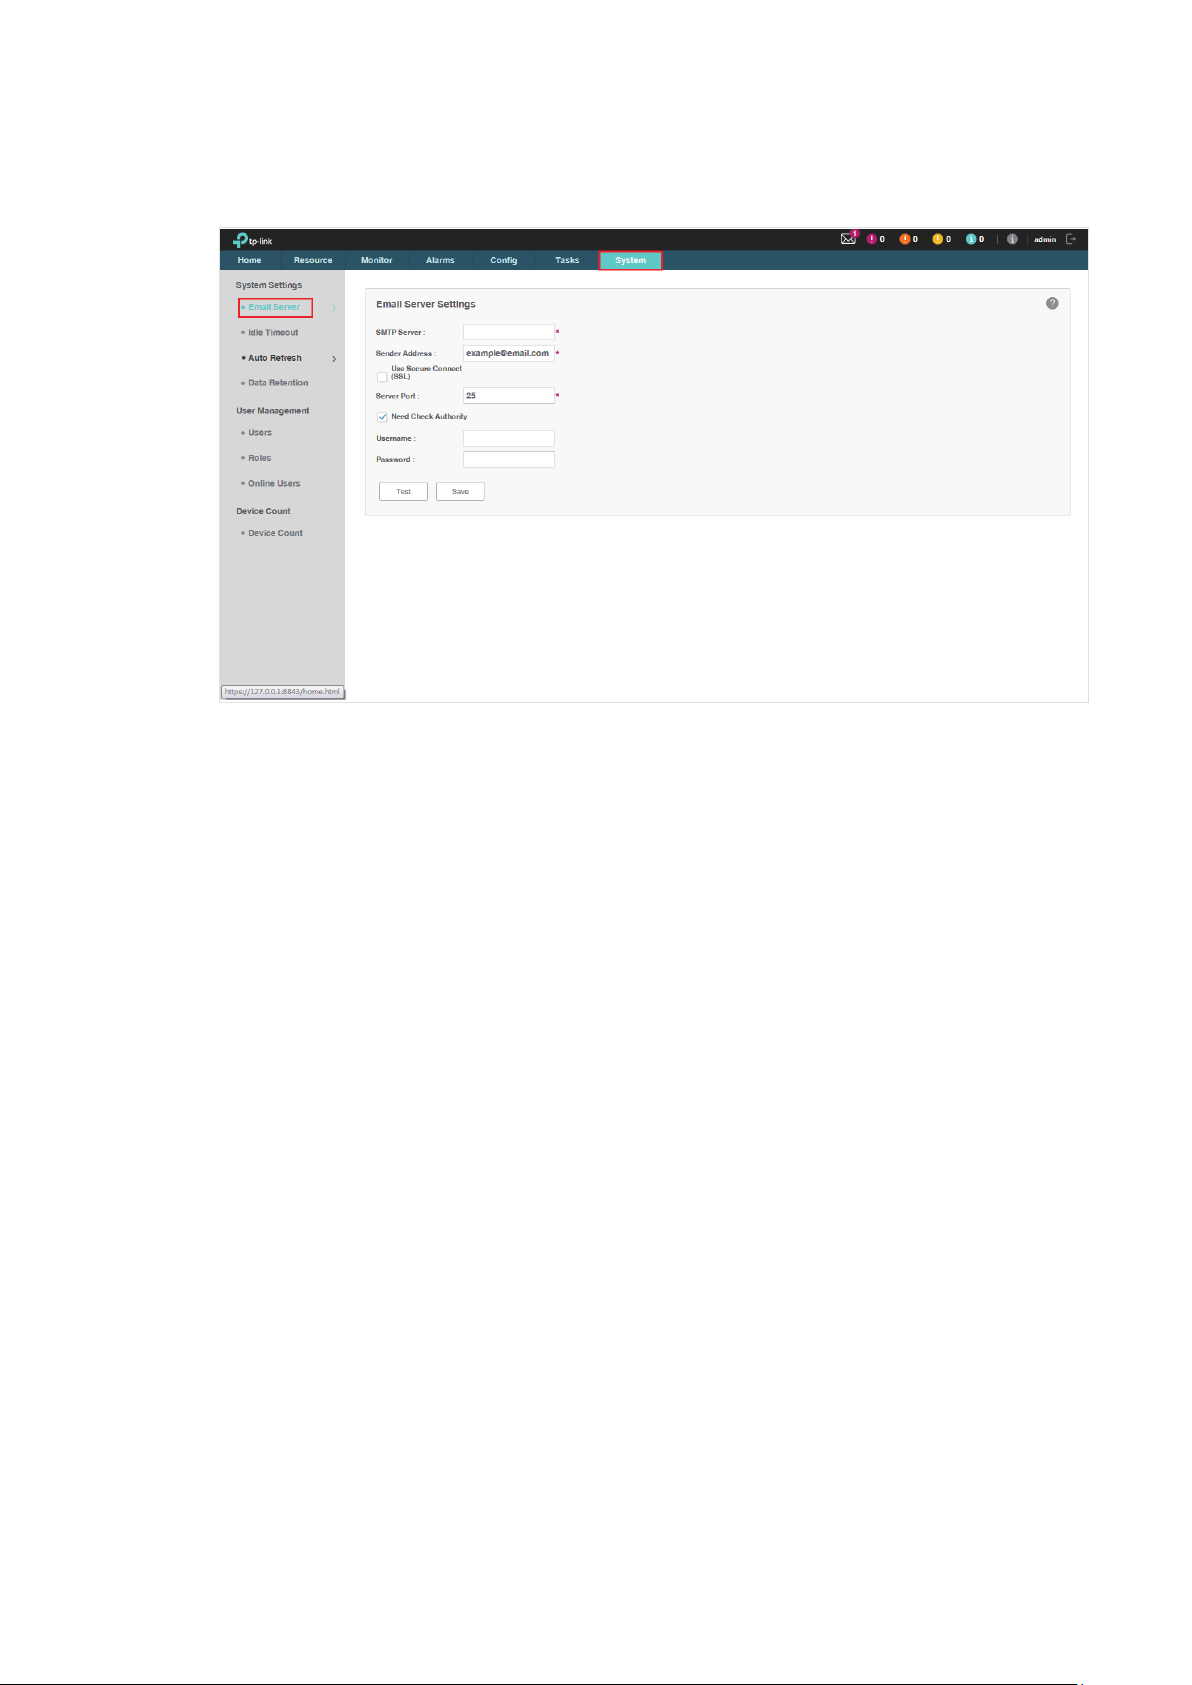
1. Go to
Figure 1-14 Configure Email server settings
System > System Settings > Email Server
.
2. Enter your SMTP server address in the
SMTP Server
field. For example: smtp.gmail.
com.
3. Enter your email address in the
Sender Address
field. For example: jerry@gmail.com.
4. If you want to encrypt the communications between the server and the recipient, select
the
Use Secure Connect (SSL)
5. Enter your SMTP server port in the
6. If your SMTP server requires authentication, select the
check box.
Server Port
field.
Need Check Authority
check
box and enter your user name and password for your email account.
7. Click the
button to verify your email server settings. A test mail will be sent from
Test
the sender to itself, to verify the settings of the email server and the user credentials are
correct.
8. Click the
button to save your email server settings.
Save
19
Page 20

2
Monitor Network
With tpNMS you can monitor the summary information about the network, devices
and interfaces. You can monitor the device status, the network topology, the
latest alarms and the top 10 widgets for devices and interfaces by certain criteria.
You can customize these widgets on the Home screen. This chapter includes the
following sections:
• Customize the Widgets on the Home Screen
• View the Widgets
20
Page 21
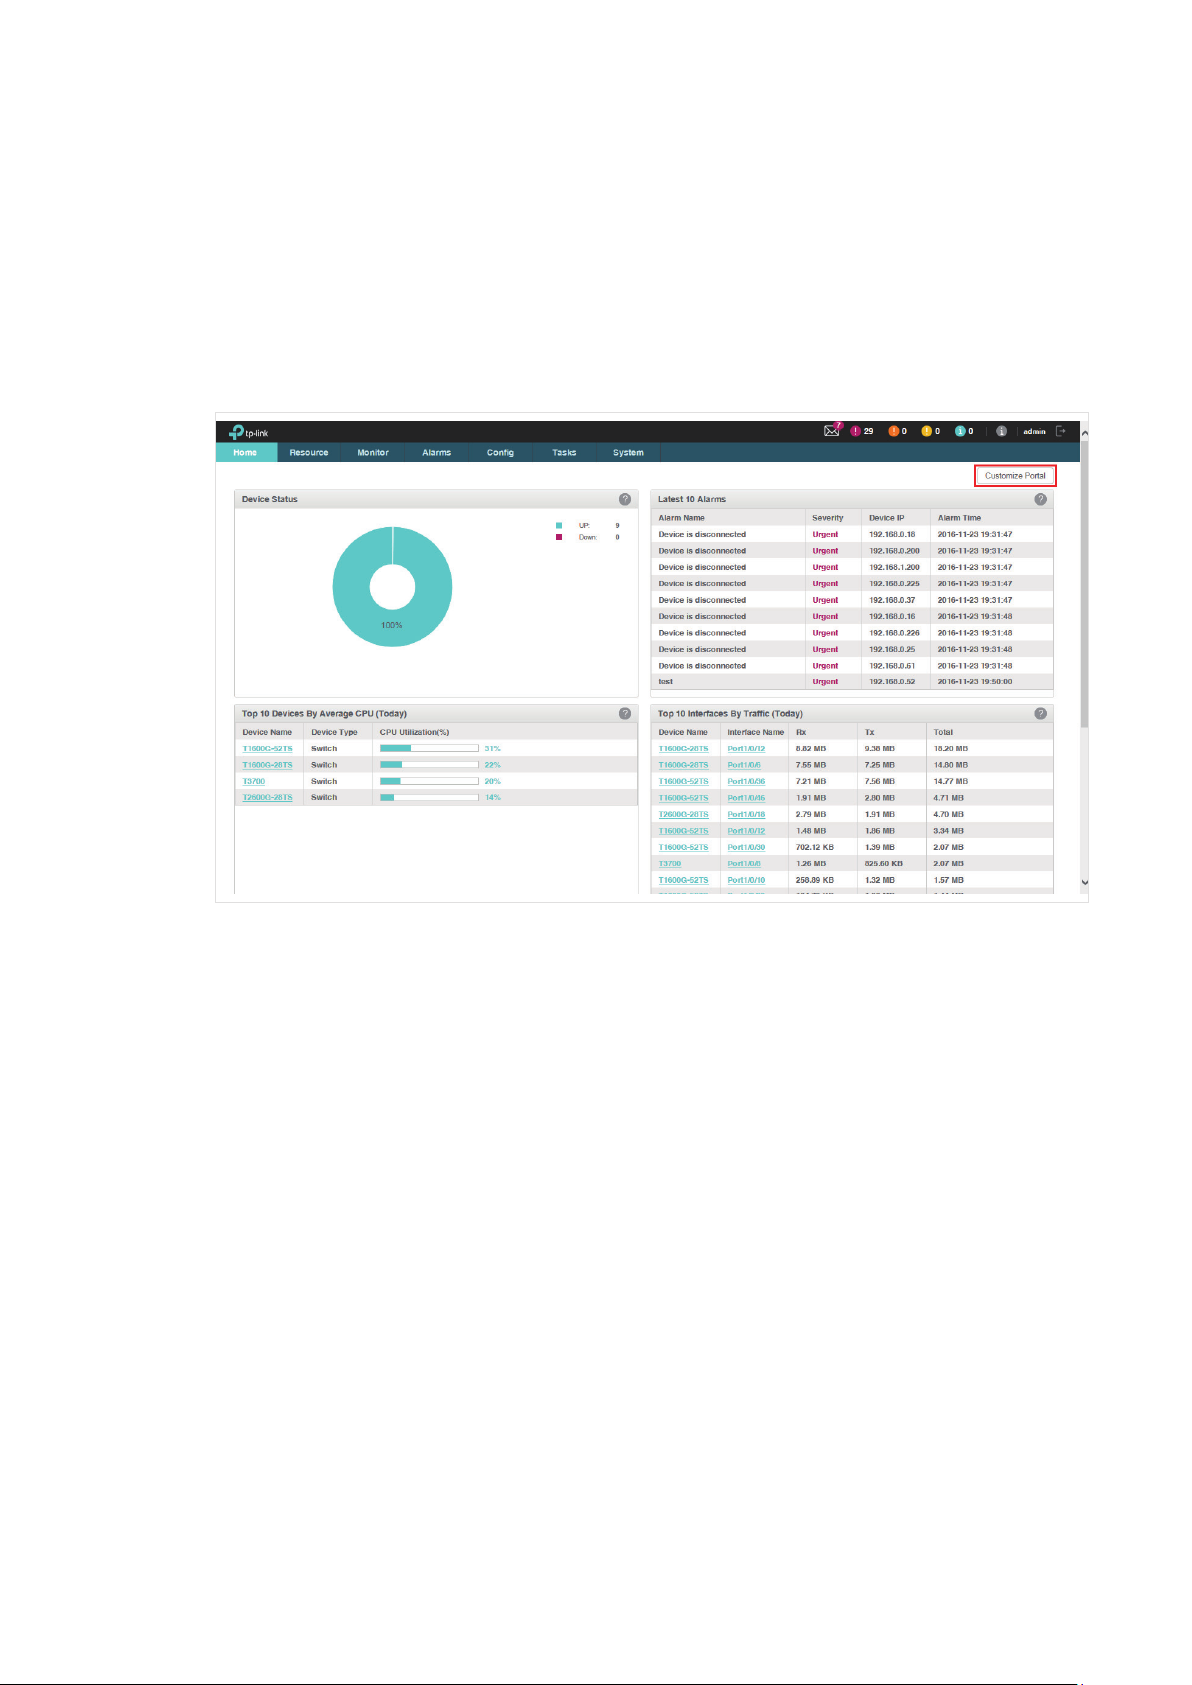
2.1 Customize the Widgets on the Home Screen
You can add, delete or re-sort the widgets displayed on the Home screen.
1. Go to
2. Click
Figure 2-1 Home screen customize
Home screen
Customize Portal
.
in the upper right corner of the
Home
screen.
3. Select a checkbox to add the widget. Deselect a checkbox to delete the widget.
21
Page 22
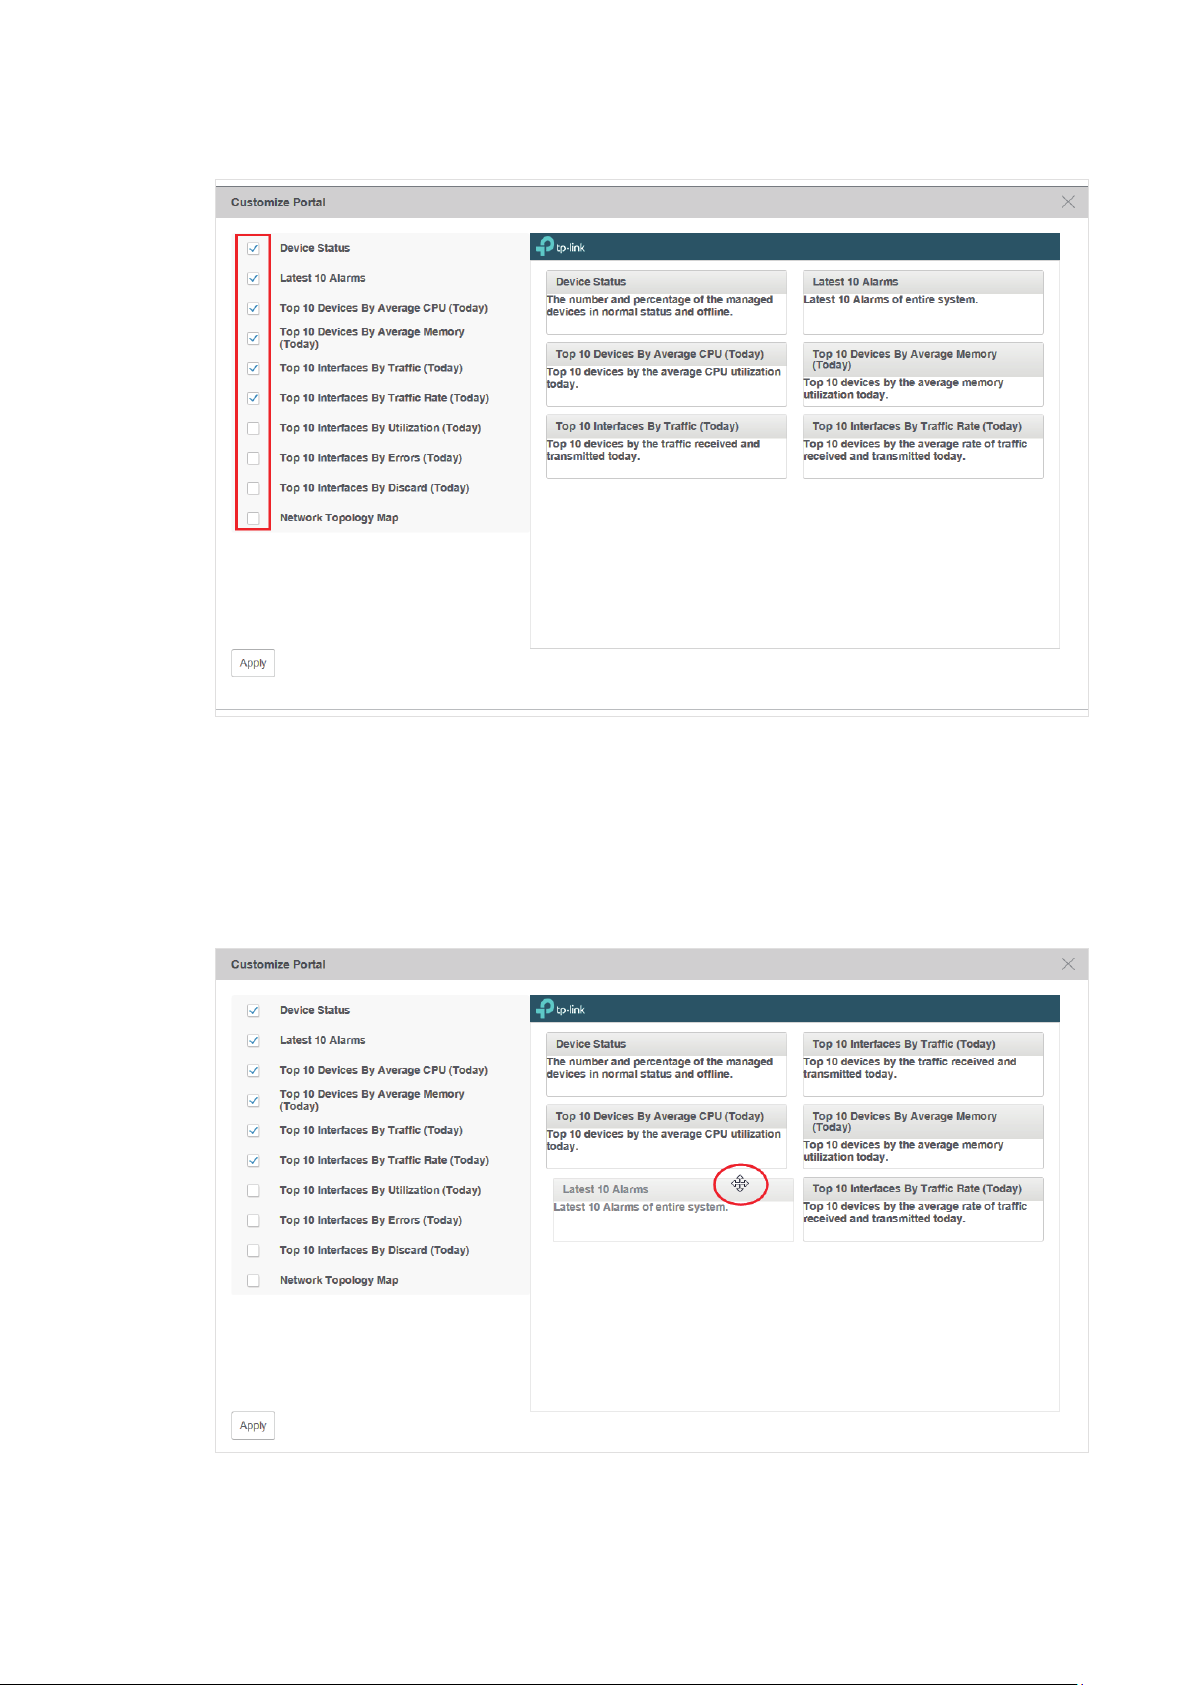
Figure 2-2 Add or delete the widgets
4. The right part is a thumbnail of the Home page. Drag the widgets to re-sort their display
order. When you move the cursor onto the title bar of a widget, the cursor will turn into
a four-head arrow. Click and hold the title bar to drag the widget to the place you want,
and release the left button of your mouse to complete the operation.
Figure 2-3 Re-sort the widgets
22
Page 23
5. Click
Apply
to save your changes.
2.2 View the Widgets
You can view the widgets displayed on the Home page.
Figure 2-4 Home page view
You can click the device name or interface name in the tables to view their detailed
information.
The widgets and the elements they contain are introduced below.
Widget Label Description Default Items Displayed
The percentage of the online
devices
The percentage of the offline
Device Status
Latest 10 Alarms The latest 10 alarms of the entire network.
The number and percentage of the managed
devices online and offline.
devices
The number of the online
devices
The number of the offline
devices
Alarm Name
Severity
Device IP
Alarm Time
23
Page 24

Widget Label Description Default Items Displayed
Top 10 Devices By
Average CPU (Today)
Top 10 Devices By
Average Memory (Today)
Top 10 Interfaces By
Traffic (Today)
Top 10 Interfaces By
Traffic Rate (Today)
Top 10 devices by the average CPU utilization
today. Click device name to show device detail
view.
Top 10 devices by the average memory
utilization today. Click device name to show
device detail view.
Top 10 devices by the traffic received and
transmitted today. Click device name to show
device detail view. Click interface name to
show interface detail view.
Top 10 devices by the average rate of traffic
received and transmitted today. Click device
name to show device detail view. Click
interface name to show interface detail view.
Device Name
Device Type
CPU Utilization (%)
Device Name
Device Type
Memory Utilization (%)
Device Name
Interface Name
Rx
Tx
Total
Device Name
Interface Name
Rx (bps)
Tx (bps)
Total (bps)
Top 10 Interfaces By
Utilization (Today)
Top 10 Interfaces By
Errors (Today)
Top 10 Interfaces By
Discard (Today)
Network Topology Map
Top 10 interfaces by the average utilization on
both receiving and transmitting today. Click
device name to show device detail view. Click
interface name to show interface detail view.
Top 10 devices by errors on both receiving
and transmitting today. Click device name to
show device detail view. Click interface name
to show interface detail view.
Top 10 devices by discards on both receiving
and transmitting today. Click device name to
show device detail view. Click interface name
to show interface detail view.
The network topology of the managed devices.
Double click the node in the map to jump to
the Network Topology tab and see the detailed
map information.
Device Name
Interface Name
Rx Utilization
Tx Utilization
Total
Device Name
Interface Name
Rx Errors
Tx Errors
Total
Device Name
Interface Name
Rx Discards
Tx Discards
Total
24
Page 25

3
Discover and Manage Resources
With tpNMS you can manage the resources in the network, including devices,
interfaces and Topology. This chapter includes the following sections:
• Discover Devices on Your Network
• View and Manage Devices
• Import Devices
• Add Devices into Groups
• View and Manage Links on Your Network
• Manage Maps and Topologies
25
Page 26
3.1 Discover Devices on Your Network
• Schedule a Discovery Job
• Manage Discovery Templates
3.1.1 Schedule a Discovery Job
The discovery profile can filter the devices that tpNMS can detect. tpNMS can
discover devices by a single IP or in an IP range, device name, SNMP template and
Telnet template.
To obtain the monitoring statistics from the target switch, you should configure the
SNMP-related function in the target switch, and configure the SNMP Template in
this section the same with the settings in the target switch.
To backup, restore and upgrade the target switch successfully, you should
configure the Telnet Template in this section the same with the telnet settings in
the target switch.
• Add or modify a discovery profile
• Delete a discovery profile
Add or modify a discovery profile
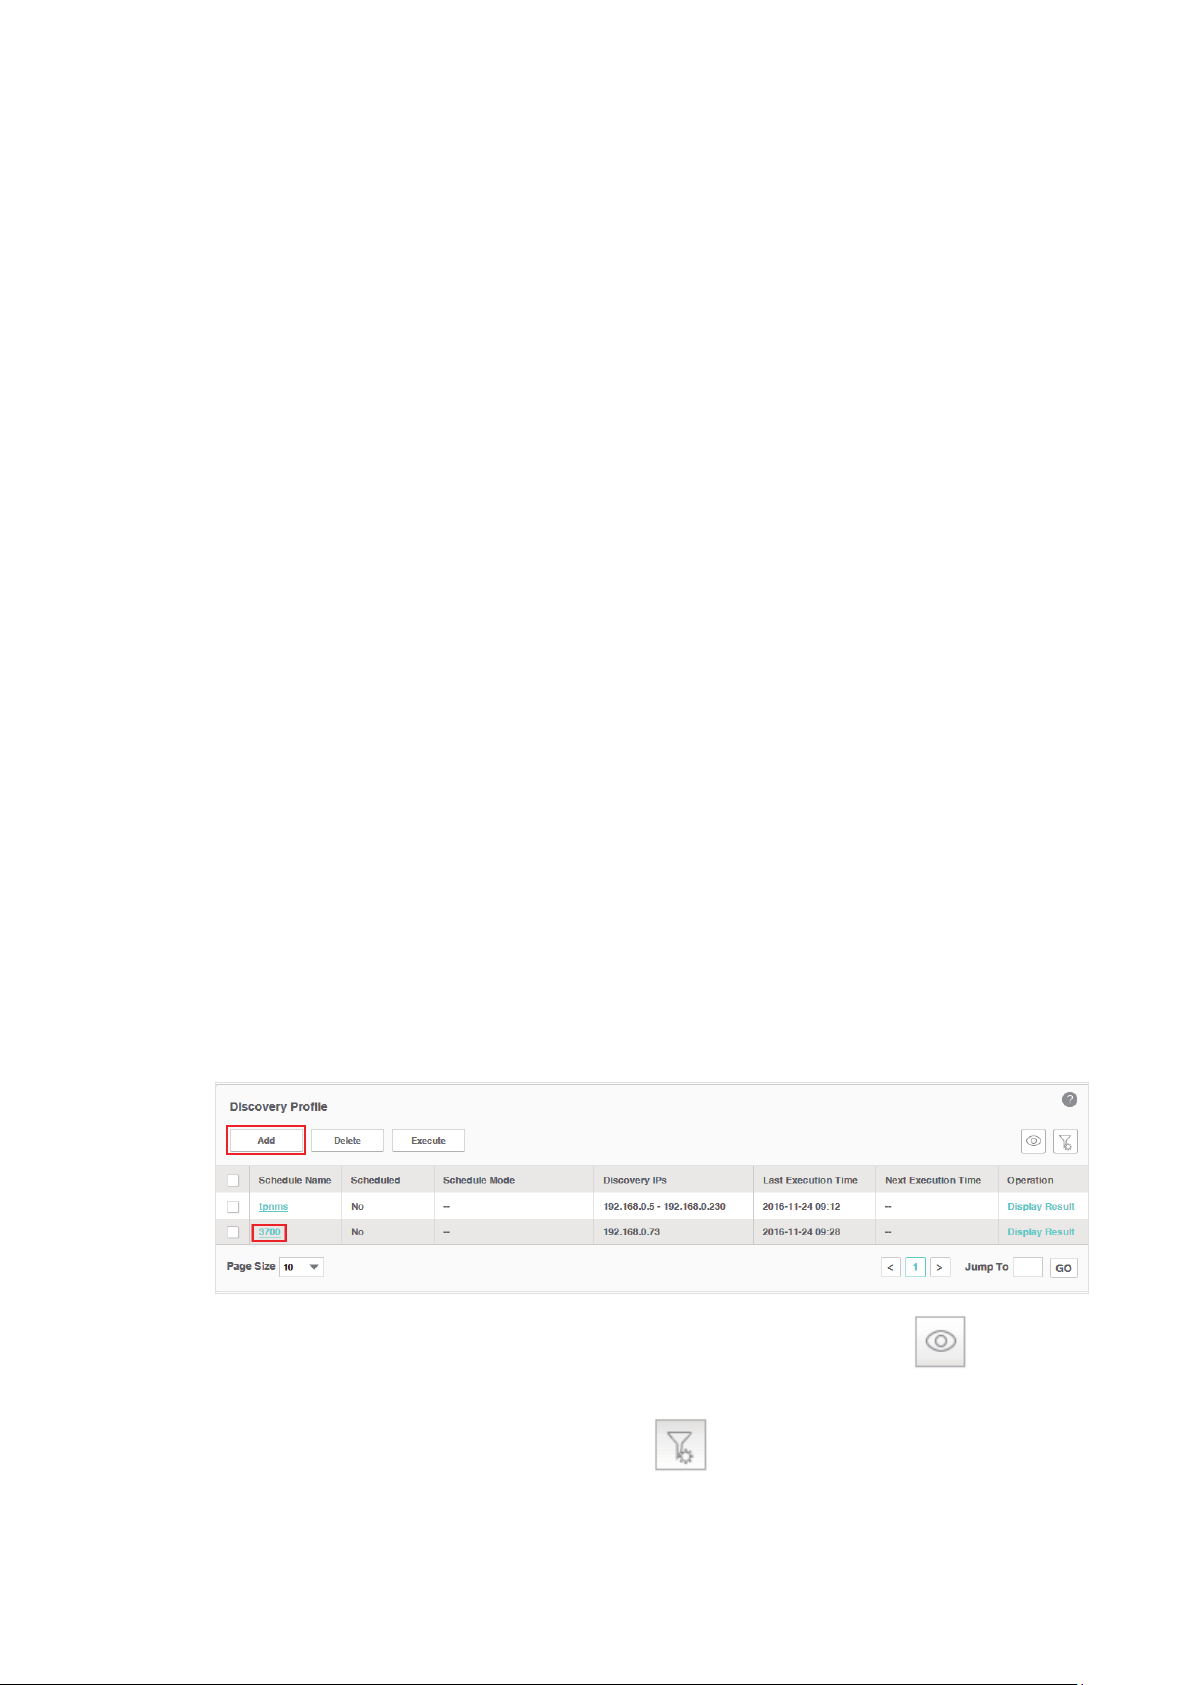
1. Go to
2. Click
Resource > Device Management > Device Discovery
to create a new discovery profile, or click the schedule name in the table to
Add
.
modify the schedule.
Figure 3-1 Schedule modify
To add or delete columns displayed in the device list table, click the and specify
the columns by selecting or deselecting the corresponding checkboxes.
To filter the schedules in the list, click the
.
Filter
26
. Enter the Schedule Name and click
Page 27
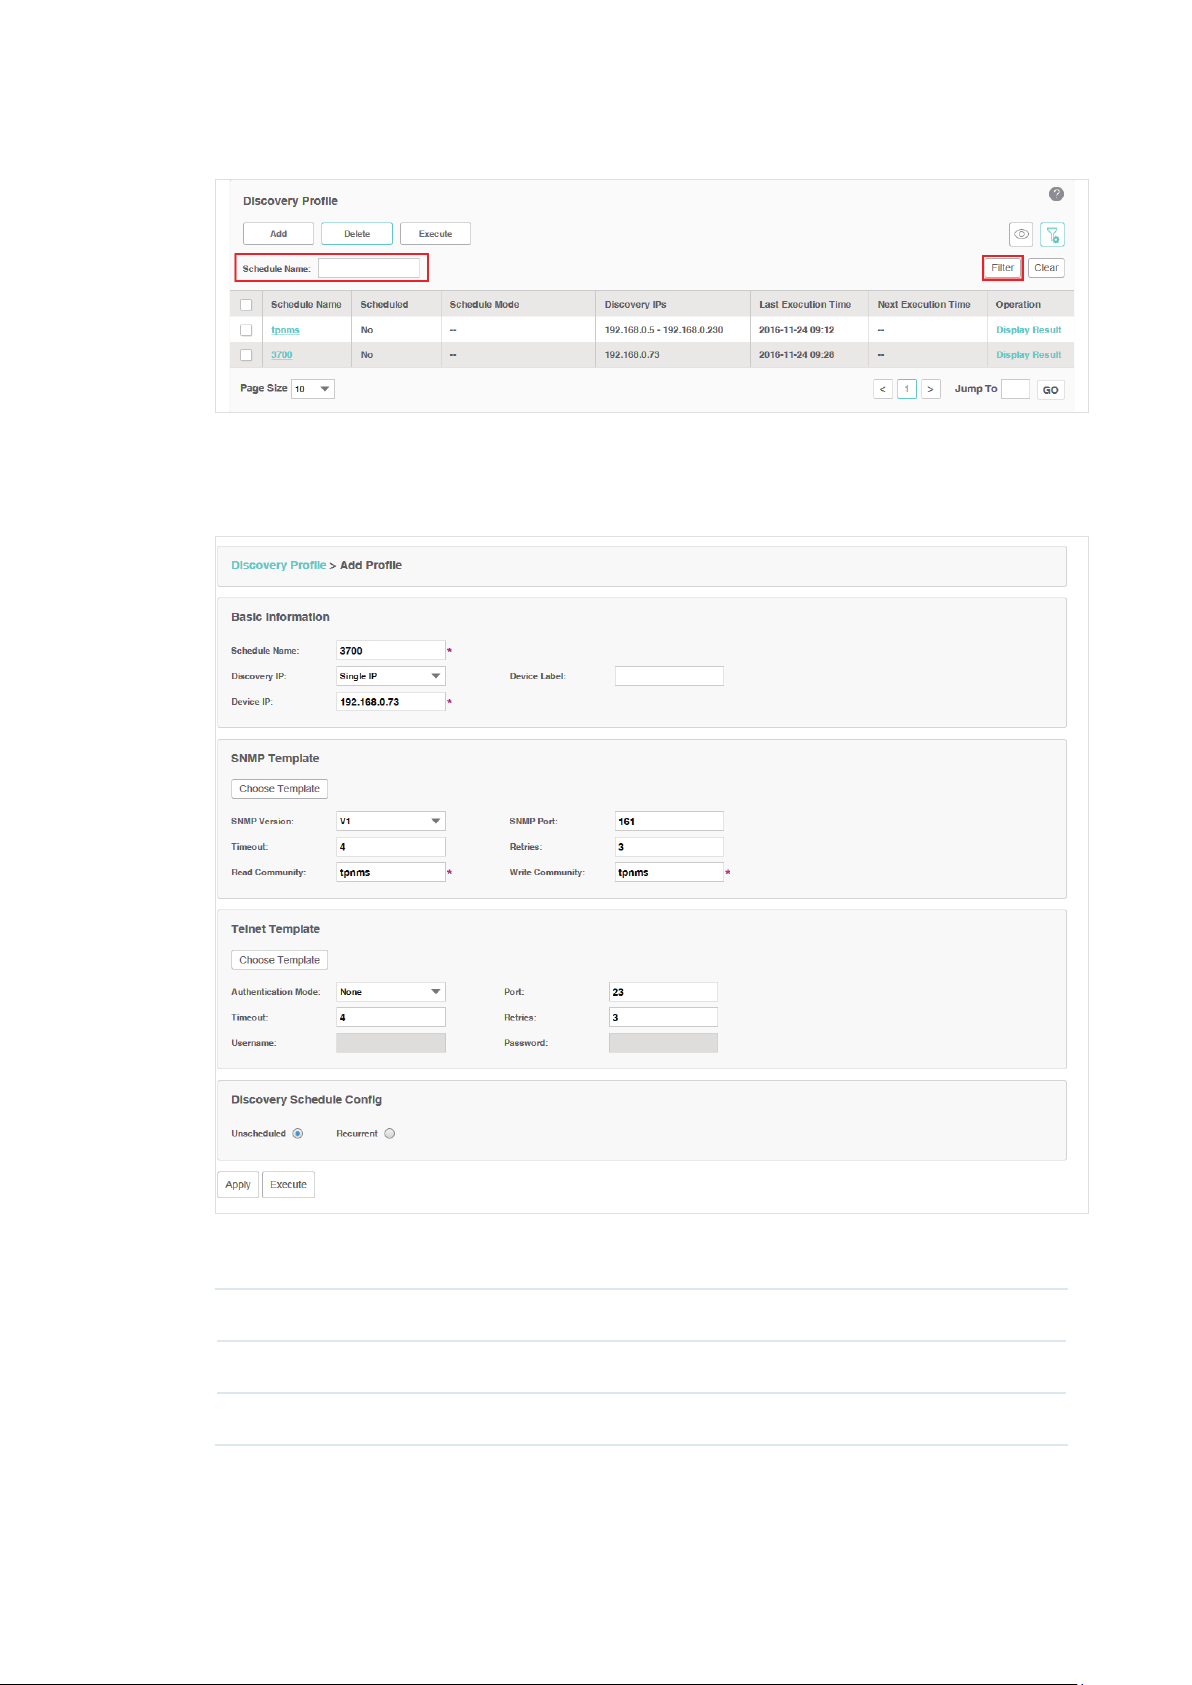
Figure 3-2 Schedule filter
3. Edit the discovery schedule's information.
Figure 3-3 Edit schedule's basic information
Basic Information
Schedule Name Enter the name of the schedule.
Discovery IP Specify the target IP type as Single IP or IP Range
Device IP Enter the target device's IP address or IP address range.
27
.
Page 28

Device Label Assign a device label to the device discovered if you select Single IP.
SNMP Template
Click
Choose Template
SNMP Version Select the SNMP version.
SNMP Port Enter the SNMP port, which is 161 by default.
Timeout Enter the timeout value, which is 4 seconds by default. The target device will be
assumed as unaccessible if it doesn’t respond within the timeout value.
Retries Enter the number of SNMP query messages that tpNMS sends, which is 3 by
default.
Read
Community (v1/
v2c only)
Write
Community (v1/
v2c only)
Security Name (v3
only)
Enter the read community strings to match the target device for authentication.
Enter the write community strings to match the target device for authentication.
Enter the user name to log in the switch.
or edit the SNMP Template manually.
Context Name
(v3 only)
Authentication
(v3 only)
Mode
Authentication
Key (v3 only)
Privacy Mode
only)
Privacy Key (v3
only)
(v3
Telnet Template
Enter the SNMP context.
Select the Authentication Mode for the SNMP v3 User.
None: No authentication method is used.
·
MD5: The port authentication is performed via HMAC-MD5 algorithm.
·
SHA: The port authentication is performed via SHA (Secure Hash
·
Algorithm). This authentication mode has a higher security than MD5 mode.
Enter the password for authentication.
Select the Privacy Mode for the SNMP v3 User.
None: No privacy method is used.
·
DES: DES encryption method is used.
·
Enter the Privacy Password.
Click
Choose Template
or edit the Telnet Template manually. You must configure
the correct telnet information for managing the device (backup, restore or upgrade
actions). The name and password in the telnet template are the same user information
28
Page 29
that you use to telnet in to the device to perform system conguration.
Authentication
Mode
Port Enter the port for telnet connection, which is 23 by default.
Timeout Enter the timeout value, which is 4 seconds by default.
Retries Enter the number of retries, which is 3 by default.
Username Enter the username for the telnet connection.
Password Enter the password for the telnet connection.
Select the authentication mode to telnet the target device.
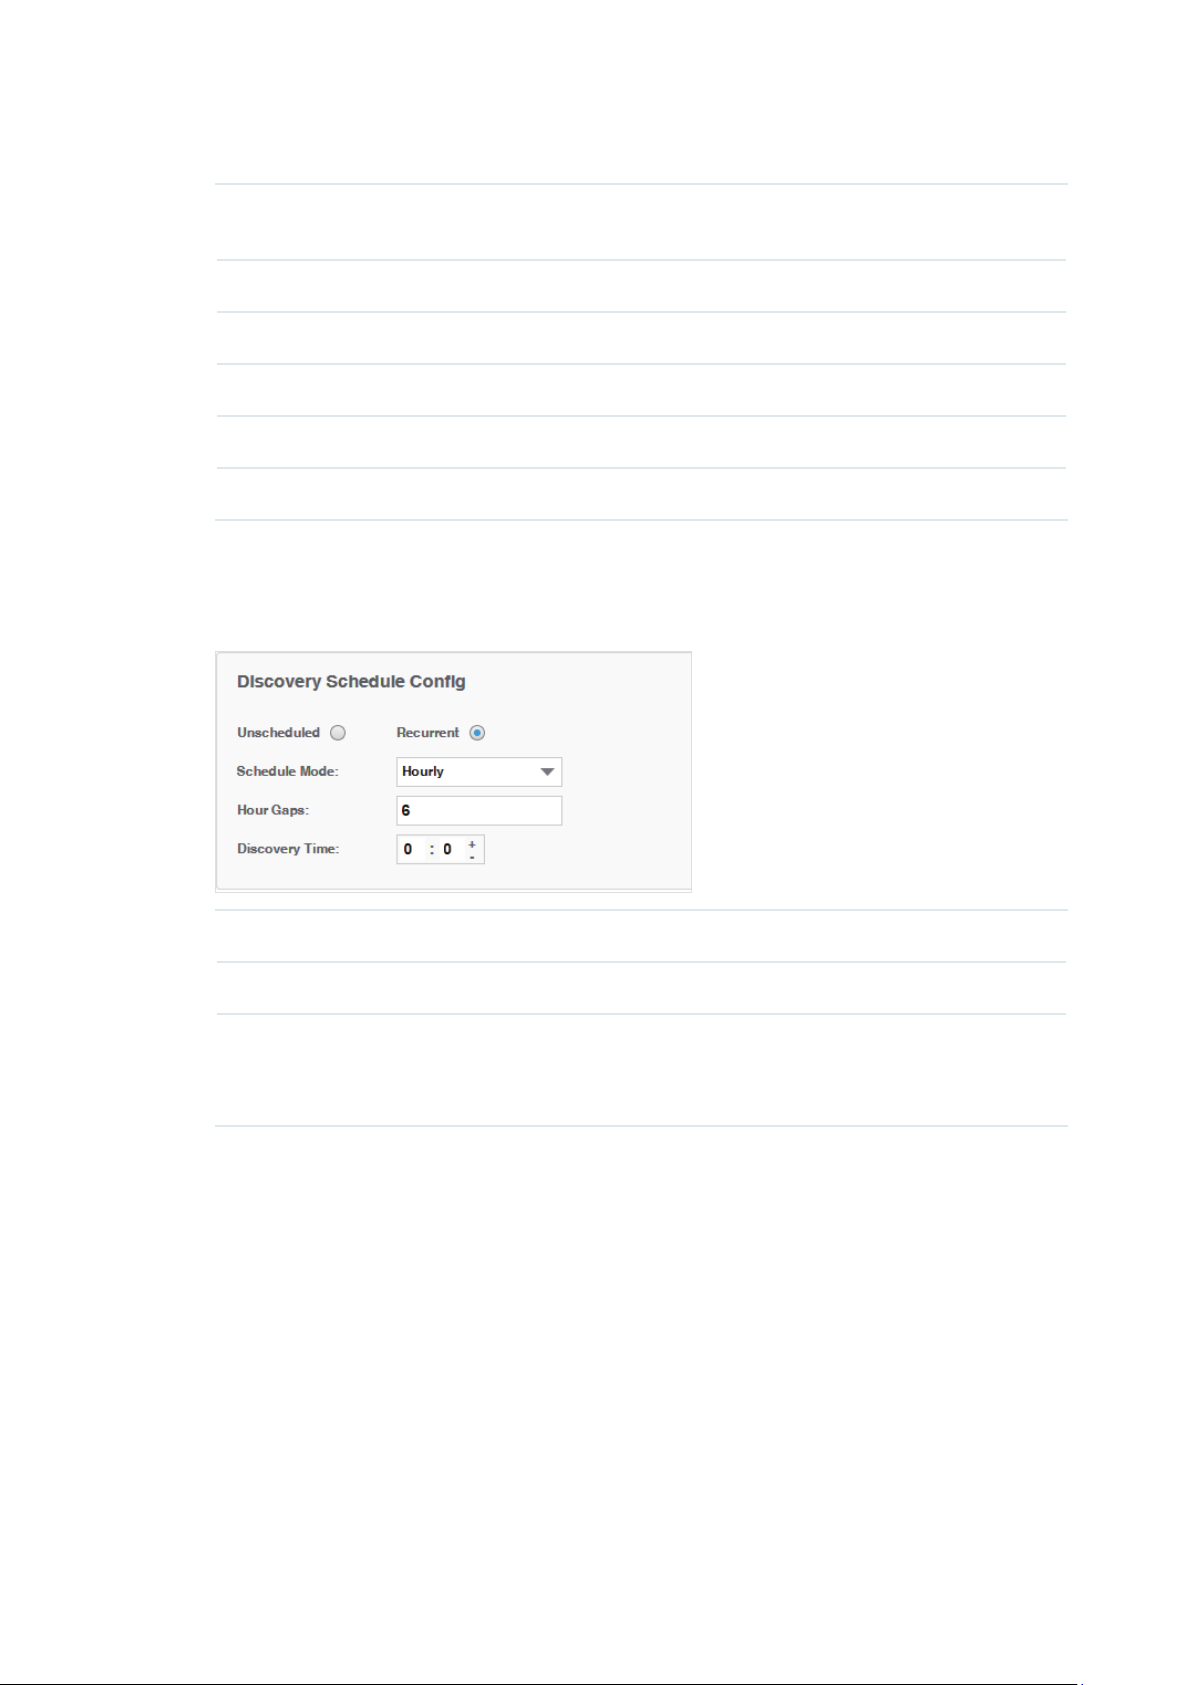
Discovery Schedule Cong
Figure 3-4 Choose schedule's execute circle
Unscheduled Select Unscheduled and the discovery job will not be executed.
Recurrent Select Recurrent and the discovery job will be executed periodically.
Schedule Mode Select the recurrent mode as Hourly, Daily, Weekly or Monthly.
Configure the exact time of the discovery schedule according to the schedule
mode you choose.
29
Page 30
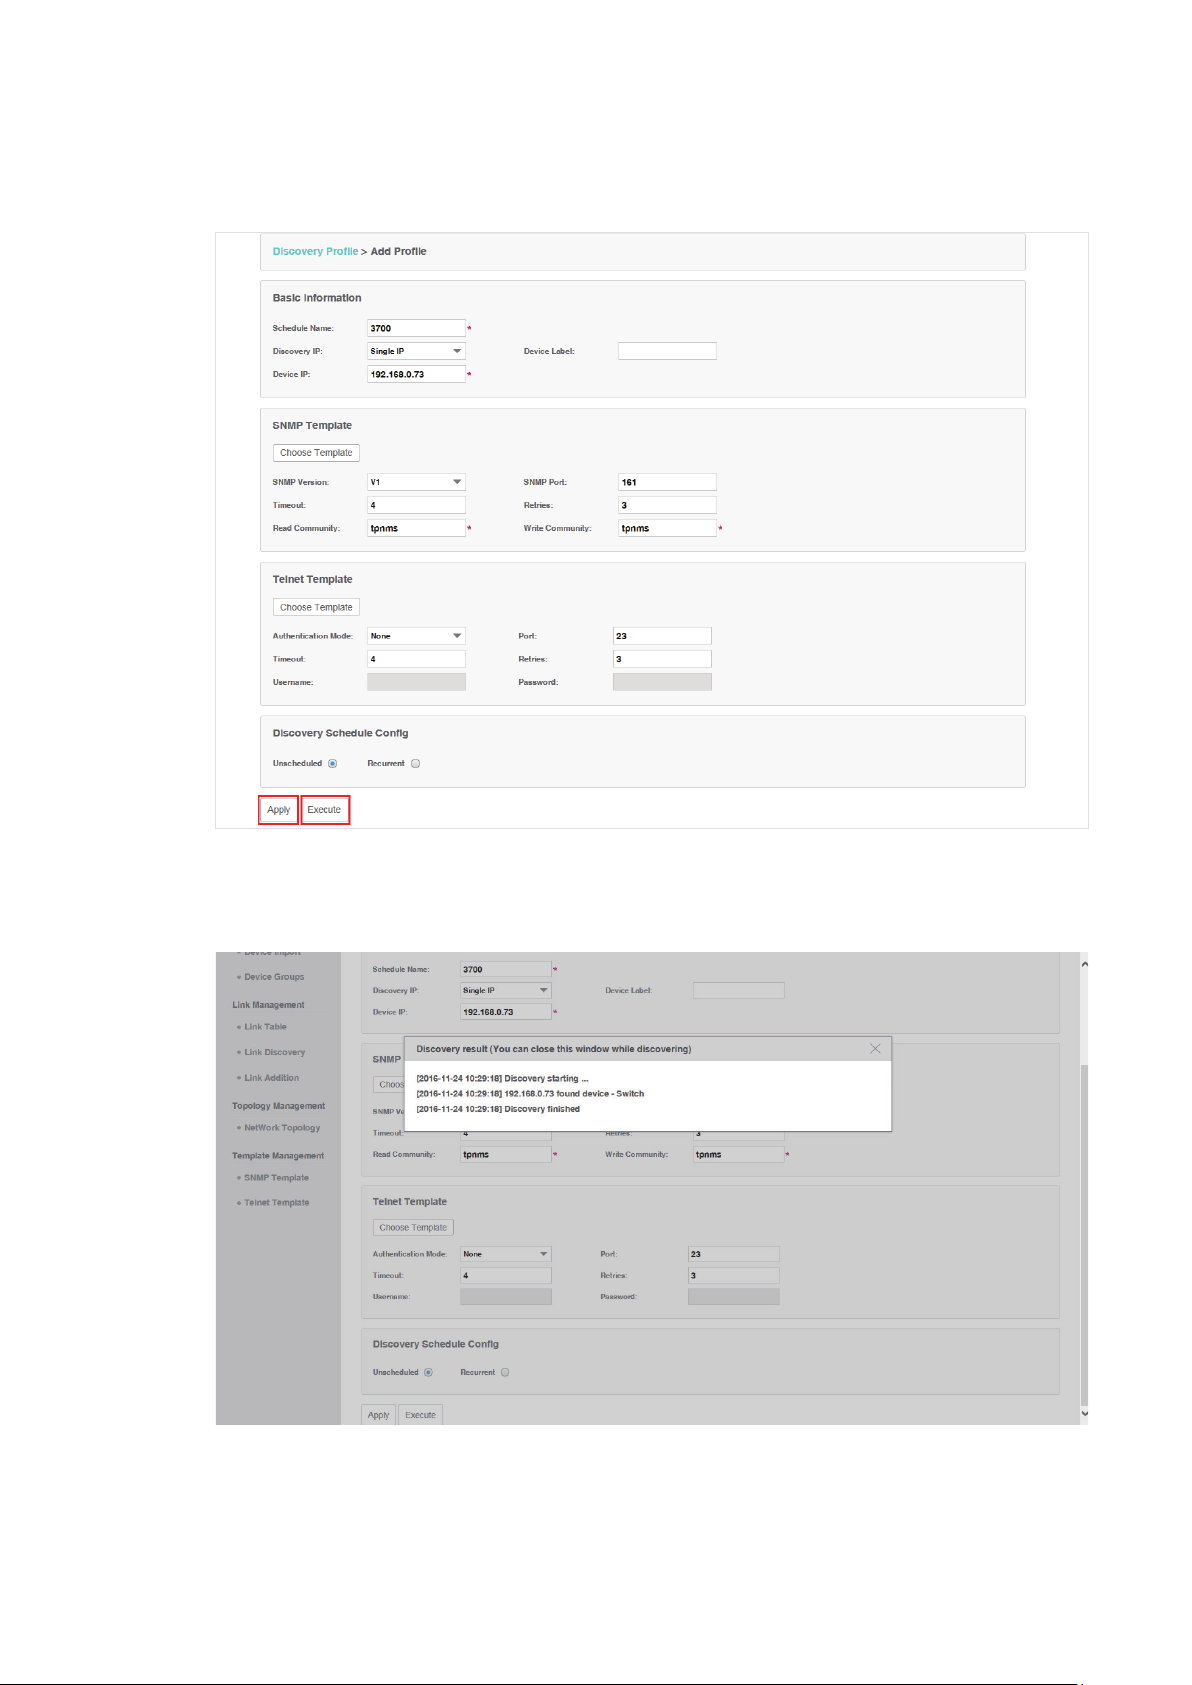
4. Click
Apply
Figure 3-5 Save or execute a schedule
to save this profile. Click
Execute
to run this schedule immediately.
5. An example of discovery result is displayed below.
Figure 3-6 Discovery result
Delete a discovery profile
Click Delete to remove the selected discovery schedule from the table.
30
Page 31

Figure 3-7 Delete a discovery schedule
3.1.2 Manage Discovery Templates
• Add or modify an SNMP Template
• Add or modify a Telnet Template
Add or modify an SNMP Template
You can manage SNMP Templates on the Resource > Template Management>
SNMP Template screen.
Figure 3-8
Click
Add
Manage SNMP templates
or click the template name in the table to edit the template.
31
Page 32

Figure 3-9 Add or edit an SNMP template
Add or modify a Telnet Template
You can manage Telnet Templates on the Resource > Template Management
Telnet Template screen.
Figure 3-10
Click
Figure 3-11 Add or edit an Telnet template
Manage Telnet templates
or click the template name in the table to edit the template.
Add
>
32
Page 33

3.2 View and Manage Devices
This section describes the following tasks that you can perform:
• View the Device List
• Remove a Device
• Synchronize a Device
• Log in to a Device
• Ping or Traceroute a Device
• Reboot a Device
• Access Config
You can manage devices on the Resource > Device Management > Device Table
screen.
3.2.1 View the Device List
1. Go to
Resource > Device Management > Device Table
devices that the application has discovered.
Figure 3-12 Device list
. The screen displays all the
2. To add or delete columns displayed in the device list table, click the and specify
the columns by selecting or deselecting the corresponding checkboxes.
33
Page 34

3. To filter the devices in the list, click the . Enter the filter conditions and click
Figure 3-13 An example of filtering the T1600 series switches
Filter
You can filter the listed devices through one or more of the following conditions:
Device Label, Device IP, Device MAC and Device Status.
.
Click
to display all the discovered devices.
Clear
3.2.2 Remove a Device
Go to Resource > Device Management > Device Table
Click Delete to remove the selected devices from the device table.
Figure 3-14
Remove a device
.
34
Page 35

3.2.3 Synchronize a Device
Go to Resource > Device Management > Device Table
.
Click Synchronize to synchronize the selected devices in the device table. The
synchronization result pops up as below.
Figure 3-15 Synchronization result
Your successful synchronization operation will synchronize the device’s
information to tpNMS immediately. By default the devices‘ information in this list is
synchronized every 2 minutes.
3.2.4 Log in to a Device
Go to Resource > Device Management > Device Table
Select a device and click Web Management to log into the device's web interface.
The login interface opens in a new tab. This connection uses the TCP port 80,
which cannot be changed.
Figure 3-16 Log in to the device
.
35
Page 36

Enter the username and password to log in to the device. For TP-Link switches, the
default User Name is admin and the default Password is admin.
Figure 3-17 Login to the device's interface
3.2.5 Ping or Traceroute a Device
Go to Resource > Device Management > Device Table
Click Ping or Traceroute to ping or traceroute the selected device in the device
table. The result displays in the pop-up window.
Figure 3-18 Ping result
.
36
Page 37

Figure 3-19 Traceroute result
3.2.6 Reboot a Device
Go to Resource > Device Management > Device Table. Click Reboot to reboot the
selected devices in the device table.
3.2.7 Access Config
Go to Resource > Device Management > Device Table. Click Access Config to
configure the credentials that pertain to the devices you are trying to access.
Figure 3-20 Access configurations
37
Page 38

SNMP Template
Congure the SNMP template to match the SNMP congurations on the target switches.
SNMP Version Select the SNMP version as v1,v2c or v3.
SNMP Port Enter the SNMP port, which is 161 by default.
Timeout Enter the timeout value, which is 4 seconds by default. The target device will be
assumed as unaccessible if it doesn’t respond within the timeout value.
Retries Enter the number of SNMP query messages that tpNMS sends, which is 3 by
default.
Read
Community (v1/
v2c only)
Write
Community (v1/
v2c only)
Security Name (v3
only)
Context Name
(v3 only)
Authentication
(v3 only)
Mode
Authentication
Key (v3 only)
Enter the read community strings to match the target device for authentication.
Enter the write community strings to match the target device for authentication.
Enter the user name to log in the switch.
Enter the SNMP context.
Select the Authentication Mode for the SNMP v3 User.
None: No authentication method is used.
·
MD5: The port authentication is performed via HMAC-MD5 algorithm.
·
SHA: The port authentication is performed via SHA (Secure Hash
·
Algorithm). This authentication mode has a higher security than MD5 mode.
Enter the password for authentication.
Privacy Mode
only)
Privacy Key (v3
only)
(v3
Select the Privacy Mode for the SNMP v3 User.
None: No privacy method is used.
·
DES: DES encryption method is used.
·
Enter the Privacy Password.
Telnet Template
Edit the Telnet Template manually. You must configure the correct telnet information for
further managing the device (backup, restore or upgrade actions).
Authentication
Mode
Select the authentication mode to telnet the target device.
38
Page 39

Port Enter the port for telnet connection.
Timeout Enter the timeout value, which is 4 seconds by default.
Retries Enter the number of retries, which is 3 by default.
Username Enter the username for the telnet connection.
Password Enter the password for the telnet connection.
3.3 Import Devices
You can customize a template file and use the file as a criteria to search for
devices in the network. Only the devices that match the customized conditions
will be discovered. The Import Devices function gives you more control over the
discovery process because the conditions you set are a bit more complicated.
1. Go to
2. Click
Figure 3-21 Download Config template
Resource > Device Management > Device Import
template.xls
to download the excel file
Config Template
.
.
3. Edit the parameters in the downloaded template.xls.
Figure 3-22 Edit template
4. Upload customized template file to import devices that match the criteria.
Figure 3-23 Upload Config template and import devices
39
Page 40

Click
Choose
to select your customized template file and click
Import
to search for
devices that match the conditions.
Figure 3-24 Import result
Note:
If you want to manage the imported device (backup, restore or upgrade), you should go
to the
Access Config
page and configure the device’s telnet template. The name and
password in the telnet template are the same user information that you use to telnet in to
the device to perform system conguration.
3.4 Add Devices into Groups
Once the devices are discovered, you can group them by model, category, location
or other criteria. You can create static and dynamic device groups. Device group
offers a convenient way for the batch backup, restore and update actions.
• View Groups
• Add Devices to Static Group
• Add Devices to Dynamic Group
• Delete Groups
3.4.1 View Groups
Go to Resource > Device Management > Device Groups
displayed below.
Figure 3-25
Device groups
40
. The device groups are
Page 41

3.4.2 Add Devices to Static Group
1. Go to
2. Click
Resource > Device Management > Device Groups
Add Static Group
description.
Figure 3-26 Create a static group
3. Click
to add devices into the group.
Add
.
to create a static device group. Enter the group name and
Figure 3-27 Add Devices to a static group
You can select devices manually in the device list, or use the filter function to filter
the specified devices. In this example all the T1600 series switches are filtered out.
Select the devices and click Apply to add these devices to the group.
4. Click
Apply
to save the static group.
41
Page 42

3.4.3 Add Devices to Dynamic Group
Go to Resource > Device Management > Device Groups
to
add the devices that match the specified criteria to a dynamic group
Figure 3-28 Add devices to a dynamic group
3.4.4 Delete Groups
. Click
Add Dynamic Group
.
Go to Resource > Device Management > Device Groups. Click Delete to remove
the selected device groups from the group table.
Figure 3-29 Remove device groups
3.5 View and Manage Links on Your Network
• View Links on Your Network
• Discover Links on Your Network
• Add a Link
3.5.1 View Links on Your Network
Go to Resource > Link Management > Link Table
. The links are displayed below.
42
Page 43

Figure 3-30 View links
Link Status Displays whether the link is up or down.
Link Name Displays the link name. There are two types of link names. 'auto-discovery' means the
link is established by LLDP automatically, while links with the other names are created
by users manually.
Link Type Displays the link type. Cable means it's a physical link. Link layer link means it's a link
in layer 2.
Source Device Displays the source device of the link.
Source Port Displays the source port of the link.
Destination
Device
Destination
port
Link Speed Displays the speed of the link.
Displays the destination device of the link.
Displays the destination port of the link.
3.5.2 Discover Links on Your Network
Go to Resource > Link Management > Link Discovery
.
Click Start Discovery to discover all the links between the devices with LLDP
enabled. For devices that do not support LLDP, you can manage links manually.
43
Page 44
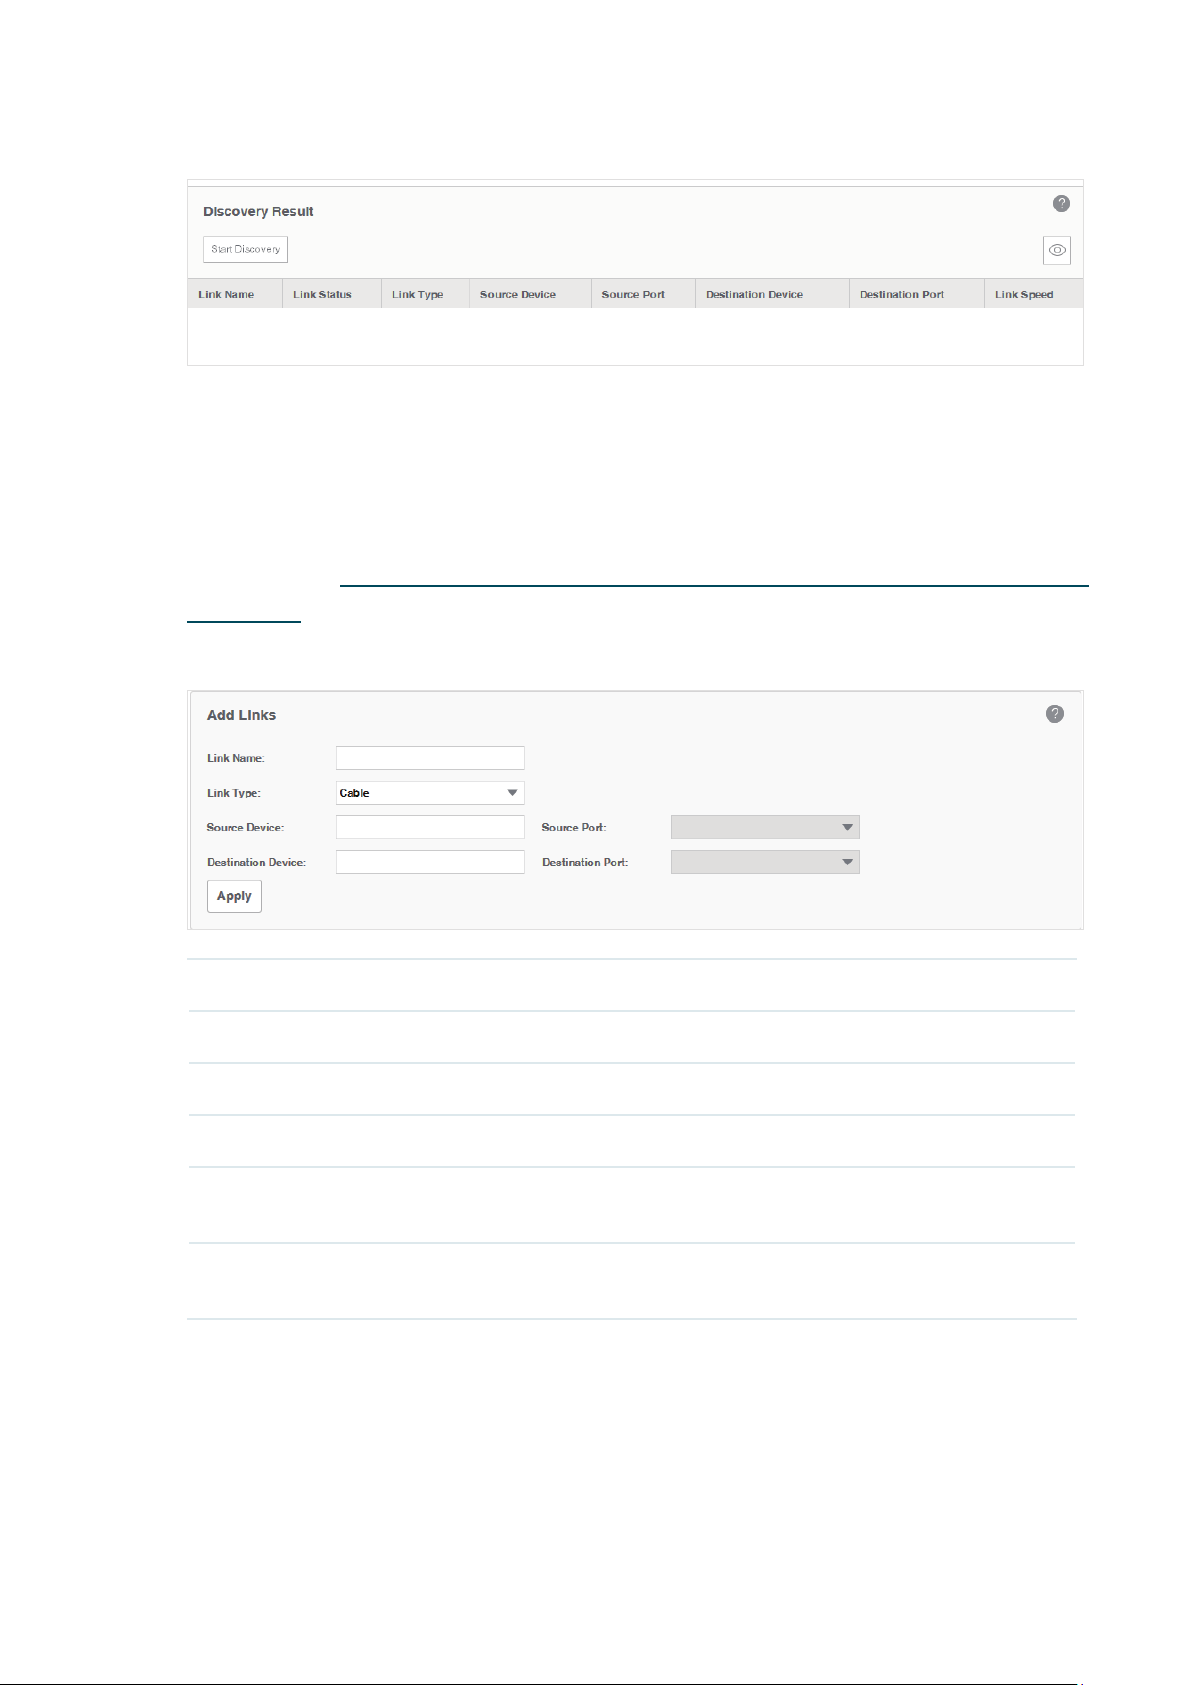
Figure 3-31 Link discovery
3.5.3 Add a Link
Go to Resource > Link Management > Link Addition
.
You can add a link on this page manually. You can also draw these links manually
on the map in Discovery and Manage Resources > Manage Maps and Topologies >
Add a Link
Figure 3-32
Link Name Enter the link's name.
Link Type Select the link's type.
.
Add a link
Source Device Select source device from the device list.
Source Port Select the port on source device as source port.
Destination
Device
Destination
Port
Click
Apply
to save the conguration.
Select destination device from the device list.
Select the port on destination device as destination port.
44
Page 45

3.6 Manage Maps and Topologies
tpNMS provides a world map as the default map. The world map is the root map
for any child map that you add. You can locate devices and links onto the maps
manually, thus establishing visual topologies.
This section introduces the following tasks:
• View the Maps in the Map List
• Add a Map
• Add a Device
• Add a Link
• Delete a Device, Link or Map
• Refresh the Topology
• Auto-Refresh
Go to Resource > Topology Management > Network Topology
displays below.
Figure 3-33 Network topology
. The default map
45
Page 46

3.6.1 View the Maps in the Map List
The map list contains the world map as the Root map by default. The map list is a
hierarchical directory structure.
3.6.2 Add a Map
Click the icon to upload a new child map to your selected map.
Figure 3-34 Add a map
Enter the map name and upload a map with
3.6.3 Add a Device
Click the icon to add a device to the current map.
Figure 3-35 Add a device
.png
or
extension from your computer.
.jpg
46
Page 47

Select the target device and click
Figure 3-36 Device on the map
Apply
. The device will appear on the map.
3.6.4 Add a Link
Click the icon to add a new link between devices.
Figure 3-37 Add a link
47
Page 48

Draw a line between the two target devices and complete the link information,
which includes link name, link type and the connecting interfaces on both ends.
3.6.5 Delete a Device, Link or Map
Select a device, link or map and click to remove your selected object.
3.6.6 Refresh the Topology
Click to refresh the current topology manually.
3.6.7 Auto-Refresh
Click and the topology will refresh every 2 minutes automatically.
Click this icon again to cancel the auto refresh.
48
Page 49

4
Monitor Devices and Network
You can view summary and detailed information of the devices, interfaces and the
network statistics.
This chapter includes the following sections:
• Monitor the Top 10 Devices
• Monitor the Top 10 Interfaces
• Specify the Device Monitor
• Manage and View Dashboard
Please note that only T-series models’ CPU and Memory utilization can be
monitored in tpNMS. For other models’ utilization status, you can log in their web or
CLI interface to view.
49
Page 50

4.1 Monitor the Top 10 Devices
You can monitor today’s top 10 devices by average CPU and by average memory.
Go to Monitor > TopN > TopN Devices.
Top 10 Devices by Average CPU (Today)
·
Figure 4-1 Top 10 devices by average CPU
Device Name Displays the name of the device.
Device Type Displays the type of the device.
CPU Utilization
(%)
Displays the CPU utilization of the device.
Click the device name to view its detailed information.
Figure 4-2 Device information
50
Page 51

Top 10 Devices by Average Memory (Today)
·
Figure 4-3 Top 10 devices by average memory
Device Name Displays the name of the device.
Device type Displays the type of the device.
Memory
Utilization (%)
Displays the memory utilization of the device.
Click the device name to view its detailed information.
4.2 Monitor the Top 10 Interfaces
You can monitor today’s top 10 interfaces by traffic, traffic rate, bandwidth
utilization, error packets and discard packets.
Go to Monitor > TopN > TopN Interfaces.
Top 10 Interfaces by Traffic (Today)
·
Figure 4-4 Top 10 interfaces by traffic
Device Name The name of the device.
Interface Name The name of the interface.
Rx The received traffic on this interface.
Tx The sent traffic on this interface.
51
Page 52
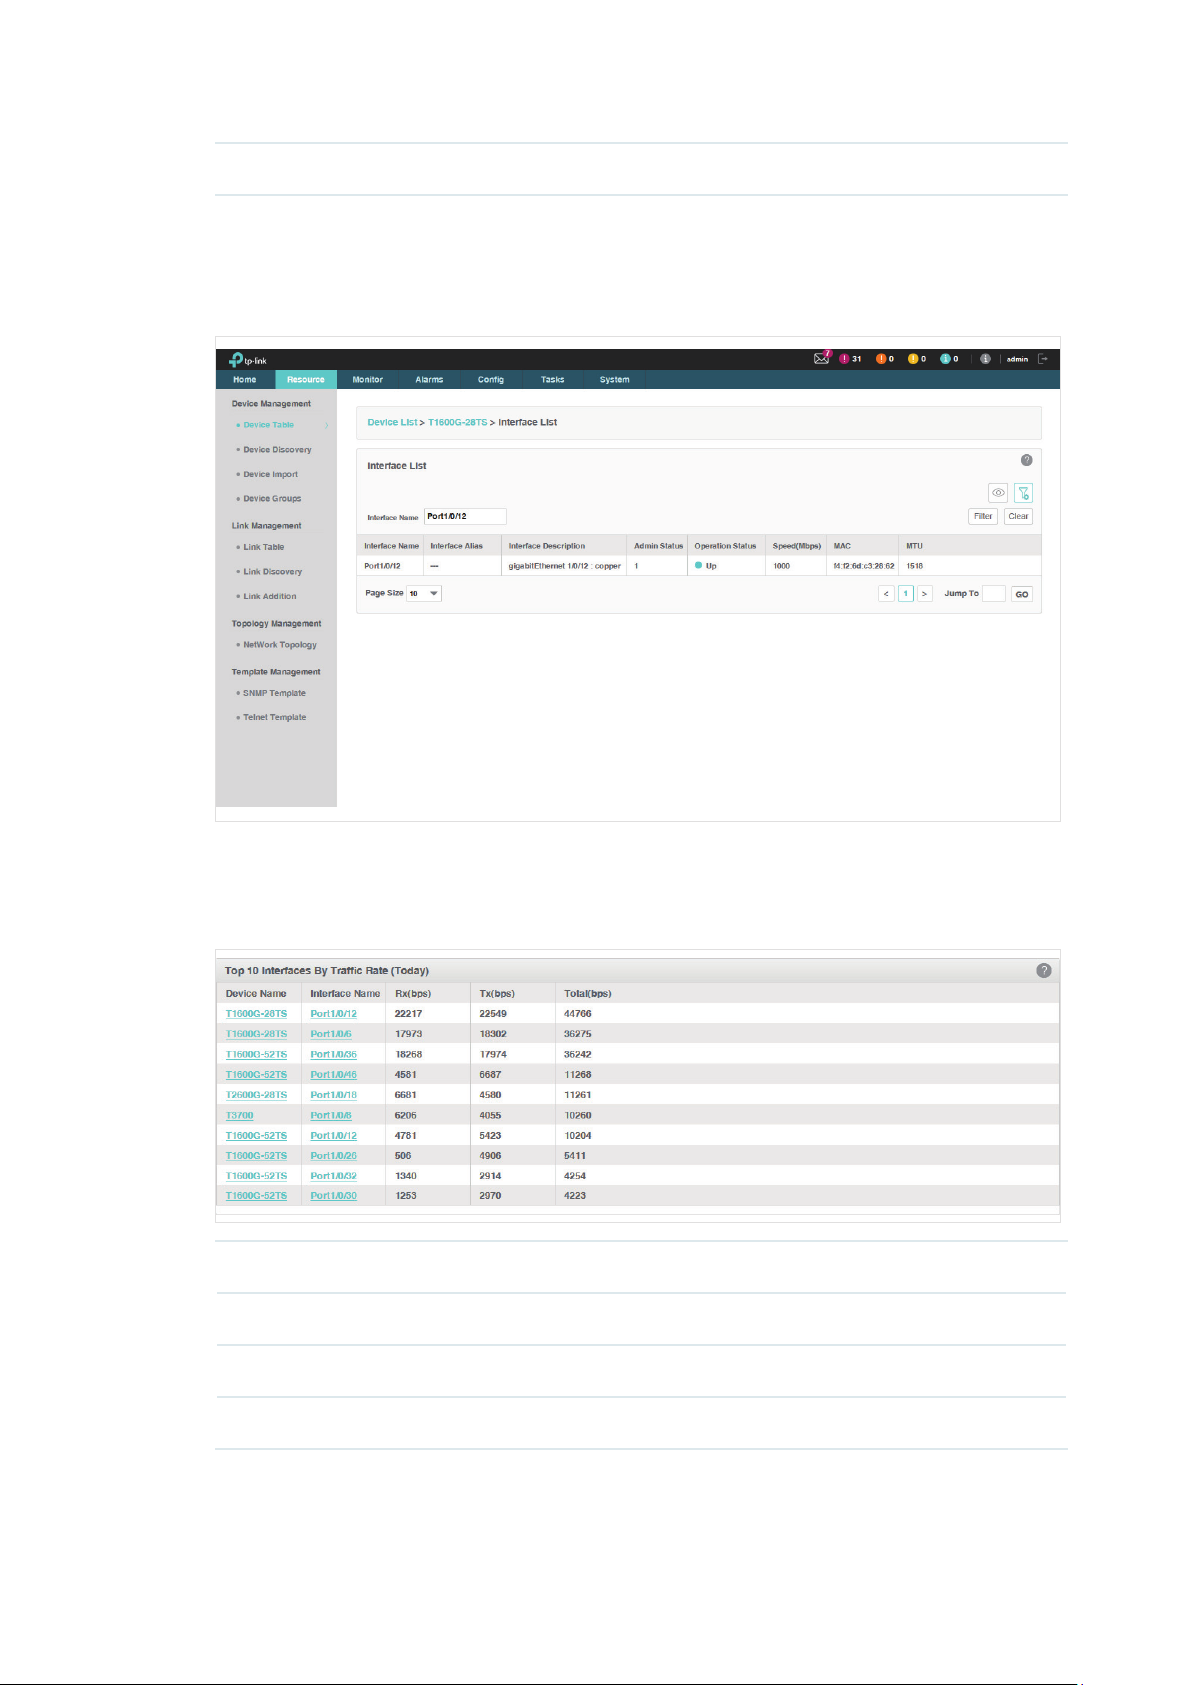
Total The total traffic forwarded on this interface.
Click the device name to view detailed information about the device. Click the interface
name to view detailed information about the interface.
Figure 4-5 Interface information
Top 10 Devices by Traffic Rate (Today)
·
Figure 4-6 Top 10 interfaces by traffic rate
Device Name The name of the device.
Interface Name The name of the interface.
Rx (bps) The received traffic rate on this interface.
Tx (bps) The sent traffic rate on this interface.
52
Page 53

Total (bps) The total traffic rate forwarded on this interface.
Click the device name to view detailed information about the device. Click the interface
name to view detailed information about the interface.
Top 10 Interfaces by Utilization (Today)
·
Figure 4-7 Top 10 interfaces by utilization
Device Name The name of the device.
Interface Name The name of the interface.
Rx Utilization The interface's utilization on receiving bandwidth.
Tx Utilization The interface's utilization on sending bandwidth.
Total The total utilization of the interface
.
Click the device name to view detailed information about the device. Click the interface
name to view detailed information about the interface.
Top 10 Interfaces by Errors (Today)
·
Figure 4-8 Top 10 interfaces by errors
Device Name The name of the device.
Interface Name The name of the interface.
53
Page 54

Rx Errors The error packets received on the interface.
Tx Errors The error packets sent on the interface.
Total The total error packets forwarded on the interface.
Click the device name to view detailed information about the device. Click the interface
name to view detailed information about the interface.
Top 10 Devices by Discard (Today)
·
Figure 4-9 Top 10 interfaces by discard
Device Name The name of the device.
Interface Name The name of the interface.
Rx Discards The discarded packets in the interface's received packets.
Tx Discards The discarded packets in the interface's sent packets.
Total The total discarded packets on the interface.
Click the device name to view detailed information about the device. Click the interface
name to view detailed information about the interface.
4.3 Specify the Device Monitor
tpNMS provides monitors for the following device metrics:
IP Traffic
·
ICMP Traffic
·
TCP Traffic
·
UDP Traffic
·
SNMP Traffic
·
54
Page 55

Interface Traffic
·
CPU
·
Memory
·
By default all the monitors are enabled. You can enable/disable and specify these
monitors on the page Monitor > Monitor Management > Device Monitor.
For information about how to configure alarms basing on these monitors, please
refer to
View and Manage Alarm Configurations
.
Go to Monitor > Monitor Management > Device Monitor.
Figure 4-10 Monitor devices
Monitor Name The name of the monitor.
Status The status of the monitor.
Monitor Type The monitor type.
Interval The interval of the monitor obtains the parameters from the target devices.
Description The description for this monitor.
Enable/Disable the Monitors
Click Enable/Disable to enable/disable the selected monitors.
55
Page 56

Specify the information of the Monitors
Click the monitor name to modify its detailed information.
1. Click
General Information
Figure 4-11 General Settings
to edit the monitor's basic information.
Monitor Name The name of the monitor.
Enable Enable or disable this monitor.
Interval Select the interval of the monitor obtains the parameters from the target
devices.
Description Description for this monitor.
56
Page 57

2. Click
Monitor Devices
Figure 4-12 Add monitor devices
to specify the devices or device groups that are monitored.
Monitor Devices Specify the devices that are monitored. The options are All Applicable Devices,
Select Devices and Select Device Groups. Use the Add and Delete button to
edit the target devices or device groups, and click Save to save the changes.
The Select Devices window displays as below.
57
Page 58

Figure 4-13 Add devices
The Select Device Groups window displays as below.
Figure 4-14 Add device groups
58
Page 59

3. Click
Monitor Indicators
Figure 4-15 Add indicators
to specify the parameters that are monitored by this monitor.
Edit the parameters that are monitored. By default all the parameters are selected. Click
Save
to save the changes.
59
Page 60

4.4 Manage and View Dashboard
You can create and customize network information to be displayed on the tpNMS
dashboard.
• Create or Modify a Dashboard View
• Launch a Dashboard View
• Display the Dashboard View
4.4.1 Create or Modify a Dashboard View
Go to Monitor > Dash Board > Dash Board Setting.
Figure 4-16 Dash board view
1. Click
to create a new dashboard view, or click the view name in the table to edit
Add
the existed dashboard view.
2. Click
General Info
Figure 4-17 Dashboard general information
to edit the basic information of the dashboard view.
60
Page 61

View Name Enter or modify the name for the dashboard view.
Interval Type Specify the time period over which you want to view the performance.
• Real Time: View the performance in real time.
• Last 1 Hour: View the performance over the last 1 hour.
• Last 24 Hours: View the performance over the last 24 hours.
• Last 7 Days: View the performance over the last 7 days.
• Last 30 Days: View the performance over the last 30 days.
Interval If you select Real Time, select the refresh frequency of the view here. The
information of this dashboard refreshes in the interval you set.
Data Source Specify the data source as Device or Interface.
3. Click
Monitor Type
Figure 4-18 Dashboard monitor type
to configure the monitors of the dashboard view.
Monitor Type Select the monitor type. There are a series of monitors for devices and a series
of monitors for interfaces.
Monitor
Indicators
Specify the monitor sources.
61
Page 62

4. Click
monitor.
Add Devices/Add Interfaces
to configure the target devices/interfaces of the
The following screenshots use
Figure 4-19 Dashboard target devices
Devices
as an example.
Click
Figure 4-20 Add target devices
to add devices in the device table. Click OK to save your selections.
Add
62
Page 63

5. Click
Apply
to save your configurations on the dashboard.
4.4.2 Launch a Dashboard View
Go to Monitor > Dash Board > Dash Board Setting. Select a dashboard view in the
table and click Launch.
Figure 4-21 Launch a dashboard
The dashboard view will be displayed in a new tab of the browser. The following tab is the
dashboard monitoring the CPU utilization of several T-series switches.
Figure 4-22 Display a dashboard
63
Page 64

4.4.3 Display the Dashboard View
Go to Monitor > Dash Board > Dash Board View. Click Select Dashboard and
select one dashboard name for display.
The dashboard will be displayed on current page.
64
Page 65

5
Manage Alarms and Traps
tpNMS can manage the traps sent from the devices.
tpNMS can define alarms basing on traps, monitor and the tpNMS system.
tpNMS can define the recipients to receive the notification emails when the
specific alarms are triggered.
This chapter includes the following contents:
• View and Manage Traps Sent from Devices
• View and Manage Alarm Configurations
• View and Manage Alarms
• View and Manage Remote Notice Profiles
65
Page 66

5.1 View and Manage Traps Sent from Devices
Go to Alarms > Trap Management > Traps.
The Trap table displays the traps sent from devices. On this screen, you can view
details of the traps, remove the traps and export the traps.
Figure 5-1 Trap list
5.1.1 View the Traps
Click the trap OID to view the trap’s detail information.
5.1.2 Delete the Traps
Select the traps and click Delete to remove them from the Trap table.
5.1.3 Export the Traps
Select the traps and click Export to PDF or Export to Excel to save the traps to
your computer.
5.2 View and Manage Alarm Configurations
tpNMS provides three types of alarms depending on their sources: Trap Alarms,
Monitor Alarms and System Alarms. Trap alarms, system alarms and some of the
monitor alarms are system built-in alarms which cannot be deleted. Users can add
new monitor-type alarms.
tpNMS provides the following four severity levels for alarms. Four shortcut icons
representing the four level alarms are placed in the upper-right region of the main
page. The color represents the severity, while red represents the highest level
66
Page 67

severity and blue represents the lowest severity. The numbers beside these icons
represent each alarm’s current quantity.
• Urgent (Red)
• Serious (Orange)
• Normal (Yellow)
• Hint (Blue)
Click on the alarm icon to view the alarm’s detail information.
Figure 5-2 Urgent alarm details
The following sections describe the alarm-related tasks
• View and Manage Current Alarm Configurations
• Add a New Alarm Configuration
• Modify Current Alarm Configurations
67
:
Page 68

5.2.1 View and Manage Current Alarm Configurations
Go to Alarms > Alarm Management > Alarm Configuration
.
You can view, enable, disable, delete and export alarm configurations on this page.
Figure 5-3 Alarm configuration list
View the alarms
To add or delete columns displayed in the alarm list table, click the
and specify the
columns by selecting or deselecting the corresponding checkboxes.
To filter the alarms in the list, click the
Alarm Name The name of the alarm. Click it to view the alarm's detailed configurations.
Status The status displays whether this alarm is valid.
Severity Four levels of severity: Urgent, Serious, Normal and Hint.
Alarm Type Three types of alarms: Trap, Monitor and System.
Description Displays the trigger conditions of the alarm.
Trap OID Displays the trap OID if this is a trap-type alarm.
. Enter the filter conditions and click
Click the alarm name to view and edit the alarm's configuration.
Filter
.
Enable/Disable the alarms
Select alarms and click the
alarm configurations.
Enable/Disable
68
button to enable/disable the corresponding
Page 69

Delete the alarms
Click the
Delete
button to remove the selected alarm configurations. The system built-in
alarms cannot be deleted.
Export the alarms
Select alarms and click the
Export to PDF/Export to Excel
corresponding alarm configurations to your computer.
5.2.2 Add a New Alarm Configuration
Go to Alarms > Alarm Management > Alarm Configuration
You can define new alarms for the monitors. The monitors can be configured on
the following page: Monitor > Monitor Management > Device Monitor.
The alarm you add is based on an existing monitor and includes a threshold.
Click Add to add a monitor-type alarm.
button to export the
.
69
Page 70

Figure 5-4 Add an alarm configuration
Monitor Information
Monitor Name Select a monitor.
Enable Displays whether this monitor is valid.
Description Displays the detailed information of this monitor.
General Information
Alarm Name Enter a name for the alarm.
Description Enter a description for the alarm.
Enable Select whether to make this alarm configuration effective.
Severity Select the alarm's severity. tpNMS supports four levels of severity: Urgent,
Serious, Normal and Hint.
Indicator Select one indicator in the monitor you chose.
70
Page 71

Alarm Type You can only create monitor-type alarms.
Calculate Type Select a consecutive or average calculation type.
Count Select a number of times that a particular event must occur before the
threshold is met.
Note Enter a note for this alarm.
Threshold Information
Threshold Type Select an upper or lower threshold.
Threshold Enter. If this threshold is exceeded, the alarm will be triggered.
Click
Apply
to save your alarm congurations.
5.2.3 Modify Current Alarm Configurations
Go to Alarms > Alarm Management > Alarm Configuration
You can modify the current alarm configurations on this page.
Modify a trap-type alarm
Click the trap-type alarm name to modify this alarm.
.
71
Page 72
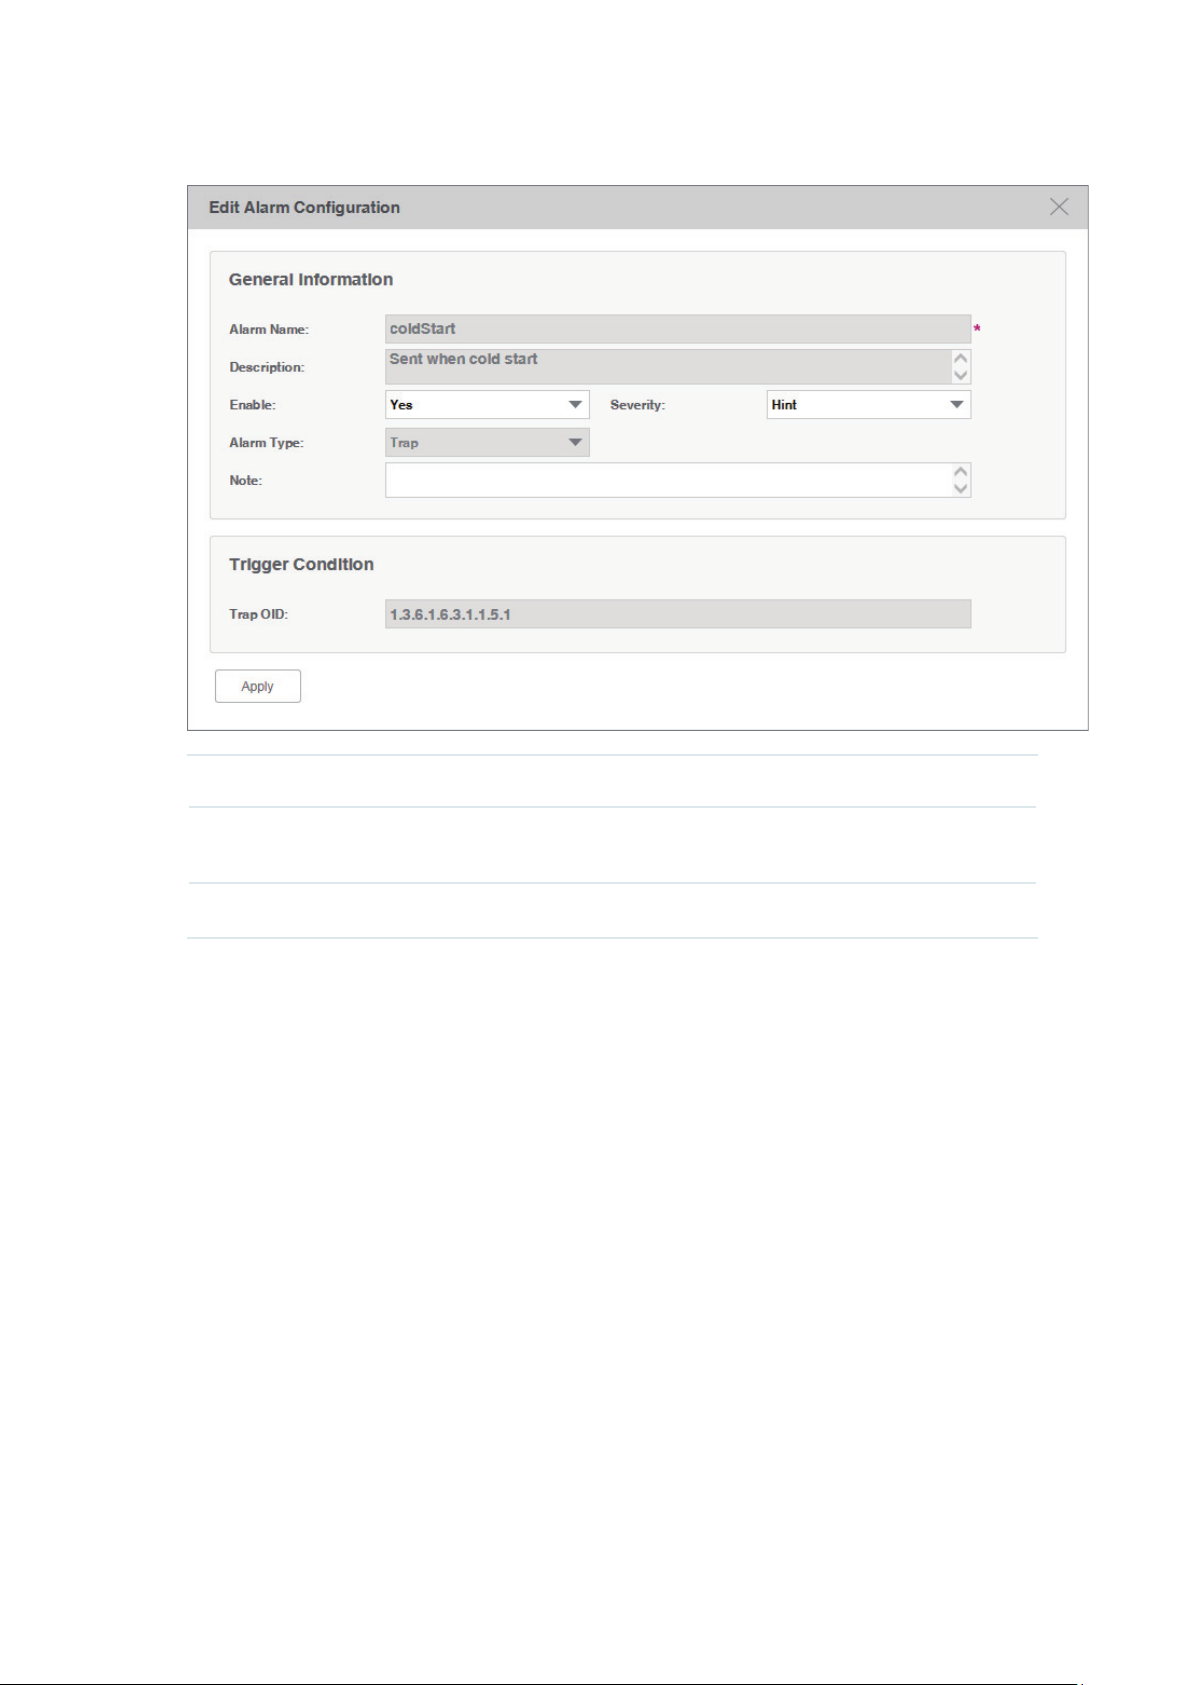
Figure 5-5 Modify a trap-type alarm configuration
Enable Enable or disable this alarm configuration.
Severity Modify the alarm's severity. tpNMS supports four levels of severity: Urgent,
Serious, Normal and Hint.
Note Add a note to this alarm.
72
Page 73

Modify a monitor-type alarm
Click the monitor-type alarm name to modify this alarm.
Figure 5-6 Modify a monitor-type alarm configuration
Enable Enable or disable this alarm configuration.
Severity Modify the alarm's severity. tpNMS supports four levels of severity: Urgent,
Serious, Normal and Hint.
Count Specify the number of times that a particular event must occur before the
threshold is met.
Note Add a note to this alarm.
Threshold Modify the threshold. If this threshold is exceeded, the alarm will be triggered.
73
Page 74
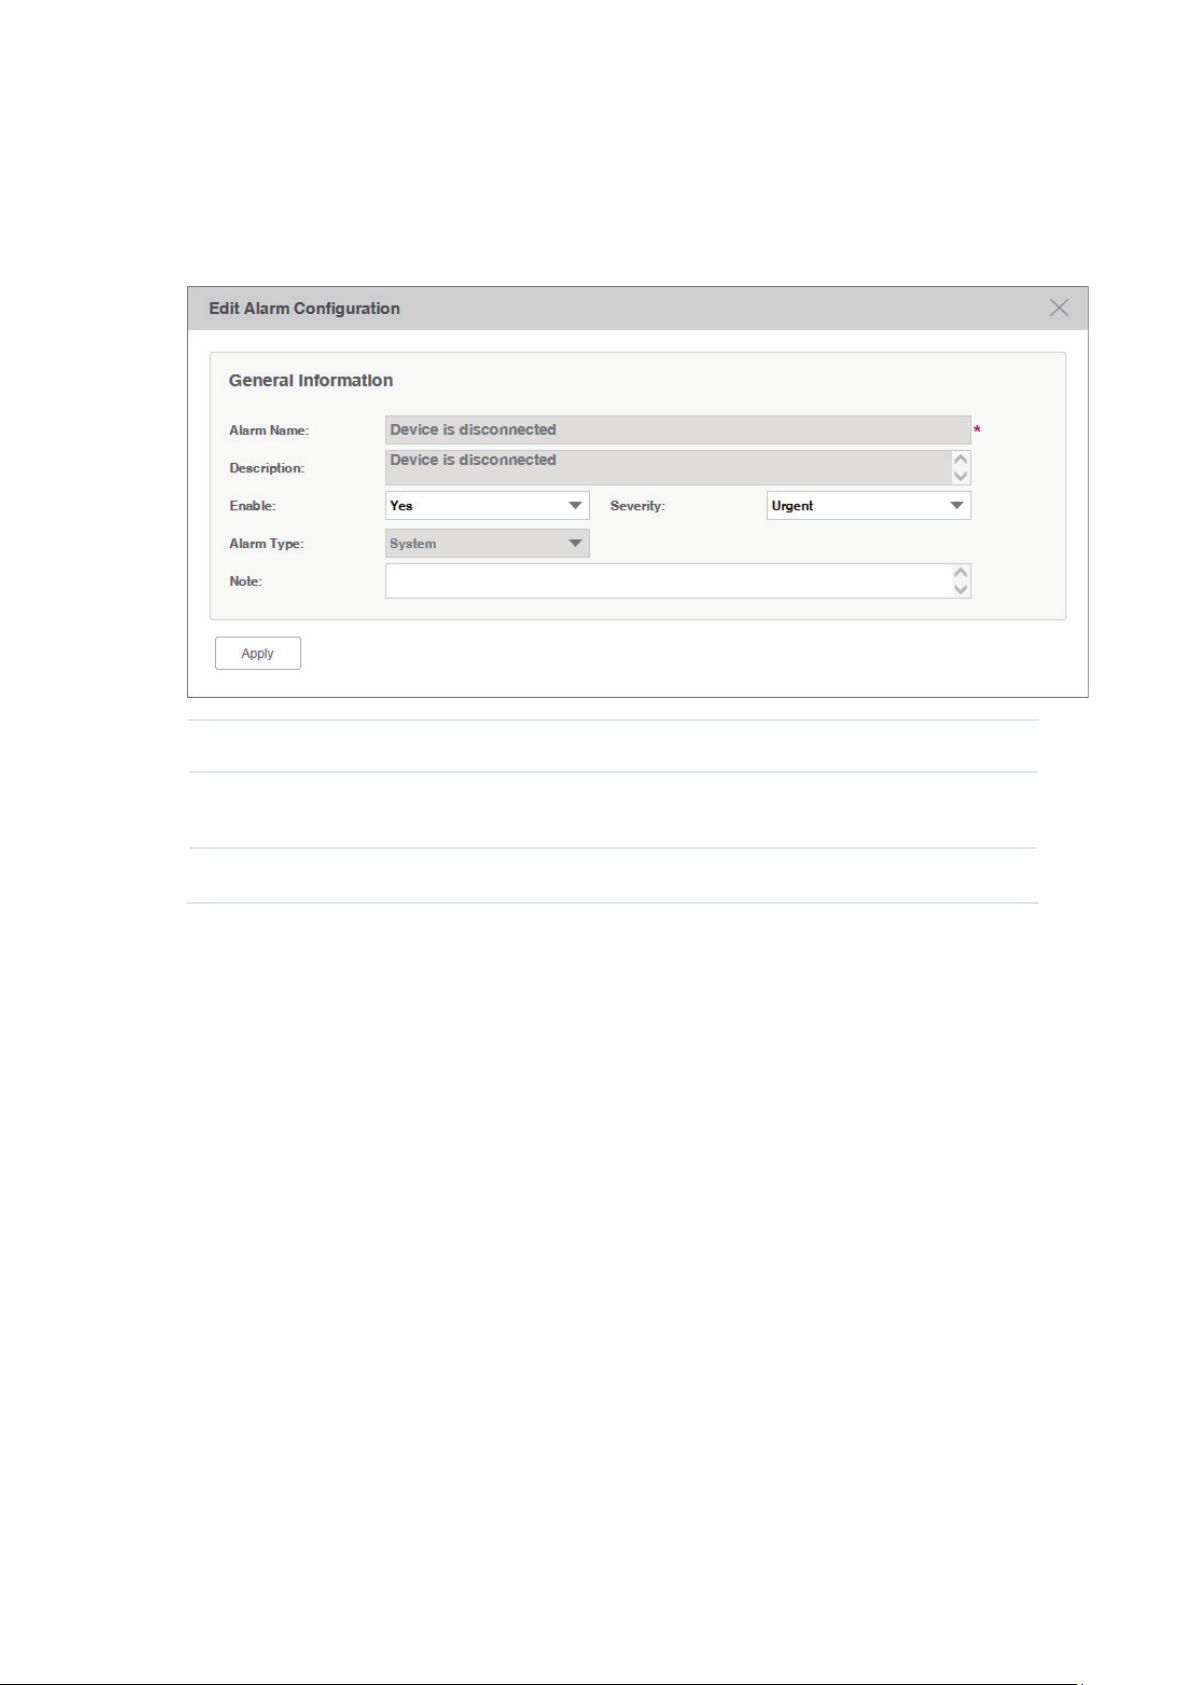
Modify a system-type alarm
Click the system-type alarm name to modify this alarm.
Figure 5-7 Modify a system-type alarm configuration
Enable Enable or disable this alarm configuration.
Severity Modify the alarm's severity. tpNMS supports four levels of severity: Urgent,
Serious, Normal and Hint.
Note Add a note to this alarm.
5.3 View and Manage Alarms
You can view and manage the current alarms and history alarms.
• View and Manage Current Alarms
• View and Manage History Alarms
5.3.1 View and Manage Current Alarms
Go to Alarms > Browse Alarm > Current Alarms
The alarm list on this page displays the current active alarms of the network. You can
acknowledge, clear and export alarms.
.
74
Page 75

Figure 5-8 Current alarm list
View the current alarms
To add or delete columns displayed in the alarm list table, click the
and specify the
columns by selecting or deselecting the corresponding checkboxes.
To filter the alarms in the list, click the
Alarm Name The name of the alarm. Click it to view the alarm's detailed configurations.
Alarm Status Whether this alarm is valid.
Alarm Type Three types of alarms: Trap, Monitor and System.
Severity Four levels of severity: Urgent, Serious, Normal and Hint.
Device IP The device IP on which the alarm occurred.
Alarm Source The source of the alarm.
Last Arrived
Time
Acked User User who confirmed the alarm.
Displays the last time the alarm arrived at tpNMS.
. Enter the filter conditions and click
Filter
.
Description The description of this alarm.
Click the alarm name to view the detailed information of the alarm.
75
Page 76
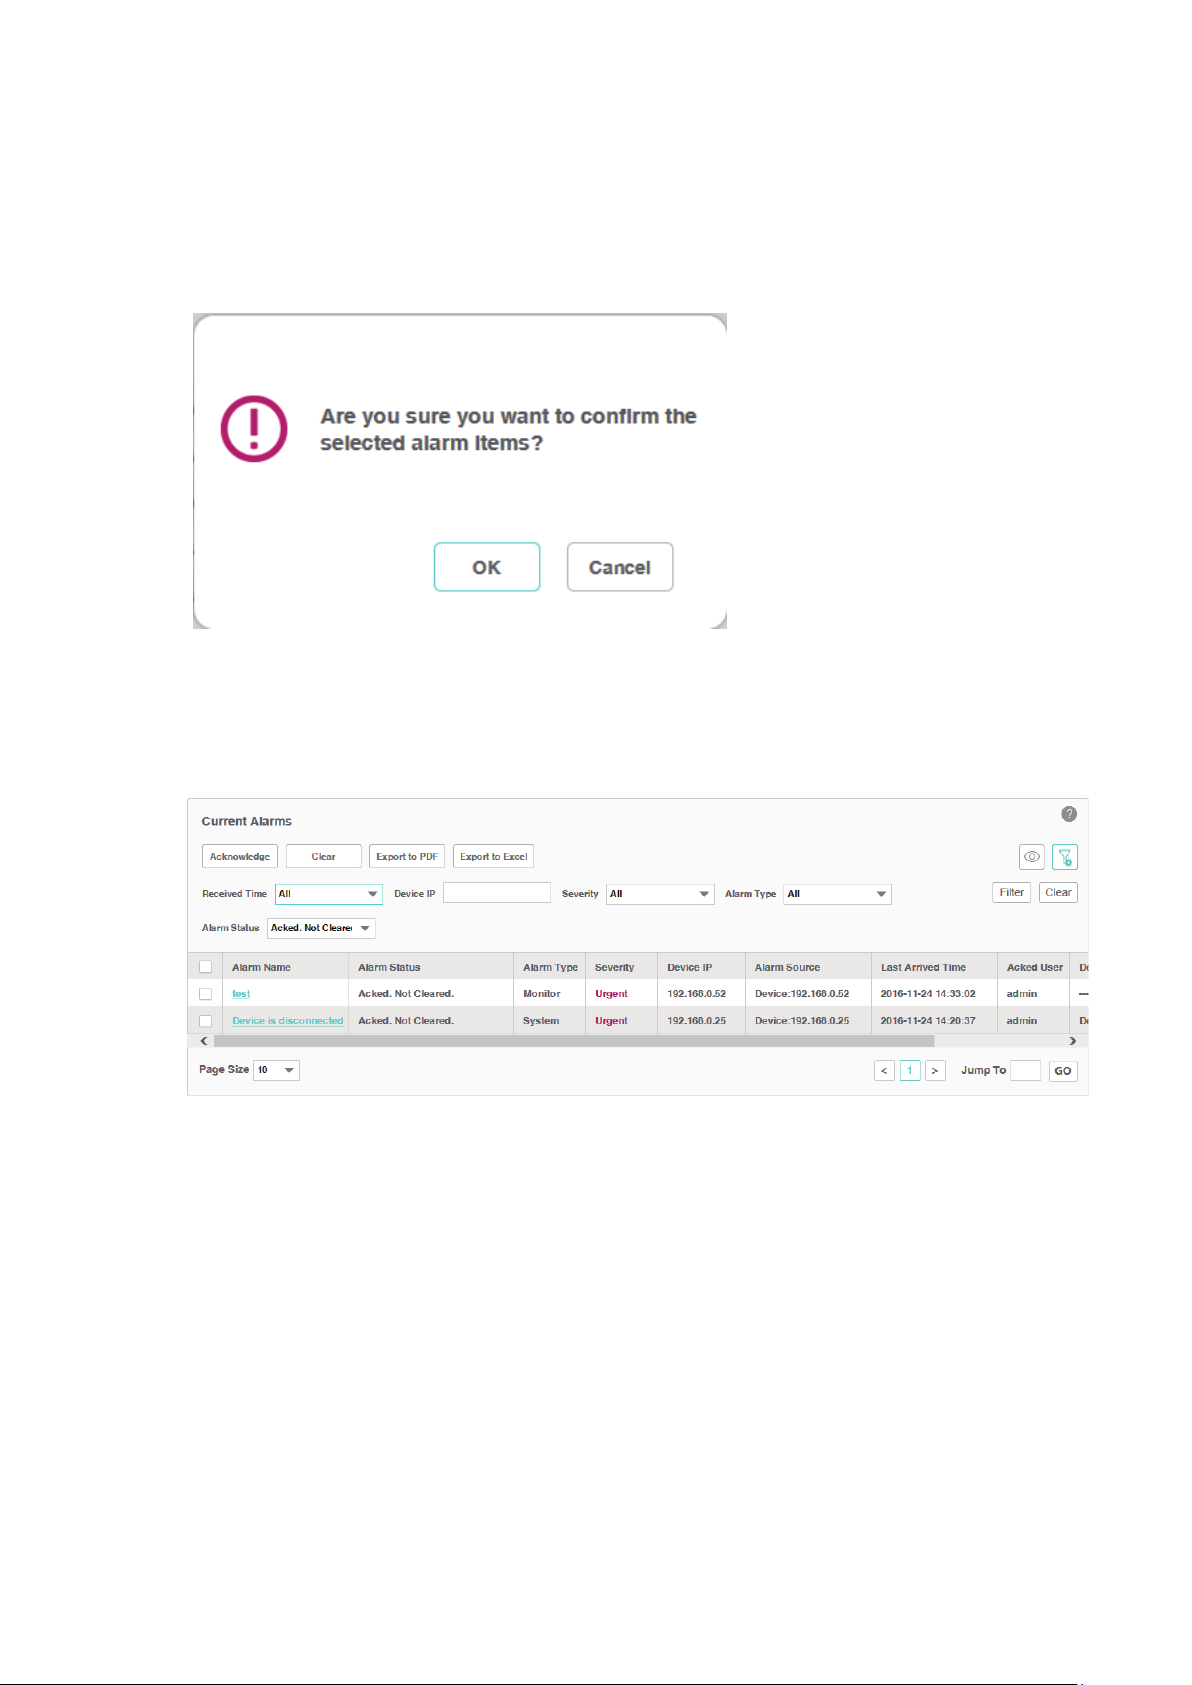
Acknowledge the current alarms
Select your desired alarms and click
Acknowledge
to confirm the alarms. Acknowledging
an alarm means that you are in charge of this alarm.
Figure 5-9 Confirm an alarm
When an alarm is confirmed, the confirmed user's name will be filled in the Acked User
column.
Figure 5-10 Confirmed alarm
Remove the current alarms
Select your desired alarms and click
to remove the alarms from this table. The
Clear
alarms you cleared here will be displayed in the History Alarms list.
Export the current alarms
Select your desired alarms and click
Export to PDF
or
Export to Excel
to your computer.
76
to save the alarms
Page 77

5.3.2 View and Manage History Alarms
Go to Alarms > Browse Alarm > History Alarms
.
You can remove and export history alarms on this page.
Figure 5-11 History alarm list
View the history alarms
To add or delete columns displayed in the alarm list table, click the
columns by selecting or deselecting the corresponding checkboxes.
To filter the alarms in the list, click the
. Enter the filter conditions and click
and specify the
.
Filter
Alarm Name The name of the alarm. Click it to view the alarm's detailed configurations.
Alarm Status Whether this alarm is valid.
Alarm Type Three types of alarms: Trap, Monitor and System.
Severity Four levels of severity: Urgent, Serious, Normal and Hint.
Device IP The device IP on which the alarm occurred.
Alarm Source The source of the alarm.
Alarm Time Displays the time the alarm arrived at tpNMS.
Acked User User who confirmed the alarm.
Description The description of this alarm.
Click the alarm name to view the detailed information of the alarm.
Remove the history alarms
Select your desired alarms and click
to remove the alarms from this table.
Clear
77
Page 78

Export the history alarms
Select your desired alarms and click
Export to PDF
or
Export to Excel
to your computer.
5.4 View and Manage Remote Notice Profiles
A remote notice profile defines certain criteria basing on the alarms. tpNMS will
generate and send alarm notice emails when specified alarm occurs. The recipients
can be customized.
Before the application can send notice emails, you should provide the email
addresses of the recipients.
• View and Manage the Recipients
• View and Manage the Notice Rules
5.4.1 View and Manage the Recipients
Go to Alarms > Remote Notice > User Groups
.
to save the alarms
Figure 5-12 Notification recipients
Add or modify a user
To add a user, click the
·
Add
button.
To modify an existing user, click the username.
·
78
Page 79

Figure 5-13 Add or modify a user
Username Enter the username.
Email Enter the email address of the user. The alarm notice emails will be sent to this
email address.
Phone Optional. Enter the phone number of the user.
Description Optional. Enter the description for this user.
Add or modify a user group
To add a user group, click the
·
To modify an existing user group, click the group name.
·
Figure 5-14 Add or modify a user group
Add
button.
79
Page 80

Basic Information
User Group Enter the user group name.
Description Optional. Enter the description for this group.
User List
Click Add or Delete to manage users in this user group.
View the current users and user groups
To add or delete columns displayed in the alarm list table, click the
columns by selecting or deselecting the corresponding checkboxes.
To filter the notice rules in the list, click the
.
Filter
Click the user/user group name to view the detailed information of the users/user groups.
5.4.2 View and Manage the Notice Rules
Go to Alarms > Remote Notice > Notice Rules
Figure 5-15 Notice rule list
and specify the
. Enter the filter conditions and click
.
Add or Modify the notice rules
To add a notice rule, click the
·
To modify an existing notice rule, click the rule name.
·
Add
button.
80
Page 81

Figure 5-16 Add or modify a notice rule (general information)
General Information
Congure the basic information of the remote rule.
Rule Name Enter the rule name.
Enable Enable or disable this notice rule.
Severity Select which level alarms will trigger this notice.
Send when the
alarm is cleared.
Description Enter the description for this notice rule.
A notice mail will be sent when the alarm is cleared if you check this box.
81
Page 82

Alarm Conguration Information
Congure the alarms in this notice rule.
Figure 5-17 Add or modify a notice rule (alarm configuration)
Target Alarms Select All Applicable Alarm Configuration, or select Select Alarm
Configuration to add the alarm configurations manually.
Add Click Add to add the existing alarm configurations. It is multi-optional.
Delete Delete the alarm configurations in the Alarm table below.
82
Page 83

Device Information
Congure the target devices that the alarms are monitoring.
Figure 5-18 Add or modify a notice rule (device information)
Target Devices Select all the applicable devices or select devices by model, by group or
separately.
Add Click Add to add devices according to their model, group or separately.
Delete Delete the devices in the device table below.
83
Page 84

The
Device Add
Figure 5-19 Add or modify a notice rule (add device)
page displays as below.
Recipient Information
Congure the recipients of the notice, and the alarm’s time-range restriction.
Figure 5-20 Add or modify a notice rule (recipient information)
Time Select the time-range restriction on the alarms.
All Day: Alarms that occurs at any time of the day will trigger the notice mail.
Specified Time: Specify a time-range. tpNMS will send notice mail only when the
alarms occurs in this specified time-range.
84
Page 85

Add Click Add to add user groups who will receive the notice email.
Delete Delete the user groups in the recipient list table below.
Click
to save your modications.
Save
View the current notice rules
To add or delete columns displayed in the alarm list table, click the
and specify the
columns by selecting or deselecting the corresponding checkboxes.
To filter the notice rules in the list, click the
.
Filter
. Enter the filter conditions and click
Click the rule name to view the detailed information of the notice rules.
Rule Name The name of the notice rule. Click it to view and edit the rule's configurations.
Status The status displays whether this rule is valid.
User Groups Displays the recipients of the notification email.
Time The sending time period of the notification email.
Severity Displays the filtering criteria of the alarms. Only the alarms of the severity levels
displayed will be sent in the email.
Description Displays the description on this notice rule.
85
Page 86

6
Manage the Configuration and Firmware Files
This chapter mainly introduces how to manage the device’s configuration files and
firmware files.
If you want to manage the discovered device (backup, restore or upgrade), you should
go to the
password in the telnet template are the same user information that you use to telnet in to
the device to perform system conguration.
• Back Up Device Configurations
• Restore Device Configurations
• Upgrade Device Firmwares
• View and Manage Schedules
• Example: Backup Configuration File for a Device
• Example: Upgrade Firmware for Several Devices
Access Config
page and congure the device’s telnet template. The name and
86
Page 87

6.1 Back Up Device Configurations
You can schedule a backup task to back up the configurations of the devices on your
network.
The backup configuration files will be saved in the \data\tftpDir in the tpNMS’s
installation directory.
• Add or Modify a Backup Schedule
• Execute a Backup Schedule
• View the Execution Result of a Backup Schedule
• Remove a Backup Schedule
6.1.1 Add or Modify a Backup Schedule
1. Go to
Figure 6-1 Backup schedule list
Config > Backup Management > Backup Schedule
.
2. Add a backup schedule or modify an existing backup schedule.
To add a backup schedule, click the Add button.
·
To modify an existing backup schedule, select your desired schedule entry
·
and click Edit.
87
Page 88

The following screen displays.
Figure 6-2 Add or modify a backup schedule
Basic Information
Name Enter the name of the backup schedule.
Enable CLI
Password
Description Enter the description for this schedule.
Check this box and enter the device's privilege-mode password if necessary.
Device Cong
Select Device
By
Select the target device by device or by device group.
Selected Devices
Add Add a device/device group whose configuration files will be backed up.
Delete Remove the selected device/device group from the table below.
Schedule Cong
Unscheduled The unscheduled backup task will be displayed in the schedule list, but will not be
executed automatically. You can manually perform the backup task on the screen
Config > Backup Management > Backup Schedule with the Execute button.
88
Page 89

One Time Select One Time and enter the Execution Time, the schedule task will be executed
automatically at the time you set.
Recurrent Select Recurrent and complete the schedule mode and frequency below, the
schedule task will be executed recurrently.
Click
Apply
to save your congurations.
6.1.2 Execute a Backup Schedule
You can execute a backup task in the schedule table immediately, either the task is
unscheduled or recurred.
1. Go to
Figure 6-3 Backup schedule list
Config > Backup Management > Backup Schedule
Schedule Name Displays the name of the backup schedule.
.
Schedule Mode Displays the mode of the backup schedule.
Last Execution
Time
Next Execution
Time
Last Execution
Result
Displays the last execution time of this backup time.
Displays the next execution time of this backup time.
Click the link to view the detailed information of this backup task's last execution
result.
89
Page 90
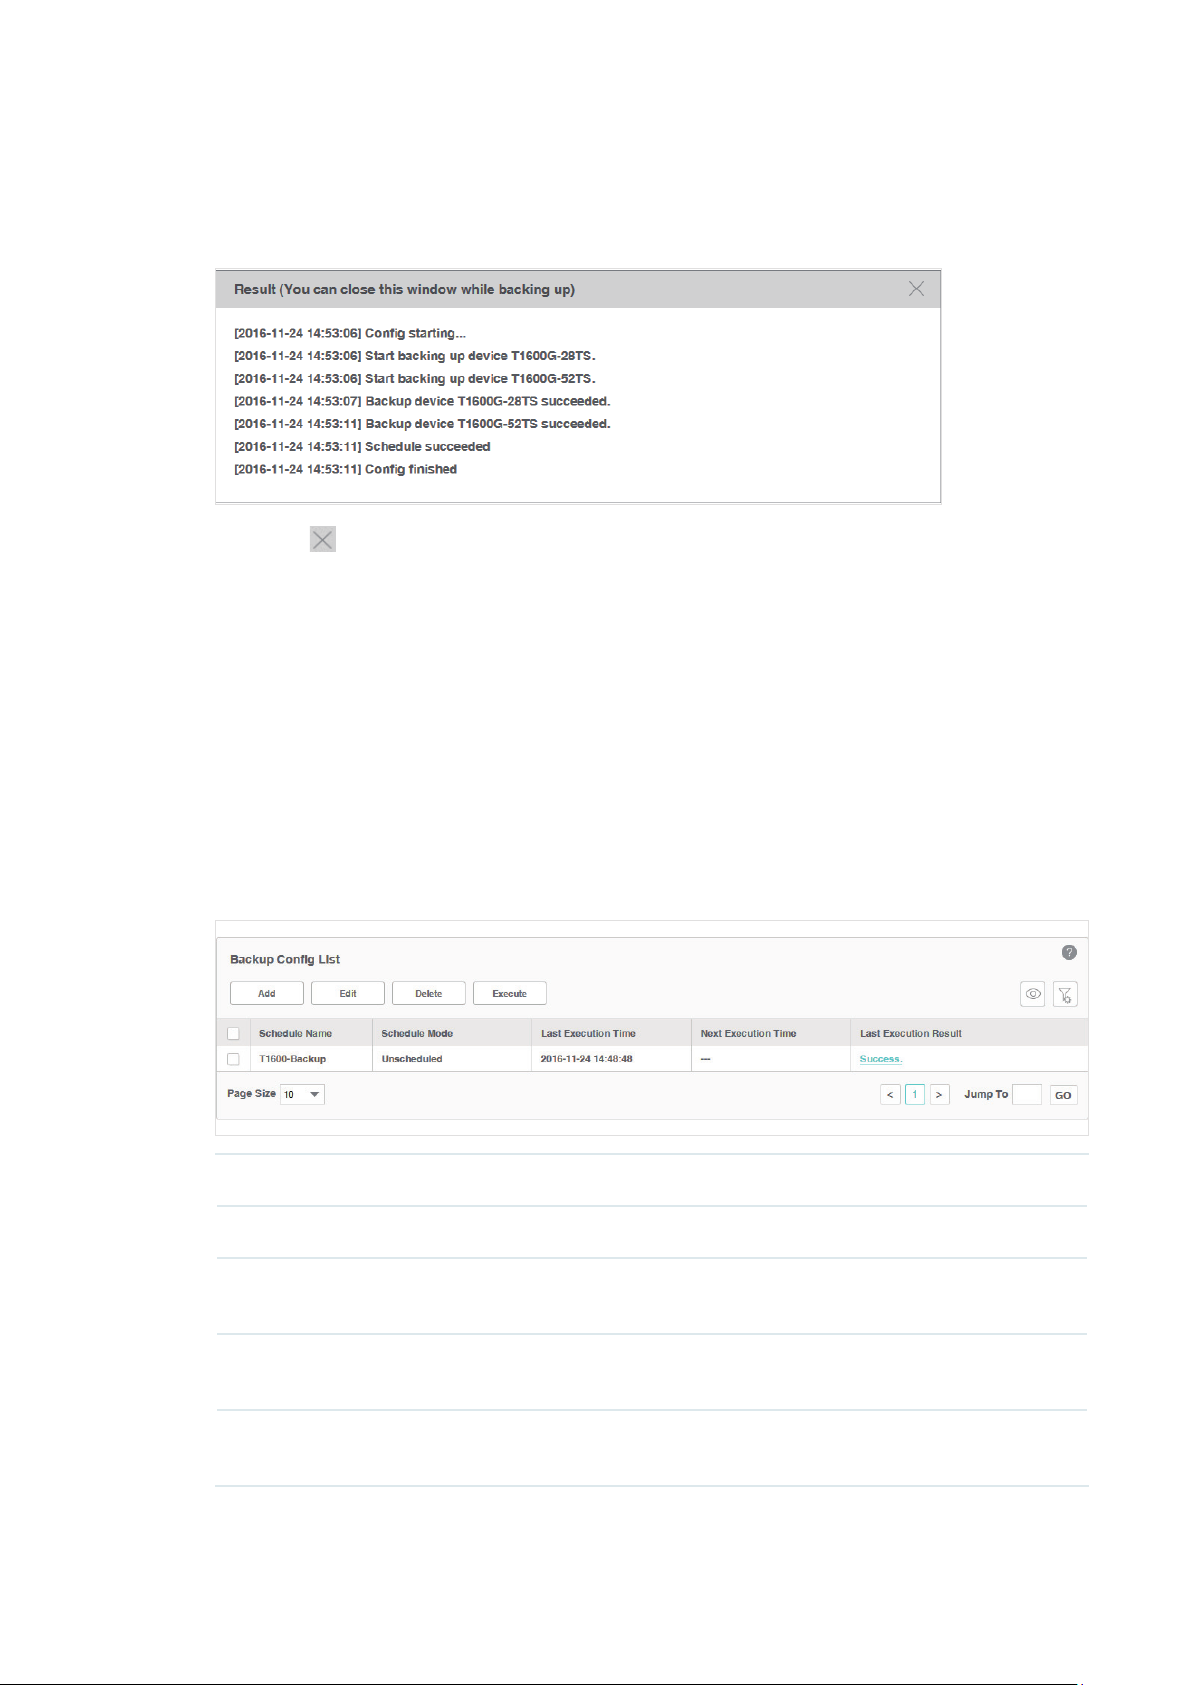
2. Click the
Execute
button to execute your selected backup schedule immediately. A
window will pop up to display the execution result.
Figure 6-4 Backup process
Click the in the upper-right corner to close this pop-up window. You can close this
window and perform some other operations with tpNMS during the backup process.
The backup process will run in the background. You can view the backup's progress on
the screen
Tasks > Task Management > Tasks
.
6.1.3 View the Execution Result of a Backup Schedule
You can view the execution status of your desired backup job to ensure that the
device's configuration is backed up as scheduled.
1. Go to
Figure 6-5 Backup schedule list
Config > Backup Management > Backup Schedule
Schedule Name Displays the name of the backup schedule.
Schedule Mode Displays the mode of the backup schedule.
Last Execution
Time
Displays the last execution time of this backup time.
.
Next Execution
Time
Last Execution
Result
Displays the next execution time of this backup time.
Click the link to view the detailed information of this backup task's last execution
result.
90
Page 91
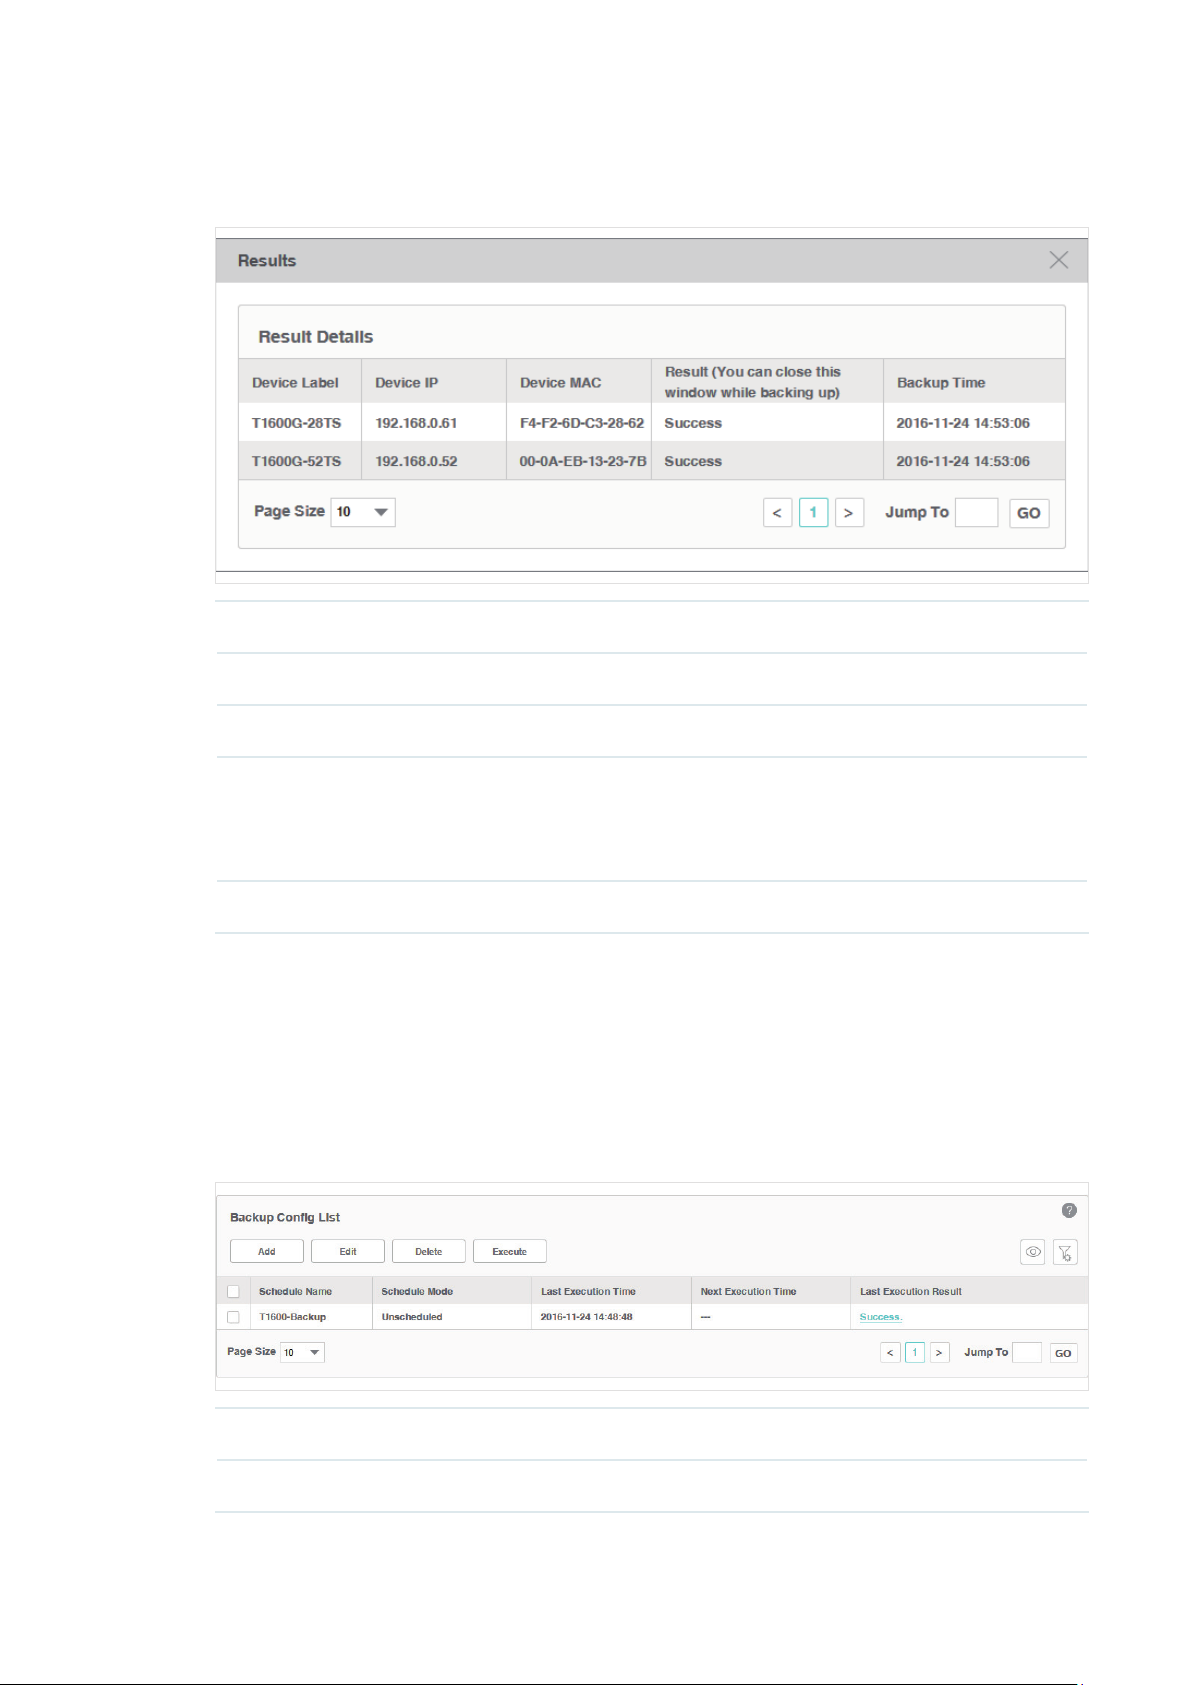
2. Click the link in the last row of the schedule table to view the detailed execution result.
Figure 6-6 Backup result
Schedule Name Displays the label of the device.
Device IP Displays the IP address of the device.
Device MAC Displays the MAC address of the device.
Result (You
can close this
window while
backing up)
Backup Time Displays the time of the backup operation.
Displays the backing up result.
6.1.4 Remove a Backup Schedule
You can remove your selected backup schedule task in the schedule Table.
1. Go to
Figure 6-7 Backup schedule list
Config > Backup Management > Backup Schedule
.
Schedule Name Displays the name of the backup schedule.
Schedule Mode Displays the mode of the backup schedule.
91
Page 92

Last Execution
Time
Displays the last execution time of this backup time.
Next Execution
Time
Last Execution
Result
2. Select the backup profile and click
Displays the next execution time of this backup time.
Click the link to view the detailed information of this backup task's last execution
result.
Delete
to remove the profile from this table.
6.2 Restore Device Configurations
You can upload the configuration files of the devices to tpNMS, and restore the
configuration files to corresponding device(s) on your network.
• Import a Configuration File
• Modify a Configuration File
• Remove a Configuration File
• Add a Restore Schedule
6.2.1 Import a Configuration File
1. Go to
Figure 6-8 Configuration file list
Config > Deploy Management > Config File
.
92
Page 93

2. Click
Import
Figure 6-9 Upload a configuration file
to upload the configuration file with
extension from your computer.
.cfg
3. Click
Apply
and the configuration file is listed in the Config File table.
6.2.2 Modify a Configuration File
1. Go to
Figure 6-10 Configuration file list
Config > Deploy Management > Config File
.
93
Page 94

2. Select the desired configuration file in the table and click
Figure 6-11 Edit a configuration file
Edit File
to modify this file.
3. Click
Apply
to save your modifications to the configuration file.
6.2.3 Remove a Configuration File
1. Go to
Figure 6-12 Configuration file list
Config > Deploy Management > Config File
.
94
Page 95

2. Select the desired configuration file and click
3. Click OK in the pop-up confirm window to complete the deletion.
6.2.4 Add a Restore Schedule
Delete
to remove this file from the table.
1. Go to
Figure 6-13 Configuration file list
Config > Deploy Management > Config File
.
95
Page 96

2. Select the configuration file in the table and click
Restore
.
3. In the
Deploy Config List > Deploy Schedule
information.
Figure 6-14 Edit a restore schedule
window, edit the schedule’s
Basic Info
Name Enter the name of the restore schedule.
Restore File Display the name of the configuration file.
Enable
password
Description Enter the description of the restore schedule.
Click the checkbox to enter the device's privileged password if necessary.
Target Devices
Select Device
By
Select the target devices by devices or by device groups.
Selected Devices
Add/Delete Edit the target devices or device groups.
96
Page 97

Schedule
Unscheduled The unscheduled restore task will be displayed in the schedule list, but will not be
executed automatically. You can manually perform the restore task on the screen
Config > Deploy Management > Deploy Schedule with the Execute button.
One Time Select One Time and enter the Execution Time, the schedule task will be executed
automatically at the time you set.
Recurrent Select Recurrent and complete the schedule mode and frequency below. The
schedule task will be executed recurrently.
Click
Apply
to save the restore schedule information.
6.3 Upgrade Device Firmwares
You can upload the firmware files of the devices to tpNMS, and upgrade
corresponding device(s) on your network with the configuration files.
• Import a Firmware File
• Remove a Firmware File
• Add a Firmware Upgrade Schedule
6.3.1 Import a Firmware File
1. Go to
Config > Deploy Management > Firmware
Figure 6-15 Firmware file list
.
97
Page 98

2. Click
Import
Figure 6-16 Import a firmware file
Import File Click Choose to select the firmware file from your computer.
Name Enter the name of this firmware file.
to upload the firmware file from your computer.
Vendor Select the vendor of the device corresponding to this firmware.
Version Enter the firmware version.
Description Enter the description of this firmware file.
3. Click
Apply
and the firmware file is listed in the Firmware File table.
6.3.2 Remove a Firmware File
1. Go to
Config > Deploy Management > Firmware
Figure 6-17 Firmware file list
.
98
Page 99

2. Select the desired firmware file and click
Delete
3. Click OK on the pop-up confirm window to complete the deletion.
6.3.3 Add a Firmware Upgrade Schedule
to remove this file from the table.
1. Go to
Config > Deploy Management > Firmware
Figure 6-18 Firmware file list
2. Select the firmware file in the table and click
3. In the
Deploy Config List > Deploy Schedule
information.
Figure 6-19 Edit a upgrade schedule
.
Upgrade
.
window, edit the schedule’s
Basic Info
Name Enter the name of the upgrade schedule.
99
Page 100

Firmware Display the name of the firmware file.
Enable
password
Description Enter the name of the upgrade schedule.
Click the checkbox to enter the device's privileged password if necessary.
Target Devices
Select Device
By
Select the target devices by devices or by device groups.
Selected Devices
Add/Delete Edit the target devices or device groups.
Schedule
Unscheduled The unscheduled upgrade task will be displayed in the schedule list, but will not
be executed automatically. You can manually perform the upgrade task on the
screen Config > Deploy Management > Deploy Schedule with the Execute
button.
One Time Select One Time and enter the Execution Time. The schedule task will be
executed automatically at the time you set.
Recurrent Select Recurrent and complete the schedule mode and frequency below, the
schedule task will be executed recurrently.
Click
Apply
to save the upgrade schedule information.
6.4 View and Manage Schedules
Go to Config > Deploy Management > Deploy Schedule.
Your configuration-restore schedules and firmware-upgrade schedules can be
viewed and managed on this page.
Figure 6-20 Schedule list
100
 Loading...