

Page 1
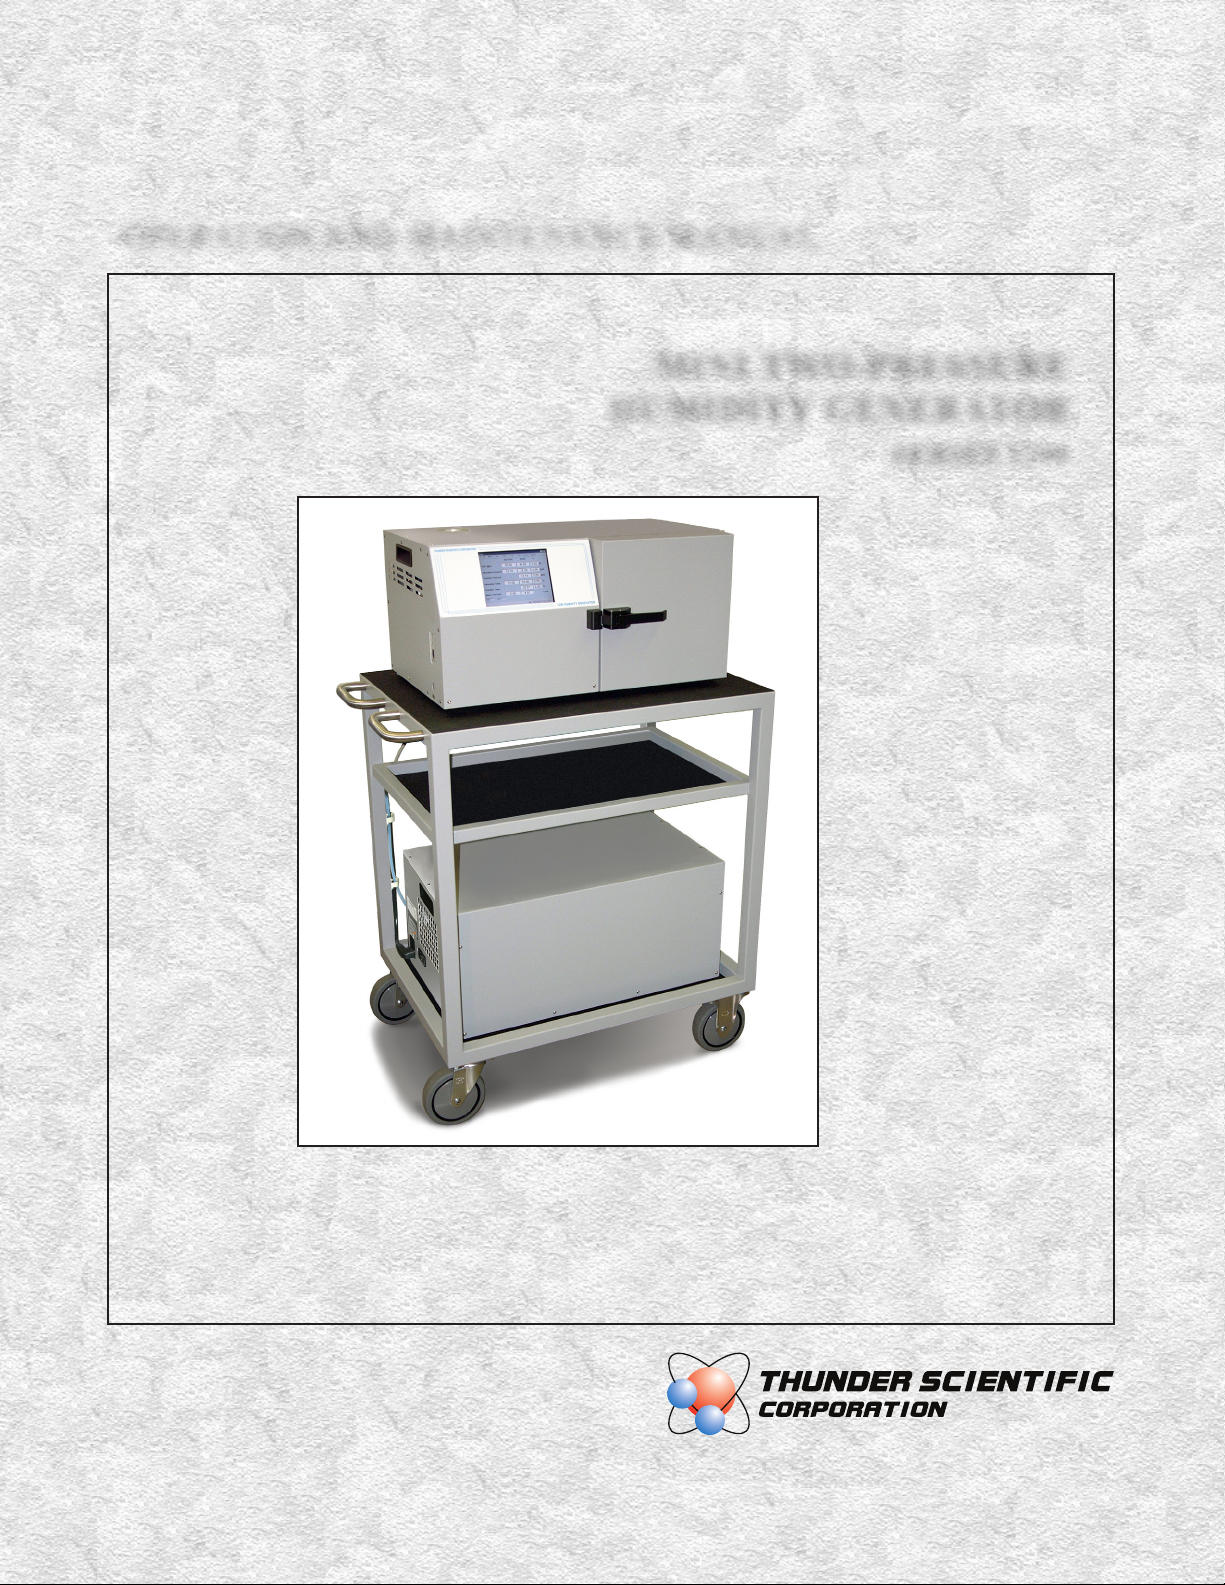
OPERATION AND MAINTENANCE MANUAL
MINI TWO-PRESSURE
HUMIDITY GENERATOR
SERIES 1200
®
Page 2

MINI 1200
MADE IN USA
TWO-PRESSURE
HUMIDITY GENERATOR
OPERATION AND
MAINTENANCE MANUAL
Copyright © 2004-2018
THUNDER SCIENTIFIC CORPORATION
623 WYOMING BLVD. SE
ALBUQUERQUE, NEW MEXICO 87123-3198
www.thunderscient
Printed 2018
Document Edition 10 June 2018
THUNDER SCIENTIFIC® is the registered trademark of Thunder Scientific Corporation.
All the information provided in this document is correct and true at the time of publication.
Thunder Scientific Corporation reserves the right to change any technical data without notice.
ific.com
Tel: 505.265.8701 Fax: 505.266.6203
E-mail: [email protected]
Page 3
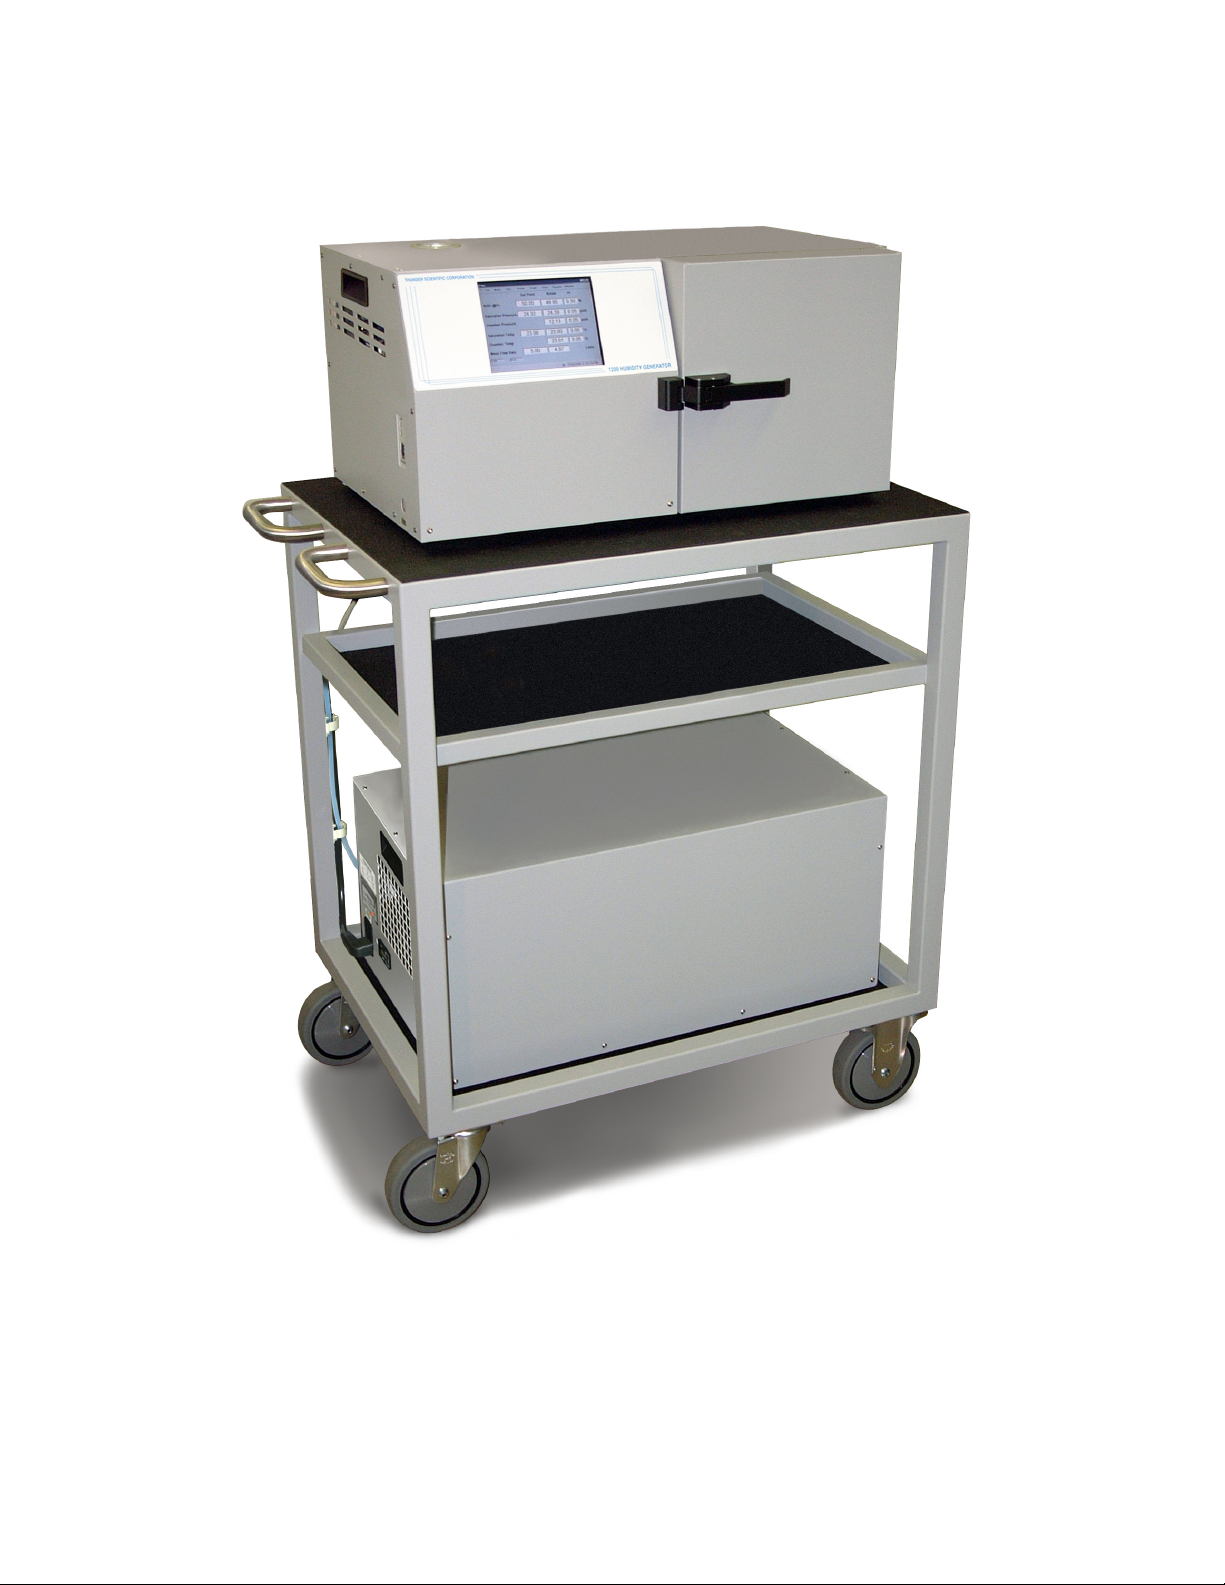
Model 1200 Two-Pressure Two-Temperature Humidity Generator
Page 4

TABLE OF CONTENTS
Section 1 - GENERAL INFORMATION
1.1 INTRODUCTION ------------------------------------------------------------------------------- 1-1
1.2 PRINCIPLE OF OPERATION --------------------------------------------------------------- 1-1
1.2.1 General Description ----------------------------------------------------------------------- 1-1
1.2.2 Humidity Formulas ------------------------------------------------------------------------ 1-2
1.2.2.1 Saturation Vapor Pressure, e ----------------------------------------------------- 1-2
1.2.2.2 Enhancement Factor, ƒ ------------------------------------------------------------- 1-3
1.2.2.3 Relative Humidity, %RH ------------------------------------------------------------ 1-4
1.2.2.4 Frost Point ----------------------------------------------------------------------------- 1-7
1.2.2.5 Dew Point ------------------------------------------------------------------------------ 1-8
1.2.2.6 Part Per Million by Volume, PPMv ----------------------------------------------- 1-9
1.2.2.7 Parts Per Million by Weight, PPMw ---------------------------------------------- 1-9
1.3 SPECIFICATIONS ---------------------------------------------------------------------------- 1-10
1.3.1 General ------------------------------------------------------------------------------------ 1-10
1.3.2 Facility Requirements------------------------------------------------------------------- 1-10
1.3.3 Environmental ---------------------------------------------------------------------------- 1-10
1.4 COMPUTER / CONTROL SYSTEM ----------------------------------------------------- 1-11
1.4.1 General Description --------------------------------------------------------------------- 1-11
1.4.2 Computer System ----------------------------------------------------------------------- 1-11
1.4.2.1 MCU Controller --------------------------------------------------------------------- 1-11
1.4.2.2 Thin Film Transistor Display (TFT) -------------------------------------------- 1-11
1.4.2.3 USB and Ethernet Interface ----------------------------------------------------- 1-11
1.5 ELECTRICAL SYSTEM --------------------------------------------------------------------- 1-12
1.5.1 Power Distribution ----------------------------------------------------------------------- 1-12
1.5.1.1 Power Supply +24 VDC (DC1) -------------------------------------------------- 1-12
1.5.1.2 Power Supply +5/+12 VDC (DC2) --------------------------------------------- 1-12
1.5.2 S
1.5.2.1 Analog to Digital Converters ----------------------------------------------------- 1-12
1.5.2.2 Flow Valve --------------------------------------------------------------------------- 1-12
1.5.2.3 Expansion Valve -------------------------------------------------------------------- 1-12
1.5.2.4 Thermoelectric Assembly -------------------------------------------------------- 1-12
1.5.3 Analog Inputs ----------------------------------------------------------------------------- 1-13
1.5.3.1 Temperature Measurement------------------------------------------------------ 1-13
1.5.3.2 Mass Flow Transducer (T0) ----------------------------------------------------- 1-13
1.5.3.3 System Pressure Transducer (T1) --------------------------------------------- 1-13
1.5.3.4 Supply Pressure Transducer (T2) ---------------------------------------------- 1-13
1.5.3.5 Reservoir Level Monitor ---------------------------------------------------------- 1-14
1.5.3.6 Presaturator Level Monitor ------------------------------------------------------- 1-14
1.5.4 Control Logic------------------------------------------------------------------------------ 1-14
1.5.4.1 Air Supply Solenoid Valve -------------------------------------------------------- 1-14
1.5.4.2 Pressure Bleed Solenoid Valve ------------------------------------------------- 1-14
1.5.4.3 Pressure Select Solenoid Valve ------------------------------------------------ 1-14
1.5.4.4 Presaturator Heater ---------------------------------------------------------------- 1-14
1.5.4.5 Presaturator Fill Solenoid Valve ------------------------------------------------ 1-15
1.5.4.6 Expansion Valve Heaters -------------------------------------------------------- 1-15
1.5.4.7 Fluid Circulation Pump ------------------------------------------------------------ 1-15
1.5.4.8 Console Fans ----------------------------------------------------------------------- 1-15
ystem Control Blocks ----------------------------------------------------------------- 1-12
i
Page 5

1.6 PNEUMATIC SYSTEM ---------------------------------------------------------------------- 1-16
1.6.1 General Description --------------------------------------------------------------------- 1-16
1.6.1.1 Reservoir ----------------------------------------------------------------------------- 1-16
1.6.1.2 Presaturator -------------------------------------------------------------------------- 1-16
1.6.1.3 Saturator ------------------------------------------------------------------------------ 1-17
1.6.1.4 Expansion Valve -------------------------------------------------------------------- 1-17
1.7 FLUID SYSTEM ------------------------------------------------------------------------------- 1-17
1.7.1 General Description --------------------------------------------------------------------- 1-17
1.7.1.1 Temperature Conditioning -------------------------------------------------------- 1-17
Section 2 - INSTALLATION
2.1 GENERAL---------------------------------------------------------------------------------------- 2-1
2.2 FACILITIES REQUIRED --------------------------------------------------------------------- 2-1
2.2.1 Bench Space ------------------------------------------------------------------------------- 2-1
2.2.2 Power ---------------------------------------------------------------------------------------- 2-1
2.2.3 Air Supply ----------------------------------------------------------------------------------- 2-1
2.2.4 Distilled Water Supply ------------------------------------------------------------------- 2-1
2.3 PREPARATION -------------------------------------------------------------------------------- 2-1
2.3.1 Chamber Fluid Filling Procedure ------------------------------------------------------ 2-1
2.3.2 Chamber Overflow Cap Removal ----------------------------------------------------- 2-2
2.3.3 Pressure Vent Cap Removal ----------------------------------------------------------- 2-2
2.4 CONNECTIONS -------------------------------------------------------------------------------- 2-3
2.4.1 Air Supply ----------------------------------------------------------------------------------- 2-3
2.4.2 AC Power ----------------------------------------------------------------------------------- 2-4
2.4.3 Optional Utility Cart Connections ------------------------------------------------------ 2-4
2.5 INITIAL START-UP ---------------------------------------------------------------------------- 2-4
2.6 EXTERNAL HUMIDITY CALIBRATION FIXTURE INSTALLATION (Option) --- 2-5
ection 3 - OPERATION
S
3.1 GETTING STARTED -------------------------------------------------------------------------- 3-1
3.1.1 Power Up ----------------------------------------------------------------------------------- 3-1
3.1.2 Initiating the Generate Mode ----------------------------------------------------------- 3-2
3.1.3 Changing the %RH Setpoint ----------------------------------------------------------- 3-4
3.1.4 Shutdown ----------------------------------------------------------------------------------- 3-4
3.1.5 Power Down -------------------------------------------------------------------------------- 3-5
3.2 WINDOWS -------------------------------------------------------------------------------------- 3-5
3.2.1 Main Screen -------------------------------------------------------------------------------- 3-5
3.2.2 Calculated Humidity Parameters ------------------------------------------------------ 3-6
3.2.3 Graph ---------------------------------------------------------------------------------------- 3-9
3.2.4 Status Log --------------------------------------------------------------------------------- 3-10
3.2.5 Tabular Data ------------------------------------------------------------------------------ 3-10
3.2.6 Profile --------------------------------------------------------------------------------------- 3-11
3.2.7 System Timing ---------------------------------------------------------------------------- 3-11
3.2.8 Calibration Coefficients ----------------------------------------------------------------- 3-11
3.2.9 Water Level and Supply Pressure --------------------------------------------------- 3-12
3.2.10 Auxiliary Parameters -------------------------------------------------------------------- 3-12
ii
Page 6

3.2.11 Remote Desktop Control -------------------------------------------------------------- 3-13
3.3 GENERATING --------------------------------------------------------------------------------- 3-15
3.3.1 Initiating a Generate -------------------------------------------------------------------- 3-15
3.3.2 What Happens in Generate ----------------------------------------------------------- 3-15
3.3.3 Special Considerations in Generate ------------------------------------------------ 3-15
3.3.4 Chamber Fan ----------------------------------------------------------------------------- 3-16
3.4 SHUTDOWN ----------------------------------------------------------------------------------- 3-16
3.4.1 Initiating a Shutdown -------------------------------------------------------------------- 3-16
3.4.2 What Happens during Shutdown ---------------------------------------------------- 3-16
3.4.3 Special Considerations during Shutdown ------------------------------------------ 3-16
3.5 HUMIDITY CONTROL MODES ----------------------------------------------------------- 3-17
3.5.1 Changing the Humidity Control Mode----------------------------------------------- 3-17
3.5.2 %RH @PcTc Control Mode ----------------------------------------------------------- 3-17
3.5.3 %RH @Pc Control Mode -------------------------------------------------------------- 3-18
3.5.4 Frost Point Control Mode -------------------------------------------------------------- 3-18
3.5.5 Dew Point Control Mode --------------------------------------------------------------- 3-18
3.5.6 PPMv Control Mode--------------------------------------------------------------------- 3-18
3.5.7 PPMw Control Mode -------------------------------------------------------------------- 3-18
3.5.8 Saturation Pressure Control Mode -------------------------------------------------- 3-18
3.6 SETPOINTS ----------------------------------------------------------------------------------- 3-19
3.6.1 To Change Setpoints ------------------------------------------------------------------- 3-19
3.6.2 What Happens When Changing Setpoints ---------------------------------------- 3-19
3.6.3 Special Considerations When Changing Setpoints ----------------------------- 3-20
3.7 UNITS ------------------------------------------------------------------------------------------- 3-20
3.7.1 How to Change Units ------------------------------------------------------------------- 3-20
3.7.2 What Happens When Changing Units --------------------------------------------- 3-21
3.7.3 Special Considerations When Changing Units ----------------------------------- 3-21
8 DATA STORAGE & RETRIEVAL --------------------------------------------------------- 3-22
3.
3.8.1 How the System Stores Data --------------------------------------------------------- 3-22
3.8.2 Saving the System Data --------------------------------------------------------------- 3-22
3.8.3 Retrieving Data From Previous Runs ----------------------------------------------- 3-23
3.8.4 Data Storage Interval ------------------------------------------------------------------- 3-23
3.8.4.1 Changing the Data Storage Interval ------------------------------------------- 3-24
3.9 PRINTING -------------------------------------------------------------------------------------- 3-24
3.9.1 Page Setup-------------------------------------------------------------------------------- 3-24
3.9.2 Enabling/Disabling the Printer -------------------------------------------------------- 3-25
3.9.3 What Happens When the Printer is Enabled ------------------------------------- 3-25
3.9.4 Printing Immediate Data --------------------------------------------------------------- 3-25
3.9.5 Special Considerations When Printing --------------------------------------------- 3-25
3.10 GRAPHING ------------------------------------------------------------------------------------ 3-26
3.10.1 The Tool Bar ------------------------------------------------------------------------------ 3-26
3.10.2 The Graph Menu------------------------------------------------------------------------- 3-27
3.10.3 Graph Data -------------------------------------------------------------------------------- 3-29
3.11 DIAGNOSTICS -------------------------------------------------------------------------------- 3-29
3.11.1 Performing System Diagnostics ------------------------------------------------------ 3-29
3.11.2 What Happens During Diagnostics-------------------------------------------------- 3-29
3.12 WATER LEVEL and SUPPLY PRESSURE -------------------------------------------- 3-30
3.12.1 Reservoir Water Level------------------------------------------------------------------ 3-30
3.12.2 Presaturator Water Level -------------------------------------------------------------- 3-30
3.12.3 Supply Pressure ------------------------------------------------------------------------- 3-31
iii
Page 7

3.13 AUTO PROFILING ---------------------------------------------------------------------------- 3-31
3.13.1 Entering a Profile ------------------------------------------------------------------------- 3-31
3.13.1.1 Showing the Profile in Memory -------------------------------------------------- 3-31
3.13.1.2 Entering a New Profile ------------------------------------------------------------- 3-32
3.13.1.3 Setting the Profile Units ----------------------------------------------------------- 3-32
3.13.1.4 Setting the Profile Humidity Mode ---------------------------------------------- 3-33
3.13.1.5 Entering the Profile Data ---------------------------------------------------------- 3-33
3.13.1.6 Setting the Assurance Conditions ---------------------------------------------- 3-34
3.13.1.7 Historical Data ----------------------------------------------------------------------- 3-34
3.13.1.8 Saving a Profile --------------------------------------------------------------------- 3-34
3.13.1.9 Open an Existing Profile ---------------------------------------------------------- 3-35
3.13.1.10 Printing a Profile -------------------------------------------------------------------- 3-35
3.13.1.11 Saving a Profile as the Default -------------------------------------------------- 3-35
3.13.2 Starting the Auto Profile ---------------------------------------------------------------- 3-35
3.13.2.1 Understanding Phase and Point ------------------------------------------------ 3-36
3.13.3 Manual Override of Profile ------------------------------------------------------------- 3-36
3.13.3.1 Holding the Profile ------------------------------------------------------------------ 3-36
3.13.3.2 Advancing to the Next Phase ---------------------------------------------------- 3-37
3.13.3.3 Advancing to the Next Point ----------------------------------------------------- 3-37
3.13.4 Stopping an Auto Profile --------------------------------------------------------------- 3-37
3.13.5 Special Considerations While Auto Profiling -------------------------------------- 3-37
3.14 REPORTS ------------------------------------------------------------------------------------- 3-38
3.14.1 Collecting Report Data ------------------------------------------------------------------ 3-38
3.14.2 Clearing Report Data-------------------------------------------------------------------- 3-39
3.14.3 The Report Editor ------------------------------------------------------------------------ 3-39
3.14.3.1 Creating, Printing, and Saving a Report --------------------------------------- 3-40
3.14.3.2 E
3.14.3.3 Editing the Footer ------------------------------------------------------------------- 3-42
3.14.3.4 Editing the Test Information ------------------------------------------------------ 3-43
3.14.3.5 Editing the Data --------------------------------------------------------------------- 3-44
3.15 STATISTICAL ANALYSIS ------------------------------------------------------------------- 3-45
4.1 GENERAL---------------------------------------------------------------------------------------- 4-1
4.2 CALIBRATION ---------------------------------------------------------------------------------- 4-1
4.2.1 Temperature Calibration ---------------------------------------------------------------- 4-1
4.2.2 System Pressure Transducer Calibration ------------------------------------------- 4-5
4.2.3 Supply Pressure Transducer Calibration -------------------------------------------- 4-8
4.2.4 Flow Meter Calibration ------------------------------------------------------------------ 4-11
4.2.5 Viewing the Current Calibration Coefficients -------------------------------------- 4-13
4.2.6 Editing Calibration Coefficients ------------------------------------------------------- 4-14
4.2.7 Printing Calibration Records ---------------------------------------------------------- 4-15
4.3 ROUTINE MAINTENANCE ----------------------------------------------------------------- 4-16
4.3.1 Chamber Fluid Level -------------------------------------------------------------------- 4-16
4.3.2 Pre-saturator water change ----------------------------------------------------------- 4-16
4.3.3 Cleaning thermoelectric unit and fan grill ------------------------------------------ 4-17
4.3.4 Data Backup ------------------------------------------------------------------------------ 4-18
4.4 ERROR CODES and TROUBLESHOOTING ------------------------------------------ 4-19
diting the Header ----------------------------------------------------------------- 3-41
Section 4 - CALIBRATION AND MAINTENANCE
iv
Page 8

Section 5 - PARTS LISTS
5.1 1200 SYSTEM ----------------------------------------------------------------------------------- 5-1
LIST OF REFERENCE DRAWINGS
DRAWING # DRAWING TITLE
03D12901 ----------------------------- Mechanical/Utility Layout
03D12902-1, -2, & -3 --------------- Component Location Diagram
03D12903 ----------------------------- Electrical Box Layout Diagram
03S12904 ----------------------------- Computer Control Schematic
03S12905 ----------------------------- Main Power Schematic
03S12906 ----------------------------- Heater/Pump/Solenoid Schematic
03S12907 ----------------------------- Temperature Probe/Transducer Schematic
03S12908 ----------------------------- Pneumatic System Schematic
03S12909 ----------------------------- Heat Transfer Fluid Schematic
03D12910 ----------------------------- Chamber Fluid Filling Instructions
05D12913 ----------------------------- 1200 Utility Cart Dimensions
06D12914 ----------------------------- ACS1210 Mechanical / Utility Layout
06D12915 ----------------------------- Generator & ACS1210 Placement Drawing
07D12916 ----------------------------ACS12030 ---------------------------- ACS1210 Pneumatic Schematic
ACS12001_01 ----------------------- ACS1210 Electrical Schematic Low Voltage
ACS12001_02 ----------------------- ACS1210 Electrical Schematic High Voltage
EHC-10 Remote Calibration Assembly
v
Page 9

WARRANTY
Thunder Scientific Corporation (TSC) warrants, to the Buyer, the
Product manufactured by TSC to be free of defects in material and
workmanship under normal use and service and to be free from
inadequate mechanical design when operated within the specified
design limitations for a period of one year from date of
acceptance. TSC's obligation under this warranty shall be limited
to the following: the Product is returned to TSC with
transportation charges prepaid and that TSC's examination reveals
the Product to be defective. TSC, at its option, shall either refund
to the Buyer the purchase price of the product or repair or replace
at TSC's plant, any part or parts of the Product which is or are
defective. This warranty shall not apply to any Product which has
been maintained, handled, stored, repaired or altered in any
manner, or by anyone other than an authorized TSC
representative, so as to affect adversely such Product or which has
been subject to improper installation, misuse, negligence, accident
or corrosion. THIS WARRANTY IS EXCLUSIVE AND IN
LIEU OF ANY WARRANTY OF MERCHANTABILITY,
FITNESS FOR A PARTICULAR PURPOSE OR ANY OTHER
WARRANTY, WHETHER EXPRESS OR IMPLIED, AND ALL
OTHER LIABILITIES AND OBLIGATIONS ON THE PART OF
TSC; TSC SHALL NOT BE LIABLE FOR ANY OTHER
CLAIMS OR DAMAGES, EITHER DIRECT OR
CONSEQUENTIAL, ARISING DIRECTLY OR INDIRECTLY
OUT OF SUPPLYING THE PRODUCT. All warranties, express
or implied, with respect to any device or component not
manufactured by TSC but incorporated into its Product are the
responsibility of the original manufacturer and shall not affect or
apply to TSC.
Page 10
Thunder Scientific®
Corporation
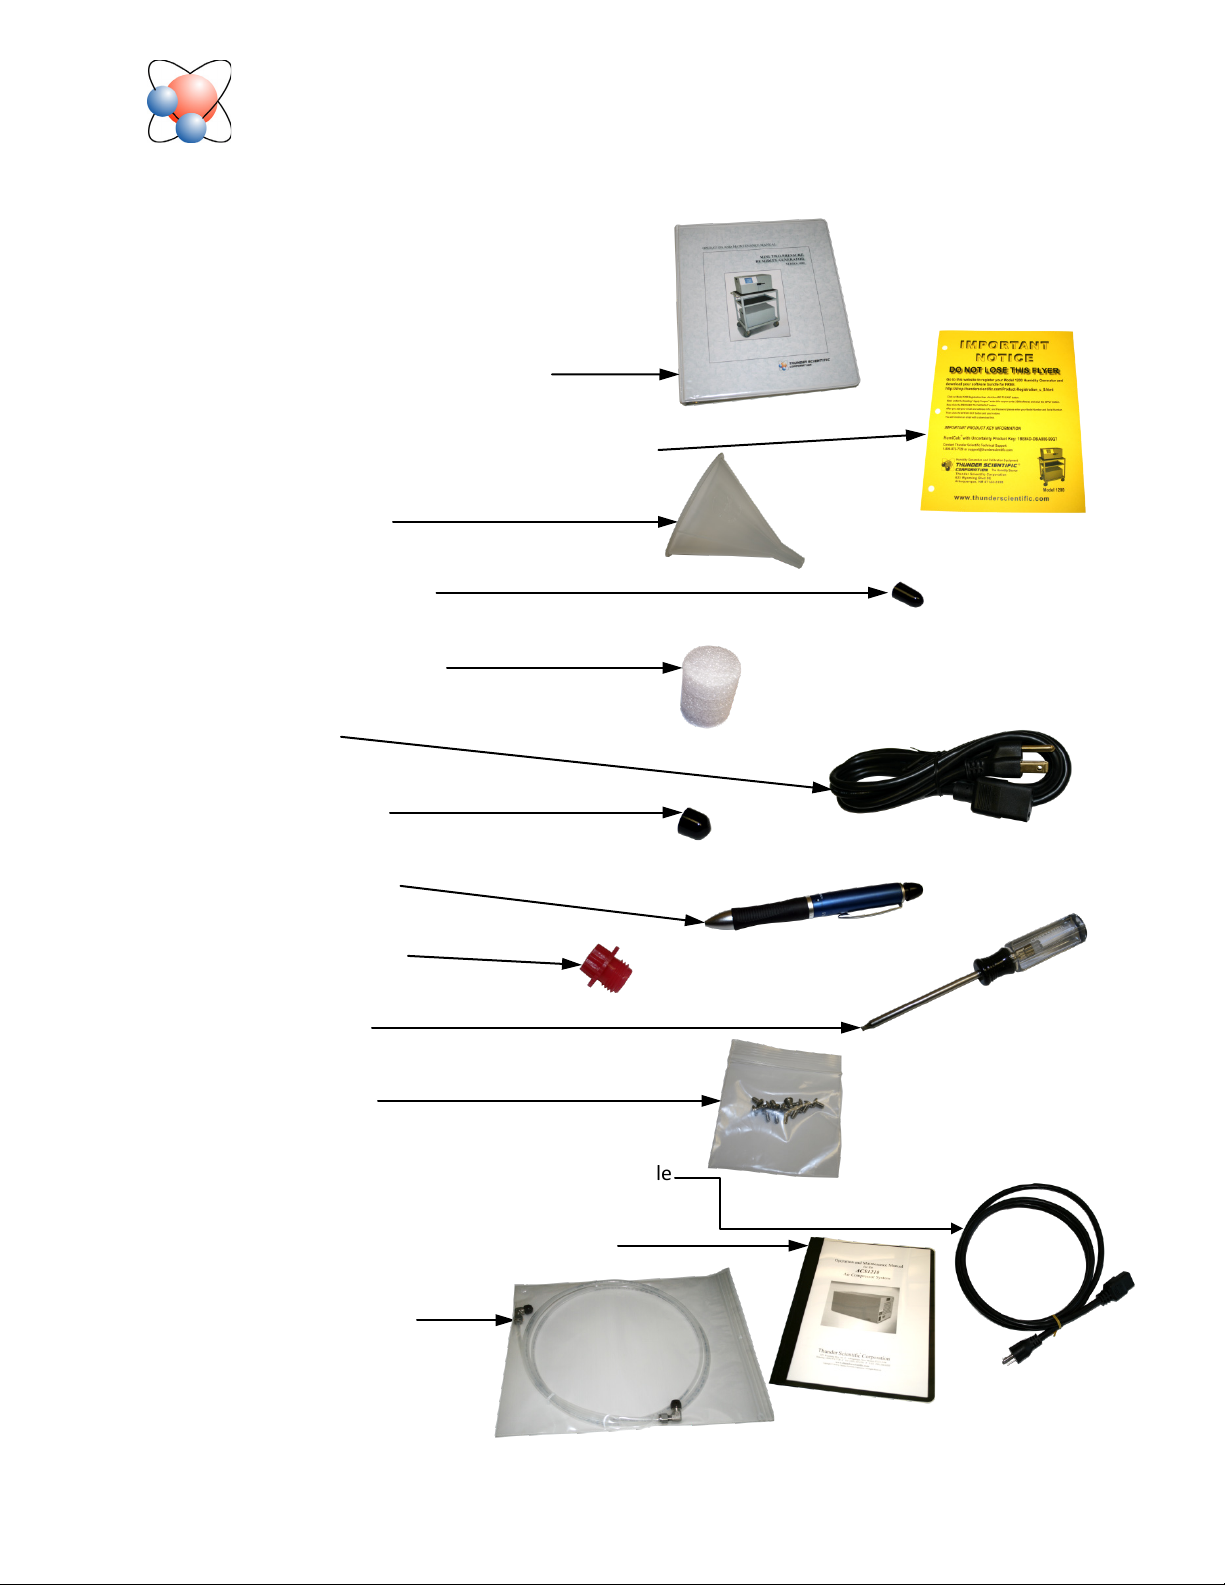
Item Check List
1200
ertificate of Calibration (In Manual)
1. C
2. Operation and Maintenance Manual
3. HumiCalc® with Uncertainty Software Download
4. 4oz. Plastic Funnel
5. Chamber Overflow Cap
6. Chamber Port Foam Plug
7. Power Cable
8. Pressure Vent Cap
9. Stylus Ballpoint Pen
10. 1/4” MPT Air In Plug
11. Torx Driver, #10
12. Torx Screws, #10
1. Optional Equipment – Air compressor power cable
2. ACS1210 – Air Compressor System Manual
3. Air Hose – On Air Box
Thunder Scientific Corporation Web: www.thunderscientific.com
623 Wyoming Blvd. SE E-mail: [email protected]
Albuquerque, NM 87123 Phone: 1-800-872-7728
Page 11

Microsoft Software License Terms for:
Windows® XP Embedded Runtime
These license terms are an agreement between you and Thunder Scientific Corporation. Please read them.
They apply to the software included on this device. The software also includes any separate media on which
you received the software.
The software on this device includes software licensed from Microsoft Corporation or its affiliate.
The terms also apply to any Microsoft
• Updates,
• Supplements,
• Internet-based services, and
• Support services
for this software, unless other terms accompany those items. If so, those terms apply. If you obtain
updates or supplements directly from Microsoft, then Microsoft, and not Thunder Scientific Corporation,
licenses those to you.
As described below, using some features also operates as your consent to the transmission of certain
standard computer information for Internet-based services.
By using the software, you accept these terms. If you do not accept them, do not use or copy the
software. Instead, contact Thunder Scientific Corporation to determine its return policy for a refund or
credit.
If you comply with these license terms, you have the rights below.
1. Use Rights.
You may use the software on the device with which you acquired the software.
2. Additional Licensing Requirements and/or Use Rights.
a. Specific Use.
use the software for that use.
b. Other Software. You may use other programs with the software as long as the other programs
• Directly support the manufacturer’s specific use for the device, or
• Provide system utilities, resource management, or anti-virus or similar protection.
Software that provides consumer or business tasks or processes may not be run on the device. This
includes email, word processing, spreadsheet, database, scheduling and personal finance software.
The device may use terminal services protocols to access such software running on a server.
c. Device Connections.
• You may use terminal services protocols to connect the device to another device running
• You may allow up to ten other devices to access the software to use
• File Services,
• Print Services,
Thunder Scientific Corporation
business task or processes software such as email, word processing, scheduling or
spreadsheets.
designed this device for a specific use. You may only
• Internet Information Services, and
• Internet Connection Sharing and Telephony Services.
Page 12

The ten connection limit applies to devices that access the software indirectly through
“multiplexing” or other software or hardware that pools connections. You may use unlimited
inbound connections at any time via TCP/IP.
3. Scope of License. The software is licensed, not sold. This agreement only gives you some rights to use
the software. Thunder Scientific Corporation and Microsoft reserve all other rights. Unless
applicable law gives you more rights despite this limitation, you may use the software only as
expressly permitted in this agreement. In doing so, you must comply with any technical limitations
in the software that allow you to use it only in certain ways. For more information, see the
software documentation or contact Thunder Scientific Corporation. Except and only to the extent
permitted by applicable law despite these limitations, you may not:
• Work around any technical limitations in the software;
• Reverse engineer, decompile or disassemble the software;
• Make more copies of the software than specified in this agreement;
• Publish the software for others to copy;
• Rent, lease or lend the software; or
• Use the software for commercial software hosting services.
Except as expressly provided in this agreement, rights to access the software on this device do not give
you any right to implement Microsoft patents or other Microsoft intellectual property in software or
devices that access this device.
You may use remote access technologies in the software such as Remote Desktop to access the software
remotely from another device. You are responsible for obtaining any licenses required for use of these
protocols to access other software.
• Remote Boot Feature. If the Thunder Scientific Corporation enabled the device Remote Boot
feature of the software, you may
(i) use the Remote Boot Installation Service (RBIS) tool only to install one copy of the software on
your server and to deploy the software on licensed devices as part of the Remote Boot process;
and
(ii) use the Remote Boot Installation Service only for deployment of the software to devices as part
of the Remote Boot process; and
(iii) download the software to licensed devices and use it on them.
For more information, please refer to the device documentation or contact Thunder Scientific
Corporation.
• Internet-Based Services. Microsoft provides Internet-based services with the software. Microsoft
may change or cancel them at any time.
a. Consent for Internet-Based Services. The software features described below connect to
Microsoft or service provider computer systems over the Internet. In some cases, you will not
receive a separate notice when they connect. You may switch off these features or not use them.
For more information about these features, visit
http://www.microsoft.com/windowsxp/downloads/updates/sp2/docs/privacy.mspx.
By using these features, you consent to the transmission of this information. Microsoft does not
use the information to identify or contact you.
b. Computer Information. The following features use Internet protocols, which send to the
appropriate systems computer information, such as your Internet protocol address, the type of
operating system, browser and name and version of the software you are using, and the language
code of the device where you installed the software. Microsoft uses this information to make the
Internet-based services available to you.
Page 13

• Web Content Features. Features in the software can retrieve related content from
Microsoft and provide it to you. To provide the content, these features send to Microsoft
the type of operating system, name and version of the software you are using, type of
browser and language code of the device where the software was installed. Examples of
these features are clip art, templates, online training, online assistance and Appshelp.
These features only operate when you activate them. You may choose to switch them off or
not use them.
• Digital Certificates. The software uses digital certificates. These digital certificates
confirm the identity of Internet users sending X.509 standard encrypted information. The
software retrieves certificates and updates certificate revocation lists. These security
features operate only when you use the Internet.
• Auto Root Update. The Auto Root Update feature updates the list of trusted certificate
authorities. You can switch off the Auto Root Update feature.
• Windows Media Player. When you use Windows Media Player, it checks with Microsoft for
• Compatible online music services in your region;
• New versions of the player; and
• Codecs if your device does not have the correct ones for playing content. You can
switch off this feature. For more information, go to:
http://microsoft.com/windows/windowsmedia/mp10/privacy.aspx.
• Windows Media Digital Rights Management. Content owners use Windows Media digital
rights management technology (WMDRM) to protect their intellectual property, including
copyrights. This software and third party software use WMDRM to play and copy WMDRMprotected content. If the software fails to protect the content, content owners may ask
Microsoft to revoke the software’s ability to use WMDRM to play or copy protected content.
Revocation does not affect other content. When you download licenses for protected
content, you agree that Microsoft may include a revocation list with the licenses. Content
owners may require you to upgrade WMDRM to access their content. Microsoft software
that includes WMDRM will ask for your consent prior to the upgrade. If you decline an
upgrade, you will not be able to access content that requires the upgrade. You may switch
off WMDRM features that access the Internet. When these features are off, you can still
play content for which you have a valid license.
c. Misuse of Internet-based Services. You may not use these services in any way that could harm
them or impair anyone else’s use of them. You may not use the services to try to gain
unauthorized access to any service, data, account or network by any means.
4. Windows Update Agent (also known as Software Update Services). The software on the device
includes Windows Update Agent (“WUA”) functionality that may enable your device to connect to and
access updates (“Windows Updates”) from a server installed with the required server component.
Without limiting any other disclaimer in this Micrososoft Software License Terms or any EULA
accompanying a Windows Update, you acknowledge and agree that no warranty is provided by MS,
Microsoft Corporation or their affiliates with respect to any Windows Update that you install or attempt
to install on your device.
5. Product Support. Contact Thunder Scientific Corporation for support options. Refer to the support
number provided with the device.
6. Backup Copy. You may make one backup copy of the software. You may use it only to reinstall the
software on the device.
7. Proof Of License. If you acquired the software on the device, or on a disc or other media, a genuine
Certificate of Authenticity label with a genuine copy of the software identifies licensed software. To be
valid, this label must be affixed to the device, or included on or in Thunder Scientific Corporation’s
software packaging. If you receive the label separately, it is not valid. You should keep the label on the
device or packaging to prove that you are licensed to use the software. To identify genuine Microsoft
software, see http://www.howtotell.com.
Page 14

8. Transfer to a Third Party. You may transfer the software only with the device, the Certificate of
Authenticity label, and these license terms directly to a third party. Before the transfer, that party
must agree that these license terms apply to the transfer and use of the software. You may not retain
any copies of the software including the backup copy.
9. Not Fault Tolerant. The software is not fault tolerant. Thunder Scientific Corporation installed the
software on the device and is responsible for how it operates on the device.
10. Restricted Use. The Microsoft software was designed for systems that do not require fail-safe
performance. You may not use the Microsoft software in any device or system in which a malfunction of
the software would result in foreseeable risk of injury or death to any person. This includes operation of
nuclear facilities, aircraft navigation or communication systems and air traffic control.
11. No Warranties for the Software. The software is provided “as is”. You bear all risks of using it.
Microsoft gives no express warranties, guarantees or conditions. Any warranties you receive
regarding the device or the software do not originate from, and are not binding on, Microsoft or its
affiliates. When allowed by your local laws, Thunder Scientific Corporation and Microsoft exclude
implied warranties of merchantability, fitness for a particular purpose and non-infringement.
12. Liability Limitations. You can recover from Microsoft and its affiliates only direct damages up to
two hundred fifty U.S. Dollars (U.S. $250.00). You cannot recover any other damages, including
consequential, lost profits, special, indirect or incidental damages.
This limitation applies to:
• Anything related to the software, services, content (including code) on third party internet
sites, or third party programs; and
• Claims for breach of contract, breach of warranty, guarantee or condition, strict liability,
negligence, or other tort to the extent permitted by applicable law.
It also applies even if Microsoft should have been aware of the possibility of the damages. The
above limitation may not apply to you because your country may not allow the exclusion or
limitation of incidental, consequential or other damages.
13. Export Restrictions. The software is subject to United States export laws and regulations. You must
comply with all domestic and international export laws and regulations that apply to the software.
These laws include restrictions on destinations, end users and end use. For additional information, see
www.microsoft.com/exporting.
Page 15
Suomi
English
Tämä tuote noudattaa WEEE-direktiivin (2002/96/EY)
merkintävaatimuksia. Kiinnitetty etiketti osoittaa, että tätä
sähkö-/elektroniikkalaitetta ei saa hävittää kotitalousjätteissä.
Tuoteluokka: Viitaten WEEE-direktiivin liitteessä I mainittuihin
laitteisiin, tämä tuote on luokiteltu luokan 9 “Tarkkailu- ja
ohjauslaitteet” -tuotteeksi.
Ei saa heittää kotitalousjätteiden mukana!
Palauta tarpeettomat tuotteet ottamalla yhteyttä valmistajan
websivustoon, joka mainitaan tuotteessa tai paikalliseen
myyntitoimistoon tai jakelijaan.
Dansk
Dette produkt er i overensstemmelse med kravene om afmærkning
i WEEE-direktivet (2002/96/EC). Det påhæftede mærkat angiver,
at du ikke må bortskaffe dette elektriske/elektroniske produkt via
husholdningsaffald.
Produktkategori: Med reference til kravene i WEEE-direktivets
bilag I klassificeres dette produkt som et produkt til “overvågning
og kontrolinstrumentering” i kategori 9.
MÂ ikke bortskaffes via husholdningsaffald!
Hvis du vil returnere uønskede produkter, skal du besøge
producentens websted, som vises på produktet, eller den lokale
forhandler eller distributør.
This product complies with the WEEE Directive (2002/96/EC) marking
requirements. The affixed label indicates that you must not discard
this electrical/electronic product in domestic household waste.
Product Category: With reference to the equipment types in the
WEEE Directive Annex I, this product is classed as category 9
“Monitoring and Control Instrumentation” product.
Do not dispose in domestic household waste!
To return unwanted products, contact the manufacturer’s web site
shown on the product or your local sales office or distributor.
Français
Ce produit est conforme aux normes de marquage de la directive
DEEE (2002/96/CE). La présence de cette étiquette indique que
cet appareil électrique/électronique ne doit pas être mis au rebut
avec les déchets ménagers.
Catégorie de EEE : Cet appareil est classé comme catégorie 9 parmi
les « instruments de surveillance et de contrôle » en référence aux
types d’équipements mentionnés dans l’Annexe I de la directive DEEE.
Ne pas éliminer avec les autres déchets ménagers !
Pour renvoyer les produits indésirables, contacter le site Web du
fabricant mentionné sur le produit, ou son distributeur ou bureau de
ventes local.
Español
Este producto cumple la Directiva WEEE (2002/96/EC) sobre
requisitos de las marcas. La etiqueta que lleva pegada indica
que no debe desechar este producto eléctrico o electrónico con
los residuos domésticos.
Categoría del producto: con referencia a los tipos de equipo
del anexo I de la Directiva WEEE, este producto está clasificado
como categoría 9 de “Instrumentación de supervisión y control”.
¡No lo deseche con los residuos domésticos!
Para devolver productos que no desee, póngase en contacto con
el sitio Web del fabricante mostrado en el producto, o con la oficina
de ventas o distribuidor local.
PN 2566073, 1/2006
Page 16
Deutsch
Nederlands
Dieses Produkt stimmt mit den Kennzeichnungsanforderungen
der WEEE-Richtlinie (2002/96/EC) überein. Das angebrachte
Etikett weist darauf hin, dass dieses elektrische/elektronische
Produkt nicht in Hausmüll entsorgt werden darf.
Produktkategorie: In Bezug auf die Gerätetypen in Anhang
I der WEEE-Richtlinie ist dieses Produkt als Kategorie 9
“Überwachungs- und Kontrollinstrument” klassifiziert.
Nicht in Hausmüll entsorgen!
Zur Rückgabe von unerwünschten Produkten die auf dem
Produkt angegebene Website des Herstellers oder die zuständige
Verkaufsstelle bzw. den zuständigen Fachhändler konsultieren.
Italiano
Questo prodotto risponde ai requisiti sull’etichettatura stabiliti
nella Direttiva RAEE (2002/96/CE). Il simbolo apposto indica che
non si deve gettare questo prodotto elettrico o elettronico in un
contenitore per rifiuti domestici.
Categoria del prodotto: con riferimento ai tipi di apparecchiature
elencate nell’Allegato 1 della Direttiva RAEE, questo prodotto
rientra nella categoria 9 “Strumenti di monitoraggio e di controllo”.
Non gettare in un contenitore per rifiuti domestici.
Per restituire prodotti non desiderati, visitare il sito Web del
produttore riportato sul prodotto o rivolgersi al distributore o
all’ufficio vendite locale.
Dit product voldoet aan de merktekenvereisten van de AEEArichtlijn (2002/96/EG). Het aangebrachte merkteken duidt erop dat
dit elektrische/elektronische product niet met het huishoudelijk
afval mag worden afgevoerd.
Productcategorie: Met betrekking tot de apparatuurcategorieën
van bijlage I van de AEEA-richtlijn, valt dit product onder categorie
9 ‘meet- en controle-instrumenten’.
Niet afvoeren met huishoudelijk afval!
Om ongewenste producten te retourneren, neemt u contact op
met de website van de fabrikant die op het product staat vermeld,
of met uw plaatselijke verkoopkantoor of distributeur.
Svenska
Denna produkt uppfyller märkningskraven enligt WEEE Directive
(2002/96/EC). Märkningsetiketten anger att du inte får kassera denna
elektriska/elektroniska produkt tillsammans med vanliga hushållssopor.
Produktkategori: Med hänvisning till utrustningstyperna i
WEEE Directive Annex I, är denna produkt klassad som kategori 9
“Monitoring and Control Instrumentation” (Instrument för
övervakning och styrning).
Får ej kasseras tillsammans med vanliga hushållssopor!
Returnera ej önskvärda produkter genom att gå till tillverkarens
webbplats, vilken anges på produkten, eller till det lokala
försäljningskontoret eller distributören.
Português
Este produto está em conformidade com as exigências de rotulagem
da Directiva WEEE (2002/96/EC). O rótulo afixado indica que o
utilizador não deve deitar este produto eléctrico/electrónico fora
juntamente com o lixo doméstico.
Categoria do produto: No que se refere aos tipos de equipamento listados no Anexo I da Directiva WEEE, este produto está classificado como
produto da categoria 9, “Instrumentação de monitorização e controlo”.
Não deite fora juntamente com o lixo doméstico!
Para devolver produtos indesejados, contacte o fabricante através do
Website constante do produto ou contacte o seu representante de
vendas ou distribuidor local.
Norsk
Dette produktet oppfyller bestemmelsene ifølge WEEE-direktiv
(2002/96/EC) med krav til merking. Påsatt merke viser at det ikke
er tillatt å kassere dette elektriske/elektroniske produktet sammen
med husholdningsavfall.
Produktkategori: På grunnlag av utstyrstypene i WEEEdirektivet, vedlegg I, er dette produktet klassifisert i kategori 9,
“Instrumentering for overvåking og kontroll”.
Må ikke kastes sammen med husholdningsavfall!
Ved behov for returforsendelse av uønskede produkter må du gå
til produsentens nettside som er angitt på produktet, eller du må
kontakte det lokale salgskontoret eller den lokale forhandleren.
Page 17
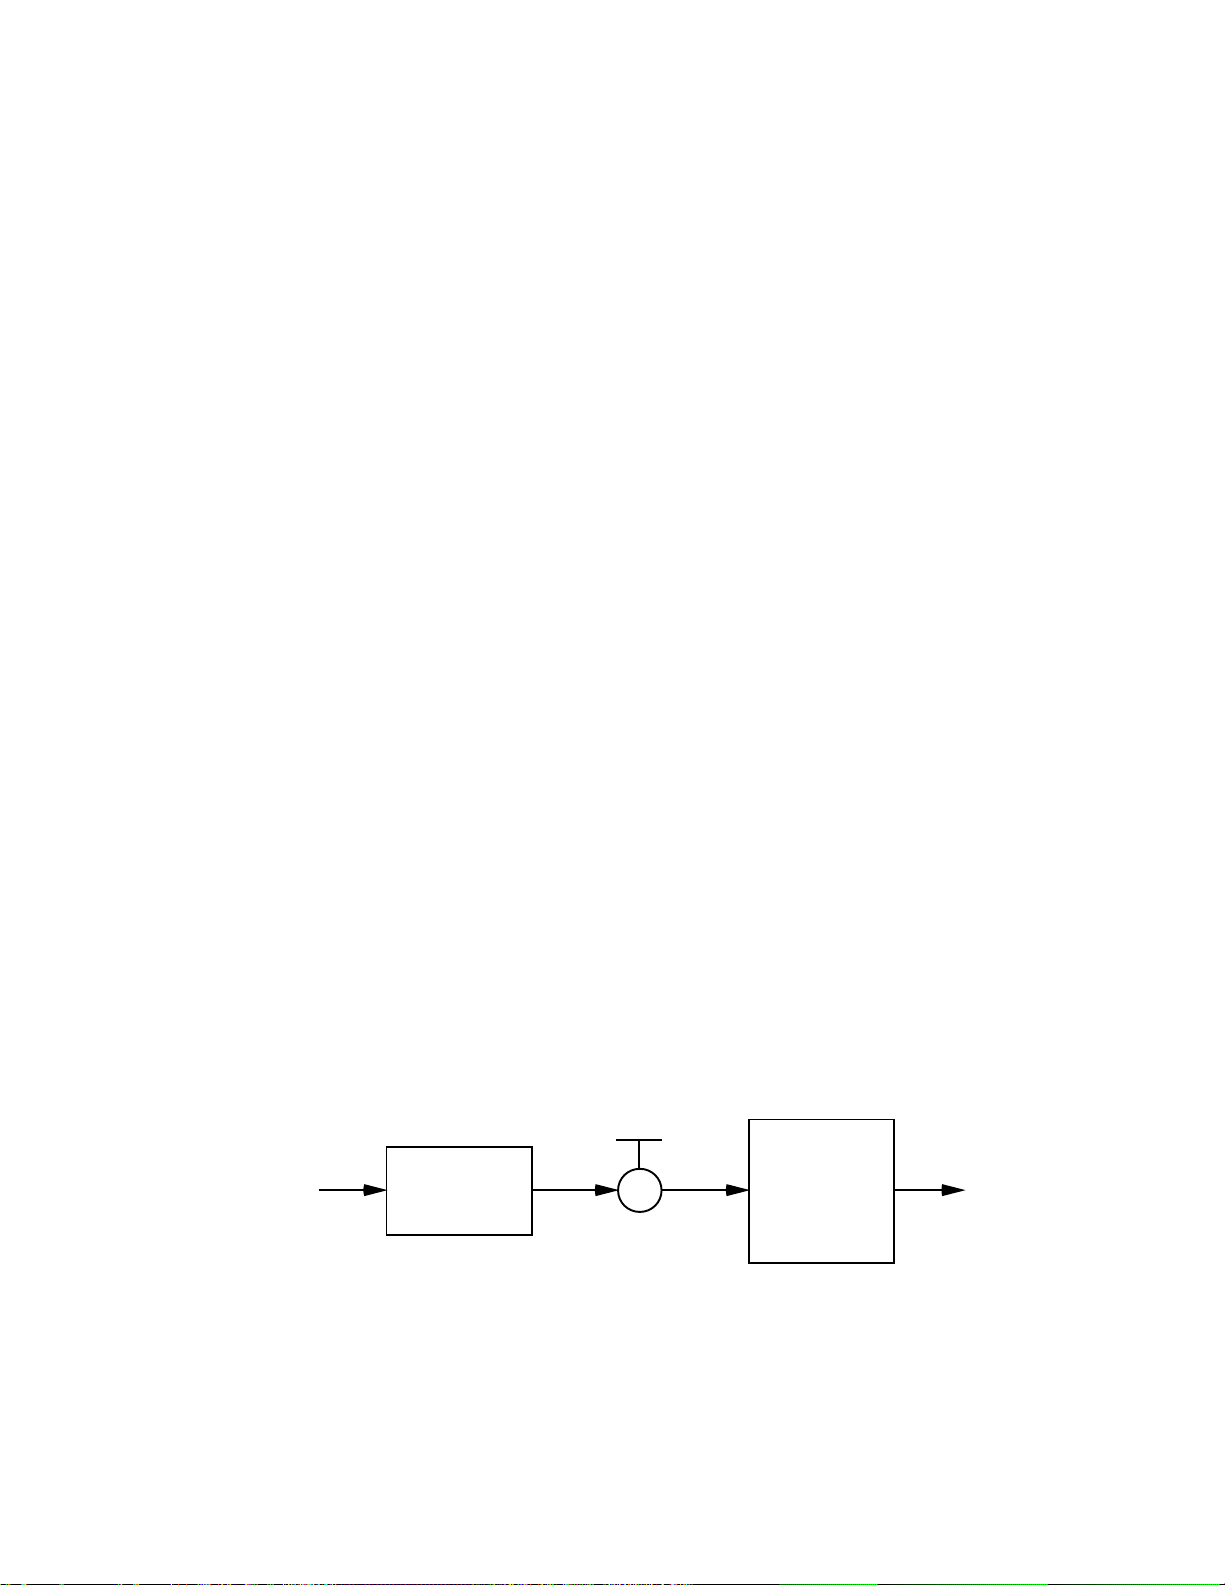
Section 1
TEST CHAMBER
SATURATOR
AIR SUPPLY
EXHAUST
EXPANSION
VALVE
GENERAL INFORMATION
1.1 INTRODUCTION
The 1200 humidity generating system produces known humidity values for instrument calibration and
evaluation using the fundamental principle of the "two pressure" generator originally developed by NIST.
The automatic features allow the 1200 to generate manually entered humidity and temperature set-points
as well as multipoint profiles completely unattended while continuously recording and printing system
data. Upon completion of a profile, usually in a few hours or the following day, the system shuts-down
automatically.
Virtually all functions of the 1200 humidity generator are controlled automatically through the use of an
embedded computer. Visual indications of system status are displayed in real time on the full color active
matrix liquid crystal display. Operator interaction is through the integral touch panel or optional USB
keyboard and mouse.
1.2 PRINCIPLE OF OPERATION
1.2.1 General Description
The Series 1200 humidity generation system is based on the two-pressure principle. This process
involves saturating air or some other gas, such as nitrogen, with water vapor at a given temperature and
pressure. The saturated high pressure gas flows through an expansion valve where it is isothermally
reduced to test pressure (Figure 1-1). The indications of saturation temperature, saturation pressure, test
temperature, and test pressure are then used in the determination of all hygrometric parameters such as
%RH, Dew Point, PPM, etc. Humidity generation by this system does not depend upon measuring the
amount of water vapor, but rather is dependent on the measurements of temperature and pressure
alone. The precision of the system is determined by the accuracy of the temperature and pressure
measurements, and on the constancy of them throughout.
Figure 1-1
1-1
Page 18

1.2.2 Humidity Formulas
TgTg
i
i
i
ln
7
2
6
0
+
−
=
∑
TkTk
i
i
i
ln
5
2
4
0
+
−
=
∑
The humidity (or water vapor content) of a gas may be expressed in a variety of ways. The humidity
parameters available with the 1200, and the formulas used to derive them, will be expressed in terms of
the two-pressure generator. While some basic understanding of humidity is helpful, thorough knowledge
of the following formulas and their relationships to the 1200 is not a requirement for successful operation
of the generator.
1.2.2.1 Saturation Vapor Pressure, e
Saturation Vapor Pressure (SVP) is the pressure exerted by water vapor alone when in equilibrium with
pure ice or water, and is expressed as a function of temperature only.
Wexler’s
1
formula for the saturation vapor pressure over water in the pure phase with Hardy’s2 adjusted
coefficients for the ITS-90 temperature scale is as follows:
ln e
where g
g
g
g
g
g
g
g
=
w(T)
= -2.8365744 x10³
0
= -6.028076559 x10³
1
= 1.954263612 x101
2
= -2.737830188 x10
3
= 1.6261698 x10
4
= 7.0229056 x10
5
= -1.8680009 x10
6
= 2.7150305 x100
7
(1)
-2
-5
-10
-13
ew(T) = The saturation vapor pressure (in Pascals) at
temperature, T (in Kelvin) with respect to water.
Hyland’s&Wexler’s
3
formula for the saturation vapor pressure over ice in the pure phase with Hardy’s2
adjusted coefficients for the ITS-90 temperature scale is as follows:
ln e
where k
k
k
k
k
k
=
i(T)
= -5.8666426 x10³
0
= 2.232870244 x101
1
= 1.39387003 x10⁻²
2
= -3.4262402 x10
3
= 2.7040955 x10
4
= 6.7063522 x10⁻¹
5
(2)
-5
-8
ei(T) = The saturation vapor pressure (in Pascals) at
temperature, T (in Kelvin) with respect to ice.
1
Wexler, Arnold, "Vapor Pressure Formulation for Water in Range 0 to 100 °C. A Revision.", Journal of Research of the National
Bureau of Standards - A. Physics and Chemistry, Vol. 80A, Nos. 5 and 6, September-December 1976, pp 775-785, Equation 18.
2
R. Hardy, “ITS-90 Formulations for Vapor Pressure, Frost Point Temperature, Dew Point Temperature and Enhancement
Factors in the Range – 100 to +100 °C”, The Proceedings of the Third International Symposium on Humidity & Moisture,
Teddington, England, April 1998
3
Hyland, Richard, and Wexler, Arnold, "Formulations of the Thermodynamic Properties of the Saturated Phases of H
173.15 K to 473.15 K", Ashrae Transactions 1983, Part 2A, pp 500-513, Equation 18
O from
2
1-2
Page 19

1.2.2.2 Enhancement Factor, ƒ
(
)
(
)
−+
− 11
Te
P
b
P
Te
a
w
w
∑
=30i
i
i
TA
∑
=30i
i
i
TB
(
)
(
)
−+
− 11
Te
P
b
P
Te
a
i
i
The enhancement factor, ƒ, corrects for the non-ideal behavior of a gas admixed with water vapor. The
enhancement factor is a function of two independent variables; pressure, P, and temperature, T. A
formula for calculation of the enhancement factor, when air is used as the carrier gas, at any given
pressure and temperature above freezing is given by Greenspan
4
as
ƒw(T,P) = exp
where P = the absolute pressure in Pascals, and
ew(T) = the saturation vapor pressure (in Pascals) at
temperature, T.
The two remaining variables, a and b, with Hardy’s
scale are as follows:
a =
b = exp
where A0 = 3.53624 x10
A1 = 2.9328363 x10
A2 = 2.6168979 x10
A3 = 8.5813609 x10⁻⁹
B0 = -1.07588 x101
B1 = 6.3268134 x10
B2 = -2.5368934 x10
B3 = 6.3405286 x10⁻⁷
T = temperature of the gas in °C.
This formula for the enhancement factor is valid over the pressure range of the 1200 and over the
temperature range of 0 to 100 °C.
When calculating enhancement factors for temperatures below freezing, the formula becomes
5
adjusted coefficients for the ITS-90 temperature
-4
-5
-7
-2
-4
(3)
ƒi(T,P) = exp
where P = the absolute pressure in Pascals, and
ei(T) = the saturation vapor pressure in Pascals at
temperature, T.
4
Greenspan, Lewis, "Functional Equations for the Enhancement Factors of CO2-Free Moist Air", Journal of Research of the
National Bureau of Standards - A. Physics and Chemistry, Vol. 80A, No.1, January-February 1976, pp. 41-44
5
R. Hardy, “ITS-90 Formulations for Vapor Pressure, Frost Point Temperature, Dew Point Temperature and Enhancement
Factors in the Range – 100 to +100 °C”, The Proceedings of the Third International Symposium on Humidity & Moisture,
Teddington, England, April 1998
1-3
(4)
Page 20

Again the variables, a and b, with Hardy’s
∑
=30i
i
i
TA
∑
=30i
i
i
TB
100
,∗TP
w
v
X
X
P
P
v
follows:
6
adjusted coefficients for the ITS-90 temperature scale are as
a =
and b = exp
where A0 = 3.64449 x10
A1 = 2.9367585 x10
A2 = 4.8874766 x10
-4
-5
-7
A3 = 4.3669918 x10⁻⁹
B0 = -1.07271 x101
B1 = 7.6215115 x10
B2 = -1.7490155 x10
-2
-4
B3 = 2.4668279 x10⁻⁶
T = temperature of the gas in °C.
1.2.2.3 Relative Humidity, %RH
Relative Humidity, %RH, is a percentage ratio of the amount of water vapor in a given gas mixture to the
maximum amount physically allowable in the gas at the same temperature and pressure. In its strictest
form, relative humidity is defined in terms of mole fractions and is given as
%RH =
where Xv = the mole fraction of water vapor in a sample of moist air at a specific
pressure, P, and temperature, T, and
Xw = the mole fraction of water vapor which would exist in a sample of air if
it were saturated with water vapor at the same pressure, P, and
temperature, T, as the unsaturated sample Xv.
The mole fraction of water vapor in a sample of gas is given by
X =
where Pv = the partial pressure of the gas which is exerted by the water vapor
constituent alone, and
P = the absolute (or total) pressure of the gas, which is also equal to the
sum of the partial pressures exerted by the water vapor and dry air
constituents.
6
R. Hardy, “ITS-90 Formulations for Vapor Pressure, Frost Point Temperature, Dew Point Temperature and Enhancement
Factors in the Range – 100 to +100 °C”, The Proceedings of the Third International Symposium on Humidity & Moisture,
Teddington, England, April 1998
1-4
Page 21

When a gas is fully saturated with water vapor, the partial pressure, Pv, exerted by the water vapor
(
)
P
Te
w
c
w
P
c
Te
c
v
P
P
s
w
P
s
Te
c
v
P
P
constituent is a known
quantity, ew(T), and is termed "the saturation vapor pressure". Since, at
saturation, Pv = ew(T), the mole fraction equation of a saturated gas may be written as
X =
where ew(T) = the saturation vapor pressure at temperature T, and is the partial
pressure exerted by the water vapor constituent alone, and
P = the absolute (or total) pressure of the gas.
The mole fraction of water vapor which would exist in a saturated gas sample at the chamber pressure,
Pc, and chamber temperature, Tc, would be the quantity, Xw, which is needed to calculate the relative
humidity relationship previously discussed. Here, the mole fraction, under saturated conditions, may be
expressed by
Xw =
where ew(Tc) = the saturation vapor pressure at the chamber temperature, Tc, and
Pc = the measured absolute pressure in the chamber expressed in the
same units as ew(Tc).
The other quantity, Xv, required for the calculation of relative humidity, is that mole fraction of water vapor
which actually exists in the air sample within the chamber at pressure Pc, and temperature Tc. If the
chamber pressure, Pc, were used in the calculation of the mole fraction Xv, the expression would be
Xv =
which would require direct measurement of the water vapor content, Pv. However, this requirement is
eliminated by using the relationship
=
where ew(Ts) = the saturation vapor pressure at the saturation temperature, Ts, and
Ps = the measured absolute (or total) pressure at which the sample is
saturated (the saturation pressure).
The basis for this relationship lies in the fact that the number of molecules of the constituents within a
sample of gas remain constant regardless of the pressure or temperature, provided that the temperature
or pressure applied does not cause a change in phase (i.e., gas to liquid).
Since the saturation vapor pressure, ew(T), is a well known function of the temperature alone, the total
pressure at saturation, Ps, may be adjusted to any reasonable value to achieve the desired mole fraction
of water vapor. Relying on this relationship, the mole fraction of water vapor entering the chamber (and
at chamber temperature) may be written as that mole fraction of water vapor existing in the saturator at
the saturation pressure and temperature.
1-5
Page 22

Thus, by combination of the two previous expressions, the mole fraction of water vapor may be written as
s
w
P
s
Te
100
,∗TP
w
v
X
X
100
∗
c
w
s
w
P
c
Te
P
s
Te
c
Xv =
where ew(Ts) = the saturation vapor pressure at saturation temperature, Ts, and
Ps = the measured absolute (or total) pressure at which the sample is
saturated (the saturation pressure).
The relative humidity may now be expressed in terms of these other quantities by returning to the original
definition and substituting in the appropriate expressions.
%RH =
=
After rearrangement of terms, the relative humidity formula for ideal gas may then be expressed as
Te
%RH =
w
w
P
c
s
P
Te
(5)
100∗∗
s
where ew(Ts) = the saturation vapor pressure at saturation temperature, Ts
ew(Tc) = the saturation vapor pressure at chamber temperature, Tc
Pc = the absolute pressure in the chamber, and
Ps = the absolute pressure in the saturator.
Any gas, when admixed with water vapor, exhibits non-ideal properties which affect the saturation vapor
pressure, ew(T). The saturation vapor pressures, ew(Ts) and ew(Tc), in the relative humidity formula (5),
must be replaced by their "effective" saturation vapor pressures which are related to the ideal SVP by
ew'(P,T) = ƒw(P,T) ew(T)
where ew'(P,T) = the "effective saturation vapor pressure" at absolute pressure, P, and
temperature, T, and
ƒw(P,T) = the "enhancement factor for moist air" at pressure, P, and
temperature, T.
1-6
Page 23

100
),('
),('
∗∗
s
c
ccw
ssw
P
P
TPe
TPe
( ) ( )
( ) ( )
100
,
,
∗
∗∗
∗∗
sccc
csss
PTePTf
PTePTf
scf
csss
PPT
PTePT
∗
∗∗
ƒ
ƒ
),(
)(),(
The relative humidity formula, based on the effective saturation vapor pressures, is then written as
%RH =
and, after making the appropriate substitutions, is expressed by
%RH =
where ƒ(Ts,Ps) = the enhancement factor at saturation temperature, Ts, and
saturation pressure ,Ps
ƒ(Tc,Pc) = the enhancement factor at the chamber temperature, Tc, and
chamber pressure, Pc
e(Ts) = the SVP (ei or ew) at saturation temperature, Ts
e(Tc) = the SVP (ei or ew) at chamber temperature, Tc
Pc = the absolute chamber pressure, Pc
Ps = the absolute saturation pressure, Ps
It can now be seen by inspection of the relative humidity formula, expressed in its final form in equation 6,
that known relative humidities may be accurately generated through precise measurement and control of
pressure and temperature alone.
The 1200 generates a particular Relative Humidity by determining the saturation pressure, Ps, required
(at saturation temperature, Ts) to establish the correct %RH at chamber temperature, Tc, and chamber
pressure, Pc. Relative Humidity is dependent on both chamber temperature and chamber pressure.
The 1200 displays and generates %RH using saturation vapor pressure at the test chamber temperature,
e(Tc), computed with respect to water (equation 1) for test temperatures above 0 °C, and with respect to
ice (equation 2) for test chamber temperatures below 0 °C.
1.2.2.4 Frost Point
Frost point temperature, Tf, is the temperature to which a gas must be cooled in order to just begin
condensing water vapor in the form of ice or frost. For this reason, frost point is not applicable above
freezing. In the two-pressure generator, frost point vapor pressure is derived from the formula
(6)
ei(Tf) =
where ƒ(Ts,Ps) = the enhancement factor at saturation temperature, Ts, and
saturation pressure, P
ƒ(Tf,Pc) = the enhancement factor at the frost point temperature, Tf,
and test chamber pressure, Pc. (Since frost point is not
known, this equation is solved by iteration.)
e(Ts) = the SVP (ei or ew) at saturation temperature, Ts
Pc = the absolute test chamber (or test) pressure, Pc
Ps = the absolute saturation pressure, Ps.
1-7
(7)
s
Page 24

Then frost point temperature relative to that vapor pressure is solved for as the inverse of the SVP
( )
fi
Tet
scd
csss
PPT
PTePT
∗
∗∗
ƒ
ƒ
),(
)(),(
( )
dw
Tet
formula (see equation 2 section 1.2.2.1)
Tf =
where ei(Tf) = SVP over ice at the frost point temperature, Tf, obtained from
equation 5.
The 1200 generates a particular frost point by determining the saturation pressure, Ps, required to
establish the correct frost point vapor pressure (and ultimately the correct frost point temperature) at any
given test chamber pressure, Pc. Frost point is independent of test chamber temperature.
1.2.2.5 Dew Point
Dew point temperature, Td, is the temperature to which a gas must be cooled in order to just begin
condensing water vapor in the form of dew. Unlike frost point, dew point can exist both above and below
freezing. In the two-pressure generator, dew point vapor pressure is derived from the formula
(8)
ew(Td) =
where ƒ(Ts,Ps) = the enhancement factor at saturation temperature, Ts, and
saturation pressure, Ps
ƒ(Td,Pc) = the enhancement factor at the dew point temperature, Td,
and test chamber pressure, Pc. (Since dew point is not
known, this equation is solved by iteration.)
e(Ts) = the SVP (ei or ew) at saturation temperature, Ts
Pc = the absolute test chamber (or test) pressure, Pc
Ps = the absolute saturation pressure, Ps.
Then dew point temperature relative to that vapor pressure is solved for as the inverse of the SVP
formula (see equation 1 section 1.2.2.1)
Td =
where ew(Td) = SVP over water at the dew point temperature, Td, obtained
from equation 7.
The 1200 generates a particular dew point by determining the saturation pressure, Ps, required to
establish the correct dew point vapor pressure (and ultimately the correct dew point temperature) at any
given test chamber pressure, Pc. Dew point is independent of test chamber temperature.
(10)
(9)
1-8
Page 25

1.2.2.6 Parts Per Million by Volume, PPMv
6
10
)(),(
)(),(
∗
∗
∗
ƒ−
ƒ
ssss
sss
TePTP
TePT
v
a
w
PPM
MW
MW
∗
PPMv is a relationship between the number of molecules of water vapor to the number of molecules of
dry gas in the mixture. In the two-pressure generator, it is expressed by the relationship
PPMv =
(11)
where ƒ(Ts,Ps) = the enhancement factor at saturation temperature, Ts, and
saturation pressure, Ps
e(Ts) = the SVP (ei or ew) at saturation temperature, Ts
Ps = the absolute saturation pressure, Ps.
The 1200 generates a particular PPMv by determining the required saturation pressure, Ps, at any given
value of saturation temperature, Ts. PPMv is independent of test chamber pressure and test chamber
temperature.
1.2.2.7 Parts Per Million by Weight, PPMw
PPMw is a relationship between the weight of the molecules of water vapor to those of the dry gas in the
mixture. PPMw is related to PPMv by the formula
PPMw =
(12)
where MWw = molecular weight of water (˜ 18.02 g/mol)
MWa = molecular weight of air (˜ 28.97 g/mol)
PPMv = Parts Per Million by Volume from equation 9.
Therefore PPMw ˜ 0.622 PPMv. With the exception of the 0.622 scaling factor, PPMw is generated in a
manner identical to that of PPMv. PPMw is also independent of test chamber temperature and test
chamber pressure.
1-9
Page 26

1.3 SPECIFICATIONS
1.3.1 General
Relative Humidity Range: ...................................................................................................... 10 to 95%
Relative Humidity Uncertainty: @ PcTc * ...................................................................................... 0.5%
Frost Point Temperature Range: ........................................................................................ –18 to 0 °C
Dew Point Temperature Range: ....................................................................................... –20 to 50 °C
Dew Point Uncertainty: * ............................................................................................................. 0.1 °C
Chamber Temperature Range: ........................................................................................... 10 to 60 °C
Chamber Temperature Control Stability: ................................................................................ ±0.04 °C
Chamber Temperature Uniformity: ** ......................................................................................... 0.1 °C
Chamber Temperature Measurement Uncertainty: * ................................................................. 0.05 °C
Chamber Temperature Cooling Rate: .......................................................... 4 Minutes Per °C Average
Chamber Temperature Heating Rate: ......................................................... 2 Minutes Per °C Average
Saturation Pressure Range: .................................................................................. Ambient to 152 psiA
Saturation Pressure Uncertainty: * ............................................................................. 0.08% of FS psiA
Test Chamber Pressure Range: .............................................................................................. Ambient
Test Chamber Pressure Uncertainty: * ...................................................................... 0.08% of FS psiA
Display Resolution: ......................................................................................................................... 0.01
Gas Type: ....................................................................................................................... Air or Nitrogen
Gas Pressure Rating (MAWP): ............................................................................................... 175 psiG
Gas Flow Rate Range: ..................................................................................................... 2 to 10 L/min
Gas Flow Rate Resolution: .................................................................................................. 0.01 L/min
Gas Flow Rate Uncertainty: * ................................................................................................. 1.0 L/min
Test Chamber Dimensions: ............................................... 6" x 6" x 6" (152 mm x 152 mm x 152 mm)
Access Port: ......................................................................... Ø 1.688" (42.8 mm) located on right side
Physical Dimensions: ............................... 11.8" H x 24.1" W x 14.1" D (30.1 cm x 61.2 cm x 35.8 cm)
Dry Weight: ............................................................................................................... 56 lbs. (25.40 Kg)
Wet Weight: .............................................................................................................. 65 lbs. (29.48 Kg)
Utility Cart Dimensions: ........................... 33.0" H x 30.6" W x 20.0" D (83.8 cm x 77.7 cm x 50.8 cm)
Utility Cart Weight: ................................
.................................................................... 84 lbs. (38.10 Kg)
* Represents an expanded uncertainty using a coverage factor, k=2, at an approximate level of
confidence of 95%.
** When operated within ±10 °C of ambient temperature.
1.3.2 Facility Requirements
1200 Humidity Generator ............................................................................. 100-240 vac, 6 A, 50/60Hz
ACS1210 Air Compressor .............................................. 100/100-115 vac, 10 A, 50/60Hz single phase
ACS1210 Air Compressor (optional) ............................. 220-240/230 vac, 6.3 A, 50/60Hz single phase
Gas Supply: ................................................................................... 155-175 psiG @ 0.5 cfm (15 L/min)
1.3.3 Environmental
Operating Temperature: ...................................................................................................... 15 to 30 °C
Storage Temperature: ........................................................................................................... 0 to 50 °C
Humidity: ...................................................................................................... 5 to 95% Non-condensing
1-10
Page 27

1.4 COMPUTER / CONTROL SYSTEM
Reference Drawing 03S12904
1.4.1 General Description
The computer/control system of the 1200 humidity generator performs all control functions required in the
humidity generation process. Temperature and pressure measurement and control, as well as displaying,
printing, and storing of system parameters are all performed in real time. The computer/controller is
made up of several main components, each with individual yet cooperative functions.
1.4.2 Computer System
The 1200 employs a Windows Embedded computer system, color TFT LCD touch panel display, and
interfaces for USB and Ethernet. The computer controls all aspects of the humidity generation process
(i.e., controlling temperatures, pressures, etc.) as well as performing all human interface functions of user
input and information display. Typical windows functions are limited to provide a small embedded
footprint and conserve disk space for data storage.
1.4.2.1 MCU Controller
The Main Computer Unit (MCU) used in the 1200 humidity generator is an embedded SBC running
Windows XP Embedded OS and Thunder Scientifics’ ControLog® for the Series 1200. The main
computer unit supplies a CPU running at 400MHz or better, 1GB or larger solid state disk for
program/data storage, a LCD interface for display connection, serial and parallel ports for system
communication and control, and USB/Ethernet connections for user interfacing.
1.4.2.2 Thin Film Transistors Display (TFT)
The LCD display incorporated into the 1200 humidity generator is a backlit, touch sensitive, thin film
transistor display (TFT). It is used for the purpose of user input and display of system information such
as setpoints, measurements, and any other information pertinent to the operation of the 1200 humidity
generator.
1.4.2.3 USB and Ethernet Interface
The 1200 humidity generator incorporates USB and Ethernet interfaces for communication. The USB
port can be expanded with the use of a USB hub. A multitude of devices can be used, such as a
keyboard, mouse, jump drive, or printer. Ethernet capabilities are provided to connect to local servers.
This feature supports remote desktop operations, Ethernet printing, and file transfers. To connect to you
network please refer to you IT personnel. All connections are standard Windows XP protocol.
1-11
Page 28

1.5 ELECTRICAL SYSTEM
1.5.1 Power Distribution
Reference Drawing 03S12905
The 1200 requires 100/240 VAC 50/60 Hz at approximately 6 amps.
1.5.1.1 Power Supply - +24 VDC (DC1)
The +24 VDC power supply provides power for the pump, fans, stepper motors, solenoid valves, heaters,
and the thermoelectric assembly.
1.5.1.2 Power Supply - +5/+12 VDC (DC2)
The +5/+12 VDC power supply provides power to the main computer (MCU), relay control board (RCB),
and fan control board (FCB) as well as the analog voltage modules for temperature, pressure, and flow
measurement.
1.5.2 System Control Blocks
1.5.2.1 Analog to Digital Converters
The temperature, flow, and pressure transducers are measured by the use of DGH Analog to Digital
Converters. Each of these is discussed further in following sections.
1.5.2.2 Flow Valve
The Flow Valve (V1) is used to control system mass flow rate and is driven indirectly from the main
computer. The stepper motor drive to this valve is powered by the +24 VDC supply (DC1).
1.5.2.3 Expansion Valve
The Expansion Valve (V2) is used to control saturation pressure and is driven indirectly from the main
computer. The stepper motor drive to this valve is powered by the +24 VDC supply (DC1).
1.5.2.4 Thermoelectric Assembly
The Thermoelectric Assembly (TE) is used to control saturation temperature and is driven indirectly from
the main computer. The thermoelectric assembly is powered by the +24 VDC supply (DC1).
1-12
Page 29

1.5.3 Analog Inputs
Reference Drawings 03S12906, 03S12907
1.5.3.1 Temperature Measurement
Four 2K ohm thermistors are used for temperature measurement with continuous real time display by the
main computer. All are easily removable for calibration.
1. Saturation Temperature (RTD0) (indication and control) 0
2. Presaturation Temperature (RTD1) (indication and control) 1
3. Expansion Valve Temperature (RTD2) (indication and control) 2
4. Test Chamber Temperature (RTD3) (indication only) 3
These thermistor temperatures are measured by a DGH analog to digital converter with a resolution of
approximately +/-0.01 °C. Since the temperatures measured by the DGH are based on ideal R-T curves,
further calibration of the temperature output is performed by the main computer prior to use or display
(refer to 4.2.2 for calibration).
1.5.3.2 Mass Flow Transducer (T0)
The mass flow control system utilizes a thermal type Mass Flow Transducer (T0). Mass flow rate through
the generator is settable from 1 to 10 L/min and is displayed in real time on the liquid crystal display
(LCD).
The flow transducer is powered by the +12 VDC power supply (DC2) and has an output of 0 to 5 VDC for
a mass flow rate of 0 to 20 L/min. The flow transducer output is measured by a DGH analog to digital
converter with a resolution better than +/-0.01L. Further calibration of the mass flow output is performed
by the main computer prior to use or display (refer to 4.2.2 for calibration).
1.5.3.3 System Pressure Transducer (T1)
The 0-155 psiA System Pressure Transducer (T1) is a micromachined silicon sensing element mounted
within a high integrity pressure module constructed from stainless steel 316L. During humidity
generation, this system pressure transducer normally monitors the saturation pressure but will switch via
the pressure select solenoid valve (SOL5) to read chamber pressure (barometric) about once every 10
minutes. The system pressure transducer is powered by the +12 VDC power supply (DC2) and has an
output of 0 to 5 VDC for a range of 0 to 155 psiA. This transducer is measured by a DGH analog to
digital converter with a resolution of approximately +/-0.02 psiA. Further calibration of actual pressure
values is performed by the main computer prior to use or display (refer to 4.2.2 for calibration).
1.5.3.4 Supply Pressure Transducer (T2)
The 0-200 psiG Supply Pressure Transducer (T2) is a micromachined silicon sensing element mounted
within a high integrity pressure module constructed from stainless steel. This transducer is used to
measure incoming supply pressure. The output of the transducer is 0 to 5 VDC for a range of 0 to 200
psiG. Transducer output is measured by a DGH analog to digital converter with a resolution of
approximately +/-0.02 psiG. Further calibration to actual pressure values is performed by the main
computer prior to use or display (refer to 4.2.2 for calibration).
Channel #
1-13
Page 30

1.5.3.5 Reservoir Level Monitor
The Reservoir Level Monitor, located on the Relay Control Board (RCB), is used by the main computer to
measure reservoir distilled water level, which can be displayed on the LCD screen. When an empty
indication occurs during RH generation, an audible alarm will sound accompanied by a warning message.
An empty reservoir during start up forces a shutdown, accompanied by both audible and visual alarms.
1.5.3.6 Presaturator Level Monitor
The Presaturator Level Monitor, located on the Relay Control Board (RCB), is used by the main computer
to monitor the presaturator distilled water level. When the distilled water level drops below the control
point (i.e., presaturator empty) the main computer is signaled of this condition and the presaturator fill
solenoid (SOL4) is activated allowing distilled water to flow into the presaturator until a full condition is
obtained.
If the presaturator does not fill to the control point (i.e., reservoir empty) within approximately 5 minutes,
the system will shut down.
1.5.4 Control Logic
Reference Drawing 03S12906
All control is performed digitally at a logic level of +5 VDC. Activation of all devices is accomplished by
applying a high logic level to the control input of the associated solid state relay or other coupling device.
1.5.4.1 Air Supply Solenoid Valve
The Air Supply Solenoid Valve (SOL1) is activated (air on) by applying a high logic level to the gate of
SSR1 (U6) on the Relay Control Board (RCB). Valve actuation voltage is +24 VDC.
1.5.4.2 Pressure Bleed Solenoid Valve
The Pressure Bleed Solenoid Valve (SOL3), when deactivated (normally open), vents system pressure
during a SHUTDOWN or when electrical power is OFF. This valve is activated by applying a high logic
level to the gate of SSR3 (U7) on the Relay Control Board (RCB). Valve actuation voltage is +24 VDC.
1.5.4.3 Pressure Select Solenoid Valve
The Pressure Select Solenoid Valve (SOL2) allows the System Pressure Transducer (T1) to measure the
saturation pressure and the chamber (barometric) pressure when activated and deactivated respectively.
This valve is activated by applying a high logic level to the gate of SSR2 (U11) on the Relay Control
Board (RCB). Valve actuation voltage is +24 VDC.
1.5.4.4 Presaturator Heater
The Presaturator Heater (H1) is a resistive foil heating element. Activation is accomplished by applying a
high logic level to the gate of SSR8 (U10,U14,U15) on the Relay Control Board (RCB). The presaturator
heater is controlled through a PID driven pulse width modulated +24 VDC drive.
1-14
Page 31

1.5.4.5 Presaturator Fill Solenoid Valve
The Presaturator Fill Solenoid Valve (SOL4) is activated by the main computer when it is determined that
the water level in the presaturator has dropped below the control point. The presaturator fill solenoid
valve, when activated, allows distilled water to flow into the presaturator until a full condition is obtained.
If the presaturator does not fill to the control point (i.e., reservoir empty) within approximately 5 minutes,
the system will shut down.
This valve is activated by applying a high logic level to the gate of SSR4 (U12) on the Relay Control
Board (RCB). Valve actuation voltage is +24 VDC.
1.5.4.6 Expansion Valve Heaters
The Expansion Valve Heaters (H2 & H3), when activated, are used to warm the expansion valve body
offsetting the cooling effects due to gas expansion. The heaters are activated by applying a high logic
level to the gate of SSR7 (U9) on the Relay Control Board (RCB). The expansion valve heaters are
controlled through a PID driven pulse width modulated +24 VDC drive.
1.5.4.7 Fluid Circulation Pump
The Fluid Circulation Pump (P1) is a magnetically coupled pump energized by applying a high logic level
to the gate of SSR6 (U13) on the Relay Control Board (RCB). Pump voltage is +24 VDC.
1.5.4.8 Console Fans
The Console Fan Assembly (FAN) is made up of four (4) individual fans (F1-4). These are configured
into two (2) banks: Bank one (1) contains three (3) fans (F1-3) and bank two (2) contains one (1) fan
(F4). During idle powered up conditions, bank two (2) is used to cool the cabinet temperature when
above about 30 °C. During system generation, both banks are enabled to keep the cabinet and the
thermoelectric assembly cool. Bank one (1) is energized by applying a high logic level to the gate of U3
on the Fan Control Board (FCB). This is the same drive signal as used for the Fluid Circulation Pump
(P1). Bank two (2) is energized by applying a high logic level to the gate of U2 on the Fan Control Board
(FCB). These fans are powered by the +24 VDC supply (DC1).
1-15
Page 32

1.6 PNEUMATIC SYSTEM
1.6.1 General Description
Reference Drawing 03S12908
The 1200's pneumatic system requires an air/gas supply that is clean, oil free, and should be capable of
supplying a pressure of 155-175 psiG at a minimum flow rate of 0.5 cfm (15 L/min). A gas supply with a
pressure dew point of 10 °C or less is recommended. The air supply is connected to a 1/4" FPT fitting
located at the lower right rear of the console. From this point, air is admitted through the air supply
solenoid valve (SOL1) to the air supply regulator (REG). Regulated pressure is then monitored by the
supply pressure transducer (T2) and can be displayed on the LCD display. After regulation, the air
passes through the mass flow meter (T0) to the flow control valve (V1). The flow control valve is an
electromechanically actuated plug valve controlled by the main computer with feedback from the mass
flow meter. Mass flow rates are user selectable and displayed on the LCD display.
From the flow control valve, the air flows to the presaturator (PSAT). The presaturator water temperature
is maintained 10 to 20 °C warmer than saturation temperature so as to humidify the air stream to a water
vapor content greater than saturation temperature conditions. This saturated air stream exits the
presaturator and enters the saturator (SAT). As the air flows through the saturator it is cooled to
saturation temperature and excess water vapor is condensed as the air establishes equilibrium with the
chamber fluid thus achieving 100% saturation. Saturation pressure and saturation temperature are
measured as the saturated air exits the saturator and flows to/through the expansion valve (V2).
The computer controlled expansion valve (V2) allows the saturated high pressure air to be reduced to
chamber pressure by varying the orifice of the expansion valve from nearly closed to fully open
depending upon the required saturation pressure. After expansion, the air enters the test chamber at the
desired relative humidity with reference to the chamber temperature and pressure conditions. The air
exits the test chamber through the exhaust port located at the bottom rear of the test chamber (as long as
the chamber access port is sealed).
1.6.1.1 Reservoir
The reservoir (RES) is a pressure vessel constructed of 316 series stainless steel and holds
approximately 0.75 liter of distilled water for the presaturator. This vessel is maintained at system
pressure and, upon demand, supplies distilled water to the presaturator. Reservoir water level can be
monitored on the LCD display in bar gauge form.
1.6.1.2 Presaturator
The presaturator (PSAT) is a vertical pressure vessel presenting a water surface to the incoming air
stream. The presaturator is maintained at a temperature 10 to 20 °C warmer than the desired saturation
temperature. Presaturator temperature is monitored using the Presaturator Temperature Probe (RTD1).
Heating of the presaturator is accomplished by the Presaturator Heater (H1), a resistive foil heating
element powered by the +24 VDC power supply using a PID driven pulse width modulated solid state
control. The presaturator water level is controlled automatically via the presaturator level monitor and the
main computer control of the presaturator fill solenoid valve (SOL4). This allows distilled water to flow
from the reservoir (RES) maintaining a constant water level in the presaturator.
1-16
Page 33

1.6.1.3 Saturator
The air stream is saturated with water vapor in a single pass "tube in shell" type heat exchanger and this
assembly is called a "saturator" (SAT). The humidified air from the presaturator (PSAT), humidified to an
absolute moisture content greater than saturation at saturation temperature, is made to flow through the
saturator on the shell side of the heat exchanger. Temperature controlled chamber fluid flows through
the saturator, in the opposite direction of the air, on the tube side of the heat exchanger. The
presaturated air on the shell side is cooled to chamber fluid temperature as it flows through the saturator.
Excess water vapor is condensed from the air stream as it establishes equilibrium with the chamber fluid,
ensuring that the air stream is saturated. The "Saturation Pressure" (T1) and "Saturation Temperature"
(RTD0) are monitored as the air exits the saturator. These measurements are used in the calculation
and control of the desired humidity.
1.6.1.4 Expansion Valve
After exiting the saturator, the saturated high pressure air stream is reduced to chamber pressure
through what is called an "expansion valve". The expansion valve (V2) is an electro-mechanically
actuated plug valve, using feedback from the system pressure transducer. This valve is heated and
thermally insulated to maintain the valve body above the dew point of the air stream.
1.7 FLUID SYSTEM
1.7.1 General Description
Reference Drawing 03S12909
The temperature control system utilizes distilled water as a heat transfer fluid. The fluid is circulated
through the system at 2.5 gallons per minute by a magnetically coupled centrifugal pump (P1). In this
closed loop system, conditioned fluid flows from the pump through the thermoelectric heat exchanger
(TE), through the saturator assembly and then into the test chamber fluid shell. The fluid then exits the
chamber fluid shell and returns to the pump inlet, completing the fluid circuit.
1.7.1.1 Temperature Conditioning
The 1200's heat transfer fluid is heated and cooled by a thermoelectric heat exchanger (TE) located in
the main fluid path between the circulation pump and the saturator. Pulsed power to the thermoelectric
element is switched using a solid state controller (TEC) that is driven by the PID output from the main
computer using feedback from the saturator temperature measurement (RTD0).
1-17
Page 34

Section 2
INSTALLATION
2.1 GENERAL
Preparations should be made to have adequate floor or bench space (if used without utility cart), a
power source, and an air supply available at the location of operation if the system is to be used
without the ACS1210 Air Compressor System.
2.2 FACILITIES REQUIRED
Reference Drawings 03D12901, 06D12914 & 06D12915
2.2.1 Floor or Bench Space
A minimum area of 2' x 3' of floor space or bench space (if used without utility cart) is required. This
allows clearance for ventilation at the rear of the system and clearance for opening the door.
2.2.2 Electrical Power
1200 Humidity Generator ............................................................................ 100-240 vac, 6 A, 50/60 Hz
ACS1210 Air Compressor ............................................ 100/100-115 vac, 10 A, 50/60 Hz single phase
ACS1210 Air Compressor (optional) ........................... 220-240/230 vac, 6.3 A, 50/60 Hz single phase
2.2.3 Air Supply
The 1200 requires a gas supply that is of instrument quality, typically 5 micron or better particulate
filtration, and oil free at a regulated pressure of 165-175 psiG and a pressure dew point of 10 °C or
less. Regulated supply pressure lower than recommended is acceptable, but will limit the lowest
humidity obtainable from the generator and will require an internal pressure regulator adjustment.
2.2.4 Distilled Water Supply
The 1200 Humidity Generator is shipped from the factory with the reservoir filled approximately 1/2
full. Approximately 0.75 liters of distilled water is required to fill an empty reservoir. Refer to Section
3.12.1 for filling procedure.
The system is shipped from the factory with the chamber fluid jacket filled. Refer to drawing
03D12901 for filling procedure and drawing 03D12902 for drain location.
2.3 PREPARATION
Reference Drawings 03D12901, 06D12914 & 06D12915
2.3.1 Generator and ACS1210 Placement
Place 1200 Humidity Generator on bench or on mobile cart per reference drawing 06D12915.
2-1
Page 35
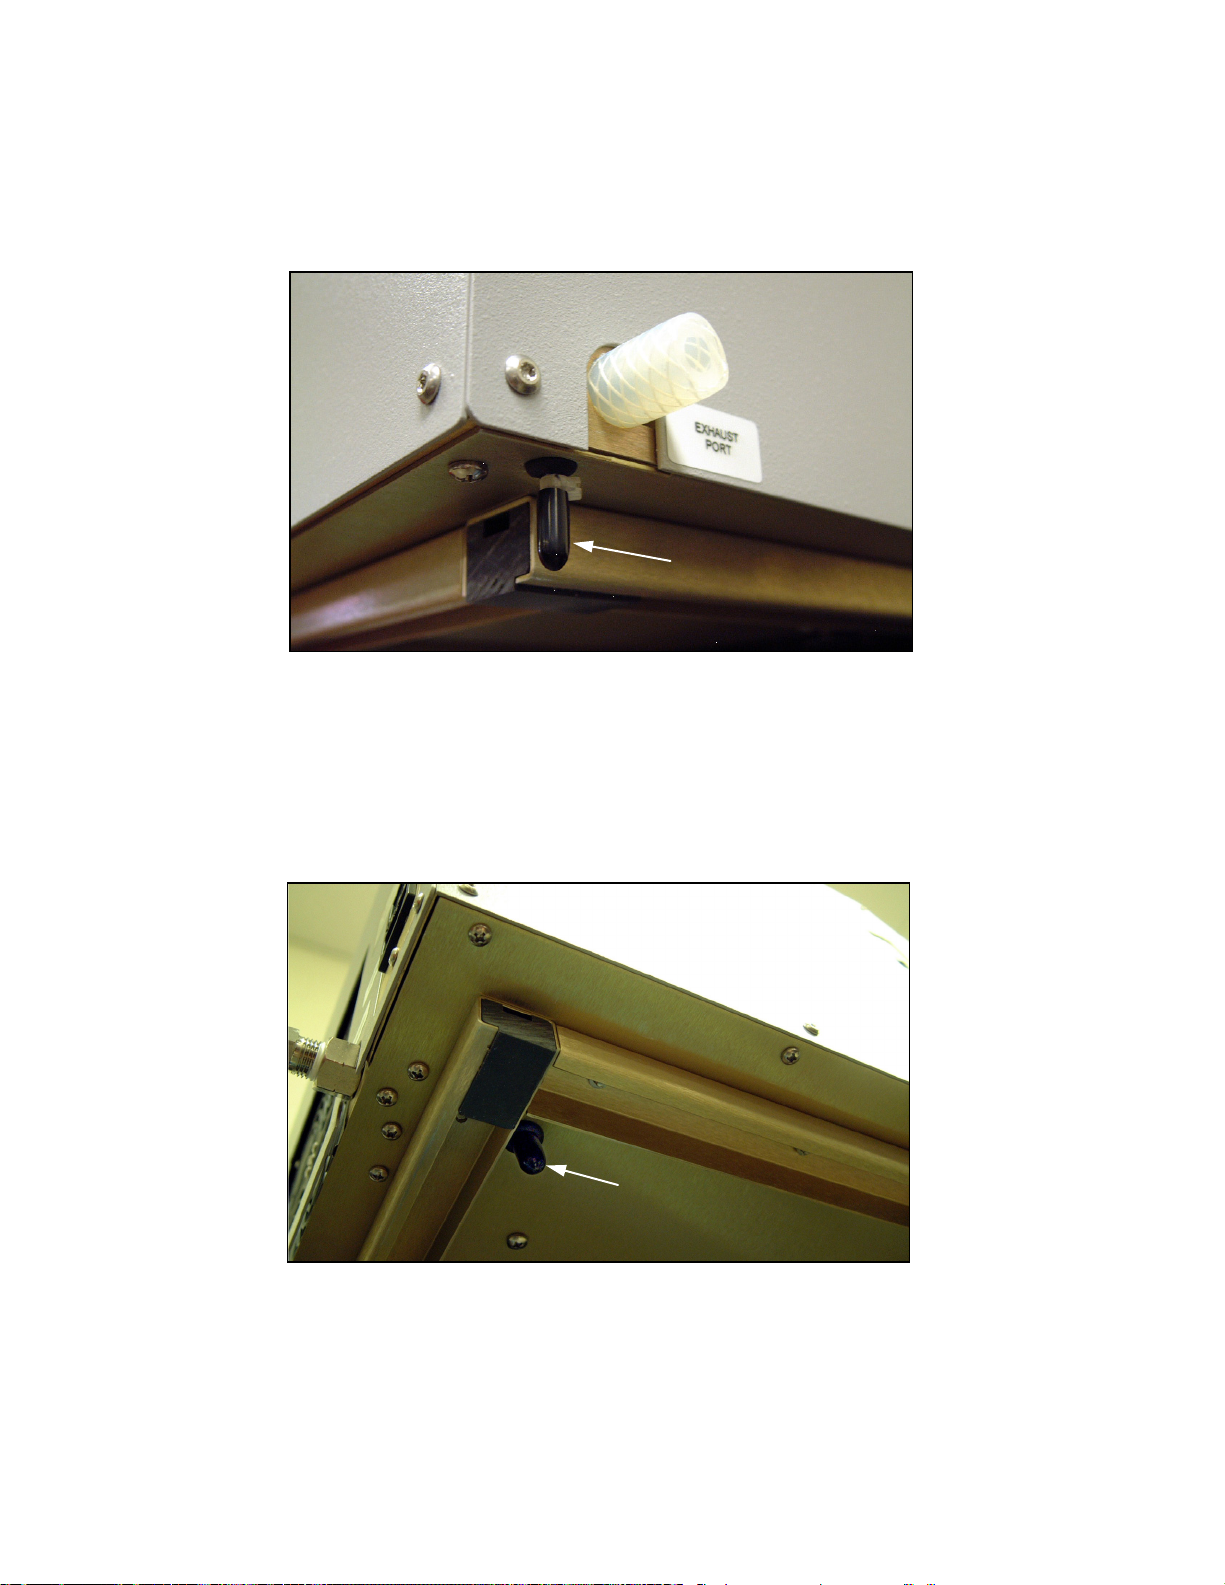
2.3.2 Chamber Overflow Cap Removal
Chamber overflow cap
Pressure vent cap
The location of the chamber overflow cap is at the lower left rear corner of the system. Remove
Chamber Overflow Cap before system startup. See figure 2-1.
Figure 2-1
2.3.3 Pressure Vent Cap Removal
The location of the pressure vent cap is at the lower right rear corner next to the system frame
rail. After setting the system on the utility cart or workbench, rotate the system so as to see
under the system and remove Vent Cap before system startup. See figure 2-2.
Figure 2-2
2-2
Page 36
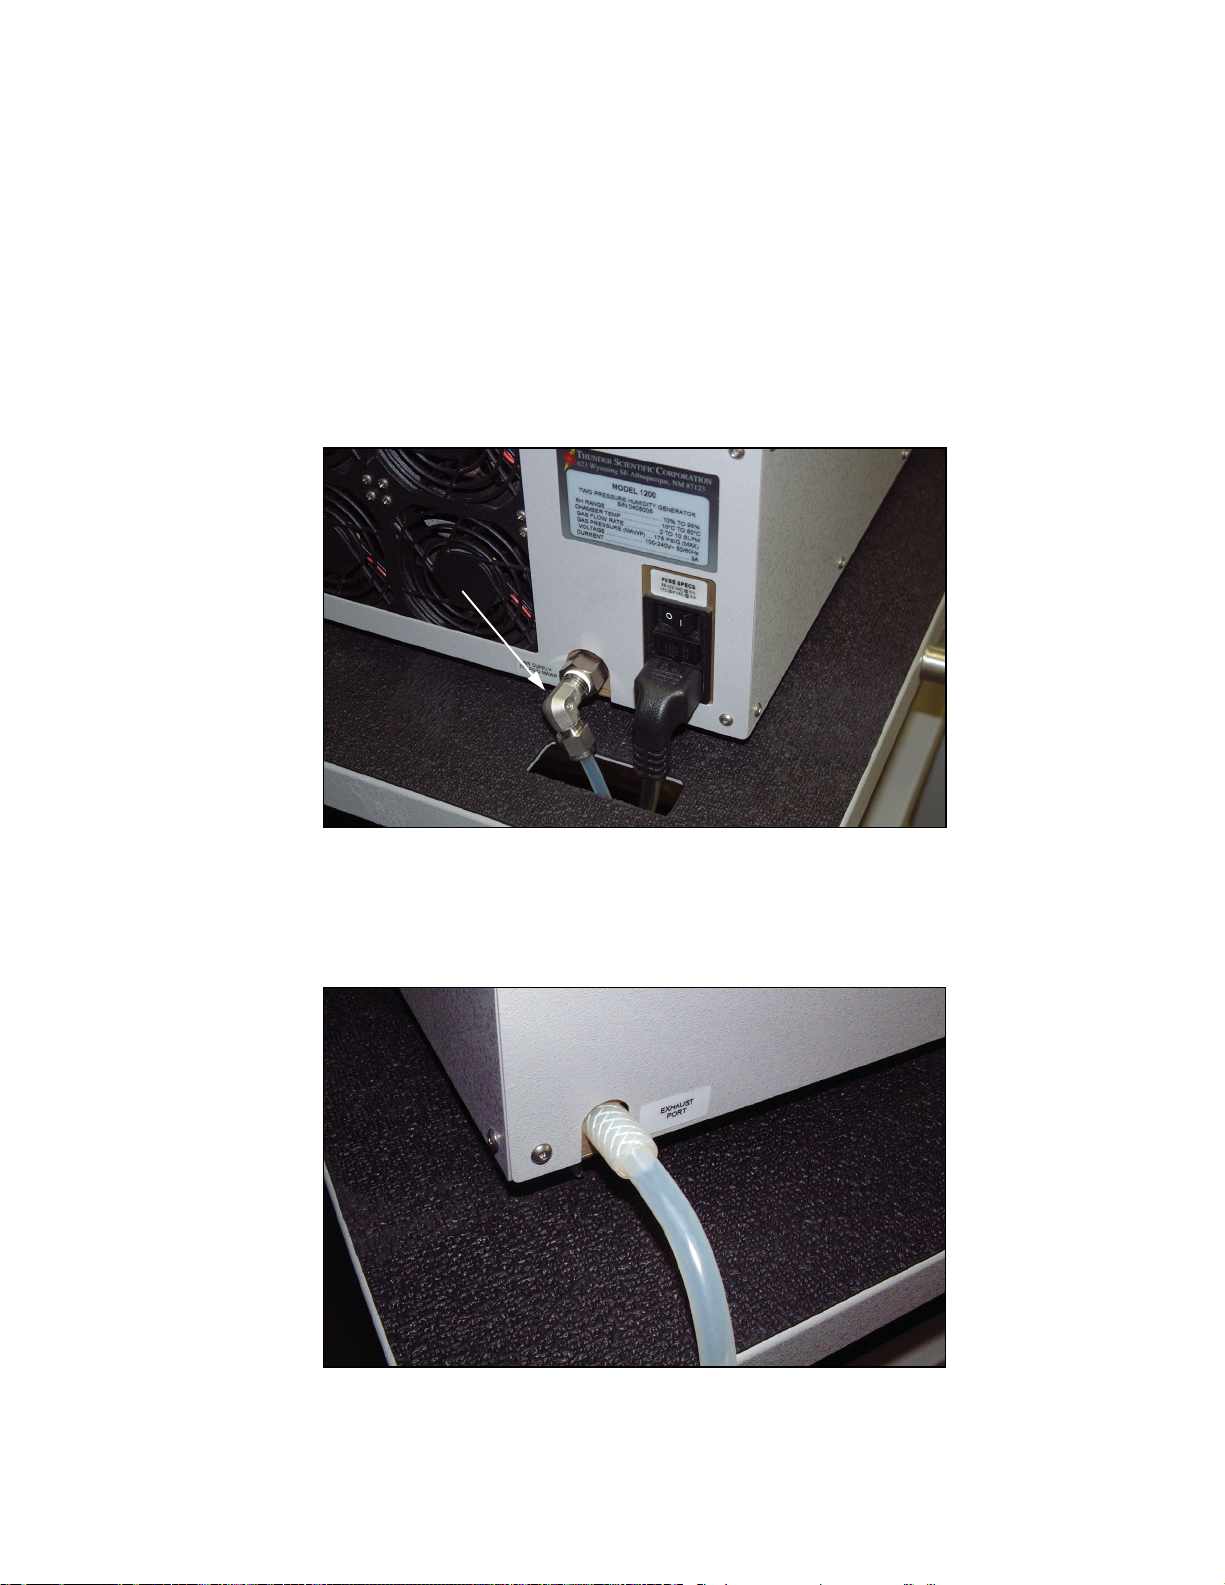
2.4 CONNECTIONS
Air In Elbow
Reference Drawing 03D12901
2.4.1 Air Supply
Connect a source of clean, oil free, instrument quality air to "AIR IN" connection on rear of
system. The maximum working pressure is 175 psiG with a minimum flow rate of 0.5 cfm (15
L/min) and a pressure dew point not greater than 10 °C.
Position the “Air In” elbow at the five o’clock position while using a backup wrench on the
system fitting. Tighten the Swagelok nut on hose 1/8 turn after finger tight. See figure 2-3.
Figure 2-3
If required, a 1/4" ID plastic hose may be inserted into the exhaust tubing and run to an area
that a possible high humidity discharge will not harm. This line should not be longer than 8’
and must slope away from the 1200 so all condensation is discharged. See figure 2-4.
Figure 2-4
2-3
Page 37
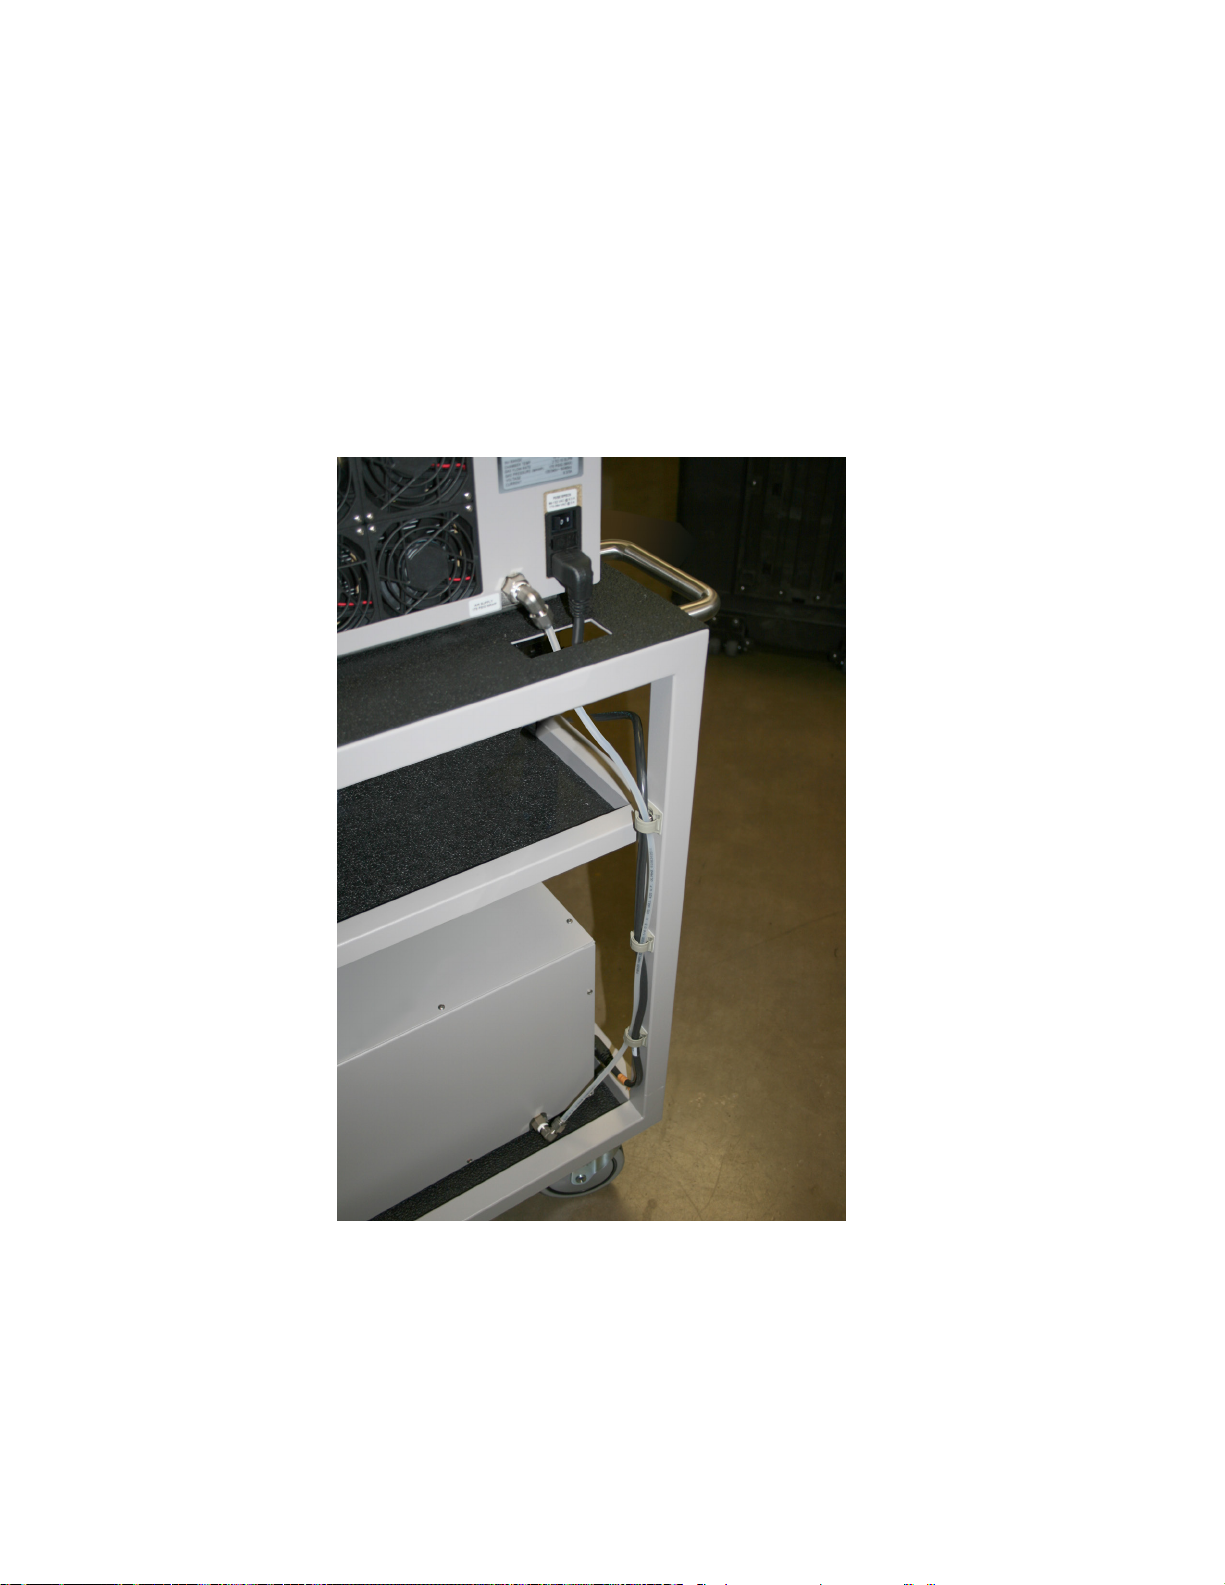
2.4.2 AC Power
Connect power source per 2.2.2 to system using power cord supplied.
2.4.3 Utility Cart Connections
Reference Drawings 03D12901, 06D12914 & 06D12915
Connect the power cord from the power strip to power module of system then connect power strip
main power cord to main power source. See figure 2-5.
Figure 2-5
2.5 INITIAL START-UP
Refer to Section 3 of the Operations Manual before using the 1200 for the first time. The system is
ready for operation if all procedures in Section 2 have been completed.
2-4
Page 38
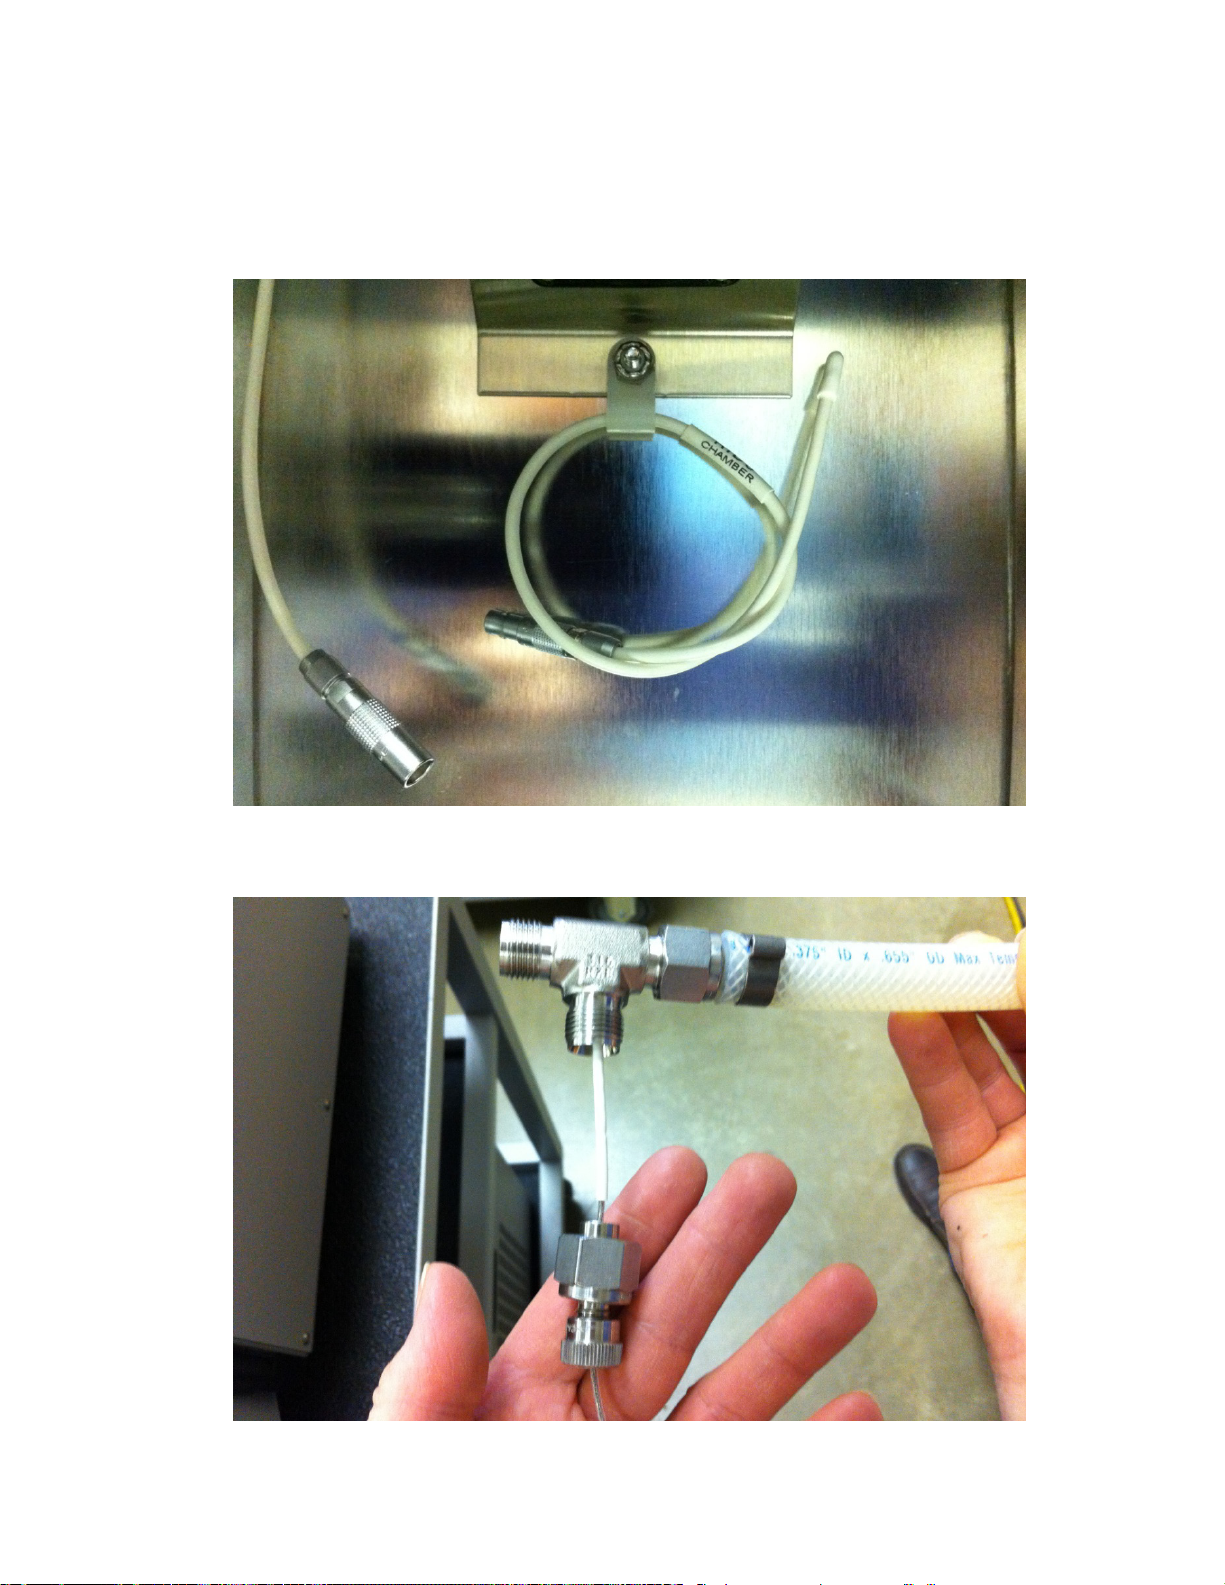
2.6 EXTERNAL HUMIDITY CALIBRATION FIXTURE INSTALLATION (Option)
Reference Drawing 07D12916
1. Unplug normal Chamber Temperature RTD.
2. Loosen knurled wire compression fitting. Using an 11/16” wrench decouple the wire
compression fitting from the tee.
2-5
Page 39
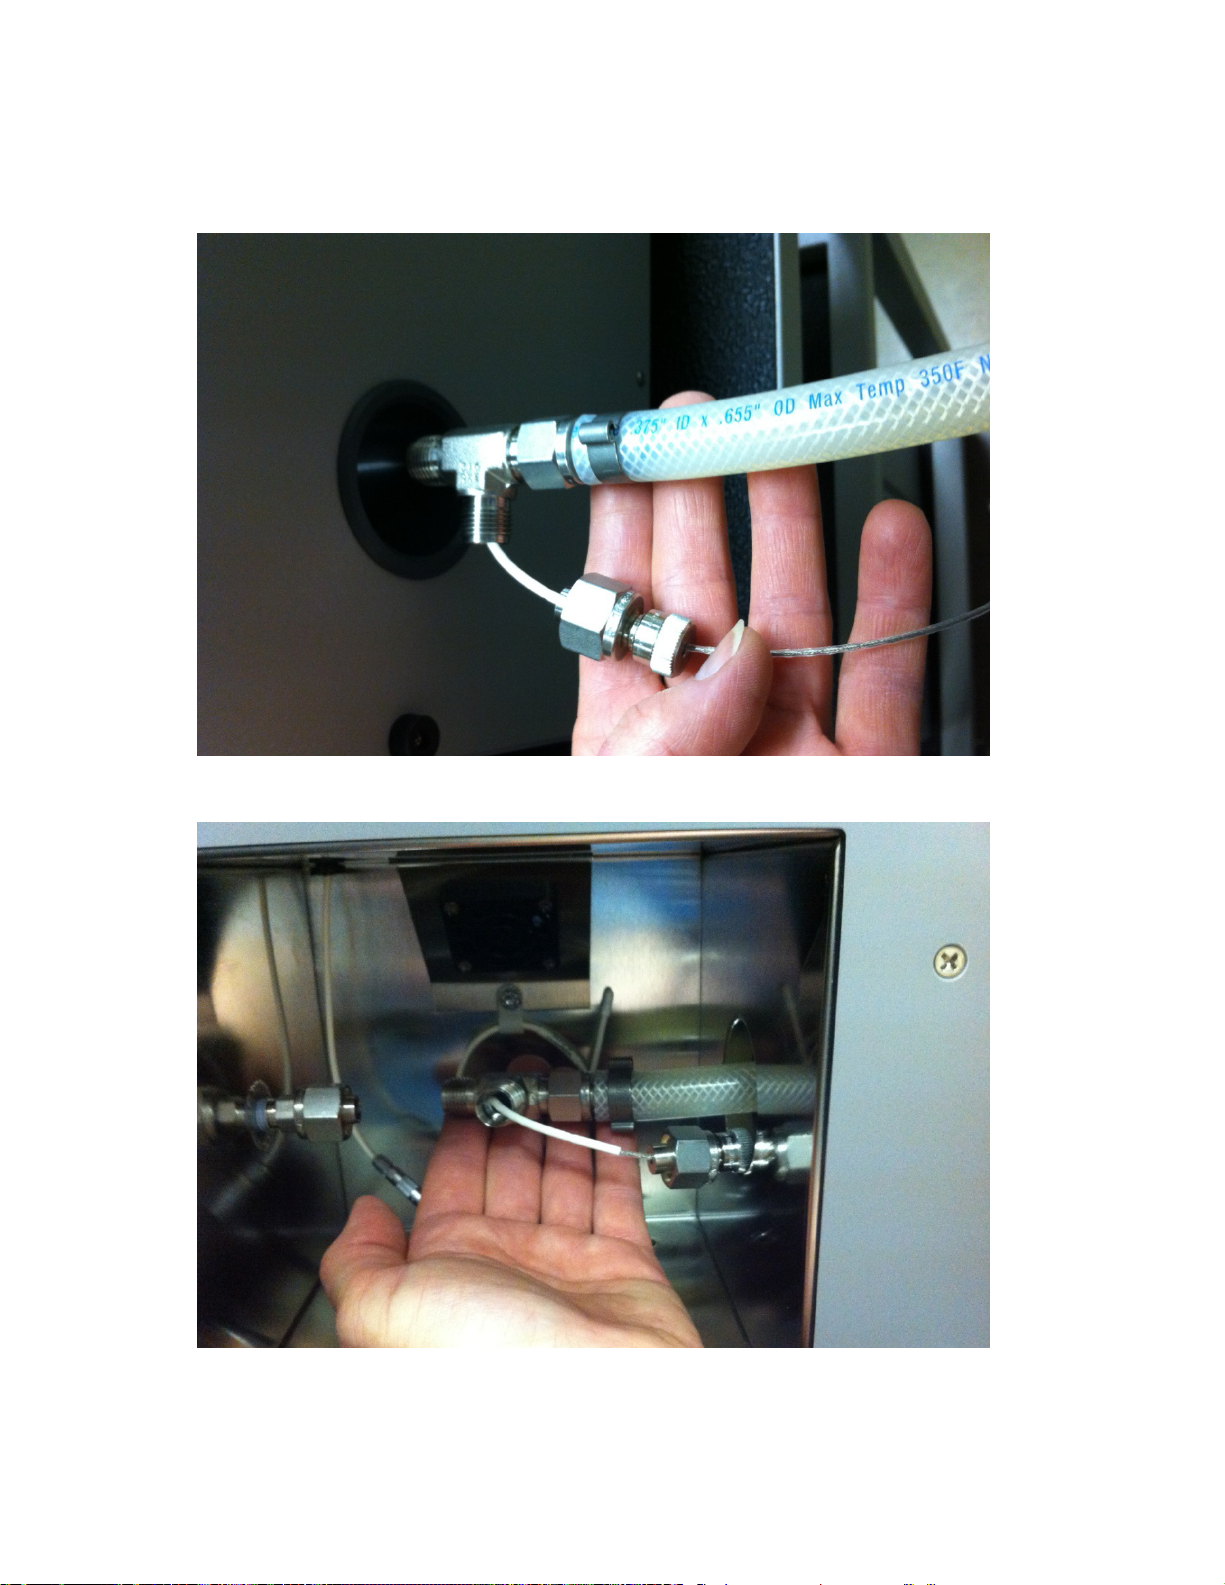
3. Insert assembly into access port as shown.
4. Make sure not to crimp the wires of the probe.
2-6
Page 40
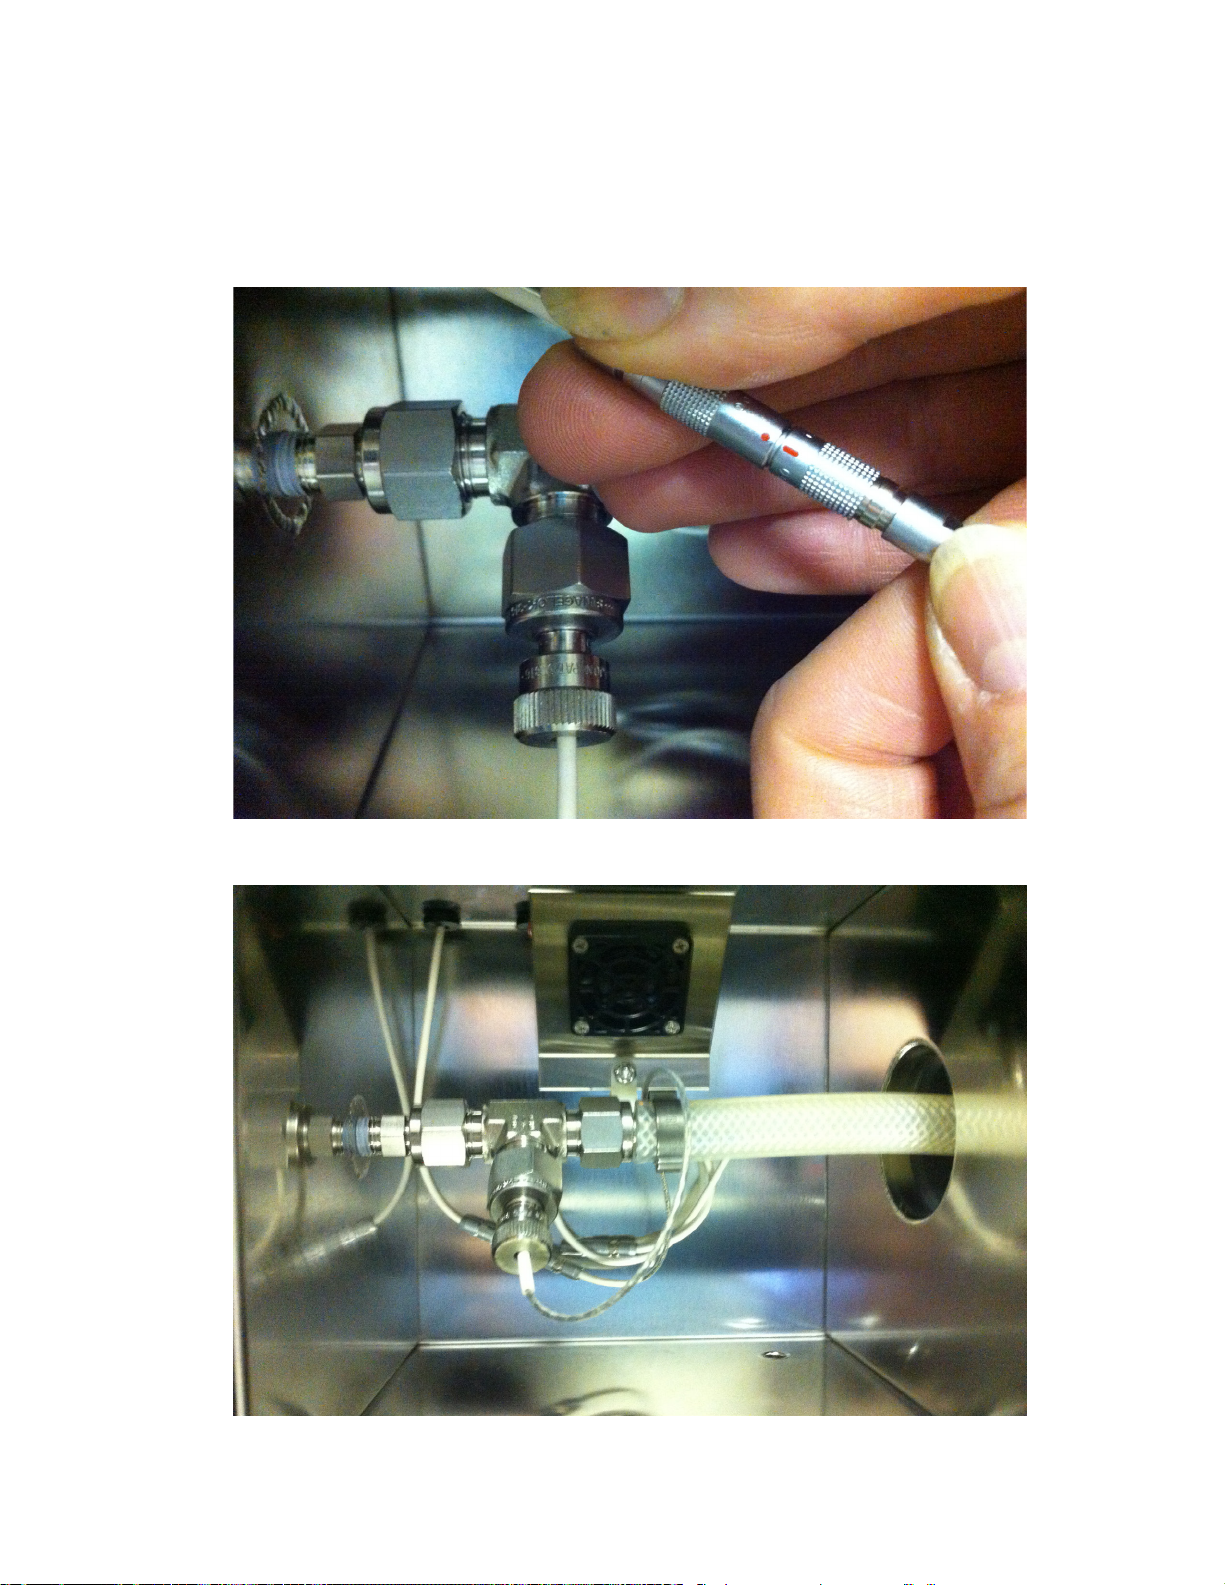
5. Connect the tee assembly to the fitting on 1200’s inlet port. Reassemble the wire
compression fitting to the tee assembly and tighten the knurled wire compression fitting just
enough to keep the wire from sliding in the fitting. Align the red dots on connectors and push
together.
6. Completed assembly.
2-7
Page 41
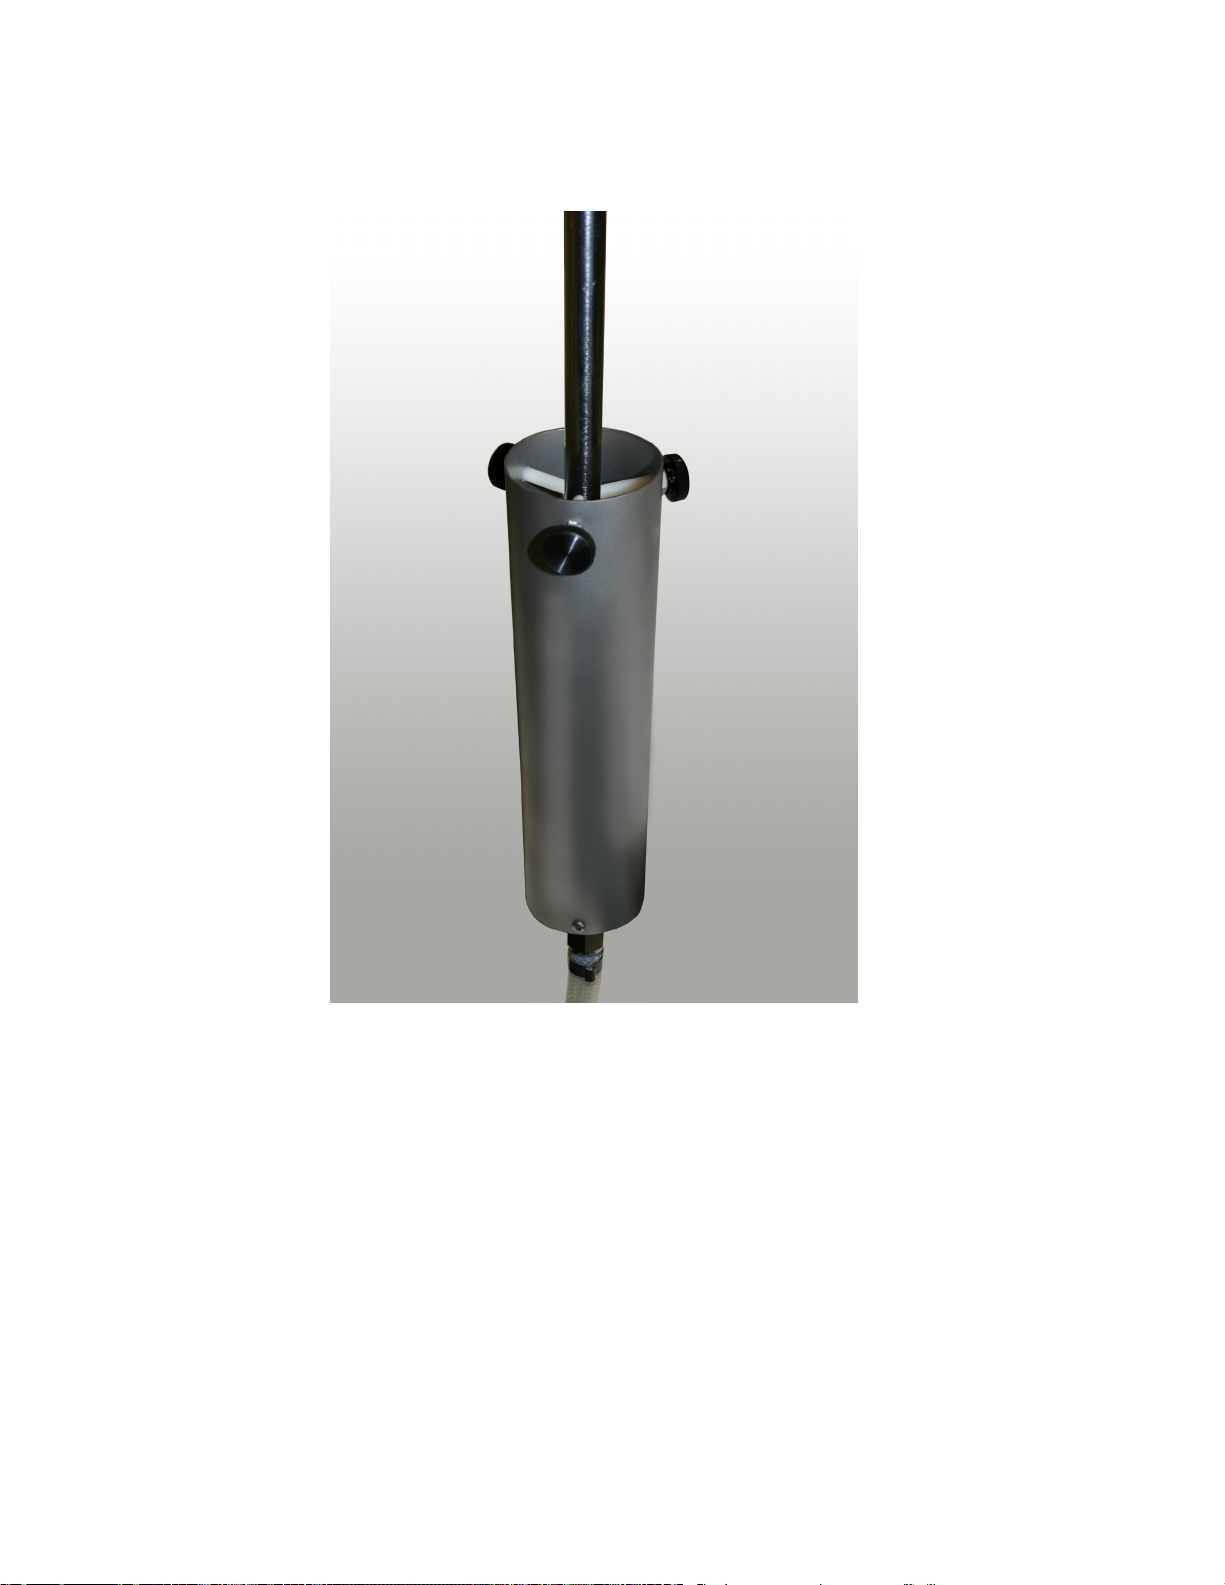
7. Remote calibration assembly, shown clamped to a humidity probe.
Calibration coefficient installation for remote RTD
1) Refer to Section 4, paragraph 4.2.5.Viewing the Current Calibration Coefficients and
paragraph 4.2.6 Editing Calibration Coefficients and review the editing procedure.
2) Power-up the 1200 and bring up the Calibration Coefficients window corresponding to the
Chamber Temperature.
3) Refer to page 5 of the 1200’s calibration report and install the temperature calibration
coefficients exactly as shown for the remote RTD.
4) Close the Editing Calibration Coefficients window.
2-8
Page 42
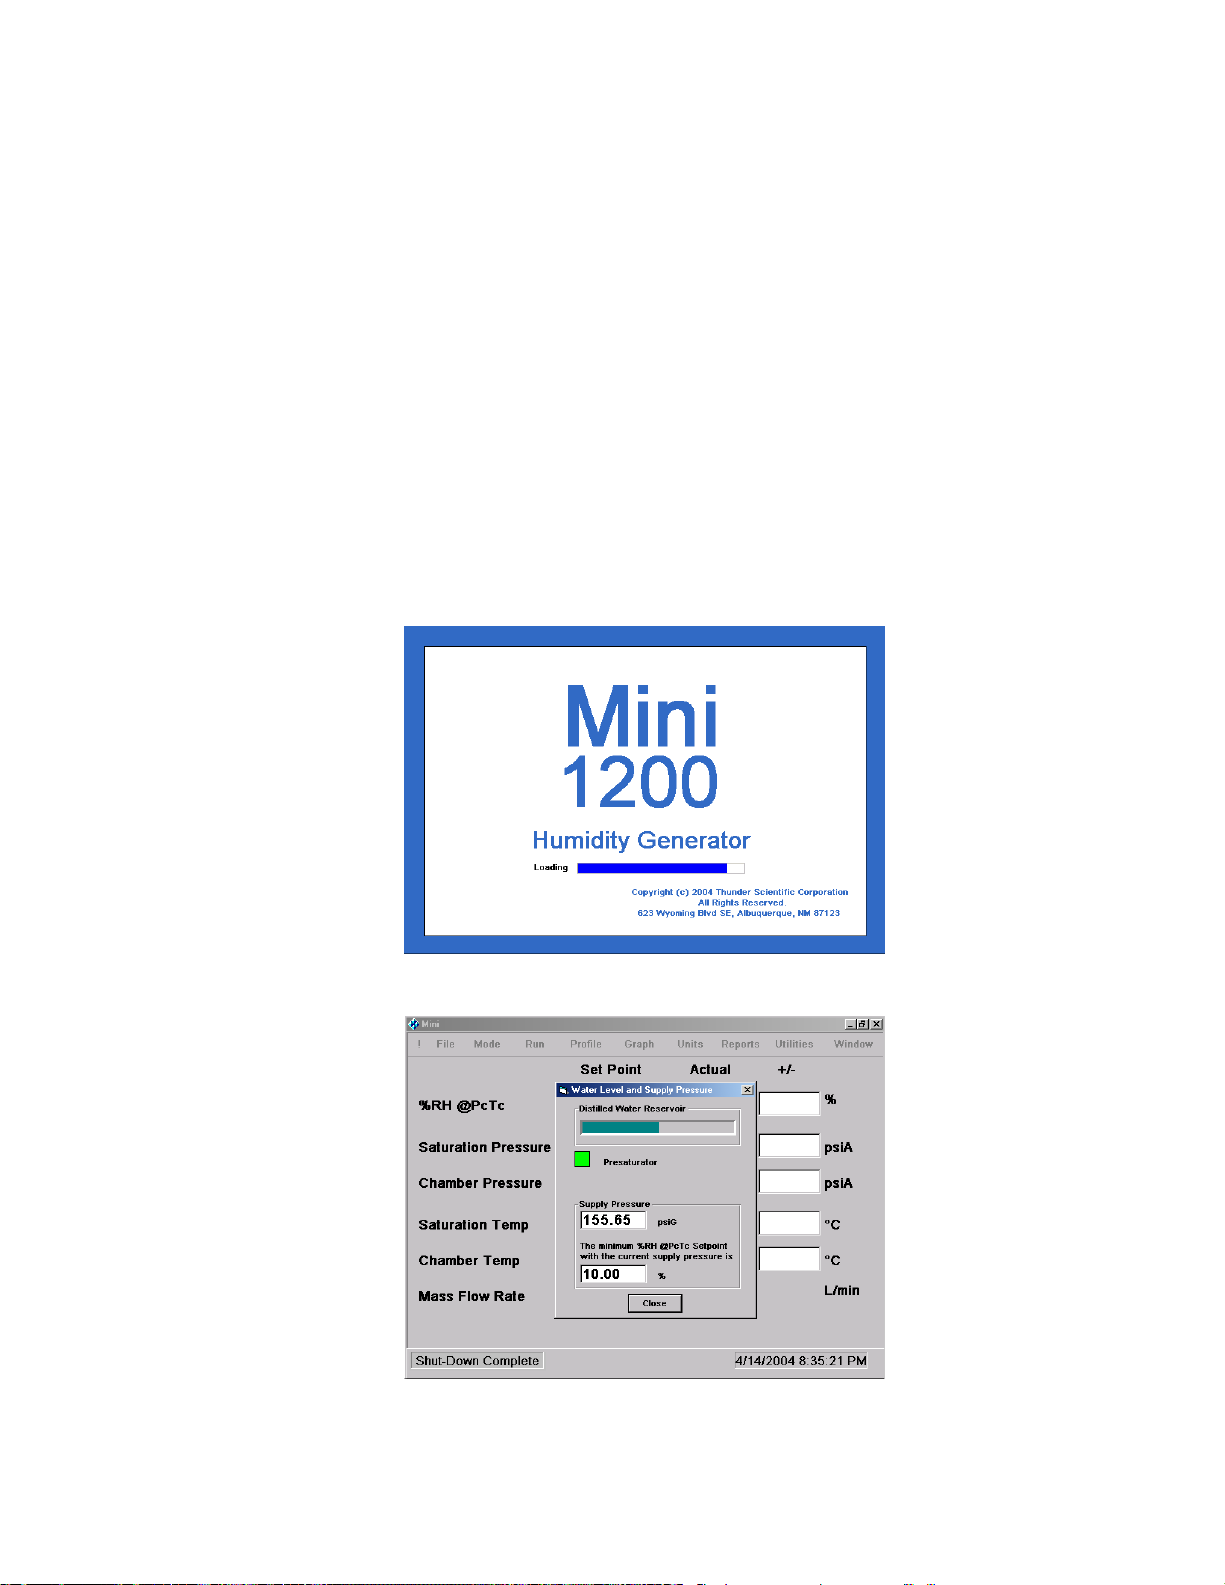
Section 3
OPERATION
3.1 GETTING STARTED
This section is intended to provide you with enough information to start up the generator and begin using
it right away. By following along with the examples, you will become familiar with the basic operating
procedures. Prior to continuing, ensure that installation and preparation has been completed (see
sections 2.3 Preparation and 2.4 Connections).
3.1.1 Power Up:
A) Verify power is connected. Press the 1200 Generator Power Switch to ON. Press the ACS1210
Air Compressor Power Switch to ON if applicable. If operating from facility air/gas system ensure
any/all ON/OFF valves are open and verify supply pressure.
B) The computer's bios will load followed by a Windows XP screen. A banner screen will appear
while the 1200 program is initializing.
C) At the end of the power-up sequence, the following screen appears:
If the "Reservoir" water level is at least 1/2 full, "Presaturator" indicator is green and "Supply Pressure" is
adequate, click Close. If not, proceed to Section 3.12 Water Level and Supply Pressure.
3-1
Page 43
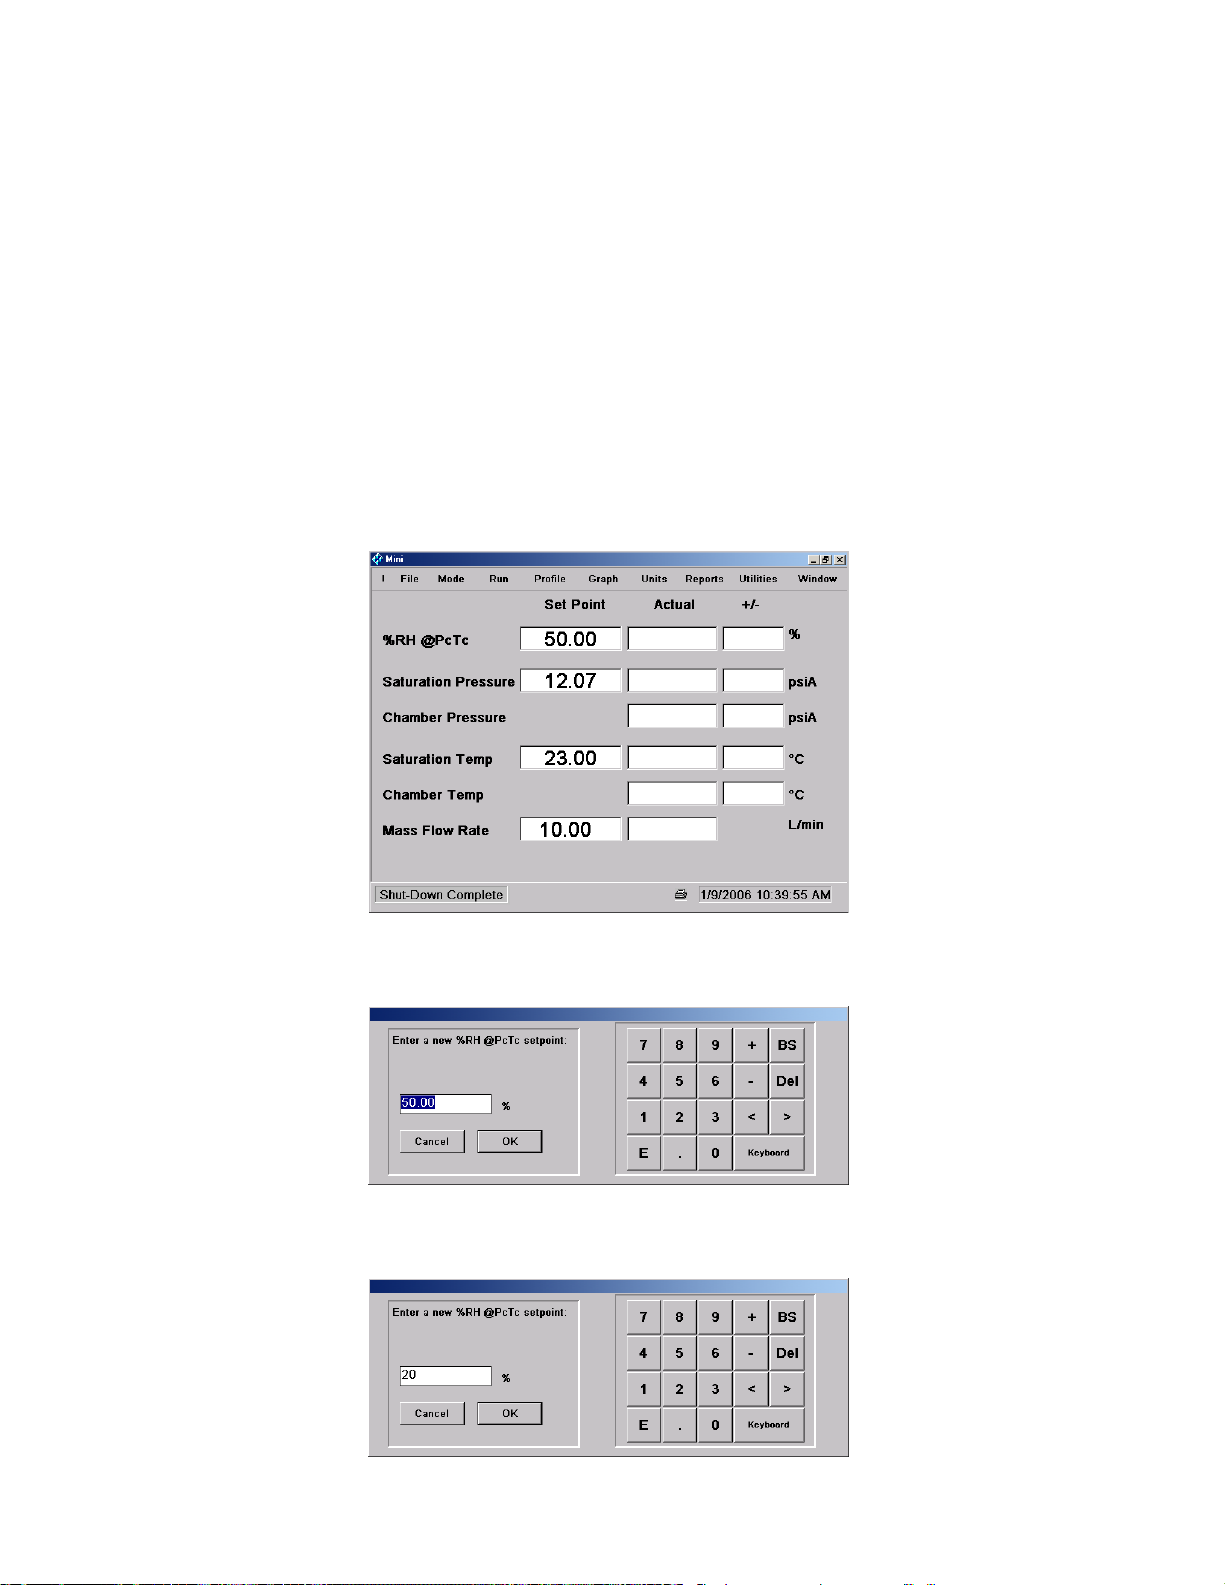
3.1.2 Initiating the Generate Mode
For our first trial run we will generate two different Relative Humidity points and then perform a system
shutdown.
The first point we want to generate is 20% Relative Humidity with a 10 L/min flow rate at a test
temperature of approximately 23 °C. First make sure the test chamber door is closed and the chamber
access port plug is in place.
To start the Generate Mode:
1. Using a stylus on the touch-screen or an optional mouse, click on the %RH Setpoint field of the
Main Screen window.
The following dialog box will appear:
2. Using a stylus or mouse on the touch-screen keypad or an optional keyboard, enter a setpoint
value of 20. Then click OK.
3-2
Page 44
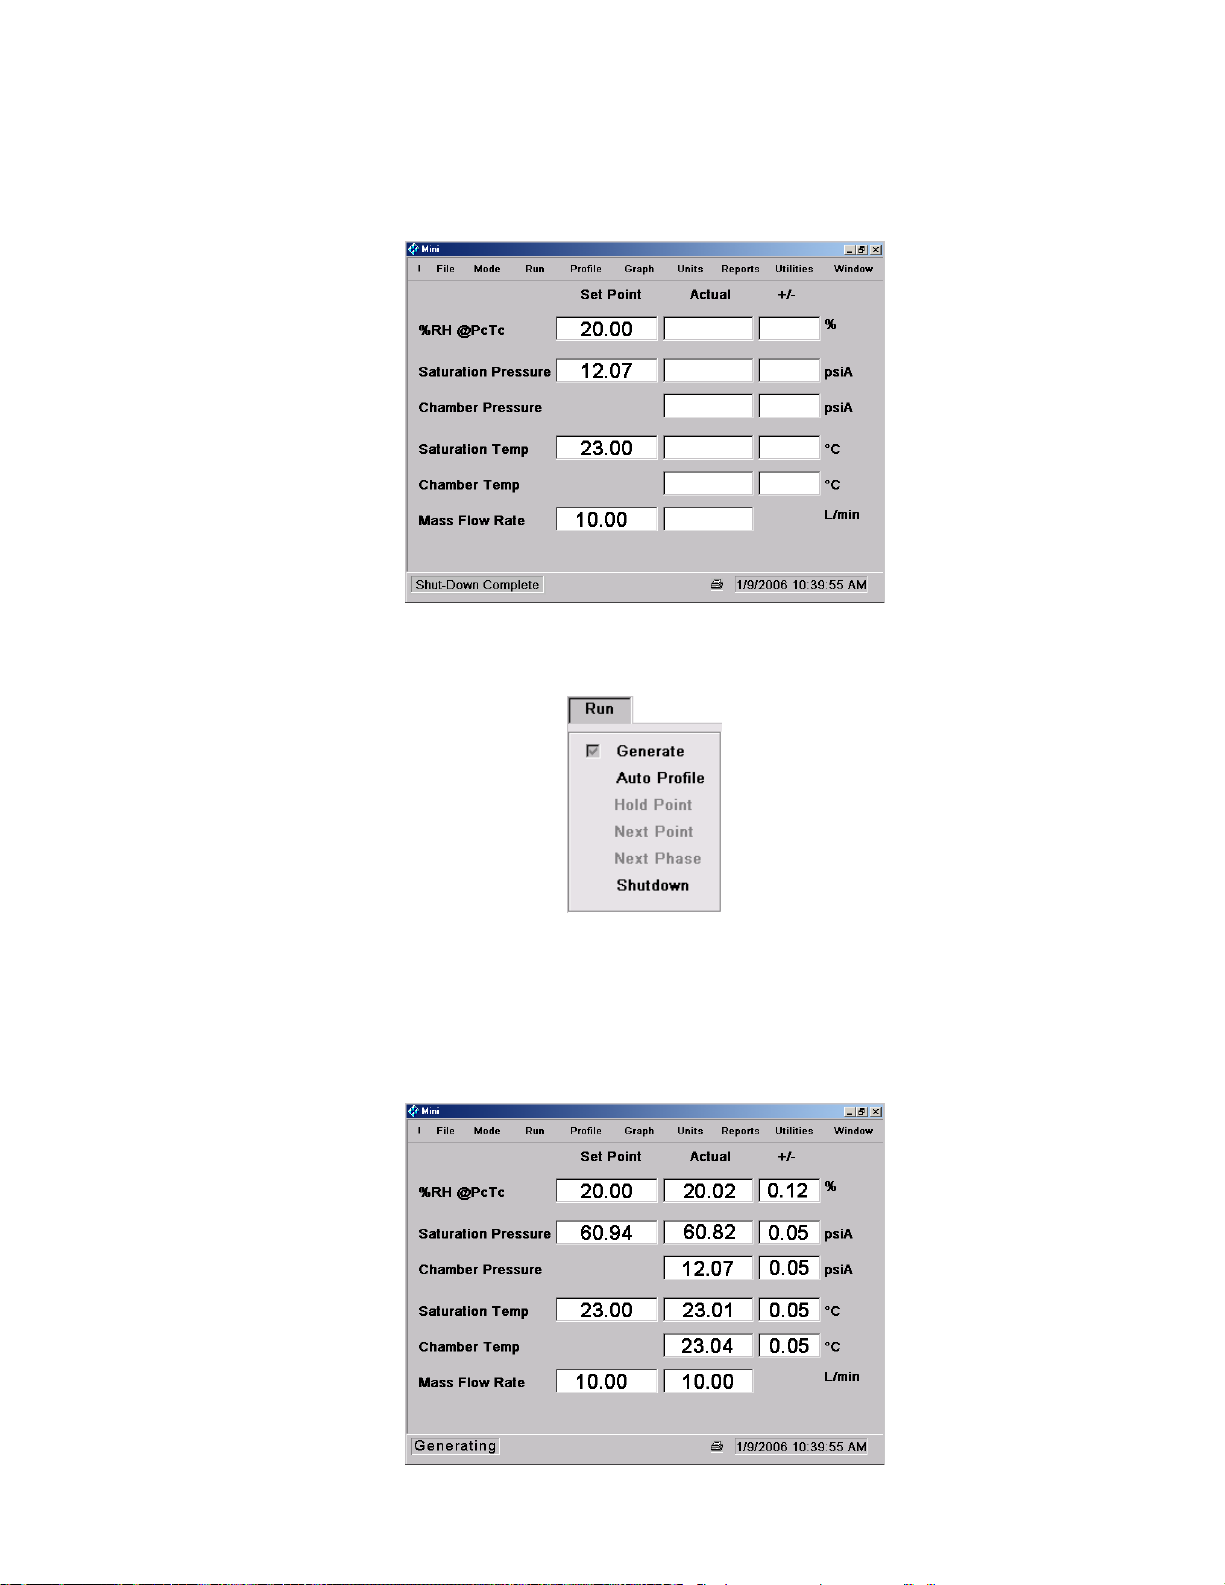
Notice that the %RH setpoint field updates to the new value. Since the setpoint values for flow
rate and saturation temperature are already set to the correct values, there is no need to change
them.
3. Select Generate from the Run drop-down menu.
When the generate mode starts, all fields on the Main Screen will begin to update with current
data. At this point, the generator will begin to control towards the mass flow, saturation pressure
and saturation temp set points. Stabilization time of these control points will vary based on
distance from the set points and distance of the set points from ambient conditions, as well as,
any heat load placed in the chamber.
3-3
Page 45
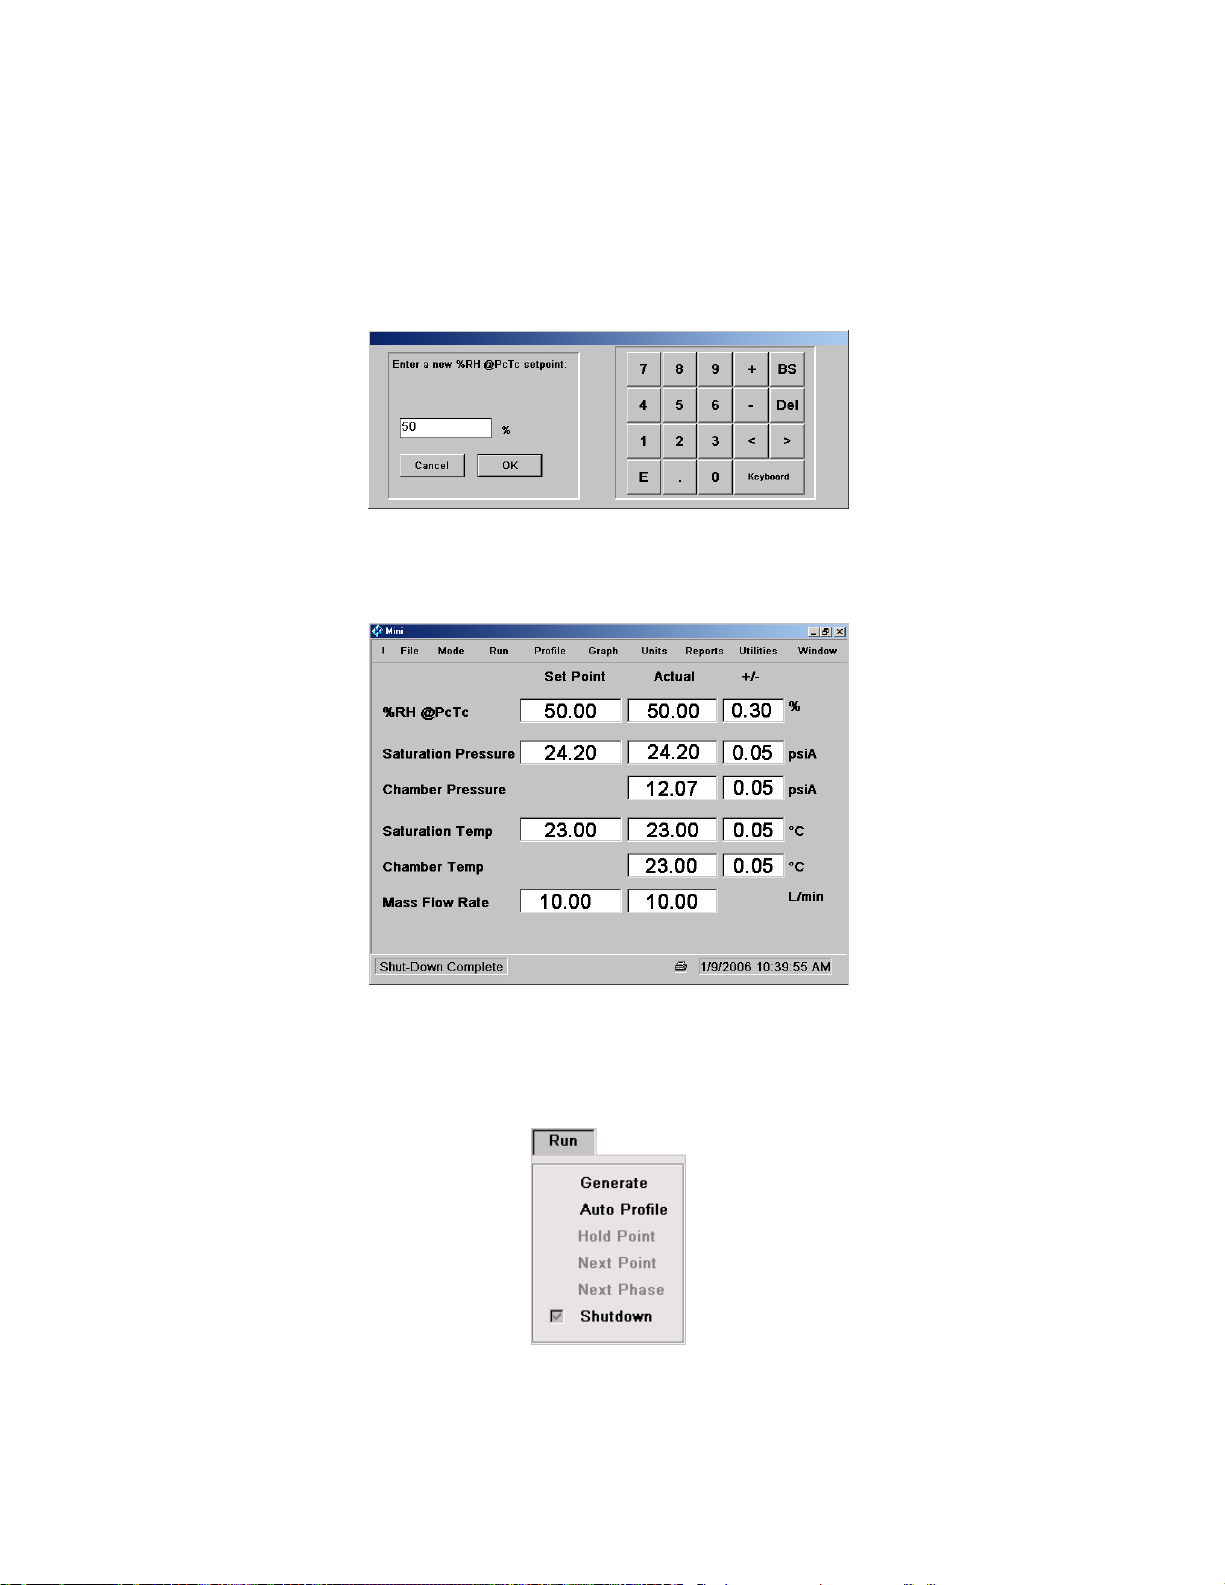
3.1.3 Changing the %RH Setpoint
Once the 1200 has become stable at 20% RH, we will change to a 50% Relative Humidity setpoint.
1. Click on the %RH setpoint field and enter 50 as the new set point.
2. Click OK and allow the system to stabilize at the new %RH.
3.1.4 Shut Down
Now that we have completed our first trial run, select Shutdown from the Run drop-down menu.
3-4
Page 46
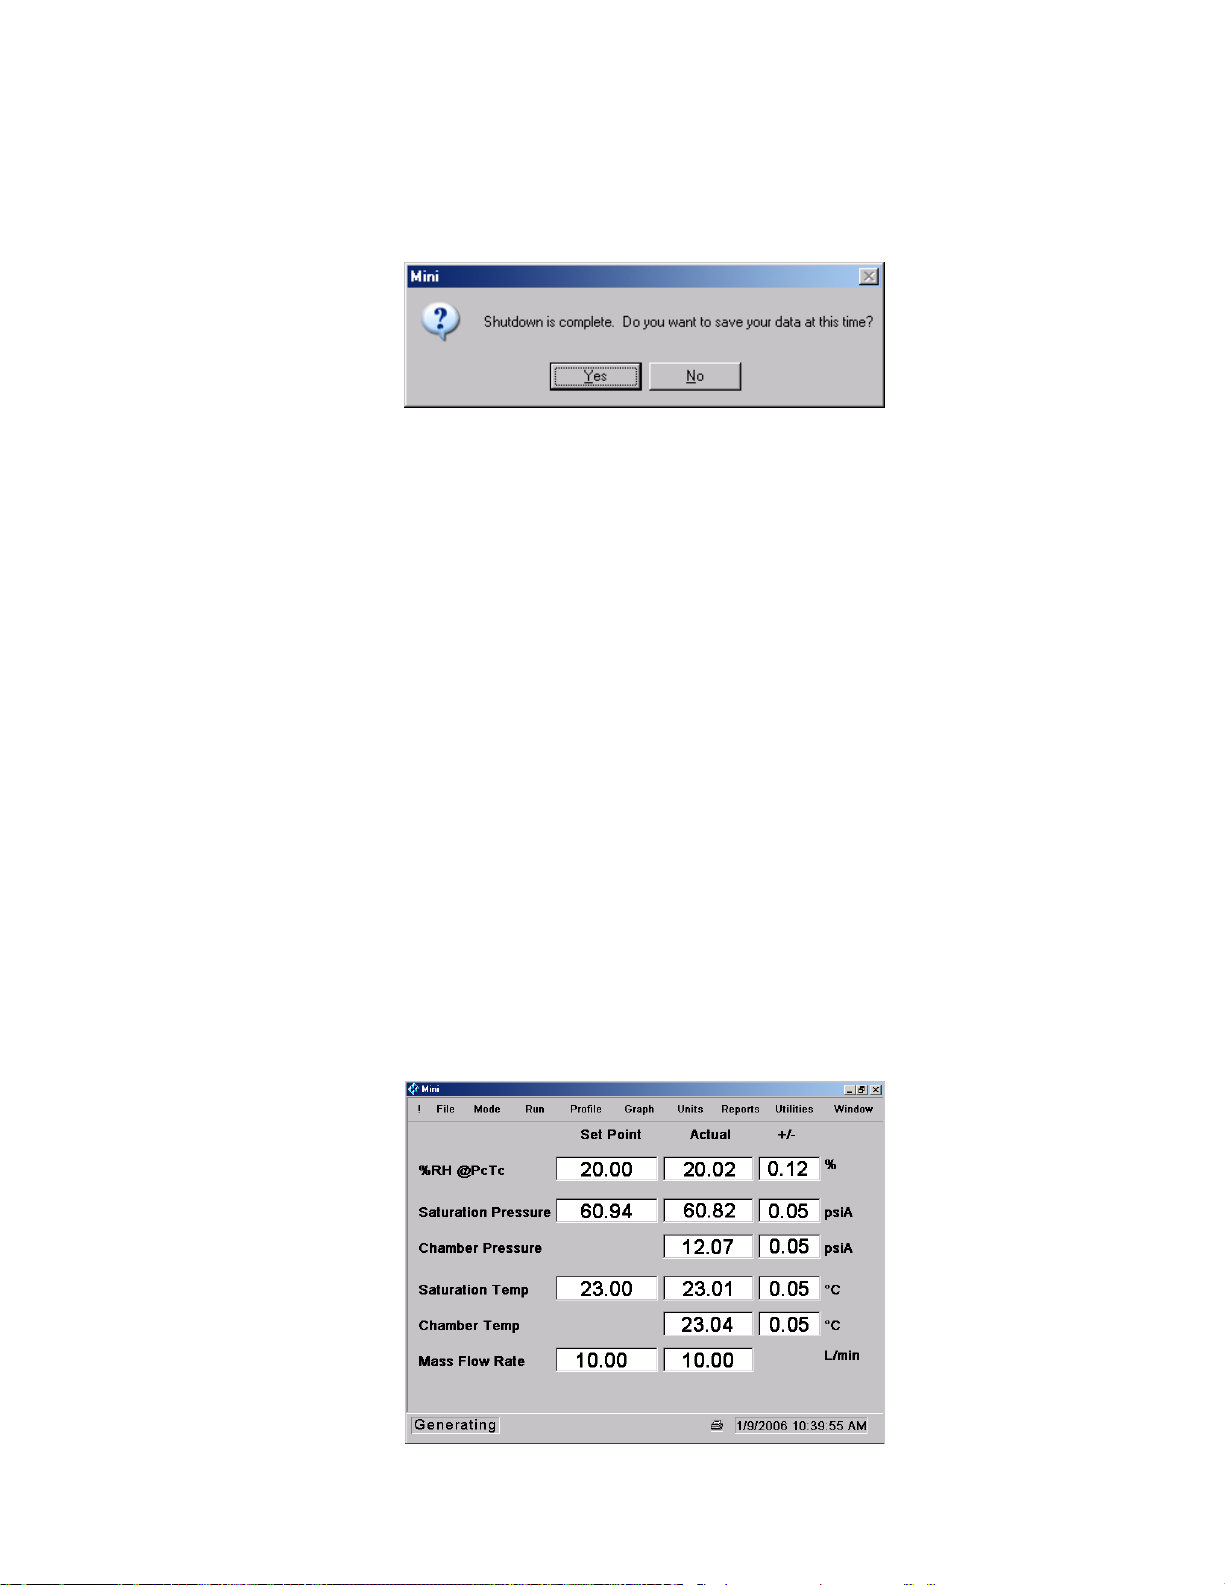
Performing a shutdown causes the generator to disable control routines and vent the saturator pressure
to ambient. Once the generator is shutdown, you will be asked if you would like to save the data that was
stored during your trial run.
If you choose Yes and supply a valid file name the data will be stored to disk for later use.
3.1.5 Power Down
To properly power down the unit and prevent possible compact flash drive corruption the user must:
A) Perform a Shut Down.
B) Exit ControLog using either the control box “X” or by selecting “Exit” from the file menu.
C) Select “Shutdown” from the windows start menu.
D) Wait until the computer shuts down. This is indicated by the LCD screen going completely black.
E) Power off the unit by switching the 1200 Generator Power Switch to OFF.
3.2 WINDOWS
3.2.1 Main Screen
The Main Screen window contains all the control and measurement parameters critical to the operation of
the humidity generator. Notice that each parameter consists of a brief title, unit of measurement, and the
data values for Setpoint, Actual, and Error Estimate as applicable. The first line contains the active
humidity control parameter (i.e. %RH@PcTc).
3-5
Page 47
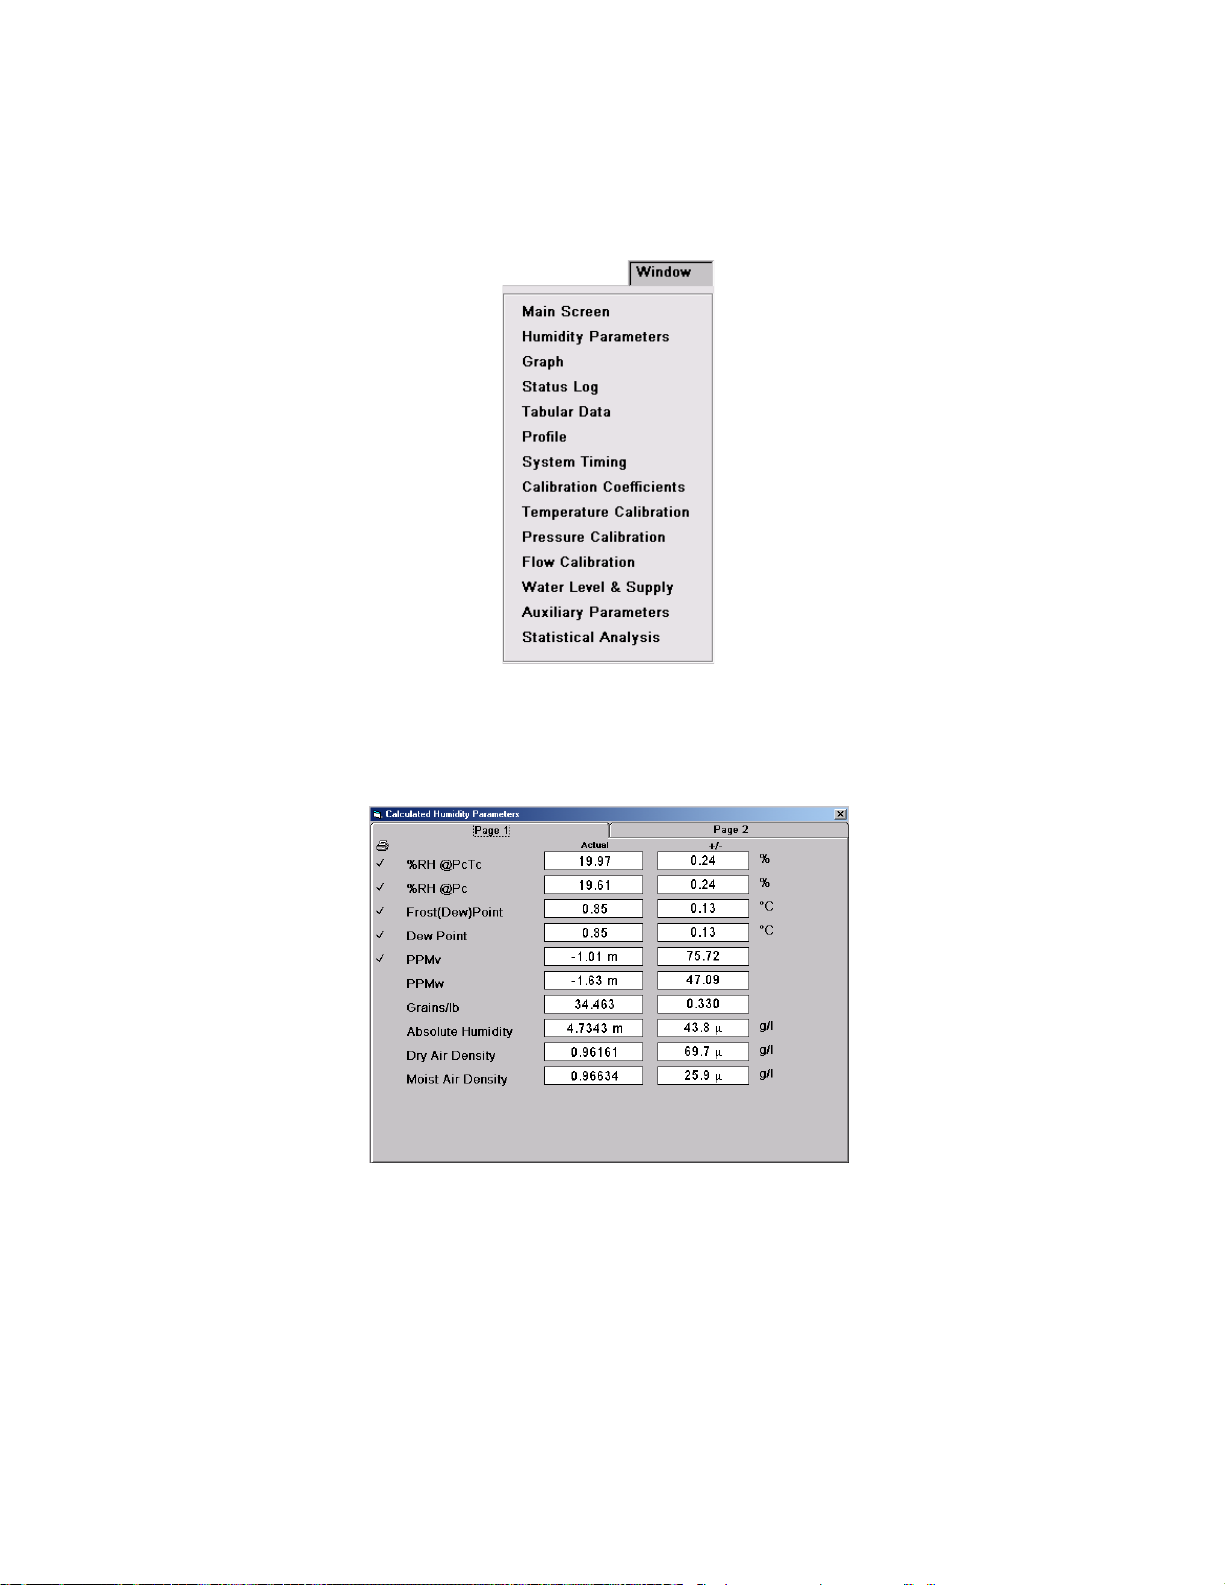
3.2.2 Calculated Humidity Parameters
Select Calculated Humidity Parameters from the Window drop-down menu.
The Calculated Humidity Parameters window contains calculated values of humidity based on the current
system temperatures and pressures. An Error Estimate is given for each value. A check mark in front of
any item indicates that the item will be included in printed data.
%RH@PcTc %RH@PcTc is calculated at test chamber pressure Pc and test chamber
temperature Tc from saturation pressure Ps and saturation temperature Ts.
Percent relative humidity is the ratio of the amount of water vapor in a given
sample to the maximum amount possible at the same temperature and
pressure.
3-6
Page 48

%RH@Pc %RH@Pc is calculated at test chamber pressure Pc from saturation pressure Ps
and saturation temperature Ts. Percent relative humidity is the ratio of the
amount of water vapor in a given sample to the maximum amount possible at the
same temperature and pressure. This mode ignores possible temperature
differences between saturation and chamber.
Frost Point Frost point temperature is calculated at test chamber pressure Pc from
saturation temperature Ts and saturation pressure Ps. Frost point temperature
is the temperature to which a gas must be cooled in order to just begin
condensing water vapor in the form of frost or ice and therefore only exists at
values below 0.01 °C. When operating the system with indicated frost point
above 0.01 °C, the values indicated are to be interpreted as dew point.
However, frost point is not the same as dew point for values below freezing.
Frost point is independent of test chamber temperature.
Dew Point Dew point temperature is calculated at test chamber pressure Pc from saturation
temperature Ts and saturation pressure Ps. Dew point temperature is the
temperature to which a gas must be cooled in order to just begin condensing
water vapor in the form of dew. Generally, dew point exists at temperatures
above freezing. However, in many instances dew point may actually exist at
indicated values below freezing. It is important to note that dew point is not the
same as frost point. Dew point is independent of test chamber temperature.
PPMv Parts Per Million by Volume, PPMv, is calculated from saturation temperature Ts
and saturation pressure Ps. PPMv is a ratio of the number of molecules of water
vapor to the number of molecules of the other constituents in the gas. PPMv is
pressure and temperature insensitive and is therefore independent of test
chamber temperature and test chamber pressure.
PPMw Parts Per Million by Weight, PPMw, is calculated from saturation temperature
Ts, saturation pressure Ps, and the molecular weight of the carrier gas. PPMw
is a ratio of the weight of the water vapor in a sample to the weight of the
remaining constituents in the gas. PPMw is pressure and temperature insensitive
and is therefore independent of test chamber temperature and test chamber
pressure.
Grains/lb Grains per pound is calculated from saturation temperature Ts, saturation
pressure Ps and the molecular weight of the carrier gas. Grains per pound is a
ratio of the weight, in grains (7000 grains = 1 pound), of water vapor to the
weight in pounds of the other constituents in the gas. Grains/lb is pressure and
temperature insensitive and is therefore independent of test chamber
temperature and test chamber pressure.
Absolute Humidity Absolute Humidity is calculated from saturation temperature Ts, saturation
pressure Ps, test chamber temperature Tc and test chamber pressure Pc.
Absolute Humidity is the weight of the water vapor per unit volume of humidified
gas.
3-7
Page 49
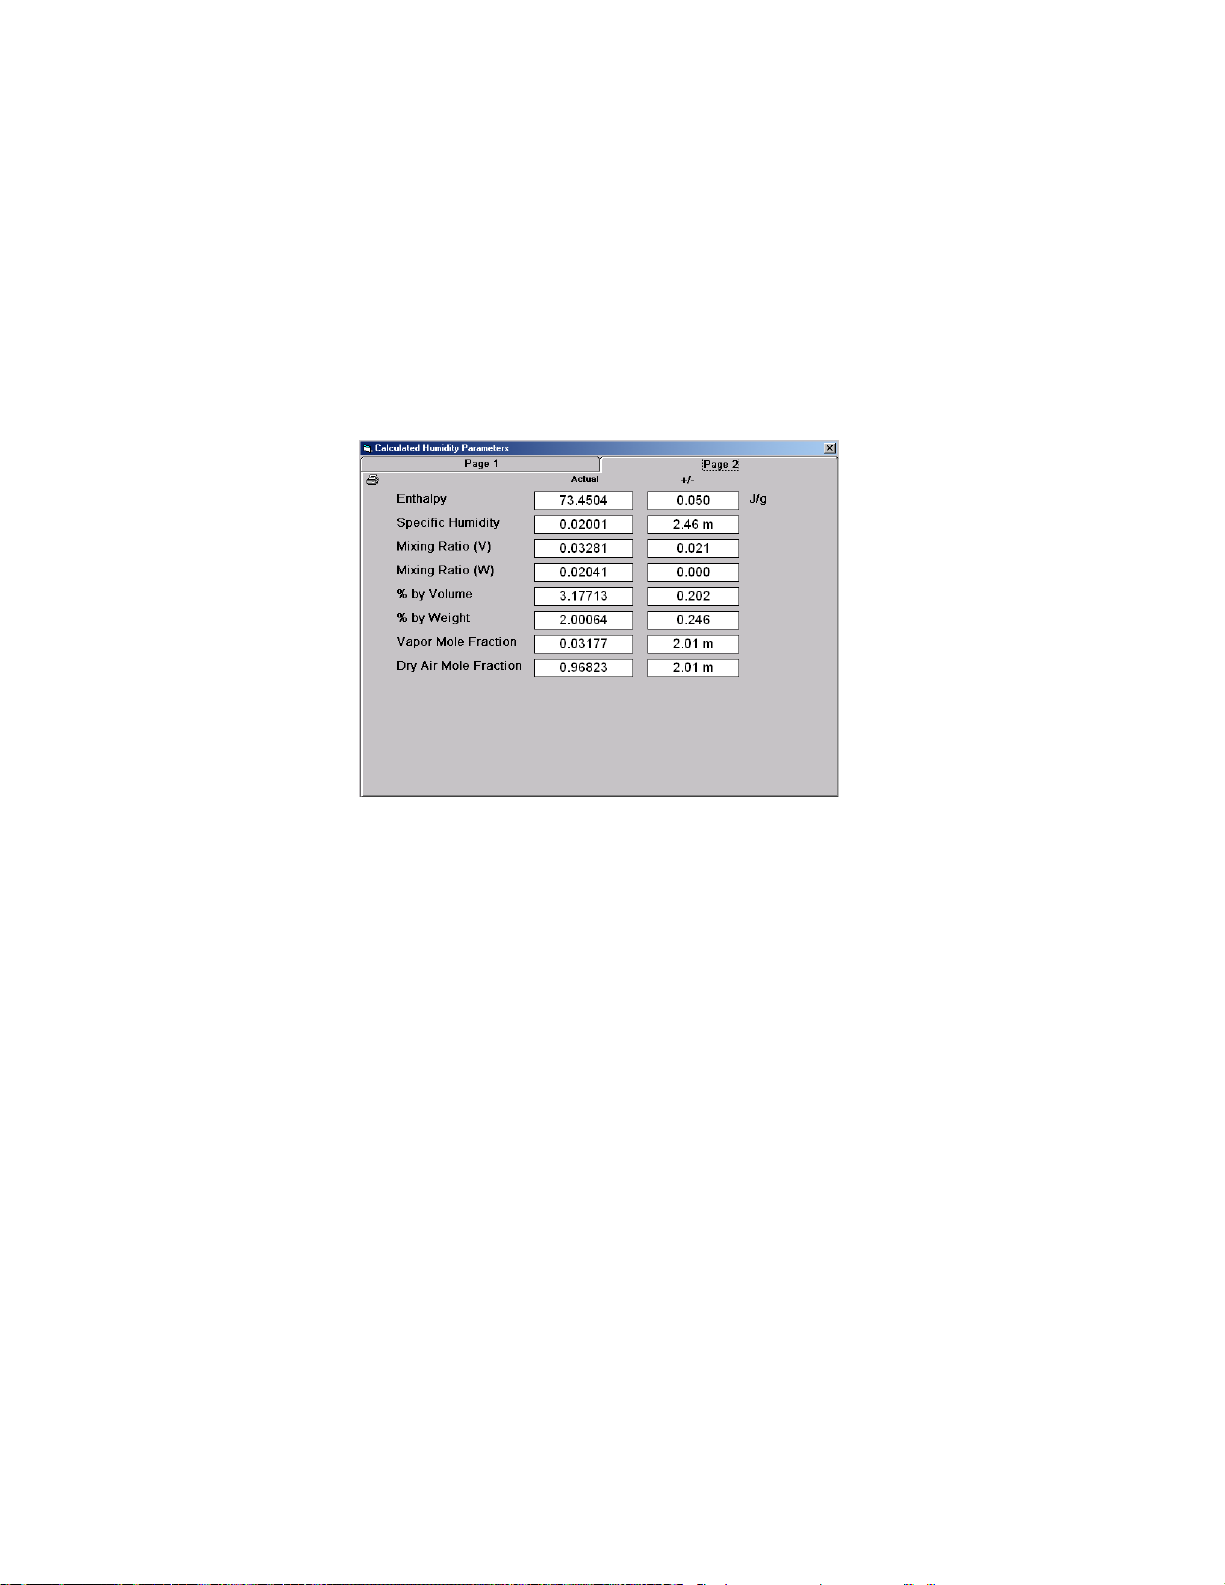
Dry Air Density Partial Dry Air Density is calculated from saturation temperature Ts, saturation
pressure Ps, test chamber temperature Tc and test chamber pressure Pc. Dry
Air Density is the partial density in weight per unit volume of only the dry air
portion of a moist air sample. In other words, if the water vapor were removed
from a fixed volume of air the remaining dry air would exhibit this density.
Moist Air Density Moist Air Density is calculated from saturation temperature Ts, saturation
pressure Ps, test chamber temperature Tc and test chamber pressure Pc. Moist
Air Density is the total weight per unit volume of a moist air sample. This density
includes both the weight of the air and the weight of the water vapor.
Enthalpy Enthalpy is calculated from saturation temperature Ts, saturation pressure Ps,
test chamber temperature Tc and test chamber pressure Pc. Enthalpy is a
measure of the amount of energy required to change a gas from one
temperature and/or humidity value to another. In application, enthalpy is not
used as an absolute value, it is the difference in enthalpy between two distinct
points which are of interest. The datum point which results in zero enthalpy was
therefore arbitrarily chosen at a test temperature of 0 °C and 0 %RH. Applying
enthalpy is a matter of computing the difference in enthalpy between two or more
distinct data points.
Specific Humidity Specific Humidity is calculated from saturation temperature Ts, saturation
pressure Ps and test chamber pressure Pc. Specific humidity is a ratio of the
weight of the water vapor to the total weight of the humidified gas. Specific
humidity is independent of test chamber temperature.
Mixing Ratio (V) Mixing Ratio by Volume is calculated from saturation temperature Ts, saturation
pressure Ps and test chamber pressure Pc. Mixing Ratio by Volume is a ratio of
the partial pressure of the water vapor to the partial pressure of the remaining
constituents in the sample. Mixing Ratio by Volume is independent of test
chamber temperature.
Mixing Ratio (W) Mixing Ratio by Weight is calculated from saturation temperature Ts, saturation
pressure Ps and test chamber pressure Pc. Mixing Ratio by Weight is a ratio of
the weight of the water vapor to the weight of the remaining constituents in the
sample. Mixing Ratio by Weight is independent of test chamber temperature.
3-8
Page 50
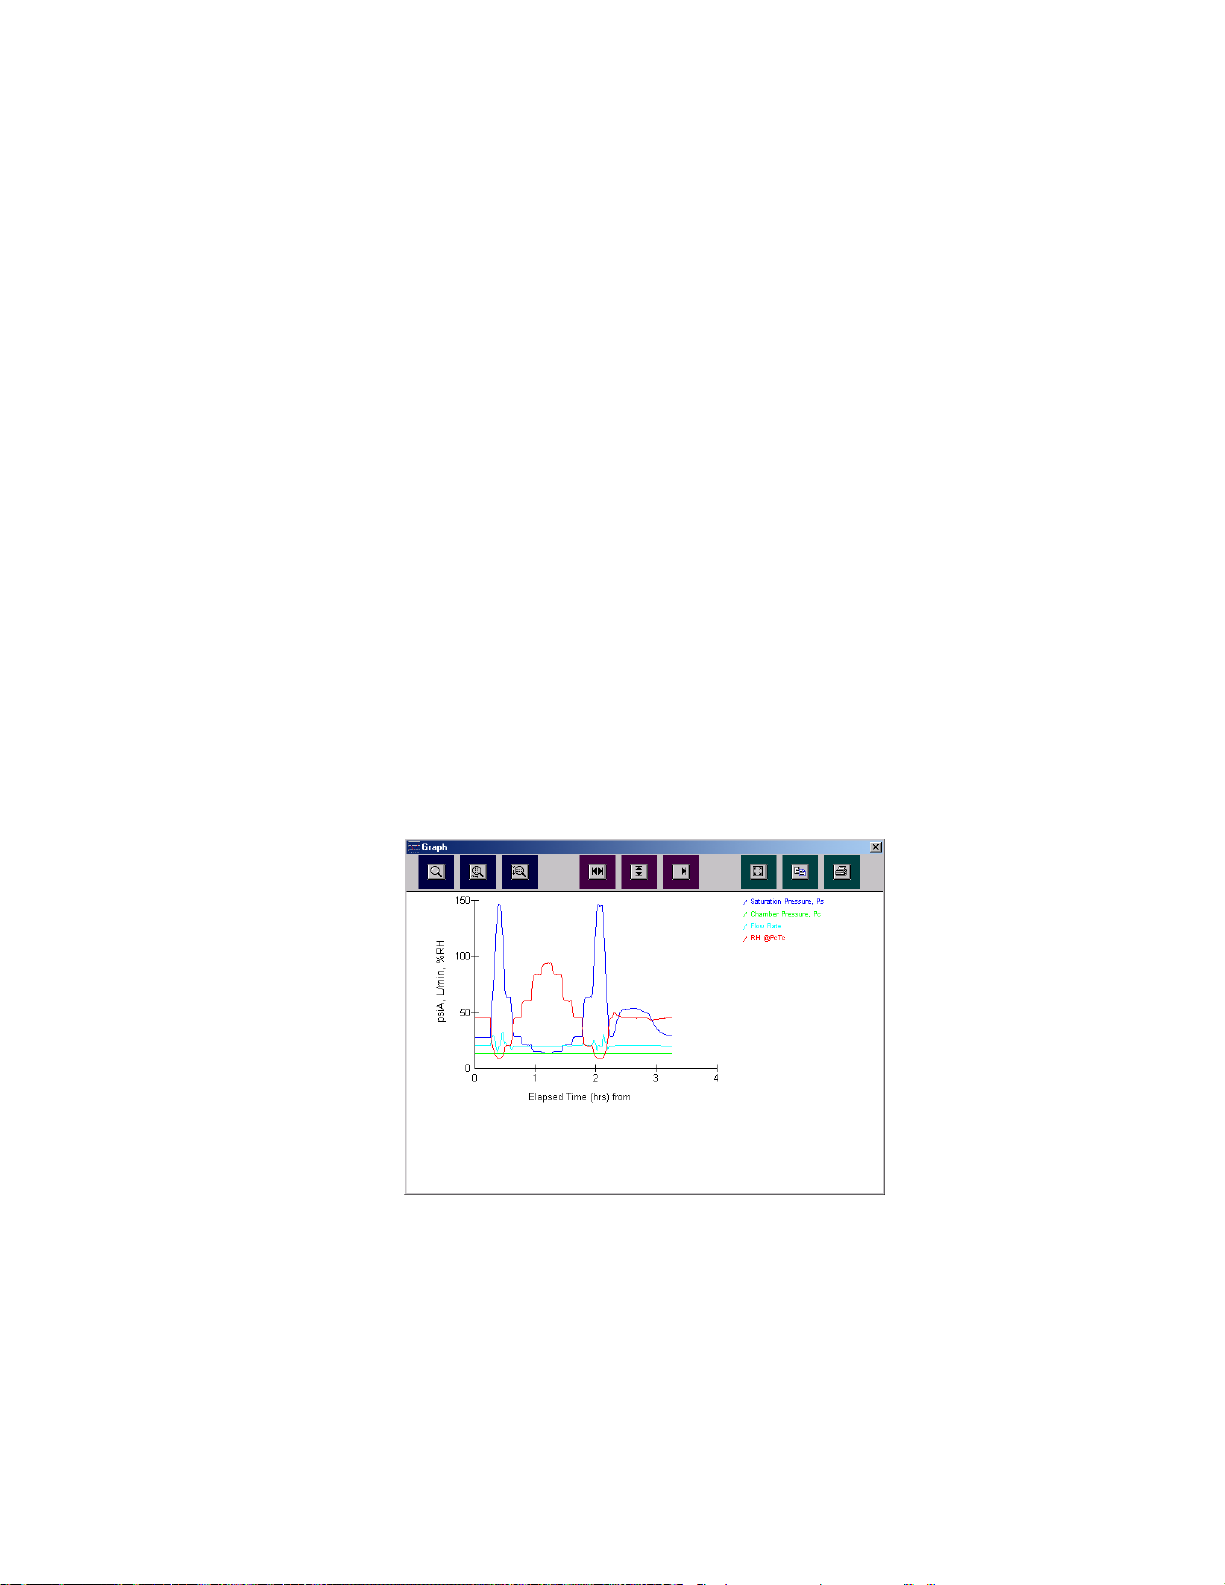
% by Volume Percent by Volume is calculated from saturation temperature Ts, saturation
pressure Ps and test chamber pressure Pc. Percent by Volume is a ratio
(expressed as a percentage) of the partial pressure of the water vapor to the
total pressure of the sample. Percent by Volume is independent of test chamber
temperature.
% by Weight Percent by Weight is calculated from saturation temperature Ts, saturation
pressure Ps and test chamber pressure Pc. Percent by Weight is a ratio
(expressed as a percentage) of the weight of the water vapor to the total weight
of the sample. Percent by Weight is independent of test chamber temperature.
Vapor Mole Fraction Vapor Mole Fraction is calculated from saturation temperature Ts, saturation
pressure Ps and test chamber pressure Pc. Vapor Mole Fraction is the mole
fraction of water vapor in a sample.
Dry Air Mole Fraction Dry Air Mole Fraction is calculated from saturation temperature Ts, saturation
pressure Ps and test chamber pressure Pc. Dry Air Mole Fraction is the mole
fraction of the dry air portion of a sample. The dry air portion is considered to be
all constituents in a gas exclusive of the water vapor.
3.2.3 Graph
The Graph window is a powerful tool used to view previously generated data or to monitor the current
data in real time using the strip chart feature. Use of the graph is fully explained in section 3.10
Graphing.
3-9
Page 51
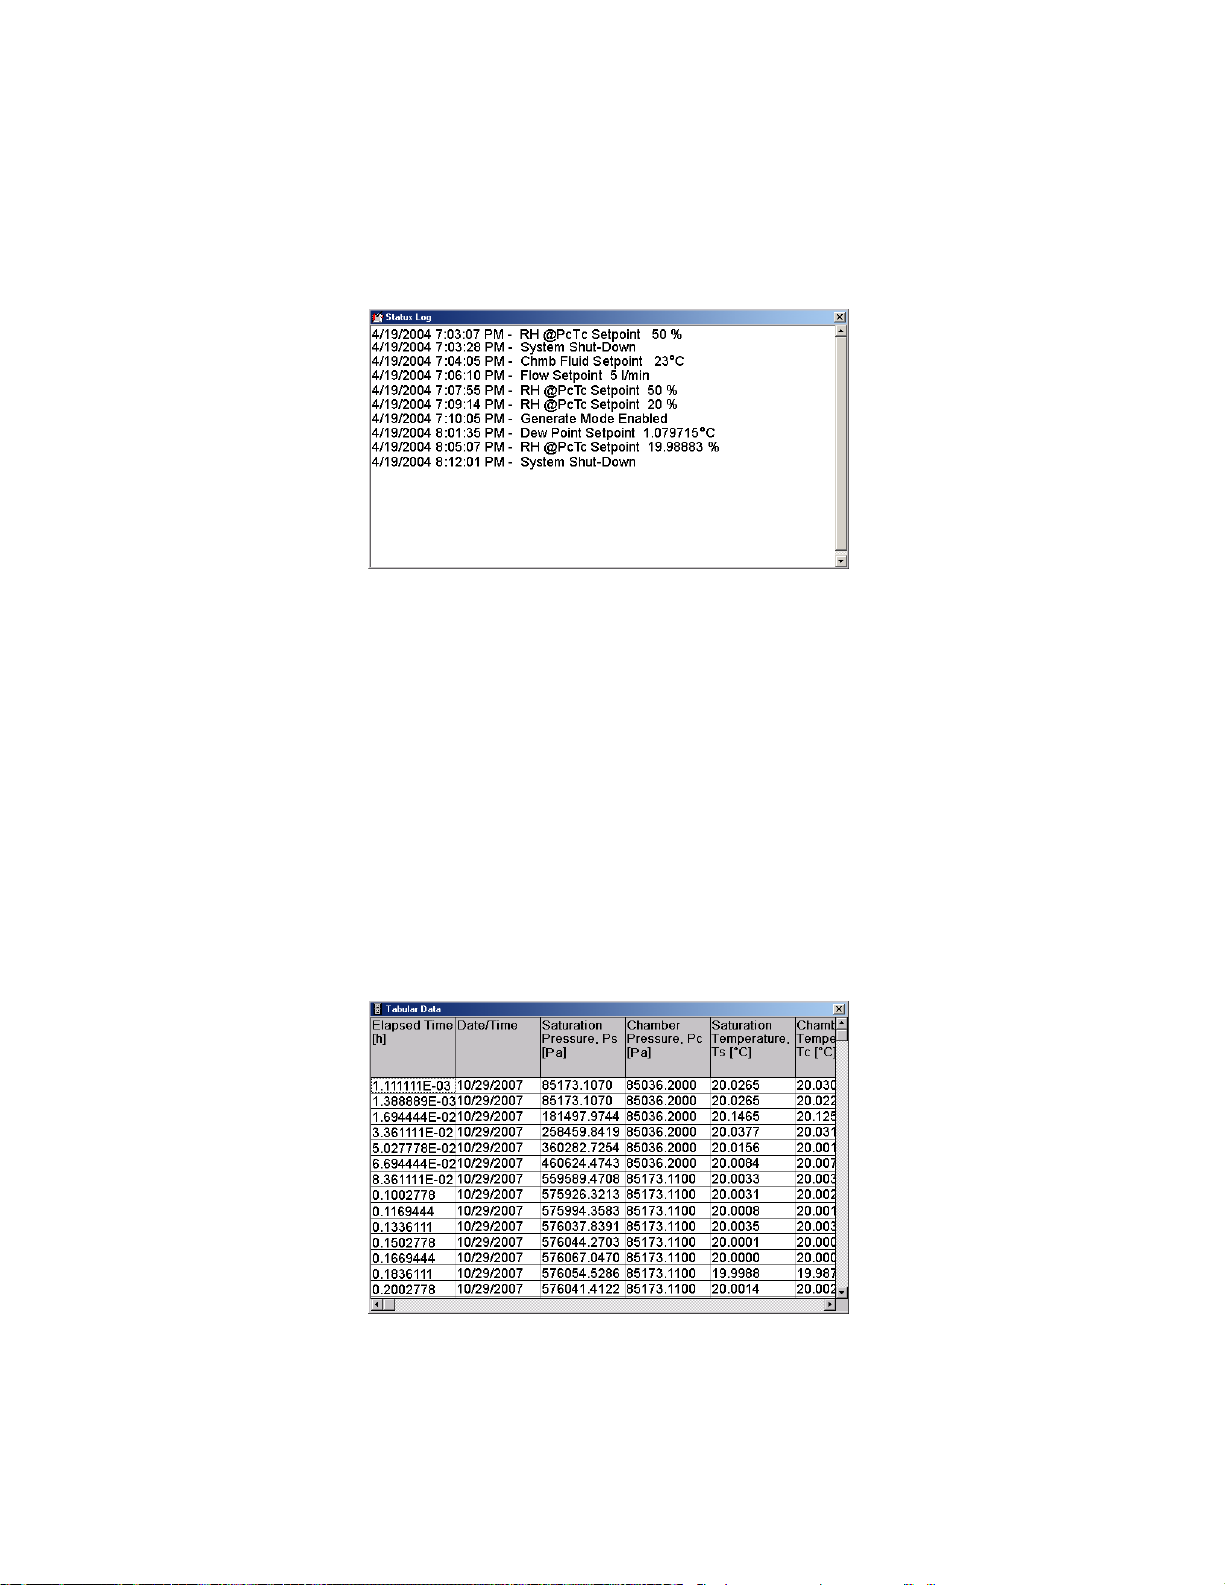
3.2.4 Status Log
The Status Log contains information about the system status, logging start times of operational modes,
setpoint changes, and runtime errors due to communication or mechanical difficulties the generator
encounters.
To print the contents of the status log, select Print Status Log from the File drop-down menu.
Should the status log become very large, the entire log may be cleared by selecting Clear Status Log
from the File drop-down menu.
3.2.5 Tabular Data
The Tabular Data window contains a spreadsheet type view of actual system data including both system
control parameters (Saturation Temperature, Saturation Pressure, Flow, etc.) and calculated humidity
parameters (%RH, Frost Point, Dew Point, etc.) Tabular data is always stored in the system units
selected. If the units are changed while in Generate mode the user is prompted to save the data and a
new tabular data file is started. This is to maintain the consistency of units within the tabular data file. For
a further discussion of the Tabular Data information, refer to section 3.8 Data Storage & Retrieval.
3-10
Page 52
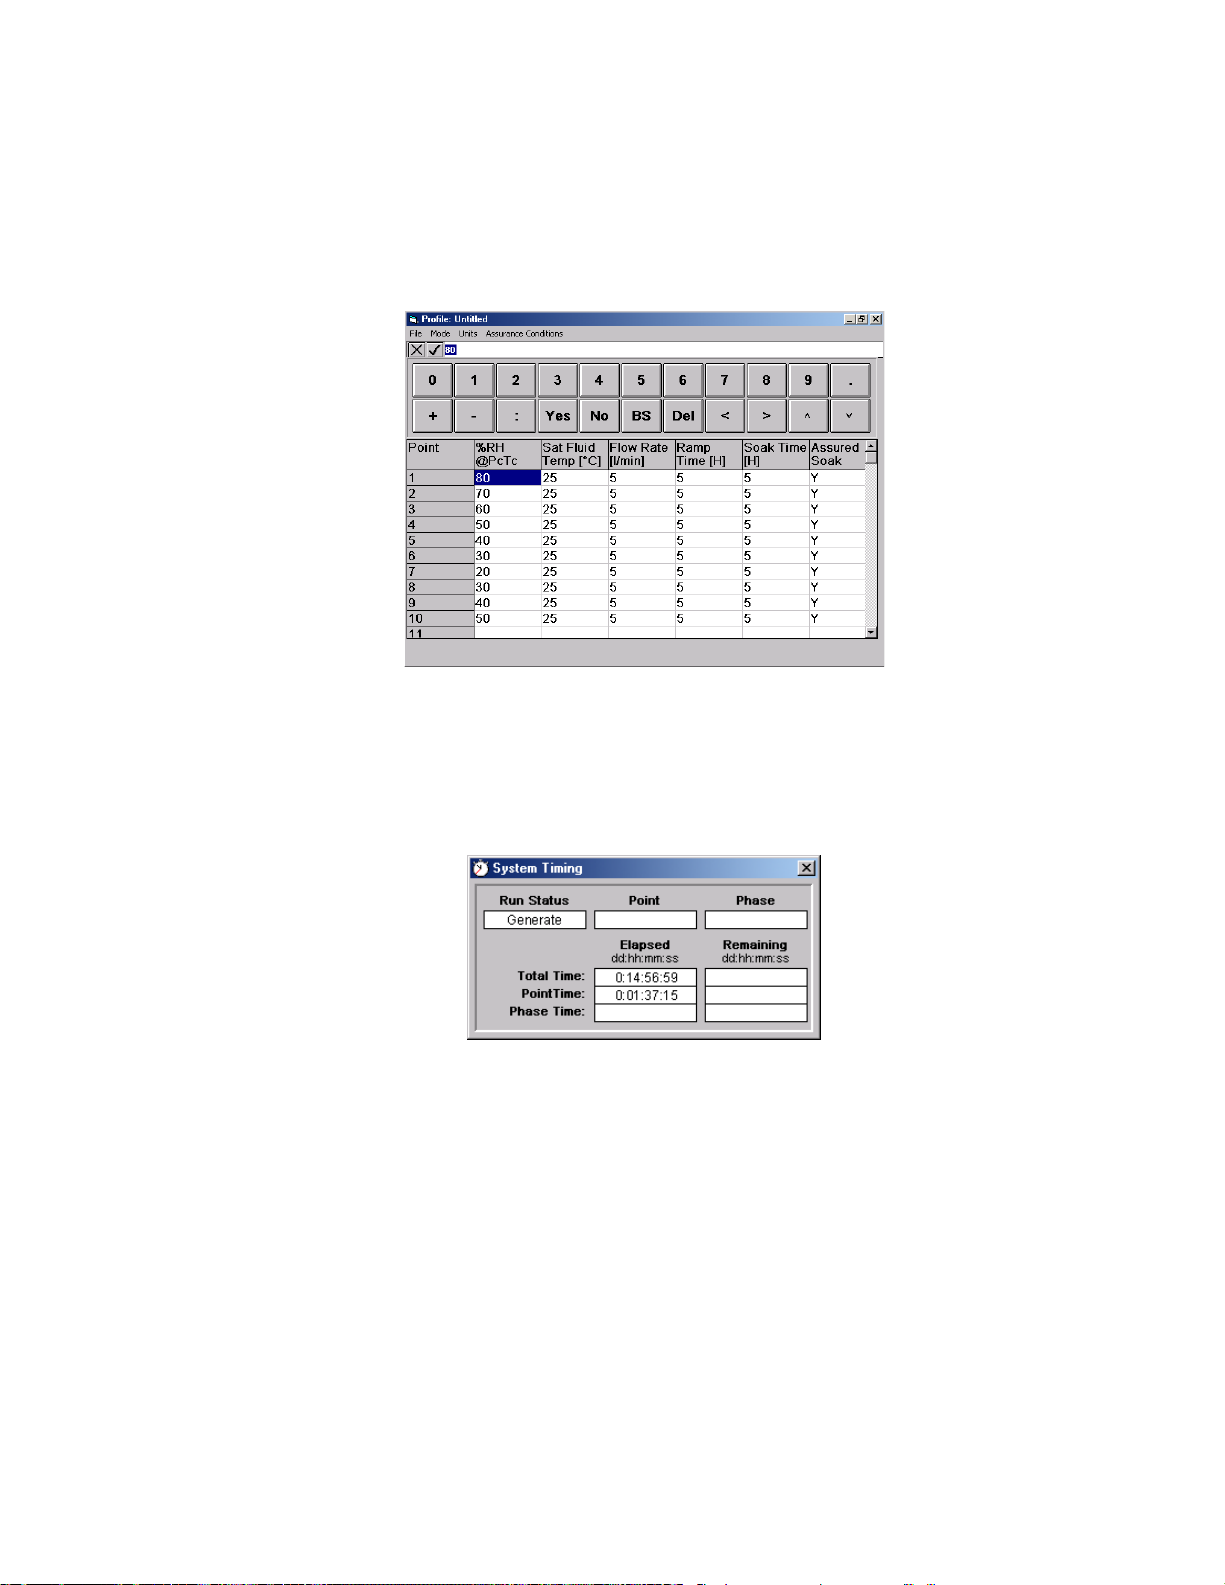
3.2.6 Profile
A Profile is a list of humidity, temperature, flow, and time parameters that are used during Automated
Control of the 1200 Generator. The Profile essentially programs the computer/controller operations. The
profile form stores this information.
3.2.7 System Timing
The System Timing window shows information about the current operating mode (Generate or Auto) and
the timing associated with it, such as, the amount of run time elapsed at the current humidity conditions.
This window may be viewed at any time by selecting System Timing from the Window drop-down menu.
3.2.8 Calibration Coefficients
Calibration Coefficients for each of the temperature, pressure, and flow transducers may be viewed in the
Calibration Coefficients window. The Calibration Coefficients window, along with windows for
Temperature Calibration, Pressure Calibration, and Flow Calibration are discussed in detail in section 4.2
Calibration.
3-11
Page 53
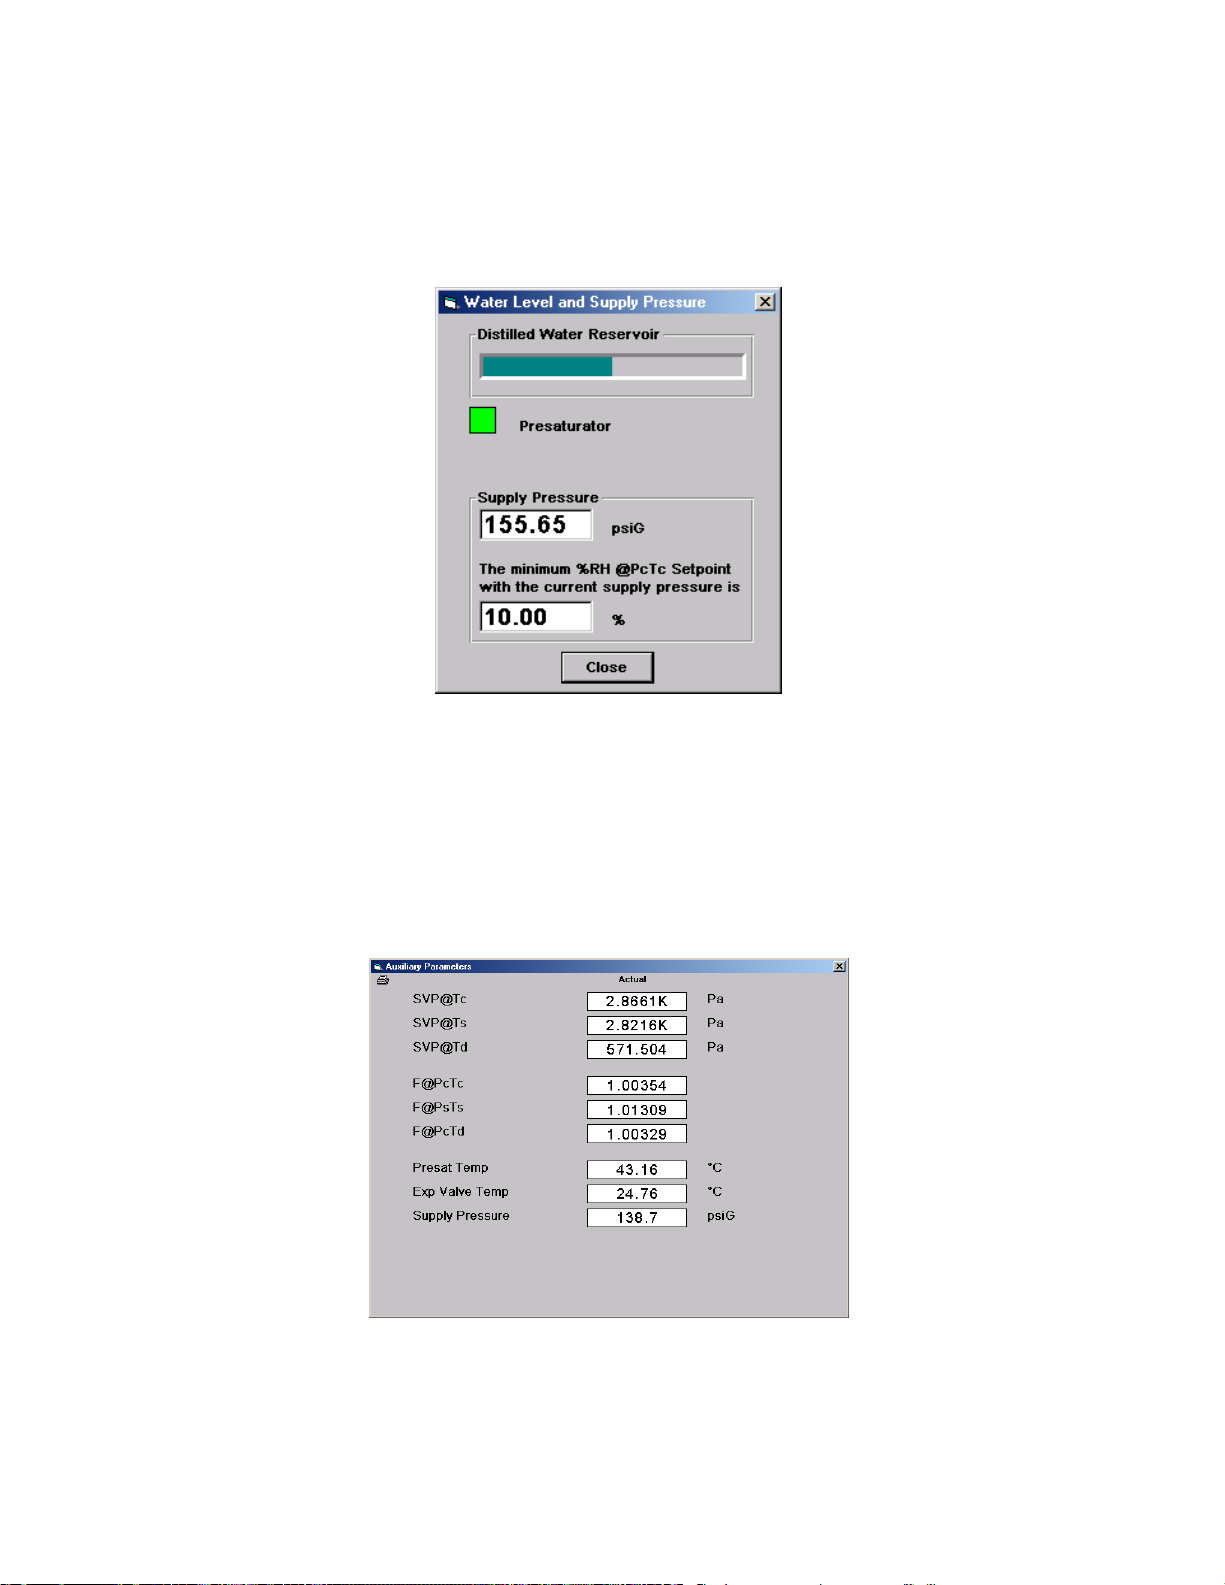
3.2.9 Water Level and Supply Pressure
The Water Level and Supply Pressure window is used to monitor the water levels in the reservoir and
presaturator vessels, as well as indicate available supply pressure. For a further discussion of this
window, refer to section 3.12 Water Level and Supply Pressure.
3.2.10 Auxiliary Parameters
The Auxiliary Parameters window contains values of vapor pressure and enhancement factors calculated
from current system temperatures and pressures. Also displayed are current values for presaturator
temperature, expansion valve temperature, and supply pressure. A check mark in front of any item
indicates that the item will be included in printed data. This window may be shown at any time by
selecting Auxiliary Parameters from the Window drop-down menu.
SVP@Tc Saturation Vapor Pressure calculated at test chamber temperature, e(Tc), is the
maximum allowable vapor pressure in a sample of gas at that temperature. For
Tc ≥ 0.01 °C, vapor pressure is computed with respect to water. For Tc < 0.01
°C, vapor pressure is computed with respect to ice.
3-12
Page 54
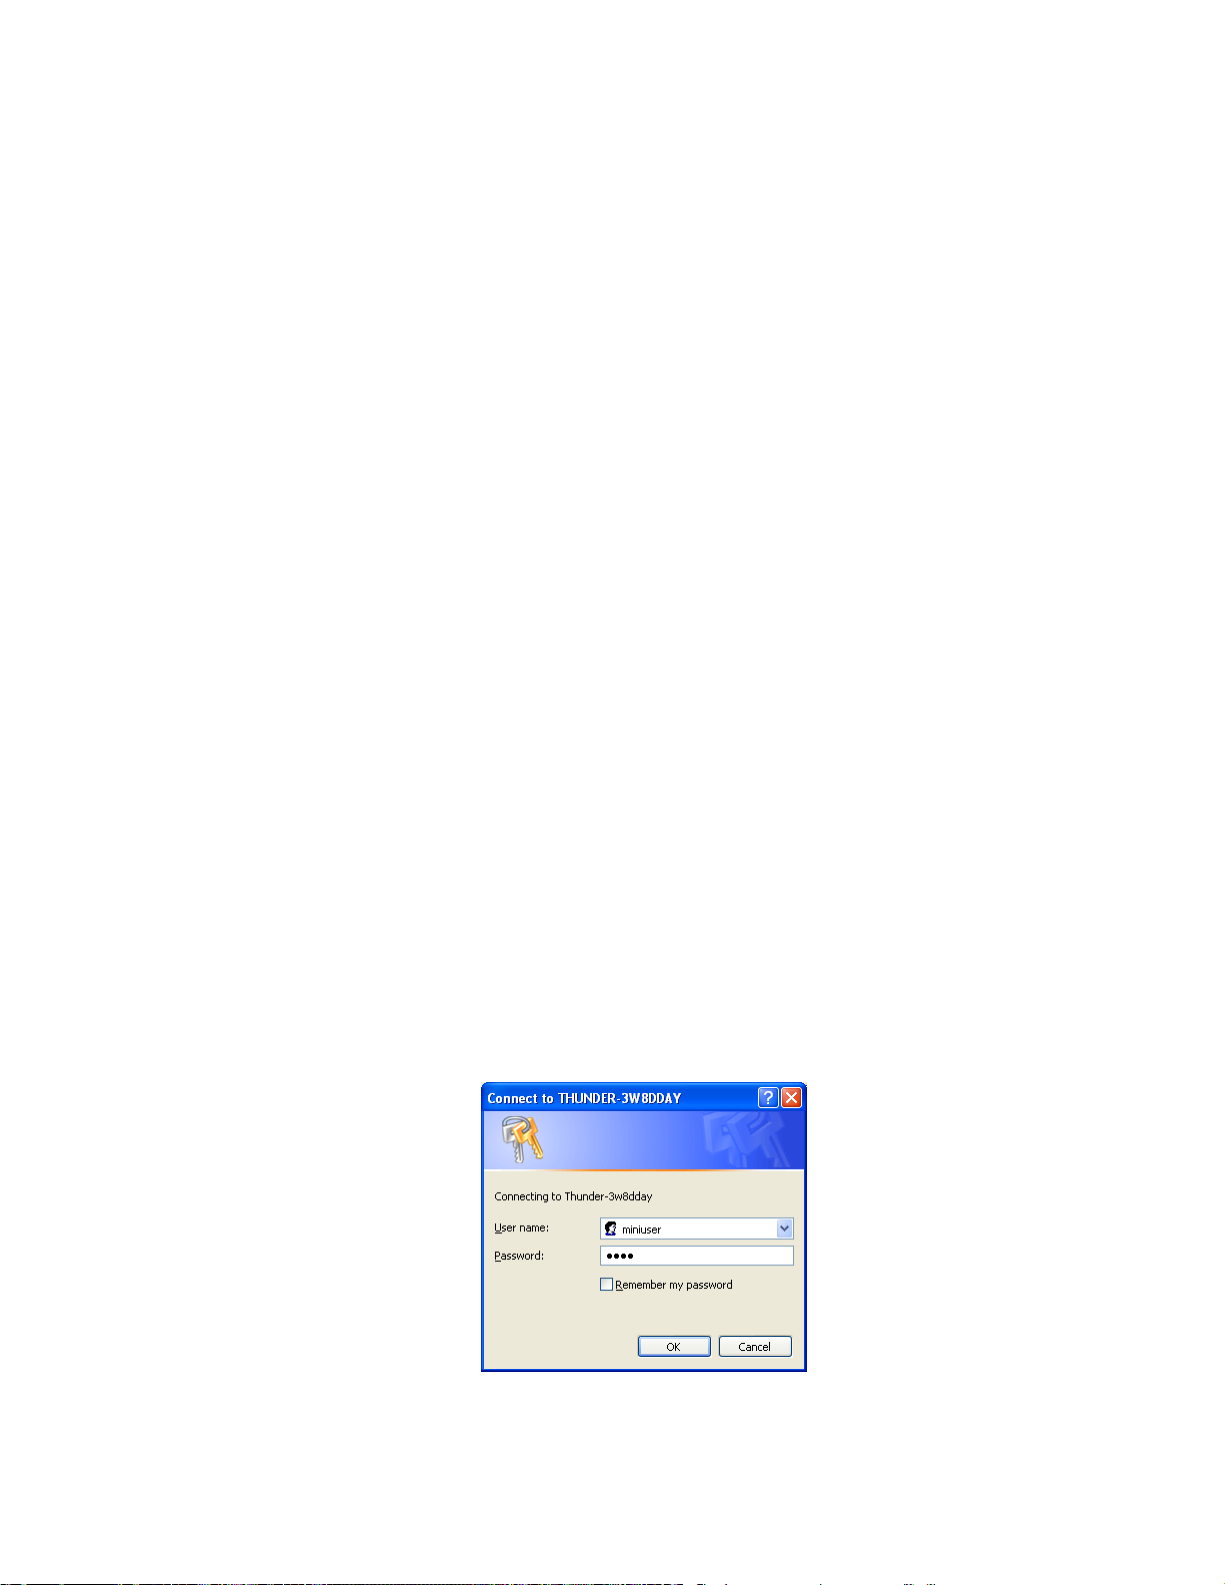
SVP@Ts Saturation Vapor Pressure calculated at saturation temperature, e(Ts), is the
maximum allowable vapor pressure in a sample of gas at the saturation
temperature. For Ts ≥ 0.01 °C, e(Ts) is computed with respect to water. For Ts
< 0.01 °C, e(Ts) is computed with respect to ice.
SVP@Td Saturation Vapor Pressure calculated at dew point temperature, ew(Td), with
respect to water, is commonly referred to as the dew point vapor pressure. For
Td<0.01 °C, this vapor pressure may also be computed at the frost point
temperature Tf, with respect to ice. While ew(Td) is vapor pressure with respect
to water at the dew point temperature, and ei(Tf) is vapor pressure with respect
to ice at frost point temperature, then for Td < 0.01 °C, ew(Td)=ei(Tf) even
though Td≠Tf.
F@PcTc Enhancement Factor is calculated at test chamber pressure Pc and test
chamber temperature Tc.
F@PsTs Enhancement Factor is calculated at saturation pressure Ps and saturation
temperature Ts.
F@PcTd Enhancement Factor is calculated at test chamber pressure Pc and dew point
temperature Td.
Presat Temp Temperature of the water in the presaturator.
Exp Valve Temp Temperature of the gas after expansion as it exits the expansion valve.
Supply Pressure Indicated pressure after internal pressure regulation.
3.2.11 Remote Desktop Control
An Ethernet connection is required for file sharing.
The 1200 supports file sharing via a network to aid in data file transfer. By default the 1200 will be a
member of the 1200 workgroup once connected to a network. To access the 1200 file sharing, browse
your network from the any client Windows XP computer and locate the desired 1200 within the 1200
workgroup. To gain access to file sharing use the user name of “miniuser” with a password of “1200”.
3-13
Page 55
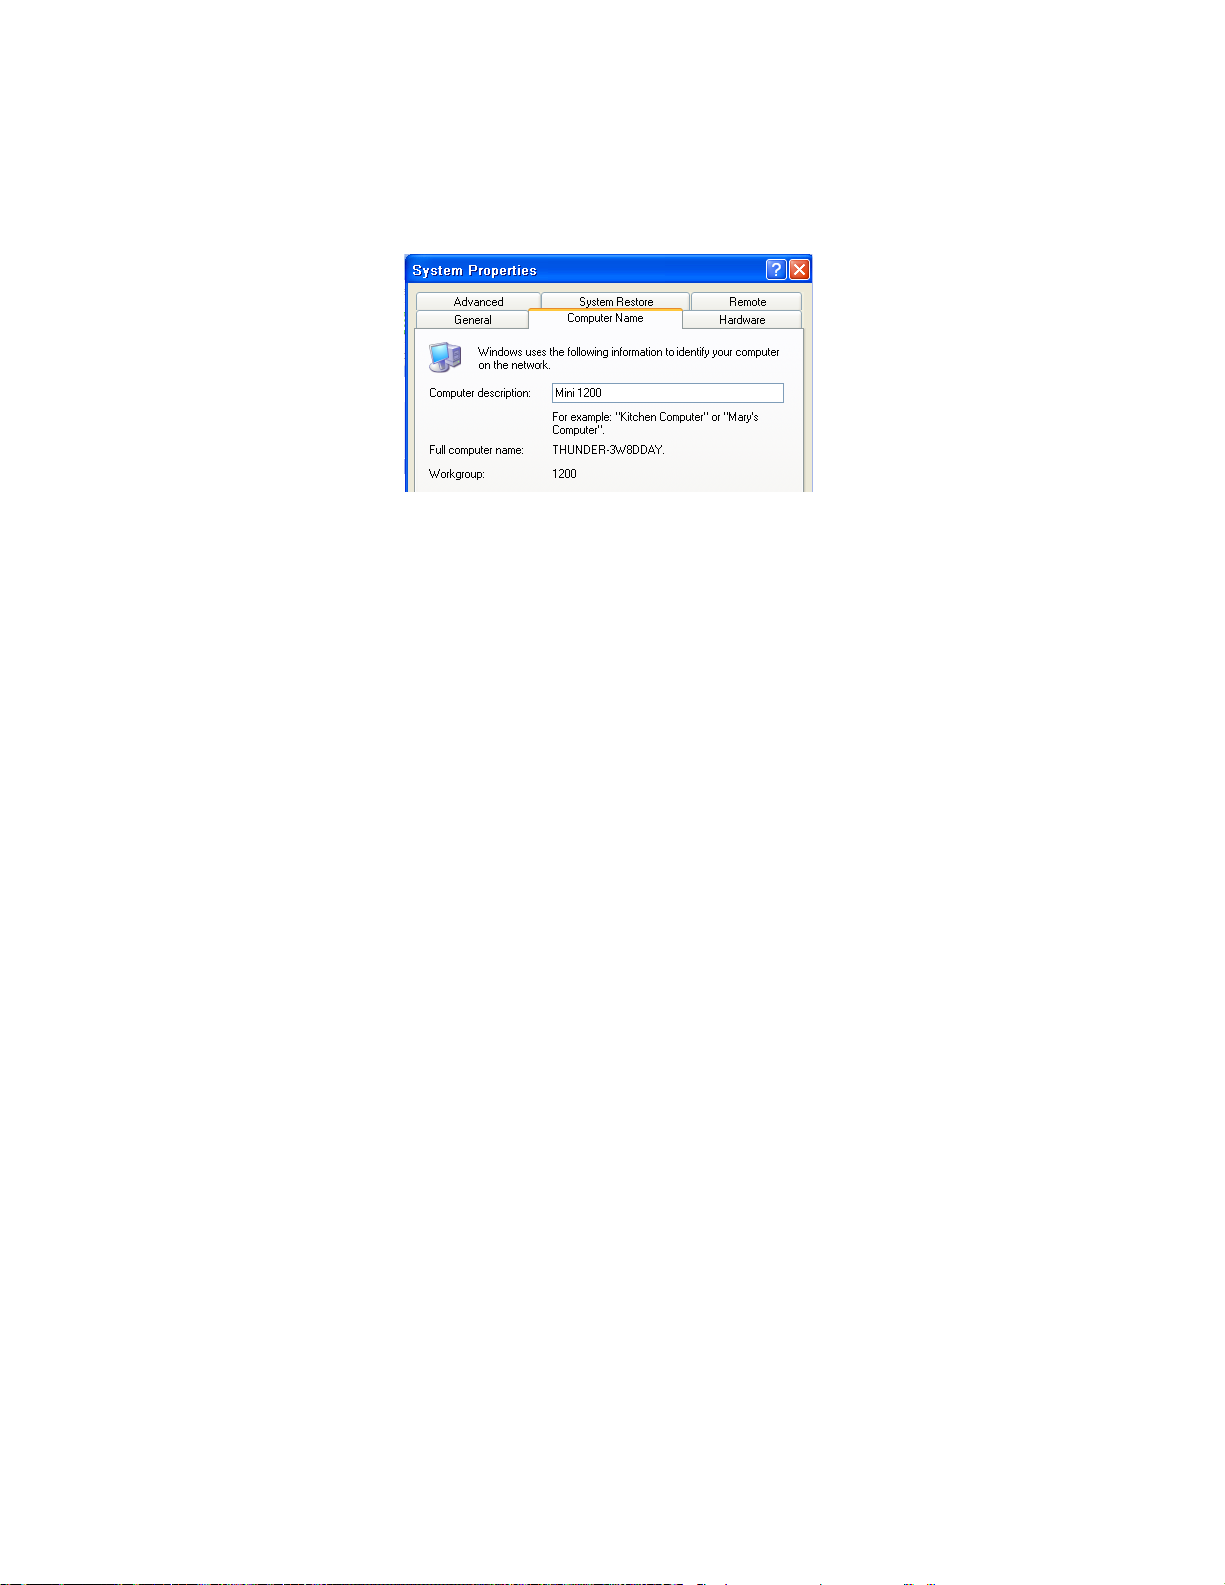
All 1200s will have a full computer name in the format of “Thunder-xxxxxxx”. Where xxxxxxx represents
a unique set of alphanumeric characters. To determine the full computer name of a particular 1200 select
> Start > Control Panel > Performance and Maintenance > System and select the “Computer Name” tab
on the 1200.
3-14
Page 56

3.3 GENERATING
The Generate Mode is used to generate gas of a desired humidity. In the generate mode, the gas flows
through the presaturator, through the saturator at saturation temperature and pressure, and then to the
test chamber and the devices under test at the test chamber temperature and pressure.
3.3.1 Initiating Generate
To operate the system in the Generate Mode:
1) Ensure chamber door is closed and latched.
2) Select Generate from the Run drop-down menu. When Generate is selected, the elapsed time
counter (System Timing) resets and the humidity generation process begins. The 1200 will
generate the values indicated in the setpoint column. The Generate menu item will now be
checked indicating the generate process is active.
3) Change setpoints to desired values.
4) After operating in the Generate mode for a sufficient time, the system should be at the desired
humidity. Check all instrumentation for stability and record a data point.
5) Adjust the humidity to the next desired setpoint. Ample time should be allowed for the system
and instrumentation being calibrated to stabilize and equilibrate to the new value.
3.3.2 What Happens in Generate
When the system is placed into Generate mode, gas flows from the gas supply and flow control valve,
through the presaturator, through the saturator, through the expansion valve and then to the test
chamber. It then flows through the test chamber to the gas exhaust outlet.
The temperature of the fluid medium surrounding the chamber is controlled at the Saturation Temp
setpoint. Since this fluid medium is common to the chamber and saturator, both the chamber and
saturation temperatures converge toward this value.
3.3.3 Special Considerations in Generate
To prevent condensation on a cold device under test when transitioning upward in temperature, lower the
humidity setpoint prior to changing the Saturation Temp setpoint. Since it is not always easy to
remember which temperature direction causes this problem, the general rule of thumb is to make
temperature transitions at low humidities only (below 20 %RH).
Since the generated Relative Humidity is relative to the measurement of the test chamber temperature,
place the chamber temperature probe as close as possible to the humidity sensing element of the device
under test.
Heat loads in the chamber will cause temperature gradients resulting in humidity gradients within the
chamber. Keep heat loads to a minimum if possible.
Generate may be initiated regardless of the current operating mode. In other words the system may be
freely switched to generate mode from either Auto Profile or Shutdown.
3-15
Page 57
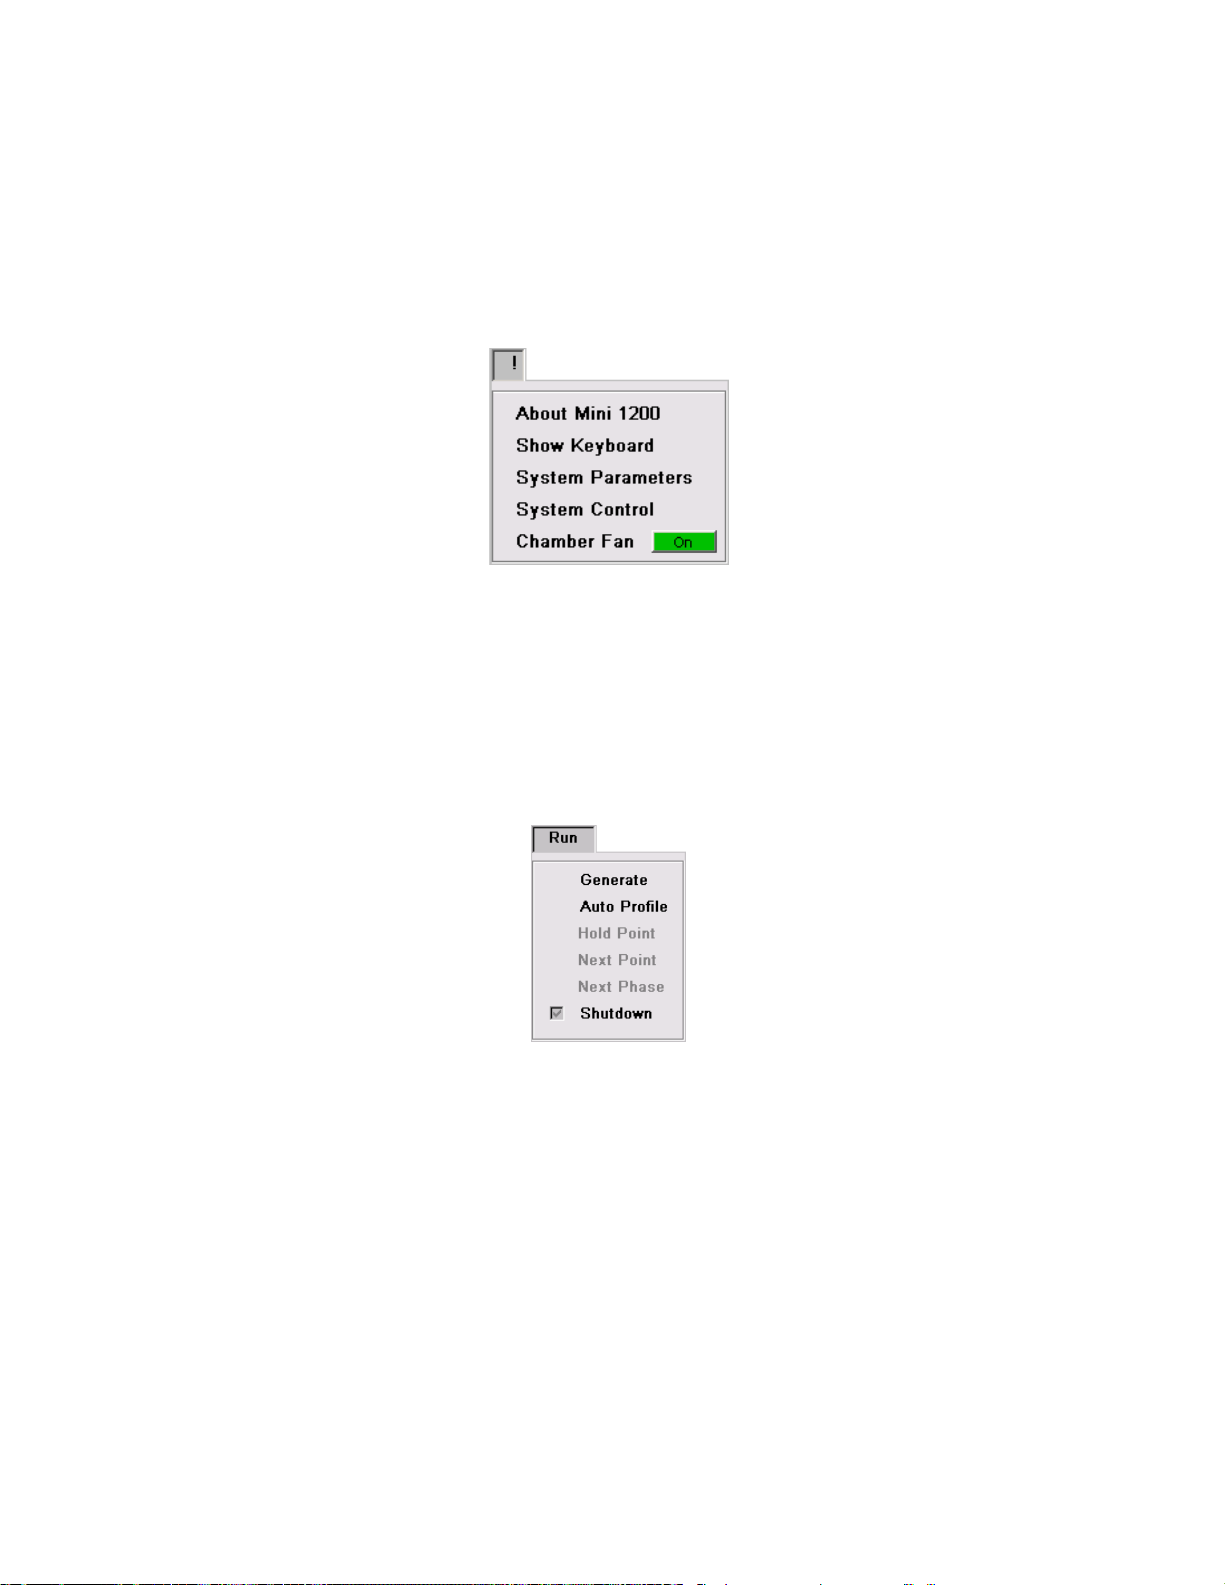
3.3.4 Chamber Fan
The Chamber Fan is an optional item, which provides a uniform distribution of air within the 1200’s
chamber. The Chamber Fan option is generally used when a circulated distribution of air above ambient
temperature is desired. The chamber will experience a slight rise in temperature when the Chamber Fan
is in use and should be considered when performing particular tests. By default the Chamber Fan is set
to “OFF”. To turn the Chamber Fan “ON”, select the menu option “!” And select the Chamber Fan menu
item.
3.4 SHUTDOWN
The Shutdown mode is used to stop the system and place it in a depressurized and idle state.
3.4.1 Initiating a Shutdown
To shut the system down select Shutdown from the Run drop-down menu.
3.4.2 What Happens during Shutdown
A Shutdown causes all gas flow to stop, saturation pressure vents to ambient, and all other controls to
stop. Following the shutdown sequence a prompt is displayed which allows saving of data if desired.
If the Shutdown was caused by a system malfunction, or the system discovered a malfunction during
shutdown, then an entry is made to the Status Log indicating the nature of the error.
3.4.3 Special Considerations during Shutdown
A Shutdown, if followed later by a Generate or Auto Profile causes all system data to be reinitialized.
Prior to reinitialization, an opportunity is provided via prompt to save any unsaved data. If the data was
saved upon Shutdown, then no additional prompt is required and the data is automatically reinitialized.
3-16
Page 58
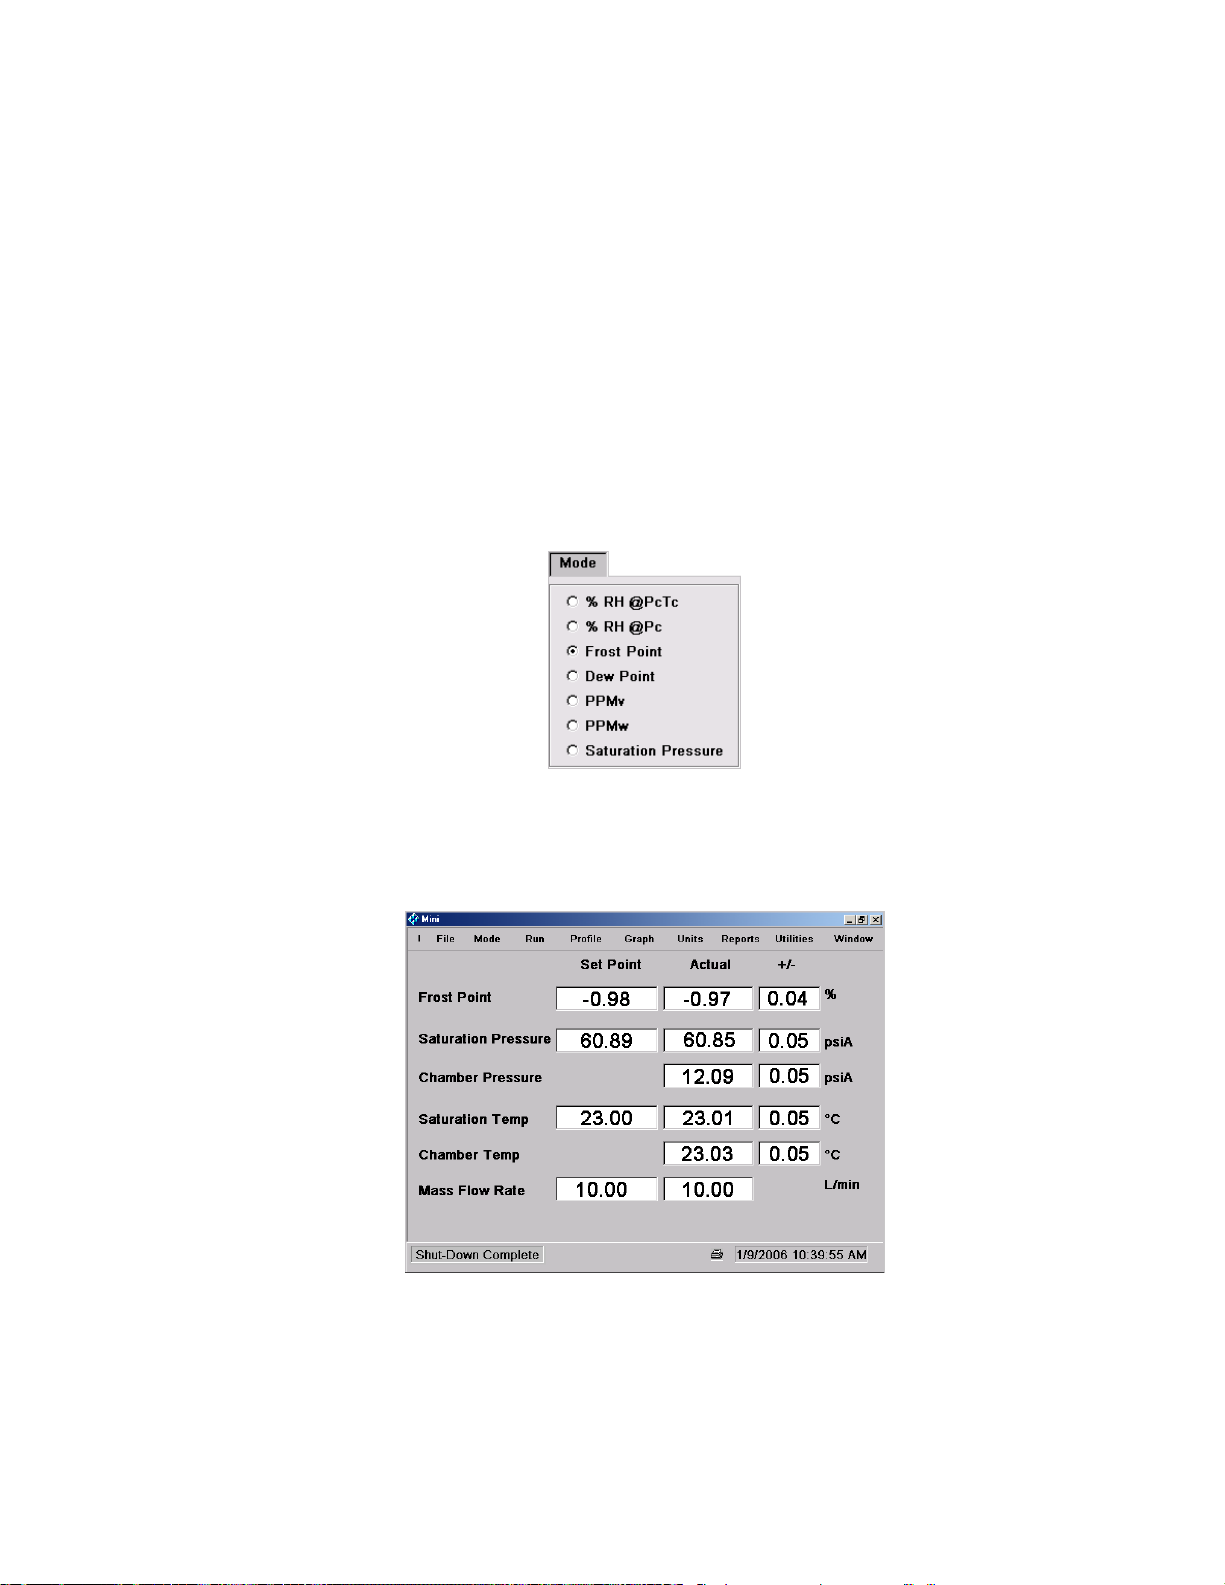
3.5 HUMIDITY CONTROL MODES
The generator may be operated in one of several possible Humidity Control modes:
1. %RH@PcTc
2. %RH@Pc
3. Frost Point
4. Dew Point
5. PPMv
6. PPMw
7. Saturation Pressure
3.5.1 Changing the Humidity Control Mode
To select a new Humidity Control Mode, choose the desired mode from the Mode drop-down menu.
The Control Parameters window changes to reflect the new Humidity Control mode selected, and the
setpoint value is changed to the equivalent of the previous humidity setpoint.
3.5.2 %RH @PcTc Control Mode
This control mode is the one most often used and is the power-up default mode of the generator.
%RH@PcTc is controlled at a constant value by varying saturation pressure Ps to compensate for any
changes in saturation temperature Ts, test chamber temperature Tc, or test chamber pressure Pc. While
%RH@PcTc is held constant, all other humidity parameters may vary.
3-17
Page 59

3.5.3 %RH @Pc Control Mode
%RH @Pc is controlled at a constant value by varying saturation pressure Ps to compensate for any
changes in test chamber pressure Pc. While %RH @Pc is held constant other humidity parameters may
vary.
3.5.4 Frost Point Control Mode
Frost point is controlled at a constant value by varying the saturation pressure Ps to compensate for
changes in either saturation temperature Ts, or test chamber pressure Pc. While frost point is held
constant other humidity parameters may vary. Frost point is independent of test chamber temperature.
3.5.5 Dew Point Control Mode
Dew point is controlled at a constant value by varying saturation pressure Ps to compensate for any
changes in either saturation temperature Ts, or test chamber pressure Pc. While dew point is held
constant, other humidity parameters may vary. Dew point control mode is valid both above and below
0°C. Dew point is independent of test temperature.
3.5.6 PPMv Control Mode
PPMv is controlled at a constant value by varying saturation pressure Ps to compensate for any changes
in saturation temperature Ts. While PPMv is held constant other humidity parameters may vary. PPMv
is independent of test chamber pressure and temperature.
3.5.7 PPMw Control Mode
PPMw is controlled at a constant value by varying saturation pressure Ps, to compensate for any
changes in saturation temperature Ts. While PPMw is held constant other humidity parameters may
vary. PPMw is independent of test chamber pressure and temperature.
3.5.8 Saturation Pressure Control Mode
Saturation Pressure Ps, is controlled at a constant value independent of any other pressure, temperature,
or humidity value. While saturation pressure is held constant some humidity parameters may vary.
3-18
Page 60
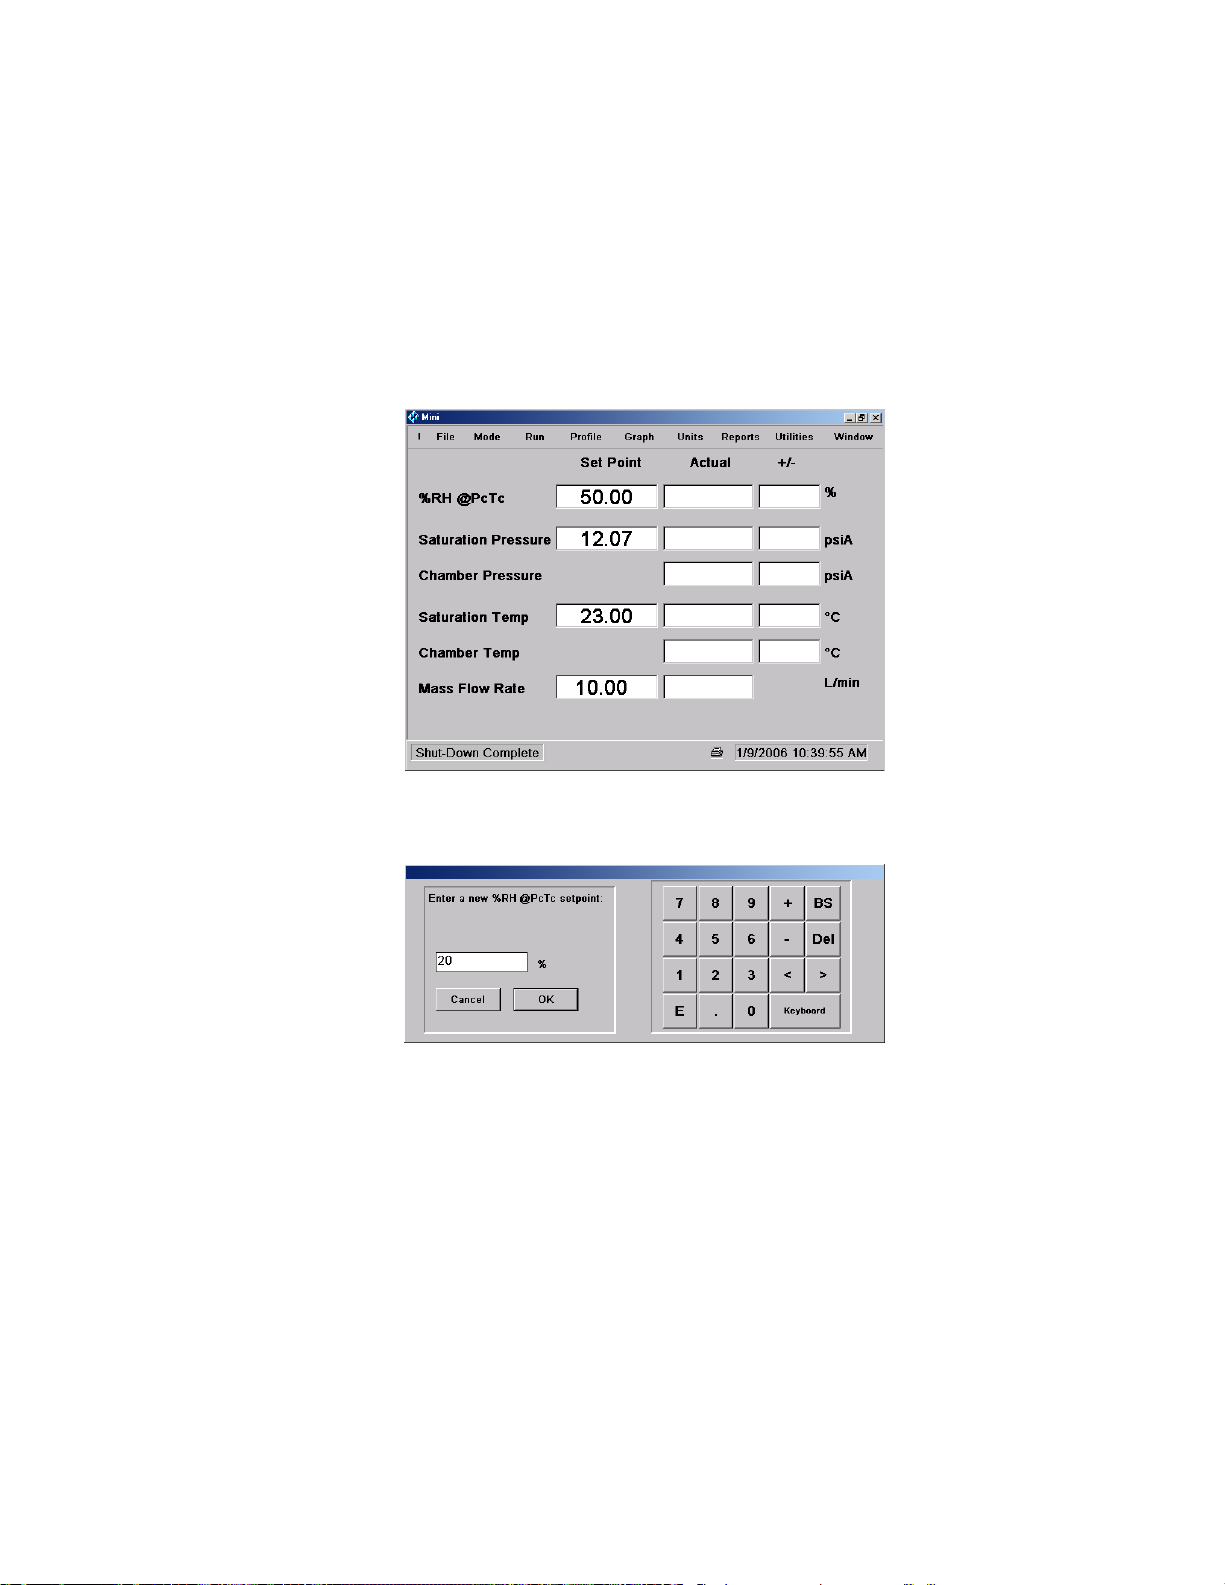
3.6 SETPOINTS
Setpoints, which may be changed, are listed in the Set Pt column of the Main Screen window. Editable
setpoints in addition to the top listed humidity parameter include Saturation Temp and Mass Flow Rate.
Note that Saturation Pressure is only editable when selected as the humidity control mode.
3.6.1 To Change Setpoints
1. Click once on the desired setpoint entry field.
2. A dialog box appears on the screen with the prompt Enter a new %RH@PcTc setpoint:
3. Using the touch-screen keypad or an optional keyboard, enter the desired value in the units
indicated in the dialog box.
4. After entering the new value select OK or Cancel button. Selecting cancel will abort the setpoint
entry procedure.
5. The value you entered should be displayed in the appropriate setpoint entry field.
3.6.2 What Happens When Changing Setpoints
Setpoints within legal limits are accepted. If an entry is invalid due either to mistakes in setpoint entry or
out of range conditions, the computer will retain the original setpoint value.
3-19
Page 61
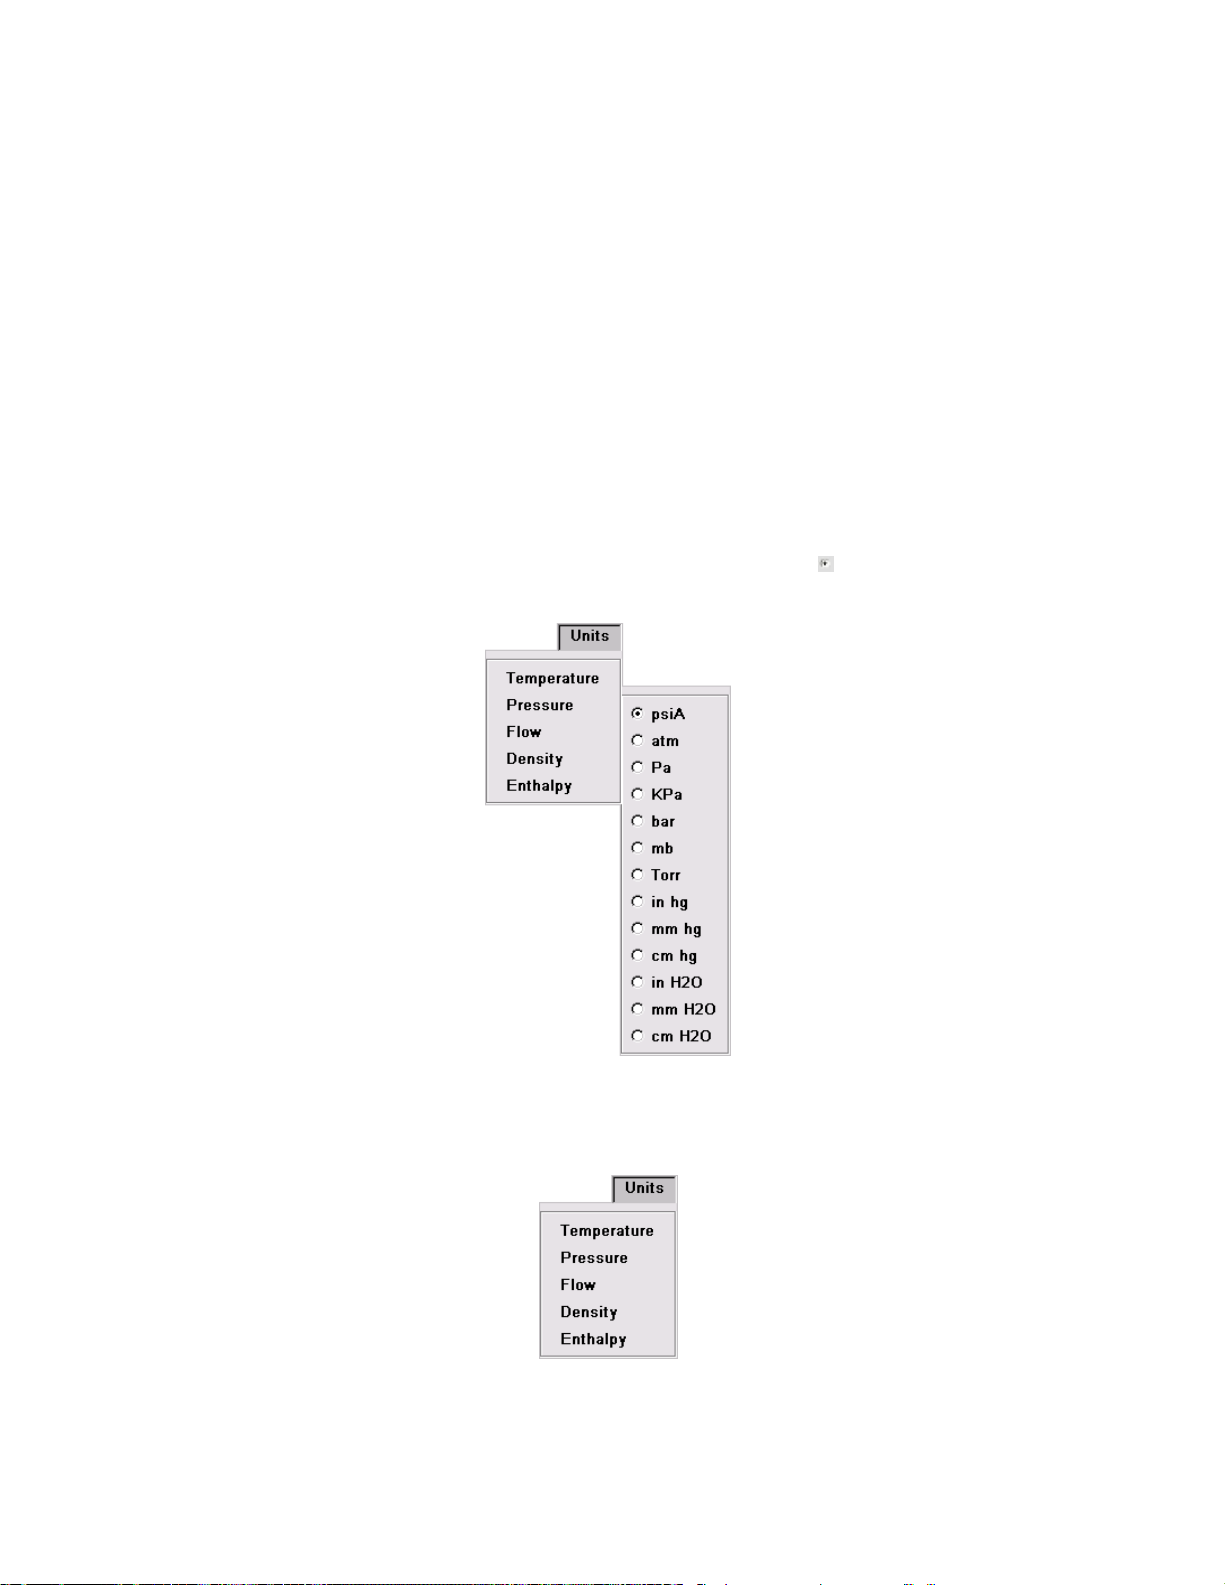
Editing the Saturation Temp setpoint sets the temperature of the fluid medium, which flows around and
through the saturator and around the test chamber. Note that some instruments installed in the test
chamber may generate a heat load and cause a temperature difference between the saturation
temperature and the actual chamber temperature.
3.6.3 Special Considerations When Changing Setpoints
A Saturation Pressure setpoint may only be entered if saturation pressure is the current humidity control
mode. In all other humidity control modes, saturation pressure setpoint is automatically determined by
the computer in order to achieve the desired humidity output.
3.7 UNITS
The Units menu allows the operator to select desired engineering units for display, printing, and graphing
purposes. The current engineering units are indicated with a selection mark
3.7.1 How To Change Units
1. Pull down the Units menu.
3-20
Page 62
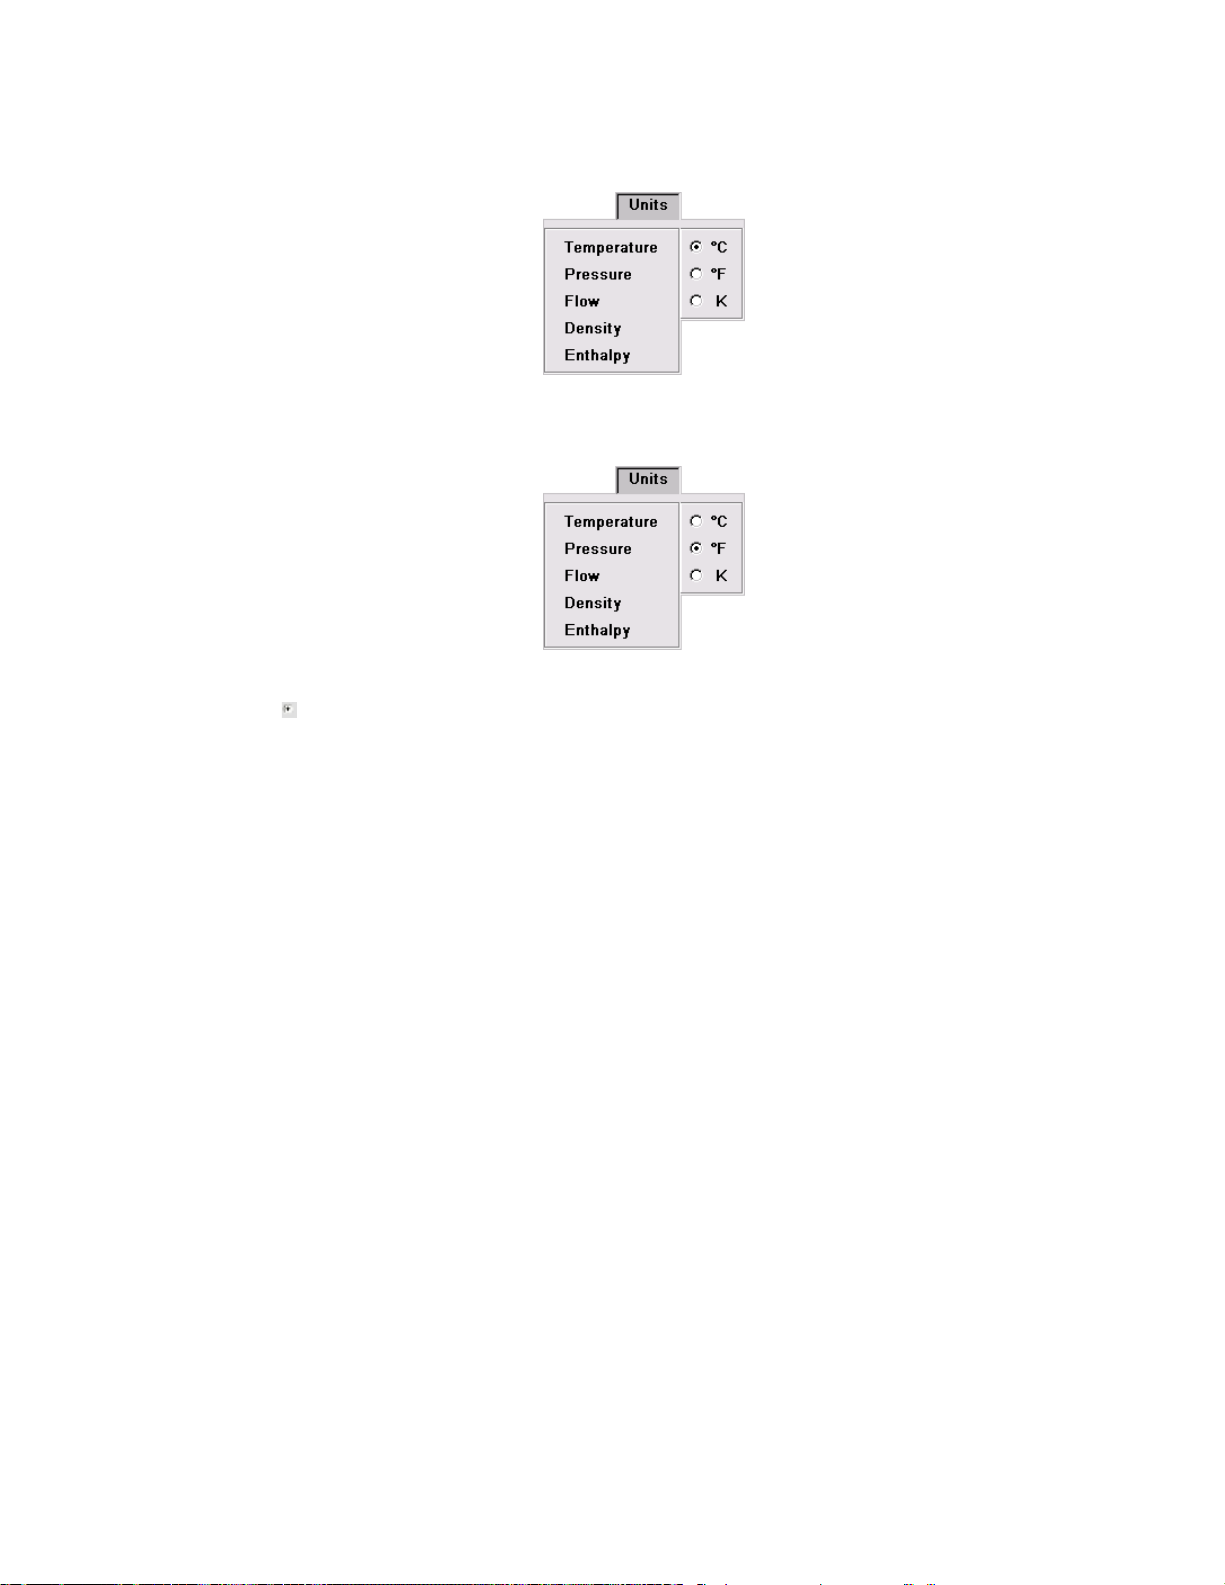
2. Select the units type to change.
3. From the sub menu select the desired units.
4. A
will be placed in front of the currently selected units.
3.7.2 What Happens When Changing Units
1. The units label on the affected control and humidity parameter items update to reflect the new
units selection.
2. All affected data values in the fields of the Main, Calculated Humidity Parameters and Auxiliary
Parameters screens will update within a few seconds to reflect the change.
3. If a selected graph item is affected, changing units will update the y-axis values to reflect the
change.
3.7.3 Special Considerations When Changing Units
Changing units may cause the values that are displayed to become very large or very small. In order to
maintain significant digits, values are displayed in a modified scientific notation form.
6
M = 10
K = 10
m = 10
µ = 10
n = 10
3
-3
-6
-9
This notation is only used for display and printing purposes, not for entry of data, set points or for data
storage. For these cases, standard scientific notation (1.23E3, 1.23E-3, etc.) is used.
3-21
Page 63
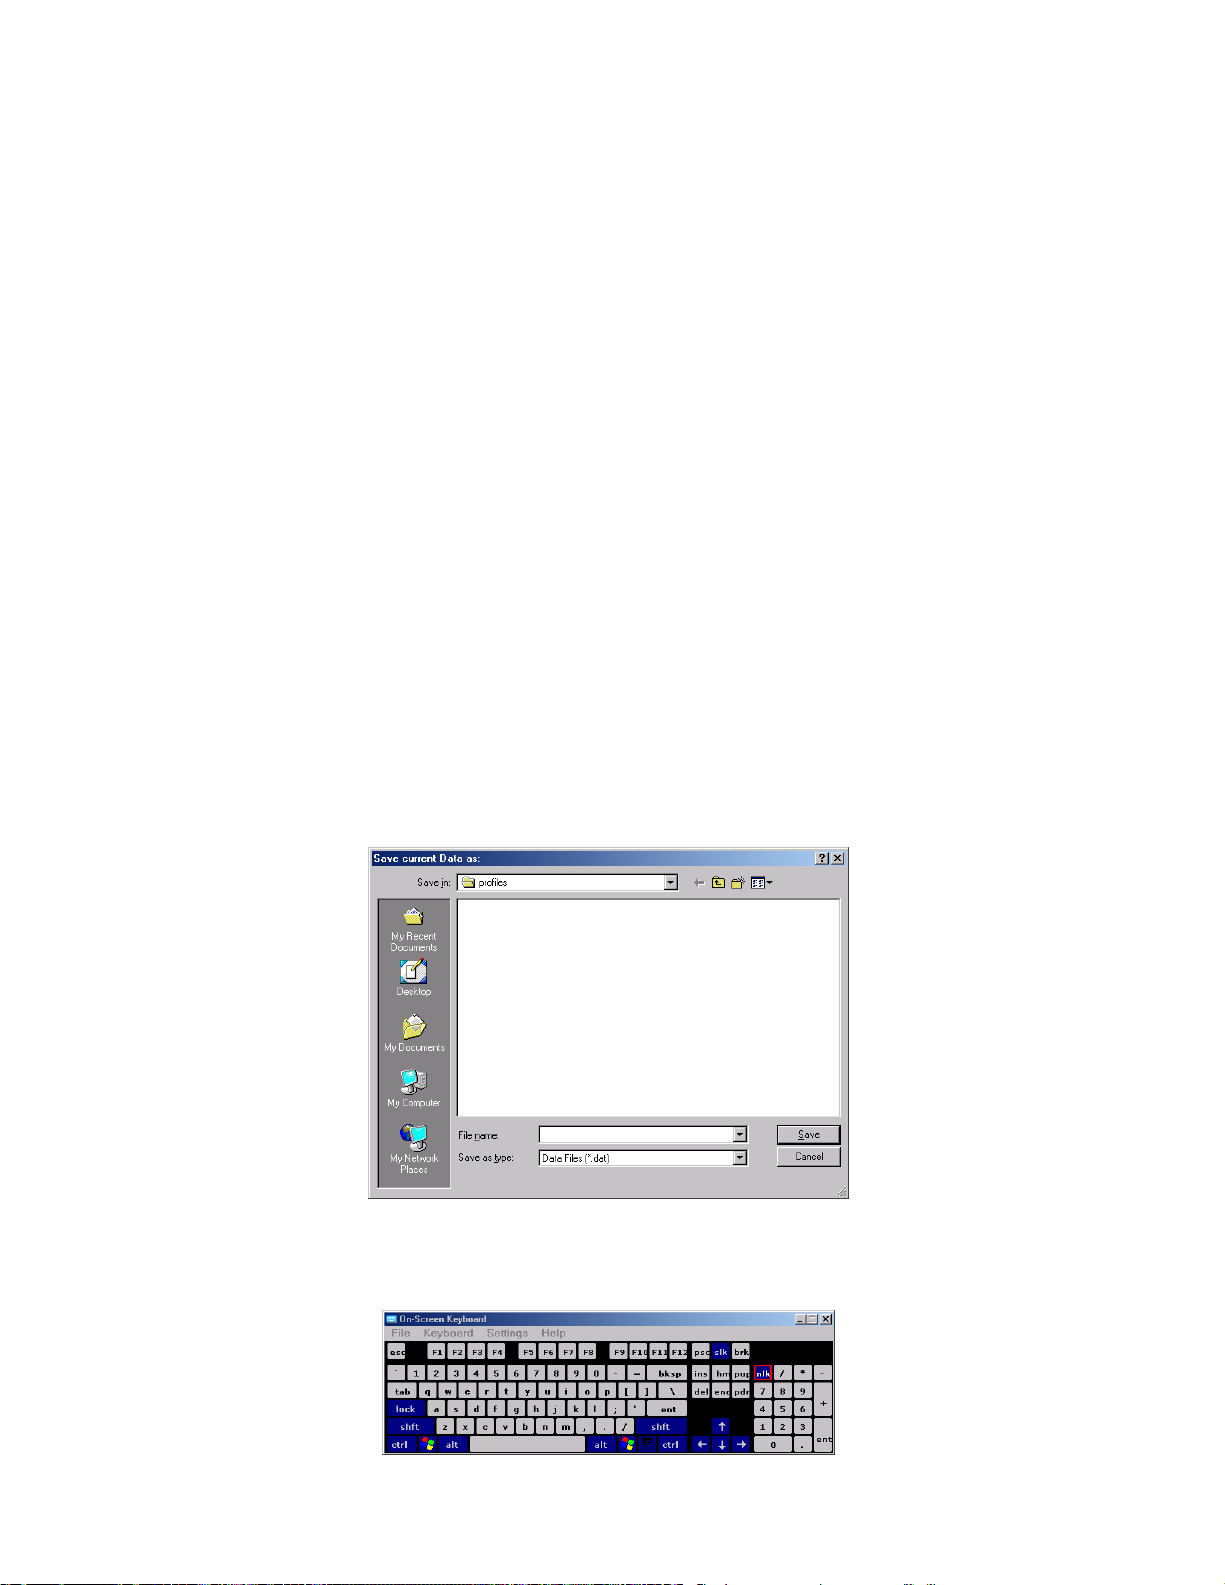
3.8 DATA STORAGE & RETRIEVAL
3.8.1 How the System Stores Data
The system stores system data and other calculated parameters to the tabular data window and a
temporary data file named c:\windows\thunder\sys.dat. Tabular data is always stored in the system units
selected. This data is also stored in the tabular data window for use by the 1200's graphing function.
The items stored are dependent on the type of function the generator is performing. Both (generate, auto
profile) modes store the system data consisting of elapsed time, date/time, and the measured system
parameters. In generate and auto profile modes, the data stored will also include the calculated humidity
parameters and some additional system parameters. In (temperature, pressure, and flow) calibration
modes data and coefficients are stored to a separate calibration system file.
The difference between the tabular data window and the temporary data file is the storage capacity. The
tabular data window will contain only the most recent one thousand lines of data while the data file is only
limited by the available space on the flash drive. The graph can only access data that is currently in the
tabular data window.
The tabular data window and the temporary data file are cleared at the beginning of each new run (i.e.
from a shutdown condition). The current data file can also be cleared by selecting Clear Data... from the
File drop-down menu.
3.8.2 Saving the System Data
The user at any time may save a copy of the temporary data file to a data file for their own use. To save
a copy of the current data file, select Save Data as... from the File drop-down menu. Enter an
appropriate file path and name when prompted, then click OK.
Use the On-screen Keyboard to enter a file name. Click and hold on the upper bar of the keyboard to
move it to other parts of the screen.
3-22
Page 64
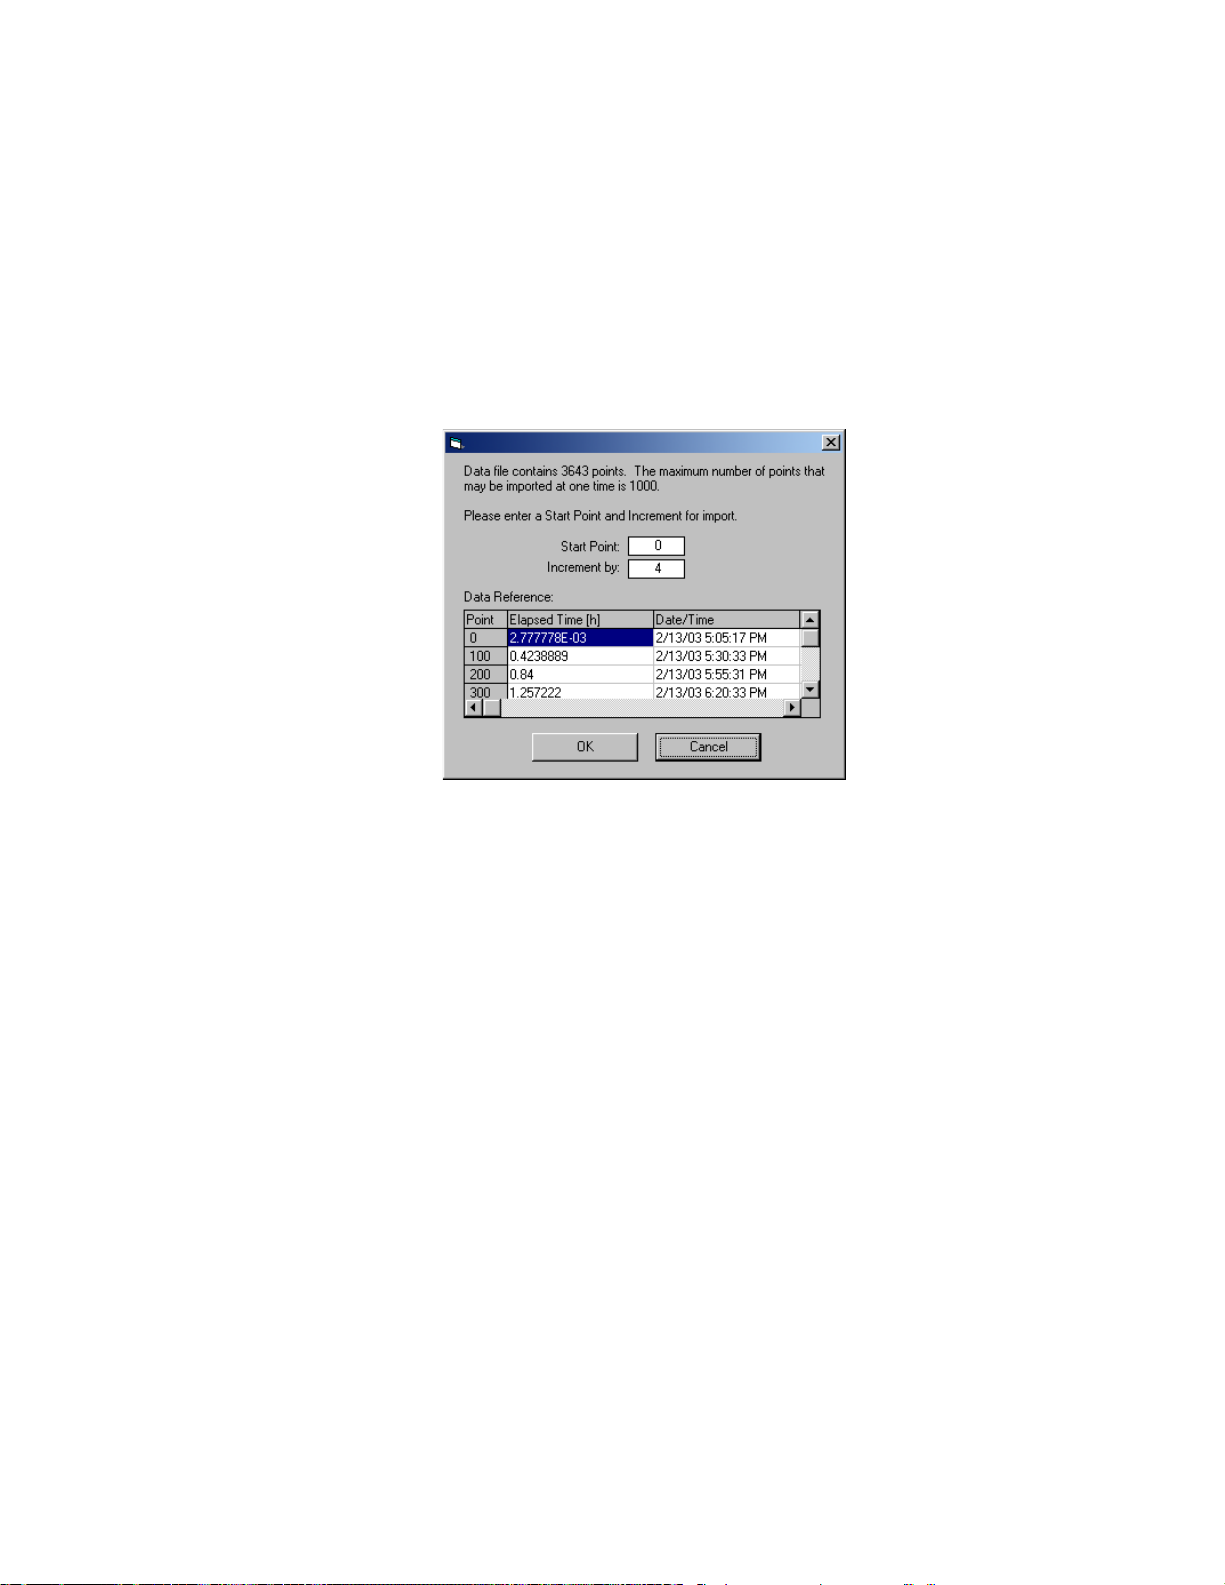
3.8.3 Retrieving Data from Previous Runs
Data that has been saved from a previous run may be imported for subsequent graphing functions. If the
current data is important, save a copy of it prior to importing a new data set.
Note: Data may only be imported when the generator is shutdown (not running).
Select Import Data... from the File drop-down menu, then choose the file you wish to import. This data
will replace the current data in the Tabular Data window. If the selected data file contains more than one
thousand data lines, the following dialog box will appear:
By setting the start line and the increment of the import function you will reduce the data file to a more
manageable size.
The data reference table given may be used to select a data range and will automatically calculate a
corresponding data interval. Or, it may be used just as a reference for you to select an appropriate
starting line, reading in each and every point up to the maximum allowed.
Any line, which exists within the given number of data lines, may be used as the start line.
A data interval of 1 will retrieve every point starting with the user selected start point.
3.8.4 Data Storage Interval
Storing and maintaining data can become a very time consuming process. The more data that is stored
in the tabular data window, the slower and less responsive the system will become. For this reason,
some consideration should be given to the amount of data desired, the overall time span of the data (i.e.
four hours, two days, possibly weeks), and ultimately the data interval.
The data interval determines when the data is stored and also when data will be printed. The 1200's
default data interval for a generate mode is one minute. This is just a guideline. You, as the user, should
decide what data storage interval best suits your needs.
3-23
Page 65
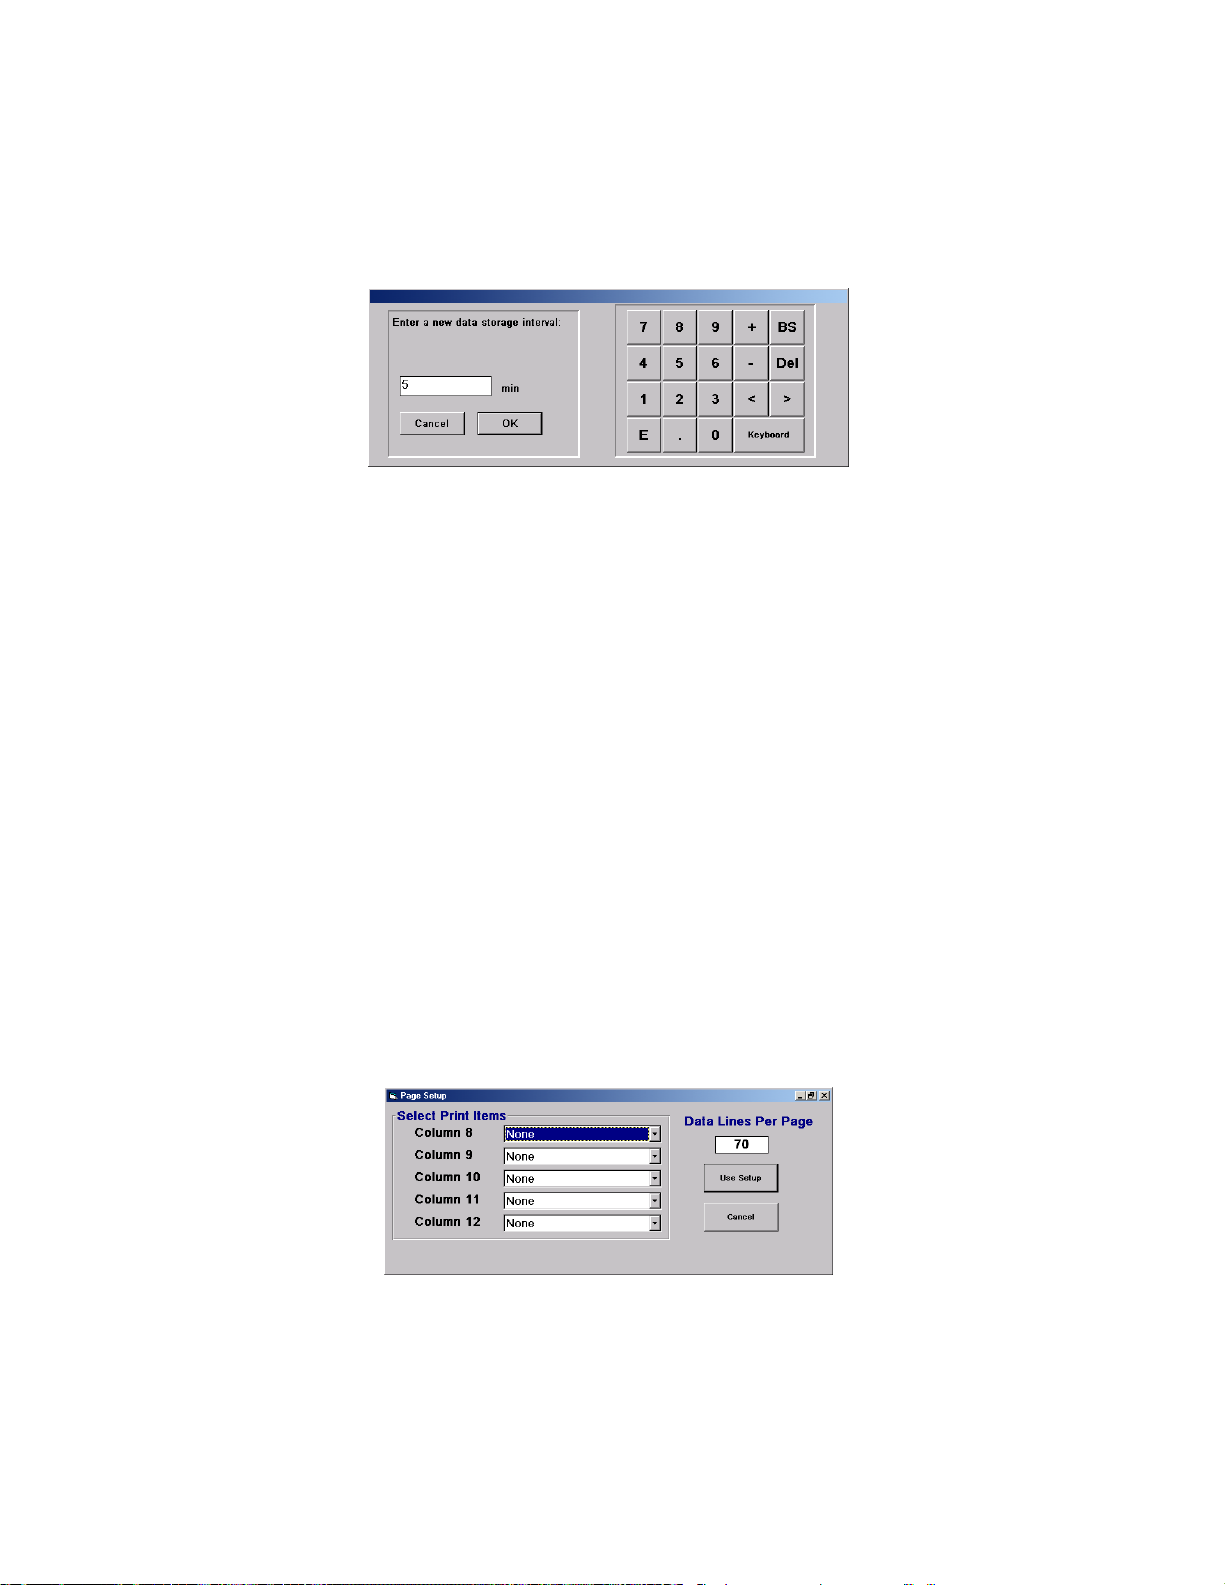
3.8.4.1 Changing the Data Storage Interval
To change the data storage interval, select Data Storage Interval from the File drop-down menu. The
following dialog box will appear.
Enter the new time interval in minutes and select OK.
3.9 PRINTING
A printer may be connected to the USB connection. The printer is used for hardcopy output of system
data and other parameters. While the 1200 generator is operating and enable printer is selected, data is
captured on a timed interval basis and sent to the printer in a page at a time format only. Prior to
enabling the printer, a Page Setup should be performed.
The system will buffer an entire page of data prior to sending it to the printer. When sending it to the
printer, the standard Windows printer driver for the selected printer type is used, and all printing is
handled by the Windows Print Manager. Printer drivers can be loaded via a USB Flash Drive connected
to the USB Port and installed using the “New printer wizard” in the Windows XP Embedded printer
section. Note that the operating system is of the embedded design and does not contain all features
supported by a full installation. In some cases this limitation may prevent some drivers from being
installed.
3.9.1 Page Setup
Printer operation and the data sent to it can be customized with Page Setup. Selecting Page Setup...
from the File drop-down menu brings up the following dialog box:
3-24
Page 66
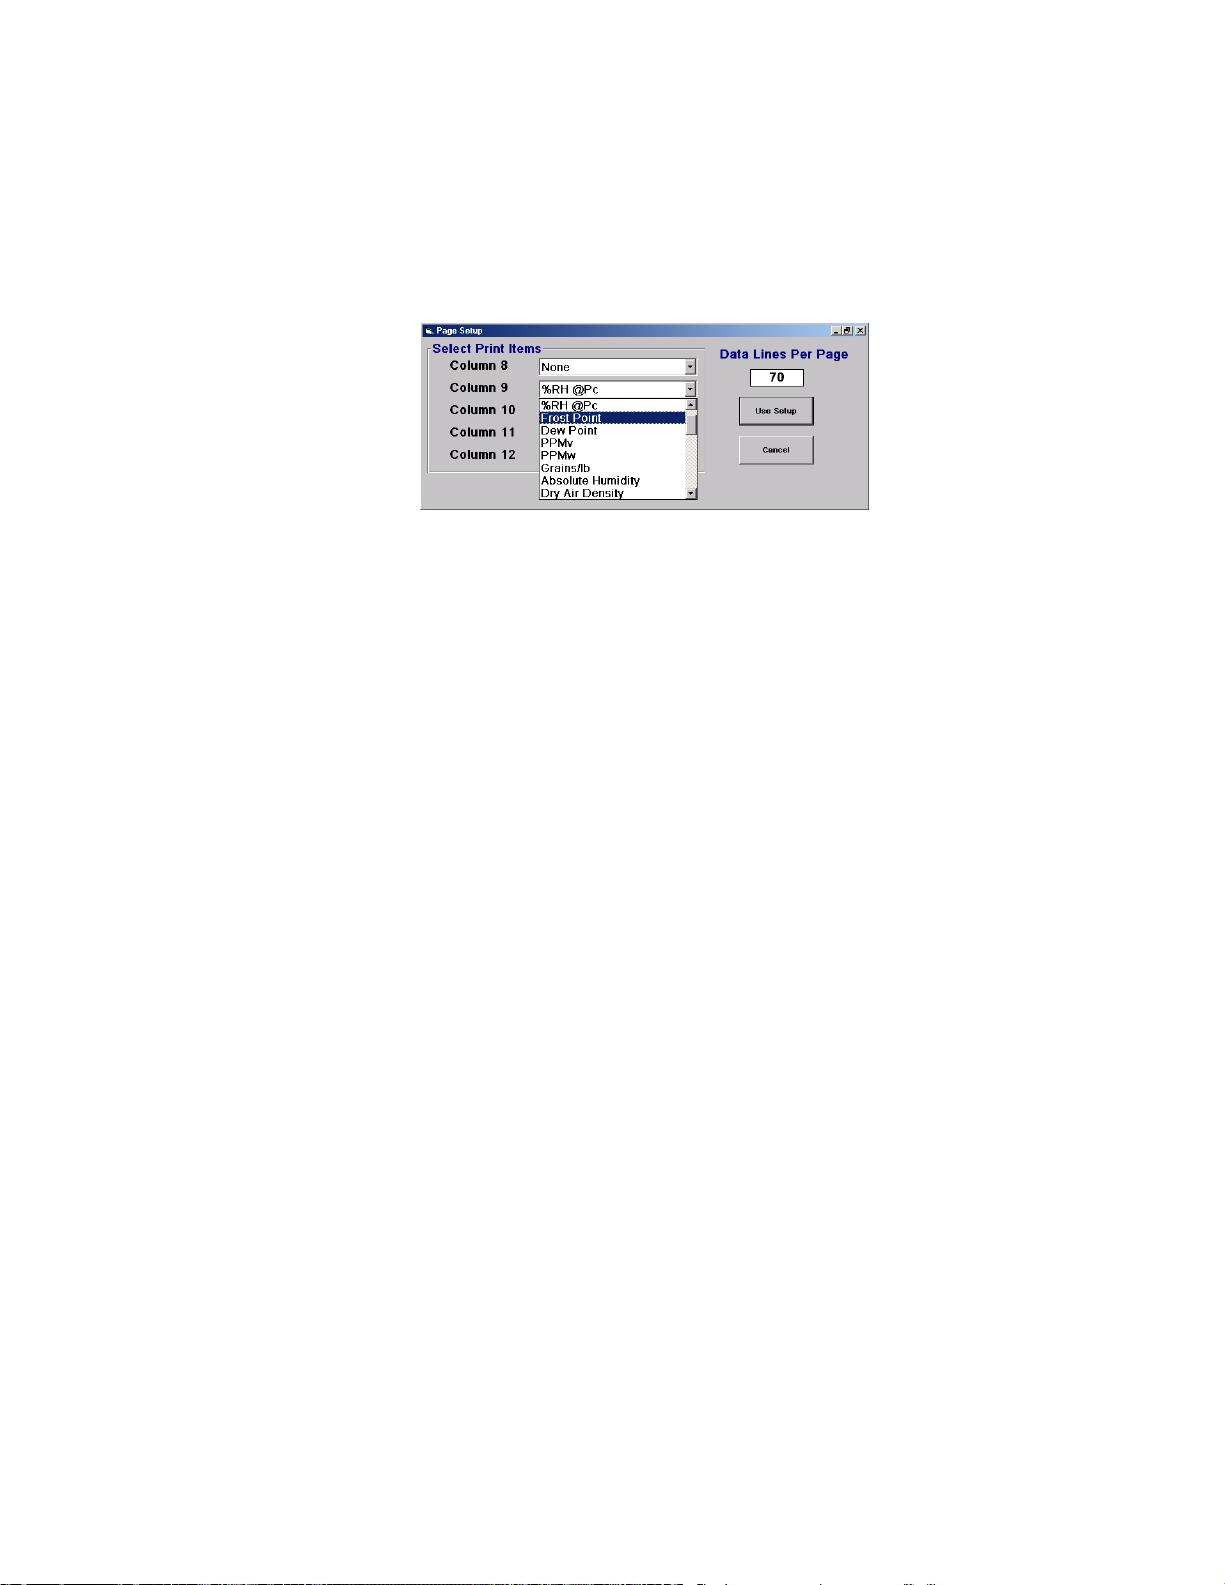
Select Print Items:
Lines of data are printed in a column format. The first several columns are fixed by the system and
include such things as Time, Date, Saturation Pressure, etc. The remaining columns of data on each
page are user selectable and are shown on the Page Setup form. To select which data items will be sent
to the printer in these later columns, choose the item from the drop-down menu which corresponds to the
column in which the data should be printed.
Data Lines Per Page:
The number of data lines printed per page may also be changed. An entry of 60 would allow for one hour
of printed data per page if the data storage interval is set to one minute (see section 3.8.4 Data Storage
Interval). After all changes have been made to the Page Setup click the OK button, or click Cancel to
abort any changes.
3.9.2 Enabling/Disabling the Printer
Selecting Enable Printer from the File drop-down menu causes measured system data to be sent to the
print buffer until enough data has been collected to satisfy the page at a time interval (see section 3.8.4
Data Storage Interval). A appears in front of the menu item.
Selecting Enable Printer, from the File drop-down menu while the printer is enabled, disables further
printer output and an end of page command will be sent which causes the page to be printed and ejected
from the printer.
3.9.3 What Happens When the Printer is Enabled
The printer, when properly setup and enabled, prints data at user selectable page at a time intervals. A
header is printed at the top of each page to indicate each columns selected parameter along with the
parameter's units. If changes are made to the Page Setup or to the Units while the printer is enabled, the
existing page will print and a new page will be started in order to reflect the changes.
3.9.4 Printing Immediate Data
Selecting Print Now from the File drop-down menu causes the system to immediately send one line of
current data to the print buffer but nothing will be seen until enough data (number of lines entered in page
setup) has been collected to print the entire page.
3.9.5 Special Considerations When Printing
Changing only the number of data lines per page will not force a new page and header to occur, however
any other changes to the Page Setup will result in a new header if printing is currently enabled.
3-25
Page 67
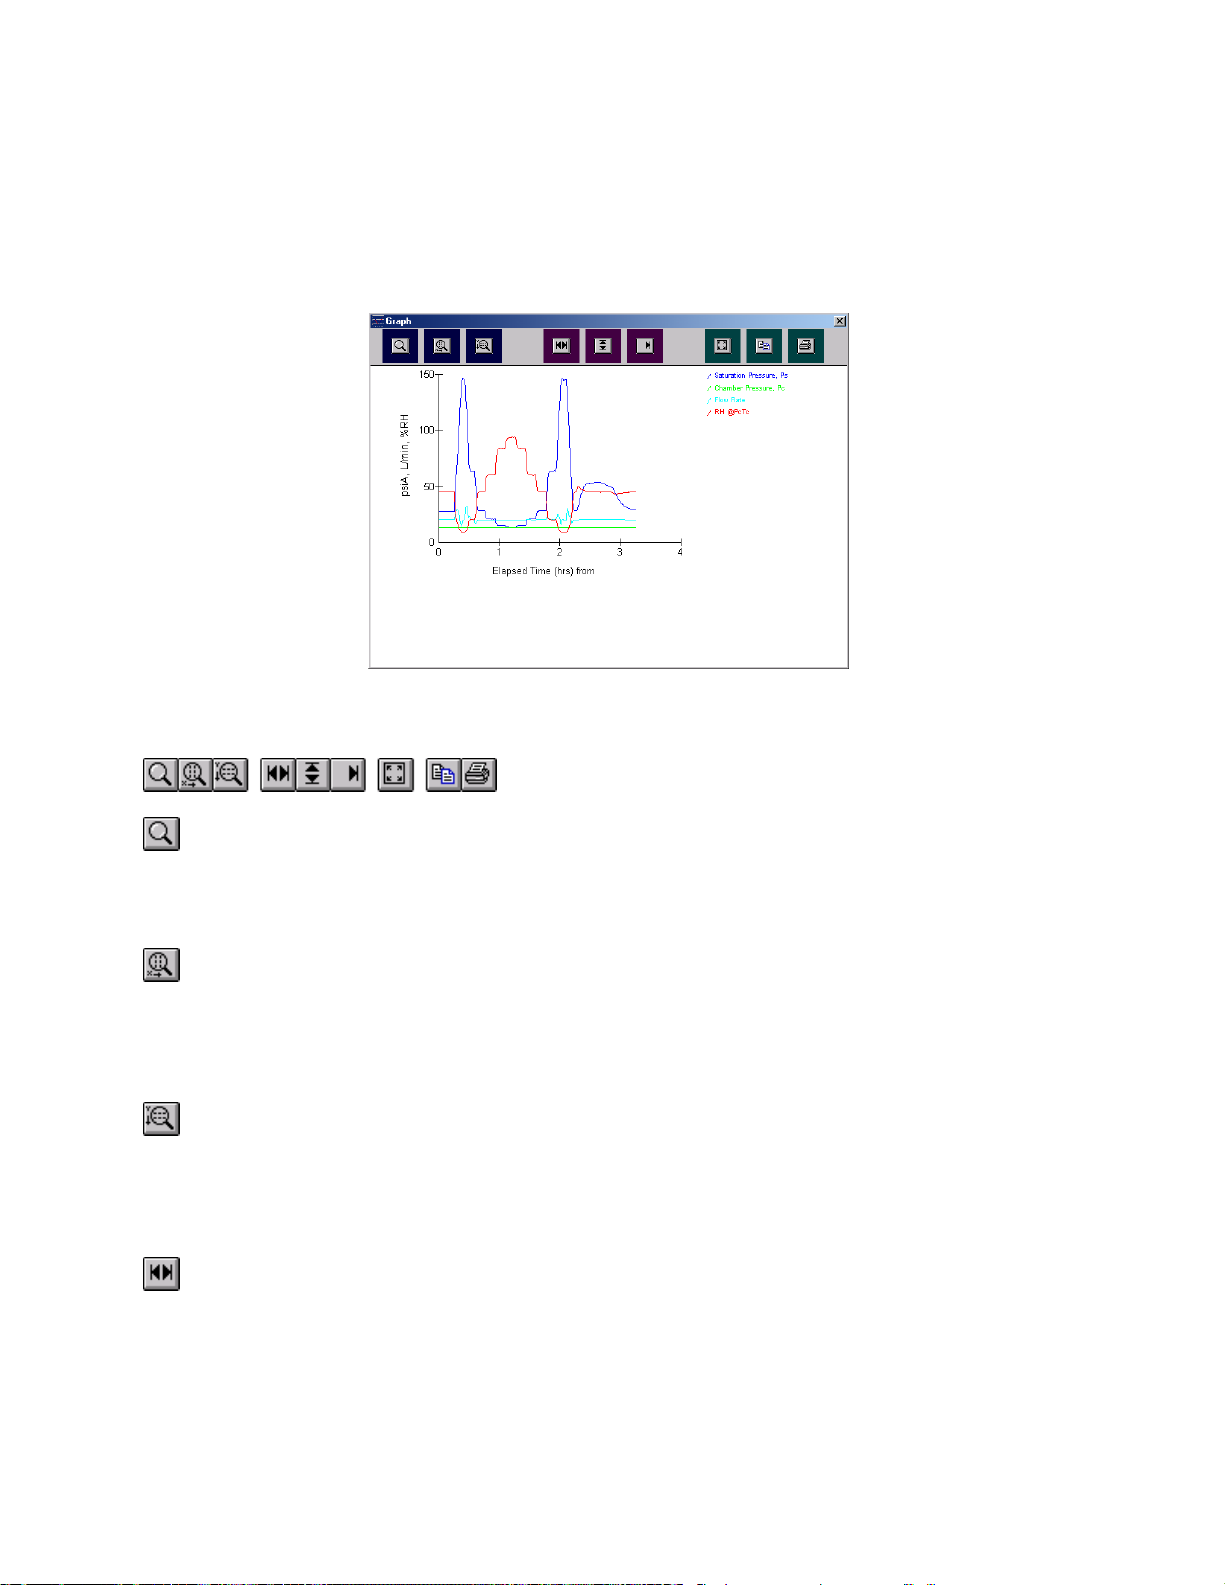
3.10 GRAPHING
The Graph window is a powerful tool used to view previously generated data or to monitor the generated
data in real time using the strip chart feature.
Select Graph from the Window drop-down menu.
3.10.1 The Tool Bar
Zoom in
Turns the pointer into a cross hair zoom tool. Move the cross hair to the graph, then click and
drag the cursor to create a box around the portion to zoom in on. The portion of the graph within
the drag box will expand to fill the entire graph. The time and Y-axis limits update accordingly.
Zoom X
Turns the pointer into a cross hair zoom tool. Click on the graph and drag the cursor so that the
portion of the X-axis (time axis) of interest is contained within the two vertical dashed zoom lines.
The portion contained within this region will expand to fill the entire X-axis. The Y-axis remains
unchanged.
Zoom Y
Turns the pointer into a cross hair zoom tool. Click on the graph and drag the cursor so that the
portion of the Y-axis of interest is contained within the two horizontal dashed zoom lines. The
portion contained within this region will expand to fill the entire Y-axis. The X-axis remains
unchanged.
Fit X
Adjusts the left and right limits of the time axis to match the beginning and ending points of the
stored data. This allows the parameters being graphed to fit within the left and right limits of the
graph window. The X limits update accordingly.
3-26
Page 68
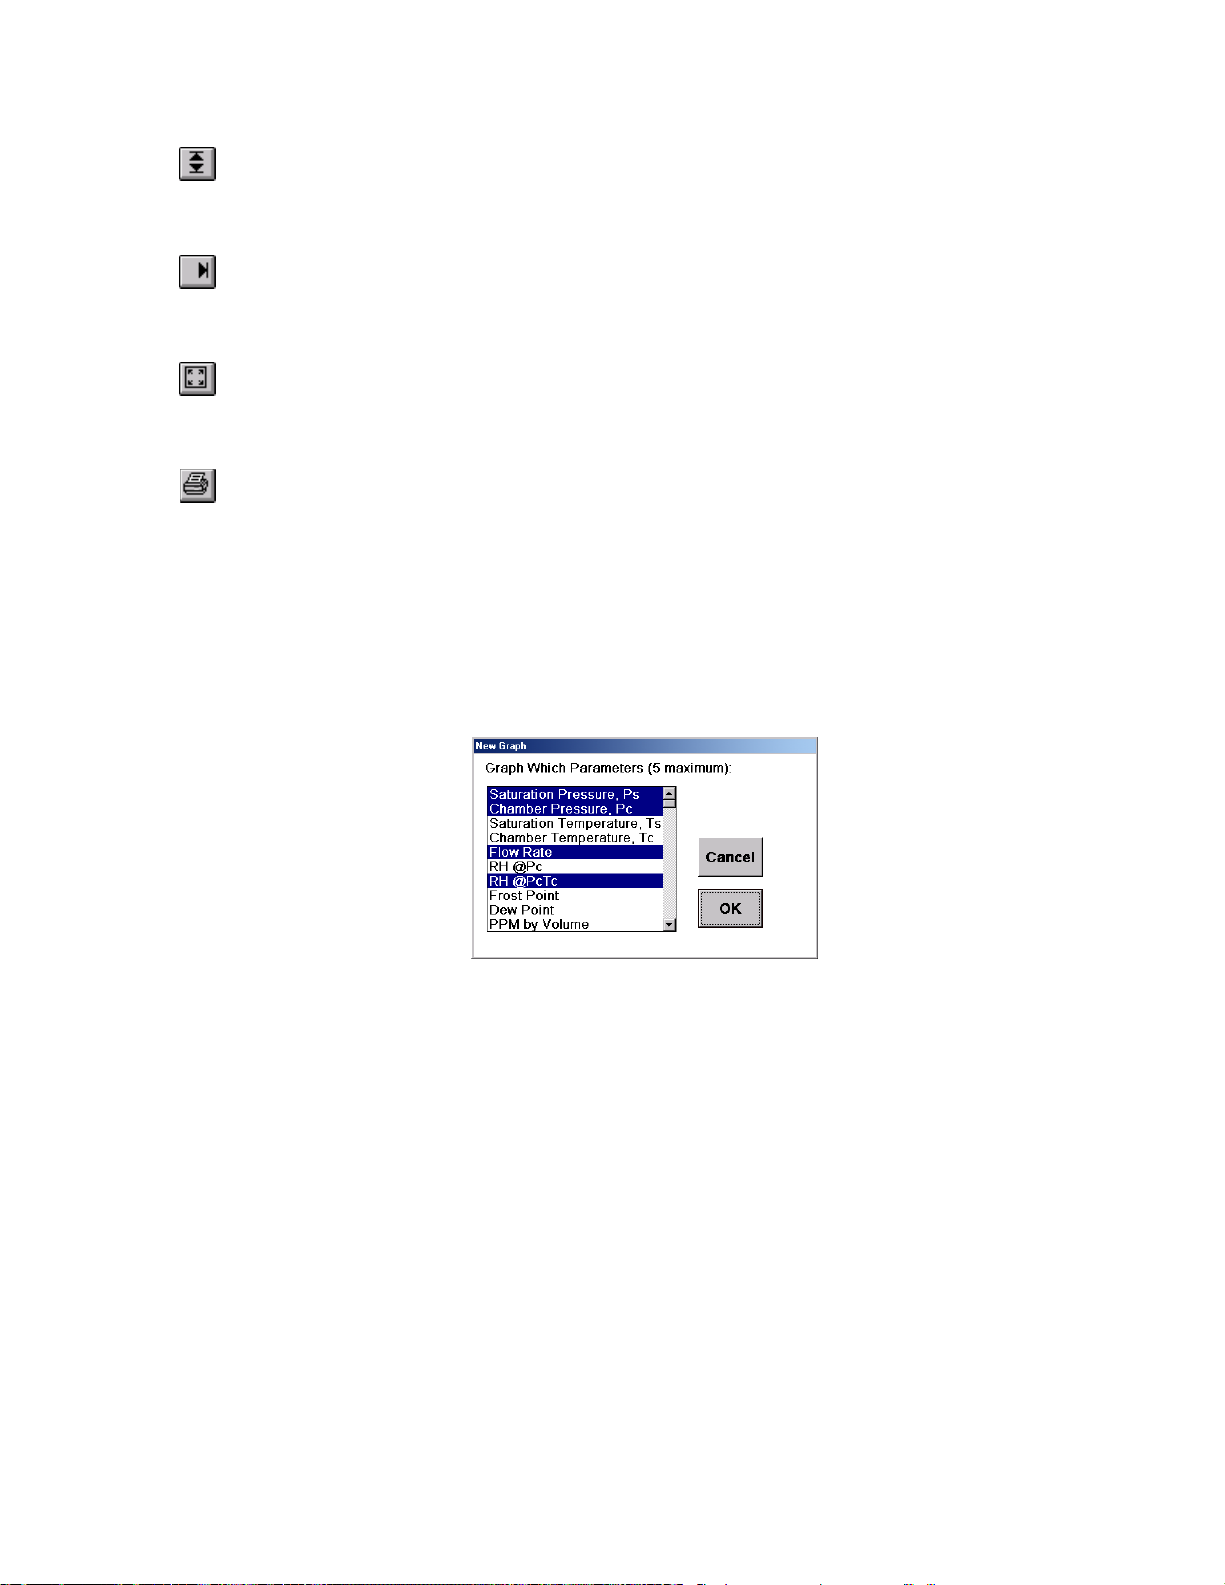
Fit Y
Current X
Shrink to Fit
Print Graph
3.10.2 The Graph Menu
Select New Graph... from the Graph drop-down menu. A dialog box with a scrolling list of all available
data will appear. The currently selected graph items will be highlighted.
Rescales the Y-axis in order to make the graphed data fit within the graph window. The Y limits
update accordingly. The X-axis remains unchanged.
Shifts the graph so that the right edge of the graph is at the ending data point. The time span
remains fixed.
Adjusts the left, right, top and bottom limits on the graph axes so that entire data set of each
selected item is contained within the boundaries of the graph.
Causes the graph to maximize and a page size picture of the current graph to be sent to the
printer. Once the graph has been sent to the printer the graph window returns to its previous
size.
Click ON or Off items to be graphed then click on the OK button allowing the graph to update, reflecting
the changes. The source of the graph data is the tabular data window. Selecting the Cancel button will
terminate the new graph operation and no changes will occur.
Time Span
Select Time Span... from the Graph drop-down menu.
A dialog box appears asking you to enter a new X-axis time span. The X-axis is updated by maintaining
the right time limit and adjusting the left time limit to reflect the specified time span.
Edit Axis limits
To edit the current axis limits either:
a. Double click on the graph window, or
b. Select Edit Axis Limits... from the Graph drop-down menu.
3-27
Page 69
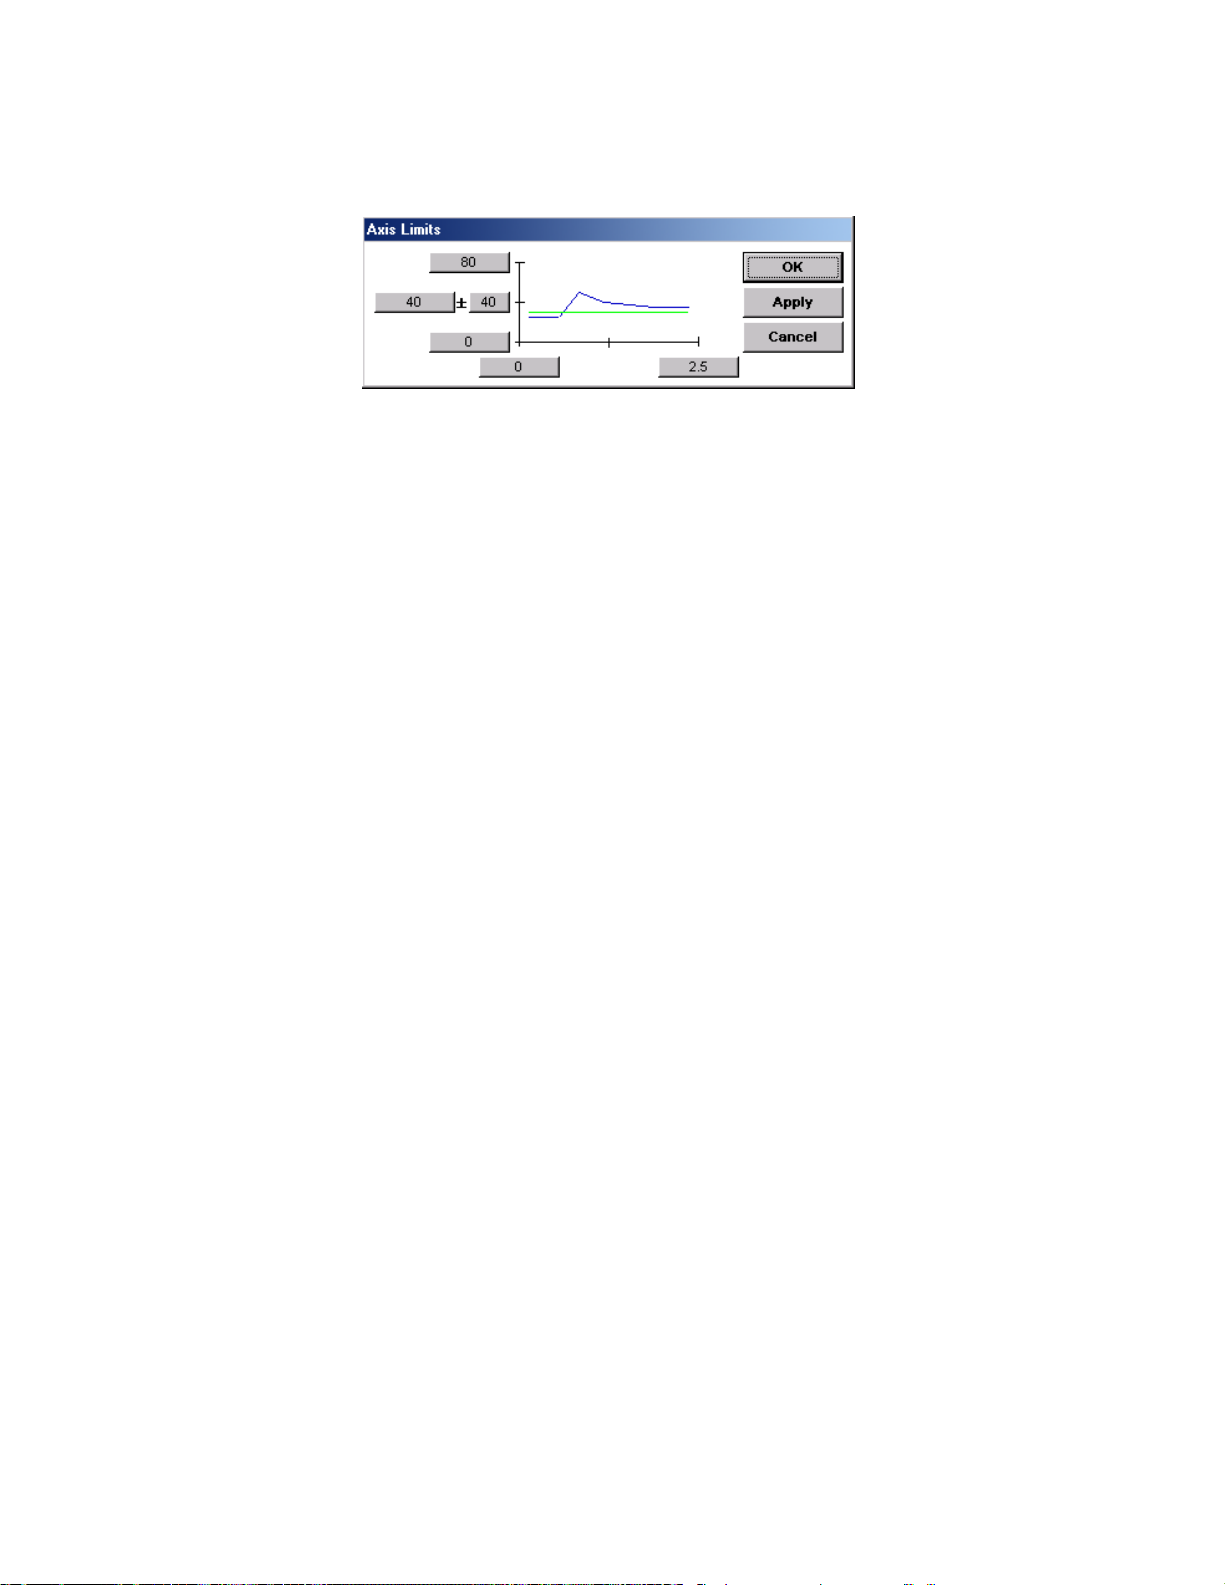
The following input box will appear.
Both the minimum and maximum limits for the X and Y axes may be changed. Another feature of the
Edit Axis input box is the ability to set a mid point and span value for the Y axis.
Enable Strip Chart
In the strip chart mode, the rightmost time limit reflects the time of the last stored data point, while the
leftmost time limit adjusts accordingly to keep a constant time span. Each time data is stored the strip
chart is updated.
Selecting Enable Strip Chart from the Graph drop-down menu causes the graph to begin updating at
regular time intervals (see section 3.8.4 Data Storage Interval). A appears in front of the menu item.
Selecting Enable Strip Chart from the Graph drop-down menu while the strip chart is enabled
disables the graph from continuously updating.
Graph title
Select Graph Title... from the Graph drop-down menu. Enter the desired graph title into the dialog box
that appears. Click OK.
Y- axis title
Select Y-Axis Title... from the Graph drop-down menu. Enter the new Y-axis title in the dialog box that
appears. Click OK.
Show legend
Select Show Legend from the Graph drop-down menu. The legend appears on the graph window. A
appears in front of the menu item. To hide the graph legend, select Show Legend again.
Edit Legend
Select Edit Legend... from the Graph drop-down menu. A dialog box appears, asking you to rename
legend item 1. The current default name is already entered and highlighted. If you want to change the
name, simply type in the new one. Select OK to update the change and/or go to the next legend item.
You will be asked to accept or change each graph legend item. After changing the legend items you
want to change, Select Cancel to exit the edit routine.
3-28
Page 70

Show Grid
A grid may be placed on top of the currently graphed data to help clarify data values. Select Show Grid
from the Graph drop-down menu. To remove the grid, select Show Grid again.
Show Markers
Markers may be placed on the graph lines to indicate the time each individual point was taken. Select
Show Markers from the Graph drop-down menu. To remove the markers, select Show Markers again.
Print Graph
The Print Graph menu item responds exactly like the Print Graph button on the Graph Window's Toolbar
(see section 3.10.1 The Tool Bar).
3.10.3 Graph Data
The graph works hand in hand with the tabular data window. While the generator is in operation, the
tabular data window stores the most recent one thousand data points. If the data exceeds the
maximum number of data points allowable, the data is still stored to the same temporary data file
(c:\windows\thunder\sys.dat) but only the most recent data is available to the graph.
3.11 DIAGNOSTICS
While the system is continually self checking when running, a diagnostic test may be initiated when the
system is shutdown. This is a useful feature to aid in the diagnosis of system failures, which cause
system shutdowns.
3.11.1 Performing System Diagnostics
Diagnostics may only be performed while the system is shutdown and the Utilities menu is showing. To
diagnose the system, select Diagnostics from the Utilities drop-down menu.
3.11.2 What Happens During Diagnostics
The system performs tests of the temperature probes, pressure transducers, limit switches, and digital
inputs. Any problems encountered are logged to the status log and a message appears on the screen
indicating the same.
3-29
Page 71
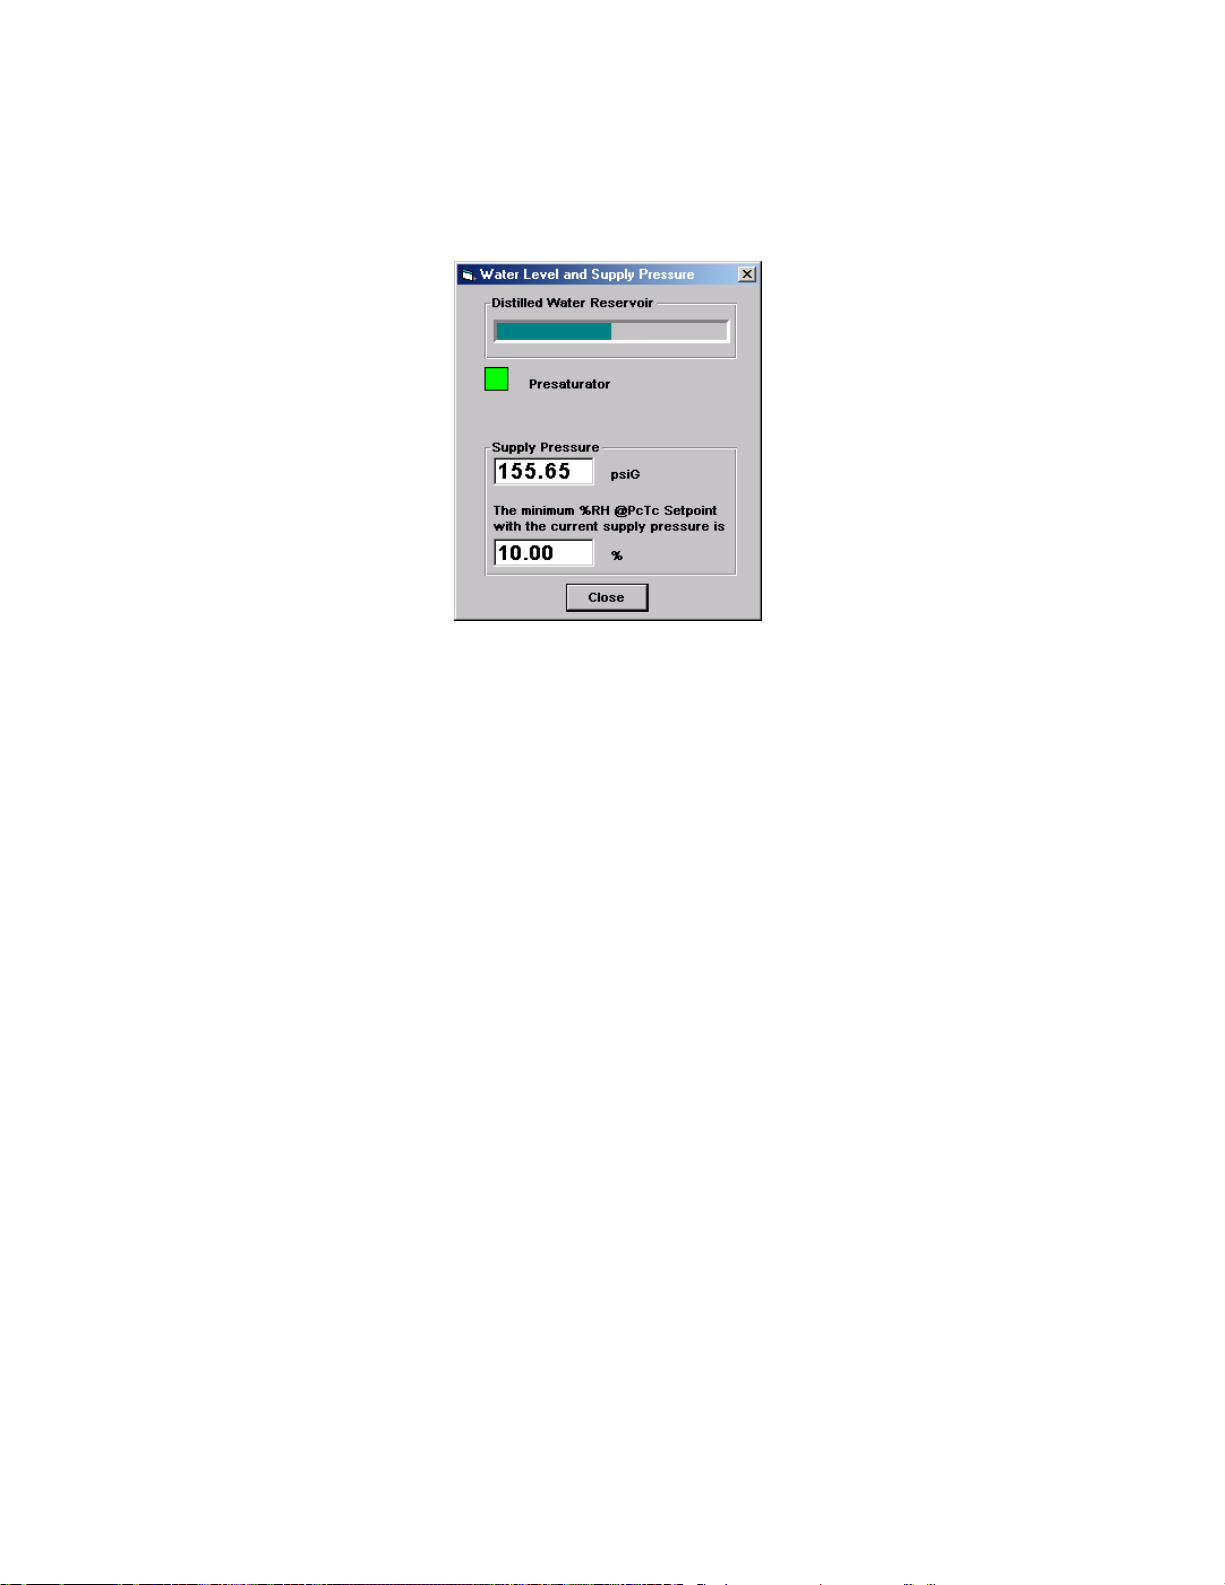
3.12 WATER LEVEL and SUPPLY PRESSURE
The Water Level and Supply Pressure window is used to monitor the water level of the distilled water
reservoir and presaturator as well as indicate available supply pressure.
3.12.1 Reservoir Water Level
The reservoir holds a supply of distilled water that is used for maintaining the proper water level in the
presaturator. Prior to extended periods of generation or periods of high temperature and/or high humidity
generation, it is a good idea to fill the reservoir. The reservoir level is displayed as a percentage of the
vessel's total capacity.
To fill the reservoir:
1) Ensure that the generator is in a shutdown mode and that an adequate distilled water supply is
available.
2) If not already showing, select Water Level and Supply Pressure from the Window drop-down
menu.
3) Remove reservoir cap, attach funnel and begin filling reservoir with distilled water. While filling,
the level gauge on the water level window updates continuously to reflect the present level.
4) Once the reservoir is 100 % full, stop filling, remove funnel and replace reservoir cap. Do not
overfill!
3.12.2 Presaturator Water Level
The Presaturator distilled water level is maintained at a constant level by the computer. When the water
level drops below the control point the computer signals a red condition. The computer will then activate
solenoid SOL4, allowing distilled water into the presaturator until a green condition is indicated.
If the presaturator does not fill to the control point (i.e., reservoir empty) within approximately 5 minutes,
the system will shut down and display an error message reflecting this problem.
3-30
Page 72
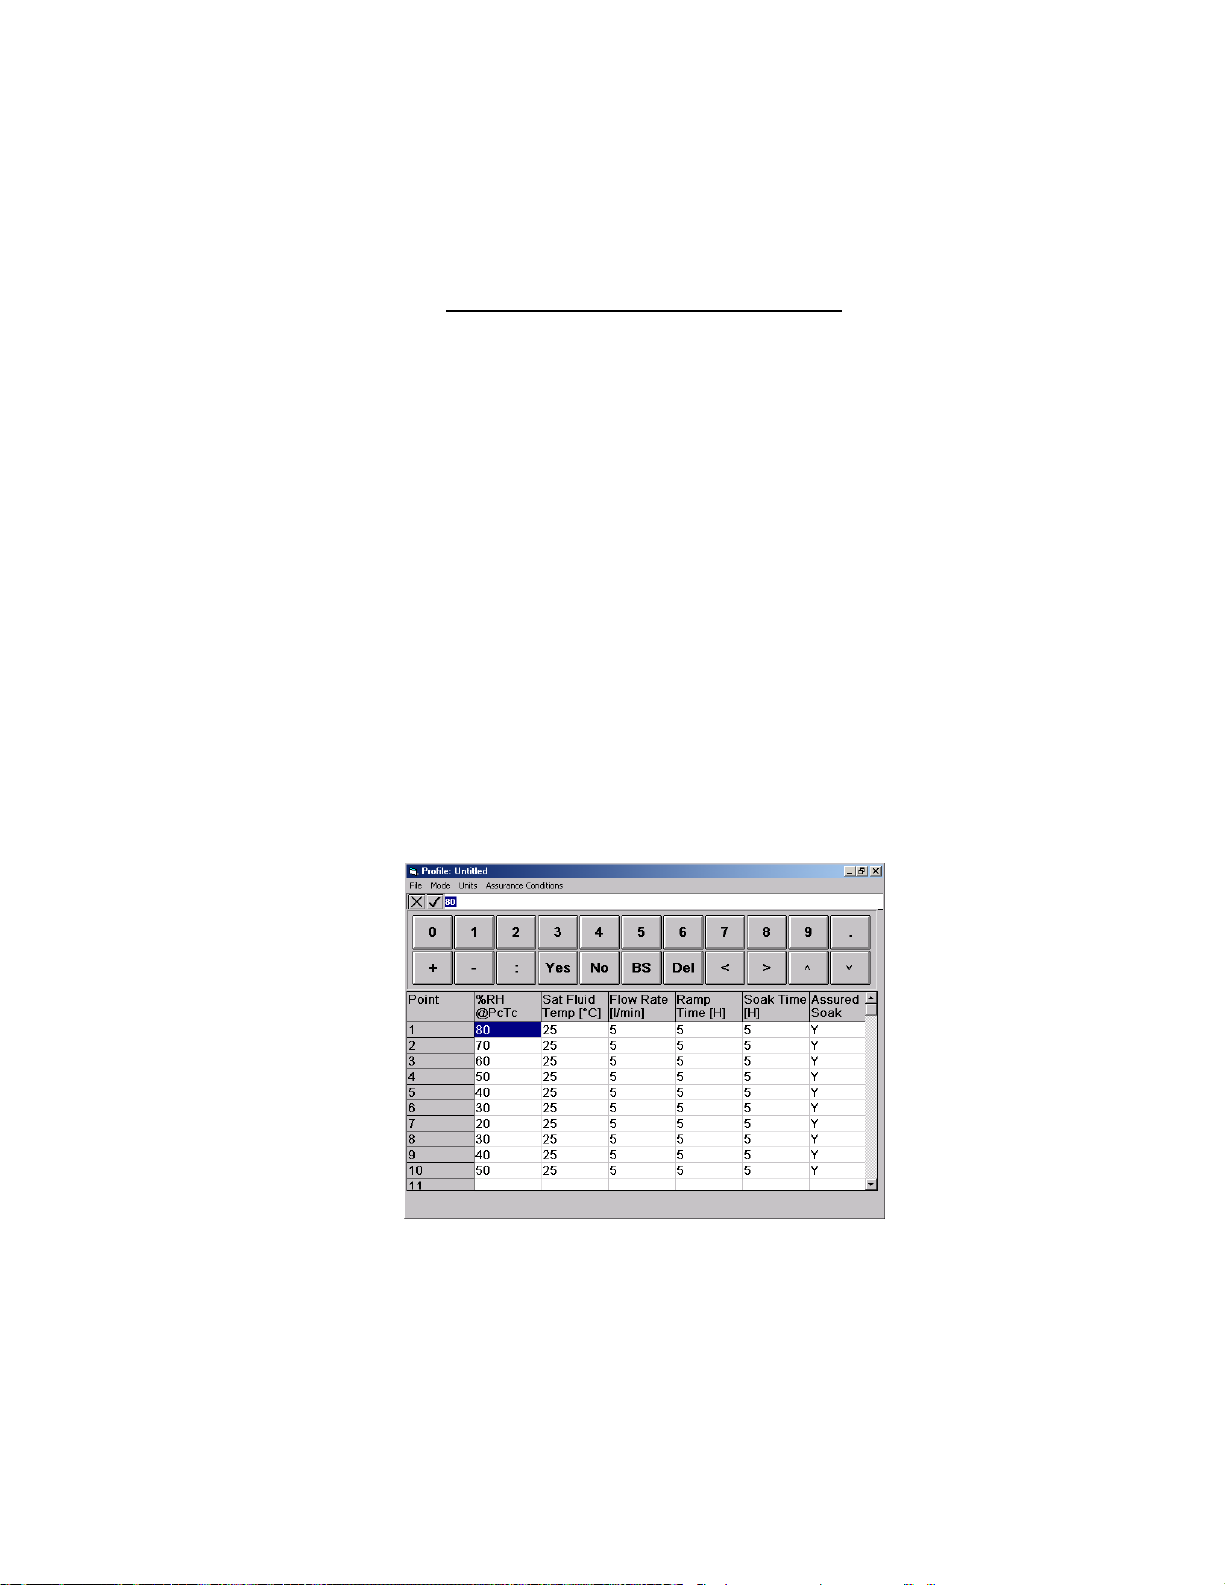
3.12.3 Supply Pressure
Regulated air supply pressure is indicated in the Water Level and Supply Pressure window. The input
pressure must be at least 5 psiG above the desired regulated supply pressure. The regulator adjustment
is accessed through the left side panel.
Warning: Do NOT exceed 150 psiG
To adjust: Using an 11/32" socket wrench, rotate stem clockwise to increase pressure and counterclockwise to decrease pressure while monitoring Water Level and Supply Pressure window.
3.13 AUTO PROFILING
The Auto Profiling mode of operation is very similar to the Generate mode with the main exception being
that profiling relies on a pre defined list of setpoints referred to as a Profile. The user configurable Profile
is used as the program's road map. It defines which setpoint values to go to, at what rate to go from one
setpoint to another, and how long to stay at a specific setpoint before moving on to the next one.
3.13.1 Entering a Profile
3.13.1.1 Showing the Profile in Memory
To show the Profile currently in memory, select Profile from the Window drop-down menu. The Profile
is a list of humidity, temperature, flow, and time parameters that are used during Automated Control of
the 1200 Generator. The Profile essentially programs the computer/controller operations. The profile
form stores this information.
The first column, next to the point numbers, contains values of humidity to generate and is titled at the top
according to the currently selected profile control mode.
The Sat Fluid Temp column contains the Saturation Temperature setpoints and should be set to the
desired Chamber Temperature. Temperature values are entered and displayed in the currently selected
profile units.
3-31
Page 73
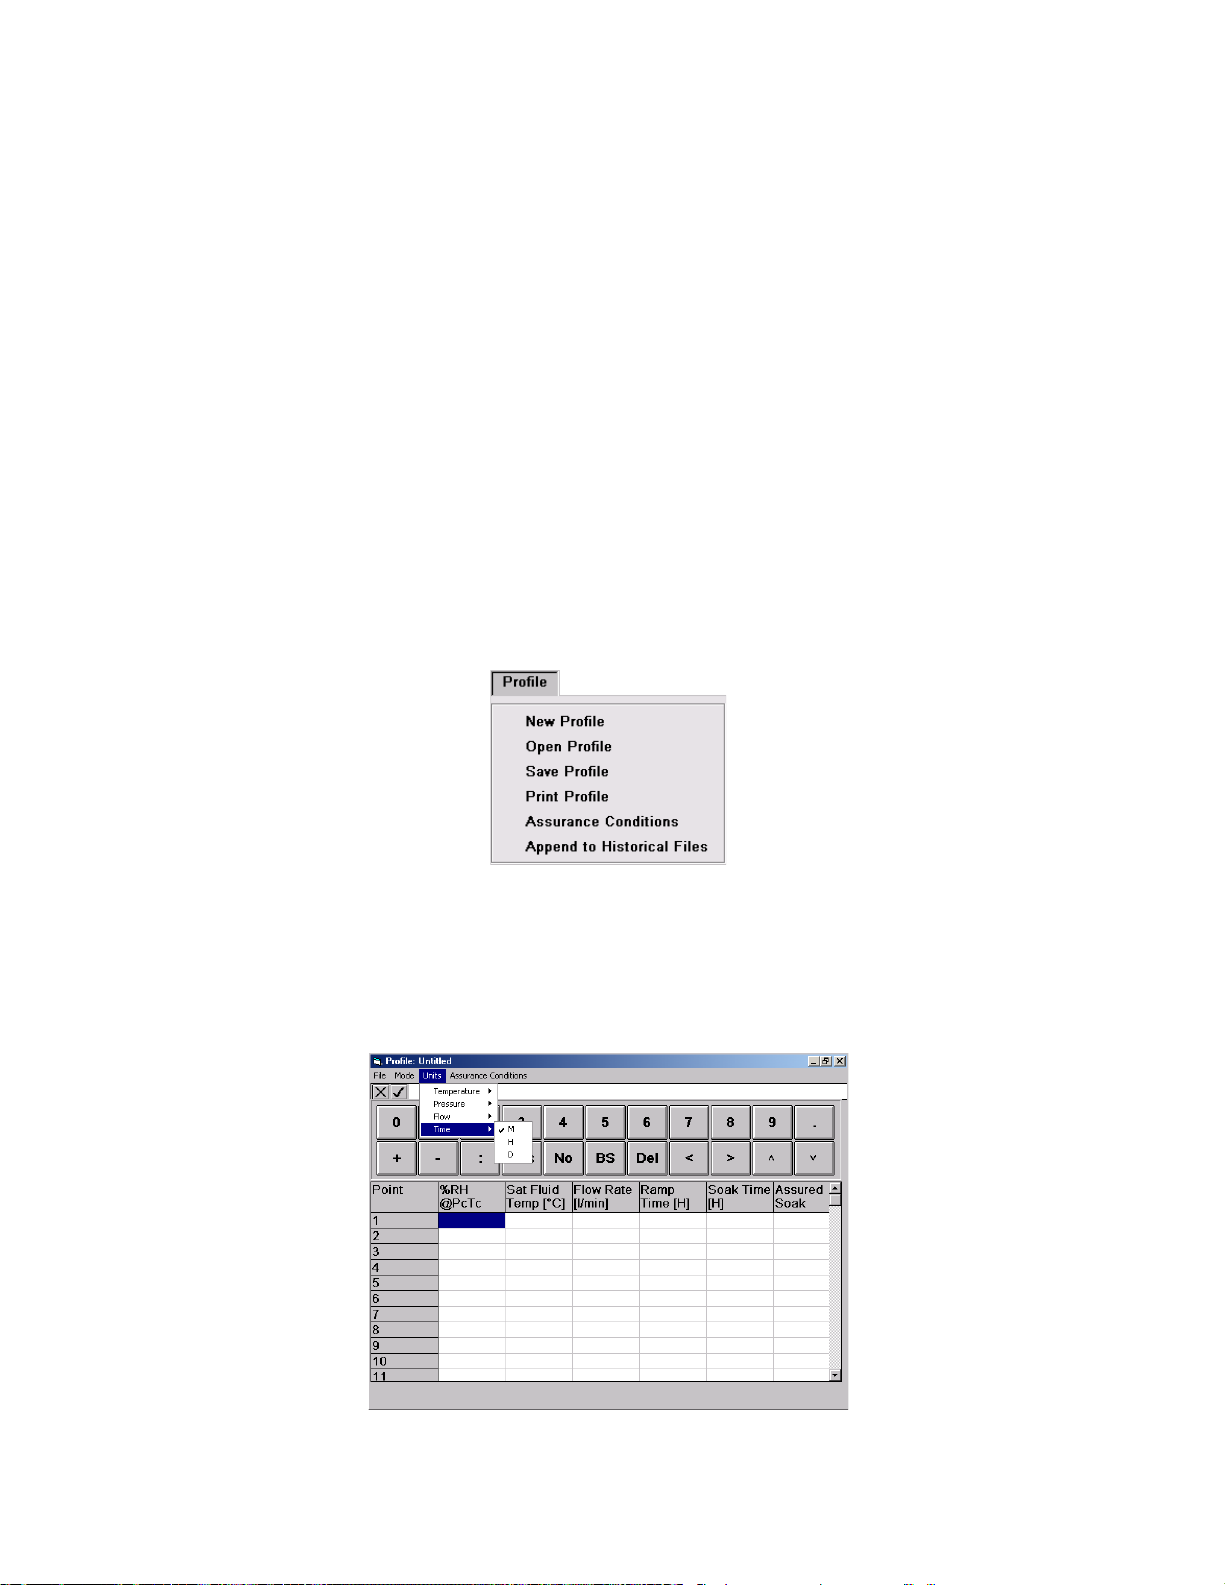
The Flow Rate column contains values of system airflow, which the generator will operate at. Although
not affecting the generated value of humidity, flow rate does affect the air exchange rate within the test
chamber and the equilibration time of any instruments under test.
Ramp Time is the desired amount of time the 1200 should take to transition from one profile test point to
another. Setting a Ramp Time of zero (0) instructs the 1200 to make the transition as quickly as
possible. Zero (0) is the setting used for most applications.
Soak Time is the desired amount of time to generate at a particular profile point. The Soak Time required
depends on the application, but should be at least 10 to 15 minutes, depending upon the humidity
measurement devices being calibrated.
Assured Soak, if set to "Y", forces the system to wait until measured parameter values are within a
specified tolerance and stability before the computer starts the Soak Phase. If "N" is set, the Soak Phase
will start immediately when the Ramp Phase is over.
3.13.1.2 Entering a New Profile
To enter a new Profile Select New Profile... from the Profile drop-down menu. This clears the existing
profile from memory.
3.13.1.3 Setting the Profile Units
From the Profile drop-down menu, select Units. Another set of cascaded menus will appear from which
you will choose the unit type to change. Please note the profile units are for use in entering the profile
only and will not change the systems units upon start-up of an Auto Profile.
3-32
Page 74
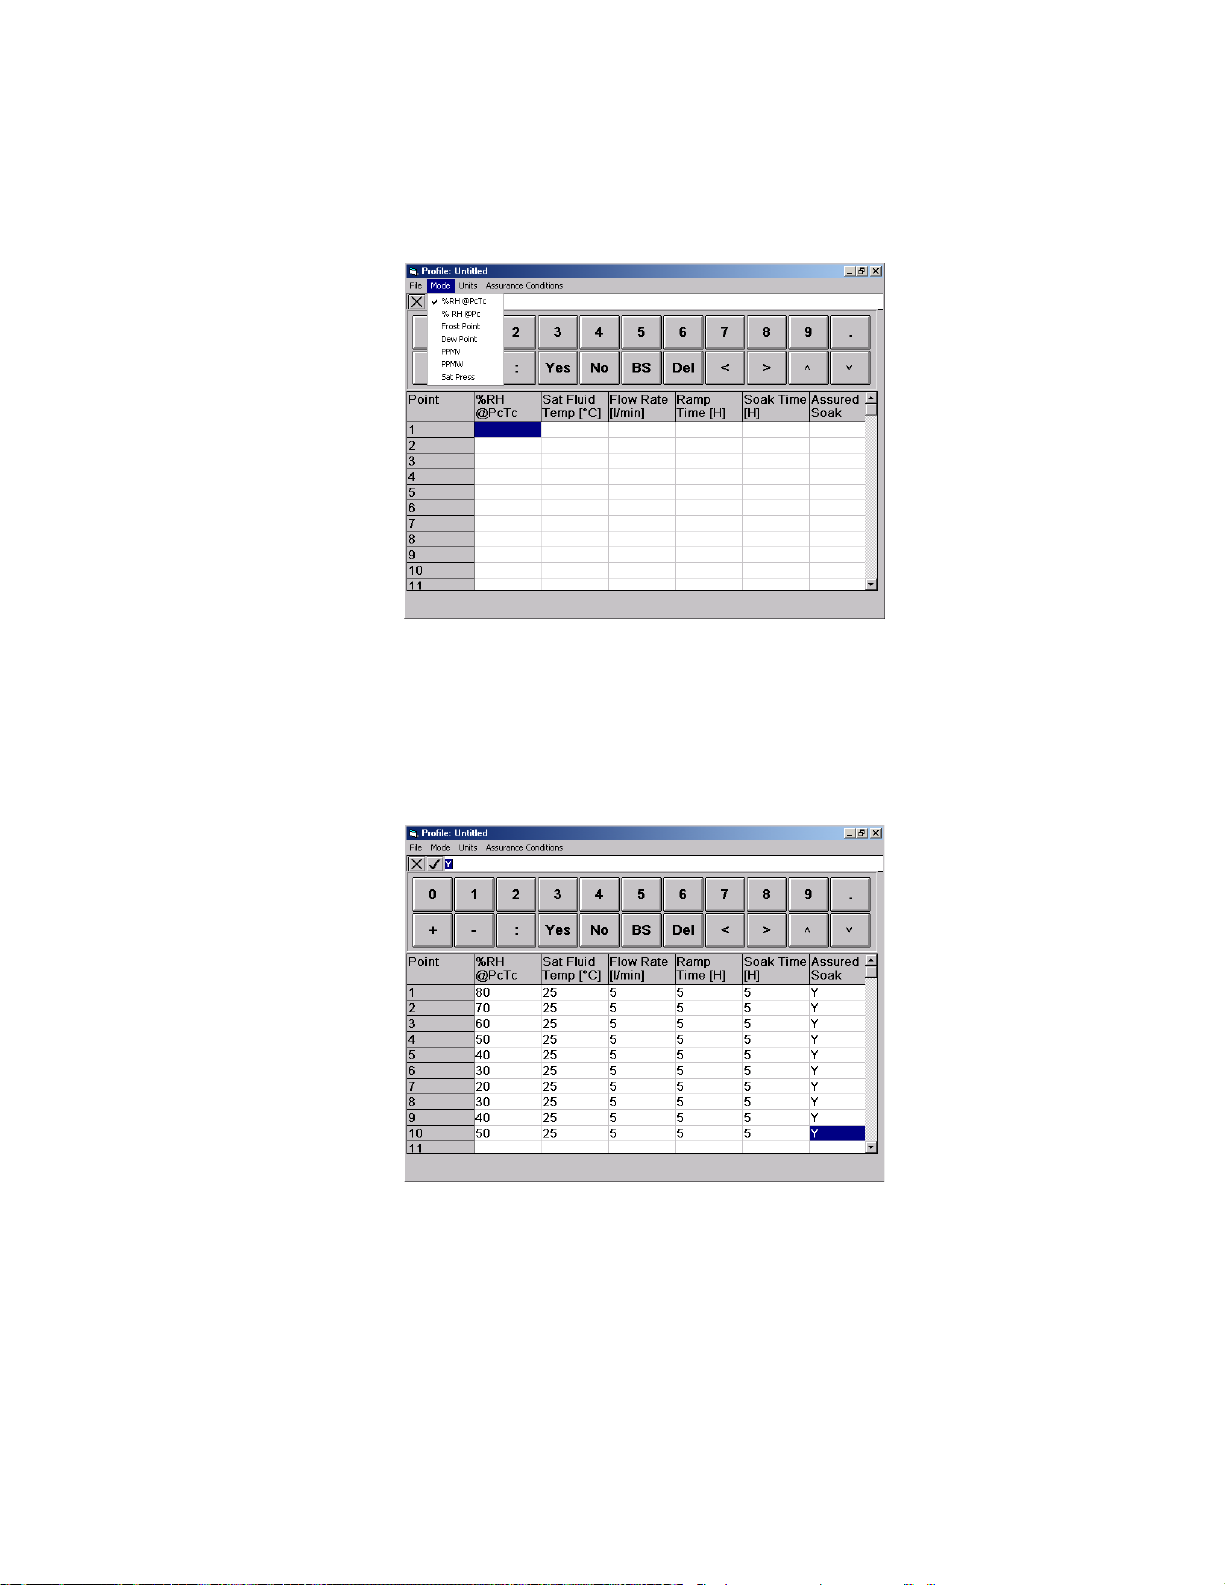
3.13.1.4 Setting the Profile Humidity Mode
From the Profile drop-down menu, select Mode. In the profile mode menu, select the desired control
mode. Upon selection the new mode caption with its units will appear as the title of the humidity value.
3.13.1.5 Entering the Profile Data
Enter the required values of humidity, temp, flow, ramp time, soak time, and either a "Y" or "N" for
assured soak. Selecting the check mark button on the profile window after each entered value advances
the cursor to the next parameter for that point. An item that is left empty is a valid entry choice, but to be
considered a valid profile point all items must be completed.
Each Profile entry is validated at time of entry as you are moving across the profile line. This validation is
to assure that each entry is within system tolerances.
When moving from one line to another, the entire line is validated with respect to all other items contained
on that profile line. Any invalid entry will cause a message box to appear and the value that may be
causing the problem to be highlighted.
Enter the remaining profile points in the same manner. As the points are entered, the computer will
predict the next value based on previous points entered. These predictions are often correct and will not
require editing. To make corrections to an existing profile item, simply select and edit the data for that
cell.
3-33
Page 75
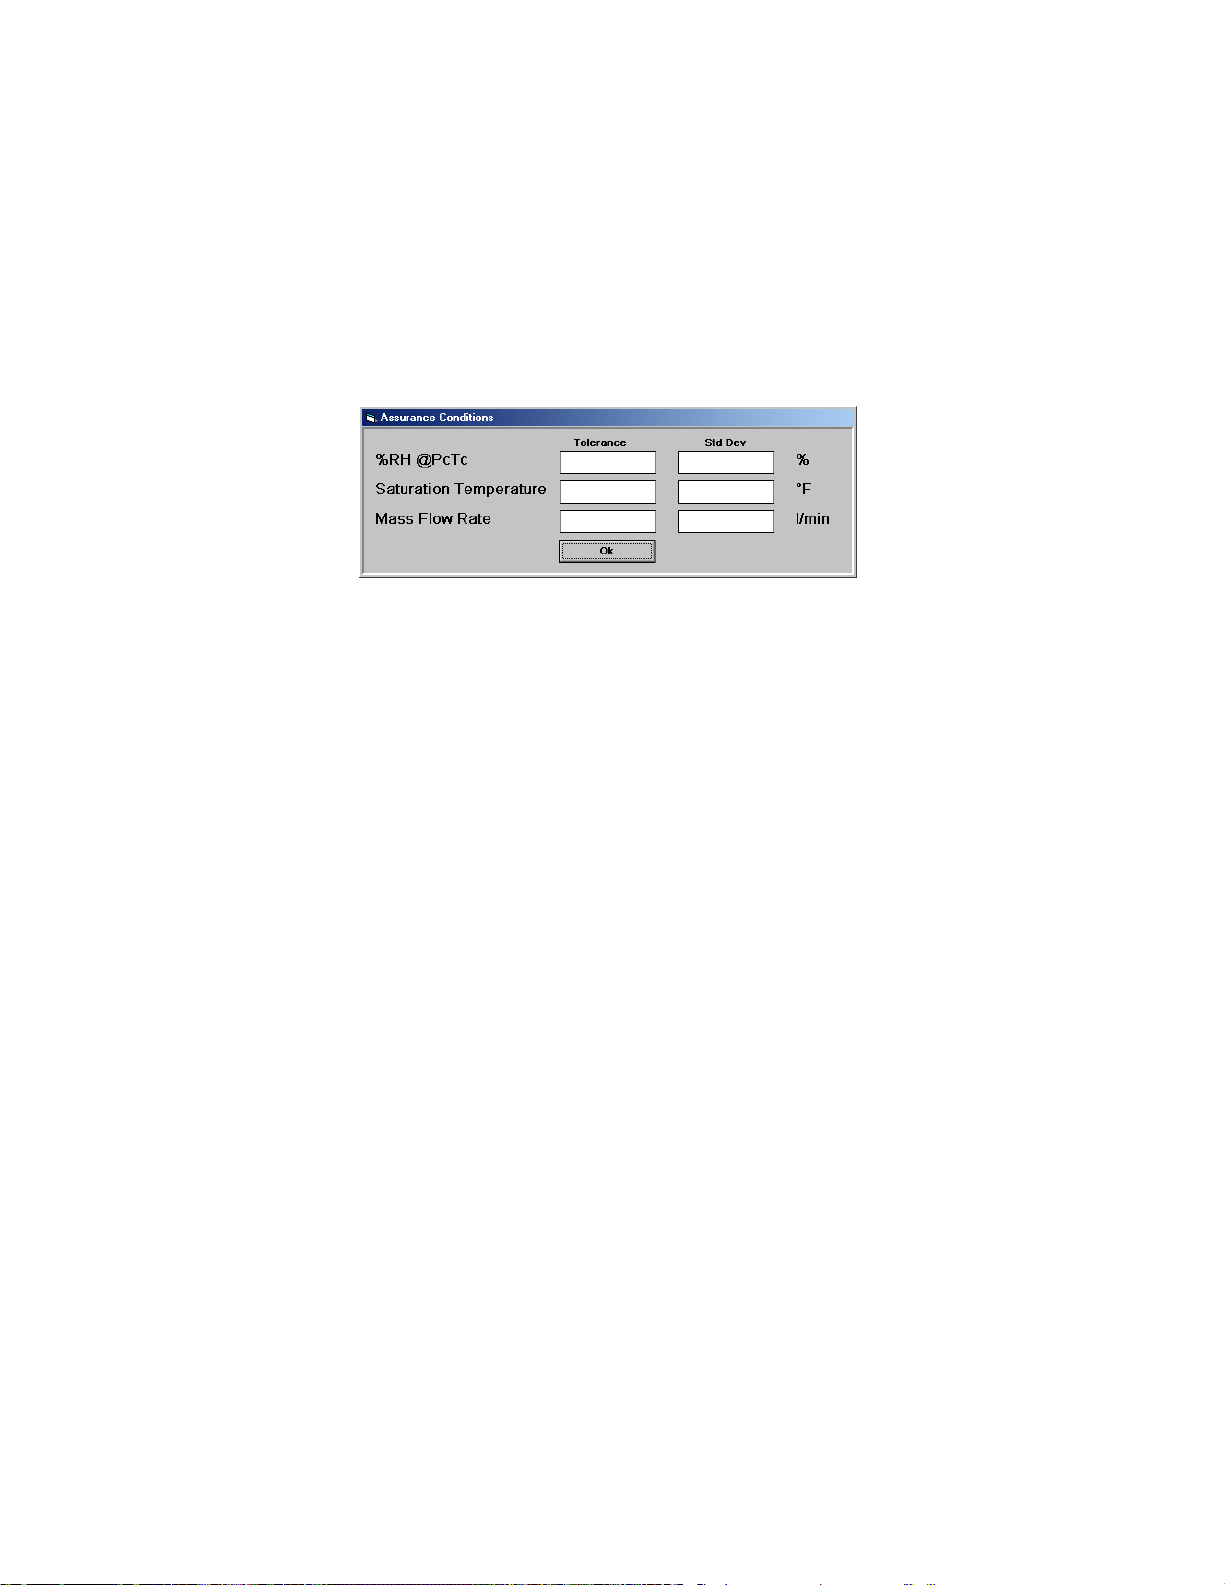
3.13.1.6 Setting the Assurance Conditions
One last task will conclude the profile entry process. If assured soak is to be used (any "Y" in the
assured soak column), then the Assurance conditions must be set.
Assurance Conditions are user specified tolerances between setpoint and measured values. These
tolerances must be met during the Assurance Phase before the Soak Phase begins.
To enter assurance tolerances, select Assurance Conditions... from the Profile drop-down menu. The
following dialog box appears:
For quicker Assurance times, increase the Tolerance and/or the Std Dev values. Tighter tolerances or
standard deviations (smaller values) result in longer Assurance times. Setting these values too small
could prevent assurance conditions from being met, therefore preventing the system from advancing to
the next profile point. Although all parameters may be edited, only the humidity parameter of the currently
selected control mode and the lower system parameter tolerance values will affect assurance conditions.
A tolerance or standard deviation value left blank will always meet the assurance conditions
3.13.1.7 Historical Data
The historical data feature of the profile allows the user to retain a record of the generator's performance
for long term comparison or repeatability analysis. When historical data is enabled, each point of a given
profile will maintain a separate data file of the soak phase data collected for that point during the profile
run. The data files have the same name as the profile itself, but the first point will have the suffix .001,
the second point will have the suffix .002, etc. Each time this same profile is run, the new soak data is
appended to the existing data in the appropriate historical files. These files are located in the same
directory as the original profile.
To Enable the historical data feature select Append to Historical Files from the Profile drop-down
menu. A appears in front of the menu item.
Selecting Append to Historical Files from the Profile drop-down menu while enabled, disables the
historical files from being updated.
Like the assurance conditions, the historical data preference is saved with the profile but may be enabled
or disabled at run time without affecting the name of the current profile.
3.13.1.8 Saving a Profile
Save a profile to disk by selecting Save Profile from the Profile drop-down menu. When asked, enter
any standard path and filename then select OK. Once saved the Profile window title will indicate the new
profile name. The existence of a profile path name on the Profile window title bar is an indication that the
profile currently in memory matches the profile of the same name stored on disk. A profile window that is
titled Profile: Untitled indicates that either the profile has not been saved, or does not exactly match the
stored profile of the same name. This occurs if the profile points are edited after being saved. Profiles
3-34
Page 76
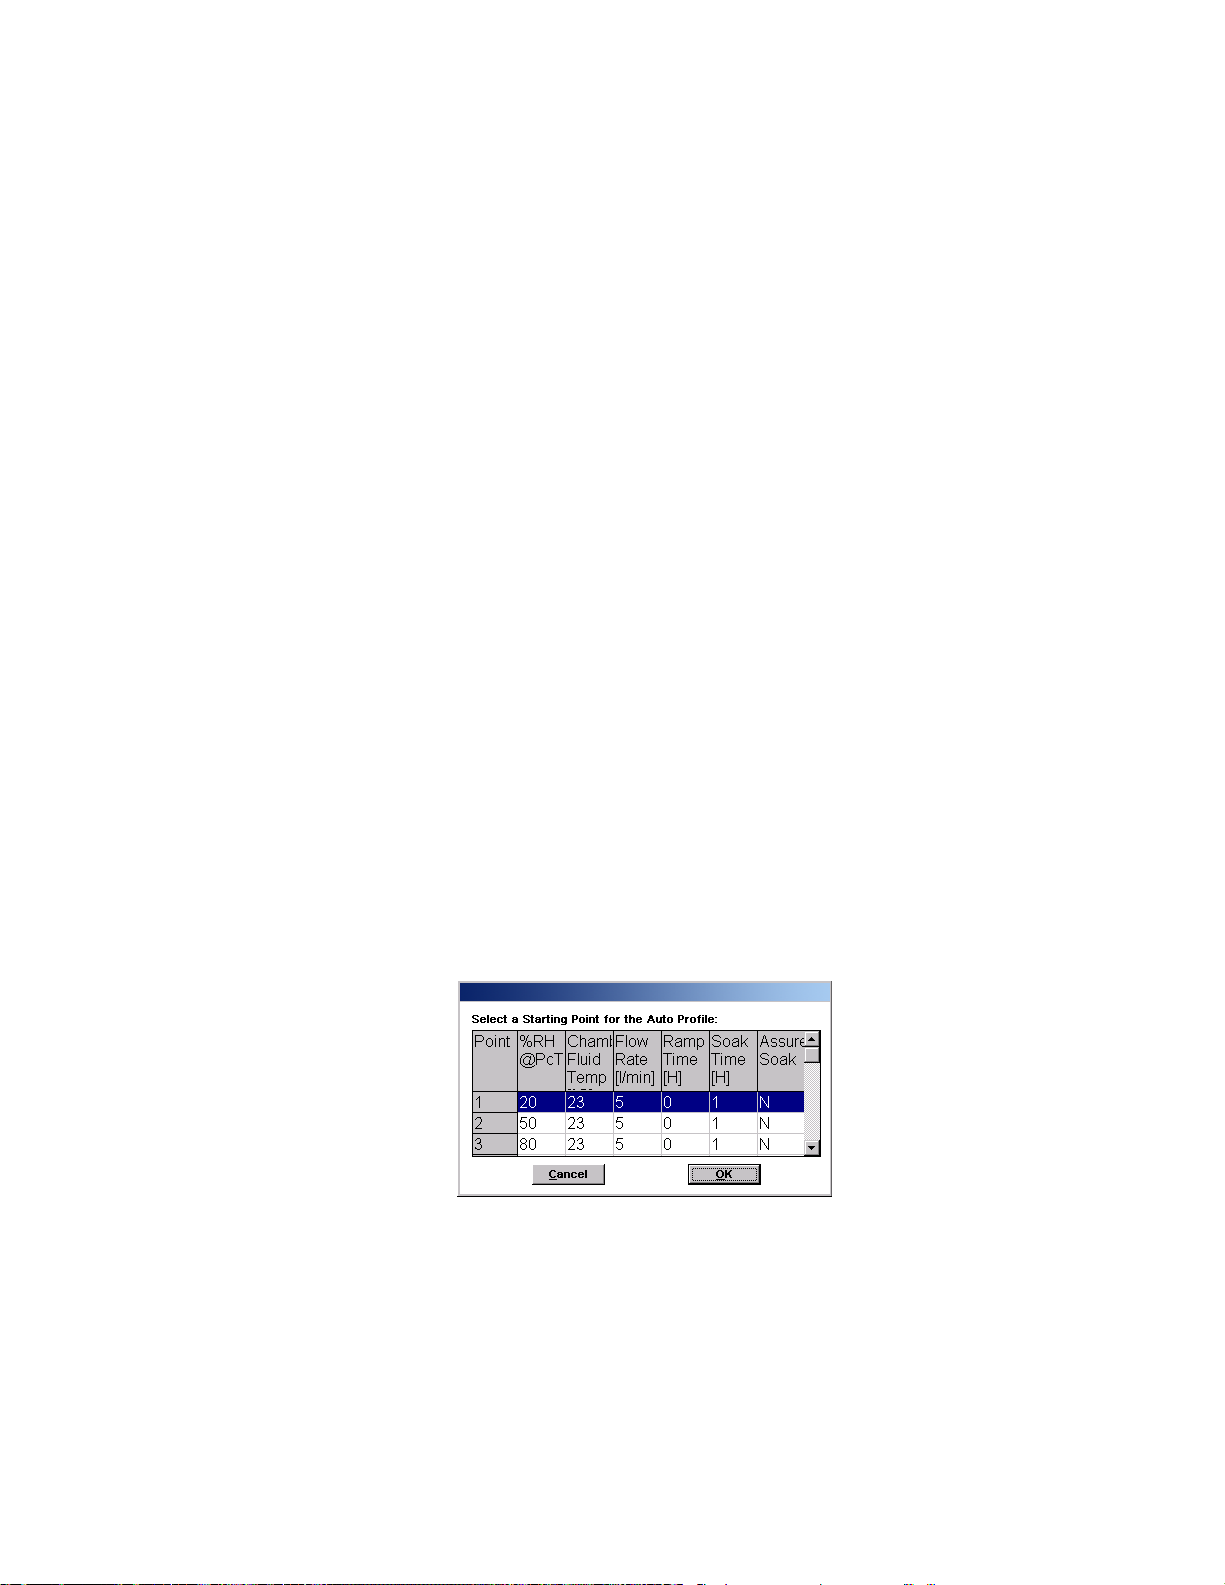
are saved with all attributes such as control mode, engineering units, assurance conditions, historical
data mode, etc..
3.13.1.9 Open an Existing Profile
To retrieve a profile from disk, select Open Profile... from the Profile drop-down menu. Choose an
existing profile filename using the dialog box. W hen opened, the profile is verified and then loaded into
memory. The previous profile is cleared from memory and the new profile is loaded with all attributes that
it was saved with.
3.13.1.10 Printing a Profile
To print a copy of the profile in memory, select Print Profile from the Profile drop-down menu. It is best
to save the profile to disk before printing so that the profile name will also be printed.
3.13.1.11 Saving a Profile as the Default
To make a specific profile the default, which loads automatically at power-up, save it as
c:\windows\thunder\profile.prf.
3.13.2 Starting the Auto Profile
1. Check the Profile window to assure the profile exists in the system memory.
2. If the profile uses assurance conditions, verify assurance conditions are correctly specified.
3. Select Auto Profile from the Run drop-down menu.
4. Select the starting point from those listed in the dialog box, then click OK.
The setpoints from the selected starting point will be entered into the appropriate setpoint fields of the
Main Window and the generator will start-up in the same fashion as a normal generate mode.
3-35
Page 77

3.13.2.1 Understanding Phase and Point
Each profile point consists of three distinct phases; Ramp, Assurance and Soak. Each phase
accomplishes a specified task.
The Ramp phase is used to linearly transition from one point's setpoints to the next point's setpoints in a
given amount of time.
The Assurance Phase forces the system to wait until measured parameters and setpoint values are
within a specified tolerance and stability before the computer starts the Soak Phase.
The Soak Phase is the desired amount of time to generate the particular profile point before proceeding
to the next point.
Examples of Ramp/Soak/Assured Soak Phase combinations:
Example 1: Ramp Time Soak Time Assured Soak
0 1 N
Example 1 causes the Soak phase to begin immediately at the start of the profile point, even though the
1200 may still be adjusting to the point. The next point will start after the 1 hour soak phase.
Example 2: Ramp Time Soak Time Assured Soak
0 1 Y
Example 2 causes the Assurance phase to begin immediately at the start of the profile point. The
measured values are continually compared with the setpoint values until they agree to within a set
tolerance and the measured values are stable to within the specified degree. Once assured (tolerances
met) the Soak phase begins. Total time required for this point is variable and depends upon the amount
of time that is required for assurance (dictated by tolerances). Total time for example 2 is elapsed
assurance time plus 1 hour.
Example 3: Ramp Time Soak Time Assured Soak
.5 1 Y
The Ramp phase (Ramp Timer) begins at the start of the point. The system adjusts slowly
setpoint, taking 30 minutes. Once the Ramp Time has elapsed, Assurance starts and waits for
tolerances to be met. When tolerances are met, the Soak phase begins and lasts 1 hour. Total time for
example 3 is 30 minutes, plus elapsed Assurance time, plus 1 hour. Assurance time is a variable and
depends on tolerances.
3.13.3 Manual Override of Profile
Although the system is operating automatically, some manual control is allowed using the Hold Point,
Next Phase and Next Point menu items on the Run drop-down menu.
3.13.3.1 Holding the Profile
Selecting Hold Point from the Run drop-down menu stops the current "Remaining Time" timers, allowing
these times to be effectively increased by the operator.
toward the
3-36
Page 78

If the system is in an Assurance phase, the Hold Point will prevent the system from assuring and holds
the profile at the current point.
To resume the profile point, select Hold Point again. This re-enables the timing functions and allows the
profile to resume normal operation.
3.13.3.2 Advancing to the Next Phase
Selecting Next Phase from the Run drop-down menu manually duplicates the action which automatically
occurs when a Remaining Ramp or Soak Time counter reaches zero (0), or when the assurance
conditions are met. In other words, it causes Ramp Phase to proceed to the Assurance or Soak Phase,
Assurance to proceed to Soak, or Soak to proceed to Ramp of the next profile point. This allows for early
manual termination of any phase within a profile point.
3.13.3.3 Advancing to the Next Point
Selecting Next Point from the Run drop-down menu manually duplicates the action, which automatically
occurs when the point time counter reaches zero (0).
3.13.4 Stopping an Auto Profile
A Shutdown may be performed at any time during a profile but will automatically occur when the last soak
phase has been completed.
System Shutdown is performed by the computer and consists of the following actions:
1. Flow and Expansion valves close.
2. Pressure Vent valve opens.
3. All control is disabled.
4. User is asked to save data.
Another way to exit the Auto Profile is to switch from Auto Profile to Generate. The current setpoints for
Saturation Pressure, Saturation Temperature and Flow are used to control the system at its current
humidity control mode point.
3.13.5 Special Considerations While Auto Profiling
Auto Profiling may be initiated from either a Generate or Shutdown condition.
3-37
Page 79
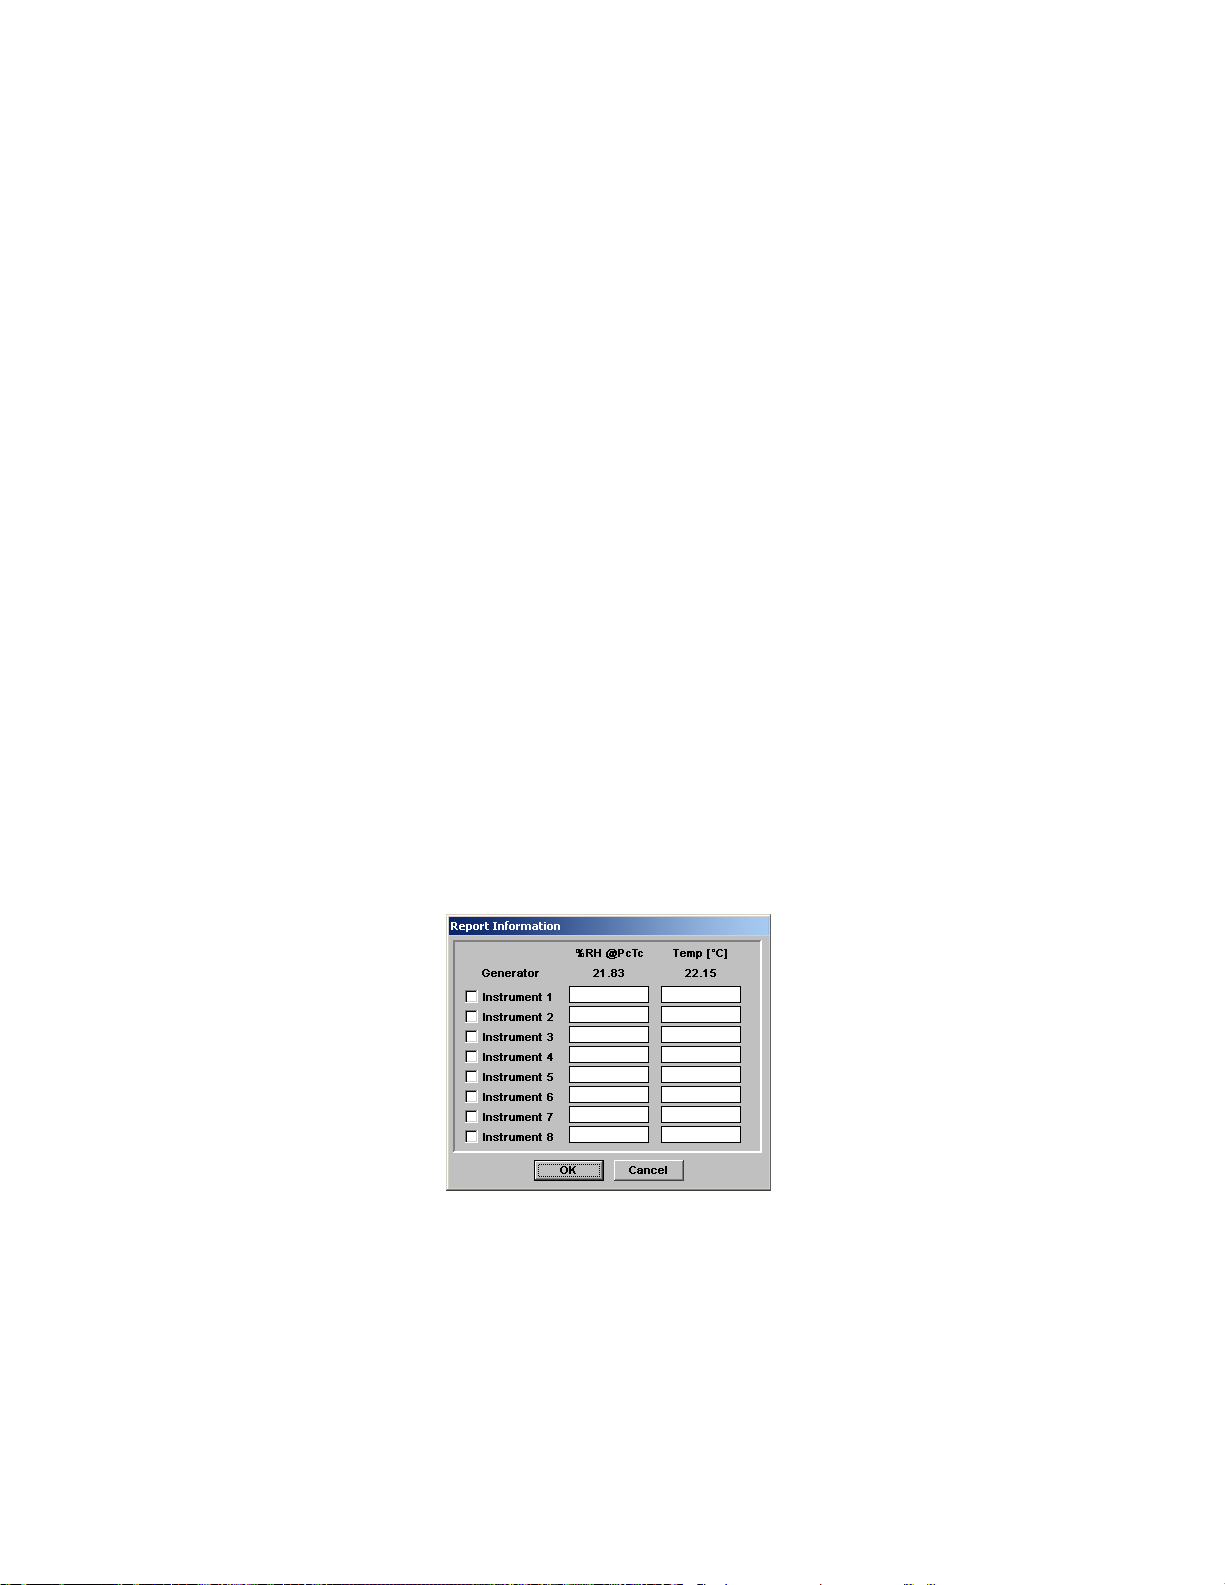
3.14 REPORTS
ControLog can create custom reports containing generator and user supplied data for up to eight
individual instruments. Data may be collected for as few or as many points as desired. Data collected is
placed into a set of temporary files for later use by the Report Editor. Data is written into these temporary
files in the following format:
Gen Temp 1200 Data Instr Data Correction
Date/Time Mode Unit Hum Temp Hum Temp Hum Temp
------------------- ------- ------ ------- ------- ------- ------- ------ -------
06Dec03 12:48 %RH C 90.01 21.005 90.27 21.062 -.27 -.062
06Dec03 13:25 %RH C 84.99 21.010 85.35 21.050 -.35 -.050
06Dec03 13:52 %RH C 70.00 21.000 70.24 21.045 -.24 -.045
Each data entry into a temporary file is time and date stamped, and includes the generated humidity
mode and temperature units. The corresponding instantaneous value of the generated humidity and
temperature is included along with the humidity and temperature that the user enters for the instrument
under test. Also included are calculated correction values, which are computed as the difference
between the generated values and those, entered for the test instrument. There is a separate temporary
file created for each of the eight test instruments.
3.14.1 Collecting Report Data
To collect system and instrument data:
1. Assure both the generator and your instruments are stable at the desired point.
2. Select Save Data Point Now... from the Reports drop-down menu. In the dialog box that
appears, the current generated humidity and temperature have already been supplied.
3-38
Page 80
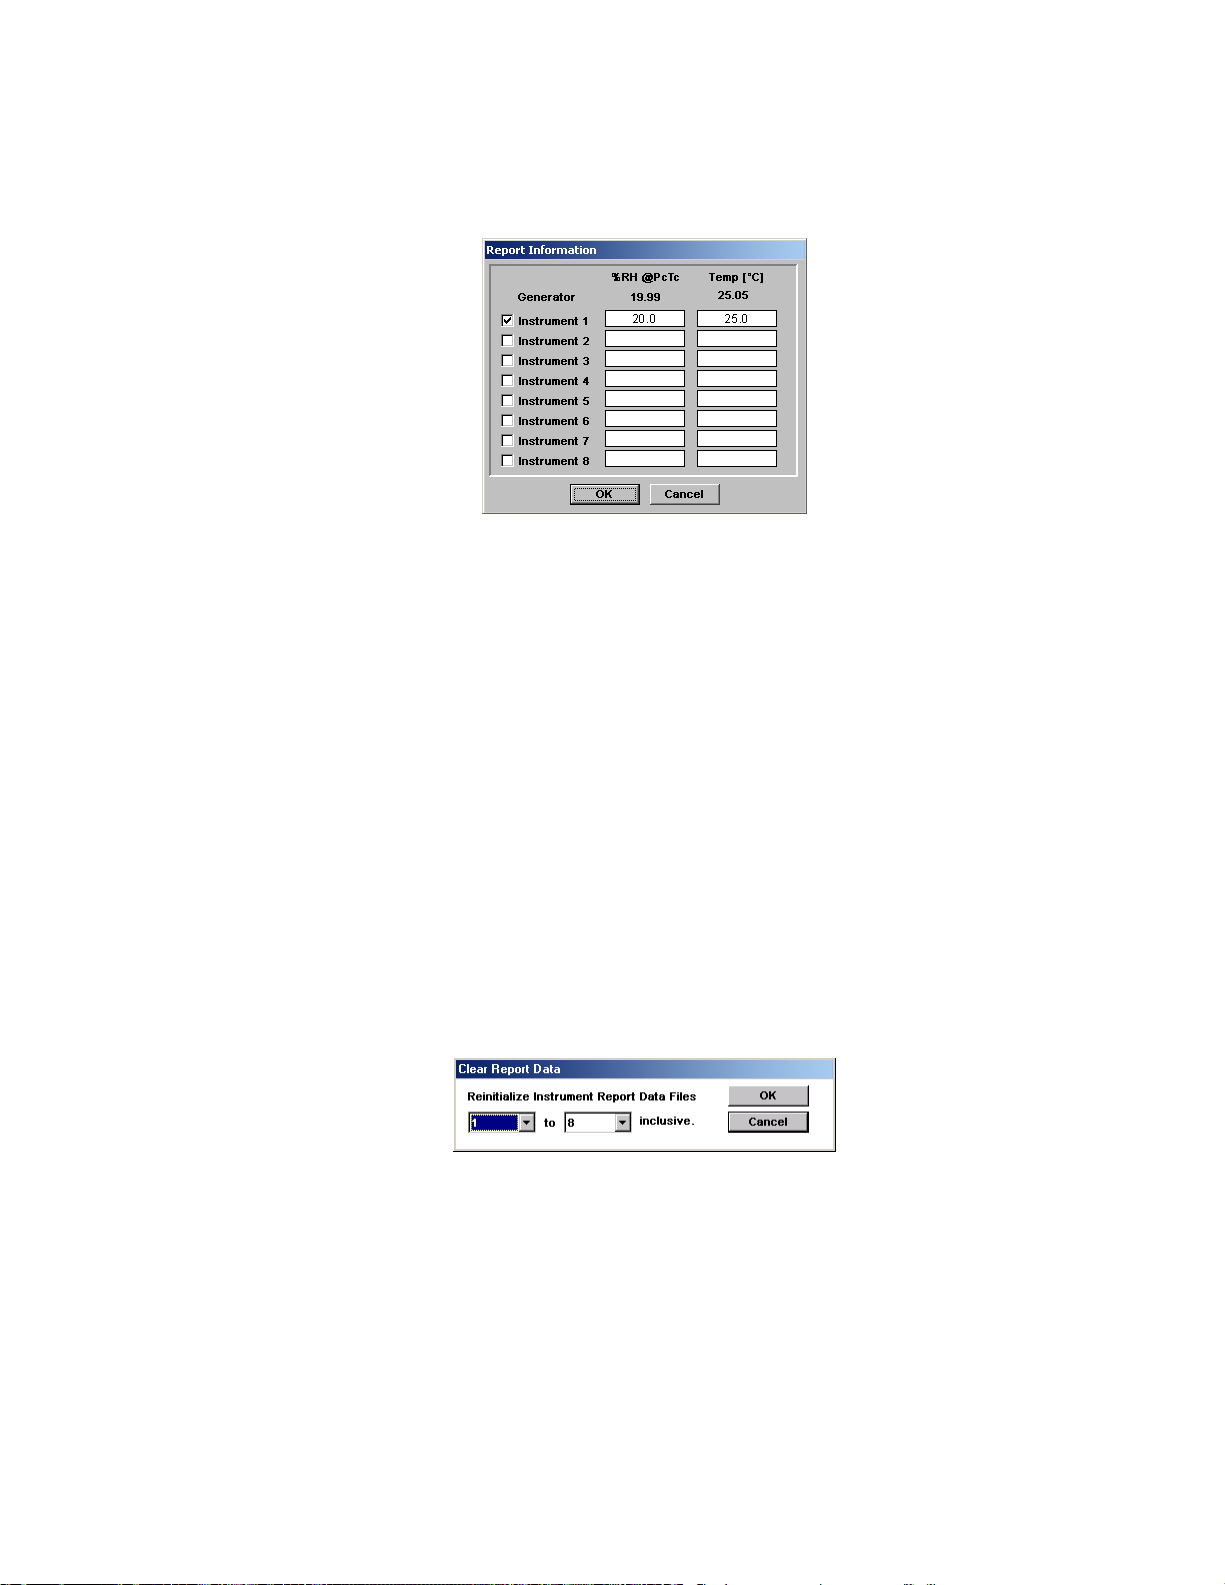
3. Click on the data entry field, which corresponds to the instrument data you wish to supply. Enter
the data, taking note of both the humidity mode and units.
4. Once you have entered all of your data for each of the instruments, Click OK. Data will be
appended to a temporary data file for each of the selected instruments.
5. Repeat steps 3 through 4 at each humidity/temperature point that requires instrument data to be
entered.
6. When the run is complete, and all of the test instrument data has been collected, use the Report
Editor to edit, print, and save the instrument reports (see section 3.11.3 The Report Editor).
3.14.2 Clearing Report Data
To start collecting data to a new temporary report data storage file, it is necessary to clear the current
temporary data storage file or restart ControLog.
To clear report data storage files:
1. Select Clear Report Data... from the Reports drop-down menu. The following dialog box will
appear.
2. Select the desired range for the data files to clear and click OK.
3.14.3 The Report Editor
The Report Editor allows for customized report generation showing test instrument performance data.
Once the data has been collected (see section 3.14.1 Collecting Report Data), the Report Editor is used
to preview, edit, print, and save completed reports for each instrument under test.
3-39
Page 81
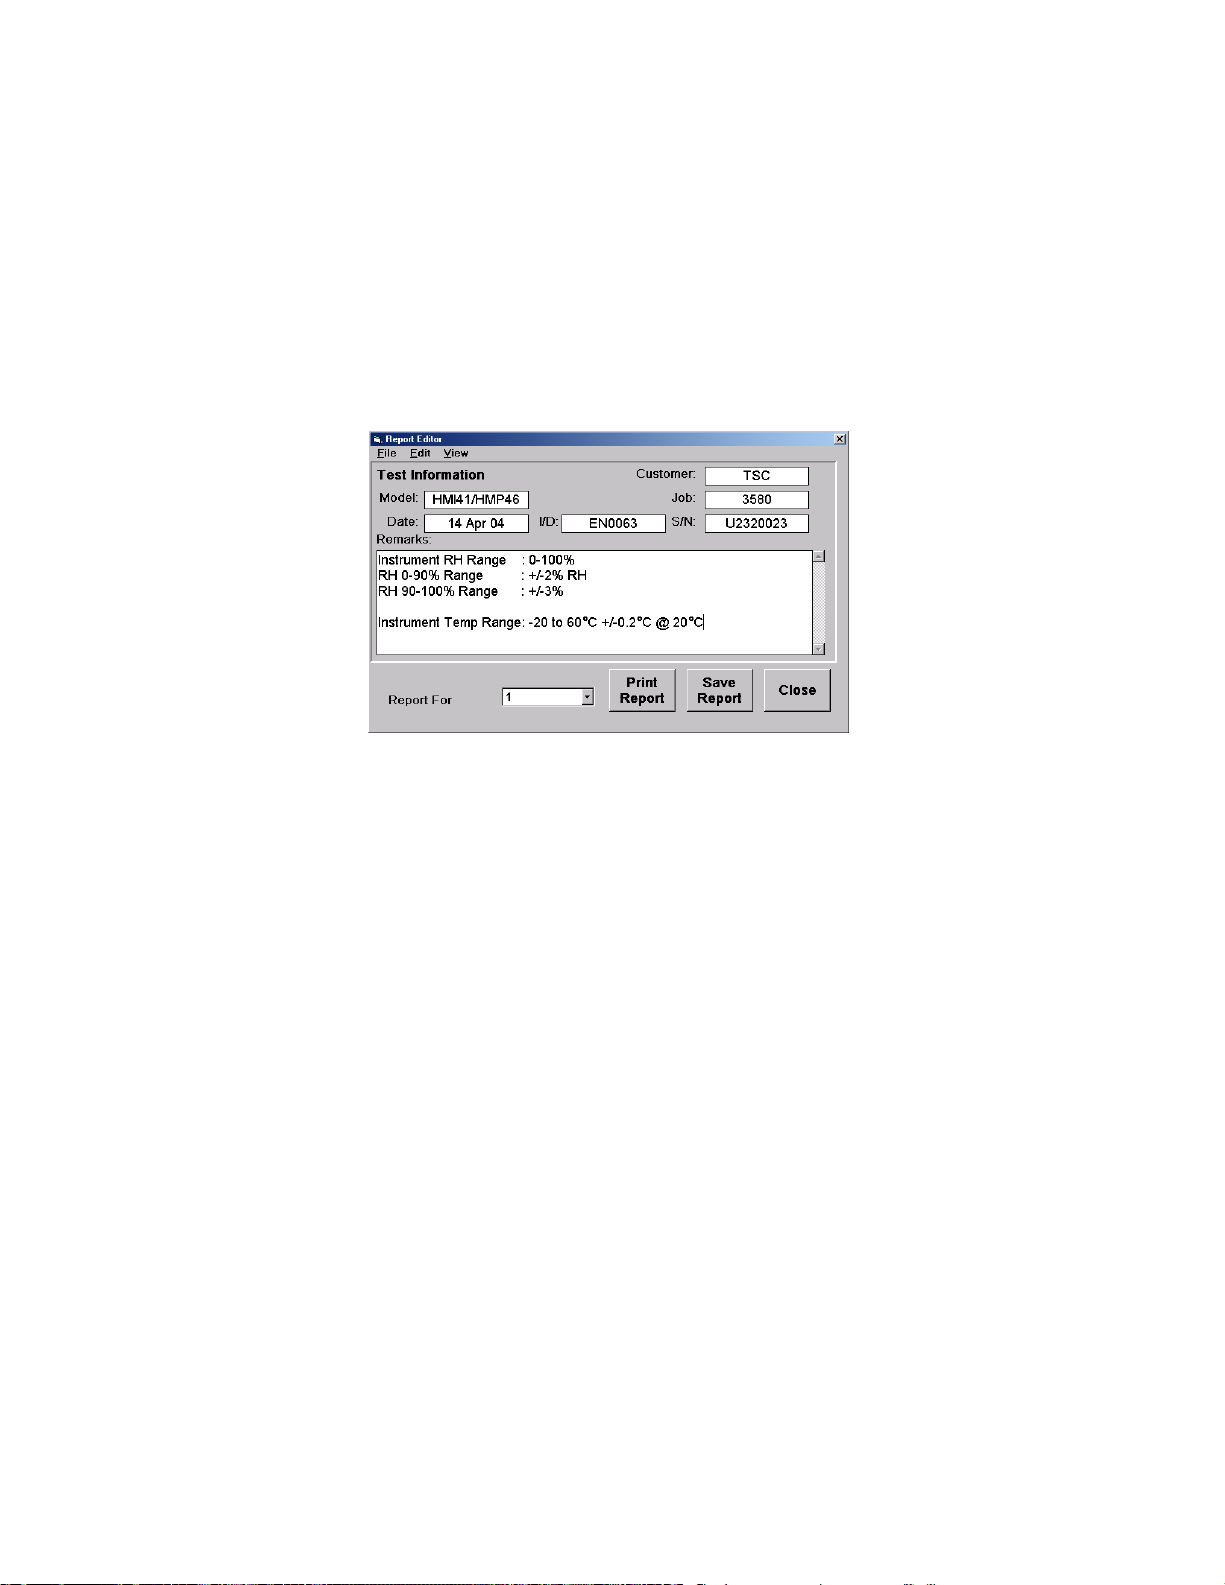
3.14.3.1 Creating, Printing, and Saving a Report
Each report consists of a Header, Test Information, Data, and a Footer section. Each of these elements
are editable prior to printing and/or saving the report. The Header, Test Information, and Footer sections
are completely customizable and may be saved in their customized forms for later recall and inclusion in
future reports.
To create, print, and save a report:
1. Select Report Editor... from the Reports drop-down menu. The Report Editor appears.
2. Select Header from the View drop-down menu. Load, edit, or save the header information as
needed (see section 3.14.3.2 Editing the Header).
3. Select Footer from the View drop-down menu. Load, edit, or save the footer information as
needed (see section 3.14.3.3 Editing the Footer).
4. If not already showing, select Test Information from the View drop-down menu. Load, edit, or
save the test information as needed (see section 3.14.3.4 Editing the Test Information).
5. Select Data from the View drop-down menu to bring up the data screen.
6. From the Report for Instrument: box at the bottom of the screen, select an instrument number.
The previously collected data for the selected instrument appears on the screen.
7. Edit the data if needed (see section 3.14.3.5 Editing the Data).
8. Click Print Report to print a report for the instrument selected using all of the information
(header, footer, data, etc.) as currently edited.
9. Click Save Report to save the report to a text file. A dialog box appears asking for the
destination filename.
10. Enter a valid filename and click OK, or click Cancel to abort the file save process. Saved reports
are stored as standard text files, and may be imported into a word processor or text editor
program for viewing or further editing at a later date.
11. Repeat steps 2 through 9 as needed for each of the instruments requiring reports.
3-40
Page 82
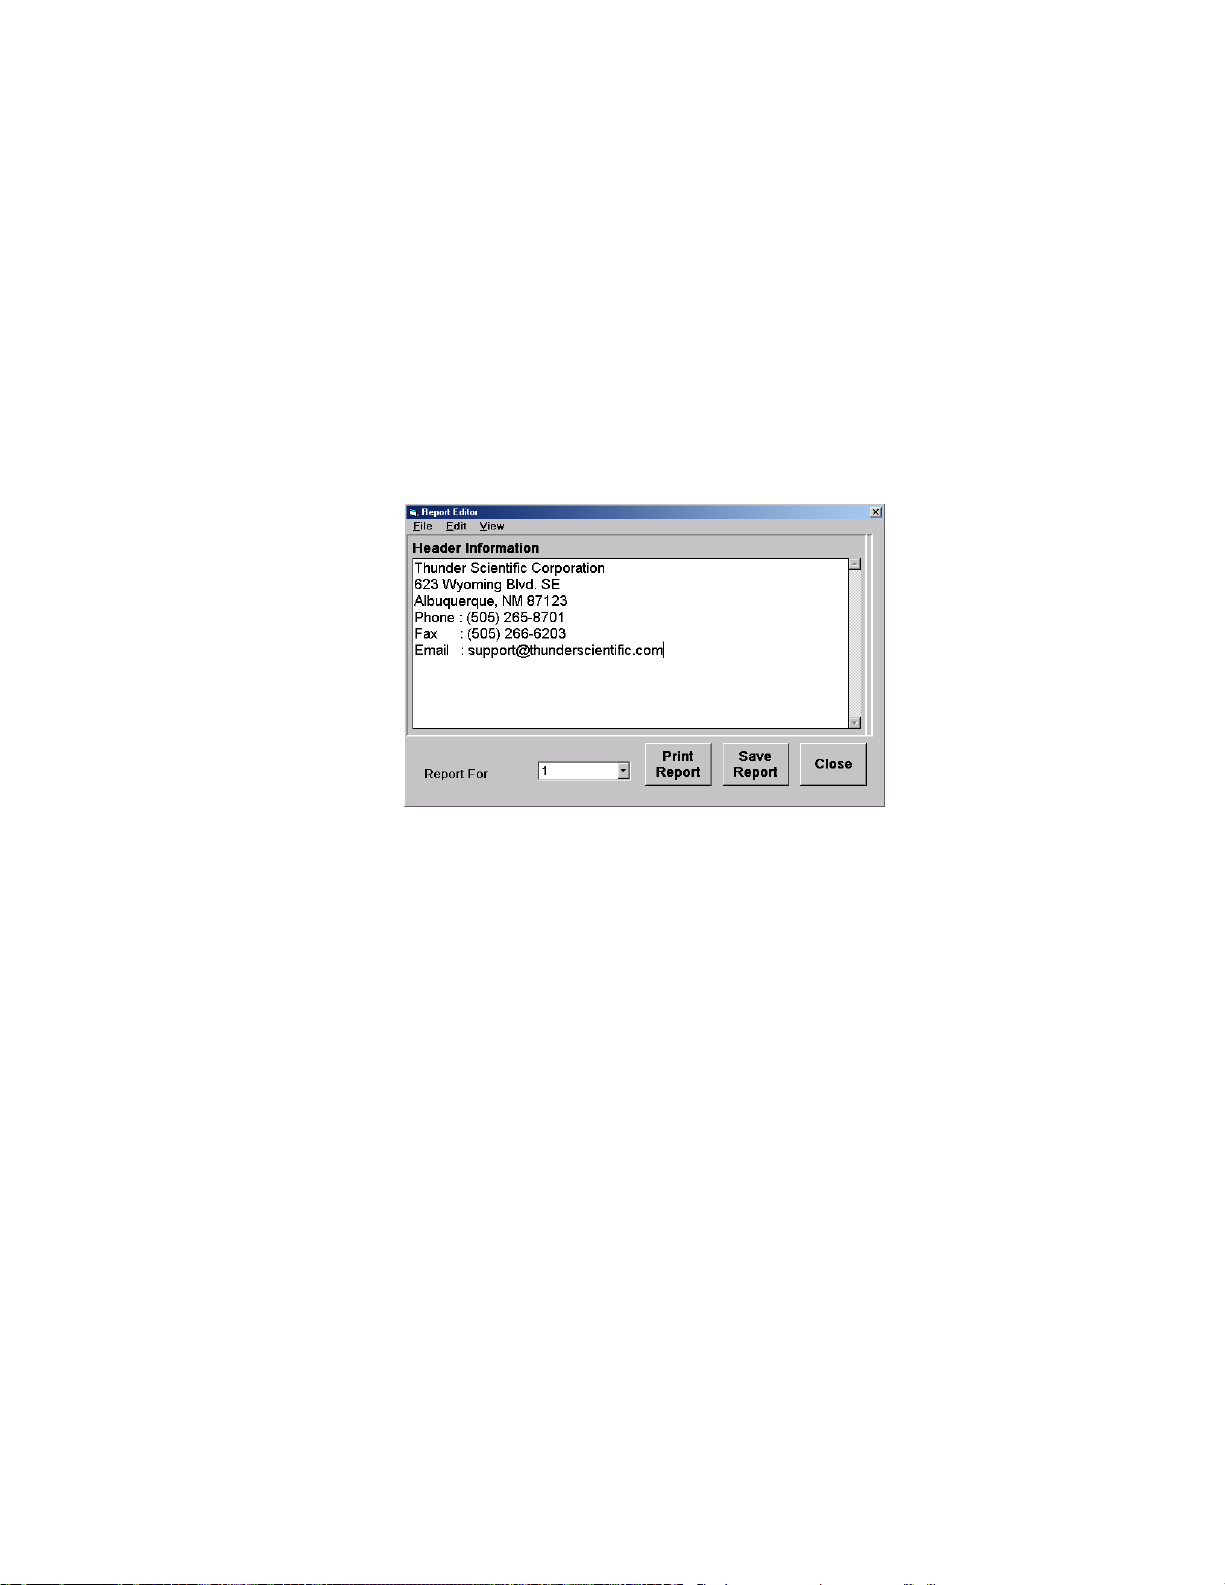
3.14.3.2 Editing the Header
The report header is printed at the top of each report and should contain fixed information such as
Company Name, Address, etc. Several report headers may be created and saved for use with different
types of report styles. For example, a different header would most likely be used when printing a report
on letterhead rather than on plain paper. The header information on the screen at the time of printing or
saving a report is the information that is used for that report.
Editing a report header:
1. If not already in the Report Editor, select Report Editor... from the Reports drop-down menu.
2. If the Header window is not visible, select Header from the Report Editor's View drop-down
menu.
3. Using normal text editing procedures, edit the header text as needed. Add blank lines (using the
Return key) at the top of the header to shift the entire report downward as needed. The header
can be centered visually using spaces to the left of each line.
Saving a report header:
1. Once edited, save the header for later recall by selecting Header... from the Save sub menu of
the Report Editor's File menu.
2. From the dialog box that appears, enter an appropriate header filename. Use a .hdr suffix when
naming header files. This makes it easier to distinguish them from other types of files when
recalling them later.
Recalling a previously stored report header:
1. Select Header... from the Open sub menu of the Report Editor's File menu. A list of any
previously created header files is displayed (files with a .hdr suffix).
2. Select a header file from the list, or enter a valid filename in the dialog box that appears. Click
OK to load the header selected, or click Cancel to abort the load process and retain the current
header information.
3-41
Page 83
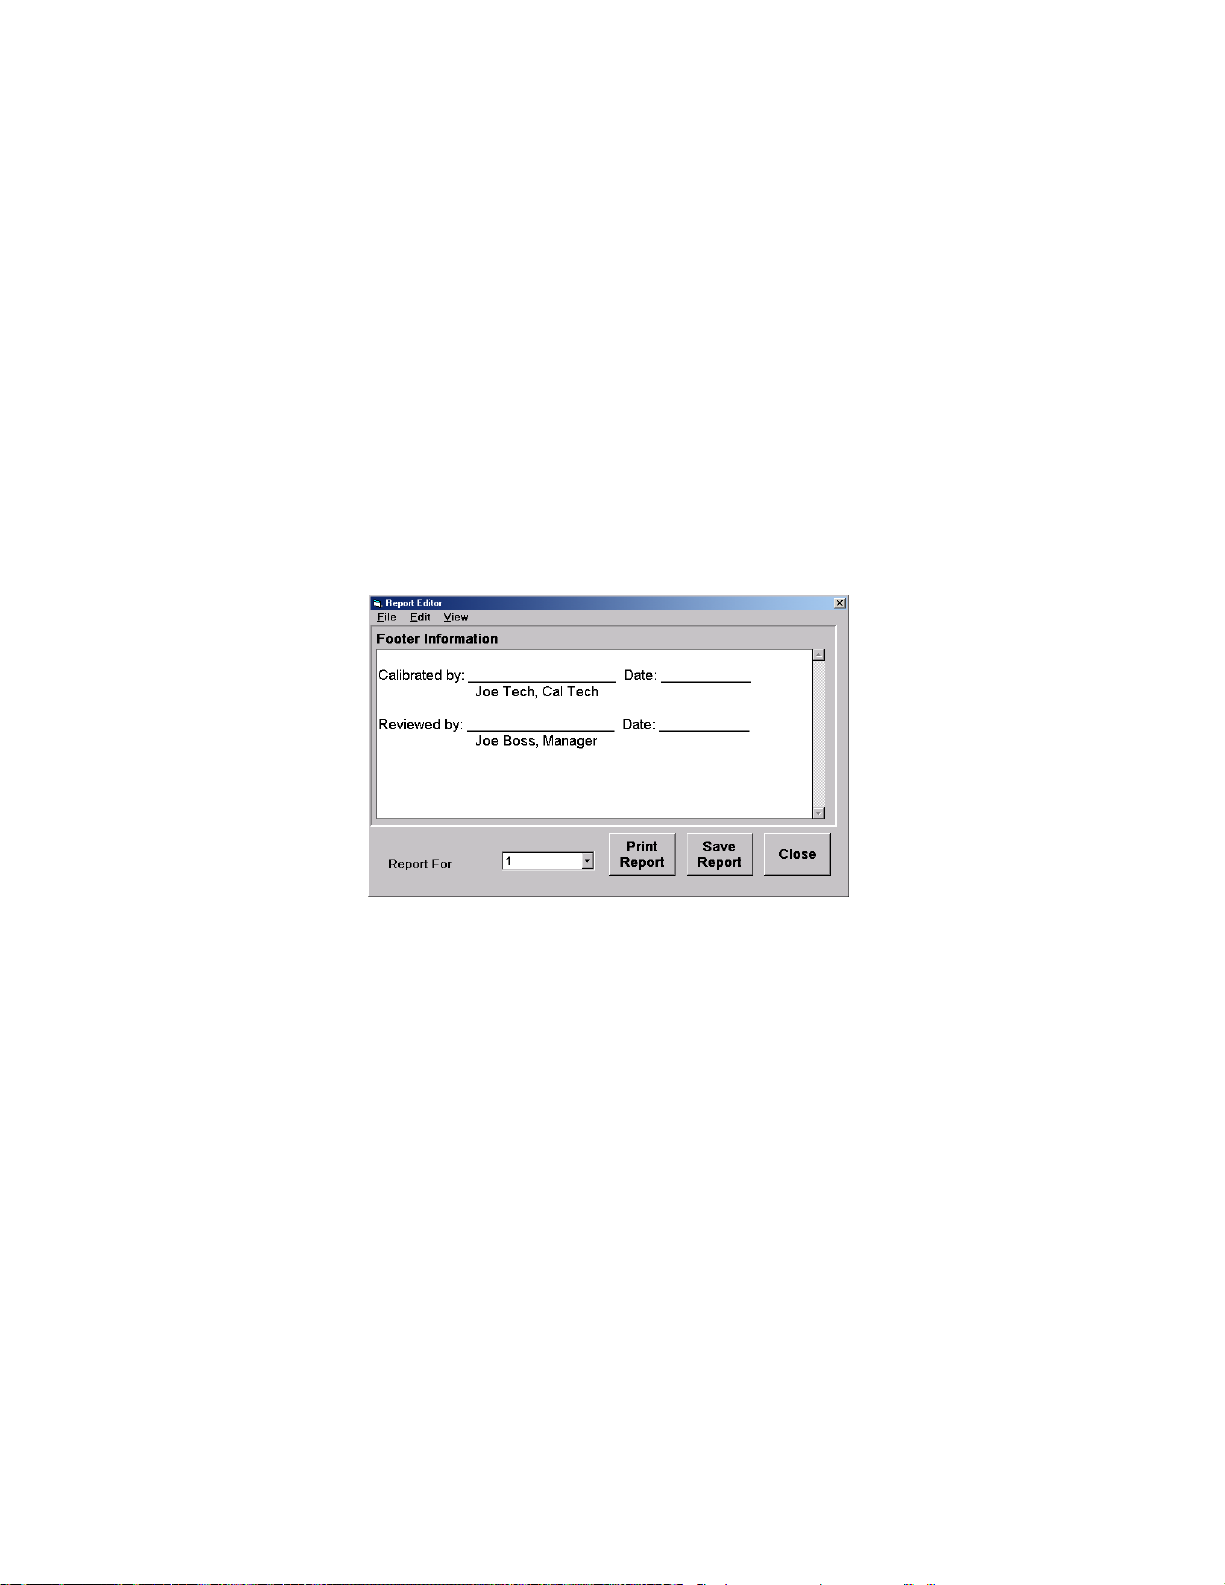
Saving a default report header:
To make a header the default header, save it as c:\windows\thunder\header.hdr.
3.14.3.3 Editing the Footer
The report footer is printed at the bottom of each report and should contain fixed information such as
technician name, signature and date lines, etc. Several report footers may be created and saved for use
by different technicians. The footer information on the screen at the time of printing or saving a report is
the information that is used for that report.
Editing a report footer:
1. If not already in the Report Editor, select Report Editor... from the Reports drop-down menu.
2. If the Footer window is not visible, select Footer from the Report Editor's View drop-down menu.
3. Using normal text editing procedures, edit the footer text as needed.
Saving a report footer:
1. Once edited, save the footer for later recall by selecting Footer... from the Save sub menu of the
Report Editor's File menu.
2. From the dialog box that appears, enter an appropriate footer filename. Use a .ftr suffix when
naming footer files. This makes it easier to distinguish them from other types of files when
recalling them later.
Recalling a previously stored report footer:
1. Select Footer... from the Open sub menu of the Report Editor's File menu. A list of any
previously created footer files is displayed (files with a .ftr suffix).
2. Select a footer file from the list, or enter a valid filename in the dialog box that appears. Click OK
to load the footer selected, or click Cancel to abort the load process and retain the current footer
information.
3-42
Page 84
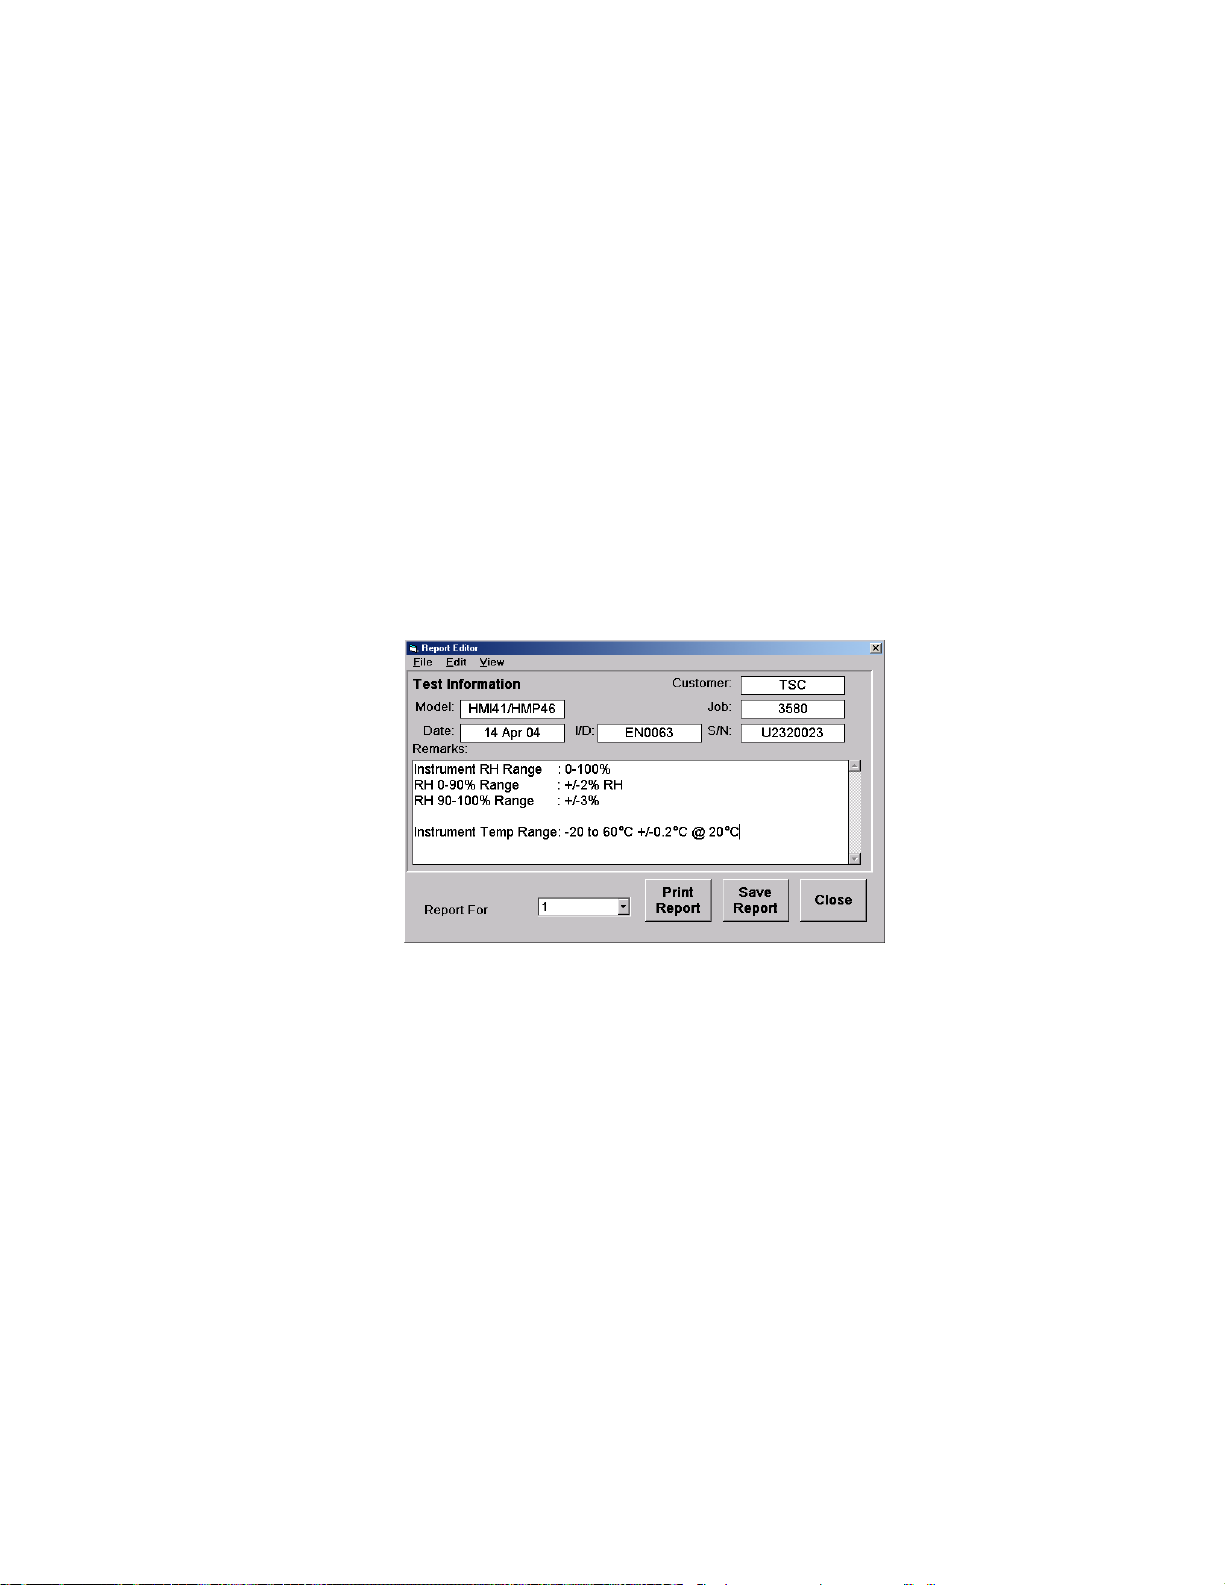
Saving a default report footer:
Create the report footer and save it as c:\windows\thunder\footer.ftr.
3.14.3.4 Editing the Test Information
The test information is printed immediately after the header of each report and should contain fixed
information such as serial number, model number, etc. specific to the instrument under test. Since test
information is device specific, several test information files may be created and stored for later recall.
The test information on the screen at the time of printing or saving is the information that is used for that
report.
Editing the test information:
1. If not already in the Report Editor, select Report Editor... from the Reports drop-down menu.
2. If the Test Information window is not visible, select Test Information from the Report Editor's
View drop-down menu. The Test Information window appears.
3. Using normal text editing procedures, edit the remarks area of the test information section as
needed.
4. Using normal data entry procedures, edit any or all fixed data items such as Serial Number,
Model Number, etc. If an entry is left blank, then neither the title nor the entry will appear on the
report.
5. To change the titles of the fixed data items, hold the Ctrl key and click directly on the title itself.
You will be prompted for a new title for that item.
Saving the test information:
1. Once edited, save the test information for later recall by selecting Test Information... from the
Save sub menu of the Report Editor's File menu.
2. From the dialog box that appears, enter an appropriate Test Information filename. Use a .msc
suffix when naming test information files. This makes it easier to distinguish them from other
types of files when recalling them later.
3-43
Page 85
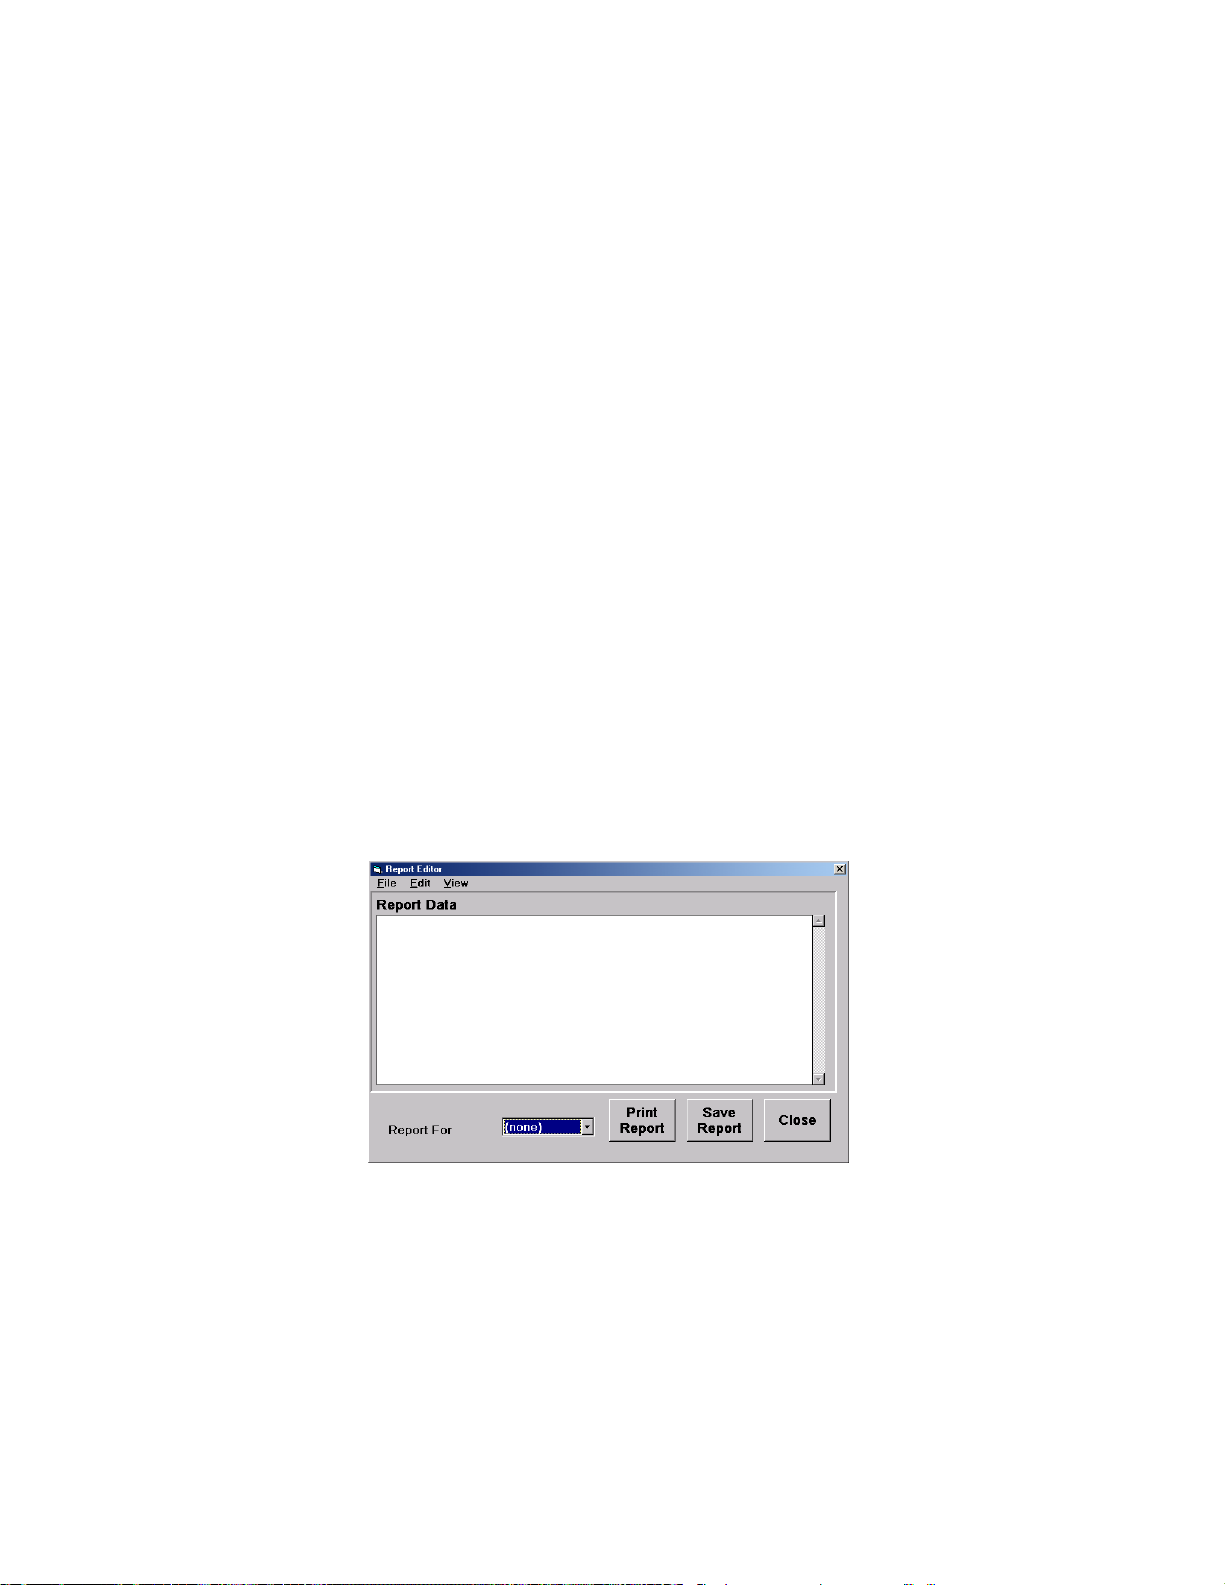
Recalling previously stored test information:
1. Select Test Information... from the Open sub menu of the Report Editor's File menu. A list of
any previously created test information files is displayed (files with a .msc suffix).
2. Select a test information file from the list, or enter a valid filename in the dialog box that appears.
Click OK to load the test information selected, or click Cancel to abort the load process and
retain the current test information.
Saving the default test information
To make the current test information the default, create the report footer and save it as
c:\windows\thunder\misc.msc.
3.14.3.5 Editing the Data
The report data is printed immediately following the test information and contains previously collected
data for the specified instrument. Prior to printing or saving the report, the data may be viewed and
edited. The data as it is on the screen at the time of printing or saving a report is the data that is used for
that report.
Selecting the test instrument data:
1. If not already in the Report Editor, select Report Editor... from the Reports drop-down menu.
2. If the Data window is not visible, select Data from the Report Editor's View drop-down menu.
The Data window appears.
3. From the Report for Instrument: box at the bottom of the screen, select an instrument number.
The previously stored data for the selected instrument appears on the screen.
Editing the data:
Prior to printing or saving, the data text can be edited as needed using normal text editing
procedures.
3-44
Page 86
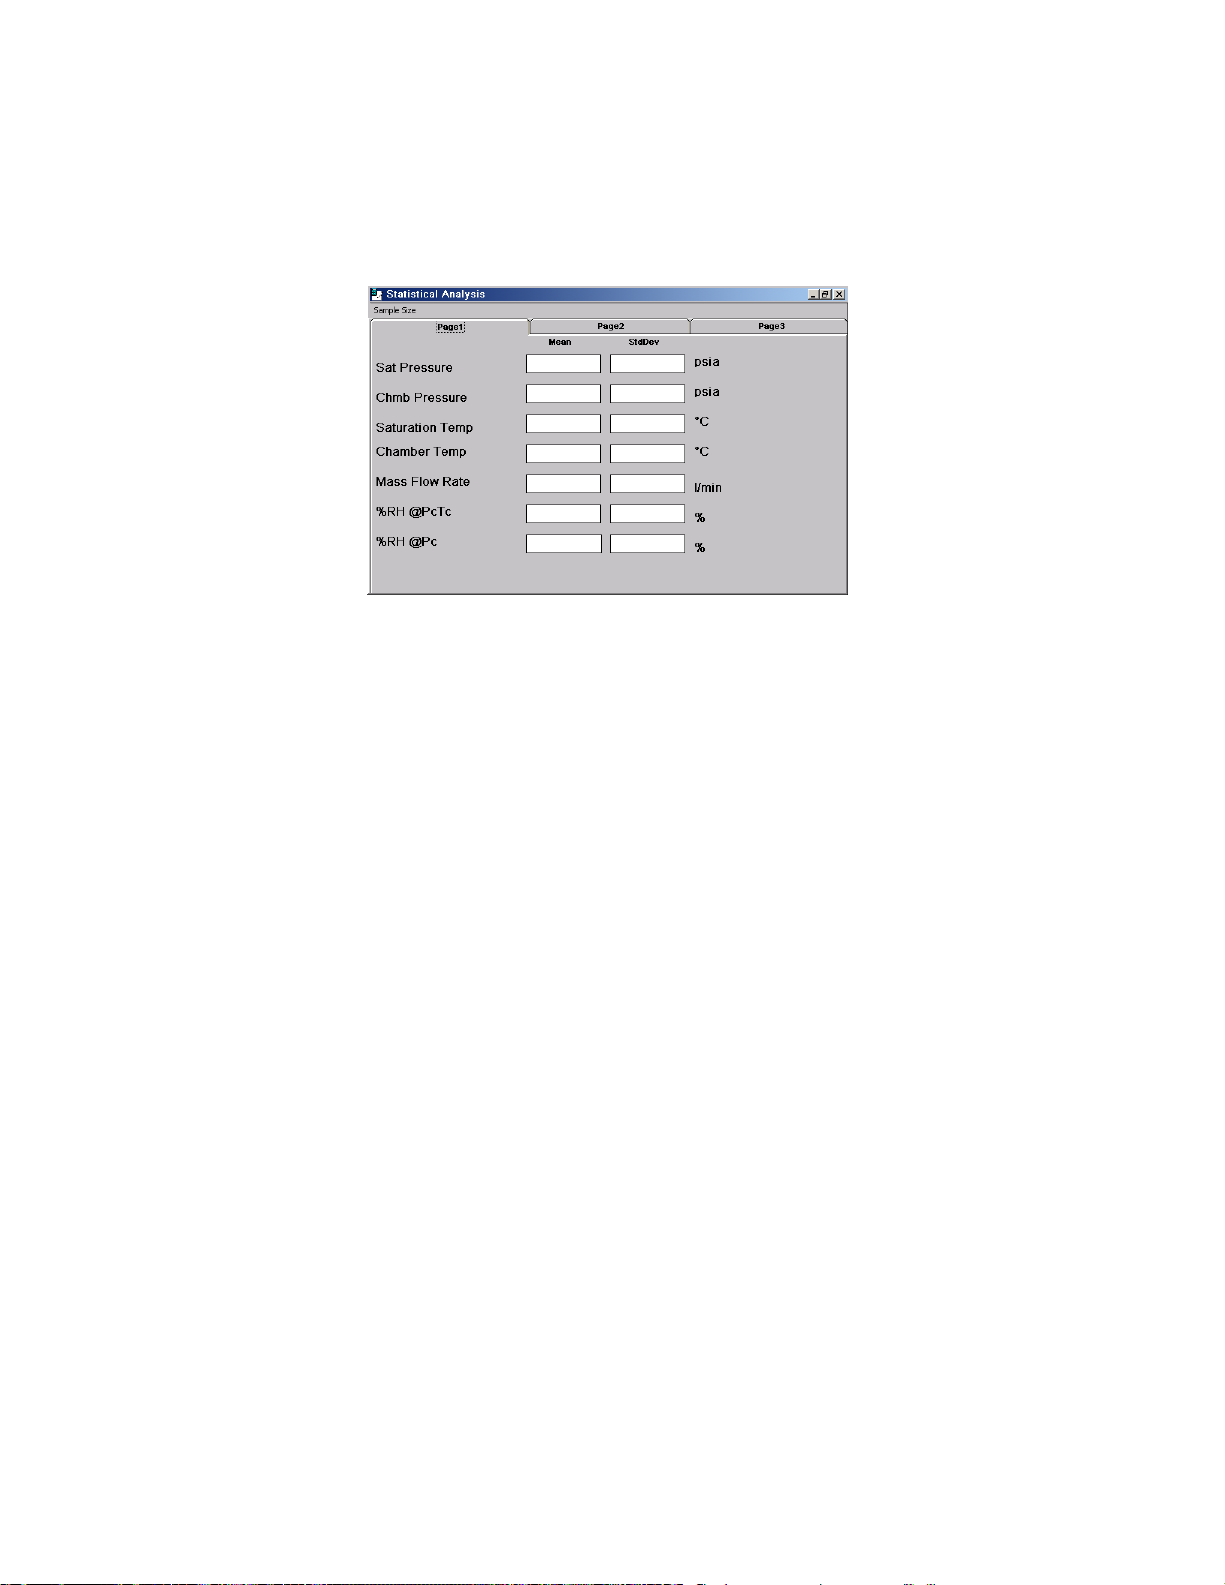
3.15 STATISTICAL ANALYSIS
The Statistical Analysis window provides a method to monitor the stability of the generator. The statistical
mean and standard deviation are calculated for each of the parameters listed and are updated and
displayed continuously in real time.
Both the mean and standard deviation are computed from a fixed size moving data set, which contains
only the most recent data.
To change the size of the data set, click on the Sample Size menu. A dialog box appears prompting for
a new data set size. Click the Page 2 and Page 3 tabs to reveal the rest of the statistical data.
3-45
Page 87

Section 4
CALIBRATION AND MAINTENANCE
4.1 GENERAL
The Model 1200 requires little periodic maintenance. Following the proper operating procedures as
given in this manual will help assure trouble-free operation of this system.
4.2 CALIBRATION
Proper calibration of the temperature and pressure transducers is critical to the accuracy of the
generated humidity. Each time a transducer is calibrated its current calibration coefficients and
calibration data are stored to disk. Calibration of the system requires the following support equipment:
1) Temperature - 10 to 60 °C:
A) Precision temperature bath of specified range with a liquid medium, and stability of ±0.01 °C
or better. Less stable baths may require the use of a thermal block.
B) Reference thermometer of specified range with resolution and accuracy of ±0.05 °C or better.
2) Pressure - ambient to 152 psiA and 0 to 150 psiG:
A) Static gas pressure source with a stability of ±0.01 % of range or better.
B) Reference pressure gage/controller with resolution and accuracy of ±0.08% of full scale or
better.
3) Flow - 0 to 10 standard liters/min:
A) Reference flow meter with resolution and accuracy of ±2 % of range or better.
4.2.1 Temperature Calibration
This temperature calibration procedure is used in conjunction with a precision temperature bath and
precision temperature reference. Using the temperature bath to generate three known temperatures
and a precision temperature reference for measurement, coefficients (ZERO, SPAN, LINEARITY) are
calculated automatically by the computer and used to update the system calibration. Calibration
reports may also be printed for each of the temperature probes at the conclusion of the calibration
sequence.
Equipment Required:
1. Precision Temperature Bath (per section 4.2).
2. Reference thermometer (per section 4.2).
3. Torx T10 driver for removal of covers.
4-1
Page 88
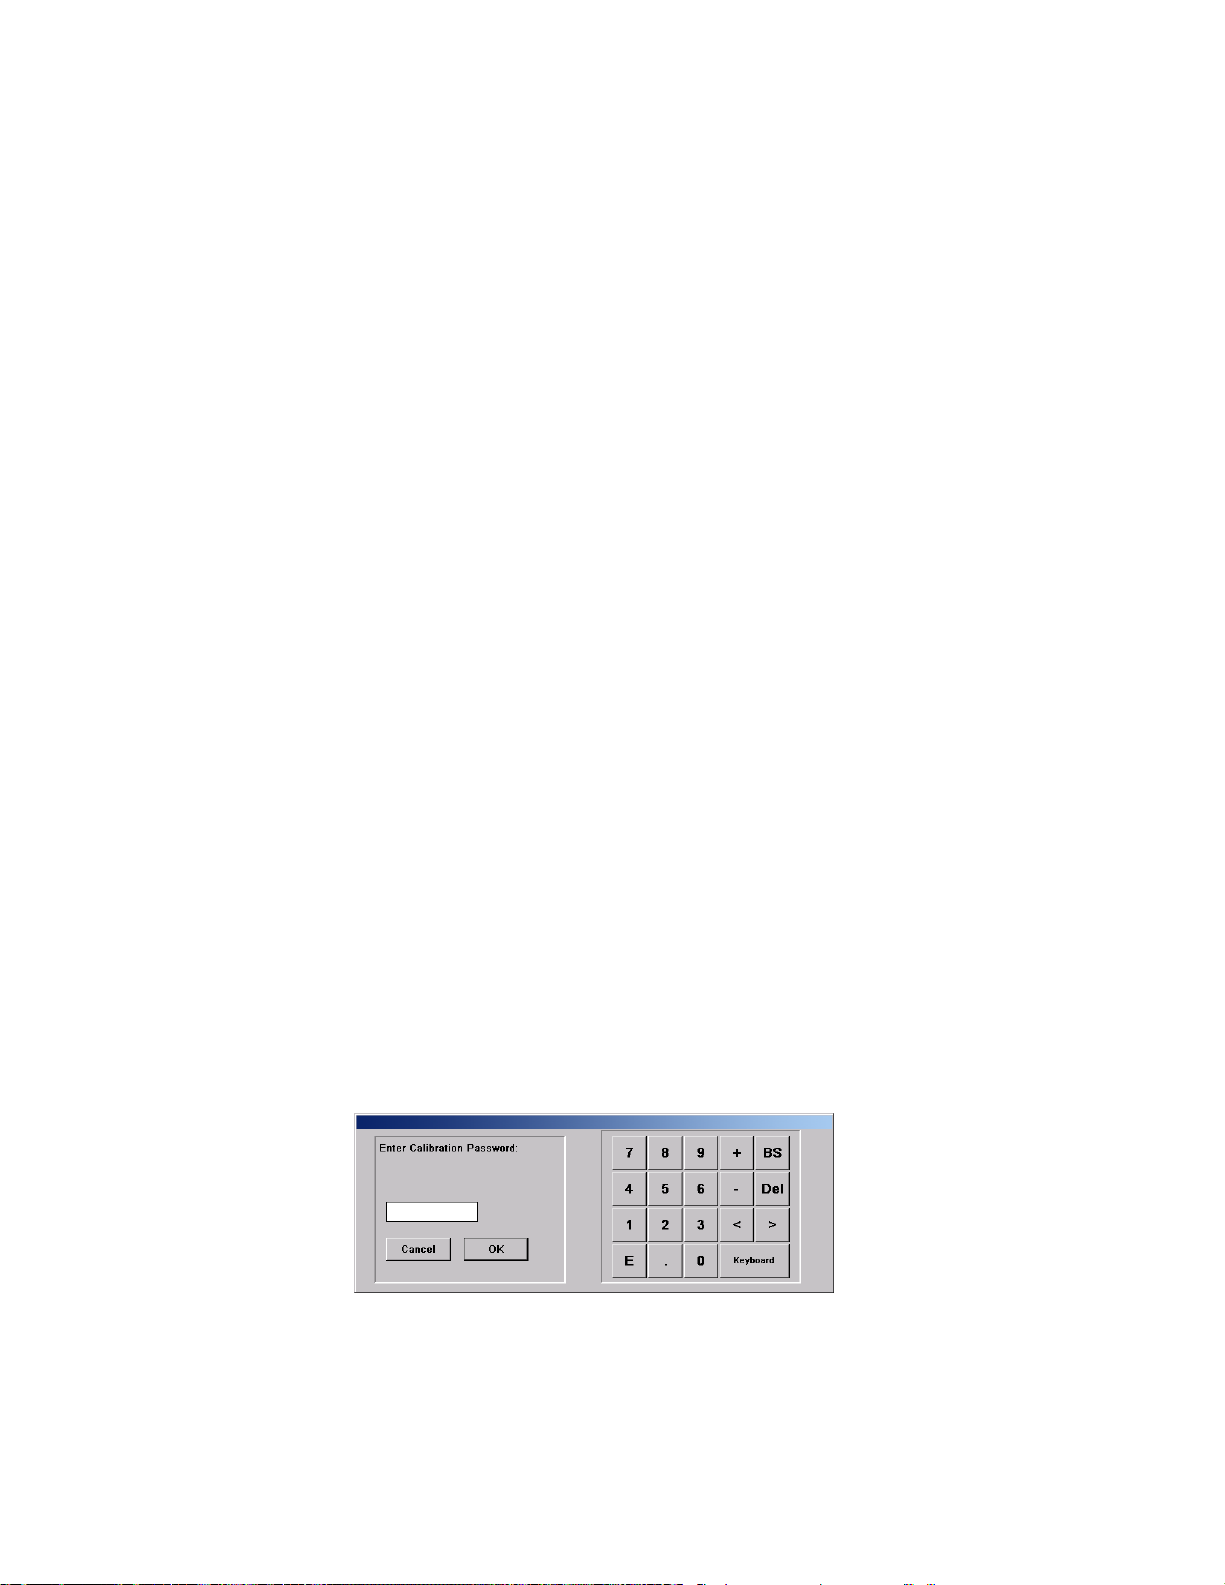
Calibration Procedure:
Reference Drawing 03D12902
1) Perform a shutdown, exit the 1200 ControLog program, shutdown Windows operating system,
switch power OFF, and remove power cord.
2) Remove the top/rear console cover.
3) Remove RTD's from system:
(A) Saturation Temperature RTD0 - Uncoil cable and pull probe out from its location.
(B) Presaturator Temperature RTD1 - Uncoil cable and pull probe out from its location.
(C) Expansion Valve Temperature RTD2 - Remove insulation from probe location, loosen
and pull back clamping nut, remove probe by pulling on rubber restraint (do not pull
probe by the cable), uncoil cable and pull excess cable through the grommet (towards
the probe location).
(D) Chamber Temperature RTD3 - Remove insulation around probe feed through, uncoil
cable, pull rubber cable restraint (inside chamber) loose and pull all excess probe cable
into the chamber, then feed probe and cable through the chamber access port.
4) Couple all RTD probes together along with the temperature reference using small rubber
bands and then insert probes with reference into the precision temperature bath.
5) Connect power and start the 1200's ControLog program.
CAUTION!
DO NOT ENABLE TEMPERATURE CONTROL
WITH RTD's REMOVED FROM SYSTEM.
6) For temperature units other than °C, select the desired temperature units for calibration from
the Units drop-down menu. Once calibration has begun, the units must not be changed
again until calibration is complete.
7) Select Temperature Calibration from the Window drop-down menu. The system then asks
for a Calibration Password
8) Enter the Calibration Password (found at the back of the manual) and click the OK button.
The Temperature Calibration form appears with continuous real time readings of all RTD's.
(Without the password, the calibration screen is in read only mode.)
.
4-2
Page 89
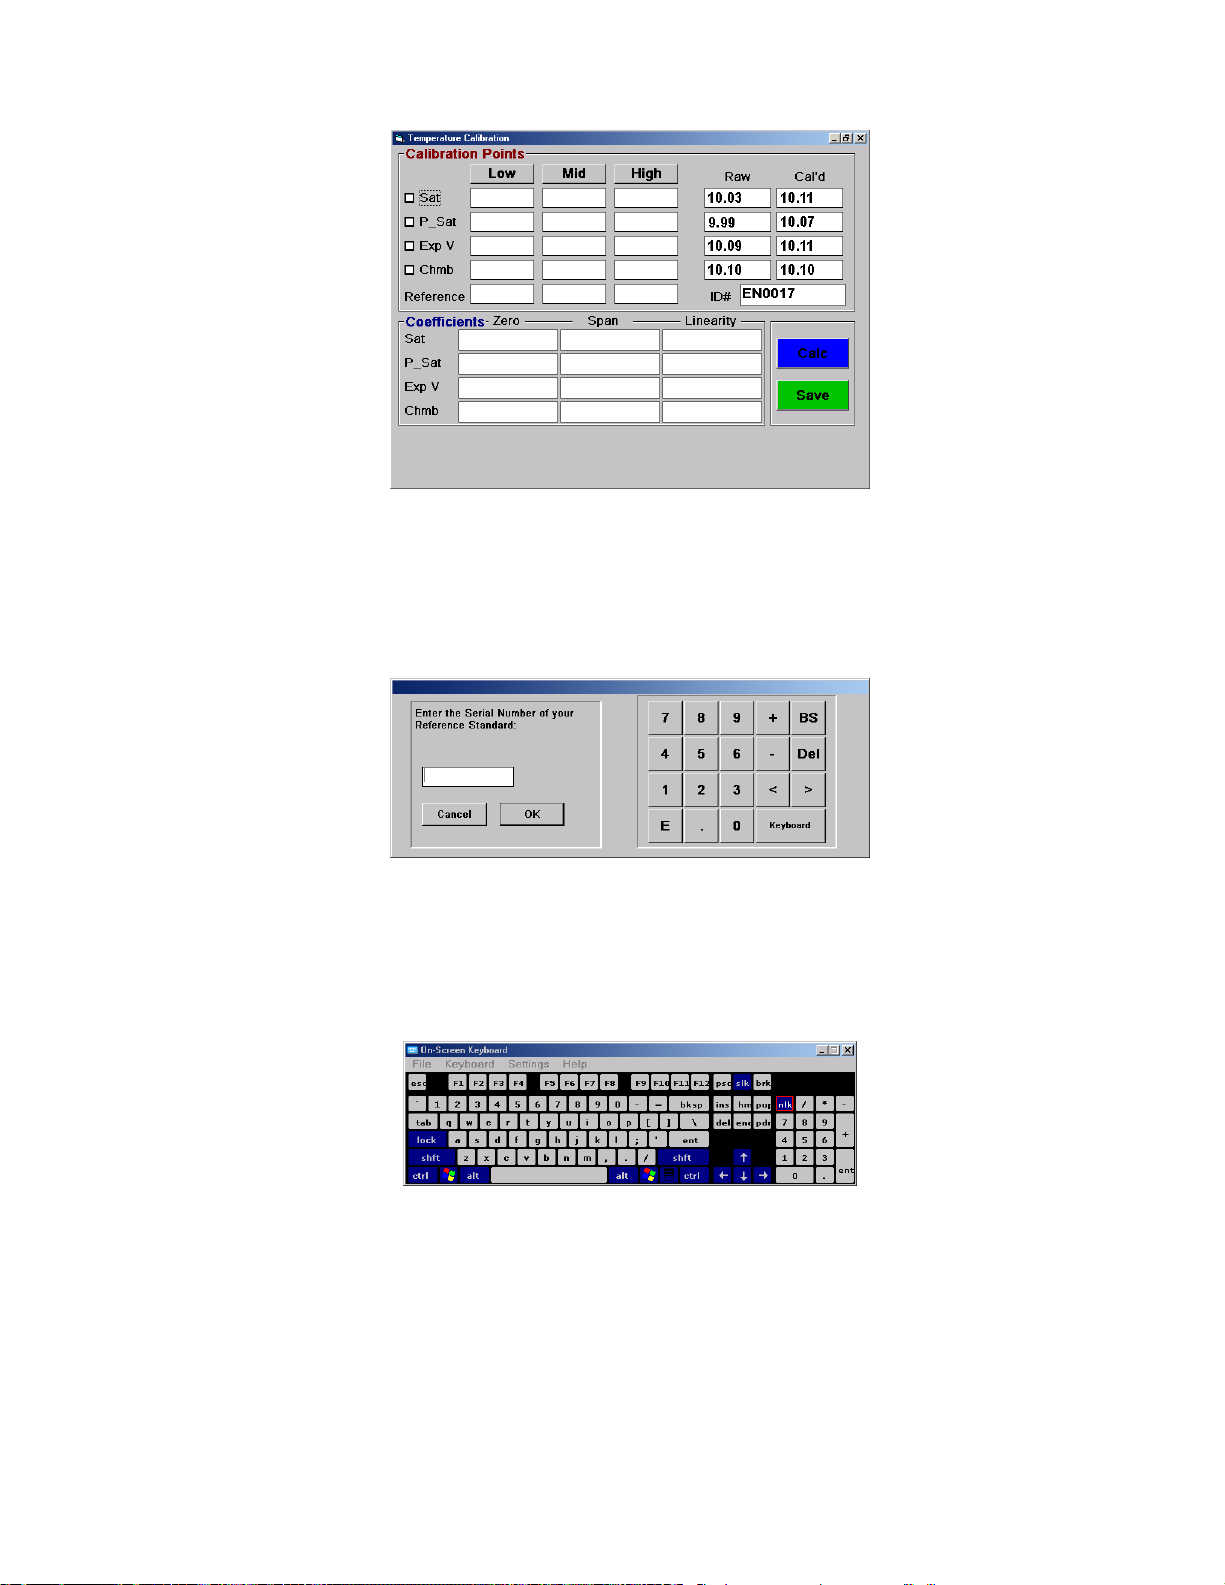
9) Using the check boxes at the left of the temperature calibration window, select the probes
to be calibrated. Then click on the ID# box and enter an identification number for your
reference thermometer. The reference thermometer identification number will then appear on
the calibration records when saved.
Click the Keyboard button and the On-screen Keyboard will appear if alpha characters are
required in identification number.
10) Using the temperature bath, generate a temperature near the low end of the 1200's
temperature range of 10 °C. Once the readings are stable, click the Low button.
4-3
Page 90
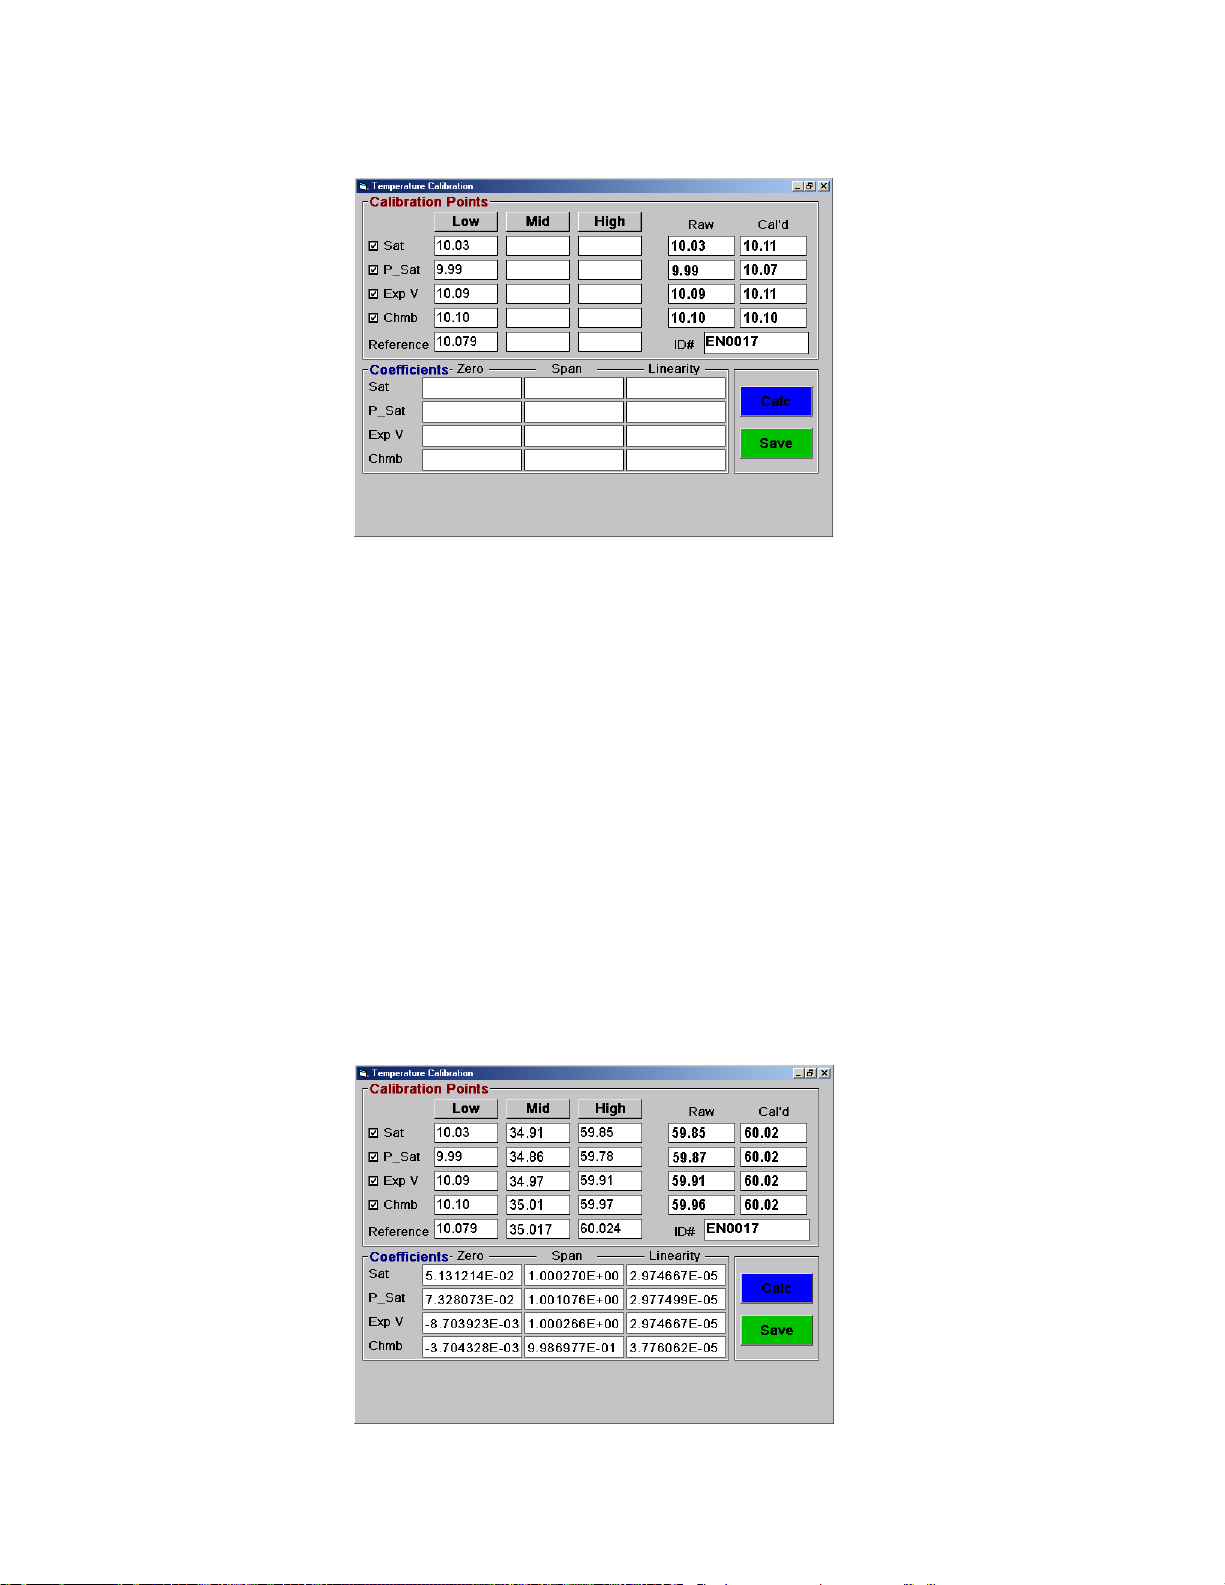
11) Enter the value of the reference thermometer (in current system units), then click OK.
The stored values from the Raw column are placed into the Low column of the selected
probes and the reference temperature is placed into its corresponding column.
- Clicking a Low, Mid, or High button again allows the previous point of each
Note
RTD to be over-written with the most current measured value. The reference
thermometer value will also be over-written with the new value entered.
12) Generate a temperature near the center of the 1200's temperature range. Once the readings
are stable, click the Mid button and enter the temperature reading from the reference
thermometer in the correct units. Note the placement of the temperature values in the
appropriate columns.
13) Generate a temperature at the upper end of the 1200's temperature range. Once the
readings are stable, click the High button and enter the temperature reading from the
reference thermometer in the correct units.
14) W hen all three temperature points have been entered, click the Calc button. New calibration
coefficients will be calculated and displayed in the appropriate Zero, Span, and Linearity
columns of the selected probes.
4-4
Page 91

15) Click Save to store and update the system with the new coefficients and data.
16) Set the bath to different temperatures within the temperature range to view the values in the
Cal'd column (As Left Data).
17) When finished, close the Temperature Calibration window, exit the 1200's program, shutdown
Windows operating system, switch power OFF and remove the power cord.
18) Reinstall all probes. Ensure that RTD0 and RTD1 probes are completely inserted. Ensure that
RTD2’s probe tip is against the rubber restraint (not inserted too deep). Reinstall all foam
insulation that was removed from around the RTD's.
19) Replace the top/rear console cover.
4.2.2 System Pressure Transducer Calibration
The calibration procedure given here is for the Sat/Chmb pressure transducer calibration. This
calibration is critical to the accuracy of the 1200 and is used in all of the humidity calculations.
This procedure is used in conjunction with an adjustable pressure reference. Using the pressure
reference to generate three known pressures, coefficients (ZERO, SPAN, LINEARITY) are then
calculated automatically by the computer and used to update the system calibration. A calibration
report may be printed for the pressure transducer at the conclusion of the calibration sequence.
Equipment Required:
1. Torx T10 driver (included with system).
2. 7/16" & 9/16" wrenches
Calibration Procedure:
Reference Drawing 03D12902
1) For safety purposes, perform a shutdown, exit the 1200 ControLog program, shutdown
Windows operating system, switch power OFF, and remove power cord. Remove the
top/rear access cover.
CAUTION!
ALL SYSTEM PRESSURE MUST BE
VENTED BEFORE PROCEEDING.
2) Using the appropriate tools, mechanically disconnect the pressure transducer from the 1200
leaving it electrically connected to the system. Connect the transducer to the pressure
reference.
3) Restore power and restart the 1200 ControLog program.
CAUTION!
DO NOT ENABLE HUMIDITY GENERATION WITH
PRESSURE TRANSDUCER DISCONNECTED.
4-5
Page 92
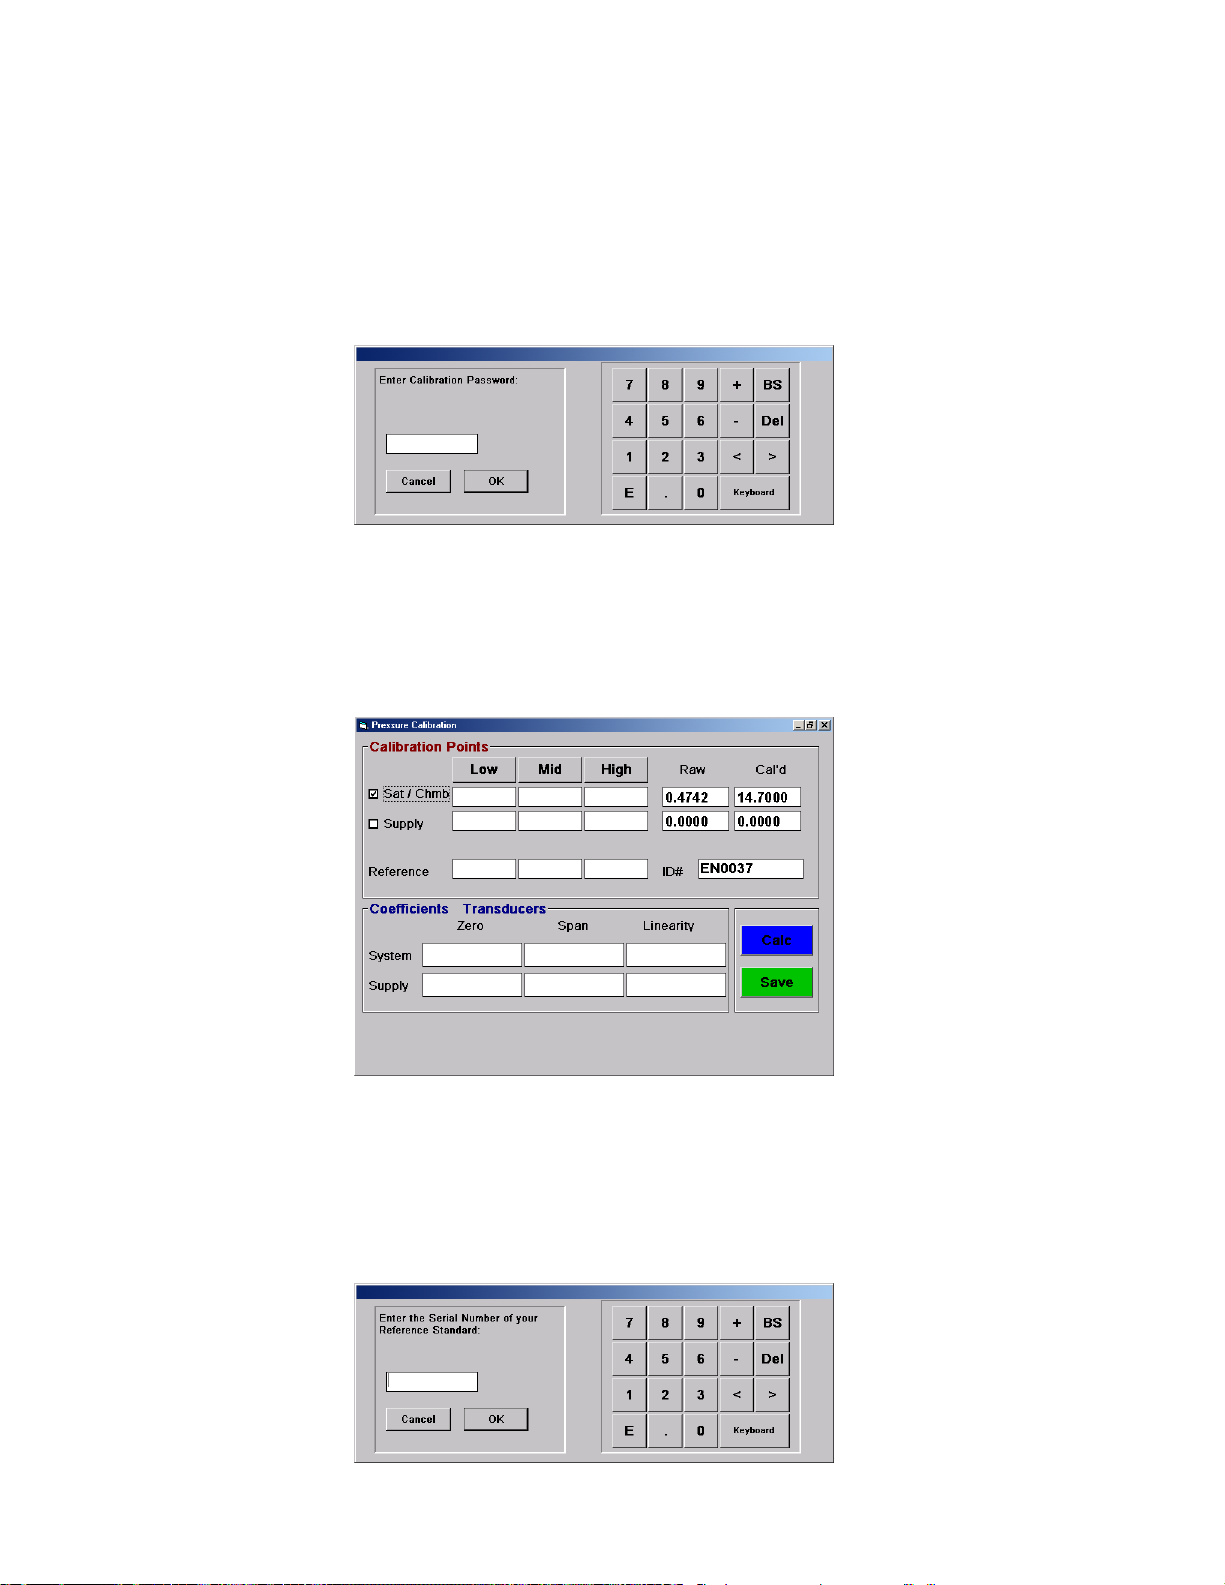
4) For pressure units other than psiA, select the desired pressure units for calibration from the
Units drop-down menu. Once calibration has begun, the units should not be changed again
until calibration is complete.
5) Select Pressure Calibration from the Window drop-down menu. The system then asks for
a Calibration Password
.
6) Enter the Calibration Password (found at the back of the manual) and click the OK button.
The Pressure Calibration form appears with continuous real time readings of the pressure
transducers. (Without the password, the calibration screen is in read only mode.)
7) Using the check boxes on the left of the calibration window, select the Sat/Chmb
transducer to be calibrated. Click on the ID# box and enter an identification number for your
pressure reference. The identification number will then appear on the calibration records
when printed.
4-6
Page 93
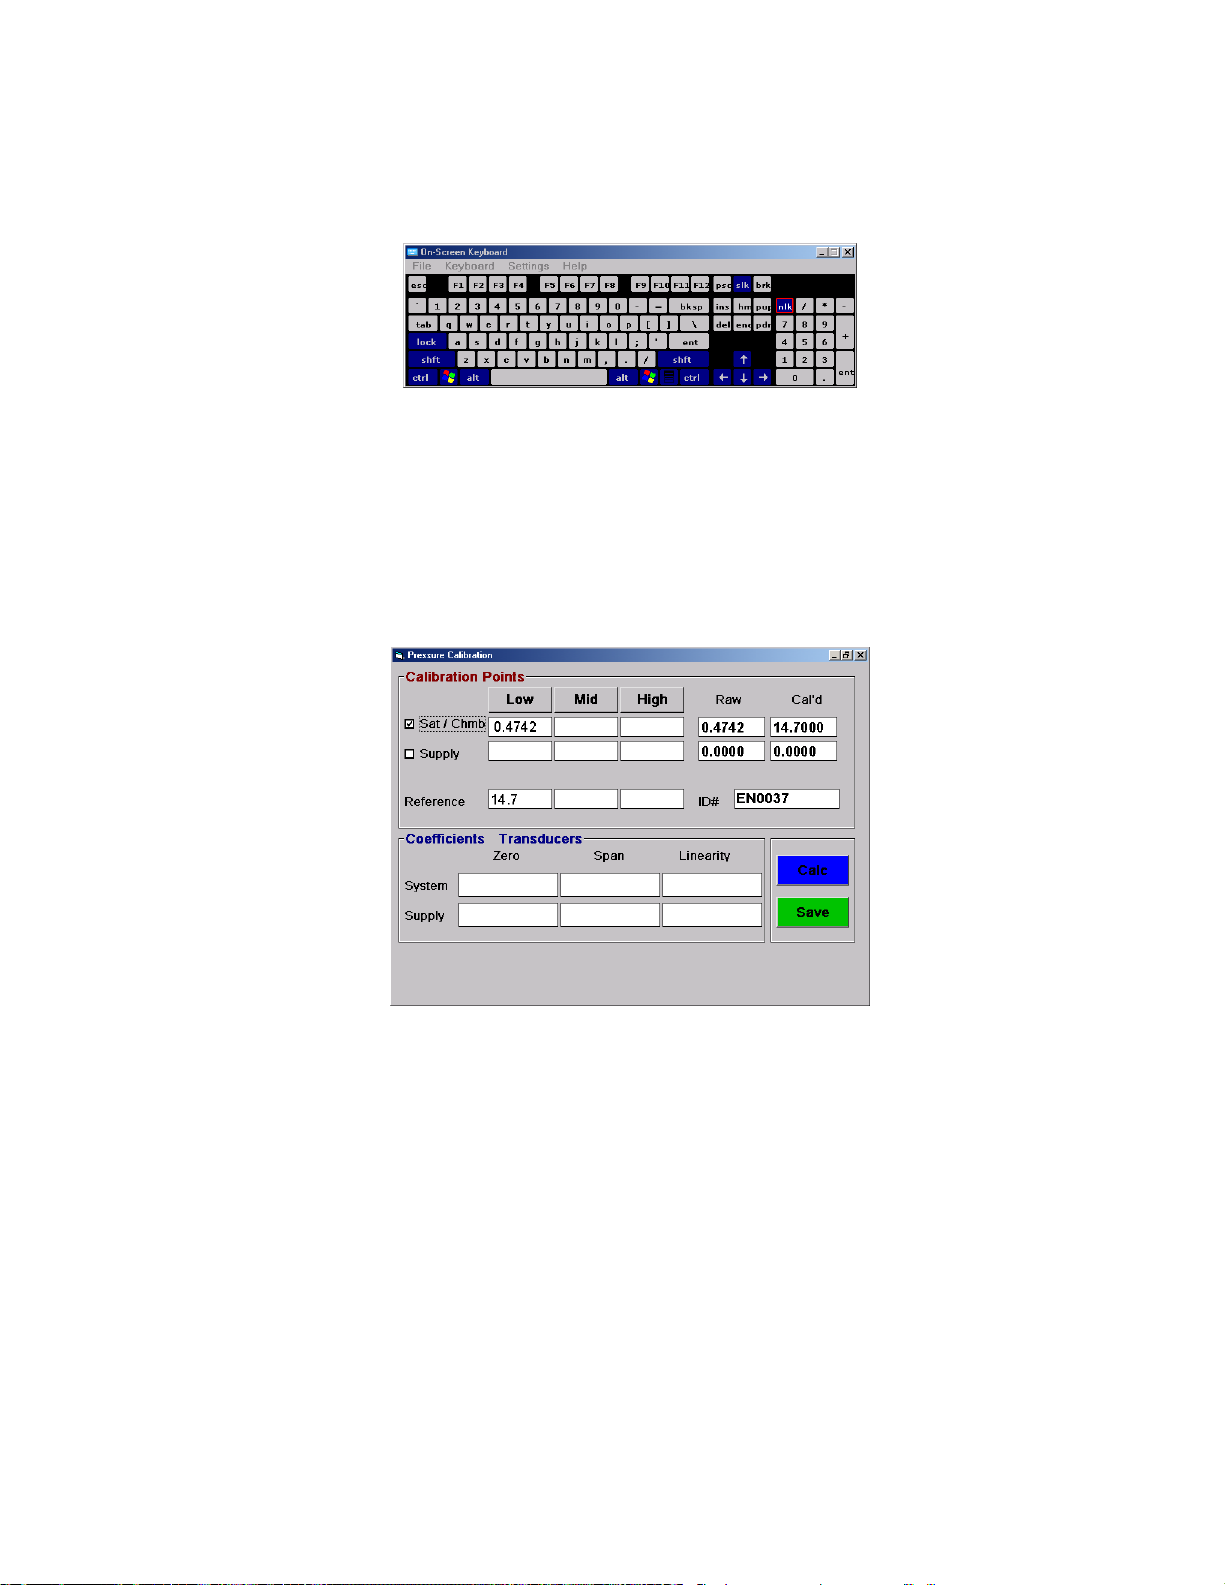
Click the Keyboard button and the On-screen Keyboard will appear if alpha characters are
required in identification number.
8) Pressurize the transducer to approximately 15 psiA or use ambient absolute pressure. Allow
the selected transducer and the pressure reference to stabilize. Once the readings are stable,
click the Low button.
- This transducer is operated at or above ambient pressure, requiring
Note
calibration between ambient and full scale only. There is no need for below
ambient testing or calibration.
9) Enter the value of the pressure reference (absolute pressure, in the current system units),
then click OK.
The stored values from the Raw column are placed into the Low column of the selected
transducer, and the pressure reference is placed into its corresponding column.
- Clicking a Low, Mid, or High button again allows the previous point to be
Note
over-written with the most current measured value. The pressure reference value
will also be over-written with the new value entered.
10) Pressurize the transducer to 75 psiA or a pressure near the center of the operating pressure
range of the transducer. Once the readings are stable, click the Mid button and enter the
pressure reading from the pressure reference in the correct units. Note the placement of the
pressure values in the appropriate columns.
11) Pressurize the transducer to 152 psiA or a pressure near the upper end of the operating
pressure range of the transducer. Once the readings are stable, click the High button and
enter the pressure reading from the pressure reference in the correct units.
4-7
Page 94
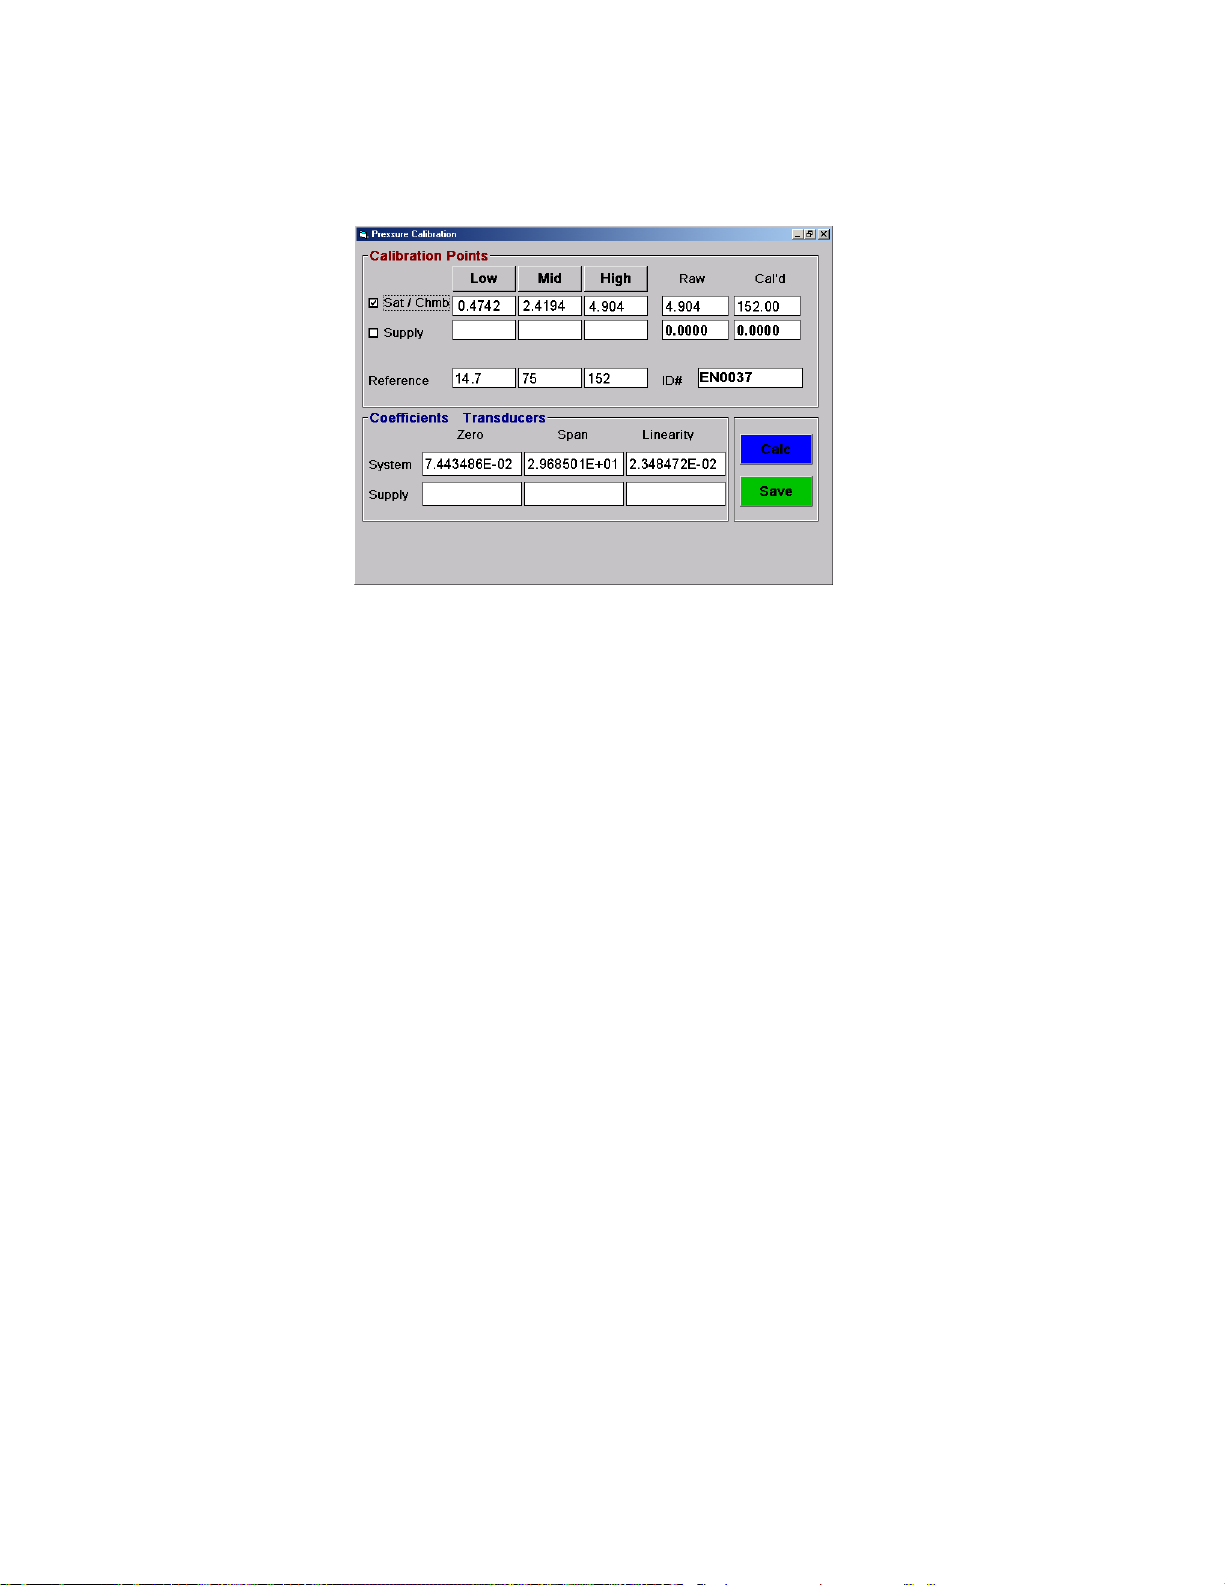
12) W hen all three pressure points have been entered, click the Calc button. New calibration
coefficients will be calculated and displayed in the appropriate Zero, Span, and Linearity
columns of the calibrated transducer.
13) Click Save to store and update the system with the new coefficients and data.
14) Set the pressure reference to various pressures within the operating pressure range of the
transducer to view the calibrated values (As Left Data) in the Cal'd column. (For information
on printing a Calibration Report refer to section 4.2.7 Printing Calibration Records.)
15) When finished, close the pressure calibration window, exit the 1200 ControLog program and
switch power OFF. Remove the power cord.
16) Reinstall the pressure transducer and tighten Swagelok nut 1/8 turn past finger tight. Replace
the console cover.
4.2.3 Supply Pressure Transducer Calibration
Although calibration procedures are given here for supply pressure transducer calibration, its
measurement is not critical to the accuracy of the 1200 and is only used in the calculation of the
lowest humidity setpoint capability.
This procedure should be used in conjunction with an adjustable pressure reference. Using the
pressure reference to generate three known pressures, coefficients (ZERO, SPAN, LINEARITY) are
then calculated automatically by the computer and used to update the system calibration. A
calibration report may be printed for the pressure transducer at the conclusion of the calibration
sequence.
Calibration Procedure:
Reference Drawing 03D12902
1) Perform a shutdown, exit the 1200 ControLog program, shutdown Windows operating system,
switch power OFF and remove power cord. Disconnect air/gas supply from system.
2) Remove the top/rear and front covers to access the supply pressure transducer.
4-8
Page 95
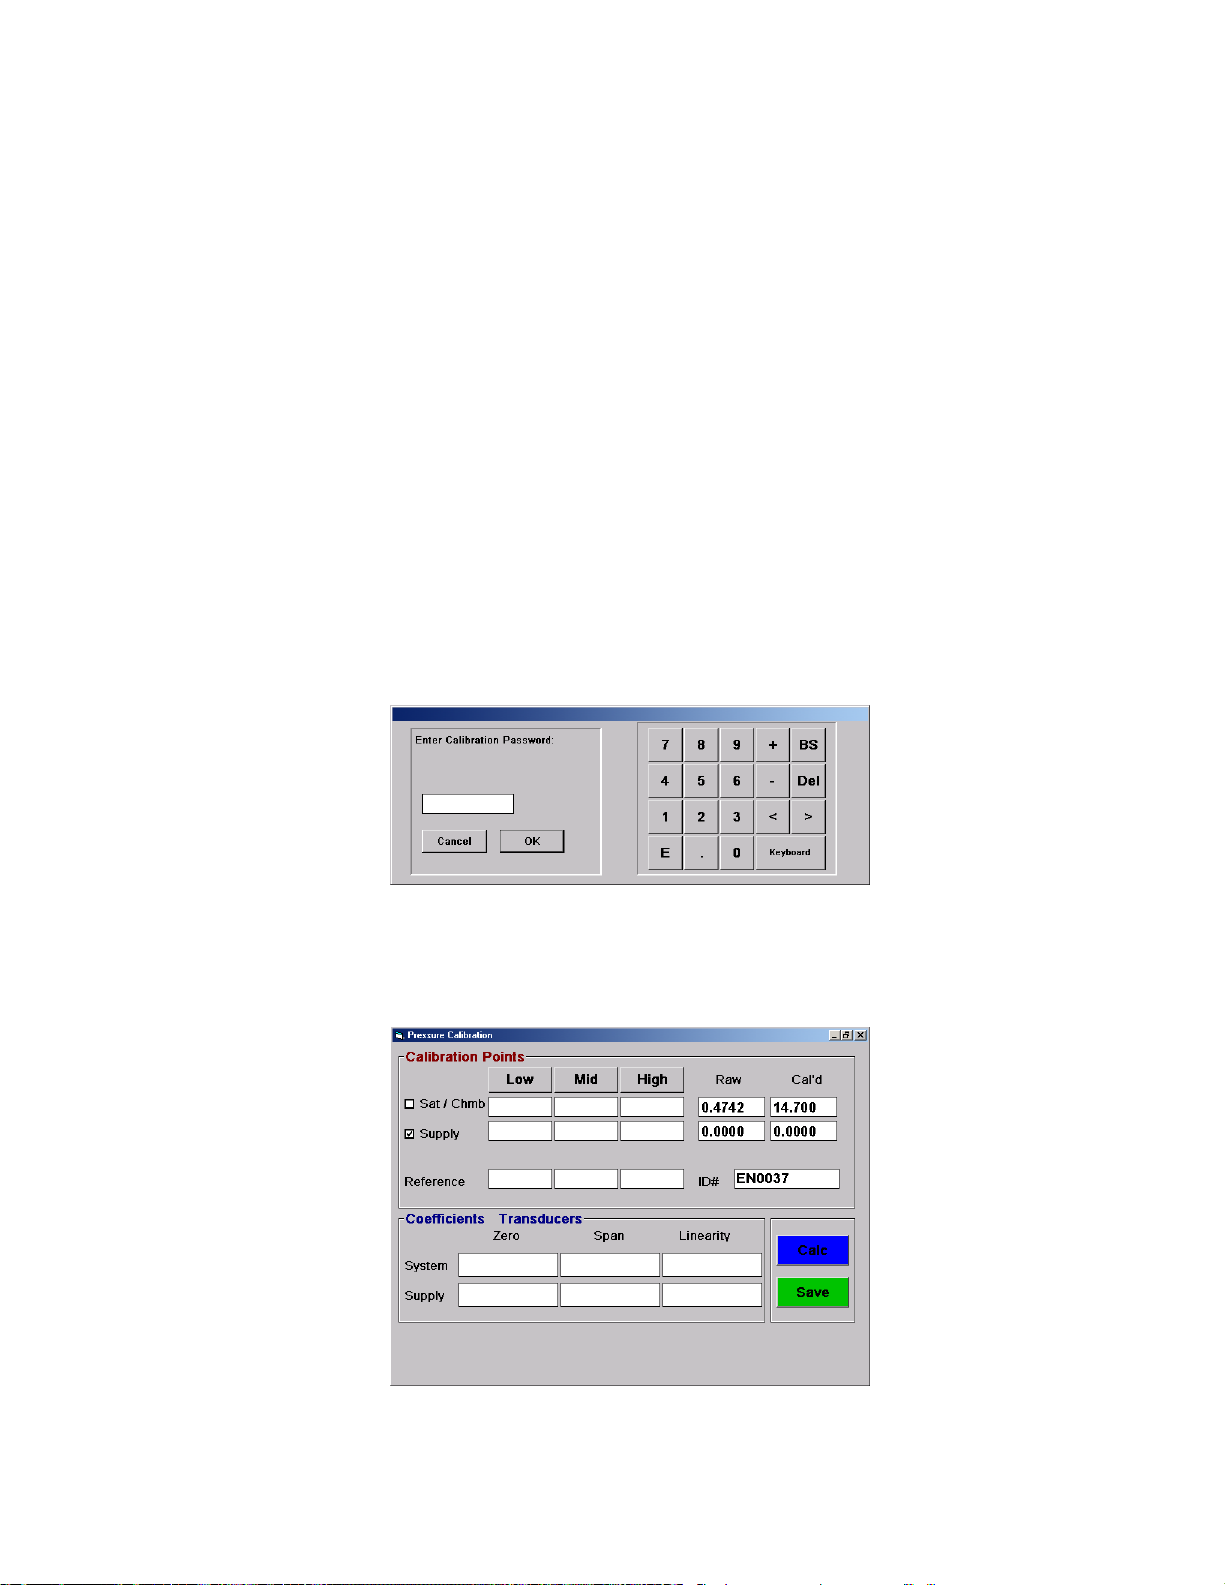
CAUTION!
AIR/GAS SUPPLY MUST BE DISCONNECTED
BEFORE PROCEEDING!
3) Using the appropriate tools, mechanically disconnect the supply pressure transducer from the
1200 leaving it electrically connected to the system. Connect the transducer to the pressure
reference.
4) Restore power and restart the 1200 ControLog program.
CAUTION!
DO NOT ENABLE SYSTEM CONTROL WITH
PRESSURE TRANSDUCER REMOVED FROM
SYSTEM.
5) For pressure units other than psiG, select the desired pressure units for calibration from the
Units drop-down menu. Once calibration has begun, the units should not be changed again
until calibration is complete.
6) Select Pressure Calibration from the Window drop-down menu. The system then asks for
a Calibration Password
.
7) Enter the Calibration Password (found at the back of the manual) and click the OK button
The Pressure Calibration form appears with continuous real time readings of the pressure
transducers. (Without the password, the calibration screen is in read only mode.)
8) On the Pressure Calibration window, click the check box to the left of Supply to select the
supply pressure transducer for calibration.
.
4-9
Page 96
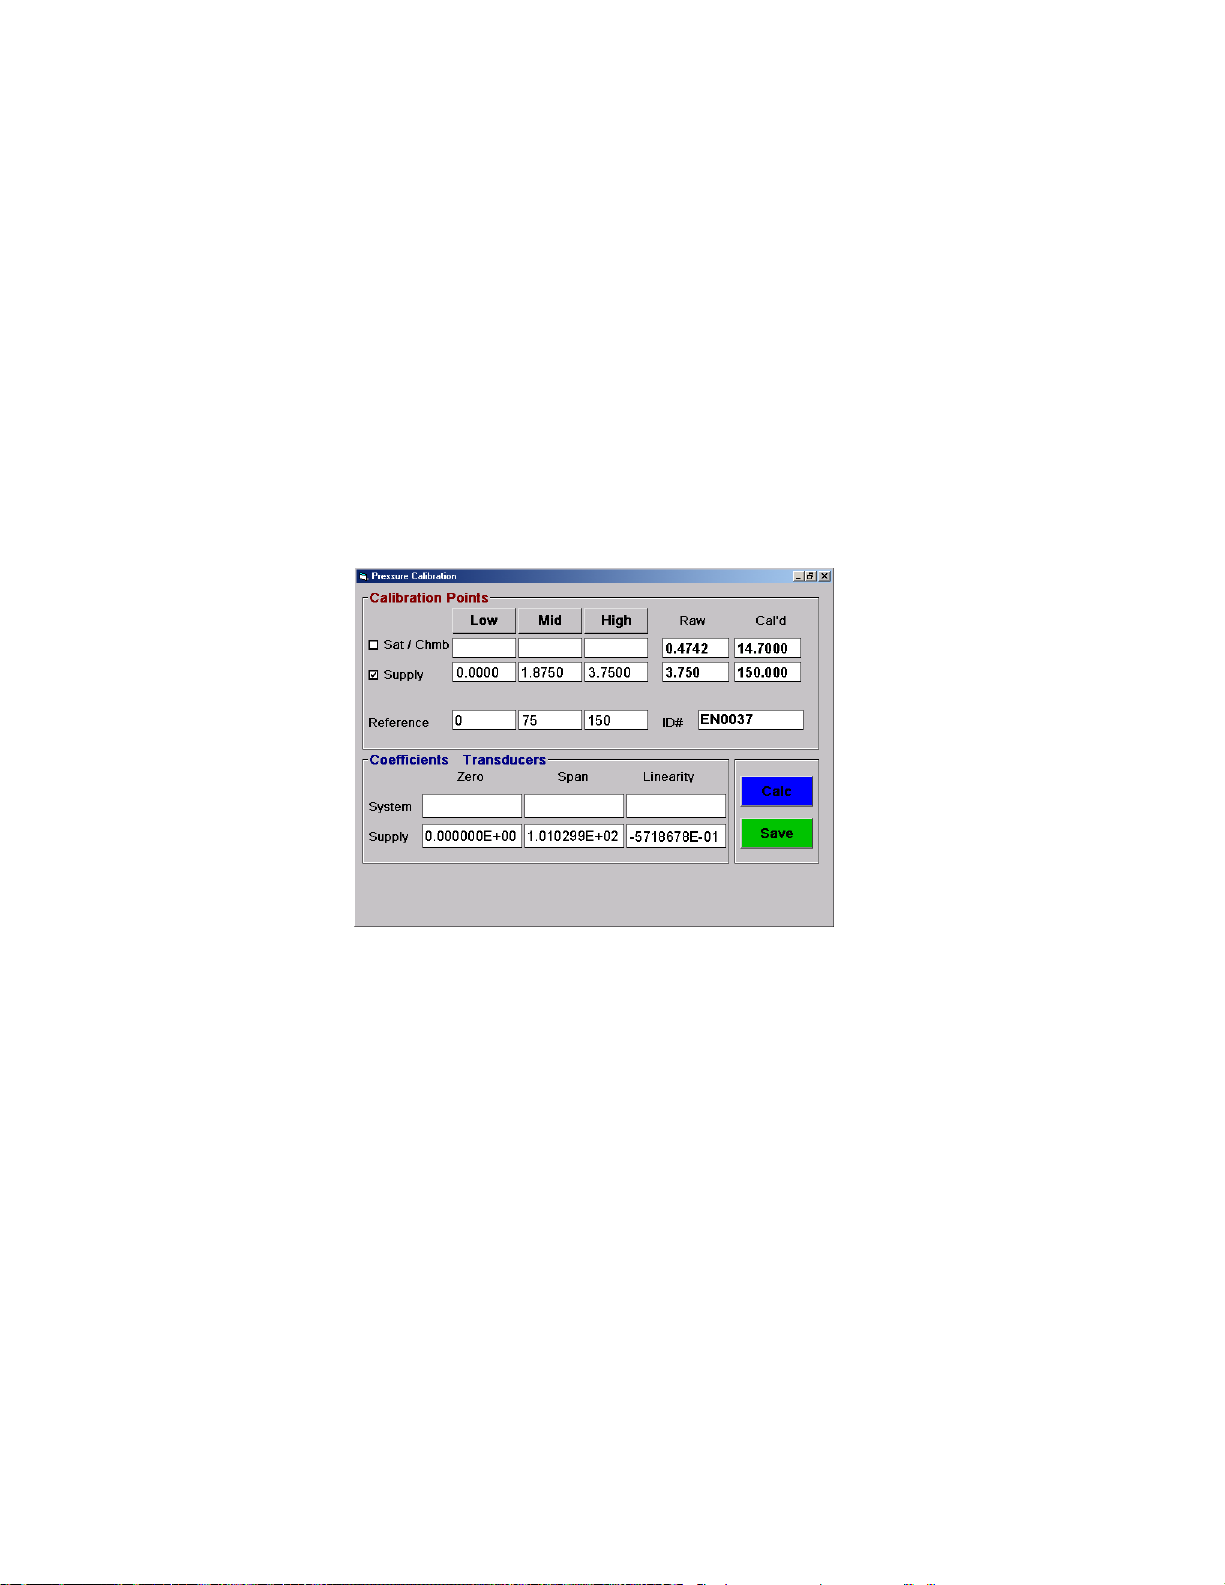
9) With no pressure applied, click the Low button. Enter a reference pressure of 0 psiG.
10) Pressurize the supply pressure transducer to approximately 75 psiG or a pressure near the
center of the operating pressure range of the supply pressure transducer.
11) Monitor the pressure calibration window for a stable reading. Once the reading is stable, click
the Mid button and enter the pressure reading from the pressure reference.
12) Pressurize the supply pressure transducer to approximately 150 psiG or a pressure near the
upper end of the operating pressure range of the supply pressure transducer.
13) Monitor the pressure calibration window for a stable reading. Once the reading is stable, click
the High button and enter the pressure reading from the pressure reference.
14) Once the low, mid, and high readings have all been taken, click the Calc button. The
coefficients will be calculated and placed in the supply pressure transducer's Zero, Span, and
Linearity section of the window.
15) To save the coefficients, click the Save button. The coefficients are then updated and saved
to disk.
16) Set the pressure reference to various pressures within the operated pressure range of the
supply pressure transducer to view the calibrated values (As Left Data) in the Cal'd column.
(For information on printing a Calibration Report refer to section 4.2.7 Printing Calibration
Records.)
17) When finished, close the pressure calibration window, exit the 1200 ControLog program,
shutdown Windows operating system, and switch power OFF. Remove the power cord.
18) Reinstall the supply pressure transducer and tighten 1/2 turn past finger tight. Ensure
transducer is it electrically connected to the system. Replace the top/rear and front covers.
Reconnect air/gas supply and connect power.
4-10
Page 97
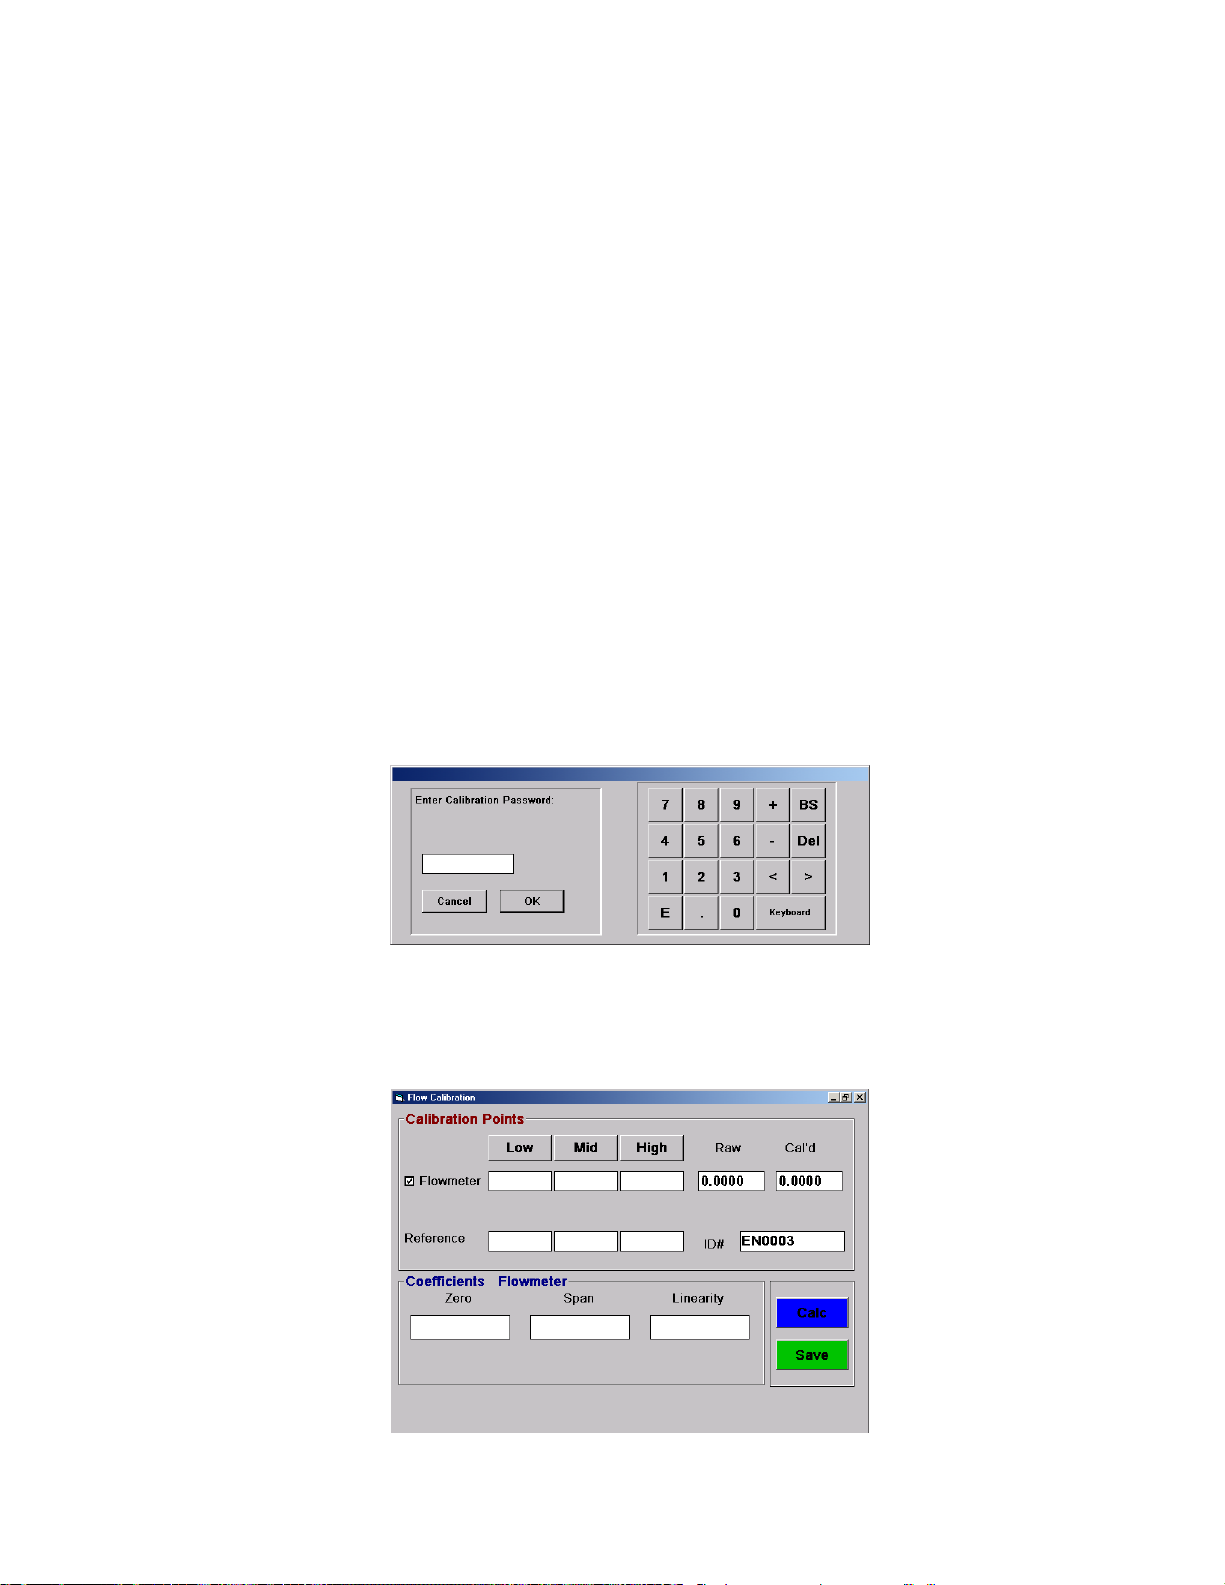
4.2.4 Flow Meter Calibration
The flow measurement, while indicated on the screen, is not critical to the accuracy of the generated
humidity and is not used in the humidity calculations. Therefore, flow calibration requirements depend
upon the needs of the user. Also, since the use of the Flow Calibration window is very similar to that
of Temperature Calibration, only abbreviated instructions are given here. For more detailed
understanding of the Calibration window usage, refer to section 4.2.1 Temperature Calibration.
Equipment Required:
1. Reference flow meter (per section 4.2).
Calibration Procedure:
Reference Drawing 03D12902
1) Connect a reference flowmeter to the test chamber inlet (inside the test chamber).
2) Using the Units drop-down menu, select the desired flow units for calibration. Once
calibration has begun, the units must not be changed again until calibration is complete.
3) Select Flow Calibration from the Window drop-down menu. The system then asks for a
Calibration Password
.
1) Enter the Calibration Password (found at the back of the manual) and click the OK button.
The Flow Calibration screen appears and the flow readings begin updating. (W ithout the
password, the calibration screen is in read only mode.)
4-11
Page 98
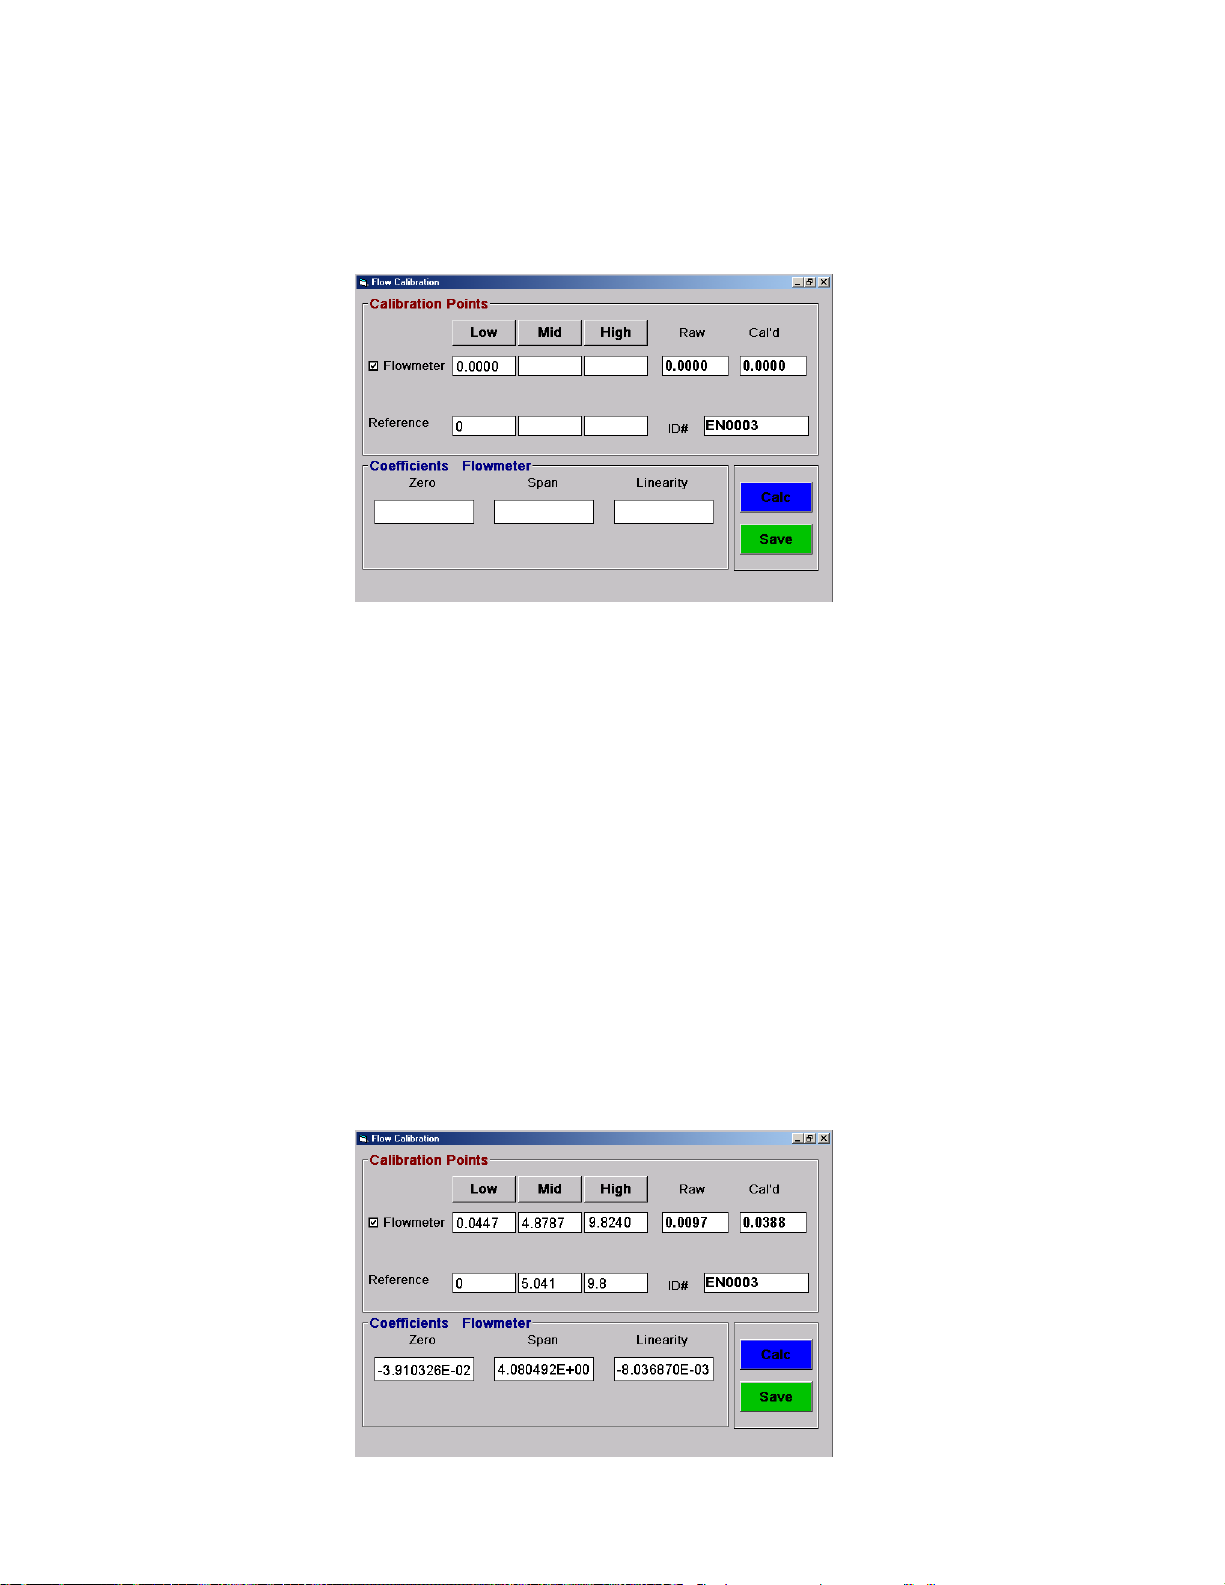
5) Click on the check box at the left of the Flow Calibration window to select the flowmeter for
calibration. If desired, enter an ID# for the reference flowmeter.
6) With no flow through the system, click the Low button once the reading is stable. Enter a
reference flow of 0.
7) Minimize the flow calibration window and start the system by selecting Generate from the
Run drop-down menu.
8) From the Main Screen, change the flow setpoint to mid range (the equivalent of 5 L/m)
keeping in mind the previously set units.
9) Again select Flow Calibration from the Window drop-down menu and monitor for a stable
flow reading at mid range. Once stable, click the Mid button. Enter the reference flowmeter
measurement in the proper units.
10) Minimize the flow calibration window and change the flow setpoint to full range (the equivalent
of 10 L/m) keeping in mind the units.
11) Again select Flow Calibration from the Window drop-down menu and monitor for a stable
flow reading at full range. Once stable, click the High button. Enter the reference flowmeter
measurement in the proper units.
12) Once the low, mid, and high readings have all been taken, click the Calc button. The
coefficients will be calculated and placed in the Zero, Span, and Linearity section of the
window.
4-12
Page 99
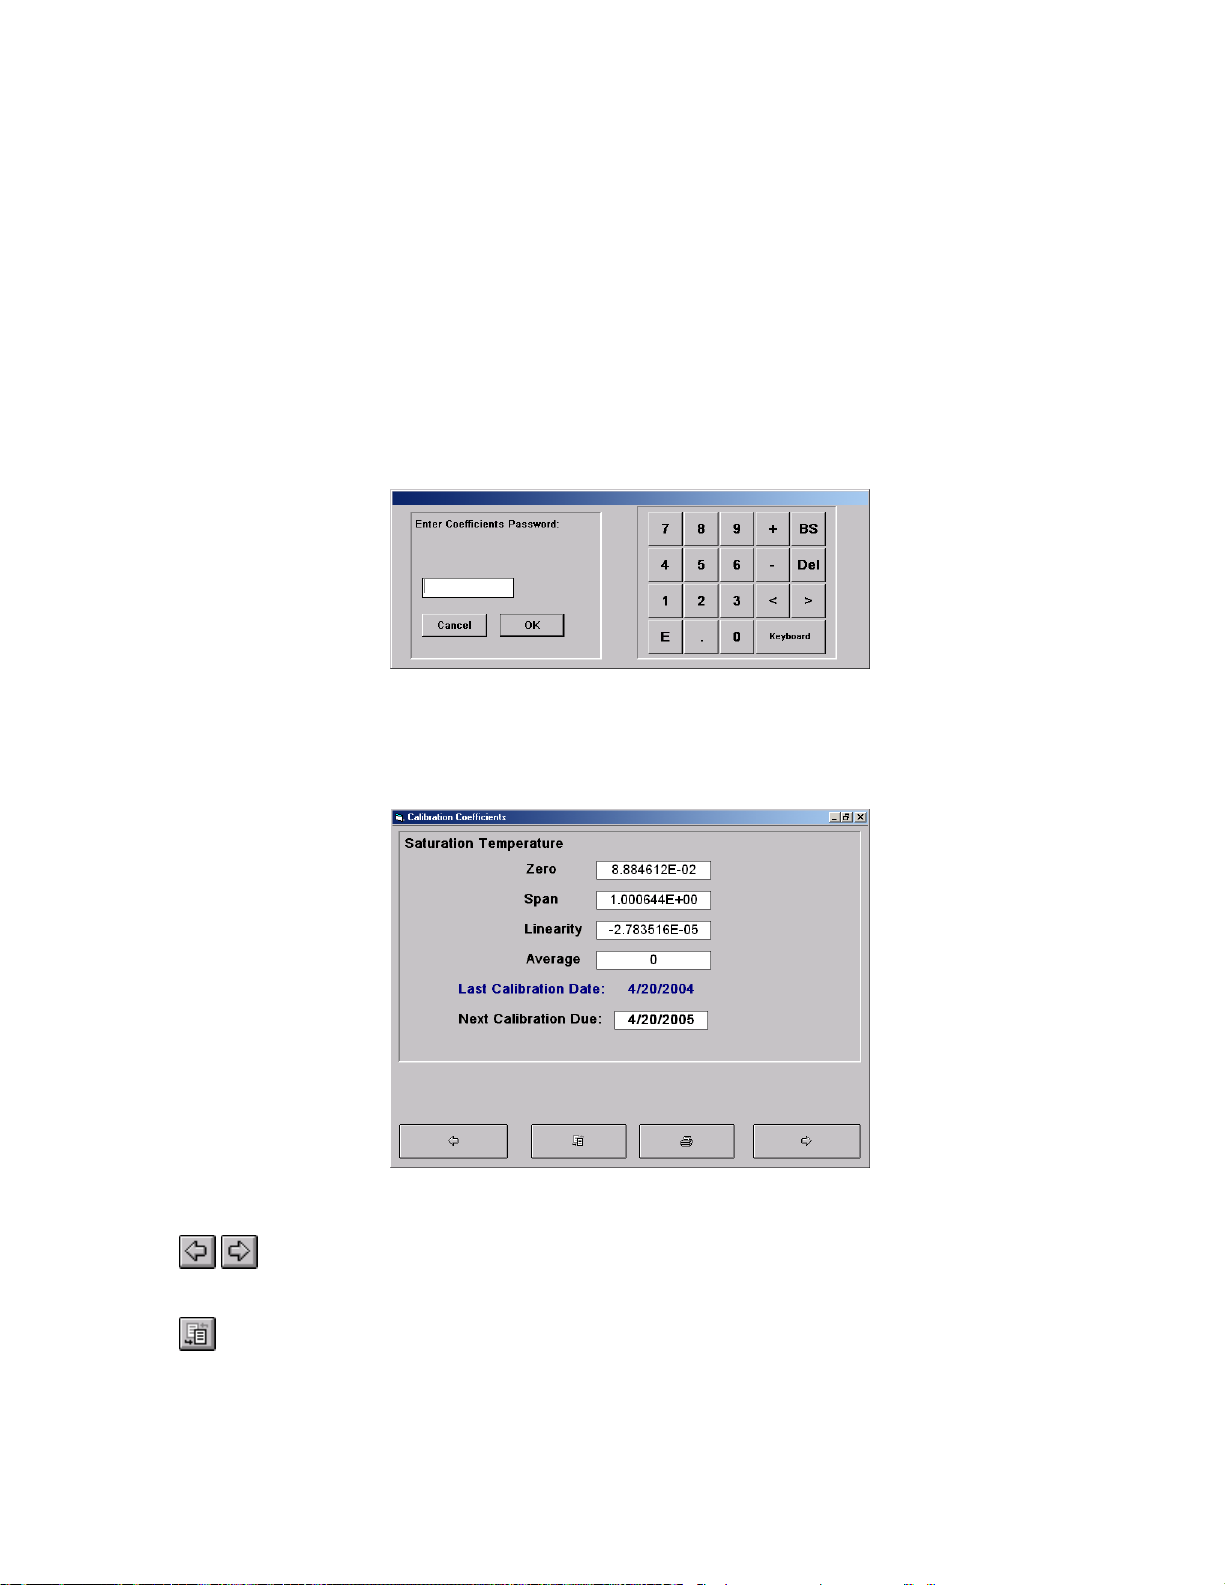
13) To save the coefficients, click the Save button. The coefficients are updated and saved to
disk.
14) Verify the flow calibration at different flow rates against the reference flowmeter.
4.2.5 Viewing the Current Calibration Coefficients
Calibration coefficients and corresponding data are available for viewing at any time.
To view the calibration coefficients and data:
1) Select Calibration Coefficients from the Window drop-down menu. The system then asks
for a Coefficients Password.
2) Enter the Coefficients Password (found at the back of the manual) and click the OK button.
The Calibration Coefficients window appears. (Without the password, the coefficients are in
read only mode.)
The Tool Bar
Navigation buttons allow viewing each of the transducers in succession in either
direction.
Toggles displayed information between calibration coefficients and actual calibration
data.
4-13
Page 100
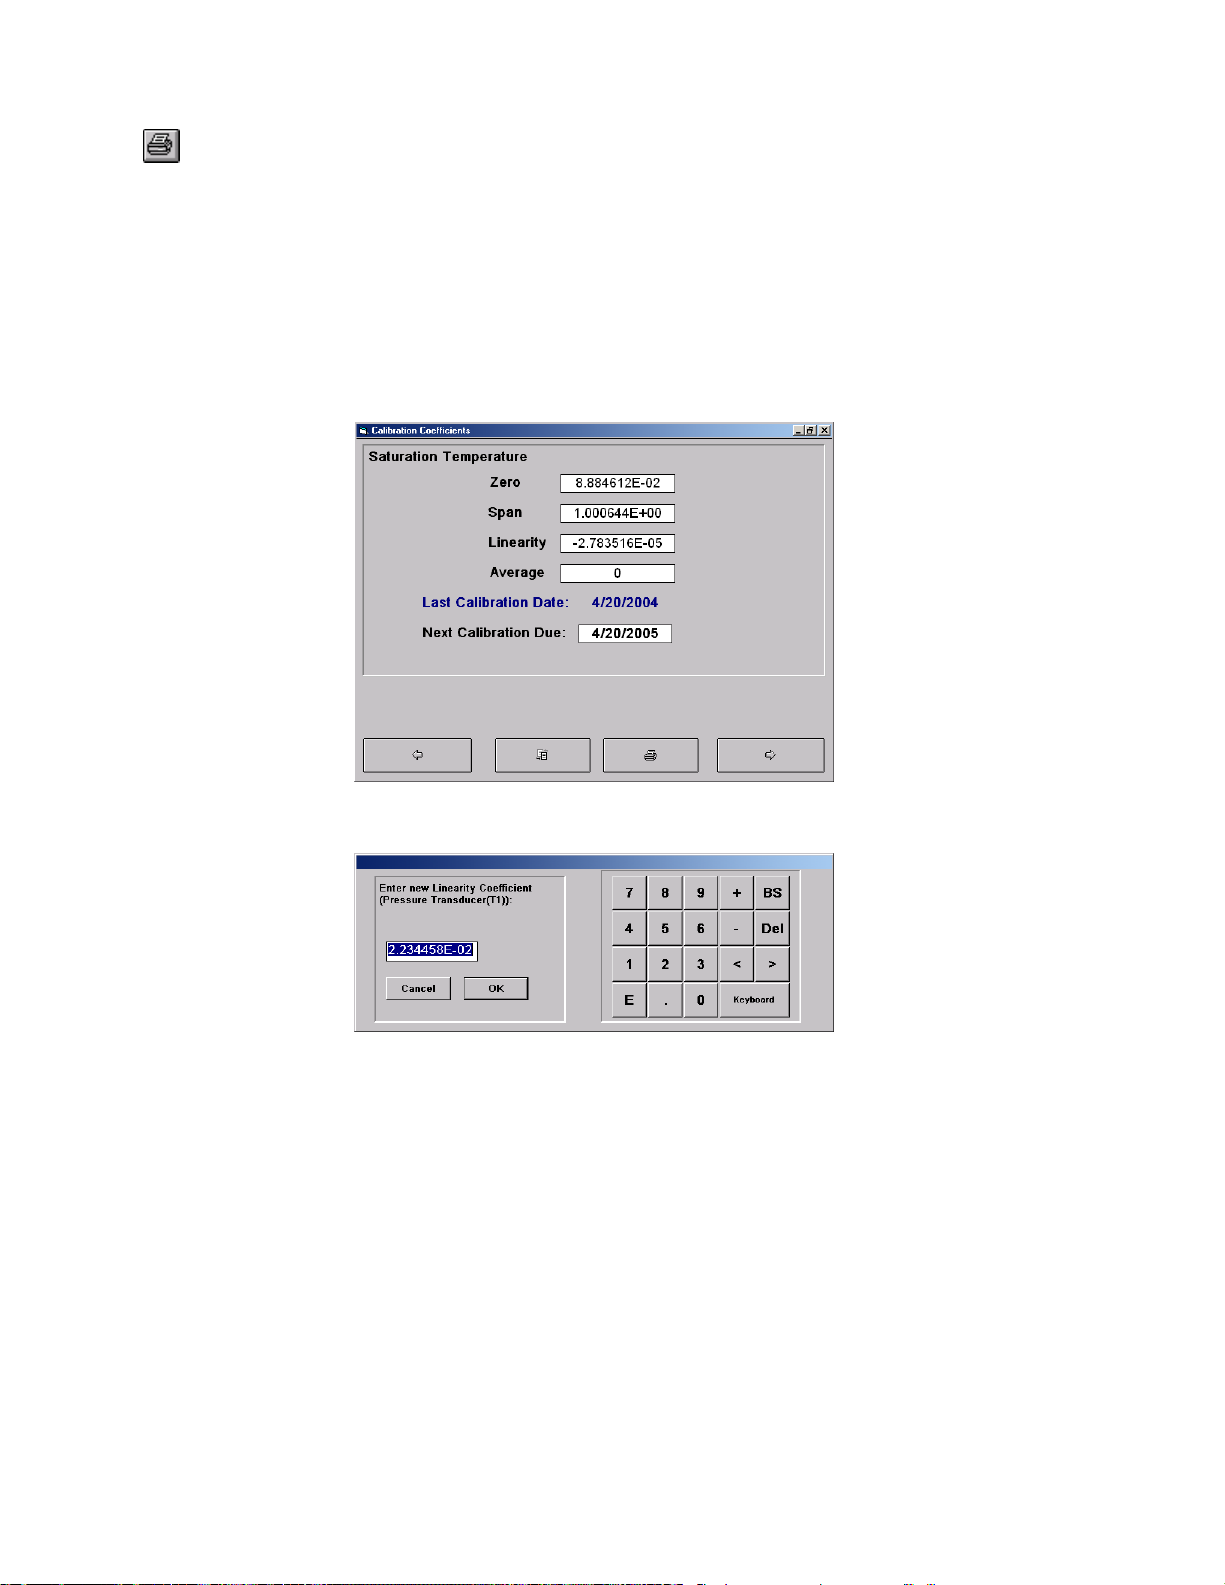
Prints the calibration record for the currently displayed transducer. You may
optionally print ALL transducer reports at once if desired. (Refer to section 4.2.7
Printing Calibration Records)
4.2.6 Editing Calibration Coefficients
Calibration Coefficients may be edited from the Calibration Coefficients window. To edit coefficients:
1) Bring up the Calibration Coefficients window corresponding to the transducer that is to be
edited. Reference section 4.2.5 Viewing the Current Calibration Coefficients.
2) Click on the number that you want to change. The program asks for a new value.
3) Enter the new number, then click OK. Any changes made are updated to disk immediately.
The Zero, Span, and Linearity affect the actual transducer calibration. Ensure you understand
the significance of each prior to changing them.
Average determines the amount of filtering applied to the displayed transducer readings. An
average of 10 is typical, 0 results in no filtering, and 100 would be excessive.
To change the calibration interval which is used to compute the Next Calibration Due date,
edit the Next Calibration Due date box with a date relative to the Last Calibration Date. For
example, a Next Calibration Due of 10/20/04 and a Last Calibration Date of 10/20/03 results
in a one year calibration interval. The next time that the transducer is calibrated, the
calibration dates will update using the existing time difference between Last and Next
calibration dates.
4-14
 Loading...