

Page 1

NanoDrop Micro-UV/Vis Spectrophotometer
C
NanoDrop One
with
NanoDrop QC Software
User Guide
269-342200 NanoDrop QC UG Revision A December 2019
Page 2

© 2019 Thermo Fisher Scientific Inc. All rights reserved.
DYMO and LabelWriter are either trademarks or registered trademarks of Newell Rubbermaid in the United States and/or other
countries. Wi-Fi is either a trademark or a registered trademark of Wi-Fi Alliance in the United States and/or other countries. Bluetooth
is either a trademark or a registered trademark of Bluetooth Special Interest Group. Windows is either a trademark or a registered
trademark of Microsoft Corporation in the United States and/or other countries. All other trademarks are the property of Thermo
Fisher Scientific inc. and its subsidiaries.
For U.S. Technical Support, please contact:
Thermo Fisher Scientific
3411 Silverside Road
Tatnall Building, Suite 100
Wilmington, DE 19810 U.S.A.
Telephone: 302 479 7707
For International Support, please contact:
http://www.nanodrop.com/support
Contact your local distributor. For contact
information go to:
http://www.nanodrop.com/Order.aspx
Toll Free: 1 877 724 7690 (U.S. & Canada only)
E-mail: nanodrop@thermofisher.com
Thermo Fisher Scientific Inc. provides this document to its customers with a product purchase to use in the
product operation. This document is copyright protected and any reproduction of the whole or any part of this
document is strictly prohibited, except with the written authorization of Thermo Fisher Scientific Inc.
The contents of this document are subject to change without notice. All technical information in this
document is for reference purposes only. System configurations and specifications in this document supersede
all previous information received by the purchaser.
Thermo Fisher Scientific Inc. makes no representations that this document is complete, accurate or errorfree and assumes no responsibility and will not be liable for any errors, omissions, damage or loss that might
result from any use of this document, even if the information in the document is followed properly.
This document is not part of any sales contract between Thermo Fisher Scientific Inc. and a purchaser. This
document shall in no way govern or modify any Terms and Conditions of Sale, which Terms and Conditions of
Sale shall govern all conflicting information between the two documents.
For Research Use Only. This instrument or accessory is not a medical device and is not intended to be used
for the prevention, diagnosis, treatment or cure of disease.
WARNING Avoid an explosion or fire hazard. This instrument or accessory is not
designed for use in an explosive atmosphere.
Page 3

Contents
C
Chapter 1 About the Spectrophotometer. . . . . . . . . . . . . . . . . . . . . . . . . . . . . . . . . . . . . . . . . . . .1
Features . . . . . . . . . . . . . . . . . . . . . . . . . . . . . . . . . . . . . . . . . . . . . . . . . . . . . . . . 2
Touchscreen . . . . . . . . . . . . . . . . . . . . . . . . . . . . . . . . . . . . . . . . . . . . . . . . . . 2
Cuvette Holder . . . . . . . . . . . . . . . . . . . . . . . . . . . . . . . . . . . . . . . . . . . . . . . . 3
USB-A port . . . . . . . . . . . . . . . . . . . . . . . . . . . . . . . . . . . . . . . . . . . . . . . . . . .3
Accessories. . . . . . . . . . . . . . . . . . . . . . . . . . . . . . . . . . . . . . . . . . . . . . . . . . . . . . 4
PR-1 Pedestal Reconditioning Kit . . . . . . . . . . . . . . . . . . . . . . . . . . . . . . . . . .4
PV-1 Performance Verification Solution . . . . . . . . . . . . . . . . . . . . . . . . . . . . . 4
Instrument Detection Limits . . . . . . . . . . . . . . . . . . . . . . . . . . . . . . . . . . . . . . . . 5
Chapter 2 Instrument Set up . . . . . . . . . . . . . . . . . . . . . . . . . . . . . . . . . . . . . . . . . . . . . . . . . . . . . .7
Register Your Instrument . . . . . . . . . . . . . . . . . . . . . . . . . . . . . . . . . . . . . . . . . . 7
Update Software . . . . . . . . . . . . . . . . . . . . . . . . . . . . . . . . . . . . . . . . . . . . . . . . . 7
Setting Up User Account Control . . . . . . . . . . . . . . . . . . . . . . . . . . . . . . . . . . . . 8
User Account Control . . . . . . . . . . . . . . . . . . . . . . . . . . . . . . . . . . . . . . . . . . . 8
Security Administration Policies . . . . . . . . . . . . . . . . . . . . . . . . . . . . . . . . . . . 9
Technical Support . . . . . . . . . . . . . . . . . . . . . . . . . . . . . . . . . . . . . . . . . . . . . . . 10
Chapter 3 Applications . . . . . . . . . . . . . . . . . . . . . . . . . . . . . . . . . . . . . . . . . . . . . . . . . . . . . . . . . .11
Measure UV-Vis . . . . . . . . . . . . . . . . . . . . . . . . . . . . . . . . . . . . . . . . . . . . . . . . 12
Measure UV-Vis . . . . . . . . . . . . . . . . . . . . . . . . . . . . . . . . . . . . . . . . . . . . . . 12
To make UV-Vis measurements . . . . . . . . . . . . . . . . . . . . . . . . . . . . . . . . . . 12
Best practices for UV-Vis measurements . . . . . . . . . . . . . . . . . . . . . . . . . . . .13
UV-Vis Reported Results. . . . . . . . . . . . . . . . . . . . . . . . . . . . . . . . . . . . . . . . 14
Settings for UV-Vis Measurements . . . . . . . . . . . . . . . . . . . . . . . . . . . . . . . . 17
Measure Chemometrics . . . . . . . . . . . . . . . . . . . . . . . . . . . . . . . . . . . . . . . . . . . 18
Measure Chemometrics . . . . . . . . . . . . . . . . . . . . . . . . . . . . . . . . . . . . . . . . . 18
Create Chemometrics Method. . . . . . . . . . . . . . . . . . . . . . . . . . . . . . . . . . . . 22
Edit Chemometrics Method . . . . . . . . . . . . . . . . . . . . . . . . . . . . . . . . . . . . . 23
Chemometrics Reported Results . . . . . . . . . . . . . . . . . . . . . . . . . . . . . . . . . . 24
Settings for Chemometric Measurements . . . . . . . . . . . . . . . . . . . . . . . . . . . 28
Thermo Scientific NanoDrop OneC with NanoDropQC Software User Guide iii
Page 4

Contents
Measure Custom . . . . . . . . . . . . . . . . . . . . . . . . . . . . . . . . . . . . . . . . . . . . . . . .29
Measure using a Custom Method . . . . . . . . . . . . . . . . . . . . . . . . . . . . . . . . . 29
Delete Custom Method. . . . . . . . . . . . . . . . . . . . . . . . . . . . . . . . . . . . . . . . . 32
Custom Method Reported Results. . . . . . . . . . . . . . . . . . . . . . . . . . . . . . . . . 33
Manage Custom Methods . . . . . . . . . . . . . . . . . . . . . . . . . . . . . . . . . . . . . . .35
Chapter 4 Learning Center . . . . . . . . . . . . . . . . . . . . . . . . . . . . . . . . . . . . . . . . . . . . . . . . . . . . . . .45
Micro-Volume Sampling—How it Works. . . . . . . . . . . . . . . . . . . . . . . . . . . . . 46
Set Up the Instrument. . . . . . . . . . . . . . . . . . . . . . . . . . . . . . . . . . . . . . . . . . . . 48
Measure a Micro-Volume Sample . . . . . . . . . . . . . . . . . . . . . . . . . . . . . . . . . . . 58
Measure a Sample Using a Cuvette . . . . . . . . . . . . . . . . . . . . . . . . . . . . . . . . . . 63
Prepare Samples and Blanks. . . . . . . . . . . . . . . . . . . . . . . . . . . . . . . . . . . . . . . . 66
Basic Instrument Operations . . . . . . . . . . . . . . . . . . . . . . . . . . . . . . . . . . . . . . . 71
NanoDrop One Home Screen. . . . . . . . . . . . . . . . . . . . . . . . . . . . . . . . . . . . 71
NanoDrop One Measurement Screens . . . . . . . . . . . . . . . . . . . . . . . . . . . . .74
NanoDrop One General Operations . . . . . . . . . . . . . . . . . . . . . . . . . . . . . . .90
Instrument Settings . . . . . . . . . . . . . . . . . . . . . . . . . . . . . . . . . . . . . . . . . . . . .100
Data Deletion Settings. . . . . . . . . . . . . . . . . . . . . . . . . . . . . . . . . . . . . . . . . 105
PC Control Software . . . . . . . . . . . . . . . . . . . . . . . . . . . . . . . . . . . . . . . . . . . . 107
PC Control Home Screen overview . . . . . . . . . . . . . . . . . . . . . . . . . . . . . . . 107
Control options . . . . . . . . . . . . . . . . . . . . . . . . . . . . . . . . . . . . . . . . . . . . . . 108
History . . . . . . . . . . . . . . . . . . . . . . . . . . . . . . . . . . . . . . . . . . . . . . . . . . . . 108
Settings . . . . . . . . . . . . . . . . . . . . . . . . . . . . . . . . . . . . . . . . . . . . . . . . . . . .109
Chapter 5 Maintenance . . . . . . . . . . . . . . . . . . . . . . . . . . . . . . . . . . . . . . . . . . . . . . . . . . . . . . . .111
Maintenance Schedule. . . . . . . . . . . . . . . . . . . . . . . . . . . . . . . . . . . . . . . . . . . 112
Cleaning the Touchscreen . . . . . . . . . . . . . . . . . . . . . . . . . . . . . . . . . . . . . . . . 113
Maintaining the Pedestals . . . . . . . . . . . . . . . . . . . . . . . . . . . . . . . . . . . . . . . . 114
Cleaning the Pedestals . . . . . . . . . . . . . . . . . . . . . . . . . . . . . . . . . . . . . . . . .114
Reconditioning the Pedestals . . . . . . . . . . . . . . . . . . . . . . . . . . . . . . . . . . . . 116
Decontaminating the Instrument . . . . . . . . . . . . . . . . . . . . . . . . . . . . . . . . . .119
Maintaining the Cuvette Sampling System . . . . . . . . . . . . . . . . . . . . . . . . . . . 121
Instrument Diagnostics . . . . . . . . . . . . . . . . . . . . . . . . . . . . . . . . . . . . . . . . . . 122
Intensity Check . . . . . . . . . . . . . . . . . . . . . . . . . . . . . . . . . . . . . . . . . . . . . .122
Performance Verification . . . . . . . . . . . . . . . . . . . . . . . . . . . . . . . . . . . . . . . 124
Pedestal Image Check . . . . . . . . . . . . . . . . . . . . . . . . . . . . . . . . . . . . . . . . . 130
Chapter 6 Safety and Operating Precautions . . . . . . . . . . . . . . . . . . . . . . . . . . . . . . . . . . . . . .131
Operating Precautions . . . . . . . . . . . . . . . . . . . . . . . . . . . . . . . . . . . . . . . . . . . 132
Safety Information. . . . . . . . . . . . . . . . . . . . . . . . . . . . . . . . . . . . . . . . . . . . . . 133
iv NanoDrop One
C
with NanoDropQC Software User Guide Thermo Scientific
Page 5
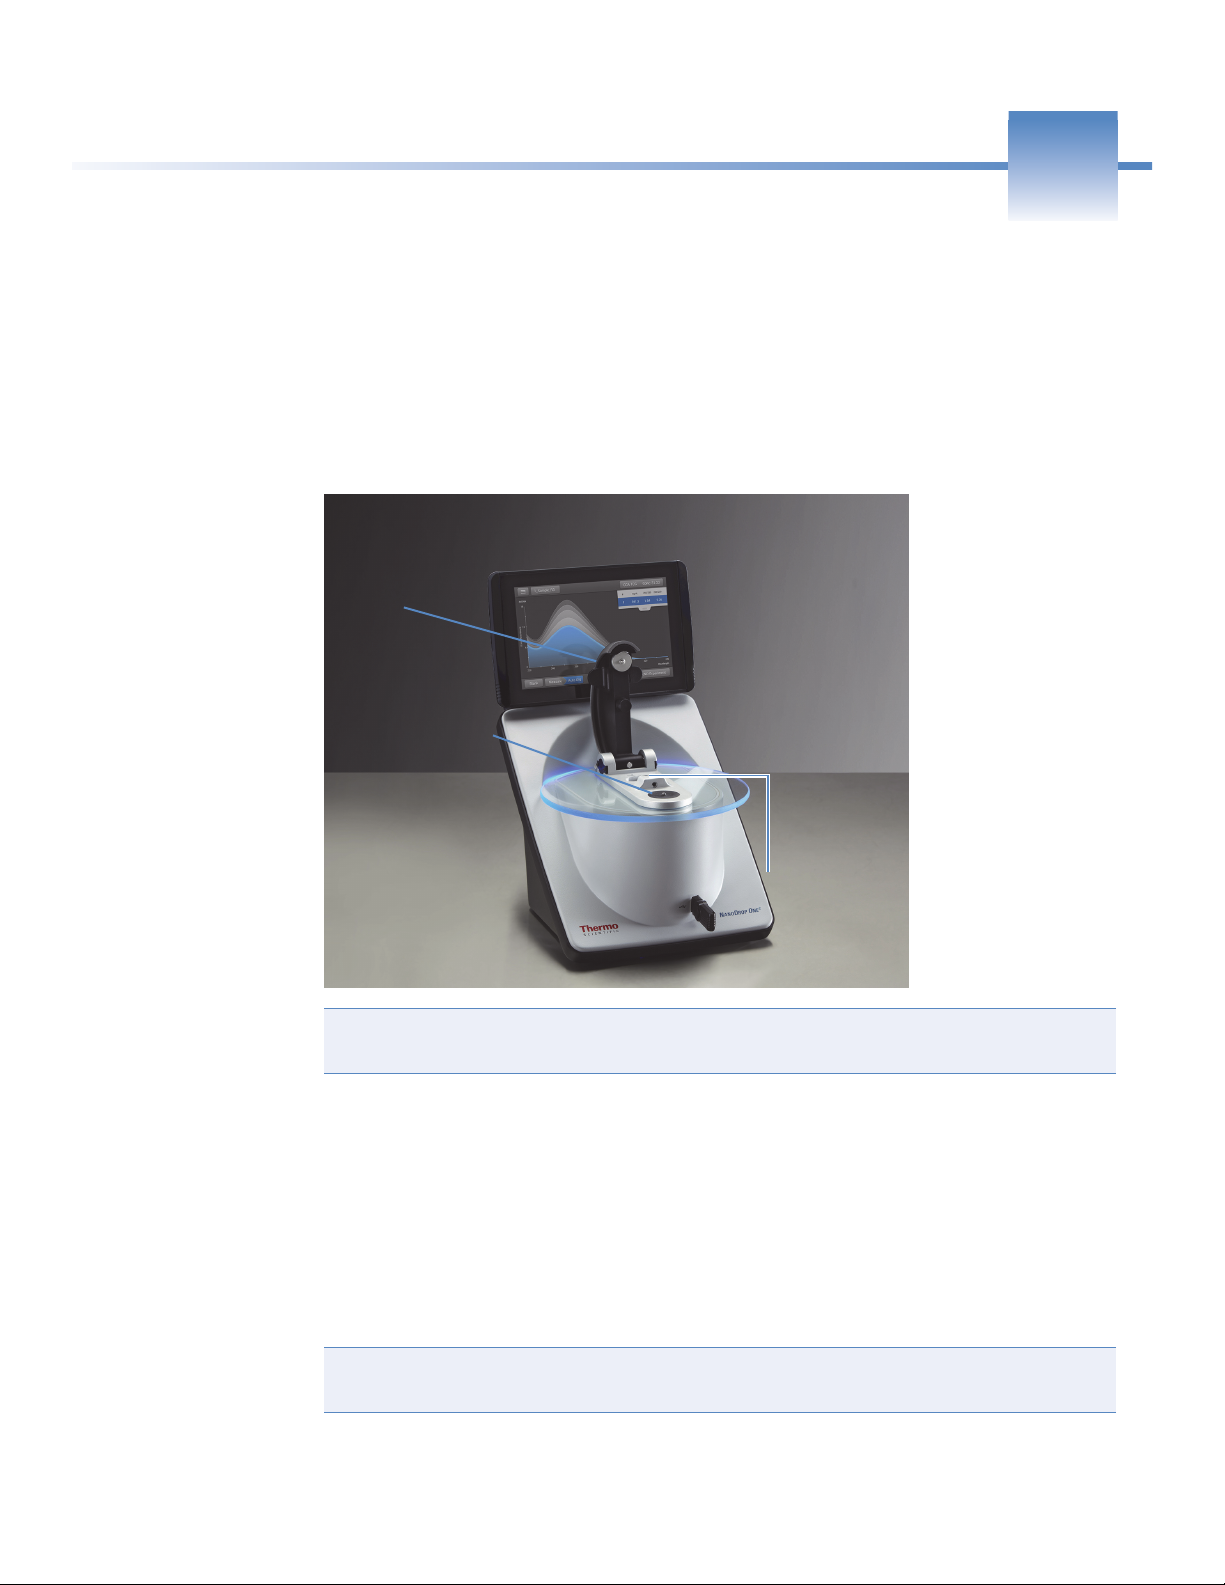
About the Spectrophotometer
NanoDrop OneC Spectrophotometer
Arm
Pedestal
1
Cuvette
holder
NOTICE Locate the instrument away from air vents and exhaust fans to minimize
evaporation
The Thermo Scientific™ NanoDrop™ OneC is a compact, stand-alone
UV-Visible spectrophotometer developed for micro-volume analysis of a wide variety of
analytes. The patented sample retention system enables the measurement of highly
concentrated samples without the need for dilutions.
C
The NanoDrop One
NanoDrop QC PC Control software can be installed on a local PC and used to control the
instrument and view data. The instrument can be connected to an optional printer with a
USB cable or to a remote printer through an Ethernet connection or wireless network.
NOTICE Before operating a NanoDrop One instrument, please read the safety and
operating precautions and then follow their recommendations when using the instrument.
system comes with preloaded software and a touchscreen display.
Thermo Scientific NanoDrop OneC with NanoDropQC Software User Guide 1
Page 6

1
About the Spectrophotometer
Features
Features
Touchscreen
TheNanoDrop OneC spectrophotometer features the patented micro-volume sample
C
retention system. The NanoDrop One
also features a cuvette holder for analyzing dilute
samples using standard UV-visible cuvettes.
TheNanoDrop OneC comes with a built-in, 7-inch high-resolution touchscreen preloaded
with easy-to-use instrument control software. The touchscreen can slide left or right to
accommodate personal preference, and tilt forward or back for optimal viewing
2 NanoDrop One
C
with NanoDropQC Software User Guide Thermo Scientific
Page 7
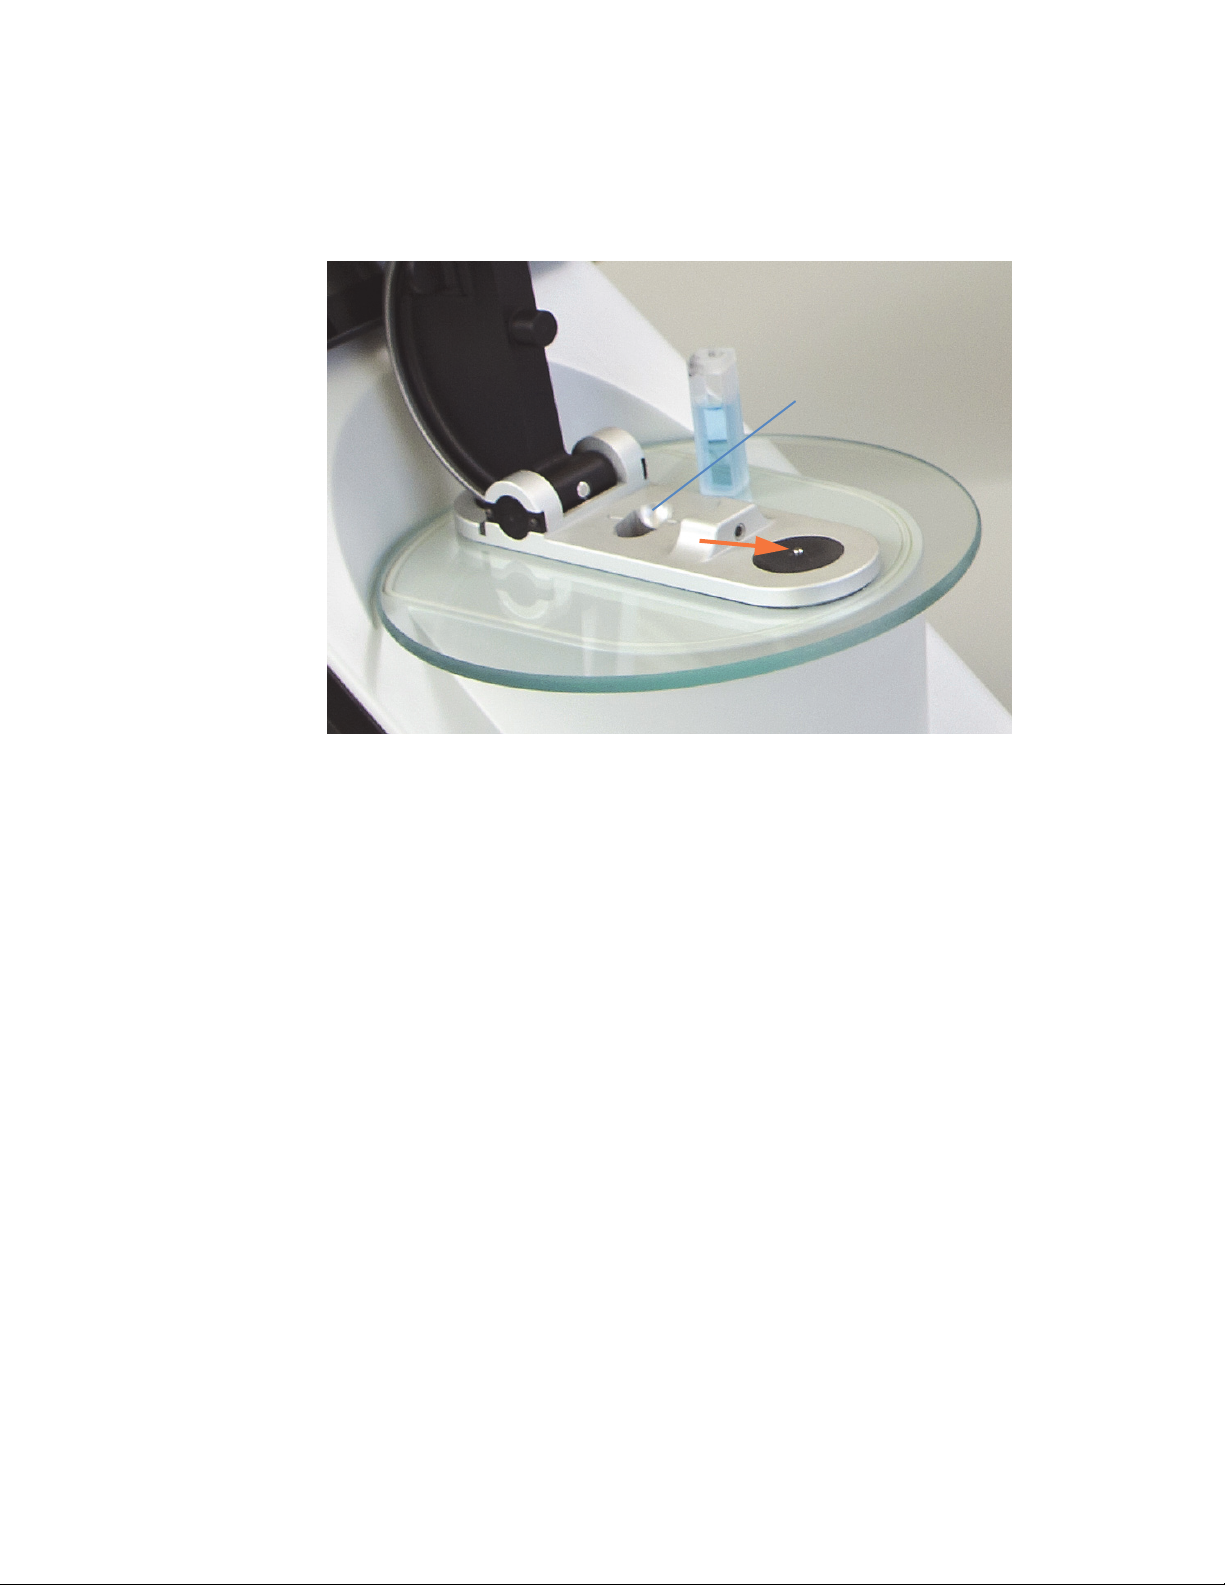
Cuvette Holder
Instrument light path
1
About the Spectrophotometer
Cuvette holder
Features
USB-A port
The NanoDrop OneC includes a cuvette holder for measuring dilute samples, colorimetric
assays, cell cultures and kinetic studies. The cuvette system has these features:
• extended lower detection limits
• 37 °C heater option for temperature-sensitive samples and analyses
• micro-stirring option to ensure sample homogeneity and support kinetic studies
For details, see Measure a Sample using a Cuvette.
Two more USB-A ports are located on instrument back panel
Thermo Scientific NanoDrop One
C
with NanoDropQC Software User Guide 3
Page 8
1
About the Spectrophotometer
Accessories
Accessories
This section lists the accessories included for use with the NanoDrop OneC.
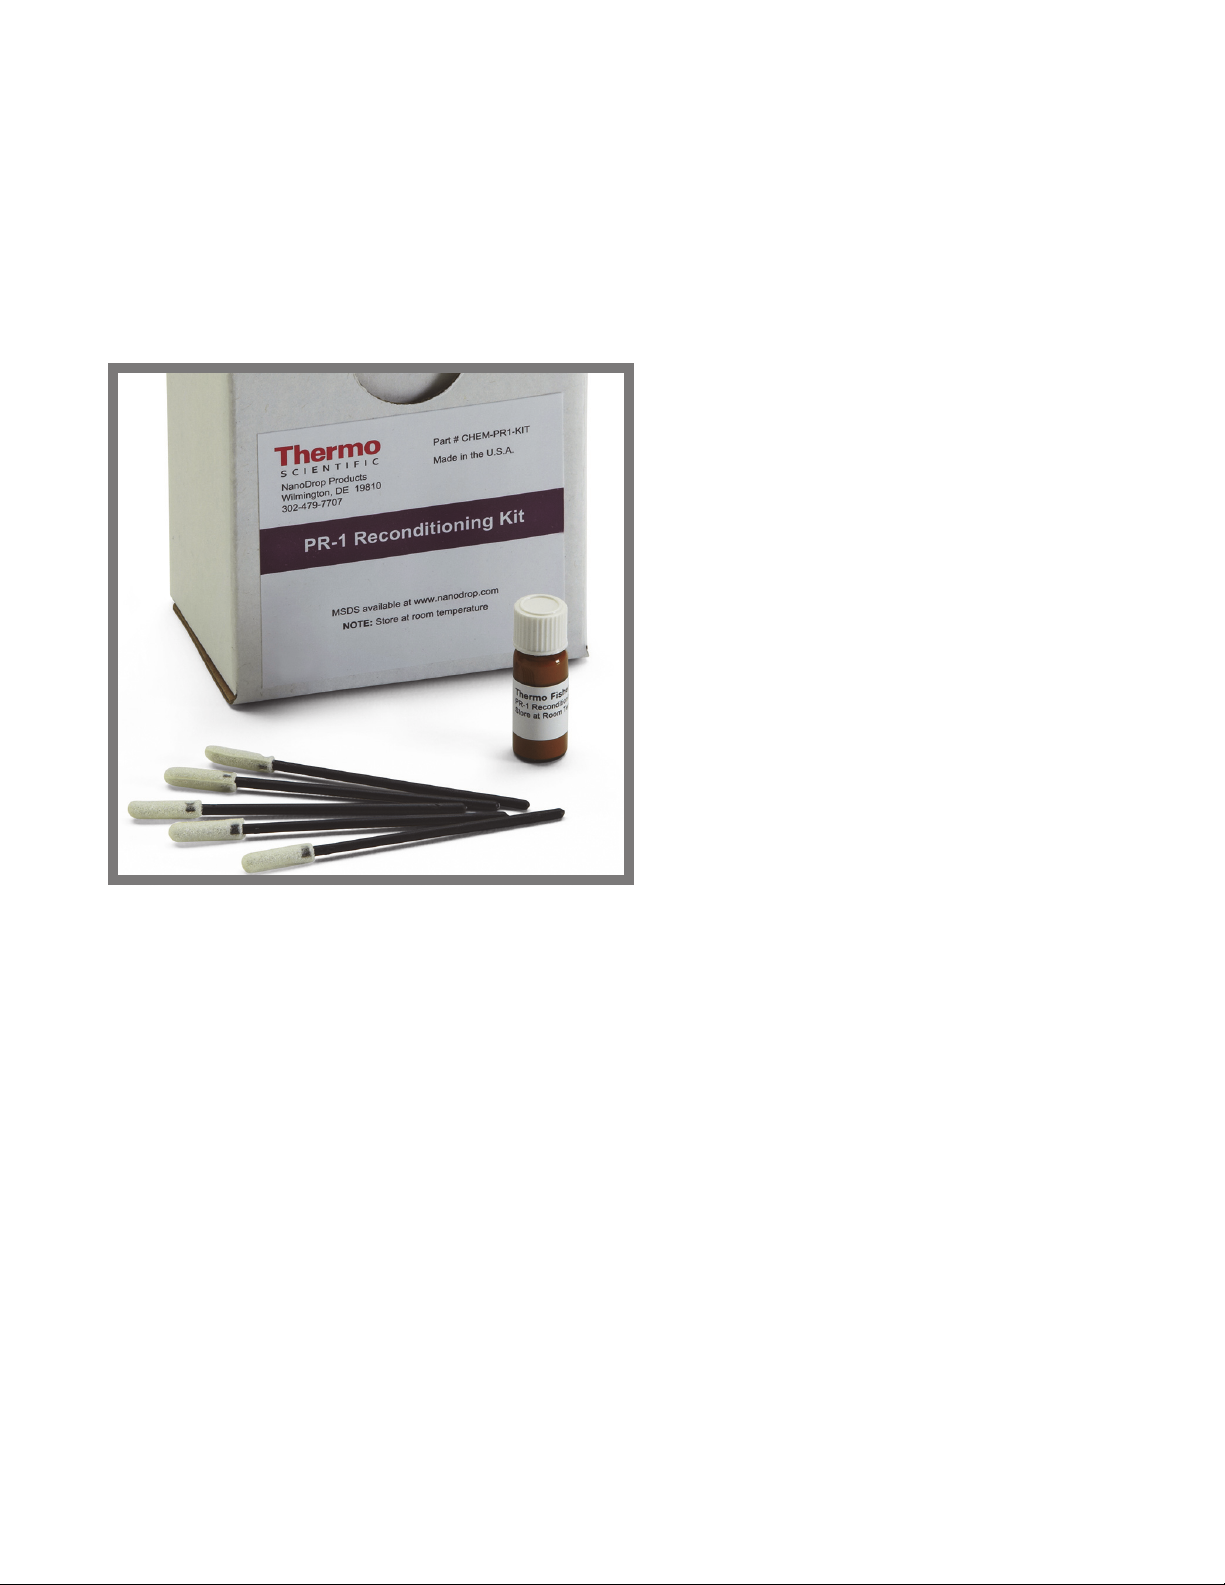
PR-1 Pedestal Reconditioning Kit
Specially formulated conditioning compound that
can be applied to the pedestals to restore them to a
hydrophobic state (required to achieve adequate
surface tension for accurate sample measurements).
The kit includes conditioning compound and
applicators. For more information, see
Reconditioning the Pedestals.
PV-1 Performance Verification Solution
Liquid photometric standard used to check instrument performance. For more information,
see Performance Verification.
4 NanoDrop One
C
with NanoDropQC Software User Guide Thermo Scientific
Page 9

Instrument Detection Limits
Measurement Location Pathlength (mm)
Pedestal 1.0 12.5
1
About the Spectrophotometer
Instrument Detection Limits
Upper Detection Limit
(10 mm Equivalent Absorbance)
0.2 62.5
0.1 150
0.05 300
0.03 550
Cuvette 10 1.5
53
2 7.5
115
Thermo Scientific NanoDrop One
C
with NanoDropQC Software User Guide 5
Page 10

1
About the Spectrophotometer
This page is intentionally blank.
6 NanoDrop One
C
with NanoDropQC Software User Guide Thermo Scientific
Page 11

Instrument Set up
Register Your Instrument
2
Register your instrument to receive e-mail updates on software and accessories for the
NanoDrop One
To register your instrument
1. Do one of the following:
On the website, locate NanoDrop One Registration and follow the instructions to register the
instrument.
Update Software
Quickly and easily download and install the latest NanoDrop One software and release notes
from our website. Follow the steps to update or upgrade the software on your local instrument
and/or install or update the NanoDrop QC software on a personal computer (PC). An
Internet connection is required to download software.
To install or update NanoDrop QC software on a PC
1. Insert the USB flash drive containing the installer software into an available USB port on
C
instrument. An Internet connection is required for registration.
– From any PC that is connected to the Internet, use any web browser to navigate to
our website.
your PC
2. Launch Start.exe. The software installer will run.
To install or update NanoDrop QC software on the instrument
1. Copy the .zip file with the new software from your computer to a USB storage device. Do
not attempt to unzip the folder.
C
2. Insert the USB device into any USB port on the NanoDrop One
3. From the instrument Home screen, tap Settings > System > Update Software and
choose the latest version of software.
Thermo Scientific NanoDrop OneC with NanoDropQC Software User Guide 7
instrument.
Page 12

2
Instrument Set up
Setting Up User Account Control
Setting Up User Account Control
User account control is managed using the Security Administration application. When you
launch Security Administration, you will need to enter your Windows log-in information.
User Account Control
Launch the Security Administration application and select NanoDrop QC from the directory
on the left to reveal Access Control and System Policies.
Access control
Access control is used to grant or deny individual users or groups access to protected features
in the instrument application. Add and remove users and groups to the access list and set
access rights using the drop-down for each entity.
System policies
8 NanoDrop One
System Policies is used to set options that define the behavior of the client application. See
“Security Administration Policies.”
C
with NanoDropQC Software User Guide Thermo Scientific
Page 13

Security Administration Policies
System policies allow you to assign data and method creation and deletion and editing
privileges for users and groups.
Launch the Security Administration application and select NanoDrop QC -> System
Policies
You can add, delete, or edit policy groups and enable or disable the group’s users permission to
delete data. When you are finished, select Save. Changes will take effect the next time
NanoDrop QC is launched. Changes made to the Security Administration policies are
applicable to the local PC only and will not affect other computers on the network.
2
Instrument Set up
Setting Up User Account Control
Thermo Scientific NanoDrop One
C
with NanoDropQC Software User Guide 9
Page 14

2
Instrument Set up
Technical Support
Technical Support
For U.S./Canada Support, please contact:
Thermo Fisher Scientific
3411 Silverside Road
Tatnall Building, Suite 100
Wilmington, DE 19810 U.S.A.
Telephone: 302 479 7707
Toll Free: 1 877 724 7690 (U.S. & Canada only)
Fax: 302 792 7155
E-mail: nanodrop@thermofisher.com
Website: www.thermoscientific.com/nanodrop
For International Support, please contact:
Contact your local distributor. For contact information go to:
http://www.nanodrop.com/Order.aspx
If you are experiencing an issue with your system, refer to the troubleshooting information. If
the issue persists, contact us. If you are outside the U.S.A. and Canada, please contact your
local distributor.
If your instrument requires maintenance or repair, contact us or your local distributor.
10 NanoDrop One
C
with NanoDropQC Software User Guide Thermo Scientific
Page 15

Applications
Use the NanoDrop OneC to perform UV-Vis, Chemometrics, or your own custom
measurements.
The UV-Vis application can be set up directly from the touchscreen and allows the
instrument to function as a conventional spectrophotometer. Up to 40 wavelengths from 190
nm to 850 nm can be monitored and reported.
The Chemometrics application allows you to use your unique chemometrics method. The
method is created using the NanoDrop QC PC Control software that is installed on your PC
and then loaded into the instrument though a USB storage device. See the NanoDrop QC PC
Control software to learn about Chemometric method features that are supported.
3
The Custom application provides additional flexibility for the method that you use with the
instrument. See the NanoDrop QC PC Control software to learn about custom method
features that are supported.
• Measure UV-Vis 12
• Measure Chemometrics 18
• Measure Custom 29
Thermo Scientific NanoDrop OneC with NanoDropQC Software User Guide 11
Page 16

3
Applications
Measure UV-Vis
Measure UV-Vis
Measure UV-Vis
The UV-Vis application allows the instrument to function as a conventional
spectrophotometer. Sample absorbance is displayed on the screen from 190 nm to 850 nm.
Up to 40 wavelengths can be designated for absorbance monitoring and inclusion in the
report. Automatic pathlength adjustment and a single-point baseline correction can also be
used.
Measures the absorbance of any sample at
up to 40 wavelengths across the ultra-violet
(UV) and visible regions of the spectrum.
Measure UV-Vis
Reported Results
Settings
Detection Limits
To make UV-Vis measurements
NOTICE
• Do not use a squirt or spray bottle on or near the instrument as liquids will flow into
the instrument and may cause permanent damage.
• Do not use hydrofluoric acid (HF) on the pedestals. Fluoride ions will permanently
damage the quartz fiber optic cables.
Before you begin...
Before taking pedestal measurements with the NanoDrop One instrument, lift the instrument
arm and clean the upper and lower pedestals. At a minimum, wipe the pedestals with a new
laboratory wipe. For more information, see Cleaning the Pedestals.
To measure a sample using the UV-Vis application
1. From the Home screen, select UV-Vis.
2. Specify up to 40 wavelengths to monitor (or you can specify them later if desired) and
whether automated pathlength adjustment, analysis wavelength, and baseline correction
will be used.
12 NanoDrop One
C
with NanoDropQC Software User Guide Thermo Scientific
Page 17

3
Applications
Measure UV-Vis
3. Pipette 1–2 µL blanking solution onto the lower pedestal and lower the arm, or insert
the blanking cuvette into the cuvette holder.
Tip: If using a cuvette, make sure to align the cuvette light path with the instrument
light path.
4. Tap Blank and wait for the measurement to complete.
Tip: If Auto-Blank is On, the blank measurement starts automatically after you lower
the arm. (This option is not available for cuvette measurements.)
5. Lift the arm and clean both pedestals with a new laboratory wipe, or remove the
blanking cuvette.
6. Pipette 1-2 µL sample solution onto the pedestal and lower the arm, or insert the
sample cuvette into the cuvette holder.
7. Start the sample measurement:
– Pedestal: If Auto-Measure is On, lower arm; if Auto-Measure is off, lower arm and
tap Measure.
– Cuvette: Tap Measure.
When the sample measurement is completed, the spectrum and reported values are
displayed (see the next section).
8. When you are finished measuring samples, tap End Experiment.
9. Lift the arm and clean both pedestals with a new wipe, or remove the sample cuvette.
Best practices for UV-Vis measurements
• Ensure the sample absorbance is within the instrument’s absorbance detection limits.
• Blank with the same buffer solution used to re-suspend the analyte of interest. The
blanking solution should be a similar pH and ionic strength as the analyte solution.
• Run a blanking cycle to assess the absorbance contribution of your buffer solution. If the
buffer exhibits strong absorbance at or near an analysis wavelength, you may need to
choose a different buffer or application. See Choosing and Measuring a Blank for more
information.
• For micro-volume measurements:
– Ensure pedestal surfaces are properly cleaned and conditioned.
– Ensure samples are homogeneous before taking a measurement. Avoid introducing
bubbles when mixing and pipetting.
– Follow best practices for micro-volume measurements.
– Use a 1-2 µL sample volume. See Recommended Sample Volumes for more
information.
Thermo Scientific NanoDrop One
C
with NanoDropQC Software User Guide 13
Page 18

3
Applications
Measure UV-Vis
• For cuvette measurements (NanoDrop OneC instruments only), use compatible cuvettes
and follow best practices for cuvette measurements.
UV-Vis Reported Results
UV-Vis measurement screen
For each measured sample, this application shows the absorbance spectrum and a summary of
the results. Here is an example as it appears on the local instrument display:
Menu of options;
tap to open
UV-Vis spectrum
Sample name;
tap to edit
Absorbance at userdefined wavelength 1
(450 nm)
Tap to edit
Absorbance at user- defined
wavelength 2 (623 nm)
Tap to edit
Tap to add
Tap row to
select sample
and update
spectrum; tap
more rows to
overlay up to five
spectra. Press
and hold
sample row to
view
Pinch and zoom to
adjust axes;
double-tap to reset
14 NanoDrop One
C
with NanoDropQC Software User Guide Thermo Scientific
Swipe screen left to
view table with more
measurement results
Tap to end
experiment and
export data
measurement
details.
Drag tab
down/up to see
more/less
sample data
Page 19

3
Applications
Measure UV-Vis
Note Micro-volume absorbance measurements and measurements taken with
nonstandard cuvettes are normalized to a 10.0 mm pathlength equivalent.
UV-Vis reported values
The initial screen that appears after each measurement (see previous image) shows a summary
of the reported values. To view all reported values, press and hold the sample row. Here is an
example:
Application
User-defined
wavelengths
Sampling
method
Baseline correction
wavelength
Sample name;
tap to edit
Absorbance
at 635 nm
Date/time
measured
Automated
pathlength
setting
Baseline
correction
absorbance
Absorbance at
450 nm
Absorbance at
623 nm
Note Scroll up to display absorbance values for any additional user-defined wavelengths.
Thermo Scientific NanoDrop One
C
with NanoDropQC Software User Guide 15
Page 20

3
Applications
Measure UV-Vis
Below is an example of the measurement screen with reported values as it appears in the
NanoDrop QC PC software:
Back to Home screen
(ends experiment)
Sample name;
select to edit
Run blank
Measure sample
solution
Select to toggle
Auto-Measure ON/OFF
Tips: Auto-Measure
default is ON
Auto-Blank default
is OFF
Select to add
absorbance at userdefined wavelengths
With sample selected, click and drag an area to zoom
Right-click and select Autoscale to fit spectra to window
Tips:
Click sample row to select sample and update spectrum
Shift-click multiple sample rows to overlay up to five spectra
Click a sample and hover locations on spectra to view measurement values
End experiment
and export data
Sample rows
16 NanoDrop One
C
with NanoDropQC Software User Guide Thermo Scientific
Page 21

Settings for UV-Vis Measurements
To show the UV-Vis settings, from the Home screen, select UV-Vis.
Setting Available Options Description
3
Applications
Measure UV-Vis
Monitored
wavelengths
Enter up to 40
wavelengths between
190 nm and 850 nm
Analytical Wavelength Any wavelength between
190 nm and 850 nm
Automated Pathlength On or Off
(affects pedestal
measurements only)
User-defined wavelengths to be measured and reported at run
time. Absorbance values for the first three entered wavelengths
are displayed in the measurement screen. To see absorbance
values for 8 monitored wavelengths, swipe left in the
measurement screen to show the Data table. To see all monitored
wavelengths, press and hold a sample row to show the Sample
Details screen (scroll up to display absorbance values for any
additional user-defined wavelengths).
Note: If Baseline Correction is selected, all displayed absorbance
values are the corrected values.
This is the wavelength the software will use to determine the
pathlength selection.
Optional automated pathlength selection. Allows the software
to use the optimal (shorter) pedestal pathlength for high
concentration samples to help prevent detector saturation (see
Detection Limits for details).
• When selected, the shorter pathlength is used when any
wavelength between 220 nm and 850 nm has 10 mm
equivalent absorbance value of 12.5 or higher. For
wavelengths between 190 nm and 219 nm the change to the
shorter pathlength occurs when any wavelength in this range
has a 10 mm equivalent absorbance value of 10 or higher.
• When deselected, the pedestal pathlength is restricted to
10 mm across all wavelengths.
Note: In either case, displayed absorbance values have been
normalized to a 10 mm pathlength equivalent.
Baseline Correction On or off
Optional user-defined baseline correction. Can be used to
correct for any offset caused by light scattering particulates by
Enter baseline correction
wavelength in nm or use
default value (750 nm)
subtracting measured absorbance at specified baseline correction
wavelength from absorbance values at all wavelengths in sample
spectrum. As a result, absorbance of sample spectrum is zero at
specified baseline correction wavelength.
Thermo Scientific NanoDrop One
C
with NanoDropQC Software User Guide 17
Page 22

3
Applications
Measure Chemometrics
Measure Chemometrics
Make chemometric measurements.
Measure Chemometrics
Create Chemometric Method
Edit Chemometric Method
Reported Results
Settings
Detection Limits
Measure Chemometrics
The NanoDrop OneC model instrument can be used to make chemometric measurements.
Note The instrument arm can be up during cuvette measurements, which allows you to
add reagents to the sample solution if desired.
To make chemometric measurements
NOTICE
• To prevent damage from spills, keep containers of liquids away from the instrument.
• Do not use a squirt or spray bottle on or near the instrument as liquids will flow into
the instrument ans may cause permanent damage.
Chemometric methods can only be created on a personal computer running the
NanoDrop QC PC Control software. If you want to run a chemometric method and store the
measurement results on the instrument, the method must also reside on the instrument. (This
is the only way to run a chemometric method if your instrument is not connected to the
computer with an Ethernet cable.)
18 NanoDrop One
C
with NanoDropQC Software User Guide Thermo Scientific
Page 23

3
Applications
Measure Chemometrics
Load a chemometrics method
To measure a sample using a chemometrics method, you must first load the method onto the
instrument.
To load chemometrics methods onto the instrument:
1. Export the method from the personal computer and copy the method file to the root of a
portable USB device such as a memory stick.
Method files have a “.qmethod” filename extension.
2. Connect the USB device to one of the USB ports on the instrument.
3. From the Home screen, select the Chemometric Application icon
4. Use the list box at the top of the screen to indicate the USB port used.
5. Select Load Method.
A message box shows the NanoDrop One methods available on the selected USB device.
6. Select one or more method names in the Load Method box to select the methods to load.
7. Select Load.
Thermo Scientific NanoDrop One
C
with NanoDropQC Software User Guide 19
Page 24

3
Applications
Measure Chemometrics
To measure a sample using the chemometrics application
1. From the Home screen, select the Chemometrics icon.
The Chemometrics Method Selection screen is displayed. If one or more chemometric
methods exist in the currently selected Data Storage Location, they will be listed in the
Select Method box. A description of the selected method appears in the Method Details
box.
2. Select a method:
20 NanoDrop One
• select an existing method by selecting the method name in the Select Method box.
3. Select Run Method.
4. Follow the on-screen instructions to measure a sample.
C
with NanoDropQC Software User Guide Thermo Scientific
Page 25

3
Applications
Measure Chemometrics
To measure a sample using the chemometrics application from the PC software
1. From the Home screen, select the Chemometric Method icon.
The Chemometrics Method Selection screen is displayed. If one or more chemometric
methods exist in the currently selected Data Storage Location, they will be listed in the
method selection pane below the search feature. Details of the selected method appears in
the method details pane to the right.
2. Select a method:
• select an existing method by selecting the method name in the method selection
pane.
3. Select .
Follow the on-screen instructions to measure a sample.
Thermo Scientific NanoDrop One
C
with NanoDropQC Software User Guide 21
Page 26
3
Applications
Measure Chemometrics
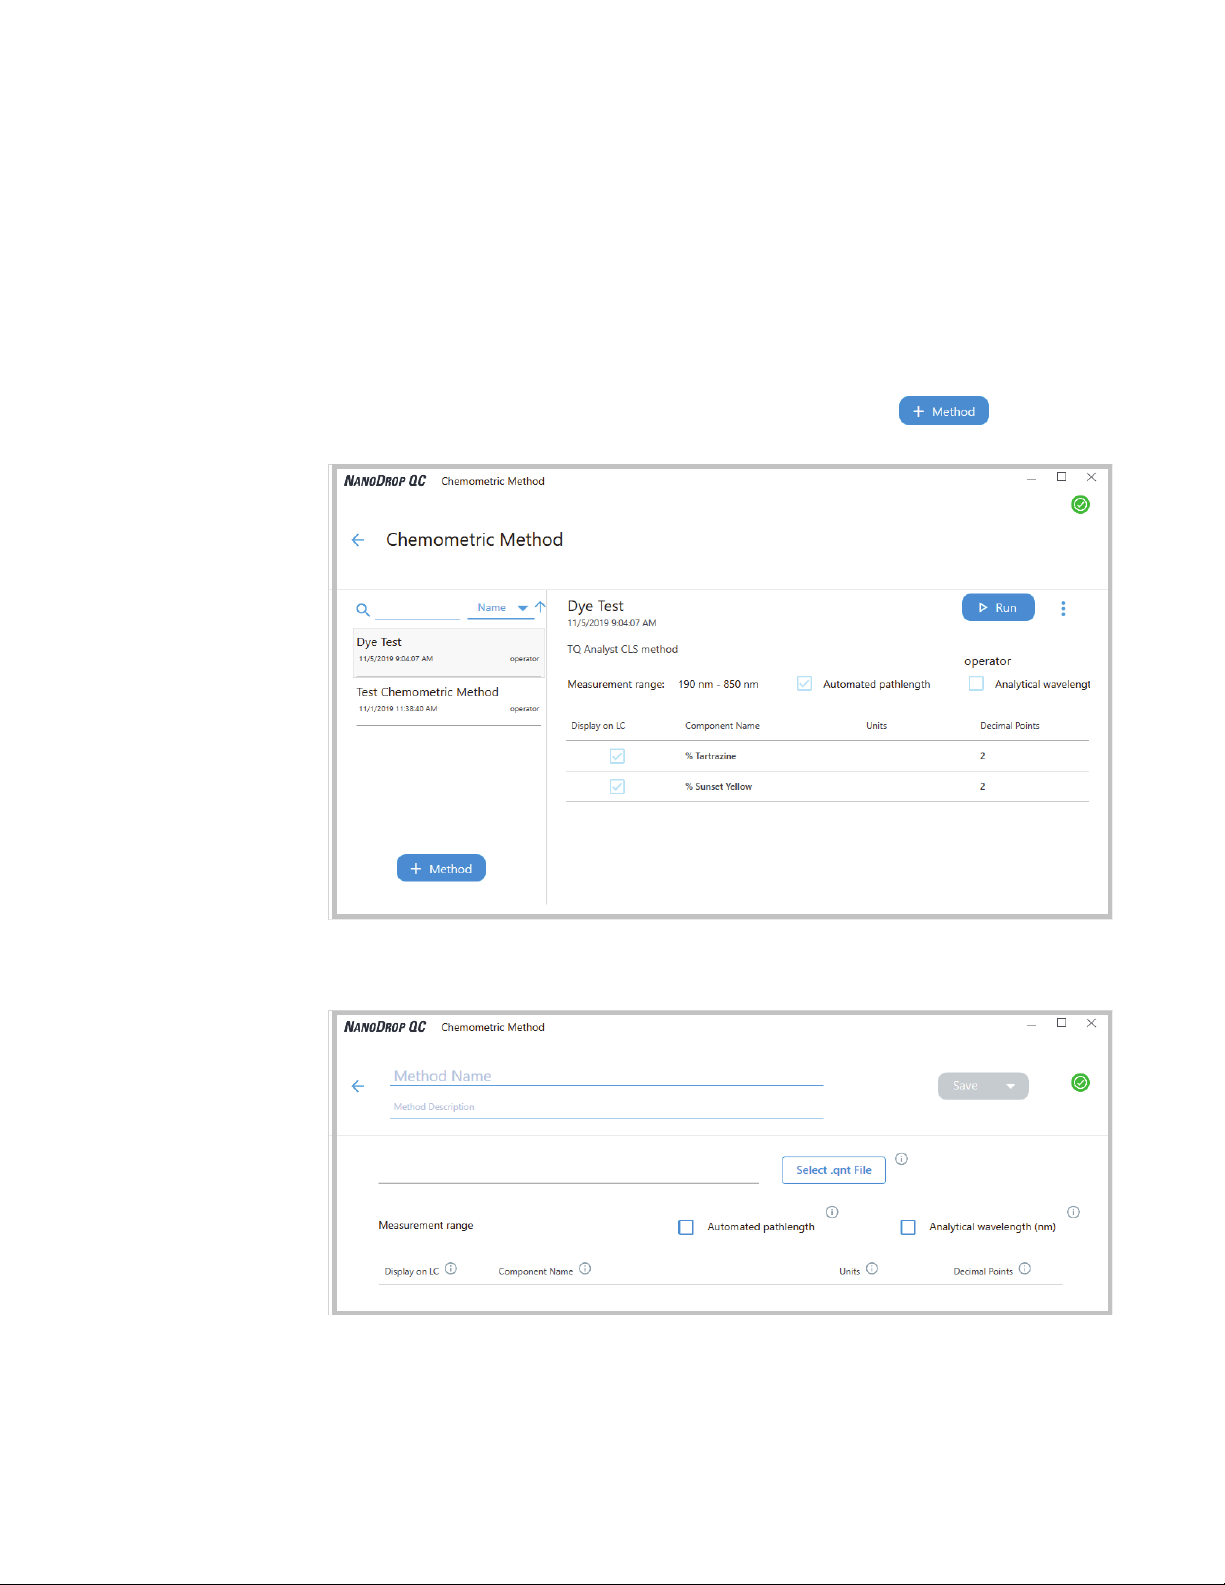
Create Chemometrics Method
Chemometrics methods can be created only on the NanoDrop QC PC Control software.
However, once the method is created, it can be saved in the NanoDrop One database on the
local instrument, or in the NanoDrop QC database on the PC. To create a new
Chemometrics method:
– From the NanoDrop QC software, select the Chemometric Method icon
– From the Chemometric Method Management pane, select
22 NanoDrop One
– Enter both a name and description for your chemometric method
– Select the quant method (.qnt fiile) you want to use
C
with NanoDropQC Software User Guide Thermo Scientific
Page 27
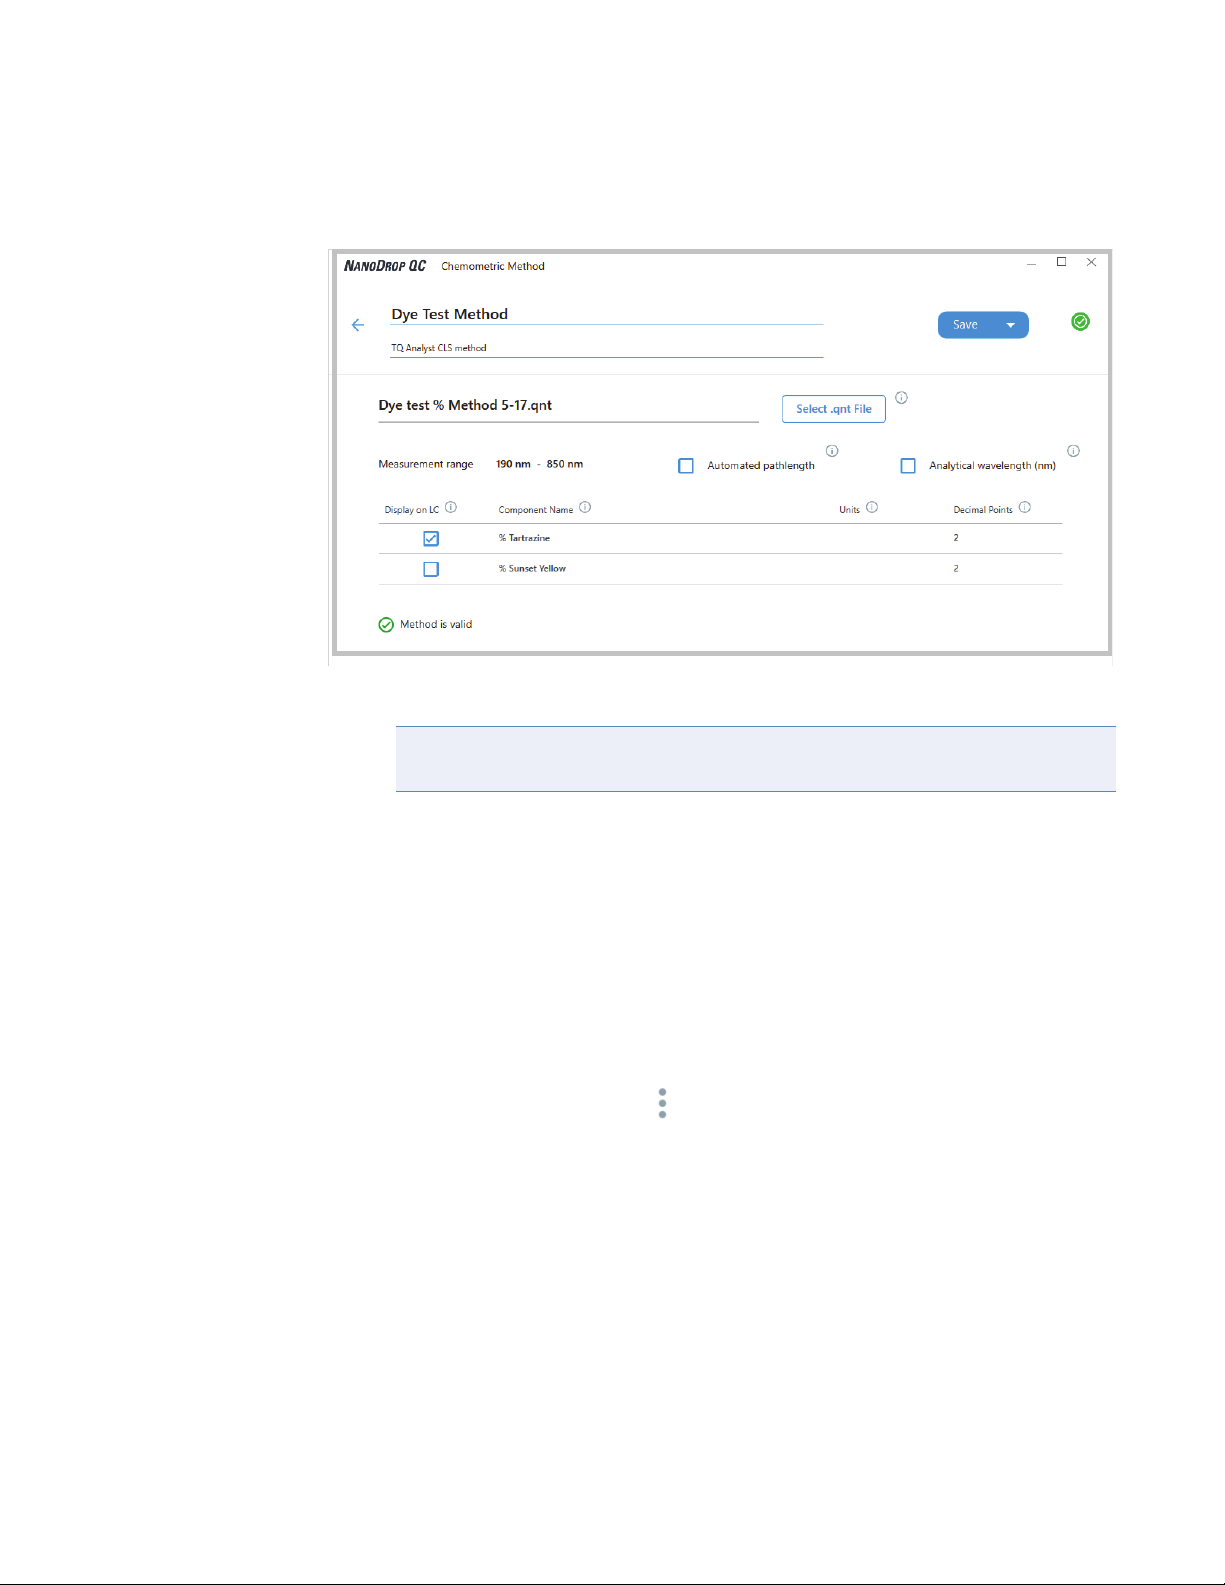
– Adjust the method settings as desired
3
Applications
Measure Chemometrics
– Select Save
Note The method is saved in the currently selected Data Storage Location (local
instrument or a connected PC).
– To run the method, select Run Method
Edit Chemometrics Method
Chemometrics methods can be edited only on the NanoDrop QC software. To edit an
existing chemometrics method:
– From the NanoDrop QC software, select the Chemometric Method icon
– From the Chemometric Method Management screen, select the method you would
like to edit from the list of loaded methods.
– From the drop-down menu select Edit.
– Adjust the method settings as desired. You can select the components to be displayed
on the LC.
– Select Save
Thermo Scientific NanoDrop One
C
with NanoDropQC Software User Guide 23
Page 28

3
Applications
Measure Chemometrics
Chemometrics Reported Results
Chemometrics method measurement screen (shown from Data
Viewer)
For each measured sample, this application shows the absorbance spectrum and a summary of
the results. Here is an example:
Menu of options;
tap to open
UV-visible spectrum
Analyte
concentrations
Tap row to
select sample
and update
spectrum; tap
more rows to
overlay up to
five spectra.
Press and
hold sample
row to view
measurement
details.
Drag tab
down/up to
see more/less
Pinch and zoom to
adjust axes;
double-tap to reset
24 NanoDrop One
C
with NanoDropQC Software User Guide Thermo Scientific
sample data
Swipe screen left to
view table with more
measurement results
Note Micro-volume absorbance measurements and measurements taken with
nonstandard cuvettes are normalized to a 10.0 mm pathlength equivalent.
Page 29

3
Applications
Measure Chemometrics
Chemometrics method reported values
The initial screen that appears after each measurement (see previous image) shows a summary
of the reported values. To view all reported values, press and hold the sample row. Here is an
example:
Method
name
Sampling
method
Sample name;
tap to edit
Date/time
measured
Analyte
concentration
Method
details
Thermo Scientific NanoDrop One
C
with NanoDropQC Software User Guide 25
Page 30

3
Applications
Measure Chemometrics
Data Table
To see the data table, swipe the rate measurement screen (see above) to the left. Each row in
the table shows the absorbance values at all user-defined wavelengths at a given stage and time.
Scroll down to see measurement information that is out of view. The image below highlights
the available features.
Measurement
number
Sample name
Analyte concentration
Press and hold
row to view
measurement
details
26 NanoDrop One
Swipe screen right to return
to Rate measurement screen
C
with NanoDropQC Software User Guide Thermo Scientific
Tap to end experiment
and export data
Page 31

3
Applications
Measure Chemometrics
Measurement Details
To view details for a measurement, from the absorbance measurement screen or data table,
press and hold the measurement row. Here is an example:
Print this
Application
used
Return to
Sample nameSampling
method
Date/time
measured
Component
results
Method details
(scroll up to
view more)
Delete this
screen
previous screen
User-defined
wavelengths
Thermo Scientific NanoDrop One
measurement
C
with NanoDropQC Software User Guide 27
Page 32

3
Applications
Measure Chemometrics
Settings for Chemometric Measurements
Settings for chemometrics methods are defined by the quant method used. From the
instrument Home screen, select Chemometrics, and select a mehtod from the list. The
method details are displayed. Settings can be edited only from the NanoDrop QC software. In
the PC Control software, you can select which components are displayed on the instrument
and set significant figures for each component.
28 NanoDrop One
C
with NanoDropQC Software User Guide Thermo Scientific
Page 33

Measure Custom
Runs a custom measurement method created
using NanoDrop QC software.
Measure Custom Method
Delete Custom Method
Reported Results
Measure using a Custom Method
Use the Custom application to run a user-defined method created using the NanoDrop QC
software running on a personal computer. For more information, see “Create Custom
Method” on page 35.
3
Applications
Measure Custom
To load a custom method
Custom methods can only be created on a personal computer running the NanoDrop QC
software. If you want to run a custom method and store the measurement results on the
instrument, the method must also reside on the instrument. (This is the only way to run a
custom method if your instrument is not connected to the computer with an Ethernet cable.)
Load custom methods onto the instrument
1. Export the method from the personal computer and copy the method file to the root of a
portable USB device such as a memory stick.
Method files have a “.method” filename extension.
Note Custom methods downloaded from the NanoDrop One website have a .zip
filename extension and must be extracted using a third-party file decompression
program before the software will recognize them as custom methods.
2. Connect the USB device to one of the USB ports on the instrument.
3. From the Home screen, select Custom Method.
4. Use the list box at the top of the screen to indicate the USB port used.
Thermo Scientific NanoDrop One
C
with NanoDropQC Software User Guide 29
Page 34

3
Applications
Measure Custom
5. Select Load Method.
A message box shows the NanoDrop One methods available on the selected USB device.
6. Select one or more method names in the Load Method box to select the methods to load.
7. Select Load.
To measure using a custom method
NOTICE
• Do not use a squirt or spray bottle on or near the instrument as liquids will flow into
the instrument and may cause permanent damage.
• Do not use hydrofluoric acid (HF) on the pedestals. Fluoride ions will permanently
damage the quartz fiber optic cables.
Before you begin...
Before taking pedestal measurements with the NanoDrop One instrument, lift the instrument
arm and clean the upper and lower pedestals. At a minimum, wipe the pedestals with a new
laboratory wipe. For more information, see Cleaning the Pedestals.
To measure a sample using a custom method using the local instrument interface
30 NanoDrop One
1. Make sure the method resides in same location as the database where you want to store
the measurement results (see To Load a Custom Method for details).
2. From the Home screen, select Custom Method.
3. In the Select Method box, select to select the method to run.
C
with NanoDropQC Software User Guide Thermo Scientific
Page 35

3
Applications
Measure Custom
Information about the selected method appears in the Method Details box.
4. Select Run Method.
5. Follow the on-screen instructions to measure a sample.
To measure a sample using a custom method using the PC software
1. Make sure the method resides in same location as the database where you want to store
the measurement results (see To Load a Custom Method for details).
2. From the Home screen, select Custom Method.
Thermo Scientific NanoDrop One
C
with NanoDropQC Software User Guide 31
Page 36

3
Applications
Measure Custom
3. In the method selection pane, select to select the method to run.
Information about the selected method appears in the method details pane.
4. Select .
5. Follow the on-screen instructions to measure a sample.
Delete Custom Method
– From Home screen, select Custom Method.
– In Select Method box, select a method to delete
– Select
32 NanoDrop One
C
with NanoDropQC Software User Guide Thermo Scientific
Page 37

Custom Method Reported Results
Custom method measurement screen (shown from Data Viewer)
For each measured sample, this application shows the absorbance spectrum and a summary of
the results. Here is an example:
3
Applications
Measure Custom
Menu of options;
tap to open
UV-visible spectrum
Analyte
concentration
Tap row to
select sample
and update
spectrum; tap
more rows to
overlay up to five
spectra. Press
and hold
sample row to
view
measurement
details.
Drag tab
Pinch and zoom to
adjust axes;
double-tap to reset
Note Micro-volume absorbance measurements and measurements taken with
nonstandard cuvettes are normalized to a 10.0 mm pathlength equivalent.
Thermo Scientific NanoDrop One
Swipe screen left to
view table with more
measurement results
down/up to see
more/less
sample data
C
with NanoDropQC Software User Guide 33
Page 38

3
Applications
Measure Custom
Custom method reported values
The initial screen that appears after each measurement (see previous image) shows a summary
of the reported values. To view all reported values, press and hold the sample row. Here is an
example:
Method
name
Sampling
method
Sample name;
tap to edit
Date/time
measured
Analyte
concentration
Method
details
34 NanoDrop One
C
with NanoDropQC Software User Guide Thermo Scientific
Page 39

Manage Custom Methods
The NanoDrop QC PC Control software is your tool for creating and managing custom
methods, which contain user-defined settings that can be used to acquire data with the
instrument. Custom methods can be made with or without standards.
Create Custom Method
Create method to be used for sample measurements with user-defined settings.
Create new custom method
– from the NanoDrop QC Home screen, select Custom Method
3
Applications
Measure Custom
Custom
Method
Icon
– in Manage Custom Methods screen, select and choose one of the
following:
– Formula (if your method will not have standards)
– Standard Curve (if your method will have standards)
– in the setup window, enter Method Name (this name appears in the Custom Setup
box on the instrument after the method has been transferred there)
– enter detailed Description of method, if desired
– specify how to calculate and report the method results:
– if method does not have standards, specify factor or extinction coefficient of
analyte (enter “1” to report absorbance measurements only)
– if method has standards, enter name and concentration of each standard and
select the curve fit type
– enter or choose remaining custom settings as needed
– choose Save
Thermo Scientific NanoDrop One
C
with NanoDropQC Software User Guide 35
Page 40

3
Applications
Measure Custom
Note If appears at the bottom left of the screen instead of a green check
mark icon, the method is invalid because it contains an error. Hover your mouse
over the icon for suggested solutions.
if the method has a green check mark icon at the bottom, select Close to exit method
setup
36 NanoDrop One
View or edit custom method
– select Custom Method (existing methods are listed in Select Method box along with
their type (formula or standards) and Description
– From the Custom Method Management screen, select the method you would like to
edit from the list of loaded methods.
– From the drop-down menu select Edit
– View and adjust the method settings as desired
– Select Save
C
with NanoDropQC Software User Guide Thermo Scientific
Page 41

3
Applications
Measure Custom
Custom method settings
These settings are available for creating custom methods.
Setting Available Options
Result name Enter descriptive name for calculated concentration result (for example, “Polymer A
analysis”) and use adjacent drop down list to select appropriate unit. Result name
appears as column heading for reported concentration value.
Measurement range Select spectral range in which method will acquire data.
Available options:
• Ultra-violet only (190 nm - 350 nm)
• Visible only (350 nm - 850 nm)
• Ultra-violet and visible (190 nm - 850 nm)
• Custom (specify starting and ending point in nanometers)
Analysis wavelength
correction
Notes:
• If a Baseline correction and/or Analysis wavelength correction are used, make sure
your selected spectral range includes your specified baseline correction and/or
analysis correction wavelength.
• For micro-volume absorbance measurements and measurements taken with nonstandard (other than 10 mm) cuvettes, the spectra are normalized to a 10 mm
pathlength equivalent.
Use this option to specify absorbance correction at analysis wavelength only. Available
options:
• None. No correction at analysis wavelength.
• Single point. Enter wavelength for analysis correction. (Absorbance value at
specified analysis correction wavelength is subtracted from absorbance value at
analysis wavelength. Corrected value is used to calculate sample concentration.)
• Sloping baseline. Enter two wavelengths that define sloping baseline for analysis
correction. (Absorbance value of sloping baseline at analysis wavelength is
subtracted from absorbance value at analysis wavelength. Corrected value is used
to calculate sample concentration.)
Thermo Scientific NanoDrop One
C
with NanoDropQC Software User Guide 37
Page 42

3
Applications
Measure Custom
Setting Available Options
Factor or Extinction coefficient at 1 cm pathlength
(Formula methods only)
Specify whether to use factor or extinction coefficient to calculate concentration
result:
• User-defined factor. Enter factor for 1 cm pathlength and use adjacent drop
down list to select appropriate unit. Equation below shows how factor is used to
calculate sample concentration:
c = (A * f) / b
where:
c = analyte concentration
A = absorbance in absorbance units (A)
f = factor (typically 1/
coefficient, or extinction coefficient)
b = pathlength in cm (determined at measurement time, then normalized to
10 mm (1 cm) pathlength equivalent)
• Extinction coefficient and molecular weight. Enter extinction coefficient for
1 cm pathlength and use adjacent drop down list to select appropriate unit.
Equation below shows how extinction coefficient is used to calculate sample
concentration:
, where = wavelength-dependent molar absorptivity
c = A / ( * b)
where:
c = analyte concentration
A = absorbance in absorbance units (A)
= wavelength-dependent molar absorptivity coefficient (or extinction
coefficient)
b = pathlength in cm (determined at measurement time, then normalized to
10 mm (1 cm) pathlength equivalent)
Notes:
• Refer to product literature for information about factors and extinction
coefficients for specific materials.
• To set up a method that reports absorbance measurements only, select Factor or
Extinction Coefficient with the factor or extinction coefficient set to “1”.
• If specified unit for factor or extinction coefficient is based on mass (such as
mg/mL) and specified unit for calculated result is based on molarity (such as
pmol/µL) or vice versa, enter molecular weight and use adjacent drop down list
to select appropriate unit.
38 NanoDrop One
C
with NanoDropQC Software User Guide Thermo Scientific
Page 43

Setting Available Options
3
Applications
Measure Custom
Standards (Standard curve
methods only)
Define the standards:
• Enter name and analyte concentration of each standard and a reference, if desired:
– Depending on the Curve Type setting, a standard curve can be generated
using two or more standards. (The software allows a reference and up to 7
standards.)
– All reference and standards solutions should be in the same buffer used to
resuspend the samples plus the same volume of reagent added to the samples.
– First standard can be a reference measurement. The reference solution
should contain none of the analyte of interest. (The reference measurement is
not the same as a blank measurement.)
– Concentration values for standards can be entered in any order but the
standards must be measured in the order in which they were entered;
however, best practice dictates that standards be measured from the lowest
concentration of the standard analyte stock to the highest.
– Concentration range of the standards must cover the dynamic range of the
assay and the expected range of the unknown samples. Sample analyte
concentrations are not extrapolated beyond the concentration of the highest
standard.
• Select curve fit type.
Analysis wavelength
(Standard curve methods
only)
Specify type of equation used to create standard curve from standard concentration
values. Available options:
– Linear: Draws the linear least squares line through all measured standards
(requires reference measurement and at least one standard)
– Interpolation: Draws a series of straight lines to connect all measured
standards (requires reference measurement ans at least one standard)
nd
– 2
order polynomial: Draws th 2nd order least squares polynomial using all
measured standards (requires reference measurement and at least standards)
– 3rd order polynomial: Draws the 3rd order least squares polynomial using all
measured standards (requires reference measurement and at least three
standards)
Monitor absorbance at specified wavelength (enter the wavelength in nanometers).
Note: The specified wavelength must fall within the selected measurement range.
The measurement results or the concentration will be calculated automatically using
the absorbance value at the specified wavelength and applying the selected method
type (factor or standard curve).
Thermo Scientific NanoDrop One
C
with NanoDropQC Software User Guide 39
Page 44

3
Applications
Measure Custom
Setting Available Options
Baseline correction Select this option to correct offset caused by light scattering particulates by subtracting
the absorbance at a specified baseline point. Then specify wavelength for baseline
correction.
Note: Software subtracts absorbance value at specified baseline correction wavelength
from absorbance values at all wavelengths in sample spectrum. As a result, absorbance
of sample spectrum is zero at specified baseline correction wavelength.
Automated pathlength Affects micro-volume measurements only.
• When Automated Pathlength is selected, software selects the optimal pathlength
(between 1.0 mm and 0.03 mm) based on sample absorbance at the analysis
wavelength. For example, when sample absorbance at the analysis wavelength is
less than or equal to 12.5 (10 mm pathlength equivalent), the optimal longer
pathlength is used. When sample absorbance is greater than 12.5, the optimal
shorter pathlength is used. Recommended for samples that are highly absorbing at
the analysis wavelength. (This option may cause reduced sensitivity when the
sample spectra have a large absorbance peak that is not at the analysis
wavelength.)
Note: When the analysis wavelength is between 190 nm and 219 nm, the optimal
longer pathlength is used when sample absorbance is less than or equal to 10
(10 mm pathlength equivalent), and the optimal shorter pathlength is used when
sample absorbance is greater than 10.
• When Automated Pathlength is deselected, the software uses a 1 mm pathlength
regardless of the sample absorbance. This can cause detector saturation (resulting
in jagged peaks) for highly absorbing samples (e.g., ~15 A at 10 mm pathlength
equivalent).
40 NanoDrop One
C
with NanoDropQC Software User Guide Thermo Scientific
Page 45

3
Applications
Measure Custom
Setting Available Options
Formula table (optional) Use the Formula table to specify additional reported results, such as a purity ratio, for
each sample.
Available options:
• Predefined. Select from a list of predefined formulas, which can be used as is or
edited, and choose Add. The predefined formula is listed in the Formula Table.
• Add. Create formula for current method. Available options:
• Formula Name. Enter a name for the formula. After a measurement, the
name is reported in Data Table and Sample Details screens.
• Formula. Enter valid formula (see below for rules and examples). After a
measurement, the measured or calculated value is reported in Data Table and
Sample Details screens.
• Unit. Enter unit for reported result. After a measurement, the unit is reported
in Data Table and Sample Details screens.
• Edit. Edit selected formula for current method.
• Delete. Delete selected formula from current method.
Formula rules Custom formulas can include the following operators and functions:
• Path(). Returns sample pathlength in cm.
• A(nm). Returns sample absorbance at specified wavelength (for example, enter
A(650) to add the measured absorbance at 650 nm to your equation).
• Operators: + (add), - (subtract), * (multiply), / (divide).
• Functions: Log(x), Pow(x,y).
Notes: Follow these additional rules for all languages:
• Use period “.” decimal separators for floating point and double-floating point
numbers.
• Use comma “,” list separators (for example, “POW(2,8)”).
• Do not use comma “,” group separators for large numbers (for example, enter
1000 rather than 1,000).
Thermo Scientific NanoDrop One
C
with NanoDropQC Software User Guide 41
Page 46

3
Applications
Measure Custom
Copy Custom Method
To create a custom method that is similar to an existing one, open the existing method, make
your changes, then select Save As and enter a new name.
Copy custom method
You can now select the saved method and edit the Description and settings.
– from the Custom Methods screen, select a custom method
– from the drop-down menu choose Edit
– enter new Method name and Description
– select Save As
– Enter a filename for the method and click Save
Run Custom Method
If you want to run a custom method and store the measurement results on the instrument, the
method must also reside on the instrument (see Load a Custom Method for details).
Export Custom Method
Export a custom method in order to run it and store the measurement results on the
NanoDrop One
– from the Custom Methods screen, select a custom method
– from the kebab menu, choose Export (if method is invalid, an error message is
– choose Save (method is exported to method file (*.method filename extension) in
C
instrument.
displayed; errors must be fixed before method can be exported)
proprietary format)
To transfer the method to the NanoDrop One instrument, copy the method file to a
USB memory device and then load the method (see Load a Custom Method for
details)
42 NanoDrop One
C
with NanoDropQC Software User Guide Thermo Scientific
Page 47

Import custom method
Import a custom method back to a computer running the NanoDrop One QC software in
order to edit the method settings.
– from the Custom Methods screen, choose Import
– locate and select “.method” file
– choose Open (imported method is added to end of Select Method list)
Edit custom method
Edit a custom method in order to change the method settings.
– from Custom Methods screen, select a custom method from the list of available
methods
3
Applications
Measure Custom
– from the kebab menu, choose Edit
– edit method settings as desired
– choose Save
Delete custom method
– from Custom Methods screen, select a custom method from the list of available
– from the drop-down menu , choose Delete
after confirmation message, choose Ye s
methods
Thermo Scientific NanoDrop One
C
with NanoDropQC Software User Guide 43
Page 48

3
Applications
This page is intentionally blank.
44 NanoDrop One
C
with NanoDropQC Software User Guide Thermo Scientific
Page 49

Learning Center
Contents
• Micro-Volume Sampling—How it Works 46
• Set Up the Instrument 48
• Measure a Micro-Volume Sample 58
• Measure a Sample Using a Cuvette 63
• Prepare Samples and Blanks 66
• Basic Instrument Operations 71
4
• Instrument Settings 100
• PC Control Software 107
Thermo Scientific NanoDrop OneC with NanoDropQC Software User Guide 45
Page 50

4
Learning Center
Micro-Volume Sampling—How it Works
Micro-Volume Sampling—How it Works
Surface Tension
Absorbance Spectrum
Sample Absorbance
Sample Concentration
Baseline Correction
Surface Tension
The NanoDrop OneC spectrophotometer uses surface
tension to hold a small volume of sample between two
pedestals. The patented sample retention system enables
the measurement of highly concentrated samples
without the need for dilutions.
A fiber optic cable embedded in the upper pedestal leads
to a xenon light source. A second cable embedded in the
lower pedestal leads to a detector. When the instrument
arm is down, the sample forms a liquid column,
essentially bridging the gap between the two fiber optic
cables.
46 NanoDrop One
C
with NanoDropQC Software User Guide Thermo Scientific
Page 51

4
Learning Center
Micro-Volume Sampling—How it Works
Absorbance Spectrum
The light passes through the liquid column to the
detector, which generates a spectrum of absorbance
versus wavelength. The spectrum shows the amount of
light absorbed by the molecules of the sample at each
measured wavelength.
Note: To prevent evaporation, which affects
measurement accuracy, close the arm quickly after you
finish loading a sample or blank.
The example at the left shows a typical absorbance
spectrum taken of a nucleic acid sample. The spectrum
is measured from 190 nm to 850 nm. The displayed
range may vary for each application.
Sample Absorbance
Absorbance
intensity
--------------------------------------
log–=
intensityblank
sample
When the instrument is blanked, a reference spectrum is
taken of the blanking solution and stored in memory.
For each sample measurement, the sample intensities
along with the blank intensities are used to calculate the
total absorbance of the sample according to the
equation at the left.
Baseline Correction
For some applications, the instrument can be set up to
apply a baseline correction to each measurement to
minimize any offset caused by light scattering
particulates in the sample spectra. The correction
subtracts the absorbance value at a reference wavelength
that is close to zero from the absorbance value at each
wavelength across the spectrum, essentially “anchoring”
the spectrum to zero absorbance units at the reference
wavelength.
Thermo Scientific NanoDrop One
C
with NanoDropQC Software User Guide 47
Page 52

4
Learning Center
Set Up the Instrument
Set Up the Instrument
Power on/off
USB-A (2)
Ethernet
Power
Connect Power
CAUTION Avoid shock hazard. Each wall outlet used must be equipped with a ground.
The ground must be a noncurrent-carrying wire connected to earth ground at the main
distribution box.
Connect the provided power cord to a grounded wall outlet. See “Power Cords” on page 137
for more information.
Connect an Accessory
To connect a compatible printer or other compatible accessory such as a USB keyboard
and/or mouse to the instrument, use any USB port on the instrument (front, back-left or
back-right). See Accessories for information about accessories compatible with the
NanoDrop One instruments.
Set Up Bluetooth Connections
48 NanoDrop One
Use Bluetooth™ to connect the instrument to one or more Bluetooth (wireless) input devices
such as a Bluetooth keyboard, mouse or barcode scanner.
C
with NanoDropQC Software User Guide Thermo Scientific
Page 53

4
Learning Center
Set Up the Instrument
Note Make sure the device is labeled “Bluetooth” and not just “wireless.” All Bluetooth
devices are wireless but not all wireless devices will run with Bluetooth.
Set up Bluetooth connections on the instrument
– from instrument Home screen, tap (Settings)
– tap System tab
– tap Bluetooth (if Bluetooth is disabled, button in upper right is set to “Off” and no
Bluetooth input devices are listed)
– tap Off button to enable Bluetooth connectivity (button turns blue, changes to “On”
and software automatically searches for any available Bluetooth input devices)
If no Bluetooth devices are found, after a few seconds the message “No nearby
Bluetooth devices were found” is displayed
– to add a Bluetooth device, follow manufacturer instructions to pair the device (for
example, you may need to hold down a button) and tap Search For Devices on
instrument)
device name should appear in Available Devices list
Thermo Scientific NanoDrop One
C
with NanoDropQC Software User Guide 49
Page 54

4
Learning Center
Set Up the Instrument
– to pair device, tap its name in Available Devices list (a pairing request similar to the
following may be displayed)
– complete any instructions to pair the device
Note If your Bluetooth device does not pair, restart the device and then repeat
the steps above to pair it with the instrument (you may also try turning Bluetooth
off and back on). After a device is paired, it remains paired even after the
instrument is restarted.
– tap Back (Bluetooth status is displayed at right of Bluetooth button)
50 NanoDrop One
– repeat steps above to add another Bluetooth device or tap Done to close Settings
C
with NanoDropQC Software User Guide Thermo Scientific
Page 55

4
Learning Center
Set Up the Instrument
Deselect Bluetooth input device
You may want to stop using a Bluetooth device for input without disconnecting or unpairing
it. This allows others to easily reselect and use the device for input. For example, if there are
multiple connected and paired Bluetooth input devices such as a keyboard and a barcode
scanner, follow these steps to select the devices to use or to deselect devices you don’t want to
use:
– from instrument Home screen, tap
– tap System tab
– tap Bluetooth
– to deselect a paired Bluetooth device such as a
keyboard for input, tap its Profiles button
– deselect Use For Input by clearing it’s associated checkbox
– tap Paired Bluetooth Device in upper left to return to previous screen
– tap Back to return to System settings
– tap Done to close Settings
Note
• If no Bluetooth device is selected for input, the instrument relies on the
integrated touchscreen keyboard for input.
• To select the device again, follow the steps above and select the device’s Use
for Input checkbox.
Thermo Scientific NanoDrop One
C
with NanoDropQC Software User Guide 51
Page 56

4
Learning Center
Set Up the Instrument
Disconnect Bluetooth device
– from instrument Home screen, tap
– tap System tab
– tap Bluetooth
– to disconnect paired Bluetooth device, tap its Profiles button
– tap Unpair
device is no longer listed under “Paired Devices” but remains in Available Devices list
– tap Back to return to System settings
– tap Done to close Settings
52 NanoDrop One
C
with NanoDropQC Software User Guide Thermo Scientific
Page 57

Set Up Ethernet Connection
The instrument Ethernet port can be used to set up a wired connection between the
instrument and either a personal computer (PC) or an active network wall jack.
If the instrument is connected to a network wall jack, you can export data files to a network
location, for example, in order to transfer them to another computer. You can define multiple
network paths that the operator can select when exporting data. See Export Settings for
details.
Tools needed:
• Standard (straight through) Ethernet cable (CAT5e or newer is recommended)
Note If the computer is an older model, you may need a crossover Ethernet cable instead.
Most newer model computers are designed to automatically detect and work with both
cable types. However, a straight through cable will provide best performance.
Set up Ethernet connection
4
Learning Center
Set Up the Instrument
– from instrument Home screen, tap
– tap Networking tab
– tap Ethernet
– select an Ethernet option and choose OK.
• Direct connection to a PC. Select if you plan to connect an Ethernet cable
C
between the NanoDrop One
instrument and a personal computer.
• Connection to a network jack. Select if you plan to connect an Ethernet cable
between the NanoDrop One
C
instrument and a network wall jack.
– connect one end of Ethernet cable to Ethernet port on instrument back panel
Thermo Scientific NanoDrop One
C
with NanoDropQC Software User Guide 53
Page 58

4
Learning Center
Set Up the Instrument
Ethernet port
– connect other end of Ethernet cable to either the computer Ethernet port or an active
network wall jack
Set up Wireless Connections
Select Wi-Fi network on the instrument
– from instrument Home screen, tap (Settings)
– tap Networking tab
– tap Wi-Fi (if Wi-Fi is disabled, button in upper right is set to “OFF” and no wireless
networks are listed)
– tap button to enable Wi-Fi and display available Wi-Fi networks
54 NanoDrop One
C
with NanoDropQC Software User Guide Thermo Scientific
Page 59

4
Learning Center
Set Up the Instrument
– select remote computer’s Wi-Fi network host and tap Connect (here is an example)
– tap Back to exit Wi-Fi setup (if the connection is successful, the instrument is
assigned an IP (Internet Protocol) address, which appears at the right of the Wi-Fi
button as in the example below)
Note Some Wi-Fi networks may require an identity, password or other
information before you can connect to them, or they may be anonymous (that is,
you may have to search for them by name). For more information, see the system
administrator at your work site.
– tap Done to exit Settings
Thermo Scientific NanoDrop One
C
with NanoDropQC Software User Guide 55
Page 60

4
Learning Center
Set Up the Instrument
Assess Instrument Connectivity
Use the System Status icon at the top right of the instrument Home screen to quickly assess
the instrument’s connectivity status including Bluetooth and Wi-Fi:
Tap to show connectivity status
Show connectivity status
– tap on instrument Home screen to open System Status box
Location of database where instrument is currently
storing data (Local (instrument) or Connected PC)
– tap OK to exit System Status
Wi-Fi status
Bluetooth
status
56 NanoDrop One
C
with NanoDropQC Software User Guide Thermo Scientific
Page 61

Operating Specifications
The instrument operates reliably when the room environment meets these specifications:
• operating temperatures: 5 °C - 35 °C (41 °F - 95 °F)
• relative humidity (non-condensing): 20-80%
Locate the instrument away from air vents and exhaust fans to minimize evaporation.
Note If operating the instrument at the low end of the recommended humidity range, use
adequate sample volume to avoid evaporation.
After the instrument is installed, you can leave it turned on.
4
Learning Center
Set Up the Instrument
Thermo Scientific NanoDrop One
C
with NanoDropQC Software User Guide 57
Page 62

4
Learning Center
Measure a Micro-Volume Sample
Measure a Micro-Volume Sample
The NanoDrop One spectrophotometer uses surface tension to
hold a small volume of sample between two pedestals. The
patented sample retention system enables the measurement of
highly concentrated samples without the need for dilutions. Tap
here for details.
Supplies needed
• NanoDrop One or NanoDrop OneC spectrophotometer
• lint-free laboratory wipes
• calibrated precision pipettor (0–2 µL)
• sample material resuspended in appropriate buffer solution
(see Preparing Samples)
• pure buffer solution for blanking instrument (see Choosing
and Measuring a Blank or watch multimedia training What is
a blank?)
58 NanoDrop One
C
with NanoDropQC Software User Guide Thermo Scientific
Page 63

Best practices for micro-volume measurements
Cleaning pedestals for daily operation
• Before first measurement, clean both
pedestals with a new laboratory wipe.
• Run a blanking cycle to verify pedestals
are clean.
• After each measurement, clean both
pedestals with new wipe to prevent
carryover.
• After each set of measurements, clean
pedestals with DI H2O (see Clean
pedestals between users)
• Recondition pedestals periodically to
maintain their hydrophobic property.
4
Learning Center
Measure a Micro-Volume Sample
Pipetting Samples
• Use recommended sample volumes to
ensure proper liquid column
formation.
• Use calibrated precision pipettor (0–
2 µL volume range) with well-fitting,
low-retention precision tips to apply
sample material to instrument for
measurement.
If using low accuracy (0-10 µL)
pipettor, use 2 µL sample volumes.
• Use new tip for each blank and sample
aliquot.
• Use new aliquot of sample for each
measurement.
• If solvents are used, make sure they are
compatible with the pedestals. (see
“Compatible Solvents” in Hazardous
Materials).
Thermo Scientific NanoDrop One
C
with NanoDropQC Software User Guide 59
Page 64

4
Learning Center
Measure a Micro-Volume Sample
To measure a micro-volume sample
NOTICE
• Do not use a squirt or spray bottle on or near the instrument as liquids will flow into
the instrument and may cause permanent damage.
• Do not use hydrofluoric acid (HF) on the pedestals. Fluoride ions will permanently
damage the quartz fiber optic cables.
1. From the instrument Home screen, select an application:
UV-Vis, Chemometric, or Custom Methods.
2. Lift the instrument arm and clean the upper and lower
pedestals with new laboratory wipe.
60 NanoDrop One
C
with NanoDropQC Software User Guide Thermo Scientific
Page 65

4
Learning Center
Measure a Micro-Volume Sample
3. Measure a blank:
– Pipette 1–2 µL blanking solution onto the lower
pedestal and quickly lower the arm
– Tap Blank and wait for the measurement to complete
Tip: If Auto-Blank is On, blank measurement starts
automatically after you lower the arm.
– Lift the arm and clean both pedestals with a new
laboratory wipe
4. Measure the first sample:
– Pipette 1-2 µL sample solution onto the pedestal and
quickly lower the arm (see Recommended Sample
Volumes for more information)
Tap to end experiment
– Start the sample measurement:
– if Auto-Measure is On, lower arm
– if Auto-Measure is off, lower arm and tap Measure
– When the sample measurement is completed, the
spectra and reported values are displayed.
5. To measure another sample:
– Lift the arm
– Clean both pedestals with new wipe
– Load the next sample and quickly lower the arm
– Start the sample measurement
– Wait for the measurement to complete
The new spectrum replaces the previous one on the spectral
display and the new reported values appear under the
previous ones in the table. (Drag tab down to show both
sets of data.)
Thermo Scientific NanoDrop One
C
with NanoDropQC Software User Guide 61
Page 66

4
Learning Center
Measure a Micro-Volume Sample
6. When you are finished measuring samples:
– Tap End Experiment (see previous image)
– Enter an experiment name (tap Experiment Name box
to display keyboard), or leave the default experiment
name
Tap to show keyboard;
to close, tap Done key
Tap to measure
more samples
Tap to end and
save experiment
– Tap
– Lift the arm and clean both pedestals with a new wipe
If finished with the instrument for the day, clean the
pedestals with DI H2O (see Clean pedestals between
users)
Acquired data are automatically saved in an experiment with
the entered name. In the default configuration, experiments are
stored in a database on the local instrument according to
acquisition date, experiment name, application used and any
assigned labels (see Manage identifiers on the instrument).
62 NanoDrop One
C
with NanoDropQC Software User Guide Thermo Scientific
Page 67

Measure a Sample Using a Cuvette
The NanoDrop OneC spectrophotometer includes a
cuvette holder for measuring dilute samples, colorimetric
assays, cell cultures and kinetic studies. The cuvette system
offers an extended lower detection limit and an optional
37 °C heater and micro-stirrer.
Supplies needed
• NanoDrop OneC spectrophotometer
4
Learning Center
Measure a Sample Using a Cuvette
• lint-free laboratory wipes
• two compatible cuvettes
• sample material resuspended in appropriate buffer
solution (see Preparing Samples)
• pure buffer solution for blanking instrument (see
Choosing and Measuring a Blank or watch multimedia
training What is a blank?)
Thermo Scientific NanoDrop One
C
with NanoDropQC Software User Guide 63
Page 68

4
Learning Center
Measure a Sample Using a Cuvette
Best practices for cuvette measurements
• The instrument arm can be up or
down for cuvette measurements.
• Use 10 mm, 5 mm, 2 mm or 1 mm
cuvettes up to 48 mm tall.
• Clean and dry cuvette after each
measurement.
• Use cuvettes that are free of scratches
and avoid fingerprints which may
affect results.
• Use quartz cuvettes or UV-grade
plastic cuvettes to measure samples
with analysis wavelengths in the
UV range (<340 nm).
Cuvette holder
Instrument light path
• Micro, semi-micro, and ultra-micro
cuvettes should be masked.
• Fill cuvettes with enough blanking or
sample solution to cover instrument
optical path (2 mm sample beam is
8.5 mm above cuvette bottom).
• Lift instrument arm and make sure
cuvette holder is free of debris.
• When inserting quartz or masked
plastic cuvettes, align cuvette light path
with instrument light path.
To measure a sample using a cuvette
NOTICE
• To prevent damage from spills, keep containers of liquids away from the instrument.
64 NanoDrop One
• Do not use a squirt or spray bottle on or near the instrument as liquids will flow into
the instrument ans may cause permanent damage.
C
with NanoDropQC Software User Guide Thermo Scientific
Page 69

4
Learning Center
Measure a Sample Using a Cuvette
1. From the Home screen, select (Settings)
2. Specify the cuvette options:
– Select General
– Select Use Cuvette
– Set Pathlength to pathlength (width) of
cuvette (see cuvette manufacturer for
specifications)
Cuvette holder
– Set stirrer and heater if desired
– Select Done
See General settings for details.
3. From the Home screen, select an application
4. Measure a blank:
– Fill clean, dry cuvette with enough blanking
solution to cover instrument optical path
– Lift instrument arm and insert blanking
cuvette into cuvette holder, making sure to
align light path of cuvette with light path of
instrument
– Tap Blank and wait for the measurement to
complete
Instrument light path
Thermo Scientific NanoDrop One
C
with NanoDropQC Software User Guide 65
Page 70

4
Learning Center
Prepare Samples and Blanks
Prepare Samples and Blanks
5. Measure a sample:
– Fill clean cuvette to same height with sample
solution
– Replace blanking cuvette with sample
cuvette, making sure to align light paths
– Tap Measure
– Wait for measurement to complete
– Remove cuvette
– Clean cuvette according to manufacturer
specifications
Preparing Samples
• Isolate and purify samples before measuring them with the instrument. Commercial
sample isolation kits are available for these purposes, or use an in-house protocol. After
purification, analyte of interest is typically dissolved in aqueous buffer solution before it is
measured.
Tip: Any molecule that absorbs light at analysis wavelength will contribute to total
absorbance value used to calculate sample concentration.
• Ensure final analyte concentration is within instrument’s absorbance detection limits.
• For micro-volume measurements, gently (but thoroughly) vortex each sample before
taking a measurement.
Avoid introducing bubbles when mixing and pipetting. For more information, watch
multimedia training Effects of Bubbles in Samples.
Note Samples dissolved in extremely volatile solvent such as hexane may work best with
C
cuvette sampling option (NanoDrop One
instruments only).
66 NanoDrop One
C
with NanoDropQC Software User Guide Thermo Scientific
Page 71

Choosing and Measuring a Blank
The buffer used to resuspend a sample analyte can contribute absorbance. Blanking minimizes
any absorbance contribution due to the buffer components from the sample measurement.
The resulting sample spectrum represents the absorbance of only the analyte of interest. For
more information, watch the multimedia training What is a blank?
For best results:
• For most applications, blank with the same
buffer solution used to resuspend the analyte of
interest. The blanking solution should be a
similar pH and ionic strength as the analyte
solution. For details, see “To measure samples”
in the application used.
• Measure new blank before each set of samples.
It is not necessary to blank the instrument
before each sample measurement unless the
samples are dissolved in different buffer
solutions.
4
Learning Center
Prepare Samples and Blanks
• Measure a new blank every 30 minutes.
• Run a blanking cycle to assess the suitability of
your blanking solution before using it to
perform sample measurements. For a quick
demonstration, watch the multimedia training
Evaluating a Blanking Solution for Suitability.
The resulting spectrum should vary no more
than 0.04 A (10 mm equivalent) across the
spectrum, especially at the analysis wavelength
as in the example at the right.
If the resulting spectrum is greater than 0.04 A
around the analysis wavelength, that buffer
solution may interfere with the sample analyses,
especially for low concentration samples. See
below for details.
Good blanking buffer (measured abs < 0.04)
Thermo Scientific NanoDrop One
C
with NanoDropQC Software User Guide 67
Page 72

4
Learning Center
Prepare Samples and Blanks
Problems associated with blanking
• Residual sample was left on pedestal or in
cuvette before blank measurement was
performed. (Resulting sample spectra may
exhibit negative absorbance values, indicating
blank had more absorbance than sample in that
region of spectrum.)
• Blank measurement exhibits higher absorbance
than unknown sample at analysis wavelength.
(If buffer used as blank differs in composition
from that used to resuspend sample,
measurement results will be incorrect.)
• Sample was inadvertently used to blank
instrument. (Resulting sample spectra may
exhibit negative absorbance values or, in some
cases, resemble a mirror image of a typical pure
nucleic acid or protein spectrum as in example
at right.)
Solutions for blanking problems
• Thoroughly clean and/or recondition both
pedestals and then:
– rerun blanking cycle, or
– measure new blank using new aliquot of
appropriate buffer solution, then measure
new aliquot of unknown sample
• For most applications, blank with the same
buffer solution used to resuspend the analyte of
interest. The blanking solution should be a
similar pH and ionic strength as the analyte
solution. For details, see “To measure samples”
in the application used.
Protein sample solution used to blank
instrument results in “mirror image” spectrum
68 NanoDrop One
C
with NanoDropQC Software User Guide Thermo Scientific
Page 73

Run a Blanking Cycle
Run a blanking cycle to verify the following:
• instrument is operating normally (with flat baseline)
• pedestals are clean (i.e., no dried-down sample material on pedestals)
• absorbance contribution of buffer solution you plan to use for sample analyses
Supplies needed
• lint-free laboratory wipes
• calibrated precision pipettor (0–2 µL)
• buffer solution for evaluation
4
Learning Center
Prepare Samples and Blanks
To run a blanking cycle
For quick demonstration, watch multimedia training Evaluating a Blanking Solution for
Suitability.
NOTICE
• Do not use a squirt or spray bottle on or near the instrument as liquids will flow into
the instrument and may cause permanent damage.
• Do not use hydrofluoric acid (HF) on the pedestals. Fluoride ions will permanently
damage the quartz fiber optic cables.
Thermo Scientific NanoDrop One
C
with NanoDropQC Software User Guide 69
Page 74

4
Learning Center
Prepare Samples and Blanks
1. From the Home screen, select an
application name.
2. Lift the instrument arm and clean the
upper and lower pedestals with new
laboratory wipe.
3. Measure a water blank:
– Pipette exactly 1 µL deionized water
(DI H
lower the arm.
– Tap Blank and wait for the
measurement to complete.
– Lift the arm and clean both pedestals
with new laboratory wipe.
4. Measure the buffer solution:
– Pipette 1-2 µL buffer solution onto the
pedestal and lower the arm.
O) onto the lower pedestal and
2
Example spectrum of buffer suitable
for Protein A280 protein quantification
– Start the sample measurement:
– if Auto-Measure is On, lower arm
– if Auto-Measure is off, lower arm
and tap Measure
– Wait for measurement to complete.
The resulting spectrum should vary no
more than 0.04 A from the baseline at the
analysis wavelength.
If your spectrum does not meet these
criteria, repeat steps 2–4.
If spectrum is still outside specifications,
see Solutions for Blanking Problems.
5. When you are finished with the blanking
cycle, tap End Experiment.
6. Lift the arm and clean both pedestals with
a new wipe.
Example spectrum of buffer unsuitable
for Protein A280 protein quantification
70 NanoDrop One
C
with NanoDropQC Software User Guide Thermo Scientific
Page 75

Basic Instrument Operations
• NanoDrop One Home Screen
• NanoDrop One Measurement Screens
• Open Data Viewer
• NanoDrop One General Operations
NanoDrop One Home Screen
These operations are available from the NanoDrop One Home screen.
4
Learning Center
Basic Instrument Operations
System StatusApplications
Data Viewer Instrument
Settings
Thermo Scientific NanoDrop One
Instrument
Diagnostics
C
with NanoDropQC Software User Guide 71
Page 76

4
Learning Center
Basic Instrument Operations
Applications
System Status
The NanoDrop QC software offers several configurable applications, which gives users full
control of the measurement. See“Applications” on page 11 for detailed information about
each available application.
Tap on the instrument Home screen to open the system status box. Here is an example:
72 NanoDrop One
The available information is described below.
C
Instrument type Instrument model (NanoDrop One
)
Serial number Instrument serial number
Instrument status Current status of the instrument
Data storage location Indicates location of database set where instrument is currently
storing data. These options are available:
• Local (instrument)
• Connected PC* (personal computer connected through
Ethernet cable or wireless network)
* the Ethernet and wireless options listed above also store data
on the instrument as a backup.
Wi-Fi status Status of WiFi connections for the instrument (“Connected
to...”, “Enabled and not connected” or “Disabled”)
C
with NanoDropQC Software User Guide Thermo Scientific
Page 77

Data Viewer
4
Learning Center
Basic Instrument Operations
Bluetooth status Status of Bluetooth connections for the instrument
(“Connected to...”, “Enabled-[list of any paired devices]” or
“Disabled”)
Software package version Version of instrument operating software installed
Platform release Version of instrument platform software installed
Firmware version Version of instrument firmware installed
Android release Version of customized Android operating system software
installed
Android version Version of Android operating system software installed
Tap on the Home screen to view any data acquired earlier today, last week, last month,
last six months, last year or in a specific date range. See “Open Data Viewer” on page 82 for
more information about the Data Viewer on the instrument.
Instrument Settings
Tap on the Home screen to access instrument settings for software updates, cuvette
sampling, networking and more. See “Instrument Settings” on page 100 for detailed
information about all available instrument settings.
Instrument Diagnostics
Tap on the Home screen to verify instrument operation. Instrument diagnostics
should be run periodically according to the recommended maintenance schedule. See
“Instrument Diagnostics” on page 122 for information about how to run the available
instrument diagnostics.
Thermo Scientific NanoDrop One
C
with NanoDropQC Software User Guide 73
Page 78

4
Learning Center
Basic Instrument Operations
NanoDrop One Measurement Screens
These operations are available from any measurement screen within an Application.
Menu of options;
tap to open
Sample pathlength
Sample name;
tap to edit
Measurement results; see
Applications for details
Measurement
alert; tap to
learn more
Tap row to
select sample
and update
spectrum; tap
more rows to
UV absorbance
overlay up to five
spectrum for
spectra. Press
selected sample
and hold sample
row to view
sample details.
Drag tab
Tap to measure
blank solution
Pinch and zoom
to adjust axes
Menu
Tap to measure
sample solution
AutoMeasure
Tap to end experiment
and export data
Page control; swipe screen left to view
table with more measurement results
Tap in any measurement screen to see the available menu options.
Home Return to NanoDrop One Home screen
[application] Setup View or change settings for selected application
Settings View or change instrument settings
Note: The Dye/Chrom. Editor and Protein Editor tabs appear
in Settings only when the Settings tab is opened from the
NanoDrop One Home screen or the Data Viewer.
Print Print selected measurement results
down/up to see
more/less
sample data
74 NanoDrop One
C
with NanoDropQC Software User Guide Thermo Scientific
Page 79

Sample Name
4
Learning Center
Basic Instrument Operations
Tap the Sample Name field in any measurement screen to edit the sample name.
When Auto-Naming is On (see General Settings), each sample is automatically assigned a
sample name using the default base name followed by a unique number starting with “1.” The
first time this appears is after the first blank measurement and before the first sample
measurement in each experiment as shown below.
Default sample name; tap to edit
In this example, the first sample would be named “Sample 1” followed by “Sample 2,” etc.
You can edit the default base name and overwrite any sample name.
Note If you edit the sample base name during an experiment when Auto-Naming is
selected, the assigned sample ID numbers restart.
Edit default sample base name
After you measure a blank and before the first sample is measured:
– tap Sample Name field to display keyboard
– enter new base name
– tap Done key
Edit sample name
– from Home screen, tap to open Data Viewer
– select experiment
– swipe left to show data table
– press and hold sample name to show Sample Details box
– tap Sample Name field to display keyboard
Thermo Scientific NanoDrop One
C
with NanoDropQC Software User Guide 75
Page 80

4
Learning Center
Basic Instrument Operations
Measurement Results
The types of results that appear in the measurement screens depend on the selected
application. For details, see the reported results section of that application in this guide:
– enter new sample name
– tap Done key to close keyboard
– tap OK to close Sample Details box
Applications > [application group] > Measure [application name] > Reported Results
Absorbance Spectrum
For each measured sample, each application shows the UV or UV-visible absorbance spectrum
and a summary of the results. The vertical axis shows absorbance in absorbance units (A). The
horizontal axis shows wavelength in nm. Here is an example for a chemometric method.
76 NanoDrop One
C
with NanoDropQC Software User Guide Thermo Scientific
Page 81

Sample Pathlength
4
Learning Center
Basic Instrument Operations
All applications display the sample pathlength along the spectrum’s vertical axis.
Micro-volume absorbance measurements and measurements taken with nonstandard cuvettes
are normalized to a 10.0 mm pathlength equivalent. Here is an example.
Sample pathlength
Blank Button
Measure Button
Tap Blank to measure a blank for the selected experiment.
A blank must be measured before each group of similar samples. The blank solution is
typically the pure buffer that was used to resuspend the sample. For more information, see
Choosing and Measuring a Blank.
Tap Measure to measure a sample for the selected experiment.
Samples must be properly isolated and prepared before they can be measured with the
instrument and the concentration must be within the instrument’s absorbance detection
limits. For more information, see Preparing Samples. and Measure a Micro-Volume Sample or
Measure a Cuvette Sample and Absorbance Detection Limits.
Note The Measure button is enabled after a valid blank measurement is completed.
Thermo Scientific NanoDrop One
C
with NanoDropQC Software User Guide 77
Page 82

4
Learning Center
Basic Instrument Operations
Auto-Measure and Auto-Blank Options
Speed up sample analysis with the NanoDrop One Auto-Measure and Auto-Blank features,
which cause the instrument to start the measurement immediately after you lower the
instrument arm. These options eliminate the need for repetitive Measure or Blank operations
for large batches of samples.
Note Auto-Measure and Auto-Blank are available for micro-volume measurements only.
Auto-Measure
To select or deselect Auto-Measure, from any sample measurement screen, tap the On or Off
button at the right of the Measure button.
Auto-Blank
To select or deselect Auto-Blank, from any blank measurement screen, tap the On or Off
button at the right of the Blank button.
End Experiment Button
Tap End Experiment when you are ready to name and save your experiment, add a label to
help you locate the experiment later or export the data.
78 NanoDrop One
C
with NanoDropQC Software User Guide Thermo Scientific
Page 83

4
Learning Center
Basic Instrument Operations
Note The End Experiment button is enabled after the first sample measurement is
completed.
After you tap End Experiment, the End Experiment box is displayed:
Thermo Scientific NanoDrop One
C
with NanoDropQC Software User Guide 79
Page 84

4
Learning Center
Basic Instrument Operations
Available options:
Experiment Name Enter a name for this group of measurements. The
measurement results are saved in the selected database location
using the entered experiment name.
Add Identifier Enter a descriptive label to help you find this experiment later or
to associate it with another experiment (see Manage identifiers
on the instrument for details).
Tap the Add Identifier box to display a keyboard to enter the
label text.
Tap the Add Identifier button to add the label; tap the
Done key to close the keyboard.
Export Data Select an available location for exporting the measurements in
this experiment. Experiments can be exported to a USB device
connected to any USB port on the local instrument (front,
back-left or back-right) or to a network location.
Export Button Allows you to select a file format for exporting the
measurements in this experiment and then export the data to a
USB device or network. Available export file formats:
• comma-separated values spreadsheet (.csv) file
• tab-separated values spreadsheet (.tsv) file (spectral data
only)
• NanoDrop QC (.sql) file
The filename is the entered experiment name (see above). The
file is stored in a folder named “NanodropOne” followed by the
instrument serial number. (Use System Status to view your
instrument serial number.)
Return To Experiment
button
Close the End Experiment box and display the results for the
most recent measurement. From there you can add
measurements to the current experiment and save it later.
Print button Print measurement results for current experiment
End Experiment button End the experiment and save the measurement results using the
entered experiment name. The experiment is saved in the
selected database location.
80 NanoDrop One
C
with NanoDropQC Software User Guide Thermo Scientific
Page 85

Sample Details
4
Learning Center
Basic Instrument Operations
Press and hold a sample row in any measurement screen or data table to show the sample
details, which include all available measurement results and associated details for the selected
sample. Here is an example:
Information about the measured values displayed in Sample Details is provided in this Help
system, under the application used to acquire the data.
Note You can also edit the sample name from the Sample Details box.
Thermo Scientific NanoDrop One
C
with NanoDropQC Software User Guide 81
Page 86

4
Learning Center
Basic Instrument Operations
Data Table
Swipe left in any measurement screen to see the data table for the current experiment. The
data table contains the measurement results for all samples in the experiment. The image
below highlights the available features.
Menu of options;
tap to open
Sample name;
tap to edit
Measurement results; see
Applications for details
Measurement
alert; tap to
learn more
Tap row to
select sample;
Press and hold
row for sample
details
Application
used
Open Data Viewer
82 NanoDrop One
C
with NanoDropQC Software User Guide Thermo Scientific
Page control; swipe screen right to
return to measurement screen
Whether you collect one sample or many in a row, after you choose End Experiment, the
acquired data are automatically saved in an experiment with an experiment name. In the
default configuration, experiments are stored in the NanoDrop One database on the local
instrument according to acquisition date, experiment name, application used and any
assigned labels.
Use the Data Viewer to open the database on the local instrument in order to view acquired
spectra and associated data from any experiment at any time.
Page 87

Menu
4
Learning Center
Basic Instrument Operations
Open instrument database of measurement results
C
– to open NanoDrop One
database on instrument, tap (Data Viewer) on
instrument Home screen
Tap in the Data Viewer to see the available menu options.
Home Return to NanoDrop One Home screen
Settings View or change instrument settings
Import Import data from a USB flash drive
Disk Status View remaining space available for storing measurement data on
the instrument
Thermo Scientific NanoDrop One
C
with NanoDropQC Software User Guide 83
Page 88

4
Learning Center
Basic Instrument Operations
Search Experiment Database
Tap Search in the Data Viewer to search the selected database for an experiment or to change
the time range or other search filters. The database is filtered using the current settings in the
Search box. Filters include time range, application type and any user-defined labels (see
Manage Identifiers for information about adding and deleting labels). Here is an example:
Tap to change
time range filter
Change a filter and tap OK to
display updated list of experiments
84 NanoDrop One
Tap to select or deselect
user-defined labels
C
with NanoDropQC Software User Guide Thermo Scientific
Tap to select or deselect
application filters
Page 89

Export Selected Experiments
Use Select in the Data Viewer to select experiments to be exported.
Export selected experiments
– open the Data Viewer and tap Select
4
Learning Center
Basic Instrument Operations
– tap row to list experiments acquired on that date, or use Search feature to find
experiment
– tap to select one or more experiments to export (tap again to deselect an experiment;
to select all experiments in database, select All)
– tap Export
Thermo Scientific NanoDrop One
C
with NanoDropQC Software User Guide 85
Page 90

4
Learning Center
Basic Instrument Operations
– set Export Data to an available export location (front, back-left or back-right USB
port, or a network location) and select Export
– select one or more formats to export to (see “Export Selected Experiments” in
General Operations for details) and tap Export
– after “Export Success” message, tap OK
Delete Selected Experiments
Use Select in the Data Viewer to select experiments to be deleted.
Delete selected experiments
– tap row in Data Viewer to list experiments acquired on that date, or use Search
feature to find desired experiment
– tap Select
– tap to select one or more experiments to delete (tap again to deselect an experiment)
– tap Delete and OK
86 NanoDrop One
C
with NanoDropQC Software User Guide Thermo Scientific
Page 91

NOTICE Deleted data cannot be recovered.
Open Experiment and View Associated Data
Use the Data Viewer to locate and open any experiment to see the measurement data it
contains.
Open an experiment
– tap row in Data Viewer to list experiments acquired on that date,
or use Search feature to find desired experiment
4
Learning Center
Basic Instrument Operations
– tap experiment name to open the experiment
Here is an example:
One experiment measured on this date
Tap to open this experiment; press and hold to view
or edit experiment details such as experiment name
Thermo Scientific NanoDrop One
C
with NanoDropQC Software User Guide 87
Page 92

4
Learning Center
Basic Instrument Operations
The Data Viewer provides measurement data as spectral data and data tables, similar to what
you see after you complete a measurement.
Note The data shown are dependent upon the application used to measure the samples
(nucleic acids in these examples). For more information, see the application details.
Spectral data—
After you open an experiment, the software shows the UV or UV-visible absorbance spectrum
and a summary of the associated data for the first sample measurement, much like it appears
during a measurement. The image below describes the available features.
Menu of options;
tap to open
Selected
experiment
UV spectrum for
selected sample
Measurement results; see
Applications for details
Measurement
alert; tap to
learn more
Tap row to
select sample
and update
spectrum; tap
more rows to
overlay up to five
spectra. Press
and hold
sample row to
view sample
details.
Selected
application
88 NanoDrop One
Drag tab
Pinch and zoom
to adjust axes
Page control; swipe screen left or
right to view next or previous screen
down/up to
see more/less
sample data
C
with NanoDropQC Software User Guide Thermo Scientific
Page 93

4
Learning Center
Basic Instrument Operations
Data Table—
Swipe left in any Spectral Data screen to see the data table for the current experiment. The
data table contains the measurement results for all samples in the experiment. The image
below describes the available features.
Menu of options;
tap to open
Selected
experiment
Measurement results; see
Applications for details
Tap to
select unit
Tap row to
select sample;
Press and hold
row for sample
details
Measurement
alert; tap to
learn more
Application
used
Menu
Tap from any Spectral Data or Data Table screen to see the available menu options.
Home Return to NanoDrop One Home screen
Manage Identifiers Add or delete labels for selected experiment to make it easier to
Export Export selected experiments
Print Print plot or data table for selected measurement results; if no
Settings View or change instrument settings
Disk Status View remaining space available for storing measurement data on
Thermo Scientific NanoDrop One
Page control; swipe screen right to
view previous screens (2)
find (see Manage identifiers on the instrument)
results are selected, prints all results in data table
the instrument
C
with NanoDropQC Software User Guide 89
Page 94

4
Learning Center
Basic Instrument Operations
NanoDrop One General Operations
These operations are available from any measurement screen or from the Data Viewer.
Manage Identifiers (on the instrument)
You can add one or more “identifiers” (i.e., labels or metadata tags) to an experiment to make
the experiment easier to find. Labels can be added from the NanoDrop One software running
on the instrument, or from the NanoDrop QC software installed on a personal computer (see
Manage Identifiers on a PC).
Use the Data Viewer to add labels to experiments, assign existing labels, view assigned labels
and remove or delete labels on the instrument. You can filter the list of experiments in the
Data Viewer based on one or more user-defined labels.
Label new experiment when you save it
– after the last sample has been measured, tap
– in End Experiment box, tap Add Identifier field
– use displayed keyboard to enter label and tap
– tap Done key
– tap End Experiment
90 NanoDrop One
Label experiment in Data Viewer
– from Home screen, tap to open Data Viewer
– tap to open an experiment
C
with NanoDropQC Software User Guide Thermo Scientific
Page 95

– tap and choose Manage Identifiers
– in Manage Identifiers box, tap Add Identifier field
– use displayed keyboard to enter label and tap
– tap Done key
– tap OK
View assigned labels for an experiment
– from Home screen, tap to open Data Viewer
– press and hold selected experiment to see Experiment Details
Find labeled experiments
4
Learning Center
Basic Instrument Operations
– from Home screen, tap to open Data Viewer
– tap Search
– in Search box, select date range, select application (only applications that have
associated data are shown), select one or more identifiers from scrollable list and tap
OK
Remove a label
– from Home screen, tap to open Data Viewer
– tap to open an experiment
– tap and choose Manage Identifiers
– in Manage Identifiers box, select label and tap .
– tap OK
Edit Experiment Name
You can edit the experiment name when you save the experiment or afterwards from the Data
Viewer.
Edit experiment name at end of experiment
– when finished measuring samples, tap
Thermo Scientific NanoDrop One
C
with NanoDropQC Software User Guide 91
Page 96

4
Learning Center
Basic Instrument Operations
– enter a name for this group of measurements in the Experiment Name box
– tap End Experiment
Edit experiment name from Data Viewer
– from Home screen, tap to open Data Viewer
– tap row to list experiments acquired on that date, or use Search feature to find
experiment
– press and hold experiment name to open experiment details box
92 NanoDrop One
C
with NanoDropQC Software User Guide Thermo Scientific
Page 97

– tap Experiment Name field to display keyboard
– enter new experiment name
4
Learning Center
Basic Instrument Operations
– tap Done key to close keyboard
– tap OK to close Experiment Details box
Export Selected Experiments
You can export measurement data when you save the experiment or afterwards from the Data
Viewer.
Note Data exported during a save are still saved to a database (local or remote, depending
on the Data Storage setting; see Select location for saving or viewing collected data for
more information).
Measurement data can be exported in four formats:
• as comma-separated values (.csv) files containing the measurement results and details for
each exported experiment
• as tab-separated values (.tsv) files containing x,y coordinates for every spectral data point
for each exported experiment
• as NanoDrop QC (.sql) files containing spectra and measurement results for each
exported experiment
Thermo Scientific NanoDrop One
C
with NanoDropQC Software User Guide 93
Page 98

4
Learning Center
Basic Instrument Operations
Use any spreadsheet or word processing application to open a CSV or TSV file. Here is an
example of several sample measurement results in CSV format:
Note The types of data exported are dependent upon the application used to measure the
samples (nucleic acids in this example). For more information, see the application details.
Data can be exported to a USB device connected to any USB port on the local instrument
(front, back-left or back-right) or to a network location. If you select multiple experiments for
export, each exported experiment has a corresponding file. The filenames are the same as the
experiment names. The files are stored in a folder named “NanodropOne” followed by the
instrument serial number. (Use System Status to view your instrument serial number.)
Export data at end of experiment
– when finished measuring samples, tap
– from End Experiment box, set Export Data to an available export location (front,
back-left or back-right USB port, or a network location)
– tap
– from Export box, select one or more formats to export to (see above for details) and
tap Export
94 NanoDrop One
– after “Export Success” message, tap OK
– tap End Experiment
C
with NanoDropQC Software User Guide Thermo Scientific
Page 99

4
Learning Center
Basic Instrument Operations
Export data from Data Viewer
– from Home screen, tap to open Data Viewer
– tap Select
– tap row to list experiments acquired on that date, or use Search feature to find
experiment
– tap to select one or more experiments to export (tap again to deselect an experiment;
to select all experiments in database, select All)
– tap Export
Thermo Scientific NanoDrop One
C
with NanoDropQC Software User Guide 95
Page 100

4
Learning Center
Basic Instrument Operations
– set Export Data to an available export location (front, back-left or back-right USB
port, or a network location) and tap Export
– select one or more formats to export to (see above for details) and tap Export
– after “Export Success” message, tap OK
Delete Selected Measurements
You can delete selected sample measurements from any experiment, or all the measurements
in the database.
NOTICE Deleted data cannot be recovered.
Delete data from any measurement screen
– press and hold sample row to open Sample Details box
– tap
96 NanoDrop One
C
with NanoDropQC Software User Guide Thermo Scientific
 Loading...