

Page 1
Page 2

2
2
2
3
3
3
3
4
5
5
9
9
10
10
11
11
12
13
14
14
14
14
14
14
14
15
15
15
15
15
16
16
16
16
16
17
17
17
18
19
20
23
29
29
30
30
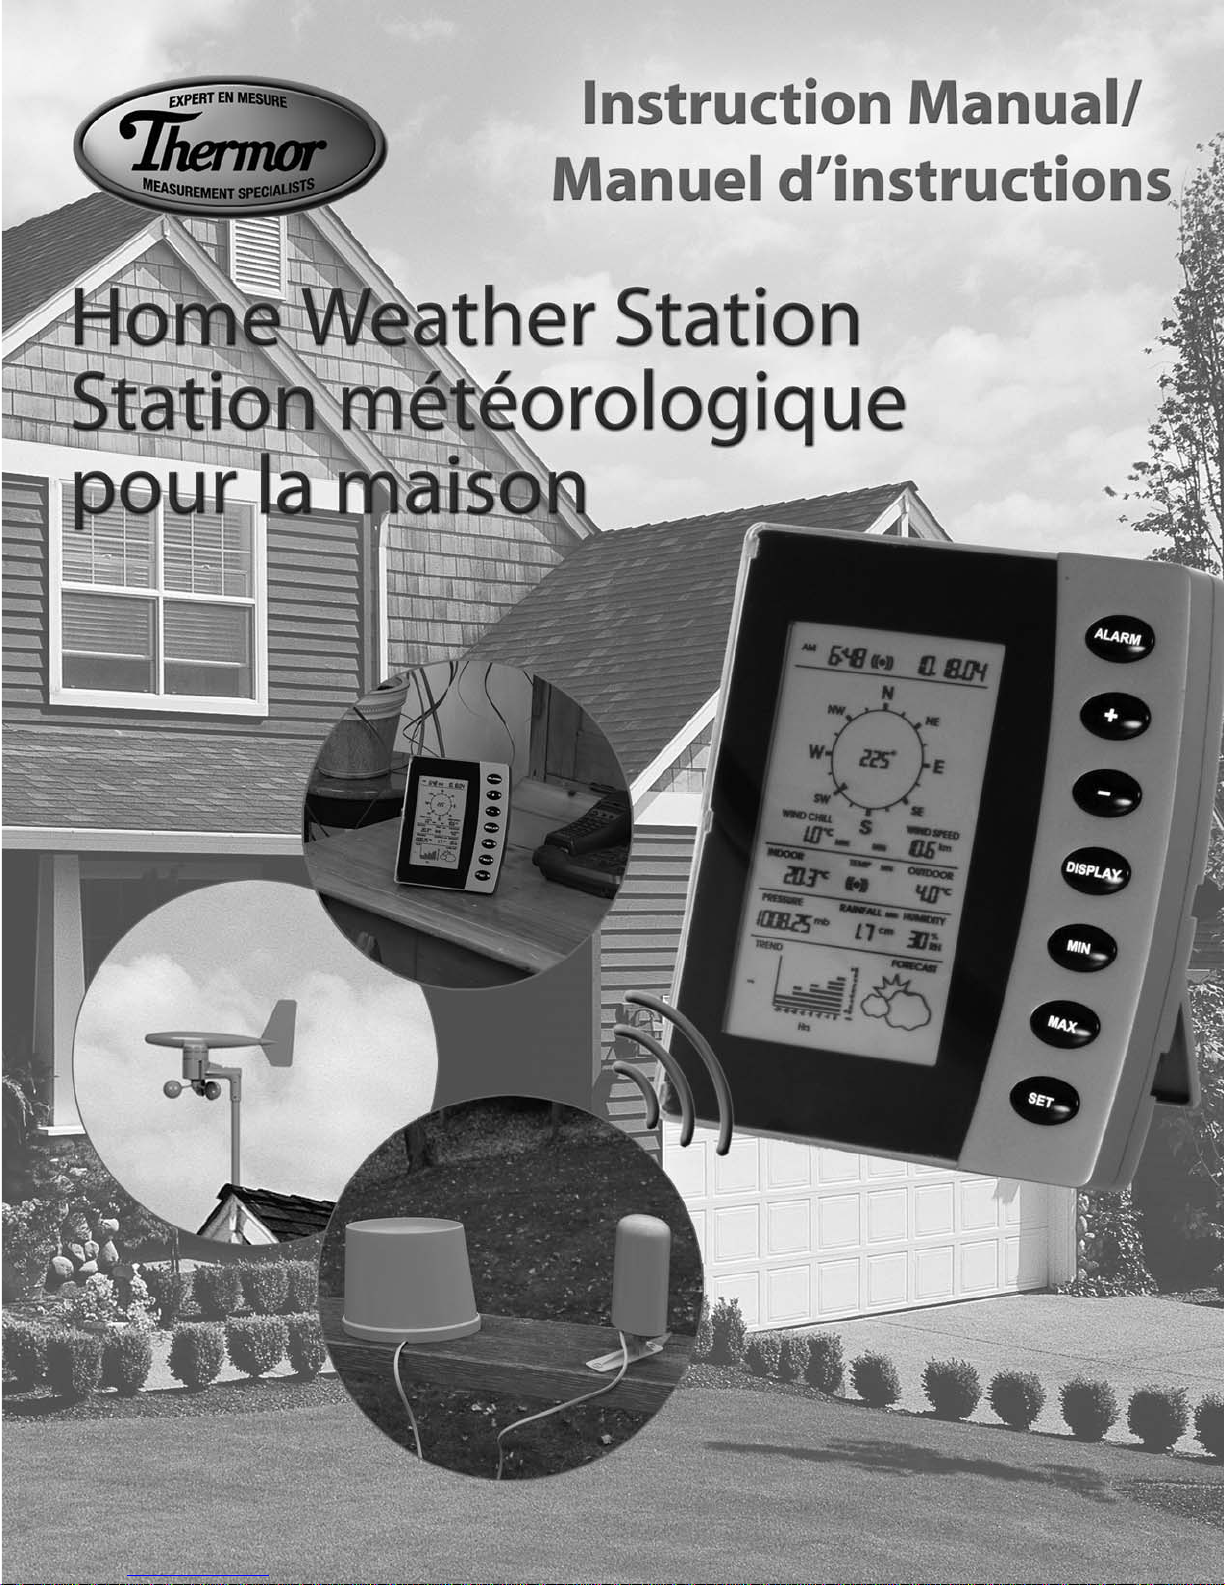
Home Weather Station (HWS)
Instruction Manual
Table of Contents
1. Introduction
2. Safety Notes
3. Weather Station Function and Features
Features of the Home Monitor
Features of the Thermometer-Transmitter Sensor
Features of the Wind Sensor
Features of the Rain Sensor
4. Components of your Home Weather Station
5. Setting up the Weather Station
A. Mounting
B. Connecting the Sensors
C. Powering up your HWS (for the first time)
D. Changing the transmitter batteries
6. Wireless Transmission
7. LCD Overview
8. LCD Breakdown
9. Optimum Viewing Angle
10. Button Breakdown
11. Setting the Home Monitor
Time
Date
Wind Speed
Temperature
Pressure
Rainfall
12. Setting the Alarm
Alarm Clock
Indoor Temperature Alarm
Outdoor Temperature Alarm
13. Turning off the Alarm(s)
14. Minimum or Maximum Memory Recall
15. Minimum or Maximum Memory Reset
16. Rainfall Measurement Reset
17. Rain Gauge Maintenance
18. Trend Chart
19. Weather Forecasting
20. Wind Chill
21. Barometric Pressure
Elevation of Major Cities in Canada
Elevation of Major Cities in the US
22. Barometric Pressure Conversions
23. Troubleshooting
24. Product Specifications
25. Warranty
26. Resources to Look At
27. FCC Information
Page 3

This instruction manual is part of this product and should be kept in a safe place for future reference. It contains
important information on setup and operation.
1. INTRODUCTION
Thank you for purchasing the Thermor Home Weather Station (HWS). Developed with state of the art technology
and digital electronics, this device readouts of the weather conditions around you.
To understand how to properly install and program your weather station,please read this instruction manual
carefully and keep it in a safe place.
The Home Weather Station and its accuracy is meant for personal use. This information should not be used for
scientific purposes.
2. SAFETY NOTES
• Damage caused by failure to comply with this instruction manual will invalidate any warranty! The manufacturer
and supplier will not be held liable for any damages due to failure to comply with this product!
• In case of harm or damage to a person or property caused by improper handling or failure to comply with this
instruction manual, the manufacturer and supplier cannot be held liable.
• For reason of safety and operation, alteration to this device is strictly prohibited.
• To operate the weather station, use only supplied adapter and batteries of the recommended type.
• Do not leave discharged batteries in the device as these may corrode and release chemicals that may damage
the unit.
• Inserting batteries in an incorrect polarity will cause damage to this product.
• Do not dispose of new or used batteries in a fire as the may explode or release dangerous chemicals into the
environment.
• This product is not a toy; keep out of the reach of children.
• This product is not to be used for medical purposes or for public information.
• Any modification or alteration to this product is strictly prohibited without the manufacturer’s authorization and
may prohibit the user’s further use to this product.
3. WEATHER STATION FUNCTION AND FEATURES
The home monitor measures the indoor environment of its surrounding area (temperature, humidity and
atmospheric pressure) and receives weather data from the following three outdoor sensors:
1) Thermometer-Transmitter Sensor
2) Wind Sensor (speed and direction)
3) Rain Gauge Sensor (cumulative rainfall)
The data from the outdoor sensors are transmitted every 128 seconds to bring you the latest weather information
which is displayed on the home monitor’s LCD (updating the information faster is prohibited by FCC criteria and
would drastically reduce battery life). The outdoor thermometer-transmitter sensor is the main data
communication unit. The thermometer-transmitter connects to the wind and rain sensors via insulated cables,
whereby power and weather information is transferred. The collected data is then transmitted by the
thermometer-transmitter back to the home monitor. Weather data is sent from the thermometer-transmitter
sensor by wireless transmission -- 433MHz (up to 60 meters in open space).
2
Page 4
Features of the Home Monitor
• Displays time and date with alarm clock
• Displays weather conditions and records minimum and maximum values
• Displays indoor and outdoor temperature in Fahrenheit (°F) or Celsius (°C) -- user selectable
• Displays indoor relative humidity (RH%)
• Displays barometric (air) pressure reading in inches of mercury (inHg) or millibars (mb) -- user selectable
• Displays cumulative rainfall data since last reset in inches (in) or centimeters (cm) – user selectable
• Displays wind speed in miles per hour (mph) or kilometers per hour (km) -- user selectable
• Wind direction display with LCD compass as well as numerical (e.g. 225°) and abbreviated characters (e.g. NE)
• Wind chill temperature display
• Displays weather forecast using weather icons (sunny,partly cloudy, cloudy or rainy)
• Barometric trend chart in inches of mercury (inHg) or millibars (mb) -- user selectable
• Indoor and outdoor temperature alarms that are set by the user
Features of the Thermometer-Transmitter Sensor
The thermometer-transmitter sensor measures the outdoor temperature. It also collects
readings from the rain gauge and wind sensor, then transmits the data to the home monitor
via wireless 433MHz transmission. The transmitter uses four AA batteries (not included).
Power Adaptor: a special transmitter adaptor is available to supply power to the transmitter rather than using
batteries. It is a perfect solution for your HWS during extremely cold temperatures in the winter months when
batteries may cause problems. Please call 1-800-387-8520 for ordering information.
Features of the Wind Sensor
The wind sensor measures wind speed and wind direction and sends the
data to the thermometer-transmitter sensor, which in turn transmits the
data to the home monitor. Operating power is taken from the
thermometer-transmitter sensor by cable connection.
Features of the Rain Sensor
The Rain Sensor measures cumulative rainfall and sends the data to the
thermometer-transmitter sensor via cable connection, which is then
transmitted back to the home monitor. The cable connection also supplies
operating power from the thermometer-transmitter sensor to the Rain Sensor.
Rain Sensor
Wind
Sensor
3
Thermometer-
Transmitter
Sensor
Page 5
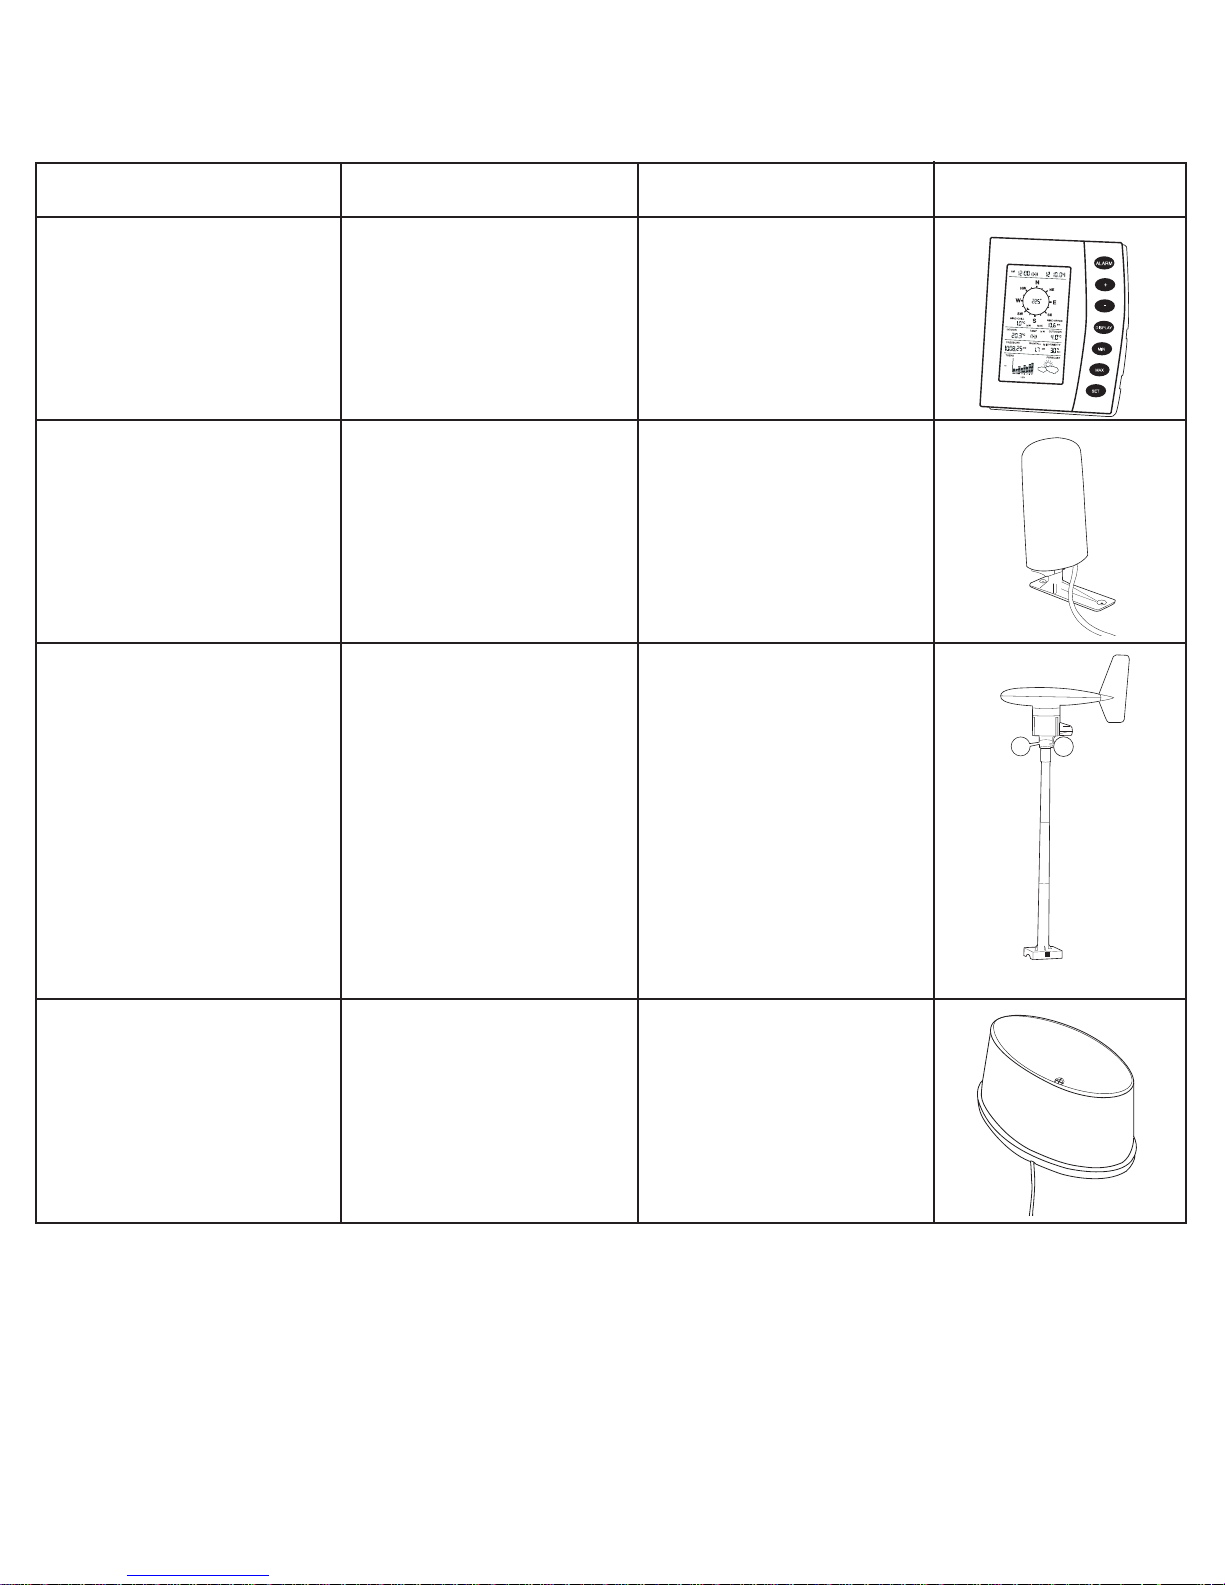
4. COMPONENTS OF YOUR HOME WEATHER STATION
Before setting up, carefully unpack the contents onto a table or flat surface and check that the following pieces are
included in the package:
4
Item Components Fittings Illustration
Home Monitor
Thermometer & Transmitter
Sensor
Wind Sensor
Rain Sensor
• Main unit
• Main unit
• Rain protection cover
• Base bracket
• Main unit with wind vane
• 30ft cable (9 m) (already
attached to the main unit)
• Mast
• Base bracket
• Main unit
• 30ft cable (9 m) (already
attached to the main unit)
• AC/DC 120V power
• Adapter – primary use
(included)
NOTE: 3 x AA batteries
should be used for back-up
purposes only.
• 2 x 1.75” wall mounting
screws
• Plastic anchors for screws
*requires 4 x AA batteries
(Recommendation: use lithium
AA batteries view “Battery
Installation”section)
• 2 x U–bolts to secure to a
mast
• 8 x washers
• 4 x nuts
• 8 x 0.25” screws (to fix
mast to main unit and
base bracket)
• 4 x 2.75” screws (to fix
base bracket to a flat
surface)
• 2 x 2.75” screws (to fix rain
sensor to a flat surface)
Page 6
5. SETTING UP THE WEATHER STATION
CAUTION: Great care must be taken when mounting the Home Weather Station components.The
manufacturer/supplier can not be held liable for personal or property damage when setting up the components.
Please use caution when choosing a mounting point.
A. Mounting
IMPORTANT: Prior to drilling mounting holes and permanently affixing any of the units, please ensure the
following points are considered:
1. Cable lengths of the units meet with your distance requirements at mounting points.
2. Signal from the thermometer-transmitter sensor can be received by the Home Monitor at mounting point.
3. Make sure the transmitter is easily accessible. You will have to periodically replace batteries. Mount it as close to
the ground as possible.
Mounting
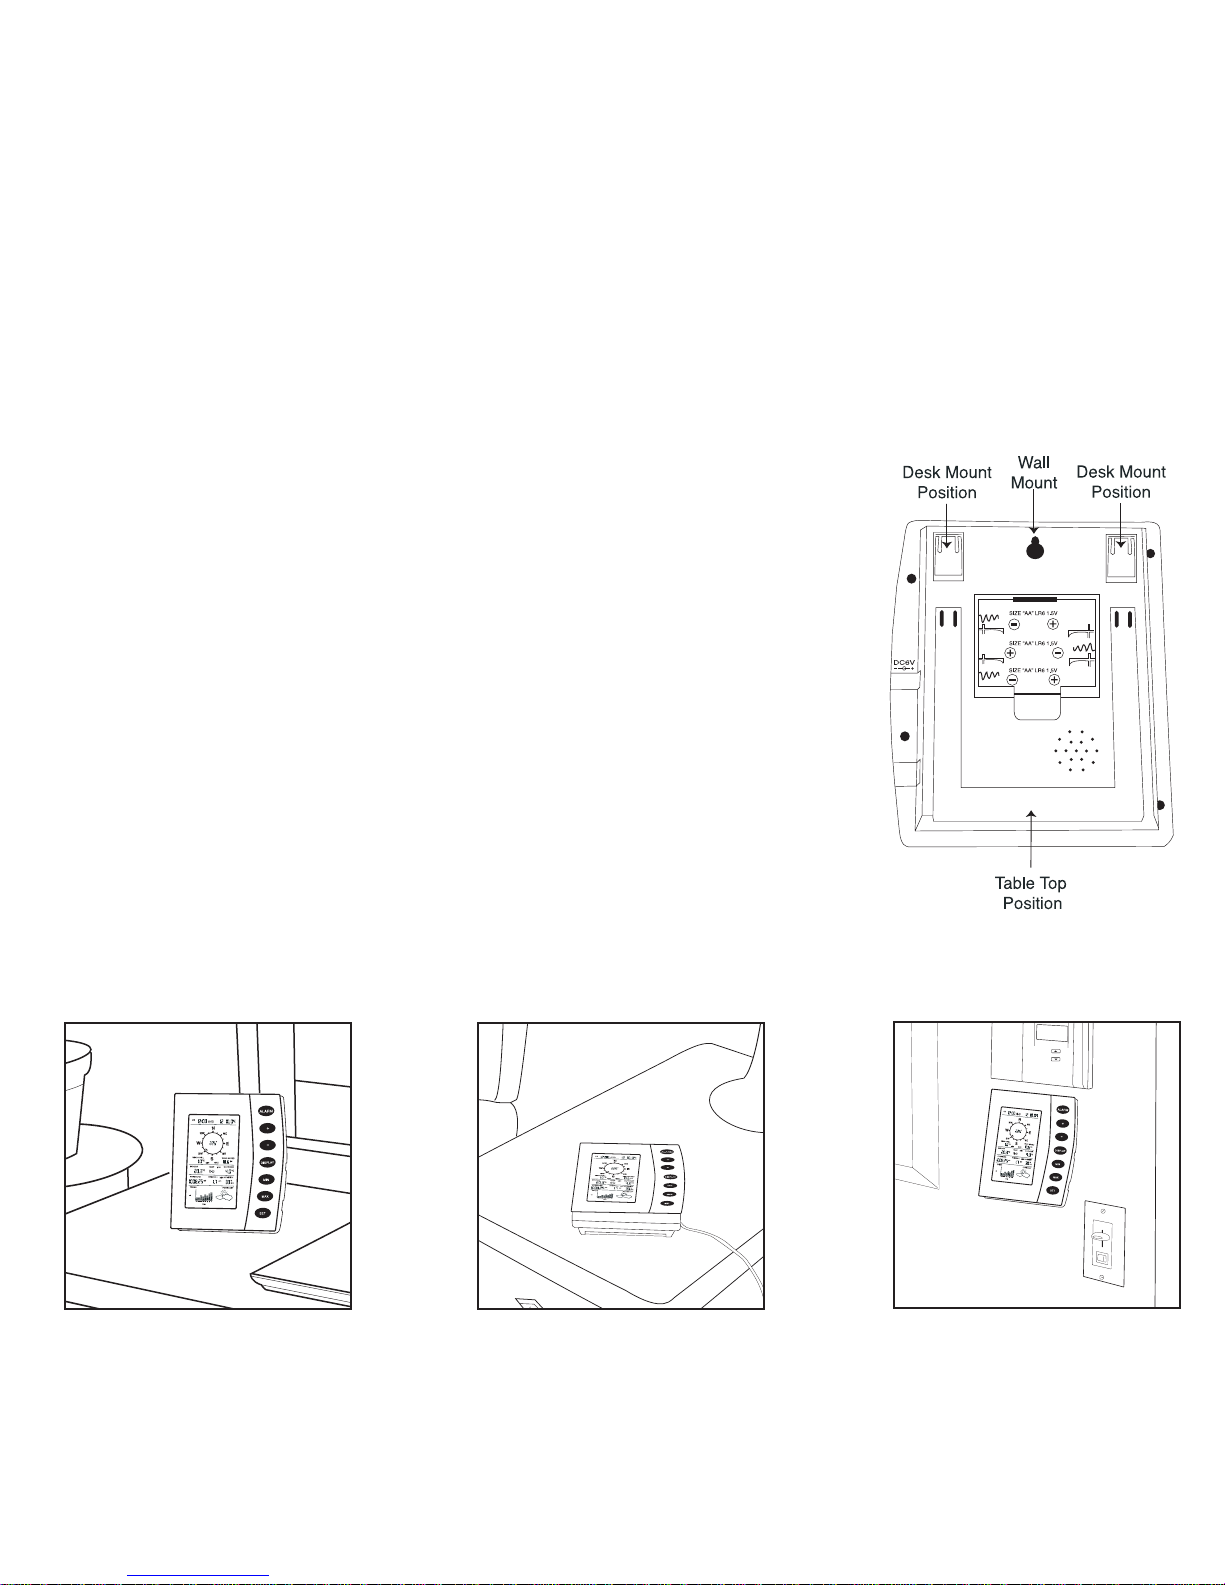
Home Monitor
With three retractable legs at the back of the Home Monitor, the unit can be placed
onto any flat surface or mounted on a wall by using a nail or screw (not provided).
• To prevent improper temperature measurements, make sure that the Home
Monitor is not placed in direct sunlight, or placed in an area with drafts caused by
heaters or air conditioners.
• Do not mount the home monitor on a wall which has metal heat/air conditioning
ductwork or high voltage wiring in the wall behind the station, it may interfere
with its ability to receive data from the transmitter.
• For proper data transmission, do not mount the home monitor closer than 5 feet
from a computer, fluorescent lights or other electrical appliances. Such devices
dramatically decrease signal reception, and in some cases, prevent all signals
from, reaching the thermometer-transmitter sensor.
• If the main unit is in an area of transmission interference (e.g. on or near concrete
walls, home appliances, computers or metal objects) the distance of transmission
will be drastically reduced or non-existent.
5
Table Top Position
Desk Mount Position Wall Mount
Page 7
Mounting
Wind Sensor
First, choose whether the wind sensor will be mounted vertically or
horizontally (on a mast). Make sure that you position the wind sensor
in a free,open area that is not protected by objects, which may distort
or interfere with the wind (e.g. large buildings, trees, chimney, etc.).
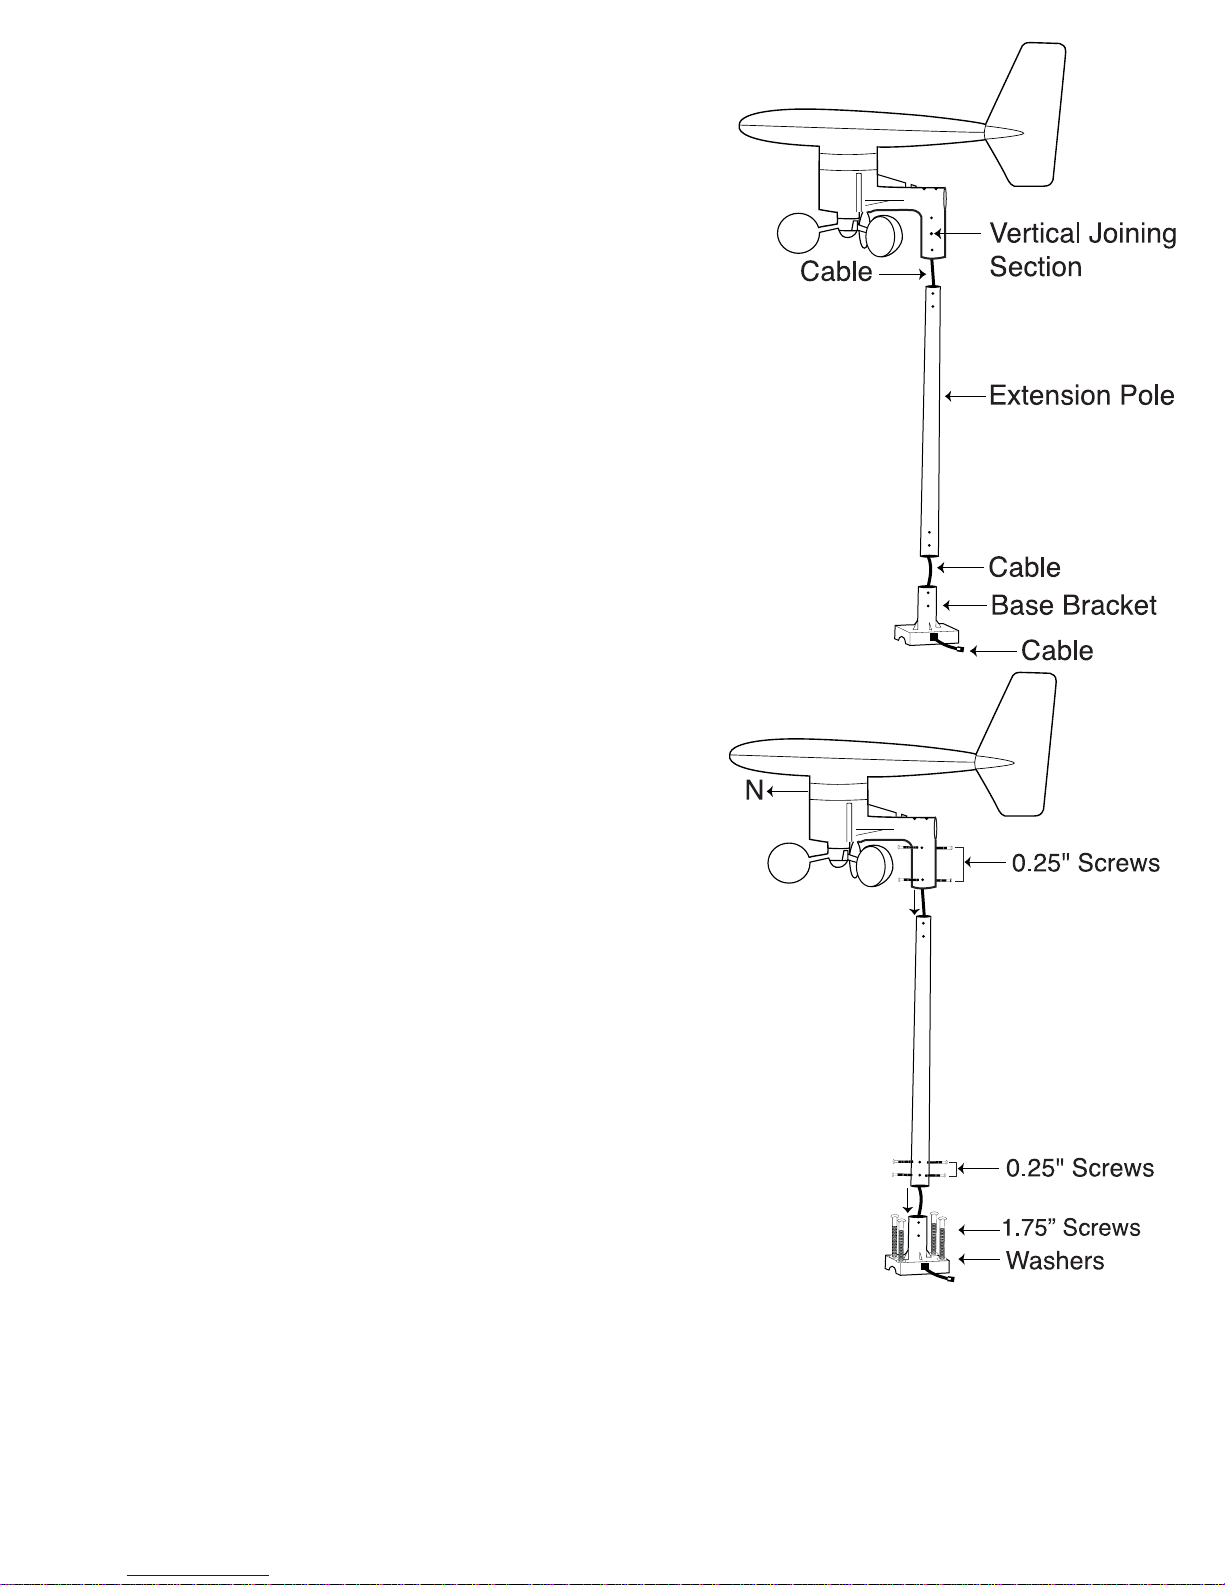
Cable Preparation for Vertical Mounting
1. Run the cable that is already fastened to the wind sensor through
the vertical joining section (see right).
2. Run the cable through the extension pole but do not secure the
pole to any sections yet.
3. Now run the cable through the top of the base-bracket and the
through the small rectangular section found on one side of the
base-bracket.
NOTE: Make sure that you completely pull the cable through the
wind sensors extension pole and base-bracket to reduce the
amount of slack on the cord.
Vertical mount
1. Make sure that the wind vane can rotate freely before fastening
the unit permanently into position.
2. Insert one end of the pole extension provided into the basebracket.
3. Secure the connection point of the pole extension and basebracket using the 0.25” metal screws provided to prevent rotation
at the joining point. (Use 4 x 0.25” screws to ensure stability).
4. Insert the vertical joining section on the bottom of the wind
sensor into the top of the pole extension. (Ensure that you pull
all cable slack through the side of the base-bracket to prevent
creasing or cutting the cable).
5. Secure the wind sensor to the mounting pole using the 0.25”
screws provided to make sure that the pole connection does not
rotate. (Use 4 x 0.25” screws to ensure stability).
IMPORTANT: For accurate readings, it is important to mount the
wind sensor so that the “N” (north) on the casing is facing the
correct direction (north).
If necessary, use a standard compass to determine north.
6. .Using 4 x 1.75”screws provided,secure the wind sensors basebracket to a flat surface.
NOTE: Make sure that when you are securing the base bracket with
the 1.75“ screws, you are aware of the cable. Prevent driving a screw
through a cable!
6
VERTICAL
MOUNT
Page 8
Horizontal Mounting
Cable Preparation for Horizontal Mounting
1. Run the cable that is already fastened to the wind sensor through the horizontal joining section (see below).
2. Run the cable through the extension pole but do not secure the pole to any sections yet.
3. Now run the cable through the top of the base-bracket and then through the small rectangular section found
on one side of the base-bracket.
NOTE: Make sure that you completely pull the cable through the wind sensor's extension pole and base-bracket
to reduce the amount of slack on the cord.
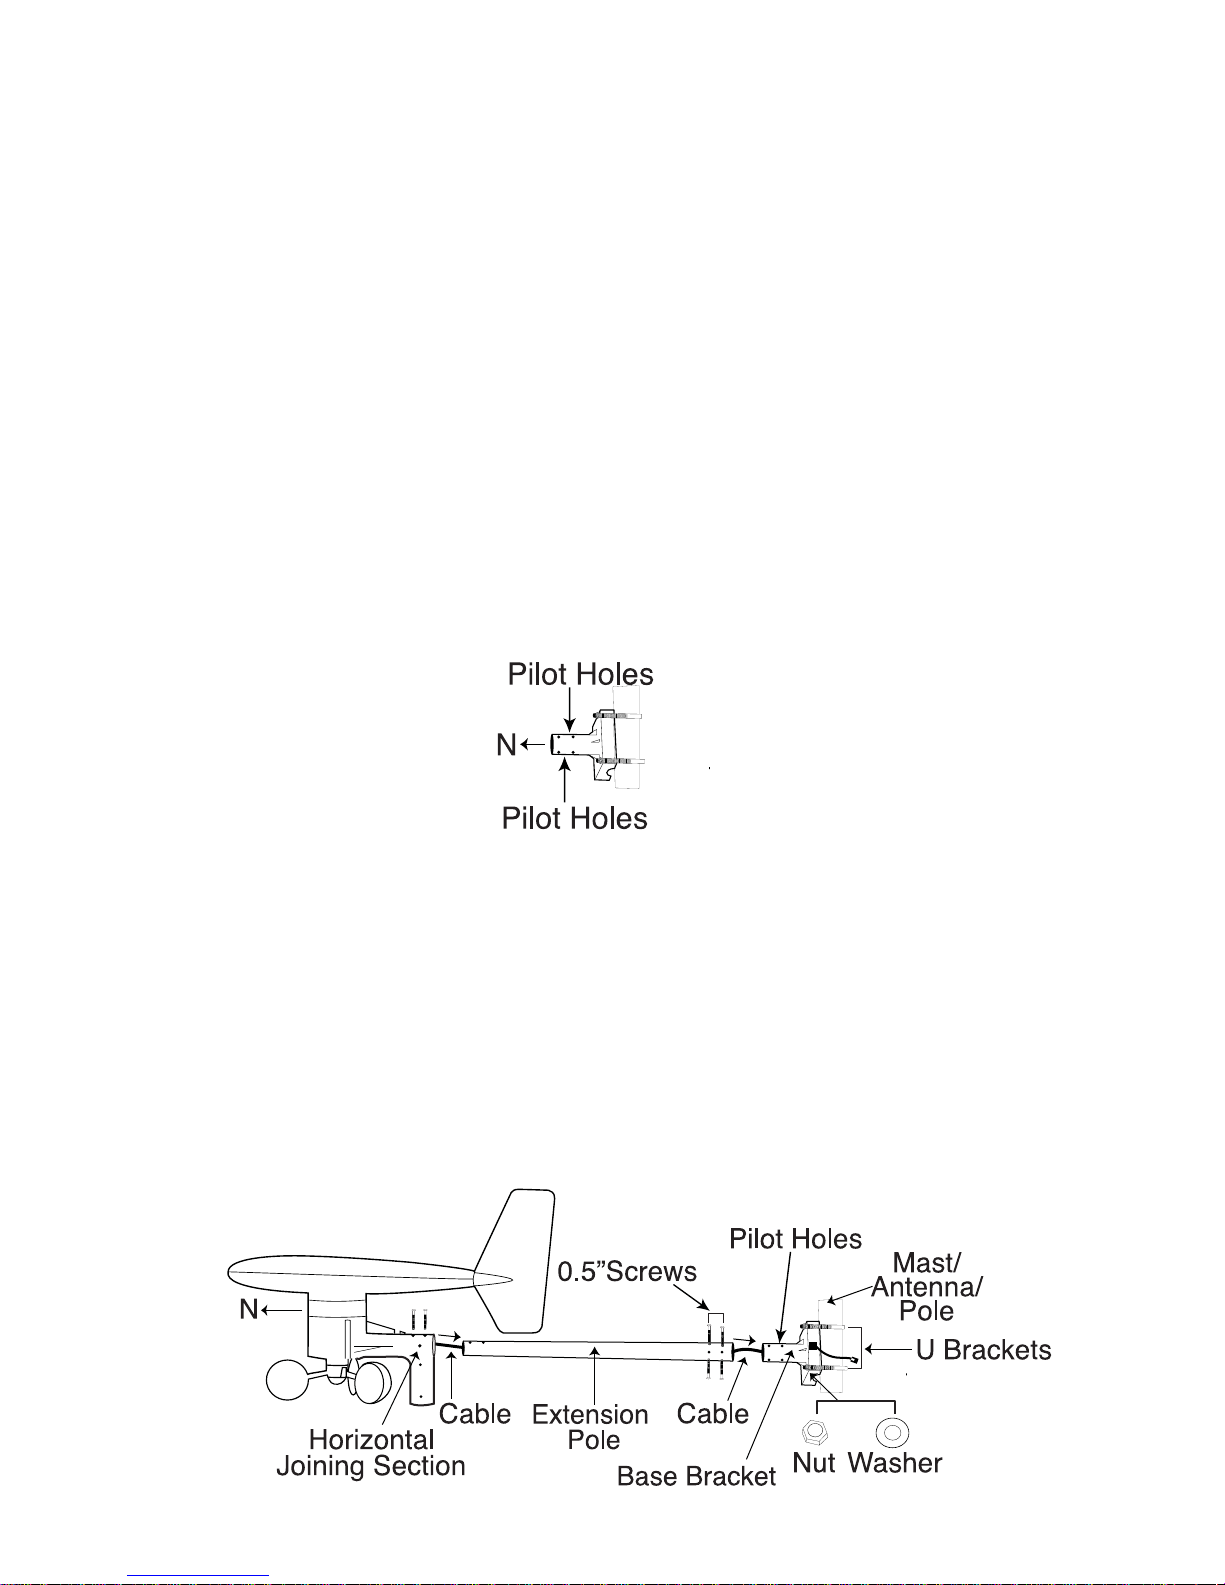
Horizontal mount – using a mast/antenna/pole
NOTE: It is not recommended to secure the wind sensor horizontally from a wall or chimney because doing so will
interrupt the flow of wind from at least one direction.
MOUNT WITH “N“ FACING NORTH:
For accurate readings, it is important to mount the wind sensor so that the “N”(north) on the casing is facing the
correct direction (north). If necessary,use a standard compass to determine north.
1. Make sure that the wind vane can rotate freely before fastening the unit permanently.
2. Using 2 x U-bolts, 4 x nuts and 4 x washers, secure the base-bracket of the wind sensor to a stable
mast/antenna/pole. (Masts made of magnetic materials, such as lead or other dense metals will cause faulty
readings).
IMPORTANT: Make sure that the pole insert of the base-bracket is facing north (N) and
the pilot holes are on the top AND bottom.
3. Use the pole extension provided to distance the wind sensor from the stable mast/antenna/pole. Insert one end
of the pole extension into the base-bracket.
4. Secure the connection point of the pole extension and base-bracket using the 0.25” screws provided to prevent
rotation at joining point. (Use 4 x 0.25” screws to ensure stability).
5. Insert the pole extension into the horizontal joining section. (Ensure that you pull all cable slack through the side
of the base-bracket to prevent creasing or cutting the cable).
6. Secure the horizontal joining section to the mounting pole using the 0.5” screws provided to make sure that the
pole connection does not rotate.
HORIZONTAL MOUNT
7
Page 9

Mounting
Rain Sensor
It is important that the rain sensor has the correct exposure to ensure accurate rainfall measurements. Place the rain
sensor as far away as possible from tall buildings, trees or other obstructions. It is suggested that the rain sensor
should be no closer to tall objects or obstructions than twice the height of the object compared to the sensor.
However, low bushes, fences or walls in the vicinit
y of the gauge are not objectionable, as these usually help break
up the force of the wind during stormy weather conditions.
NOTE: It is recommended that you mount the rain sensor 18“ (46 cm) above ground or surface to prevent water
from splashing off the ground/surface, into your rain gauge.
1. In order for the rain sensor to work properly, you MUST place the rain sensor on a flat, hor
izontal surface.
2. Remove the rain gauge lid by pushing on the tabs at either end, and pulling it upwards off the base.
3.Test that water can flow freely between the base of the rain sensor and horizontal mounting surface – pour clear
water over the water collection device and view the flow.
4. Using 2 x 2.75” screws, secure the base of the rain gauge to the flat, horizontal surface.
Mounting
Thermometer-Transmitter Sensor
It's recommended to mount the thermometer-transmitter sensor on a lower level wall on your home.
Wall Mount
1. Affix the wall bracket onto a desired wall using the 1.75” screws provided.
2. Insert the plastic plug on the back of the thermometer-transmitter sensor into the wall bracket socket.
Vertical Mount
1. Affix the wall bracket onto a flat, horizontal surface using the 1.75” screws provided.
2. Plug in the thermometer-transmitter using the plastic plug found on the bottom of the sensor into the wall
bracket socket. DO NOT mount the thermometer-transmitter sensor upside down.
8
WALL MOUNT
VERTICAL MOUNT
Page 10
B. Connecting the sensors
Thermometer-Transmitter Sensor
You must insert the cables that run from the outdoor sensors into the corresponding sockets on the thermometertransmitter before you begin to power up your home weather station.
1.You will see two sockets: one for the wind sensor, another for the rain sensor.
2. Connect the cables of the wind and rain sensors to the corresponding sockets on the thermometer-transmitter
by ‘clicking’ them into place.
3. Place the rain cover over the transmitter.
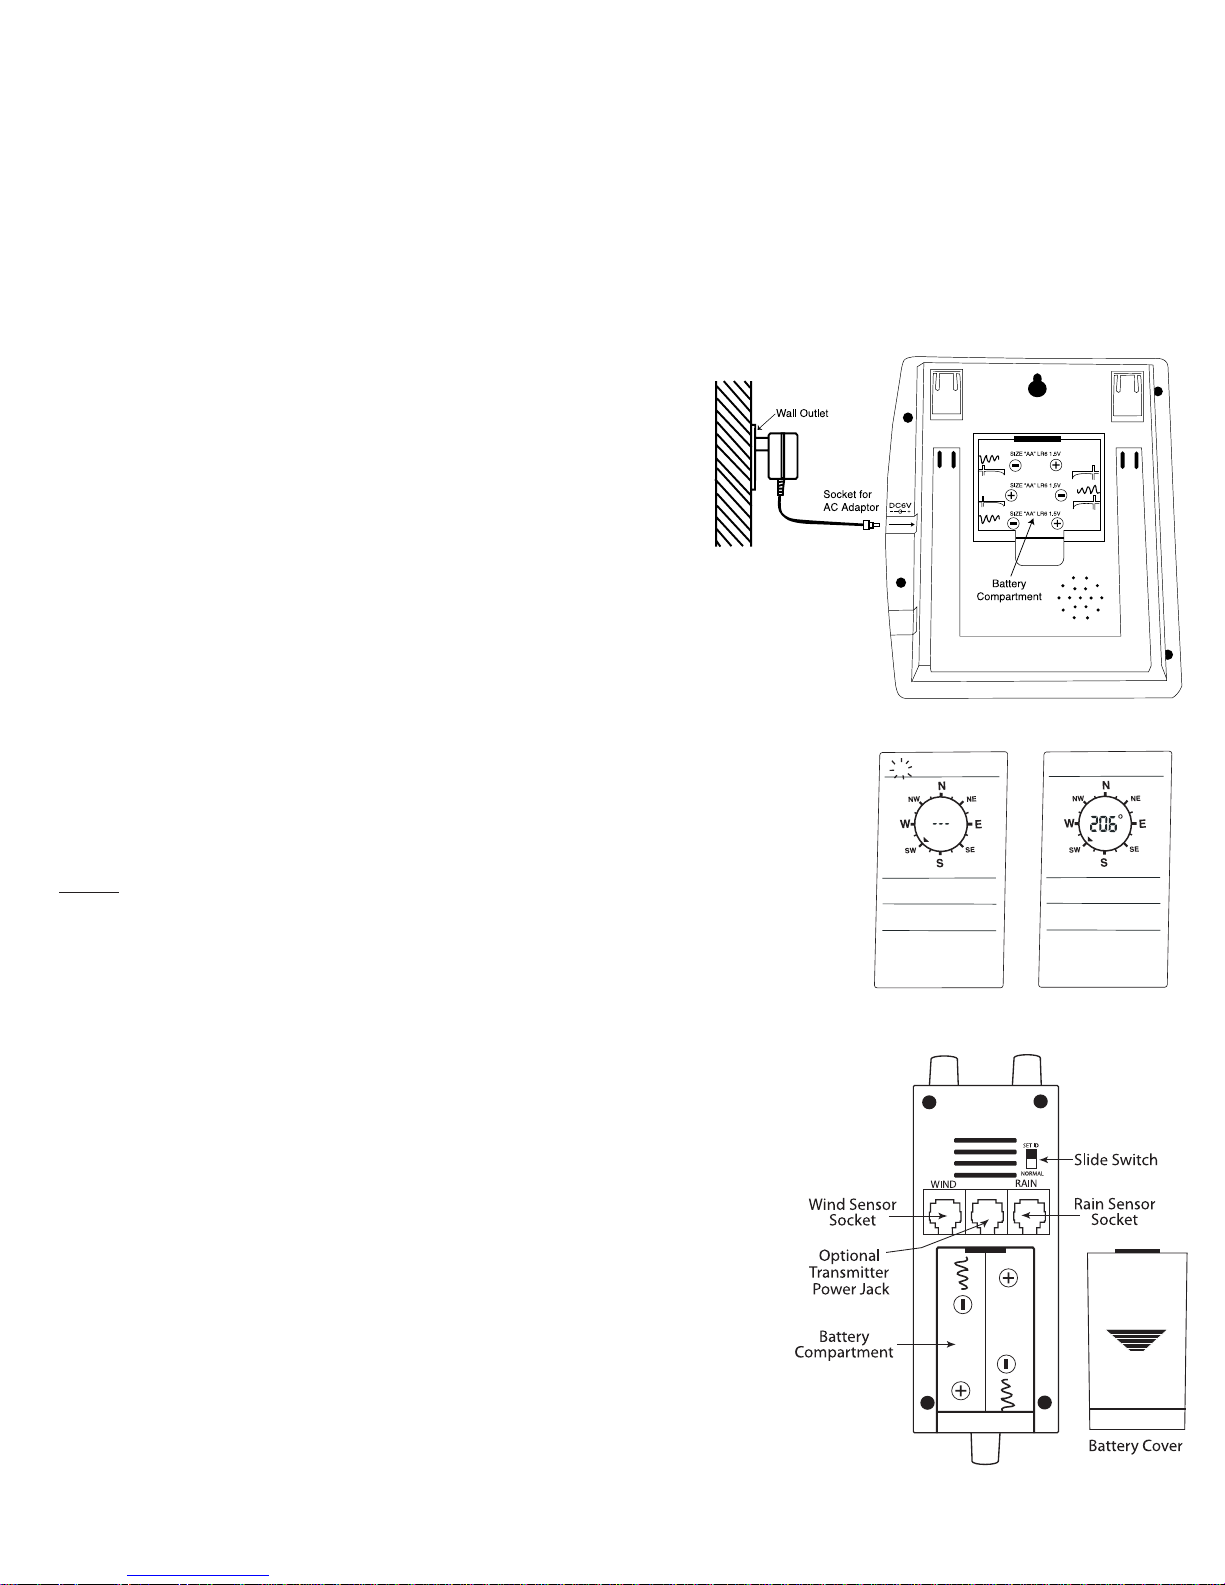
C. Powering up your HWS (for the first time):
First, locate the AC adapter (included in this set) and batteries
(optional: for back-up purposes only) to power the home
monitor.
NOTE: If you chose not to use the battery back-up, you will
lose memory data (max/min, trend chart and forecast) if
there happens to be a power failure.
IMPORTANT: When using adapter to power the home monitor,
you MUST insert the plug or batteries in the home monitor FIRST,
and follow these instructions:
Using AC adapter:
Home monitor
NOTE: Batteries should only be used in the Home Monitor for
memory back-up, or setting the ID when you need to have the home monitor
and transmitter side-by-side. Once this action is complete, and the home
monitor is placed in its final resting area, plug-in the AC adaptor for the primary
power source.
1. Remove any batteries.
2. FIRST
plug in the AC adapter to the main power outlet in your wall.
3. Insert the adapter into the DC socket located on the right side of the Home
Monitor.
Once the AC/DC adaptor has been plugged in (or batteries have been
inserted),
4. "IO" will flash in the top-left side of the LCD and “- - -“ will appear in
the centre of the compass rose. See diagram A.
Battery Installation
Thermometer-Transmitter Sensor
5. Make sure the "slide switch" is in the NORMAL position
(view diagram C).
6. Remove the battery cover found below the two sockets.
7. Insert 4 x AA batteries according to the correct polarity.
IMPORTANT: In alkaline batteries, the chemical reaction that
generates electrical currents stops at approximately
-10ºC. Lithium batteries continue to generate power down to -40ºC. If
the thermometer-transmitter sensor is exposed to extreme cold
temperatures, the battery life will fail faster than normal. It is
suggested to use lithium AA batteries, rather than regular alkaline
AA batteries to withstand colder temperatures.
9
DIAGRAM A
DIAGRAM B
DIAGRAM C
IO
IO
Page 11

Power Adaptor: a special transmitter adaptor is available to supply power to the transmitter rather than using
batteries. It is a perfect solution for your HWS during extremely cold temperatures in the winter months when
batteries may cause problems. Please call 1-800-387-8520 for ordering information.
Once the batteries have been inserted in the transmitter,
8. Move the slide switch to the “SET ID” position. If the monitor is receiving transmissions properly from the
transmitter, a transmission ID number will appear in the centre of the compass rose (e.g.206, 300, etc.). WAIT
until “IO” stops flashing at the top left side of the LCD (See diagram B).
9. Push the SET button to store the transmission ID. The main unit will automatically go to normal display mode.
10. Move the “slide switch”on the transmitter to the “NORMAL” position.
11. Replace the battery cover and the rain cover.
IMPORTANT:After setting up the transmission ID, you cannot remove the wind sensor plug or move the slide
switch to SET ID position again, otherwise the weather station will not function properly. IF you have performed
this operation, you must remove ALL power sources to the home monitor and thermometer-transmitter, and start
from step one of Section B: Connecting the Sensors.
Battery Installation
Home Monitor Back-Up Power
1. Remove the battery cover found on the back of the home monitor.
2. Insert 3 x AA batteries according to the correct polarity.
3. Replace the battery cover.
If the batteries are already inserted to perform the SET ID, just plug-in the AC adaptor, as per step 2 of “using the
AC adaptor” above.
D. Changing the transmitter batteries
1. Press and hold the "DISPLAY" button until the LCD exits normal display mode, and "IO" begins to flash in the top
left corner.
2. Follow steps 5 – 12 in the “Powering up your HWS (for the first time)”section above.
NOTE:
• At any time, you can exit the transmission ID setting mode by pushing the "DISPLAY" button, however, the ID will
NOT be stored and NO weather information will be communicated between the outdoor transmitter and home
monitor.
• Once the slide switch on the transmitter is in the NORMAL position, it will not generate a new ID even if the
switch is placed in the SET ID position.Therefore, if you want to change the ID, you must remove the batteries
from the transmitter, and start from step 1 of “Changing the transmitter batteries”section.
6. WIRELESS TRANSMISSION
The HWS utilizes a transmitter, which broadcasts at 433mHz approximately every 128 seconds to conserve battery
life. Like a cell phone signal, the transmission strength is affected by many external objects that cause
electromagnetic interference. Proximity to power and electrical appliances adversely affect the signal. Therefore,
we strongly advise that you experiment with the placement of both the transmitter and the home monitor. If the
conditions are good, you will be able to transmit at the maximum range of 60 meters, but if you are in an area with
a lot of interference, the range will be less (View "Mounting Home Monitor" on page 5).
Once the unit is powered up correctly, the thermometer-transmitter will start to send weather information to the
Home Monitor.
10
Page 12

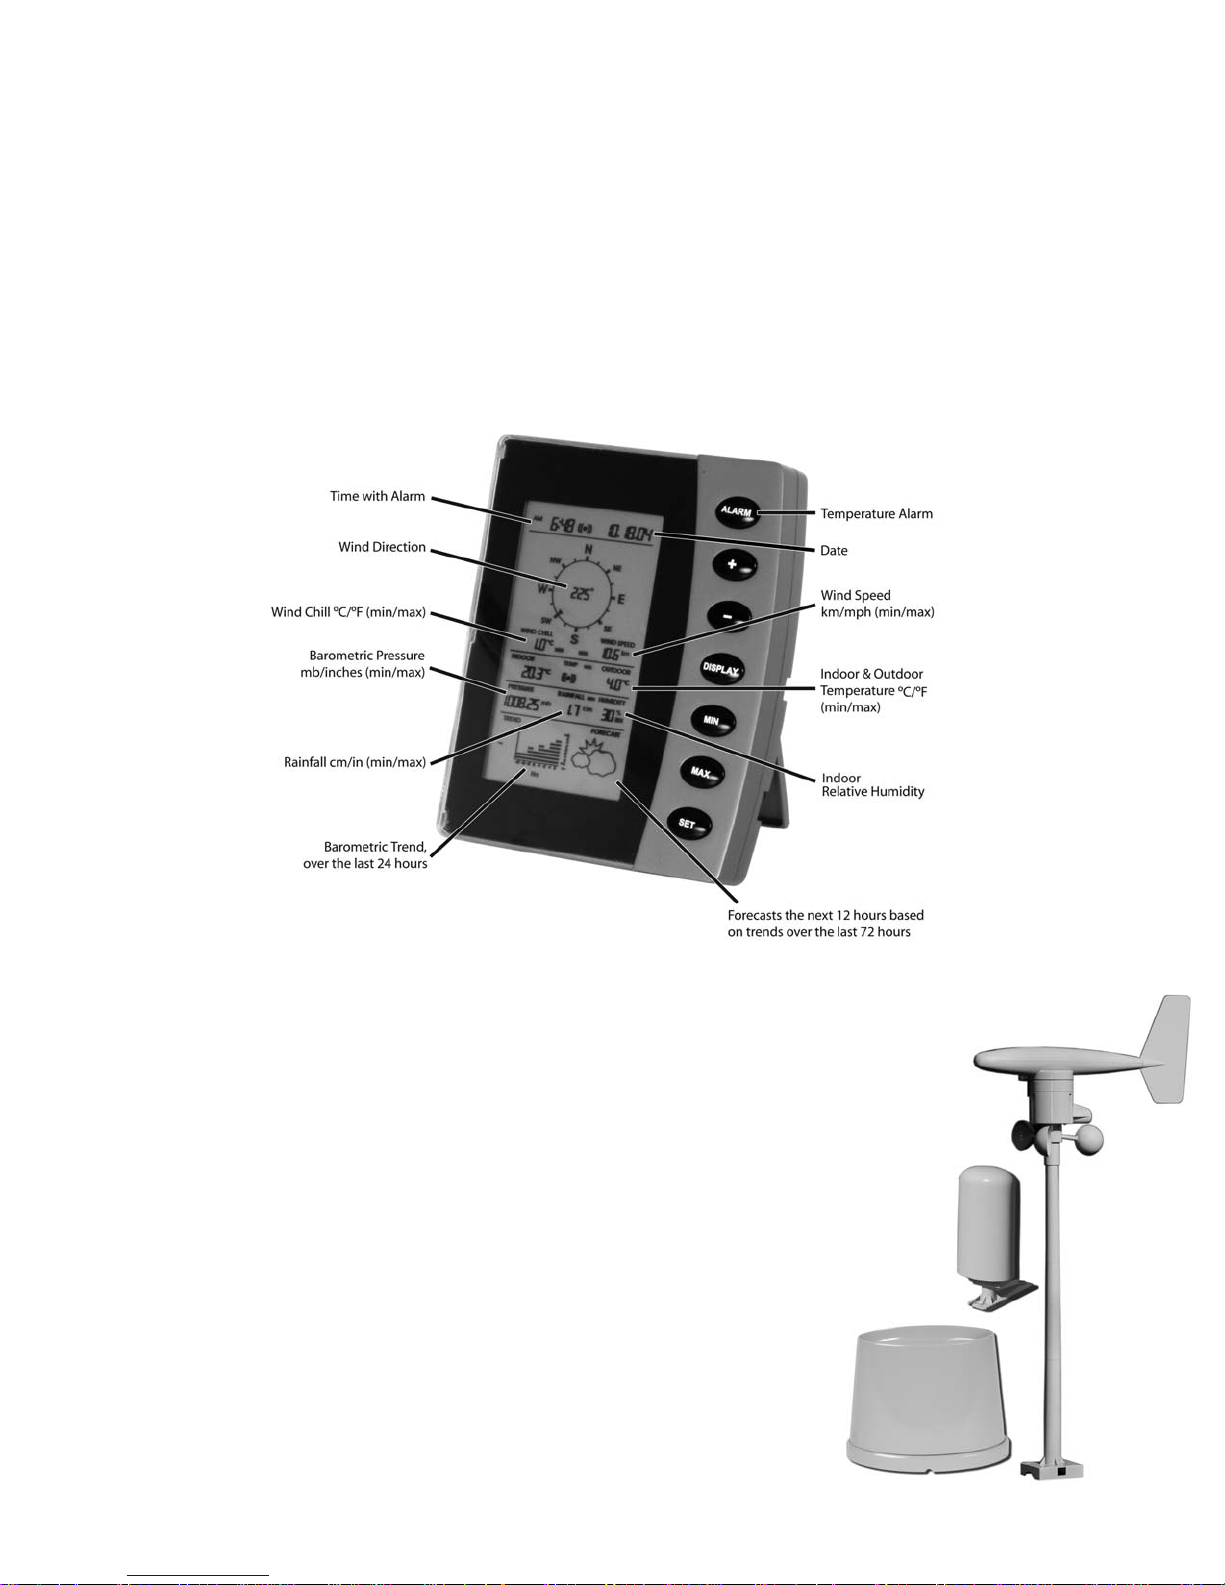
7. LCD OVERVIEW
1. Wind direction
2. Wind speed (km or mph)
3. Outdoor temperature (°C or °F)
4. Temperature alarm icon
5. Date
6. Alarm clock icon
7. Relative Humidity (RH%)
8. Rainfall (cm or inches)
9. Weather forecast icon
10. Barometric pressure trend chart (inHg or mb)
11. Absolute barometric pressure (inHg or mb)
12. Time
13. Indoor temperature (°C or °F)
14. Wind chill temperature (°C or °F)
8. LCD BREAKDOWN
Once the weather station has been setup correctly, the following information will be displayed on the LCD. This is
called the “Normal Display Mode”.
(Refer to diagram)
NOTE: If you press the DISPLAY button, the LCD screen will display certain sections. Continually press the DISPLAY
button to go through all the different display sections eventually returning to the “Normal Display Mode”.
11
Page 13

9. OPTIMUM VIEWING ANGLE
The Home Weather Station can be placed in multiple positions as previously discussed in “Mounting The Home
Monitor” on page 5.
You must always keep in mind that the LCD screen is constructed with an “optimum viewing angle”. Your eye
should be at a 45º angle to view the LCD screen clearly.
12
45º
Page 14

10. BUTTON BREAKDOWN (Quick Reference)
13
No. Button
1. ALARM
button
2. “+” button
3. “-” button
4. DISPLAY
button
5. MIN
button
6. MAX
button
7. SET
button
Function
• Press and release to enter “Alarm Set Mode”
• Toggles between the multiple segments of the “Alarm Set Mode”
• Turns all sounding alarms off (Alarm clock, indoor/outdoor temperature alarms)
• Increases values in the “Set Display Mode” (time and date)
• Increases values in “Alarm Display Mode” (clock alarm, indoor temperature alarm and outdoor
temperature alarm)
• Press and hold to reset cumulative rainfall memory
• Toggles between mode settings in the “Set Display Mode”(°C, °F, km, mph, mb,inch/inHg, cm,
inch)
• Decreases values in the “Set Display Mode” (time and date)
• Decreases values in the “Alarm Display Mode” (clock alarm, indoor temperature alarm and outdoor temperature alarm)
• Toggles between mode settings in the “Set Display Mode”(°C, °F, km, mph, mb,inch/inHg, cm,
inch)
• Activates backlight in "Normal Display Mode"
• Runs through 10 different display combinations with assorted sections on the LCD
• Press and hold to enter "ID setting mode" if changing transmitter batteries.
• Displays minimum memory recordings (Wind Chill, Wind Speed, Indoor/outdoor Temperature,
Pressure,Rainfall and Humidity)
• Press and hold to reset ALL minimum memory recordings
• Displays maximum memory recordings (Wind Chill, Wind Speed, Indoor/outdoor Temperature,
Pressure,Rainfall and Humidity)
• Press and hold to reset ALL maximum memory recordings
• Press and hold to enter “Set Display Mode”
• Toggles between the multiple segments of the “Set Display Mode”
• Activates alarms in the “Alarm Set Mode”(clock alarm, indoor temperature alarm and outdoor
temperature alarm)
• Press to store the transmission ID when in the "ID setting mode"
Page 15

11. SETTING THE HOME MONITOR
NOTE: If you pause at any time for more than 7 seconds while setting the time, date, or measurement preferences,
the Home Monitor will automatically return to “normal display mode”and exit the “set display mode”.Your
inputted information will be saved, however, you must start from step one if you did not complete the settings you
intended to input.
“Set Display Mode”– Personalized Settings
Time:
1. Press and hold the SET button for 3 seconds to enter “set display mode”.
2.The hour digit(s) will begin to flash in Section A on the LCD. (Refer to page 10,“LCD Breakdown”).
3. Using the “+” or “-“, toggle until you reach the correct hour(s).
4. Press the SET button again.
5.The minute digit(s) will begin to flash.
6. Using the “+” or “-“, toggle until you reach the correct minute(s).
Date:
7. Press the SET button again.
8.The year digits will begin to flash.
9. Using the “+” or “-“, toggle until you reach the correct year.
10. Press the SET button again.
11.The month digits will begin to flash.
12. Using the “+” or “-“, toggle until you reach the correct month.
13. Press the SET button again.
14.The date digits will begin to flash.
15. Using the “+” or “-“, toggle until you reach the correct date.
Wind Speed (km or mph):
16. Press the SET button again.
17.“Wind Speed” and the current unit of measure (km or mph) will begin to flash in Section B.
18. Using the “+” or “-“, toggle to your preferred unit of measure – kilometers (km) or miles (mph).
19. Once you have decided on your preference, press the SET button again.
Temperature (°C or °F):
20.“Wind Chill”, “Indoor”, “Outdoor” and the current unit of measure (°C or °F) will begin flashing in Sections B
and C.
21. Using the “+” or “-“, toggle to your preferred unit of measure – Celsius (°C) or Fahrenheit (°F).
22. Once you have decided on your preference, press the SET button again.
Pressure (mb or inHg):
23.“Pressure”, “Trend”and the current unit of measure (mb or inch/in Hg) will begin flashing in Sections D and E.
24. Using the “+” or “-“, toggle to your preferred unit of measure – millibars (mb) or inches of mercury (inch/in Hg).
NOTE: inches of mercury are represented as “inHg” (on the “Trend”chart) and as “inch”(under the
“Pressure”segment of Section D) – both represent the same unit of measure.
25. Once you have decided on your preference, press the SET button again.
Rainfall (cm or inch):
26.“Rainfall” and the current unit of measure (cm or inch) will begin flashing.
27. Using the “+” or “-“, toggle to your preferred unit of measure – centimeters (cm) or inches (inch).
28. Press the SET button to exit the “set display mode”, or wait 7 seconds so that the unit returns to the “normal
display mode”automatically. All set information will be stored.
14
Page 16

12. SETTING THE ALARM
NOTE: If you pause at any time for more than 7 seconds while setting the time,indoor or outdoor temperature
alarms, the Home Monitor will automatically return to “normal display mode”and exit the “alarm set mode”.Your
inputted information will be saved, however, you must start from step one if you did not complete setting the
alarms you intended to do.
“Alarm Set Mode”
Alarm Clock:
1. Firmly press and release the ALARM button for no more than 2 seconds to enter the “alarm set mode”.
2.The hour digits will begin to flash in Section A of the LCD. (refer to page 10,“LCD Breakdown”).
3. Using the “+” or “-“, toggle until you reach the desired hour(s) for the alarm clock to sound.
4. Press the ALARM button again.
5.The minute digit(s) will begin to flash.
6. Using the “+” or “-“, toggle until you reach the desired minute(s) for the alarm to sound.
7. Press the ALARM button again.
8.“((•))” icon will begin to flash.
9.To activate the alarm, press the SET button. The “((•))”icon will stop flashing to indicate that the alarm is active.
(To have the alarm inactive, ensure that the “((•))” icon is flashing)
Indoor Temperature Alarm:
10. Press the ALARM button again to progress to the indoor temperature alarm.
11.“INDOOR” and “TEMP” will begin to flash in Section C of the LCD.
12. Using the “+” or “-“, toggle until you reach the desired temperature for the temperature alarm to sound.
13. Press the ALARM button again.
14.“((•))” icon will begin to flash.
15.To activate the indoor temperature alarm, press the SET button. The “((•))” icon will stop flashing to indicate
that the alarm is active. ( To have the alarm inactive, ensure that the “((•))” icon is flashing)
Outdoor Temperature Alarm:
16. Press the ALARM button again to progress to the outdoor temperature alarm.
17.“TEMP” and “OUTDOOR” will begin to flash in Section C of the LCD.
18. Using the “+” or “-“, toggle until you reach the desired temperature for the temperature alarm to sound.
19. Press the ALARM button again.
20.“((•))” icon will begin to flash.
21.To activate the outdoor temperature alarm, press the SET button. The “((•))” icon will stop flashing to indicate
that the alarm is active. ( To have the alarm inactive, ensure that the “((•))” icon is flashing).
NOTE:
• When the clock alarm sounds,the “((•))”logo in Section A of the LCD will begin to flash to the right of the time.
• When the temperature alarm sounds, Section C of the LCD will indicate which alarm is ringing by flashing
“INDOOR” or “OUTDOOR” and the “((•))” logo.
• If both the indoor and outdoor alarms are sounding,“INDOOR”,“OUTDOOR” and the “((•))” logo will flash in Section
C of the LCD.
13. TURNING OFF THE ALARM(S)
• If any of the alarms sound, press and release the ALARM button to deactivate the signal (“beeping”). “((•))”
flashes to indicate which alarm has sounded. This will only turn off the alarm that has sounded at that particular
point in time. Example: If the alarm clock sounds and the temperature alarms are set, you can press the ALARM
button to turn off the alarm clock, however, the temperature alarms will remain active.
• Once you have deactivated a sounding alarm by pressing the ALARM button, you must reset the alarm by
following all the steps in the “Setting the Alarm” section.
15
Page 17

14. MINIMUM OR MAXIMUM MEMORY RECALL
Press the MIN button to recall all the minimum recorded weather measurements. (Including: Wind Chill,Wind
Speed, Indoor Temperature, Outdoor Temperature, Pressure, Rainfall and Humidity).
Press the MAX button to recall all the maximum-recorded weather measurements. (Including: Wind Chill,Wind
Speed, Indoor Temperature, Outdoor Temperature, Pressure, Rainfall and Humidity).
15. MINIMUM OR MAXIMUM MEMORY RESET
Press and hold the MIN button for 4 or more seconds to reset all the minimum recorded weather measurements.
Press and hold the MAX button for 4 or more seconds to reset all the maximum recorded weather measurements.
16. RAINFALL MEASUREMENT RESET
The Home Weather Station calculates cumulative rainfall. To reset the rainfall reading,press and hold the “+”
button for 4 or more seconds. “- - -” (dashes) will appear to indicate that the rainfall has reset. After about 128
seconds, the reading will return to 0.0 cm (or 0.0 inch).
17. RAIN GAUGE MAINTENANCE
• It is recommended that you inspect and clean your rain gauge every couple of months. Remove any leaves that
may have fallen into the collection bowl.
• Remove the lid on the rain gauge and check if there is anything obstructing the tipping bucket mechanism.
• The rain gauge is not designed to register snowfall, therefore, to avoid damage to the unit,it is recommended
that you bring the unit in during the winter, or if it is mounted in a permanent position, cover it to protect it from
snowfall.
18. TREND CHART
Please review the following tips on understanding your trend chart.
NOTE:
• The trend chart will not appear in the Section E after powering up the home monitor for the first time. It has to
collect air pressure data for 24 hours before it can display a trend.
• If at anytime power is lost to the home monitor, all trend information will be erased and must be collected again
for 24 hours to display a trend once the power is restored.
16
Page 18

19. WEATHER FORECASTING
• Weather forecasting is an extremely complex science. Even professional meteorologists with the best equipment
and the aid of radar and satellite imagery often have difficulty forecasting with absolute certainty. The prediction
models meteorologists use consider many weather variables; including: barometric pressure, wind direction, wind
speed, dew point, etc.
• The forecast function in the Home Weather Station is based solely on barometric pressure and the trend
recordings of general weather conditions associated with various pressure levels. It therefore has a limited ability
to forecast for the multitude of specific conditions it will encounter. It provides a general forecast of weather
changes in the same way a wall barometer forecasts changes in weather, however it does record and account for
trends that influences the forecast icon.
IMPORTANT:
• The forecast icon will always appear as “Partly Cloudy” upon powering up the home monitor. During this time the
main station is collecting pressure information in order to generate a proper forecast.
• The first 72 hours of forecast icons may be inaccurate from what you are viewing out your window,however, the
unit continually gathers pressure data to develop trends,in turn predicting forecasts of coming weather
conditions. The longer the station is powered increases the forecast accuracy.
20. WIND CHILL
• Wind chill is a combination of both the outdoor temperature and wind speed.
• For the wind chill to display on the home monitor the outdoor temperature needs to be above –50ºC (-58ºF) and
below 10ºC (50ºF) and the wind speed needs to be above 4.8 km/hr (3mph) and blow 177km/hr (110mph). If the
outdoor temperature and wind speed are out of the range the wind chill will display dashes (“---“).
21. BAROMETRIC PRESSURE
• The Home Weather Station’s barometer display will differ from local sources (TV, radio, internet, etc.). This is
because barometric pressure quoted in these types of mediums is “barometric pressure adjusted to sea level”,
which is theor
etic
al atmospheric pressure that accounts for decreasing air pressure with elevation. Air pressure
decreases 1.0 inHg for every 1000 feet you go up in elevation.Consequently, the air pressure at the top of a
mountain is considerably less than at sea level.
• The HWS uses a sensor to measure the “absolute”or actual barometric pressure. For forecasting purposes,
however, the relative changes in pressure and pressure trends indicate the coming weather. In general, rising
pressure indicates improving weather, while falling pressure indicates deterioration of current conditions.
• To determine theor
etical atmospheric pressure, please follow this procedure:
17
Page 19

1. Determine your elevation (meters or feet above sea level) by using TABLE 1 or 2 below. The internet or an atlas
are also good sources to determine your elevation if the chart does not provide the correct information for your
general area (View section 27: Resources to look at).
2. Using the barometric tables (TABLE 3 - TABLE 11), find the table that is close to your current elevation:
TABLE 3 = 250 m above sea level TABLE 8 = 1500 m above sea level
TABLE 4 = 500 m above sea level TABLE 9 = 1750 m above sea level
TABLE 5 = 750 m above sea level TABLE 10 = 2000 m above sea level
TABLE 6 = 1000 m above sea level TABLE 11 = 2250 m above sea level
TABLE 7 = 1250 m above sea level
3. Once you have chosen the correct table, view the pressure reading on the HWS and run your finger along the
top of the table until the current pressure falls between the correct range.
4. Now view the outdoor temperature reading on the HWS and run your finger do
wn the pressure column to
match the temperature range along the left side of the table.
5.Your finger now lays on the number of millibars (mb) you must add to the absolute pressure on the HWS display
to determine theoretical atmospheric pressure.
NOTE: you must repeat the actions above every time there is a change in pressure, temperature or altitude to
retrieve the correct theoretical atmospheric pressure.
Example:
TORONTO, ON
Elevation (TABLE 1): 173 m above sea level
HWS current barometric pressure reading: 987.56 mb
HWS current outdoor temperature reading: 25ºC
a) Go to TABLE 3 (250m above sea level), which is the closest table to Toronto’s elevation.
b) Run finger along the top of table to reach 970-989.9 mb.
c) Run finger down chart to reach 16.0 to 25.9ºC.
d) Add 28.8 mb to the current pressure reading on HWS: 28.8 mb + 987.56 mb = 1, 016.36 mb
Theoretical Atmospheric Pressure = 1,016.36 mb*
*Interesting Fact: If your weather network provides you with kPa (or Kilopascals), divide the millibars (mb) by 10 (above Toronto example = 101.63 kPa)
TABLE 1: Elevation
of Major Cities
in Canada
18
Above Sea Level
City
Calgary, AB
Charlottetown, PE
Churchill Falls, NF
Edmonton, AB
Fredericton, NB
Halifax, NS
Iqaluit, NU
Montreal, QC
Ottawa, ON
Quebec City,QC
Regina, SK
m
1049
49
449
670
21
51
33
36
114
74
577
ft
3440
161
1443.20
2198
69
167
108
118
374
243
1893
City
Saskatoon, SK
Prince George, BC
St. John’s, NF
Thunder Bay, ON
Toronto, ON
Vancouver, BC
Victoria, BC
Whitehorse,YT
Winnipeg, MA
Yellowknife, NT
m
504
691
140
199
173
4
19
706
239
206
ft
1653
2266
459
653
567
13
62
703
784
676
Above Sea Level
NOTE: The elevation in meters (m) and feet (ft) refers to the elevation of the
observing location above mean sea level according to Environment Canada:
http://www.climate.weatheroffice.ec.gc.ca/climateData/canada_e.html
Page 20

TABLE 2: Elevation of Major Cities in the US
19
US City Altitude US City Altitude
(feet above sea level) (feet above sea level)
Miami, FL 10
Milwaukee, WI 635
Minneapolis, MN 815
Nashville-Davidson,TN 450
New Orleans, LA 5
New York, NY 55
Oakland, CA 25
Oklahoma City, OK 1,195
Omaha, NE 1,040
Philadelphia, PA 100
Phoenix, AZ 1,090
Portland, OR 77
Sacramento, CA 30
St. Louis, MO 455
San Antonio,TX 650
San Diego, CA 20
San Francisco, CA 65
San Jose, CA 90
Seattle,WA 125
Tucson,AZ 2,390
Tulsa,OK 804
Virginia Beach, VA 10
Washington, DC 25
Wichita, KS 1,290
Albuquerque, NM 4,945
Austin,TX 505
Baltimore, MD 20
Boston, MA 21
Charlotte, NC 720
Chicago, IL 595
Cleveland, OH 660
Colorado Springs, CO 5,890
Columbus, OH 780
Dallas,TX 435
Denver, CO 5,280
Detroit, MI 585
El Paso,TX 3,695
Fort Worth,TX 670
Fresno, CA 285
Honolulu, HI 21
Houston,TX 40
Indianapolis, IN 717
Jacksonville, FL 20
Kansas City, MO 750
Las Vegas,NV 2,030
Long Beach, CA 29
Los Angeles, CA 340
Memphis,TN 275
Mesa, AZ 244
Page 21

22. BAROMETRIC PRESSURE CONVERSIONS
20
Elevation at Station 500 m
Add to Station Pressure to obtain Mean Sea Level Pressure
Station Pressure, mb
Temp ºC 900 920 940 960 980 1000 1020
919.9 939.9 959.9 979.9 999.9 1019.9 1039.9
-44.0 to -34.1 68.4 69.9 71.4 72.9 74.4 75.9 77.4
-34.0 to -24.1 65.5 67.0 68.4 69.9 71.3 72.7 74.2
-24.0 to -14.1 62.9 64.3 65.6 67.0 68.4 69.8 71.2
-14.0 to -4.1 60.4 61.8 63.1 64.4 65.8 67.1 68.4
-4.0 to 5.9 58.2 59.5 60.7 62.0 63.3 64.6 65.8
6.0 to 15.9 56.1 57.3 58.5 59.8 61.0 62.2 63.5
16.0 to 25.9 54.1 55.3 56.5 57.7 58.9 60.1 61.3
26.0 to 35.9 52.3 53.5 54.6 55.8 56.9 58.1 59.2
Elevation at Station 750 m
Add to Station Pressure to obtain Mean Sea Level Pressure
Station Pressure, mb
Temp ºC 870 890 910 930 950 970 990
889.9 909.9 929.9 949.9 969.9 989.9 1009.9
-44.0 to -34.1 100.7 103.0 105.3 107.6 109.9 112.2 114.4
-34.0 to -24.1 96.4 98.6 100.8 103.0 105.2 107.4 109.6
-24.0 to -14.1 92.5 94.6 96.7 98.8 100.9 103.0 105.1
-14.0 to -4.1 88.8 90.8 92.9 94.9 96.9 98.9 100.9
-4.0 to 5.9 85.5 87.4 89.3 91.3 93.2 95.2 97.1
6.0 to 15.9 82.3 84.2 86.1 88.0 89.8 91.7 93.6
16.0 to 25.9 79.4 81.2 83.1 84.9 86.7 88.5 90.3
26.0 to 35.9 76.7 78.5 80.2 82.0 83.7 85.5 87.2
Elevation at Station 250 m
Add to Station Pressure to obtain Mean Sea Level Pressure
Station Pressure, mb
Temp ºC 930 950 970 990 1010 1030 1050
949.9 969.9 989.9 1009.9 1029.9 1049.9 1069.9
-44.0 to -34.1 34.8 35.6 36.3 37.0 37.8 38.5 39.3
-34.0 to -24.1 33.4 34.1 34.8 35.5 36.2 36.9 37.6
-24.0 to -14.1 32.0 32.7 33.4 34.1 34.8 35.4 36.1
-14.0 to -4.1 30.8 31.5 32.1 32.8 33.4 34.1 34.7
-4.0 to 5.9 29.7 30.3 30.9 31.6 32.2 32.8 33.5
6.0 to 15.9 28.6 29.2 29.8 30.4 31.0 31.7 32.3
16.0 to 25.9 27.6 28.2 29.4 30.0 30.6 31.2
26.0 to 35.9 26.7 27.3 27.8 28.4 29.0 29.6 30.1
TABLE 3
TABLE 4
TABLE 5
28.8
Page 22

21
Elevation at Station 1500 m
Add to Station Pressure to obtain Mean Sea Level Pressure
Station Pressure, mb
Temp ºC 790 810 830 850 870 890 910
809.9 829.9 849.9 869.9 889.9 909.9 929.9
-44.0 to -34.1 191.4 196.2 201.0 205.8 210.6 215.3 220.1
-34.0 to -24.1 182.9 187.5 192.1 196.6 201.2 205.8 210.4
-24.0 to -14.1 175.1 179.5 183.9 188.3 192.6 197.0 201.4
-14.0 to -4.1 168.0 172.2 176.4 180.6 184.8 189.0 193.2
-4.0 to 5.9 161.4 165.4 169.5 173.5 177.5 181.6 185.6
6.0 to 15.9 155.3 159.2 163.1 166.9 170.8 174.7 178.6
16.0 to 25.9 149.6 153.4 157.1 160.9 164.6 168.3 172.1
26.0 to 35.9 144.4 148.0 151.6 155.2 158.8 162.4 166.0
Elevation at Station 1000 m
Add to Station Pressure to obtain Mean Sea Level Pressure
Station Pressure, mb
Temp ºC 840 860 880 900 920 940 960
859.9 879.9 899.9 919.9 939.9 959.9 979.9
-44.0 to -34.1 131.6 134.7 137.8 140.9 144.0 147.1 150.2
-34.0 to -24.1 125.9 128.9 131.9 134.8 137.8 140.8 143.7
-24.0 to -14.1 120.7 123.6 126.4 129.2 132.1 134.9 137.8
-14.0 to -4.1 115.9 118.6 121.4 124.1 126.8 129.5 132.3
-4.0 to 5.9 111.5 114.1 116.7 119.3 122.0 124.6 127.2
6.0 to 15.9 107.3 109.9 112.4 114.9 117.5 120.0 122.5
16.0 to 25.9 103.5 106.0 108.4 110.8 113.3 115.7 118.1
26.0 to 35.9 100.0 102.3 104.7 107.0 109.4 111.7 114.1
TABLE 6
TABLE 8
TABLE 7
Elevation at Station 1250 m
Add to Station Pressure to obtain Mean Sea Level Pressure
Station Pressure, mb
Temp ºC 810 830 850 870 890 910 930
829.9 849.9 869.9 889.9 909.9 929.9 949.9
-44.0 to -34.1 161.4 165.0 169.0 172.9 176.8 180.8 184.7
-34.0 to -24.1 154.0 157.8 161.6 165.3 169.1 172.8 176.6
-24.0 to -14.1 147.6 151.2 154.8 158.4 162.0 165.6 169.2
-14.0 to -4.1 141.6 145.1 148.5 152.0 155.4 158.9 162.3
-4.0 to 5.9 136.1 139.4 142.8 146.1 149.4 152.7 156.0
6.0 to 15.9 131.0 134.2 137.4 140.6 143.8 147.0 150.2
16.0 to 25.9 126.3 129.4 132.5 135.6 138.6 141.7 144.8
26.0 to 35.9 121.9 124.9 127.9 130.8 133.8 136.8 139.8
Page 23

22
Elevation at Station 2000 m
Add to Station Pressure to obtain Mean Sea Level Pressure
Station Pressure, mb
Temp ºC 740 760 780 800 820 840 860
759.9 779.9 799.9 819.9 839.9 859.9 879.9
-44.0 to -34.1 246.5 253.0 259.6 266.2 272.7 279.3 285.9
-34.0 to -24.1 235.2 241.5 247.8 254.0 260.3 266.6 272.9
-24.0 to -14.1 225.0 231.0 237.0 243.0 249.0 255.0 260.9
-14.0 to -4.1 215.5 221.3 227.0 232.8 238.5 244.3 250.0
-4.0 to 5.9 206.9 212.4 217.9 223.4 229.0 234.5 240.0
6.0 to 15.9 198.9 204.2 209.5 214.8 220.1 225.4 230.7
16.0 to 25.9 191.5 196.6 201.7 206.8 211.9 217.0 222.1
26.0 to 35.9 184.6 189.6 194.5 199.4 204.3 209.2 214.2
Elevation at Station 2250 m
Add to Station Pressure to obtain Mean Sea Level Pressure
Station Pressure, mb
Temp ºC 720 740 760 780 800 820 840
739.9 759.9 779.9 799.9 819.9 839.9 859.9
-44.0 to -34.1 273.9 281.4 288.9 296.4 303.9 311.4 318.9
-34.0 to -24.1 261.2 268.4 275.6 282.7 289.9 297.0 304.2
-24.0 to -14.1 249.7 256.5 263.4 270.2 277.1 283.9 290.8
-14.0 to -4.1 239.1 245.7 252.2 258.8 265.3 271.9 278.4
-4.0 to 5.9 229.4 235.7 242.0 248.3 254.6 260.9 267.1
6.0 to 15.9 220.5 226.5 232.5 238.6 244.6 250.7 256.7
16.0 to 25.9 212.2 218.0 223.8 229.6 235.4 241.2 247.1
26.0 to 35.9 204.5 210.1 215.7 221.3 226.9 232.5 238.1
Elevation at Station 1750 m
Add to Station Pressure to obtain Mean Sea Level Pressure
Station Pressure, mb
Temp ºC 770 790 810 830 850 870 890
789.9 809.9 829.9 849.9 869.9 889.9 909.9
-44.0 to -34.1 221.0 226.7 232.3 238.0 243.7 249.3 255.0
-34.0 to -24.1 211.0 216.4 221.9 227.3 232.7 238.1 243.5
-24.0 to -14.1 201.9 207.1 212.3 217.5 222.7 227.8 233.0
-14.0 to -4.1 193.6 198.6 203.5 208.5 213.4 218.4 223.4
-4.0 to 5.9 185.9 190.7 195.4 200.0 205.0 209.7 214.5
6.0 to 15.9 178.8 183.4 188.0 192.6 197.1 201.7 206.3
16.0 to 25.9 172.2 176.6 181.1 185.5 189.9 194.3 198.7
26.0 to 35.9 166.1 170.4 174.6 178.9 183.1 187.4 191.7
TABLE 9
TABLE 10
TABLE 11
Page 24

23. TROUBLESHOOTING
23
LCD is blank
Outdoor information not
displayed,“---”
Wind speed and direction not
displayed,“---”
Outdoor temperature not
displayed,“---”
NOTES on items in the home
that generate frequency
trouble:
• Family radios (CB’s, walky-talky)
• Digital cable or satellite boxes
radiate frequencies that will
interfere with transmission
• HAM radios
• Microwave Ovens
Wind speed does not change
A. This occurs because there is no power supplied to the main unit.
1. Check the AC power connections to the receiving unit and the power from
the wall outlet.
2. Check the batteries and make sure they are not dead.
3. Check the polarity of the batteries in the battery compartment.
4. Replace the batteries. (View section 5B: Setting up the Weather Station –
Powering up your HWS)
5. Press the DISPLAY button to see if you are in a particular display mode
screen. (View section 8: LCD Breakdown)
A. This is usually caused by transmission interference or low battery power in
the transmitter.
B. Make sure the slide switch is on "NORMAL" after the transmission ID setup
is complete (View page 9).
C. Did you perform the SET ID operation with the outdoor sensors plugged
into the therm-trans.?
i) Are there dashes for the outdoor temperature reading?
ii) Are there dashes for the wind speed reading?
iii) Are there dashes for the wind direction reading?
IF YES TO ALL QUESTIONS ABOVE:
1. Check batteries in the transmitter. Replace if needed. (View section 5C:
Setting up the Weather Station – Powering up your HWS)
2. Bring the receiver beside the transmitter and remove all the batteries.
Replace them all (View section 5B: Setting up the Weather Station –
Connecting the sensors) and observe whether ALL the outdoor readings
show up. Check the timing of updates on the receiving unit (outdoor
readings should change every 128 seconds). Then, place the receiver back
in the regular position. Check the timing of updates AGAIN on the
receiving unit. If you notice the updates occur every 128 seconds, there
should be no problem. Make sure you now plug in the AC/DC adaptor to
the home monitor.
If updates occur greater than 128 seconds (4 minutes 16 seconds +) or no
updates occur there is transmission interference between the receiver and
the transmitter. BOTH UNITS MUST BE PLACED IN DIFFERENT LOCATIONS
WITH MINIMAL TRANSMISSION INTERFERENCE.
IF THERE ARE DASHES ONLY WHERE THE WIND SPEED AND DIRECTION
ARE DISPLAYED AND THE UNIT IS REGISTERING AN OUTDOOR
TEMPERATURE:
3. Check that the wires are connected from the wind sensor to the
transmitter in the right slot (labeled "wind") and are fully inserted. If the
wind sensor was not inserted properly, remove the batteries from both
components and re-insert them. (View section 5B: Setting up the Weather
Station – Connecting the sensors).
A.This is usually an indication that the batteries have died in the transmitter.
Page 25

24
Outdoor readings stopped after
two days, one week, etc
1.To conserve battery power, the transmitter broadcasts the wind speed
data (and all other weather information) every 128 seconds (2 min. 8 sec.)
to the inside monitor. (View section 6: Wireless Transmission).
2. Check the batteries in the transmitter. Replace if needed. (View section
5C: Setting up the Weather Station – Powering up your HWS)
3. Make sure that the wind speed sensor cord is securely fastened in the
“wind” slot on the transmitter. (View section 5B: Setting up the Weather
Station – Connecting the sensors)
4. Bring the receiver beside the transmitter and remove all the batteries.
Replace them all (View section 5B: Setting up the Weather Station –
Connecting the sensors) and observe whether ALL the outdoor readings
show up. Check the timing of updates on the receiving unit (outdoor
readings should change every 128 seconds). Then, place the receiver back
in the regular position. Check the timing of updates AGAIN on the
receiving unit. If you notice the updates occur every 128 seconds, there
should be no problem.
If updates occur greater than 128 seconds (4 minutes 16 seconds +) or no
updates occur there is transmission interference between the receiver and
the transmitter. BOTH UNITS MUST BE PLACED IN DIFFERENT LOCATIONS
WITH MINIMAL TRANSMISSION INTERFERENCE.
5. Freezing rain can cause the wind direction pointer to stop moving, thus
constantly displaying the same direction. You can attempt to remove the
ice from the wind sensor, but it is str
ongly advised to wait for milder
weather to do so.
1. Battery voltage supplied by the 4 x AA batteries in the transmitter is
affected by cold weather, especially alkaline batteries. Low voltage
decreases the transmission distance significantly. If you are experiencing
weather below -10°C, it is suggested to use lithium batteries and place the
monitor and transmitter as close as possible to each other.
Power Adaptor: a special transmitter adaptor is available to supply power
to the transmitter rather than using batteries. It is a perfect solution for
your HWS during extremely cold temperatures in the winter months when
batteries may cause problems. Please call 1-800-387-8520 for ordering
information.
2. Electrical storms can cause transmission to stop. If this occurs, you must
reset the receiver and transmitter by removing the batteries and reinserting them correctly (View section 5C: Setting up the Weather Station
– Powering up your HWS). DO NOT do this during the electrical storm!
3. Electromagnetic interference can occur from different sources that
transmit radio waves that may affect how the main unit receives data
from the transmitter (if at all). It is recommended that you place the
transmitter and receiver significantly close together if there is a large
amount of electromagnetic interference in your area. Even interference
from appliances in your home may cause transmission to stop.
4. Bring the receiver beside the transmitter and remove all the batteries.
Replace them all (View section 5B: Setting up the Weather Station –
Connecting the sensors) and observe whether ALL the outdoor readings
show up. Check the timing of updates on the receiving unit (outdoor
readings should change every 128 seconds). Then, place the receiver back
Page 26

25
Wind direction is displaying faulty
readings
Wind direction is stuck on one
direction
Pressure reading is too
high / low / changed
in the regular position. Check the timing of updates AGAIN on the
receiving unit. If you notice the updates occur every 128 seconds, there
should be no problem.
If updates occur greater than 128 seconds (4 minutes 16 seconds +) or no
updates occur there is transmission interference between the receiver
and the transmitter. BOTH UNITS MUST BE PLACED IN DIFFERENT
LOCATIONS WITH MINIMAL TRANSMISSION INTERFERENCE.
i) Are you mounting the unit on a mast or metal pole?
ii) Do you know what the pole is made of?
1. Aluminum poles should not affect the wind direction readings, however,
masts or poles made of lead or other dense metals can affect the
magnetic sensors in the wind sensor causing the unusual readings. Move
the wind sensor, if necessary, or use the vertical mount procedure. (View
section 5A: Setting up the Weather Station – Mounting)
2. Freezing rain can cause the wind direction pointer to stop moving, thus
constantly displaying the same direction. You can attempt to remove the
ice from the wind sensor, but it is strongly advised to wait for milder
weather to do so.
A. Freezing rain can cause the wind direction pointer to stop moving, thus
constantly displaying the same direction. You can attempt to remove the
ice from the wind sensor, but it is strongly advised to wait for milder
weather to do so.
B. This is also an indication that there is transmission interference or
batteries have died in the transmitter.
1. Check the batteries in the transmitter. Replace if needed. (View section
5C: Setting up the Weather Station – Powering up your HWS)
2. Make sure that the wind speed sensor is securely fastened in the “wind”
slot on the transmitter. (View section 5D: Setting up the Weather Station –
Connecting the sensors)
3. Bring the receiver beside the transmitter and remove all the batteries.
Replace them all (View section 5B: Setting up the Weather Station –
Connecting the sensors) and observe whether ALL the outdoor readings
show up. Check the timing of updates on the receiving unit (outdoor
readings should change every 128 seconds). Then, place the receiver back
in the regular position. Check the timing of updates AGAIN on the
receiving unit. If you notice the updates occur every 128 seconds, there
should be no problem.
If updates occur greater than 128 seconds (4 minutes 16 seconds +) or no
updates occur there is transmission interference between the receiver
and the transmitter. BOTH UNITS MUST BE PLACED IN DIFFERENT
LOCATIONS WITH MINIMAL TRANSMISSION INTERFERENCE.
The pressure sensor in your weather station is very sensitive to voltage
changes. If you scroll through the display screen (using the DISPLAY button)
or plug in the AC adaptor with the batteries in it, the pressure may change
Page 27

26
Only transmits when the
transmitter is right beside the
receiver
No outdoor reading occur even
after resetting the units
because the voltage to the sensor has either increased or decreased. After a
very short period of time, the pressure sensor will adjust itself back to the
correct pressure readings.
A.There is a large amount of transmission interference with the current
location of the main unit and transmitter. There may be too many walls or
electrical interference (caused by appliances in your home) between the
two units.
1. Significantly reduce the distance between the main unit and the
transmitter.
2. Bring the receiver beside the transmitter and remove all the batteries.
Replace them all (View section 5B: Setting up the Weather Station –
Connecting the sensors) and observe whether ALL the outdoor readings
show up. Check the timing of updates on the receiving unit (outdoor
readings should change every 128 seconds). Then, place the receiver back
in the regular position. Check the timing of updates AGAIN on the
receiving unit. If you notice the updates occur every 128 seconds, there
should be no problem.
If updates occur greater than 128 seconds (4 minutes 16 seconds +) or no
updates occur there is transmission interference between the receiver
and the transmitter. BOTH UNITS MUST BE PLACED IN DIFFERENT
LOCATIONS WITH MINIMAL TRANSMISSION INTERFERENCE.
A. Make sure the slide switch is on "NORMAL" after the transmission ID
setup is complete. (View Page 9)
B. Make sure that you have unplugged and removed the batteries from the
main unit AND the transmitter. Re-insert the batteries in the transmitter
ONLY. Put the transmitter directly on top of a radio (preferably a clockradio due to the size – stereo radios may be too large for this test), and
tune the radio to FM 107.9. You should hear a loud beep or pulse roughly
every 128 seconds.Time the pulse to ensure this occurs approximately
every 128 seconds. If no pulse is heard, the transmitter’s batteries are
dead or the transmitter is defective.
If the pulse does occur approximately every 128 seconds, place the main
unit and the transmitter side by side (turn off your radio). Bring the receiver
beside the transmitter and remove all the batteries.Replace them all (View
section 5B: Setting up the Weather Station – Connecting the sensors) and
observe whether ALL the outdoor readings show up. Check the timing of
updates on the receiving unit (outdoor readings should change every 128
seconds).Then, place the receiver back in the regular position.Check the
timing of updates AGAIN on the receiving unit. If you notice the updates
occur every 128 seconds, there should be no problem.
If updates occur greater than 128 seconds (4 minutes 16 seconds +) or no
updates occur there is transmission interference between the receiver and
the transmitter. BOTH UNITS MUST BE PLACED IN DIFFERENT LOCATIONS
WITH MINIMAL TRANSMISSION INTERFERENCE.
Page 28

27
Wind speed too high
(190 km to 200 km)
Wind speed too low
Wind speed not accurate
Barometric trend doesn’t work
** NOTE: the radio test is only confirming that the transmitter is sending out
a signal. This proves that the transmitter should not be sent back because it
is diagnosed as faulty**
Transmission issues usually cause this to occur from other appliances or
radio waves in the air. If the problem persists,you should consider replacing
the batteries in the transmitter (View section 5C: Setting up the Weather
Station – Powering up your HWS) and possibly moving the location of the
transmitter and receiver.
1.This situation can occur because the wind speed transmission is NOT
REAL TIME. The wind speed is an average reading of gusts collected
before transmission, therefore if wind gusts happen (every 128 seconds)
to dip below the perceived wind speed over the measuring period, the
average will be reduced, resulting in what appears to be a low reading.
2. Is the anemomet
er clear of obstructions?
Wind speed & direction can be affected radically by obstructions that
interfere with actual wind. This affect can take place many meters away
from the sensor.
Example: a 40’ tree even 50 meters from the sensor on the roof of a house
will disturb enough wind that the unit will never give proper data from
the direction of that tree.
3. Wind speed and directional data will not change if there is “transmission
interference”. That means that some of the data transmitted has been
corrupted by other sources emitting waves. This could be anything –
wiring in walls, appliances, other electrical devices operating in proximity
of the monitor or transmitter, or between the two.
4. Freezing rain can cause the wind speed cups to stop moving, thus
constantly displaying 0.0 wind speed. You can attempt to remove the ice
from the wind sensor, but it is strongly advised to wait for milder weather
to do so.
Bring the receiver beside the transmitter and remove all the batteries.
Replace them all (View section 5B: Setting up the Weather Station –
Connecting the sensors) and observe whether ALL the outdoor readings
show up. Check the timing of updates on the receiving unit (outdoor
readings should change every 128 seconds). Then, place the receiver back
in the regular position. Check the timing of updates AGAIN on the
receiving unit. If you notice the updates occur every 128 seconds, there
should be no problem.
If updates occur greater than 128 seconds (4 minutes 16 seconds +) or no
updates occur there is transmission interference between the receiver and
the transmitter. BOTH UNITS MUST BE PLACED IN DIFFERENT LOCATIONS
WITH MINIMAL TRANSMISSION INTERFERENCE.
The trend function will not display after power up until it has collected 24
Page 29

28
hrs of pressure data. (View section 18: Trend Chart).
The forecast icon will always appear as “Partly Cloudy” upon powering up the
home monitor. The first several hours of forecast data may be inaccurate,
because the home monitor needs to collect barometric pressure
information. Over time the forecast icon’s accuracy will improve. (View
section 19: Weather Forecasting)
The “most accurate”professional weather forecasting system is only 70.2%
accurate. Forecasting is a very complex science involving very powerful
computer models, satellite imagery and radar.Scientific forecasts consider
barometric pressure, wind direction, dew point, etc. The HWS forecast only
evaluates the barometric pressure change over a certain period of time. It is
very much like using a traditional dial barometer for predicting changes in
the weather.
The home monitor LCD display was designed with an optimum viewing
angle from a desk position. This angle is approximately 45°.
The LCD screen works from other directions, but it is best to consider the
Optimum Viewing Angle (Section 9).
The Home Weather station requires constant battery power to accurately
scan outdoor weather readings. The wind speed sensor and the 60 meters
transmission is the main cause of power consumption. In normal
temperature ranges (50°F to 80°F, 10°C to 25°C), you can expect that the 4 x
AA batteries in the transmitter will last approximately 7 weeks (even lithium
batteries).
In colder temperatures, battery life is much less – note that the use of lithium
batteries allow the chemical reaction that is creating power to occur in
colder temperatures (-40°F / -40°C) compared to alkaline batteries, which fail
at approximately 14°F (-10°C),but it does not necessarily mean that the
battery’s charge will last longer.
Consider the amount of times you must recharge your cell phone or digital
camera. All of these items, including the HWS, use a lot of power to perform
perfectly. For power saving consider,
Power Adaptor: a special transmitter adaptor is available to supply power to
the transmitter rather than using batteries. It is a perfect solution for your
HWS during extremely cold temperatures in the winter months when
batteries may cause problems. Please call 1-800-387-8520 for ordering
information.
Forecast icons don’t change
Forecast icons limitations
Optimum viewing angle
Battery consumption
Page 30

25. WARRANTY
Thermor’s Home Weather Station is guaranteed to be free from defects in material and workmanship for one year
from the date of purchase. The warranty does not apply if the defect or malfunction is a result of user abuse, misuse, alteration, modification or damages in transit.
PLEASE CONTACT THERMOR LTD. BEFORE SENDING THE UNIT IN FOR REPAIRS AT:
1-800-387-8520
If necessary, send the defective or malfunctioning unit, freight and insurance prepaid, with the original sales
receipt and a cheque for $10.00 to cover return shipping and handling to:
Thermor Ltd.
395 Cochrane Drive
Markham, ON
CANADA
L3R 9R5
29
24. PRODUCT SPECIFICATIONS
Reading
Outdoor temperature
Indoor temperature
Humidity
Wind Speed
Air Pressure
Wind direction
Rainfall
Transmission distance
Wind Chill
Range
-40°C to 60°C (-40°F to 140°F)
0°C to 40°C (32°F to 104°F)
20% to 95% relative humidity
0 to 100 km/h (0 to 60 mph)
840 – 1200 mb (24.8-35.4 inHg)
16 directions
0 to 99.9 cm (0 to 39.3 in)
Over 60 meters (60 yards)
-74ºC to 10ºC (-101ºF to 49ºF)
Accuracy/Precision
+/- 2°C (+/-4ºF)
+/-2°C (+/-4°F)
+/- 7%
+/-4Km of the range
(Km/h or mph)
+/- 4mb (+/-0.2 inHg)
+/-0.5 cm (+/-0.2 In)
Like a cellular phone,
this is dependent upon
transmission
interference.
+/- 2ºC (+/- 4ºF)
Page 31

30
26. RESOURCES TO LOOK AT...
National Weather Service:
http://www.nws.noaa.gov
US Environment Protection Agency:
http://www.epa.gov
Environment Canada:
http://www.weatheroffice.ec.gc.ca/climateData/canada_e.html
Real Estate Journal -- Wall Street Journal (for US city elevation information):
http://homes.wsj.com/cityprofiles/
27. FCC INFORMATION
Warning: Changes or modifications to this unit not expressly approved by the party responsible for compliance
could void the user authority to operate the equipment.
NOTE: This equipment has been tested and found to comply with the limits for Class B digital device,pursuant to
Part 15 of the FCC Rules. These limits are designed to provide reasonable protection against harmful interference
in a residential installation. This equipment generates, uses and can radiate radio frequency energy and, if not
installed and used in accordance with the instructions, may cause harmful interference to radio communications.
However, there is no guarantee that interference will not occur in a particular installation. If this equipment does
cause harmful interference to radio or television reception, which can be determined by turning the equipment
off and on, the user is encouraged to try to correct the interference by one or more of the following measures:
Reorient or relocate the receiving antenna.
Increase the separation between the equipment and receiver.
Connect the equipment into an outlet on a circuit different from that to which the receiver is connected.
Consult the dealer or an experienced radio/TV technician for help.
TH0589_DG950_ORG_TH_IB_072106
 Loading...