

Page 1
gyM
sy...
Instruction Manual
(PH6000/PC6000/PH6500/CON6000/DO6000/PC6500/PCD6500)
CyberComm 6000
Data Acquisition Software
For CyberScan 6000 Series Meters
Tec hno lo
adeEa
68X090831 Rev. 0 Apr 06
Page 2

Page 3

Preface
This manual serves to explain the use of the CyberComm 6000 Data Acquisition
Software. The manual functions in two ways, firstly as a step by step guide to help
the user work with software application. Secondly, it serves as a handy reference
guide. It assumes that the user is familiar with setting up, calibrating & measuring
with CyberScan 6000 series meter.
The information presented in this manual is subject to change without notice as
improvements are made, and does not represent a commitment on part of Eutech
Instruments.
Eutech Instruments cannot accept any responsibility for damage or malfunction of the
unit due to improper use of the instrument.
Copyright ©2006 All rights reserved.
Eutech Instruments Pte Ltd.
Page 4

Page 5

Table of Contents
1. Getting Started ......................................................................................................1
1.1 Overview ................................................................................................................................ 1
1.2 Installing PC Communication Software.................................................................................. 2
1.3 Connecting to CyberScan 6000 Series Meter........................................................................ 6
1.3.1 RS232 Serial Port Connection....................................................................................... 6
1.3.2 Prepare the Meter for Communication .......................................................................... 6
1.4 Launching CyberComm ......................................................................................................... 8
1.5 Getting Familiar with CyberComm ....................................................................................... 11
1.5.1 Overview...................................................................................................................... 11
1.5.2 Menu bar...................................................................................................................... 11
1.5.3 Control tabs ................................................................................................................. 11
1.5.4 Workspace................................................................................................................... 12
1.6 Synchronizing Data ..............................................................................................................13
1.6.1 Data Import.................................................................................................................. 13
1.6.2 Data Export.................................................................................................................. 15
1.7 System Settings ................................................................................................................... 16
1.7.1 Time Stamp ................................................................................................................. 16
1.7.2 COM Port Configuration .............................................................................................. 16
2. Projects ................................................................................................................19
2.1 Overview .............................................................................................................................. 19
2.2 Adding a New Project........................................................................................................... 20
2.3 Loading a Project ................................................................................................................. 21
2.4 Editing a Project ................................................................................................................... 21
2.5 Deleting a Project ................................................................................................................. 21
3. Standardization ...................................................................................................23
3.1 About Standardization.......................................................................................................... 23
3.2 Select existing standardization data of the meter for measurement.................................... 24
3.3 Select existing standardization data of CyberComm for measurement............................... 26
3.4 New Standardization using an existing electrode ................................................................ 28
3.5 Add a new electrode to the project....................................................................................... 32
3.6 Remove an existing electrode from the project.................................................................... 33
3.7 Clear standardization from an electrode .............................................................................. 33
3.8 Compare Electrode Characteristics ..................................................................................... 34
3.9 Temperature Standardization............................................................................................... 36
4. Measurements .....................................................................................................37
4.1 About Measurement ............................................................................................................. 37
4.2 Measure Tab ........................................................................................................................ 37
4.2.1 Selecting a Single Channel ......................................................................................... 37
4.2.2 Selecting Multiple Channels ........................................................................................ 39
4.2.3 Refresh Temperature Reading.................................................................................... 41
4.2.4 Log measurement data................................................................................................ 41
4.2.5 Taking a Snap Shot of Graph ...................................................................................... 43
5. Reports.................................................................................................................44
5.1 About Reports ...................................................................................................................... 44
5.2 Graphic Sheet ...................................................................................................................... 45
5.3 View Graph........................................................................................................................... 47
5.4 Stored Data .......................................................................................................................... 49
5.5 Excel Sheet .......................................................................................................................... 50
5.6 Standardization (STD) Report.............................................................................................. 51
Page 6

6. Administrative Functions ...................................................................................57
6.1 Audit Log .............................................................................................................................. 58
6.1.1 View audit log file......................................................................................................... 58
6.1.2 Backup audit log file .................................................................................................... 59
6.1.3 Delete audit log file ...................................................................................................... 59
6.2 Unlocking Users ................................................................................................................... 60
Page 7

Instruction Manual CyberComm 6000
1. Getting Started
1.1 Overview
The Eutech Instruments’ CyberComm 6000 Data Acquisition software is a
Windows® based add-on application to CyberScan 6000 series meters. It enables
you to extend the use of CyberScan meter by seamlessly integrating the meter to a
personal computer and provides collaboration features for multi-user environment.
Key features of CyberComm:
User friendly interface to extend the CyberScan features
Easy synchronization of data between CyberScan & CyberComm
Unlimited number of data logging (depending on hard disk capacity)
Project base working environment lets users to organize their meter related
activities
Share standardization information among users and projects
Provides extensive audit track of CyberComm/CyberScan user activities
(accessible only for administrator)
Keep records of electrode configuration and buffer configuration
Provides graphical comparison of pH electrode properties
User configurable reports
Export data to Microsoft® Excel
Report printing
1
Page 8

Instruction Manual CyberComm 6000
1.2 Installing PC Communication Software
To install the PC Communication software:
1. Insert the PC Communication software installation CD into the CDROM drive of
your PC. The installation wizard should automatically start a shown in Figure 1 &
Figure 2 :.
Figure 1 : Preparing to install
2
Page 9
Instruction Manual CyberComm 6000
Figure 2 : Second screen of installation
2. In the second screen (Figure 2), click Next to continue.
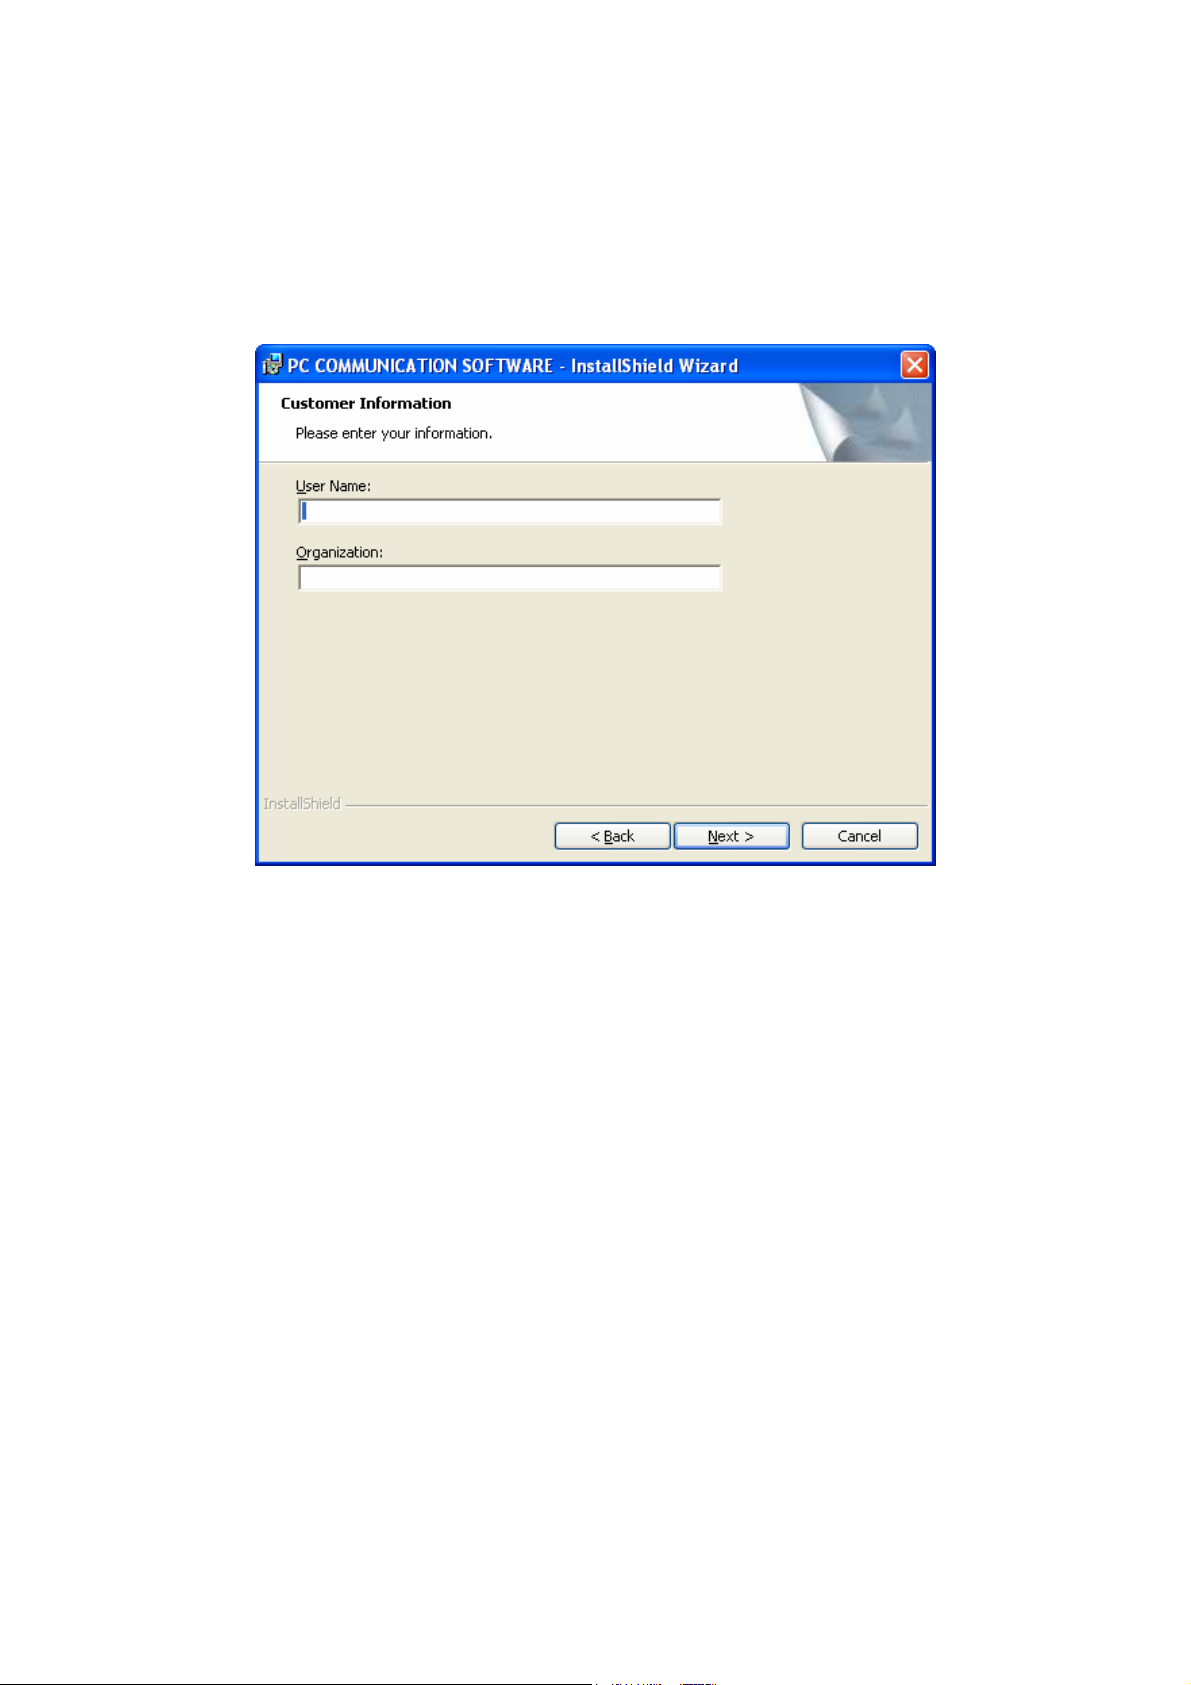
3. You may optionally enter your name & your organization’s name in the next
screen (Figure 3). Click Next to continue.
Figure 3 : Customer information
4. By default, the program will be installed into ‘C:/Program Files/ PC
Communication/Cybercomm6000_620’ folder. Click Next to install the program in
this folder. Optionally, click Change to install into a different folder. (Figure 4)
3
Page 10

Instruction Manual CyberComm 6000
Figure 4 : Destination folder
5. In the next screen, click Install to begin the installation. (Figure 5)
Figure 5 : Ready to begin installation
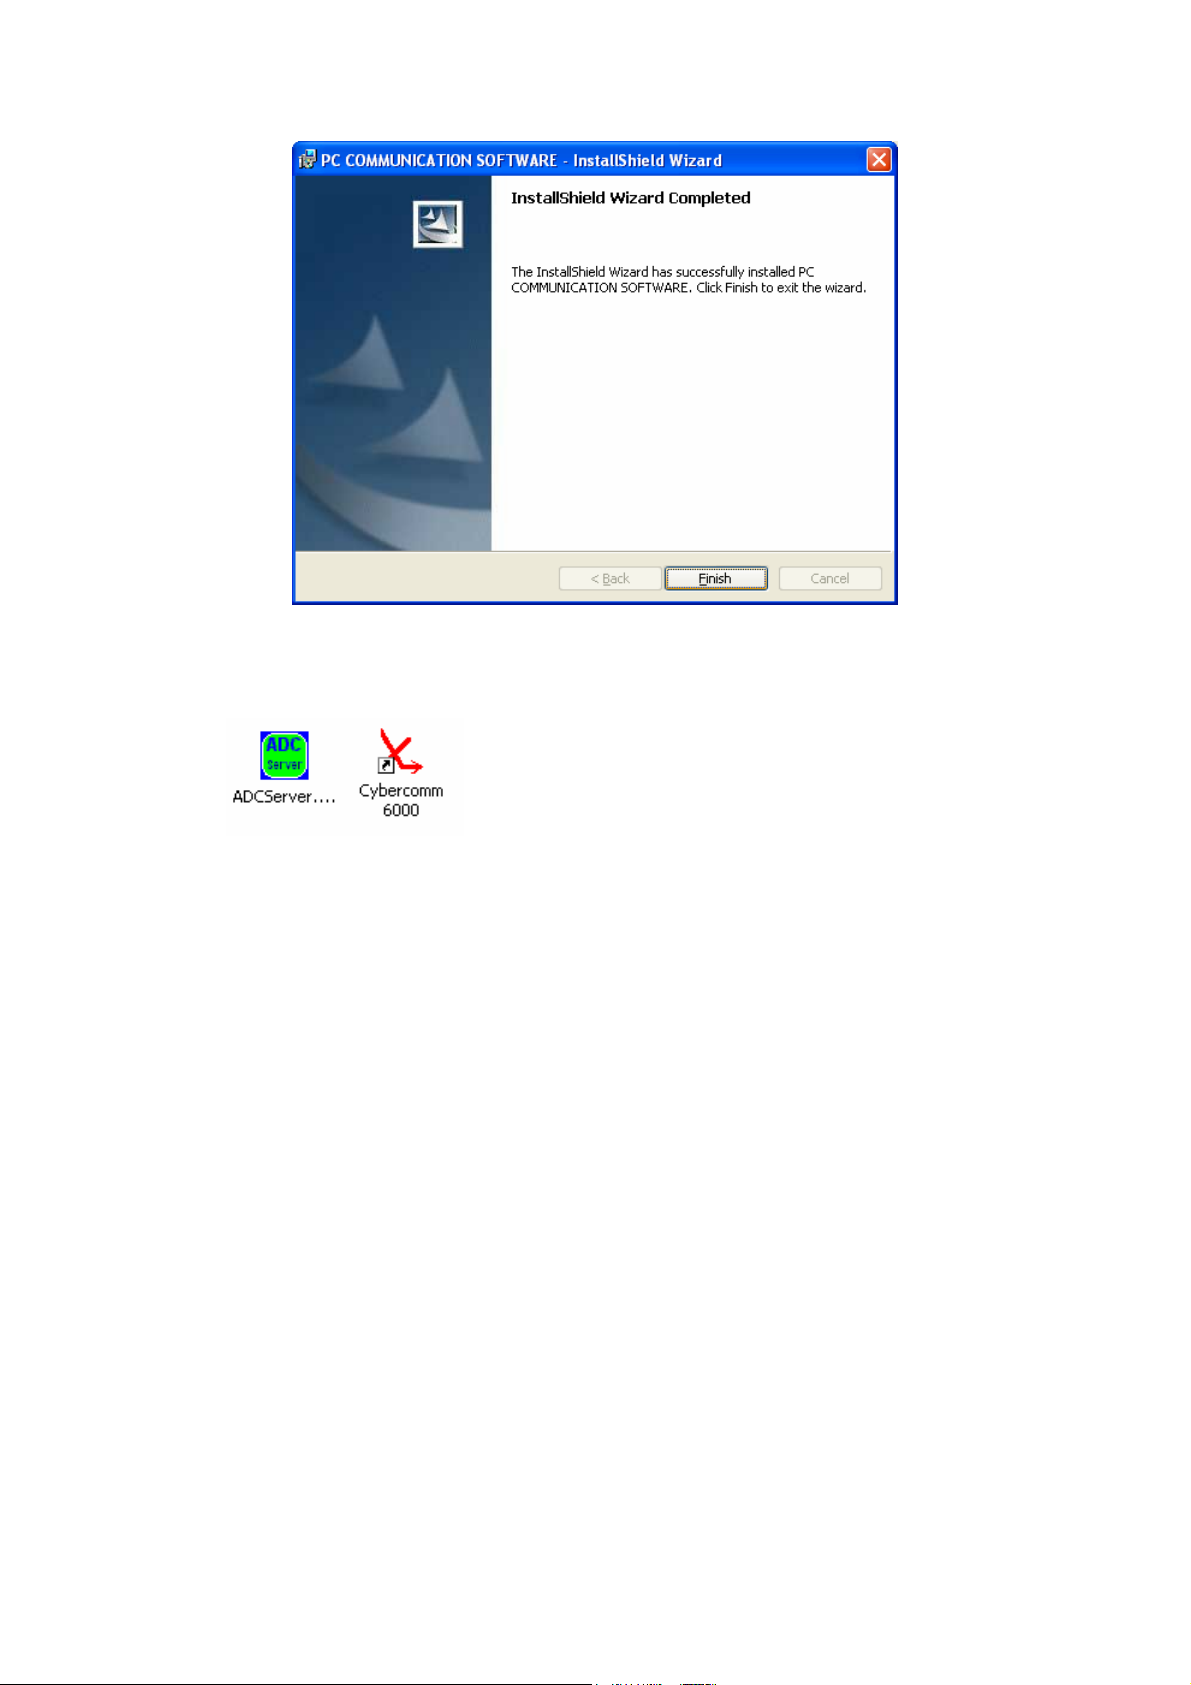
6. Once the installation successfully is completed, the following screen is shown.
(Figure 6). Click Finish to exit the wizard.
4
Page 11
Instruction Manual CyberComm 6000
Figure 6 : Installation completed
7. The following two icons are available in your Desktop after the installation.
5
Page 12

Instruction Manual CyberComm 6000
1.3 Connecting to CyberScan 6000 Series Meter
The Cybercomm 6000 Data Acquisition software is able to communicate with any
CyberScan 6000 series meter (PH6000 / PC6000 / PH6500 / CON6000 / DO6000 /
PC6500 / PCD6500) via RS232 serial port connection.
1.3.1 RS232 Serial Port Connection
1. Connect RS232 serial communication cable to RS232 port of the back panel of
CyberScan 6000 series meter.
2. Connect the other end of the cable to serial communication (COM) port of your
PC. If you use a serial communication port other than COM1, you need to specify
it in CyberComm configuration settings. Refer ‘COM Port Configuration’ in page
16.
1.3.2 Prepare the Meter for Communication
1. Make sure the required pH, DO, Conductivity probes are connected to the back
panel of the CyberScan 6000 series meter. (Refer the instruction manual of the
meter for more details)
2. Power on the meter. The CyberScan application starts automatically.
3. Tap Logoff button to exit form CyberScan application.
Note: The meter cannot be connected to the CyberComm software when
the CyberScan application is running. You need to exit the CyberScan
application before you can start communicating with CyberComm.
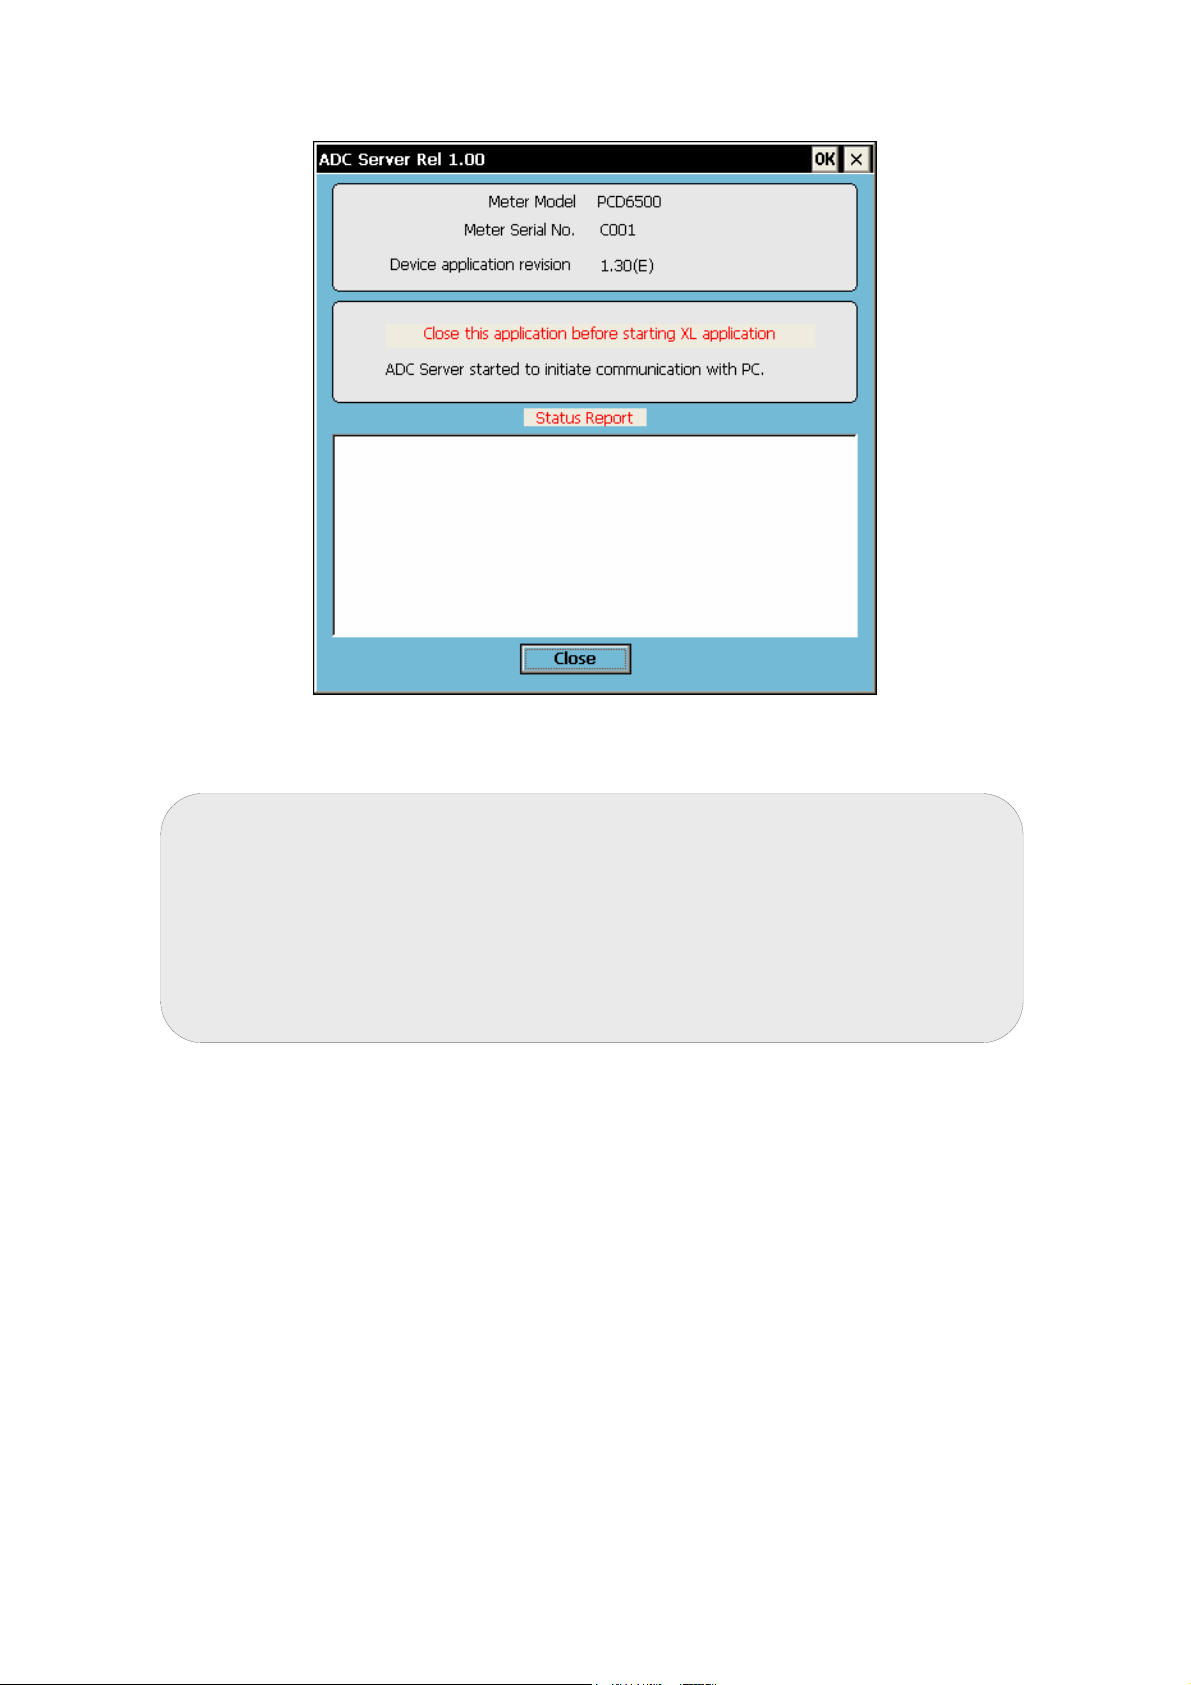
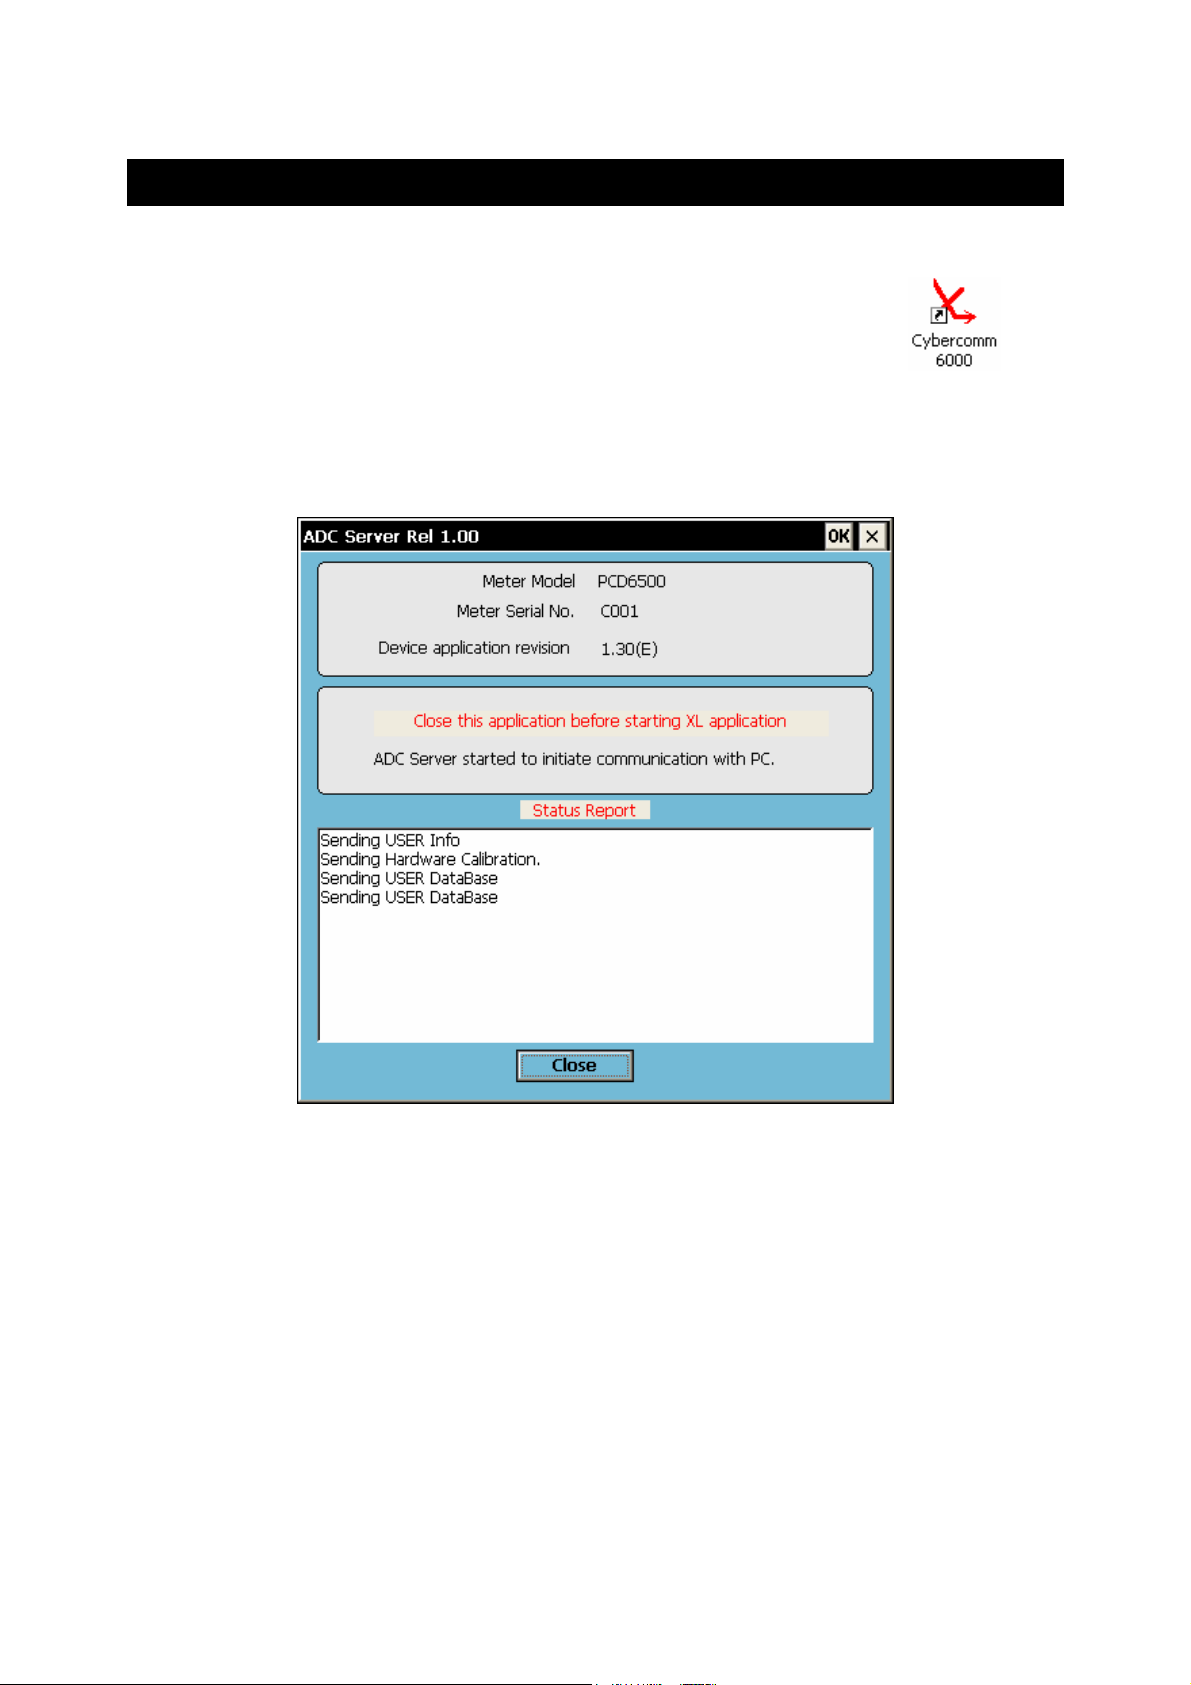
4. Start ADCServer. Double-tap on ‘ADCServer’ icon available in the
Desktop of the meter. The ADC Server application window appears.
(Figure 7)
6
Page 13
Instruction Manual CyberComm 6000
Figure 7 : ADC Server application window
Notes:
• The ADC Server is the communication interface between the meter
and the CyberComm 6000 software. Therefore, you need to run ADC
Server before you can start communicating with the CyberComm
6000.
• Do not close the ADC Server while the meter is communicating with
CyberComm software.
7
Page 14
Instruction Manual CyberComm 6000
1.4 Launching CyberComm
1. Make sure the ADC Server is running in the meter.
2. Double-click on CyberComm 6000 icon on the Desktop of your
PC. The CyberComm splash screen appears for few seconds and
then the application starts.
3. In the meter, the ADC Server recognizes the CyberComm
connection and starts sending user information, hardware calibration & user
database. The communication status information is shown in ADC Server window.
(Figure 8)
Figure 8 : ADC Server sending information
8
Page 15
Instruction Manual CyberComm 6000
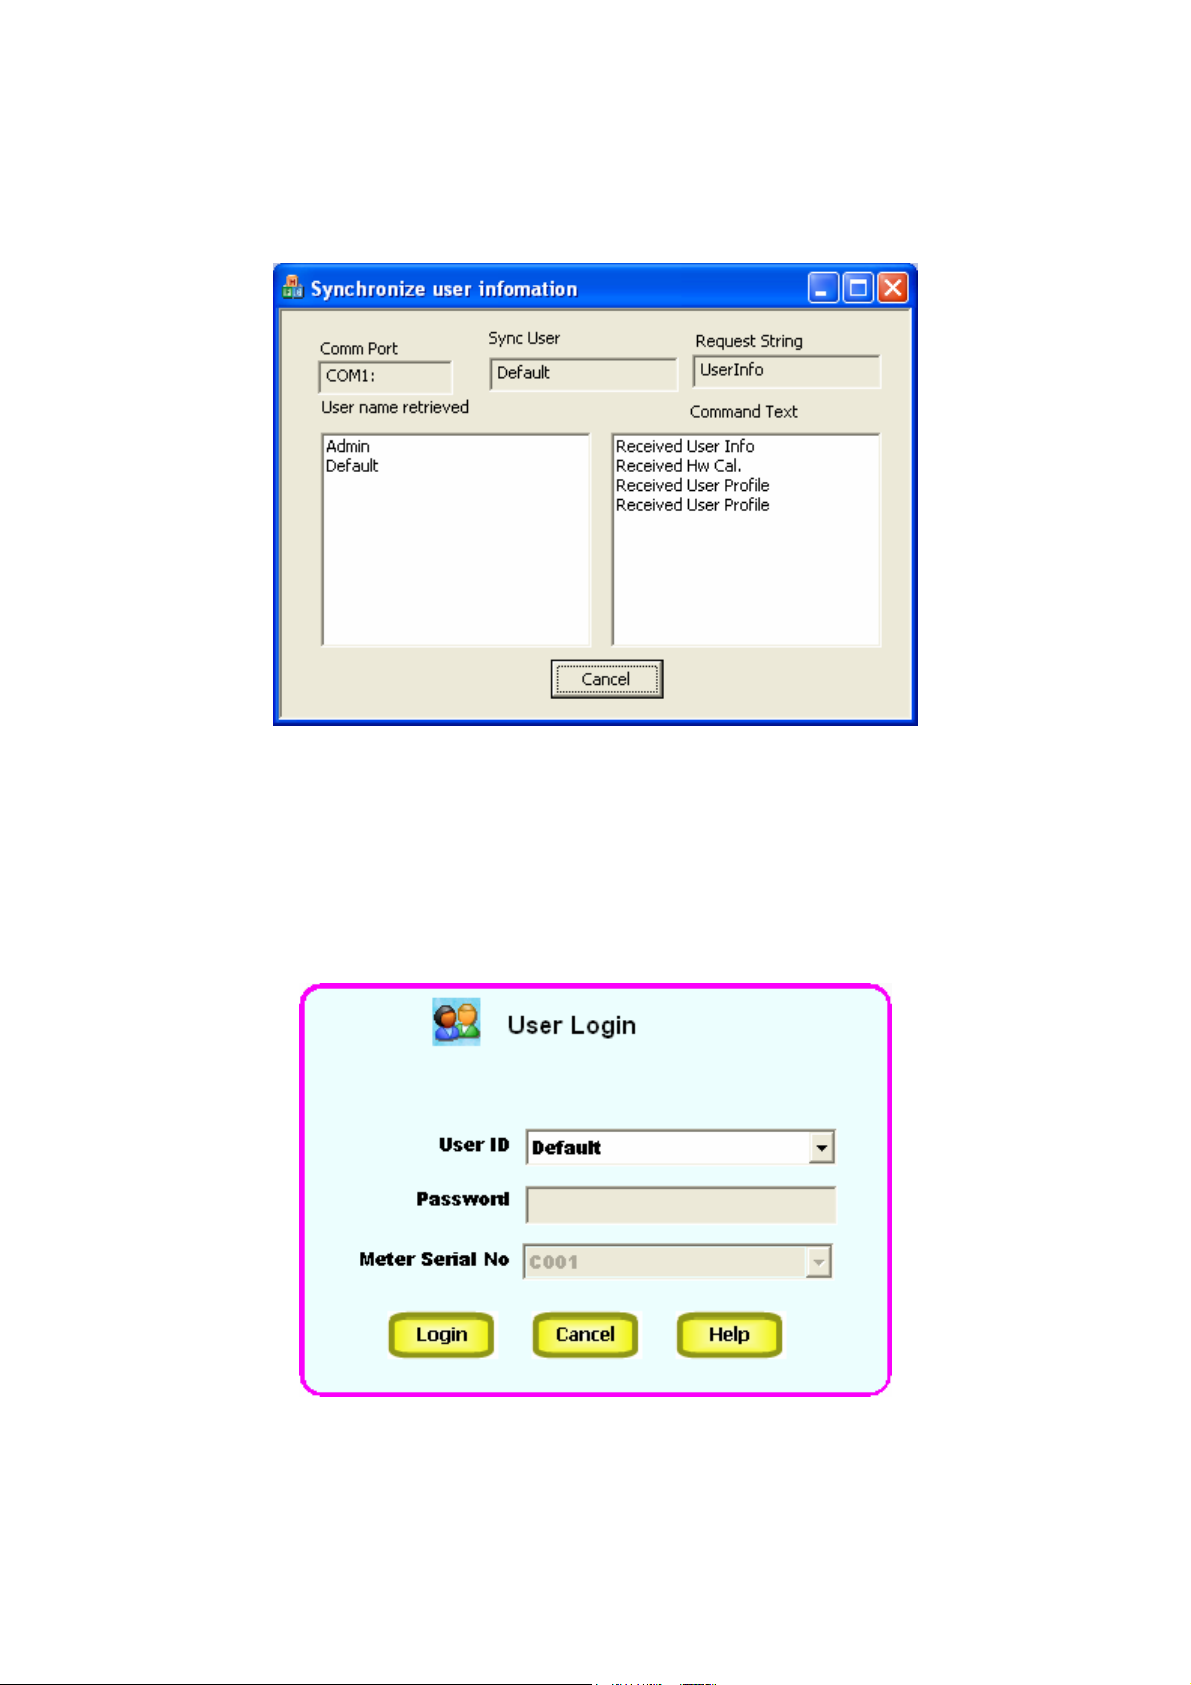
5. CyberComm establishes connection with the meter and synchronizes basic
information (user information, hardware calibration & user databases) with the
meter. (Figure 9)
Figure 9 : CyberComm synchronizes with meter
6. Once the synchronization is completed, the User Login screen appears. (Figure
10) CyberComm accepts all user IDs & passwords configured in the meter. The
user IDs available in the meter are listed in the User ID drop-down box. You can
proceed with the ‘Default’ user or select a specific user ID and enter password.
Click Login button to proceed
Figure 10 : User Login
9
Page 16
Instruction Manual CyberComm 6000
Note: If a user enters an invalid password for a particular user ID for
three consecutive attempts, CyberComm will ‘Lock’ the user profile and
the user will no longer be able to login to the system using that particular
user ID. This is a security feature. Only the ‘Admin’ user is able to unlock
such locked users. Refer ‘Unlocking Users’ in page 56.
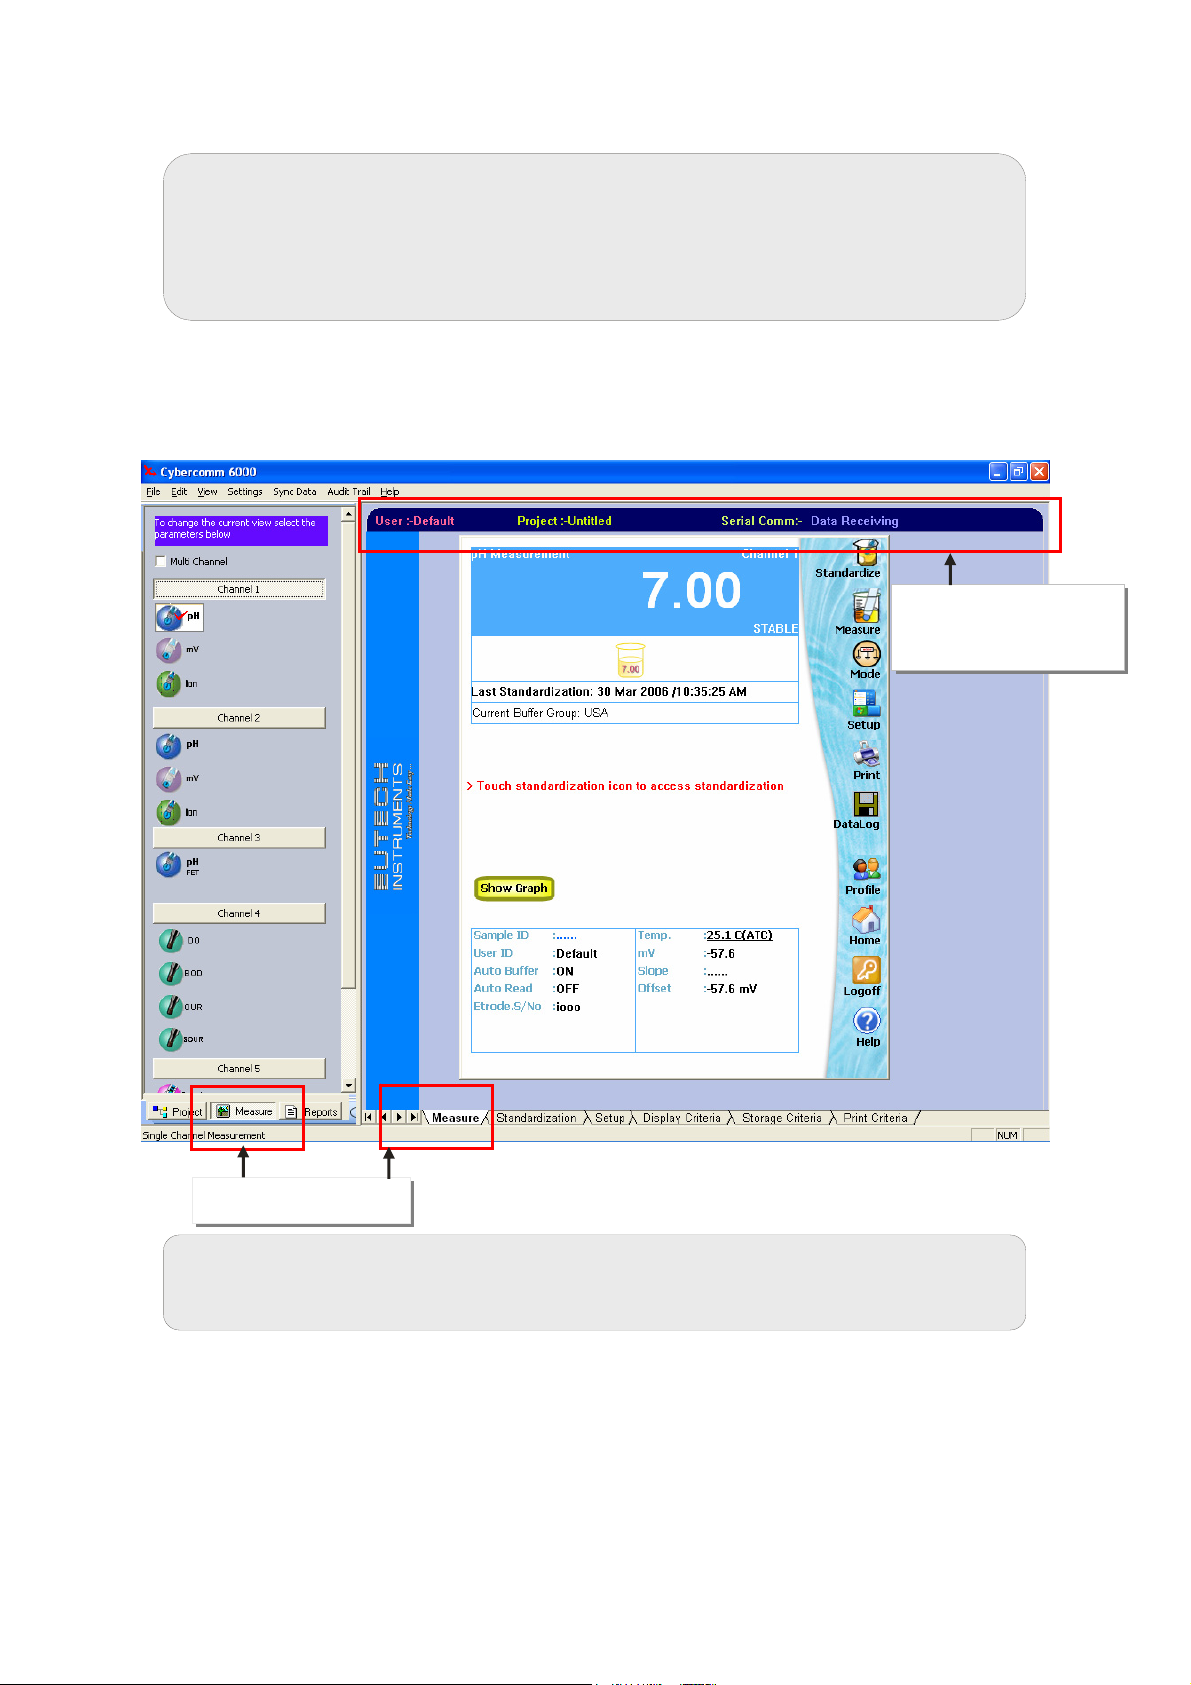
7. CyberComm goes to measurement mode in ‘Untitled’ project for the selected
user. (Figure 11). You are ready to work with the meter. You can proceed with
measurement using the meter.
Current user, project &
communication
information
Figure 11 : Measurement mode
Measurement mode
Note: All the activities you do with CyberComm are bound to your user
ID and project name.
You may perform any of the following activities:
Create a new project (See page 19)
Import setup data from the meter (See page 13)
Import standardization (calibration) data from the meter (See page 13)
Import logged data from the meter (See page 13)
10
Page 17
Instruction Manual CyberComm 6000
1.5 Getting Familiar with CyberComm
1.5.1 Overview
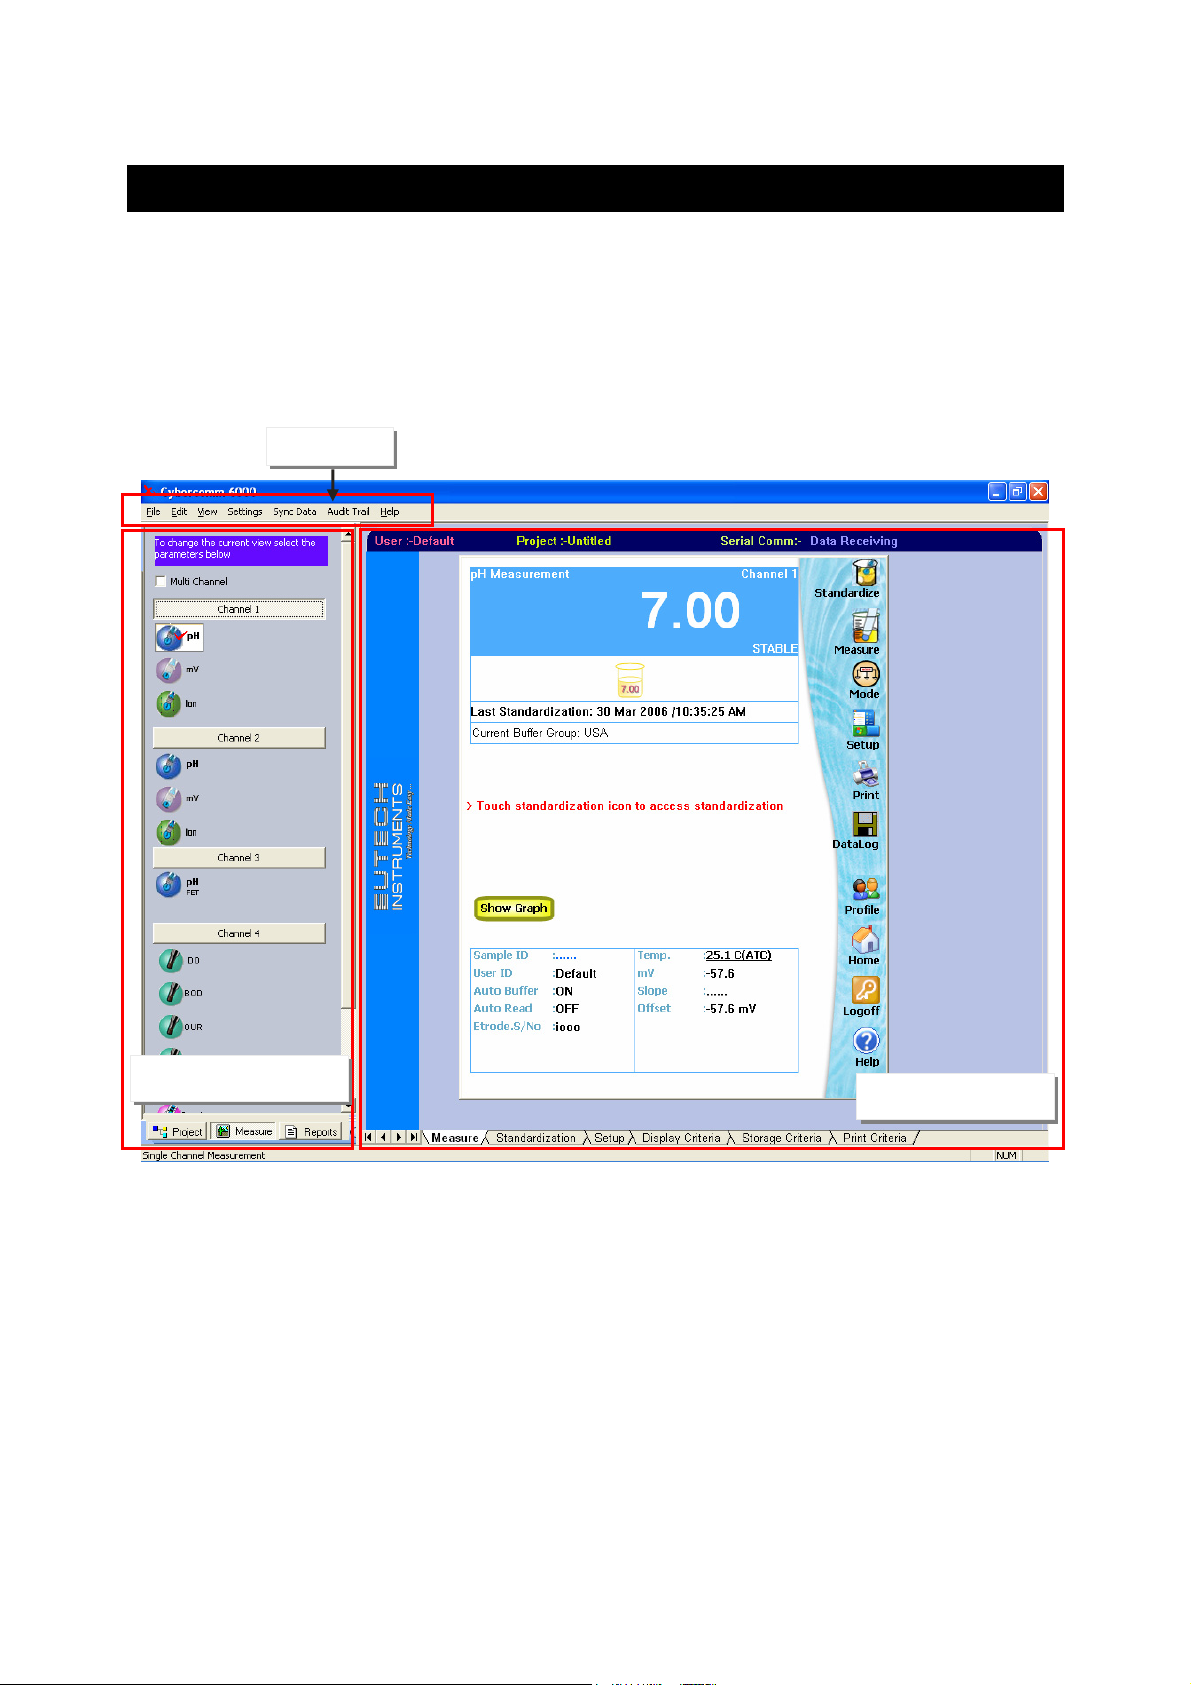
The user interface of CyberComm 6000 has the following main sections.
Menu bar
Control tabs
Workspace
Menu bar
Control tabs
Figure 12 : Menu bar, Control tabs & Workspace
1.5.2 Menu bar
Menu bar has menus and sub-menus to perform common tasks
1.5.3 Control tabs
Control tabs consist of three tabs:
Project: Project related activities are carried out in this tab. Read more about
projects (page 19)
Measure: Meter related activities are carried out in this tab. You can select
multiple channels and measuring parameters form the left-pane. The rightpane (workspace) displays 6 tabs (Measure, Standardization, Setup, Display
11
Workspace
Page 18

Instruction Manual CyberComm 6000
Criteria, Storage Criteria and Print Criteria) for the selected channel (or
channels) and a parameters. The functions and features available in your
CyberScan 6000 series meter are accessible from the measure tab.
Report: This tab provide access to various reports, graphs, view stored data &
printing reports
1.5.4 Workspace
Workspace is the main display and working area of the CyberComm. What is
displayed in workspace depends on the selections in the control tab.
12
Page 19
Instruction Manual CyberComm 6000
1.6 Synchronizing Data
CyberComm 6000 allows you to synchronize data between the PC & the CyberScan
6000 series meter. This involves import (from meter to CyberComm) & export (from
CyberComm to meter)
1.6.1 Data Import
The following data can be transferred from the meter to CyberComm.
User information & hardware calibration (Automatically synchronized each
time the meter is connected to CyberComm)
Setup data
Standardization data
Logged data
User information & hardware calibration data are synchronized automatically each
time the meter is connected to CyberComm. However, setup, standardization &
logged data of the meter have to be synchronized with user intervention as described
below.
To import Device Data:
1. Click on Project button to switch to Project tab.
2. In the menu bar, click Sync Data and then click on any of the following sub
menus :
Import Setup Data
Import STD Data, or
Import Logged Data
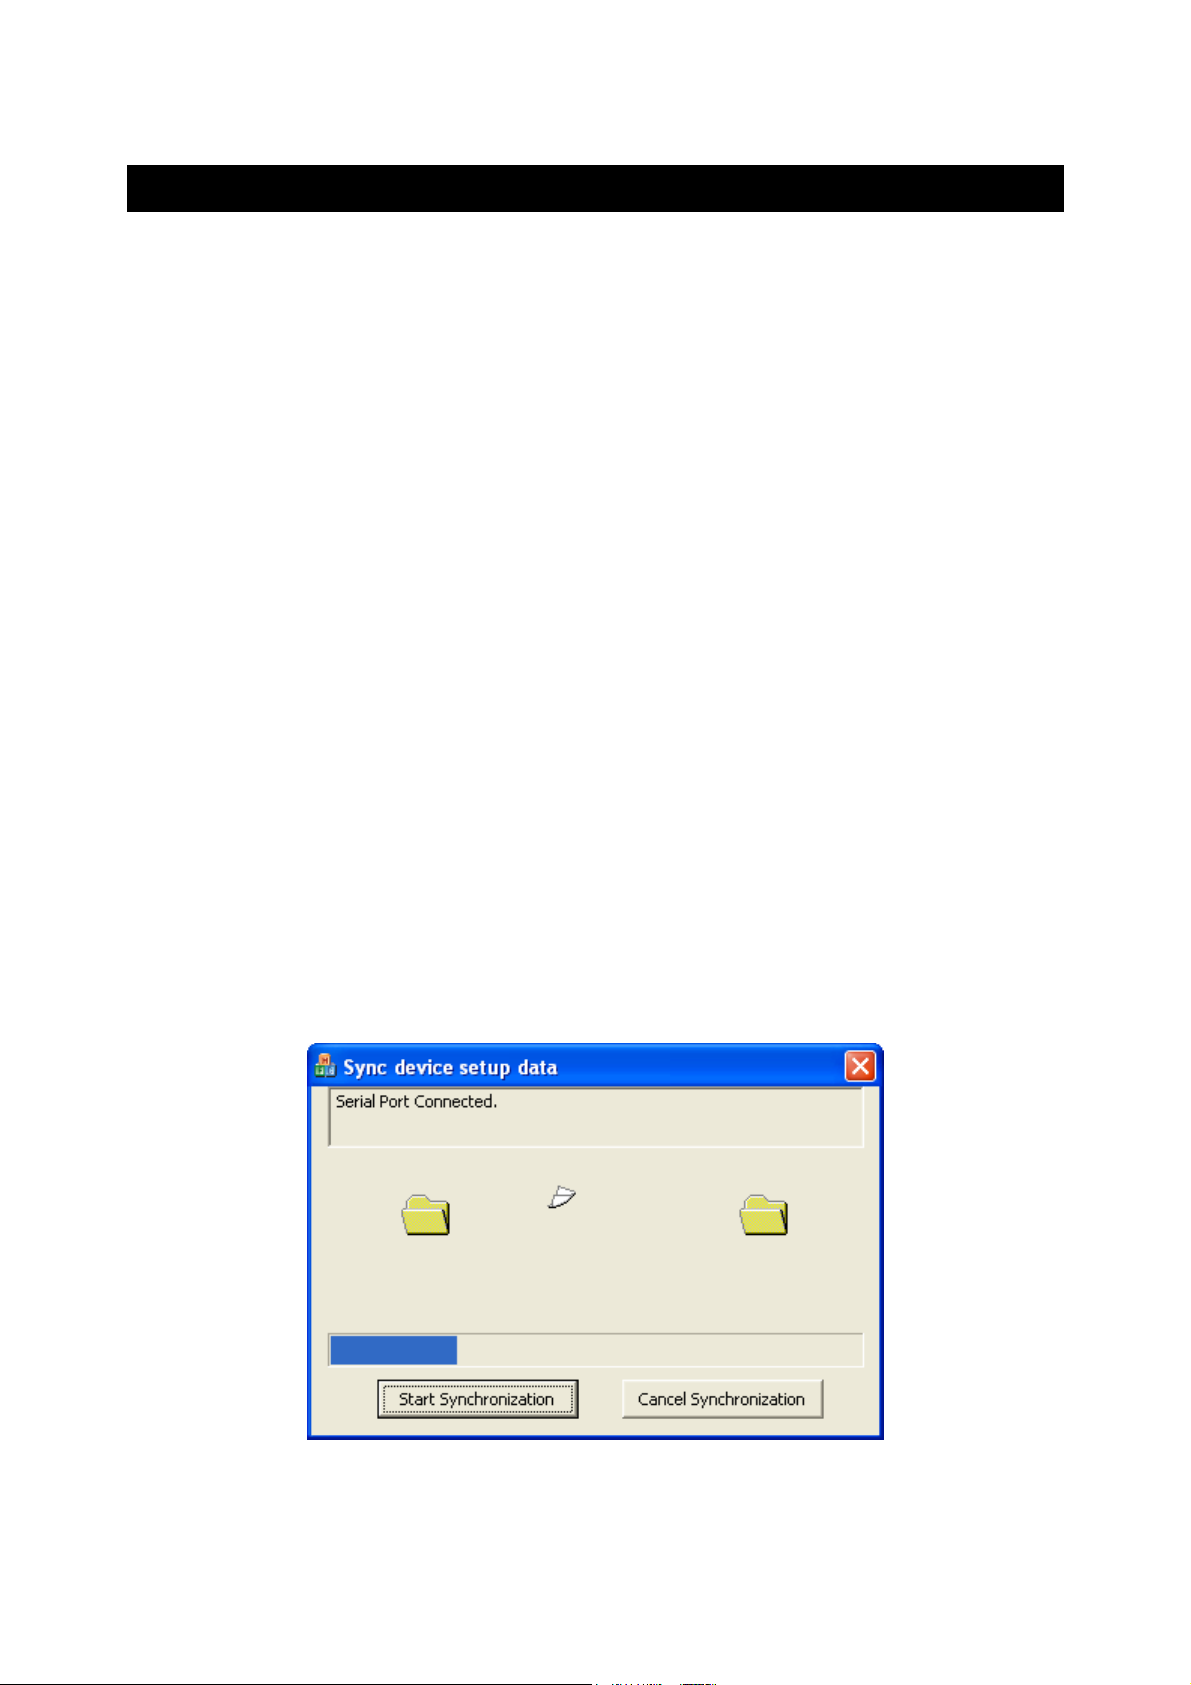
3. Sync Device Data dialog appears (Figure 13). Click Start Synchronization. The
progress bar shows the status of data synchronization.
Figure 13 : Synchronizing device data
13
Page 20
Instruction Manual CyberComm 6000
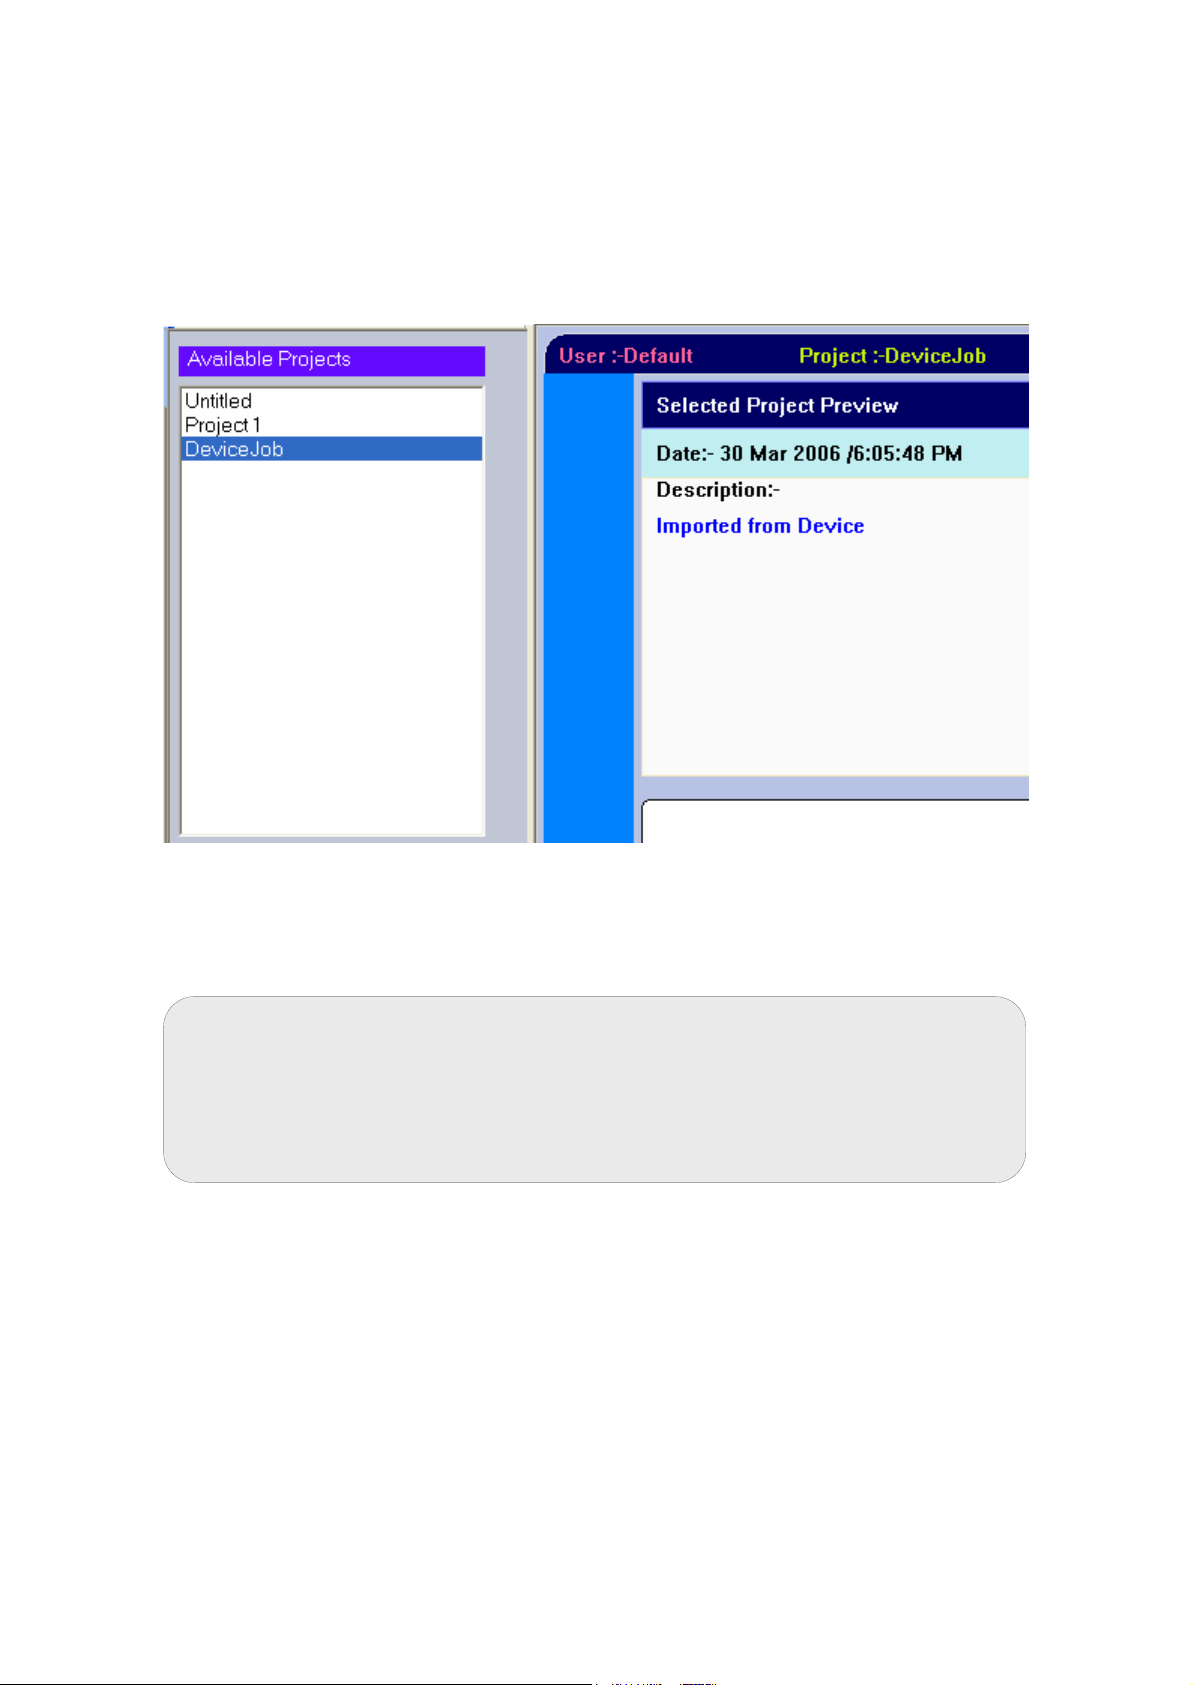
4. When the synchronization (import) is completed, system creates a new project
named ‘DeviceJob’ and attaches the imported device data to that project. (Figure
14). If there is ‘DeviceJob’ already available in the project list, then the imported
data is automatically copied to it.
Figure 14 : DeviceJob
5. Repeat step 2 & 3 selecting rest of the two sub menus to import all the device
data.
Note: The imported standardization data is available for other projects
you may create for the same CyberScan meter. Other users who use the
same CyberScan meter can access the standardization data you
imported from the meter. Thus, users do not need to calibrate the meter
for each project they create.
14
Page 21
Instruction Manual CyberComm 6000
1.6.2 Data Export
The following data can be transferred from CyberComm to the meter.
Setup data
Standardization data
When you export setup and standardization data, only the data of the current project
is transferred to the meter.
To export data:
1. Click on Project button to switch to Project tab.
2. In the menu bar, click Sync Data and then click on any of the following sub
menus :
Export Setup Data, or
Export STD Data
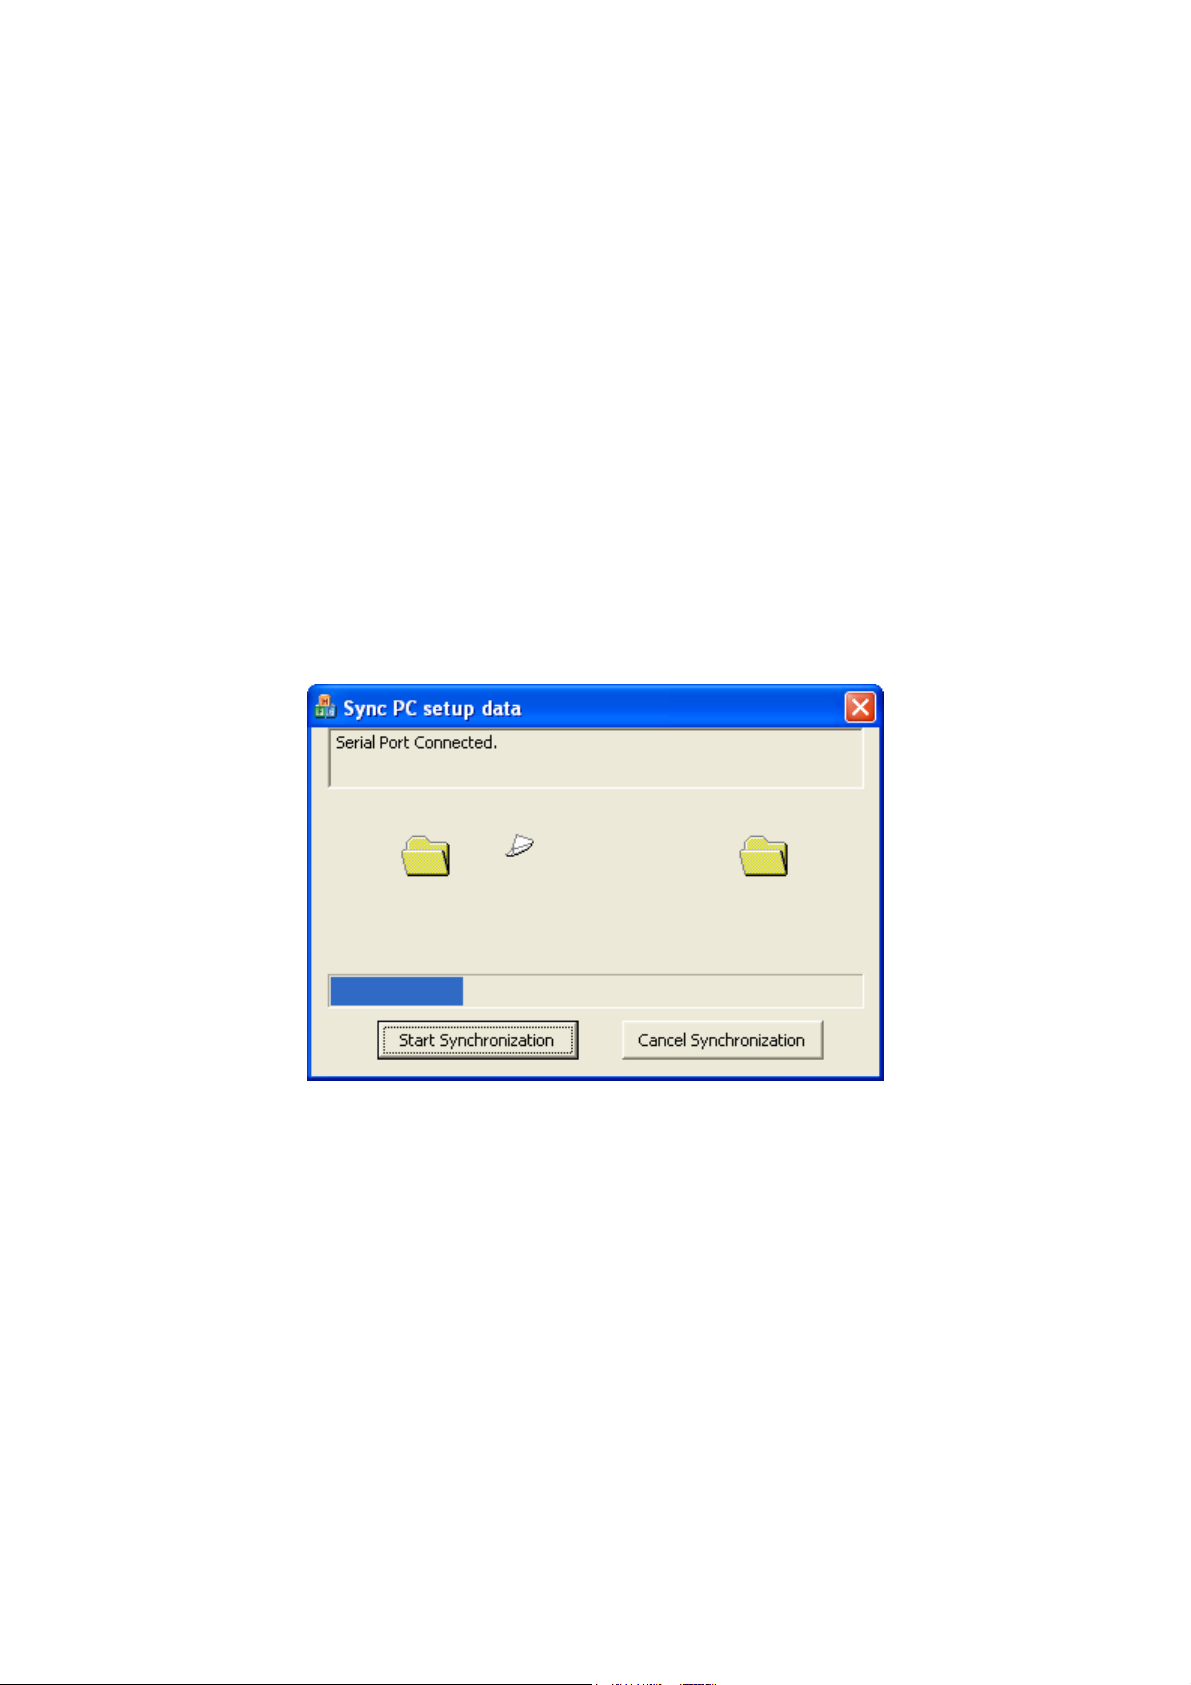
3. Sync Device Data dialog appears (Figure 15). Click Start Synchronization. The
progress bar shows the status of data synchronization.
Figure 15 : Synchronizing CyberComm data
4. When the data export is competed, the dialog box closes automatically and the
selected data (setup or standardization) of the current project copied to the meter,
replacing previously stored data of the meter (if any).
15
Page 22

Instruction Manual CyberComm 6000
1.7 System Settings
1.7.1 Time Stamp
Time stamps are used in audit logs, data logs and standardization records. By default,
CyberComm uses the system date/time of the PC (host computer) for all time stamps.
You can change this setting if you wish to use date/time of the device (CyberScan
meter) for all time stamps of CyberComm.
To change:
1. On the menu bar, click Settings menu and then click System Setting sub menu.
The System Setup dialog appears (Figure 16Figure 50).
2. In Time stamp source group, select the required option.
Figure 16 : System Setup
1.7.2 COM Port Configuration
CyberComm communicates with CyberScan meter through serial communication port
of the PC. By default, CyberComm tries to connect to COM1 port at a baud rate of
115200 bits per second. If you connect CyberScan meter to your PC using a
communication port other than COM1, CyberComm fails to communicate with the
meter. To rectify this, you need to specify the correct COM port in CyberComm.
To change COM port configuration:
1. On the menu bar, click Settings menu and then click COM Port configuration
sub menu. The following dialog appears. (Figure 17). Selected COM port and
baud rate are shown in the dialog box.
16
Page 23

Instruction Manual CyberComm 6000
(a) (b)
Figure 17 : COM Port Configuration
If CyberComm is already connected to the selected COM port, the ‘COM Port
Status’ field shows ‘COM Port is OK’ and the two drop-down boxes are readonly. [Figure 17 (a)]. To change COM port configuration, click Disconnect
button.
If the CyberComm is not connected to the selected COM port, the ‘COM Port
Status’ field shows ‘COM Port Failed’. [Figure 17 (b)]
2. Select the correct COM port from the COM Port drop-down box.
3. Click Connect button to connect to the selected COM port.
Note: If you are using a USB-to-Serial conversion cable to connect the
meter to USB port of the PC, you may need to check the Device
Manager of your PC to see what the exact port number is.
Right-click on My Computer icon. Click on Properties pop-up menu to
open System Properties. Click Hardware tab and then click Device
Manager. See the applicable COM port name under ‘Ports (COM & LPT)
as shown in Figure 18.
17
Page 24

Instruction Manual CyberComm 6000
Figure 18 : Device Manger
18
Page 25

Instruction Manual CyberComm 6000
r
2. Projects
2.1 Overview
CyberComm 6000 is a project based application. What ever activities you do with
CyberComm is bound to a project. When CyberComm starts working with a
CyberScan meter for the first time, it begins with a default project called ‘Untitled’.
You can proceed with the ‘Untitled’ project or you can create new projects of your
own. Figure 19 shows relationship between a CyberScan meter, user profile &
projects.
CyberScan 6000 Series Mete
(With unique Serial Number)
User 1
Project A
Setup data
Standardization Date
Reports
Stored Data
User 2 User 3 User N
Project B
Setup data
Standardization Date
Reports
Stored Data
Figure 19 : Meter-User-Project hierarchy
Project C
Setup data
Standardization Date
Reports
Stored Data
Setup data
Standardization Date
Reports
Stored Data
Project Z
A particular CyberScan meter can have multiple users working with it. Each user can
have his-own projects. Each project has a separate database to store its setup,
standardization, reports and stored data which cannot be accessed by other uses.
Notes:
• Users have access to standardization (calibration) information of
other users of the same meter. This allows sharing the same
meter with multiple users without having to calibrate individually.
• Also, a particular user can share standardization data between his
own projects
DeviceJob
DeviceJob is a special project created by the system when you import device data
from the meter.
19
Page 26

Instruction Manual CyberComm 6000
2.2 Adding a New Project
To add a new project:
1. Click button to switch to
Project control tab. The available
projects and project related buttons are
displayed in the Project tab (Figure 20)
2. Click Add New Project. New project
dialog box appears.
3. Specify Project Name of your choice
(mandatory) & Description (optional).
System automatically adds the system
date/time and your user ID. (Figure 21)
4. Click OK.
5. The new project is added to Available
Projects list.
Figure 20 : Project Tab
Figure 21 : Adding a New Project
20
Page 27

Instruction Manual CyberComm 6000
2.3 Loading a Project
When you select an existing project from the Available Projects list, the upper area
of the workspace shows the Project Preview which includes project description and
date created. However, the project data are not loaded to the workspace. Before you
can work with a project, you need to load it to the workspace.
To load a project:
1. Select the project from the Available Projects list.
2. Click Load Selected Project. The project details are loaded into the lower area of
the workspace. The title bar shows the name of the loaded project (Figure 22)
Figure 22: Title bar
2.4 Editing a Project
System allows you to edit the description of the project as long as it is not loaded into
workspace.
To edit a project:
1. Make sure the project is not currently loaded in the workspace.
Hint: If the project you wish to edit is currently loaded in the workspace, load
another project.
2. Click Edit Project. Project properties dialog box appears. Only the description
field is editable. Edit the description.
3. Click OK.
2.5 Deleting a Project
System allows you to delete a project as long as it is not loaded into workspace.
To delete a project:
1. Make sure the project is not currently loaded in the workspace.
Hint: If the project you wish to edit is currently loaded in the workspace, load
another project.
2. Click Delete Project. System shows a confirmation message.
3. Click Yes. The Project is permanently deleted.
21
Page 28

Instruction Manual CyberComm 6000
22
Page 29

Instruction Manual CyberComm 6000
3. Standardization
3.1 About Standardization
It is recommended that you standardize CyberComm before you make any
measurements. CyberComm provides you flexibility in Standardization. You can
either perform a fresh standardization or import existing standardization data from the
CyberScan meter or re-use standardization data of other users who have already
performed standardization in the CyberComm. At any time, you can switch your
standardization without losing the previous standardization data.
In CyberComm, standardization is available when you are in single-channel mode.
Note: If you wish to use existing standardization data of the meter, you
need to import standardization data from the meter. You will see
‘DeviceJob’ under Projects tab once you synchronized data. See page
12 for more details on importing standardization data.
Available options in standardization:
Select existing standardization data of the meter and proceed with
measurement
Select existing standardization data of CyberComm and proceed with
measurement
New standardization using an existing electrode
Temperature standardization
Additional options:
Add a new electrode to the project
Remove an existing electrode from the project
Clear standardization from an electrode
Compare electrode characteristics
23
Page 30

Instruction Manual CyberComm 6000
3.2 Select existing standardization data of the meter for
measurement
Follow the steps below, if you wish to use standardization data, available in the
CyberScan meter. Note that you need to synchronize standardization data of the
meter or any other user has already synchronized standardization data with the meter,
before you can use the data. See page 13 for more details on importing
standardization data.
To begin:
1. Make sure Multi-channel check box is not selected in the Measure control tab.
2. Select the channel and its parameter that you intend to standardize.
3. Click Setup tab and set appropriate standardization options.
For pH standardization, click on Setup tab and select the Buffer Group.
For conductivity standardization, click on Setup tab and select appropriate
Standard Recognition.
For DO standardization, click on Setup tab and select appropriate
Standardization mode.
4. Click on Standardization tab in the workspace.
5. Electrode Configuration Dialog appears. (Figure 23)
6. in User drop-down box, select :
You user ID: if you have already synchronized standardization data with
the meter and you wish to use that info
Any other user ID: if any other user has already synchronized
standardization data with the meter and you wish to use that info.
7. The Project Name (Job Name) drop-down box lists all the available projects for
the selected user. Select DeviceJob from the list
8. The Electrode Serial No drop-down box lists available electrode list for the
selected project (in this case it is ‘DeviceElectrode’)
9. Select ‘DeviceElectrode’. Existing Standardization grid shows standardization
data for the selected channel, selected parameter, for the selected
standardization buffer/range and for the selected electrode. Depending on the
selected channel/parameter, it also shows related information such as
standardization date, slope, offset, buffer expiry date etc.
Note: If the selected electrode of the project does not have a matching
standardization data for the selected channel/parameter/buffer/range, the
Existing Standardization grid does not show any data.
10. If you wish to use the standardization data shown in the grid for your
measurement, click Load Selected Standardization button.
11. The Electrode Configuration Dialog exists. CyberComm copies the selected
electrode to the current project. The selected standardization data is loaded to the
selected channel/parameter and the CyberComm is ready for measurement using
the selected standardization.
24
Page 31

Instruction Manual CyberComm 6000
Figure 23 : Selecting standardization available in the meter
25
Page 32

Instruction Manual CyberComm 6000
3.3 Select existing standardization data of CyberComm for
measurement
Follow the steps below, if you wish to use standardization data, available in the
CyberComm. This includes standardization done by you previously for the same
meter and for the same channel/parameter or standardization done by other users for
the same meter and same channel/parameter.
To begin:
1. Make sure Multi-channel check box is not selected in the Measure control tab.
2. Select the channel and its parameter that you intend to standardize.
3. Click Setup tab and set appropriate standardization options.
For pH standardization, click on Setup tab and select the Buffer Group.
For conductivity standardization, click on Setup tab and select appropriate
Standard Recognition.
For DO standardization, click on Setup tab and select appropriate
Standardization mode.
4. Click on Standardization tab in the workspace.
5. Electrode Configuration Dialog appears. (Figure 24)
6. in User drop-down box, select :
You user ID: if you have already performed standardization with this
project or any other project and you wish to use that info
Any other user ID: if any other user has already performed
standardization and you wish to use that info.
7. The Project Name (Job Name) drop-down box lists all the available projects for
the selected user. Select required project from the list
8. The Electrode Serial No drop-down box lists available electrode list for the
selected project.
9. Select required electrode’. Existing Standardization grid shows standardization
data for the selected channel, selected parameter, for the selected
standardization buffer/range and for the selected electrode. Depending on the
selected channel/parameter, it also shows related information such as
standardization date, slope, offset, buffer expiry date etc.
Note: If the selected electrode of the project does not have a matching
standardization data for the selected channel/parameter/buffer/range, the
Existing Standardization grid does not show any data.
10. If you wish to use the standardization data shown in the grid for your
measurement, click Load Selected Standardization button.
11. The Electrode Configuration Dialog exists. If you have selected standardization
data from another project, CyberComm copies the selected electrode to the
current project. The selected standardization data is loaded to the selected
channel/parameter and the CyberComm is ready for measurement using the
selected standardization.
26
Page 33

Instruction Manual CyberComm 6000
Figure 24 : Selecting existing standardization available in CyberComm
27
Page 34

Instruction Manual CyberComm 6000
3.4 New Standardization using an existing electrode
Follow the steps below, if you wish to perform a fresh standardization using an
existing electrode. It is assumed that the electrode data has been already added to
CyberComm.
Prepare you standard buffer solutions in beakers. Make sure the electrode is
attached to the meter and it is ready for standardization.
To begin:
1. Make sure Multi-channel check box is not selected in the Measure control tab.
2. Select the channel and its parameter that you intend to standardize.
3. Click Setup tab and set appropriate standardization options.
For pH standardization, click on Setup tab and select the Buffer Group.
For conductivity standardization, click on Setup tab and select appropriate
Standard Recognition.
For DO standardization, click on Setup tab and select appropriate
Standardization mode.
4. Click on Standardization tab in the workspace.
5. Electrode Configuration Dialog appears. (Figure 25)
6. Make sure your user name and your current project name are selected in User &
Project Name (Job Name) drop-down box.
7. From Electrode Serial No drop-down box lists select the electrode you wish to
use for standardization. (Existing Standardization grid shows standardization
data for the selected channel, selected parameter, for the selected
standardization buffer/range and for the selected electrode)
Note: If the selected electrode of the project does not have a matching
standardization data for the selected channel/parameter/buffer/range, the
Existing Standardization grid does not show any data.
Notes:
• You need to add buffer information to the system before you can use
a new buffer for the standardization.
• You can add only one buffer at a time. Once standardization is
completed, you need to come back to this screen if you wish to add a
second buffer.
8. To add a new buffer, click Add New Buffer button. Calibration standard
solution info screen appears. (Figure 26)
9. Enter Batch No. & Expiry Date of the buffer solution. This info will be used for
identification purposes.
28
Page 35

Instruction Manual CyberComm 6000
Note: Optionally, you may select an existing batch number from the list,
if you wish to re-use an exiting buffer.
10. Click OK to confirm the details of the new buffer. The added information is
displayed in the lower grid until you proceed with standardization.
11. To proceed with standardization for the selected electrode using the new buffer,
click OK button.
Figure 25 : New standardization using an existing electrode
29
Page 36

Instruction Manual CyberComm 6000
Figure 26 : Adding a new buffer
12. The Electrode Configuration Dialog closes. Standardization process begins for
the selected channel/electrode using the selected buffer. (Figure 27)
13. If you wish to abort the standardization due to any reason, click Cancel. To
confirm the standardization, click Confirm.
14. Once you confirm, you may proceed with standardization with another buffer by
clicking on Standardization tab or proceed with measurement by clicking
Measure tab.
30
Page 37

Instruction Manual CyberComm 6000
Figure 27 : Standardization in progress
31
Page 38

Instruction Manual CyberComm 6000
3.5 Add a new electrode to the project
You need to add electrode serial number into CyberComm before you can perform a
standardization using that electrode. The serial number uniquely identifies the
electrode. CyberComm does not allow duplicating electrode serial number.
To add a new electrode:
1. Make sure Multi-channel check box is not selected in the Measure control tab.
2. Select the channel and its parameter.
3. Click on Standardization tab in the workspace.
4. Electrode Configuration Dialog appears.
5. Click Add new electrode button. A dialog box appears (Figure 28)
6. Enter serial number of the new electrode. Click OK.
7. The newly added electrode serial number appears in the Electrode Serial No list.
Standardization data is empty for this electrode as no standardization is done yet.
You may select this electrode and perform standardization at any time.
Figure 28 : Adding a new electrode
32
Page 39

Instruction Manual CyberComm 6000
3.6 Remove an existing electrode from the project
You can delete an existing electrode from CyberComm if you are no longer using it.
The electrode and its standardization data is permanently removed from CyberComm.
To delete an existing electrode:
1. Make sure Multi-channel check box is not selected in the Measure control tab.
2. Select the channel and its parameter
3. Click on Standardization tab in the workspace.
4. Electrode Configuration Dialog appears.
5. From Electrode Serial No list, select the electrode you intend to delete.
6. Click Delete Electrode button. CyberComm shows a warning message.
7. Click OK to confirm. The electrode and its standardization data is permanently
removed from CyberComm. Standardization selected for measurement of the
current channel/parameter is also removed. You need to select standardization for
the current channel/parameter.
3.7 Clear standardization from an electrode
CyberComm allows you to remove an existing standardization data from an electrode.
This helps you to remove the current standardization from the electrode until you
perform a fresh standardization at a later time.
To clear standardization from an electrode:
1. Make sure Multi-channel check box is not selected in the Measure control tab.
2. Select the channel and its parameter
3. Click on Standardization tab in the workspace.
4. Electrode Configuration Dialog appears.
5. From Electrode Serial No list, select the electrode for which you intend to clear
standardization.
6. Click Clear Standardization button. CyberComm shows a warning message.
7. Click OK to confirm. The standardization data is permanently removed from the
electrode. Standardization selected for measurement of the current
channel/parameter is also removed. You need to select standardization for the
current channel/parameter.
33
Page 40

Instruction Manual CyberComm 6000
3.8 Compare Electrode Characteristics
CyberComm allows you to graphically compare pH electrode characteristics. You
need to add electrode serial number and perform standardization for each electrode
before you can compare them.
To compare electrodes:
1. Make sure Multi-channel check box is not selected in the Measure control tab.
2. Select the channel and its parameter
3. Click on Standardization tab in the workspace.
4. Electrode Configuration Dialog appears.
5. Click Compare Electrode button. The Electrode Comparison Graph screen
appears. (Figure 29) The graph shows electrode output characteristics against pH
values for each pH electrode in your project. Calibrated points are marked with
special symbols along the graph. The legend shows the serial number of each pH
electrode and corresponding symbols used in the graph to identify them.
Figure 29 : Electrode Comparison
6. You can select/unselect electrode form the graph. Click Select/Unselect button.
Electrode Selection Dialog appears. (Figure 30)
34
Page 41

Instruction Manual CyberComm 6000
7. A check box is available against each electrode serial number. Check to select or
uncheck to deselect electrode for graph. Click OK to conform your selection.
Figure 30 : Electrode selection for graph
Note: You can compare pH electrodes available in other projects with
the electrodes of your current project. You need to add them to your
current project before you can compare them.
35
Page 42

Instruction Manual CyberComm 6000
3.9 Temperature Standardization
CyberComm allows you to specify standardization temperature if you wish to perform
standardization at a specific temperature other than the temperature reading shown
by the meter.
To specify standardization temperature:
1. Make sure Multi-channel check box is not selected in the Measure control tab.
2. Select the channel and its parameter
3. Click on Standardization tab in the workspace.
4. Electrode Configuration Dialog appears.
5. Click Temperature Standardization button. A dialog box appears. (Figure 31)
6. Enter the temperature that you wish to perform standardization for the selected
channel/parameter.
7. Click OK to confirm. You can proceed with standardizing the selected
channel/parameter.
Note: You can reset the standardization temperature back to the actual
reading of the meter. Click Standardization Temperature button and
then click Reset.
Figure 31 : Standardization Temperature
36
Page 43

Instruction Manual CyberComm 6000
4. Measurements
4.1 About Measurement
CyberComm lets you carry out measurements just as if you were using your
CyberScan meter by providing the same look and feel screens & buttons. In addition,
CyberComm enables you to quickly access and switch between single-channel,
multi-channel, standardization, setup, display criteria, storage criteria and print criteria
screens.
With CyberComm, you can keep records of multiple electrodes & standardization and
switch between them whenever you need.
It is important to standardize the CyberScan meter/electrode or import existing
standardization data from the meter, before you start making any measurement.
4.2 Measure Tab
In Measure tab, you do your measurements, calibrations (standardizations), setting
up channel parameters, configure display, storage & print criteria.
Click to switch to Measure control tab.
The measure tab lets you:
Select between single-channel & multi-channel
Select channels and their measuring parameters
4.2.1 Selecting a Single Channel
You can view single channel measurement screen, configure a single channel, setup
display, storage & print criteria of a single channel by just selecting the channel and
its parameter from the Measure tab.
To select a single channel:
1. Make sure that the Multi Channel check box is not selected in the Measure
control tab.
2. Click on the channel button you want to select. (Click on the channel button again
if you wish to unselect.)
Example:
3. Click on the parameter icon of which you wish to measure/standardize/setup.
Example:
37
Page 44

Instruction Manual CyberComm 6000
4. The right-pane (workspace) displays the measuring screen of the selected
parameter of the channel. (Figure 32). This screen is the same as the
measurement screen of CyberScan meter.
5. Click any of the tabs shown in the bottom of the workspace to switch to other
screens (such as standardization, setup etc) of the selected parameter. (Figure
33).
Figure 32 : Single channel measurement screen
Figure 33 : Channel related tabs
38
Page 45

Instruction Manual CyberComm 6000
You may perform any of the following activities for the selected channel/parameter:
Carry out measurements
Take a snap shot of a graph (Refer page 43)
Perform a fresh standardization or switch to a different standardization
Setup channel/parameter (Refer CyberScan instruction manual)
Configure display criteria (Refer CyberScan instruction manual)
Configure storage criteria (Refer CyberScan instruction manual)
Configure print criteria (Refer CyberScan instruction manual)
4.2.2 Selecting Multiple Channels
You can view multiple channel measurement screens, configure channel/parameter,
setup display, storage & print criteria of multiple channels by just selecting channels
and its parameter from the Measure tab.
To select multiple channels:
1. In the Measure control tab, click on the Multi Channel check box to select it.
2. Click on the first channel you want to select. Click on the channel button again if
you wish to unselect.
Example:
3. Click on the parameter icon of your interest in the selected channel.
Example:
4. Repeat step 2 & 3 for other channels you wish to select.
5. The right-pane (workspace) displays the measuring screen of the selected
parameters of each of the channels. (Figure 34).
6. Click any of the tabs shown in the bottom of the workspace to switch to other
screens of the selected channel/parameters (Figure 33).
Note: Standardization is available only in single-channel mode.
You may perform any of the following activities for the selected channels/parameters:
Carry out measurements
Log measurement data (Refer page 41)
Setup channel/parameter (Refer CyberScan instruction manual)
Configure display criteria (Refer CyberScan instruction manual)
Configure storage criteria (Refer CyberScan instruction manual)
Configure print criteria (Refer CyberScan instruction manual)
39
Page 46

Instruction Manual CyberComm 6000
Figure 34 : Multi-channel measurement screen
40
Page 47

Instruction Manual CyberComm 6000
4.2.3 Refresh Temperature Reading
‘Refresh temperature’ is applicable only for ATC (Automatic Temperature
Compensation).
In some rare situations where you may notice that the temperature reading appears
in CyberComm is not accurate, click Settings menu in the menu bar and click
Refresh Temperature submenu. CyberComm reloads its temperature curve
information and the ATC temperature is refreshed.
Note: ATC mode is enabled when you connect a temperature probe to
the meter. The measurement screen indicates the ATC mode by
displaying ‘(ATC)’ next to the Temperature (‘Temp’) field of the channel
(Figure 34). When there is no temperature probe is connected to the
meter, or the temperature probe is faulty, the measurement screen
indicates ‘(Default)’ next to the temperature field of the channel.
4.2.4 Log measurement data
You can enable logging data of a single or multiple channels. When logging is
enabled, the readings are automatically stored in your PC. CyberComm allows you to
create extensive reports based on this stored data.
To enable data logging (Timed data logging):
7. Select channel & parameter you wish to log, from the Measure control tab.
8. Click on Measure tab in the workspace
9. Click on Sample ID field. A dialog appears (Figure 35)
10. Click Start Data Log button. Click OK to begin data logging.
11. A red square starts blinking next the Sample ID field, indicating the data logging is
in progress.
To disable data logging:
12. Click on Sample ID field.
13. A message appears asking whether you wish to stop data logging. Click OK
button to confirm.
14. A red square (next the Sample ID field) stops blinking, indicating the data logging
is stooped.
41
Page 48

Instruction Manual CyberComm 6000
Figure 35 : Enable data logging
42
Page 49

Instruction Manual CyberComm 6000
4.2.5 Taking a Snap Shot of Graph
In single-channel measurement mode, you can choose to view variations of the
measurement in a graphical manner by clicking on Show Graph button (Figure 36).
The graph plots the variations of the measured parameter continuously. You can take
a ‘snap shot’ of the graph any time and save it for further analysis. These saved snap
graphs can be viewed in Reports control tab.
To take a snap shot:
1. Select channel & parameter, from the Measure control tab.
2. Click on Measure tab in the workspace.
3. Click Show Graph button. The graph starts plotting the variations of the
measured parameter.
4. When you wish to take snap shot of the graph, click Snap Graph button.
CyberComm saves the snap shot with a time stamp and then it shows you a
confirmation message.
5. To view saved snap shots, click Reports control tab and then click View Graph.
Figure 36 : Taking Snap shot of graph
43
Page 50

Instruction Manual CyberComm 6000
5. Reports
5.1 About Reports
CyberComm provides extensive reporting features. This includes creating graphical
charts using stored data, exporting stored data into Microsoft Excel or HTML, View
past readings and current readings on a graph and creating customized
standardization reports.
To access the reports, click tab.
Options available in the Reports tab:
Graphic sheet
View Graph
Stored Data
Excel Sheet
Standardization Report
44
Page 51

Instruction Manual CyberComm 6000
5.2 Graphic Sheet
The Graphic Sheet allows you to create a customized graphical chart (Pie chart or
Histogram) for a set of available data in CyberComm. The chart is created for a
selected parameter (mode) of a channel of your choice. Data selection criteria allow
you to select data by date, range or sequence. You can create as many charts as
you wish, save them and print.
To add a new Graphic Sheet:
1. Go to Reports control tab.
2. Click Add Report. The New Report Object dialog appears. (Figure 37)
3. Select the report type (Pie chart or Histogram) from the Select Report Type dropdown box.
4. From Select Channel drop-down box, select the channel number for which you
wish to create graphical report.
5. From Select Mode drop-down box, select the parameter (mode) for which you
wish to create graphical report.
6. In Interval field, specify data interval for the report.
7. In Title field, specify a title for the graphical report. This will be printed at the top of
the report. (Check any limitation on number of characters?)
Figure 37 : Adding a new Graphic sheet
45
Page 52

Instruction Manual CyberComm 6000
8. In Data Selection options, select your choice of data:
o All: Selects all the available data in CyberComm for the selected
channel/parameter.
o Range: Allows you limit the data selection for a particular data range. If you
select this option you can specify your upper & lower boundaries in Low
Range & High Range fields. (E.g. Select data range between pH1 to
pH14)
o Forward Sequence: Allows you to pick data from the very first sample
logged in CyberComm. In Data Count field, specify how many sample
readings you wish to use in the graph from the very first sample.
o Reverse Sequence: Allows you to pick data from the last sample recorded
in CyberComm. In Data Count field, specify how many sample readings
you wish to use in the graph from last sample backward.
o By Date: Selects available data for a given date range. (Provided that the
data is available for the specified date range for the selected
channel/parameter in the system). In From & To fields, specify the date
range.
9. Click OK to conform your selections. The system generates the graphical report
based on the selections you made. (Figure 38). The new graphical report is added
to Available Reports list. System notifies you if there is no sufficient or matching
data available in the CyberComm for the selected channel/parameter or data
selection criteria.
Figure 38 : Pie Chart & Histogram
10. Select a report name from Available Reports list and click Print button to print.
46
Page 53

Instruction Manual CyberComm 6000
5.3 View Graph
The View Graph is an extension to the ‘Show graph’ feature available in CyberScan
meter for single channel measurement mode. Use this to view graphs (snap graphs)
which have been previously captured at measurement screen or view current
measurement graphs of a selected channel.
To view graph:
1. To see current measurement graph:
Make sure you are in single-channel mode. (Multi-channel check box
should be unchecked)
From Measure tab, select the channel and its parameter you wish to view.
Click Show Graph button in the measurement screen. The graph starts
plotting data.
Note: In order to view the graph of the currently selected channel, you
have to click Show Graph button in the measurement screen.
2. Click on Reports tab.
3. Click View Graph button. The plotted graph is shown. (Figure 39)
47
Page 54

Instruction Manual CyberComm 6000
p
Figure 39 : View Graph
4. Click Zoom In or Zoom Out button to zoom in or out the graph.
5. Click on the graph and drag it horizontally or vertically to pan the graph. Panning
is useful if you wish to see a graph which has been plotted for a long period of
time or covering wide variations of data values.
6. Click Save button, if you wish to save the graph. A dialog appears. (Figure 40)
7. Enter a suitable name and click OK. The graph is saved. The new graph is added
to Available Reports list. You may view graphs in this list by double-clicking on a
name.
Saved Graphs
Saved Sna
Graphs
Figure 40 : Saving a graph
8. The ‘snap shot’ graphs saved from the measurement screen (using Snap Graph
button) are listed in the Available Reports list. You can double-click on a snap
graph to view.
Note: Refer ‘Taking a Snap Shot of Graph’ in page 43 for more details
on snap graphs.
48
Page 55

Instruction Manual CyberComm 6000
5.4 Stored Data
This feature allows you to view data stored in your project. You can view data per
channel/parameter. Additionally, you can delete selected records and export the data
to HTML file.
To view stored data:
1. Go to Reports control tab.
2. Click on Stored Data button.
3. In Available Reports list, click on a channel and double-click on parameter you
wish to view stored data.
4. The workspace shows the stored data in a tabular format.
5. Click Refresh button, if you need to refresh the screen with latest data. This is
useful if automatic data logging is enabled.
To delete a single data record:
1. Select it by clicking on the record
2. Click Delete button
3. System shows you a confirmation message. Click OK to confirm deletion.
To delete all the records:
1. Click Delete All button
2. System shows you a confirmation message. Click OK to confirm deletion.
3. All data stored for the currently selected channel/parameter is permanently
deleted.
To export data into HTML file:
1. Click HTML Export button.
2. File Save As dialog opens. Specify a name. You can save the HTML file in any
location in your PC.
3. Click Save.
To print stored data:
1. Select a channel & parameter of which you wish to print data from Available
Reports list
2. Click Print button to print.
49
Page 56

Instruction Manual CyberComm 6000
5.5 Excel Sheet
CyberComm allows you to export stored data in to a scaled down version of
Microsoft® Excel format. The exported file is saved as .cyc file format and can be
opened from Microsoft® Excel application. Most functions available in Excel such as
formatting, plotting graphs & printing are also applicable for this file format.
Note: Exporting to Excel feature is not available if Microsoft® Excel
application has not been installed in your PC.
To Export to Excel:
1. Go to Reports control tab.
2. Click Excel Sheet button.
3. Click Launch Excel Application button in the workspace. Parameter selection
for Excel View dialog appears.
4. In Parameter selection for Excel View dialog, select the channel & parameter
for which you wish to select stored data.
5. Click OK.
6. The Microsoft® Excel application opens and data is exported to Excel spread
sheet. You may work with the file as you would work with any other excel file
(such as save the file, generate charts or print etc.)
Figure 41 : Exporting to Excel
50
Page 57

Instruction Manual CyberComm 6000
5.6 Standardization (STD) Report
CyberComm allows you to create customized & detailed reports on standardization
data. You can select multiple channels and their parameters to be included in the
report, format data, insert any additional text, insert user information and define the
paper sizes, save & print.
Note: Standardization report is a single page document. You may create
multiple pages and save them as individual reports.
Follow the steps below to create & format a report:
Select standardization data:
The first step is to select standardization data for the report.
1. Go to Reports control tab.
2. Click STD Reports button.
3. Click Select button in the workspace. A dialog box appears. (Figure 42)
Figure 42 : Selecting standardization data
4. Make sure ‘STD Report’ is selected in the Select Report Type drop-down box.
From the tree view on the left-pane, click on channel and parameter to expand the
tree. Double-click on parameter of which you wish to select standardization data.
(For pH, double-click on Buffer group.)
51
Page 58

Instruction Manual CyberComm 6000
5. The right-pane displays standardization data available for the selected
parameter/buffer group. You can unselect any of the standardization data by
clicking on the check box against the data to de-select it.
6. Click OK to add the selected data to the report. The selected standardization
data is added as a block of data. (Figure 43) You may format the look and feel of
this block, if required.
Figure 43 : Standardization data added as a block
7. You may add standardization data of another channel/parameter to the same
report. Click on Select button and make your selection again and click OK. The
newly added set of data is added to report as a separate block.
8. Optionally, you may select a block of data and press Delete keyboard button to
delete a block, if you wish to remove them.
52
Page 59

Instruction Manual CyberComm 6000
Format data:
You may format a block of data to modify its appearance by removing one or more
columns, change font types and colors o r modify column widths.
1. Right-click on block of data which you wish to format. A dialog box appears
(Figure 44)
2. The following formatting options are available:
Click on Column Name check box to unselect it, if you wish to
remove a column from the report.
Change column width of a data column
Click button to change font properties of a particular column
Click Data Font button to change font properties of all the data
columns
Click Header Font button to change font properties of the header
row.
3. Click OK to conform the formatting changes. The formatting is applied to the
selected block of data.
Figure 44 : Formatting data
53
Page 60

Instruction Manual CyberComm 6000
Insert additional text:
You may add any additional text to the report such as a Title, page number or footer
note etc.
1. Click Select button. A dialog box appears (Figure 42).
2. In Select Report Type drop-down box, select ‘Text’ and click OK.
3. A text filed is added to the report. (Figure 45).
Double-click on the text field to edit it.
Right-click on the text field to change its font properties
Drag it to move the text field to any place on the report
Figure 45 : Adding an addition text field
Insert user information:
You may add user related information to the report. This includes user name, project
name, date created and meter serial number.
1. Click Select button. A dialog box appears (Figure 42)
2. In Select Report Type drop-down box, select ‘User Info’ and click OK
3. A user info filed is added to the report. (Figure 46).
You are not allowed to edit the user info
Drag it to move the user info field to any place on the report
Figure 46 : Adding user information
54
Page 61

Instruction Manual CyberComm 6000
Setup paper size:
You may modify the paper size of the report, add a custom paper size, change paper
orientation or modify margin of the report to suit your printing requirements.
1. Click Paper button. A dialog appears. (Figure 47)
2. From Paper drop-down box, select an existing paper size or define a custom
size.
3. Change orientation or margins.
4. Click OK to confirm the changes.
Figure 47 : Setup paper size
Save a report:
Once you customize and format the report, you can save it for future reference or
print it later.
1. Click Save button. A dialog box appears. (Figure 48)
2. Specify a name for the report. Click OK. The new report is added to Available
Reports list.
Figure 48 : Saving STD report
55
Page 62

Instruction Manual CyberComm 6000
Adding a new report:
To add a new page, click New Page button. A blank page appears. You may add
standardization data, format and save.
Printing a report:
Select a report name from Available Reports list and click Print button to print.
56
Page 63

Instruction Manual CyberComm 6000
6. Administrative Functions
CyberComm provides special functions exclusively for administrator. CyberScan
meter is shipped with a default ‘Admin’ user account which has the administrator
privileges. You need to log into CyberComm using the ‘Admin’ user account to
perform the following administrative functions:
View audit log file
Backup audit log file
Delete audit log file
Unlock users
57
Page 64

Instruction Manual CyberComm 6000
6.1 Audit Log
CyberComm maintains an audit log to record all the user activities carried out in
CyberComm application.
6.1.1 View audit log file
1. On the menu bar, click Audit Trial menu and then click View Application log file
sub menu.
2. Audit Trial dialog appears. (Figure 49)
3. By default the entire audit log records are shown. To view logged activities of a
specific time period, select Date From & Date To and click Refresh button.
4. Click Print button to print the audit log file.
Figure 49 : Audit Log
58
Page 65

Instruction Manual CyberComm 6000
6.1.2 Backup audit log file
CyberComm allows you to back up the audit log file in case if you wish to keep a
back up. When backed up the audit logs are exported to a text file.
1. Click Export button. The Save As dialog appears.
2. Select a folder and specify a name for the file.
3. Click Save button. The audit log file is exported to a text file.
6.1.3 Delete audit log file
Deleting the audit log file is not recommended. However, if you wish to delete the
audit log file due to special reasons, it is recommended that you make a backup
before you deleting.
1. Back up the audit log file as described in the above section.
2. Click Delete button. System shows you a confirmation dialog box.
3. Click OK to confirm deleting.
59
Page 66

Instruction Manual CyberComm 6000
6.2 Unlocking Users
If a user enters an invalid password for three consecutive attempts while logging in to
CyberComm application, the user will be ‘locked’ by CyberComm and will not allow
the user to login again. This is a security feature. Only the administrator can unlock
these users.
To unlock a specific locked user:
1. On the menu bar, click Settings menu and then click Unlock User sub menu.
The Unlock User dialog appears (Figure 50).
2. All the ‘locked’ users currently available in the system are listed in the dialog.
Select the user you wish to unlock and then click Unlock.
3. The dialog closes and the selected user is unlocked.
Figure 50 : Unlocking a user
To unlock all locked users:
1. On the menu bar, click Settings menu and then click Unlock all locked user sub
menu.
2. System unlocks all locked users and shows a notification message (Figure 51).
Figure 51 : All users unlocked
60
Page 67

Page 68

For more information on Eutech Instruments’ products, contact your nearest
distributor or visit our website listed below:
Eutech Instruments Pte Ltd.
Blk 55, Ayer Rajah Crescent,
#04-16/24 Singapore 139949
Tel: (65) 6778 6876
Fax: (65) 6773 0836
E-mail: marketing@eutechinst.com
Web-site: www.eutechinst.com
Distributed by:
 Loading...