

Page 1

NanoDrop Micro-UV/Vis Spectrophotometers
NanoDrop One
User Guide
269-309101 Revision B July 2016
Page 2

©2015- 2016 Thermo Fisher Scientific Inc. All rights reserved.
DYMO and LabelWriter are either trademarks or registered trademarks of Newell Rubbermaid in the United
States and/or other countries. Wi-Fi is either a trademark or a registered trademark of Wi-Fi Alliance in the
United States and/or other countries. Bluetooth is either a trademark or a registered trademark of Bluetooth
Special Interest Group. Windows is either a trademark or a registered trademark of Microsoft Corporation in
the United States and/or other countries. All other trademarks are the property of Thermo Fisher Scientific inc.
and its subsidiaries.
For U.S. Technical Support, please contact:
Unity Lab Services
Part of Thermo Fisher Scientific
5225 Verona Road
For International Support, please contact:
Thermo Fisher Scientific
Telephone: +1 608 273 5017
E-mail: support.madison@thermofisher.com
Madison WI 53711-4495 U.S.A.
Telephone: 1 800 532 4752
E-mail: us.techsupport.analyze@thermofisher.com
Thermo Fisher Scientific Inc. provides this document to its customers with a product purchase to use in the
product operation. This document is copyright protected and any reproduction of the whole or any part of this
document is strictly prohibited, except with the written authorization of Thermo Fisher Scientific Inc.
The contents of this document are subject to change without notice. All technical information in this
document is for reference purposes only. System configurations and specifications in this document supersede
all previous information received by the purchaser.
This document is not part of any sales contract between Thermo Fisher Scientific Inc. and a purchaser. This
document shall in no way govern or modify any Terms and Conditions of Sale, which Terms and Conditions of
Sale shall govern all conflicting information between the two documents.
For Research Use Only. This instrument or accessory is not a medical device and is not intended to be used
for the prevention, diagnosis, treatment or cure of disease.
WARNING Avoid an explosion or fire hazard. This instrument or accessory is not
designed for use in an explosive atmosphere.
Page 3

C
Contents
Chapter 1 About the NanoDrop One Spectrophotometer. . . . . . . . . . . . . . . . . . . . . . . . . . . . . .1
Instrument Models and Features . . . . . . . . . . . . . . . . . . . . . . . . . . . . . . . . . . . . . 2
Optional Accessories . . . . . . . . . . . . . . . . . . . . . . . . . . . . . . . . . . . . . . . . . . . . . . 5
Register Your Instrument . . . . . . . . . . . . . . . . . . . . . . . . . . . . . . . . . . . . . . . . . . 6
Update Software . . . . . . . . . . . . . . . . . . . . . . . . . . . . . . . . . . . . . . . . . . . . . . . . . 7
Chapter 2 Applications . . . . . . . . . . . . . . . . . . . . . . . . . . . . . . . . . . . . . . . . . . . . . . . . . . . . . . . . . . .9
Detection Limits for All Applications . . . . . . . . . . . . . . . . . . . . . . . . . . . . . . . . . 9
Measure dsDNA, ssDNA or RNA. . . . . . . . . . . . . . . . . . . . . . . . . . . . . . . . . . . 13
Measure dsDNA, ssDNA or RNA. . . . . . . . . . . . . . . . . . . . . . . . . . . . . . . . . 13
Nucleic Acid Reported Results . . . . . . . . . . . . . . . . . . . . . . . . . . . . . . . . . . . 16
Setting for Nucleic Acid Measurements. . . . . . . . . . . . . . . . . . . . . . . . . . . . . 17
Calculations for Nucleic Acid Measurements. . . . . . . . . . . . . . . . . . . . . . . . . 18
Measure Microarray. . . . . . . . . . . . . . . . . . . . . . . . . . . . . . . . . . . . . . . . . . . . . . 23
Measure Microarray Samples. . . . . . . . . . . . . . . . . . . . . . . . . . . . . . . . . . . . . 23
Microarray Reported Results . . . . . . . . . . . . . . . . . . . . . . . . . . . . . . . . . . . . . 27
Settings for Microarray Measurements. . . . . . . . . . . . . . . . . . . . . . . . . . . . . . 28
Calculations for Microarray Measurements . . . . . . . . . . . . . . . . . . . . . . . . . . 32
Measure using a Custom Factor. . . . . . . . . . . . . . . . . . . . . . . . . . . . . . . . . . . . . 35
Measure Nucleic Acid using a Custom Factor . . . . . . . . . . . . . . . . . . . . . . . . 35
Custom Factor Reported Results . . . . . . . . . . . . . . . . . . . . . . . . . . . . . . . . . . 37
Settings for Nucleic Acid Measurements using a Custom Factor . . . . . . . . . . 39
Detection Limits for Nucleic Acid Measurements using a Custom
Factor. . . . . . . . . . . . . . . . . . . . . . . . . . . . . . . . . . . . . . . . . . . . . . . . . . . . . 39
Measure Oligo DNA or Oligo RNA . . . . . . . . . . . . . . . . . . . . . . . . . . . . . . . . . 41
Measure Oligo DNA or Oligo RNA . . . . . . . . . . . . . . . . . . . . . . . . . . . . . . . 41
Oligo Reported Results . . . . . . . . . . . . . . . . . . . . . . . . . . . . . . . . . . . . . . . . . 45
Settings for Oligo DNA and Oligo RNA Measurements . . . . . . . . . . . . . . . . 47
Detection Limits for Oligo DNA and Oligo RNA Measurements . . . . . . . . . 48
Calculations for Oligo DNA and Oligo RNA Measurements . . . . . . . . . . . . 49
Thermo Scientific NanoDrop One User Guide iii
Page 4

Contents
Measure Protein A280. . . . . . . . . . . . . . . . . . . . . . . . . . . . . . . . . . . . . . . . . . . . 53
Measure Protein Concentration at A280 . . . . . . . . . . . . . . . . . . . . . . . . . . . . 53
Protein A280 Reported Results . . . . . . . . . . . . . . . . . . . . . . . . . . . . . . . . . . . 57
Settings for Protein A280 Measurements. . . . . . . . . . . . . . . . . . . . . . . . . . . . 59
Detection Limits for Protein A280 Measurements. . . . . . . . . . . . . . . . . . . . . 64
Calculations for Protein A280 Measurements . . . . . . . . . . . . . . . . . . . . . . . . 65
Measure Proteins and Labels . . . . . . . . . . . . . . . . . . . . . . . . . . . . . . . . . . . . . . . 69
Measure Labeled Protein Samples . . . . . . . . . . . . . . . . . . . . . . . . . . . . . . . . . 69
Proteins & Labels Reported Results. . . . . . . . . . . . . . . . . . . . . . . . . . . . . . . . 72
Settings for Proteins and Labels Measurements . . . . . . . . . . . . . . . . . . . . . . . 74
Detection Limits for Proteins and Labels Measurements . . . . . . . . . . . . . . . . 76
Calculations for Proteins and Labels Measurements. . . . . . . . . . . . . . . . . . . . 77
Measure Protein A205. . . . . . . . . . . . . . . . . . . . . . . . . . . . . . . . . . . . . . . . . . . . 79
Measure Protein Concentration at A205 . . . . . . . . . . . . . . . . . . . . . . . . . . . . 79
Protein A205 Reported Results . . . . . . . . . . . . . . . . . . . . . . . . . . . . . . . . . . . 82
Settings for Protein A205 Measurements. . . . . . . . . . . . . . . . . . . . . . . . . . . . 83
Calculations for Protein A205 Measurements . . . . . . . . . . . . . . . . . . . . . . . . 85
Measure Protein BCA . . . . . . . . . . . . . . . . . . . . . . . . . . . . . . . . . . . . . . . . . . . . 87
Measure Total Protein Concentration . . . . . . . . . . . . . . . . . . . . . . . . . . . . . . 87
Protein BCA Reported Results . . . . . . . . . . . . . . . . . . . . . . . . . . . . . . . . . . . 96
Settings for Protein BCA Measurements . . . . . . . . . . . . . . . . . . . . . . . . . . . 100
Measure Protein Bradford . . . . . . . . . . . . . . . . . . . . . . . . . . . . . . . . . . . . . . . . 101
Measure Total Protein Concentration . . . . . . . . . . . . . . . . . . . . . . . . . . . . . 101
Protein Bradford Reported Results . . . . . . . . . . . . . . . . . . . . . . . . . . . . . . . 106
Settings for Protein Bradford Measurements . . . . . . . . . . . . . . . . . . . . . . . . 109
Measure Protein Lowry . . . . . . . . . . . . . . . . . . . . . . . . . . . . . . . . . . . . . . . . . . 111
Measure Total Protein Concentration . . . . . . . . . . . . . . . . . . . . . . . . . . . . . 111
Protein Lowry Reported Results . . . . . . . . . . . . . . . . . . . . . . . . . . . . . . . . . 114
Settings for Protein Lowry Measurements . . . . . . . . . . . . . . . . . . . . . . . . . . 118
Measure Protein Pierce 660. . . . . . . . . . . . . . . . . . . . . . . . . . . . . . . . . . . . . . . 119
Measure Total Protein Concentration . . . . . . . . . . . . . . . . . . . . . . . . . . . . . 119
Protein Pierce 660 Reported Results . . . . . . . . . . . . . . . . . . . . . . . . . . . . . . 124
Settings for Protein Pierce 660 Measurements . . . . . . . . . . . . . . . . . . . . . . . 127
Measure OD600 . . . . . . . . . . . . . . . . . . . . . . . . . . . . . . . . . . . . . . . . . . . . . . . 129
Measure OD600 . . . . . . . . . . . . . . . . . . . . . . . . . . . . . . . . . . . . . . . . . . . . . 129
OD600 Reported Results . . . . . . . . . . . . . . . . . . . . . . . . . . . . . . . . . . . . . . 133
Settings for OD600 Measurements . . . . . . . . . . . . . . . . . . . . . . . . . . . . . . . 134
Calculations for OD600 Measurements . . . . . . . . . . . . . . . . . . . . . . . . . . . 137
Measure Custom . . . . . . . . . . . . . . . . . . . . . . . . . . . . . . . . . . . . . . . . . . . . . . . 139
Measure using a Custom Method . . . . . . . . . . . . . . . . . . . . . . . . . . . . . . . . 139
Delete Custom Method. . . . . . . . . . . . . . . . . . . . . . . . . . . . . . . . . . . . . . . . 143
Custom Method Reported Results. . . . . . . . . . . . . . . . . . . . . . . . . . . . . . . . 144
iv NanoDrop One User Guide Thermo Scientific
Page 5

Contents
Measure UV-Vis . . . . . . . . . . . . . . . . . . . . . . . . . . . . . . . . . . . . . . . . . . . . . . . 147
Measure UV-Vis . . . . . . . . . . . . . . . . . . . . . . . . . . . . . . . . . . . . . . . . . . . . . 147
UV-Vis Reported Results. . . . . . . . . . . . . . . . . . . . . . . . . . . . . . . . . . . . . . . 150
Settings for UV-Vis Measurements . . . . . . . . . . . . . . . . . . . . . . . . . . . . . . . 152
Measure Kinetics . . . . . . . . . . . . . . . . . . . . . . . . . . . . . . . . . . . . . . . . . . . . . . . 155
Measure Kinetics . . . . . . . . . . . . . . . . . . . . . . . . . . . . . . . . . . . . . . . . . . . . . 155
Create Kinetics Method. . . . . . . . . . . . . . . . . . . . . . . . . . . . . . . . . . . . . . . . 158
Edit Kinetics Method . . . . . . . . . . . . . . . . . . . . . . . . . . . . . . . . . . . . . . . . . 159
Kinetics Reported Results . . . . . . . . . . . . . . . . . . . . . . . . . . . . . . . . . . . . . . 161
Settings for Kinetic Measurements. . . . . . . . . . . . . . . . . . . . . . . . . . . . . . . . 166
Chapter 3 Learning Center . . . . . . . . . . . . . . . . . . . . . . . . . . . . . . . . . . . . . . . . . . . . . . . . . . . . . .175
Micro-Volume Sampling—How it Works. . . . . . . . . . . . . . . . . . . . . . . . . . . . 176
Set Up the Instrument. . . . . . . . . . . . . . . . . . . . . . . . . . . . . . . . . . . . . . . . . . . 178
Measure a Micro-Volume Sample . . . . . . . . . . . . . . . . . . . . . . . . . . . . . . . . . . 193
Measure a Sample Using a Cuvette . . . . . . . . . . . . . . . . . . . . . . . . . . . . . . . . . 200
Prepare Samples and Blanks . . . . . . . . . . . . . . . . . . . . . . . . . . . . . . . . . . . . . . 204
Basic Instrument Operations . . . . . . . . . . . . . . . . . . . . . . . . . . . . . . . . . . . . . . 210
NanoDrop One Home Screen. . . . . . . . . . . . . . . . . . . . . . . . . . . . . . . . . . . 211
NanoDrop One Measurement Screens . . . . . . . . . . . . . . . . . . . . . . . . . . . . 215
NanoDrop One Data Viewer . . . . . . . . . . . . . . . . . . . . . . . . . . . . . . . . . . . 222
NanoDrop One General Operations . . . . . . . . . . . . . . . . . . . . . . . . . . . . . . 229
Instrument Settings . . . . . . . . . . . . . . . . . . . . . . . . . . . . . . . . . . . . . . . . . . . . . 236
Acclaro Sample Intelligence. . . . . . . . . . . . . . . . . . . . . . . . . . . . . . . . . . . . . . . 240
NanoDrop One Viewer Software . . . . . . . . . . . . . . . . . . . . . . . . . . . . . . . . . . 248
Viewer Home Screen. . . . . . . . . . . . . . . . . . . . . . . . . . . . . . . . . . . . . . . . . . 249
Manage Experiments and Associated Data. . . . . . . . . . . . . . . . . . . . . . . . . . 251
Manage Identifiers on a PC . . . . . . . . . . . . . . . . . . . . . . . . . . . . . . . . . . . . . 260
Manage Custom Methods . . . . . . . . . . . . . . . . . . . . . . . . . . . . . . . . . . . . . . 265
Multimedia . . . . . . . . . . . . . . . . . . . . . . . . . . . . . . . . . . . . . . . . . . . . . . . . . . . 277
Chapter 4 Maintaining Your Instrument . . . . . . . . . . . . . . . . . . . . . . . . . . . . . . . . . . . . . . . . . .279
Maintenance Schedule. . . . . . . . . . . . . . . . . . . . . . . . . . . . . . . . . . . . . . . . . . . 280
Cleaning the Touchscreen . . . . . . . . . . . . . . . . . . . . . . . . . . . . . . . . . . . . . . . . 281
Maintaining the Pedestals . . . . . . . . . . . . . . . . . . . . . . . . . . . . . . . . . . . . . . . . 282
Cleaning the Pedestals . . . . . . . . . . . . . . . . . . . . . . . . . . . . . . . . . . . . . . . . . 282
Reconditioning the Pedestals . . . . . . . . . . . . . . . . . . . . . . . . . . . . . . . . . . . . 285
Decontaminating the Instrument . . . . . . . . . . . . . . . . . . . . . . . . . . . . . . . . . . 287
Maintaining the Cuvette Sampling System . . . . . . . . . . . . . . . . . . . . . . . . . . . 290
Instrument Diagnostics . . . . . . . . . . . . . . . . . . . . . . . . . . . . . . . . . . . . . . . . . . 291
Intensity Check . . . . . . . . . . . . . . . . . . . . . . . . . . . . . . . . . . . . . . . . . . . . . . 291
Performance Verification. . . . . . . . . . . . . . . . . . . . . . . . . . . . . . . . . . . . . . . 293
Pedestal Image Check . . . . . . . . . . . . . . . . . . . . . . . . . . . . . . . . . . . . . . . . . 298
Thermo Scientific NanoDrop One User Guide v
Page 6

Contents
Chapter 5 Safety and Operating Precautions . . . . . . . . . . . . . . . . . . . . . . . . . . . . . . . . . . . . . .301
Operating Precautions. . . . . . . . . . . . . . . . . . . . . . . . . . . . . . . . . . . . . . . . . . . 302
Safety Information. . . . . . . . . . . . . . . . . . . . . . . . . . . . . . . . . . . . . . . . . . . . . . 303
Chapter 6 About this Help System . . . . . . . . . . . . . . . . . . . . . . . . . . . . . . . . . . . . . . . . . . . . . . .311
Chapter 7 Contact Technical Support . . . . . . . . . . . . . . . . . . . . . . . . . . . . . . . . . . . . . . . . . . . .313
vi NanoDrop One User Guide Thermo Scientific
Page 7
1
About the NanoDrop One Spectrophotometer
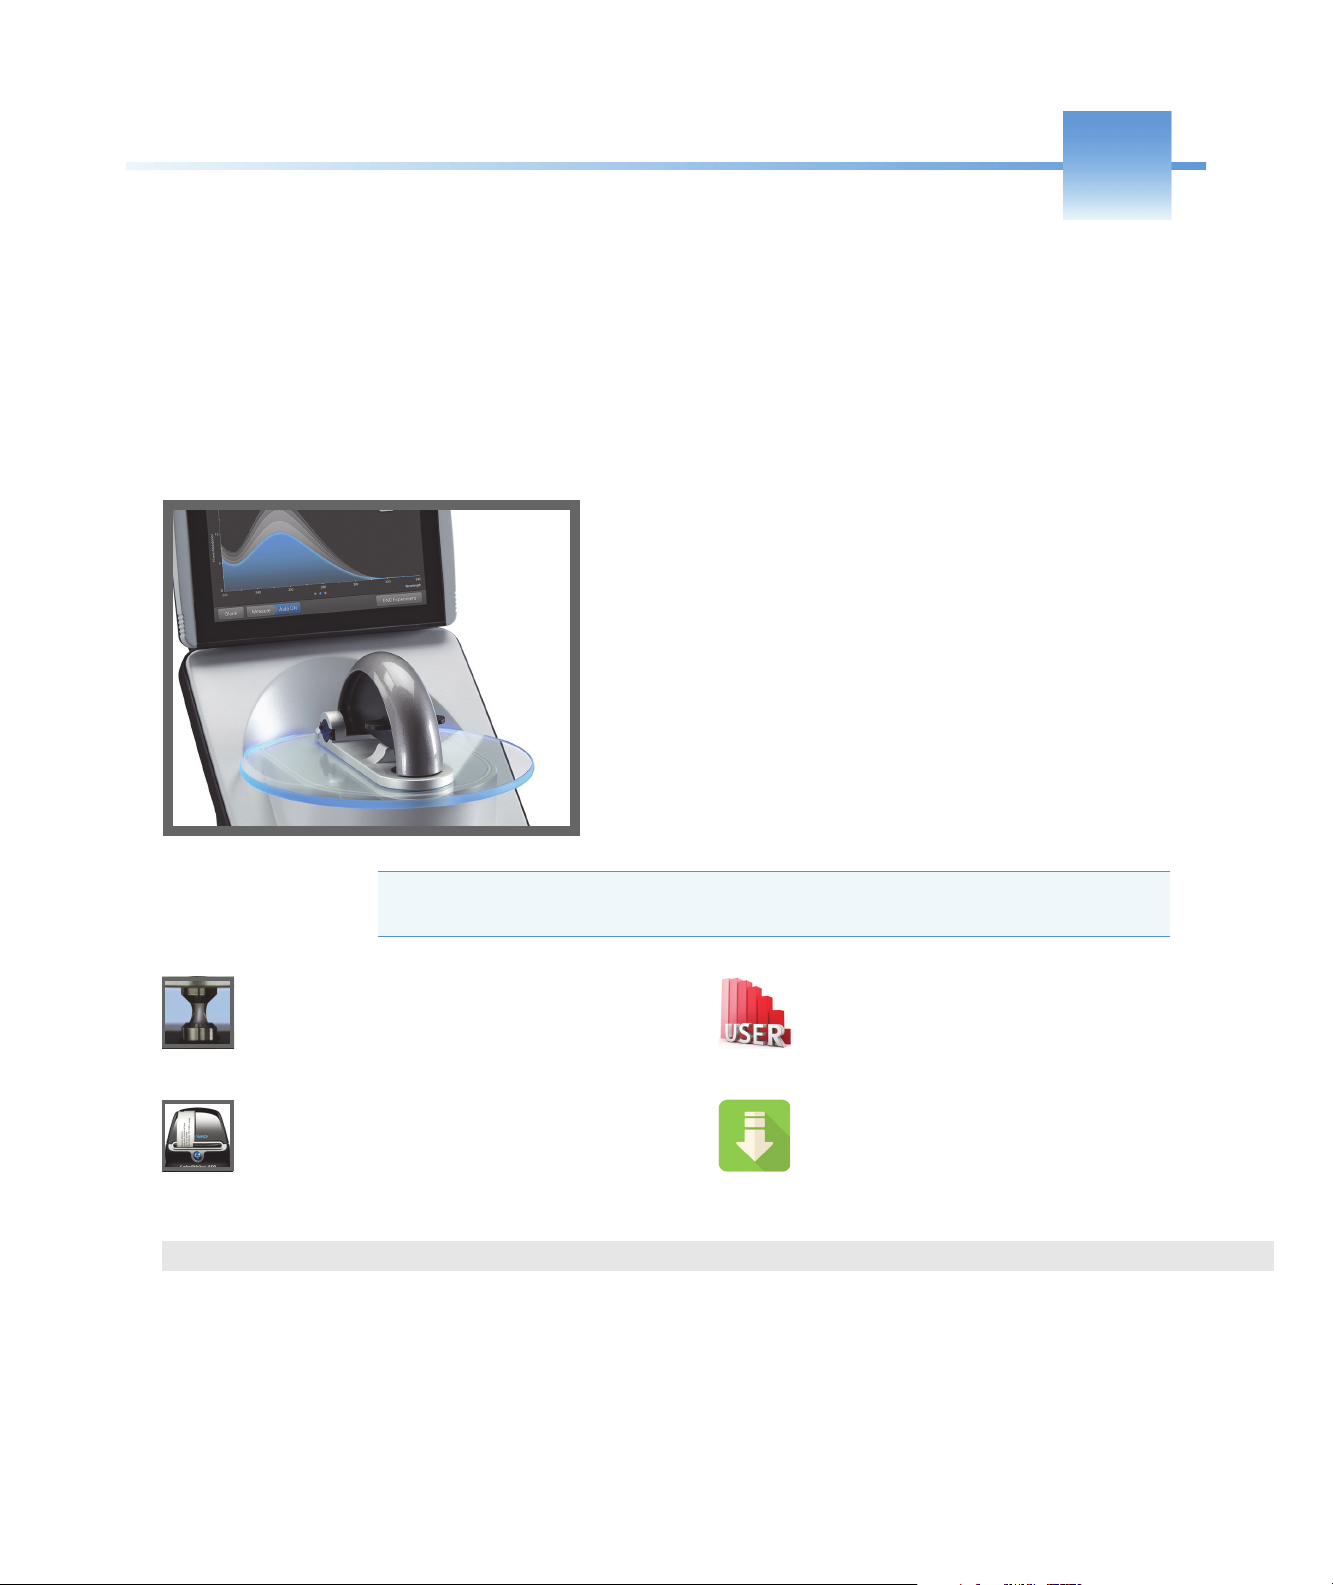
The Thermo Scientific™ NanoDrop™ One is a compact,
stand-alone UV-Visible spectrophotometer developed for
micro-volume analysis of purified nucleic acids and a wide
variety of proteins. The patented sample retention system
enables the measurement of highly concentrated samples
without the need for dilutions.
The NanoDrop One system comes with preloaded software and
a touchscreen display. The instrument can be connected to an
optional USB label printer.
NOTICE Before operating a NanoDrop One instrument, please read the safety and
operating precautions and then follow their recommendations when using the instrument.
Instrument Models and Features
There are two models available for the
NanoDrop One spectrophotometer...
Optional Accessories
A number of accessories are available for the
NanoDrop One instruments...
Thermo Scientific NanoDrop One User Guide 1
Register Your Instrument
Register your instrument to receive e-mail updates on
software and...
Update Software
Quickly and easily download the latest
NanoDrop One software...
Page 8
1
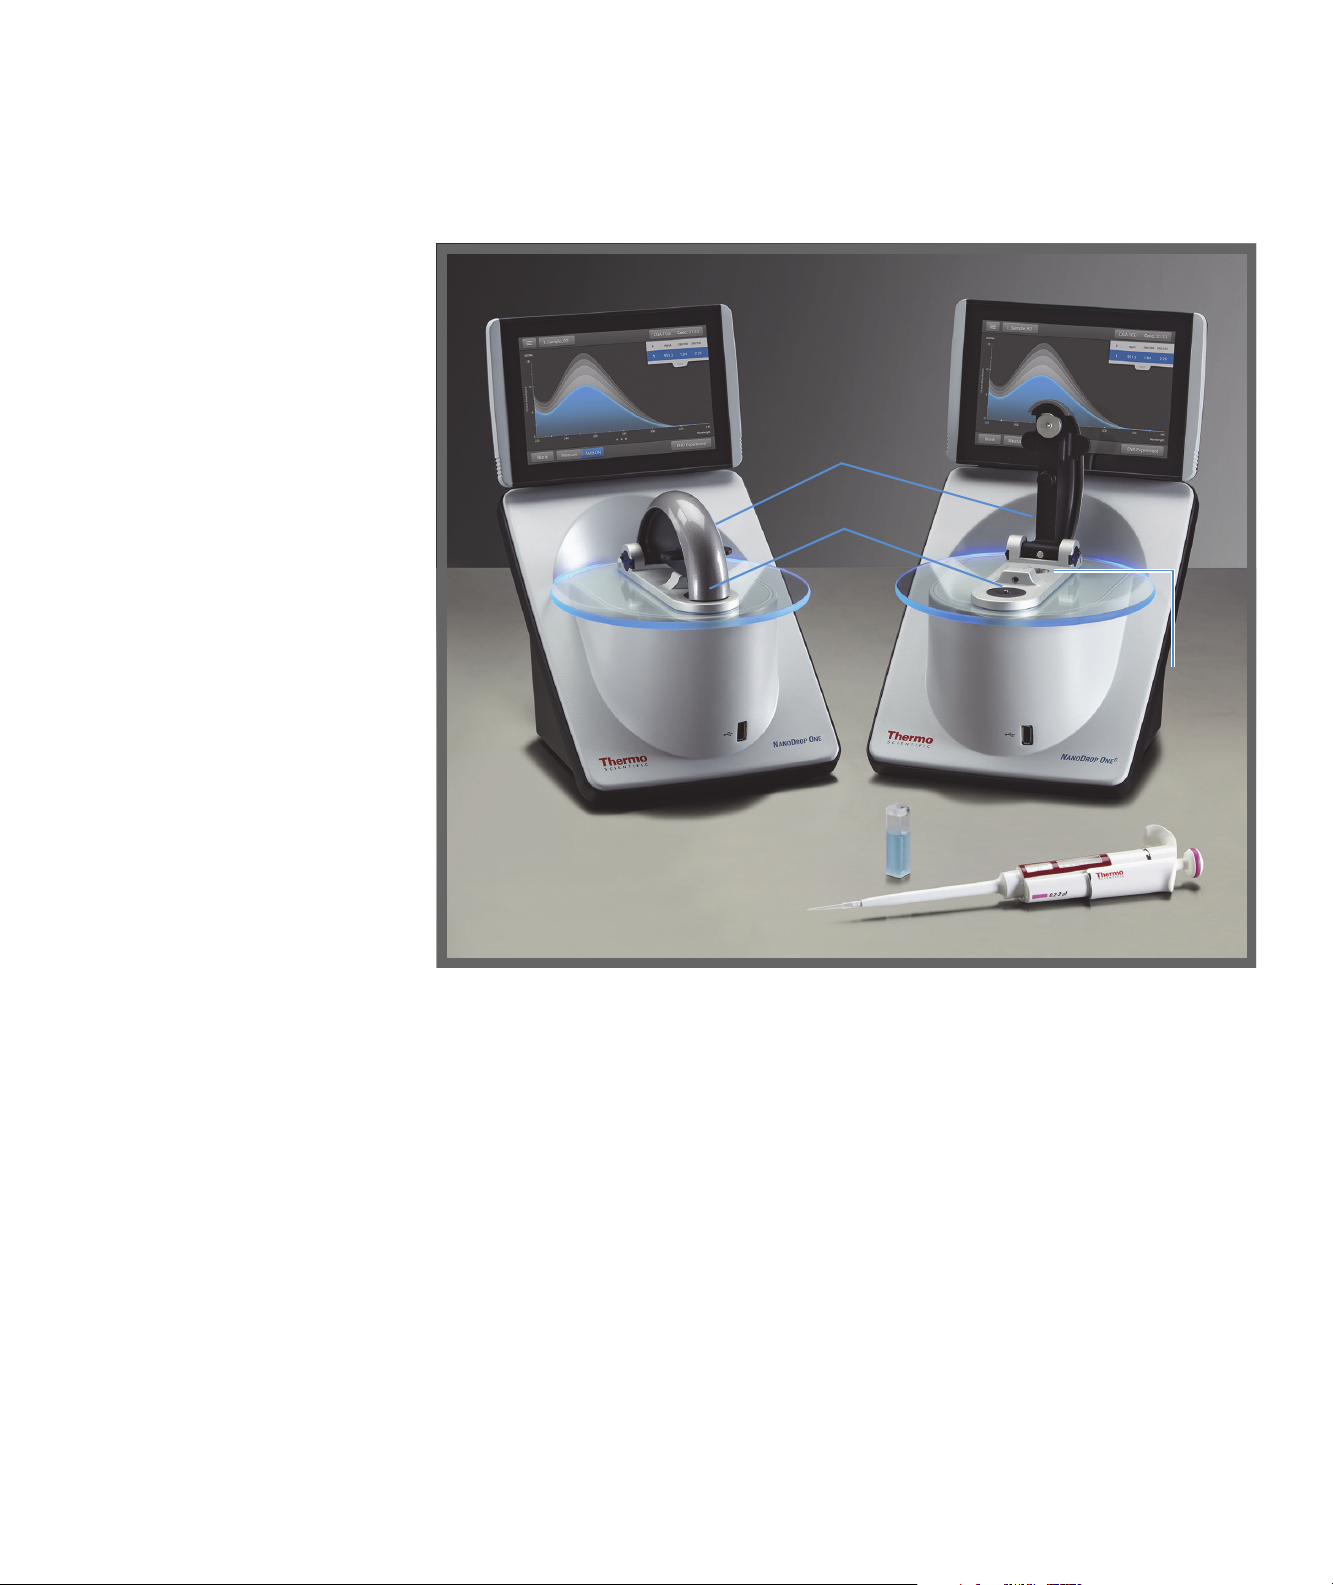
NanoDrop One Spectrophotometer NanoDrop OneC Spectrophotometer
Arm
Pedestal
Cuvette
holder
About the NanoDrop One Spectrophotometer
Instrument Models and Features
Instrument Models and Features
There are two models
available for the
NanoDrop One
spectrophotometer—the
NanoDrop One and the
NanoDrop One
models include the patented
micro-volume sample
retention system and general
features. The
NanoDrop One
features a cuvette holder for
analyzing dilute samples using
standard UV-visible cuvettes.
Both instruments come with a
built-in, 7-inch Android
high-resolution touchscreen
preloaded with easy-to-use
instrument control software.
The NanoDrop One software
is loaded with features to
integrate with and simplify
your daily workflows.
C
. Both
C
model also
1
Locate the instrument away from air vents and exhaust fans to minimize evaporation
2 NanoDrop One User Guide Thermo Scientific
Page 9
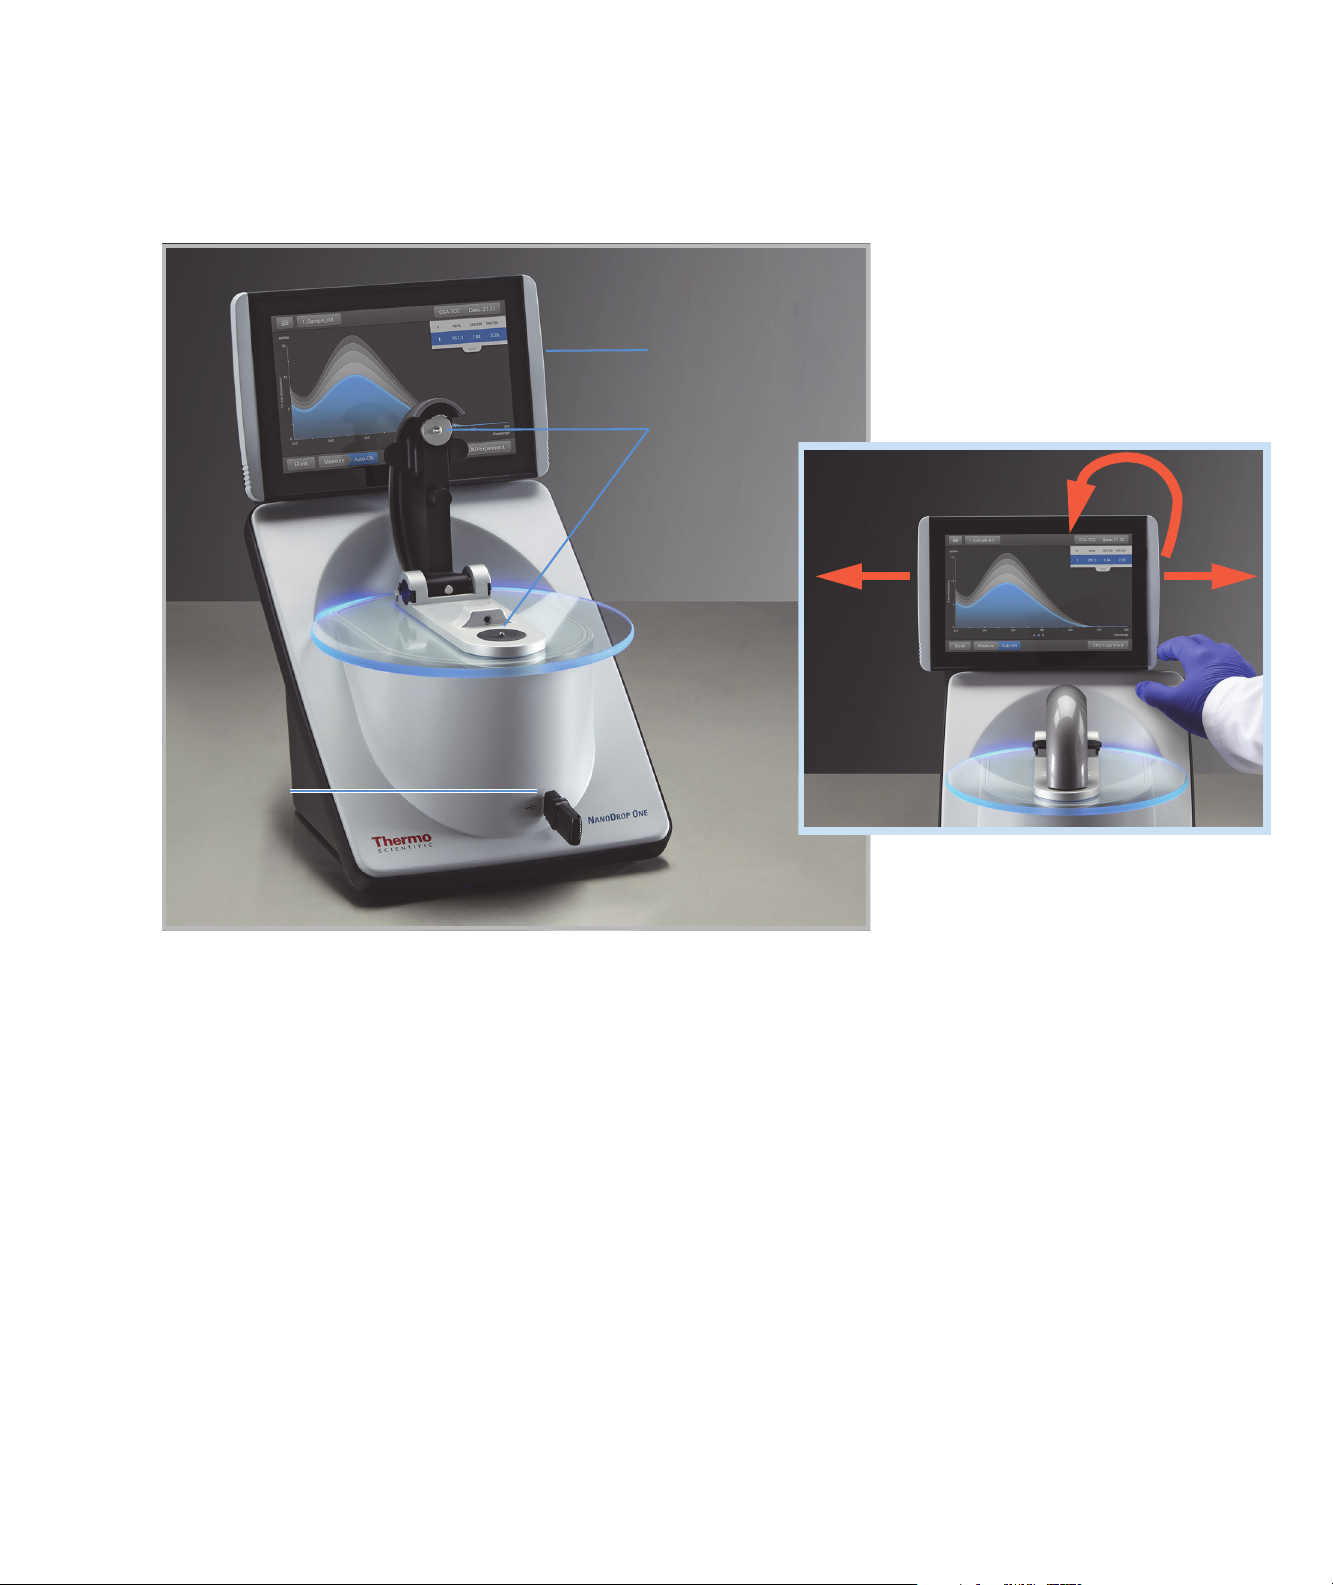
Touchscreen
USB-A port
1
Pedestals
Touchscreen
1
About the NanoDrop One Spectrophotometer
Instrument Models and Features
Touchscreen can slide left or
right to accommodate personal
preference, and tilt forward or
back for optimal viewing
1
Two more USB-A ports are located on instrument back panel
Thermo Scientific NanoDrop One User Guide 3
Page 10
1
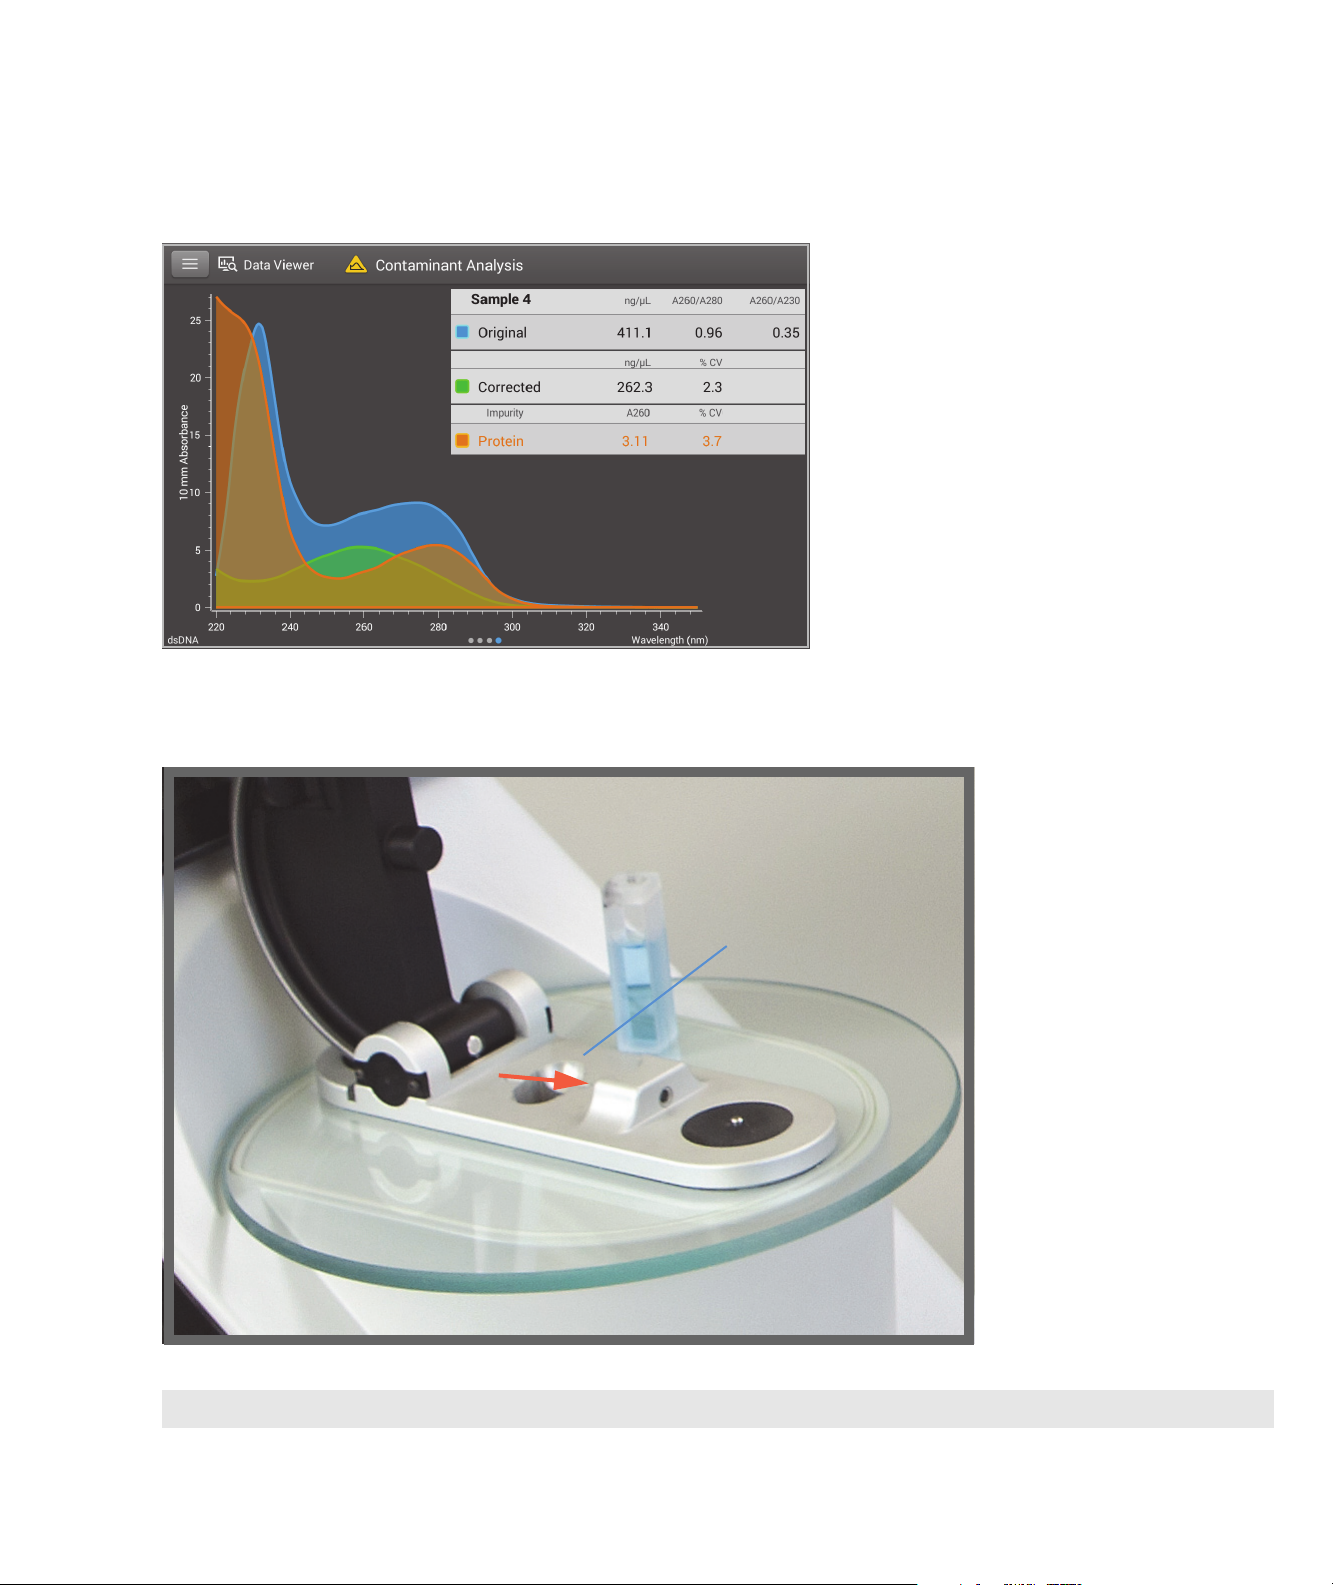
Instrument light path
Cuvette holder
About the NanoDrop One Spectrophotometer
Instrument Models and Features
NanoDrop One Software with Acclaro Sample Intelligence Technology
The Thermo Scientific™ Acclaro™ Sample
Intelligence technology built into the
NanoDrop One instruments provides these
exclusive features to help you assess sample
integrity:
• contaminant analysis to help qualify a sample
before use in downstream applications
• on-demand technical support for
measurements that are atypical or very low
concentration
• invalid result alerts (a column sensor
monitors for the presence of bubbles or
reflective particles that can compromise
measurement results)
NanoDrop OneC Model Additional Features
C
The NanoDrop One
includes a cuvette holder for
measuring dilute samples,
colorimetric assays, cell
cultures and kinetic studies.
The cuvette system has these
additional features:
• extended lower detection
limits
• 37 °C heater option for
temperature-sensitive
samples and analyses
• micro-stirring option to
ensure sample
homogeneity and support
kinetic studies
For details, see Measure a
Sample using a Cuvette.
model
4 NanoDrop One User Guide Thermo Scientific
Page 11
Optional Accessories
A number of accessories are available for the NanoDrop One instruments. To order an
accessory, contact your local distributor or visit our website.
DYMO™ LabelWriter™ 450 USB Label Printer
Prints two 5/16-in x 4-in self-adhesive labels for transferring sample data directly into
laboratory notebooks or posting on bulletin boards. The software allows printing of data from
each sample measurement or from a group of samples logged and measured together.
The printer connects to the instrument (front or back) via a USB cable (included).
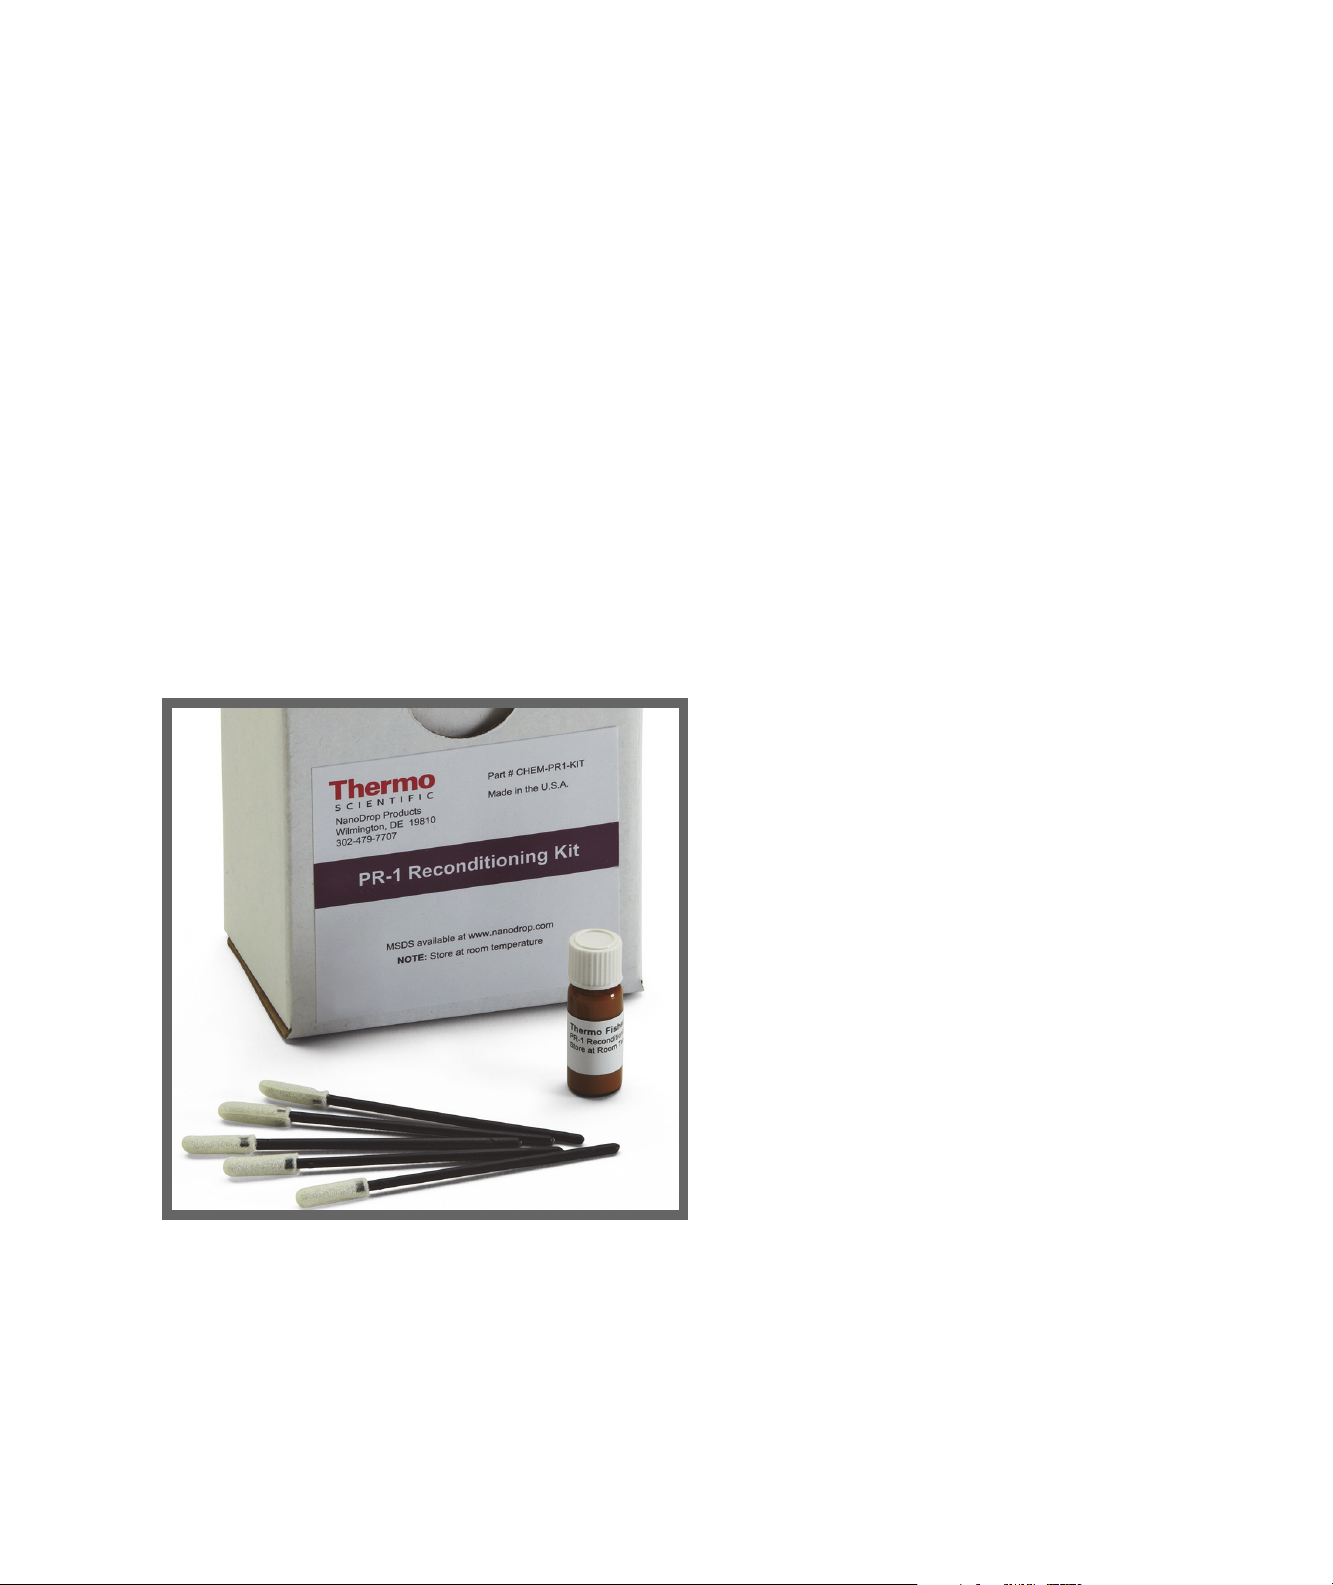
PR-1 Pedestal Reconditioning Kit
1
About the NanoDrop One Spectrophotometer
Optional Accessories
Specially formulated conditioning compound that can be
applied to the pedestals to restore them to a hydrophobic state
(required to achieve adequate surface tension for accurate
sample measurements). The kit includes conditioning
compound and applicators. For more information, see
Reconditioning the Pedestals.
PV-1 Performance Verification Solution
Liquid photometric standard used to check instrument performance. For more information,
see Performance Verification.
Thermo Scientific NanoDrop One User Guide 5
Page 12

1
About the NanoDrop One Spectrophotometer
Register Your Instrument
Register Your Instrument
Register your instrument to receive e-mail updates on software and accessories
for the NanoDrop One instruments. An Internet connection is required for
registration.
To register your instrument
1. Do one of the following:
–From the NanoDrop One Viewer software running on a personal
computer (PC) that is connected to the Internet, open the Help menu
and choose NanoDrop One Website.
– From any PC that is connected to the Internet, use any web browser to
navigate to our website.
2. On the website, locate NanoDrop One Registration and follow the
instructions to register the instrument.
6 NanoDrop One User Guide Thermo Scientific
Page 13

Update Software
1
About the NanoDrop One Spectrophotometer
Quickly and easily download and install the latest NanoDrop One software and
release notes from our website. Follow the steps to update or upgrade the software
on your local instrument and/or install or update the NanoDrop One Viewer
software on a personal computer (PC). An Internet connection is required to
download software.
Update Software
To install or update NanoDrop One Viewer software
1. Do one of the following:
• To install the Viewer software on a computer for the first time, open any
web browser and find the NanoDrop website.
• To update or upgrade the Viewer software, from the Viewer Home screen,
open the Help menu and choose NanoDrop One Website to open our
website.
2. On the NanoDrop website, locate the software downloads page.
3. Select to download NanoDrop One (PC) Viewer software (English version)
and follow the instructions to download and run the installer. (A computer
restart is required after the installer completes.)
4. To add a language, including software and Help systems, download and run the
language pack installer (English must be installed first). (No computer restart is
required after a language installer completes.)
Thermo Scientific NanoDrop One User Guide 7
Page 14

1
About the NanoDrop One Spectrophotometer
Update Software
To update or upgrade NanoDrop One instrument software
1. Do one of the following:
2. Insert a USB device such as a memory stick into a USB port on the computer.
3. On the NanoDrop website, locate the software downloads page, select to
4. To add a language, including software and Help systems, download the
5. Insert the USB device into any USB port on the NanoDrop One instrument.
–From the NanoDrop One Viewer software, open the Help menu and
choose NanoDrop One Website to open our website.
– From any personal computer that is connected to the Internet, navigate to
the NanoDrop website.
update or upgrade NanoDrop One operating software (English version) and
follow the instructions to download the installer to the USB device.
language pack installer(s) to the USB device.
6. From the instrument Home screen, tap (Settings) > System > Update
Software.
If the USB device contains more than one version of the installer, a message is
displayed. Select the version to install (English installer must be run first) and
tap Update. (An instrument restart is required after the English installer
completes.)
When the installation is complete, a message similar to the following appears
next to the Update Software button:
Version: 1.2.0 (currently installed version of instrument operating software)
Database version: 1 (version of NanoDrop One database on this instrument)
7. To add a language, including software and Help systems, tap Update Software
again, select the language and version to install and tap Update. (No
instrument restart is required after a language installer completes.)
Note: To change the language, tap Language, select an installed language and tap
OK. (An instrument restart is required after you change the language.)
8 NanoDrop One User Guide Thermo Scientific
Page 15

2
Applications
Detection Limits for All Applications
Note Detection limits provided in the tables below are approximate and apply to
micro-volume measurements only; they are based on the instrument’s photometric
absorbance range (10 mm equivalent) of 0–550 A. For measurements with 10 mm
pathlength cuvettes, the photometric absorbance range is 0–1.5 A.
Detection limits for standard applications
Sample Type Lower Detection Limit Upper Detection Limit Typical Reproducibility
dsDNA 2.0 ng/μL (pedestal)
0.20 ng/μL (cuvette)
ssDNA 1.3 ng/μL (pedestal)
0.13 ng/μL (cuvette)
RNA 1.6 ng/μL (pedestal)
0.16 ng/μL (cuvette)
Thermo Scientific NanoDrop One User Guide 9
27,500 ng/μL (pedestal)
75 ng/μL (cuvette)
18,150 ng/μL (pedestal)
49.5 ng/μL (cuvette)
22,000 ng/μL (pedestal)
60 ng/μL (cuvette)
±2.0 ng/μL for sample concentrations
between 2.0 and 100 ng/μL samples;
±2% for samples >100 ng/μL
±2.0 ng/μL for sample concentrations
between 2.0 and 100 ng/μL samples;
±2% for samples >100 ng/μL
±2.0 ng/μL for sample concentrations
between 2.0 and 100 ng/μL samples;
±2% for samples >100 ng/μL
a
Page 16

2
Applications
Detection Limits for All Applications
Sample Type Lower Detection Limit Upper Detection Limit Typical Reproducibility
DNA Microarray
(ssDNA)
Purified BSA by
Protein A280
IgG by Protein
A280
Purified BSA by
1.3 ng/μL (pedestal)
0.13 ng/μL (cuvette)
0.06 mg/mL (pedestal)
0.006 mg/mL (cuvette)
0.03 mg/mL (pedestal)
0.003 mg/mL (cuvette)
0.06 mg/mL (pedestal)
495 ng/μL (pedestal)
±2.0 ng/μL for sample concentrations
between 2.0 and 100 ng/μL samples;
49.5 ng/μL (cuvette)
825 mg/mL (pedestal)
±2% for samples >100 ng/μL
±0.10 mg/mL (for 0.10–10 mg/mL samples);
±2% for samples >10 mg/mL
402 mg/mL (pedestal)
19 mg/mL (pedestal) ±0.10 mg/mL for 0.10–10 mg/mL samples
Proteins & Labels
0.006 mg/mL (cuvette)
Protein BCA 0.2 mg/mL (20:1
8.0 mg/mL (pedestal)
2% over entire range
reagent/sample volume)
0.20 mg/mL (cuvette)
0.01 mg/mL over entire range
0.01 mg/mL (1:1
reagent/sample volume)
Protein Lowry 0.2 mg/mL (pedestal) 4.0 mg/mL (pedestal) 2% over entire range
Protein Bradford 100 μg/mL (50:1
reagent/sample volume)
8000 μg/mL
±25 μg/mL for 100–500 μg/mL samples
±5% for 500–8000 μg/mL samples
a
15 μg/mL (1:1
reagent/sample volume)
Protein Pierce 660 50 μg/mL (15:1
reagent/sample volume)
25 μg/mL (7.5:1
reagent/sample volume)
a
Based on five replicates (SD=ng/μL; CV=%)
Note To minimize instrument error with highly concentrated samples, make dilutions to
ensure that measurements are made within these absorbance limits:
• For micro-volume measurements, maximum absorbance at 260 nm (for nucleic acids)
or 280 nm (for proteins) should be less than 62.5 A.
• For measurements with 10 mm pathlength cuvettes, maximum absorbance at 260 nm
(or 280 nm for proteins) should be less than 1.5 A, which is approximately 75 ng/μL
dsDNA.
100 μg/μL
2000 μg/mL
1000 μg/mL
±4 μg/mL for 15–50 μg/mL samples
±5% for 50–125 μg/mL samples
±3 μg/mL for 50–125 μg/mL samples
±2% for samples > 125 μg/mL
±3 μg/mL for 25–125 μg/mL samples
±2% for samples >125 μg/mL
10 NanoDrop One User Guide Thermo Scientific
Page 17

Detection limits for pre-defined dyes
2
Applications
Detection Limits for All Applications
Sample Type Lower Detection Limit Upper Detection Limit
Cy3, Cy3.5, Alexa Fluor
0.2 pmol/μL (pedestal) 100 pmol/μL (pedestal) ±0.20 pmol/μL for sample
555, Alexa Fluor 660
a
Typical Reproducibility
concentrations between 0.20 and 4.0
b
pmol/μL;
±2% for samples >4.0 pmol/μL
Cy5, Cy5.5, Alexa Fluor
647
0.12 pmol/μL (pedestal) 60 pmol/μL (pedestal) ±0.12 pmol/μL for sample concentrations
between 0.12 and 2.4 pmol/μL;
±2% for samples >2.4 pmol/μL
Alexa Fluor 488, Alexa
Fluor 594
0.4 pmol/μL (pedestal) 215 pmol/μL (pedestal) ±0.40 pmol/μL for sample concentrations
between 0.40 and 8.0 pmol/μL;
±2% for samples >8.0 pmol/μL
Alexa Fluor 546 0.3 pmol/μL (pedestal) 145 pmol/μL (pedestal) ±0.30 pmol/μL for sample concentrations
between 0.30 and 6.0 pmol/μL;
±2% for samples >6.0 pmol/μL
a
Values are approximate
b
Based on five replicates (SD=ng/μL; CV=%)
Thermo Scientific NanoDrop One User Guide 11
Page 18

Page 19
Measure dsDNA, ssDNA or RNA
Measures the concentration of
purified dsDNA, ssDNA or RNA
samples that absorb at 260 nm.
Measure dsDNA, ssDNA or RNA
Reported Results
Settings
Detection Limits
Calculations
Measure dsDNA, ssDNA or RNA
Use the dsDNA, ssDNA and RNA applications to quantify purified double-stranded (ds) or
single-stranded (ss) DNA or RNA samples. These applications report nucleic acid
concentration and two absorbance ratios (A260/A280 and A260/A230). A single-point
baseline correction can also be used.
To measure dsDNA, ssDNA or RNA samples
NOTICE
• Do not use a squirt or spray bottle on or near the instrument as liquids will flow into
the instrument and may cause permanent damage.
• Do not use hydrofluoric acid (HF) on the pedestals. Fluoride ions will permanently
damage the quartz fiber optic cables.
Thermo Scientific NanoDrop One User Guide 13
Page 20
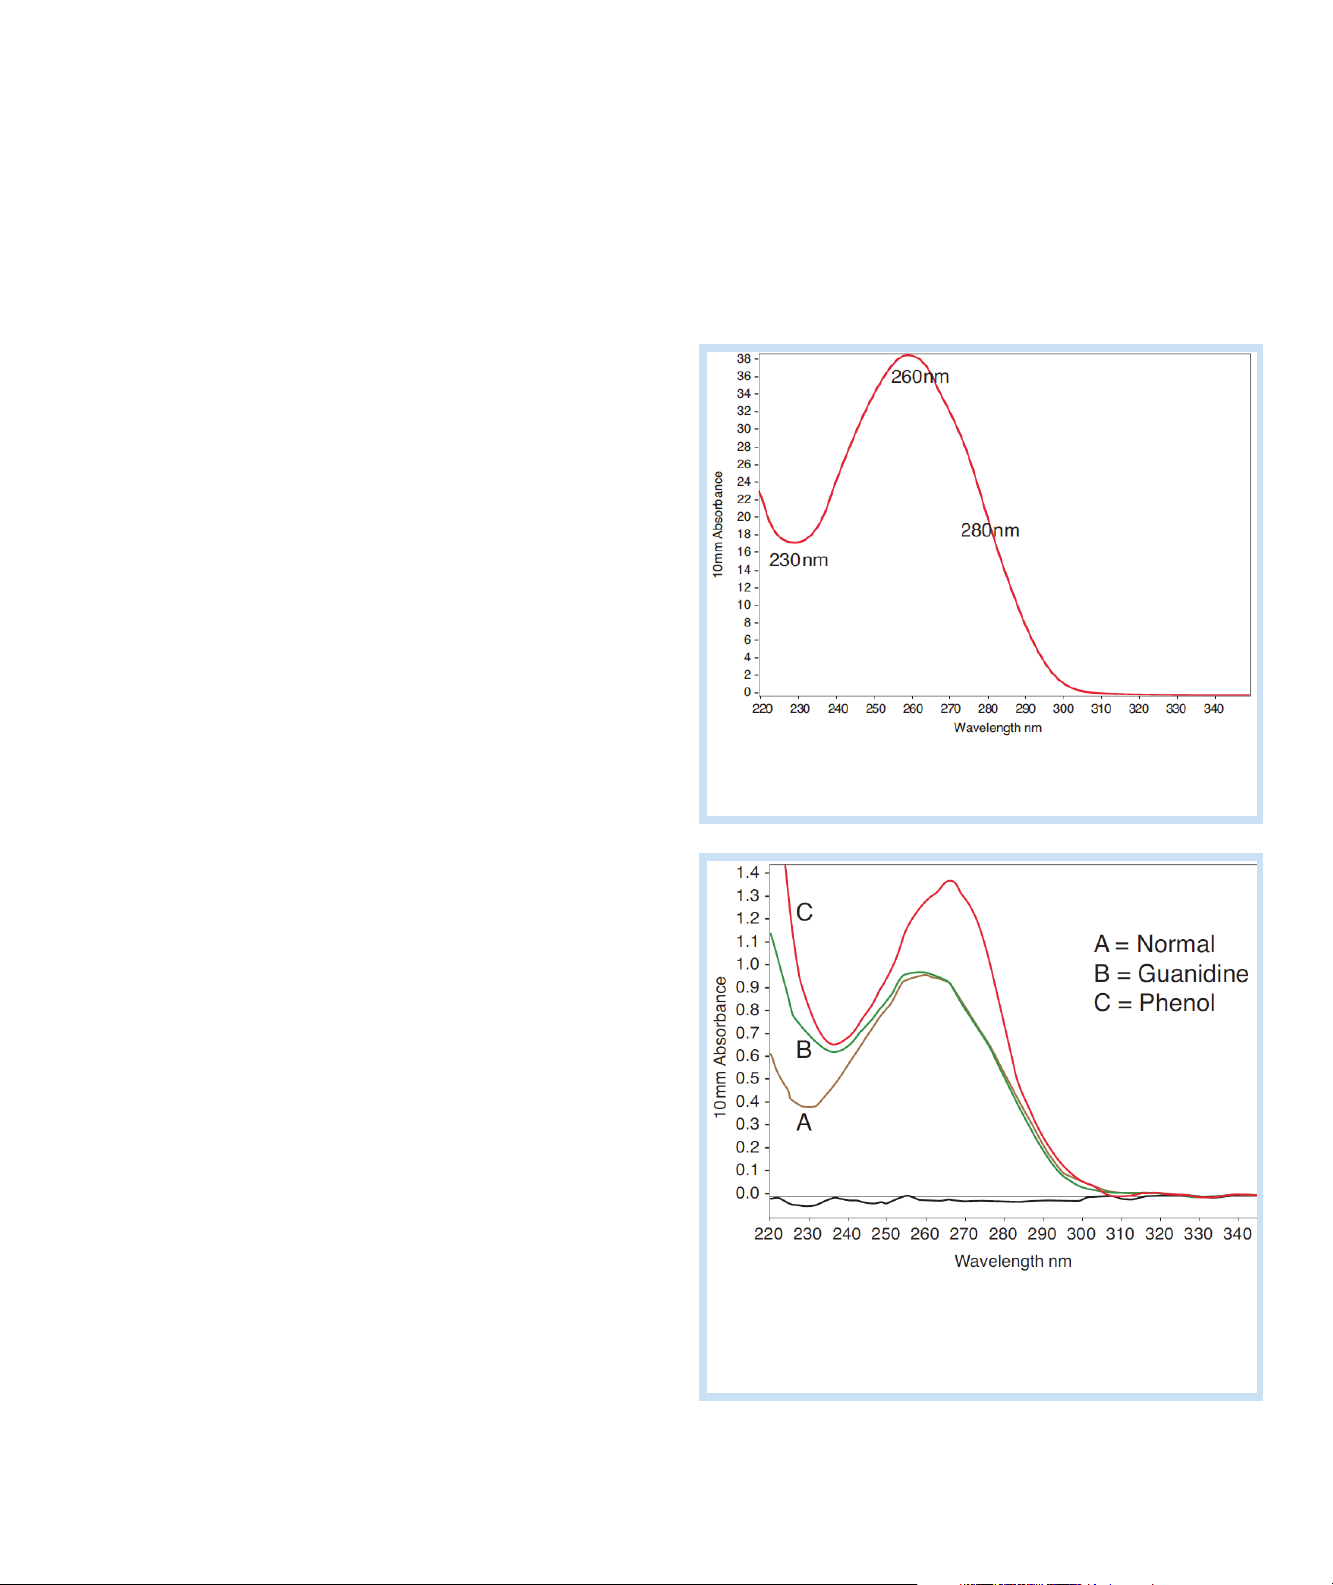
Measure dsDNA, ssDNA or RNA
Typical nucleic acid spectrum
Comparison of nucleic acid spectra with
and without two common contaminants
Before you begin...
Before taking pedestal measurements with the NanoDrop One instrument, lift the instrument
arm and clean the upper and lower pedestals. At a minimum, wipe the pedestals with a new
laboratory wipe. For more information, see Cleaning the Pedestals.
To measure nucleic acid
1. From the Home screen, select the Nucleic Acids tab
and tap dsDNA, ssDNA or RNA, depending on the
samples to be measured.
2. Specify a baseline correction if desired.
3. Pipette 1–2 μL blanking solution onto the lower
pedestal and lower the arm, or insert the blanking
cuvette into the cuvette holder.
Tip: If using a cuvette, make sure to align the cuvette
light path with the instrument light path.
4. Tap Blank and wait for the measurement to
complete.
Tip: If Auto-Blank is On, the blank measurement
starts automatically after you lower the arm. (This
option is not available for cuvette measurements.)
5. Lift the arm and clean both pedestals with a new
laboratory wipe, or remove the blanking cuvette.
6. Pipette 1-2 μL sample solution onto the pedestal and
lower the arm, or insert the sample cuvette into the
cuvette holder.
7. Start the sample measurement:
–Pedestal: If Auto-Measure is On, lower arm; if
Auto-Measure is off, lower arm and tap Measure.
– Cuvette: Tap Measure.
When the sample measurement is completed, the
spectrum and reported values are displayed (see the
next section).
8. When you are finished measuring samples, tap
End Experiment.
9. Lift the arm and clean both pedestals with a new
wipe, or remove the sample cuvette.
14 NanoDrop One User Guide Thermo Scientific
Page 21

Measure dsDNA, ssDNA or RNA
Best practices for nucleic acid measurements
• Isolate and purify nucleic acid samples before measurement to remove impurities.
Depending on the sample, impurities could include DNA, RNA, free nucleotides,
proteins, some buffer components and dyes. See Preparing Samples for more information.
Note Extraction reagents such as guanidine, phenol, and EDTA contribute
absorbance between 230 nm and 280 nm and will affect measurement results if
present in samples (even residual amounts).
• Ensure the sample absorbance is within the instrument’s absorbance detection limits.
• Blank with the same buffer solution used to resuspend the analyte of interest. The
blanking solution should be a similar pH and ionic strength as the analyte solution.
•Run a blanking cycle to assess the absorbance contribution of your buffer solution. If the
buffer exhibits strong absorbance at or near the analysis wavelength (typically 260 nm),
you may need to choose a different buffer or application. See Choosing and Measuring a
Blank for more information.
• For micro-volume measurements:
– Ensure pedestal surfaces are properly cleaned and conditioned.
– If possible, heat highly concentrated or large molecule samples, such as genomic or
lambda DNA, to 63 °C (145 °F) and gently (but thoroughly) vortex before taking a
measurement. Avoid introducing bubbles when mixing and pipetting.
– Follow best practices for micro-volume measurements.
– Use a 1-2 μL sample volume. See Recommended Sample Volumes for more
information.
C
• For cuvette measurements (NanoDrop One
instruments only), use compatible cuvettes
and follow best practices for cuvette measurements.
Related Topics
• Measure a Micro-Volume Sample
• Measure a Sample Using a Cuvette
• Best Practices for Micro-Volume Measurements
• Best Practices for Cuvette Measurements
• Prepare Samples and Blanks
• Basic Instrument Operations
Thermo Scientific NanoDrop One User Guide 15
Page 22

Measure dsDNA, ssDNA or RNA
Tap row to
select sample
and update
spectrum; tap
more rows to
overlay up to five
spectra. Press
and hold
sample row to
view
measurement
details.
Drag tab
down/up to see
more/less
sample data
Nucleic acid
concentration
UV spectrum
Tap to select unit
Purity ratios
Menu of options;
tap to open
Sample name;
tap to edit
Swipe screen left to
view table with more
measurement results
Pinch and zoom to
adjust axes;
double-tap to reset
Tap to end
experiment and
export data
Menu of options;
tap to open
Nucleic Acid Reported Results
dsDNA measurement screen
For each measured sample, the dsDNA, ssDNA and RNA applications show the UV
absorbance spectrum and a summary of the results. Here is an example:
Note Micro-volume absorbance measurements and measurements taken with
nonstandard cuvettes are normalized to a 10.0 mm pathlength equivalent.
16 NanoDrop One User Guide Thermo Scientific
Page 23

Measure dsDNA, ssDNA or RNA
dsDNA, ssDNA and RNA reported values
The initial screen that appears after each measurement (see previous image) shows a summary
of the reported values. To view all reported values, press and hold the sample row. Here is an
example:
• sample details (application and sampling method used, i.e., pedestal or cuvette)
•sample name
• created on (date sample measurement was taken)
• nucleic acid concentration
• A260/A280
• A260/A230
•A260
•A280
•factor
• baseline correction
Related Topics
• Basic Instrument Operations
• Nucleic Acid Calculations
Setting for Nucleic Acid Measurements
To show the dsDNA, ssDNA or RNA settings, from the dsDNA, ssDNA or RNA
measurement screen, tap > Nucleic Acid Setup.
Thermo Scientific NanoDrop One User Guide 17
Page 24

Measure dsDNA, ssDNA or RNA
Setting Available Options Description
Baseline Correction On or off
Enter baseline correction
wavelength in nm or use
default value (340 nm)
Optional user-defined baseline correction. Can be used to
correct for any offset caused by light scattering particulates by
subtracting measured absorbance at specified baseline correction
wavelength from absorbance values at all wavelengths in sample
spectrum. As a result, absorbance of sample spectrum is zero at
specified baseline correction wavelength.
Related Topics
• Instrument Settings
Calculations for Nucleic Acid Measurements
The nucleic acid applications use the Beer-Lambert
equation to correlate absorbance with concentration.
Solving Beer’s law for concentration yields the equation
at the right.
Beer-Lambert Equation (solved for concentration)
c = A / ( * b)
where:
A = UV absorbance in absorbance units (AU)
= wavelength-dependent molar absorptivity coefficient (or extinction
coefficient) in liter/mol-cm
b = pathlength in cm
c = analyte concentration in moles/liter or molarity (M)
Note: Dividing the measured absorbance of a sample solution by its molar
extinction coefficient yields the molar concentration of the sample. See
Published Extinction Coefficients for more information regarding molar
vs. mass concentration values.
18 NanoDrop One User Guide Thermo Scientific
Page 25

Measure dsDNA, ssDNA or RNA
The Nucleic Acid applications use a modification of the
Beer-Lambert equation (shown at right) to calculate
sample concentration where the extinction coefficient
and pathlength are combined and referred to as a
“factor.”
For the dsDNA, ssDNA and RNA applications, the
generally accepted factors for nucleic acids are used in
conjunction with Beer’s Law to calculate sample
concentration. For the Custom Factor application, the
user-specified factor is used.
Extinction Coefficients vs Factors
Using the terms in the Beer-Lambert equation, factor (f) is defined as:
factor (f) = 1/( * b)
where:
= wavelength-dependent molar extinction coefficient in ng-cm/μL
b = sample pathlength in cm
As a result, analyte concentration (c) is calculated as:
c = A * [1/( * b)]
or
c = A * f
where:
c = analyte concentration in ng/μL
A = absorbance in absorbance units (A)
f = factor in ng-cm/μL (see below)
Factors Used
• dsDNA (factor = 50 ng-cm/μL)
• ssDNA (factor = 33 ng-cm/μL)
• RNA (factor = 40 ng-cm/μL)
• Custom Factor (user entered factor between 15 ng-cm/μL and
150 ng-cm/μL
Thermo Scientific NanoDrop One User Guide 19
Page 26

Measure dsDNA, ssDNA or RNA
Calculated nucleic acid concentrations are based on the
absorbance value at 260 nm, the factor used and the
sample pathlength. A single-point baseline correction (or
analysis correction) may also be applied.
Concentration is reported in mass units. Calculators are
available on the Internet to convert concentration from
mass to molar units based on sample sequence.
Absorbance values at 260 nm, 280 nm and sometimes
230 nm are used to calculate purity ratios for the
measured nucleic acid samples. Purity ratios are
sensitive to the presence of contaminants in the sample,
such as residual solvents and reagents typically used
during sample purification.
Measured Values
Note: For micro-volume absorbance measurements and measurements
taken with nonstandard (other than 10 mm) cuvettes, the spectra are
normalized to a 10 mm pathlength equivalent.
A260 absorbance
• Nucleic acid absorbance values are measured at 260 nm using the
normalized spectrum. This is the reported A260 value if Baseline
Correction is not selected.
•If Baseline Correction is selected, the absorbance value at the
correction wavelength is subtracted from the absorbance at 260 nm.
The corrected absorbance at 260 nm is reported and used to calculate
nucleic acid concentration.
A230 and A280 absorbance
• Normalized and baseline-corrected (if selected) absorbance values at
230 nm and 280 nm are used to calculate A260/A230 and A260/A280
ratios.
Sample Pathlength
• For micro-volume measurements, the software selects the optimal
pathlength (between 1.0 mm and 0.03 mm) based on sample
absorbance at the analysis wavelength.
• For cuvette measurements, pathlength is determined by the cuvette
Pathlength setting in the software (see General Settings).
• Displayed spectra and absorbance values are normalized to a 10 mm
pathlength equivalent.
20 NanoDrop One User Guide Thermo Scientific
Page 27

Measure dsDNA, ssDNA or RNA
Reported Values
• Nucleic acid concentration. Reported in selected unit (i.e., ng/μL,
μg/uL or μg/mL). Calculations are based on modified Beer’s Law
equation using corrected nucleic acid absorbance value.
• A260/A280 purity ratio. Ratio of corrected absorbance at 260 nm to
corrected absorbance at 280 nm. An A260/A280 purity ratio of ~1.8 is
generally accepted as “pure” for DNA (~2.0 for RNA). Acidic solutions
may under represent the reported value by 0.2-0.3; the opposite is true
for basic solutions.
• A260/A230 purity ratio. Ratio of corrected absorbance at 260 nm to
corrected absorbance at 230 nm. An A260/A230 purity ratio between
1.8 and 2.2 is generally accepted as “pure” for DNA and RNA.
Note: Although purity ratios are important indicators of sample quality,
the best quality indicator quality is functionality in the downstream
application of interest (e.g., real-time PCR).
Thermo Scientific NanoDrop One User Guide 21
Page 28

Page 29
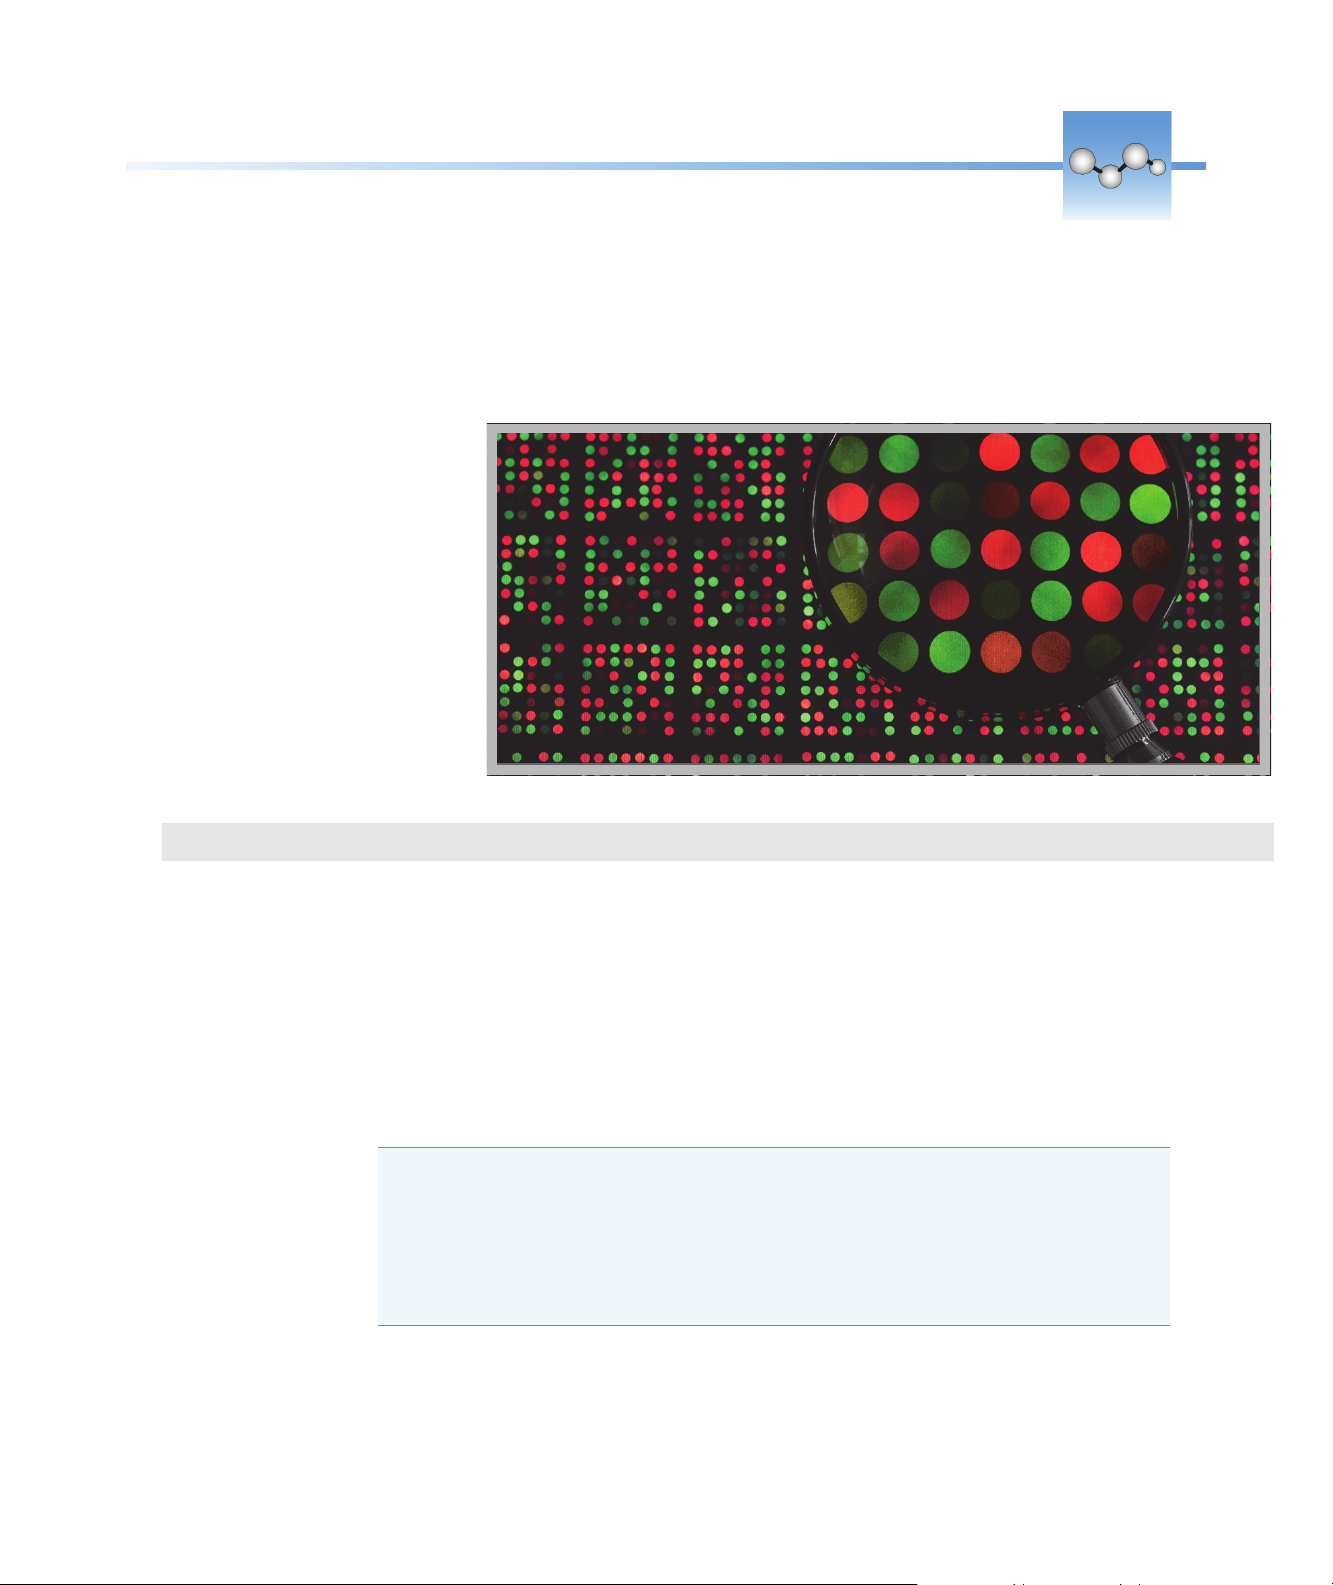
Measure Microarray
Measures the concentration of
purified nucleic acids that have been
labeled with up to two fluorescent
dyes for use in downstream
microarray applications.
Measure Microarray Samples
Reported Results
Settings
Detection Limits
Calculations
Measure Microarray Samples
Use the Microarray application to quantify nucleic acids that have been labeled with up to
two fluorescent dyes. The application reports nucleic acid concentration, an A260/A280 ratio
and the concentrations and measured absorbance values of the dye(s), allowing detection of
dye concentrations as low as 0.2 picomole per microliter.
To measure microarray samples
NOTICE
• Do not use a squirt or spray bottle on or near the instrument as liquids will flow into
the instrument and may cause permanent damage.
• Do not use hydrofluoric acid (HF) on the pedestals. Fluoride ions will permanently
damage the quartz fiber optic cables.
Thermo Scientific NanoDrop One User Guide 23
Page 30

Measure Microarray
Before you begin...
Before taking pedestal measurements with the NanoDrop One instrument, lift the instrument
arm and clean the upper and lower pedestals. At a minimum, wipe the pedestals with a new
laboratory wipe. For more information, see Cleaning the Pedestals.
24 NanoDrop One User Guide Thermo Scientific
Page 31

To measure a microarray sample
Dye absorbance peak
used to calculate dye
concentration
A260 absorbance peak
used to calculate nucleic
acid concentration
Typical microarray spectrum
1. From the Home screen, select the Nucleic Acids tab
and tap Microarray.
2. Specify the sample type and factor and the type of
dye(s) used.
Tip: Select a dye from the pre-defined list or add a
custom dye using the Dye/Chromophore Editor.
3. Pipette 1–2 μL blanking solution onto the lower
pedestal and lower the arm, or insert the blanking
cuvette into the cuvette holder.
Tip: If using a cuvette, make sure to align the cuvette
light path with the instrument light path.
4. Tap Blank and wait for the measurement to
complete.
Measure Microarray
Tip: If Auto-Blank is On, the blank measurement
starts automatically after you lower the arm. (This
option is not available for cuvette measurements.)
5. Lift the arm and clean both pedestals with a new
laboratory wipe, or remove the blanking cuvette.
6. Pipette 1-2 μL sample solution onto the pedestal and
lower the arm, or insert the sample cuvette into the
cuvette holder.
7. Start the sample measurement:
–Pedestal: If Auto-Measure is On, lower arm; if
Auto-Measure is off, lower arm and tap Measure.
– Cuvette: Tap Measure.
When the sample measurement is completed, the
spectrum and reported values are displayed (see the
next section).
8. When you are finished measuring samples, tap
End Experiment.
9. Lift the arm and clean both pedestals with a new
wipe, or remove the sample cuvette.
Thermo Scientific NanoDrop One User Guide 25
Page 32

Measure Microarray
Related Topics
• Best Practices for Nucleic Acid Measurements
• Measure a Micro-Volume Sample
• Measure a Sample Using a Cuvette
• Best Practices for Micro-Volume Measurements
• Best Practices for Cuvette Measurements
• Prepare Samples and Blanks
• Basic Instrument Operations
26 NanoDrop One User Guide Thermo Scientific
Page 33

Microarray Reported Results
Drag tab
down/up to
see more/less
sample data
Dye
concentration(s)
Tap row to
select sample
and update
spectrum; tap
more rows to
overlay up to five
spectra. Press
and hold
sample row to
view
measurement
details.
Nucleic acid
concentration
Tap to select unit
UV-visible spectrum
Menu of options;
tap to open
Sample name;
tap to edit
Swipe screen left to
view table with more
measurement results
Pinch and zoom to
adjust axes;
double-tap to reset
Tap to end
experiment and
export data
Microarray measurement screen
For each measured sample, this application shows the absorbance spectrum and a summary of
the results. Here is an example:
Measure Microarray
Note
• A baseline correction is performed at 750 nm (absorbance value at 750 nm is
subtracted from absorbance values at all wavelengths in sample spectrum).
• Micro-volume absorbance measurements and measurements taken with nonstandard
cuvettes are normalized to a 10.0 mm pathlength equivalent.
Thermo Scientific NanoDrop One User Guide 27
Page 34

Measure Microarray
Microarray reported values
The initial screen that appears after each measurement (see previous image) shows a summary
of the reported values. To view all reported values, press and hold the sample row. Here is an
example:
• sample details (application used and pedestal or cuvette)
•sample name
• created on (date sample measurement was taken)
• nucleic acid concentration
•A260
• A260/A280
• dye 1/dye 2 concentration
• sample type
• analysis correction
•factor
Related Topics
• Basic Instrument Operations
• Microarray Calculations
Settings for Microarray Measurements
Microarray settings
The Microarray Setup screen appears after you select the Microarray application from the
Nucleic Acids tab on the Home screen. To show the Microarry settings from the Microarray
measurement screen, tap > Microarray Setup.
28 NanoDrop One User Guide Thermo Scientific
Page 35

Setting Available Options Description
Measure Microarray
Sample type and
Factor
Dye 1/Dye 2 Type
dsDNA (with non-editable factor of
50 ng-cm/μL)
ssDNA (with non-editable factor of
33 ng-cm/μL)
RNA (with non-editable factor of
40 ng-cm/μL)
Oligo DNA with non-editable calculated
factor in ng-cm/μL
Oligo RNA with non-editable calculated
factor in ng-cm/μL
Custom (with user-specified factor in
ng-cm/μL)
a
Cy3, 5, 3.5, or 5.5,
Alexa Fluor 488, 546, 555, 594, 647, or
660
Widely accepted value for double-stranded DNA
Widely accepted value for single-stranded DNA
Widely accepted value for RNA
Factor calculated from user-defined DNA base sequence.
When selected, available DNA base units (i.e., G, A, T,
C) appear as keys. Define sequence by tapping
appropriate keys. Factor is calculated automatically based
on widely accepted value for each base unit.
Factor calculated from user-defined RNA base sequence.
When selected, available RNA base units (i.e., G, A, U,
C) appear as keys. Define sequence by tapping
appropriate keys. Factor is calculated automatically based
on widely accepted value for each base unit.
Enter factor between 15 ng-cm/μL and 150 ng-cm/μL
Select pre-defined dye(s) used to label sample material,
or one that has been added using Dye/Chrom. Editor.
Dye 1/Dye 2 Unit picomoles/microliter (pmol/uL),
micromoles (uM), or millimoles (mM)
Analysis
Correction
b
On or off
Enter analysis correction wavelength in nm
or use default value (340 nm)
a
To add a custom dye or edit the list of available dyes, use the Dye/Chromophore Editor.
b
The Analysis Correction affects the calculation for nucleic acid concentration only.
Select unit for reporting dye concentrations
Corrects sample absorbance measurement for any offset
caused by light scattering particulates by subtracting
absorbance value at specified analysis correction
wavelength from absorbance value at analysis
wavelength. Corrected value is used to calculate sample
concentration.
Tip: If the sample has a modification that absorbs light
at 340 nm, select a different correction wavelength or
turn off Analysis Correction.
Thermo Scientific NanoDrop One User Guide 29
Page 36

Measure Microarray
Tap to add
custom dye
Tap to edit
selected
custom dye
Tap to delete
selected
custom dye
Locked dye (pre-defined;
cannot be edited or deleted)
Selected dyes (will appear in Dye1
and Dye2 lists in Microarray Setup
or Proteins & Labels Setup)
Tap to close
Dye/Chrom. Editor
Custom dye (user-defined;
can be edited or deleted)
Dye/Chromophore Editor
Dye/chromophore editor
Use the Dye/Chromophore Editor to add a custom dye to the list of available dyes in
Microarray Setup or Proteins & Labels Setup. You can also specify which dyes are available in
that list.
To access the Dye/Chromophore Editor:
• from the Home screen, tap > Dye/Chrom. Editor
• from the Microarray or Proteins & Labels measurement screen, tap > Settings
> Dye/Chrom. Editor
30 NanoDrop One User Guide Thermo Scientific
These operations are available from the Dye/Chromophore Editor:
Page 37

Measure Microarray
Add or remove a dye
To add or remove a dye from the Dye1 or Dye2 drop-down list in Microarray Setup or
Proteins & Labels Setup:
– select or deselect corresponding checkbox
Add custom dye
– tap to show New Dye box
– enter unique Name for new dye (tap field to display keyboard, tap Done key to close
keyboard)
–select default Unit that will be used to display dye concentration
–enter dye’s Extinction Coefficient (or molar absorptivity constant) in L/mole-cm
(typically provided by dye manufacturer)
–specify Wa ve le ng th in nm (between 450 nm and 700 nm) that will be used to
measure dye’s absorbance
– specify dye’s correction values at 260 nm and 280 nm
–tap Add Dye
Note To determine dye correction values (if not available from dye manufacturer):
– use instrument to measure pure dye and note absorbance at 260 nm, 280 nm
and at analysis wavelength for dye (see above)
– calculate ratio of A
260/Adye wavelength
and enter that value for 260 nm
Correction
– calculate ratio of A
280/Adye wavelength
and enter that value for 280 nm
Correction
When a custom dye is selected before a measurement, the dye’s absorbance and
concentration values are reported and the corrections are applied to the measured sample
absorbance values, and to the resulting sample concentrations and purity ratios.
Edit custom dye
Tip Dyes pre-defined in the software cannot be edited.
– tap to select custom dye
–tap
Thermo Scientific NanoDrop One User Guide 31
Page 38

Measure Microarray
– edit any entries or settings
–tap Save Dye
Delete custom dye
Tip Dyes pre-defined in the software cannot be deleted.
– tap to select custom dye
–tap
NOTICE Deleting a custom dye permanently removes the dye and all associated
information from the software.
Related Topics
• Instrument Settings
Calculations for Microarray Measurements
As with the other nucleic acid applications, the
Microarray application uses a modification of the
Beer-Lambert equation to calculate sample
concentration where the extinction coefficient and
pathlength are combined and referred to as a “factor.”
The Microarray application offers six options (shown at
right) for selecting an appropriate factor for each
measured sample, to be used in conjunction with Beer’s
Law to calculate sample concentration.
If the factor is known, choose the Custom Factor option
and enter the factor in ng-cm/μL. Otherwise, choose the
option that best matches the sample solution.
Tip: Ideally, the factor or extinction coefficient should be
determined empirically using a solution of the study
nucleic acid at a known concentration using the same
buffer.
Available Options for Factors
• dsDNA (factor = 50 ng-cm/μL)
• ssDNA (factor = 33 ng-cm/μL)
• RNA (factor = 40 ng-cm/μL)
• Oligo DNA (calculated from user entered DNA nucleotide sequence)
• Oligo RNA (calculated from user entered RNA nucleotide sequence)
• Custom Factor (user entered factor between 15 ng-cm/μL and
150 ng-cm/μL
Note: See Sample Type for more information.
32 NanoDrop One User Guide Thermo Scientific
Page 39

Measure Microarray
Calculated nucleic acid concentrations are based on the
absorbance value at 260 nm, the factor used and the
sample pathlength. A single-point baseline correction (or
analysis correction) may also be applied.
Concentration is reported in mass units. Calculators are
available on the Internet to convert concentration from
mass to molar units based on sample sequence.
Absorbance values at 260 nm, 280 nm and sometimes
230 nm are used to calculate purity ratios for the
measured nucleic acid samples. Purity ratios are
sensitive to the presence of contaminants in the sample,
such as residual solvents and reagents typically used
during sample purification.
Measured Values
A260 absorbance
Note: The absorbance value at 750 nm is subtracted from all wavelengths
in the spectrum. As a result, the absorbance at 750 nm is zero in the
displayed spectra. Also, for micro-volume absorbance measurements and
measurements taken with nonstandard (other than 10 mm) cuvettes, the
spectra are normalized to a 10 mm pathlength equivalent.
• Nucleic acid absorbance values for all Microarray sample types are
measured at 260 nm using the 750-corrected and normalized
spectrum.
•If Analysis Correction is selected, the absorbance value at the
correction wavelength is subtracted from the absorbance at 260 nm.
• If one or more dyes are selected, the dye correction values at 260 nm
are also subtracted from the absorbance at 260 nm.
• The final corrected absorbance at 260 nm is reported and used to
calculate sample concentration.
A280 absorbance
Dye concentrations are calculated from the absorbance
value at the dye’s analysis wavelength, the dye’s
extinction coefficient, and the sample pathlength. A
sloped-line dye correction may also be used.
• 750-corrected and normalized absorbance value at 280 nm (minus the
A280 dye correction) is used to calculate an A260/A280 ratio.
Dye absorbance
• Dye absorbance values are measured at specific wavelengths. See
Dye/Chromophore Editor for analysis wavelengths used.
• If Sloping Dye Correction is selected, a linear baseline is drawn
between 400 nm and 750 nm and, for each dye, the absorbance value
of the sloping baseline is subtracted from the absorbance value at each
dye’s analysis wavelength. Baseline-corrected dye absorbance values are
reported and used to calculate dye concentrations.
Dye correction
• Pre-defined dyes have known correction values for A260 and A280.
See Dye/Chromophore Editor for correction values used.
• A260 dye corrections are subtracted from the A260 absorbance value
used to calculate nucleic acid concentration, and from the A260
absorbance value used to calculate the A260/A280 purity ratio.
Thermo Scientific NanoDrop One User Guide 33
Page 40

Measure Microarray
Sample Pathlength
• For micro-volume measurements, the software selects the optimal
pathlength (between 1.0 mm and 0.03 mm) based on sample
absorbance at the analysis wavelength.
• For cuvette measurements, pathlength is determined by the cuvette
Pathlength setting in the software (see General Settings).
• Displayed spectra and absorbance values are normalized to a 10 mm
pathlength equivalent.
•
Reported Values
• Nucleic acid concentration. Reported in selected unit (i.e., ng/μL,
μg/uL or μg/mL). Calculations are based on modified Beer’s Law
equation using corrected nucleic acid absorbance value.
• A260/A280 purity ratio. Ratio of corrected absorbance at 260 nm to
corrected absorbance at 280 nm. An A260/A280 purity ratio of ~1.8 is
generally accepted as “pure” for DNA (~2.0 for RNA). Acidic solutions
may under represent the reported value by 0.2-0.3; the opposite is true
for basic solutions.
• Dye1/Dye2 concentration. Reported in pmol/μL. Calculations are
based on Beer’s Law equation using (sloping) baseline-corrected dye
absorbance value(s).
Note: Although purity ratios are important indicators of sample quality,
the best indicator of DNA or RNA quality is functionality in the
downstream application of interest (e.g., microarray).
Related Topics
• Calculations for Nucleic Acid Measurements
34 NanoDrop One User Guide Thermo Scientific
Page 41

Measure using a Custom Factor
Measures the concentration of
purified nucleic acids using a
custom factor for the calculations.
Measure using Custom Factor
Reported Results
Settings
Detection Limits
Calculations
Measure Nucleic Acid using a Custom Factor
Use the Custom Factor application to quantify purified DNA or RNA samples that absorb at
260 nm with a user-defined extinction coefficient or factor. The application reports nucleic
acid concentration and two absorbance ratios (A260/A280 and A260/A230). A single-point
baseline correction can also be used.
To measure nucleic acid samples using a custom factor
NOTICE
• Do not use a squirt or spray bottle on or near the instrument as liquids will flow into
the instrument and may cause permanent damage.
• Do not use hydrofluoric acid (HF) on the pedestals. Fluoride ions will permanently
damage the quartz fiber optic cables.
Thermo Scientific NanoDrop One User Guide 35
Page 42

Measure using a Custom Factor
Typical nucleic acid spectrum
Before you begin...
Before taking pedestal measurements with the NanoDrop One instrument, lift the instrument
arm and clean the upper and lower pedestals. At a minimum, wipe the pedestals with a new
laboratory wipe. For more information, see Cleaning the Pedestals.
To measure using a custom factor
1. From the Home screen, select the Nucleic Acids tab
and tap Custom Factor.
2. Enter the factor to be used for the calculations and
specify a baseline correction if desired.
3. Pipette 1–2 μL blanking solution onto the lower
pedestal and lower the arm, or insert the blanking
cuvette into the cuvette holder.
Tip: If using a cuvette, make sure to align the cuvette
light path with the instrument light path.
4. Tap Blank and wait for the measurement to
complete.
Tip: If Auto-Blank is On, the blank measurement
starts automatically after you lower the arm. (This
option is not available for cuvette measurements.)
5. Lift the arm and clean both pedestals with a new
laboratory wipe, or remove the blanking cuvette.
6. Pipette 1-2 μL sample solution onto the pedestal and
lower the arm, or insert the sample cuvette into the
cuvette holder.
7. Start the sample measurement:
–Pedestal: If Auto-Measure is On, lower arm; if
Auto-Measure is off, lower arm and tap Measure.
– Cuvette: Tap Measure.
When the sample measurement is completed, the
spectrum and reported values are displayed (see the
next section).
8. When you are finished measuring samples, tap
End Experiment.
9. Lift the arm and clean both pedestals with a new
wipe, or remove the sample cuvette.
36 NanoDrop One User Guide Thermo Scientific
Page 43

Related Topics
• Measure a Micro-Volume Sample
• Measure a Sample Using a Cuvette
• Best Practices for Micro-Volume Measurements
• Best Practices for Cuvette Measurements
• Prepare Samples and Blanks
• Basic Instrument Operations
Custom Factor Reported Results
Measure using a Custom Factor
For each measured sample, this application shows the absorbance spectrum and a summary of
the results. Here is an example:
Note The Custom Factor measurement screen is identical to the measurement screen for
the other nucleic acid applications except the Custom Factor is reported in the lower left
corner (see image below).
Thermo Scientific NanoDrop One User Guide 37
Page 44

Measure using a Custom Factor
Custom factor used to calculate
nucleic acid concentration
Related Topics
• Basic Instrument Operations
• Nucleic Acid Reported Results
• Nucleic Acid Calculations
38 NanoDrop One User Guide Thermo Scientific
Page 45

Settings for Nucleic Acid Measurements using a Custom Factor
To show the Custom Factor settings, tap > Custom Factor Setup.
Setting Available Options Description
Measure using a Custom Factor
Custom Factor Enter an integer value
between 15 ng-cm/μL
and 150 ng-cm/μL
Baseline Correction On or off
Enter baseline correction
wavelength in nm or use
default value (340 nm)
Related Topics
Constant used to calculate nucleic acid concentration in
modified Beer’s Law equation. Based on extinction coefficient
and pathlength:
f = 1/(
* b))
260
where:
f= factor
= molar extinction coefficient at 260 nm in ng-cm/μL
b = sample pathlength in cm (1 cm for nucleic acids measured
with the NanoDrop One instruments)
Optional user-defined baseline correction. Can be used to
correct for any offset caused by light scattering particulates by
subtracting measured absorbance at specified baseline correction
wavelength from absorbance values at all wavelengths in sample
spectrum. As a result, absorbance of sample spectrum is zero at
specified baseline correction wavelength.
• Instrument Settings
Detection Limits for Nucleic Acid Measurements using a Custom Factor
The lower detection limits and reproducibility specifications for nucleic acids are provided
here. The upper detection limits are dependent on the upper absorbance limit of the
instrument and the user-defined extinction coefficients.
To calculate upper detection limits for nucleic acid samples
To calculate upper detection limits in ng/μL, use the following equation:
(upper absorbance limit
Thermo Scientific NanoDrop One User Guide 39
instrumen
* extinction coefficient
t
sample
)
Page 46

Measure using a Custom Factor
For example, for a sample measurement using an extinction coefficient of 55, the equation
looks like this:
(550 AU * 55 ng-cm/μL) = 30,250 ng/μL
Note For measurements with 10 mm pathlength cuvettes, the upper absorbance limit is
1.5 AU, which is approximately 75 ng/μL for dsDNA.
Related Topics
• Detection Limits for All Applications
40 NanoDrop One User Guide Thermo Scientific
Page 47

Measure Oligo DNA or Oligo RNA
Measures the concentration of
purified ssDNA or RNA
oligonucleotides that absorb at
260 nm.
Measure Oligo DNA or RNA
Reported Results
Settings
Detection Limits
Calculations
Measure Oligo DNA or Oligo RNA
Use the Oligo DNA and Oligo RNA applications to quantify oligonucleotides that absorb at
260 nm. Molar extinction coefficients are calculated automatically based on the user-defined
base sequence of the sample. These applications report nucleic acid concentration and two
absorbance ratios (A260/A280 and A260/A230). A single-point baseline correction can also
be used.
Note If the oligonucleotide has been modified, for example with a fluorophore dye, check
with the oligo manufacturer to determine if the modification contributes absorbance at
260 nm. If it does, we recommend using the Microarray application to quantify nucleic
acid concentration. The Microarray application includes a correction to remove any
absorbance contribution due to the dye from the oligo quantification result.
Thermo Scientific NanoDrop One User Guide 41
Page 48

Measure Oligo DNA or Oligo RNA
To measure Oligo DNA or Oligo RNA samples
NOTICE
• Do not use a squirt or spray bottle on or near the instrument as liquids will flow into
the instrument and may cause permanent damage.
• Do not use hydrofluoric acid (HF) on the pedestals. Fluoride ions will permanently
damage the quartz fiber optic cables.
Before you begin...
Before taking pedestal measurements with the NanoDrop One instrument, lift the instrument
arm and clean the upper and lower pedestals. At a minimum, wipe the pedestals with a new
laboratory wipe. For more information, see Cleaning the Pedestals.
42 NanoDrop One User Guide Thermo Scientific
Page 49

To measure an oligonucleotide sample
Example Oligo DNA spectrum
1. From the Home screen, select the Nucleic Acids tab
and tap either Oligo DNA or Oligo RNA, as needed.
2. Specify the Oligo base sequence and a baseline
correction if desired.
3. Pipette 1–2 μL blanking solution onto the lower
pedestal and lower the arm, or insert the blanking
cuvette into the cuvette holder.
Tip: If using a cuvette, make sure to align the cuvette
light path with the instrument light path.
4. Tap Blank and wait for the measurement to
complete.
Tip: If Auto-Blank is On, the blank measurement
starts automatically after you lower the arm. (This
option is not available for cuvette measurements.)
Measure Oligo DNA or Oligo RNA
5. Lift the arm and clean both pedestals with a new
laboratory wipe, or remove the blanking cuvette.
6. Pipette 1-2 μL sample solution onto the pedestal and
lower the arm, or insert the sample cuvette into the
cuvette holder.
7. Start the sample measurement:
–Pedestal: If Auto-Measure is On, lower arm; if
Auto-Measure is off, lower arm and tap Measure.
– Cuvette: Tap Measure.
When the sample measurement is completed, the
spectrum and reported values are displayed (see the
next section).
8. When you are finished measuring samples, tap
End Experiment.
9. Lift the arm and clean both pedestals with a new
wipe, or remove the sample cuvette.
Related Topics
• Best Practices for Nucleic Acid Measurements
Thermo Scientific NanoDrop One User Guide 43
Page 50

Measure Oligo DNA or Oligo RNA
• Measure a Micro-Volume Sample
• Measure a Sample Using a Cuvette
• Best Practices for Micro-Volume Measurements
• Best Practices for Cuvette Measurements
• Prepare Samples and Blanks
• Basic Instrument Operations
44 NanoDrop One User Guide Thermo Scientific
Page 51

Oligo Reported Results
Nucleic acid
concentration
Tap row to
select sample
and update
spectrum; tap
more rows to
overlay up to five
spectra. Press
and hold
sample row to
view
measurement
details.
Drag tab
down/up to see
more/less
sample data
UV spectrum
1
Purity ratios
Tap to select unitSample name;
tap to edit
Menu of options;
tap to open
Swipe screen left to
view table with more
measurement results
Pinch and zoom to
adjust axes;
double-tap to reset
Tap to end
experiment and
export data
Oligo DNA measurement screen
For each measured sample, the Oligo DNA and Oligo RNA applications show the UV
absorbance spectrum and a summary of the results. Here is an example:
Measure Oligo DNA or Oligo RNA
1
Measured oligo: TTT TTT TTT TTT TTT TTT TTT TTT
Note Micro-volume absorbance measurements and measurements taken with
nonstandard cuvettes are normalized to a 10.0 mm pathlength equivalent.
Thermo Scientific NanoDrop One User Guide 45
Page 52

Measure Oligo DNA or Oligo RNA
Oligo DNA and Oligo RNA reported values
The initial screen that appears after each measurement (see previous image) shows a summary
of the reported values. To view all reported values, press and hold the sample row. Here is an
example:
• sample details (application and sampling method used, i.e., pedestal or cuvette)
•sample name
• created on (date sample measurement was taken)
• nucleic acid concentration
• A260/A280
• A260/A230
•A260
•A280
•factor
• oligo sequence
• baseline correction
•stirrer status
Note The five nucleotides that comprise DNA and RNA exhibit widely varying
A260/A280 ratios. See Oligo Purity Ratios for more information.
Related Topics
• Basic Instrument Operations
•Oligo Calculations
46 NanoDrop One User Guide Thermo Scientific
Page 53

Settings for Oligo DNA and Oligo RNA Measurements
Add guanine
Add adenine
Add thymine (DNA)
or uracil (RNA)
Add cytosine
Remove most
recent base
The Oligo setup screen appears after you select the Oligo DNA or Oligo RNA application
from the Nucleic Acids tab on the Home screen. To show the Oligo settings from the
Oligo DNA or Oligo RNA measurement screen, tap > Oligo DNA Setup (or
Oligo RNA Setup).
Setting Available Options Description
Measure Oligo DNA or Oligo RNA
Oligo Base
Sequence
for DNA: Use the
G, A, T and C keys to
specify the DNA base
sequence
for RNA: Use the
G, A, U and C keys to
specify the RNA base
sequence
Specify your DNA or RNA base sequence by tapping the corresponding keys:
Each time a base is added to the sequence, the software calculates the following:
• Factor. Constant used to calculate oligonucleotide concentration in modified
Beer’s Law equation. Based on extinction coefficient and pathlength:
f = 1/(
* b)
260
where:
f= factor
= molar extinction coefficient at 260 nm in ng-cm/μL
b = sample pathlength in cm (0.1 cm for nucleic acids measured with the
NanoDrop One instrument)
Thermo Scientific NanoDrop One User Guide 47
Page 54

Measure Oligo DNA or Oligo RNA
Setting Available Options Description
• Molecular Weight of oligo calculated from user-defined base sequence.
• Number of Bases entered.
• Molar Ext. Coefficient (260 nm). Molar extinction coefficient of oligo (in
ng-cm/μL) at 260 nm calculated from entered base sequence.
• %GC. Percentage of guanine and cytosine residues in total number of bases
entered.
Baseline Correction On or off
Enter baseline
correction wavelength
in nm or use default
value (340 nm)
Corrects for any offset caused by light scattering particulates by subtracting
measured absorbance at specified baseline correction wavelength from absorbance
values at all wavelengths in sample spectrum. As a result, absorbance of sample
spectrum is zero at specified baseline correction wavelength.
Tip: If the sample has a modification that absorbs light at 340 nm, select a
different correction wavelength or turn off Baseline Correction.
Related Topics
• Instrument Settings
Detection Limits for Oligo DNA and Oligo RNA Measurements
The lower detection limits and reproducibility specifications for the oligonucleotide sample
types (ssDNA and RNA) are provided here. The upper detection limits are dependent on the
upper absorbance limit of the instrument and the extinction coefficients for the user-defined
base sequences.
To calculate upper detection limits for nucleic acid samples
To calculate upper detection limits in ng/μL, use the following equation:
(upper absorbance limit
For example, for a sample measurement using an extinction coefficient of 55, the equation
looks like this:
(550 AU * 55 ng-cm/μL) = 30,250 ng/μL
Note For measurements with 10 mm pathlength cuvettes, the upper absorbance limit is
1.5 AU, which is approximately 75 ng/μL for dsDNA.
48 NanoDrop One User Guide Thermo Scientific
instrumen
* extinction coefficient
t
sample
)
Page 55

Related Topics
260
1
2
3
1
N
+
2
N1–
–
1
N1–
=
• Detection Limits for All Applications
Calculations for Oligo DNA and Oligo RNA Measurements
Measure Oligo DNA or Oligo RNA
As with the other nucleic acid applications, the Oligo
applications use the Beer-Lambert equation to correlate
absorbance with concentration based on the sample’s
extinction coefficient and pathlength. Because
oligonucleotides are short, single-stranded molecules (or
longer molecules of repeating sequences), their
spectrum and extinction coefficient (
dependent on base composition and sequence.
(The generally accepted extinction coefficients and
factors for single-stranded DNA and RNA provide a
reasonable estimate for natural, essentially randomized,
sequences but not for short, synthetic oligo sequences.)
To ensure the most accurate results, we use the exact
value of
The NanoDrop software allows you to specify the base
sequence of an oligonucleotide before it is measured.
For any entered base sequence, the software uses the
equation at the right to calculate the extinction
coefficient.
Tip: The extinction coefficient is wavelength specific for
each oligonucleotide and can be affected by buffer type,
ionic strength and pH.
to calculate oligonucleotide concentration.
260
) are closely
Extinction Coefficients for Oligonucleotides
The software uses the nearest neighbor method and the following formula
to calculate molar extinction coefficients for specific oligonucleotide base
sequences:
where:
= molar extinction coefficient in L/mole-cm
=
1
nearest neighbor
=
2
individual bases
=
3
modifications, such as fluorescent dyes
Thermo Scientific NanoDrop One User Guide 49
Page 56

Measure Oligo DNA or Oligo RNA
Calculated nucleic acid concentrations are based on the
absorbance value at 260 nm, the factor used and the
sample pathlength. A single-point baseline correction (or
analysis correction) may also be applied.
Concentration is reported in mass units. Calculators are
available on the Internet to convert concentration from
mass to molar units based on sample sequence.
Absorbance values at 260 nm, 280 nm and sometimes
230 nm are used to calculate purity ratios for the
measured nucleic acid samples. Purity ratios are
sensitive to the presence of contaminants in the sample,
such as residual solvents and reagents typically used
during sample purification.
Measured Values
A260 absorbance
Note: For micro-volume absorbance measurements and measurements
taken with nonstandard (other than 10 mm) cuvettes, the spectra are
normalized to a 10 mm pathlength equivalent.
• Nucleic acid absorbance values are measured at 260 nm using the
normalized spectrum. This is the reported A260 value if Baseline
Correction is not selected.
•If Baseline Correction is selected, the absorbance value at the
correction wavelength is subtracted from the sample absorbance at
260 nm. The corrected absorbance at 260 nm is reported and used to
calculate nucleic acid concentration.
A230, A280 absorbance
• Normalized absorbance values at 230 nm, 260 nm and 280 nm are
used to calculate A260/A230 and A260/A280 ratios.
Sample Pathlength
• For micro-volume measurements, the software selects the optimal
pathlength (between 1.0 mm and 0.03 mm) based on sample
absorbance at the analysis wavelength.
• For cuvette measurements, pathlength is determined by the cuvette
Pathlength setting in the software (see General Settings).
• Displayed spectra and absorbance values are normalized to a 10 mm
pathlength equivalent.
•
50 NanoDrop One User Guide Thermo Scientific
Page 57

Measure Oligo DNA or Oligo RNA
The five nucleotides that comprise DNA and RNA exhibit
widely varying A260/A280 ratios. Estimated A260/A280
ratios for each independently measured nucleotide are
provided below:
Guanine: 1.15
Adenine: 4.50
Cytosine: 1.51
Uracil: 4.00
Thymine: 1.47
The A260/A280 ratio for a specific nucleic acid sequence
is approximately equal to the weighted average of the
A260/A280 ratios for the four nucleotides present.
Note: RNA will typically have a higher 260/280 ratio due
to the higher ratio of Uracil compared to that of Thymine.
Related Topics
• Calculations for Nucleic Acid Measurements
Reported Values
• Nucleic acid concentration. Reported in selected unit (i.e., ng/μL,
μg/uL or μg/mL). Calculations are based on modified Beer’s Law
equation using corrected nucleic acid absorbance value.
• A260/A280 purity ratio. Ratio of corrected absorbance at 260 nm to
corrected absorbance at 280 nm.
• A260/A230 purity ratio. Ratio of corrected absorbance at 260 nm to
corrected absorbance at 230 nm.
Note: The traditional purity ratios (A260/A280 and A260/A230), which
are used as indicators of the presence of various contaminants in nucleic
acid samples, do not apply for oligonucleotides because the shapes of their
spectra are highly dependent on their base compositions. See side bar for
more information.
Thermo Scientific NanoDrop One User Guide 51
Page 58

Page 59

Measure Protein A280
Measures the concentration of
purified protein populations that
absorb at 280 nm.
Measure A280 Proteins
Reported Results
Settings
Detection Limits
Calculations
Measure Protein Concentration at A280
Use the Protein A280 application to quantify purified protein populations that contain amino
acids such as tryptophan or tyrosine, or cys-cys disulfide bonds, which exhibit absorbance at
280 nm. This application reports protein concentration measured at 280 nm and one
absorbance ratio (A260/A280). A single-point baseline correction can also be used. This
application does not require a standard curve.
Note If your samples contain mainly peptide bonds and little or no amino acids, use the
Protein A205 application instead of Protein A280.
To measure Protein A280 samples
NOTICE
• Do not use a squirt or spray bottle on or near the instrument as liquids will flow into
the instrument and may cause permanent damage.
• Do not use hydrofluoric acid (HF) on the pedestals. Fluoride ions will permanently
damage the quartz fiber optic cables.
Thermo Scientific NanoDrop One User Guide 53
Page 60

Measure Protein A280
Before you begin...
Before taking pedestal measurements with the NanoDrop One instrument, lift the instrument
arm and clean the upper and lower pedestals. At a minimum, wipe the pedestals with a new
laboratory wipe. For more information, see Cleaning the Pedestals.
54 NanoDrop One User Guide Thermo Scientific
Page 61

To measure a Protein A280 sample
High concentration BSA sample
Low concentration BSA sample
1. From the Home screen, select the Proteins tab and
tap Protein A280.
2. Specify a sample type and baseline correction if
desired.
3. Pipette 1–2 μL blanking solution onto the lower
pedestal and lower the arm, or insert the blanking
cuvette into the cuvette holder.
Tip: If using a cuvette, make sure to align the cuvette
light path with the instrument light path.
4. Tap Blank and wait for the measurement to
complete.
Tip: If Auto-Blank is On, the blank measurement
starts automatically after you lower the arm. (This
option is not available for cuvette measurements.)
Measure Protein A280
5. Lift the arm and clean both pedestals with a new
laboratory wipe, or remove the blanking cuvette.
6. Pipette 2 μL sample solution onto the pedestal and
lower the arm, or insert the sample cuvette into the
cuvette holder.
7. Start the sample measurement:
–Pedestal: If Auto-Measure is On, lower arm; if
Auto-Measure is off, lower arm and tap Measure.
– Cuvette: Tap Measure
When the sample measurement is completed, the
spectrum and reported values are displayed (see the
next section).
8. When you are finished measuring samples, tap
End Experiment.
9. Lift the arm and clean both pedestals with a new
wipe, or remove the sample cuvette.
Thermo Scientific NanoDrop One User Guide 55
Page 62

Measure Protein A280
Best practices for protein measurements
• Isolate and purify protein samples before measurement to remove impurities. Depending
on the sample, impurities could include DNA, RNA and some buffer components. See
Preparing Samples for more information.
Note Extraction reagents that contribute absorbance between 200 nm and 280 nm
will affect measurement results if present in samples (even residual amounts).
• Ensure the sample absorbance is within the instrument’s absorbance detection limits.
• Choosing a blank:
– For the Protein A280, Protein A205, and Proteins & Labels applications, blank with
the same buffer solution used to resuspend the analyte of interest. The blanking
solution should be a similar pH and ionic strength as the analyte solution.
– For the Protein BCA, Protein Bradford, and Protein Lowry applications, blank with
deionized water (DI H
– For the Protein Pierce 660 application, blank with the reference solution used to
make the standard curve (reference solution should contain none of the standard
protein stock). For more information, see Working with standard c u r ves.
2
O).
•Run a blanking cycle to assess the absorbance contribution of your buffer solution. If the
buffer exhibits strong absorbance at or near the analysis wavelength (typically 280 nm or
205 nm), you may need to choose a different buffer or application, such as a colorimetric
assay (for example, BCA or Pierce 660). See Choosing and Measuring a Blank for more
information.
Note Buffers such as Triton X, RIPA, and NDSB contribute significant absorbance
and are not compatible with direct A280 or A205 measurements.
• For micro-volume measurements:
– Ensure pedestal surfaces are properly cleaned and conditioned. (Proteins tend to stick
to pedestal surfaces.)
– Gently (but thoroughly) vortex samples before taking a measurement. Avoid
introducing bubbles when mixing and pipetting.
– Follow best practices for micro-volume measurements.
– Use a 2 μL sample volume. See Recommended Sample Volumes for more
information.
C
• For cuvette measurements (NanoDrop One
instruments only), use compatible cuvettes
and follow best practices for cuvette measurements.
56 NanoDrop One User Guide Thermo Scientific
Page 63

Related Topics
• Best practices for protein measurements
• Measure a Micro-Volume Sample
• Measure a Sample Using a Cuvette
• Prepare Samples and Blanks
• Basic Instrument Operations
Protein A280 Reported Results
Protein A280 measurement screen
Measure Protein A280
For each measured sample, this application shows the absorbance spectrum and a summary of
the results. Here is an example:
Thermo Scientific NanoDrop One User Guide 57
Page 64

Measure Protein A280
Tap row to
select sample
and update
spectrum; tap
more rows to
overlay up to five
spectra. Press
and hold
sample row to
view
measurement
details.
Drag tab
down/up to see
more/less
sample data
Swipe screen left to
view table with more
measurement results
Pinch and zoom to
adjust axes;
double-tap to reset
Tap to end
experiment and
export data
UV spectrum
Tap to select unitMenu of options;
tap to open
Sample name;
tap to edit
Protein
concentration
Absorbance
at 280 nm
Purity ratio
Note Micro-volume absorbance measurements and measurements taken with
nonstandard cuvettes are normalized to a 10.0 mm pathlength equivalent.
Protein A280 reported values
The initial screen that appears after each measurement (see previous image) shows a summary
of the reported values. To view all reported values, press and hold the sample row. Here is an
example:
58 NanoDrop One User Guide Thermo Scientific
Page 65

Measure Protein A280
Sample name;
tap to edit
Sampling
method
Application
Date/time
measured
Protein conc.
Absorbance
at 280 nm
Sample type
Baseline correction
wavelength
Baseline correction
absorbance
Purity ratio
Settings for Protein A280 Measurements
Related Topics
• Basic Instrument Operations
• Protein A280 Calculations
To show the Protein A280 settings, from the Protein A280 measurement screen, tap >
Protein A280 Setup.
Protein A280 settings
The Protein A280 application provides a variety of sample type options for purified protein
analysis.
Thermo Scientific NanoDrop One User Guide 59
Page 66

Measure Protein A280
Each sample type applies a unique extinction coefficient to the protein calculations. If the
extinction coefficient of the sample is known, choose the
option and enter the value. Otherwise, calculate the extinction coefficient or choose the
option that best matches the sample solution. If you only need a rough estimate of protein
concentration and the sample extinction coefficient is unknown, select the 1 Abs=1 mg/mL
sample type option.
Tip Ideally, the extinction coefficient should be determined empirically using a solution of
the study protein at a known concentration using the same buffer.
+ MW (molar) or 1% (mass)
Setting Available Options
Sample type
a
1 Abs = 1 mg/mL General reference Recommended when extinction coefficient is unknown
BSA 6.67 Calculates BSA (Bovine Serum Albumin) protein
IgG 13.7 Suitable for most mammalian antibodies (i.e.,
Mass Ext. Coefficient
(L/gm-cm)
Description
and rough estimate of protein concentration is
acceptable for a solution with no other interfering
substances. Assumes 0.1% (1 mg/mL) protein solution
produces 1.0A at 280 nm (where pathlength is 10 mm),
i.e.,
1% = 10.
concentration using mass extinction coefficient (
6.67 L/gm-cm at 280 nm for 1% (i.e., 10 mg/mL) BSA
solution. Assuming MW is 66,400 daltons (Da), molar
extinction coefficient at 280 nm for BSA is
approximately 43,824 M
immunoglobulin G or IgG). Calculates protein
concentration using mass extinction coefficient (
13.7 L/gm-cm at 280 nm for 1% (i.e., 10 mg/mL) IgG
solution. Assuming MW is 150,000 Da, molar
extinction coefficient at 280 nm for IgG is
approximately 210,000 M
-1cm-1
-1cm-1
.
.
) of
) of
Lysozyme 26.4 Calculates lysozyme protein concentration using mass
extinction coefficient (
for 1% (i.e., 10 mg/mL) lysozyme solution. Assumes
molar extinction coefficient for egg white lysozyme
ranges between 36,000 M
60 NanoDrop One User Guide Thermo Scientific
) of 26.4 L/gm-cm at 280 nm
-1cm-1
and 39,000 M-1cm-1.
Page 67

Measure Protein A280
Setting Available Options
Other protein
(
+ MW)
Other protein
(
1%)
Baseline
Correction
On or off
Enter baseline correction
wavelength in nm or use
default value (340 nm)
Mass Ext. Coefficient
(L/gm-cm)
User entered molar
extinction coefficient
and molecular weight
Description
Assumes protein has known molar extinction coefficient
() and molecular weight (MW), where:
(
)*10=(
molar
Enter MW in kiloDaltons (kDa) and molar extinction
coefficient (
) in M
percent
)*(MW
-1cm-1
protein
divided by 1000 (i.e.,
)
/1000). For example, for protein with molar extinction
coefficient of 210,000 M
User entered mass
extinction coefficient
N/A Corrects for any offset caused by light scattering
Assumes protein has known mass extinction coefficient
(). Enter mass extinction coefficient in L/gm-cm for
10 mg/mL (
particulates by subtracting measured absorbance at
specified baseline correction wavelength from
absorbance values at all wavelengths in sample spectrum.
As a result, absorbance of sample spectrum is zero at
specified baseline correction wavelength.
Tip: If the sample has a modification that absorbs light
at 340 nm, select a different correction wavelength or
turn off Baseline Correction.
1%) protein solution.
-1cm-1
, enter 210.
a
To add or edit a custom protein, use Protein Editor.
Protein editor
Use the Protein Editor to add a custom protein to the list of available protein sample types in
Protein A280 Setup and Proteins & Labels Setup.
To access the Protein Editor:
• from the Home screen, tap > Protein Editor
• from the Protein A280 or Proteins & Labels measurement screen, tap >
Settings > Protein Editor
Thermo Scientific NanoDrop One User Guide 61
Page 68

Measure Protein A280
Tap to add
custom protein
Tap to edit
selected
custom protein
Tap to delete
selected
custom protein
Custom proteins (will appear in
Sample Type list in Protein A280
Setup and Proteins & Labels Setup)
Tap to close Protein Editor
Protein Editor
These operations are available from the Protein Editor:
Add custom protein
– in Protein Editor, tap to show New Protein Type box
– enter unique Name for new protein (tap field to display keyboard, tap Done key to
close keyboard)
–enter Description for new protein
– specify whether to enter Molar Extinction coefficient or Mass Extinction coefficient
for custom protein
–if Mass Extinction coefficient is selected
– enter mass extinction coefficient in L/gm-cm for 10 mg/mL (
solution
1%) protein
62 NanoDrop One User Guide Thermo Scientific
Page 69

Measure Protein A280
Tap a field to show keyboard;
to close, tap Done key
–if Molar Extinction is selected
– enter molar extinction coefficient (
/1000). For example, for protein with molar extinction coefficient of
210,000 M
– enter molecular weight (MW) in kiloDaltons (kDa)
–tap OK to close New Protein Type box
After you choose OK, the new custom protein appears in the Type list in Protein A280
Setup and Proteins & Labels Setup.
Edit custom protein
– in Protein Editor, tap to select custom protein
– tap to show Edit Protein Type box
– edit any entries or settings
–tap OK
-1cm-1
, enter 210
) in M
-1cm-1
divided by 1000 (i.e.,
Thermo Scientific NanoDrop One User Guide 63
Page 70

Measure Protein A280
Delete custom protein
– in Protein Editor, tap to select custom protein
–tap
Note Deleting a custom protein permanently removes the protein and all associated
information from the software.
Related Topics
• Instrument Settings
Detection Limits for Protein A280 Measurements
Detection limits and reproducibility specifications for purified BSA proteins are provided
here. The BSA lower detection limit and reproducibility values apply to any protein sample
type. The upper detection limits are dependent on the upper absorbance limit of the
instrument and the sample’s extinction coefficient.
To calculate upper detection limits for other (non-BSA) protein
sample types
To calculate upper detection limits in ng/μL for proteins, use the following equation:
(upper absorbance limit
For example, if the sample’s mass extinction coefficient at 280 nm is 6.67 for a 1%
(10 mg/mL) solution, the equation looks like this:
(550 / 6.67) * 10 = 824.6 (or ~825)
instrumen
Related Topics
• Detection Limits for All Applications
/mass extinction coefficient
t
sample
) * 10
64 NanoDrop One User Guide Thermo Scientific
Page 71

Calculations for Protein A280 Measurements
Measure Protein A280
The Protein A280 application uses the Beer-Lambert
equation to correlate absorbance with concentration.
Solving Beer’s law for concentration yields the equation
at the right.
The extinction coefficient of a peptide or protein is
related to its tryptophan (W), tyrosin (Y) and cysteine (C)
amino acid composition.
Tip: The extinction coefficient is wavelength specific for
each protein and can be affected by buffer type, ionic
strength and pH.
Beer-Lambert Equation (solved for concentration)
c = A / ( * b)
where:
A = UV absorbance in absorbance units (AU)
= wavelength-dependent molar absorptivity coefficient (or extinction
coefficient) in liter/mol-cm
b = pathlength in cm
c = analyte concentration in moles/liter or molarity (M)
Note: Dividing the measured absorbance of a sample solution by its molar
extinction coefficient yields the molar concentration of the sample. See
Published Extinction Coefficients for more information regarding molar
vs. mass concentration values.
Extinction Coefficients for Proteins
At 280 nm, the extinction coefficient is approximated by the weighted sum
of the 280 nm molar extinction coefficients of the three constituent amino
acids, as described in this equation:
= (nW * 5500) + (nY * 1490) + (nC * 125)
where:
= molar extinction coefficient
n = number of each amino acid residue
5500, 1490 and 125 = amino acid molar absorptivities at 280 nm
Thermo Scientific NanoDrop One User Guide 65
Page 72

Measure Protein A280
This application offers six options (shown at right) for
selecting an appropriate extinction coefficient for each
measured sample, to be used in conjunction with Beer’s
Law to calculate sample concentration.
If the extinction coefficient of the sample is known,
choose the
enter the value. Otherwise, calculate the extinction
coefficient or choose the option that best matches the
sample solution.
Tip: Ideally, the extinction coefficient should be
determined empirically using a solution of the study
protein at a known concentration using the same buffer.
Most sources report extinction coefficients for proteins
measured at or near 280 nm in phosphate or other
physiologic buffer. These values provide sufficient
accuracy for routine assessments of protein
concentration.
+ MW (molar) or 1% (mass) option and
Available Options for Extinction Coefficient
• 1 Abs = 1 mg/mL, where sample type and/or ext. coefficient is
unknown (produces rough estimate of protein concentration)
• BSA (Bovine Serum Albumin, 6.67 L/gm-cm)
• IgG (any mammalian antibody, 13.7 L/gm-cm)
• Lysozyme (egg white lysozyme, 26.4 L/gm-cm)
• Other protein (
• Other protein (
•
Note: See Sample Type for details.
Published Extinction Coefficients
Published extinction coefficients for proteins may be reported as:
• wavelength-dependent molar absorptivity (or extinction) coefficient
) with units of M
(
+ MW), user-specified molar ext. coefficient
1%), user-specified mass ext. coefficient
-1cm-1
The equation at the right shows the relationship
between molar extinction coefficient (
percent extinction coefficient (
1%).
molar
) and
• percent solution extinction coefficient (1%) with units of
(g/100 mL)
1 cm cuvette)
• protein absorbance values for 0.1% (i.e., 1 mg/mL) solutions
Tip: Assess published values carefully to ensure unit of measure is applied
correctly.
Conversions Between
(
molar
Example: To determine percent solution extinction coefficient (1%) for a
protein that has a molar extinction coefficient of 43,824 M
molecular weight (MW) of 66,400 daltons (Da), rearrange and solve the
above equation as follows:
1% = (
-1cm-1
(i.e., 1% or 1 g/100 mL solution measured in a
and 1%
molar
) * 10 = (1%) * (MW
* 10) / (MW
molar
protein
protein
)
)
-1cm-1
and a
1% = (43,824 * 10) / 66,400 Da)
1% = 6.6 g/100 mL
66 NanoDrop One User Guide Thermo Scientific
Page 73

Measure Protein A280
To determine concentration (c) of a sample in mg/mL, use
the equation at the right and a conversion factor of 10.
Tip: The NanoDrop One software includes the
conversion factor when reporting protein concentrations.
Calculated protein concentrations are based on the
absorbance value at 280 nm, the selected (or entered)
extinction coefficient and the sample pathlength. A
single-point baseline correction (or analysis correction)
may be applied.
Concentration is reported in mass units. Calculators are
available on the Internet to convert concentration from
mass to molar units based on sample sequence.
Absorbance values at 260 nm and 280 nm are used to
calculate purity ratios for the measured protein samples.
Purity ratios are sensitive to the presence of
contaminants in the sample, such as residual solvents
and reagents typically used during sample purification.
Conversions Between g/100 mL and mg/mL
C
Example: If measured absorbance for a protein sample at 280 nm relative
to the reference is 5.8 A, protein concentration can be calculated as:
C
C
C
Measured Values
A280 absorbance
Note: For micro-volume absorbance measurements and measurements
taken with nonstandard (other than 10 mm) cuvettes, the spectra are
normalized to a 10 mm pathlength equivalent.
• Protein absorbance values are measured at 280 nm using the
normalized spectrum. If Baseline Correction is not selected, this is the
reported A280 value and the value used to calculate protein
concentration.
•If Baseline Correction is selected, the normalized and
baseline-corrected absorbance value at 280 nm is reported and used to
calculate protein concentration.
A260 absorbance
in mg/mL = (A / 1%) * 10
protein
= (A / 1%) * 10
protein
= (5.8/6.6 g/100 mL) * 10
protein
= 8.79 mg/mL
protein
• Normalized and baseline-corrected (if selected) absorbance value at
260 nm is also reported.
Sample Pathlength
• For micro-volume measurements, the software selects the optimal
pathlength (between 1.0 mm and 0.03 mm) based on sample
absorbance at the analysis wavelength.
• For cuvette measurements, pathlength is determined by the cuvette
Pathlength setting in the software (see General Settings).
• Displayed spectra and absorbance values are normalized to a 10 mm
pathlength equivalent.
•
Thermo Scientific NanoDrop One User Guide 67
Page 74

Measure Protein A280
Reported Values
• Protein concentration. Reported in selected unit (mg/mL or μg/mL).
Calculations are based on Beer-Lambert equation using corrected
protein absorbance value.
• A260/A280 purity ratio. Ratio of corrected absorbance at 260 nm to
corrected absorbance at 280 nm. An A260/A280 purity ratio of ~0.57
is generally accepted as “pure” for proteins.
Note: Although purity ratios are important indicators of sample quality,
the best indicator of protein quality is functionality in the downstream
application of interest (e.g., real-time PCR).
68 NanoDrop One User Guide Thermo Scientific
Page 75

Measure Proteins and Labels
Measures the concentration of
purified proteins that have been
labeled with up to two fluorescent
dyes.
Measure Labeled Proteins
Reported Results
Settings
Detection Limits
Calculations
Measure Labeled Protein Samples
Use the Proteins and Labels application to quantify proteins and fluorescent dyes for protein
array conjugates, as well as metalloproteins such as hemoglobin, using wavelength ratios. This
application reports protein concentration measured at 280 nm, an A269/A280 absorbance
ratio, and the concentrations and measured absorbance values of the dyes, allowing detection
of dye concentrations as low as 0.2 picomole per microliter. This information is useful for
evaluating protein/dye conjugation (degree of labeling) for use in downstream applications.
To measure labeled protein samples
NOTICE
• Do not use a squirt or spray bottle on or near the instrument as liquids will flow into
the instrument and may cause permanent damage.
• Do not use hydrofluoric acid (HF) on the pedestals. Fluoride ions will permanently
damage the quartz fiber optic cables.
Thermo Scientific NanoDrop One User Guide 69
Page 76

Measure Proteins and Labels
Before you begin...
Before taking pedestal measurements with the NanoDrop One instrument, lift the instrument
arm and clean the upper and lower pedestals. At a minimum, wipe the pedestals with a new
laboratory wipe. For more information, see Cleaning the Pedestals.
70 NanoDrop One User Guide Thermo Scientific
Page 77
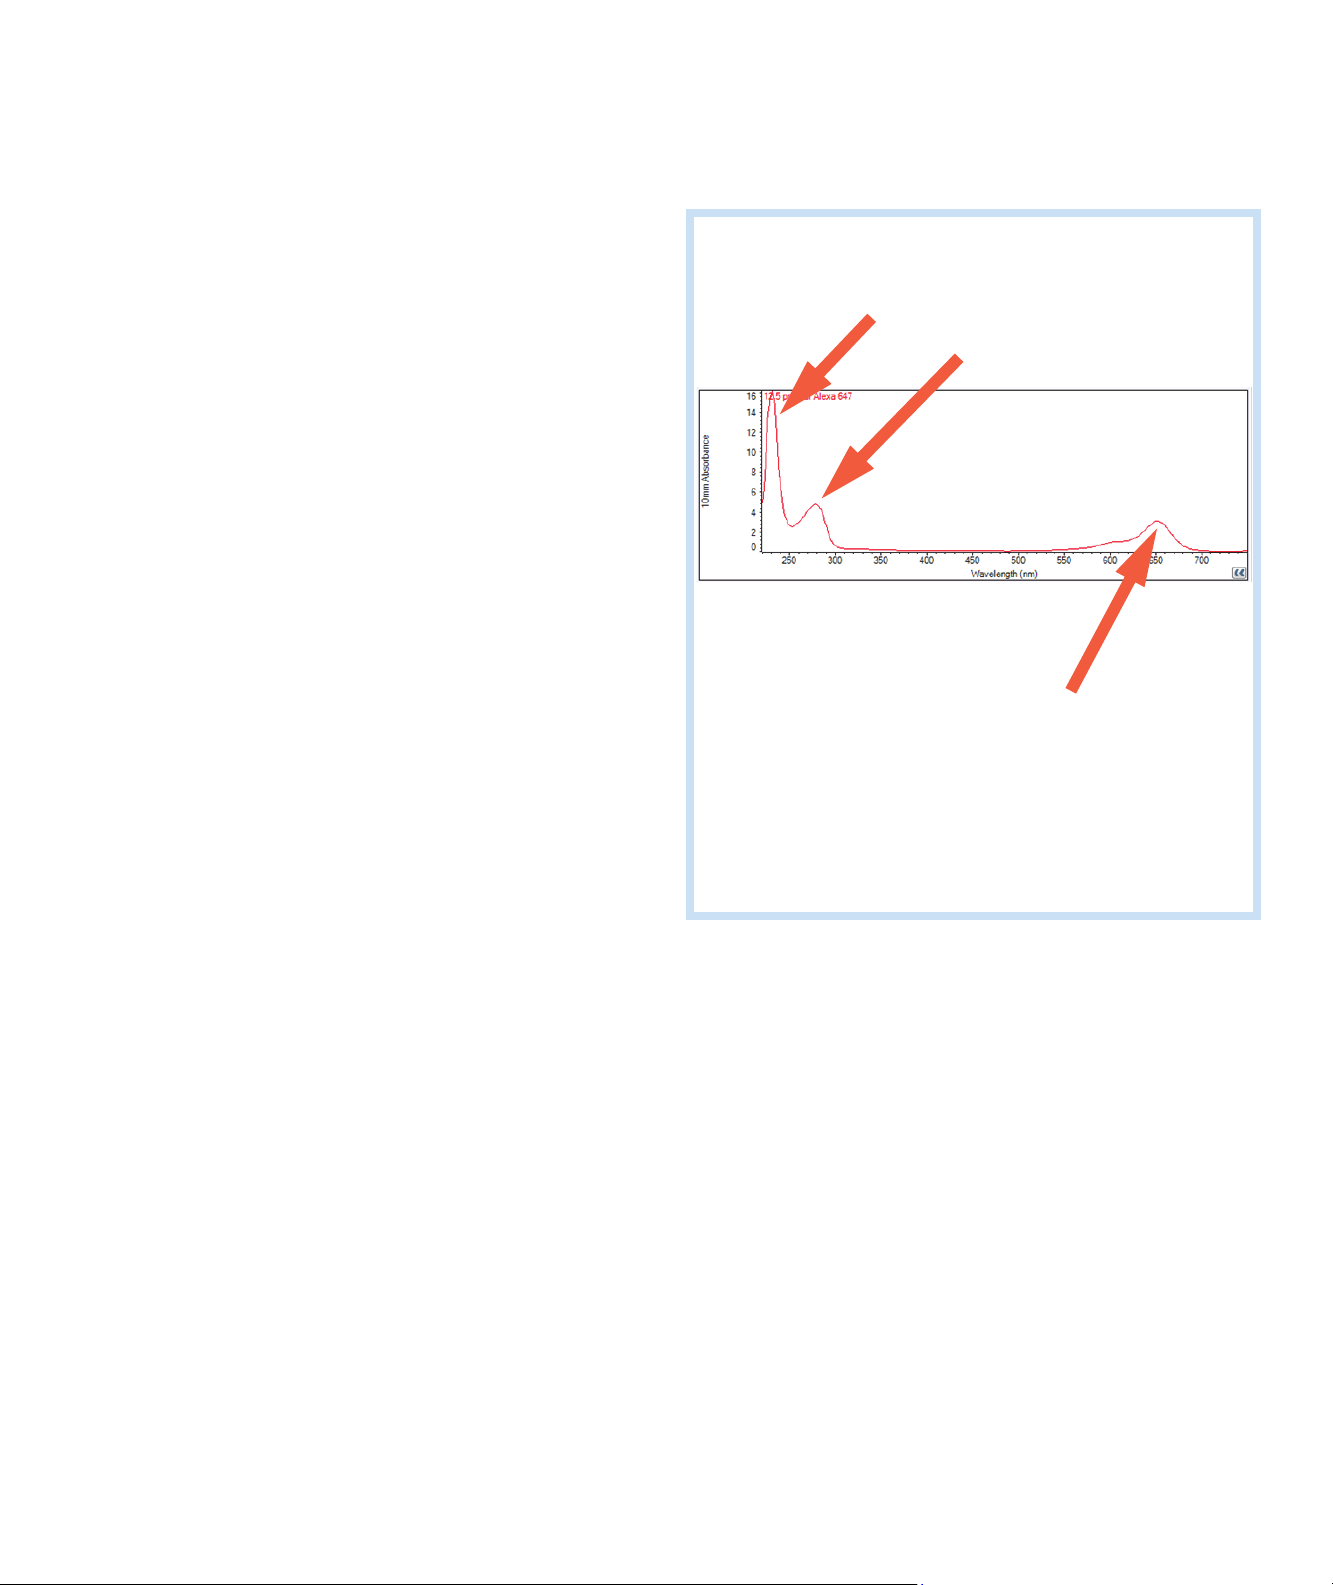
To measure a labeled protein sample
Dye absorbance peak
used to calculate dye
concentration
A280 absorbance peak
used to calculate protein
concentration
Peptide
backbone
Typical sample spectrum measured with
Proteins & Labels application
1. From the Home screen, select the Proteins tab and
then tap Protein & Labels.
2. Specify the sample type and the type of dye(s) used.
Tip: Select a dye from the pre-defined list or add a
custom dye using the Dye/Chromophore Editor.
3. Pipette 1–2 μL of the blanking solution onto the
lower pedestal and lower the arm, or insert the
blanking cuvette into the cuvette holder.
Tip: If using a cuvette, make sure to align the cuvette
light path with the instrument light path.
4. Tap Blank and wait for the measurement to
complete.
Measure Proteins and Labels
Tip: If Auto-Blank is On, the blank measurement
starts automatically after you lower the arm. (This
option is not available for cuvette measurements.)
5. Lift the arm and clean both pedestals with a new
laboratory wipe, or remove the blanking cuvette.
6. Pipette 2 μL sample solution onto the pedestal and
lower the arm, or insert the sample cuvette into the
cuvette holder.
7. Start the sample measurement:
–Pedestal: If Auto-Measure is On, lower arm; if
– Cuvette: Tap Measure
When the sample measurement is completed, the
spectrum and reported values are displayed (see the
next section).
8. When you are finished measuring samples, tap
End Experiment.
9. Lift the arm and clean both pedestals with a new
wipe, or remove the sample cuvette.
Auto-Measure is off, lower arm and tap Measure.
Thermo Scientific NanoDrop One User Guide 71
Page 78

Measure Proteins and Labels
Related Topics
• Best practices for protein measurements
• Measure a Micro-Volume Sample
• Measure a Sample Using a Cuvette
• Prepare Samples and Blanks
• Basic Instrument Operations
Proteins & Labels Reported Results
Proteins & Labels measurement screen
For each measured sample, this application shows the absorbance spectrum and a summary of
the results. Here is an example:
72 NanoDrop One User Guide Thermo Scientific
Page 79
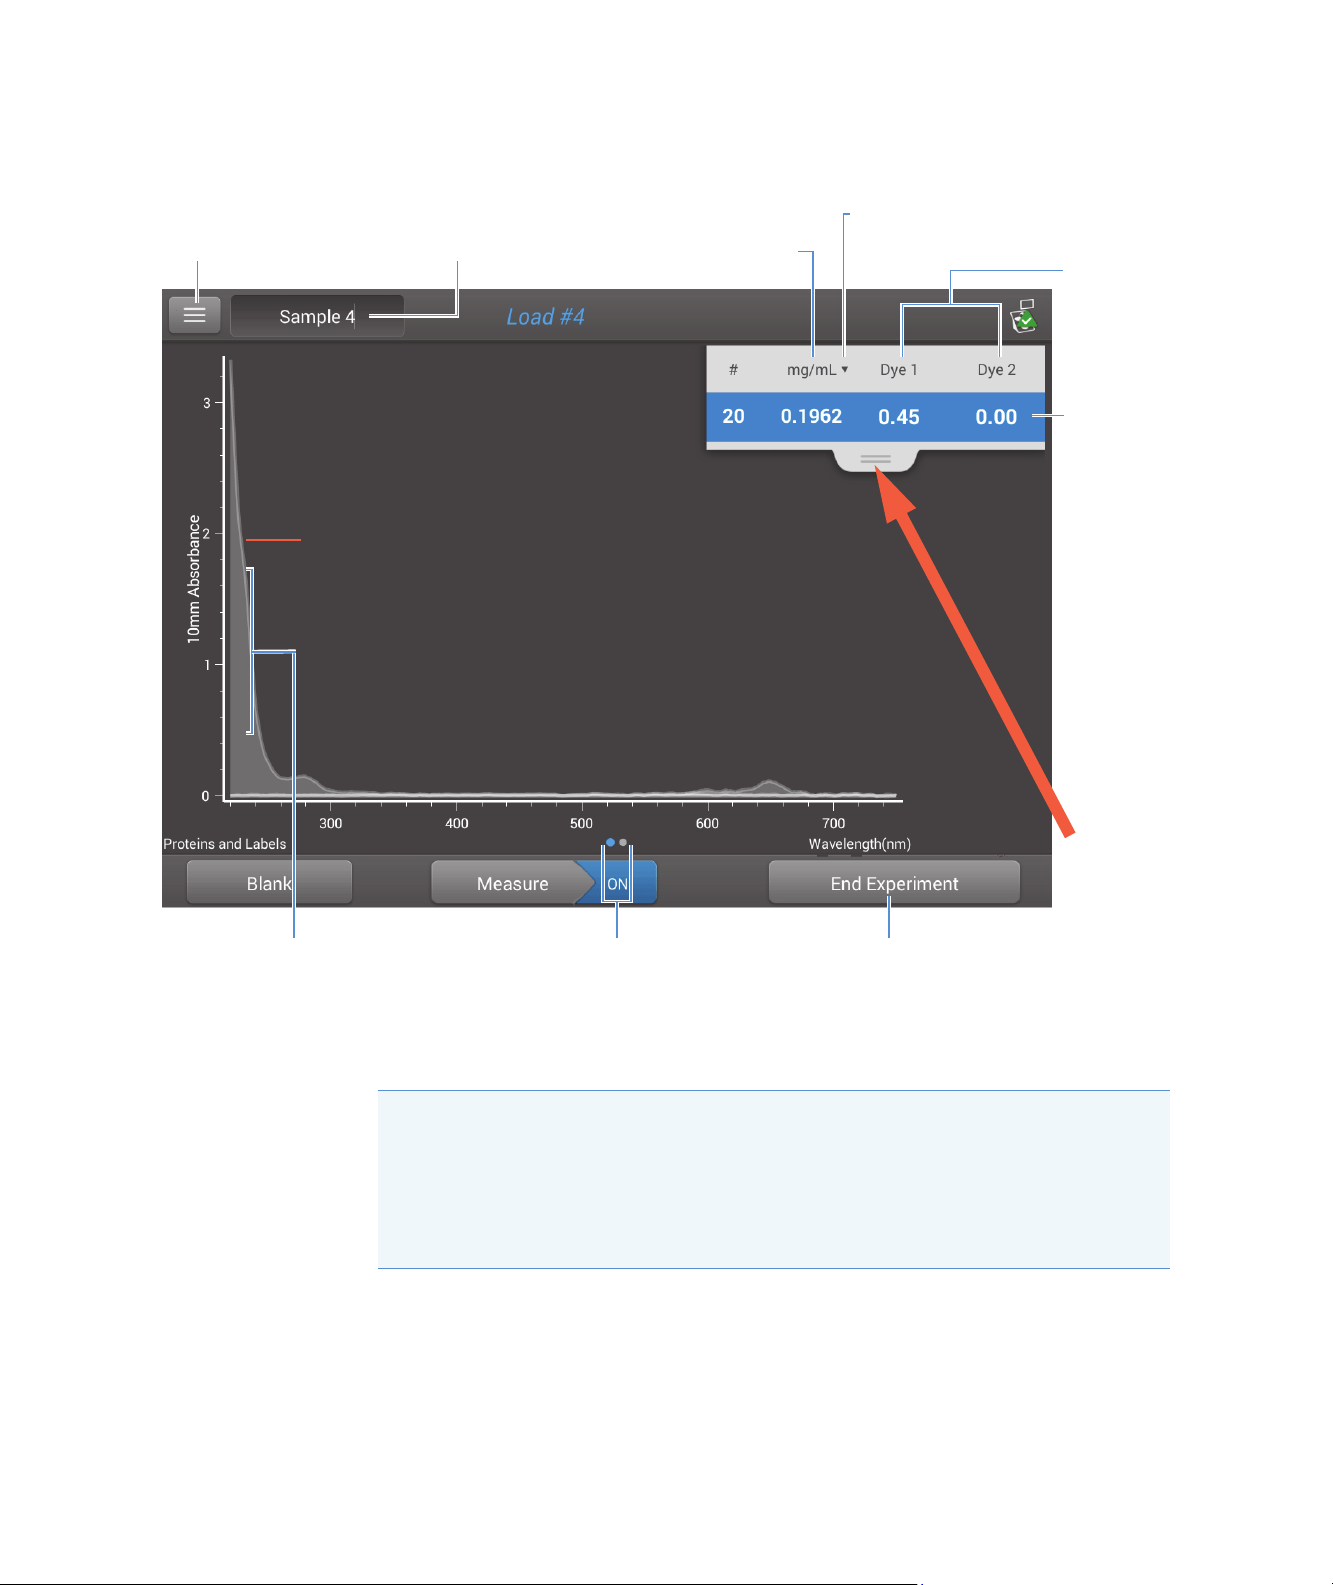
Measure Proteins and Labels
Tap row to
select sample
and update
spectrum; tap
more rows to
overlay up to five
spectra. Press
and hold
sample row to
view
measurement
details.
Drag tab
down/up to see
more/less
sample data
UV-visible spectrum
Tap to select unitMenu of options;
tap to open
Sample name;
tap to edit
Protein
concentration
Dye
concentration(s)
Swipe screen left to
view table with more
measurement results
Pinch and zoom to
adjust axes;
double-tap to reset
Tap to end
experiment and
export data
Note
• A baseline correction is performed at 750 nm (absorbance value at 750 nm is
subtracted from absorbance values at all wavelengths in sample spectrum).
• Micro-volume absorbance measurements and measurements taken with nonstandard
cuvettes are normalized to a 10.0 mm pathlength equivalent.
Thermo Scientific NanoDrop One User Guide 73
Page 80

Measure Proteins and Labels
Proteins & Labels reported values
The initial screen that appears after each measurement (see previous image) shows a summary
of the reported values. To view all reported values, press and hold the sample row. Here is an
example:
Reported values for Proteins & Labels application
• Sample details (application and sampling method used, i.e., pedestal or cuvette)
•Sample Name
•Creation date
•Protein
•A280
•Sample Type
•Dye 1/Dye 2
• Sloping Dye Correction
•Analysis Correction
Related Topics
• Basic Instrument Operations
• Proteins & Labels calculations
Settings for Proteins and Labels Measurements
To show the Proteins & Labels settings, from the Proteins & Labels measurement screen, tap
> Proteins & Labels Setup.
74 NanoDrop One User Guide Thermo Scientific
Page 81

Measure Proteins and Labels
Setting Available Options
Sample type
a
1 Abs = 1 mg/mL
BSA
IgG
Lysozyme
Other protein
+ MW)
(
Other protein
(
1%)
Analysis
Correction
On or off
b
Enter analysis correction
wavelength in nm or use
default value (340 nm)
Mass Ext. Coefficient
(L/gm-cm)
General reference
6.67
Description
Tap he re for detailed description of each available setting.
Each sample type applies a unique extinction coefficient to
the protein calculations. If the extinction coefficient of the
13.7
26.4
user-entered molar
extinction
coefficient/molecular
weight
User entered mass
extinction coefficient
sample is known, choose the
+ MW (molar) or 1%
(mass) option and enter the value. Otherwise, calculate the
extinction coefficient or choose the option that best
matches the sample solution. If you only need a rough
estimate of protein concentration and the sample extinction
coefficient is unknown, select the 1 Abs=1 mg/mL sample
type option.
Tip: Ideally, the extinction coefficient should be
determined empirically using a solution of the study
protein at a known concentration using the same buffer.
N/A Corrects sample absorbance measurement for any offset
caused by light scattering particulates by subtracting
absorbance value at specified analysis correction wavelength
from absorbance value at analysis wavelength. Corrected
value is used to calculate sample concentration.
Dye 1/Dye 2
c
Ty pe
Cy3, 5, 3.5, or 5.5,
Alexa Fluor 488, 546,
555, 594, 647, or 660
See
Dye/Chromophore
Editor for specific
values for each dye
Dye 1/Dye 2
Unit
picomoles/microliter
(pmol/uL), micromoles
not applicable Select unit for reporting dye concentrations.
(uM), or millimoles
(mM)
Sloping Dye
Correction
a
To add or edit a custom protein, use Protein Editor.
b
Analysis Correction affects calculation for protein concentration only.
c
To add custom dye or edit list of available dyes, use Dye/Chromophore Editor.
d
Sloping Dye Correction affects calculations for dye concentration only.
On or off Corrects dye absorbance measurements for any offset
d
Tip: If the sample has a modification that absorbs light at
340 nm, select a different correction wavelength or turn off
Analysis Correction.
Select pre-defined dye used to label sample material, or one
that has been added using Dye/Chrom. Editor.
caused by light scattering particulates by subtracting
absorbance value of a sloping baseline from 400 nm to
750 nm from absorbance value at dye’s analysis wavelength.
Thermo Scientific NanoDrop One User Guide 75
Page 82

Measure Proteins and Labels
Related Topics
• Instrument Settings
• Protein Editor
• Dye/Chromophore Editor
Detection Limits for Proteins and Labels Measurements
Detection limits and reproducibility specifications for purified BSA proteins and dyes that are
pre-defined in the software are provided here. The BSA lower detection limit and
reproducibility values apply to any protein sample type. The upper detection limits are
dependent on the upper absorbance limit of the instrument and the sample’s extinction
coefficient.
To calculate upper detection limits for other (non-BSA) protein
sample types
To calculate upper detection limits in ng/μL for proteins, use the following equation:
(upper absorbance limit
For example, if the sample’s mass extinction coefficient at 280 nm is 6.67 for a 1%
(10 mg/mL) solution, the equation looks like this:
(550 / 6.67) * 10 = 824.6 (or ~825)
instrumen
Related Topics
• Detection Limits for All Applications
/mass extinction coefficient
t
sample
) * 10
76 NanoDrop One User Guide Thermo Scientific
Page 83

Calculations for Proteins and Labels Measurements
Measure Proteins and Labels
As with the other protein applications, Proteins & Labels
uses the Beer-Lambert equation to correlate absorbance
with concentration based on the sample’s extinction
coefficient and pathlength.
This application offers six options (shown at right) for
selecting an appropriate extinction coefficient for each
measured sample, to be used in conjunction with Beer’s
Law to calculate sample concentration.
If the extinction coefficient of the sample is known,
choose the
enter the value. Otherwise, calculate the extinction
coefficient or choose the option that best matches the
sample solution.
Tip: Ideally, the extinction coefficient should be
determined empirically using a solution of the study
protein at a known concentration using the same buffer.
Calculated protein concentrations are based on the
absorbance value at 280 nm, the selected (or entered)
extinction coefficient and the sample pathlength. A
single-point baseline correction (or analysis correction)
may be applied.
Concentration is reported in mass units. Calculators are
available on the Internet to convert concentration from
mass to molar units based on sample sequence.
+ MW (molar) or 1% (mass) option and
Available Options for Extinction Coefficient
• 1 Abs = 1 mg/mL, where sample type and/or ext. coefficient is
unknown (produces rough estimate of protein concentration)
• BSA (Bovine Serum Albumin, 6.67 L/gm-cm)
• IgG (any mammalian antibody, 13.7 L/gm-cm)
• Lysozyme (egg white lysozyme, 26.4 L/gm-cm)
• Other protein (
• Other protein (
+ MW), user-specified molar ext. coefficient
1%), user-specified mass ext. coefficient
Note: See Sample Type for details.
Measured Values
A280 absorbance
Note: The absorbance value at 750 nm is subtracted from all wavelengths
in the spectrum. As a result, the absorbance at 750 nm is zero in the
displayed spectra. Also, for micro-volume absorbance measurements and
measurements taken with nonstandard (other than 10 mm) cuvettes, the
spectra are normalized to a 10 mm pathlength equivalent.
• Protein absorbance values are measured at 280 nm using the
750 nm-corrected and normalized spectrum. If Analysis Correction
and Dye Correction are not selected, this is the reported A280 value
and the value used to calculate protein concentration.
•If Analysis Correction is selected, the 750-corrected, normalized and
analysis-corrected absorbance value at 280 nm is reported and used to
calculate protein concentration.
• If a Dye is used, the 750-corrected, normalized, analysis-corrected and
dye-corrected absorbance value at 280 nm is reported and used to
calculate protein concentration.
Thermo Scientific NanoDrop One User Guide 77
Page 84

Measure Proteins and Labels
Dye concentrations are calculated from the absorbance
value at the dye’s analysis wavelength, the dye’s
extinction coefficient, and the sample pathlength. A
sloped-line dye correction may also be used.
Dye absorbance
• Dye absorbance values are measured at specific wavelengths. See
Dye/Chromophore Editor for analysis wavelengths used.
• If Sloping Dye Correction is selected, a linear baseline is drawn
between 400 nm and 750 nm and, for each dye, the absorbance value
of the sloping baseline is subtracted from the absorbance value at each
dye’s analysis wavelength. Baseline-corrected dye absorbance values are
reported and used to calculate dye concentrations.
Dye correction
• Pre-defined dyes have known correction values for A260 and A280.
See Dye/Chromophore Editor for correction values used.
• A280 dye correction is subtracted from A280 absorbance value used to
calculate protein concentration.
Sample Pathlength
• For micro-volume measurements, the software selects the optimal
pathlength (between 1.0 mm and 0.03 mm) based on sample
absorbance at the analysis wavelength.
Related Topics
• Beer-Lambert Equation
• Protein A280 Calculations
• For cuvette measurements, pathlength is determined by the cuvette
Pathlength setting in the software (see General Settings).
• Displayed spectra and absorbance values are normalized to a 10 mm
pathlength equivalent.
Reported Values
• Protein concentration. Reported in selected unit (mg/mL or μg/mL).
Calculations are based on Beer-Lambert equation using corrected
protein absorbance value.
• Dye1/Dye2 concentration. Reported in pmol/μL. Calculations are
based on Beer’s Law equation using (sloping) baseline-corrected dye
absorbance value(s).
78 NanoDrop One User Guide Thermo Scientific
Page 85

Measure Protein A205
Measures the concentration of
purified protein populations that
absorb at 205 nm.
Measure A205 Proteins
Reported Results
Settings
Detection Limits
Calculations
Measure Protein Concentration at A205
Use the Protein A205 application to quantify purified peptides and other proteins that
contain peptide bonds, which exhibit absorbance at 205 nm. This application reports protein
concentration and two absorbance values (A205 and A280). A single-point baseline
correction can also be used. This application does not require a standard curve.
Note If your samples contain mainly amino acids such as tryptophan or tyrosine, or
cys-cys disulfide bonds, use the Protein A280 application instead of Protein A205.
To measure Protein A205 samples
NOTICE
• Do not use a squirt or spray bottle on or near the instrument as liquids will flow into
the instrument and may cause permanent damage.
• Do not use hydrofluoric acid (HF) on the pedestals. Fluoride ions will permanently
damage the quartz fiber optic cables.
Thermo Scientific NanoDrop One User Guide 79
Page 86

Measure Protein A205
Before you begin...
Before taking pedestal measurements with the NanoDrop One instrument, lift the instrument
arm and clean the upper and lower pedestals. At a minimum, wipe the pedestals with a new
laboratory wipe. For more information, see Cleaning the Pedestals.
To measure a Protein A205 sample
1. From the Home screen, select the Proteins tab and then tap Protein A205.
2. Specify a sample type and baseline correction if desired.
3. Pipette 1–2 μL of the blanking solution onto the lower pedestal and lower the arm, or
insert the blanking cuvette into the cuvette holder.
Tip: If using a cuvette, make sure to align the cuvette light path with the instrument
light path.
4. Tap Blank and wait for the measurement to complete.
Tip: If Auto-Blank is On, the blank measurement starts automatically after you lower
the arm. (This option is not available for cuvette measurements.)
5. Lift the arm and clean both pedestals with a new laboratory wipe, or remove the
blanking cuvette.
6. Pipette 2 μL sample solution onto the pedestal and lower the arm, or insert the sample
cuvette into the cuvette holder.
7. Start the sample measurement:
–Pedestal: If Auto-Measure is On, lower arm; if Auto-Measure is off, lower arm and
tap Measure.
– Cuvette: Tap Measure
When the sample measurement is completed, the spectrum and reported values are
displayed (see the next section).
8. When you are finished measuring samples, tap End Experiment.
9. Lift the arm and clean both pedestals with a new wipe, or remove the sample cuvette.
Related Topics
• Best Practices for Protein Measurements
• Measure a Micro-Volume Sample
• Measure a Sample Using a Cuvette
80 NanoDrop One User Guide Thermo Scientific
Page 87

• Prepare Samples and Blanks
• Basic Instrument Operations
Measure Protein A205
Thermo Scientific NanoDrop One User Guide 81
Page 88

Measure Protein A205
Tap row to
select sample
and update
spectrum; tap
more rows to
overlay up to five
spectra. Press
and hold
sample row to
view
measurement
details.
Drag tab
down/up to see
more/less
sample data
Swipe screen left to
view table with more
measurement results
Pinch and zoom to
adjust axes;
double-tap to reset
Tap to end
experiment and
export data
UV spectrum
Tap to select unitMenu of options;
tap to open
Sample name;
tap to edit
Protein
concentration
Absorbance
at 205 nm
Absorbance
at 280 nm
Protein A205 Reported Results
Protein A205 measurement screen
For each measured sample, this application shows the absorbance spectrum and a summary of
the results. Here is an example:
Note Micro-volume absorbance measurements and measurements taken with
nonstandard cuvettes are normalized to a 10.0 mm pathlength equivalent.
82 NanoDrop One User Guide Thermo Scientific
Page 89

Measure Protein A205
Sample name;
tap to edit
Sampling
method
Application
Date/time
measured
Protein conc.
Absorbance
at 205 nm
Sample type
Baseline Correction
wavelength
Baseline Correction
absorbance
Absorbance
at 280 nm
Protein A205 reported values
The initial screen that appears after each measurement (see previous image) shows a summary
of the reported values. To view all reported values, press and hold the sample row. Here is an
example:
Settings for Protein A205 Measurements
Thermo Scientific NanoDrop One User Guide 83
Related Topics
• Basic Instrument Operations
• Protein A205 Calculations
To show the Protein A205 settings, from the Protein A205 measurement screen, tap >
Protein A205 Setup.
Page 90

Measure Protein A205
Setting Available Options
Sample type 31 31 Assumes 0.1% (1 mg/mL) at 205 nm = 31
Scopes 27 + 120 * (A280/A205) Assumes
Other protein
1%)
(
Baseline
Correction
On or off
Enter baseline correction
wavelength in nm or use
default value (340 nm)
Mass Ext. Coefficient
(L/gm-cm)
Description
0.1% (1 mg/mL) at 205 nm = 27 + 120 *
(A280/A205)
User entered mass
extinction coefficient
N/A Corrects for any offset caused by light scattering
Assumes protein has known mass extinction coefficient
(). Enter mass extinction coefficient in L/gm-cm for
1mg/mL (
particulates by subtracting measured absorbance at
specified baseline correction wavelength from
absorbance values at all wavelengths in sample spectrum.
As a result, absorbance of sample spectrum is zero at
specified baseline correction wavelength.
Tip: If the sample has a modification that absorbs light
at 340 nm, select a different correction wavelength or
turn off Baseline Correction.
0.1%) protein solution.
Related Topics
• Instrument Settings
84 NanoDrop One User Guide Thermo Scientific
Page 91

Calculations for Protein A205 Measurements
Measure Protein A205
As with the other protein applications, Proteins A205
uses the Beer-Lambert equation to correlate absorbance
with concentration based on the sample’s extinction
coefficient and pathlength.
This application offers three options (shown at right) for
selecting an appropriate extinction coefficient for each
measured sample, to be used in conjunction with Beer’s
Law to calculate sample concentration.
If the extinction coefficient of the sample is known,
choose the
Otherwise, calculate the extinction coefficient or choose
the option that best matches the sample solution.
Tip: Ideally, the extinction coefficient should be
determined empirically using a solution of the study
protein at a known concentration using the same buffer.
Calculated protein concentrations are based on the
absorbance value at 205 nm, the selected (or entered)
extinction coefficient and the sample pathlength. A
single-point baseline correction may also be applied.
Concentration is reported in mass units. Calculators are
available on the Internet to convert concentration from
mass to molar units based on the sample sequence.
1% (mass) option and enter the value.
Available Options for Extinction Coefficient
• 31, assumes
• Scopes, assumes
0.1% (1 mg/mL) at 205 nm = 31
0.1% (1 mg/mL) at 205 nm = 27 + 120 *
(A280/A205)
• Other protein, enter mass extinction coefficient in L/gm-cm for
1mg/mL (0.1%) protein solution
Note: See Sample Type for details.
Measured Values
A205 absorbance
Note: For micro-volume absorbance measurements and measurements
taken with nonstandard (other than 10 mm) cuvettes, the spectra are
normalized to a 10 mm pathlength equivalent.
• Protein absorbance values are measured at 205 nm using the
normalized spectrum. If Baseline Correction is not selected, this is the
reported A205 value and the value used to calculate protein
concentration.
•If Baseline Correction is selected, the normalized and
baseline-corrected absorbance value at 205 nm is reported and used to
calculate protein concentration.
A280 absorbance
• Normalized and baseline-corrected (if selected) absorbance value at
280 nm is also reported.
Thermo Scientific NanoDrop One User Guide 85
Page 92

Measure Protein A205
Sample Pathlength
• For micro-volume measurements, the software selects the optimal
pathlength (between 1.0 mm and 0.03 mm) based on sample
absorbance at the analysis wavelength.
• For cuvette measurements, pathlength is determined by the cuvette
Pathlength setting in the software (see General Settings).
• Displayed spectra and absorbance values are normalized to a 10 mm
pathlength equivalent.
Reported Values
• Protein concentration. Reported in selected unit (mg/mL or μg/mL).
Calculations are based on Beer-Lambert equation using corrected
protein absorbance value.
Related Topics
• Beer-Lambert Equation
• Protein A280 Calculations
86 NanoDrop One User Guide Thermo Scientific
Page 93
Measure Protein BCA
Measures total protein
concentration of unpurified protein
samples using a bicinchoninic acid
colorimetric detection reagent.
Measure Total Protein
Reported Results
Settings
Detection Limits
Measure Total Protein Concentration
The Protein BCA assay uses bicinchoninic acid as a colorimetric detection reagent to
determine total protein concentration in unpurified protein samples. This application is
useful for measuring dilute protein solutions or proteins in the presence of components that
exhibit significant absorbance between 200 nm and 280 nm, which rules out direct protein
measurements at 280 nm or 205 nm. This application measures absorbance at 562 nm and
uses a standard curve to calculate protein concentration. A single-point baseline correction is
applied.
Theory of Protein BCA assay
The Protein BCA assay uses bicinchoninic acid (BCA) as the detection reagent for Cu+1,
which is formed when Cu
purple reaction product is formed by the chelation of two molecules of BCA with one cuprous
ion (Cu
562 nm and baseline-corrected using the absorbance value at 750 nm. Pre-formulated kits of
BCA reagent and CuSO
Thermo Scientific NanoDrop One User Guide 87
+1
). The resulting Cu-BCA chelate formed in the presence of protein is measured at
+2
is reduced by certain proteins in an alkaline environment. A
are available from us or a local distributor.
4
Page 94

Measure Protein BCA
Protein assay kits and protocols
Please refer to the NanoDrop website for up-to-date kits and protocols for the
NanoDrop One instruments. Follow the assay kit manufacturer’s recommendations for all
standards and samples (unknowns). Ensure each is subjected to the same timing and
temperature throughout the assay.
Protein standards for generating a standard curve may also be provided by the kit
manufacturer. Since the NanoDrop One pedestals can measure higher protein concentrations
than traditional cuvette-based spectrophotometers, you may need to supply your own protein
standards at higher concentrations than provided by the manufacturer. For example,
additional standards may be required to ensure the standard curve covers the dynamic range
of the assay and the expected range of the unknown samples.
Working with standard curves
A standard curve is required for colorimetric protein analysis.
• Each experiment requires a new standard curve.
• Prepare standards and unknown samples the same way. See the kit manufacturer’s
guidelines and recommendations.
– All reference and standards solutions should be the same buffer used to resuspend
the samples plus the same volume of reagent added to the samples.
– First standard is a reference measurement. The reference solution should contain
none of the analyte of interest. (The reference measurement is not the same as a blank
measurement. This application requires both.)
– Concentration range of the standards must cover the dynamic range of the assay
and the expected range of the unknown samples. Sample analyte concentrations are
not extrapolated beyond the concentration of the highest standard.
• Use the application setup screen to enter concentration values for the standards and to
specify how standards and samples will be measured (number of replicates, etc.).
– Depending on the Curve Type setting, a standard curve can be generated using two
or more standards.
–The software requires one reference measurement and allows up to 7 standards.
– Concentration values for standards can be entered in any order but the standards
must be measured in the order in which they were entered; however, best practice
dictates that standards be measured from the lowest concentration of the standard
analyte stock to the highest.
88 NanoDrop One User Guide Thermo Scientific
Page 95

Measure Protein BCA
Reference concentration
and absorbance value
Standard concentrations
and absorbance values
Swipe left one screen
to view standard curve
Menu; tap
to open
Press and hold
any row to
view details
• For all colorimetric assays except Protein Pierce 660, blank the instrument with
DI H
O (deionized water). For Protein Pierce 660, blank with the reference solution (see
2
below).
• Measure the reference and all standards before you start analyzing samples. (After the
first sample has been measured, no additional changes are allowed to the standard curve.)
As you measure the standards, a measurement screen appears, similar to the measurement
screens for samples.
Thermo Scientific NanoDrop One User Guide 89
Page 96

Measure Protein BCA
Swipe left one screen to
view data table for standards
Curve type setting
R2 value (1.0 equals perfect fit)
White circles indicate data
points for standards
Standard curve
Press and hold
any row to
view details
Swipe left one screen to see the standard curve as you build it. Here is an example:
2
The R
perfect fit; all points lie exactly on the curve).
value indicates how well the standard curve fits the standard data points (1.0 is a
90 NanoDrop One User Guide Thermo Scientific
Page 97

Measure Protein BCA
Press and hold
any row to
view details
Tap to delete
this
measurement
Swipe left one screen to see the data table for the standards. Here is an example:
Press and hold a row in any of the previous screens to view details about an individual
standard. Here is an example:
Thermo Scientific NanoDrop One User Guide 91
Page 98

Measure Protein BCA
After the minimum number of standards has been measured for the selected curve type, a
message similar to the following appears:
Load more standards: returns to the setup screen where you can add or edit the
concentration value for any standard and then measure the standard.
Run samples: continues to sample measurement screen, after which standards can no
longer be edited.
• You can add, edit or delete a standard any time before the first sample measurement.
Add standard
– from standards measurement screen, tap > [application name] Setup
– tap the next empty Concentration field and enter the concentration value for the new
standard
–tap Done
Edit standard
– from standards measurement screen, tap > [application name] Setup
– tap the Concentration field and edit the concentration value
–tap Done
Delete standard
– from standards measurement screen, standard curve screen, or standards data table,
press and hold the row to show Standard Details box
–tap
The standard no longer appears in the table on the measurement screen and its
concentration value no longer appears on the setup screen.
Note You can use this method to delete the reference measurement; however, a new
reference must be measured immediately afterwards.
92 NanoDrop One User Guide Thermo Scientific
Page 99

• After the minimum number of standards has been measured for the selected curve type,
the message “Invalid Curve” changes to “Valid Curve.” (This occurs even when additional
standards have been defined but not yet measured.) If the “Invalid Curve” message
remains after all entered standards have been measured, try:
– selecting a different curve type
– remeasuring standards using the correct standard material
Valid Curve indicator: This is only an indicator that the required minimum number of
points has been established for the selected curve type. It does not validate the integrity of
the curve. For example, additional standards may be required to cover the expected assay
concentration range.
To measure Protein BCA standards and samples
Measure Protein BCA
NOTICE
• Do not use a squirt or spray bottle on or near the instrument as liquids will flow into
the instrument and may cause permanent damage.
• Do not use hydrofluoric acid (HF) on the pedestals. Fluoride ions will permanently
damage the quartz fiber optic cables.
Before you begin...
Before taking pedestal measurements with the NanoDrop One instrument, lift the instrument
arm and clean the upper and lower pedestals. At a minimum, wipe the pedestals with a new
laboratory wipe. For more information, see Cleaning the Pedestals.
To measure Protein BCA standards and samples
1. From the Home screen, select the Proteins tab and tap Protein BCA.
2. Specify a curve type and number of replicates for each standard and enter the
concentration of each standard.
Tip: For this assay, we recommend setting Curve Type to “Linear”.
3. Measure blank:
– pipette 2 μL DI H
O onto lower pedestal and lower arm, or insert DI H2O
2
blanking cuvette into cuvette holder
Thermo Scientific NanoDrop One User Guide 93
Page 100

Measure Protein BCA
Tip: If using a cuvette, make sure to align cuvette light path with instrument light
path.
–tap Blank and wait for measurement to complete
– lift arm and clean both pedestals with new laboratory wipe, or remove cuvette
4. Measure reference standard:
– pipette 2 μL reference solution onto pedestal, or insert reference cuvette (reference
solution should contain none of the standard protein stock, see Working With
Standard Curves for details)
– lower arm to start measurement (or tap Measure if Auto-Measure is off)
– lift arm and clean both pedestals with new wipe, or remove cuvette
– if Replicates setting is greater than 1, repeat measurement
5. Measure remaining standards:
– pipette 2 μL standard 1 onto pedestal, or insert standard 1 cuvette
– lower arm to start measurement (or tap Measure if Auto-Measure is off)
– lift arm and clean both pedestals with new wipe, or remove cuvette
– if Replicates setting is greater than 1, repeat measurement
– repeat substeps above for each additional standard (when specified number of
standards and replicates have been measured, a message asks whether to load more
standards or begin measuring samples)
– if finished measuring standards, tap Done (swipe left to view standard curve)
6. Measure samples:
– pipette 2 μL sample 1 onto pedestal, or insert sample 1 cuvette
– lower arm to start measurement (or tap Measure if Auto-Measure is off)
– lift arm and clean both pedestals with new wipe, or remove cuvette
– if Replicates setting is greater than 1, repeat measurement
7. When you are finished measuring samples, tap End Experiment.
8. Lift the arm and clean both pedestals with a new wipe, or remove the sample cuvette.
Related Topics
• Best practices for protein measurements
• Measure a Micro-Volume Sample
• Measure a Sample Using a Cuvette
94 NanoDrop One User Guide Thermo Scientific
 Loading...