

Page 1
CDT370
Addendum to the TMS370 Family C Source Debugger
User' s Guide
Addendum
1993 Microprocessor Development Systems
Page 2

Printed in U.S.A., October 1993; reprinted July 1995
265691 1–9761 revision B
SPNU133
Page 3
CDT370 Addendum
to the TMS370 Family
C Source Debugger
User's Guide
SPRU133
July 1995
Printed on Recycled Paper
Page 4

IMPORTANT NOTICE
T exas Instruments (TI) reserves the right to make changes to its products or to discontinue any
semiconductor product or service without notice, and advises its customers to obtain the latest
version of relevant information to verify , before placing orders, that the information being relied
on is current.
TI warrants performance of its semiconductor products and related software to the specifications
applicable at the time of sale in accordance with TI’s standard warranty . T esting and other quality
control techniques are utilized to the extent TI deems necessary to support this warranty.
Specific testing of all parameters of each device is not necessarily performed, except those
mandated by government requirements.
Certain applications using semiconductor products may involve potential risks of death,
personal injury , or severe property or environmental damage (“Critical Applications”).
TI SEMICONDUCTOR PRODUCTS ARE NOT DESIGNED, INTENDED, AUTHORIZED, OR
WARRANTED TO BE SUITABLE FOR USE IN LIFE-SUPPORT APPLICATIONS, DEVICES
OR SYSTEMS OR OTHER CRITICAL APPLICATIONS.
Inclusion of TI products in such applications is understood to be fully at the risk of the customer.
Use of TI products in such applications requires the written approval of an appropriate TI officer .
Questions concerning potential risk applications should be directed to TI through a local SC
sales office.
In order to minimize risks associated with the customer’s applications, adequate design and
operating safeguards should be provided by the customer to minimize inherent or procedural
hazards.
TI assumes no liability for applications assistance, customer product design, software
performance, or infringement of patents or services described herein. Nor does TI warrant or
represent that any license, either express or implied, is granted under any patent right, copyright,
mask work right, or other intellectual property right of TI covering or relating to any combination,
machine, or process in which such semiconductor products or services might be or are used.
Copyright 1995, Texas Instruments Incorporated
Page 5

About This Manual
This book tells you how to install and use the CDT370 (Compact Development
T ool) and explains the similarities and differences between the debugger used
with the CDT370 and the debugger that is described in the
Source Debugger User’s Guide
Information About Cautions
This book contains cautions.
This is an example of a caution statement.
A caution statement describes a situation that could potentially
damage your software or equipment.
Read This First
TMS370 Family C
.
The information in a caution is provided for your protection. Please read each
caution carefully.
FCC Warning
This equipment is intended for use in a laboratory test environment only. It
generates, uses, and can radiate radio frequency energy and has not been
tested for compliance with the limits of computing devices pursuant to subpart
J of part 15 of FCC rules, which are designed to provide reasonable protection
against radio frequency interference. Operation of this equipment in other
environments may cause interference with radio communications, in which
case the user at his own expense will be required to take whatever measures
may be required to correct this interference.
Read This First
iii
Page 6

Trademarks
Trademarks
PC-DOS is a trademark of International Business Machines.
MS-DOS and Windows are trademarks of Microsoft Corporation.
iv
Page 7

Contents
Contents
1 Introduction 1-1. . . . . . . . . . . . . . . . . . . . . . . . . . . . . . . . . . . . . . . . . . . . . . . . . . . . . . . . . . . . . . . . . . . . .
1.1 About the CDT370 Board 1-2. . . . . . . . . . . . . . . . . . . . . . . . . . . . . . . . . . . . . . . . . . . . . . . . . . . .
1.2 About the Target Cable Set 1-3. . . . . . . . . . . . . . . . . . . . . . . . . . . . . . . . . . . . . . . . . . . . . . . . . .
2 Getting Started 2-1. . . . . . . . . . . . . . . . . . . . . . . . . . . . . . . . . . . . . . . . . . . . . . . . . . . . . . . . . . . . . . . . . .
2.1 System Hardware Requirements 2-2. . . . . . . . . . . . . . . . . . . . . . . . . . . . . . . . . . . . . . . . . . . . .
2.2 System Software Requirements 2-3. . . . . . . . . . . . . . . . . . . . . . . . . . . . . . . . . . . . . . . . . . . . . .
2.3 Unpacking The CDT370 Board 2-4. . . . . . . . . . . . . . . . . . . . . . . . . . . . . . . . . . . . . . . . . . . . . . .
2.4 Add-On PC Connection 2-5. . . . . . . . . . . . . . . . . . . . . . . . . . . . . . . . . . . . . . . . . . . . . . . . . . . . .
2.5 Serial RS-232 Connection 2-7. . . . . . . . . . . . . . . . . . . . . . . . . . . . . . . . . . . . . . . . . . . . . . . . . . .
2.6 Software Installation 2-9. . . . . . . . . . . . . . . . . . . . . . . . . . . . . . . . . . . . . . . . . . . . . . . . . . . . . . . .
2.7 Using the Debugger With Microsoft Windows 2-15. . . . . . . . . . . . . . . . . . . . . . . . . . . . . . . . . .
2.8 Power-Up Procedure 2-17. . . . . . . . . . . . . . . . . . . . . . . . . . . . . . . . . . . . . . . . . . . . . . . . . . . . . . .
2.9 Invoking the Debugger 2-18. . . . . . . . . . . . . . . . . . . . . . . . . . . . . . . . . . . . . . . . . . . . . . . . . . . . .
2.10 Exiting the Debugger 2-21. . . . . . . . . . . . . . . . . . . . . . . . . . . . . . . . . . . . . . . . . . . . . . . . . . . . . . .
3 Trace 3-1. . . . . . . . . . . . . . . . . . . . . . . . . . . . . . . . . . . . . . . . . . . . . . . . . . . . . . . . . . . . . . . . . . . . . . . . . . .
3.1 Trace and Timing 3-2. . . . . . . . . . . . . . . . . . . . . . . . . . . . . . . . . . . . . . . . . . . . . . . . . . . . . . . . . . .
3.2 Trace Commands 3-5. . . . . . . . . . . . . . . . . . . . . . . . . . . . . . . . . . . . . . . . . . . . . . . . . . . . . . . . . . .
3.3 Differences Between XDS/22 BTT and CDT370 Trace 3-7. . . . . . . . . . . . . . . . . . . . . . . . . . .
4 Programming 4-1. . . . . . . . . . . . . . . . . . . . . . . . . . . . . . . . . . . . . . . . . . . . . . . . . . . . . . . . . . . . . . . . . . .
4.1 Programming a Device (the P Command) 4-2. . . . . . . . . . . . . . . . . . . . . . . . . . . . . . . . . . . . . .
4.2 Action Selection 4-3. . . . . . . . . . . . . . . . . . . . . . . . . . . . . . . . . . . . . . . . . . . . . . . . . . . . . . . . . . . .
4.3 Memory Type Selection 4-4. . . . . . . . . . . . . . . . . . . . . . . . . . . . . . . . . . . . . . . . . . . . . . . . . . . . .
4.4 Validation Dialog Box 4-5. . . . . . . . . . . . . . . . . . . . . . . . . . . . . . . . . . . . . . . . . . . . . . . . . . . . . . . .
4.5 Messages 4-6. . . . . . . . . . . . . . . . . . . . . . . . . . . . . . . . . . . . . . . . . . . . . . . . . . . . . . . . . . . . . . . . .
5 Autotest 5-1. . . . . . . . . . . . . . . . . . . . . . . . . . . . . . . . . . . . . . . . . . . . . . . . . . . . . . . . . . . . . . . . . . . . . . . .
6 Clock Source 6-1. . . . . . . . . . . . . . . . . . . . . . . . . . . . . . . . . . . . . . . . . . . . . . . . . . . . . . . . . . . . . . . . . . . .
7 Defining a Memory Map 7-1. . . . . . . . . . . . . . . . . . . . . . . . . . . . . . . . . . . . . . . . . . . . . . . . . . . . . . . . . .
7.1 Memory Mapping Introduction 7-2. . . . . . . . . . . . . . . . . . . . . . . . . . . . . . . . . . . . . . . . . . . . . . . .
7.2 Memory Mapping 7-3. . . . . . . . . . . . . . . . . . . . . . . . . . . . . . . . . . . . . . . . . . . . . . . . . . . . . . . . . . .
7.3 Copying Data Within the On-Board RAM 7-6. . . . . . . . . . . . . . . . . . . . . . . . . . . . . . . . . . . . . . .
Contents
v
Page 8

Contents
8 Target Cables 8-1. . . . . . . . . . . . . . . . . . . . . . . . . . . . . . . . . . . . . . . . . . . . . . . . . . . . . . . . . . . . . . . . . . .
8.1 Target Cables Description 8-2. . . . . . . . . . . . . . . . . . . . . . . . . . . . . . . . . . . . . . . . . . . . . . . . . . .
8.2 Switches Description 8-4. . . . . . . . . . . . . . . . . . . . . . . . . . . . . . . . . . . . . . . . . . . . . . . . . . . . . . . .
8.3 Installing the Target Cable in the Emulator 8-5. . . . . . . . . . . . . . . . . . . . . . . . . . . . . . . . . . . . .
8.4 Connecting the Target Cable to the Target System 8-7. . . . . . . . . . . . . . . . . . . . . . . . . . . . . .
8.5 How to Use the Target Cable 8-8. . . . . . . . . . . . . . . . . . . . . . . . . . . . . . . . . . . . . . . . . . . . . . . . .
9 CDT370 Repair Guide 9-1. . . . . . . . . . . . . . . . . . . . . . . . . . . . . . . . . . . . . . . . . . . . . . . . . . . . . . . . . . . .
9.1 The Debugger Menu Doesn’t Display 9-2. . . . . . . . . . . . . . . . . . . . . . . . . . . . . . . . . . . . . . . . . .
9.2 The CDT370 Does Not Function 9-4. . . . . . . . . . . . . . . . . . . . . . . . . . . . . . . . . . . . . . . . . . . . . .
9.3 The Target System Doesn’t Respond 9-5. . . . . . . . . . . . . . . . . . . . . . . . . . . . . . . . . . . . . . . . . .
10 Additional Notes 10-1. . . . . . . . . . . . . . . . . . . . . . . . . . . . . . . . . . . . . . . . . . . . . . . . . . . . . . . . . . . . . . .
vi
Page 9

Running Title—Attribute Reference
Figures
2–1. Configuration Switches 2-5. . . . . . . . . . . . . . . . . . . . . . . . . . . . . . . . . . . . . . . . . . . . . . . . . . . . . . . .
2–2. DOS Command Setup for the Debugger 2-10. . . . . . . . . . . . . . . . . . . . . . . . . . . . . . . . . . . . . . . .
4–1. Modify Address Dialog Box 4-2. . . . . . . . . . . . . . . . . . . . . . . . . . . . . . . . . . . . . . . . . . . . . . . . . . . . .
4–2. Select Action Dialog Box 4-3. . . . . . . . . . . . . . . . . . . . . . . . . . . . . . . . . . . . . . . . . . . . . . . . . . . . . . .
4–3. Select Memory Type Dialog Box 4-4. . . . . . . . . . . . . . . . . . . . . . . . . . . . . . . . . . . . . . . . . . . . . . . .
4–4. Validation Dialog Box 4-5. . . . . . . . . . . . . . . . . . . . . . . . . . . . . . . . . . . . . . . . . . . . . . . . . . . . . . . . . .
8–1. PLCC Target Cable Termination 8-2. . . . . . . . . . . . . . . . . . . . . . . . . . . . . . . . . . . . . . . . . . . . . . . . .
8–2. Switch Positions 8-4. . . . . . . . . . . . . . . . . . . . . . . . . . . . . . . . . . . . . . . . . . . . . . . . . . . . . . . . . . . . . .
8–3. Connecting the Target Cable to the CDT370 Board 8-5. . . . . . . . . . . . . . . . . . . . . . . . . . . . . . . .
Contents
vii
Page 10

Running Title—Attribute Reference
Tables
2–1. On-Board Switches 2-5. . . . . . . . . . . . . . . . . . . . . . . . . . . . . . . . . . . . . . . . . . . . . . . . . . . . . . . . . . . .
2–2. RS-232 Pin and Signal Assignments 2-8. . . . . . . . . . . . . . . . . . . . . . . . . . . . . . . . . . . . . . . . . . . . .
2–3. Summary of the Debugger Options 2-18. . . . . . . . . . . . . . . . . . . . . . . . . . . . . . . . . . . . . . . . . . . . .
2–4. Screen Size Options (for Use With the –b Option) 2-19. . . . . . . . . . . . . . . . . . . . . . . . . . . . . . . .
2–5. Serial Port and Add-On Address Options 2-19. . . . . . . . . . . . . . . . . . . . . . . . . . . . . . . . . . . . . . . .
3–1. Displayed Trace Samples 3-3. . . . . . . . . . . . . . . . . . . . . . . . . . . . . . . . . . . . . . . . . . . . . . . . . . . . . .
8–1. Available Target Cables 8-3. . . . . . . . . . . . . . . . . . . . . . . . . . . . . . . . . . . . . . . . . . . . . . . . . . . . . . .
8–2. Switch Signals 8-4. . . . . . . . . . . . . . . . . . . . . . . . . . . . . . . . . . . . . . . . . . . . . . . . . . . . . . . . . . . . . . . .
8–3. Connections for CDT370/Target Cables 8-6. . . . . . . . . . . . . . . . . . . . . . . . . . . . . . . . . . . . . . . . . .
10–1. Predefined Constants for Use With Conditional Commands 10-1. . . . . . . . . . . . . . . . . . . . . . . .
viii
Page 11

Introduction
Chapter 1
Introduction
The CDT370 (Compact Development Tool) offers a low-cost but highly efficient route to TMS370 family development. In addition, the CDT370 supports
programming of the new Field Programmable Microcontroller (FPM) family
members. Features such as a new interactive windowed CDT370 debugger,
real-time emulation, and an integrated EPROM and EEPROM programmer all
contribute to enhanced user productivity and, consequently , a shorter design
cycle.
The CDT370 is composed of:
-
CDT370 emulator board
-
Interactive windowed CDT370 C-source debugger
-
Assembler and linker
-
Complete support documentation
The CDT370 debugger is a screen-oriented, interactive program that aids in
the development of applications for TMS370 family microcontrollers. The debugger is used with a hardware unit called an emulator, which provides realtime, in-circuit emulation of the TMS370 microcontroller. The debugger runs
under the MS-DOS operating system on an IBM or compatible and connects
to the emulator through an add-on PC connection or RS-232 serial communications link.
Topic Page
1.1 About The CDT370 Board 1-2
1.2 About The Target Cable Set 1-3
Introduction
1-1
Page 12
About the CDT370 Board
1.1 About the CDT370 Board
Once the CDT370 is unpacked, you can begin code development immediately .
Everything required to emulate or program TMS370 devices is provided. The
CDT370 supports the following devices:
-
TMS370Cx1x
-
TMS370Cx2x
-
TMS370Cx4x
-
TMS370Cx5x
Use the
XDS22 Extended Development System
to develop code for
TMS370Cx3x PACT devices.
The CDT370 emulator hardware is a single board that can be connected in two
different ways:
-
The CDT370 board is designed to plug into the expansion chassis of any
IBM XT/AT or compatible
-
The CDT370 can be connected to the PC through an RS-232 serial link
The CDT370 on-board hardware provides:
-
Serial/parallel communication interface
-
Real-time TMS370 emulation logic (up to 20 MHz)
-
Real-time TMS370 data EEPROM emulation logic
-
Real-time trace circular buffer (up to 2048 program steps)
-
Real-time 24-bit cycle counter
-
Integrated EPROM and EEPROM device programmer
1-2
Page 13

1.2 About the Target Cable Set
Each emulator can have a target cable with a connector on one end that has
the same pinout as the device being emulated. This connector plugs directly
into the socket on the application system (also referred to as the
circuit board that would normally hold the TMS370 device. This allows direct,
in-circuit emulation. Each target cable also has an easy-extract socket that
allows you to program the devices.
In the supported TMS370 family, there are five different packages:
-
28DIL
-
28LCC
-
40DIL
-
44LCC
-
68LCC
There are seven different target cables to support these packages because
the 40-pin DIL and the 44-pin LCC TMS370Cx2x devices have different pinouts than the 40-pin DIL and 44-pin LCC TMS370Cx4x devices. As a result,
the emulator target cables for the devices are different and not interchangeable. The seven target cable sets are listed below along with the devices they
support:
About the Target Cable Set
target system
)
-
x1x devices in 28-pin DIL socket 28-pin DIL target cable. . . . . . . . . . . . .
-
x1x devices in 28-pin LCC socket 28-pin LCC target cable. . . . . . . . . . .
-
x2x devices in 40-pin DIL socket 40-pin DIL target cable. . . . . . . . . . . . .
-
x2x devices in 44-pin LCC socket 44-pin LCC target cable. . . . . . . . . . .
-
x4x devices in 40-pin DIL socket 40-pin DIL target cable. . . . . . . . . . . . .
-
x4x devices in 44-pin LCC socket 44-pin LCC target cable. . . . . . . . . . .
-
x5x devices in 68-pin LCC socket 68-pin LCC target cable. . . . . . . . . . .
Introduction
1-3
Page 14

1-4
Page 15

Running Title—Attribute Reference
Chapter 2
Getting Started
This chapter includes the proper procedures to set up the CDT370.
The following topics are covered:
Topic Page
2.1 System Hardware Requirements 2-2
2.2 System Software Requirements 2-3
2.3 Unpacking the CDT370 Board 2-4
2.4 Add-On PC Connection 2-5
2.5 Serial RS-232 Connection 2-7
2.6 Software Installation 2-9
2.7 Using the Debugger With Microsoft Windows 2-15
2.8 Power-Up Procedure 2-17
2.9 Invoking the Debugger 2-18
2.10 Exiting the Debugger 2-21
Chapter Title—Attribute Reference
2-1
Page 16

System Hardware Requirements
2.1 System Hardware Requirements
Host An IBM PC XT/A T or 100% compatible PC with a hard-disk system,
a serial port or a free full-length internal slot, and a 1.2-Mbyte 5-1/4”
floppy-disk drive.
Memory A minimum of 640K bytes of main memory is needed, but extended
(minimum 256K bytes) memory is also needed when you run the debugger under Windows.
Display A monochrome screen can be used, but a color screen (EGA or
VGA) is recommended.
Cable A target cable is required to connect the CDT370 board to the target,
but it is not needed when the emulator runs in stand-alone mode.
Options A Microsoft-compatible mouse.
An EGA- or VGA-compatible graphics display card and a large
monitor.
The debugger has two options that allow you to change the overall
size of the debugger display.
To use a larger screen size, you must invoke the debugger with the
appropriate option. For more information about options, refer to
Section 2.9,
Miscellaneous Blank, formatted disks.
Invoking the Debugger
.
2-2
Note: Firmware Version
Make sure you are using a CDT370 board with firmware version 3.0 or later.
Page 17

2.2 System Software Requirements
Operating System MS-DOS or PC-DOS (version 3.0 or later)
Optional: Microsoft Windows (version 3.0 or later)
Software Tools TMS370 C compiler, assembler (version 5.06 or later), and linker.
If you have a program that you assembled with an earlier version of
the assembler, be sure to update it.
Optional Files
†
init.cmd is a file that contains debugger commands. The version of
this file that’s shipped with the debugger defines a ’370 memory
map. If this file isn’t present when you first invoke the debugger, then
all memory is invalid at first. When you first start using the debugger,
this memory map should be sufficient for your needs.
Later, you may want to define your own memory map. For information about setting up your own memory map, refer to Section 7.2,
Memory Mapping
ily C Source Debugger User’s Guide
In addition to init.cmd, there are several other .cmd files in the maps
directory. These .cmd files define memory maps for standard ’370
devices. If you want to emulate a specific device, copy the appropriate .cmd file into your init.cmd file.
init.clr is a general-purpose screen configuration file. If this file isn’t
present when you invoke the debugger, the debugger uses the default screen configuration.
The default configuration file (.clr extension) is for color monitors;
another file (.mon extension) can be used with monochrome monitors. Several of each type of screen configuration file are included
in your screens directory. When you first invoke the debugger, the
default screen configuration should be sufficient for your needs. Later, you may want to define your own custom configuration.
and
Defining a Memory Map
System Software Requirements
, in the
TMS370 Fam-
.
†
For information about these files and about setting up your own
screen configuration, refer to
TMS370 Family C Source Debugger User’s Guide
the
Customizing the Debugger Display
.
, in
Due to the 640K-byte memory limitation under DOS, it may not be
possible to load and/or debug large applications with the DOS version of the debugger. The Windows version of the debugger will
make use of any extended memory available on the PC.
Included as part of the debugger package, these files are available on the C-source debugger
product disk but have not been copied by the installation process.
Getting Started
2-3
Page 18

Unpacking the CDT370 Board
2.3 Unpacking the CDT370 Board
Before you unpack the CDT370 board, decide if you want to plug the board into
an expansion slot inside your PC or connect it to an RS-232 cable outside your
PC. Placing the board inside your computer’s case is preferable, but if you
have no empty slots or if the internal mount makes it awkward to access the
target system, the RS-232 link can be used.
Remove the CDT370 board from its antistatic protection sheath.
To avoid damage to the board, do not touch the board directly,
except at a static-free workstation.
Do not connect any electric motors or fluorescent lights to the
CDT370 power circuit. Noise and/or voltage spikes from these
devices could affect operation.
Do not plug the CDT board into a slot next to an Ethernet card. The
target cables are not shielded.
2-4
Page 19
2.4 Add-On PC Connection
The CDT370 board can be plugged into any IBM PC XT/AT or compatible.
There are two different areas of jumpers on the board:
-
CONF with two possible positions
-
COM PORT with 4 possible positions
The shipping position is: Add-on PC link / Address 318h, IRQ4.
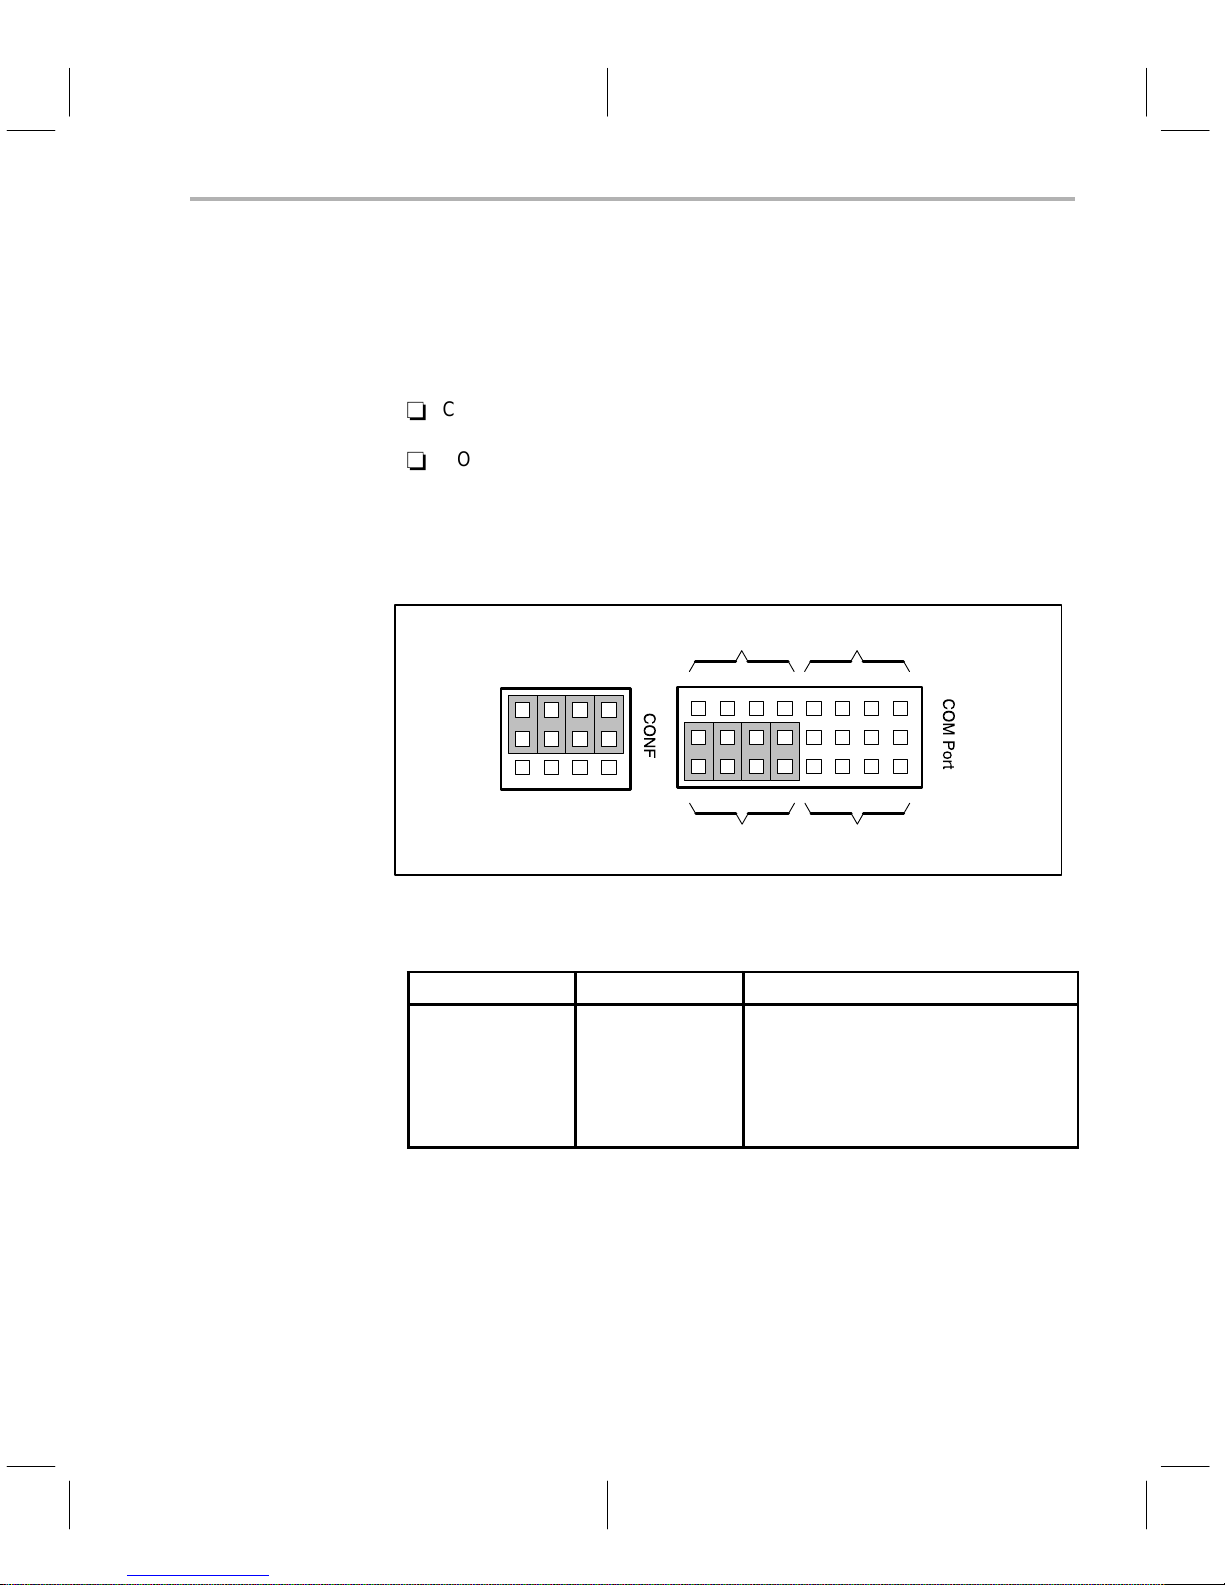
Figure 2–1.Configuration Switches
Add-On PC Connection
COM2 COM4
Add-On
Table 2–1.On-Board Switches
CONF COM Port Comments
ADD-ON
ADD-ON
ADD-ON
ADD-ON
RS-232
RS-232
Step 1: The CONF jumper must be set to the ADD-ON position, and the com
Step 2: Switch off your IBM PC XT/A T or compatible and remove the cover.
RS232
COM1 COM3
COM1
COM2
COM3
COM4
X
X
Add-on PC link / 318h, IRQ4
Add-on PC link / 358h, IRQ2
Add-on PC link / 338h, IRQ3
Add-on PC link / 398h, IRQ7
RS-232 link / serial com port 1
RS-232 link / serial com port 2
PORT jumper must be set to one of the four positions that are
referred to as COM1 through com 4.
Then, carefully plug the properly configured CDT370 board into an
empty slot.
Getting Started
2-5
Page 20

Add-On PC Connection
Step 3: To use the CDT370 to perform in-circuit emulation on your target
device or device programming, plug the target cable dedicated to the
TMS370 family member you are working with into the CDT370 board
before closing the cover.
For target cable connection, refer to Chapter 8,
T arget Connectors
Step 4: Close the cover of your PC and turn the power on.
.
2-6
Page 21

2.5 Serial RS-232 Connection
This section discusses connecting the debugger’s host machine to the
CDT370 board with a serial RS-232 communication link.
In addition to what is supplied with the CDT370 board, you must supply a 5-volt
regulated power supply (Icdt max = 1.8 A. Standard 5-V , 3-A power supply recommended) and an RS-232 serial cable type DB-9.
Do not connect the system to a power source at this time. Wait until
all installation checks are complete.
Check to make sure that there are no metal objects beneath the
CDT370 board that might short the V
Step 1: The CONF jumper must be set to the position RS232.
When the CONF jumper is set to RS232, the com PORT area’s jumper is not relevant, and any position is allowed.
Serial RS-232 Connection
, ground, or other signals.
cc
Step 2: Connect the external regulated power supply to the CDT370 board
through the dedicated connector. Make sure that the polarity is set
correctly.
Step 3: Connect the RS-232 cable of the host to the DB-9 pin connector of
the CDT370 according to the cable description (Table 2–2).
Step 4: If you want to perform in-circuit emulation or device programming
with the CDT370, install the target cable dedicated to the TMS370
family member you are working with.
For target cable connections, refer to Chapter 8,
T arget Connectors
Step 5: Turn the CDT370 board on before you turn on the application hard-
ware.
.
Getting Started
2-7
Page 22
Serial RS-232 Connection
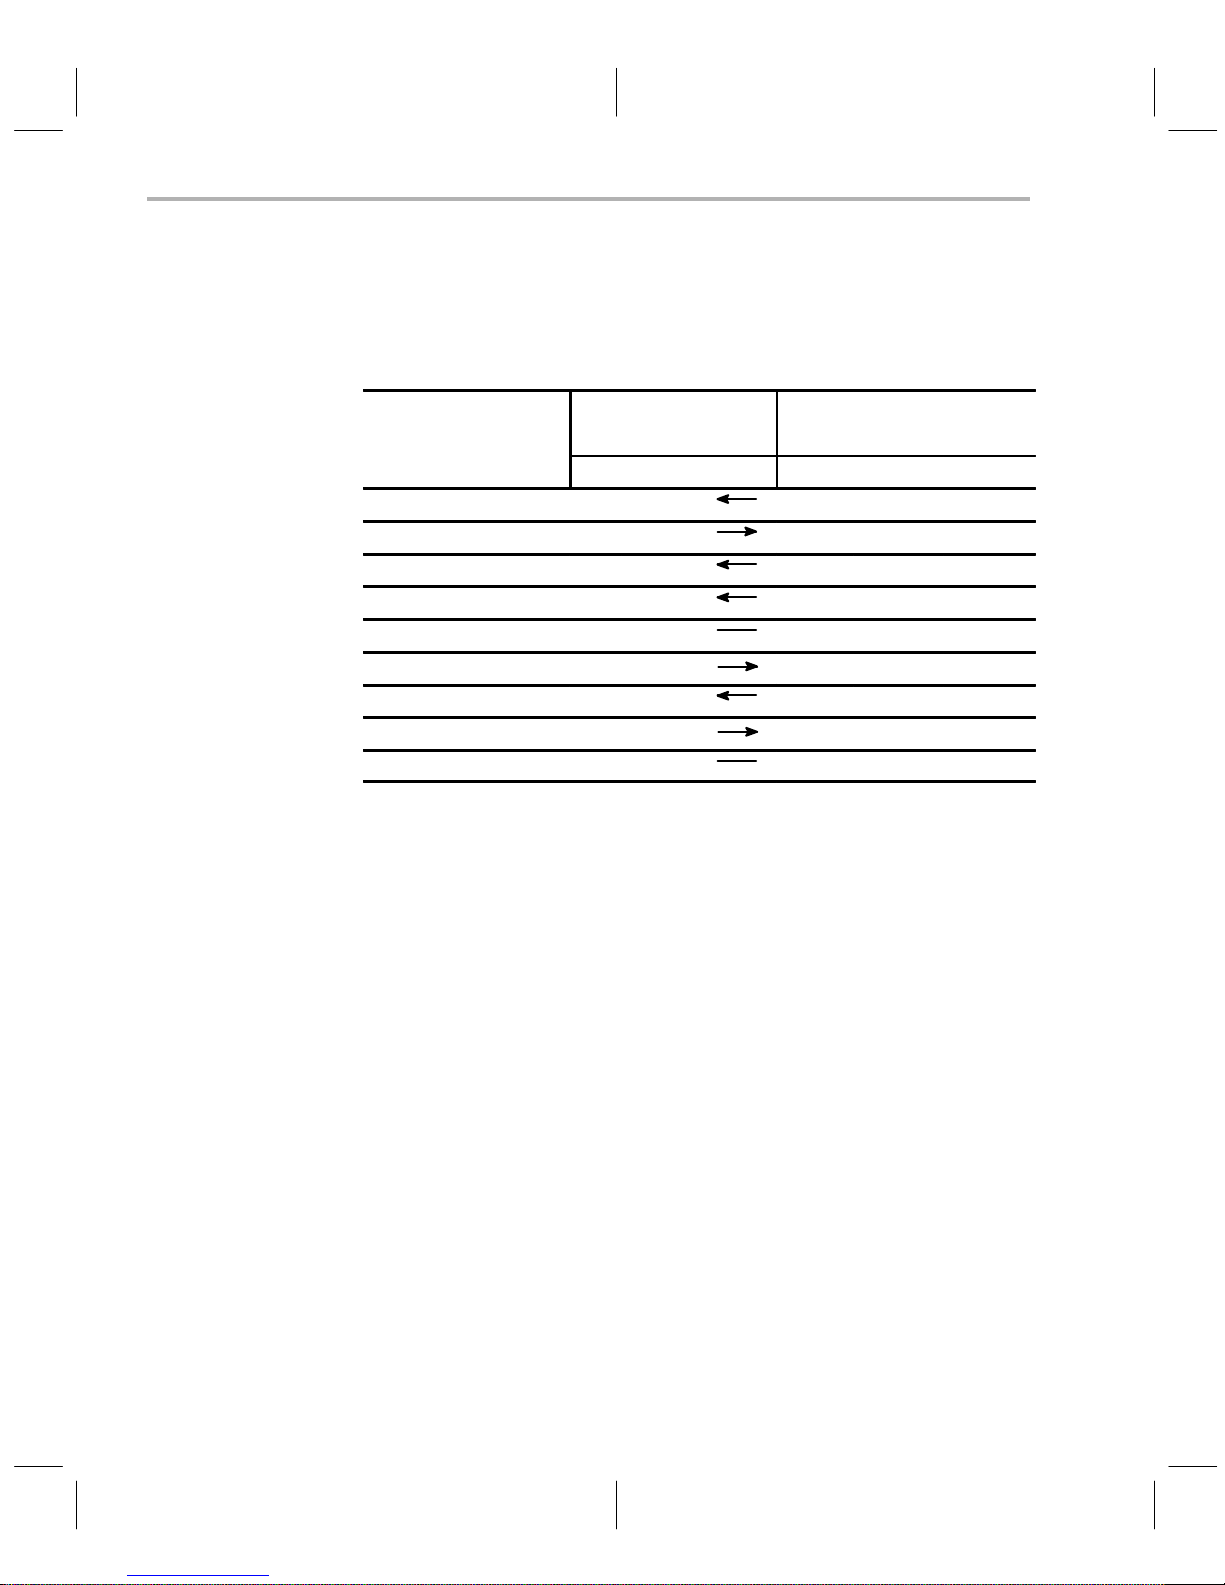
The CDT370 uses 8 of the 9 signals on a DB9 connector to communicate with
the host. The pin and signal assignments for the emulator and host computer
are listed in Table 2–2.
Table 2–2.RS-232
Pin and Signal Assignments
CDT370 HOST
Function
Female DB-9 DB-25 DB-9
Pin
Signal Signal Pin/XT Pin/AT
Connect Established 1 DCD DCD 8 1
Data to Host 2 TX RX 3 2
Data to Emulator 3 RX TX 2 3
Terminal Ready 4 DTR DTR 20 4
Signal Ground 5 GND GND 7 5
Emulator Ready 6 DSR DSR 6 6
Attention to Emulator 7 CTS RTS 4 7
Attention to Host 8 RTS CTS 5 8
Not used 9 RI RI 22 9
2-8
Page 23

2.6 Software Installation
This section explains the process of installing the debugger software on a
hard-disk system:
1) Make a backup copy of each product disk. Refer to a DOS manual, if necessary, to complete this step.
2) On your hard disk or system disk, create a directory named 370TOOLS.
This directory will contain the debugger software.
md c:\370TOOLS
3) Insert a product disk into drive A. Copy the debugger software onto the
hard disk or system disk.
copy a:\*.* c:\370TOOLS\*.* /v
Repeat this step for each product diskette.
4) If you don’t plan to use both the DOS and the Windows versions of the
debugger, you may want to delete the one you’re not using.
To delete the DOS executable file, enter:
del cdt370.exe
To delete the Windows executable file, enter:
del cdt370w.exe
Software Installation
Modifying your config.sys file
When using the debugger, you can have only twenty files open or active at the
same time. To tell the system not to allow more than twenty active files, you
must add the following line to your config.sys file:
FILES = 20
Once you have edited your config.sys file and added the line, invoke the file
by turning off the PC’s power and turning it on again.
Setting up the debugger environment
To ensure that your debugger works correctly, you must:
-
Modify the PATH statement to identify the 370TOOLS directory.
-
Define environment variables so that the debugger can find the files it
needs.
Not only must you do these things before you invoke the debugger for the first
you must do them any time you power up or reboot the system
time,
Getting Started
.
2-9
Page 24
Software Installation
You can accomplish these tasks by entering individual DOS commands, but
it’s simpler to put the commands in a batch file.
Y ou can edit your system’s autoexec.bat file; however , in some cases, modifying the autoexec.bat file may interfere with other applications running on your
PC. So, if you prefer, you can create a separate batch file that performs these
tasks.
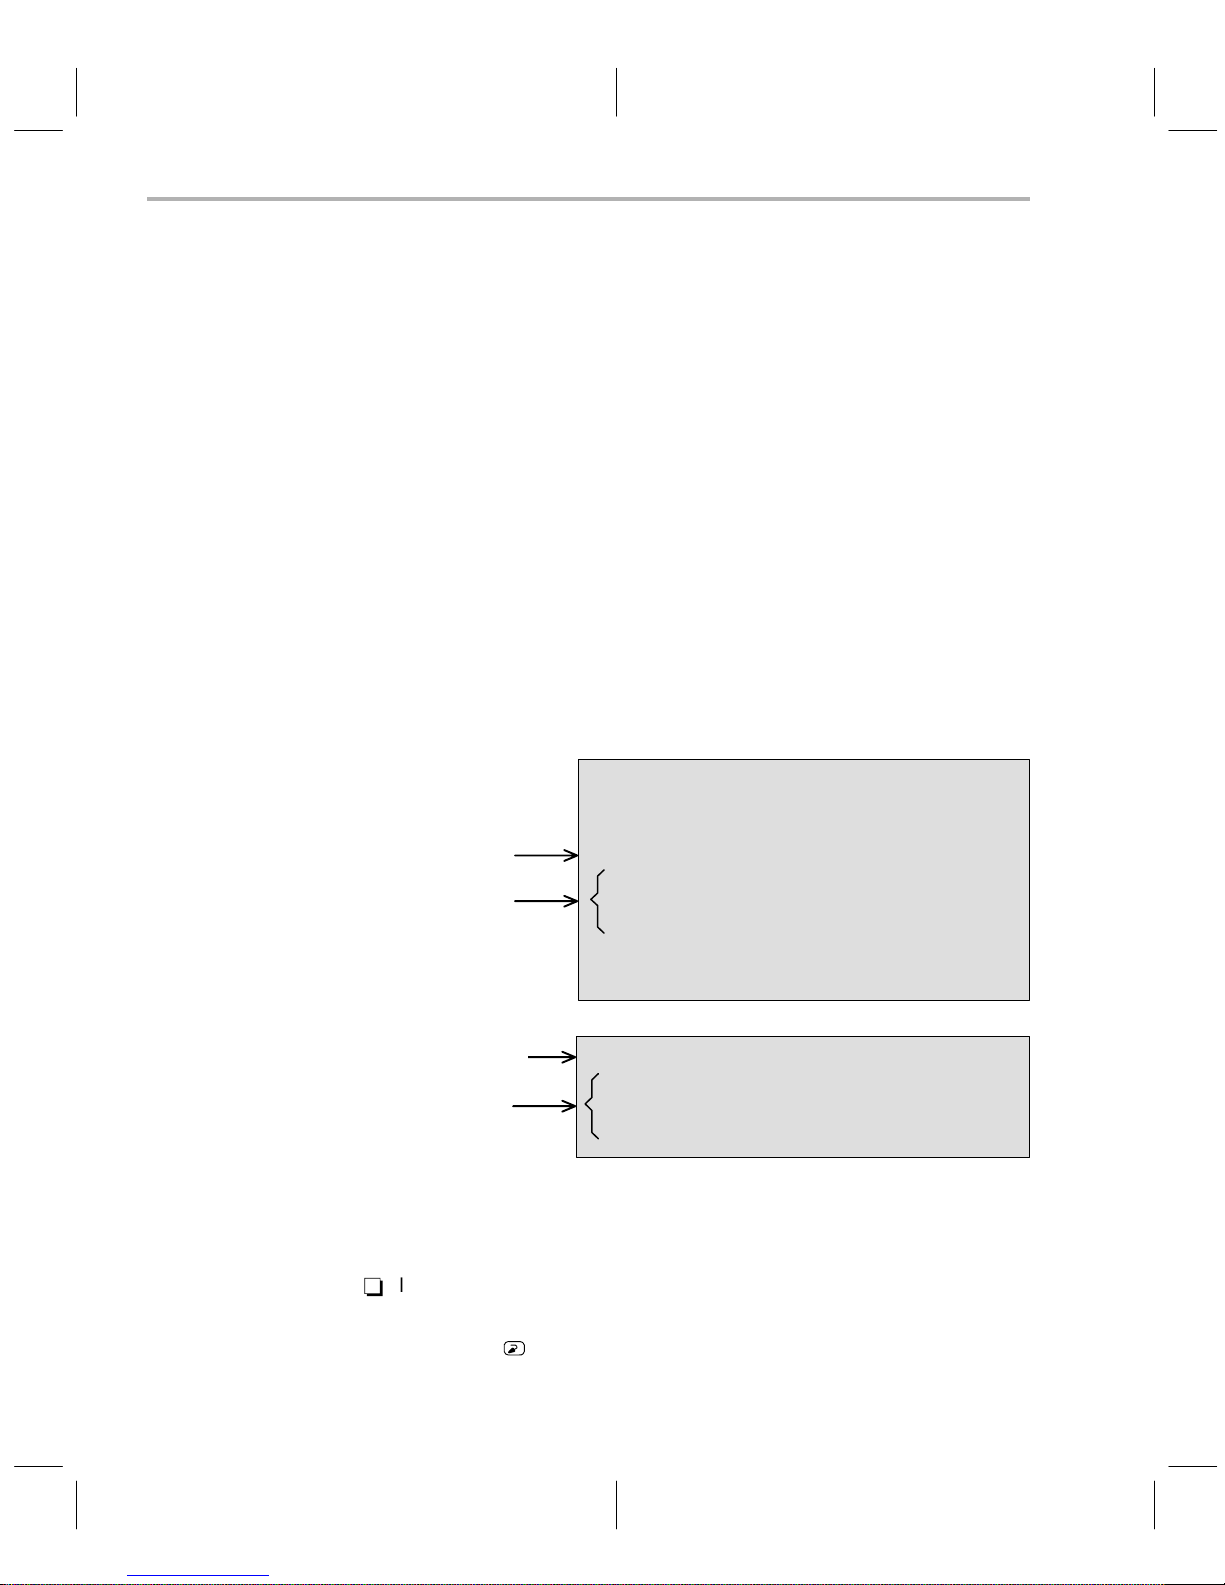
Figure 2–2 (a) shows an example of an autoexec.bat file that contains the suggested modifications (highlighted in bold type).
Figure 2–2 (b) shows a sample batch file that you could create instead of editing the autoexec.bat file. (For the purpose of discussion, assume that this sample file is named initdb.bat). The subsections following the figure explain these
modifications.
Figure 2–2.DOS Command Setup for the Debugger
(a) Sample autoexec.bat file
P ATH statement
Environment
variables and
I/O space
(b) Sample initdb.bat file
P ATH statement
Environment
variables and
I/O space
Invoking the new or modified batch file
-
If you modify the autoexec.bat file, be sure to invoke it before invoking the
debugger for the first time. To invoke this file, enter:
autoexec
DATE
TIME
ECHO OFF
PATH=c:\dos;c:\370tools
SET D_DIR=c:\370tools
SET D_SRC=;c:\csource
SET D_OPTIONS=–p2 –b
SET C_DIR=c:\370tools
CLS
PATH=C:\370tools;%path%
SET D_DIR=c:\370tools
SET D_SRC=c:\csource
SET D_OPTIONS=–p2 –b
2-10
Page 25

-
If you create an initdb.bat file, you must invoke it before invoking the debugger for the first time. If you are using Microsoft Windows, invoke
initdb.bat
to invoke initdb.bat any time that you power up or reboot your PC. To do
so, enter:
initdb
Modifying the path statement
Define a path to the debugger directory. The general format for doing this is:
Software Installation
before
entering the Windows environment. After that, you’ll need
PATH = C:\370TOOLS;
This allows you to invoke the debugger without specifying the name of the directory that contains the debugger executable file.
-
If you are modifying your autoexec.bat file and it already contains a P A TH
statement, simply include ;C:\370TOOLS at the end of the statement, as
shown in Figure 2–2 (a).
-
If you are creating an initdb.bat file, use a different format for the PATH
statement:
PATH=C:\370TOOLS;%path%
The addition of ;%path% ensures that this P ATH statement won’t undo the
PATH statements in other batch files (including the autoexec.bat file).
Setting up the environment variables
An environment variable is a special system symbol that the debugger uses
for finding or obtaining certain types of information. The debugger uses three
environment variables named D_DIR, D_SRC, and D_OPTIONS. The next
three steps tell you how to set up these environment variables. The format for
doing this is the same for both the autoexec.bat and initdb.bat files.
pathname2;pathname3
;...
-
Set up the D_DIR environment variable to identify the 370TOOLS directory:
SET D_DIR=C:\370TOOLS;
pathname2
;....
(Be careful not to precede the equal sign with a space).
This directory contains auxiliary files (init.cmd) that the debugger needs.
Getting Started
2-1 1
Page 26

Software Installation
-
Set up the D_SRC environment variable to identify any directories that
contain program source files that you will want to look at while you’re debugging code. The general format is:
SET D_SRC=
pathname1;pathname2
;...
(Be careful not to precede the equal sign with a space).
For example, if your ’370 programs reside in a directory named
CSOURCES, the D_SRC setup would be:
SET D_SRC=C:\CSOURCES
-
Y ou can use several options when you invoke the debugger. If you use the
same options over and over, it’s convenient to specify them with D_OPTIONS. The general format for doing this is:
SET D_OPTIONS=[
object filename][debugger options
(Be careful not to precede the equal sign with a space).
This tells the debugger to load the specified object file and use the se-
lected options each time you invoke the debugger.
These are the options that you can identify with D_OPTIONS:
]
Verifying the installation
To ensure that you have correctly installed the emulator and debugger software, enter this command at the system prompt:
CDT370 C:\370TOOLS\sample –p
or
CDT370 C:\370TOOLS\sample –a
–b –bb –i
–a
add-on address
–t
filename
–profile –s
–v
pathname
–p
serial port
Note that the –p and –a options cannot be used at the same time. Also, you
can override D_OPTIONS by invoking the debugger with the –x option.
For more information about options, refer to Section 2.9,
Debugger
.
serial port
add_on address
Invoking the
2-12
Page 27

Software Installation
If you are using Microsoft Windows, use cdt370w to invoke the debugger.
Please refer to Section 2.7 for information on running under Microsoft Windows. After invoking the debugger, you should see a display similar to this:
Load Break Watch Memory
DISASSEMBLY
7185 88 c_into0: MOVW #02883h,R021
7189 98 MOVW R021,R01F
718c 52 MOV #022h,B
718e fd LDSP
718f 8e CALL 7199h
7192 8e CALL main
7195 8e CALL exit
7198 fa RTI
7199 88 MOVW #0723Ah,R0F
719d 00 JMP 71BFh
719f f4 MOV 3(R0F),A
71a3 d0 MOV A,R0D
71a5 f4 MOV 2(R0F),A
71a9 d0 MOV A,R0C
71ab 70 INCW #4,R0F
71ae 00 JMP 71BAh
COMMAND
(c)Copyright 1992, Texas Instruments
Silicon Revision 2
Emulator Revision 1
Loading sample.out
Done
>>>
-
If you see a display similar to this one, you have correctly installed your
MoDe Run=F5 Step=F8 Next=F10Color
BTT
MEMORY
0000 87 00 cb 01 00 00 28 e5 00 00 00 00
000c 28 81 72 44 00 00 00 00 00 00 00 00
0018 00 00 00 00 00 00 28 87 28 8f 00 70
0024 40 00 00 00 00 00 00 00 00 00 00 00
0030 00 00 00 00 00 00 00 00 00 00 00 00
CPU
PC 7185
A87
B00
ST 40
SP 22
emulator and debugger.
-
If you don’t see a display, then your debugger or cables may not be
installed properly. Go back through the installation instructions and be
sure that you have followed each step correctly; then reenter the command.
Installation error messages
If the following message appears on your screen:
One of several conditions may be the cause.
Check these items:
-
CANNOT INITIALIZE TARGET SYSTEM ! !
– Check I/O configuration
– Check cabling and target power
If the target cable is installed on the target board, is the target board powered?
Getting Started
2-13
Page 28

Software Installation
-
If the target cable is not installed on the target, is it isolated from any conductive surfaces, including conductive foam or bags?
-
Is the emulator board installed properly and powered?
-
Are you using the correct host communication port?
-
If an RS-232 link is used, is the cable properly connected and wired?
-
Is your serial port or add-on address set correctly?
2-14
Page 29

Using the Debugger With Microsoft Windows
2.7 Using the Debugger With Microsoft Windows
When using the debugger under Windows, you must configure a communication port:
-
Serial Connection: The debugger will communicate with Windows
through Windows com port 1 if you have connected the CDT370 to com
port 1, and Windows com port 2 if you have connected the CDT370 to com
port 2. The standard communication settings (baud rate, data bits, parity ,
stop bits, and flow control) are configured directly by the debugger software without your intervention and can therefore be ignored.
The advanced settings should be configured by your Windows program to
correspond to your hardware setup. You can verify this by checking the
advanced communications settings of the com port you are using; open
the Control Panel window, select the Ports icon, and compare the
advanced settings for the port you are using (COM1 or COM2) against
your hardware manual.
-
Add-On PC Connection: Regardless of how you set the com port jumper
on the CDT370 board, the debugger software will always communicate
with Windows through Windows com port 3. The standard communication
settings (baud rate, data bits, parity , stop bits, and flow control) are configured directly by the debugger software without your intervention and can
therefore be ignored. Y ou must set the advanced settings, however (base
I/O port address and interrupt request line (IRQ)).
To configure the port, open the Control Panel window and choose the
Ports icon. The Ports dialog box appears, showing icons for the four possible serial ports. Double-click on the COM3: icon. The Settings dialog box
appears. Choose the Advanced button. The Advanced Settings dialog box
appears. Type the correct value into the Base I/O Port Address; then open
the Interrupt Request Line list and select the proper IRQ number. These
values are determined by the way you have positioned the com port
jumper on the CDT370 board and are shown in Table 2–1 on page 2-5.
Choose the OK button and restart Windows by choosing the Restart Now
button.
Getting Started
2-15
Page 30

Using the Debugger With Microsoft Windows
Example 2–1.Examples of Windows COM Port Configuration for Add-on Connections
1) Add-on connection with jumper position COM2
0358
2
2) Add-on connection with jumper position COM3
0338
3
Invoking the debugger with Microsoft Windows
Y ou may want to create an icon to make it easier to invoke the debugger from
within the Microsoft Windows environment. To install the debugger software
in Microsoft Windows, create a new program item. (Please refer to your Microsoft Windows manual for details.) While creating a new program item, type
cdt370w.exe at the command line and include any additional parameters you
want. If you plan on using the profiler, be sure to include the
–profile
option.
If you prefer, you can also execute the DOS version from Windows by entering
cdt370.exe at the command line. If you are going to be switching frequently
between the basic debugger and the profiler, it might be more convenient for
you to create separate program items for each.
Using Microsoft Windows, you can freely move or resize the debugger display
on the screen. If the resized display is bigger than the debugger requires, the
extra space is not used. If the resized display is smaller than required, the display is clipped. Note that when the display is clipped, it can’t be scrolled.
When running Microsoft Windows, you should run it in either the standard
mode or the 386 enhanced mode to get the best results.
2-16
Page 31

2.8 Power-Up Procedure
If a target system is used, replace the TMS370 microprocessor in the target
system with the target connector of the CDT370. See Section 8.4,
the Target Cable to the Target System
correct.
Note: Pin 1 is marked with an open dot ( f ).
Always ensure that the power of the CDT370 is off before
connecting or disconnecting the target connectors.
Power-Up Procedure
Connecting
. Make sure that the pin orientation is
Getting Started
2-17
Page 32

Invoking the Debugger
2.9 Invoking the Debugger
Before invoking the debugger, check that the emulator is properly configured
and that the cable from the emulator to the PC host (if used) is properly connected. The debugger will not operate unless the emulator is correctly connected and turned on.
Here’s the basic format for the commands that invoke the debugger:
cdt370 [
filename
] [
–options
cdt370 is the command that invokes the debugger. If you are using
Microsoft Windows, use cdt370w to invoke the debugger.
filename
is an optional parameter that names an object file that the
debugger will load into memory during invocation. The
debugger looks for the file in the current directory; if the file
isn’t in the current directory , you must supply the entire pathname. If you don’t supply an extension for the filename, the
debugger assumes that the extension is .out.
–options
supply the debugger with additional information (Table 2–3
summarizes the available options).
You can also specify filename and option information with the D_OPTIONS
environment variable (see
2-1 1). T able 2–3 lists the debugger options; the subsections following the table
describe the options.
Table 2–3.Summary of the Debugger Options
Option Brief description
–b[b] Selects the screen size
–i
pathname
address
–a
–p
serial port
–profile Enter the profile environment (Windows version only)
–s Load the symbol table only
–t
filename
–v Load without the symbol table
–x
]
Setting up the environment variables
Identify additional directories
Identify the add-on address
Identify the serial port
Identify a new initialization file
Ignore D_OPTIONS
on page
Selecting the screen size (–b option)
By default, the debugger uses an 80-character-by-25-line screen. Y ou can use
one of the options in Table 2–4 to specify a different screen size.
2-18
Page 33

Table 2–4.Screen Size Options (for Use With the –b Option)
Option Description Notes
none
–b 80 characters by 43 lines Any EGA or VGA display
–bb 80 characters by 50 lines VGA only
Note:
80 characters by 25 lines Default display
Invoking the Debugger
Using the –b options overrides the
init.clr
file.
Identifying additional directories (–i option)
The –i option identifies additional directories that contain your source files. Re-
place
pathname
with an appropriate directory name. Y ou can specify several
pathnames; use the –i option as many times as necessary. For example:
CDT370 –i
path1
–i
path2
–i
path3
...
Using –i is similar to using the D_SRC environment variable.
Setting up the environment variables
(See
in 2.4.3)
If you name directories with both –i and D_SRC, the debugger first searches
through directories named with –i. The debugger can track a cumulative total
of 20 paths (including paths specified with –i,D_SRC, and the debugger USE
command).
Identifying the serial port (–p option )or the add-on address (–a option)
The –p or –a option identifies the serial port or the add-on address that the
debugger uses for communicating with the emulator. The default value, –a1,
corresponds to the CDT370 board shipping position (Add-on PC link, Address
318h, IRQ4). Depending on your configuration, use one of these values:
Table 2–5.Serial Port and Add-On Address Options
Option CONF COM PORT Comments
–a1
–a2 ADD-ON COM2 Add-on PC link 358h IRQ2
–a3 ADD-ON COM3 Add-on PC link 338h IRQ3
–a4 ADD-ON COM4 Add-on PC link 398h IRQ7
–p1 RS-232 X RS232 link serial com port 1
–p2
ADD-ON COM1 Add-on PC link 318h IRQ4
RS-232 X RS232 link serial com port 2
Getting Started
2-19
Page 34

Invoking the Debugger
Note: You Cannot Use the –a and –p Options at the Same Time
the –a and –p options are mutually exclusive; only one can be used (according to your hardware configuration)
If you used a wrong setting, you’ll see this error message when you try to invoke the debugger:
CANNOT INITIALIZE TARGET SYSTEM ! !
– Check I/O configuration
– Check cabling and target power
Entering the profiling environment (–profile option)
The –profile option allows you to bring up the debugger in a profiling environ-
ment so that you can collect statistics about code execution. Note that only a
subset of the base debugger features is available in the profiling environment.
Loading the symbol table only (–s option)
.
If you supply a filename when you invoke the debugger, you can use the –s
option to tell the debugger to load only the file’s symbol table (without the file’s
object code). This is similar to the debugger’s SLOAD command.
Identifying a new initialization file (–t option)
The –t option allows you to specify an initialization command file that will be
used instead of init.cmd. If –t is present on the command line, the file specified
by filename will be invoked as the command file instead of init.cmd.
Loading without the symbol table (–v option)
The –v option prevents the debugger from loading the entire symbol table
when you load an object file. The debugger loads only the global symbols and
later loads local symbols as it needs them. This speeds up the loading time and
consumes less memory space.
The –v option affects all loads, including those performed when you invoke the
debugger and those performed with the LOAD command within the debugger
environment.
Ignoring D_OPTIONS (–x option)
The –x option tells the debugger to ignore any information supplied with the
D_OPTIONS. For more information about D_OPTIONS, please refer to
ting up the environment variables
Set-
in Section 2.6.
2-20
Page 35

2.10 Exiting the Debugger
To exit any version of the debugger and return to the operating system, enter
this command:
quit
You don’t need to worry about where the cursor is or which window is
active—just type. If a program is running, press
before you quit the debugger.
If you are running the debugger under Microsoft Windows, you can also exit
the debugger by selecting the exit option from the Microsoft Windows menu
bar.
Exiting the Debugger
ESC
to halt program execution
Getting Started
2-21
Page 36

2-22
Page 37

Running Title—Attribute Reference
Chapter 3
Trace
This chapter explains how to use the circular trace buffer that exists on the
CDT370 board. With the trace buffer and the trace and timing commands, you
can monitor and collect statistics on the CPU as it runs. This chapter also covers the differences between the CDT370 trace functions and the breakpoint/
trace/timing (BTT) board described in the
User’s Guide.
Topic Page
3.1 Trace and T iming 3-2
3.2 Trace Commands 3-5
3.3 Differences Between XDS/22 BTT and CDT370 Trace 3-7
TMS370 Family C Source Debugger
Chapter Title—Attribute Reference
3-1
Page 38

Trace and Timing
3.1 Trace and Timing
There is a 2K x 16-bit trace circular buffer on the CDT370 board. The TMS370
internal address bus is stored each time an opcode fetch is detected. When
you want to display the contents of this buffer , the debugger reconstitutes all
the opcodes executed by the TMS370.
This trace feature is fully real time because the CPU is not halted. The sample
capture begins when you start the CPU and ends when you halt it, either with
a breakpoint or halt command.
A 24-bit-wide on-board counter is incremented by the CPU’s clock, so the total
number of cycles can be measured between two defined instructions (referenced by two breakpoints).
The capacity of this counter is up to 16 777 216 cycles; at 20 MHz, that means
a total time of 3.35 seconds.
Trace Feature
The trace feature is used to display trace samples that have been collected,
as well as the value of the timer.
Trace Samples
When you select Trace from the menu bar , a pull-down menu is opened, where
you can open the Inspect window, position the frame to display within the Inspect window, or save the trace buffer to a file.
Most of the inspect window consists of space for the trace samples. In the bottom corner, the value of the on-board timer is displayed. You can move and
scroll through trace samples in the same way as with other windows.
Trace samples are snapshots of bus cycle activity that are collected and stored
by the on-board trace logic when the CDT370 is running.
The trace buffer is a circular buffer that can hold 2048 samples. If more samples than this are collected, the buffer wraps around, and new samples overwrite the old ones. Each sample is 16 bits wide and contains the value of the
address bus of the CPU when an opcode fetch is detected.
Each trace sample is referred to by its index in the trace buffer, starting from
0. Trace samples with lower indices are chronologically older than samples
with higher indices. Thus, if the buffer is full, sample 2046 is always the most
recent sample taken.
3-2
Page 39

When trace samples are displayed on the screen, they include the information
shown in Table 3.1 identified by a heading displayed on top of the screen.
Table 3–1.Displayed Trace Samples
Field Description
SAMPLE Index in trace buffer
ADDRESS 16-bit value of address bus
REVERSE ASM
Note: The first trace sample is never taken, but the runtime value is accurate. After target reset, trace buffer content are irrelevant.
Timer Value
On the bottom of the screen, the value of the on-board counter is displayed.
This counter is incremented by the CPU’s clock in run mode. When you enter
the RUN command (F5 key), this timer is automatically reset before the CPU
runs, and automatically disabled when the CPU is halted (manually or by a
breakpoint). As a result, you can measure the number of cycles spent during
the whole run mode. The major purpose of this counter is to measure the number of cycles spent between defined addresses. You simply need to define
breakpoints before executing the RUN command; Each time a breakpoint is
reached, the number of cycles spent since the last breakpoint is displayed.
Trace and Timing
Disassembled code
This counter is 24 bits wide, so it overflows at 16 777 216 cycles.
A time information can be obtained by applying the following formula :
TIME_SPENT (ms)
ACCURACY (ms)
4 COUNTER_VALUE
+
FREQUENCY_USED (MHz)
+
FREQUENCY_USED (MHz)
4
For example, if the frequency is 16 MHz, and the counter value is 42 400, the
time spent and accuracy are:
TIME_SPENT (ms)
ACCURACY (ms)
4 42400
+
+
16 MHz
16 MHz
4
+
+
10600ms+10.6 ms
4
+
16
0.25ms
+
250 ns
At the maximum allowed frequency of 20 MHz, the maximum time measurable
is about 3. 355 433 seconds with an accuracy of 200 ns.
Trace
3-3
Page 40

Trace and Timing
Benchmarking
Code benchmarking, as explained in the
User’s Guide
, is also available in the CDT370. The value of the pseudoregister
TMS370 Family C Source Debugger
CLK is valid after a RUN or a RUNB command that is terminated by a software
breakpoint.
3-4
Page 41

3.2 Trace Commands
Trace Commands
T o access the T race , simply hit
opens a trace pull-down menu in which you can select or click the following
commands:
-
Inspect
-
Position
-
Save
Inspect frames (the I command)
When Inspect is selected, the debugger checks the emulator to determine how
many trace samples have been collected. If the emulator has no trace samples, a blank window appears on the screen. Otherwise, the debugger reads
a screenful of the most recent trace samples and displays them. The Inspect
window looks as follows.
(This is given as an example only and assumes that the trace has collected something)
Inspect
Sample ADDR Reverse ASM
0007
0008 7043 CALL INIT_INIT
0009 7090 RTS
0010 7046 CALL SPI_INIT
... ... ...
... ... ...
... ... ...
ALT T
7042 LDSP
, or click Trace from the menu bar . This
Sample is the frame number within the trace buffer, ADDR is the program
counter of the traced instruction, and Reverse ASM is the recreated mnemonic
of the instruction.
Position at an index (the P command)
When Position is selected by pressing
mouse, the following dialog box is opened.
ALT P
Position
Sample Number [...............................]
or by clicking the P with the
<Bottom>
<Top>
<<OK>> <Cancel>
Trace
3-5
Page 42

Trace Commands
To select the frame to display within the Inspect window, enter an adequate
frame number, select the Bottom frame (with the
it with the mouse), or select the T op frame (with the
it with the mouse). Once the choice is made, simply quit the Position window
ALT O
with the
(for OK) or
be updated accordingly.
T (T op Samples) positions the screen at the top of the trace buf fer . The oldest
samples in the buffer are displayed, starting with index 0.
B (Bottom Samples) positions the screen at the bottom of the trace buffer . The
most recent samples in the buffer are displayed. If the buffer is full, the highest
index is 2046. Otherwise, the highest index is one less than the total.
Saving trace information (the S command)
When the Save Command is invoked, the following dialog box is opened:
Save trace buffer
File name [................................................................]
Start [.....] to End [.....]
ALT B
keys or by clicking
ALT T
keys or by clicking
ALT A
(for Cancel). The Trace Window will then
The Save command saves trace samples to a disk file for later inspection. Any
number of samples can be saved, up to the number that were recorded. Just
type in the filename of the file where you want to store the trace information
and hit the enter key or click the O (for O. K.) with the mouse.
Enter the indices of the first and last samples if you want specific frames to be
saved.
The default start index is 0, and the default end index is the last sample taken;
using both defaults causes the whole trace buffer to be saved. The specified
trace samples are read from the emulator, formatted just as they would be for
display on the screen, and written to the file. If many samples are saved, this
process can be somewhat lengthy. For example, saving a full trace buffer of
2048 samples may take approximately 30 seconds.
Execute from the trace screen
Y ou can execute code while you are viewing the trace screen. You use the F8
or F10 command from the trace menu. After the code executes, the debugger
will update the trace screen by reading the new trace samples from the emulator and displaying the most recent ones.
<<OK>> <Cancel>
3-6
Page 43

Differences Between XDS/22 BTT and CDT370 Trace
3.3 Differences Between XDS/22 BTT and CDT370 Trace
The BTT command, which is specific to the XDS/22 BTT, is not available with
the CDT370.
The
TMS370 Family C Source Debugger User’s Guide
that are not applicable to the CDT370 debugger:
and
Using Hardware Breakpoint, Trace, and Timing Features
The following commands are available:
-
INSP Open INSPECT Window
-
TSAVE Store and Save the Trace Buffer
-
RUNF Run Free
-
RRUNF Reset and Run Free
-
WRUNF Wait and Run Free
-
HALT Halt Target System
T utorial: Using BTT Features
includes two chapters
.
Please refer to the
Family C Source Debugger User’s Guide
Summary of Commands and Special Keys
for a description of these commands.
in the
TMS370
Since the CDT370 does not have a BTT , you remain in control of the command
ESC
line; that is, you do not have to press
to regain control after entering a
RUNF, RRUNF, or WRUNF command.
Trace
3-7
Page 44

3-8
Page 45

With the debugger, it is possible to:
-
Program an EPROM device (FPM)
-
Program data EEPROM
-
Blank Check a device
-
Verify a device
-
Upload the contents of a device to RAM
Running Title—Attribute Reference
Chapter 4
Programming
These features use the emulator’s memory. First, you must configure the emulator memory map to match the device you are emulating. Second, you must
load your code into the emulator’s memory in the same locations where the
code will ultimately reside on the device. For information on memory mapping,
please refer to Section 7.2,
in the
TMS370 Family C Source Debugger User’s Guide.
Memory Mapping
, and to
Defining a Memory Map
Topic Page
4.1 Programming a Device (the P Command) 4-2
4.2 Action Selection 4-3
4.3 Memory T ype Selection 4-4
4.4 Validation Dialog Box 4-5
4.5 Messages 4-6
Chapter Title—Attribute Reference
4-1
Page 46

Programming a Device (the P Command)
4.1 Programming a Device (the P Command)
The P (programming) command is used to program the device that you will
plug into the target connector’s easy-extract socket. When you type
or click the P on the menu bar with the mouse, the Device Programming window is displayed and a dialog box is opened as shown in Figure 4–1.
Figure 4–1.Modify Address Dialog Box
DEVICE PROGRAMMING
Data EEPROM start address :0x1E00
Data EEPROM end address :0x1FFF
Program EPROM start address :0x4000
Program EPROM end address :0x7FFF
Warning:
1) Disconnect emulation cable from target system
2) Ensure target switches are set to ’EMU’ & install device in socket
3) Set all 3 switches on target connector to ’PROG’
A warning at the bottom of the window reminds you that you must disconnect
the emulation cable from the target system, ensure that target switches are set
to EMUL, install the device to be programmed into the socket, and finally set
all 3 switches on target connector to PROG.
Modify Address
Data EEprom start : [0x1E00]
Data EEprom end : [0x1FFF]
Program Eprom start : [0x4000]
Program Eprom end : [0x7FFF]
<<OK>> <Cancel>
ALT P
,
4-2
If you want to modify the start and end address of each memory block, click
with the mouse, or position the cursor (with the keyboard cursor keys) on the
address to modify, then enter the proper value for each memory type.
Remember to load your object code in the emulator RAM at these address
ranges before entering the Programming mode if you intend to program or
verify your device.
When the values are right for your application, click on OK with the mouse or
activate it with the
ALT O
keys. The debugger will then load progv3.obj, the
device programming utility (DPU), and open the Select Action dialog box.
Note: Effects of Loading the DPU
Loading the Device Programming Utility erases the current debugger symbol
table.
To go back, or to cancel the P Command, simply click the A with the mouse
ALT A
or use the
keys to activate the cancel command. When you specify this
commmand, the debugger will return to the menu bar.
ESC
Press the
to return to the previous window.
Page 47

4.2 Action Selection
Once the address ranges convenient for the application are selected, the
Select Action dialog box is opened as shown in Figure 4–2.
Figure 4–2.Select Action Dialog Box
Data EEPROM start address : 0x1F00
Data EEPROM end address : 0x1FFF
Program EPROM start address : 0x6000
Program EPROM end address : 0x7FFF
Warning:
1) Disconnect emulation cable from target system
2) Ensure target switches are set to ’EMU’ & install device in socket
3) Set all 3 switches on target connector to ’PROG’
You can select one of following actions:
-
Program to program the device
DEVICE PROGRAMMING
Select Action
<<Program>>
<Blanck Check>
<Verify>
<Upload>
Action Selection
<Cancel>
Program
Blank Check
Verify
Upload
-
Blank Check to check that the device has no program
-
Verify to check the contents of the device against the CDT’s content
-
Upload to upload the contents of the device into the CDT’s memory
Program is the default selection. The action selected will be applied to the
memory address ranges selected previously.
This action programs the contents of the CDT370 RAM into the device (byte
per byte copy , at the same addresses). The program is automatically verified.
This action checks whether a device has already been programmed or not.
Each EPROM or EEPROM memory location is compared to FFh.
This action verifies that the contents of the device memory perfectly match the
contents of the CDT370 RAM.
This action loads the contents of the device memory into the CDT370 RAM.
Programming
4-3
Page 48

Memory T ype Selection
4.3 Memory Type Selection
Once you have selected an action, select the type of memory you want to access.
The dialog box looks like:
Figure 4–3.Select Memory Type Dialog Box
Data EEPROM start address : 1F00
Data EEPROM end address : 1FFF
Program EPROM start address : 6000
Program EPROM end address : 7FFF
Warning:
1) Disconnect emulation cable from target system
2) Ensure target switches are set to ’EMU’ & install device in socket
3) Set all 3 switches on target connector to ’PROG’
DEVICE PROGRAMMING
Selected Action
<<Program Eprom>>
<Data EEprom>
<Both Eprom + EEprom>
<Cancel>
You can apply the selected action (Program, Blank Check, Verify or Upload)
to:
-
the Program EPROM only,
-
the Data EEPROM only,
-
or Both EPROM and EEPROM.
Program EPROM is the default selection.
4-4
Page 49

4.4 Validation Dialog Box
After selecting the memory type, the V alidation dialog box allows you to start
or cancel the operation.
Figure 4–4.Validation Dialog Box
Data EEPROM start address : 1F00
Data EEPROM end address : 1FFF
Program EPROM start address : 6000
Program EPROM end address : 7FFF
PROG Prog Eprom
Warning:
1) Disconnect emulation cable from target system
2) Ensure target switches are set to ’EMU’ & install device in socket
3) Set all 3 switches on target connector to ’PROG’
Make sure that all three target connector switches are set to PROG before
starting the operation. To abort the process once it has been started, press
ESC
.
Validation Dialog Box
DEVICE PROGRAMMING
Selected Action Selected Memory Type
<<START>>
<Cancel>
Once the operation has completed, a warning message at the bottom of the
window reminds you that, to avoid damage to the device, you must return all
3 target switches to EMUL before removing the device from the programming
socket; a completion message is displayed in the command window. You can
then repeat the same operation to the same device or a different one, or cancel
and go back to Action Selection.
Programming
4-5
Page 50

Messages
4.5 Messages
Depending on the action selected, the following messages can be displayed:
Action Message
Program Device programmed and checked
Programmation failed
Verification failed
Blank Check Device is blank
Device is not blank
Verify Device programmed and checked
Verification failed
Upload Device upload completed
All
Fault condition ... Operation failed
4-6
Page 51

Running Title—Attribute Reference
Chapter 5
Autotest
The Autotest command, from the Load pull-down menu, provides a quick technical check of the CDT370 board functionality . When you select this function,
the debugger loads the Autotest and a TMS370C756 memory map required
to perform the test. When started, the Autotest software displays the message:
AUTOTEST IN PROGRESS.
At the end of the Autotest (a few seconds), the completion message is displayed as:
AUTOTEST SUCCESSFUL or AUTOTEST FAILED.
and the original memory map is restored. The autotest program can be run
from the command line of the Command window or in a batch file.
The Autotest software must be run with
No connection to a target system and
No device in the easy extract socket of the target cable.
The Autotest software is not exhaustive.
See Chapter 9,
fails.
Note: Autotest Restores the Memory Map, but not Memory
Running the Autotest command erases the symbol table and the CDT370
memory contents.
Repair Guide,
for information about what to do if the Autotest
Autotest
5-1
Page 52

5-2
Page 53

Running Title—Attribute Reference
Chapter 6
Clock Source
Y ou can select an alternate clock setting through the Configuration dialog box
in the Load menu. Please refer to
C Source Debugger User’s Guide
CDT370.
The choices are:
-
OSCILLATOR: If you select OSCILLATOR from the menu, the debugger
will reset the TMS370 device with Osc 2 as the clock. If there is not a
usable clock signal at Osc 2, the device will use Osc 1. The CDT370 20
MHz oscillator (location Osc 1) is used to generate the default clock. Y ou
can also plug in another oscillator at Osc 2, to work at any allowed frequency. Osc 2 is the highest priority device.
Setting Up The Clock
. The crystal option is not available on the
in the
TMS370 Family
-
TARGET: If you select T ARGET , the CPU expects the clock input from the
target system. A clock buffer circuitry is found in the target cable head, so
the external clock can be a crystal.
As a result, the target clock source can be:
1) A crystal connected between low and high input lead on the target connector (the crystal driver of the target connector will generate the clock for the
CDT370 board).
2) An oscillator driving low input lead on the target connector.
If you change the clock source, the debugger tries to reset the TMS370 device
with the new clock source. If the emulator detects that the device is not operating properly , it rejects the new clock source and resets the chip again, restoring
the old clock.
When this occurs, an error message is displayed:
source
not available for clock
source
is the clock source you tried to select.
Chapter Title—Attribute Reference
6-1
Page 54

6-2
Page 55

Running Title—Attribute Reference
Chapter 7
Defining a Memory Map
Before you begin using the debugger, you must supply the debugger with a
memory map. The memory map tells the debugger which areas of memory it
can access and how those areas are accessed.
Topic Page
7.1 Memory Mapping Introduction 7-2
7.2 Memory Mapping 7-3
7.3 Copying Data Within the On-Board RAM 7-6
Chapter Title—Attribute Reference
7-1
Page 56

Memory Mapping Introduction
7.1 Memory Mapping Introduction
The memory mapping capability of the TMS370 debugger allows you to specify exactly how the CPU is allowed to access various memory ranges. The
TMS370 device provides significant flexibility in the memory map, with its various configurations of internal memory and external addressing capability. In
addition, the emulator has 64K bytes of high-speed emulation RAM, which can
be used to functionally emulate target system memory . The debugger memory
mapping system allows you to take advantage of the hardware’s flexibility.
Specifying the memory map is accomplished by dividing the 64K address
space into ranges. Each range starts and ends on a 16-byte boundary and has
a type that determines how addresses in the range are accessed. The type
determines:
-
what class of memory the range falls into, such as RAM, program ROM,
EEPROM, etc... (the type for a given range is determined by the architecture of the particular TMS370 device being emulated),
-
whether the memory is to be accessed internally on the chip, from external
target memory, or from emulator RAM, and
-
the protection that allows you to prevent the CPU from reading and/or writing to the given address range.
Please refer to
bugger User’s Guide
Defining a Memory Map
for more information.
in the
TMS370 Family C source De-
Any address that is not covered by a specified range in the debugger memory
map is considered to be “unconfigured”. All unconfigured memory is protected
against both read and write operations so that if the CPU tries to access an
unconfigured location, an access violation occurs, and the CPU halts.
7-2
Page 57

7.2 Memory Mapping
The emulator board contains 64K bytes of RAM reserved for emulation.
Memory references from the TMS370 can be satisfied in one of three ways:
-
-
-
The 64K-byte address range of the microcontroller is divided into 16-byte
areas called frames. The memory mapping scheme of the debugger and emulator allows you to specify , for each 16-byte frame of the address space, where
memory references to that frame are to be satisfied. References to the register
file (addresses 000h to 0FFh) are always satisfied internally. Sixteen-byte
frames in the peripheral register file (addresses 1000h to 10FFh) can be
mapped either internally or to an optional user-supplied peripheral expansion
board on the emulator.
In addition to mapping various parts of the address space to different parts of
the physical memory , you can protect areas of memory from certain types of
access. Protection can be on read cycles, write cycles, both, or none. If the
CPU tries to execute a memory cycle on an address that is protected for that
cycle, a trap occurs, and the CPU is halted. Thus, you can use memory as
ROM by write protecting it, and you can treat it as nonexistent by both read and
write protecting it. Any memory that you don’t explicitly map is fully protected
in this way so that any attempt to access an address outside configured
memory causes a trap and halts the CPU.
Memory Mapping
Internally from the TMS370 device,
Externally from target system memory, or
Externally from emulator RAM.
The CDT370 emulates ROM by write-protecting the ROM area of emulator
memory.
The CDT370 emulates data EEPROM with on-board hardware that allows the
use of every feature of the data EEPROM module:
-
Control frame access
-
Write-protect registers
-
Write-protect override
-
Write ones, write zeros
-
Array programming
-
Programming time of 10 ms (20 ms for array programming)
Y ou access emulated data EEPROM on the CDT370 in the same way as you
would access EEPROM on a TMS370 chip.
For more information, refer to
Data Manual
.
Data EEPROM Modules
Defining a Memory Map
in the
TMS370 Family
7-3
Page 58

Memory Mapping
Register File Memory
Description Locations are part of the TMS370 on-chip register file.
Mapping Attributes It should be mapped as IRAM for location 0x00 to 0x7F
or 0xFF, depending on the device to emulate.
Peripheral Frame Memory
Description This type is used for 16-byte ranges in the peripheral register file.
Program ROM/EPROM Memory
Description This memory type is used for addresses that fall in the range of
the on-chip mask ROM. Program ROM and program EPROM are emulated
using the high-speed RAM in the emulator.
Mapping Attributes Program ROM should be mapped as emulator ROM,
and program EPROM should always be mapped as PEPROM. This means
that whenever internal memory is enabled on the device, memory accesses
in this range are satisfied by the emulator (just as if the memory were actually
on the chip).
You must not define any EPROM control frame (EPCTL) when you define
PEPROM. You can define only one PEPROM.
Protection Attributes Program ROM is, by default, write protected. Write
cycles to addresses in a range of this type cause an access violation trap to
occur. W rites to external target memory cause a trap, but the write operation
cannot be prevented.
Note: Unsupported EPROMS
Data EPROM (DEPROM) and Custom EPROM (CEPROM) are not supported.
Data EEPROM Memory
Description The data EEPROM type is used for addresses that fall in the
range of the chip data EEPROM. Some devices have no memory of this type
in the memory map. Data EEPROM is emulated using the RAM in the emulator
and a special interface logic that allows you to use all the data EEPROM module features found in any TMS370 devices:
-
-
-
-
-
Control frame access
Write protection registers
Write protect override mode
Array programming
Minimum programming time criteria
7-4
Page 59

Memory Mapping
When a programming operation is started, it must be finished; the EXE bit must
be reset at least 10 or 20 ms (depending on the operation) after its rising edge.
Otherwise, the CPU is halted and an the following error message is displayed:
EEPROM VIOL
Since the data EEPROM memory is emulated through a simple RAM, all written data are retained as long as the CDT370 is powered; they are lost when
it is switched-off.
In all other respects, the CDT370 behaves exactly as if you were programming
actual data EEPROM with a TMS370 device. Refer to
EEPROM
in the
TMS370 Family Data Manual
for complete instructions.
Programming the Data
Mapping Attributes Data EEPROM memory must always be mapped as
DEEPROM; you can define only one DEEPROM. You must not define any
EPROM control frame (EPCTL) when you define a DEEPROM. An EPCTL is
automatically created (address 0x1010, length 0x10); any frame that may
have existed at this address must be deleted first. The EPCTL is automatically
deleted when the DEEPROM is deleted.
Note: Unsupported EEPROMS
Program EEPROM (PEEPROM) and Custom EEPROM (CEEPROM) are
not supported.
Defining a Memory Map
7-5
Page 60

Copying Data Within the On-Board RAM
7.3 Copying Data Within the On-Board RAM
You can use the MEMCOPY command to copy data from one location in the
on-board RAM to another. The syntax for the command is:
memcopy
-
The
source, destination, length
source
parameter identifies the starting address of the range that you
want to copy . This parameter can be an absolute address, a C expression,
the name of a C function, or an assembly language label.
-
destination
The
parameter identifies the location in RAM where you want
the data to go. This parameter can be an absolute address, a C expression, the name of a C function, or an assembly language label.
length
-
The
parameter defines the length of the range. This parameter can
be any C expression.
If you select Memcopy from the Memory menu, or if you enter MEMCOPY without any parameters, the debugger displays a dialog box for you to enter the
source, destination, and length.
7-6
Page 61

Running Title—Attribute Reference
Chapter 8
Target Cables
T arget cables allow you to emulate and program TMS370 devices. This chapter describes the target cables and their installation.
The following sections are included:
Topic Page
8.1 T arget Cables Description 8-2
8.2 Switches Description 8-4
8.3 Installing the T arget Cable in the Emulator 8-5
8.4 Connecting the T arget Cable to the Target System 8-7
8.5 How to Use the Target Cable 8-8
Chapter Title—Attribute Reference
8-1
Page 62

Target Cables Description
8.1 Target Cables Description
All the CDT370 target cables are built in the same way and allow you to emulate any of the TMS370 devices or program any TMS370 Field Programmable
Device.
Figure 8–1.PLCC Target Cable Termination
emulation / programming switches
easy extract socket
emulation pod
These items are at the end of a target cable:
-
an emulation pod (for real time in-circuit emulation)
-
a crystal driver HC4061 (allowing the use of a target crystal)
-
an easy to extract socket (for field programmable device programming)
-
a set of three switches (emulation/programming selection)
Depending on the type of device to emulate (or to program), 3, 4 or 5 flat ribbon
cables are found. They are used to connect the target cable to the CDT370
board. They are terminated by 34-pin 2-row female connectors.
Five different emulation pods may be found, one for each package of the
TMS370 microcontrollers family supported by the CDT370.
Table 8.1 shows the target cables available for the CDT370.
8-2
Page 63

Table 8–1. Available Target Cables
Reference Emulated Device
EDSTRG28DIL 28-pin DIL
EDSTRG28PLCC 28-pin PLCC
EDSTRG2XDIL 40-pin DIL (x2x)
EDSTRG2XPLCC 44-pin PLCC (x2x)
EDSTRG40DIL 40-pin DIL (x4x)
EDSTRG44PLCC 44-pin PLCC (x4x)
EDSTRG68PLCC
Target Cables Description
68-pin PLCC
Target Cables
8-3
Page 64

Switches Description
8.2 Switches Description
Figure 8–2 shows the position of the target cable switches for both the emulation and the programming configuration.
Figure 8–2.Switch Positions
S1
S2
In-Circuit Emulation
S3
S1
S2
Device Programming
S3
Table 8–2 shows the signals that are controlled by these three switches.
Table 8–2.Switch Signals
Switch EMUL position PROG position
S1 VCC disable on socket VCC enable on socket
S2 VPP disable on socket VPP enable on socket
S3
8-4
HC4061 enable HC4061 disable
Page 65

8.3 Installing the Target Cable in the Emulator
To install a target cable in the emulator or change from one cable to another
one, you must remove the CDT370 board from the PC when it is connected
in add-on PC mode.
Installing the Target Cable in the Emulator
Follow the CDT370 board installation procedure detailed in Chapter 2,
Started
.
1) Carefully remove the currently installed target cable by grasping the connectors of the target cable and pulling them gently upward while holding
the CDT370 emulator board down on the table. Do not grasp, pull, or twist
the cable at any time.
2) Align the connectors of the new target cable with the CDT370 board according to Figure 8–3. Move the target cable slightly from side to side until
all the pins have slipped into the connectors.
3) Gently push the target cable down onto the emulator card until the cable
is firmly attached. Check that no pins are bent.
Figure 8–3.Connecting the Target Cable to the CDT370 Board
Getting
On the CDT370 Board, there are five 2-row headers referenced CONN0 to
CONN4. Table 8–3 describes the connection of each target cable.
CONN0
CONN4
Target Cables
8-5
Page 66

Installing the Target Cable in the Emulator
Table 8–3.Connections for CDT370/Target Cables
Target Cable # of Connectors CONN0 CONN1 CONN2 CONN3 CONN4
EDSTRG28DIL 3
EDSTRG28PLCC 3
EDSTRG40DIL 4
EDSTRG44PLCC 4
EDSTRG2XDIL 5
EDSTRG2XPLCC 5
EDSTRG68 PLCC 5
✖ ✖ ✖
✖ ✖ ✖
✖ ✖ ✖ ✖
✖ ✖ ✖ ✖
✖ ✖ ✖ ✖ ✖
✖ ✖ ✖ ✖ ✖
✖ ✖ ✖ ✖ ✖
8-6
Page 67

Connecting the Target Cable to the Target System
8.4 Connecting the Target Cable to the Target System
Handle the target connector with extreme care at all times because it can be
easily damaged.
When removing a PLCC from its socket, use a sharp instrument to pry the assembly from its target; do not pull it out by the attached cable.
Protect against electrostatic discharge into the target connector, especially in
extremely dry air conditions. An electrostatic discharge would damage the internal circuits of the CDT370 board.
Check the Target Cable Before Installing
When installing the target connector into the target system, make
sure that the lead orientation is correct.
Make sure that no device is plugged into the easy extract socket
A ground connection is made between the CDT370 and the target system
through the V
get connector into the target system in place of the microprocessor. The target
system can be any circuit that incorporates one or several processors. The target connector pinout for the TMS370 microprocessor and the signal characteristics are provided in the specification of the appropriate TMS370 family device.
pin of the emulation pod. For normal applications, plug the tar-
SS
Target Cables
8-7
Page 68

How to Use the Target Cable
8.5 How to Use the Target Cable
-
Emulation mode
When you use the CDT370 as a real time in-circuit emulator, all three
switches (S1,S2,S3) must be in the EMUL position.
-
Programming mode
In this mode, the CDT power must be on and the board must be under the
control of the debugger software. For example, you have finished an emulation session and you want to program some TMS370 Field Programmable Microcontroller samples. Follow this procedure:
1) Make sure all switches are in the EMUL position.
2) Carefully insert the device you wish to program into the easy extract
socket.
3) Set all the switches to the PROG position.
4) Run the programming command.
5) When the command has executed, move all the switches back to the
EMUL position.
6) Remove the device from the easy extract socket.
Note:
You can execute steps 2 and 3 either before entering the programming
screen or when the programming screen is already displayed, but you must
complete both steps before starting a command (Program, Verify, Upload
or Blank check).
Do Not Use Program Mode While Connected to the T arget System
When using target cables in programming mode, disconnect the
emulation pod from the target system. You may damage your
system if you do not.
8-8
Page 69

How to Use the Target Cable
If you need to program many devices:
1) Configure all switches in the EMUL position.
2) Extract the programmed device from the easy extract socket and insert a
new device.
3) Set all the switches to the PROG position.
4) Run the programming command.
5) When finished, go back to step 1.
Target Cables
8-9
Page 70

8-10
Page 71

Running Title—Attribute Reference
Chapter 9
CDT370 Repair Guide
This chapter contains a brief system repair guide for both the add-on PC connection and the serial link.
The following topics are included in this chapter.
Topic Page
9.1 The Debugger Menu Doesn’t Display 9-2
9.2 The CDT370 Does Not Function 9-4
9.3 The T arget System Doesn’t Respond 9-5
Chapter Title—Attribute Reference
9-1
Page 72

The Debugger Menu Doesn’t Display
9.1 The Debugger Menu Doesn’t Display
If the CDT370 board is connected inside the PC, refer to this page. If the
CDT370 board is connected through an RS-232 link, refer to page 9-3.
Add-on PC connection
1) If the screen displays nothing, follow normal troubleshooting procedures
and/or local repair procedures for the computer.
2) If the screen displays an error message when you invoke the debugger,
push the CDT370 reset button and try again.
3) Be sure there is no chip in the easy extract socket of the target connector.
4) If you are using a target system, disconnect the target connector from the
target system and try again. If it works with the target connector disconnected, see Section 9.3.
5) If the problem remains, be sure you invoke the proper communication port
and interrupt request line. Be sure also that the I/O address/IRQ used by
the CDT is not used by another card inside the PC.
6) Switch off your PC, remove the cover, and check that the CDT370’s configuration jumpers are correctly set and all components are firmly plugged
in their respective sockets.
7) If the CDT370 board seems to be well configured and you are using a target system, disconnect the target connector from the CDT 370 board and
try again. If the CDT370 works, the problem is linked to the target connector itself; see Section 9.3.
8) If all is OK and the debugger menu doesn’t display, please contact your
local Texas Instruments Distributor.
9-2
Page 73

RS-232 serial link
The Debugger Menu Doesn’t Display
1) If the screen displays nothing, follow normal troubleshooting procedures
and/or local repair procedures for the computer.
2) If the screen displays an error message when you invoke the debugger,
push the CDT370 reset button and try again.
3) Verify that the CDT370 board is powered up and that the external power
supply matches CDT370 board requirements (5 V, 3 A).
4) Verify that the connections from the RS-232 cable between the PC and
CDT370 board are correct and tight.
5) Check that the CDT370’s configuration jumpers are properly set.
6) Verify that all components are firmly plugged into their respective sockets.
7) Ensure that there are no metal objects beneath the CDT370 board that
might short V
, ground, or other signals.
CC
8) Be sure there is no chip in the easy extract socket of the target connector.
9) If you are using a target system, disconnect the target connector from the
target system and try again. If it works with the target connector disconnected, see Section 9.3,
Target System Doesn’t Respond
.
10) If the CDT370 board seems to be well configured and you are using a target system, disconnect the target connector from the CDT 370 board and
try again. If the CDT370 works, the problem is linked to the target connector itself; see Section 9.3.
11) Disconnect the RS-232 cable and check its wiring against Table 2–2 on
page 2-8.
12) If the problem remains, be sure you invoke the proper serial communication port.
13) If all is OK and the debugger screen doesn’t display, contact your local T exas Instruments Distributor.
CDT370 Repair Guide
9-3
Page 74

The CDT370 Does Not Function
9.2 The CDT370 Does Not Function
If the debugger screen displays but the CDT370 does not function, you can run
the Autotest Software by typing the A (Autotest) Command in the Load menu.
This Autotest Software must be run with no link to a target system
(T arget Connectors must be disconnected from the target system)
and no chip resident in the easy extract socket.
This Autotest software is a “go-no-go” software that tells you if the CDT370
board is definitively functional or not. This autotest is not exhaustive but checks
almost all board functionalities, including EEPROM emulation logic. See
Chapter 5,
If the debugger screen displays but the Autotest software fails each time, contact your local Texas Instruments Distributor.
Autotest
.
9-4
Page 75

9.3 The Target System Doesn’t Respond
If the PC and CDT370 board work but the target system doesn’t respond, or
if a problem linked to the target connector causes the emulator to hang, follow
this procedure:
1) Check the target system power (must be on when you invoke the debugger).
2) If OK, power off the target system, remove the target connector from target
system, and check for broken or bent pins.
3) If the problem remains, power off the target system and the CDT370. If an
add-on PC connection is used, power off the PC and remove the cover.
Then check that the target system cable is properly connected to the
CDT370 board. Refer to the Chapter 8.
4) Check that there is no short circuit or broken wire on the target connector.
5) Check the application hardware (look for short-circuit and supply problems).
The Target System Doesn’t Respond
6) If the problem remains, contact your local Texas Instruments Distributor.
CDT370 Repair Guide
9-5
Page 76

9-6
Page 77

Running Title—Attribute Reference
Additional Notes
Like the other debugging tools available to the 370 family , the CDT370 debugger defines a symbol that you can use in batch files (See
in the
From a Batch File
Table 10–1.Predefined Constants for Use With Conditional Commands
Constant Debugger Tool
$$XDS22$$ XDS/22 emulator
$$ABD$$ application board
$$CDT370$$
TMS370 Family Debugger User’s Guide
CDT370 emulator
Chapter 10
Entering Commands
).
Chapter Title—Attribute Reference
10-1
Page 78

10-2
Page 79

$$ABD$$ constant, 10-1
$$CDT370$$ constant, 10-1
$$XDS22$$ constant, 10-1
A
–a debugger option, 2-18, 2-19
action selection, 4-3
add-on address, 2-5
identifying with the –a debugger option, 2-19
add-on connection, 2-5
addresses, 3-2
COM port, 2-5, 2-19
for windows, 2-16
displayed in trace samples, 3-3
application board
$$ABD$$ constant, 10-1
$$CDT370$$ constant, 10-1
autoexec.bat file, 2-9
example, 2-10
invoking, 2-10
autotest, 5-1–5-2
B
–b debugger option, 2-18
benchmarking, 3-4
blank check, 4-3
Index
Index
installing, 2-4–2-18
serial connection, 2-7
cdt370 command
options, 2-18
–a, 2-19
–b, 2-18
–i, 2-19
–p, 2-19
–profile, 2-20
–s, 2-20
–t, 2-20
–v , 2-20
–x, 2-20
parameters, 2-18
CLK register, 3-4
clock
from target CPU, 6-1
source, 6-1–6-2
closing, debugger, 2-21
code benchmarking, 3-4
COM port
configuring for Windows, 2-15
jumper, 2-5
CONF jumper, 2-5
position for RS–232, 2-7
config.sys file, 2-9
configuration switches, 2-5
COM port, 2-5
COM1—COM4, 2-5
CONF, 2-5
RS–232—Add-On, 2-5
C
CDT370 board
about, 1-2
connecting to a PC add-on slot, 2-5
connecting to an RS–232 cable, 2-7
D
D_DIR environment variable, 2-1 1
D_OPTIONS environment variable, 2-1 1, 2-18
ignoring with the –x debugger option, 2-20
D_SRC environment variable, 2-1 1
Index-1
Page 80

Index
data EEPROM memory , 7-4
emulation of, 7-4
DB–25, pinouts, 2-8
DB–9, pinouts, 2-8
debugger
exiting, 2-21
invoking, 2-18
from Windows, 2-16
options
–b option, 2-18
–i option, 2-19
summary table, 2-18
device programming, 4-2
E
EEPROM
data, 7-4
emulation of, 7-4
programming, 4-4
emulator, $$XDS22$$ constant, 10-1
environment variables, 2-1 1
D_DIR, 2-11
D_OPTIONS, 2-11, 2-18
D_SRC, 2-11
for debugger options, 2-18
EPROM
program memory , 7-4
programming, 4-4
error messages, installation, 2-14
exiting the debugger, 2-21
H
halting
debugger, 2-21
program execution, 2-21
hardware requirements, 2-2
I
–i debugger option, 2-18, 2-19
init.cmd, 2-20
initialization file, 2-20
installation
error messages, 2-14
of hardware, 2-4–2-9
of software, 2-9–2-14
verifying, 2-12
M
memory , 7-1–7-6
data EEPROM, 7-4
emulation of, 7-4
mapping, 7-3–7-5
introduction, 7-2
peripheral frame, 7-4
program ROM/EPROM, 7-4
register file, 7-4
type selection, 4-4
Microsoft Windows
configuring the COM port for, 2-15
examples, 2-16–2-22
invoking the debugger from, 2-16–2-22
using the debugger with, 2-15–2-22
modify address, 4-2
O
osc 1, 6-1
osc 2, 6-1
oscillators, 6-1
P
–p debugger option, 2-18, 2-19
parameters
cdt370 command, 2-18
xds370w command, 2-18
path, for CDT executables, 2-1 1
peripheral frame memory , 7-4
power-up procedure, 2-17
–profile debugger option, 2-18, 2-20
profiling environment, 2-20
program, 4-3
execution, halting, 2-21
program ROM/EPROM memory , 7-4
programming devices, 4-1–4-6
messages, 4-6
the P command, 4-2
Index-2
Page 81

Index
Q
QUIT command, 2-21
R
register file memory , 7-4
repairs, 9-1–9-6
ROM, program memory , 7-4
RS–232 cabling, 2-8
RUN command, and CLK register, 3-4
RUNB command, and CLK register, 3-4
S
–s debugger option, 2-18, 2-20
samples. See trace samples
screen size, 2-18
select action, 4-3
selected action, 4-4
serial connection, 2-7
serial port, identifying with the –p debugger option,
2-19
software installation, 2-9–2-14
software requirements, 2-3
symbol table
during autotest, 5-1
loading with the –s debugger option, 2-20
loading without (the –v debugger option), 2-20
system
hardware requirements, 2-2
software requirements, 2-3
T
installation
CDT370 board, 8-5
target system, 8-7
switches, 8-4
timer, value, 3-3
timing commands, 3-1–3-8
trace, 3-1–3-8
buffer, 3-2
CDT370 differs from XDS/22 BTT, 3-7
commands, 3-5
inspect, 3-5
position, 3-5
save, 3-6
samples, 3-2
capture, 3-2
timer value, 3-3
U
upload, 4-3
V
–v debugger option, 2-18, 2-20
validation, 4-5
verify, 4-3
verifying installation, 2-12
W
Windows
configuring the COM port for, 2-15
examples, 2-16
invoking the debugger from, 2-16
using the debugger with, 2-15
–t debugger option, 2-18, 2-20
target cables, 1-3, 8-1–8-10
description, 8-2
how to use, 8-8
X
–x debugger option, 2-18, 2-20
xds370w command, options, 2-18
Index-3
Page 82

Index-4
Page 83

IMPORTANT NOTICE
T exas Instruments (TI) reserves the right to make changes to its products or to discontinue any semiconductor
product or service without notice, and advises its customers to obtain the latest version of relevant information
to verify, before placing orders, that the information being relied on is current.
TI warrants performance of its semiconductor products and related software to the specifications applicable at
the time of sale in accordance with TI’s standard warranty. Testing and other quality control techniques are
utilized to the extent TI deems necessary to support this warranty. Specific testing of all parameters of each
device is not necessarily performed, except those mandated by government requirements.
Certain applications using semiconductor products may involve potential risks of death, personal injury, or
severe property or environmental damage (“Critical Applications”).
TI SEMICONDUCTOR PRODUCTS ARE NOT DESIGNED, INTENDED, AUTHORIZED, OR WARRANTED
TO BE SUITABLE FOR USE IN LIFE-SUPPORT APPLICATIONS, DEVICES OR SYSTEMS OR OTHER
CRITICAL APPLICATIONS.
Inclusion of TI products in such applications is understood to be fully at the risk of the customer. Use of TI
products in such applications requires the written approval of an appropriate TI officer . Questions concerning
potential risk applications should be directed to TI through a local SC sales office.
In order to minimize risks associated with the customer’s applications, adequate design and operating
safeguards should be provided by the customer to minimize inherent or procedural hazards.
TI assumes no liability for applications assistance, customer product design, software performance, or
infringement of patents or services described herein. Nor does TI warrant or represent that any license, either
express or implied, is granted under any patent right, copyright, mask work right, or other intellectual property
right of TI covering or relating to any combination, machine, or process in which such semiconductor products
or services might be or are used.
Copyright 1996, Texas Instruments Incorporated
 Loading...