

Page 1
OPE RATIN G
MAN UAL
Page 2

Introduction
Dear valued customer,
Thank you for purchasing a Tenma instrument. To use your new product correctly, make sure you read this User Manual
carefully and completely before operation and pay particular attention to the “Safety Instructions” section.
Please keep this User Manual in a safe place after reading it carefully. For easy reference during future operation, we
recommend putting it alongside your Tenma product or in an easily accessible place.
Page 3
Copyright Information
● Tenma . All rights reserved.
● products are protected by patents granted and pending in the People's Republic of China and other countries.
● The Company reserves the right to change product specifications and prices.
all rights reserved. All licensed software products are properties of Tenma its subsidiaries or
suppliers. They are protected by the national copyright law and international conventions.
Information contained in this manual supercedes all information in previously published versions.
is the registered trademark of Farnell.
DSO Series User Ma nual
1
Page 4

If this product is sold or assigned by the original purchaser to a third is to be delivered to an address within the country where the
party within three years of purchase, the new owner should note maintenance centre operates, Tenma shall pay the cost of returning the
that warranty is available for a period of three years from the day product to the
the original purchaser acquired the product from Tenma or an
destination, all freight, custom duty, tax and other costs will be paid by
authorized dealer. The probe, other accessories and fuses are not
the customer.
covered by warranty.
This warranty does not apply to any defect, malfunction or damage
If any genuine defect is found during the valid warranty period, Tenma
caused by accident, normal wear and tear of mechanical parts, any
has the option to repair the defective product without any charge for
form of application other than the stated ones, improper use, improper
parts or labor, or replace it with another product (at the discretion of
maintenance or poor maintenance. Under the warranty terms and
Tenma). Tenma may use parts, modules and replacement products that
conditions, Tenma has no obligation to provide the following services :
are brand new or repaired to a good-as-new standard. All old parts,
modules and products that are removed during replacement become
a) Repairing any damage arising from installation, repair or
properties of Tenma.
maintenance carried out by a non Tenma service representative;
b) Repairing any damage arising from improper use or connection
In this User Manual, “ customer” means an individual or entity
to incompatible equipment;
vested with the rights hereunder. To enjoy the warranty service,
the “customer” must report any defect to Tenma during the valid
c) Repairing any damage or malfunction arising from using a power
warranty period and make appropriate arrangement to allow
source not provided by Tenma;
servicing. The customer should pack the defective product in a
d) Servicing a product that has been modified or integrated with other
container and deliver it to a maintenance centre specified by Tenma.
products (such modification or integration makes repair more
The customer should also prepay all freight cost and provide a copy of
time consuming and difficult).
the original sales receipt issued to the original purchaser. If the product
DSO Series User Ma nual
2
Page 5

To avoid fire and personal injury :
supercedes all other p re vi ou s warranties, whether e xp re ss or
implied. Tenma and its dealers wil l not make any im pl ie d
Use a correct power cable : Use only the specified power cable which
guarantee on t he salability or suitability of this product for any specific
is authorized in the country of use.
purpose. In the event of breach of warranty terms and conditions, repair
Remove the plug correctly : Do not remove the probe or testing cable
or replacement of the defective product shall be the only remedial
when they are connected to power.
measure offered by Tenma. Notwithstanding any prior notification of
Ensure good grounding : This unit is grounded by the ground wire of
potential damage that is indirect, special, consequential or inevitable,
the power cable. To avoid electric shock, the grounding conductor must
Tenma and its dealers shall bear no liability for any such damage.
touch the ground. Before connecting the input or output terminal,
ensure the unit is properly grounded.
Safety Instructions
Connect the probe of the digital storage oscilloscope : The probe
This unit is designed and manufactured strictly in accordance with
ground cable is the same as ground potential. Do not connect the
GB4793 safety requirements for electronic testing meters and
ground cable to non ground voltage or high voltage.
IEC61010-1 safety standards. It fully meets CAT II 600V insulation and
Check the rated values of all terminals : To prevent fire and
overvoltage requirements and Grade II anti-pollution safety standards.
excessive current shock, please check all rated values and label data.
To prevent personal injuries and damage of this unit or any other
Read the manual carefully and check the rated values before
devices connected to it, please take note of the following safety
connecting the unit.
precautions. To avoid potential hazards, use this unit strictly as
instructed by this User Manual.
Do not operate the unit with the chassis cover open : Do not operate
this unit when the outer cover or front panel is open.
Maintenance should only be carried out by a trained professional.
This w ar ra nt y is ma de available to this p ro du ct specifically and
DSO Series User Ma nual
3
Page 6
Use suitable fuses : Only use specified fuse types and rated
Messages on the product : The following messages may appear
specifications.
on the product :
Avoid exposing circuitry : When power is on, never make contact with
“Danger” means potential damage that is immediate.
exposed adaptor or components.
“Warning” means potential damage that is not immediate.
When fault is suspected, stop operation : If you suspect a fault, ask a
“ Caution” means possible damage to this product or other
qualified maintenance professional to carry out inspection.
properties.
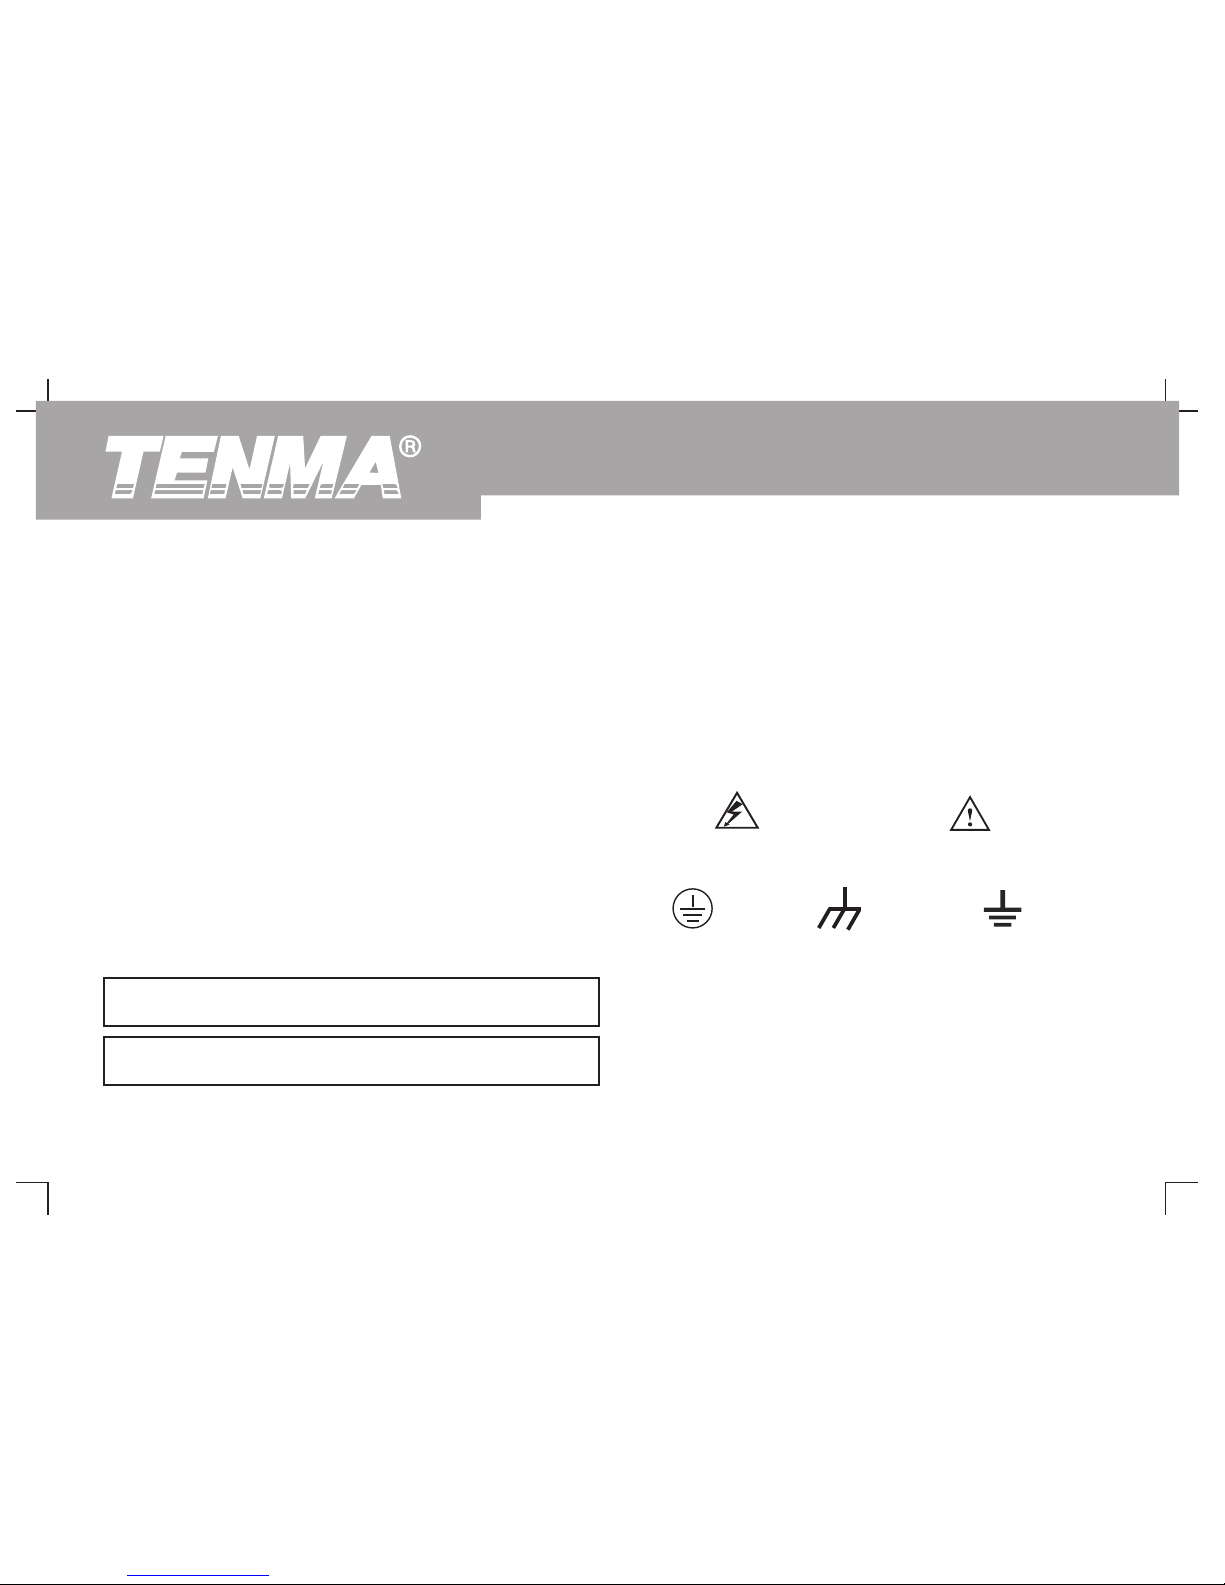
Icons on the product : The following icons may appear on the
Maintain good ventilation.
product :
Do not operate in humid conditions.
Do not operate in combustible and explosive conditions.
High voltage Caution! Refer to manual
Keep the product surface clean and dry.
Safety Messages and Symbols
Safety terminology used in this manual. The following messages may
Protective Ground terminal Ground terminal
appear in this manual :
ground terminal for chassis for testing
Warning : Warning statements identify conditions or practices that
could result in injury or loss of life.
Caution : Caution statements identify conditions or practices that
could result in damage to this unit or other properties
DSO Series User Ma nual
4
Page 7

Preface
DSO oscilloscopes offer user-friendliness, outstanding technical
indicators and a host of advanced features. They are your perfect tools
This manual provides information on the operation of the DSO digital
to complete testing tasks swiftly and efficiently.
storage oscilloscopes series. Guidance is given in several chapters
as follows :
This manual is a user guide for two models of the digital storage
oscilloscope series :
Chapter 1 User Guide : Simple guide to oscilloscope functions
and installation.
Model Bandwidth Real-time Sampling Rate Display
Chapter 2 Instrument Setups : Guide to operation of the DSO
72-8705 50MHz
digital storage oscilloscope series.
72-8710 10 0M Hz
Chapter 3 Practical Example Illustrations : Example illustrations
are provided to solve various testing problems.
Chapter 4 System Prompts and Trouble-shooting :
Chapter 5 Servicing and Support :
Chapter 6 Appendixes :
Appendix A : Technical Indicators
Appendix B : Accessories for DSO Series Digital Storage
Oscilloscopes
Appendix C : Maintenance and Cleaning
Appendix D: Chinese and English Cross Reference Table for the
Front Panel
The DSO Digital Storage Oscilloscopes Series
1GS/s Color
DSO Series User Ma nual
5
Page 8
DSO Oscilloscopes offer a user-friendly front panel with clear Dual analog channels; width range : mV/div ~ 20V/div
indications to allow access to all basic functions for easy operation.
High definition color LCD system, 400 x 240 resolution
The scaling and position buttons for all channels are optimally
Supports plug-and-play USB storage device. Communication
arranged for intuitive operation. As design is based on the familiar
with and remote control of computer through the USB device
practices of traditional instruments, users can use the new units
Automatic waveform and status configuration
without spending considerable time in learning and familiarizing
Storage of waveforms, setups and interfaces; waveforms and
with operation. For faster adjustment to ease testing, there is a [AUTO]
setups reproduction
key to instantly display the appropriate waveform and range position.
Fine window extension; precise analysis of waveform details and
Apart from being extremely user-friendly, DSO Oscilloscope have the
overview
high performance indicators and superb functions required for
Automatic measurement of 28 waveform parameters
speedy execution of measurement tasks. Thanks to 1GS/s real-time
Automatic cursor tracing measurement function
sampling and 25GS/s equivalent sampling, you can observe higher
Unique waveform recording and replay function
speed signals with your DSO Oscilloscope. The strong trigger and
Built-in FFT
analytical functions make it easy to acquire and analyse waveforms,
Multiple waveform mathematics functions (including add,
while the sharp and clear LCD and mathematics functions ensure
subtract, multiply and divide)
clear observation and reliable analysis of signal conditions.
Edge, pulse width and alternate trigger functions
Multilingual menu displays
Help messages in English and Chinese
The performance features listed below will explain why the DSO series
can fully satisfy your testing and measurement requirements:
1
DSO Series User Ma nual
6
Page 9

DSO accessories :
2 x 1.2m, : / : probe. For details refer to the probe
instructions. These accessories conform with
EN 1 01 0-0 1 :20 08 standards
Power line conforming to international standards applicable in
the country of use
User Manual
USB connecting cable :
UT-D05 (two-terminal USB/HOST plug)
DSO oscilloscope communication control software (USB-
device)
1 1 10 1
6 3
DSO Series User Ma nual
7
Page 10

Table of Contents
Item Page
Safety Instructions
Preface
Chapter 1 User Guide-------- --------- --------- --------- -- --------- --------- --------- --------- ------
General Inspection-- -- --------- --------- --------- --------- --------- -- --------- --------- -
Functional Check-- -- --------- --------- --------- --------- --------- -- --------- --------- ---
Probe Compensation-- --------- -- --------- --------- --------- --------- -- --------- --------
Automatic Setup for Waveform Display----- --------- --------- --------- -- --------- ------
Getting to Know the Vertical System------ --------- --------- -- --------- --------- --------
Getting to Know the Horizontal System------- -- --------- --------- --------- --------- -- --
Getting to Know the Trigger System------ --------- --------- -- --------- --------- --------
Chapter 2 Instrument Setups-------- --------- --------- --------- -- --------- --------- --------- -------
Setting the Vertical System-------- --------- --------- -- --------- --------- --------- -------
Setting the Horizontal System----------- --------- --------- --------- --------- -- --------- -
Setting the Trigger System-------- --------- --------- -- --------- --------- --------- -------
Alternate Trigger-- --------- --------- --------- -- --------- --------- --------- --------- -- ----
Setting the Sampling System---- --------- --------- --------- --------- -- --------- -------
Sett in g the Displ ay S ystem---- --------- --------- --------- -- --------- --------- -------
11
15
15
18
18
19
20
22
24
25
33
37
41
45
47
DSO Series User Ma nual
8
Page 11

Item Page
Storage and Recall --- --------- --------- --------- -- --------- --------- --------- --------- --
Utility Function Setup-- --------- --------- --------- -- --------- --------- --------- --------- -
Au to matic Measu rement--- --------- --------- --------- -- --------- --------- --------- --
Cursor Measurement -- --------- --------- --------- -- --------- --------- --------- ---------
Using the Run Button--------- -- --------- --------- --------- --------- -- --------- --------- -
Chapter 3 Practical Example Illustrations------ --------- -- --------- --------- --------- --------- -----
Illustration 1 : Measuring simple signals------- -- --------- --------- --------- --------- ---
Illustration 2 : Observing the delay and time-lapse caused by a
sine wave signal passes through the circuit ---------------------------------------------------
Illustration 3 : Acquiring single signals------ --------- --------- --------- -- --------- ------
Illustration 4 : Reducing random noise of signals----- --------- -- --------- --------- -----
Illustration 5 : Using the cursors for measurement----- -- --------- --------- --------- ---
Illustration 6 : Using the X-Y function-- --------- --------- --------- --------- ----------- ---
Illustration 7 : Using the USB upgrade programme----- ----------- --------- --------- ---
Illustration 8 : Screen copy----------- --------- --------- --------- --------- -- --------- -----
48
52
55
60
61
63
63
64
65
66
68
69
70
78
DSO Series User Ma nual
9
Page 12

Item Page
Chapter 4 System Prompts and Trouble-shooting--------------------------------------------------------
Definitions of System Prompts--------------------------------------------------------------------
Troubleshooting--------------------------------------------------------------------------------------
Chapter 5 Technical Indicators---------------------------------------------------------------------------------
Appendix A : Technical indicators----------------------------------------------------------------
Appendix B : Accessories for DSO Series Digital Storage Oscilloscope ----- -
Appendix C : Maintenance and Cleaning------ --------- --------- --------- -- --------- ---
Index ---- --------- -- --------- --------- --------- --------- -- --------- --------- --------- --------- ---
79
79
79
81
81
87
87
88
DSO Series User Ma nual
10
Page 13
front panel. The functions of knobs are similar to other Oscilloscopes.
Chapter 1 User Guide
On the right you will find the screen copy key (PrtSc) which enables you
Your DSO Series digital storage oscilloscope is a small and compact
to save the current screen in an external USB device in picture format
benchtop device. The user-friendly front panel enables easy operation.
and five menu operation keys (designated as [F1] to [F5] from top
This chapter will guide you through basic testing steps.
down). With these keys you can set up different options of the current
menu. The other keys are function keys. You can use them to enter
This chapter provides notes on the following :
different function menus or access particular functions directly.:
General inspection
Functional check
Probe compensation
Automatic setups for waveform display
Getting to know the vertical system
Getting to know the horizontal system
Getting to know the trigger system
When beginning to use your DSO oscilloscope first familiarize yourself
with the front panel. This chapter briefly describes the operation and
functions of the front panel, so you can get started with your DSO series
digital storage oscilloscope as quickly as possible.
Your DSO oscilloscope comes with a front panel with at-a-glance
functions for easy operation. There are knobs and function keys on the
11
DSO Series User Ma nual
Page 14
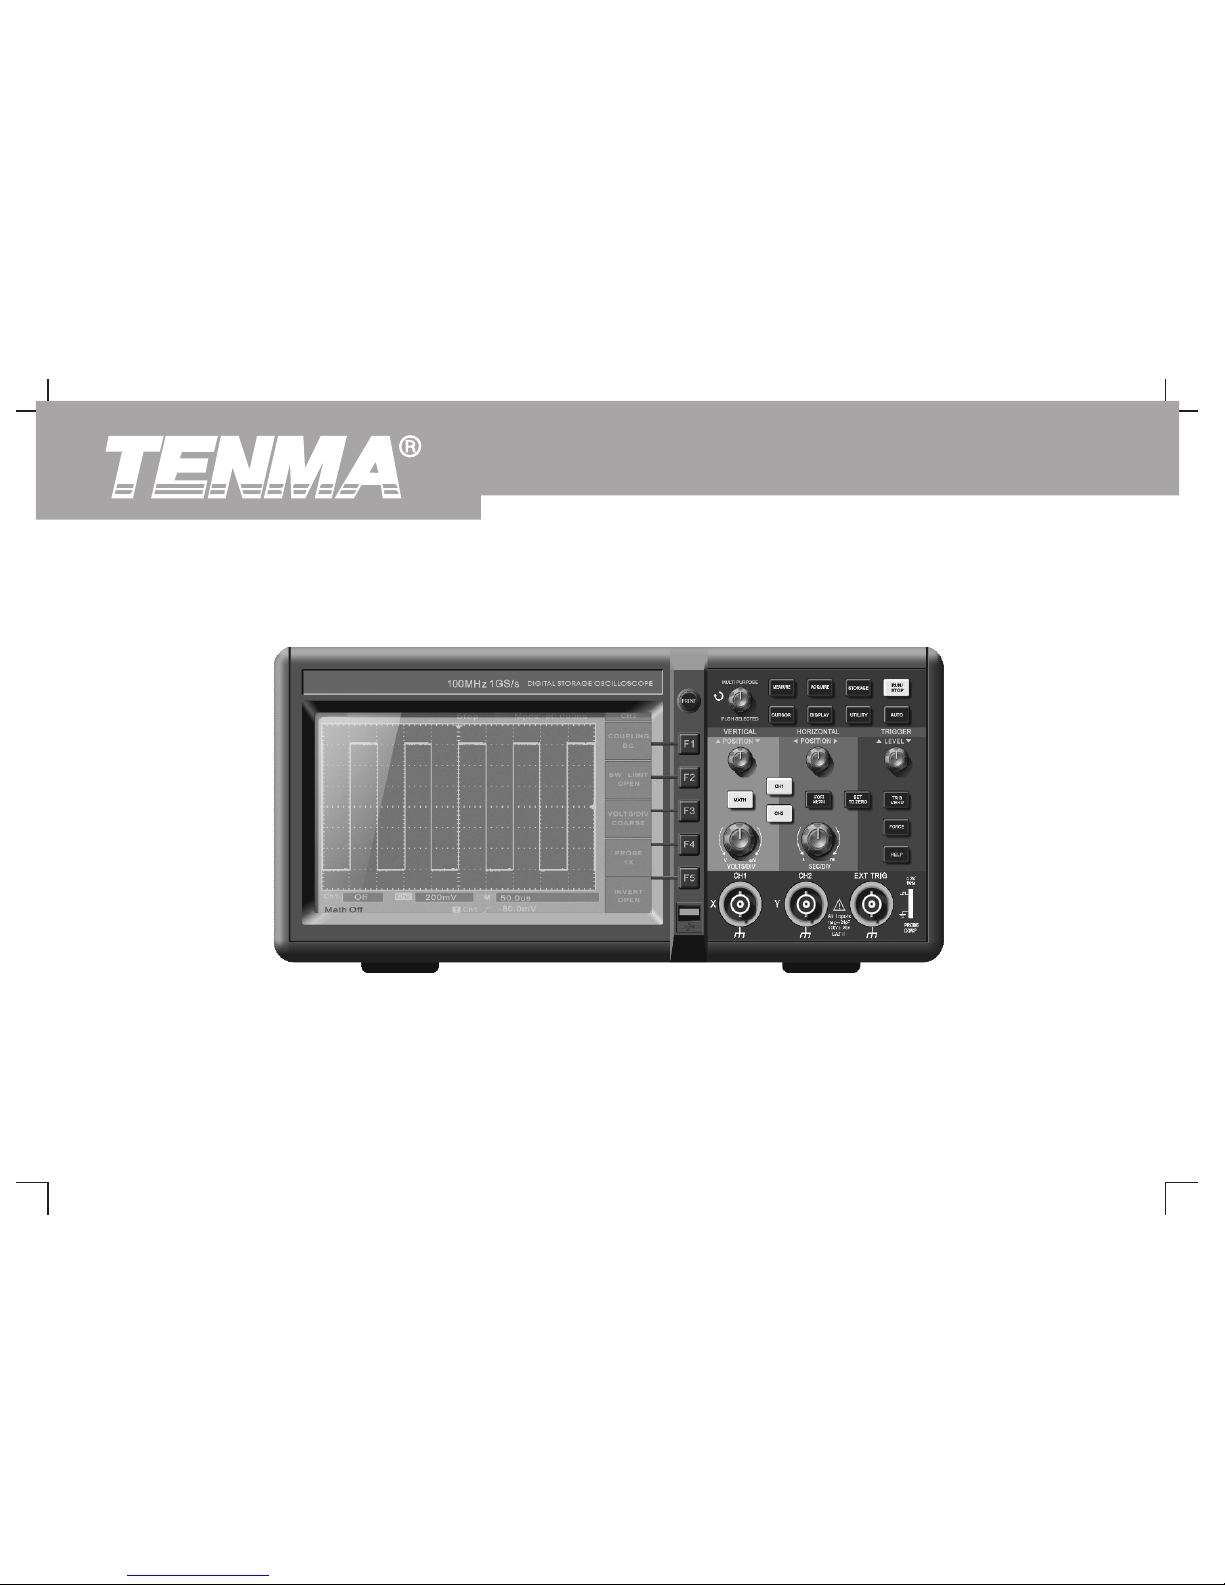
Figure 1-1 DSO Series Digital Storage Oscilloscope
12
DSO Series User Ma nual
Page 15
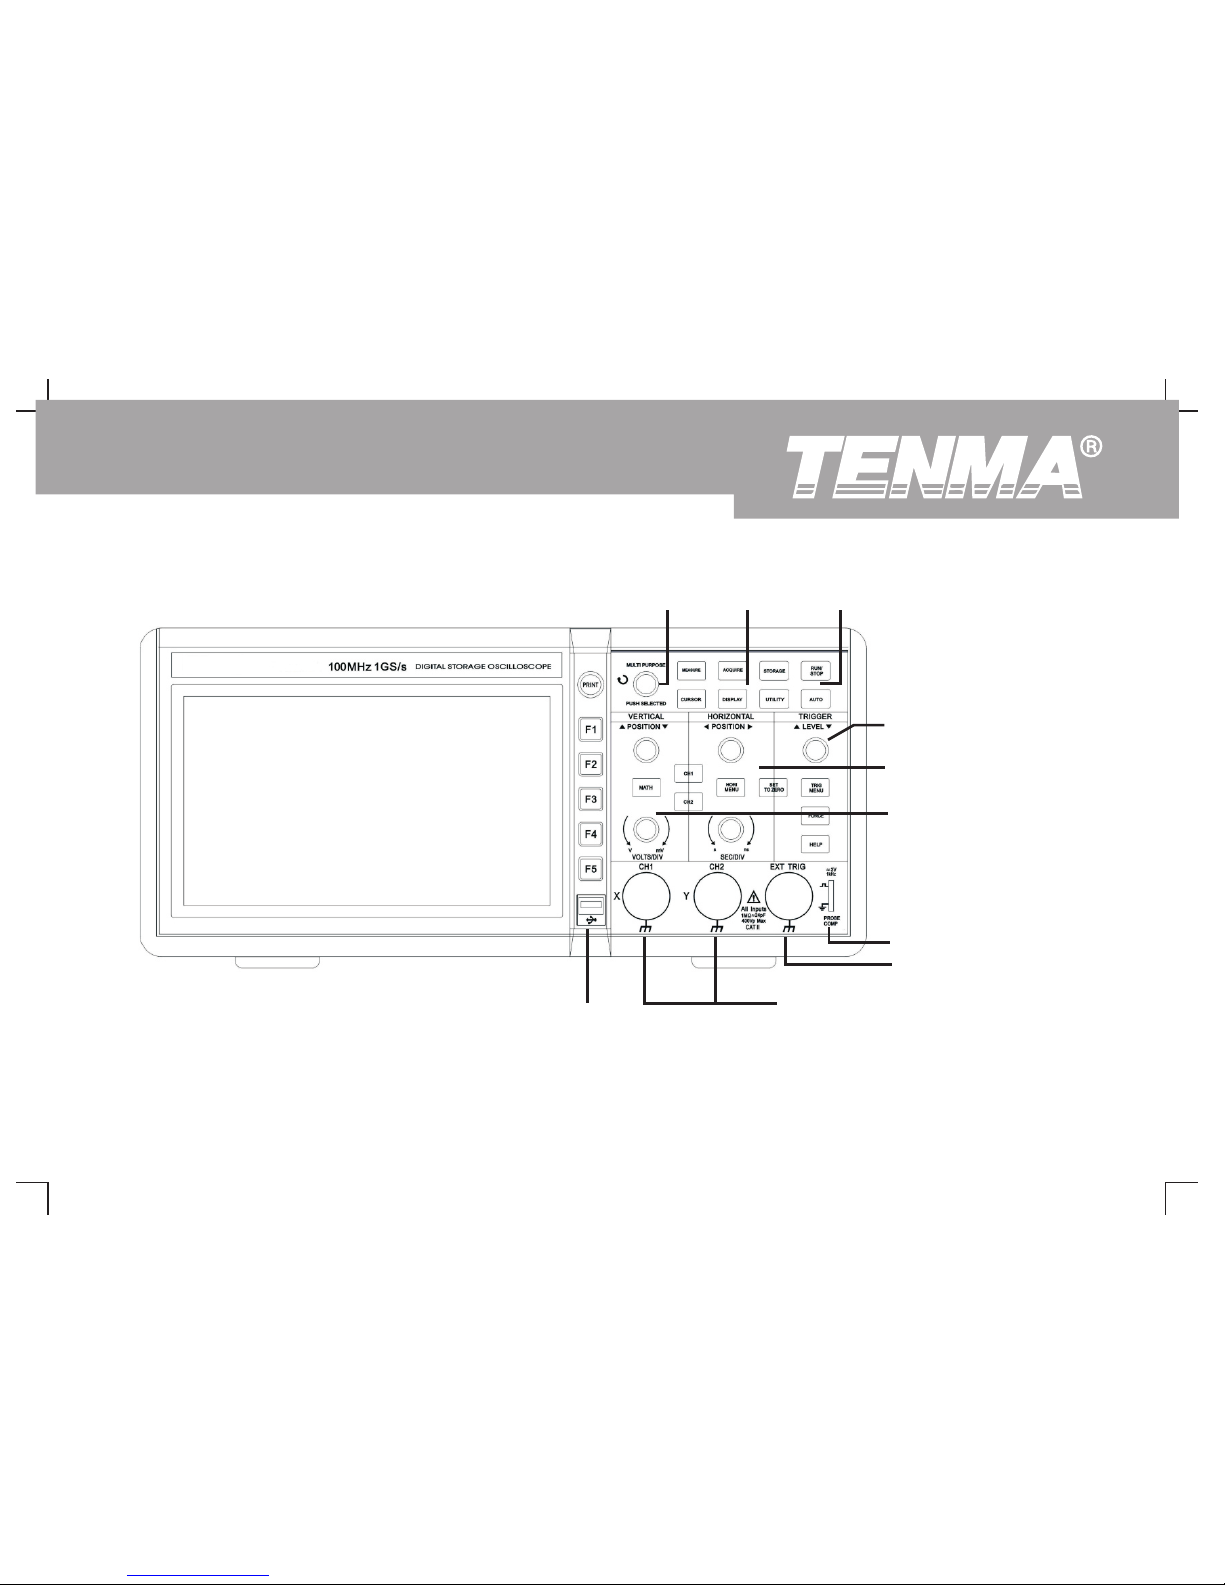
13
External trigger
inputt
Probe compensation
signal output
Vertical controls
Horizontal controls
Trigger controls
Operation
controls
Frequently
Used Menus
Multifunction
control knob
Analog
signal input
USB Host
interface
Figure 1-2 Schematic Diagram of the DSO Front Panel
DSO Series User Ma nual
Page 16
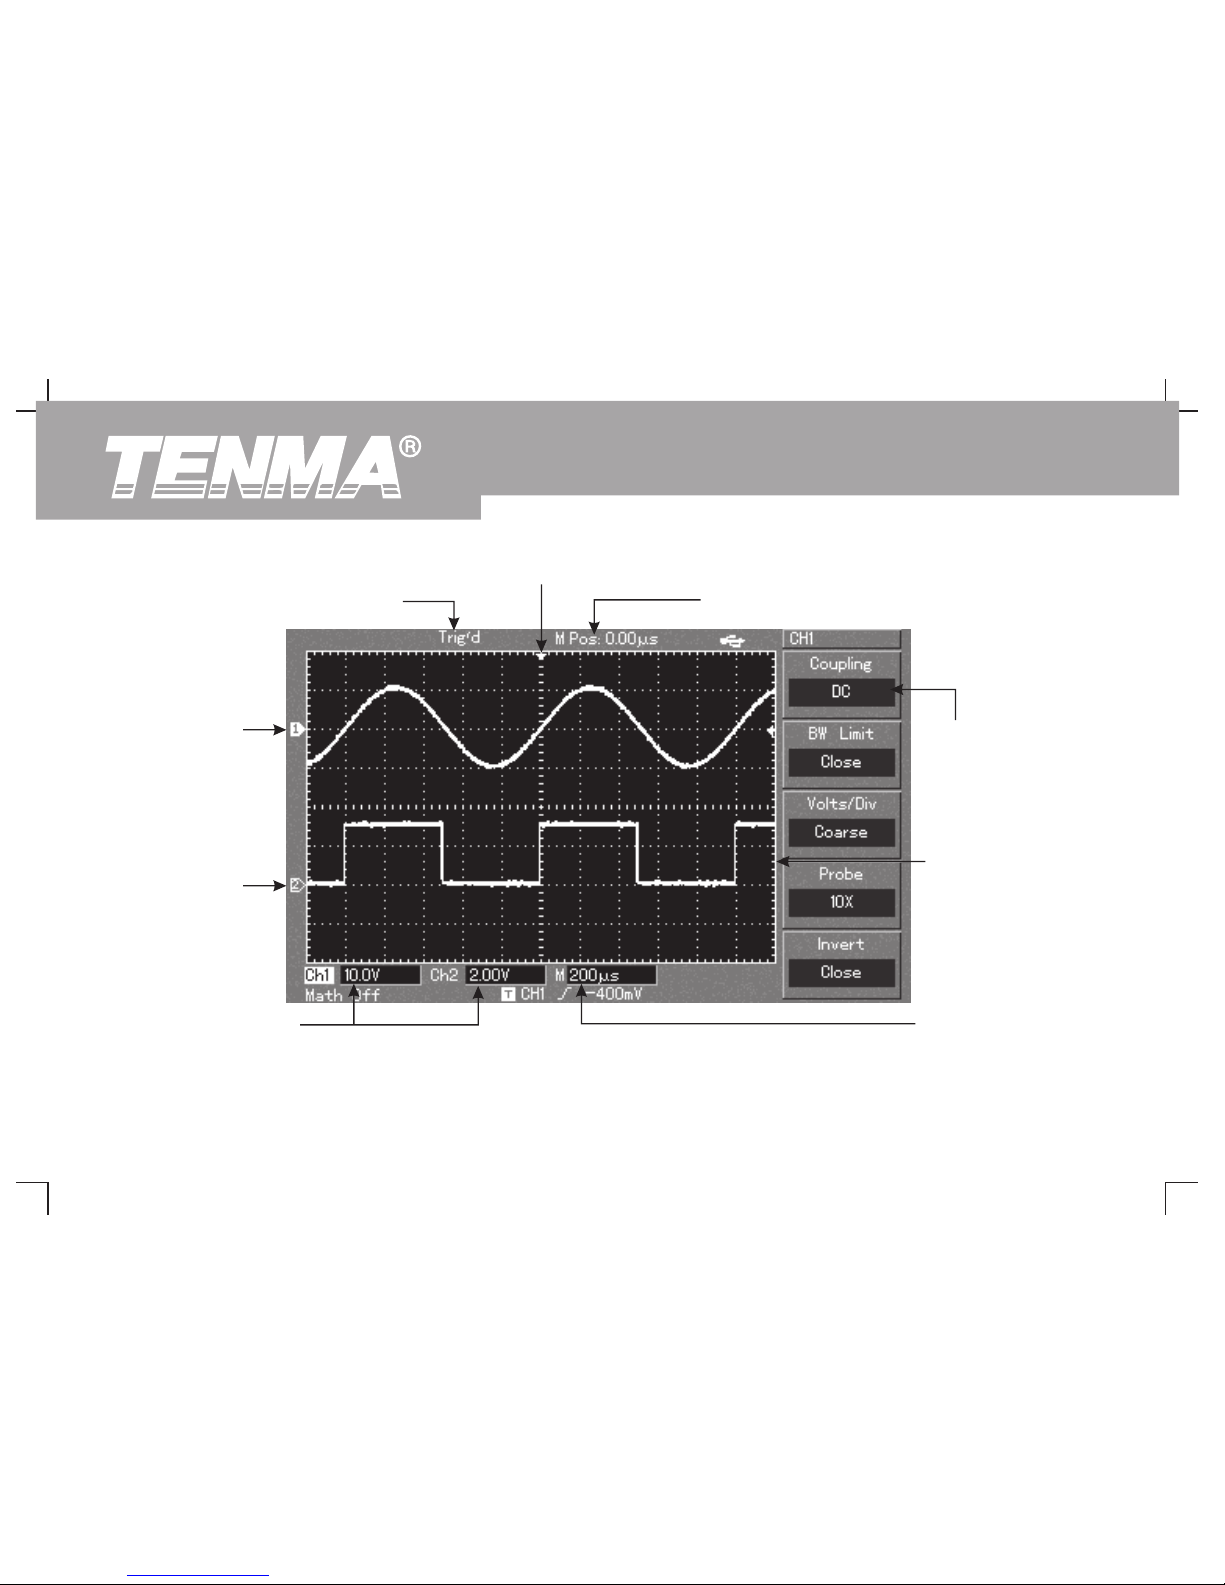
Figure 1-3 Schematic diagram of the display interface
Tri gg er s ta tu s di sp la y
Displaying the horizontal trigger position
Displaying the central graticule time
Displaying the vertical
graticule factor of the
channel
Displaying main
time base setup
Waveform
display window
The menu varies with
individual function keys
CH1 icon
Ch2 icon
14
DSO Series User Ma nual
Page 17

General Inspection Functional Check
Carry out a quick functional check in the following steps to make sure
We suggest checking your new DSO oscilloscope in the following
your oscilloscope is operating normally.
steps.
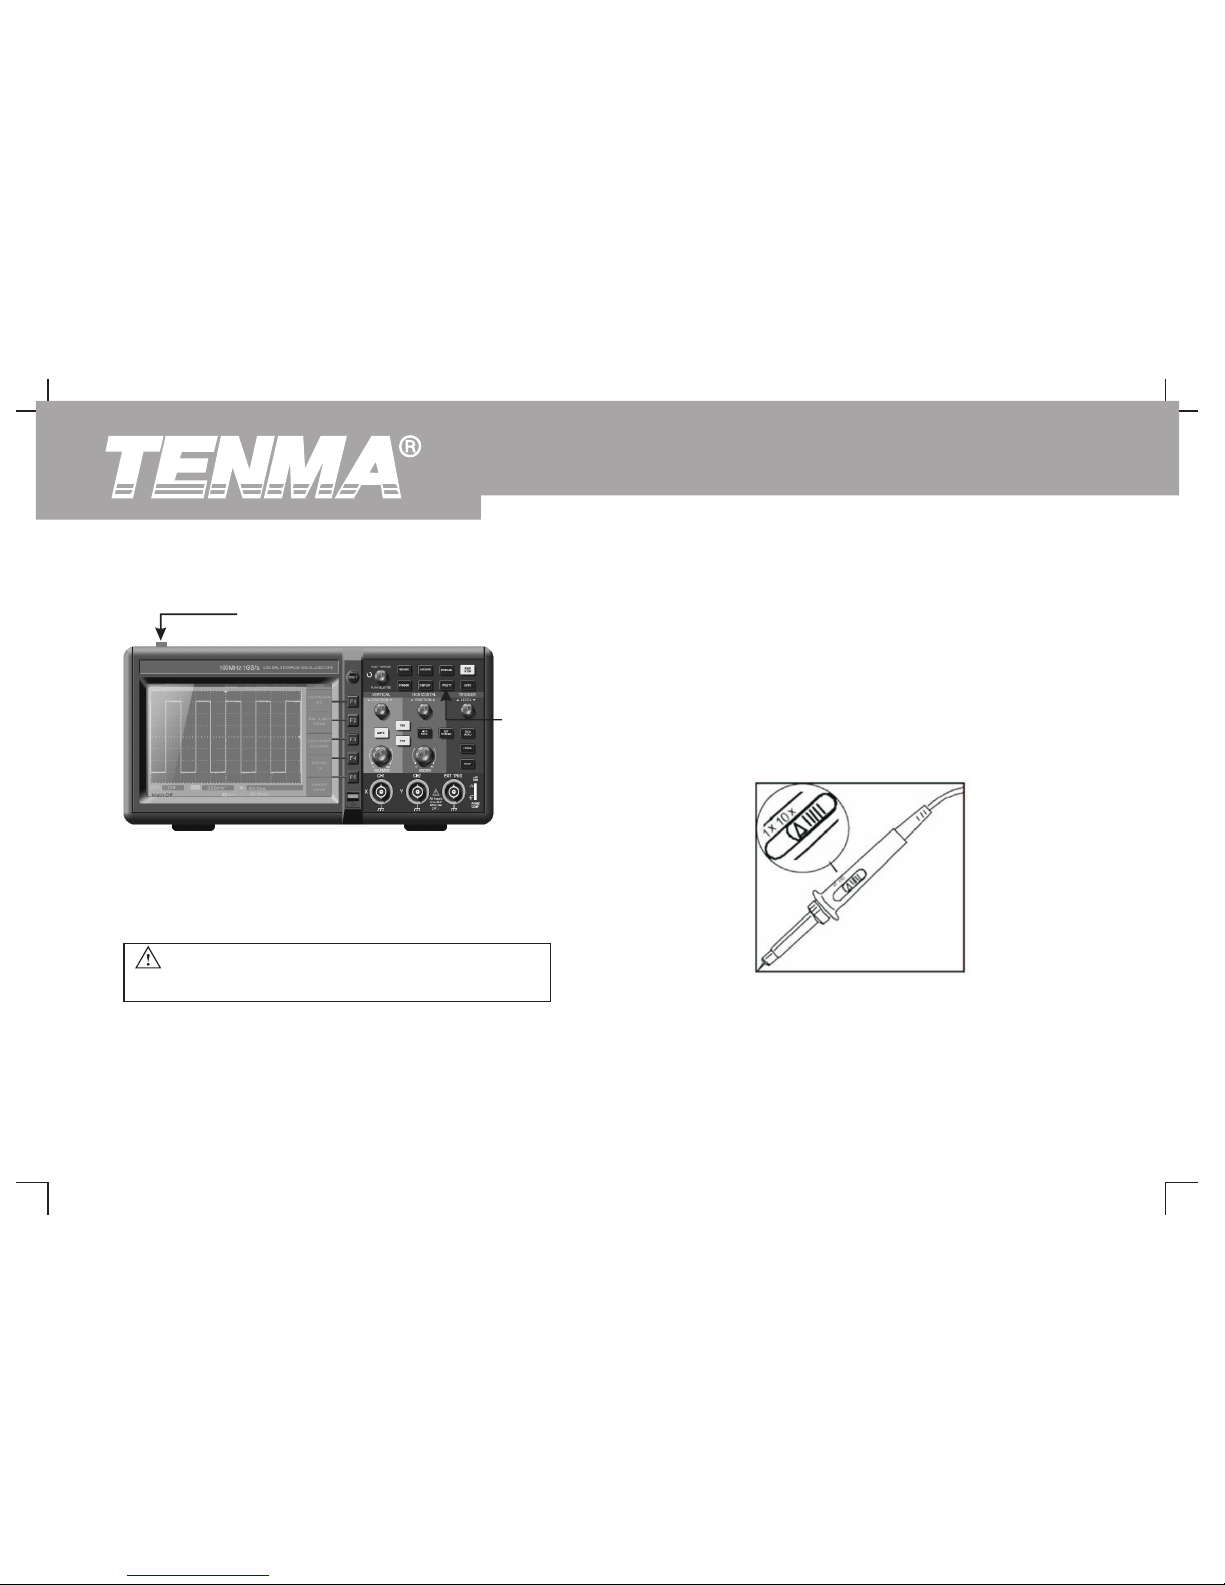
1. Check the unit for possible shipping damages
1. Power on the unit
If the package carton or foam plastic protective lining is seriously
Power on the unit. AC power supply voltage range is 100V AC to 240V
damaged, please arrange for exchange immediately.
AC, frequency Hz- Hz. After connecting to power, start the
self calibration process on the optimal oscilloscope signal path at
2. Check the accessories
greatest measurement accuracy. Press the [UTILITY] button and
A checklist of accessories that come with your DSO oscilloscope is
[F1], then press F ] to go to the next page and press [F1]. To
provided in the section “ Accessories for DSO Series Digital
recall DEFAULT SETUP, see Figure 1-4.
Storage Oscilloscope” of this user manual. Please check any
After completing the above steps, press CH1] to enter the CH1 menu.
missing items against this list.
If any item is missing or damaged, please contact your Tenma dealer or
our local office.
3. Thorough inspection of the entire unit
If the exterior of the unit is damaged, or it is not operating normally, or it
fails to pass the performance test, please contact your Tenma dealer or
our local office.
In the event of any shipping damages, please retain the packaging and
notify our shipping department or your Tenma dealer. We will be glad to
arrange maintenance or repair.
45 44 0
[ 5
[
15
DSO Series User Ma nual
Page 18
2. Accessing signals
Your DSO oscilloscope has dual input channels and an external
trigger input channel. Please access signals in the following steps :
① Connect the probe of the digital storage oscilloscope to the
CH1 input terminal, and set the attenuation switch of the probe to
10X (Figure 1-5).
Power switch
Figure 1-4
Warning : To avoid danger, ensure the digital
storage oscilloscope is safely
grounded.
Figure 1-5 Setting the attenuation switch of the probe
Function
key
16
DSO Series User Ma nual
Page 19
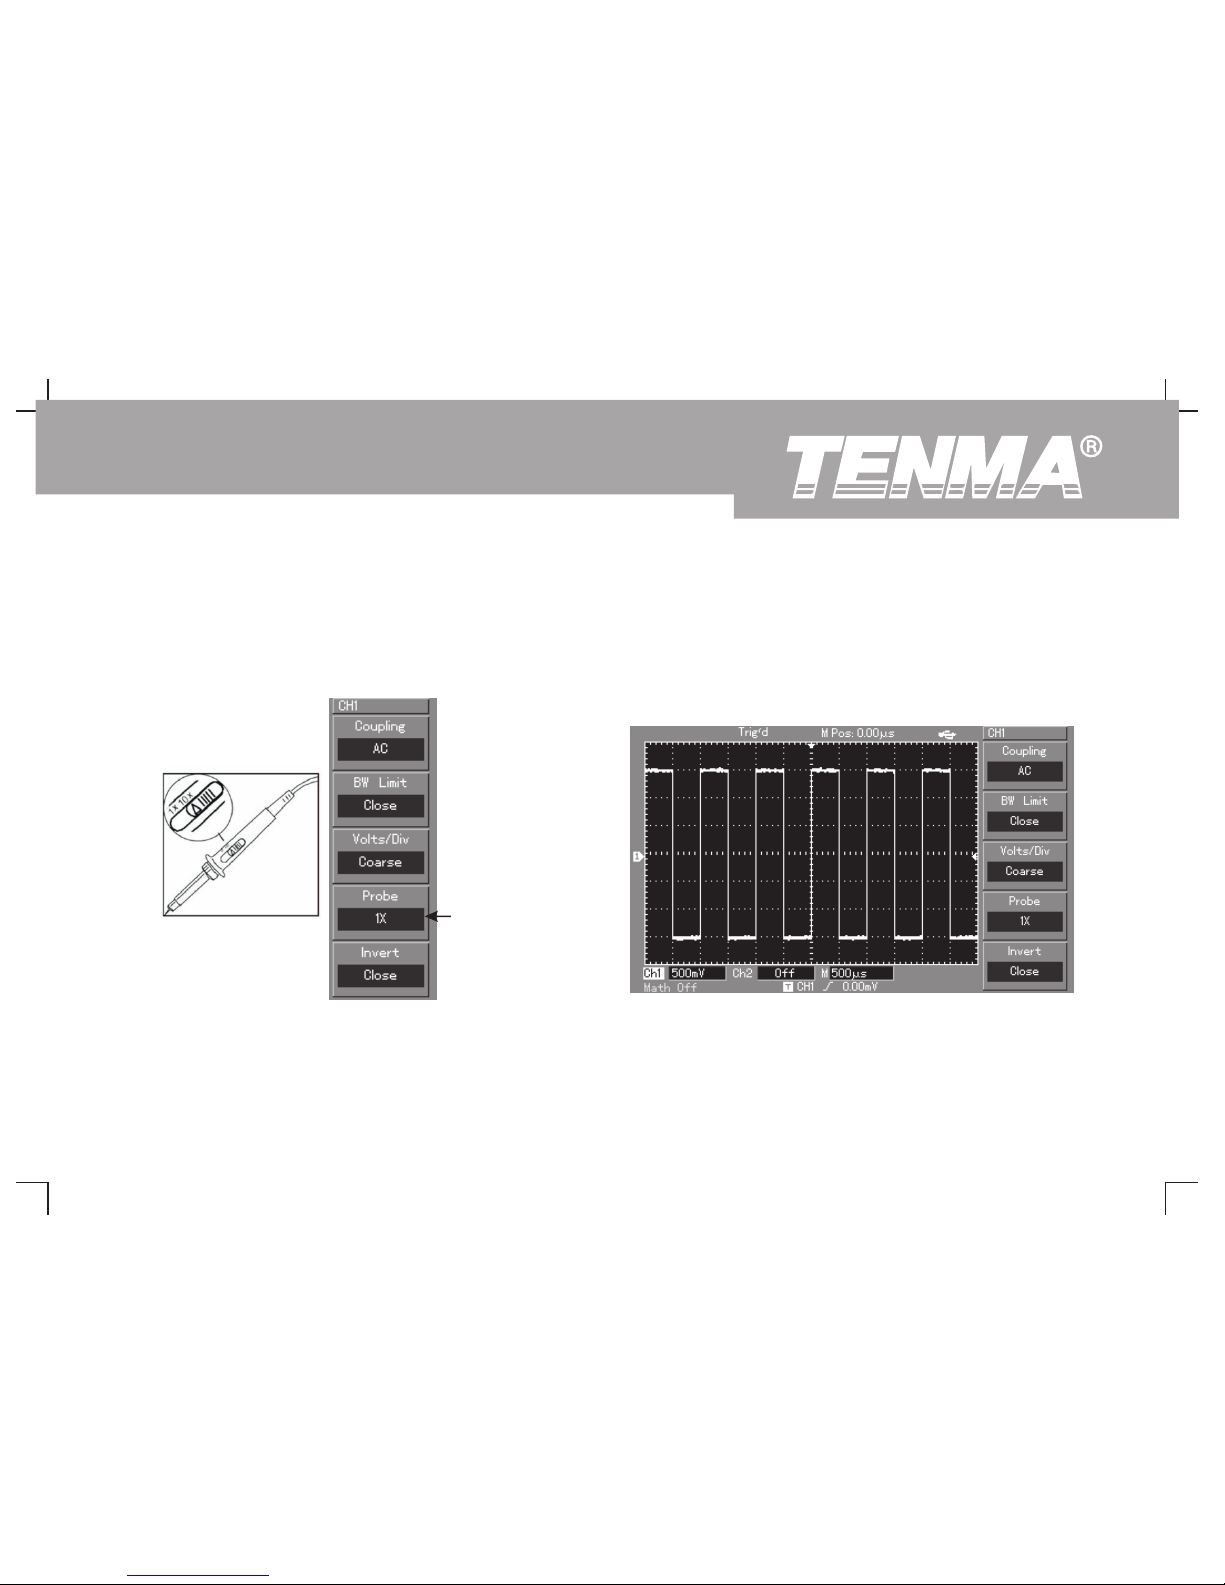
② You have to set the probe attenuation factor of the oscilloscope. ③ Connect the probe tip and ground clamp to the connection terminal
This factor changes the vertical range multiple to ensure the for the probe compensation signal. Press [AUTO] and you will see a
measurement result correctly reflects the amplitude of the signal square wave in the display (1kHz, approximately 3V, peak-to-peak
being tested. Set the attenuation factor of the probe as follows : value) in a few seconds, as shown in Figure 1-7. Use the same method
Press [F ] to show X on the menu.
to check CH2. Press function key [CH1] again to close CH1. Press
function key [CH2] to activate CH2 and repeat steps 2 and 3.
4 10
Figure 1-6 Setting the deflection factor
of the oscilloscope probe
Figure 1-7 Probe compensation signal
Probe ration
17
DSO Series User Ma nual
Page 20
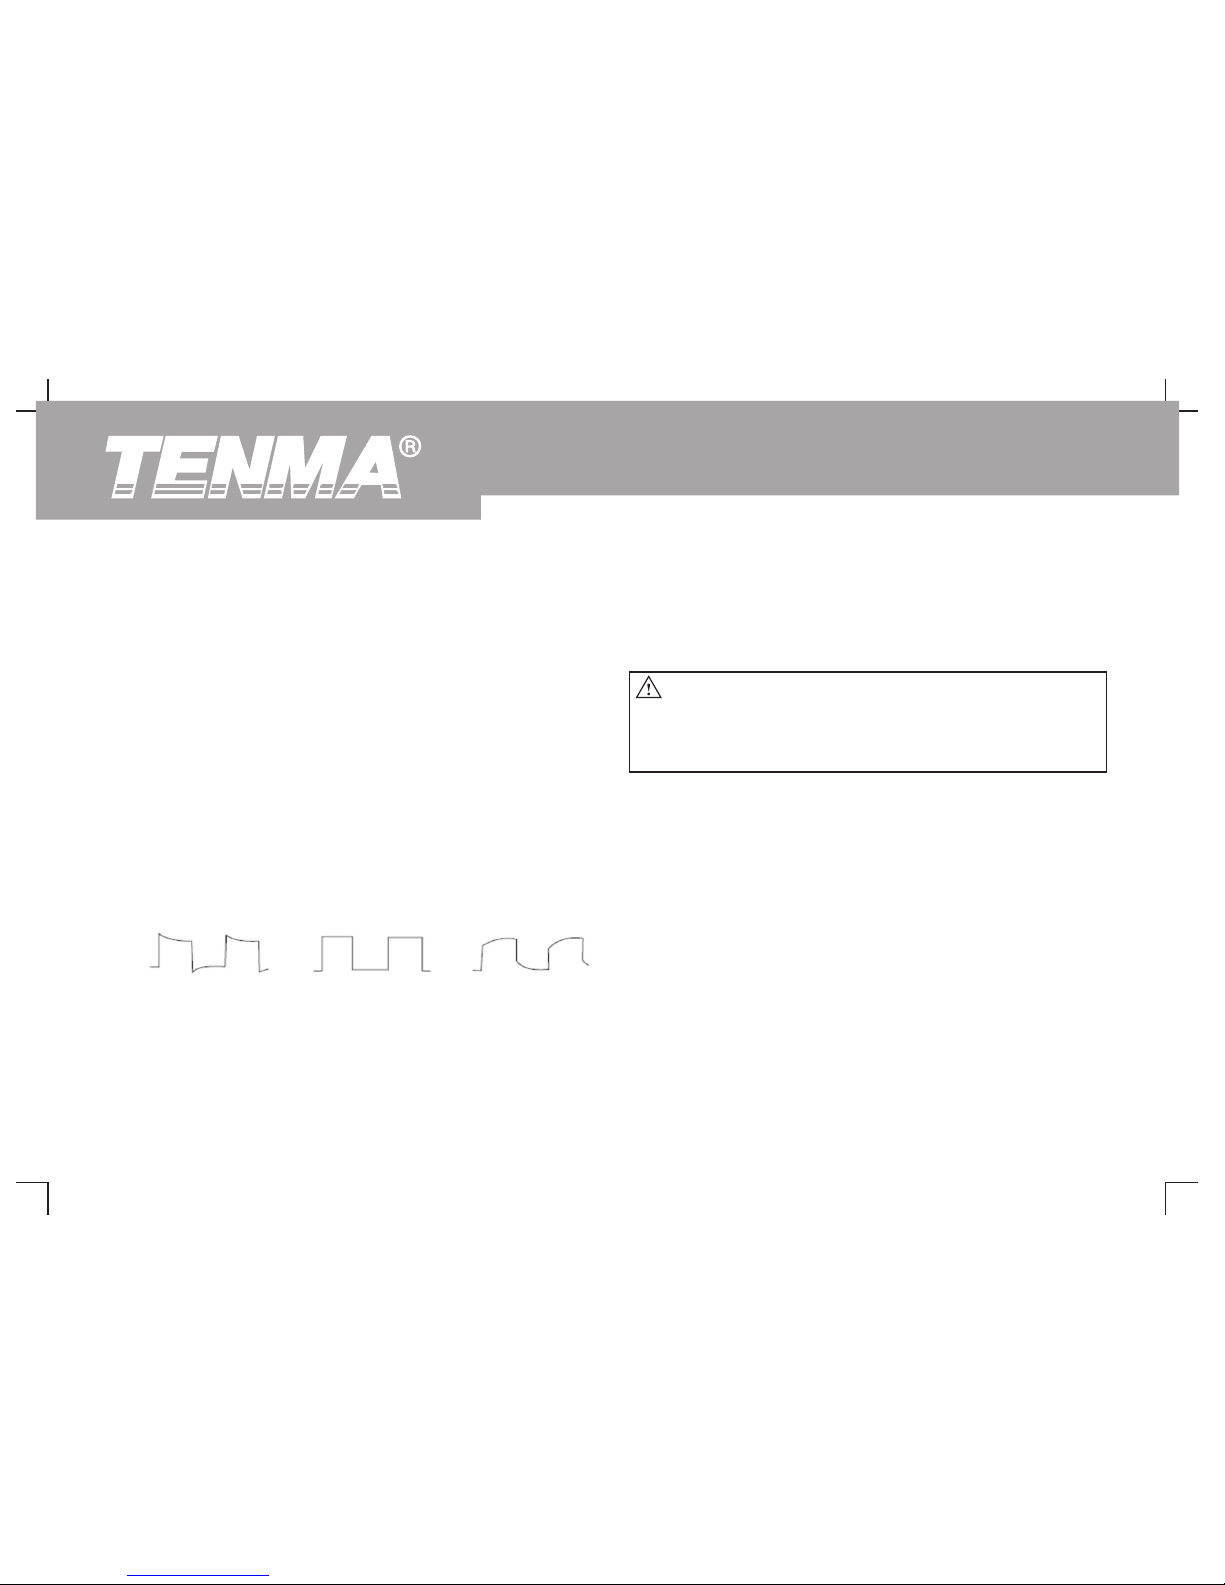
3. If you see an “Undercompensation” or “Overcompensation”
Probe Compensation
waveform display, adjust the adjustable capacitance tab of the
When connecting the probe to any input channel for the first time,
probe with a screwdriver with non-metal handle, until a “Correct
perform this adjustment to match the probe to the channel. Skipping the
Compensation” waveform shown in the above figure is displayed.
compensation calibration step will result in measurement error or fault.
Please adjust probe compensation as follows :
1. Set the probe attenuation factor to 10X. Move the switch on the
probe to 10X and connect the probe to CH1. When using a hook-
tip, ensure it is well connected to the probe. Connect the probe tip
Automatic Setup for Waveform Display
to the output terminal of the probe compensator's signal
connector, and the ground clamp to the ground cable connector of
Your DSO oscilloscope features an auto setup function. It can
the probe compensator. Activate CH1 then press [AUTO].
automatically adjust the vertical deflection factor, scanning time
base and trigger mode based on the input signal, until the most
2. Observe the displayed waveform.
appropriate waveform is displayed. The auto setup function can only
be operated when the signal to be measured is 20Hz or above and
the duty ratio is larger than 1%.
Using the Aut o Se tu p Fu nc ti on :
1. Connect the signal to be tested to the signal input channel.
2. Press [AUTO]. The oscilloscope will automatically set the vertical
deflection factor, scanning time base and trigger mode.
Overcompensation Correct Compensation Undercompensation
Figure 1-8 Probe compensation calibration
Warning : To avoid electric shock when measuring high
voltage with the probe, ensure the probe's
insulation lead is in good condition. Do not
touch the metal part of the probe when
connected to HV power.
18
DSO Series User Ma nual
Page 21
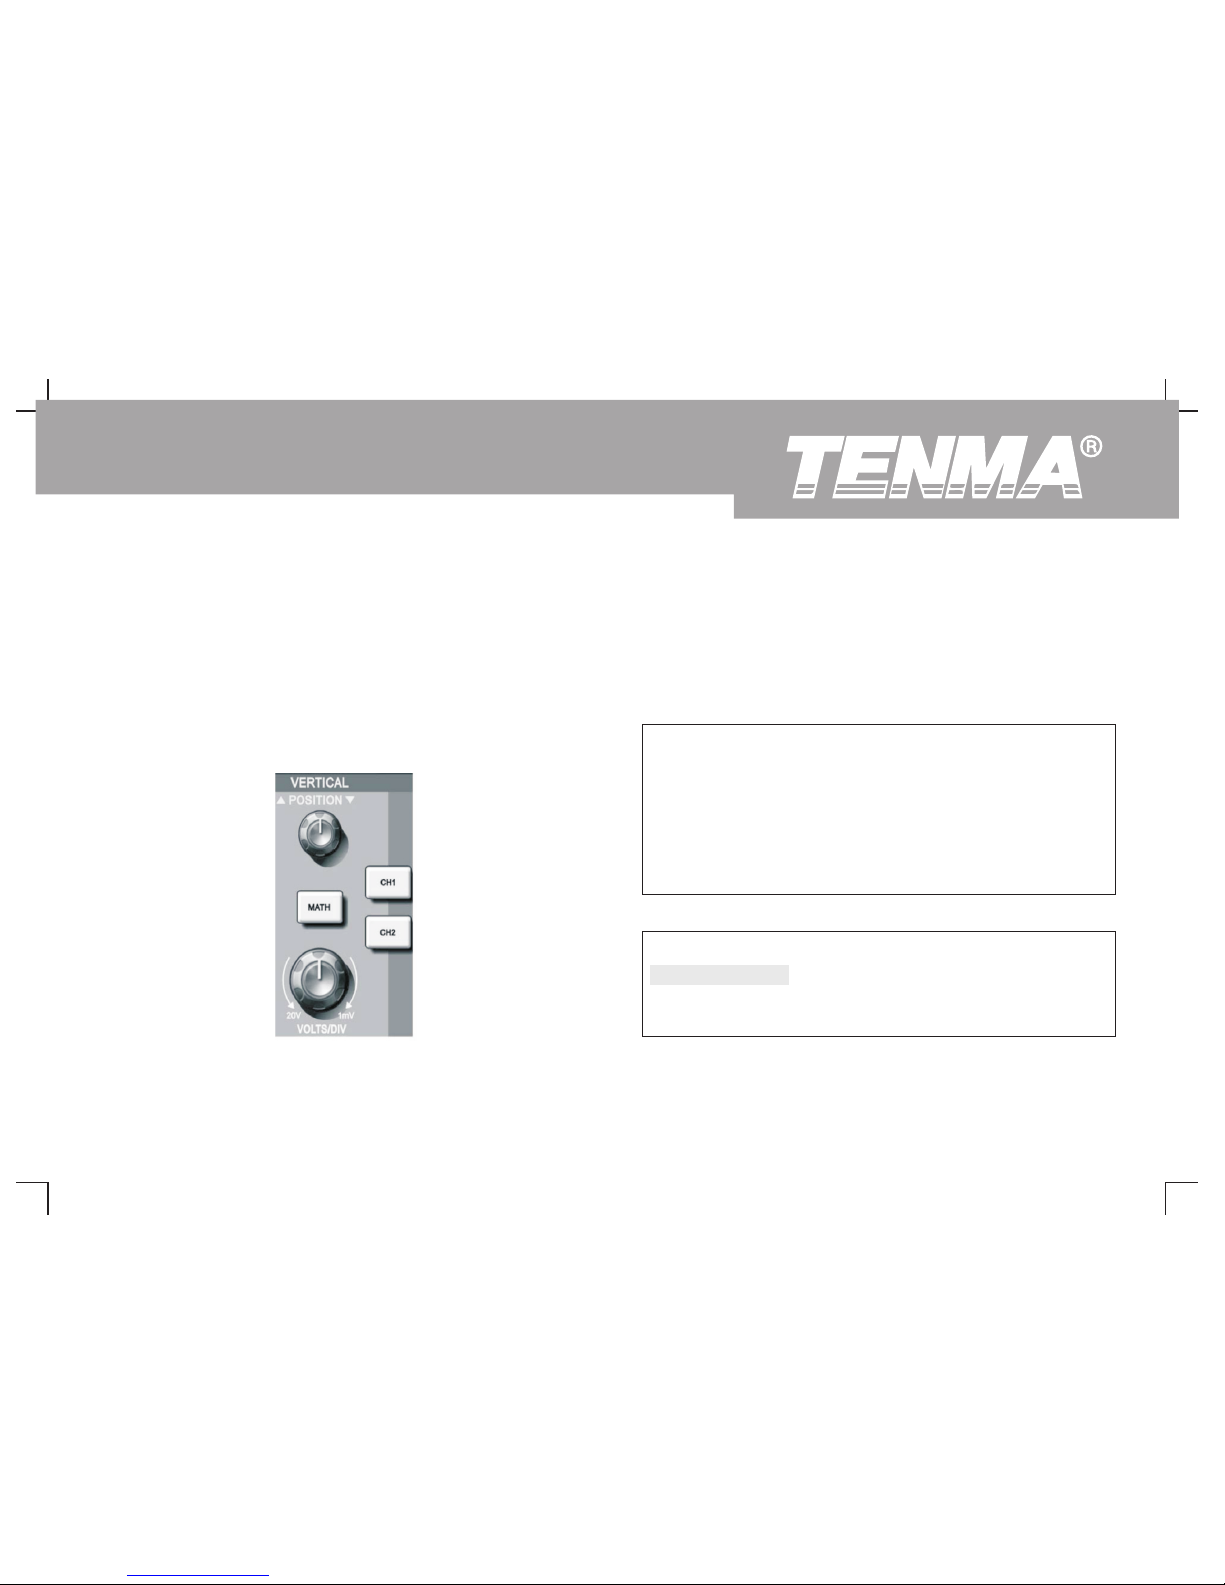
Should you require to make more detailed check, you can adjust 1. Turn the vertical position knob to display the signal in the centre of
manually after the auto setup process until you get the optimal the window. The vertical position knob controls the vertical
waveform display. display position of the signal.
When you turn the vertical position knob, the sign indicating the
Getting to Know the Vertical System
[GROUND] channel will move up and down with the waveform.
As shown in the figure below, there are a group of buttons and knobs in
the vertical control zone. The following exercise will guide you through
vertical setup.
Figure 1-9 Vertical control zone on the front panel
Measurement Tips :
If the channel coupling is DC, you can measure the signal's DC%
quickly by checking the difference between the waveform and
signal ground.
In the case of AC coupling, the DC% within the signal will be
filtered. With this coupling mode you can display the AC% of the
signal with higher sensitivity.
Shortcut key for resetting to zero :
[SET TO ZERO]
This shortcut key can reset vertical shift, horizontal shift and holdoff
to the zero position (center point), and set the trigger level to 50%.
19
DSO Series User Ma nual
Page 22
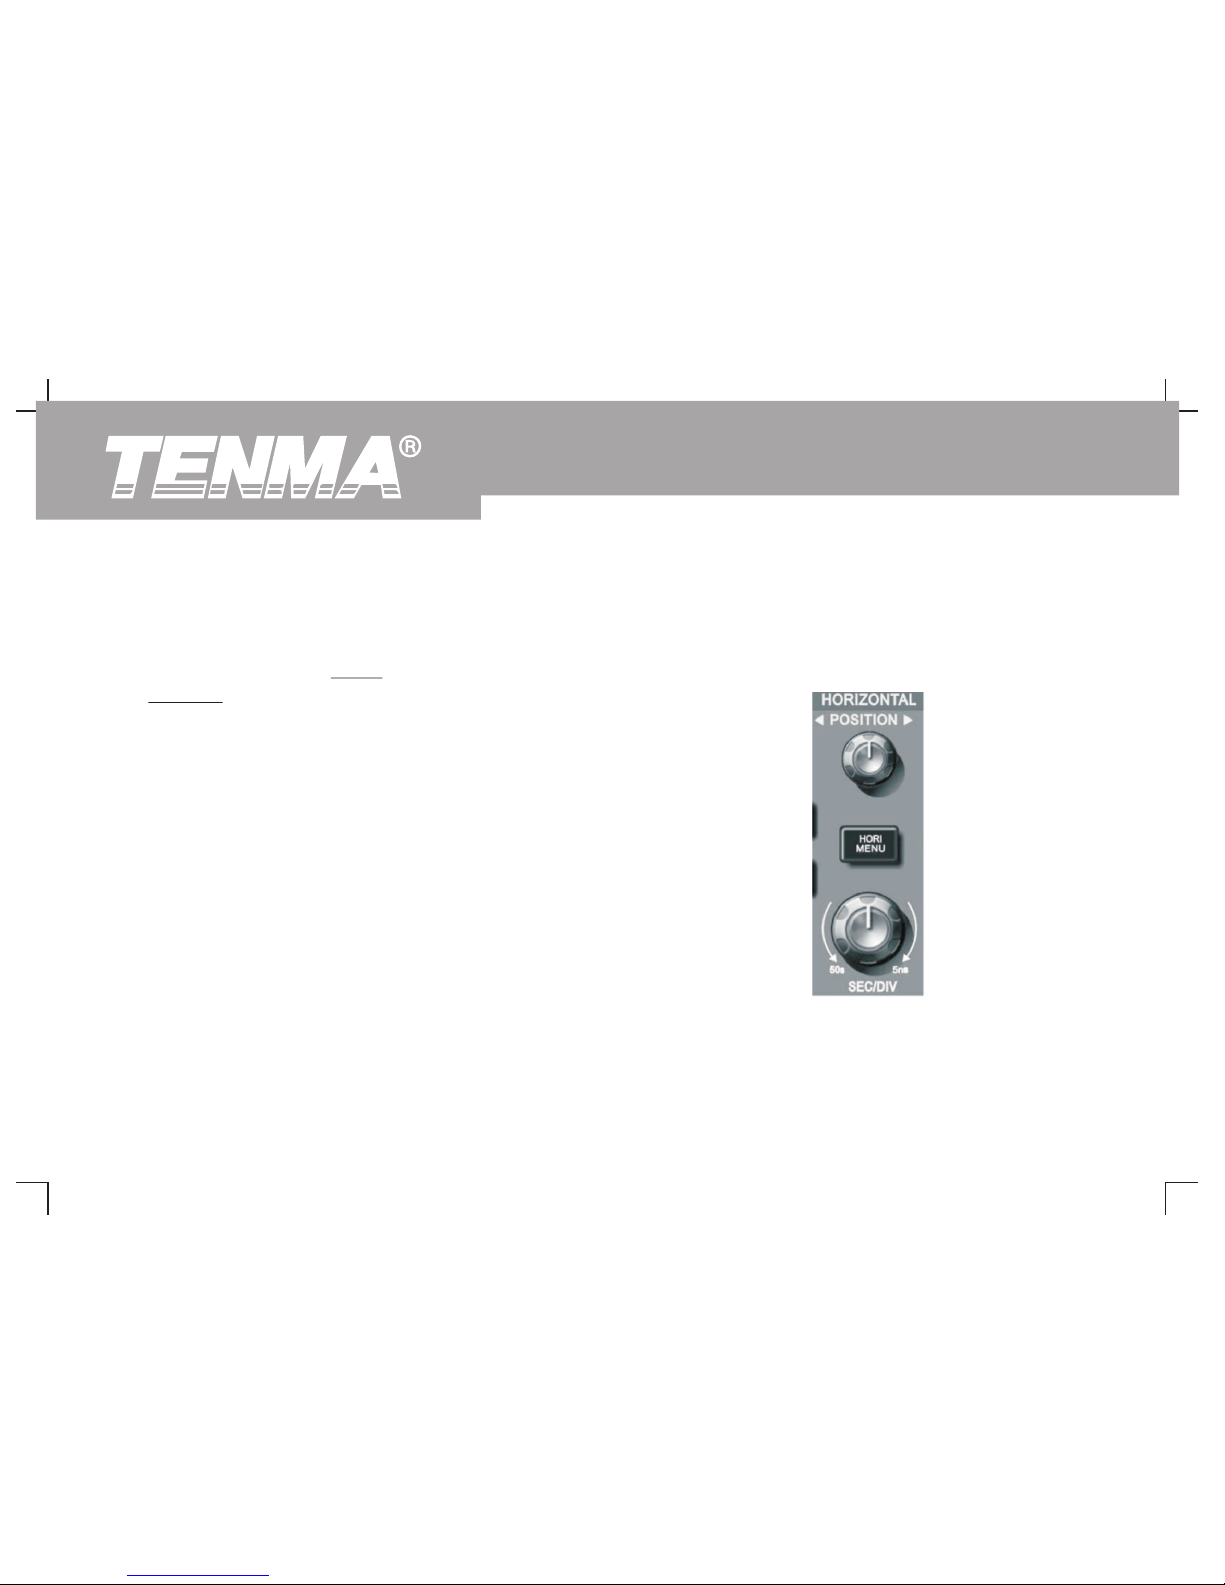
2. Change the vertical setup and observe changes of status
Getting to Know the Horizontal System
information.
As shown in the figure below, there are one button and two knobs in the
You can identify changes of any vertical range by reading the
horizontal control zone. The following steps will get you familiar with
status display column at the lower corner of the waveform
horizontal time base setup.
window. Turn the vertical SCALE knob to change the vertical
VOLT/DIV range. You will find that the range in the
corresponding channel has changed accordingly. Press [CH1],
[CH2] or [MATH] and the screen will show the corresponding
operation menu, sign, waveform and range status information.
Press the corresponding button for the currently activate channel
again to close the selected channel.
Figure 1-10 Horizontal control zone on the
front panel
20
DSO Series User Ma nual
Page 23
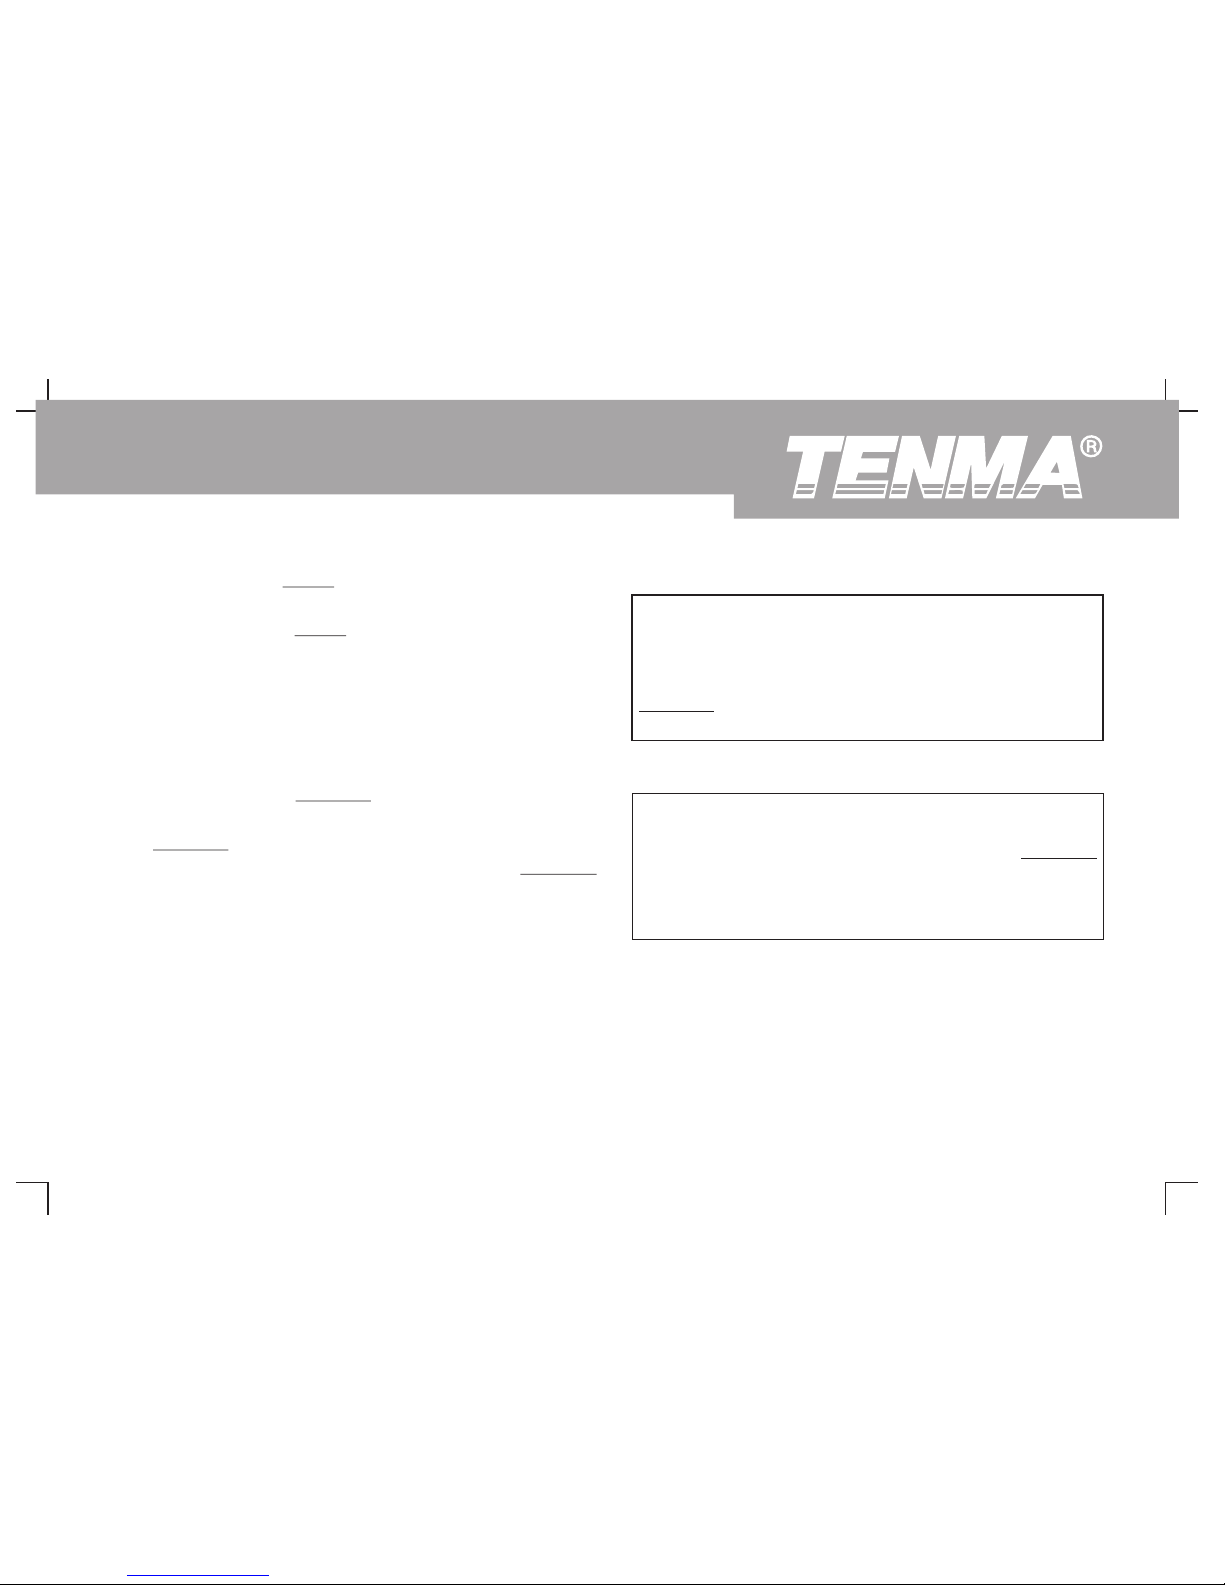
1. Use the horizontal SCALE knob to change the horizontal time
base range setup and check any changes in time base range.
Turn the horizontal SCALE knob to change the SEC/DIV time
base range. You will find that the time base range in the current
status column has changed accordingly. Range of horizontal
scanning rate is 2ns~50s, in steps of 1-2-5.
* Note : Horizontal scanning time base range of the DSO
Series varies from model to model.
2. Use the horizontal POSITION knob to adjust the signal's
horizontal position of the waveform window. The horizontal
POSITION knob controls trigger shift of the signal. When this
function is used for trigger shift and the horizontal POSITION
knob is turned, you can see that the waveform moves
horizontally with the knob.
3. Press [HORI MENU] to display the ZOOM menu. In this menu
press [F3] to activate window expansion. Then press [F1] to quit
window expansion and return to the main time base. You can
also set the holdoff time with this menu.
Shortcut key for resetting trigger point displacement to horizontal
zero :
The shortcut key [ SET TO ZERO] can quickly reset the trigger
point to the vertical centre point. You can also turn the horizontal
POSITION knob to adjust the horizontal position of the signal
in the waveform window.
Definition
Trigger point means the actual trigger point relative to the centre
point of the storage device. By turning the horizontal POSITION
knob, you can move the trigger point horizontally.
Holdoff means reactivating the time interval of the trigger circuit.
Turn the multifunction control knob to set the holdoff time.
21
DSO Series User Ma nual
Page 24
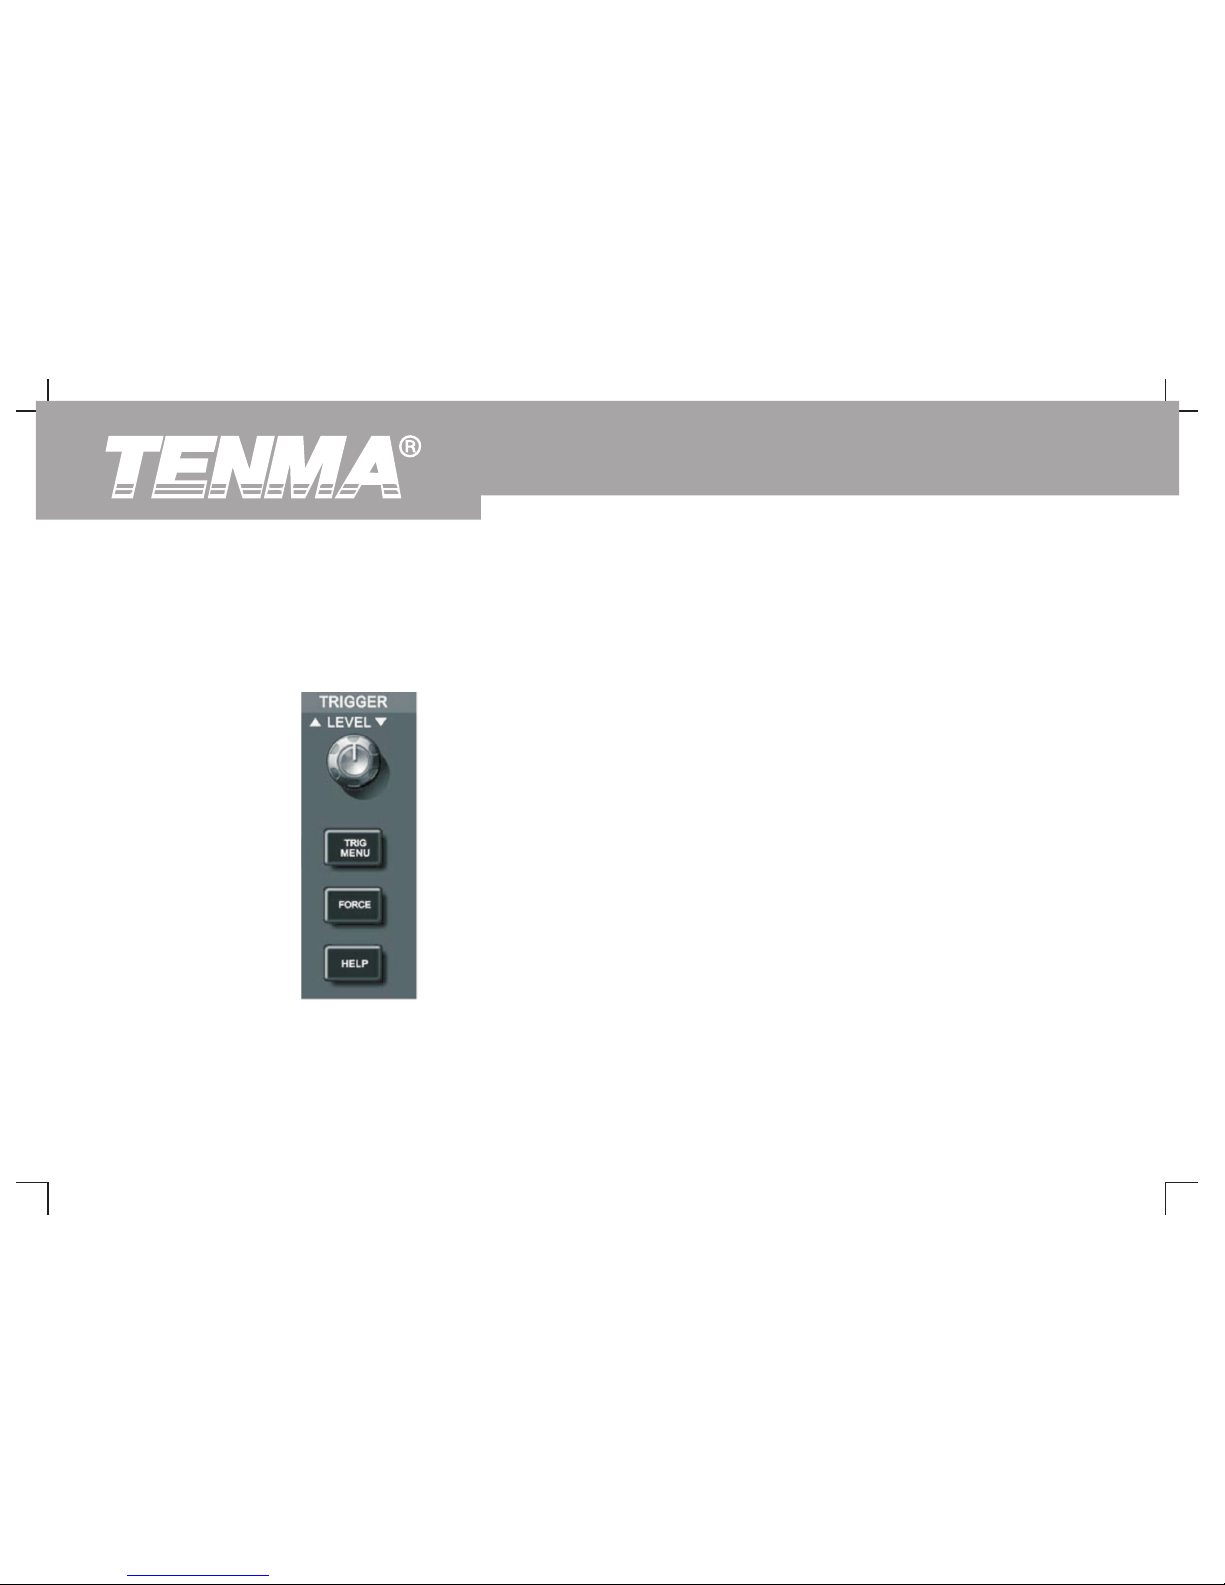
1. Use the trigger level knob to change the trigger level. You will see
Getting to Know the Trigger System
a trigger sign on the screen that indicates the trigger level. The
As shown in Figure 1-11, there is one knob and three buttons in the
sign will move up and down with the knob. While you move the
trigger menu control zone. The following steps will get you familiar with
trigger level, you will find the trigger level value at the bottom of
trigger setup.
the screen changing accordingly.
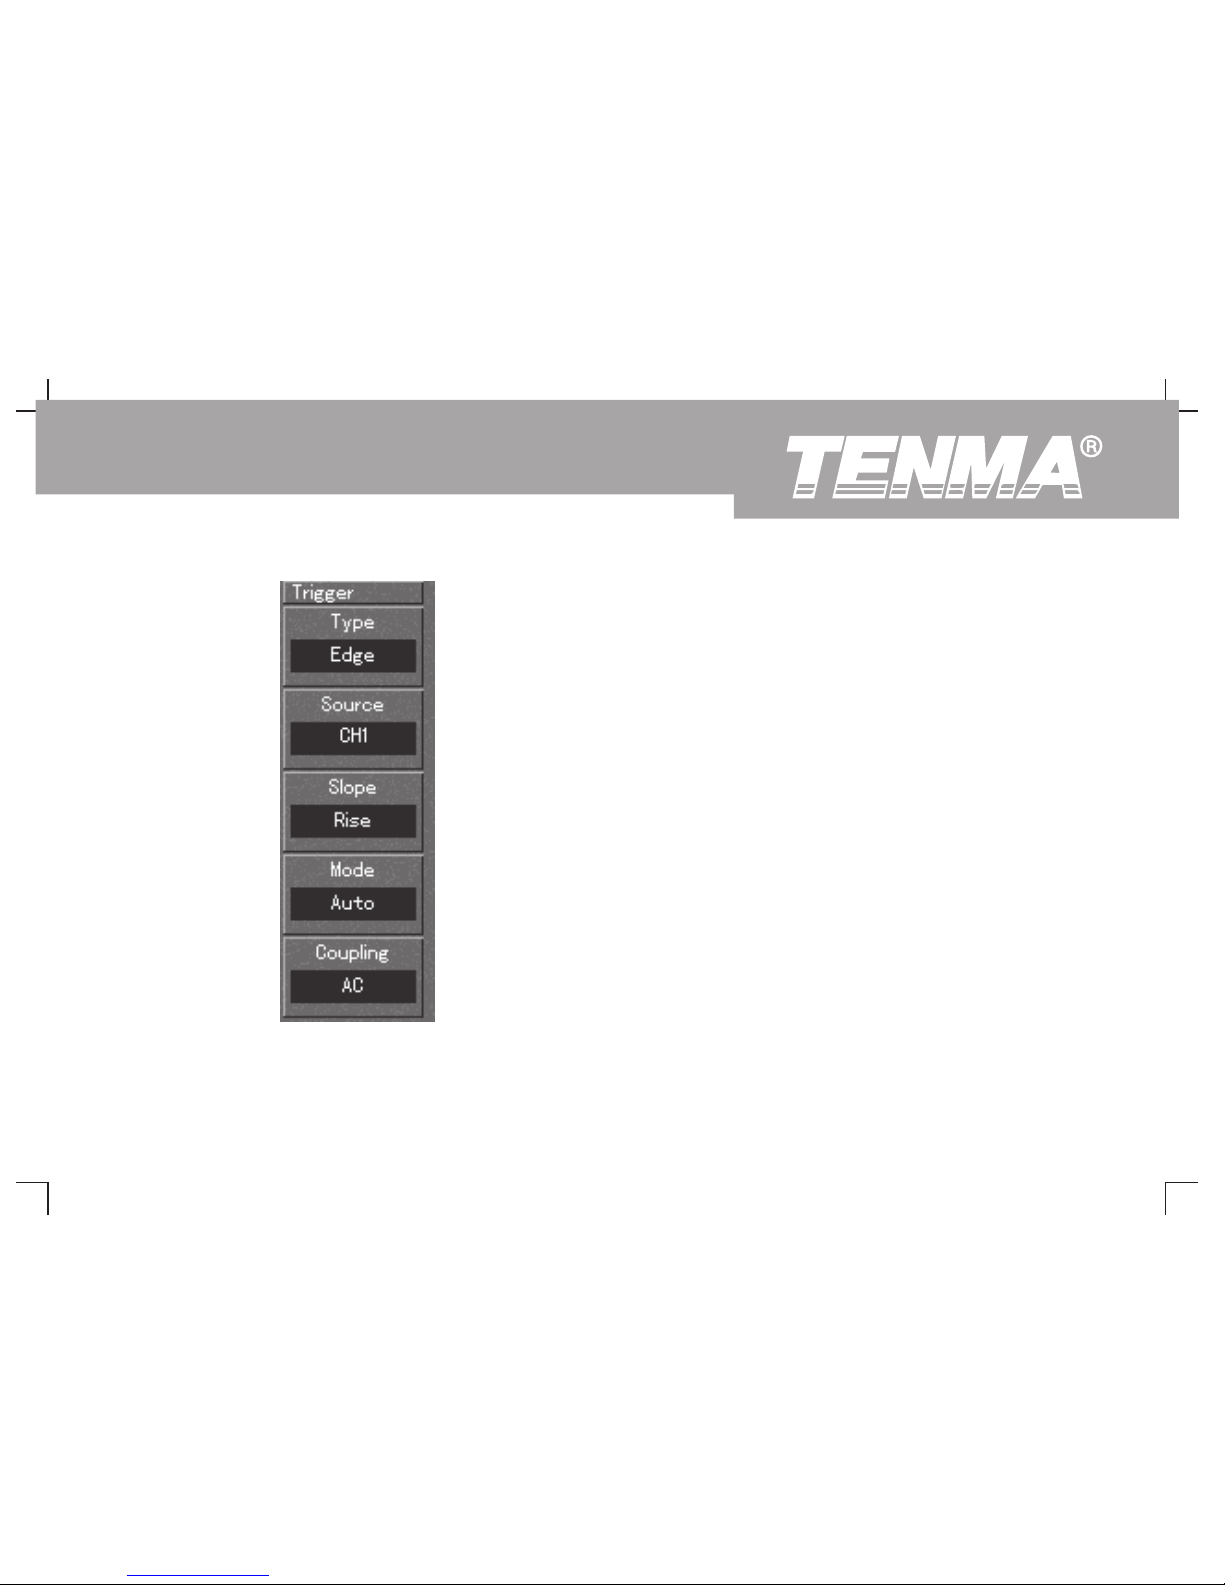
2. Open the [TRIGGER MENU] (see Figure 1-12) to change trigger
setup.
Press [F1] and select RISING for {TYPE}.
Press [F2] and select CH1 for {TRIGGER SOURCE}.
Press [F3] and set RISING for {SLEW RATE}.
Press [F4] and set AUTO for {TRIGGER MODE}.
Press [F5] and set AC for {TRIGGER COUPLING}.
Figure 1-11 Trigger menu control zone on the front panel
22
DSO Series User Ma nual
Page 25
3. Press [SET TO ZERO] to set the trigger level at the vertical centre
point of the trigger signal amplitude.
4. Press [FORCE] to generate a compulsory trigger signal that is
mainly used in the normal and single trigger modes.
Figure 1-12 Trigg er Menu
23
DSO Series User Ma nual
Page 26
n Setting the help system ([UTILITY])
Chapter 2 Instrument Setups
n Automatic measurement ([MEASURE])
You should be familiar with basic operation of the vertical controls,
n Cursor measurement ([CURSOR])
horizontal controls and trigger system menu of your DSO Series
oscilloscope by now. After reading the last chapter, you should be
n Using the execution buttons ([AUTO], [RUN/STOP])
able to use the menus to set up your digital storage oscilloscope. If
It is recommended that you read this chapter carefully to understand
you are still unfamiliar with these basic operation steps and methods,
the various measurement functions and system operation steps of your
please read Chapter 1.
DSO Series oscilloscope.
This chapter will guide you through the following :
n Setting the vertical system ([CH1], [CH2], [MATH],
[VERTICAL POSITION], [VERTICAL SCALE])
n Setting the horizontal system ([HORI MENU],
[HORIZONTAL POSITION], [HORIZONTAL SCALE])
n Setting the Trigger system ([TRIGGER LEVEL], [TRIG MENU],
[FORCE])
n Setting the sampling method ([ACQUIRE])
n Setting the display mode ([DISPLAY])
n Storage and recall ([STORAGE])
24
DSO Series User Ma nual
Page 27
Setting the Vertical System
CH1, CH2 and setups
Each vertical channel has its own vertical menu. You should set up each
item for each channel individually. Press the [CH ] or [CH ] function
button and the system will display the operation menu for CH1 or
CH2. For explanatory notes please see Table 2-1 opposite:
1 2
Table 2-1:Explanatory notes for channel menu
Function Menu Setup Explanatory Note
Coupling
AC
DC
GND
Intercept the DC quantities of the
input signal
Pass AC and DC quantities of
input signal
Disconnect input signal
Limit bandwidth to 20 MH z to
reduce noise display
Full bandwidth
Open
Clos e
BW Limit
Volts/Div
Coarse
Fine
Coarse tune in steps of 1-2-5 to
set up the deflection factor of
the vertical system
Fine tune means further tuning
within the coarse tune setup
range to improve the vertical pixel
aspect ratio
Select either one value based on
the probe attenuation factor to
keep the vertical deflection factor
reading correct. There are four
values : 1x, 10x, 100x and 1000x
1x
10x
100x
1000x
Probe
Invert Open
Close
Waveform invert function on
Normal waveform display
25
DSO Series User Ma nual
Page 28

Press [F1] to select DC. Both DC and AC quantities of the testing signal
1. Setting the channel coupling :
being inputted to CH1 can pass through. The waveform display is as
Take an example of applying a signal to CH . The signal being
follows :
tested is a sine signal that contains DC quantities.
Press [F1] to select AC. It is now set up as AC coupling. DC quantities of
the signal being tested will be intercepted. The waveform display is as
follows :
1
Figure 2-1 DC quantities of the signal are intercepted
Figure 2-2 Both DC and AC quantities of the signal are
displayed
AC coupling
setup
DC coupling
setup
26
DSO Series User Ma nual
Page 29
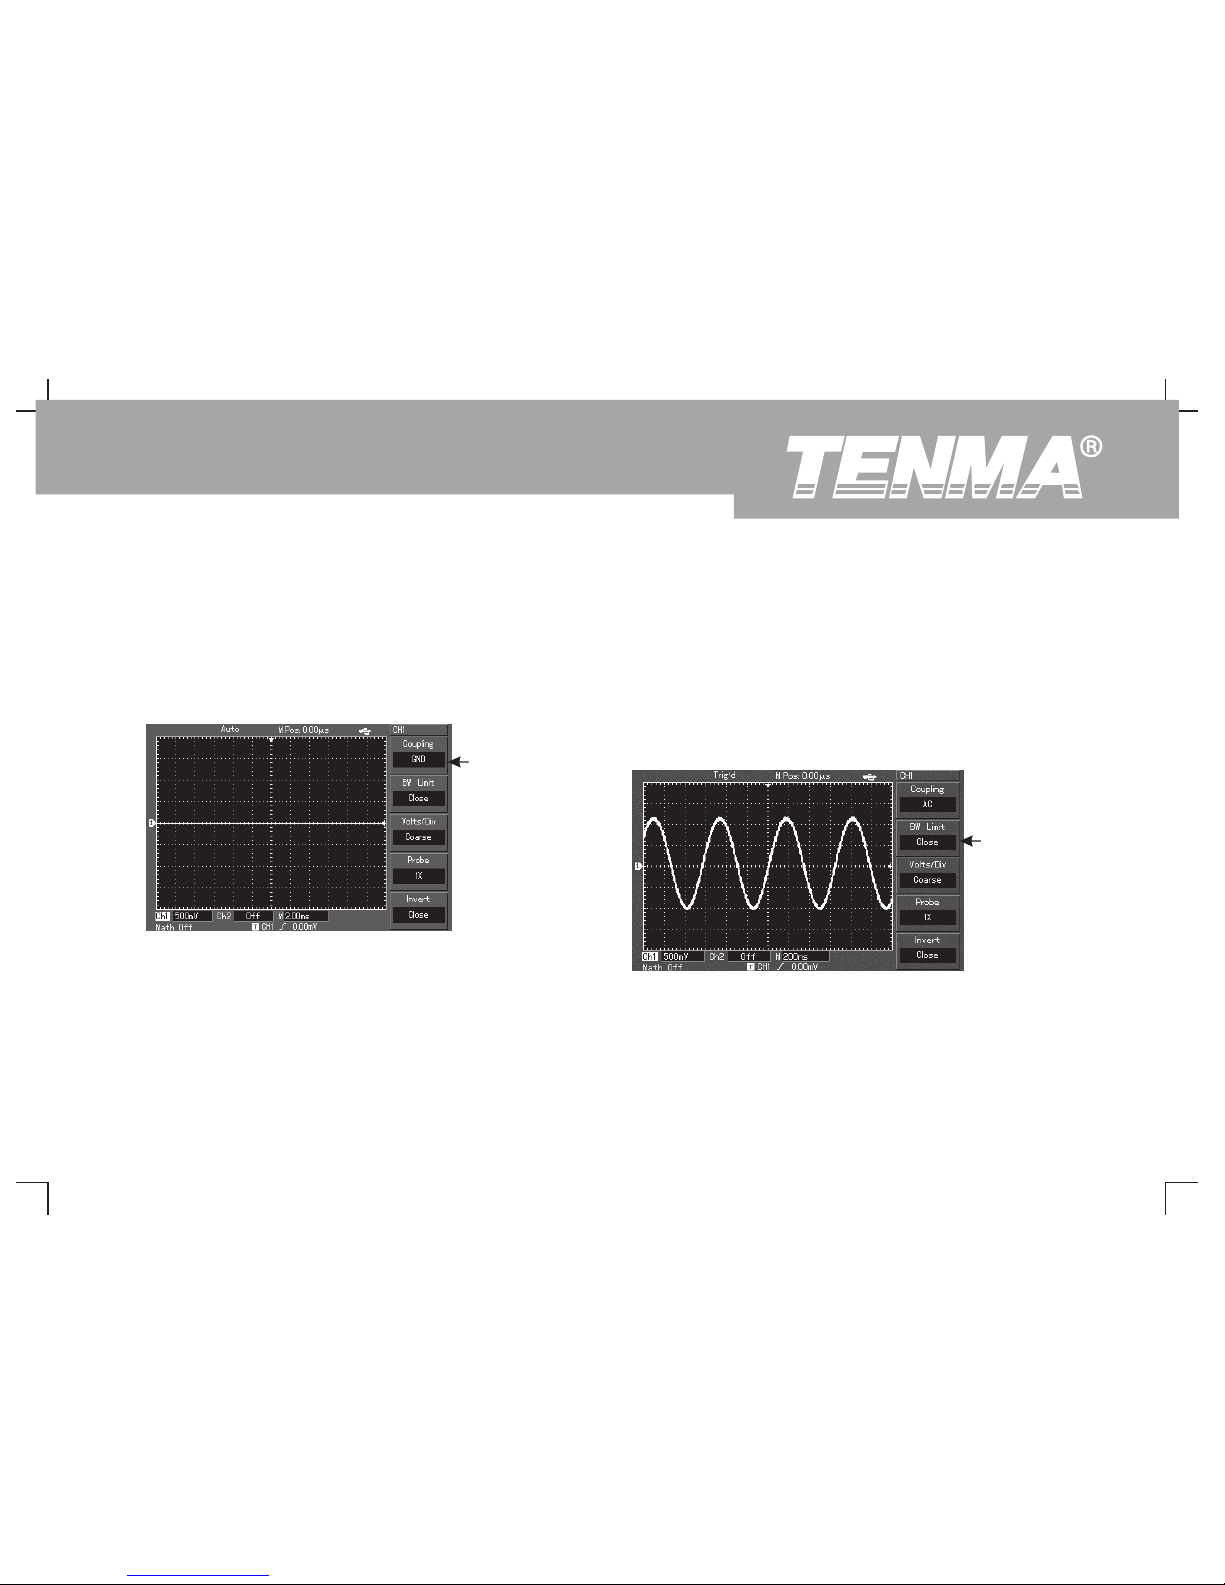
Press [F1] to select GROUND. It is now set up as ground. The display is
2. Setting channel bandwidth suppression :
as follows :
Bandwidth suppression can suppress high frequency quantities over
20MHz or noise in the signal being tested. Application is as follows :
(Note:in this mode, although waveform is not displayed, the
signal remains connected to the channel circuit)
Press [CH1] to turn CH1 on. Then press [F2] to set BANDWIDTH
SUPPRESSION OFF. It is now set up as full bandwidth. The signal
being measured can pass through even if it contains high frequency
quantities. The waveform display is as follows :
Figure 2-3 Screen display in ground mode
Fi gure 2-4 Wav eform di splay wh en
bandwidth suppression is off
Ground coupling
setup
Bandwidth
suppression off
27
DSO Series User Ma nual
Page 30
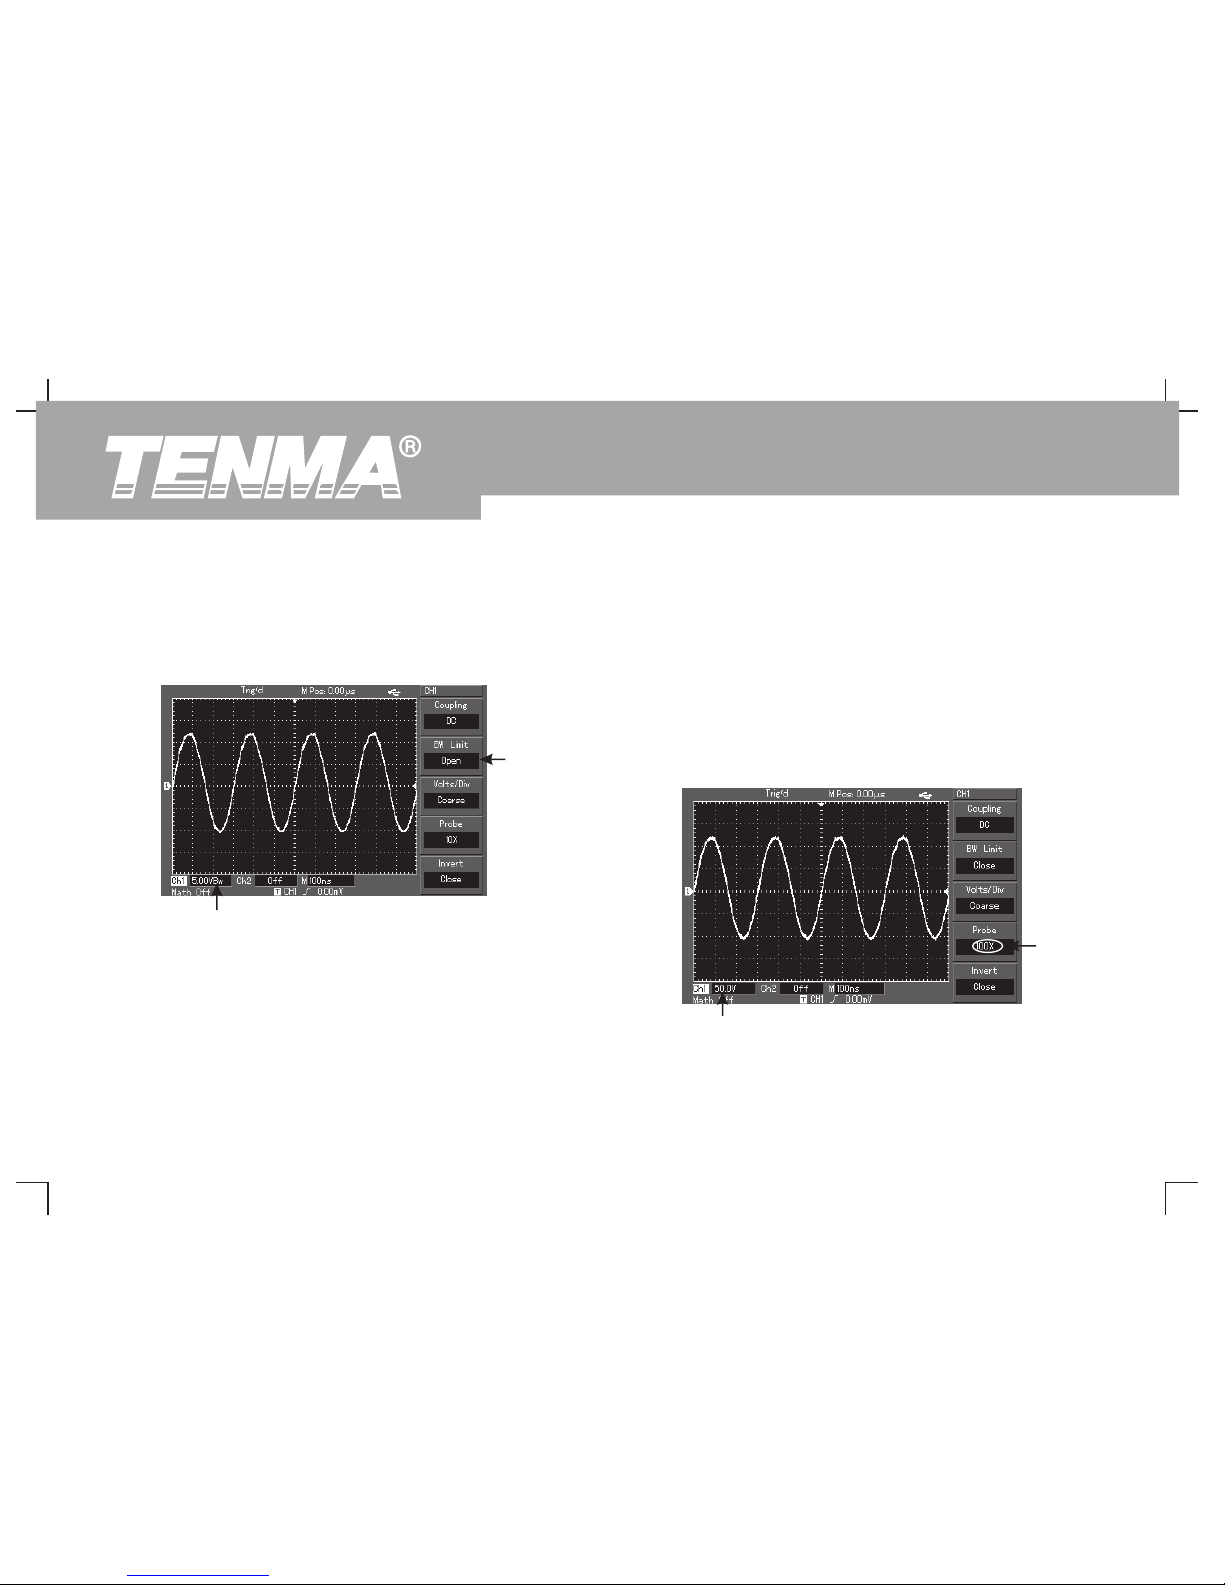
Press [F2] to set BANDWIDTH SUPPRESSION ON. All high frequency
3. Setting the probe rate :
quantities higher than 20MHz in the signal being tested will be limited.
To match the probe attenuation factor setup, it is necessary to set up the
The waveform display is as follows :
PROBE attenuation factor in the channel operation menu accordingly.
For example, when the probe attenuation factor is 10:1, set the probe
attenuation factor at 10X in the menu. Apply this principle to other
values to ensure the voltage reading is correct.
The figure below shows the setup and vertical range display when the
probe is set at 10:1.
Figure 2-5 Waveform display when bandwidth
suppression is on
Figure 2-6 Setting the probe attenuation factor in the
channel menu
Bandwidth
suppression
20MHz
Bandwidth suppression icon
Probe
attenuation
factor
Vertical range movement
28
DSO Series User Ma nual
Page 31
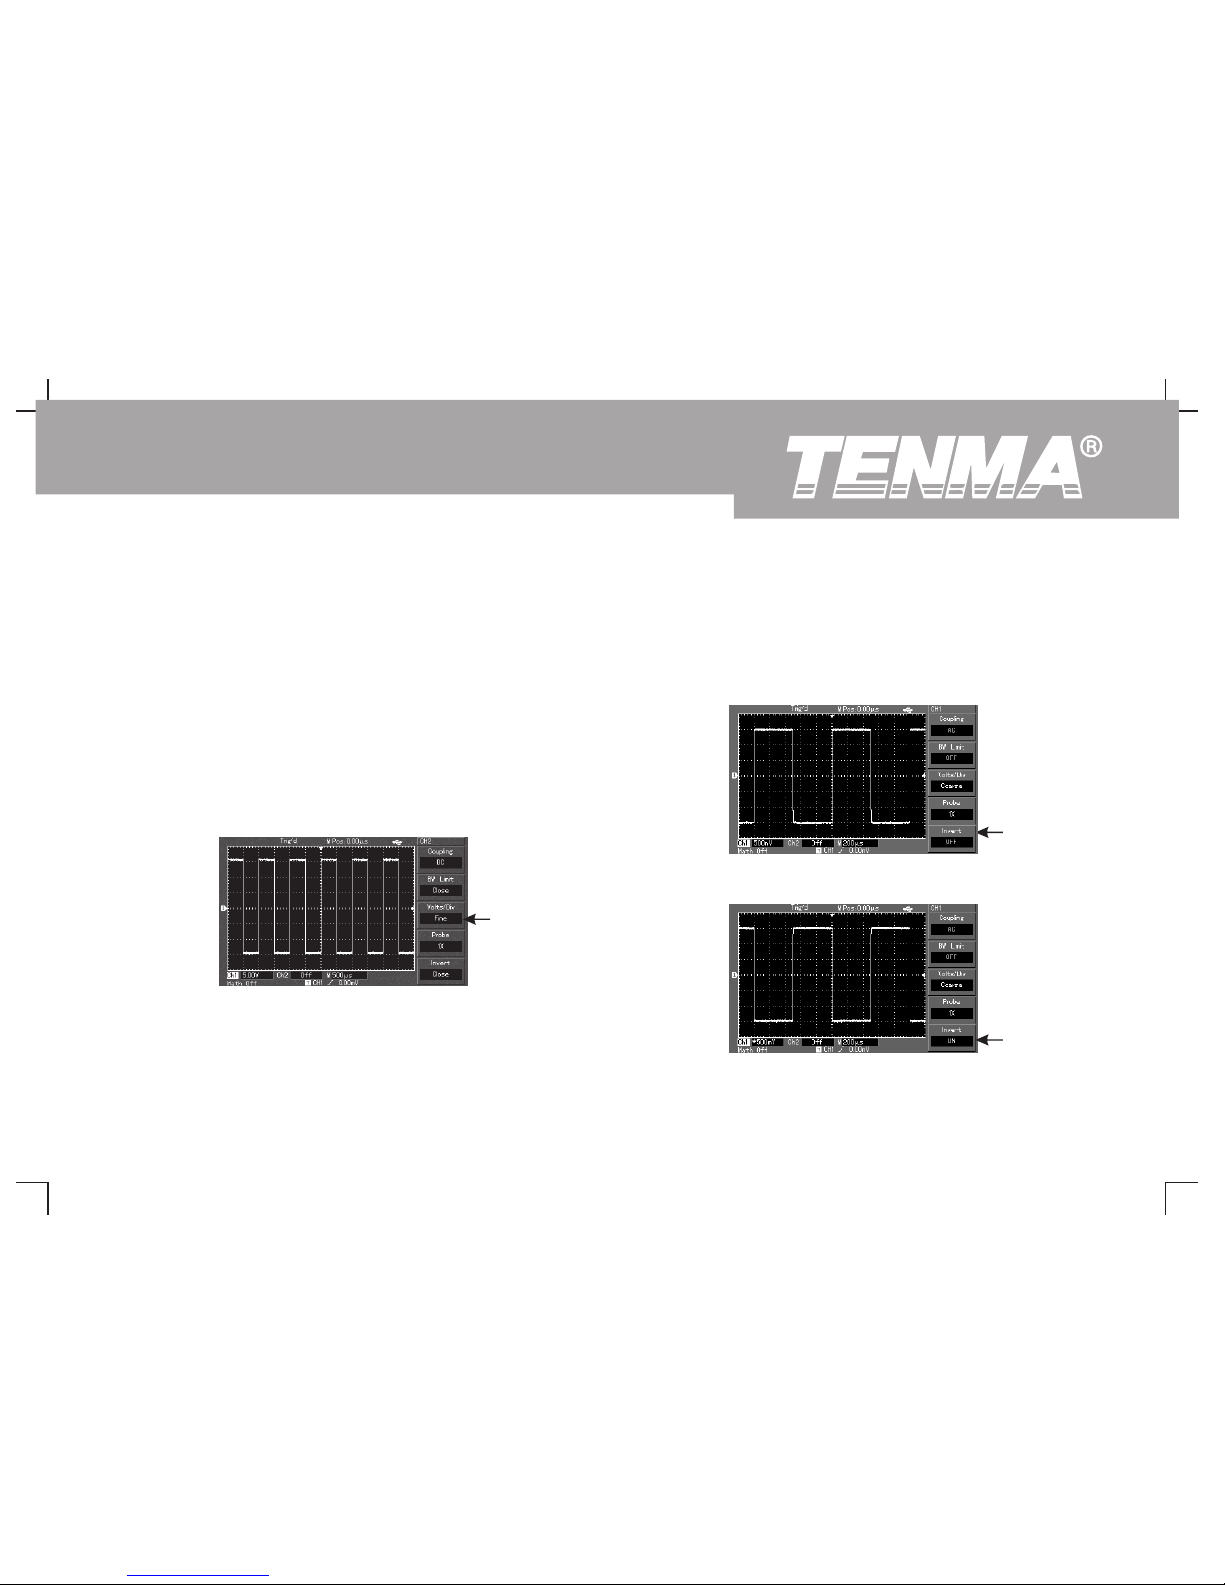
4. Vertical VOLTS/DIV adjustment setup :
You can adjust the VOLTS/DIV range of the vertical deflection factor
either in the coarse tune mode or fine tune mode. In COARSE TUNE
mode, the VOLTS/DIV range is 1mV/div~20V/div. Tuning is in steps of
1-2-5. In FINE TUNE mode, you can change the deflection factor
in even smaller steps within the current vertical range, so as to
continuously adjust the vertical deflection factor within the range of
1mV/div~20V/div without interruption.
5. Wavefor m inversion setu p
Wav ef or m i nv er si on : The dis pl ay ed signal is i nv er te d 1 80
degrees w it h r es pe ct to the ground le ve l. Fi gu re 2-8 shows the
no n -in v ert e d w ave f orm . F i gur e 2 -9 s how s t h e i nve r ted
waveform.
Figure 2-7 Coarse tuning and fine tuning
the vertical deflection factor
Fine tune
setup
29
Figure 2-8 Inversion setup for vertical channel (non-inverted)
Figure 2-9 Inversion setup for vertical channel (inverted)
non-inverted
inverted
DSO Series User Ma nual
Page 32
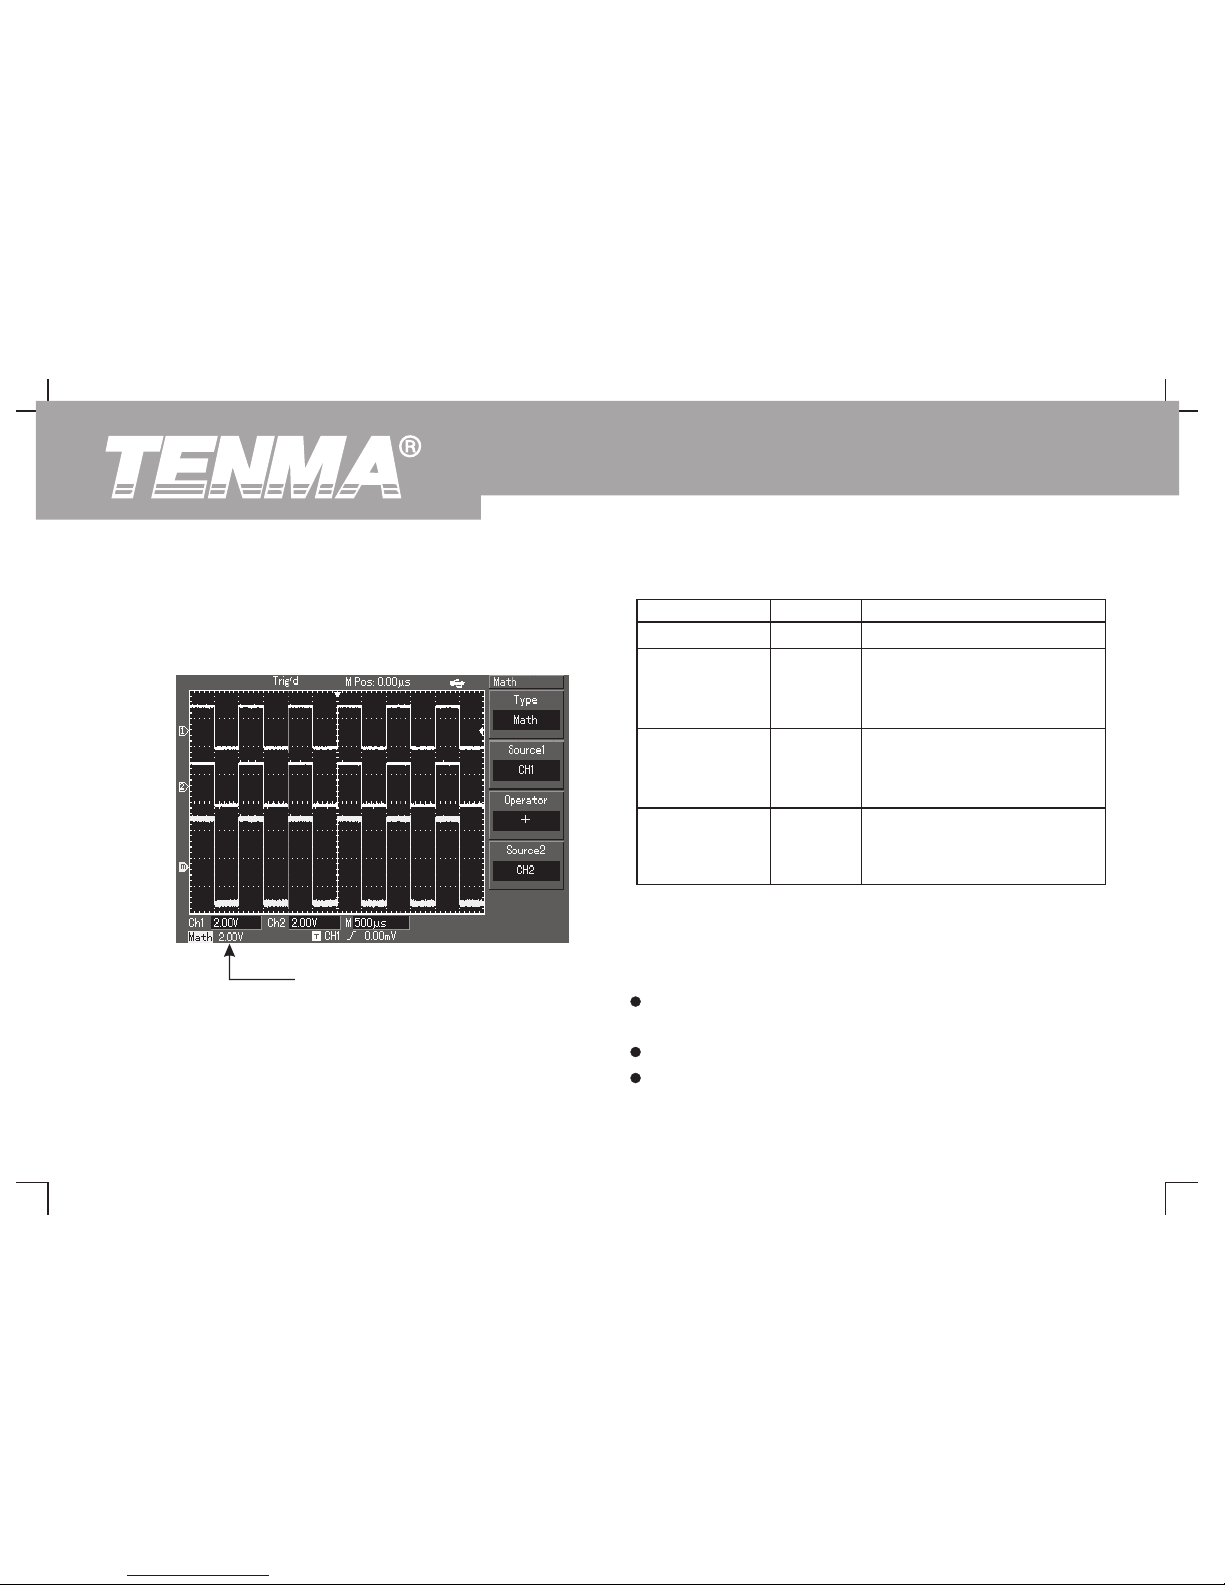
I. Operating Math Functions
Math functions are displays of +, -, × ,/ and FFT mathematical
results of CH1 and CH2 waveforms. The menu is as follows :
FFT spectrum analysis
By using the FFT (Fast Fourier Transform) algorithm, you can convert
time domain signals (YT) into frequency domain signals. With FFT, you
can conveniently observe the following types of signals :
:
Measure the harmonic wave composition and distortion of the
signal
Measure the noise characteristics of the DC power
Analyse oscillation
Figure 2-10 Math functions
Table 2-2 : Explanatory notes for the Math menu
Function Menu Setup Explanatory Note
Type Math To carry out +, -, ×,/ functions
Set signal source 1 as CH1
waveform
Set signal source 1 as CH2
waveform
Ch1
Ch2
Source 1
Operator
+
-
×
/
Signal source 1 + Signal source 2
Signal source 1 - Signal source 2
Signal source 1 x Signal source 2
Signal source 1 / Signal source 2
Set signal source 2 as CH1
waveform
Set signal source 2 as CH2
waveform
Ch1
Ch2
Source 2
Math range
30
DSO Series User Ma nual
Page 33
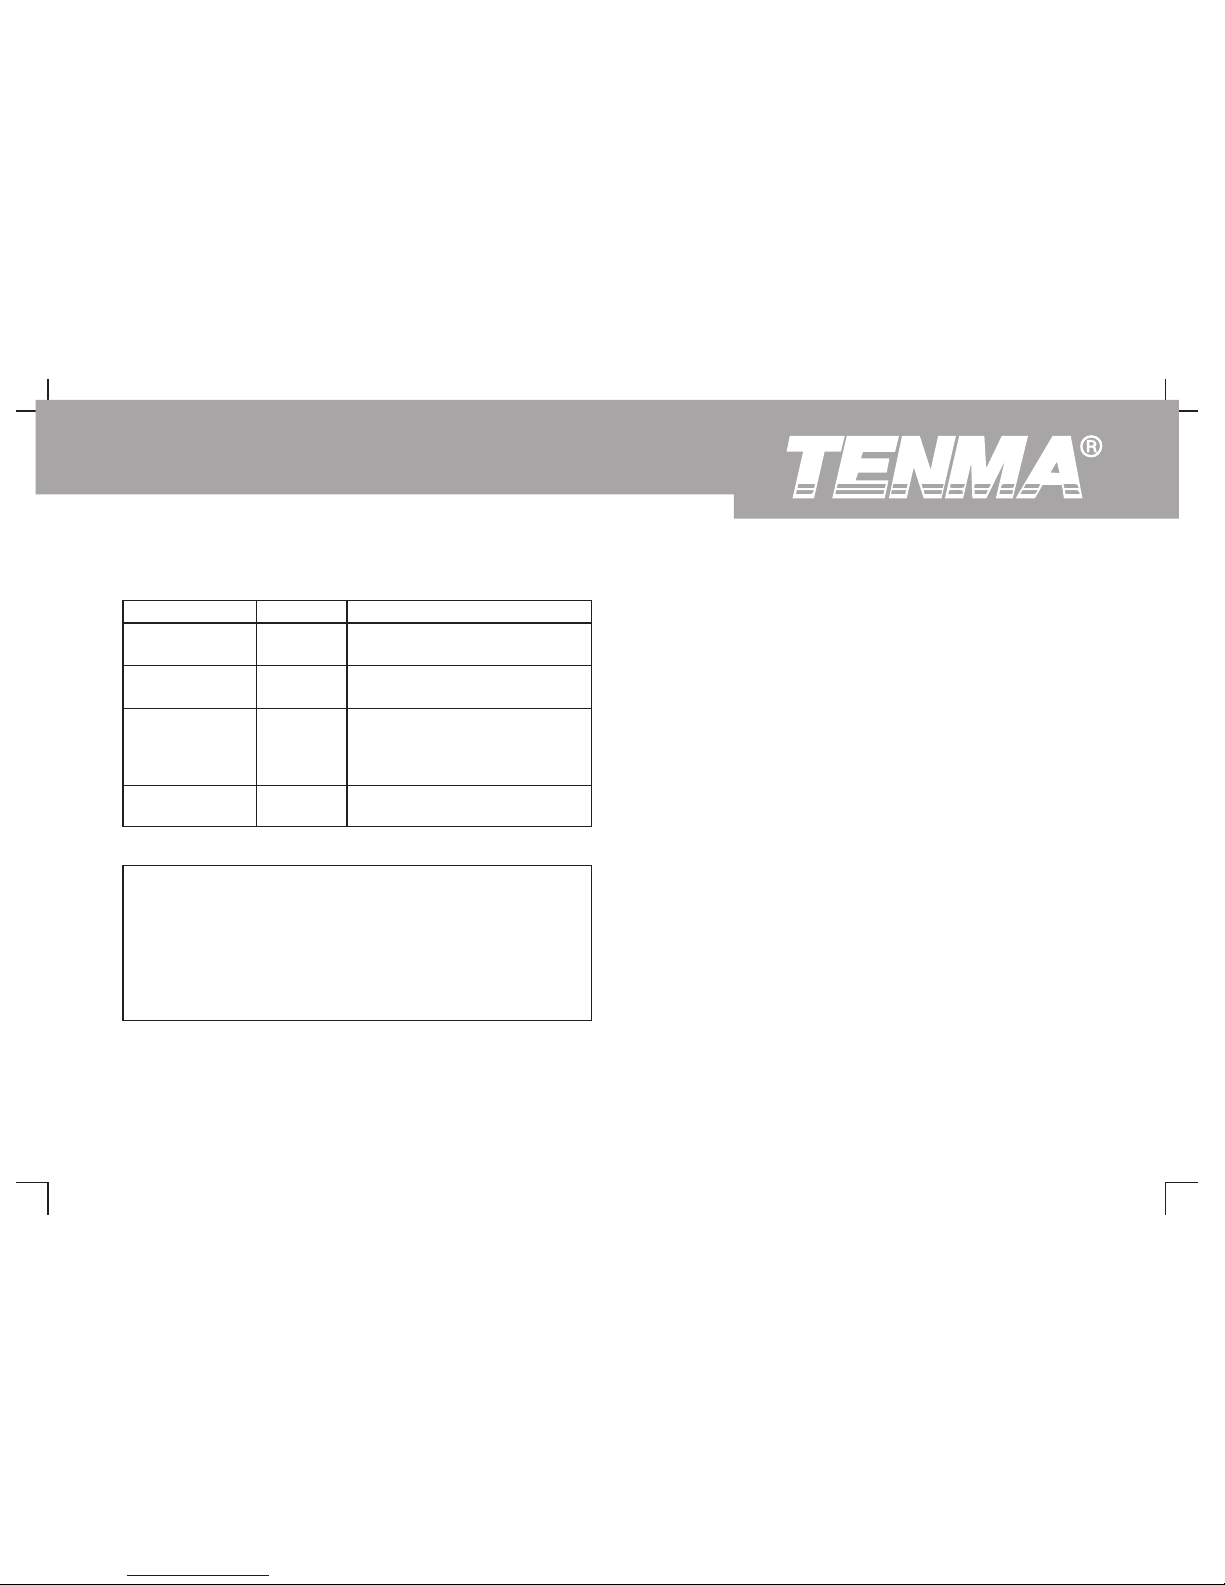
Select the FFT Window
Assuming the YT waveform is constantly repeating itself, the
oscilloscope will carry out FFT conversion of time record of a limited
length. When this cycle is a whole number, the YT waveform will have
the same amplitude at the start and finish. There is no waveform
interruption. However, if the YT waveform cycle is not a whole number,
there will be different amplitudes at the start and finish, resulting in
transient interruption of high frequency at the connection point. In
frequency domain, this is known as leakage. To avoid leakage, multiply
the original waveform by one window function to set the value to 0 for
start and finish compulsively. For application of the window function,
please see the table below :
Table 2-3 Explanatory notes for the FFT menu
Function Menu Setup Explanatory Note
Type FFT To carry o ut FF T algorithm
functions
Set CH1 as math waveform
Set CH2 as math waveform
Ch1
Ch2
Source
Window
Hanning
Hamming
Blackman
Rectangle
Set Hanning window function
Set Hamming window function
Set Blackman window function
Set Rectangle window function
Set the vertical unit to Vrms or
dBVrms
Vrms
dBVrms
Vertical
How to use FFT functions
Signals with DC quantities or DC offset will cause error or offset of
FFT waveform quantities. To reduce DC quantities, select AC
coupling. To reduce random noise and frequency aliasing resulted
by repeated or single pulse event, set the acquiring mode of your
oscilloscope to average acquisition.
31
DSO Series User Ma nual
Page 34
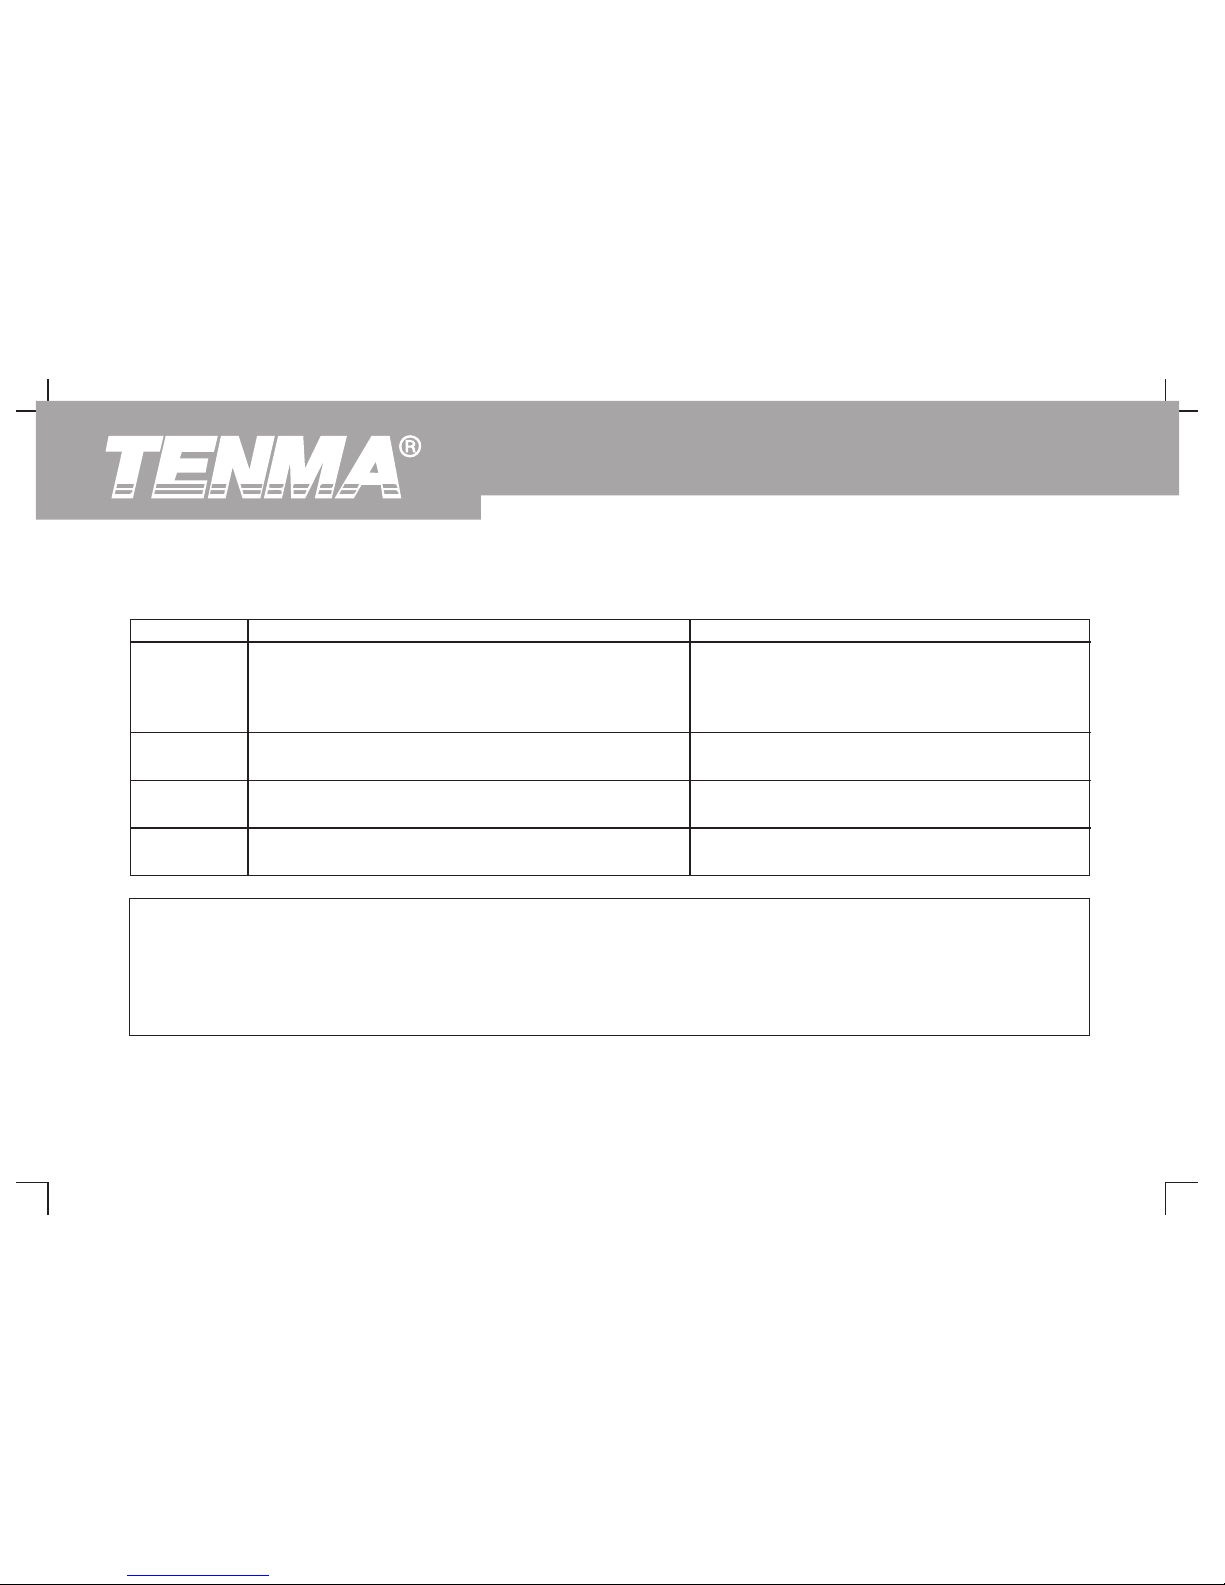
Table 2-4
FFT Window Feature Most Suitable Measurement Item
Rectangle
The best frequency recognition rate, the worst amplitude
recognition rate. Basically similar to a status without adding
window.y recognition rate, the worst amplitude recognition
rate. Basically similar to a status without adding window.
Temporary or fast pulse. Signal level is generally the
same before and after. Equal sine wave of very
similar frequency. There is broad-band random
noise with slow moving wave spectrum.
Sine, cyclical and narrow-band random noise.Frequency recognition rate is better than the rectangle
window, but amplitude recognition rate is poorer.
Hanning
Hamming
Frequency recognition rate is marginally better than Hanning
window.
Temporary or fast pulse. Signal level varies greatly
before and after.
Mainly for single-frequency signals to search for
higher-order harmonic wave.
The best amplitude recognition rate and the poorest
frequency recognition rate.
Blackman
Definition :
FTT recognition rate means the quotient of the sampling and math points. When math point value is fixed, the lower the sampling
rate the better FFT recognition rate you get.
Nyquist frequency : To rebuild the original waveform, at least 2f sampling rate should be used for waveform with a maximum
frequency of f. This is known as Nyquist stability criterion, where f is the Nyquist frequency and 2f is the Nyquist sampling rate.
32
DSO Series User Ma nual
Page 35
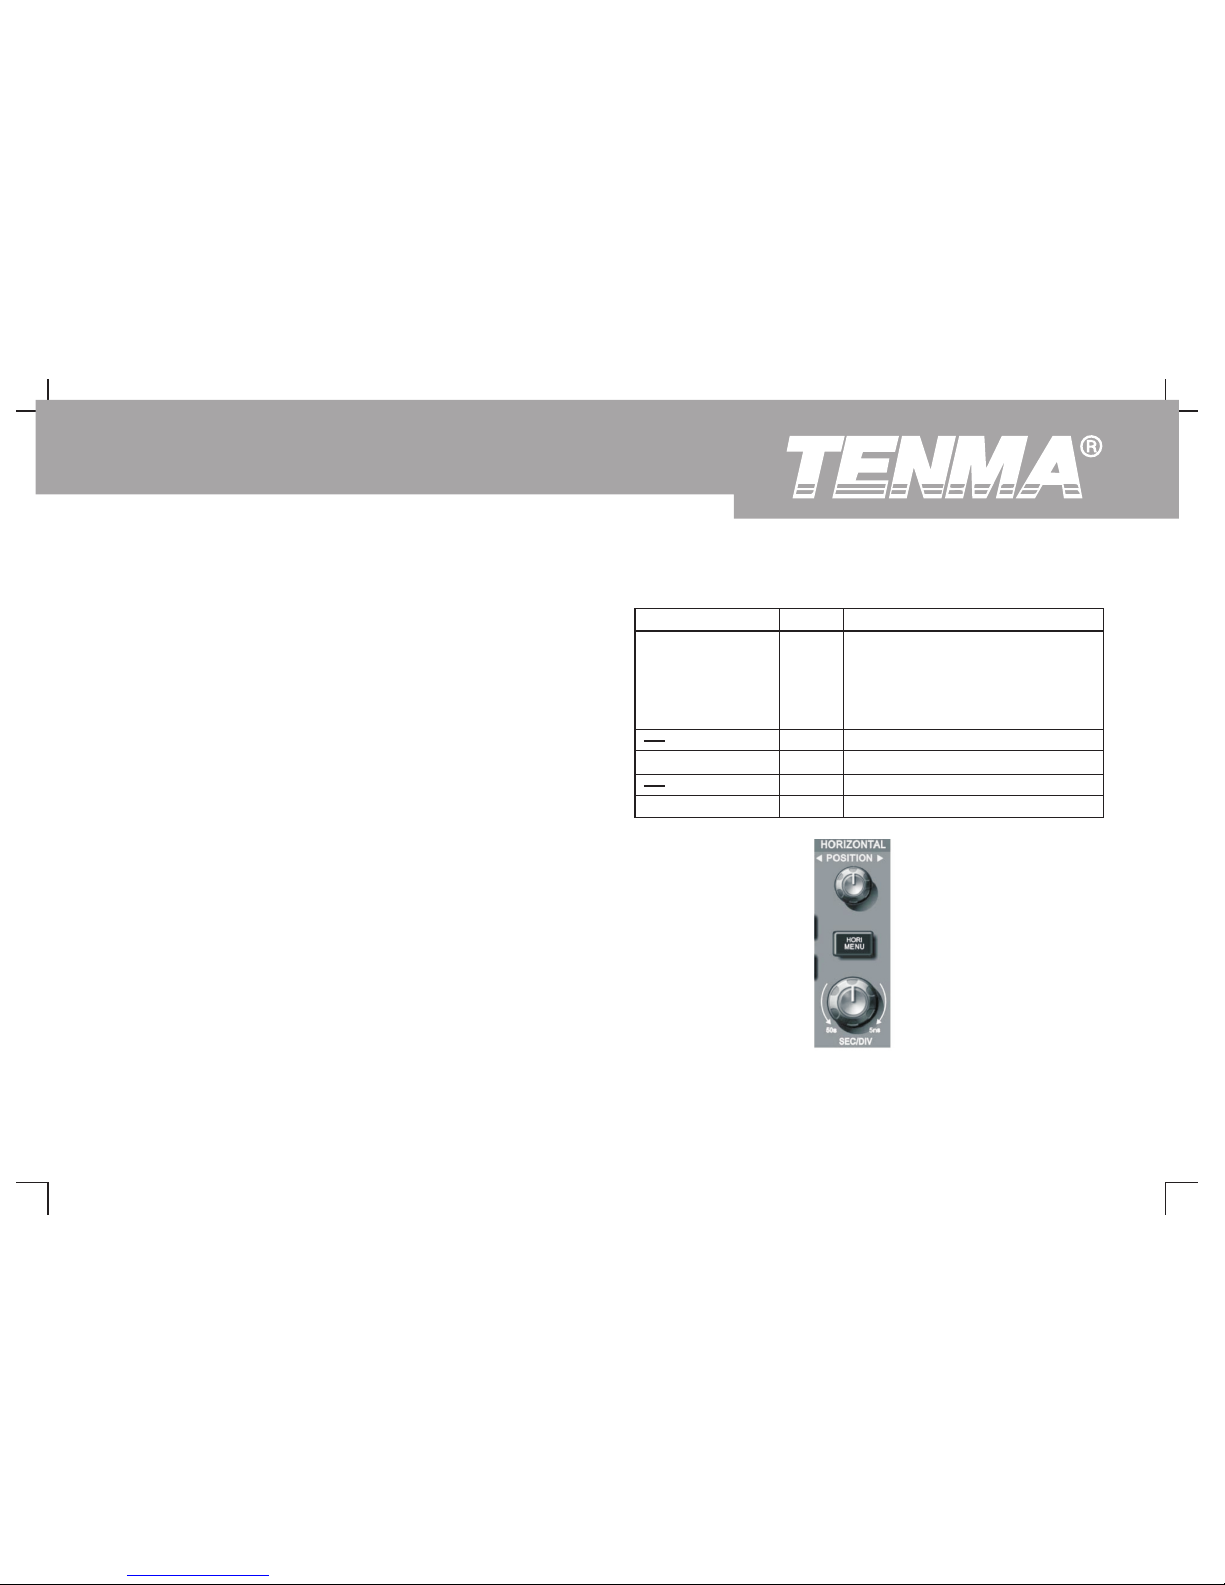
Setting the Horizontal System
The horizontal shift knob
You can move the waveform on the screen with the horizontal shift
knob. By turning it clockwise, you can shift the waveform to the left to
see more pre-trigger signals. Contrarily, turning it anticlockwise can
display more post-trigger signals.
Horizontal scaling : Adjust the main time base, i.e s/div. When time base
extension is on, you can use the horizontal scaling knob to change the
window width. For details see notes on time base extension.
Horizontal control knob menu : Display the horizontal menu (see the
table below).
Table 2-5
Function Menu Setup Explanatory Note
Main 1. Open the main time base.
2. If you press the main time base
when window
extension is on, window extension
will close.
Window Open time base extension.
Adjust holdoff time.Hold off
Figure 2-11 Horizontal system control zone
33
DSO Series User Ma nual
Page 36
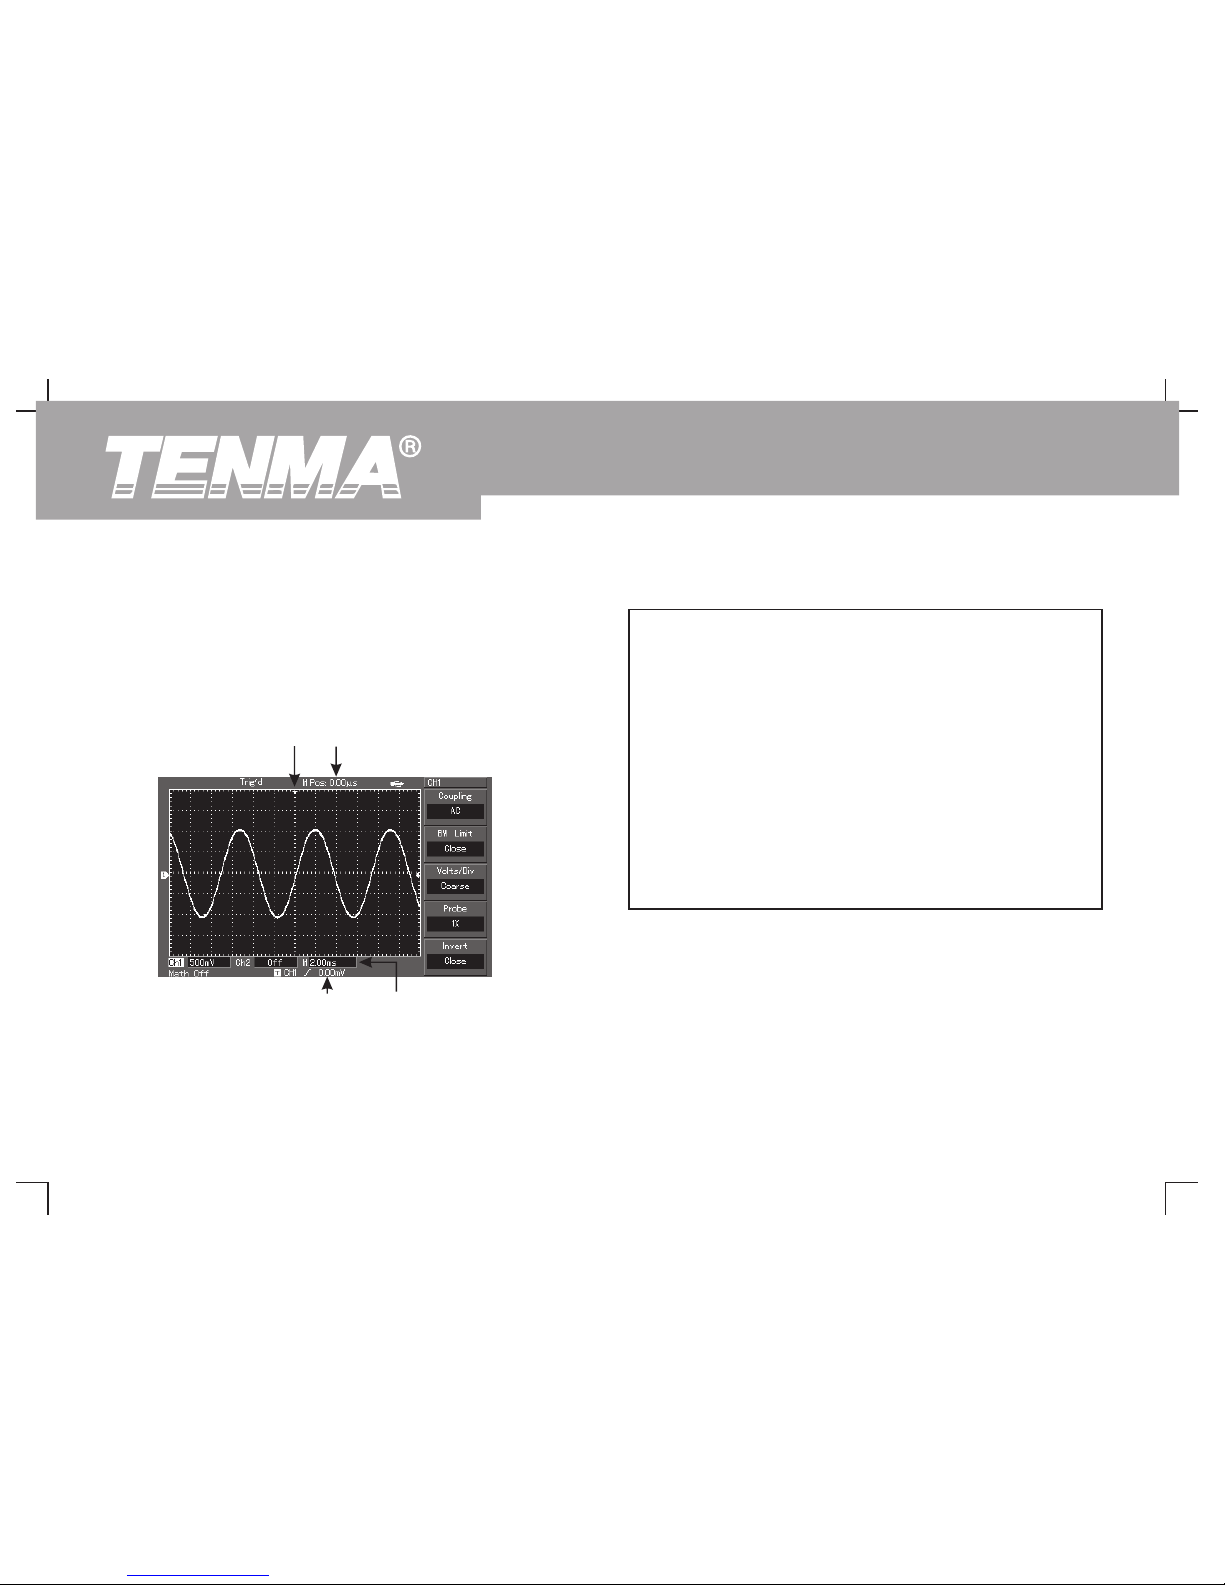
Icon definitions :
① The distance between the triggering position and horizontal
centre point (time).
② Represents the memory position of the triggering point.
③ Represents the trigger level of the current waveform.
④ Horizontal time base (main time base), i.e. s/div.
Window Extension
Window extension can be used to zoom in a band of waveform to check
image details. Please refer to Fig ur e 2- 13 .
Definitions
Y-T Mode : In this mode the Y axis indicates voltage and the X
axis indicates time.
X-Y Mode : In this mode the X axis indicates CH1 voltage and
the Y axis indicates CH2 voltage.
Slow Scanning Mode : When horizontal time base control is set
at 50ms/div or slower, the unit will operate in the slow scan
sampling mode. When observing low frequency signals in slow
scanning mode, it is advised to set the channel coupling as DC.
S/div : A horizontal scaling (time base) unit. If waveform
sampling is stopped (by pressing the [RUN/STOP] button),
time base control can expand or compress the waveform.
Figure 2-12 Display of horizontal parameters
③
①
②
④
34
DSO Series User Ma nual
Page 37
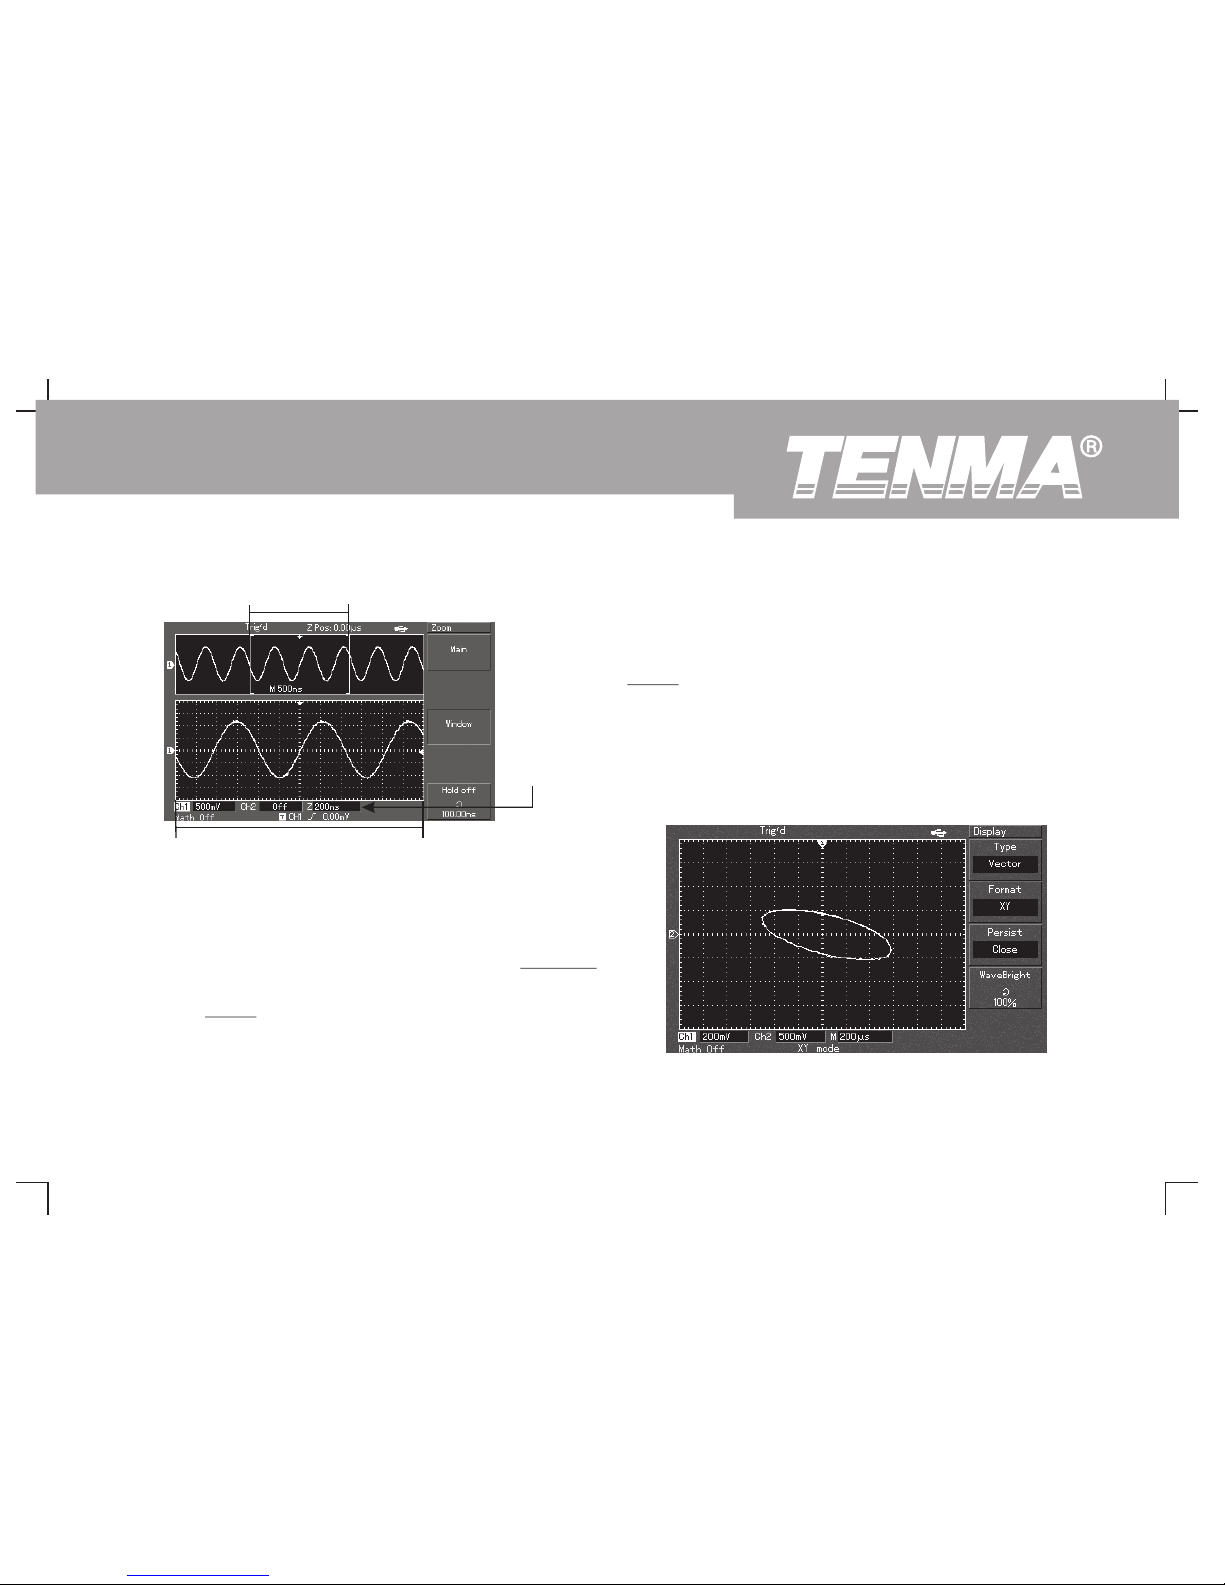
extended time base relative to the main time base is now higher (as
shown in the above figure). Since the waveform shown in the
entire lower part corresponds to the selected zone in the upper part,
you can increase the extended time base by turning the horizontal
SCALE knob to decrease the size of the selected zone. In other
words, you can increase the multiple of waveform extension.
X-Y Mode
This mode is suitable for CH1 and CH2 only. After selecting the X-Y
display mode, the horizontal axis will display CH1 voltage, while the
vertical axis will display CH2 voltage.
In the time base extension mode, the display is divided into two zones
as shown above. The upper part displays the original waveform. You
can move this zone left and right by turning the horizontal POSITION
knob, or increase and decrease the selected zone in size by turning
the horizontal SCALE knob.
The lower part is the horizontally extended waveform of the selected
original waveform zone. Please note that the recognition rate of
Figure 2-13 Display with the window extended
Figure 2-14 Waveform display in X-Y mod
Horizontal extension
of the waveform
Horizontally extended part of the waveform
Time base
extension
35
DSO Series User Ma nual
Page 38

Caution : In the normal X-Y mode, the oscilloscope can use the
random sampling rate to acquire waveforms. To adjust sampling rate
and channel vertical range in the X-Y mode and to adjust the time
range, the omitted sampling rate is 100MS/s. Generally, lowering the
sampling rate appropriately will result in lissajous figures of better
display quality. The following functions have different effects in the X-Y
display mode :
n Automatic measurement mode
n Cursor measurement mode
n Reference or math waveform
n Vector display type
n Horizontal MENU knob
n Trigger control
36
DSO Series User Ma nual
Page 39

[TRIG MENU] : Button for the trigger setup menu.
Setting the Trigger System
Trigger Control
Triggering decides when the oscilloscope collects data and display
Trigger modes : edge, pulse and alternate.
waveforms. Once the trigger is correctly set up, it can transform
Edge Trigger
unstable displays into meaningful waveforms. When beginning to
When the edge of the trigger signal reaches a given level, trigger
acquire data, the digital storage oscilloscope first collects sufficient
occurs.
data required for drawing a waveform on the left side of the trigger
point. While waiting for the trigger condition to mature, your
Pulse Width Trigger
oscilloscope will acquire data continuously. When trigger is
When the pulse width of the trigger signal reaches a preset trigger
detected, it will continue to acquire sufficient data to draw a
condition, trigger occurs.
waveform on the right side of the trigger point. The trigger control zone
Alternate Trigger
on the operation panel of your oscilloscope comprises a trigger level
Applicable to triggering signals without frequency coherence.
adjustment knob, a trigger menu button [TRIG MENU], the [SET TO
Below are notes for various trigger menus.
ZERO] button for setting the trigger level to the vertical centre point of
Edge Trigger
the signal, and a compulsory trigger button [FORCE].
Edge trigger means triggering at the trigger threshold of the input signal
Trigger level : Trigger level is set to a signal voltage that matches the
edge. When selecting “ edge trigger”, you are triggering at the
trigger point.
rising and falling edges of the input signal.
[SET TO ZERO]: Trigger level is set to the vertical centre point of
the signal.
[FORCE]: To generate a trigger signal compulsorily. This button is used
mainly in the trigger mode and “normal” and “single” mode.
37
DSO Series User Ma nual
Page 40
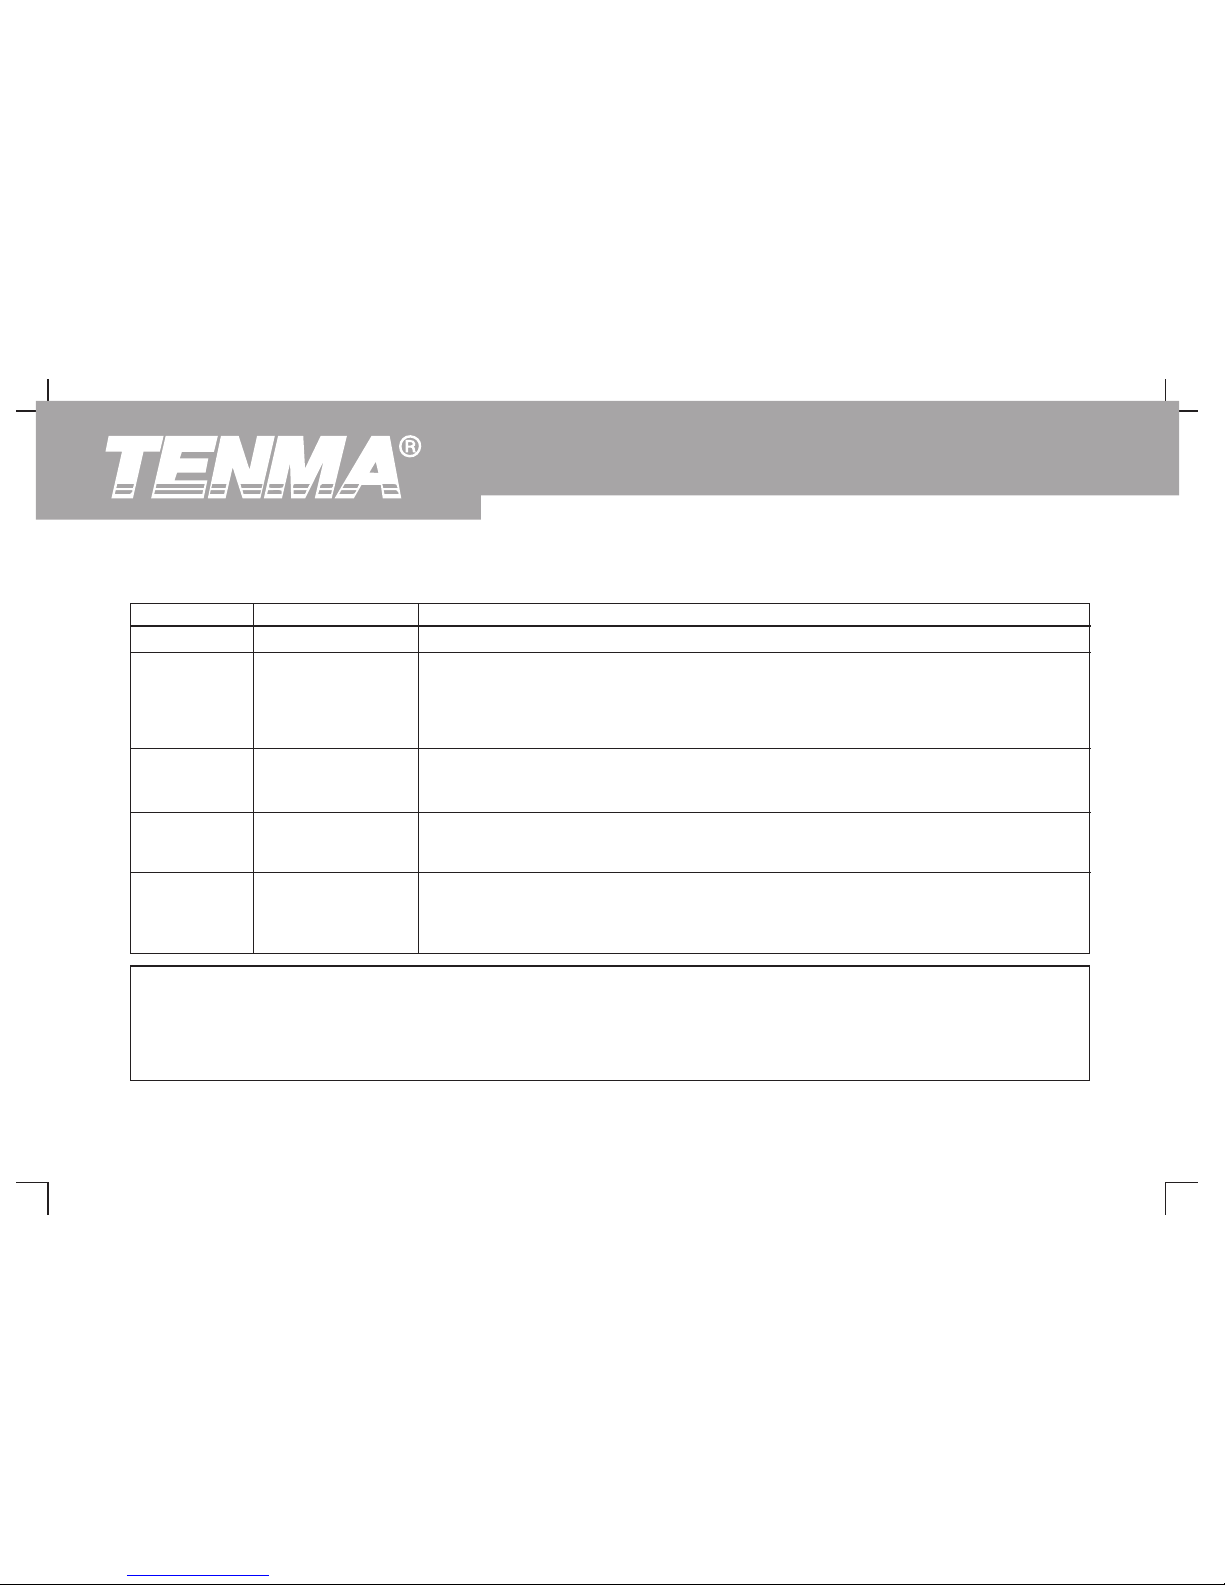
Table 2-6
FFT Window Feature Most Suitable Measurement Item
Type Edge
Set CH1 as the signal source trigger signal
Set CH2 as the signal source trigger signal
Set the external trigger input channel as the signal source trigger signal
Set up as grid trigger
Ch1, CH2 trigger their own signals alternately
CH1
C H2
EXT
AC Line
Alter
Source
Slope Rise
Fall
Rise & Fall
Set to trigger on the signal's rising edge
Set to trigger on the signal's falling edge
Set to trigger on the signal's rising and falling edges
Set to sample waveform only if no trigger condition is detected
Set to sampling waveform only when trigger condition is met
Set to sample waveform once when detecting one trigger and then stop
Auto
Normal
Single
Mode
Coupling
DC
AC
HF Reject
LF Re je ct
Allow AC and DC quantities of the input signal to pass
Intercept DC quantities of the input signal
Reject high frequency quantities above 80kHz of the signal
Reject low frequency quantities below 80kHz of the signal
Note :
With regard to edge and pulse width trigger, the oscilloscope will determine the trigger frequency based on the number of trigger
occurrences. When main frequency counter is on, display comes up at the top right corner. To maintain a stable trigger frequency,
a larger trigger signal range is required.
38
DSO Series User Ma nual
Page 41
Pulse Width Trigger
Pulse width trigger means determining the triggering time based on the
trigger width. You can acquire abnormal pulse by setting the pulse width
condition.
Table 2-7(P.1)
Function Menu Setup
Explanatory Note
Type Pulse
Set CH1 as the signal source trigger signal
Set CH2 as the signal source trigger signal
Set the external trigger input channel as the signal source trigger signal
Set up as grid trigger
CH1, CH2 trigger signals alternately
C H1
CH2
EXT
AC Line
Alter
Source
When
>
<
=
Trigger when pulse width is larger than default value
Trigger when pulse width is smaller than default value
Trigger when pulse width equals to default value
Set the pulse width at 20ns~10s and adjust by turning the multifunction
control knob on the upper front panel
20ns ~ 10s Setting
Next ½
Move to next page
39
DSO Series User Ma nual
Page 42
Table 2-8
Function Menu Setup
Explanatory Note
Type Pulse
Set positive pulse width as the trigger signal
Set negative pulse width as the trigger signal
Positive
Negative
Polarity
Mode
Auto
Normal
Single
The system automatically samples waveform data when there is no trigger signal input. The
scan baseline is shown on the display. When the trigger signal is generated, it automatically
turns to trigger scan
The system stops acquiring data when there is no trigger signal. When the trigger signal is
generated, trigger scan occurs
One trigger scan will occur when there is an input trigger signal. Then trigger will stop
Allow AC and DC quantities of the trigger signal to pass
Intercept DC quantities of the trigger signal
Intercept high frequency quantities of the signal, only allow low
frequency quantities to pass
Intercept low frequency quantities of the signal, only allow high
frequency quantities to pass
DC
AC
HF Reject
LF Re je ct
Coupling
Return to previous page
Next page2/2
40
DSO Series User Ma nual
Page 43
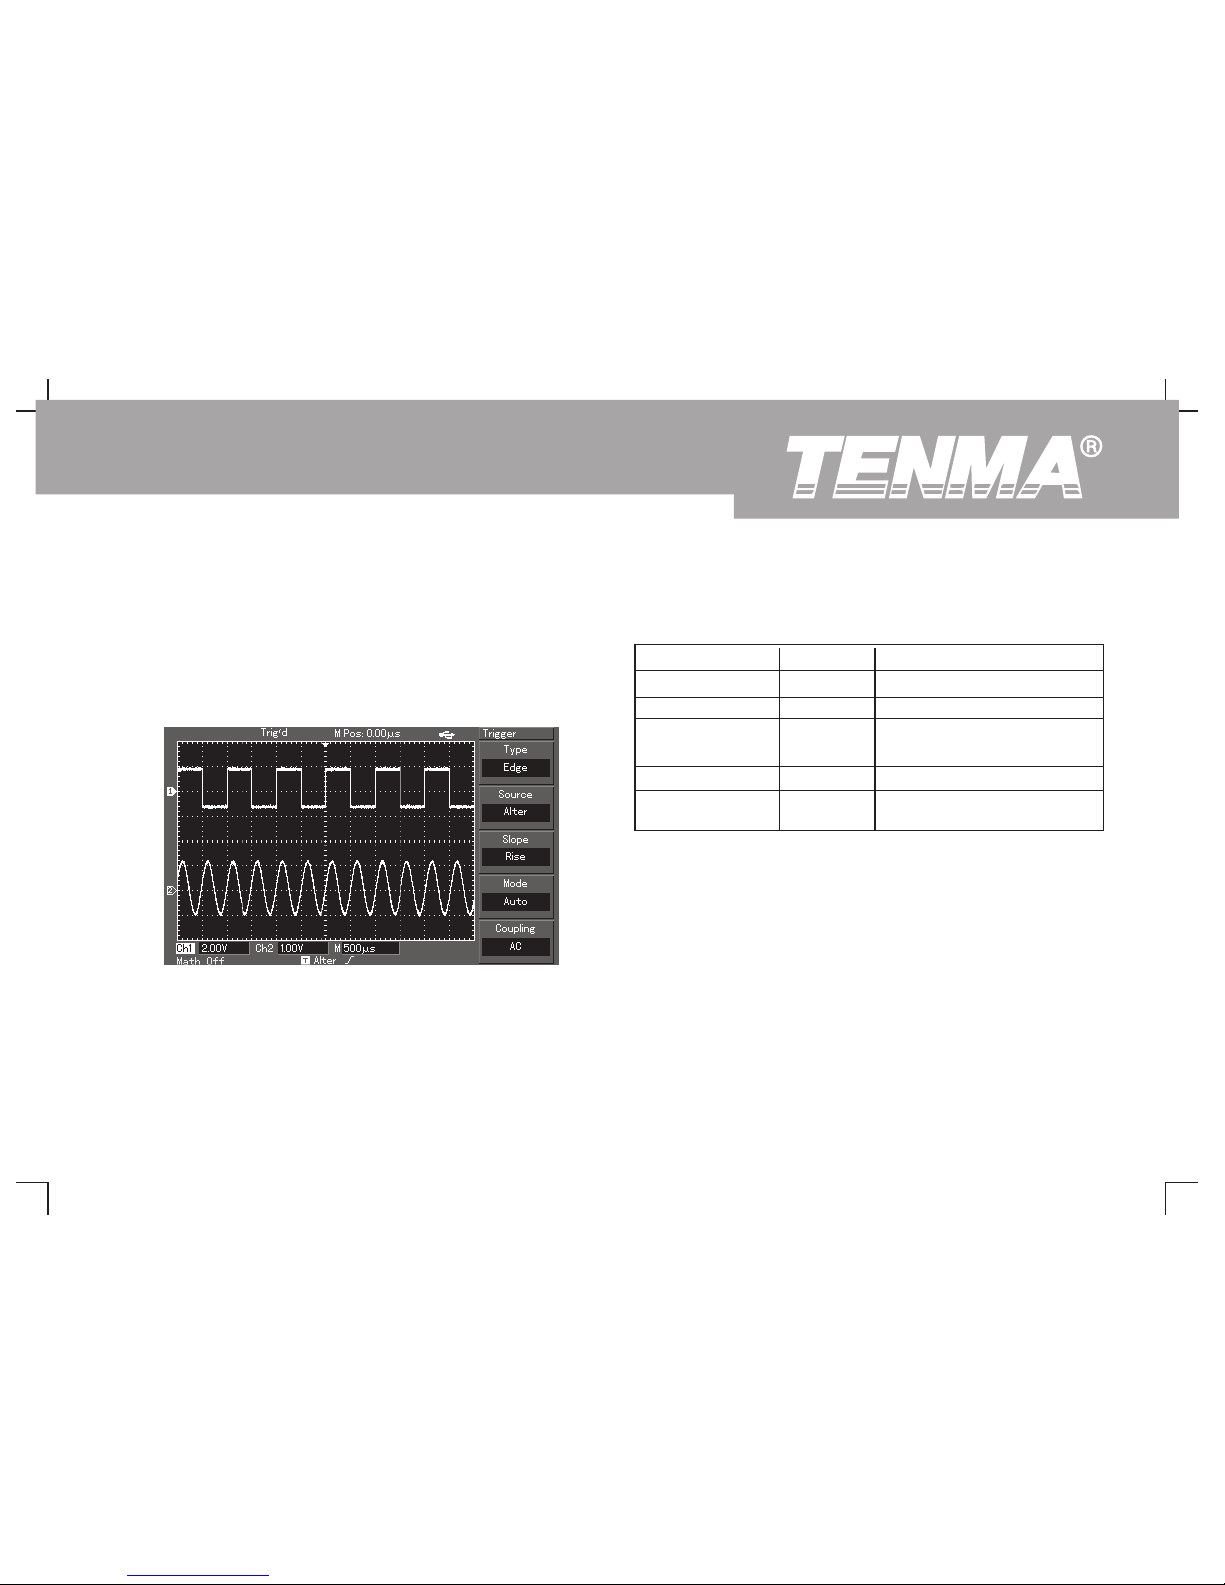
Alternate Trigger
When alternate trigger is selected, the trigger signal will be present in
two vertical channels. This triggering mode is suitable for observing two
signals of unrelated signal frequencies. The figure below shows the
alternate trigger waveform. Alternate trigger menu is listed in Table 2-9.
“Alterna te trigger” can also be used to compare pulse width
Figure 2-15 Observing two signals of different frequencies in the
alternate trigger mode
Table 2-9 Alternate trigger mode setup
Function Menu Setup Explanatory Note
Type Set trigger mode to edge
Source
Open time base extension.
Set trigger cou pl in g m od e
to AC
Coupling
Edge
Alter
Set trigger inclination as rising
edge
Inclination
Rise
Mode Auto
Set trigger mode to automatic
AC
41
DSO Series User Ma nual
Page 44
Setup for Trigger coupling mode Adjusting the Holdoff Time
Enter the trigger setup menu to set up the trigger coupling mode and
You can adjust the holdoff time to observe complicated waveforms (e.g.
achieve the most stable synchronization. The trigger coupling menu is
pulse string series). Holdoff time means the waiting time for the trigger
as follows :
circuit to be ready for use again when the oscilloscope is restarted.
During this time the oscilloscope will not trigger until the holdoff is
complete. For example, if you wish to trigger one group of pulse series at
the first pulse, set the holdoff time to the pulse string width as shown in
Figure 2-16. For holdoff menu please see the table below :
Function Menu Setup Explanatory Note
Main 1. Enable main time base
2. If window extension is enabled,
press main time base to disable
window extension
Window Enable time base extension
Adjust holdoff time.Hold off
FFT Window Feature Most Suitable Measurement Item
Type Edge
Set CH1 an C H2 to trigger alternate AlterSource
Slope Rise
Set trigger as rising edgelnclination
Set trigger mode to automaticAutoMode
Coupling
DC
AC
HF Reject
LF Re je ct
Intercept DC quantities to pass
Allow all quantities to pass
Intercept high frequency quantities
of the s ignal, only allow low
frequency quantities to pass
Intercept low frequency quantities
of the signal, only allow high
frequency quantities to pass
Table 2-10
Table 2-11
42
DSO Series User Ma nual
Page 45
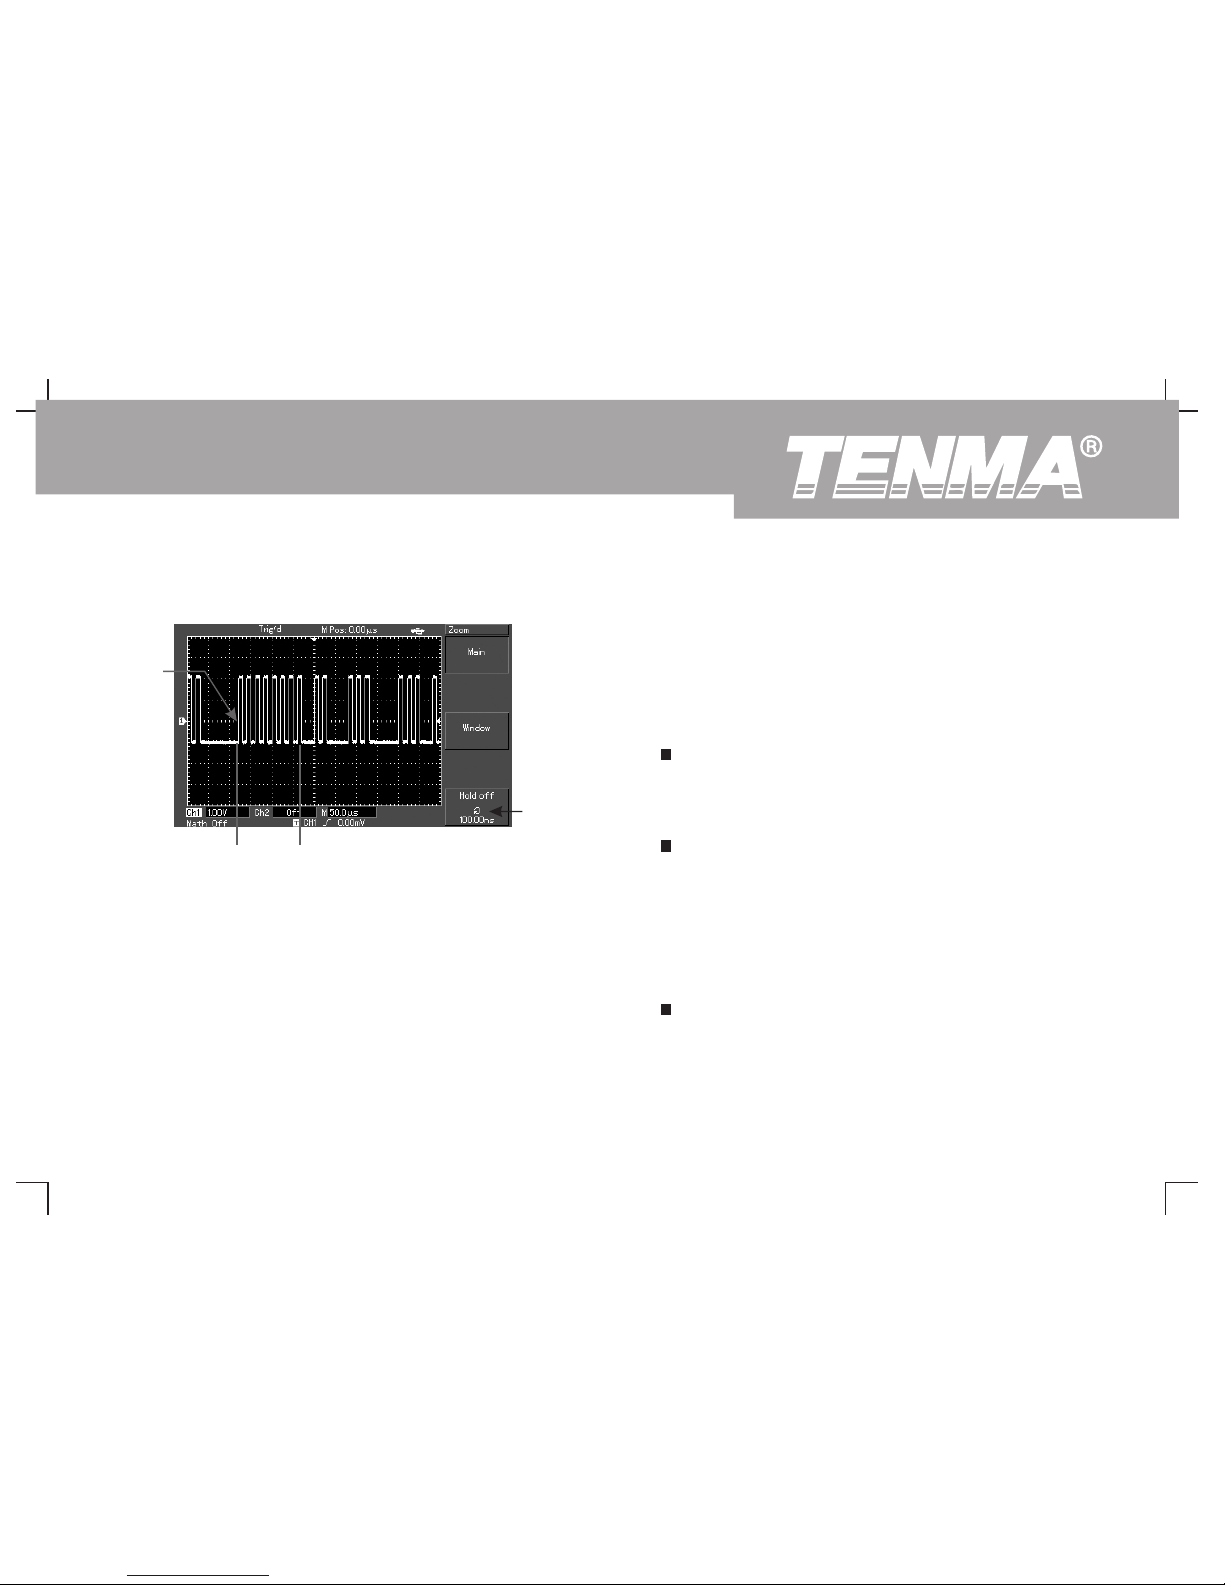
3. Adjust the multifunction control knob in the upper front panel.
The holdoff time will change accordingly until the waveform
display is stable.
Operation
1. Follow the normal signal synchronization procedure and select the
edge, trigger source and inclination in [TRIG MENU]. Adjust the
trigger level to make the waveform display as stable as possible.
2. Press the horizontal [HORI MENU] key to display the horizontal
menu.
Figure Use the holdoff function to synchronize
complicated waveforms
2-16
Definitions
1. Trigger source : Trigger can be obtained from various signal
sources : Input channel (CH1, Ch2), external trigger (EXT),
LINE.
n Input Channel : The most common trigger source is
vertical channel (choose either one). The channel
selected as trigger source can operate normally whether
the input is displayed or not.
n External Trigger : This type of trigger source can trigger in
a third channel while acquiring data in two other channels.
For example, you can use an external clock or the signal from
a circuit to be tested as the trigger source. EXT trigger source
uses external trigger signals from the EXT TRIG adaptor.
EXT can use the signals directly. You can use EXT within the
trigger level range of –3V and +3V.
n LINE : means the grid power source. This trigger mode is
suitable for observing signals related to the grid e.g. the
correlation between lighting equipment and power source
equipment to achieve stable synchronization.
Trigger
position
Holdoff
Holdoff
time
43
DSO Series User Ma nual
Page 46

3. Trigger coupling : Trigger coupling determines which
quantities of the signal are transmitted to the trigger circuit.
Coupling modes are DC, AC, low frequency suppression and
high frequency suppression.
n DC : Allowing all quantities to pass.
n AC : Intercepting DC quantities and attenuating signals
under 10Hz.
n Low Frequency Suppression : Intercepting DC
quantities and attenuating low frequency quantities under
80kHz.
n High Frequency Suppression : Attenuating high
frequency quantities over 80kHz.
4. Pretrigger/Delayed Trigger : Data sampled before/after
triggering.
The trigger position is typically set at the horizontal center of the
screen. In this case, you are able to view 6 divisions of
pretrigger and delayed information. Turning the horizontal
position of the waveform allows you to adjust the horizontal
displacement of the waveform. By observing pretrigger data,
you can see the waveform before trigger occurs. For example,
you can detect the glitch that occurs when the circuitry starts.
Observation and analysis of pretrigger data can help you identify
the cause of glitch.
2. Trigger mode : Determine the action of your oscilloscope at no
trigger. This oscilloscope offers three trigger modes for selection :
auto, normal and single.
Auto Trigger : The system will acquire waveform data
automatically when there is no trigger signal input. The
scan baseline is shown on the display. When the trigger
signal is generated, it automatically turns to trigger scan
for signal synchronization.
Note : When time base of the scan range is set to 50ms/div or
slower, the “Auto” mode allows no trigger signal.
n Normal Trigger : In this mode, your oscilloscope samples
waveforms only when triggering conditions are met. The
system stops acquiring data and waits when there is no
trigger signal. When the trigger signal is generated, trigger
scan occurs.
n Single Trigger : In this mode, you only have to press the
“ Run” button once and the oscilloscope will wait for
trigger. One sampling will occur and the acquired
waveform will be displayed when the digital storage
oscilloscope detects a trigger. Then trigger will stop.
3. Trigger coupling : Trigger coupling determines which
quantities of the signal are transmitted to the trigger circuit.
Coupling modes are DC, AC, low frequency suppression and
high frequency suppression.
44
DSO Series User Ma nual
Page 47
Setting the Sampling System
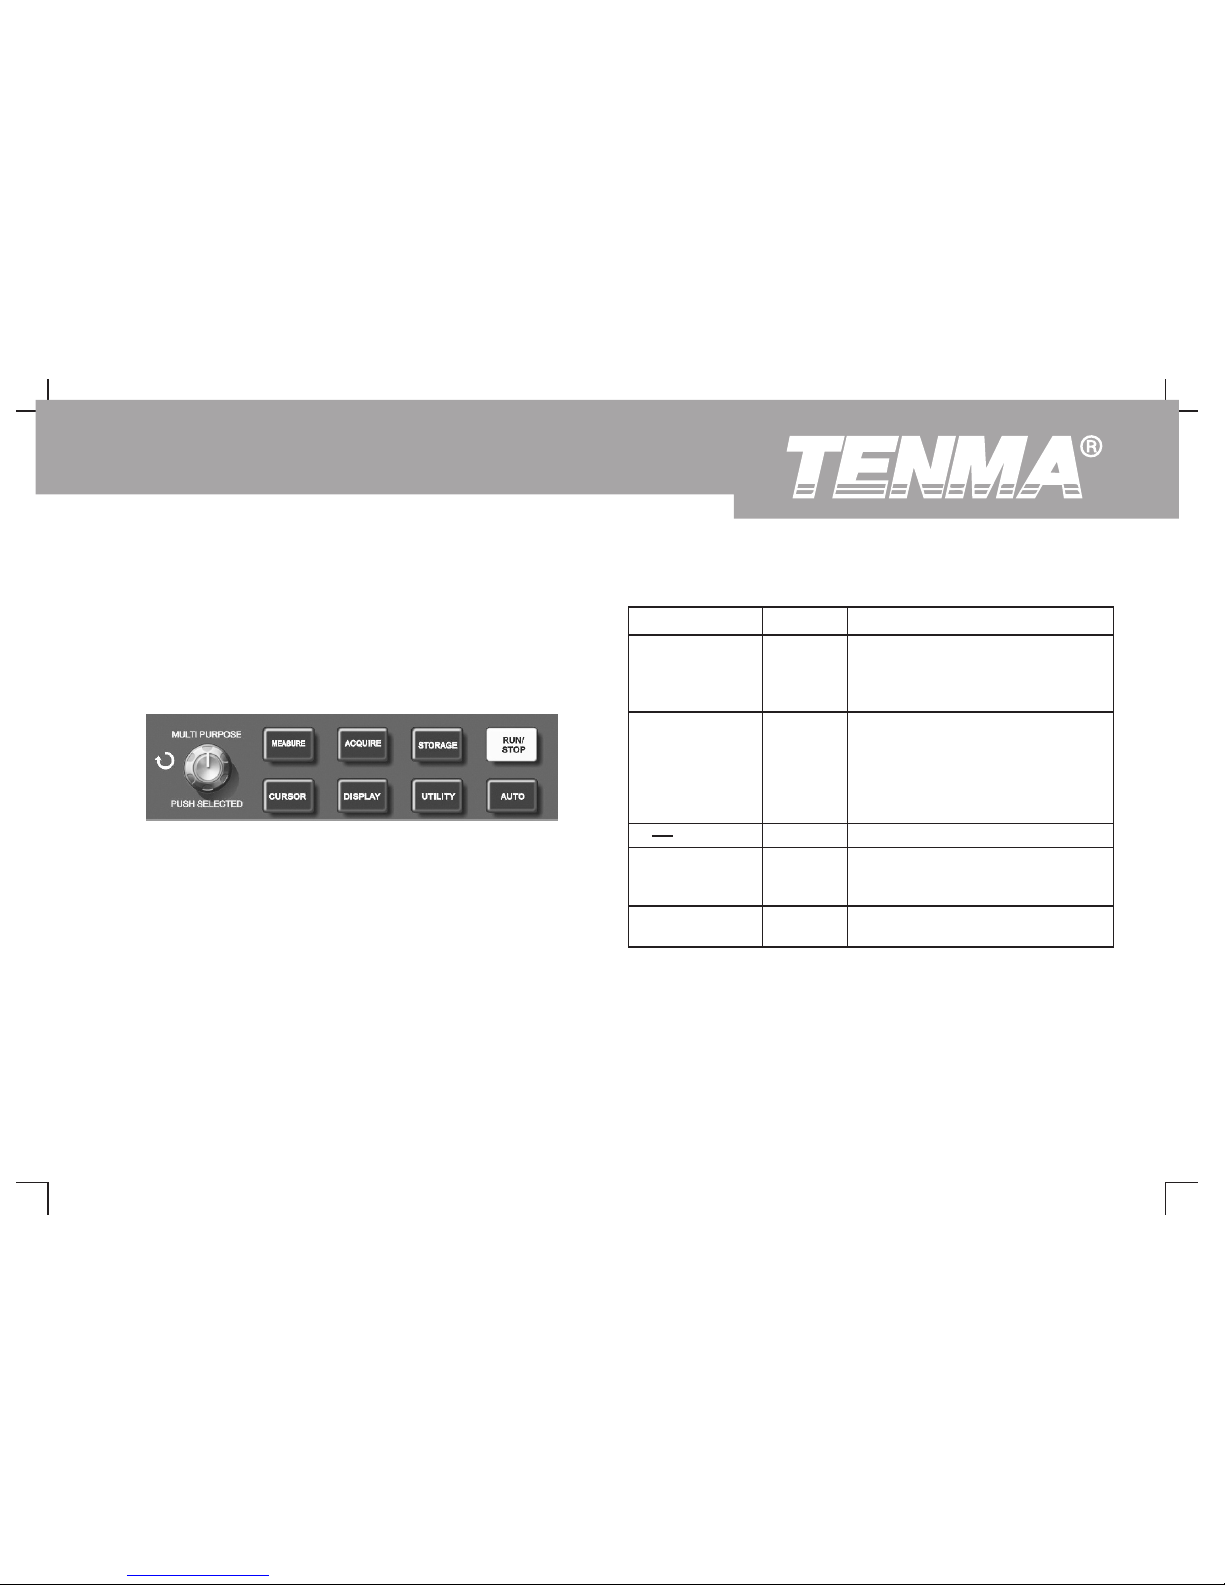
As shown below, [ACQUIRE] button in the control zone is the
function key for the sampling system.
Press the [ACQUIRE] button to pop out the sampling setup menu. You
can use this menu to adjust the sampling mode.
Figure 2-17 Function key for the sampling system
Function Menu Setup Explanatory Note
Mode
Turn on the ordinary sampling mode
Turn on the peak detect mode
Set to average sampling and display
the average number of times
Sampling
ON
OFF
Quick acquisition function is on
Quick acquisition function is off
FastACQ
Table 2- 12 Sampling menu
Sample
Peak
Average
Average
2~256
Set the average number of times in
multiples of 2, i.e. 2, 4, 8, 16, 32, 64,
128, 256. To change the average
n u m be r o f t im es , u se t h e
multifunction control knob on the
left of Figure 2-16
Real time
Equ-time
Set sampling to real time sampling
Set samp l i n g t o e q u i valent
sampling
45
DSO Series User Ma nual
Page 48
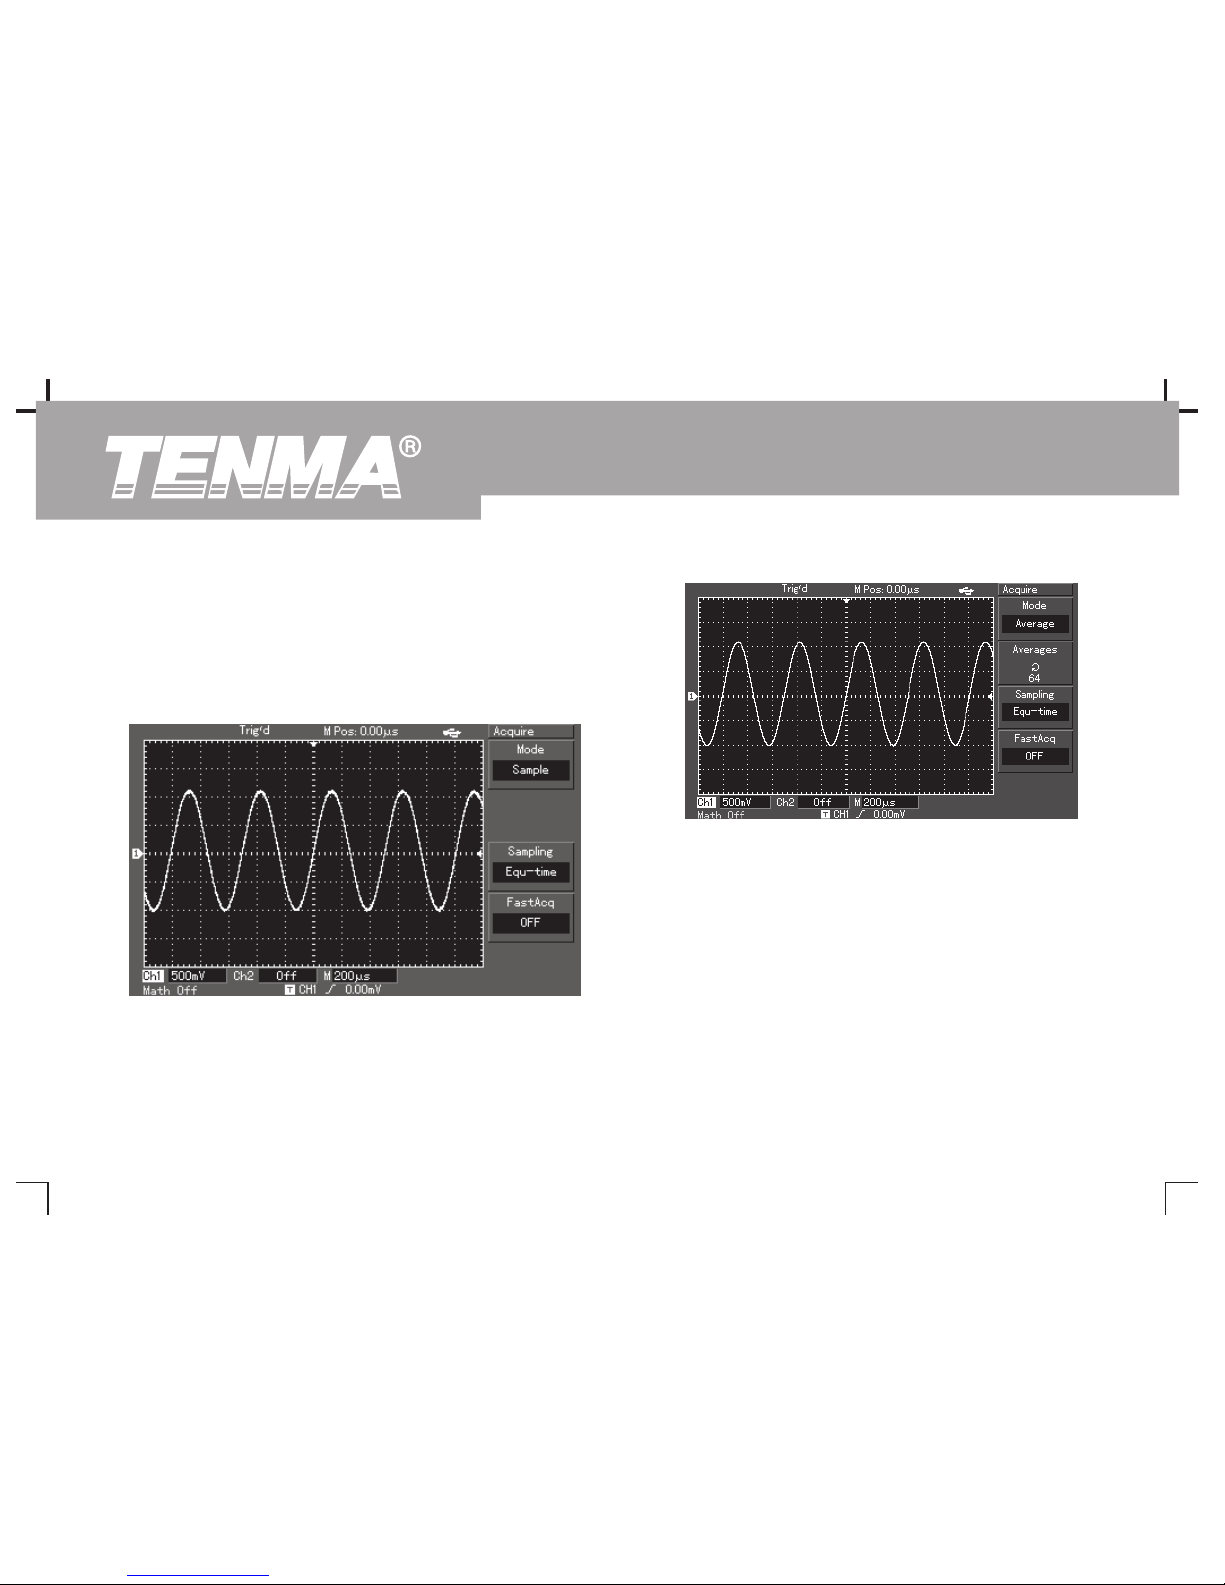
By changing the acquisition setup, you can observe the consequent
changes in waveform display. If the signal contains considerable noise,
you will see the following displays when average sampling is not
selected and when 64-time average sampling is selected. For sampling
waveform display please see Figure 2-18 and Figure 2-19.
Notes :
1. Use Real time sampling to observe single signals.
2. Use Equivalent sampling to observe high frequency cyclical
signals.
3. To avoid mixed envelop when observing a signal, select Peak
Detect. To reduce random noise of the displayed signal, select
average sampling and increase the average number of times in
multiples of 2, i.e selecting from 2 to 2 .56
Figure 2-18 Waveform without average sampling
Figure 2-19 Waveform when 64-time average
sampling is selected
46
DSO Series User Ma nual
Page 49
Setting the Display System
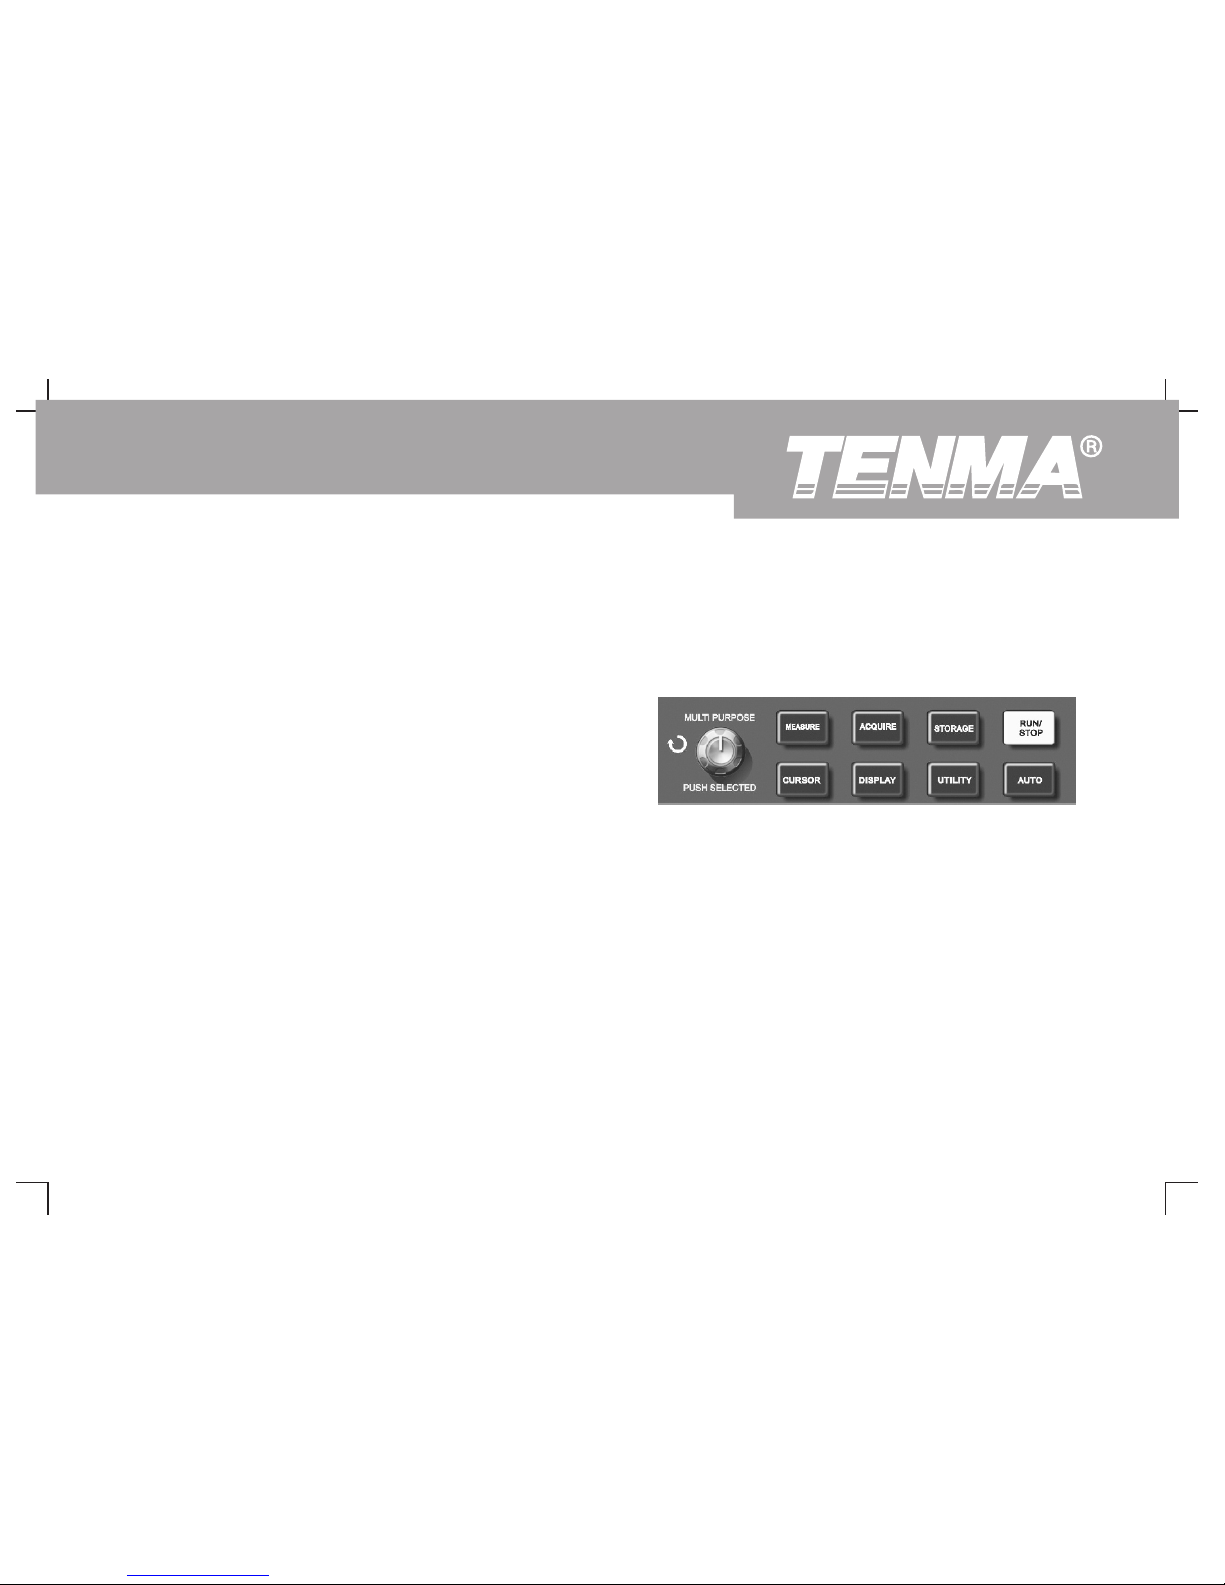
As shown below, the [DISPLAY] button in the control zone is the
function key for the display system.
Press the [DISPLAY] button to pop out the setup menu shown below.
You can use this menu to adjust the display mode.
Figure 2-20 Function key for the sampling system (display)
Definitions :
Real time sampling : In this mode, the system makes full
acquisition to fill the memory. Maximum real time sampling rate is
1GS/s. At a setting of 50ns or faster, the oscilloscope will automatically
carry out interpolation, i.e. inserting a sampling point between other
sampling points.
Equivalent sampling : This is a repeated sampling mode that allows
detailed observation of repeated cyclical signals. In the equivalent
sampling mode, the horizontal pixel aspect ratio is 40ps higher than
the real time mode, i.e. 25GS/s equivalent.
Sampling mode : Your oscilloscope acquires signal samples at
equal time intervals to reconstruct waveform.
Peak detect mode : In this acquisition mode, the oscilloscope
identifies the biggest and smallest values of the input signals at
each sampling interval and use these values to display the
waveform. In effect, the oscilloscope can acquire and display narrow
pulse which would otherwise be omitted in the sampling mode. Noise
seems to be more significant in this mode.
Average mode : The oscilloscope acquires several waveforms and
take the average value to display the final waveform. You can use
this mode to reduce random noise.
47
DSO Series User Ma nual
Page 50
Storage and Recall
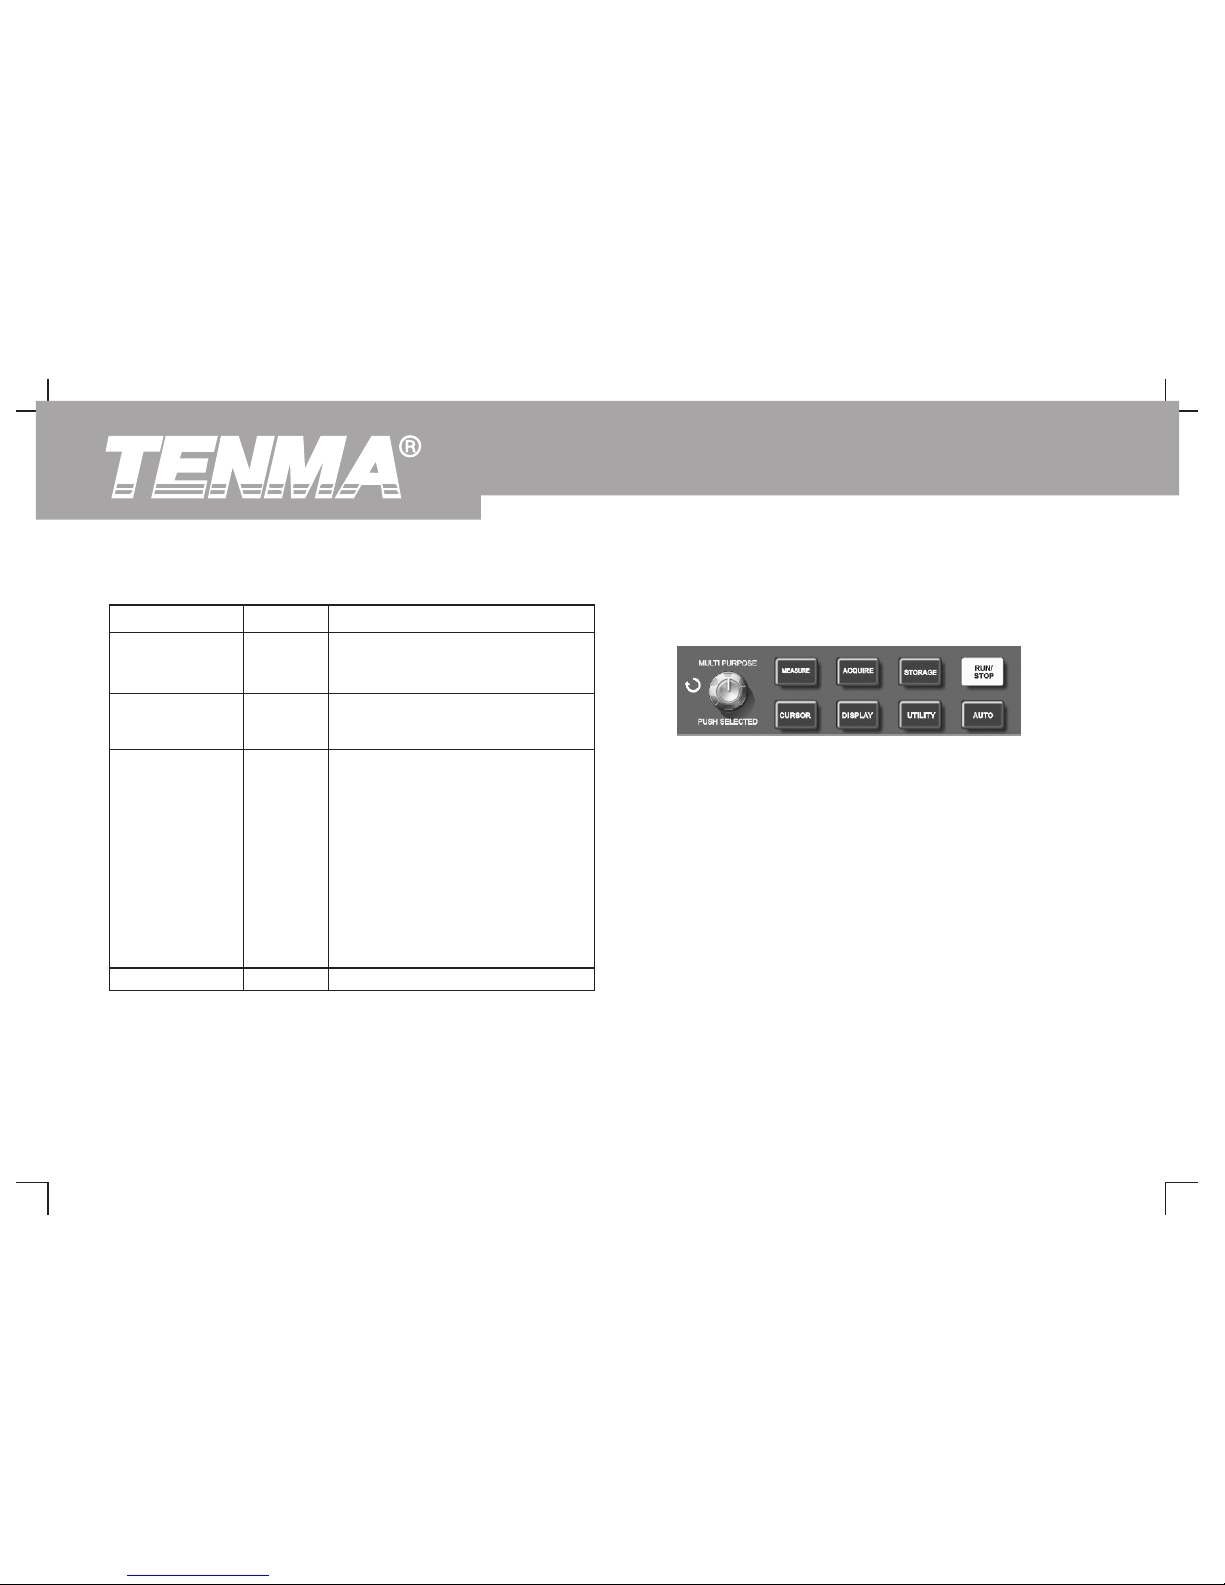
As shown below, the [STORAGE] button in the MENU control zone is
the function key for the storage system.
Press the [STORAGE] button to display the storage setup menu. You
can use this menu to save waveforms or setup status of the
oscilloscope in the internal memory or the USB device, and recall any
stored waveform through RefA (or RefB), or press [STORAGE] to recall
the setup status. When the USB device is inserted, you can store the
oscilloscope's waveform display in bitmap format on the USB device
under the DSO directory. The bitmap can be read in a PC.
Operation steps :
Press [STORAGE] to go to the type menu. There are three types to
choose from : waveform, setup and bitmap.
Key points :
1. Select waveform to go to the waveform storage menu shown
Display Type : Vector dots fill the space between adjacent sample
below (see Figure 2-16). A stored waveform can be recalled with
points in the display. Dots display only the sampling points.
the call back function under waveform storage.
Figure 2-21 Function key for the sampling system (storage)
Function Menu Setup Explanatory Note
Type
Sampling points are linked for
display
Only sampling points are displayed
Persist
1%-100%
Setting the waveform brightness
WaveformBright
Table 2-13 Display menu
Vector
Format
YT
XY
Operating mode of the oscilloscope
X-Y is the display mode; CH is X
input, CH2 is Y input
1
Close
1s
2s
5s
Infinite
The waveform on the screen is
refreshed at a fast rate;
The waveform on the screen is
refreshed at 1s;
The waveform on the screen is
refreshed at 2s;
The waveform on the screen is
refreshed at a 5s;
The original waveform on the
screen remains on display. New
data will be added continuously
until this function is disabled.
48
DSO Series User Ma nual
Page 51
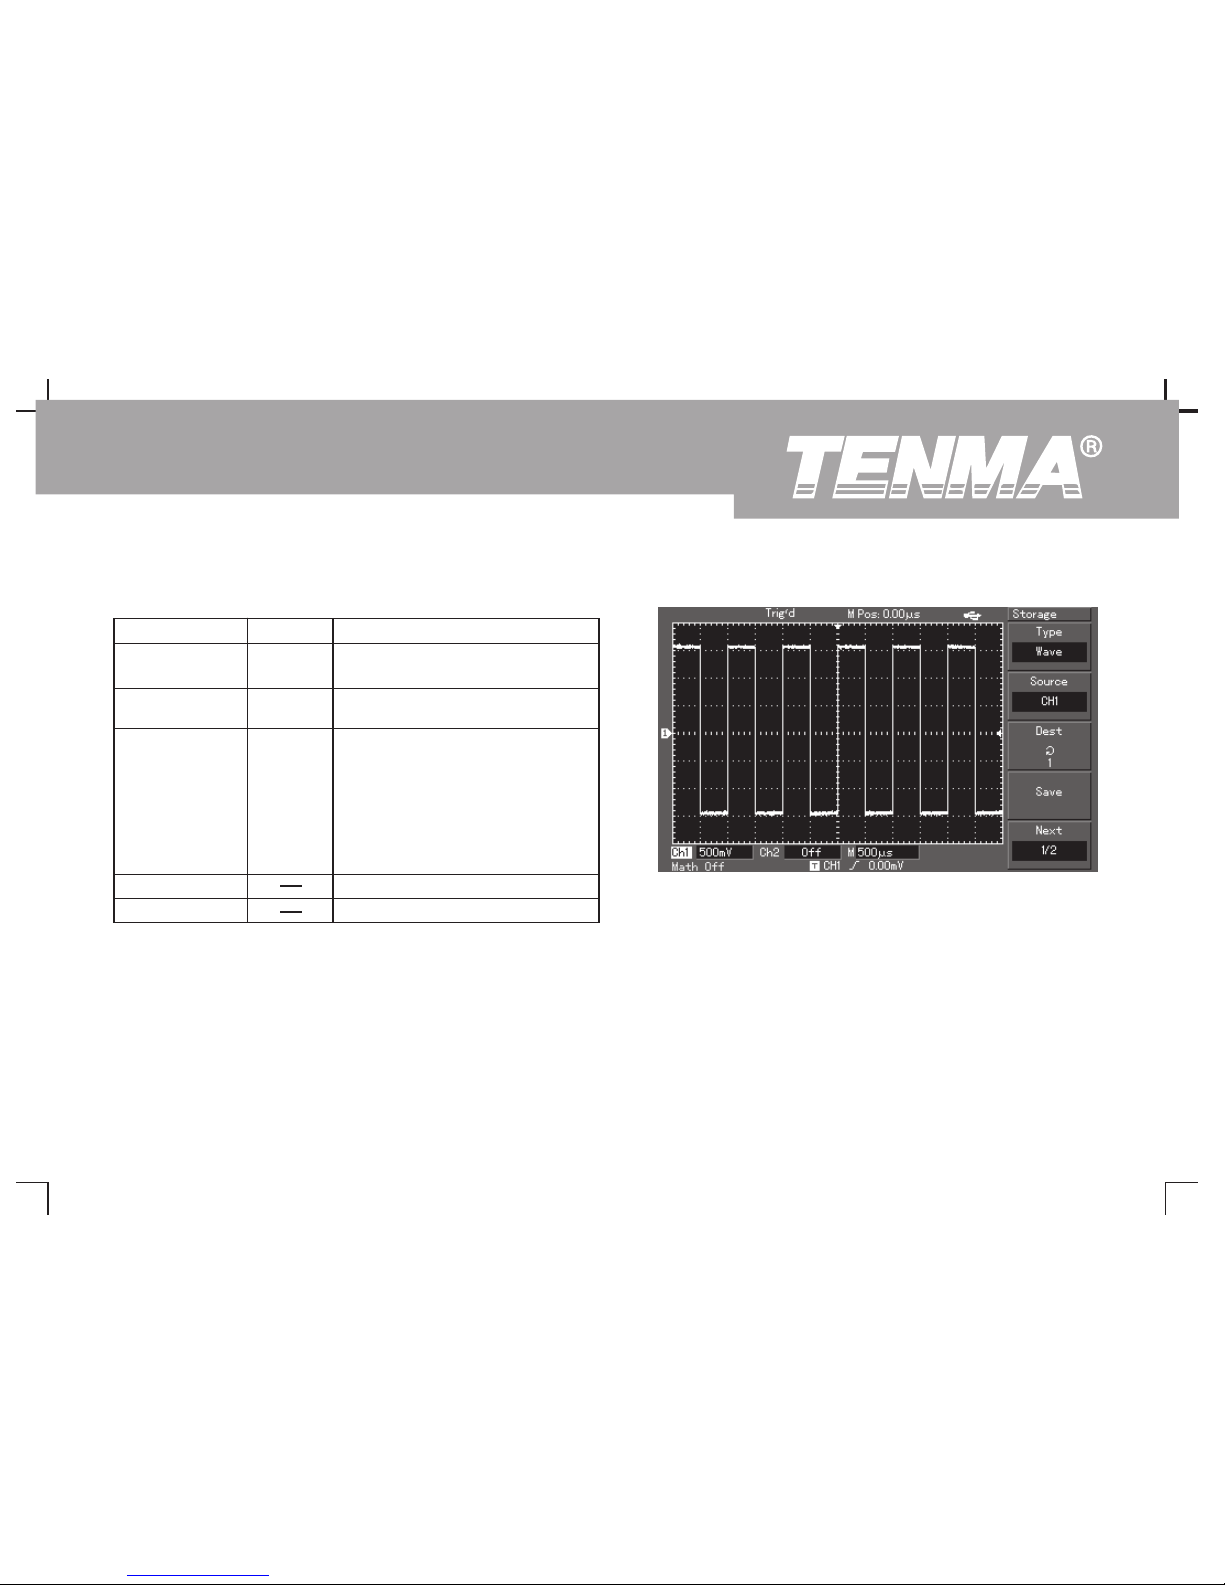
Figure 2-22 Storing the waveform
Function Menu Setup Explanatory Note
Type
Select the waveform storage and
recall menu
Dest
Go to the next page
Next page1/2
Table 2-14 Waveform storage menu (page 1)
Wave
Source
CH1
CH2
Selected signal is from CH1
Selected signal is from CH2
1~20
1~200
Turn the multifunction control knob
to set the wave form s torag e
position on the internal memory
Set the waveform storage position
on the USB device (This function
can be enabled only when the USB
device is plugged in and the disk
menu is set to “USB”)
Store the waveform
Save
49
DSO Series User Ma nual
Page 52
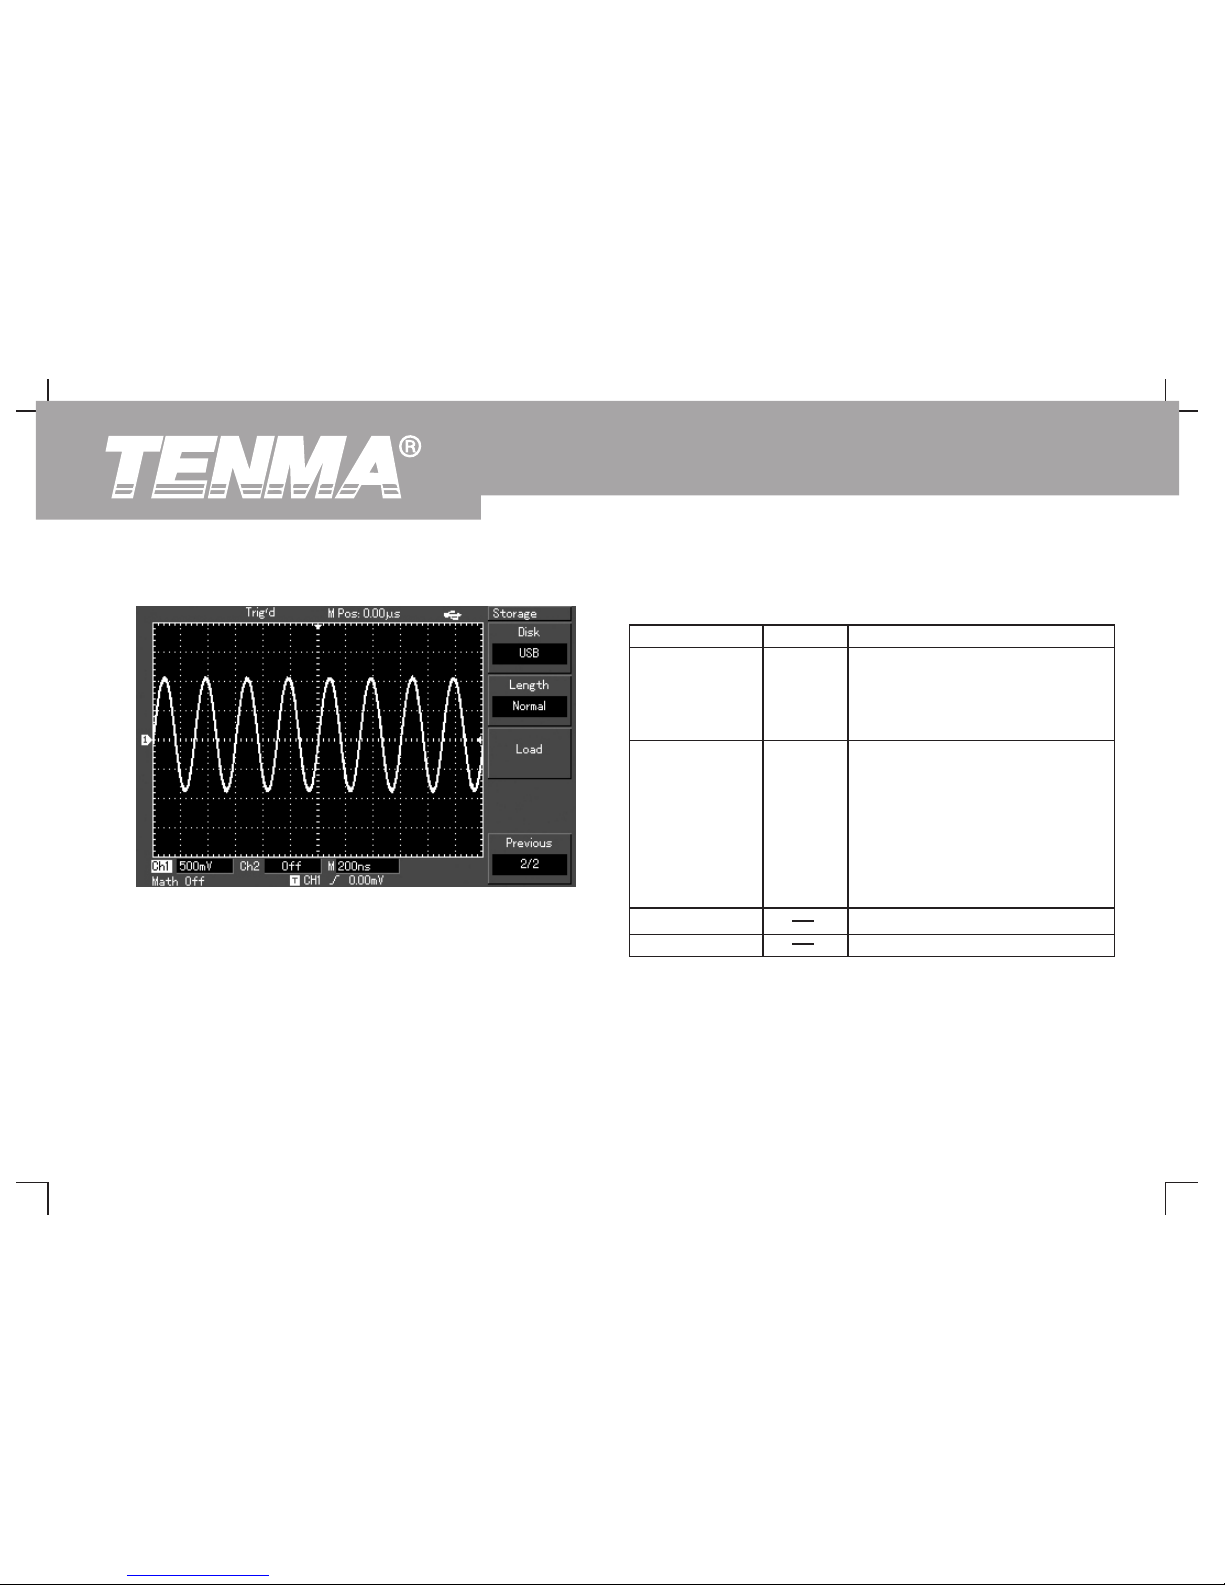
.
Figure 2-23 Storing a waveform on the USB
Function Menu Setup Explanatory Note
Disk
Select the internal memory of the
oscilloscope
Select the external USB. (This
function can only be used with the
USB key plugged in)
Load
Return to the previous page
Previous 2/2
Table 2-15 Waveform storage menu (page 2)
DSO
USB
Lenght
Normal
Long
Select normal storage depth
Select long storage depth (Note :
this function can only be activated
when the USB device is plugged in.
Data stored in a USB key can only
recalled with the waveform loading
functio n o f the DSO Series
computer test and control
software)
Recall the waveform
50
DSO Series User Ma nual
Page 53
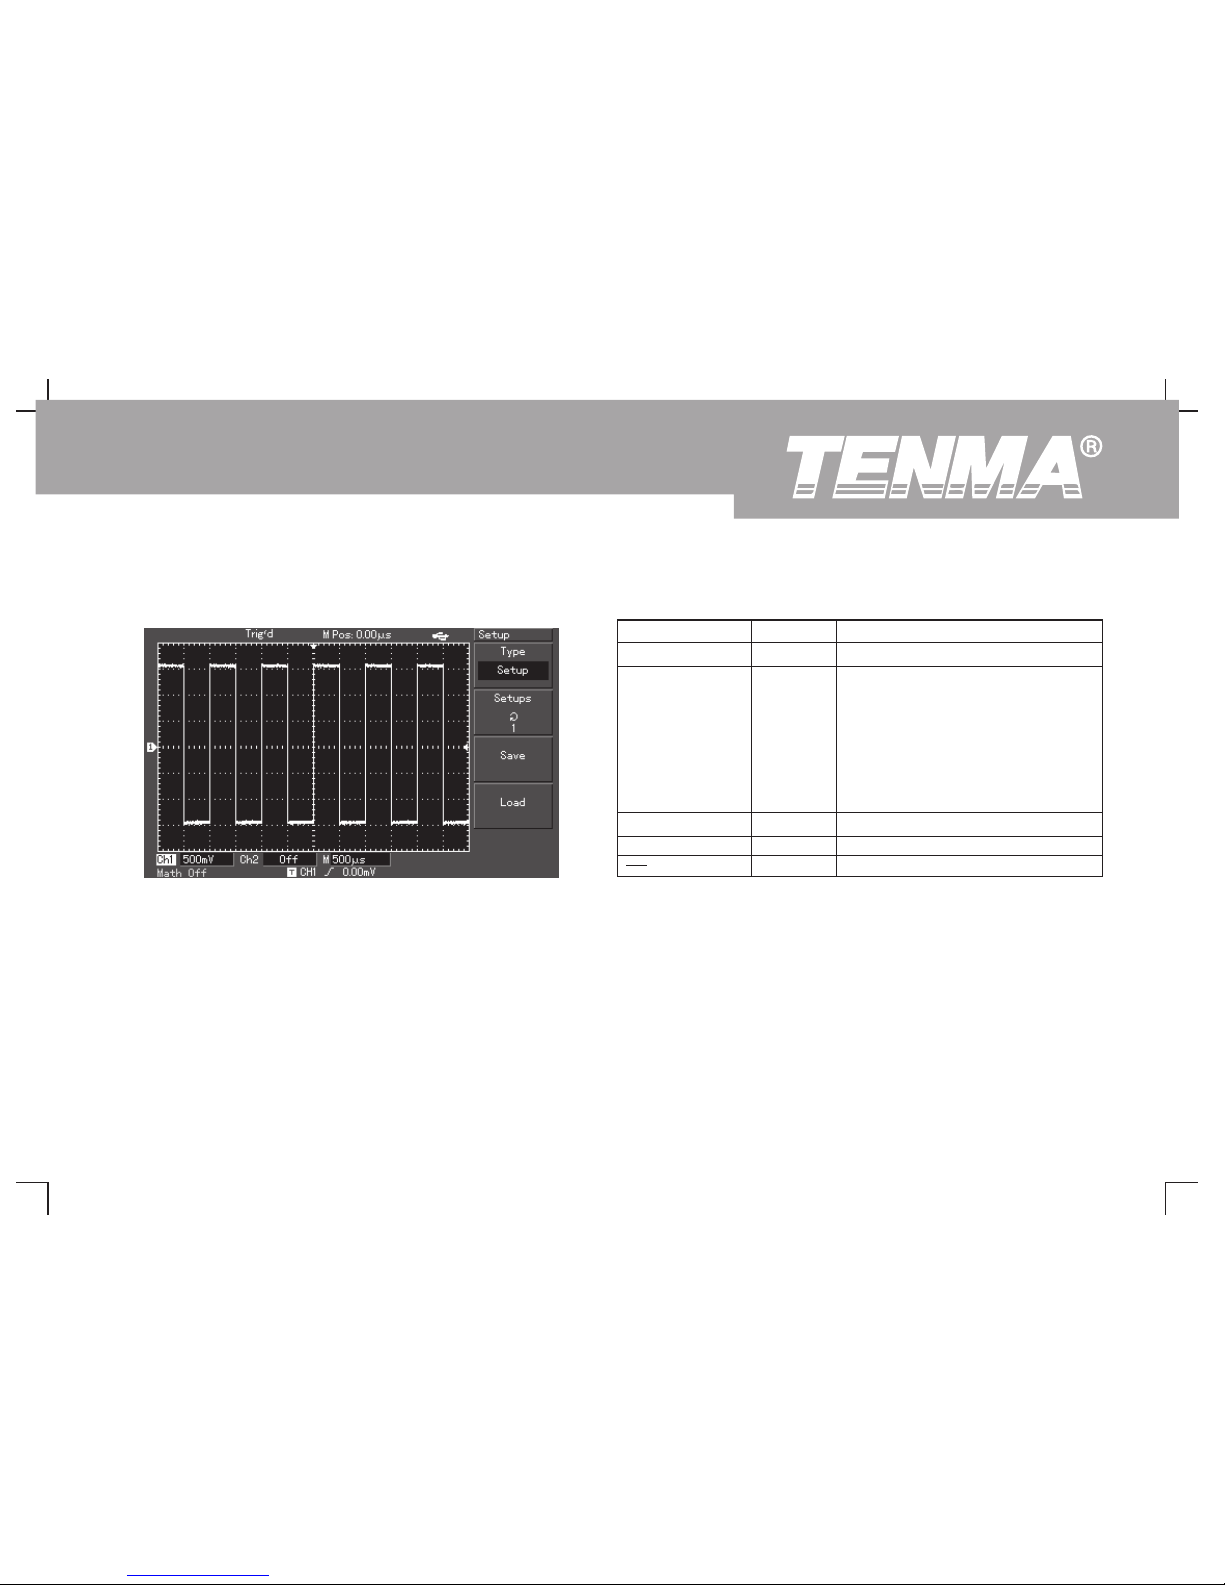
2. For the setup storage menu, see Table 2-16.
Figure 2-24 Storage setup
Function Menu Setup Explanatory Note
Setup
Select the front panel setup menu
Setups
Recall the setting
Recall
Table 2-16 Setting the storage menu
1~20
1~200
Maximum 20 front panel setups
can be stored with the multifunction
control knob on the front panel
Set the waveform storage position
on the USB device (This function
can be enabled only when the USB
device is plugged in and the disk
menu is set to “USB”)
Store the setting
Save
51
DSO Series User Ma nual
Page 54
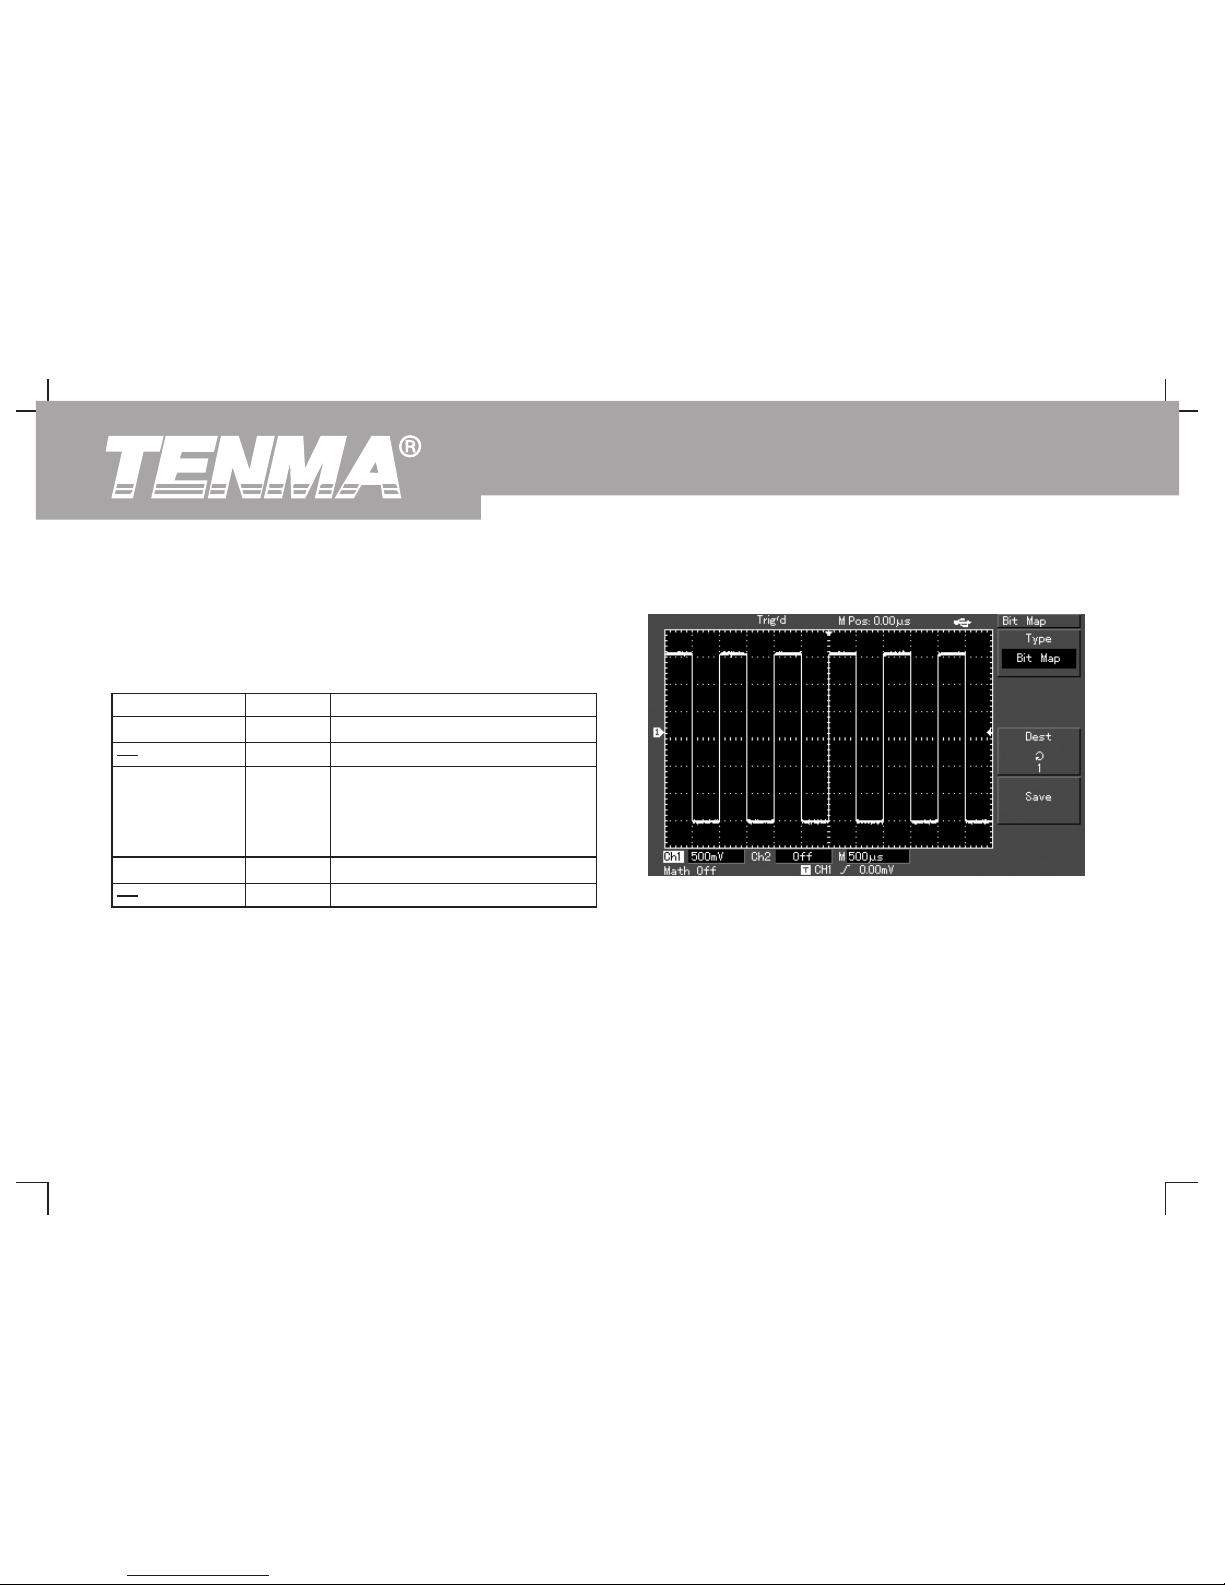
3. Select bitmap to enter the bitmap storage menu. See Table 2-17.
Note : This function can be enabled only when the USB device is
plugged in.
Utility Function Setup
As shown below, the [UTILITY] button in the MENU control zone is the
function key for utility functions.
Figure 2-25 Bitmap storing
Function Menu Setup Explanatory Note
Bitmap
Select the bitmap menu
Save
Table 2-17 Bitmap storage menu
Dest
1~200
Maximum 200 bitmap data can be
s t o r e d . S e l e c t w i t h t h e
multifunction control knob at the top
of the front panel (data can only be
stored on the USB device)
Store the bitmap data
52
DSO Series User Ma nual
Page 55
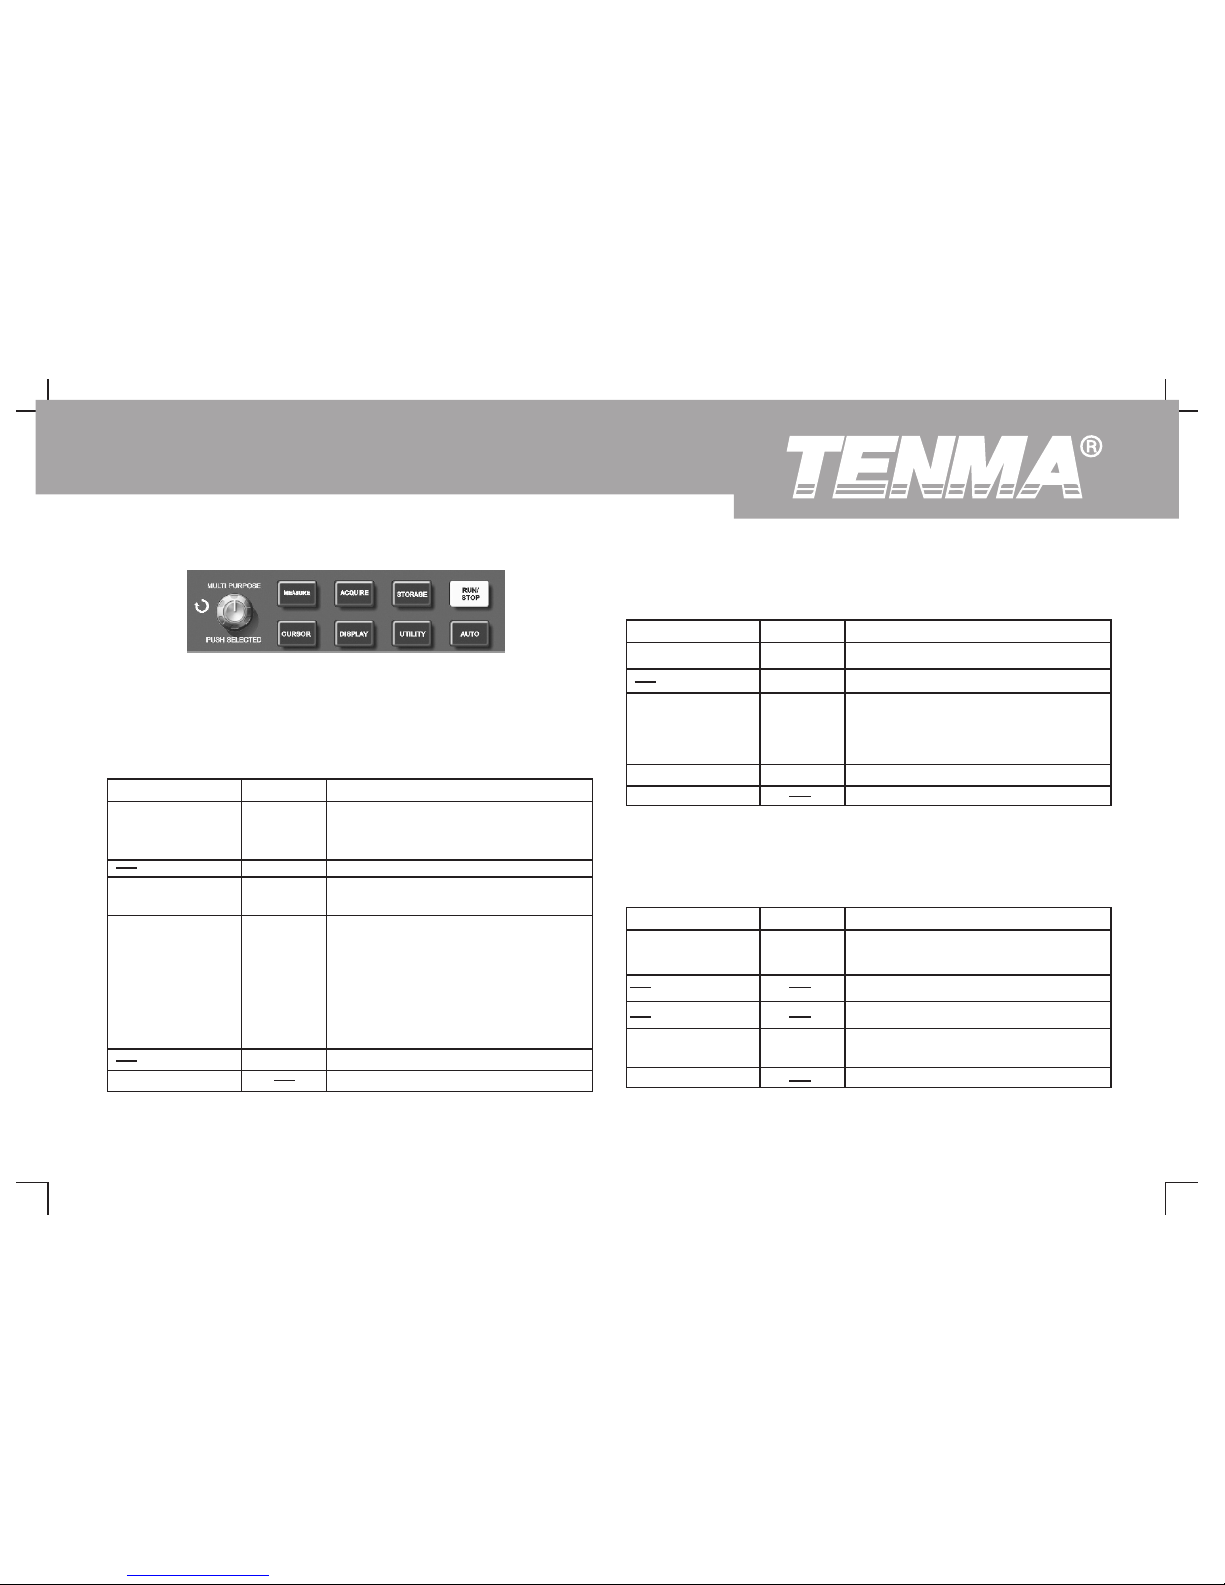
Press the [UTILITY] button to pop out the setup menu for utility
functions.
Figure 2-26 Function key for the sampling
system (function)
Function Menu Setup Explanatory Note
Reset
Setting the factory setup recall
Skin
Table 2-19 Utility function menu (page 2)
1
2
3
4
Setting the i nt er fa ce d es ig ns .
Two designs (mono display) /
four designs (colour)
Store the setting
Grid Bright
Function Menu Setup Explanatory Note
Selt Adj
Run auto calibration
Cancel auto calibration and return
to the previous page
Recorder
Go to the next page
Next page 1/3
Table 2-18 Utility function menu (page 1)
Execute
Close
Setup for recording the waveform
Language
See Table
2-21
Select the language interface
Simplified
Chinese
Traditional
Chinese
English
Spanish
Portuguese
French
1%-100%
Function Menu Setup Explanatory Note
Versi on
Displ a y t h e c u rrent s y s t e m
information of the oscilloscope
Cymometer
Table 2-20 Utility function menu (page 3)
ON
OFF
Frequency counter is on
Frequency counter is off
Return to the first page
First page 3/3
53
First page 2/3
DSO Series User Ma nual
Page 56
Function Menu Setup Explanatory Note
Source
Select CH1 as the recording signal
source
Select CH2 as the recording signal
source
Select CH1 + CH2 as the recording
signal source
Load
Table 2-21 Waveform record menu (1)
(Press [UTILITY] to enter)
Save
1~30
Ente r t he ne xt page for the
recording operation menu (a s
shown in Table - )2 22
Select the recall position of the
USB waveform
Ch1
Ch2
CH1+CH2
Operation
Select the save position for USB
waveform recording
1~30
Return to the first page
Return
Function Menu Setup Explanatory Note
Record(F )1
Record button. Press this button to
record. The number of screens
recorded is displayed at the bottom
of the screen.
Table 2-22 Waveform record menu (2)
(Press [OPERATION] to enter. See the above table)
1. Playback button.
2. When you press this button the
sy s tem pla ys b a ck. (Th e
number of the screen being
played is displayed in the
bottom right corner. By turning
the multifunction control knob
on the upper front panel, you
can suspend playback. Turn
the knob further and you can
select the waveform of a certain
screen to be played back
repeatedly.)
3. If you wish to continue full
playback, press F3 to stop and
then press F2.
4. You can record as many as
1,000 screen data.
Stop recording
Return to the previous page
Replay(F )2
Stop(F )3
Return(F )4
54
DSO Series User Ma nual
Page 57
Important Points :
Auto Calibration :
You can correct measurement errors caused by environmental
changes with the auto calibration function. This process can be run
selectively when necessary. To make calibration more accurate, power
on your oscilloscope and allow 20 minutes to warm up. Then press the
[UTILITY] button (help function) and follow on-screen instructions.
Choose your language :
Your DSO Series Digital Storage Oscilloscope can be operated in
Application Examples
many languages.
The measurement menu of your oscilloscope is capable of measuring
To select a display language, press the [UTILITY] menu button and
28 waveform parameters.
choose your desired language.
Press [MEASURE] to enter the parameter measurement display menu
Automatic Measurement
which has 5 zones for simultaneous display of measurement values,
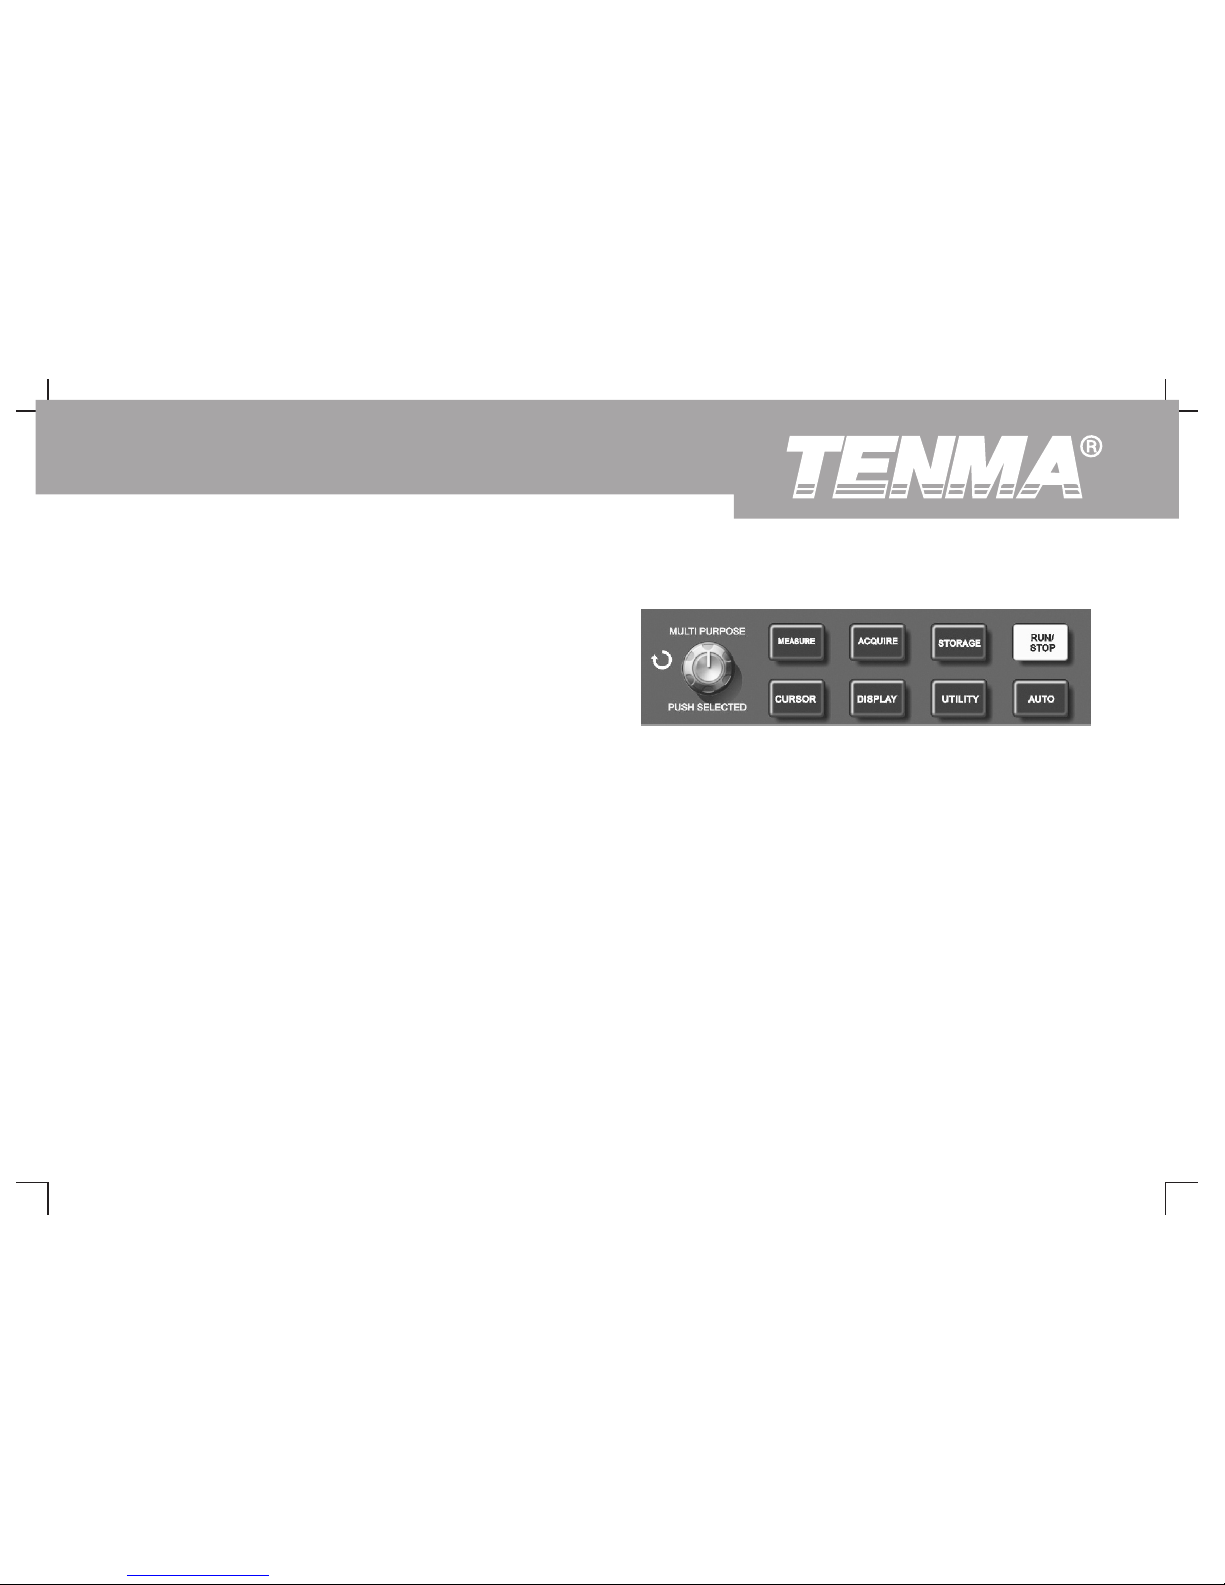
As shown below, the [MEASURE] button is the function key for auto
assigned to function keys [F1] ~ [F5] respectively. When selecting the
measurement. Read the following instructions to familiarize with all the
measurement type of any zone, press the corresponding function key
powerful automatic measurement functions of your DSO Series
to enter the type option menu.
Oscilloscope.
Figure 2-27 Function key for the sampling
system (auto measurement)
55
DSO Series User Ma nual
Page 58

The measurement type o pt io n m en u lets you choose v ol ta ge or
Example 2 : Setup for delayed measurement. You can use the delayed
time. You can e nt er the voltage or time measurement by
measurement function to measure the time interval between the rising
pressing [F1] ~ [F5] f or the co rr es po nd in g type, a nd then return
edge of two signal source, i.e. the time interval between the rising
to t he p ar am eter m ea su re me nt d is pl ay m en u. You can al so
edge of the first cycle of a certain signal source and the rising edge
press [F5] and select “ A LL PAR AM ET ER S” to s ho w a ll
of the first cycle of another signal source. Measure as follows :
measurement parameters of both vo lt ag e a nd ti me . P re ss
1. In the measurement menu, as shown in the previous example,
[F2 ] to se le ct the ch an ne l ( measurement is carried ou t
select the display zone for delayed measurement value (time
only w he n th e ch an ne l is enabled) . If you do not wish to
type page 3/3).
change the cu rr en t measurement t yp e, press [F 1] to re tu rn
2. Press [F2] to enter the delay menu.
to the parameter measurement display menu
3. Select reference signal source : CH1, and then select the delay
Example 1 : To display the measurement peak-to-peak value of CH2 in
signal source : Ch2.
the [F1] zone, follow the steps below :
4. Press [F5] to confirm. The delayed measurement is now
1. Press [F1] to enter the measurement type option menu.
displayed in your specified zone.
2. Press [F2] to select channel 2 .
3. Press [F3] to select voltage.
4. Press [F5] (1/4 next page) and you will see the peak-to-peak
value at position [F3].
5. Press [F3] to select peak-to-peak value and then automatically
return to the parameter measurement display menu.
On the first page of the measurement menu, peak-to-peak value is
displayed in zone [F1].
56
DSO Series User Ma nual
Page 59

Average value : Average amplitude of signals within 1 cycle.
Automatic measurement of voltage parameters
Root mean square value (Vrms) : The effective value. Energy
Your DSO Series Oscilloscope can automatically measure the
generated by AC signal conversion during 1 cycle with respect to the
following voltage parameters :
DC voltage that produces equivalent energy, i.e. root mean square
Peak-to-peak value (Vpp) : The voltage value from the highest point to
value.
lowest point of the waveform.
Maximum value (Vmax) : The voltage value from the highest point to
Auto matic measu rement of tim e pa rameters
ground (GND) of the waveform.
Your DSO Series Oscilloscope can automatically measure the
Minimum value (Vmin) : The voltage value from the lowest point to
frequency, cycle, rising time, falling time, positive pulse width, negative
ground (GND) of the waveform.
pulse width, delay 1 2(rising edge), delay 1 2(falling edge), positive
Amplitude value (Vamp) : The voltage value from top to base of the
duty ratio, negative duty ratio and 10 time parameters. Definitions of
waveform.
these parameters are as follows :
Mean (Vmid) : Half of the amplitude.
RiseTime : The time taken by the waveform amplitude to rise from 10%
Top value (Vtop) : The voltage value from the level top to ground (GND)
to 90%.
of the waveform.
FallTime : The time taken by the waveform amplitude to fall from 90% to
Base value (Vbase) : The voltage value from the level base to ground
10%.
(GND) of the waveform.
Positive Pluse Width (+Width) : The pulse width when positive pulse is
Overshoot : The ratio value of the difference between maximum
at 50% amplitude.
value and top value to the amplitude value of the waveform.
Negative Pluse Width (-Width) : The pulse width when negative pulse is
at 50% amplitude.
Preshoot : The ratio value of the difference between minimum
value and base value to the amplitude value of the waveform.
57
DSO Series User Ma nual
Page 60
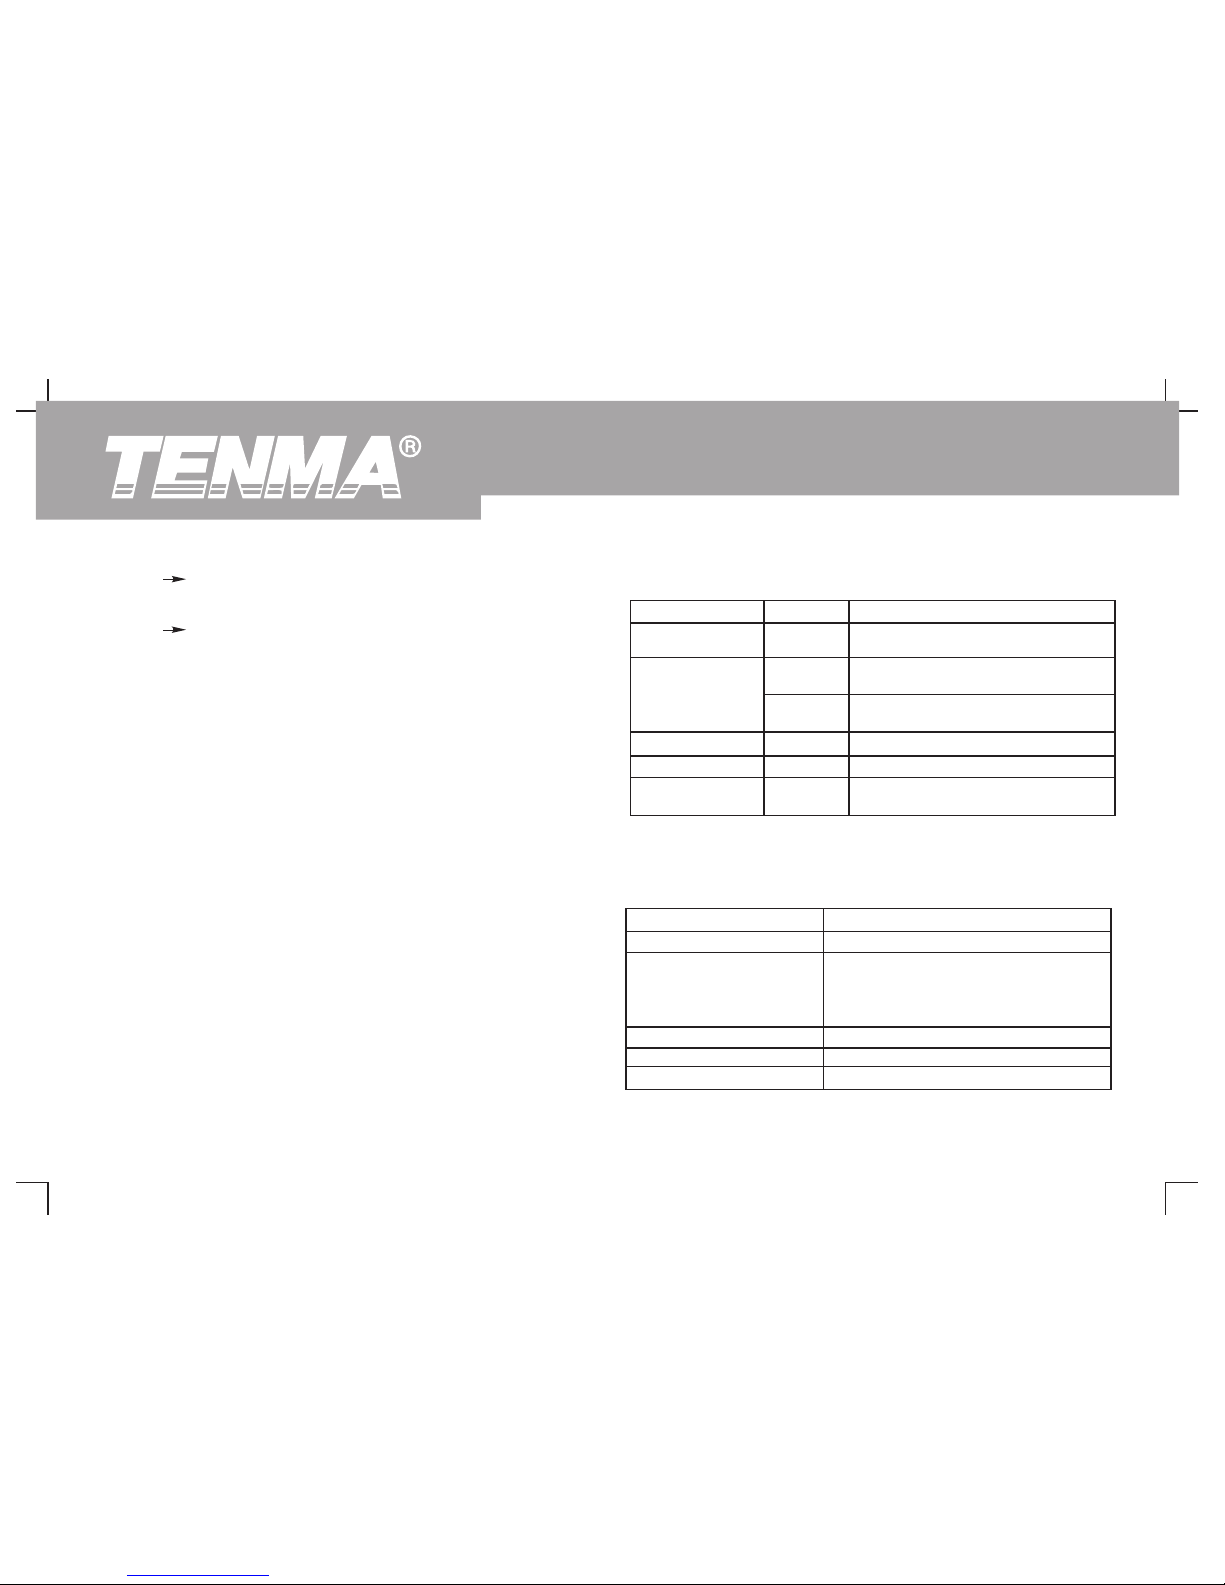
Delay 1 2 (Rising edge) : Delayed time of the rising edge of CH1,
Ch2.
Delay 1 2 (Falling edge) : Delayed time of the falling edge of
Ch1, Ch2.
Positive duty ratio (+Duty) : Ratio of positive pulse width to cycle.
Negative duty ratio (-Duty) : Ratio of negative pulse width to cycle.
Measurement menu
Operation :
Press [MEASURE] to display the zones for 5 measurement values. You
can press any one of F1~F5 to enter the measurement option menu, as
shown in Table 2-23.
Voltage type menus are shown in Table 2-24 to Table 2-27.
Function/Measurement Explanatory Note
Return to the menu shown in Table 2-23
Overshoot
Table 2-24 Waveform record menu (1) (Press [UTILITY] to enter)
Amplitude
Select to return to the parameter
measurement display menu and
replace the original parameter in that
position
Preshoot
Ditto
Turn page
Previous
Function Menu Setup Explanatory Note
Back
Return to the parameter measurement
display menu
Time
Table 2-23
Volt
Select the channel for parameter
measurement
Source
Enter the voltage type parameter menu
Di sp lay/c lo se all measu re ment
parameters
Parameters
Select the channel for parameter
measurement
Ch1
Ch2
Enter the time type parameter menu
Ditto
Next page (1/4)
58
DSO Series User Ma nual
Page 61
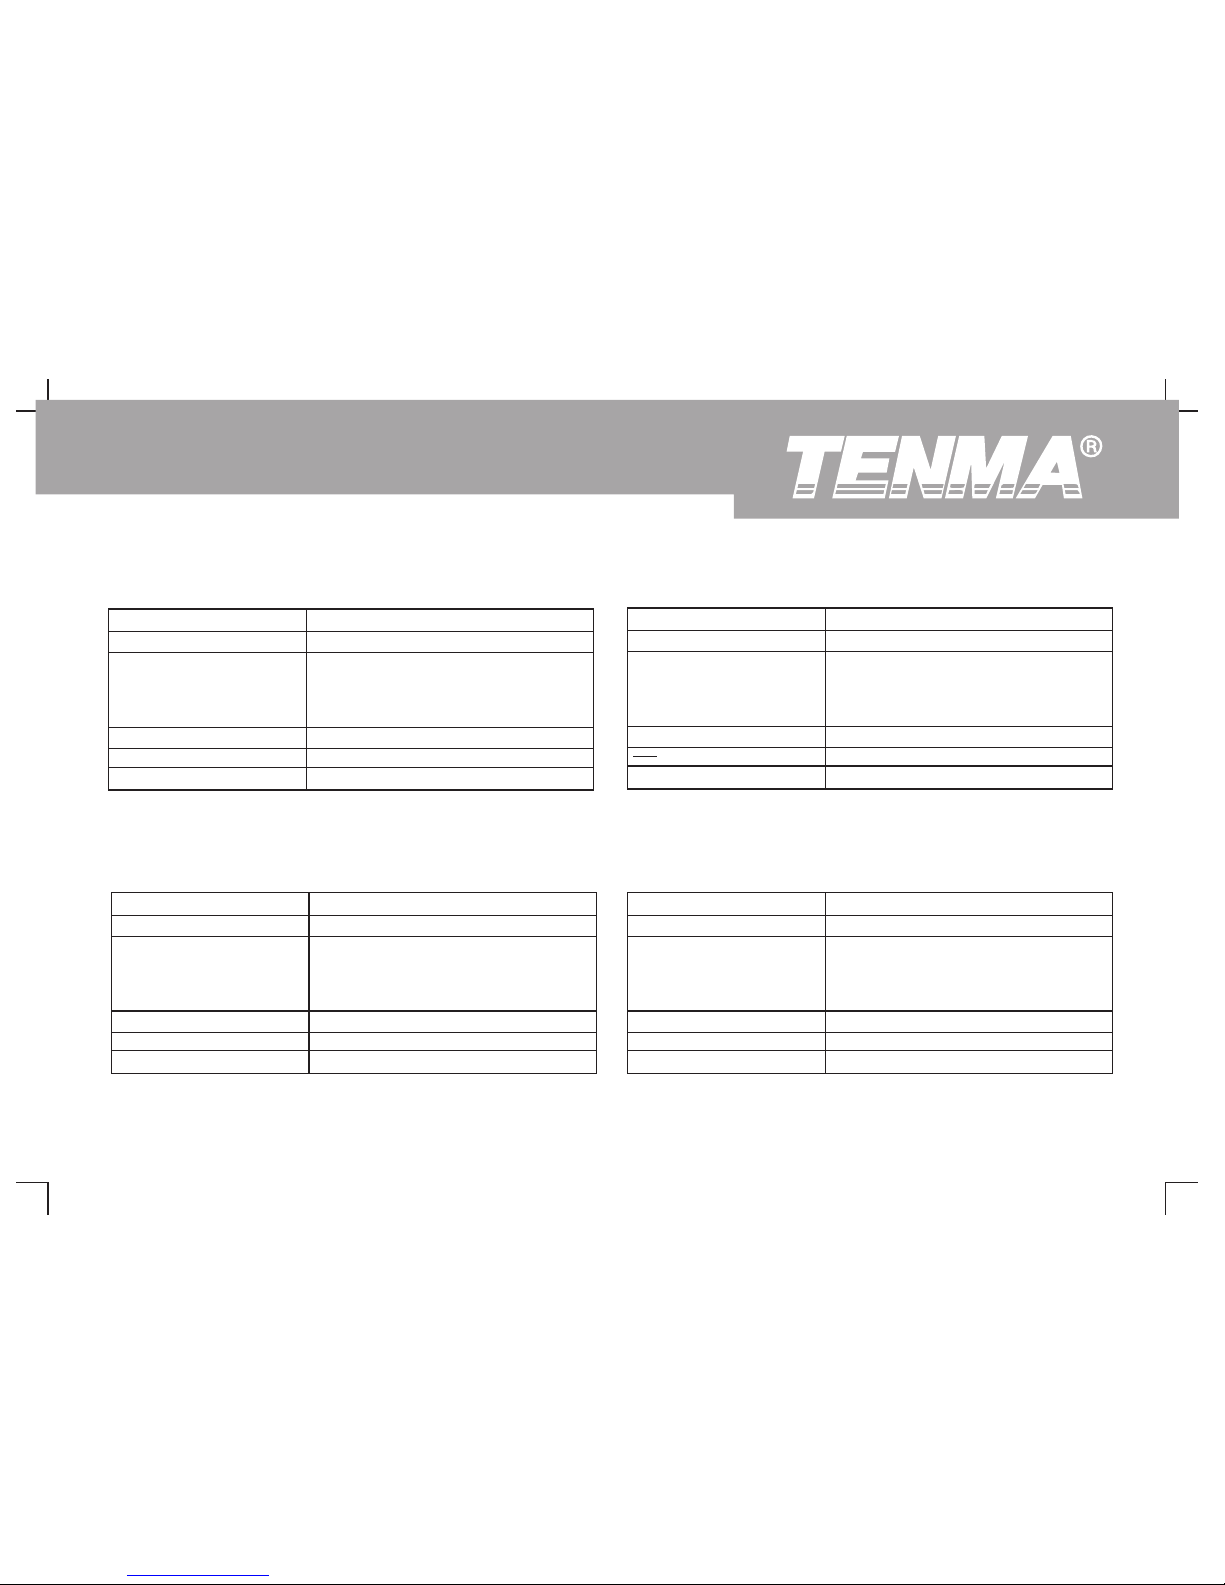
“Time Type” menus are shown in Table 2-2 8 to Table 2- 31 .
Function/Measurement Explanatory Note
Return to the previous page
Middle
Table 2-26
Low
Select to return to the parameter
measurement display menu and
replace the original parameter in that
position
High
Ditto
Turn page
Previous
Ditto
Next (3/4)
Function/Measurement Explanatory Note
Return to the previous page
RMS
Table 2-25
Pk-Pk
Select to return to the parameter
measurement display menu and
replace the original parameter in that
position
Mean
Ditto
Turn page
Previous
Ditto
Next ( )2/ 4
Function/Measurement Explanatory Note
Return to the previous page
Rise
Table 2-28
Period
Select to return to the parameter
measurement display menu and
replace the original parameter in that
position
Freq
Ditto
Turn page
Back
Ditto
Next (1/3)
Function/Measurement Explanatory Note
Return to the previous page
Table 2-27
Min
Select to return to the parameter
measurement display menu and
replace the original parameter in that
position
Max
Ditto
Return to page 1 (as shown in Table 2-24)
Previous
Next ( )4/4
59
DSO Series User Ma nual
Page 62
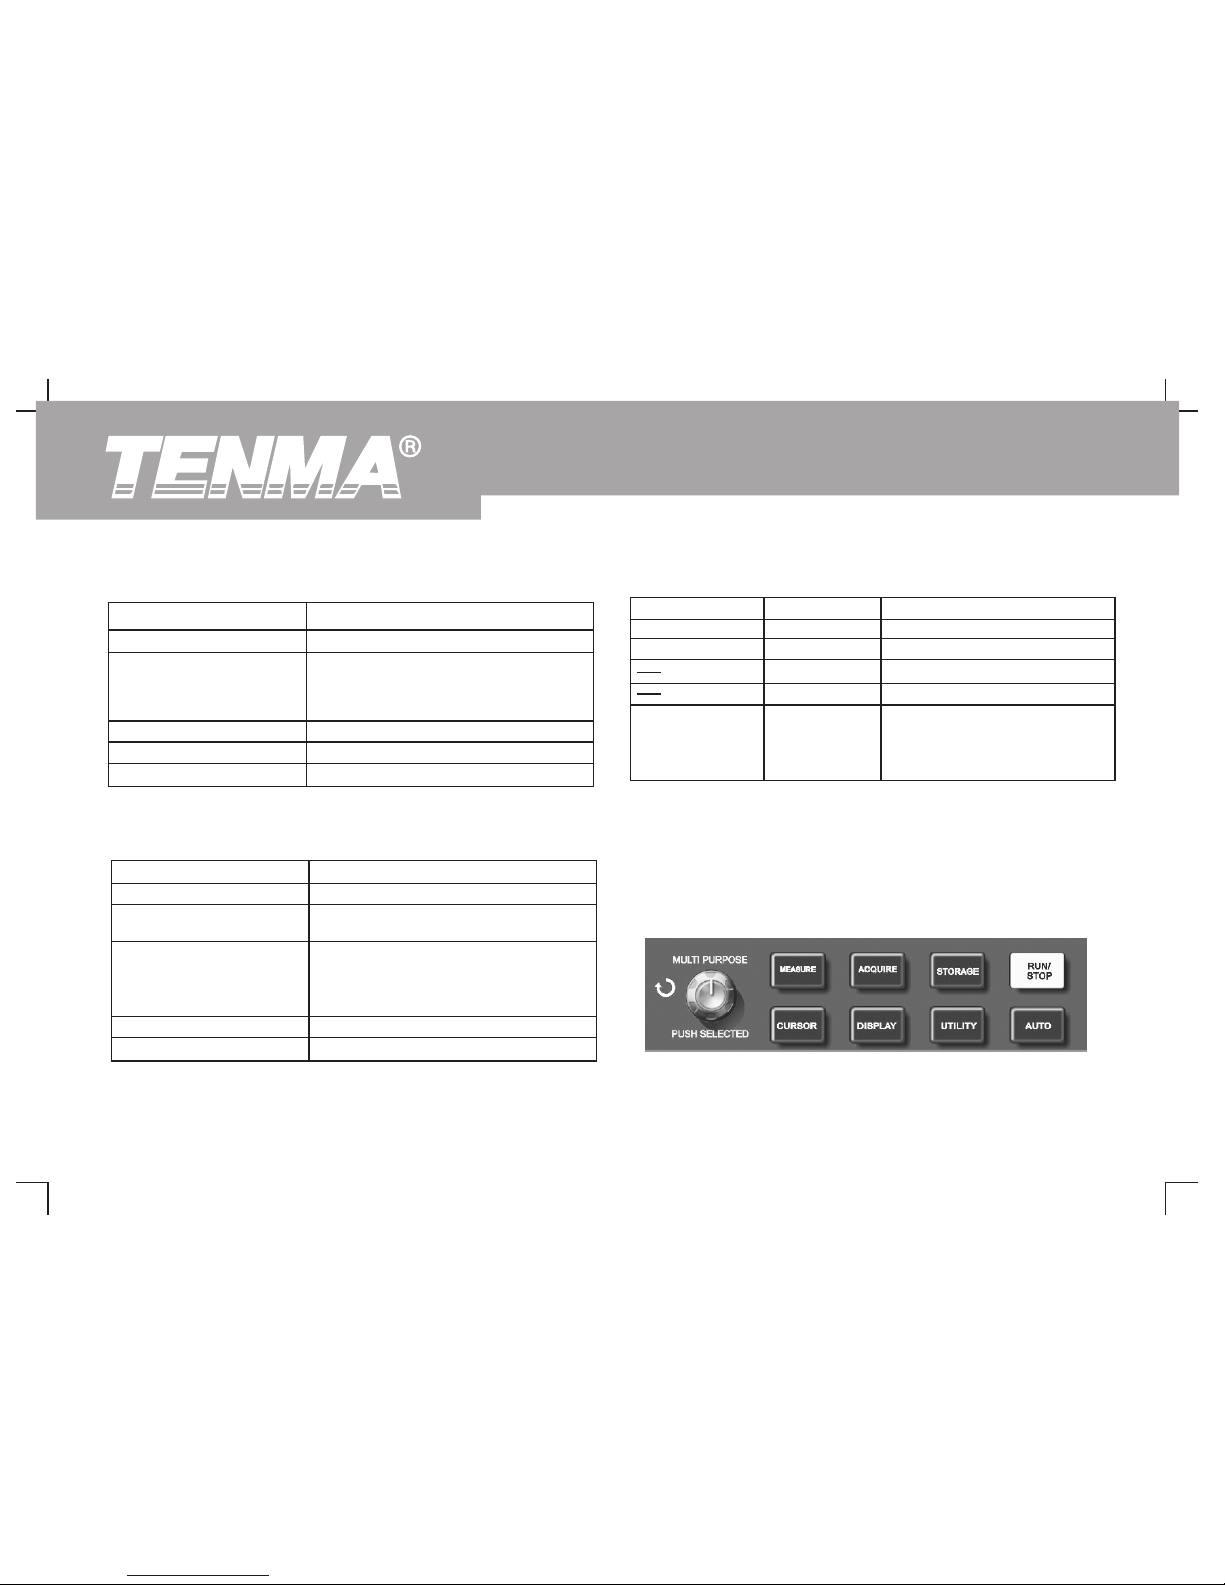
Cursor Measurement
Press [CURSOR] to display the measurement cursor and cursor menu,
then adjust the cursor position by turning the multifunction control knob.
As shown in the figure below, [CURSOR] in the MENU control zone is
the function key for cursor measurement.
Function/Measurement Explanatory Note
Return to the previous page
- Duty
Table 2-30
+Duty
Select to enter the delay option menu
(as shown in Table 2-31)
Delay
Select to return to the parameter
me asu remen t di spl ay men u an d
replace the original parameter in that
position
Return to page 1 (as shown in Table 2-28)
Previous
Ditto
Next (3/3)
Function/Measurement Explanatory Note
Return to the previous page
- Width
Table 2-29
+ Width
Select to return to the parameter
measurement display menu and replace
the original parameter in that position
Fall
Ditto
Turn page
Previous
Ditto
Next ( )2/ 3
Table 2-31
Function Menu Setup Explanatory Note
From(Channel)
Select the reference channel
Select the channel to be measured
To(Channel)
Select to return to the parameter
measurement display menu and
replace the original parameter in
that position
OK
CH1/CH2/MATH
CH1/CH2/MATH
Figure 2-28 Function key for the sampling system (cursor)
60
DSO Series User Ma nual
Page 63
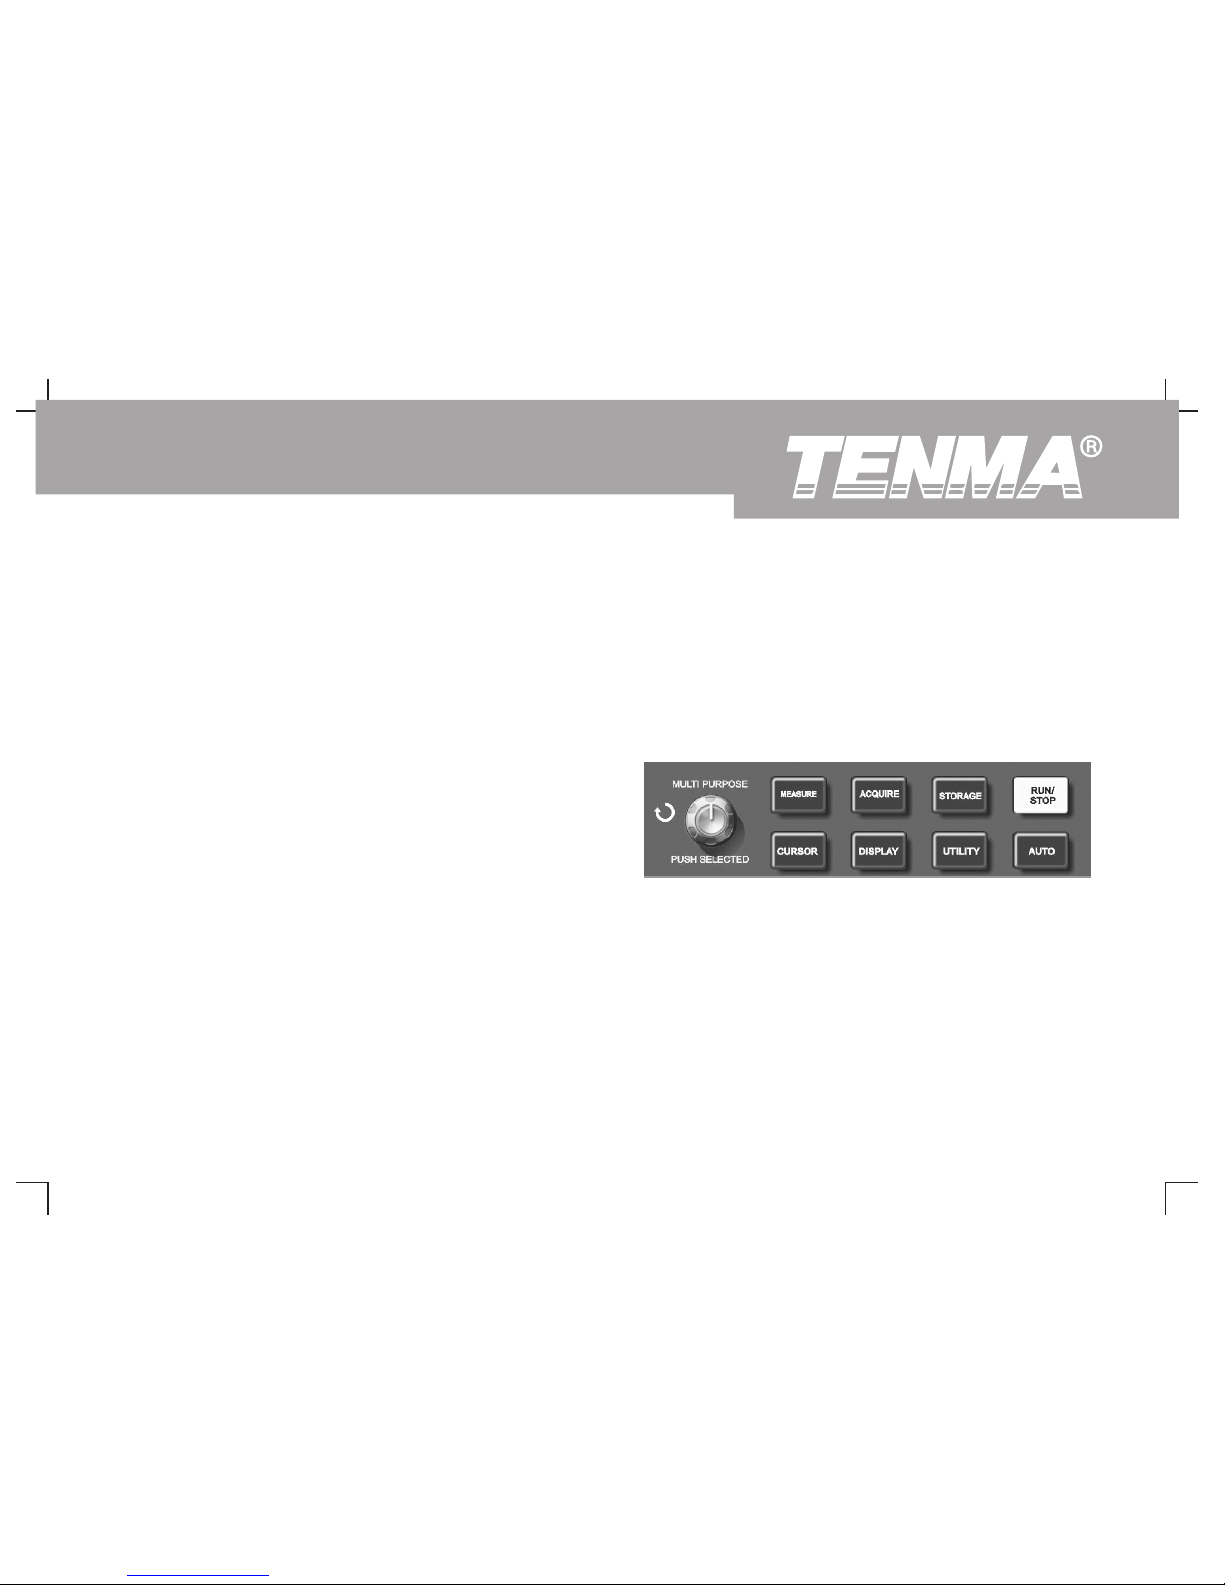
You can move the cursor to carry out measurement in the [CURSOR] 5. When the cursor function is enabled, measurement value is
mode. There are three modes to choose from : voltage, time and automatically displayed in the upper right hand corner.
tracking. When measuring voltage, press [PUSH SELECTED] and [F2]
Using the Run Button
on the front panel. Positions of the two cursors and the cursor moving
There is a button on the top right hand corner on the front panel :
speed can be adjusted with the multifunction control knob to measure V.
[RUN/STOP]. When this button is pressed and a green indicator lights
Likewise, by selecting time, you can measure t. In the tracking mode
up, your oscilloscope is in a running status. If a red light comes on after
and waveform display is on, you can see the cursor and track signal
pressing this button, it indicates the unit has stopped operation.
changes automatically by adjusting with the multifunction control knob.
Notes :
1. [PUSH SELECTED] : To select the cursor.
2. Coarse tune/fine tune : To adjust the cursor moving speed.
3. Measuring voltage/time : Cursor 1 or cursor 2 will appear
simultaneously. Adjust their positions on the screen with the
multifunction control knob and select which cursor to adjust with
the [PUSH SELECTED] button. The displayed reading is the
Auto Setup :
voltage or time value between the two cursors.
As shown above, auto setup can simplify operation. Press [AUTO] and
4. Tracking mode : Horizontal and vertical cursors cross to form a
the oscilloscope can automatically adjust the vertical deflection factor and
cross-shaped cursor. It automatically positions itself on the
horizontal time base range according to the amplitude and frequency of
waveform. You can adjust the horizontal position of the cross
the waveform, and ensure stable display of the waveform. When the
cursor by turning the multifunction control knob. Your oscilloscope
oscilloscope is in auto setup mode, the system setup is as follows :
will also display the coordinate of the cursor point.
Figure 2-29 RUN/STOP button
61
DSO Series User Ma nual
Page 64
RUN/STOP : Acquire waveform continuously or stop acquisition.
If you want the oscilloscope to acquire waveform continuously, press
[RUN/STOP] once. Press the button again to stop acquisition. You can
use this button to switch between acquiring and stop acquiring
waveform. In the Run mode, a green light comes on and AUTO appears
on the screen. In the STOP mode, a red light comes on and STOP
appears on the screen.
Function Menu Setu p
Sampling
SEC/DIV
Table 2-32
Horizontal position
Set to YT
Display format
Automatic adjustment
AC
Acquisition mode
Adjust according to signal frequency
Trigger coupling
Minimum value
Holdoff
Auto
Trigger mode
Trigger level
Set at 50%
Rising
Trigger inclination
Set to CH1 but if there is no signal in
CH1 and CH2 applies a signal, it will
set to CH2
Trigger source
Full
Vertical bandwidth
Trigger type
Edge
Adjust according to amplitude of the
signal
VOLT/DIV
62
DSO Series User Ma nual
Page 65
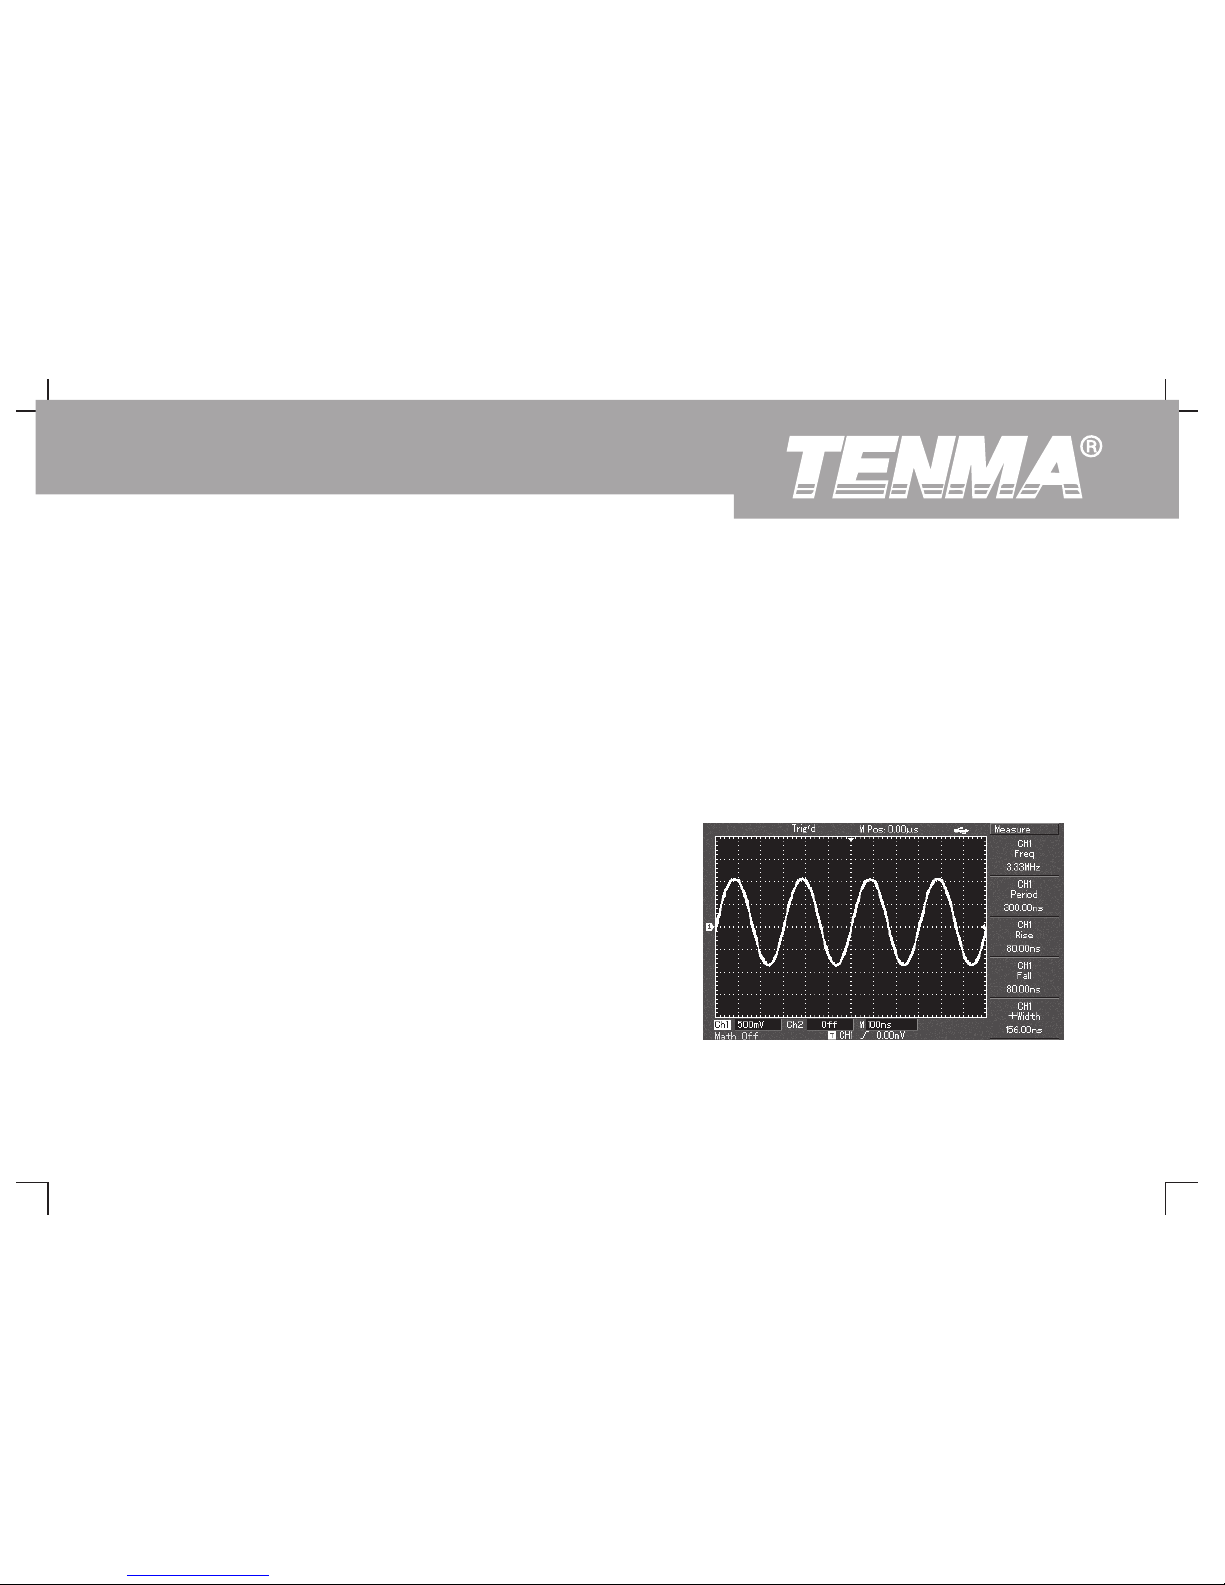
menu.
Chapter 3 Practical Example
② Press [F1] to enter the measurement type selection menu.
Illustrations
③ Press [F3] to select voltage.
④ Press [F5] to go to page 2/4, then press [F3] to select
Illustration 1 : Measuring simple signals
measurement type : peak-to-peak value.
To observe and measure an unknown circuit signal, and to quickly
⑤ Press [F2] to enter the measurement type selection menu,
display and measure the signal's frequency and peak-to-peak value.
then press [F4] to select time.
1. To quickly display this signal, follow the steps below :
⑥ Press [F2] to select measurement type : frequency.
① In the probe menu, set the attenuation factor to 10X and set
Peak-to-peak value and frequency measurement value are
the switch on the probe to 10X.
now displayed in positions [F1] and [F2] respectively.
② Connect the CH1 probe to the circuitry point to be measured.
Press [AUTO].
③ The oscilloscope will carry out auto setup to optimise
waveform display. In this status, you can further adjust the
vertical and horizontal range until you get the desired
waveform display.
2. Voltage and time parameters for automatic measurement
Your oscilloscope can automatically measure most display
signals. To measure signal frequency and peak-to-peak value,
follow the steps below :
① Press [MEASURE] to display the automatic measurement
Figure 3-1 Automatic measurement
63
DSO Series User Ma nual
Page 66
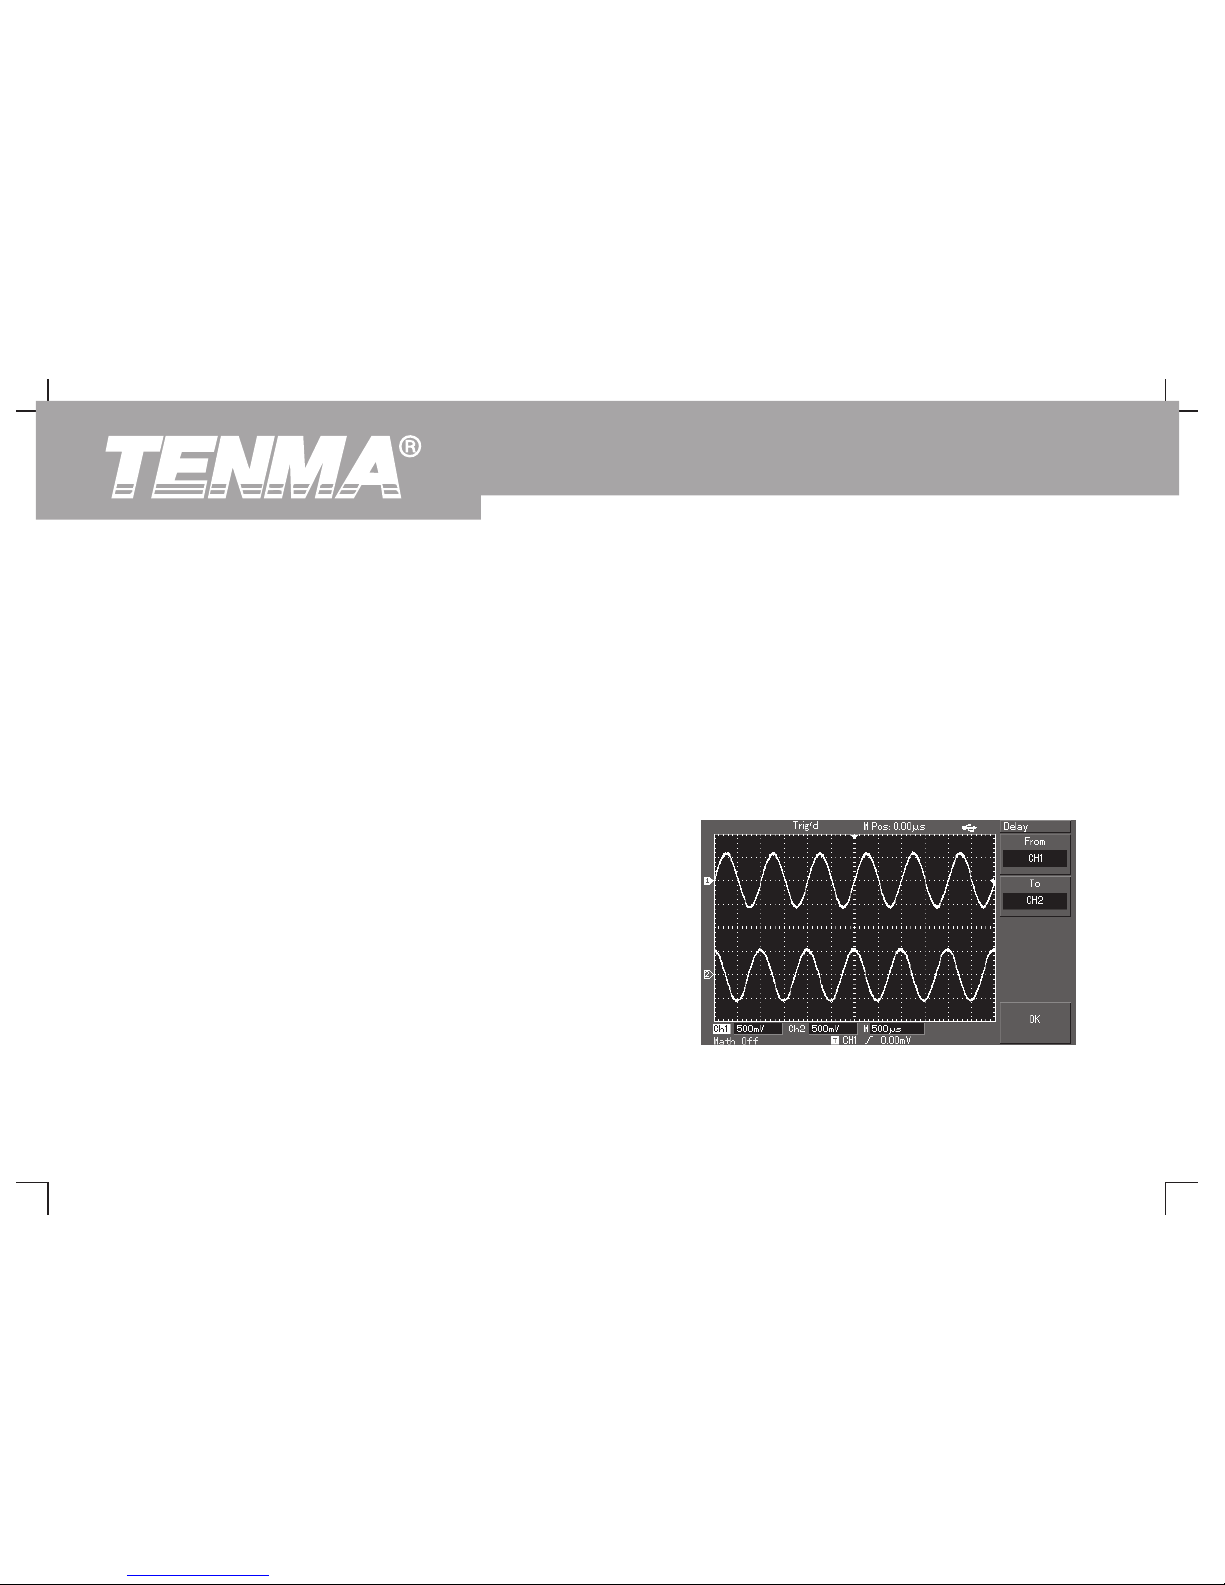
menu.
Illustration 2 : Observing the delay caused by a sine wave
Press [F1] to enter the measurement type selection menu.
signal passes through the circuit
Press [F4] to enter the time measurement parameters table.
As in the previous scenario, set the probe attenuation factor of the
Press [F5] twice to go to page 3/3.
probe and oscilloscope channel to 10X. Connect the CH1 to the circuit
Press [F2] to select delayed measurement.
signal input terminal. Connect CH2 to the output terminal.
Press [F1], select CH1 and then press [F2] to select moving
Steps :
to CH2, then press [F5] to confirm.
1. To display CH1 and CH2 signals :
You can see the delay value below “CH1-CH2 delay” in
① Press [AUTO].
the [F1] zone now.
② Continue to adjust the horizontal and vertical range until you
② Observe waveform changes (see the figure below).
get the desired waveform display.
③ Press [CH1] to select CH1. Adjust vertical position of the CH1
waveform by turning the vertical position control knob.
④ Press [CH2] to select CH2. In the same way described above,
adjust vertical position of the CH2 waveform so that the
waveforms of CH1 and CH2 do not overlap. This will make
observation easier.
2. Observing the delay caused by a sine wave signal passes through
the circuit and observing waveform changes.
① When measuring channel delay automatically :
Press [MEASURE] to display the automatic measurement
Figure 3-2 Waveform delay
64
DSO Series User Ma nual
Page 67

appropriate range.
Illustration 3 : Acquiring single signals
④ Turn the [TRIGGER LEVEL] control knob to get the desired
The advantages and special features of your digital storage
level.
oscilloscope lie in its ability to acquire non cyclical signals like pulse and
⑤ Press [RUN/STOP] and wait for a signal that meets the trigger
glitch. To acquire a single signal, you must have transcendental
condition. If any signal reaches the set trigger level, the
knowledge of that signal to set the trigger level and trigger edge. For
system will sample once and display it on the screen. By
example, if the pulse is a logical signal of TTL level, the trigger level
using this function you can easily acquire any occasional
should be set at about 2V and the trigger edge should be set to rising
event. For example, when a sudden glitch of relatively big
edge trigger. If you are not certain about the signal, you can observe it
amplitude is acquired : set the trigger level to just higher than
by automatic or normal trigger to determine the trigger level and trigger
the normal signal level. Press [RUN/STOP] and begin
edge.
waiting. When a glitch occurs, the machine will automatically
Steps :
trigger and record the waveform immediately before and
1. As in the previous illustration, set the attenuation factor of the
after triggering. By turning the horizontal POSITION knob in
probe and CH1.
the horizontal control zone on the front panel, you can change
the trigger position horizontally to achieve negative delay
2. Carry out trigger setup.
trigger of various lengths for easy observation of waveform
① Press [TRIG MENU] in the trigger control zone to display the
occurring before the glitch
trigger setup menu.
② In this menu, use F1~F5 menus to set the trigger type to
EDGE, set trigger source to CH1, set inclination to RISING,
set trigger type to SINGLE and set trigger coupling to AC.
③ Adjust horizontal time base and vertical range to an
65
DSO Series User Ma nual
Page 68
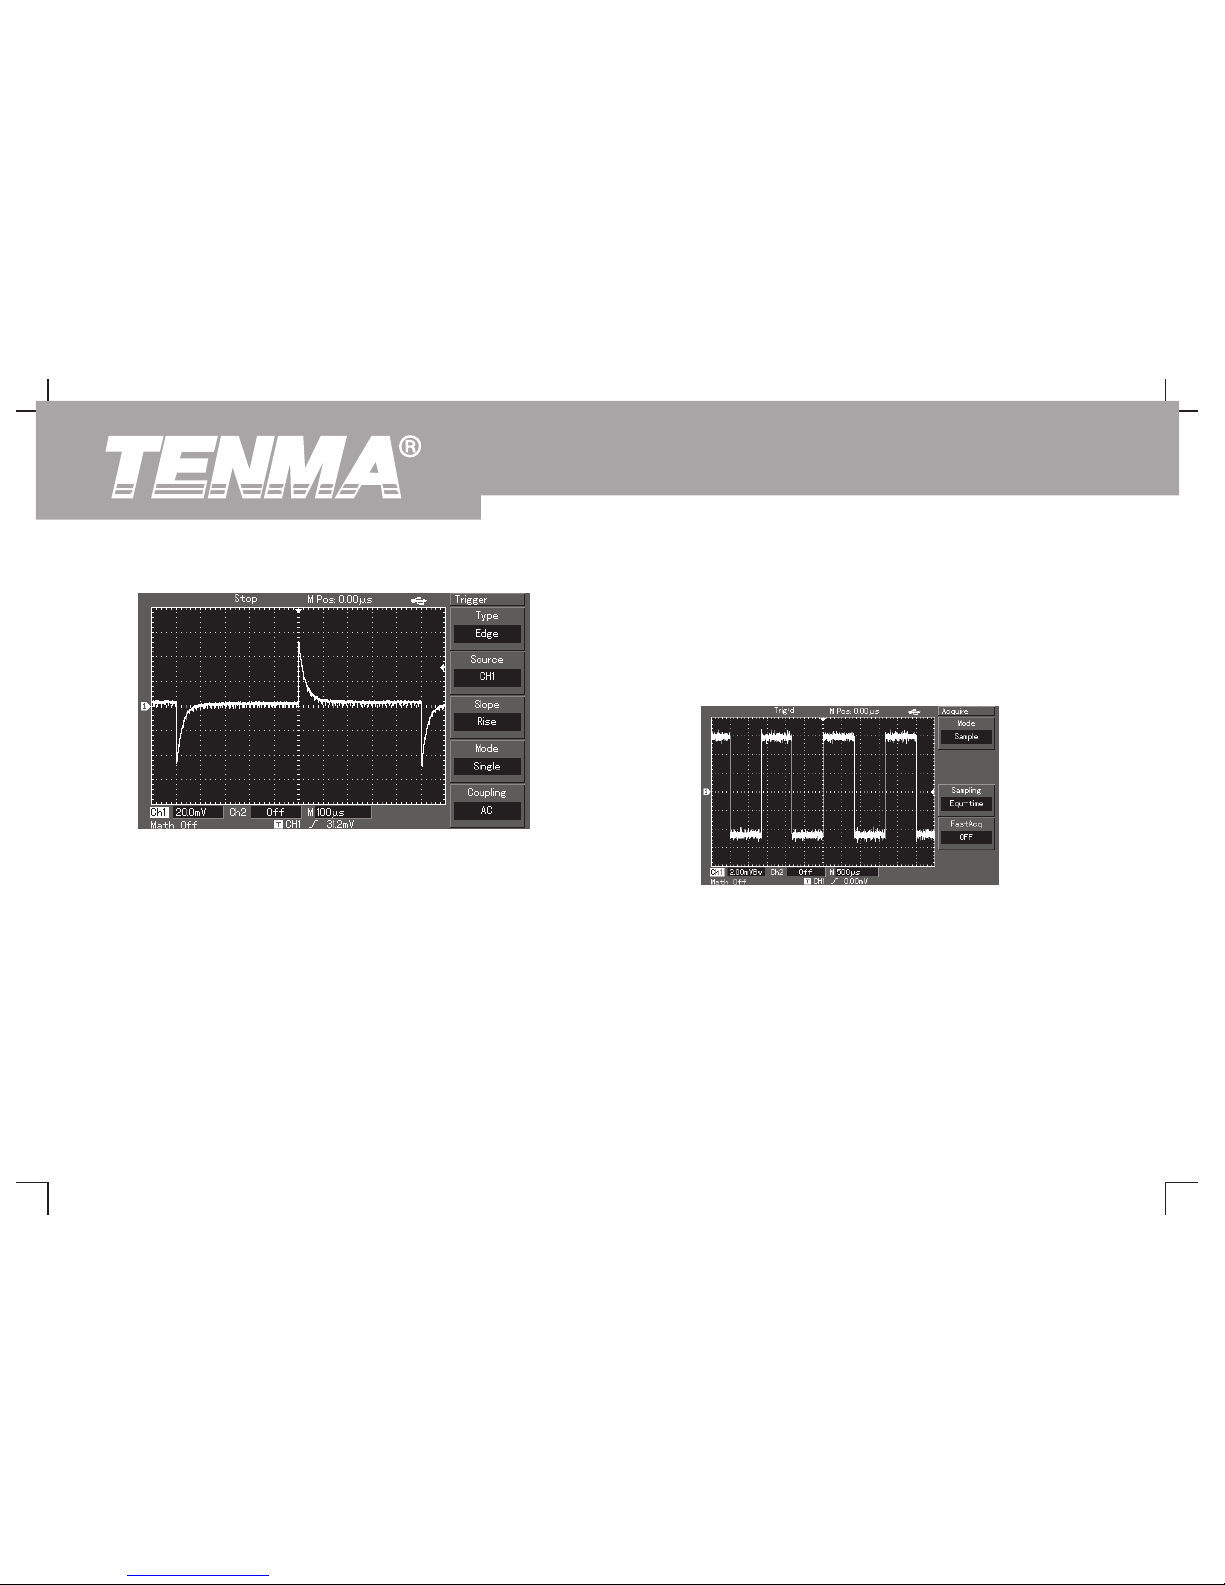
Illustration 4 : Reducing random noise of signals
If the signal being measured is stacked with random noise, you can
adjust the setups of your oscilloscope to filter or reduce the noise, so it
will not cause interference to the signal during measurement.
(Waveform is shown below)
Steps :
1. As in the previous illustration, set the attenuation factor of the
probe and Ch1.
2. Connect the signal to ensure stable display of waveform. See the
previous illustration for operation instruction. See the previous
chapter for guidance on adjusting the horizontal time base and
vertical range.
Figure 3-4 Reducing random noise of signals
Figure 3-3 Single signal
66
DSO Series User Ma nual
Page 69
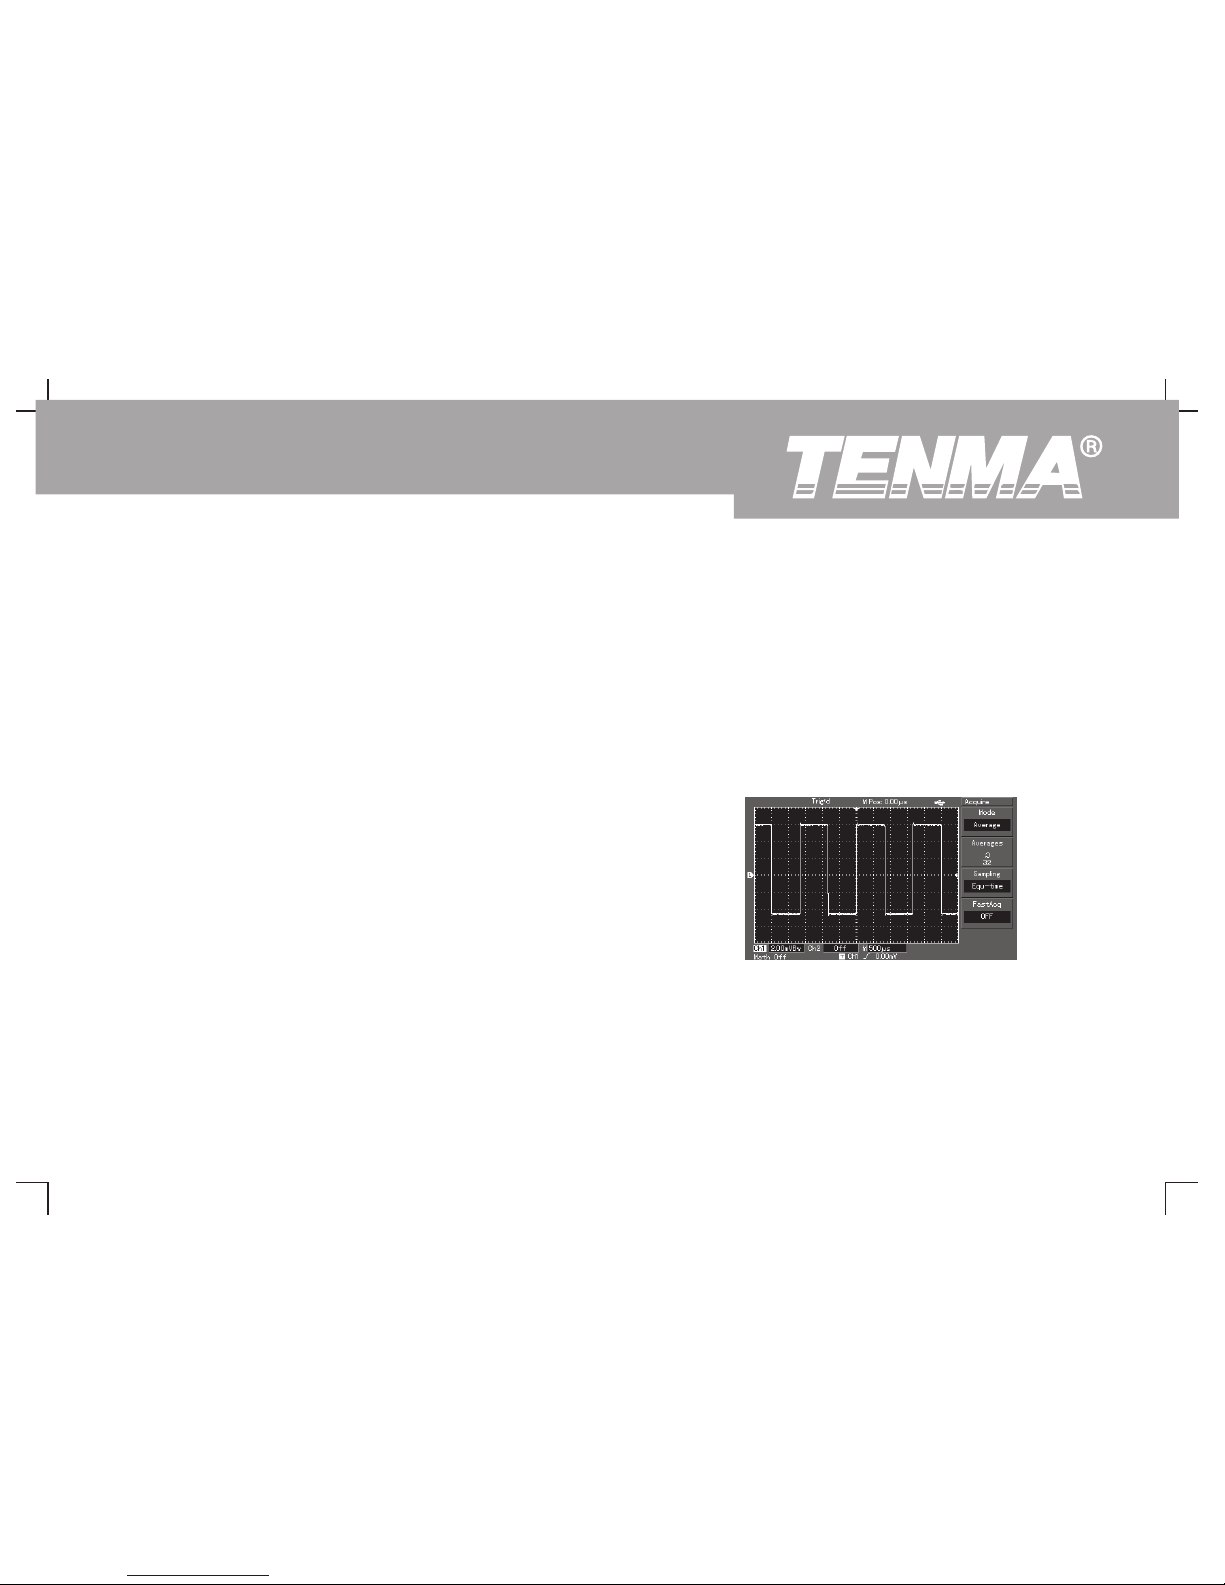
3. Improving trigger by setting trigger coupling. reduced and details of the signal are clearer. Follow the steps
below :
① Press [TRIG MENU] in the trigger zone to display the trigger
Press [ACQUIRE] in the menu zone of the front panel to
setup menu.
display the sampling setup menu. Press menu operation key
② Set TRIGGER COUPLING to LOW FREQUENCY
[F1] to set acquisition mode to AVERAGE, then press the
SUPPRESSION or HIGH FREQUENCY SUPPRESSION.
multifunction control knob to adjust the average number of
By selecting low frequency suppression a high-pass filter
times in multiples of 2, i.e. 2 to , until you get the
is set up. It filters low frequency signal quantities under
desired waveform display that meets observation and
80kHz and allows high frequency signal quantities to pass
measurement requirements. (See the figure below)
through. If you select high frequency suppression a low-
pass filter is set up. It filters high frequency signal quantities
higher than 80kHz and allows low frequency signal quantities
to pass through. By setting LOW FREQUENCY
SUPPRESSION or HIGH FREQUENCY SUPPRESSION,
you can suppress low frequency or high frequency noise
respectively and achieve a stable trigger.
4. Reducing display noise by setting the sampling mode.
① If the signal being measured is stacked with random noise
and the waveform is too coarse as a result, you can use the
② You can also lower the waveform brightness to reduce display
average sampling mode to eliminate random noise display
noise.
and reduce the size of waveform for easy observation and
measurement. After getting the mean, random noise is
256
Figure 3-5 Signal noise suppressed
Caution :In the average sampling mode the waveform display
will update at a slower rate. This is normal.
67
DSO Series User Ma nual
Page 70
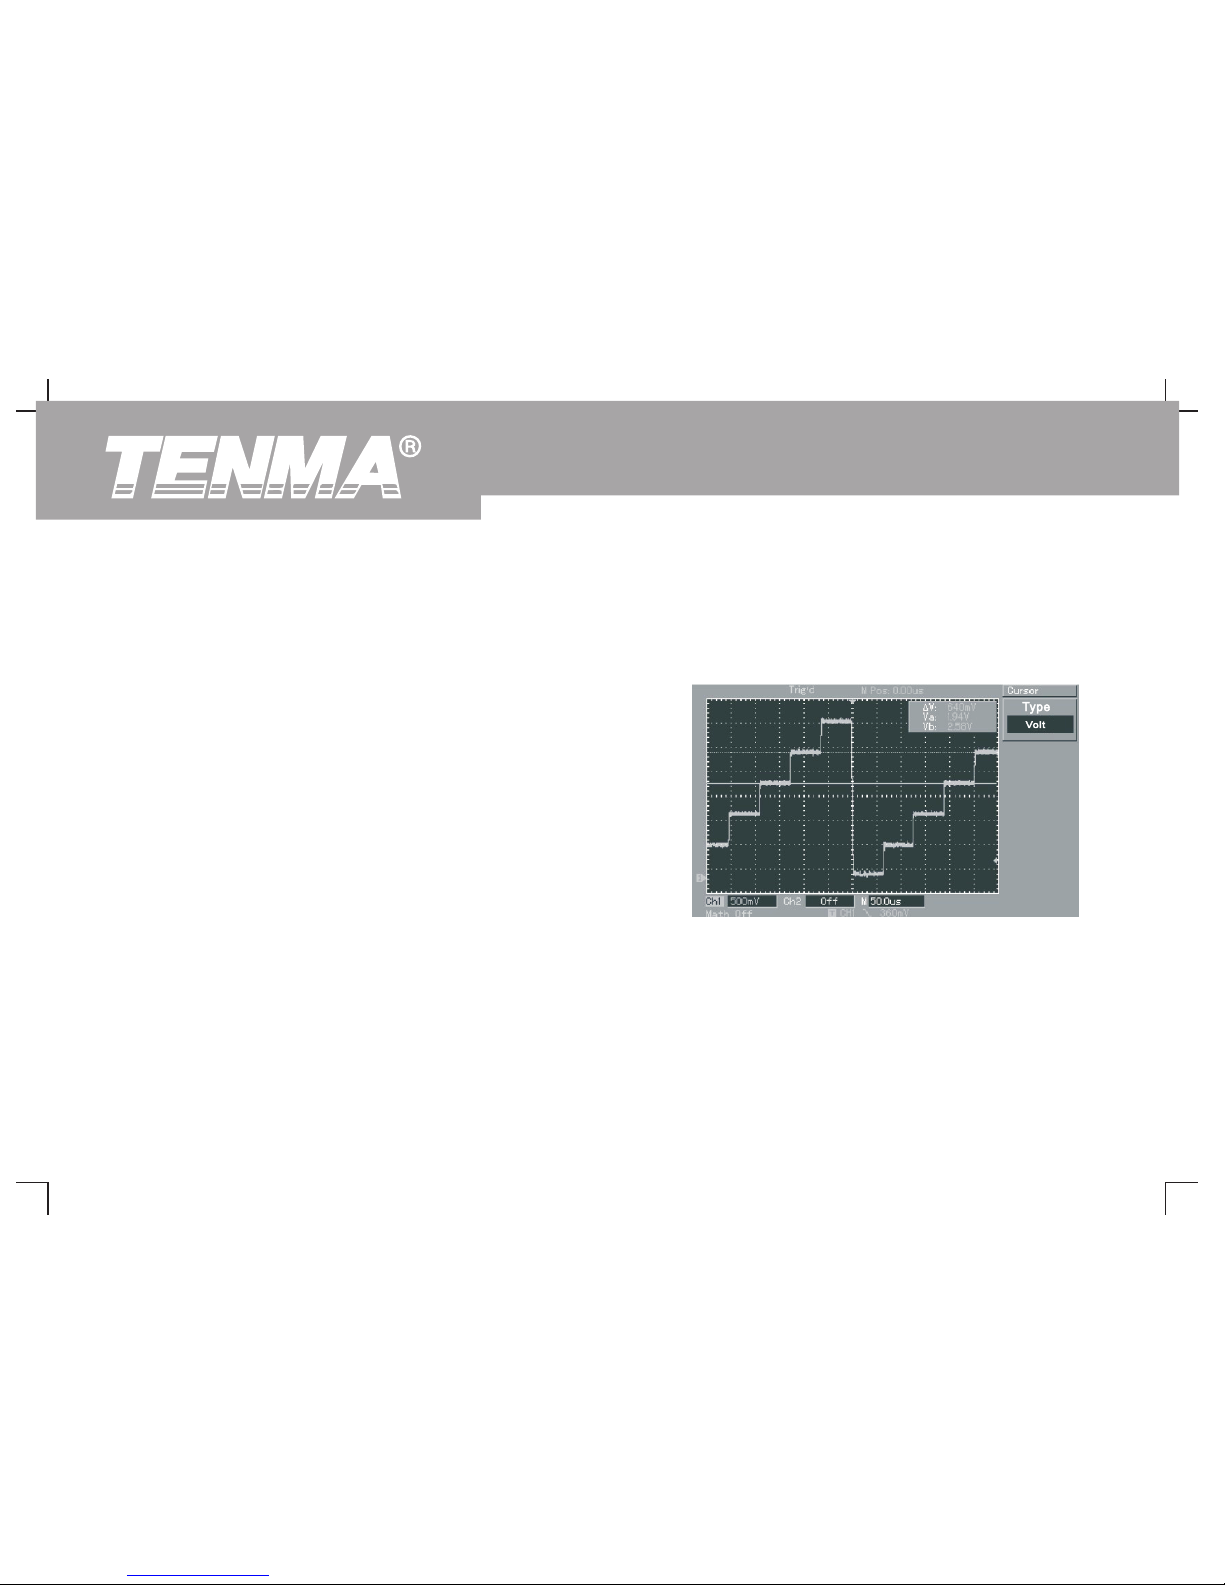
Illustration 5 : Using the cursors for measurement
Your oscil lo scope ca n meas ur e 2 8 wave fo rm param et er s
automatically. All auto parameters can be measured with the cursors.
By using the cursors, you can quickly measure the time and voltage of a
waveform.
Measuring one step voltage of the step signal
To measure one step voltage of the step signal, follow the steps below :
1. Press [CURSOR] to display the cursor measurement menu.
2. Press menu operation key [F1] to set cursor type to VOLTAGE.
3. Turn the multifunction control knob to set cursor 1 at one step
voltage of the step signal.
4. Press [PUSH SELECTED] to select the cursor, then turn the
multifunction control knob again to set cursor 2 at another step
voltage of the step signal.
The cursor menu will automatically display the V value, i.e. the voltage
difference of that point. See the figure below.
Note : When using the cursors to measure time, follow step 2
only and set the cursor type to time.
Figure 3-6 : Using the cursors to test signal voltage
68
DSO Series User Ma nual
Page 71

and calculate the phase difference. (see the figure below)
Illustration 6 : Using the X-Y function
To check the phase difference between two channels.
Example : To measure the phase variation when a signal passes
through the circuit, connect your oscilloscope to the circuit and
monitor the input and output signals. To check the circuit's input and
output in the X-Y coordinate mode, follow the steps below :
1. Set the attenuation factor of the probe to 10X. Set the switch of the
probe to 10X.
2. Connect the CH1 probe to the input terminal of the network.
Connect the CH2 probe to the output terminal of the network.
3. If the channel is not displayed, press the [CH1] and [CH2] menu
button to enable the two channels.
4. Press [AUTO].
5. Adjust the vertical scale knob to make the displayed amplitude of
the two channels to about equal.
6. Press the [DISPLAY] menu key to recall the display menu.
7. Press F2 to select X-Y. The oscilloscope will display the circuit's
input and output characteristics in a Lissajous figure.
8. Adjust the vertical scale and vertical position knob to achieve
the best result of waveform.
9. Using the elliptic oscilloscope display graph to observe, measure
Figure 3-7
Signal must be
horizontally central
If sinθ = or ,
θ is the angle of disparity between the channels. For definitions of A,
B, C, D see the above figure. Calculating with this formula, the
angle of disparity is
θ = ±arcsin( ) or θ= ±arcsin ( )
If the elliptic main axis is within quadrants I and III, the angle of disparity
should be within quadrants I and IV, i.e. inside (0~ ) or ( ~ ).
If the main axis is within quadrants II and IV, the angle of disparity should
be within quadrants II and III, i.e. inside ( ~ ) or ( ~ ).
π
3π
2
π
2
A
B
C
D
A
B
C
D
2π
π
2
π
3π
2
69
DSO Series User Ma nual
Page 72
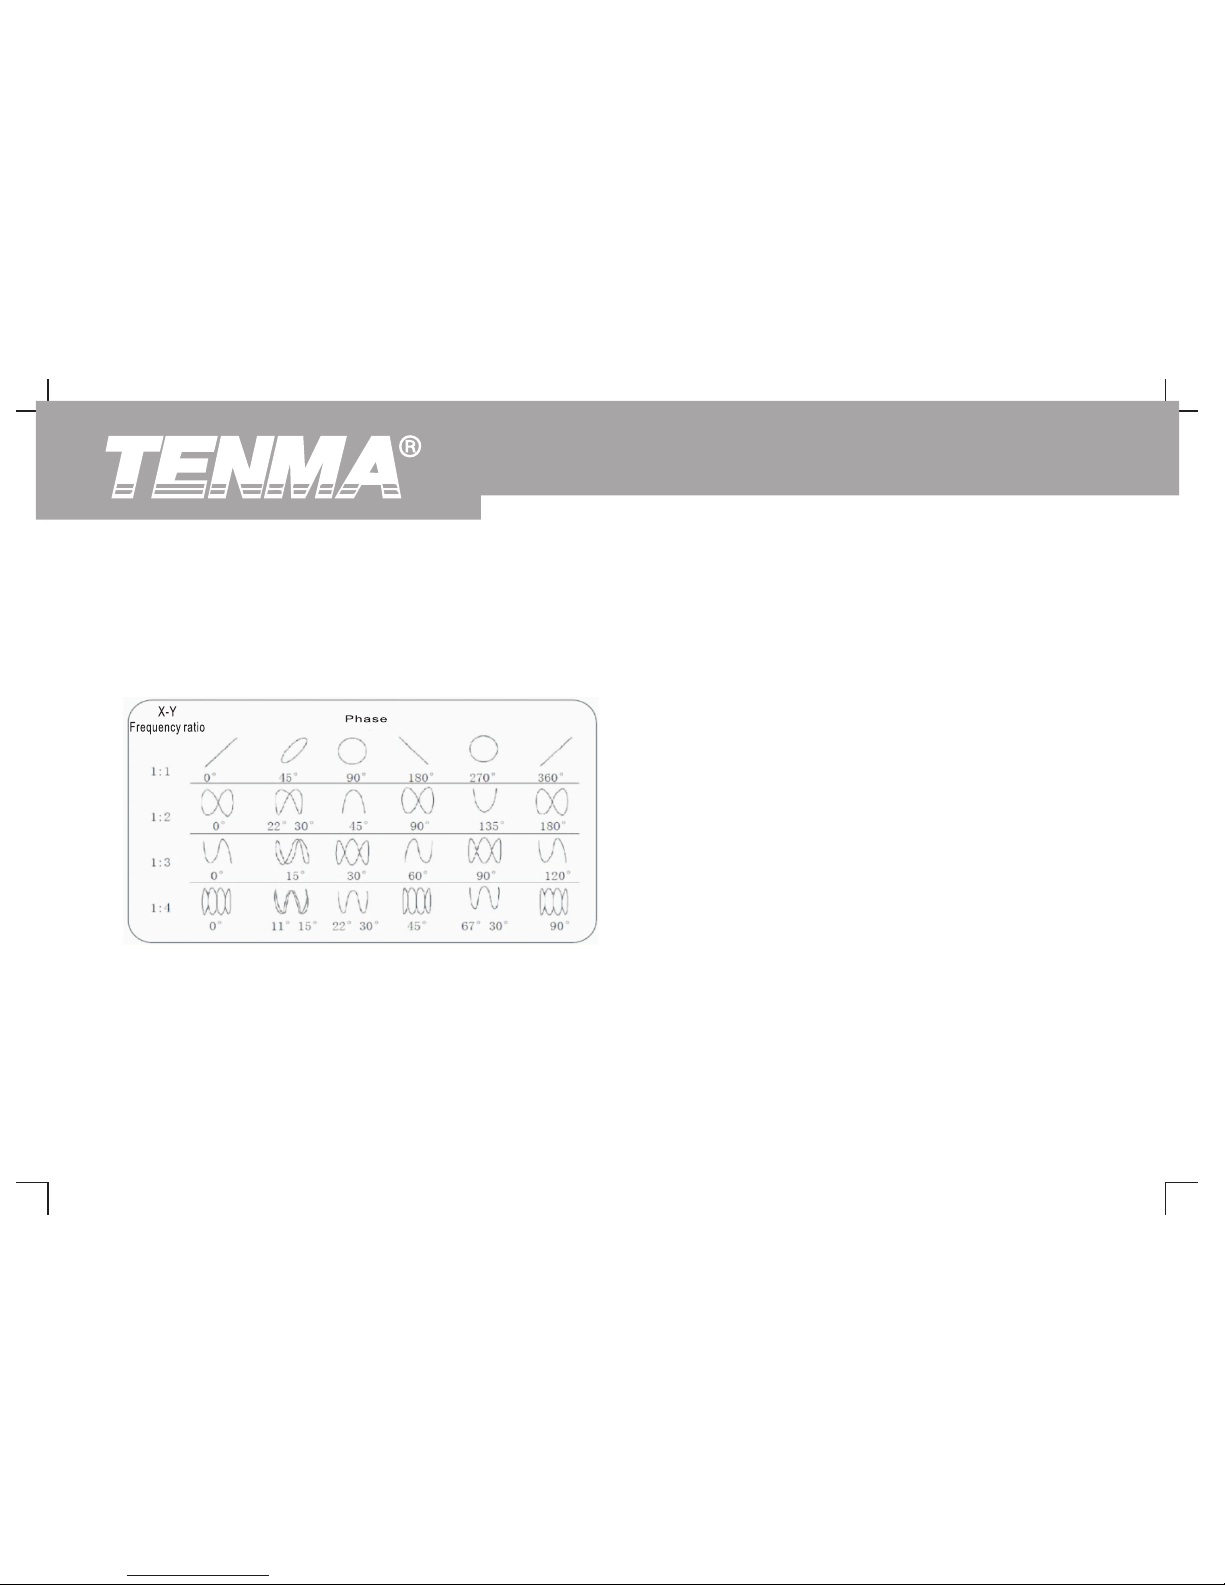
Furthermore, if the frequencies and phase differences of two signals
Illustration 7 : Using the USB upgrade program
being measured are whole multiples, you can calculate the frequency
The USB upgrade program makes upgrade easier and more flexible. To
and phase correlation between the two signals.
use this function follow the steps below :
1. Check the model name, software and hardware versions of your
10. X-Y Phase difference table :
oscilloscope in Table 2-19.
2. Download the highest version of the update program document
that matches your model, software and hardware versions online,
and store it on the USB device (preferably a USB device
recommended by us).
3. Power off the oscilloscope then insert the USB device. Then
power on the oscilloscope again. The prompt “Please press [F5]
to continue or [F1] to cancel” appears on the screen, as shown in
the figure on the right.
70
DSO Series User Ma nual
Page 73
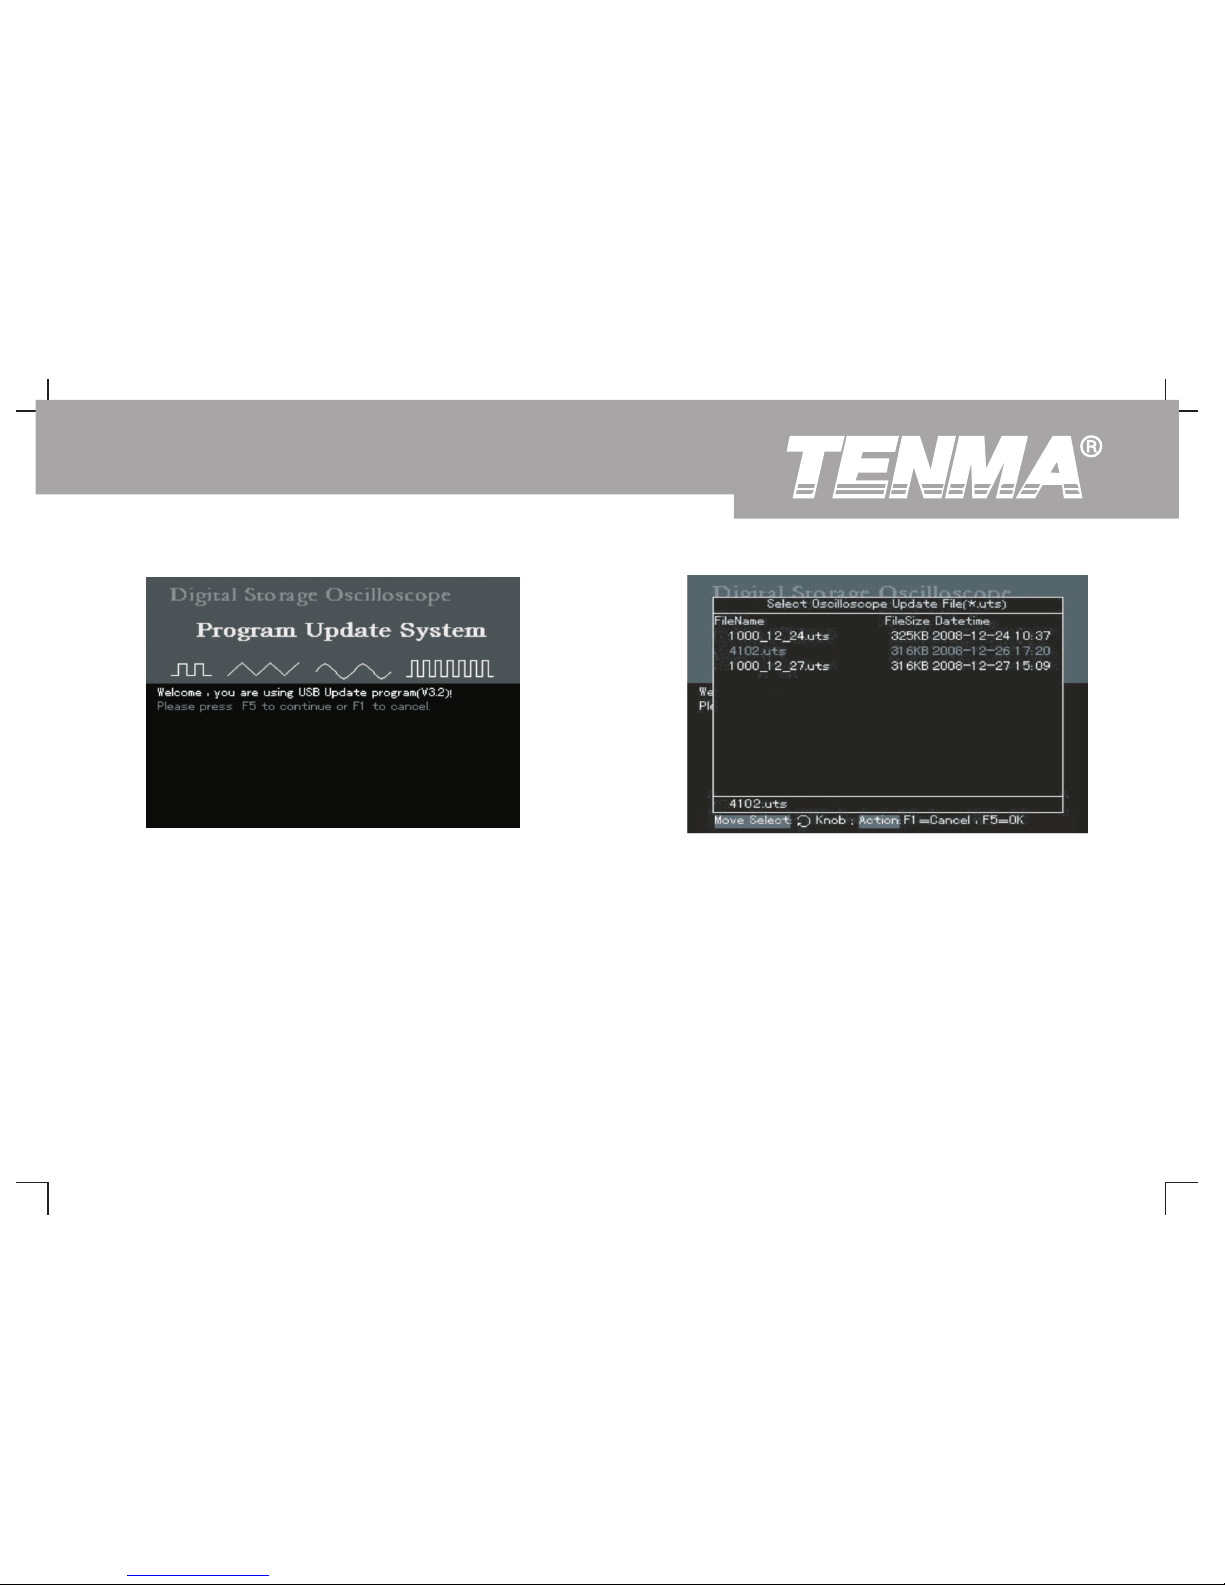
After pressing F5, the screen will prompt you to select the update
program, as shown in the following figure. You can now select the
required update program with the multifunction control knob then press
4. When [F5] is pressed as shown in Figure 3-9, the prompt on the
[F5] to move to the next step (If there is only one program on the USB
right will appear : “Are you sure you wish to update? If yes, press
device, the following screen will not appear. The system will move
[F5], otherwise press [F1] to cancel upgrade”.
straight to the next step).
Figure 3-8 USB update confirmation
Figure 3-9 Selection of the USB upgrade
document
71
DSO Series User Ma nual
Page 74
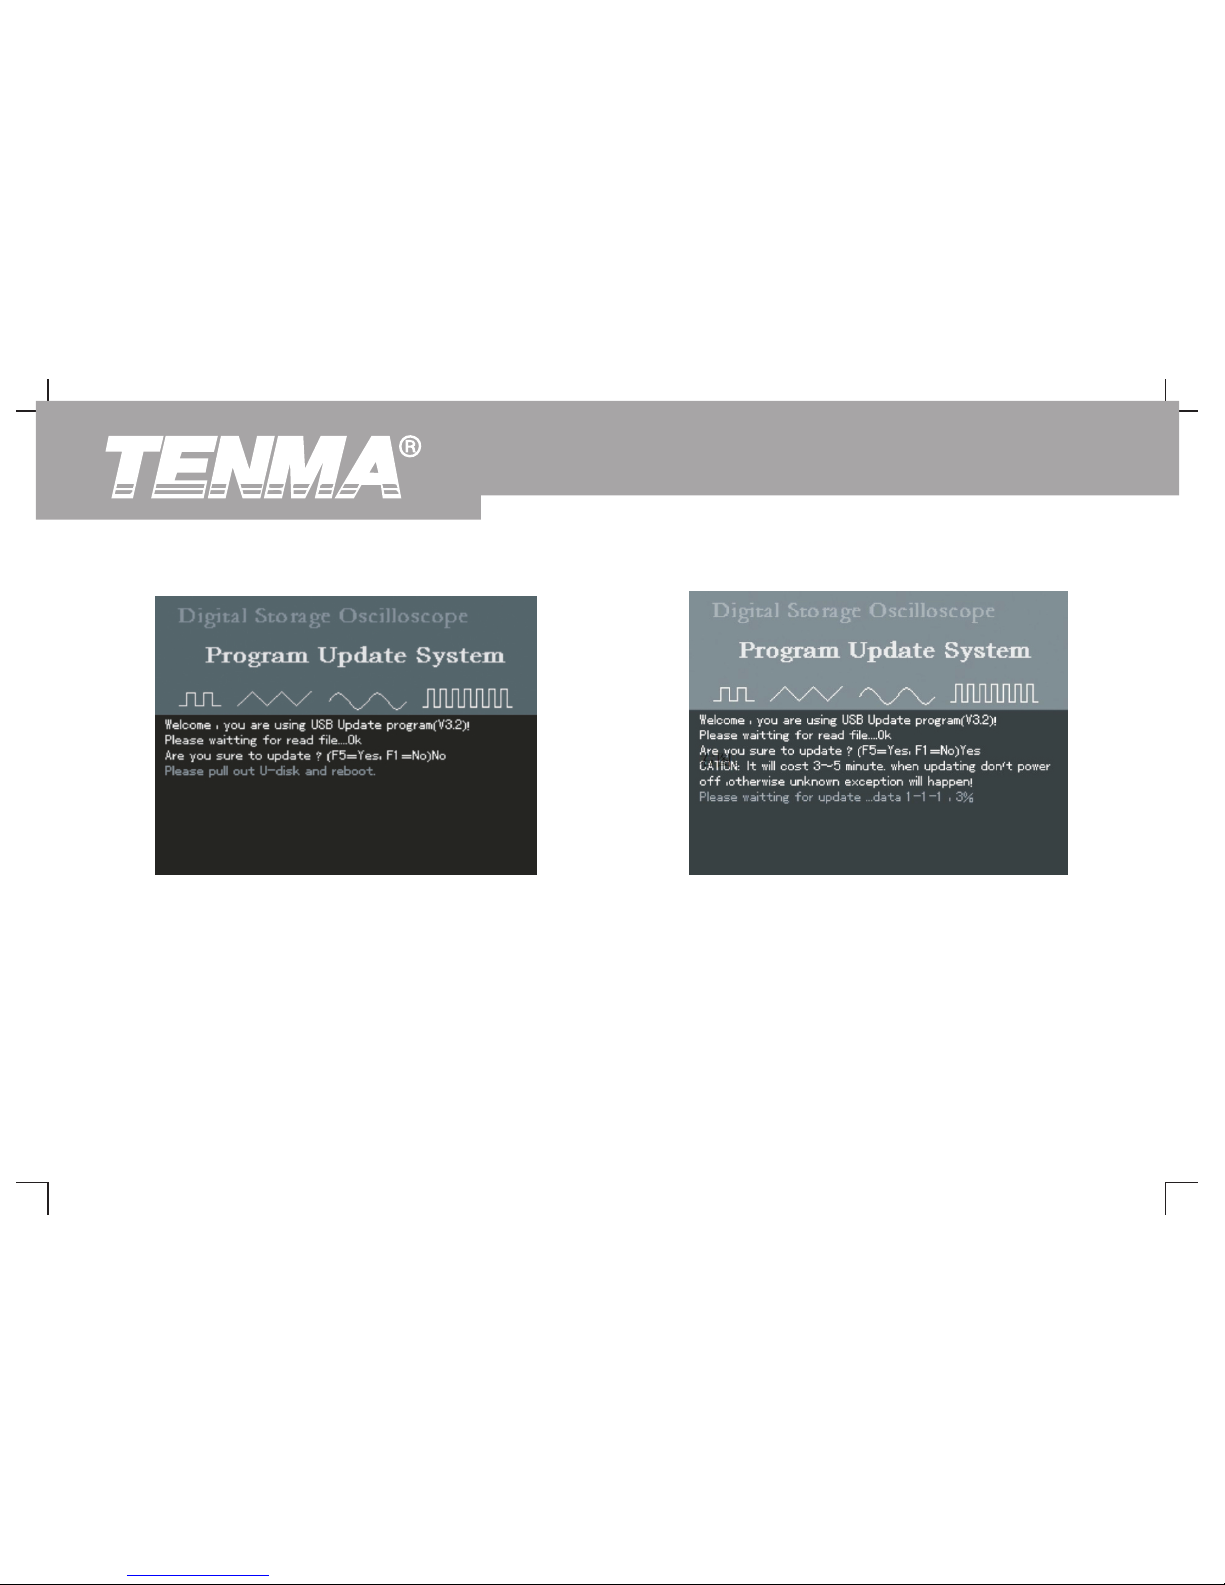
6. When update is complete, a successful update prompt will appear :
“Upgrade is successfully complete. Please remove USB device,
5. When the USB document is confirmed the following prompt will
then power off your oscilloscope and power it back on again to
appear : “System upgrade is in progress. Please wait”. (This
complete the process.” The oscilloscope program is now
process may take 3 to 5 minutes)
updated and system upgrade is complete. In the event of update
failure, follow the steps below.
Figure 3-10 Confirming the USB update
document
Figure 3-11 USB upgrade in progress
72
DSO Series User Ma nual
Page 75
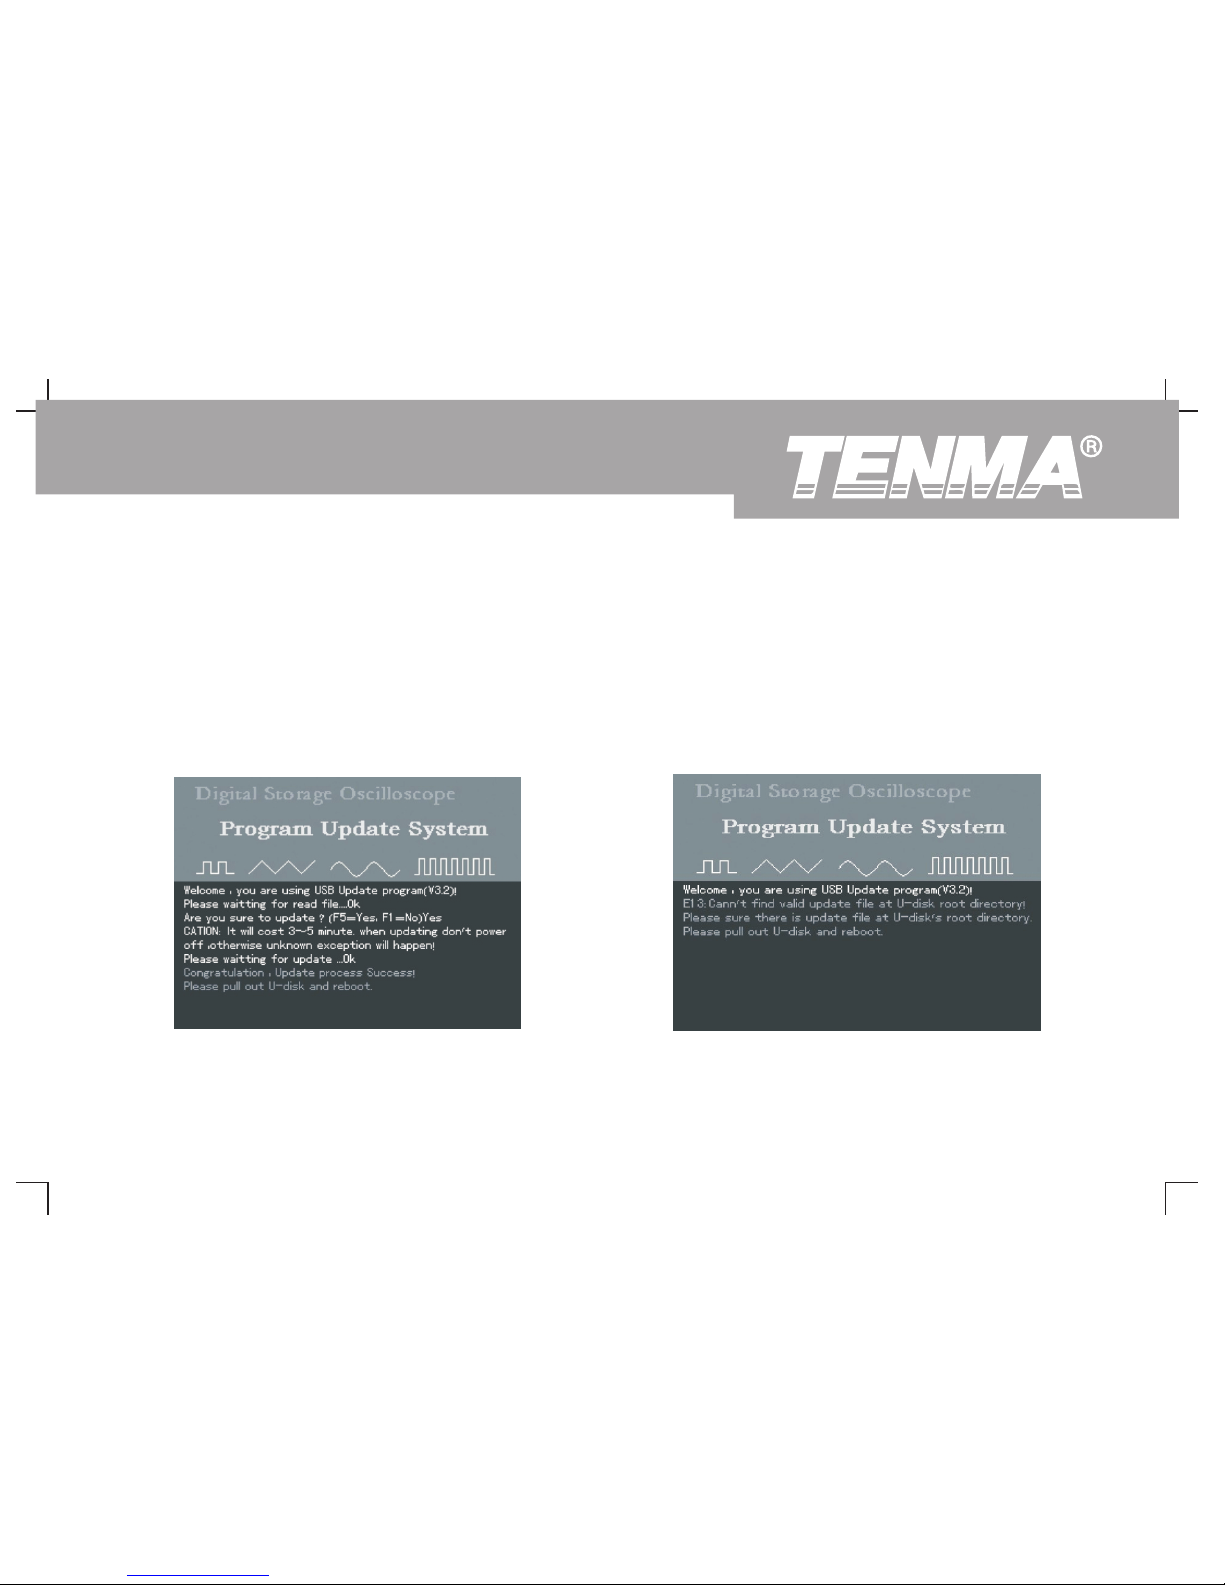
Caution : If upgrade fails due to power interruption, power off the
oscilloscope and repeat all the USB update steps.
Below are some common causes for update failure :
1. No update document.
If there is no document with the suffix “ uts”, the following
message will appear when [F5] is pressed after powering on :
“Can't find the valid update file! Please ensure there is update file on
the USB device then restart the operation.”.
Figure 3-12 Successful USB update
Figure 3-13 No valid update document
73
DSO Series User Ma nual
Page 76
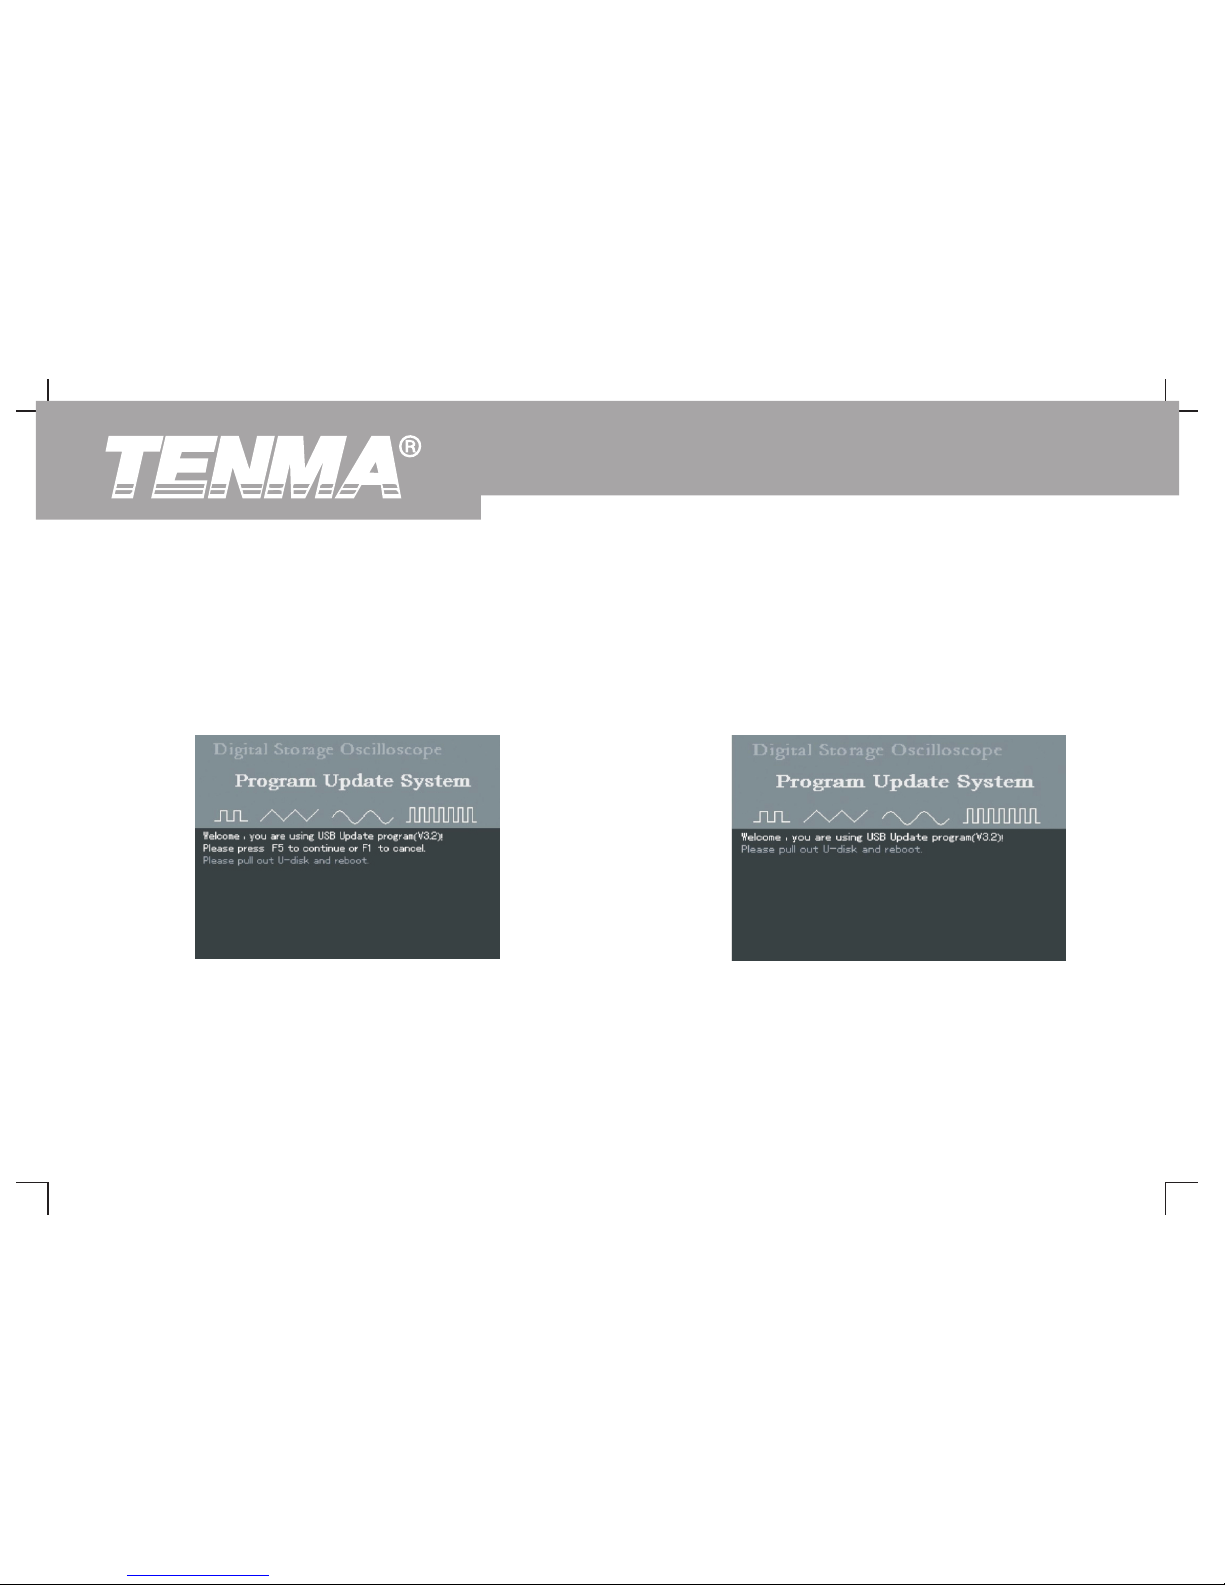
2. The user cancels the update process. ② During the update process, you can cancel update by
pressing [F1]. To cancel upgrade and operate your
① When the oscilloscope is restarted with the USB device
oscilloscope normally, follow the on-screen instructions :
plugged in, you can cancel upgrade by pressing [F1]. To
“Remove the USB device and reboot.”
cancel upgrade and operate your oscilloscope normally,
follow the on-screen instructions : “ Remove the USB
device and reboot.”
Figure 3-14 Cancel update (1)
Figure 3-15 Cancel update (2)
74
DSO Series User Ma nual
Page 77
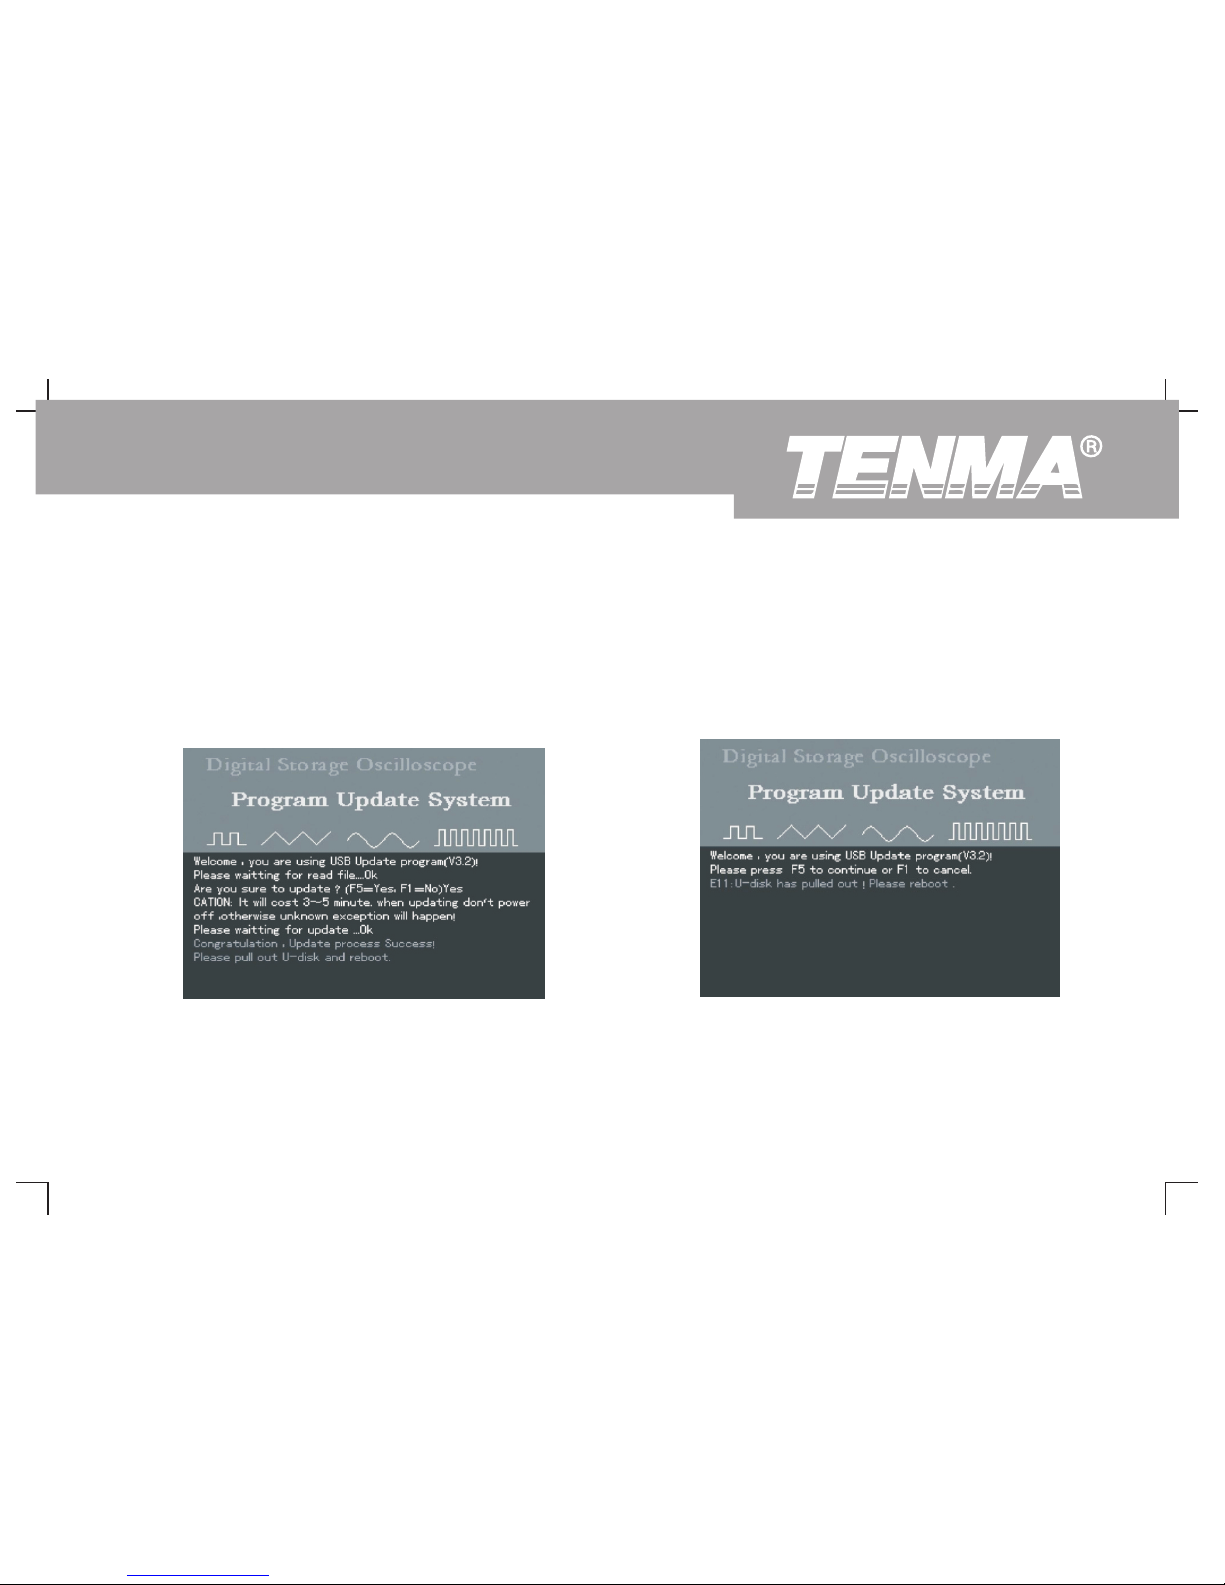
③ You can still cancel update when the oscilloscope is ready 3. The USB device is removed before update begins
for the process. Simply press [F1] to return to normal
If the USB device is removed when the update document is being
operation. Please follow the on-screen instructions :
read before commencement of update, the following prompt will
“Remove the USB device and reboot.”
appear : “USB device has been removed! Please reboot.” To
resume normal operation, power on the oscilloscope with the USB
device unplugged.
Figure 3-16 Cancel upgrade (3)
Figure 3-17 USB device is removed before update
75
DSO Series User Ma nual
Page 78
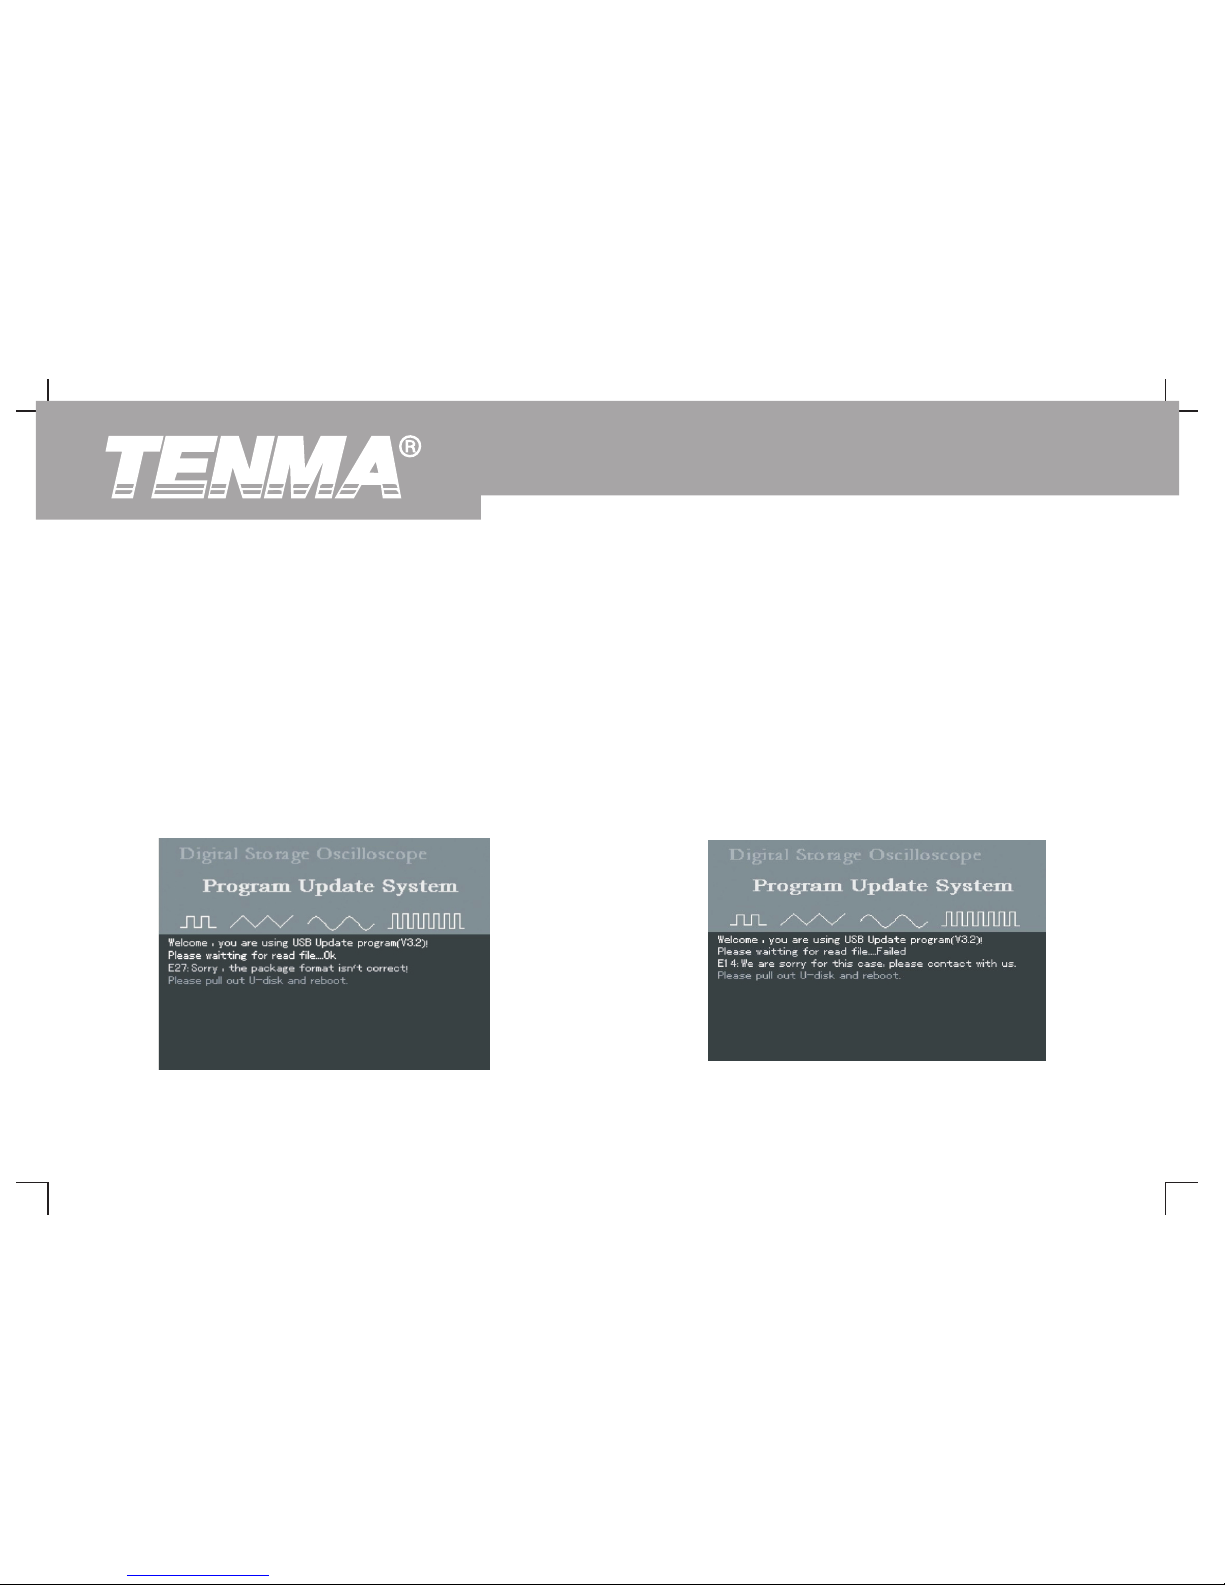
4. Incorrect update document 5. Failure in reading update document
If the version of the update document on the USB device is
After selecting the update document, press [F5] to read. If the
incorrect, update will fail upon selecting the upgrade document
document cannot be read, you will see the prompt : “Sorry,
by pressing [F5] (Figure 3-18). You will see the prompt :
upgrade has failed. Please contact our after-sales service
“Incorrect upgrade document”. Save a correct document
department” . It may be that our oscilloscope does not
on the USB device and repeat the previous steps for
support your USB device, or document reading is
upgrade.”
unsuccessful due to other reasons. You can retry and see if
the problem can be solved, or use a USB device we recommend.
If the problem persists, contact our after-sales service
department. To resume normal operation, power off your
oscilloscope and then reboot.
Figure 3-18 Incorrect update document version
Figure 3-19 Reading failure
76
DSO Series User Ma nual
Page 79
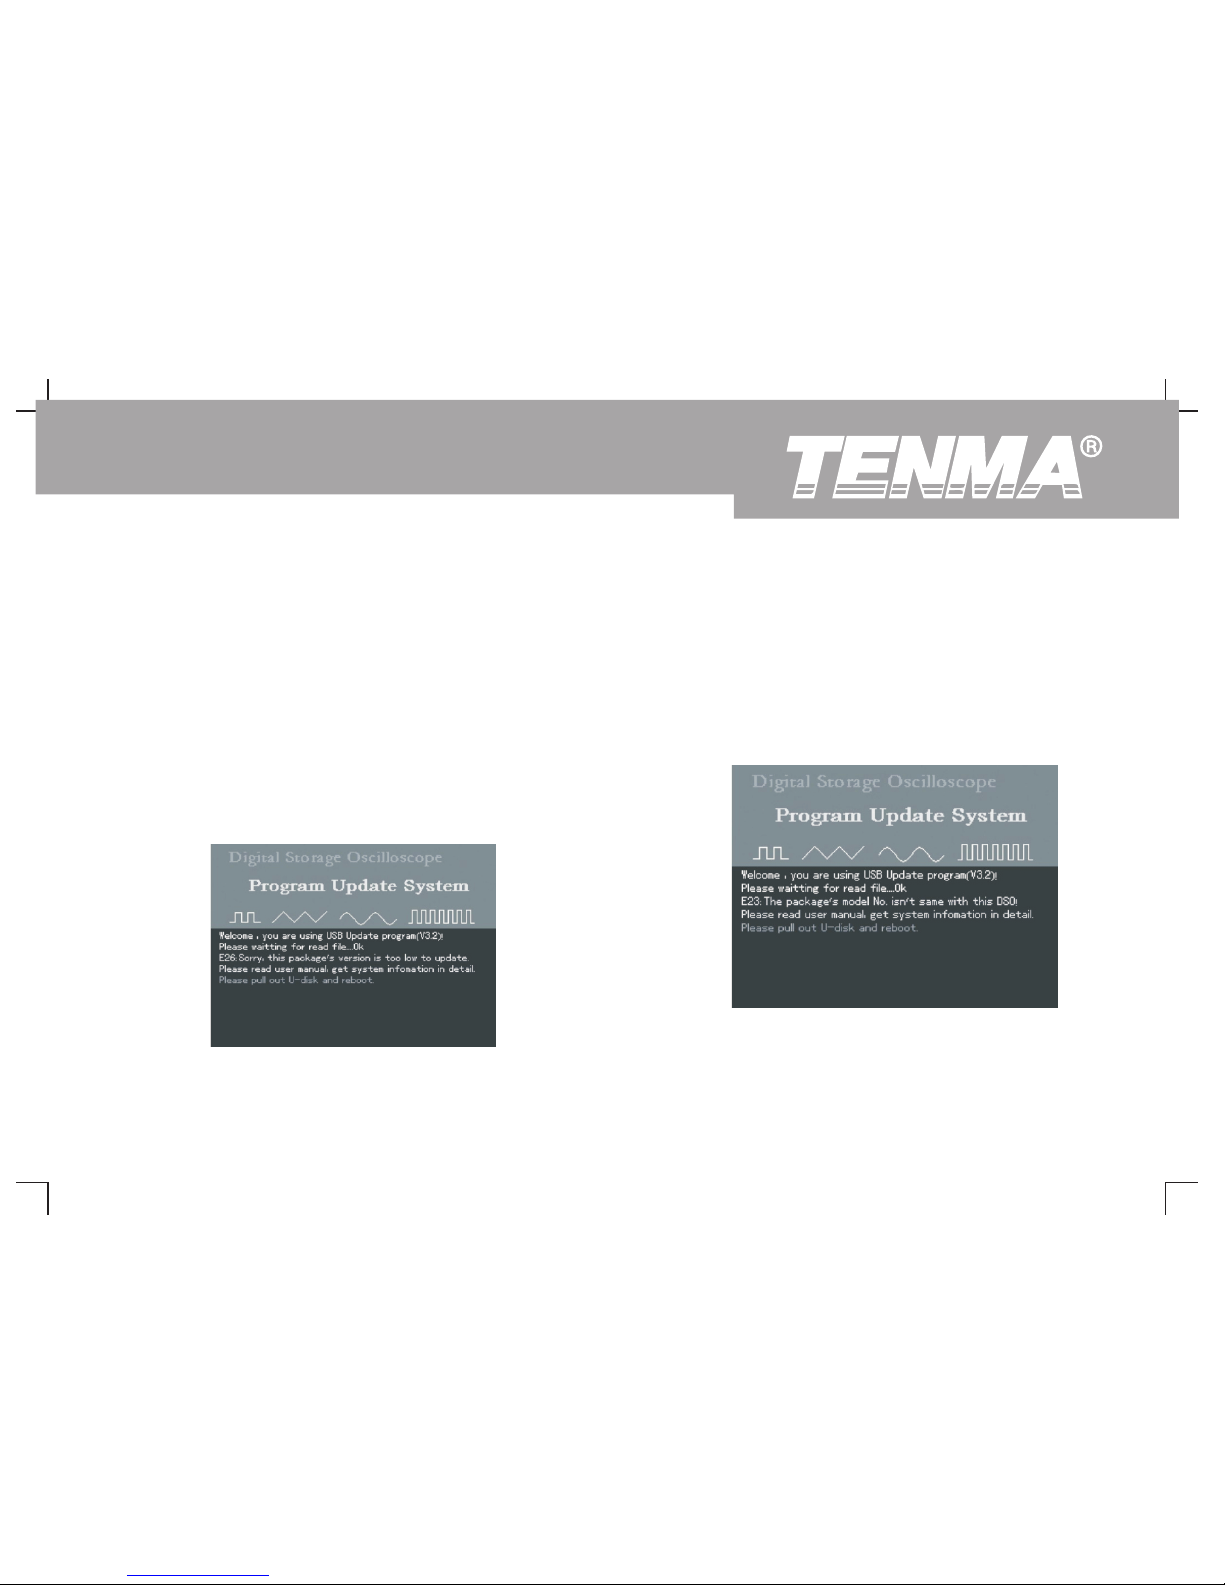
6. Low software version 7. Software document incompatible with product model
If the USB update document is incompatible with the oscilloscope
If the version of USB document is lower than that of the
model, update will fail. You will be prompted that, “Software and
oscilloscope, update will fail. You will be prompted that,
product model incompatible. Please read the user manual for
“ Software version too low. Please read the user manual for
further instructions.” You should download an update
further instructions.” This indicates that the software version
document which corresponds with your oscilloscope model,
you have saved on to the USB device is lower than the
e.g. 72-8710, then repeat the USB update steps.
existing one on the oscilloscope. You should acquire the
correct version either online or through our after-sales service
department. To see version information, press [UTILITY]
[SYSTEM CONFIGURATION] [SYSTEM INFORMATION].
Please download the suitable update document.
Figure 3-20 Low software version
Figure 3-21 Incompatible software document and
product model
77
DSO Series User Ma nual
Page 80
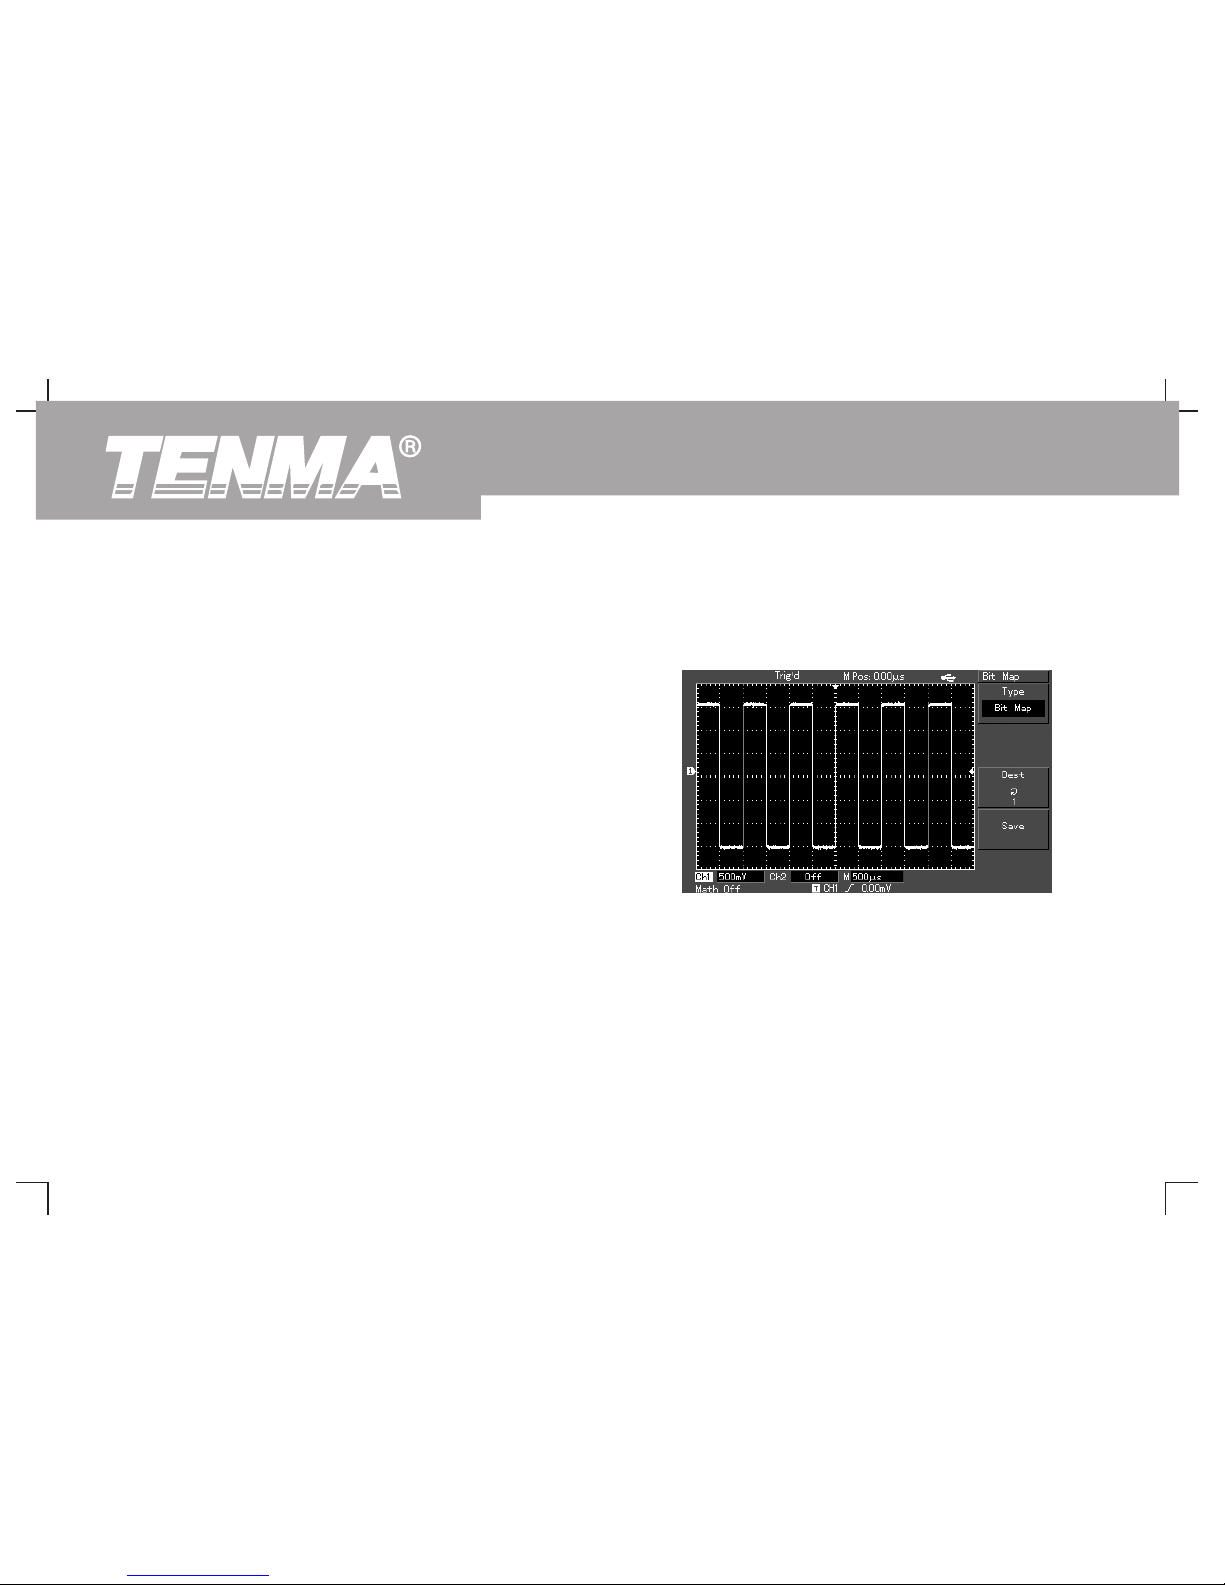
Illustration 8 : Screen copy
You can press the screen copy key (PrtSc) to intercept a full screen. To
use this function, follow the steps below :
1. Press the screen copy key (PrtSc), copying is done when the
completion screen is displayed.
2. Store the intercepted graphic on the USB device. Insert the USB
device, press [STORAGE] and select bitmap in the type menu.
Select any storage position between 1 and 200 with the
multifunction control knob, then press F4 (storage key) to
complete the storage process.
Note : When the USB device is plugged into DSO, the graphic will be
stored on the USB directly.
Figure 3-22 Copying a screen on to the USB
device
78
DSO Series User Ma nual
Page 81

Troubleshooting
Chapter 4 System Prompts and
1. If the screen of your oscilloscope remains black without any display
Trouble-shooting
after powering on, follow the steps below to find the cause :
Definitions of System Prompts
① Check the power cable connection and check if there is normal
Adjustment at Ultimate Limit : This informs you that the multifunction
power supply.
control knob has reached its adjustment limit in the current status. No
② Check if the power switch is properly pressed.
further adjust is possible. When the vertical deflection factor switch,
③ Restart the unit after performing the above checks.
time base switch, X shift, vertical shift and trigger level adjustments
④ If the unit still fails to work, contact Tenma to request service.
have reached their ultimate limits, this prompt will appear.
2. If no waveform is displayed after you have acquired a signal, follow
USB Device Installed : After a USB device is plugged into the
the steps below to find the cause :
oscilloscope, this prompt appears when the connection is valid.
① Check whether the probe is properly connected to the signal
lead.
USB Device Unplugged : After a USB key is unplugged from the
② Check whether the signal lead is properly connected to the
oscilloscope, this prompt appears.
BNC (channel adaptor).
Saving : When the oscilloscope is saving a waveform, this prompt is
③ Check whether the probe is connected properly to the object to
shown on the screen. A progress bar appears at the bottom.
be measured.
Loading : During waveform recall, this prompt is shown on the screen.
④ Check whether the object for measurement is generating
A progress bar appears at the bottom.
signals (connect the channel with signals to the questionable
channel to find the cause).
⑤ Restart the acquisition process.
79
DSO Series User Ma nual
Page 82

3. The measurement voltage amplitude value is 10 times larger or MODE to AUTO.
smaller than the actual value :
② Press [AUTO] to complete the automatic setup.
Check if the channel attenuation factor corresponds with the
6. Display speed is slow after average sampling time is enabled :
probe attenuation you have chosen.
① If average sampling is carried out for more than 32 times,
4. There is waveform display but it is not stable :
the display speed will drop. This is normal.
① Check the TRIGGER SOURCE setup in the trigger menu.
② You can reduce the intervals of average sampling.
See whether it is the same as the actual signal input
7. Trapezoidal waveform display :
channel.
① This is normal. The reason is possibly horizontal time base
② Check the trigger type : Use EDGE TRIGGER for ordinary
range is too low. You can improve horizontal pixel aspect
signals and VIDEO TRIGGER for video signals. Stable
ratio and enhance the display quality by increasing the
waveform display is achieved only when the correct
horizontal time base.
trigger mode is selected.
② If the display type is VECTOR, the connection between
③ Tr y cha ngi n g th e COU P LIN G dis p lay to H I GH
sampling dots may cause a trapezoidal waveform. Set the
FREQUENCY SUPPRESSION or LOW FREQUENCY
display type to DOT to solve this problem.
SUPPRESSION to filter any high or low frequency noise
that is interfering with triggering.
5. No display after pressing [RUN/STOP] :
① Check if the TRIGGER MODE is set to NORMAL or SINGLE
in the menu, and whether the level exceeds the waveform
range.
If so, move the trigger level to the centre or set TRIGGER
80
DSO Series User Ma nual
Page 83
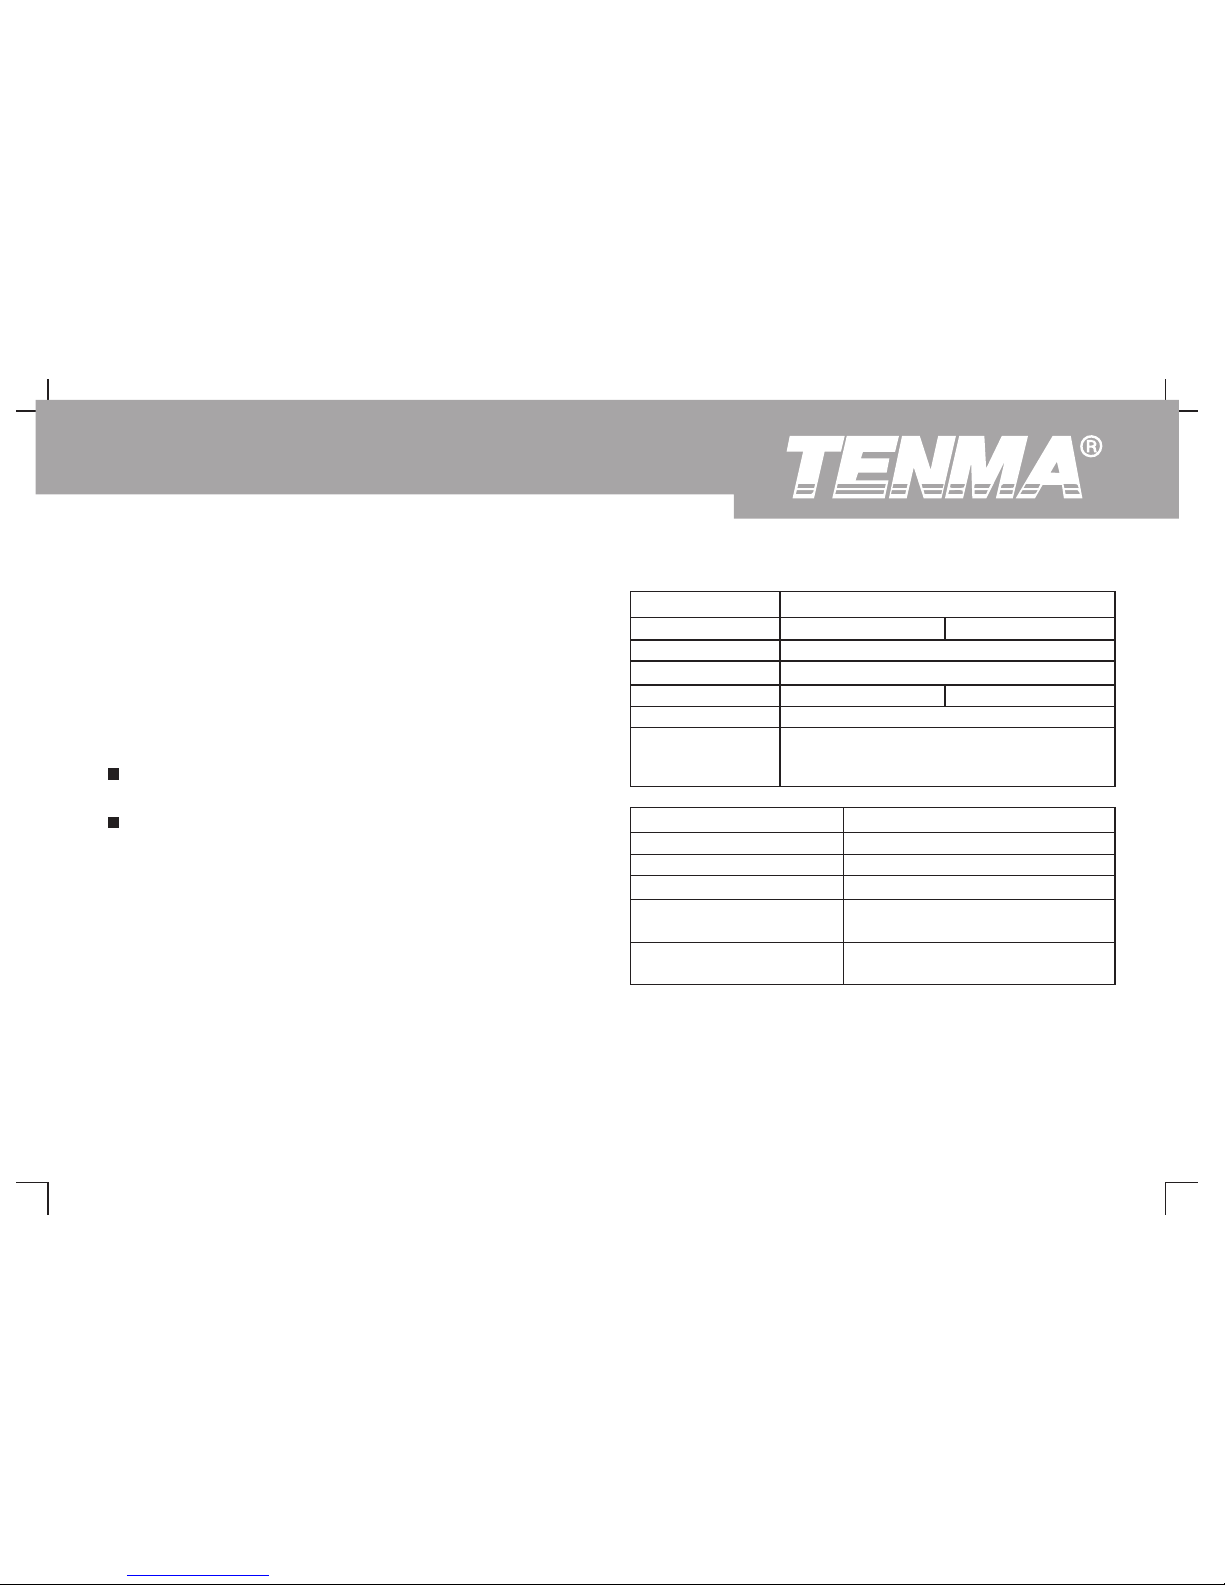
Technical Indicators
Chapter 5 Appendixes
Appendix A : Technical Indicators
Unless otherwise specified, all technical specifications apply to probes
with attenuation setting of 10X and the DSO Series Digital
Oscilloscope. To verify that your oscilloscope meets specifications, it
must first meet the following conditions :
n The oscilloscope must have been operating continuously for
thirty minutes at the specified operating temperature.
n If the operating temperature changes by more than 5°C, you
must perform the “Self Cal” operation, accessible through
the system functions menu. All specifications are guaranteed
unless noted “Typical”.
81
Samp ling
Sampling modes
Real time sampling
Equivalent sampling
Bandwidth
Sampling
Average value
72-8710
72-8705
1GS/s
100MHz 50MHz
Sampling, peak detect, average
When all channels have made N samplings
simultaneously, N is selectable from 2, 4, 8, 16,
32, 64, 128 to 256
50GS/s
Inpu t
Input coupling
Input impedance
Probe attenuation factor
Maximum input voltage
Ti m e d el ay b e t we en
channels (Typical)
DC, AC, GND
1MΩ ± 2% in parallel with 20 ± 3pF
400V (DC + AC Peak, 1MΩ input
impedance)
150ps
1 , 10×, 100×, 1000××
DSO Series User Ma nual
Page 84
82
Horizontal
Waveform interpolation
Recording length
Saving depth
Scanning range (s/div)
Accuracy of sampling rate
and delay time
Sin (x) / x
2 x 600k sampling dot
2ns/div-50s/div ( at 1-2-5 increment)
± 50ppm (any time interval ≥ ms)1
25k for single channel; k for dual channels12.5
Time interval (ΔT)
Me as ur ement ac cu ra cy
(full bandwidth)
Single : ± ( sampling time interval + ppm x reading + ns);
> average values : ± ( sampling time interval + ppm x
reading + ns)
1 50 0.6
16 1 50
0.4
DSO Series User Ma nual
Page 85
83
Verti call
A/D converter
Deflection factor range
(VOLTS/DIV)
Position range
Single bandwidth
8-bit resolution
1 mV/div ~ 20V/div (at input BNC)
± div10
100MHz(72-8710),50MHz(72-8705)
Vo l t a g e d i f f e r e n c e ( Δ V )
m e a su re me nt a c c ur ac y
(average acquisition mode)
When vertical position is zero and N ≥16 :
± ( x reading + div + mV) and mV/div~ mV/div is selected;
± ( x reading + div + mV) and mV/div is selected;
± ( x reading + div + mV) and mV/div~ V/div is selected;
When vertical position is not zero and N ≥16 :
± [ x (reading + vertical shift reading) + ( x vertical shift reading)] + div). Set from
mV/div to mV/div plus mV;
Setup value > 200mV/div to
20V/div plus 50mV.
5% 0.1 1 1 2
4% 0.1 1 5
3% 0.1 1 10 2 0
3% 1% 0.2
5 200 2
100MHz(72-8710),50MHz(72-8705)
Analog bandwidth
Selectable analog
bandwidth limit (Typical)
20MHz
Low frequency response
(AC coupling, -3dB)
≤ Hz at BNC10
Rise time
3.5ns,7ns at 100MHz and 50MHz bandwidths respectively
DC gain accuracy
When vertical sensitivity is 1mV/div~2mV/div : ± 5% (sample or average acquisition mode);
When vertical sensitivity is 5mV/div : ± 4% (sample or average acquisition mode);
When vertical sensitivity is 10mV/div~
20V/div : ± 3% (sample or average acquisition mode)
DC measurement accuracy
(average acquisition mode)
Under identical setup and environmental conditions, the voltage difference (ΔV) between any two
points of the waveform after the average of ≥16 waveforms acquired waveforms is taken : ± ( x
reading + div)
3%
0.05
DSO Series User Ma nual
Page 86
84
Trigger
Trigger sensitivity
Trigger level range
Trigger level accuracy (Typical)
applied on signals of ≥20ns rise
or fall time
Holdoff range
Internal trigger : div; external trigger : V1 0.2
± div from the centre of the screen8
± ( div x V/div) (within ± div from the centre of the screen)0.3 4
100ns-1.5s
(Greater than, less than or equal to) positive pulse; (Greater than, less than or equal to) negative pulse
Normal mode/scanning mode, pretrigger/delayed trigger. Pretrigger depth is adjustable
Pretrigger capability
Set level to 50% (Typical)
Input signal frequency ≥50Hz
Edge Trigger
Edge type
Rise, fall, rise and fall
Pulse Trigger
Trigger mode
Pulse width range
20 10ns- s
Alternate Trigger
Edge, pulse
A Trigger
B Trigger
Edge, pulse
DSO Series User Ma nual
Page 87
85
Measurement
Cursor
Automatic measurement
Manual mode
Automatic measurement mode
Peak-to-peak, amplitude, maximum, minimum, top, bottom, mean, average, root mean square,
overshoot, preshoot, frequency, cycle, rising time, falling time, positive pulse, negative pulse, positive duty
ratio, negative duty ratio, delay.
Cu sto miz e d p a ram ete r
measurement
3types
Math functions
+,-,×,/
Saving waveforms
Internal : 20 groups of waveforms and 20 setups
USB : 200 groups of screens, 200 groups of waveforms
FFT
Voltage difference (△V) between cursors; time difference ( T) between
cursors; time difference (△T) countdown (Hz) (1/△T)
△
Cursor display is enabled during measurement
Window
Hanning, Hamming, Blackman-Harris, Rectangular
Sampling points
1024 points
± degrees3
Phase difference
Lissajous Figure
Trigger frequency counter
Reading pixel aspect ratio
Trigger sensitivity
Accuracy (Typical)
6
30Vrms
± ppm (including all frequency reference errors and ± word)51 1
DSO Series User Ma nual
Page 88
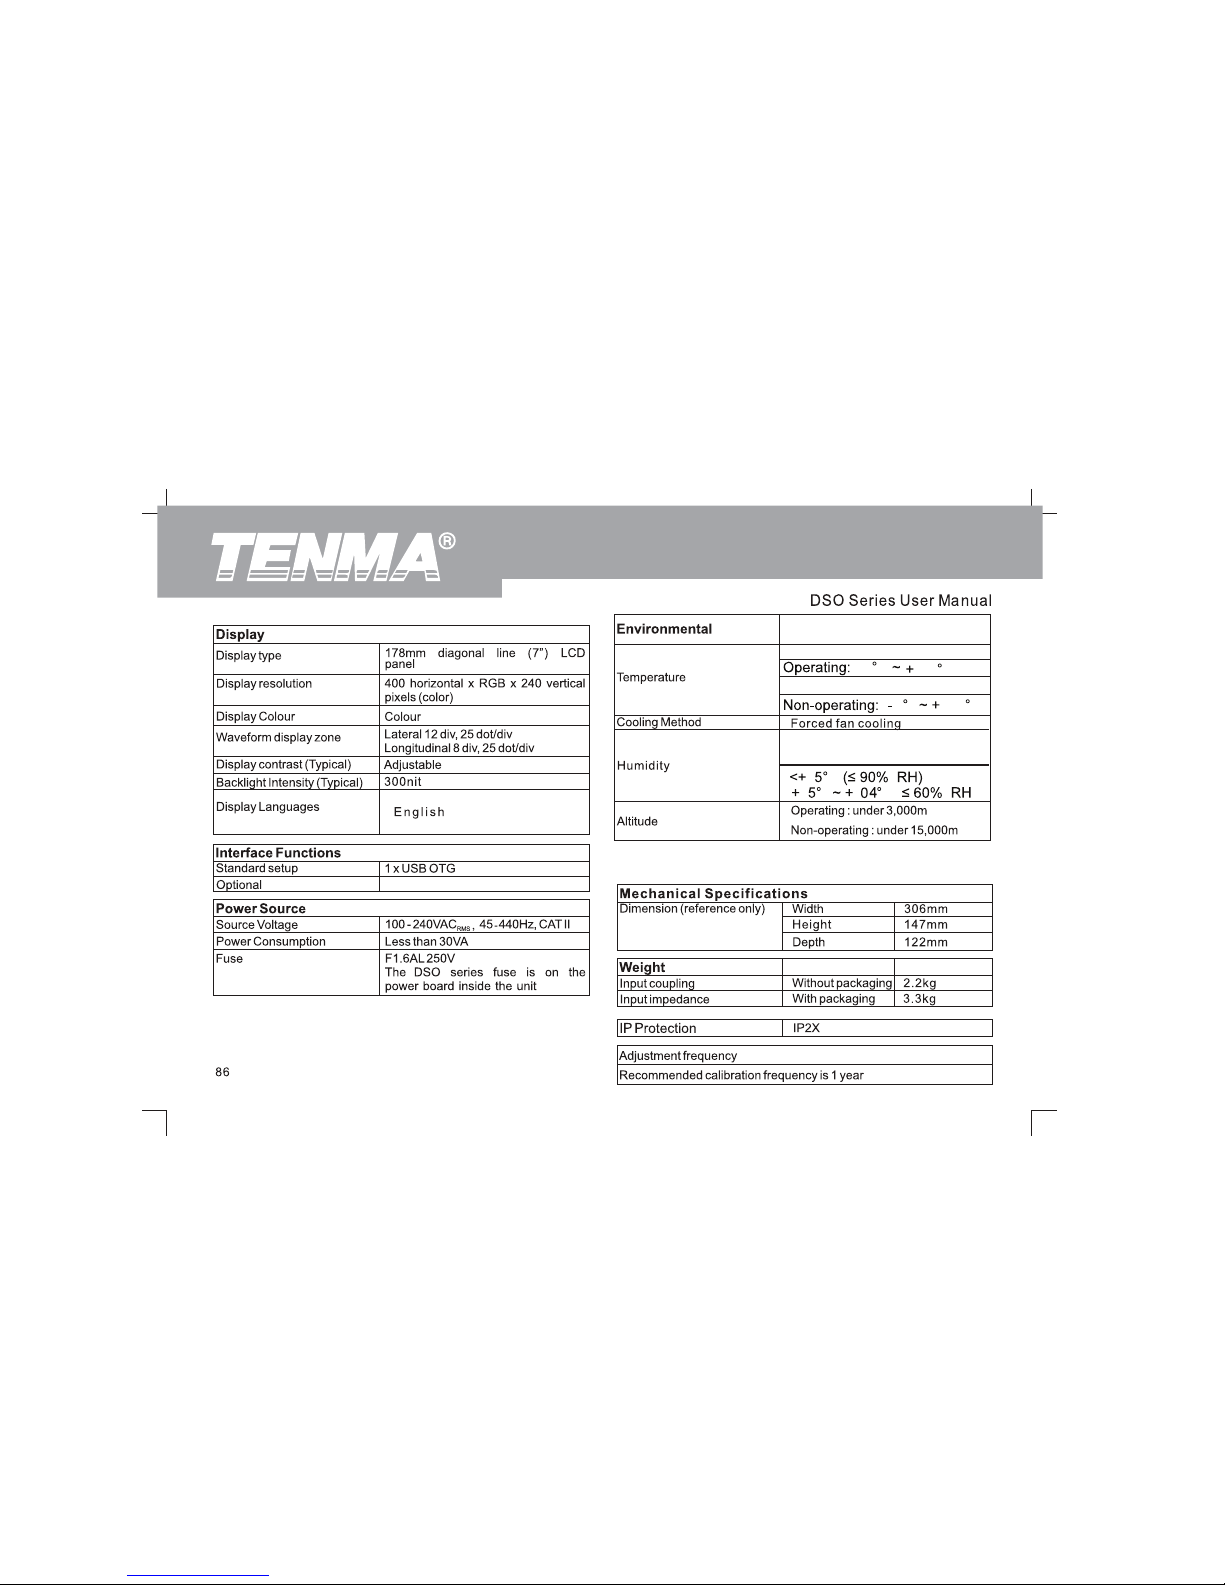
Please note
The product come with the power source 220V
(for UK/Europe) or 110V (forUSA);
32
F
104
F
4
F
140
F
9
F
9
F
1
F
Opera tin g : 0 C~+4 0 C° °
Non-operating
: °C~ 60°C- +20
< 35 C : ≤ RH
;
+35°C~+40°C : ≤ RH;
+ ° 90%
60%
110401102754
Page 89

87
General Care
Appendix B : Accessories for DSO Series Digital Storage
Oscilloscope
Do not store or leave the oscilloscope where the LCD display will be
exposed to direct sunlight for long periods of time.
Standard Accessories :
Caution : To avoid damage to the oscilloscope or probes, do not expose
Two 1.2m, passive voltage probes. For details
them to sprays, liquids or solvents.
please read the probe manual. EN
standard.
Cleaning
Rating is 150V CAT II when the switch is in the 1X position;
Inspect the oscilloscope and probes as often as operating conditions
Rating is 300V CAT II when the switch is in the 10X position.
require. To clean the exterior surface, follow these steps :
One international standard power cord.
1. Remove dust on the outside of the oscilloscope and probes with a
One User Manual.
soft cloth. When cleaning the LCD, use care to avoid scratching the
DSO communication & control software.
clear protection film of the LCD.
USB connection cable : UT-D05.
2. Use a dampened but not dripping soft cloth to clean the
oscilloscope. Remember to disconnect power. Use a mild cleaner
or water. To avoid damaging the product or probe, do not use
abrasive chemical cleaner.
Appendix C : Maintenance and Cleaning
1:1(10:1)
61010-031:2008
Warning : To avoid short circuit or personal injury due to the
presence of moisture, please ensure the product is completely dry
before reconnecting power for operation.
DSO Series User Ma nual
Page 90

88
Refresh rate -----------------------------------------------
Inde x
Single trigger ----------------------------------------------
Alph abet
Cycle -----------------------------------------------------
DSO -----------------------------------------------------
Vertical system ---------------------------------------------
EXT -----------------------------------------------------
Grid ------------------------------------------------------
FFT resolution ---------------------------------------------
Acquisition ------------------------------------------------
FFT frequency analysis-------------------------------------
Cursor measurement ---------------------------------------
USB -----------------------------------------------------
Display system ---------------------------------------------
X-Y mode ------------------------------------------------
Compulsory -----------------------------------------------
Y-T mode ------------------------------------------------
Horizontal system ------------------------------------------
Negative duty ratio ----------------------------------------
Math ------------------------------------------------------
Positive duty ratio -----------------------------------------
Measurement ----------------------------------------------
Amplitude ------------------------------------------------
Preshoot --------------------------------------------------
Mean ---------------------------------------------------
Storage ---------------------------------------------------
General check --------------------------------------------
RUN/STOP -----------------------------------------------
General care ---------------------------------------------
Trigger system ---------------------------------------------
Rise time ------------------------------------------------
Functions -------------------------------------------------
Fall time -------------------------------------------------
Vertical system ---------------------------------------------
System prompts ------------------------------------------
Select -----------------------------------------------------
50
43
33
61
11
34
34
57
58
57
57
15
88
59
57
79
48
44
31
19
38
45
60
47
23
24
30
55
57
15
62
22
25
25
26
DSO Series User Ma nual
Page 91

89
Coarse tune ---------------------------------------- Measuring simple signals -----------------------------------
Nyquist frequency----------------------------------------
Sec/div ---------------------------------------------------
Realtime sampling ---------------------------------------
Pulse width trigger -----------------------------------------
Top value -----------------------------------------------
Language selection ----------------------------------------
Bottom value -------------------------------------------
Off -------------------------------------------------
Technical indicators -------------------------------------- Using the RUN button -------------------------------------Waveform inversion----------------------------------- Horizontal system -------------------------------------
Waveform recording -------------------------------------- Factory setup ----------------------------------------------
Pulse trigger -------------------------------------------- Functional check ------------------------------------------Overshoot ---------------------------------------------- External trigger----------------------------------------
Cleaning ------------------------------------------------
Average---------------------------------------------
Top value -----------------------------------------------
Average acquisition ----------------------------------------
Save----------------------------------------------
Positive pulse width ----------------------------------------
Warranty -------------------------------------------
Power ----------------------------------------------------
Signal source---------------------------------------- Edge trigger ----------------------------------------------
Bandwidth suppression-----------------------------------
Alternate trigger-------------------------------------------
Troubleshooting-------------------------------------
Cursor measurement ----------------------------------
Window extension ----------------------------------------
Tracking -------------------------------------------------
Display system ----------------------------------------- -
Screen design----------------------------------------
Display type --------------------------------------------- Input channel ---------------------------------------------
Standard accessories ------------------------------------ Storage and recall -----------------------------------------
25
32
47
57
57
82
31
54
85
57
88
57
48
81
31
27
79
34
47
87
87
63
21
38
55
20
61
20
53
11
38
57
31
40
87
37
37
60
61
54
43
48
DSO Series User Ma nual
Page 92

90
Trigger coupling ------------------------------------------ Sampling system--------------------------------------
Mechanical specifications ---------------------------------
Coarse tune/fine tune-----------------------------------
Automatic setup ------------------------------------------
Utility system functions----------------------------------
Automatic measurement ----------------------------------
Maximum value---------------------------------------
Automatic trigger -----------------------------------------
Minimum value----------------------------------------
Self calibration -------------------------------------------
Equivalent sampling------------------------------------
Holdoff -------------------------------------------------
Contact us-------------------------------------------
Negative pulse width----------------------------------
Math------------------------------------------------
Root mean square value -----------------------------------
Trigger level------------------------------------------
Peak measurement ---------------------------------------
Trigger setup-----------------------------------------
Peak-to-peak --------------------------------------------
Trigger system----------------------------------------
Acquiring single signals -----------------------------------
Hold off----------------------------------------------
Recall --------------------------------------------------
Range adjustment ----------------------------------------
Delayed measurement ------------------------------------
Channel setup ------------------------------------------Channel coupling -----------------------------------Pretrigger -----------------------------------------Reducing signal random noise --------------------------Probe compensation-----------------------------------
Probe rate -----------------------------------------------
45
61
52
57
57
47
81
30
37
22
22
33
22
87
80
55
65
55
33
40
57
45
56
65
48
29
64
28
26
44
66
18
28
DSO Series User Ma nual
Page 93

91
DSO Series User Ma nual
This user manual may be revised without prior notice.
Copyright 2010 Tenma All rights reserved.
Manufacturer:
Tenma
405 S. Pio ne er B lvd,
Spring bo ro , Ohio 45066-3001
Phone: 1 -8 88 -655-5409
C
Page 94
序号 项目 内容
1
2
3
4
5
7
6
8
尺寸 210x145MM
材质 封面、封底用230G铜版纸,内页80G书纸。
颜色 1:1印刷,印刷黑色
外观要求 印刷完整清晰、版面整洁,无分层、残损、毛边等缺陷。
装订方式 采用胶装
排版 封面、封底分别印在说明书第一面及最后一面,按页码及页
面顺序往下排,注意整本说明书页首的方向一致。
表面处理 封面、封底表面过哑胶,内页无表面处理
备注 在原基础上更改第86页内容,其他不变,
旧P/N:110401102754X
DWH
设 计
MODEL
机型:
(UTD2052CEL/
UTD2102CEL改)
说明书
Part NO.
物料编号:110401104855X
CHK
审 核
APPRO.
批 准
说明书菲林做货要求:
陈秋兰2014-3-28
 Loading...