

Page 1

Operator's Manual
WaveRunner/MDA 8000HD
Oscilloscopes
Page 2

WaveRunner/MDA8000HDOscilloscopesOperator'sManual
© 2019Teledyne LeCroy,Inc. Allrights reserved.
Unauthorizedduplicationof Teledyne LeCroy,Inc. documentation materialsisstrictlyprohibited.Clientsare
permittedtoduplicateanddistribute TeledyneLeCroy,Inc.documentationforinternaleducationalpurposes.
Teledyne LeCroyisa trademarkof Teledyne LeCroy,Inc.,Inc. Otherproduct orbrandnames aretrademarksor
requestedtrademarksof their respectiveholders.Information inthispublication supersedes allearlierversions.
Specificationsare subject tochangewithout notice.
October,2019
waverunner8000hd_om_eng.pdf
Page 3

Contents
AboutThisManual iv
OscilloscopeOverview andSet Up 1
Safety 1
Overview 4
PoweringOn/Off 10
Connectingto OtherDevices/Systems 10
Configuringthe UserButton 12
OscilloscopeApplication 12
UsingMAUI 15
Touch Screen 15
MAUIwith OneTouch 21
NewWindows10 Gestures 26
WorkingWith Traces 27
Zooming 32
Acquisition 37
Auto Setup 37
Vertical 38
Digital(MixedSignal) 45
Timebase 49
Trigger 61
Display 75
DisplaySet Up 76
Q-ScapeDisplay 78
Persistence Display 80
Cursors 83
CursorTypes 83
Apply andPositionCursors 86
StandardCursorsDialog 87
XYCursorsDialog 87
Measure 89
MeasureTable 90
MeasureDialog 91
Parameter Set Up 95
List of StandardMeasurements 103
Parameter Math 113
Using WebEditor 115
Using Histograms 118
i
Page 4

WaveRunner/MDA8000HDOscilloscopes Operator's Manual
Using Trends 122
Using Tracks 123
Track vs.Trend 124
EMCPulse ParameterSoftware Package 124
Math 125
Math Function Set Up 125
List of StandardMath Operators 127
Average Function 132
CopyFunction 133
EResFunction 134
Fast WavePort Function 136
FFTFunction 137
Interpolate Function 139
Sparse Function 139
RescaleFunction 140
Phistogram Function 145
Ptrace Functions 146
Math Dialog 147
Memory 149
SavingMemories 149
RestoringMemories 150
AnalysisTools 151
WaveScan 151
PASS/FAIL Testing 157
AdvancedCustomization(XDEV) 161
SavingData(File Functions) 169
Save 169
Recall 175
LabNotebook 177
Report Generator 183
Share 184
Print 185
Email &Report Settings 186
Using theFile Browser 187
Utilities 189
UtilitiesDialog 189
Disk Utilities 195
PreferencesDialogs 196
ii
Page 5

Maintenance 201
Restart/Reboot Instrument 201
Restore Default Setup 201
ChangingScreenSettings 201
SoftwareandFileManagement 202
X-StreamDSOFirmwareUpdate 203
SwitchingWindowsUsers 204
Technical Support 205
Returninga Product for Service 206
Certifications 207
EMCCompliance 207
Safety Compliance 208
EnvironmentalCompliance 209
ISOCertification 209
IntellectualProperty 209
Index 211
iii
Page 6

WaveRunner/MDA8000HDOscilloscopes Operator's Manual
About This Manual
Thankyoufor purchasingaTeledyne LeCroy oscilloscope.We're certainyou'llbe pleasedwiththedetailed
featuresuniquetoourinstruments.
Thismanualcoverstheoperationandmaintenance of allinstruments in theWaveRunner8000HDand
MDA8000HDseries.The MDAisbuilt on the 8-channelWaveRunner8000HDplatform andsharesall
operationalspecificationsand functionalitywiththeWaveRunner.Theonlydifference istheadditionof
theMotor DriveAnalysissoftware,which is onlyavailable on MDAs.Therefore,anywheretheterm
"WaveRunner"appearsin thetext,it canbeassumed to meanMDA8000HD,aswell.
Documentationfor implementingCOMAutomationandremotecontrol,andfor usingoptionalsoftware
packagessoldfor TeledyneLeCroyinstruments can be downloadedfrom ourfree technical library
at:teledynelecroy.com/support/techlib
Motor DriveAnalyzer functionalityisdescribedinthe MotorDriveAnalyzer SoftwareInstructionManual,
availablefrom the technicallibraryat the URLabove.
Our website maintainsthemost current product specificationsandshould be checkedfor updates.
Detailedspecificationsare listedonthe product datasheet.
Note:Specificationsaresubject to changewithout notice.
iv
Page 7
Oscilloscope Overview andSet Up
OscilloscopeOverview and Set Up
Safety
Symbols
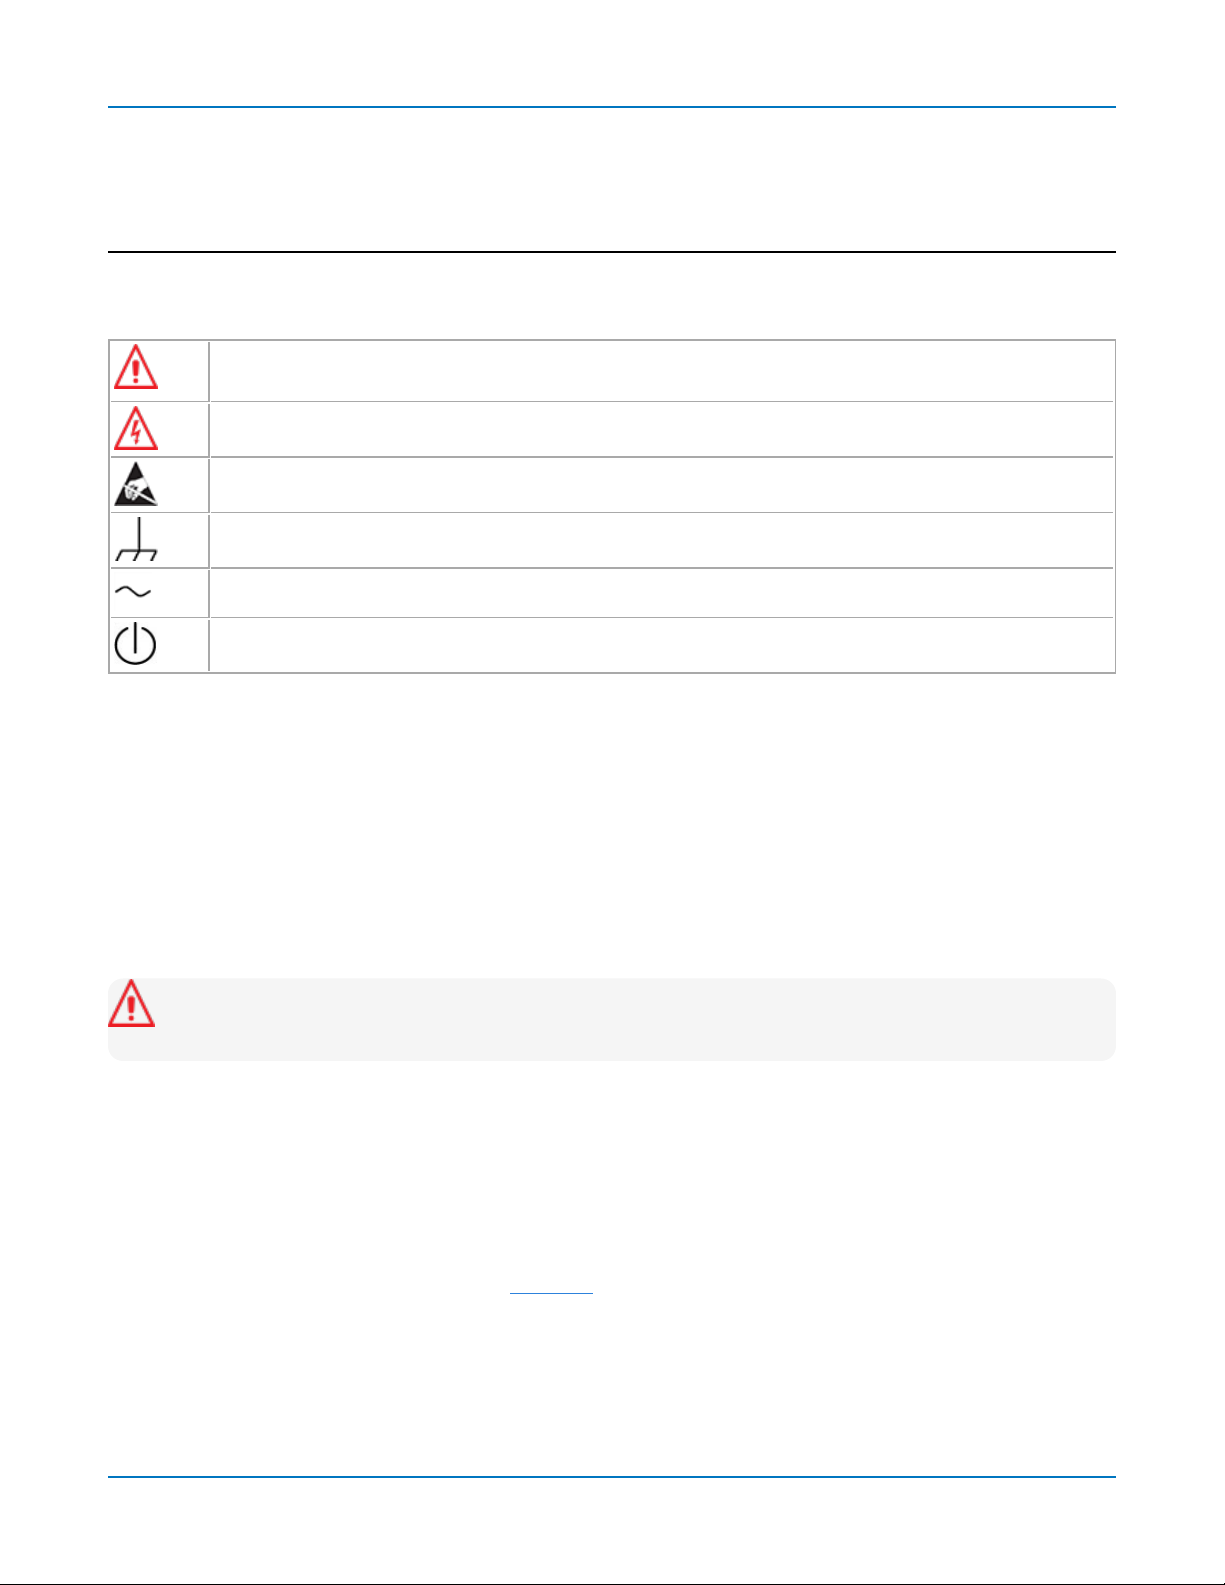
Thesesymbolsappearonthe instrument orin documentationtoalert youto important safetyconcerns:
Cautionof potentialdamageto instrument orWarningof potential bodilyinjury. Referto
manual.Donot proceeduntil theinformationisfullyunderstoodand conditionsare met.
Caution,highvoltage;riskof electric shock or burn.
Caution
Frame or chassis terminal(groundconnection).
Alternatingcurrent.
Standbypower (front of instrument).
,containsparts/assembliessusceptibletodamage byElectrostatic Discharge(ESD).
Precautions
Observegenerallyaccepted safety proceduresinadditionto the precautionslisted here.Theoverall
safetyofanysystem incorporatingthisproductistheresponsibilityoftheassembler of the system.
Useindoorsonly.
Useonlywithinthe operationalenvironmentlisted. Donot use inwet orexplosive atmospheres.
Maintainground. TheACinlet ground isconnected directlyto the chassis of the instrument. To avoid
electric shock,connect only to amating outlet with a safety groundcontact.
Caution:Interruptingthe protectiveconductor insideor outsidethe oscilloscope,or disconnecting
thesafetygroundterminal,createsahazardous situation.Intentionalinterruptionisprohibited.
Connect anddisconnectproperly. Donot connect/disconnect probes,test leads,or cableswhiletheyare
connected to a livevoltagesource.
Observeallterminalratings. Donot applyavoltageto anyinput that exceedsthemaximum ratingof that
input. Refer to thebodyof theinstrument for maximum input ratings.
Useonlythepowercordshippedwiththeinstrument andcertifiedfor the country of use.
Keepproduct surfacescleananddry.SeeCleaning.
Donot removethecoversorinside parts.Refer allmaintenancetoqualified servicepersonnel.
Exercisecarewhenlifting.
Donot operatewithsuspectedfailures. Donot usetheproduct if any part isdamaged.Ceaseoperation
immediatelyand secure the instrumentfrom inadvertent use.
1
Page 8
WaveRunner/MDA8000HDOscilloscopes Operator's Manual
Operating Environment
Temperature
Humidity
Altitude
: Maximum relativehumidity
: Upto 10,000 ft (3,048m) at orbelow30°C.
:
5°Cto 40
decreasinglinearlyto50%relativehumidityat 40 °C.
°C.
90%
upto 31 °C,
Measuring Terminal Ratings (C1-C8 and Ext)
MaximumInput Voltage:50 Ω coupling≤ 5Vrms
1MΩ coupling≤ 400 Vpkmax.(PeakAC≤ 10 kHz+DC)
deratingat 18 dB/decadefrom 10 kHzto 1 MHz,
5Vpk max.above 1 MHz
Caution:Measuringterminalshaveno ratedmeasurement categoryper IEC/EN61010-1:2010.
Measuringterminalsarenot intendedto be connecteddirectlyto supplymains.
Cooling
Therelieson forcedaircoolingwith internalfansandvents. Takecare to avoidrestrictingthe airflow to
anypart. Inabenchtopconfiguration,leavea minimum of 15 cm (6inches)aroundthesidesbetween the
instrument and thenearestobject.Thefeet provide adequate bottom clearance.Follow rackmount
instructionsfor proper rackspacing.
Caution:Do not blockthe coolingvents.
Theinstrument also hasinternalfancontrolcircuitry that regulatesthefan speedbasedon the ambient
temperature.Thisisperformedautomaticallyafter start-up.
Cleaning
Cleanonlythe exteriorof the instrumentusingasoft clothmoistenedwith water or an isopropyl alcohol
solution.Donot useharshchemicalsor abrasiveelements.Undernocircumstancessubmergethe
instrument or allow moisture topenetrate it. Drythoroughly beforeconnecting alivevoltagesource.
Caution:Unplugthe power cordbefore cleaning. Donot attempt tocleaninternalparts.
2
Page 9

Oscilloscope Overview andSet Up
Power
Theinstrument automaticallyadapts to thelinevoltage;manualvoltageselectionisnot required.
ACPowerSource
MaximumConsumption
NominalConsumption
StandbyConsumption
* AllPCperipheralsandactiveprobesinstalledonfourchannels.
Theprovidedpower cordsmate to a compatiblepower inlet on the instrument for makinglinevoltageand
safetygroundconnections.TheACinlet ground isconnected directlyto the chassis of the instrument. For
adequate protectionagainelectric shock,connect toamatingoutlet with a safety groundcontact.
: 100-240 VACat 50/60 Hz(± 5%)
100-120 VACat 400 Hz(±5%)
:*
:
:
500 W(500 VA)
400 W(400 VA)
10 W
3
Page 10
WaveRunner/MDA8000HDOscilloscopes Operator's Manual
Overview
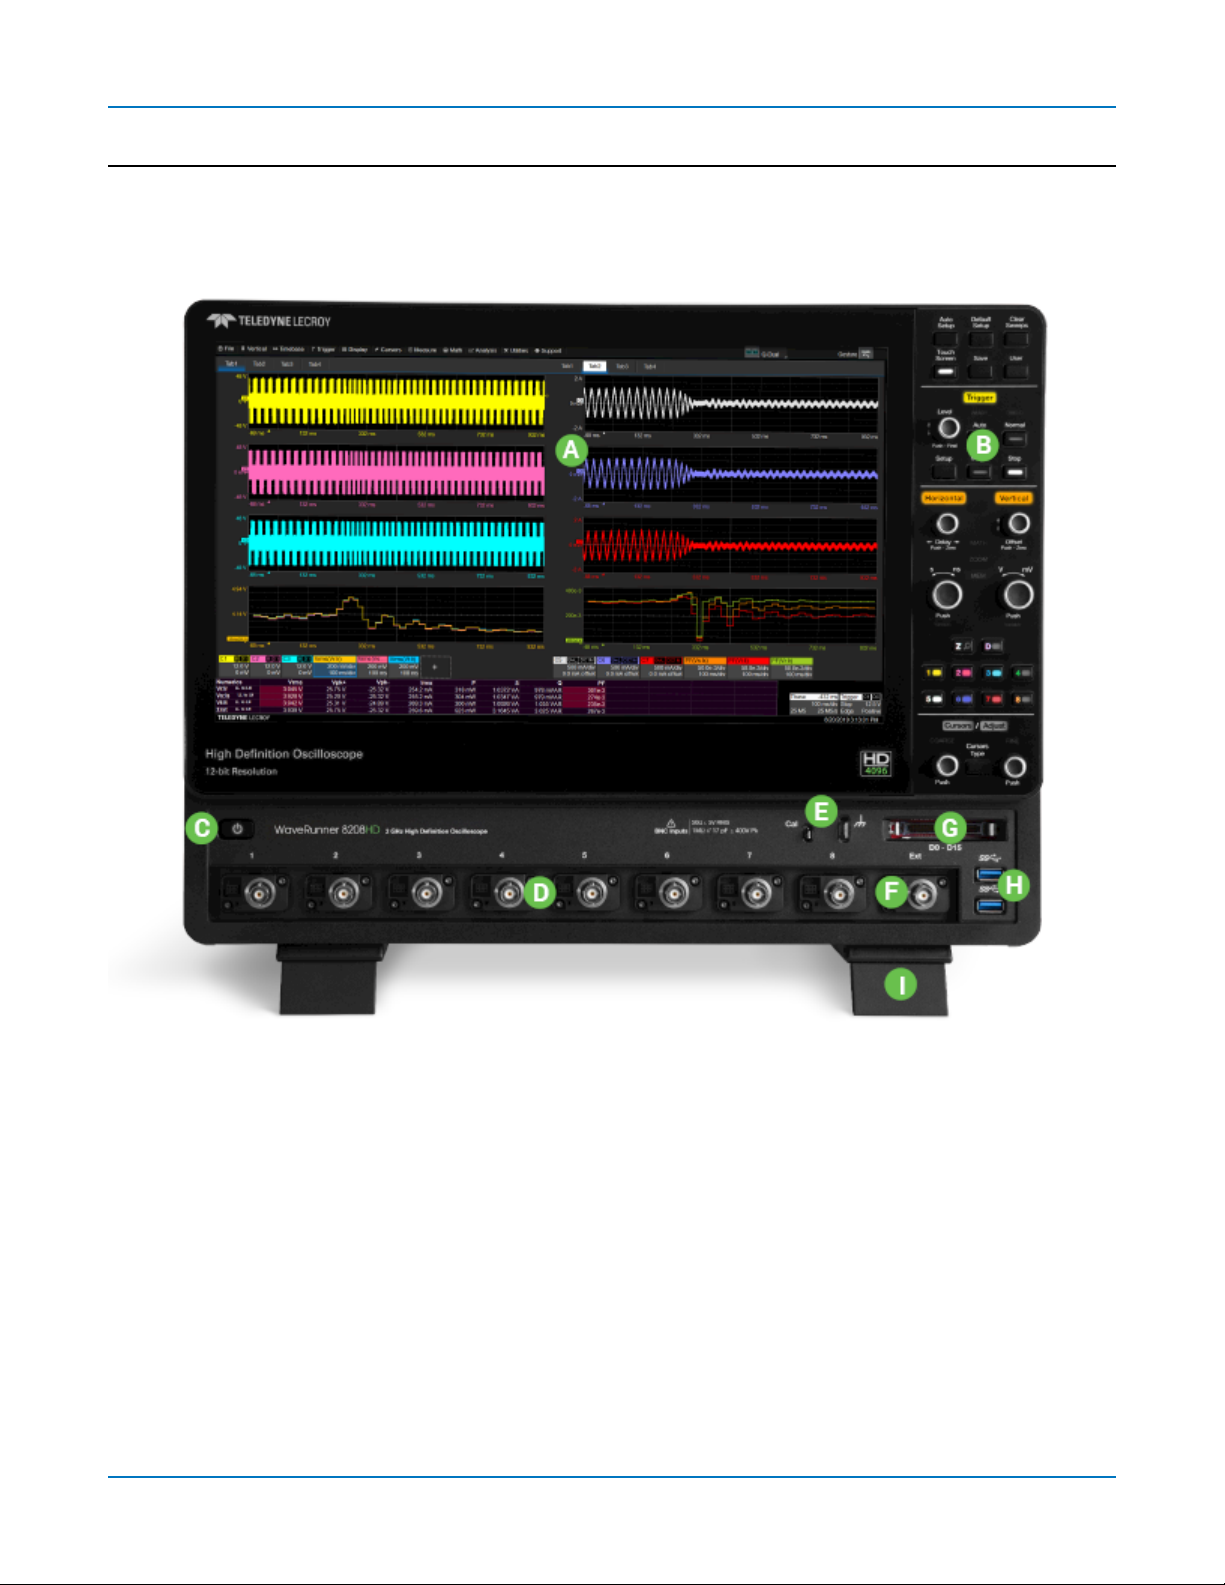
Front of Oscilloscope
A. Touch screen display
B. Front panelcontrols
C. Standbypower button
D. Analogchannelinputs (8)
E. Ground and Cal Out terminals
4
F. Externaltrigger input
G. Mixedsignalinterface
H. USB3.1Gen 1 ports (2)
I. Tiltingfeet
Page 11
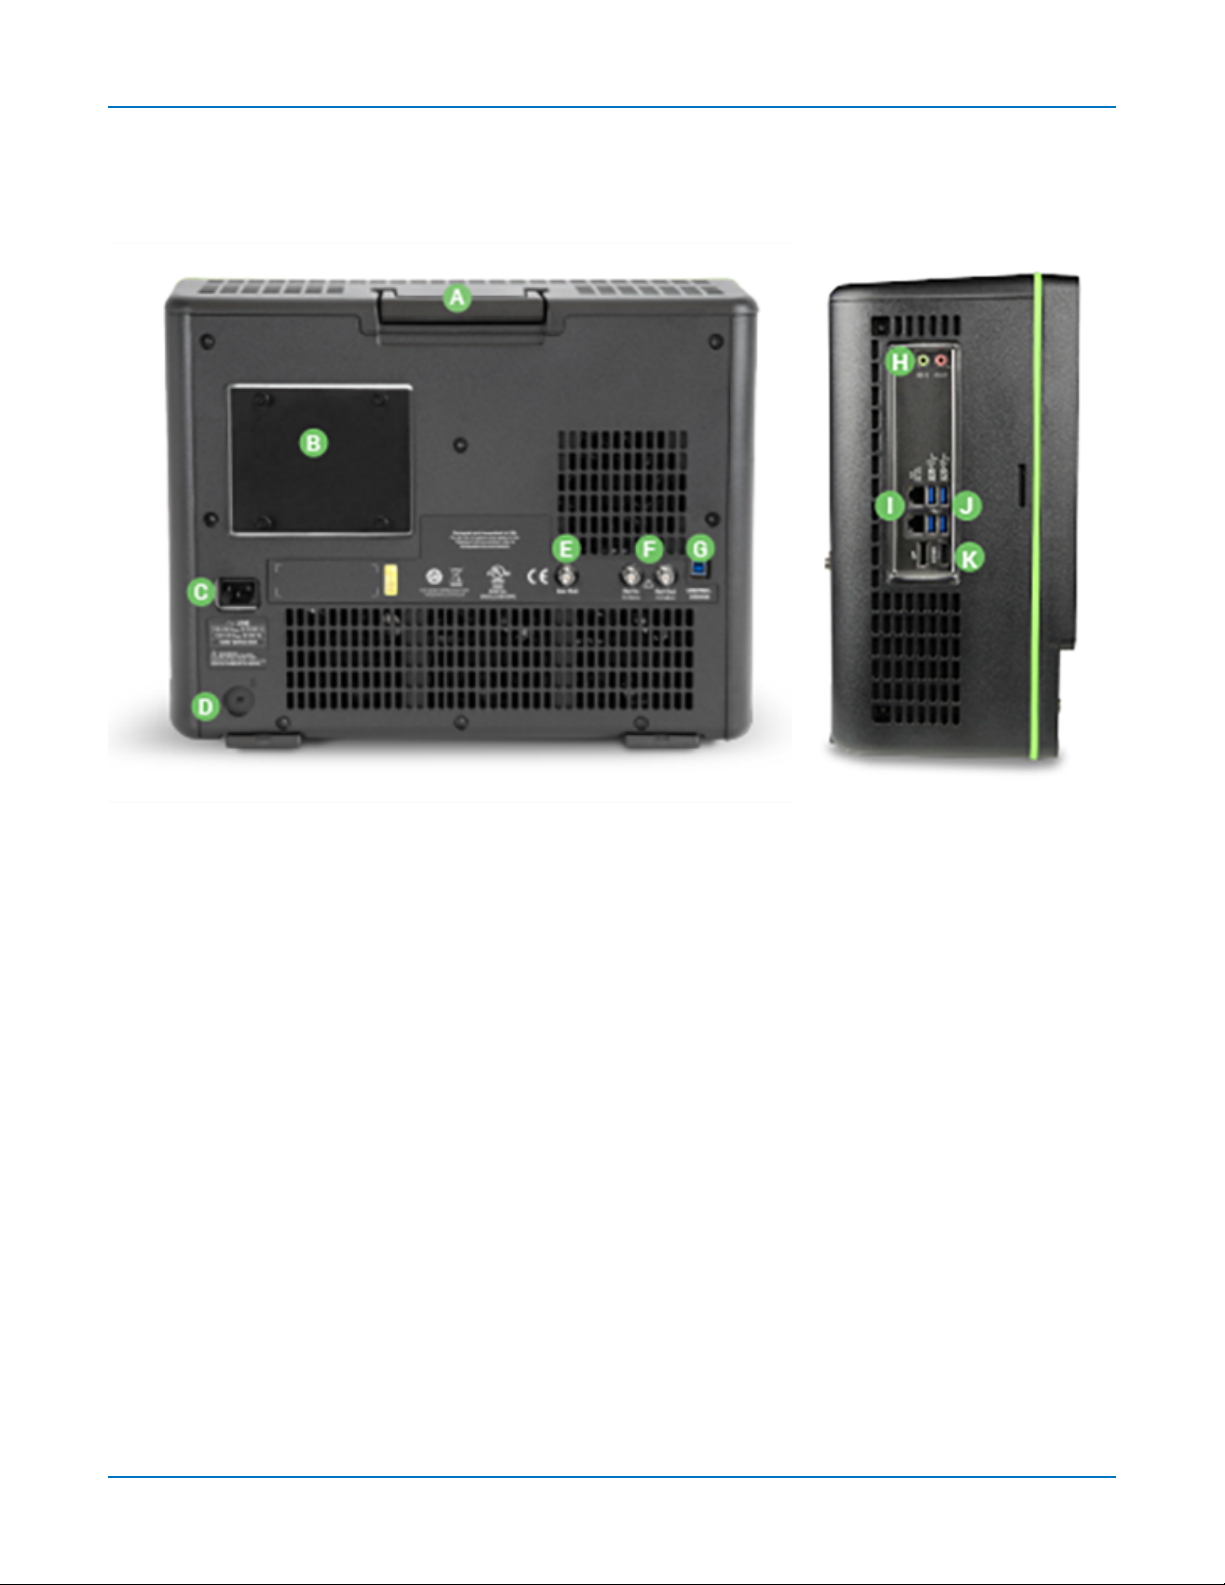
Back and Side of Oscilloscope
Oscilloscope Overview andSet Up
A. Built-incarrying
handle
B. Removable solid
state drive
C. ACpower inlet
D. Kensingtonlock
E. AuxOut connector
F. 10 MHzRef In and
Ref Out connectors
G. USBTMCport
H. SpeakerOut and
Mic Inconnectors
I. Ethernet ports
J. USB3.1Gen1ports
K. HDMI andDisplayPort
out to external
monitors
5
Page 12

WaveRunner/MDA8000HDOscilloscopes Operator's Manual
Front Panel
Front panelcontrolsduplicatefunctionalityavailable throughthetouch
screenandare describedhereonlybriefly.
Knobs onthefront panelfunctionone way if turnedandanotherif pushed
likeabutton. Thefirst labeldescribesthe knob’s“turn”action,thesecond
labelits “push”action.Actionsperformedfrom thefront panelalwaysapply
tothe activetrace.
Many buttons light to showtheactivetracesandfunctions.
MiscellaneousControls
AutoSetupperformsanAuto Setup. After thefirst press,youwillbe
promptedforaconfirmation. Pressthe buttonagainorusethe touch
screentoconfirm.
Default Setupsets allvolatile setupstothe factorydefault settings.After
thefirst press,youwillbe prompted for a confirmation.Pressthebutton
againor usethe touch screento confirm. SeeRestore Default Setup.
Clear Sweepsresets theacquisitioncounterandrestartsanyaveraging,
cumulativemeasurementsandhistograms.
TouchScreentoggleson/off touch screenfunctionality.
Save/Userbuttoncan be configuredasyouchoose,for example:tosavea
screencapture usingyourcurrent ScreenImage Preferences;tosavea
LabNotebookor other typeof file.SeeConfiguringtheUserButton for
instructionsonmakingthe selection.
TriggerControls
Thefront panelLevelknobchangesthe triggerthresholdlevel(V).The
number isshown on theTriggerdescriptor box.Pushing the knobsetsthe
triggerlevelto the50%point oftheinputsignal.
TheREADYindicator is lit whenthe triggerisarmed.TRIG'Dislit
momentarilywhen a triggeroccurs.
SetupopenstheTriggerSetup dialog.Press it again to closethedialog.
Autosets Auto triggermode,whichtriggerstheoscilloscopeafter a set
time,evenif the triggerconditionsarenot met.
Normalsets Normal triggermode,which triggerstheoscilloscopeeachtime a signalispresent that meets
thetrigger conditions.
Single setsSingletriggermode.The first press armsthe oscilloscopeto trigger.Thesecondpresstriggers
theoscilloscopeonce(single-shot acquisition)whentheinput signalmeets thetriggerconditions.
Stoppreventsthescopefrom triggeringon a signal. If youstart theinstrument with the triggerinStop
mode,a "Notrace available"messageisshown. Select atriggermodeto makean acquisitionanddisplaya
trace.
6
Page 13

Oscilloscope Overview andSet Up
HorizontalControls
Turnthe DelayknobtochangetheTrigger Delayvalue(S).Push the knobto reset Delayto zero.
If thetrace source isaninput channel,turn the HorizontalAdjustknobto set theTime/division(S)of the
oscilloscopeacquisitionsystem. The valueisshown on theTimebasedescriptor box.Whenusingthis
control,theoscilloscopeallocatesmemory asneededtomaintainthe highest samplerate possiblefor the
timebasesetting.If the activetrace isamath,zoom or memory,use thisknobto changethe Horizontal
Scale,effectively"zooming"inorout. The valueisshownon thecorrespondingdescriptorbox.Push the
knobtoadjustscaleinfineincrements;pushit again to return to steppedincrements.
VerticalControls
TheOffset knobadjusts thezerolevelof the trace(thismakesit appear to moveup or down relativeto the
center axisof thegrid).Thevalueappearson the tracedescriptor box.Push it to reset Offset to zero.
TheVerticalAdjust knobsets VerticalGain (V/div)for channeltraces or VerticalScaleformath,zoom and
memorytraces. Thevalueappearsonthe tracedescriptor box.Push the knobto togglebetween fineand
steppedincrements.
TheChannelbuttons(1-8)turn on a channelthat isoff,oractivate a channelthat is alreadyon. Whenthe
channelis active,pushingitschannelbuttonturnsit off. Alit buttonshows theactivechannel.
TheZoom (Z) buttoncreates a QuickZoom of each open trace.The resultingzoomtraces are 1/10 of the
sourcechannelscaleand centered onthedisplay.UsetheHorizontalknobsto adjust this,or touchthe
zoom descriptor box twicetodisplaythezoomdialogcontrols.Touchthe Zoom buttonagaintoturn off
thezooms.
TheDigital(D) buttonenablesdigitalinput oninstruments with MixedSignal capabilities.
Math,Zoom,andMemIndicators
TheseLEDslight to indicatewhenatype of traceother thananinput channeliscurrentlyactiveand
controllableusingtheFront Panel.Touch a tracedescriptor boxtomakeit activeand controllable.
CursorControls
Cursorsidentify specific voltageandtime valueson the waveform. The white cursormarkershelpmake
thesepoints morevisible,aswellasprovideasimplewayto repositionthem. Areadout of theVertical
valuesappearson thetrace descriptor box,whiletheHorizontalvalues appearbelowthe Timebase
descriptor box.
Thereare fivepreset cursortypes,eachwithauniqueappearance onthedisplay.Theseare describedin
more detailin theCursorssection.
Press theCursorType button to applyor removecursors.Continuepressingto cyclethroughallcursor
typesuntil thedesiredtype isfound("Off"occurswhennocursorsare visible).
Turnthe Coarseknobto adjust the positionof absolute cursors(dashed-dottedlines).Pushit to returnthe
cursor to thedefault 2.5divisionsetting.If you're usingtheBothRelcursor type,eachpushwilltoggle
betweenthe Horizontal andVerticalabsolute cursors.Withthecorrect cursorselected (highlighted),turn
theknobtoadjust the position.
Turnthe Fineknobto adjust thepositionof relativecursors(dashedlines).Pushit to returnthecursor to
thedefault 7.5 division setting,or to select theother relativecursorwhenusing the Both Relcursortype.
7
Page 14

WaveRunner/MDA8000HDOscilloscopes Operator's Manual
When a numeric valuefieldis selected,theseknobsserveasthe Adjust knobs. Turn theCoarseknobto
make 1-,2-,5-,10-steppedadjustments;turn theFineknobto makesingle-increment adjustments. Push
either knobto return to thedefault setting.
When a waveform trace is selected(by touchingthedescriptor boxorthetrace itself),theseknobs
increase/decreasetraceintensity.
Signal Interfaces
Teledyne LeCroyinstruments offer avarietyof interfaces to input analogor digital signals. Seethe
oscilloscopeproduct page at teledynelecroy.com for a list of compatibleinput devices.
ProBusInterface
Channelinputs C1-C8 utilizetheProBusinterface. The ProBus interfacecontainsa 6-pinpower and
communicationconnectionand a BNCsignalconnection totheprobe,with senseringsfor detecting
passiveprobes.It offersboth 50 Ω and1MΩ input impedanceandprovidesprobepowerandcontrolfor a
widerangeof probessuchashighimpedance passive probes,highimpedance activeprobes,current
probes,highvoltage probes,anddifferentialprobes.
TheProBus interface completelyintegrates theprobewith the channel. UponconnectingaTeledyne
LeCroyprobe,theprobe typeis recognized andsome setup information,suchasinput coupling and
attenuation,isperformedautomatically.Thisinformationisdisplayedonthe ProbeDialog,behindthe
Channel(Cn) dialog.System (probe plusinstrument) gainsettingsareautomaticallycalculatedand
displayedbasedonthe probeattenuation.
TheProBus interface mayhaveaBNC-terminatedcableconnected directlyto it. Dependingon theBNC
connector usedonthe cable,theinterfaceisrated for upto 4 GHz with 50 Ωcouplingor 1 GHzwith1MΩ
coupling.
Note:Operationalbandwidth isequalto themaximum input frequencyof youroscilloscopemodel.
See the product datasheet.
8
Page 15

Oscilloscope Overview andSet Up
OtherAnalogInputs
EXTIncanbeusedto input anexternaltriggerpulse.
REFIncan beusedto input an external reference clocksignal.
Theseinputs havea simpleBNCinterfacewithnopowersupply. Seeyourproduct datasheet for voltage
andfrequency ratings.
MixedSignalInputs
Thedigitalleadset shippedwiththeMSOoptionconnectstotheMixedSignalInput on thefront of the
oscilloscopetoinputof up-to-16linesof digital data.Physicallinescan be preconfiguredintodifferent
logicalgroups,Digitaln,correspondingto a busandrenamedappropriatelydepending on thegroup.The
transitionsfor each linemay beviewedthroughdifferent displays.
See DigitalSetupUsingthe DigitalLeadset fordetailedinstructions.
Probes
Theoscilloscopeiscompatiblewith the includedpassiveprobesandmost Teledyne LeCroyactiveprobes
that are rated for theinstrument’sbandwidth.Probespecificationsanddocumentationare available at
teledynelecroy.com/probes.
PassiveProbes
Thepassiveprobessupplied are matched to theinput impedance of the instrument but mayneedfurther
compensation.Follow thedirectionsintheprobe instructionmanualto compensate the frequency
response of the probes.
If usingother passiveprobesthanthosesupplied,besureto perform alow frequencycalibration before
usingthem to measuresignal.Youcanuse thesignal from the CalOut hookon the front of the
oscilloscope.
ActiveProbes
Teledyne LeCroyoffers a variety of activeprobesfor usewithyouroscilloscope.Most activeprobes
match probeto oscilloscoperesponse automaticallyusingproberesponsedatastored inanon-board
EEPROM. Thisensuresthebest possible combinedprobeplusoscilloscopechannelfrequency response
without the needto perform anyde-embeddingprocedure.
Beaware that manyactiveprobesrequireaminimum oscilloscopefirmware versionto be fully
operational.Seetheprobedocumentation.
9
Page 16
WaveRunner/MDA8000HDOscilloscopes Operator's Manual
Powering On/Off
Press thePowerbuttontoturnonthe instrument.TheX-Stream applicationloadsautomatically
whenyouusethe Powerbutton.
Thesafest wayto power downthe oscilloscopeis tousethe File > Shutdownmenu option,whichwill
alwaysexecuteapropershut downprocessandpreservesettings.QuicklypressingthePowerbutton
should alsoexecute a proper shut down,but holdingthePower buttonwillexecute a“hard”shut down (as
ona computer),which we do not recommenddoingbecauseit doesnot allow theoperatingsystem to
closeproperly,and setup data maybe lost. Neverpower off bypullingthepowercord from the socket,or
bypoweringoff aconnected power striporbattery without first shuttingdown properly.
ThePower buttondoesnot disconnect the instrument from the ACpowersupply. The onlyway to fully
powerdowntheinstrument istounplugtheACpower cord.
Werecommendunpluggingtheinstrument if it willremainunusedfor a longperiodof time.
Caution:Do not changetheinstrument’sWindows®Power Optionssettingfrom the default Never
toSystem Standbyor System Hibernate.Doing socan causethe system tofail.
Caution:Do not poweronorcalibrate with a signalattached.
Connecting to Other Devices/Systems
Use the menuoptionslisted below to configureconnectionsto other devices.
LAN
Theinstrument ispreset to accept aDHCPnetworkaddressover a TCP/IPconnection.Connect acable
from an Ethernet port on the backsidepanelto a network accessdevice. Go to Utilities>UtilitiesSetup>
Remote tofindtheIPaddress.
Toassign a static IPaddress,chooseNet Connectionsfrom the Remote dialog. Usethe standard
Windows networkingdialogstoconfigurethe device address.
ChooseFile > File Sharingand openthe Email&Report Settingsdialogtoconfigureemailsettings.
Audio/USBPeripherals
Connect the deviceto the appropriate port onthefront or sidebackof the instrument.Theseconnections
are"plug-and-play"anddo not require anyadditionalconfiguration.
Printer
MAUIoscilloscopessupport USBprinters compatiblewith the instrument'sWindowsOS.Go to File > Print
Setuptoconfigureprinter settings.Select Propertiesto openthe WindowsPrint dialog.
10
Page 17

Oscilloscope Overview andSet Up
External Monitor
You may operate the instrument usingthe built-intouch screenor attachanexternalmonitorforextended
desktop operation.Seeyourproduct datasheet for thesupported monitor resolution.
Connect the monitor cableto a videooutput on theinstrument. Youcanusean adaptor if the monitor
cablehasa different interface. GotoDisplay>DisplaySetup>OpenMonitorControlPanelto configure
thedisplay.Besureto select the instrument as the primary monitor.
TousetheExtend Grids feature,configurethesecondmonitortoextend,not duplicate,theoscilloscope
display.If theexternalmonitor istouchscreenenabled,the MAUI user interfacecan be controlledthrough
touch ontheexternalmonitor.
Remote Control
Go to Utilities> UtilitiesSetup>Remote to configure remote control.Connect theoscilloscopetothe
network/controllerusingthe cabletyperequiredbyyourselection.
l VICP( TCP/IP)andVXI-11(LXI)overEthernet aresupported standard,asis USBTMC.
l GPIBis supportedwiththeuse of theoptionalUSB-GPIBadapter.
Note:If usingTCP/IP,youcanconnect overthe LANor directlyto thecontroller.Besurethe
oscilloscopeison thesame subnet asthe controller.Depending onthehost,youmayneedto use
across-over cableto makea direct connection.
Sample Clock
Toinput anexternalsampleclock signal,connect aBNCcablefrom the EXTinput totheother device.Go
toTimebase>HorizontalSetup >Clock Sourceto configurethe clock.
Reference Clock
Toinput/output areferenceclock signal,connect aBNCcablefrom the Ref In/Out connector to the other
instrument. GotoTimebase>HorizontalSetup> ClockSourceto configurethe clock.
Auxiliary Output
Tooutput signalfrom the instrument to another device,connect aBNCcable from AuxOut to theother
device. Goto Utilities>UtilitiesSetup> AuxOutputto configurethe output.
11
Page 18
WaveRunner/MDA8000HDOscilloscopes Operator's Manual
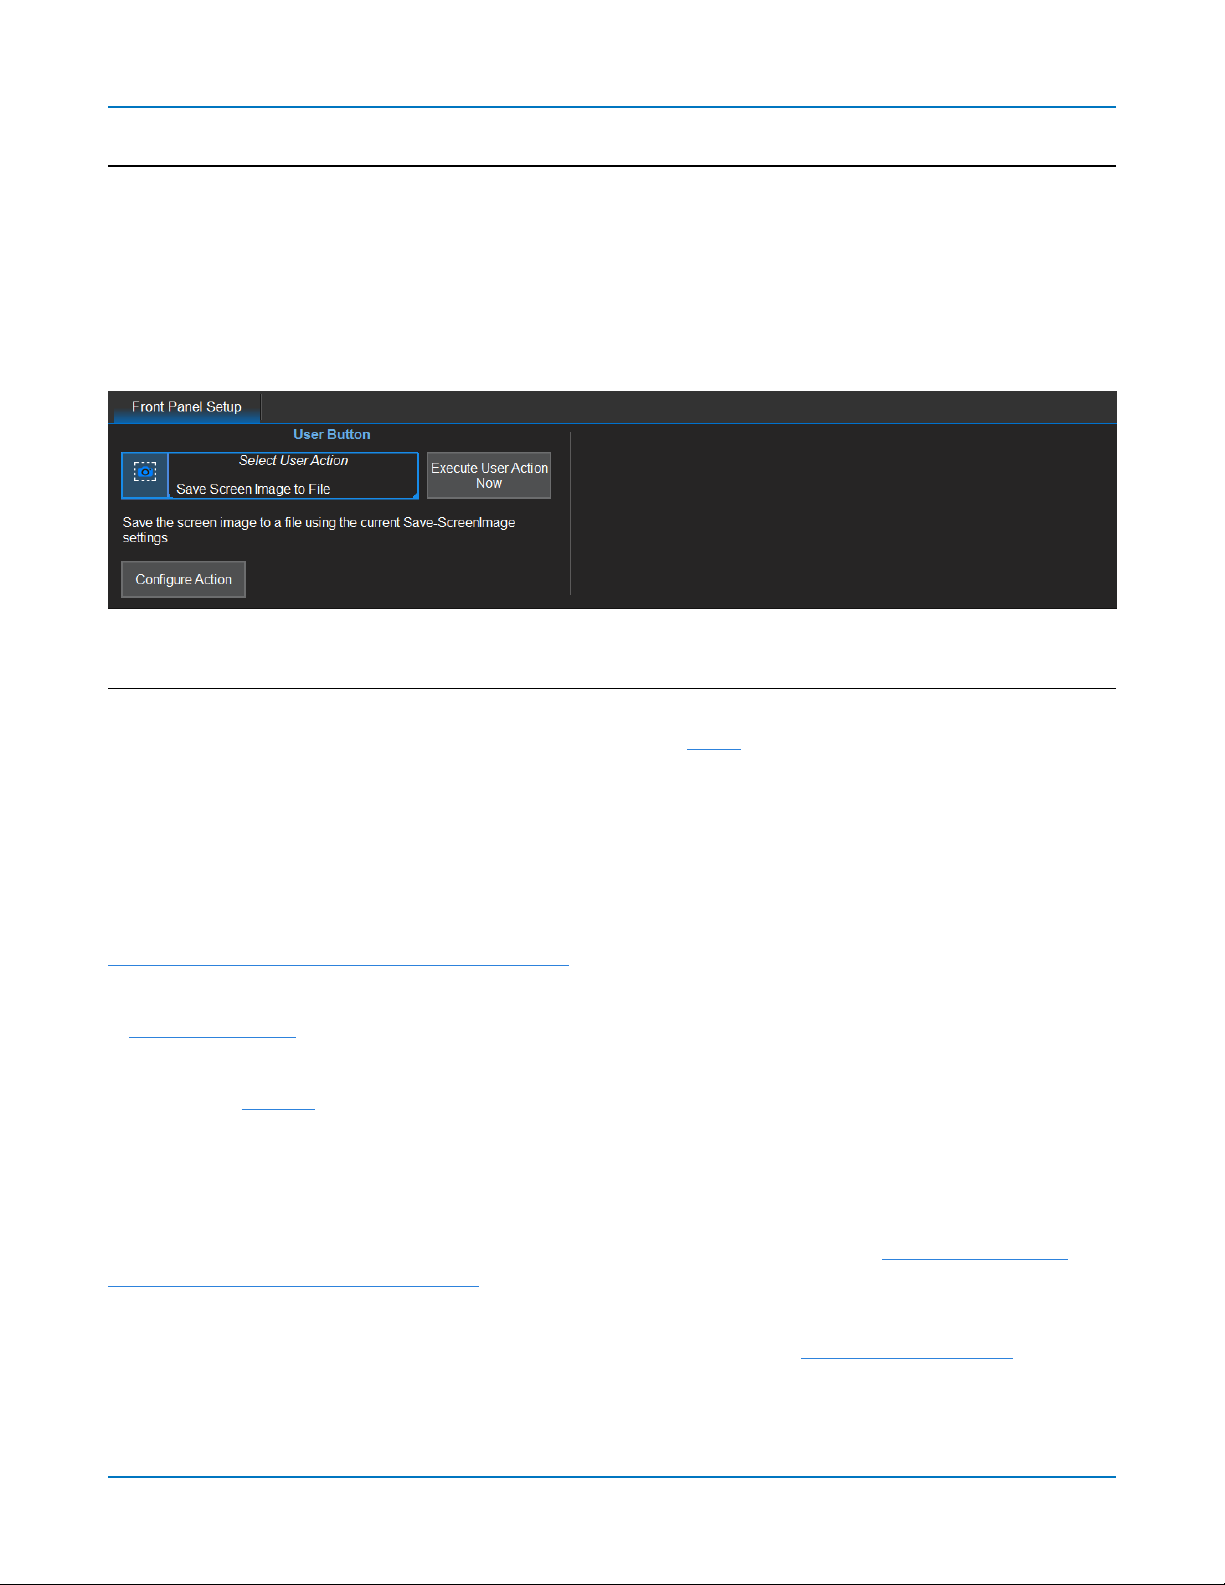
Configuring the User Button
Thefront panelUserbutton canbe configuredtoperform yourchoiceof actions,such as savingascreen
imageorotherfile type.
1. GotoUtilities> Front PanelSetup,thentouchSelectUserActionandmakeyour Userbutton
selection.
2. Optionally,touch Configure Actionto makeanyothersettingrelatedtothat action,such as Screen
Image or Print preferences.
Oscilloscope Application
Waveform rendering andmeasurement functionsareperformedbythe XStreamDSOoscilloscope
software,which runson the Microsoft Windows10 platform. MAUI,the Most AdvancedUserInterface,
forms thefront-endof XStreamDSO,providinga singleinterface for allstandardandoptionaloscilloscope
applications.
Theoscilloscopesoftware (firmware and standard applications)isactiveupondelivery.At power-up,the
instrument loadsthe softwareautomatically.
Freeupdatesare available periodicallyfrom theTeledyne LeCroy website at:
teledynelecroy.com/support/softwaredownload
Registereduserscanreceivean emailnotificationwhena new updateisreleased.Follow the instructions
inFirmware Update to downloadand installthe software.
If you decide topurchaseanoption,youwillreceivea licensekeyviaemailthat activatesthe optional
features.SeeOptionsfor instructionsonactivatingoptionalsoftware packages.
Customization
TheXStreamDSOapplicationis a COM Automationserver.Allthe configurableapplicationobjects that are
presentedthrough MAUI canbecontrolledusingCOMAutomationstringsembeddedin remote control
scripts,or sent via remoteutilitiessuch asthe free WaveStudiosoftware.Seethe MAUIOscilloscopes
RemoteControland AutomationManualforinstructions.
Besidesreadingwaveform andmeasurement data from theoscilloscope,acommonuse of Automationis
thecreationof remote setup files.In fact,MAUIprovidesa simplewayto saveanyoscilloscope
12
Page 19

Oscilloscope Overview andSet Up
configurationtoaLeCroySystem Setup (.LSS) file,which isnothingmore than a COM Automation
program written inVBScript,readyto restorethe entiresaved configurationwhenexecuted.
Our proprietary LabNotebookfeature goesevenfurthertosave not onlythe setupsbut alsothe waveform
data to a filethat canrestore the fulloscilloscopedisplaytotheexact state inwhich it wassaved.
Further customization,suchasthe introductionof custom math or measurement processorsinto
XStreamDSO,can beperformed onoscilloscopesequippedwith CustomDSO.Seeour websitefor
examples.
Volatile vs. Non-Volatile Settings
Most of theoscilloscopesettingsare volatile,meaningthey willautomaticallyrevert to thefactorydefault
wheneverthe oscilloscopeisrebooted,orwhenyouchooseto recall thedefault setup usingthefront
panelDefault Setup buttonorthe Recalldialog.
Thosesettingsthat arethe exceptionto thisruleare callednon-volatile. Thesesettingswillberetained
sessiontosession until youmanuallychangethem. Non-volatilesettingsinclude:
l Allpreferencessettings(includingacquisition,calibration,colorandmiscellaneous)
l Allnetworking,remote controland emailsettings
l Allprinter settingsandscreenimage(file)preferences
l Allreport settings,includinglogoselections
l Allfilepathsand names,includingauto-namingselections
13
Page 20

WaveRunner/MDA8000HDOscilloscopes Operator's Manual
14
Page 21
Using MAUI
Using MAUI
MAUI(Most AdvancedUserInterface)isTeledyneLeCroy's uniqueoscilloscopeuser interface. MAUI
provides an extensiblefront-endto the XStreamDSOoscilloscope application,seamlessly integrating
software optionsintoasingle applicationthat canbe controlledusingthelatest Windowstouchscreen
features.
Touch Screen
With MAUI,the touch screenis theprincipalcontrolcenterof the oscilloscope.The entiredisplay isactive:
useyourfingeror a stylustotouch,drag,swipe,anddraw selectionboxes.Withtheadditionof OneTouch,
gesturessuchaspinch and flickcan alsobe usedto controlthe screen.
Many controlsthat displayinformationalsoworkas“buttons”to accessotherfunctions,andeventhe
waveform tracescan bemanipulated.If you haveamouseinstalled,youcanclick anywhereyoucan
touch toactivate a control;in fact,youcan alternate between clickingandtouching,whicheveris
convenientforyou.
Thetouchscreenisdividedinto the followingmajorcontrolgroups:
Menu bar
Grid
Descriptorboxes
Dialogs
Messagebar
Menu Bar
Thetop of the window containsacomplete menuof functions.Makingaselectionherechangesthe
dialogs displayedat the bottom of the screen. Whilemanyoperationscanalsobeperformed from the
front panelorlaunchedviathe descriptor boxes,themenu baristhe best wayto accessdialogs for
Save/Recall(File)functions,Display functions,Status,LabNotebook,Pass/Fail setup,optionalAnalysis
packages,andUtilities/Preferencessetup.
You willseeaQ-Scape controladdedto themenu bar when theQ-ScapeMulti-tabbed
Displayfeaturesareavailable. Thisallowsyouto choosedifferent tabbeddisplayconfigurations.
If an actioncan be“undone”,theUndo button restores theoscilloscopetotheprior state.
15
Page 22
WaveRunner/MDA8000HDOscilloscopes Operator's Manual
Grid
Thegrid displays thewaveform traces.Everygridis8 Verticaldivisions representingthe fullnumber of
4096 Verticallevelsand10 Horizontaldivisions each representingacquisitiontime. Thevaluerepresented
byVerticaland Horizontal divisionsdepends on theVertical andHorizontalscaleof the tracesthat appear
onthe grid.
Multi-GridDisplay
Thescreencan bedividedintomultiplegrid configurations,each gridshowingdifferent typesand
numbersof traces(inAuto Gridmode,it willdivide automaticallyasneeded).Regardless of the number
andorientation of grids,everygrid alwaysrepresents thesame number of Verticallevels.Therefore,
absolute Verticalmeasurement precision ismaintained.SeeDisplay.
Different types of tracesopeningin amulti-griddisplay.
Q-ScapeTabs
On instruments with the Q-Scape multi-tabbeddisplayfeatures,Tabs1-4appearabovethegrids.Each tab
isa distinct multi-grid display.See Display for more informationabout using Q-Scape.
16
Page 23
Using MAUI
GridIndicators
Theseindicatorsappeararoundor on thegridto markimportant pointsonthe display. They arematched
tothe colorof the tracetowhich theyapply. Whenmultipletracesappearon thesame grid,indicators
refer totheforeground trace—the onethat appearson top of theothers.
Axislabels
asyoupanthe traceorchangethe Vertical/Horizontalscale.Originallyshowninabsolute
values,thelabelschangeto show deltafrom 0 (center) when the number of significant
digitsgrowstoo large.Thenumberof labelsthat appear oneach griddepends on thetotal
number of grids open.Toremoveaxislabels,go to Display>Display Setup anddeselect
AxisLabels.
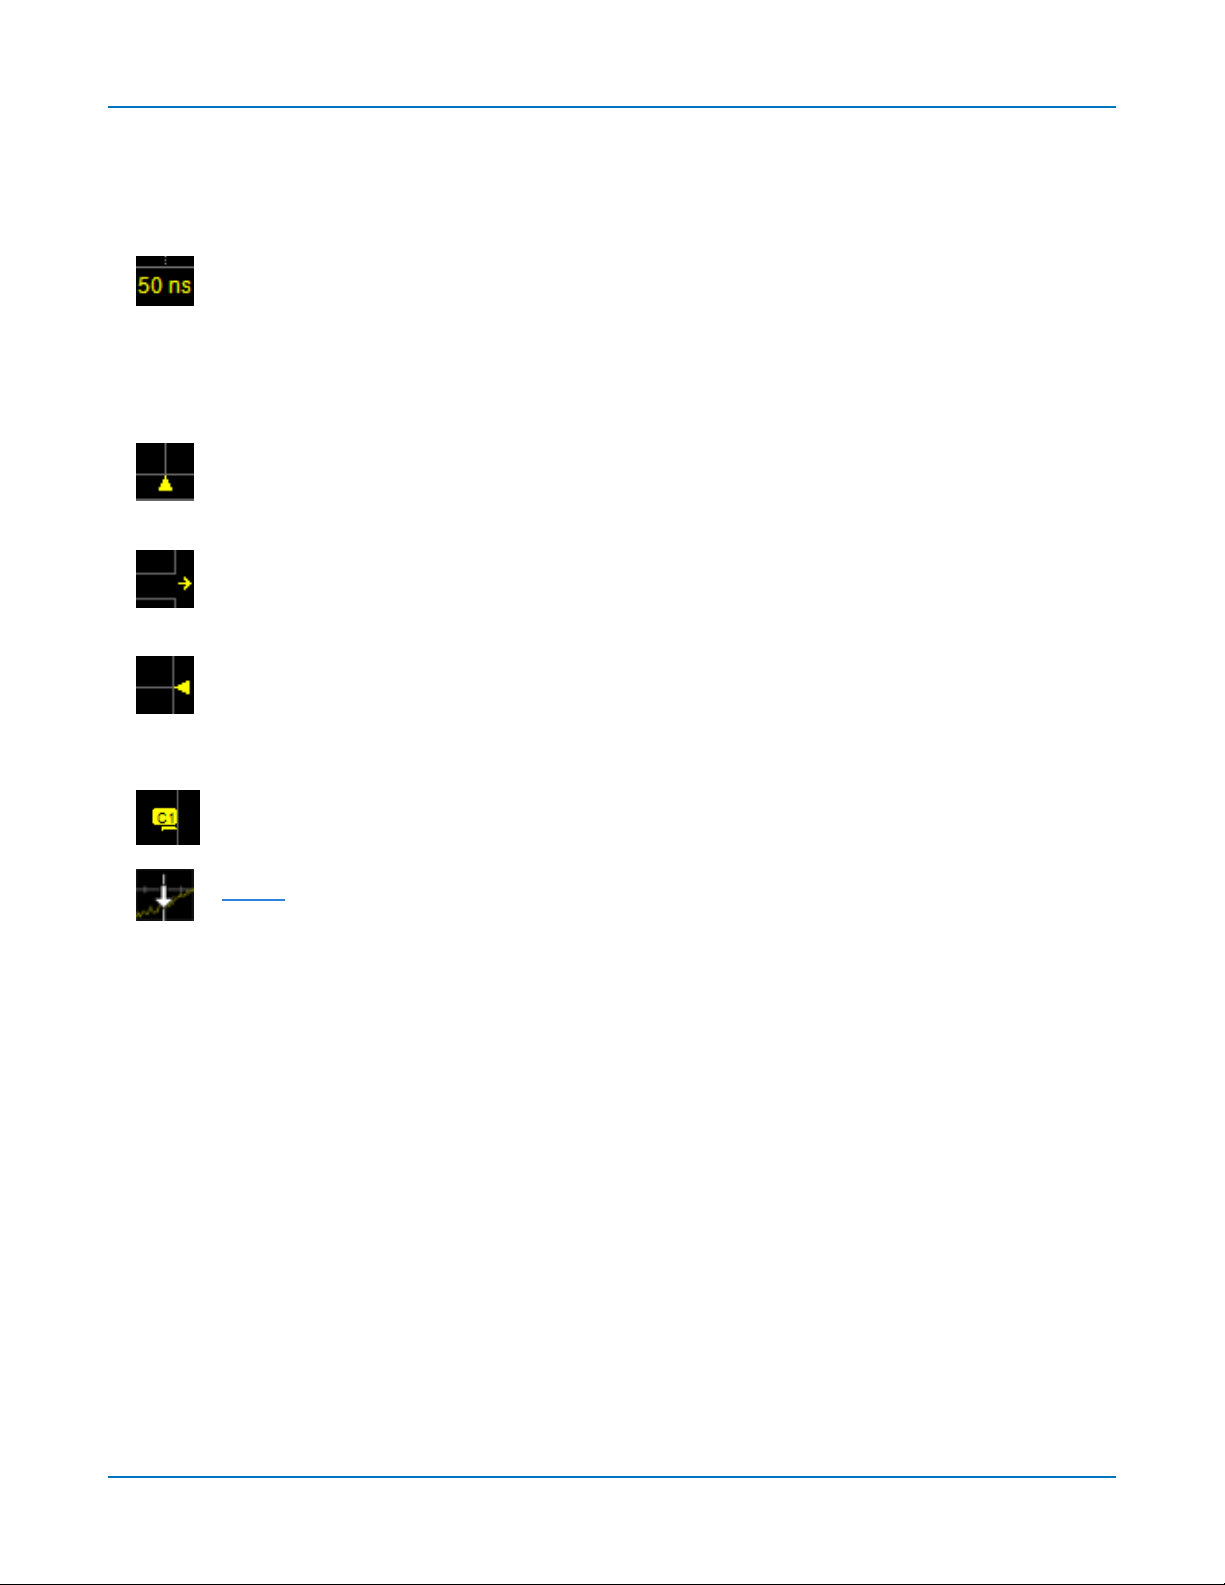
Trigger Time
time of the trigger.UnlessHorizontalDelayisset,thisindicator isat the zero(center) point
of the grid.Delaytimeisshown at thetopright of theTimebasedescriptor box.
Pre/Post-triggerDelay
pre-orpost-triggerDelay hasshiftedthe TriggerPositionindicator to a point in time not displayedon the grid.AllDelayvaluesare shown on theTimebaseDescriptor Box.
Trigger Level
indicates thelasttriggeredlevel.If you changethe triggerlevelprior to acquisition(e.g.,
whilein Stop mode),a hollowtriangleof thesamecolor appearsat the new triggerlevel.
Thetriggerlevelindicatorisnot shownif the triggeringchannelisnot displayed.
ZeroVoltsLevel
thegrid,sharingthenumber andcolor of thetrace.
mark the times/units representedbya grid division.Theyupdatedynamically
,asmalltrianglealongthebottom (horizontal)edgeof the grid,shows the
,asmallarrow tothebottom left orright of the grid,indicates that a
at the right edgeof the grid tracksthetriggervoltage level.Asolidtriangle
islocated at theleft edgeof the grid.Oneappearsfor each opentrace on
Cursormarkers
thewaveform. Drag-and-drop cursormarkerstoquicklyrepositionthem.
appearoverthegrid to indicate the voltage andtime beingmeasuredon
GridIntensity
You can adjust thebrightnessof thegridlinesby goingto Display> DisplaySetupand enteringa new Grid
Intensitypercentage.Thehigherthenumber,thebrighter andbolderthegridlines.
17
Page 24
WaveRunner/MDA8000HDOscilloscopes Operator's Manual
Descriptor Boxes
Trace descriptor boxesappearjust beneaththegrid whenever a trace isturned on.Theyfunction to:
l Inform—descriptors summarizethe current trace settingsanditsactivity status.
l Navigate—touch the descriptor box once to activatethetrace,againto openthe setupdialog.
l Arrange—drag-and-drop descriptorboxestomove traces amonggrids.
l Configure—drag-and-dropdescriptor boxesto changesource or copysetups.
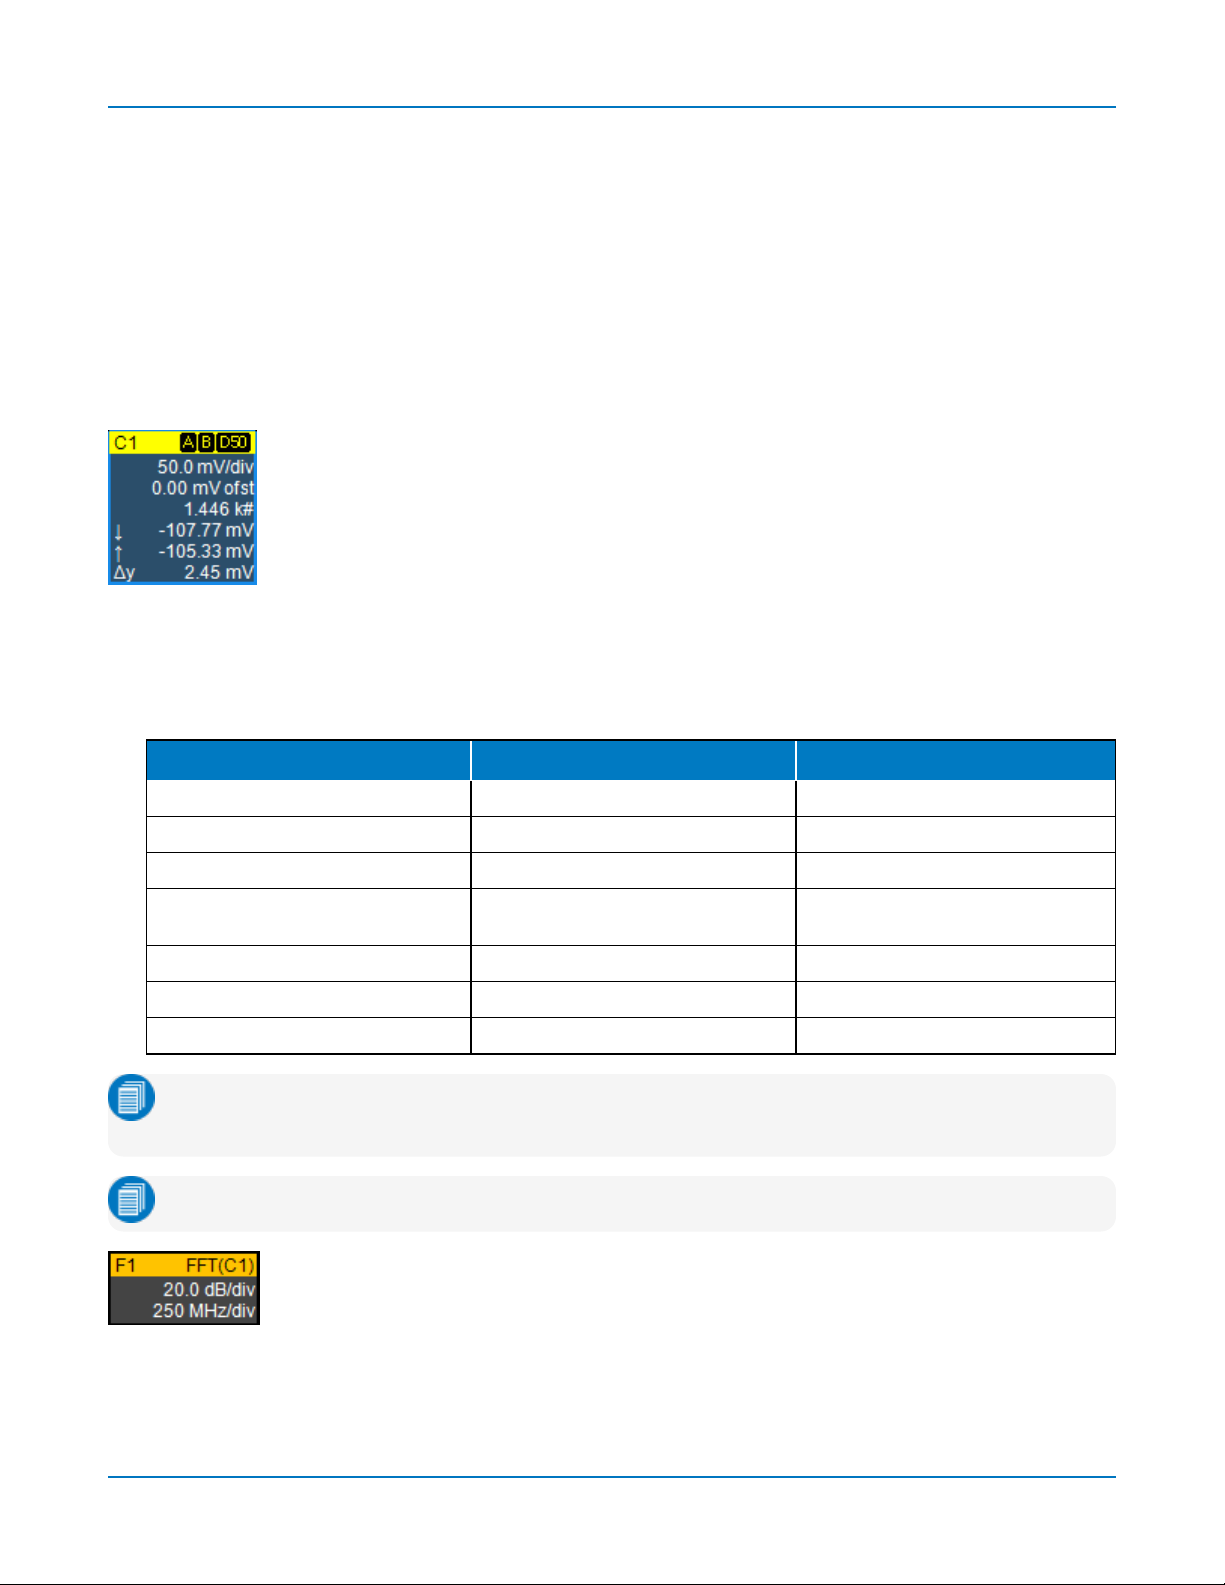
TraceDescriptorBox
Channeltrace descriptor boxescorrespondtoanalogsignalinputs.They show
(clockwisefrom top left):ChannelNumber,Pre-processinglist,Coupling,Vertical Scale
(gain)setting,VerticalOffset setting,SweepsCount (whenaveraging),Vertical Cursor
positions,and Number of Segments acquired(when inSequencemode).
If you are interleavingchannels,channeldescriptorboxeswillshow the channel'soverall
acquisitionstatus:trigger only,active,ornot active.
Codesare usedto indicatecouplingand otherprocessesaffectingthe channel.Theshort form isused
whenseveralprocessesarein effect.
SymbolsonDescriptorBoxes
Processing Type Long Form Short Form
Coupling DC50
Bandwidth Limiting BWL B
Averaging AVG A
(Sinx)/x Interpolation
Enhanced Sample Rate
Deskew DSQ DQ
Noise Filter (ERes) FLT F
Inversion INV I
/
, DC1M, AC1M
/ ESR
SINX
or GND D50, D1, A1 or G
/ E
S
Note:When(Sinx)/x interpolationisapplied by theEnhancedSample Rate feature,the Cn
descriptor boxwillshow ESR.Whenappplied manually,descriptorswillshow SINX.
Note:Interpolation,Averaging andNoise Filter are disabledonacquisitions>500 Mptsinlength.
Similardescriptor boxesappearformath (Fn),zoom (Zn),andmemory(Mn)traces.
Thesedescriptorboxesshowany Horizontalscalingthat differsfrom the signal
timebase.Units willbeautomaticallyadjustedfor the typeof trace.
18
Page 25

TraceContextMenu
Thetrace context menuis a pop-up menuof actionsto applyto atrace,such as turnoff,
move tonext grid,measure,labelorrename.
Toopenthetrace context menu,touchandholdonthe tracedescriptor box until a white
boxappears(or right-clickwithamouse).
TimebaseandTriggerDescriptorBoxes
TheTimebasedescriptor boxshows:(clockwisefrom top right)
HorizontalDelay,Time/div,Sample Rate,Numberof Samplesand
SamplingMode (blankwhen inreal-timemode).
Using MAUI
TheTriggerdescriptor boxshows:(clockwisefrom top right) Source
andCoupling,Level(V),Slope/Polarity,Typeand Mode.
Horizontal(time) cursorreadout,includingthetime betweencursorsandthe frequency,isshown beneath
theTimeBase and Triggerdescriptor boxes.Seethe Cursorssectionfor moreinformation.
Dialogs
Dialogsappearat the bottom of the display for enteringsetupdata. Thetopdialog willbethemainentry
point for theselected functionality.For convenience,related dialogsappearas a seriesof tabsbehindthe
main dialog.Touch the tabto open thedialog.
Right-HandSubdialogs
At times,yourselectionswillrequiremore settingsthancan fit on one dialog,or thetaskinvitesfurther
action,suchaszooming anew trace.In that case,subdialogs willappearto theright of the dialog.These
subdialogsettingsalwaysapplyto the object that isbeingconfiguredonthe left-handdialog.
19
Page 26
WaveRunner/MDA8000HDOscilloscopes Operator's Manual
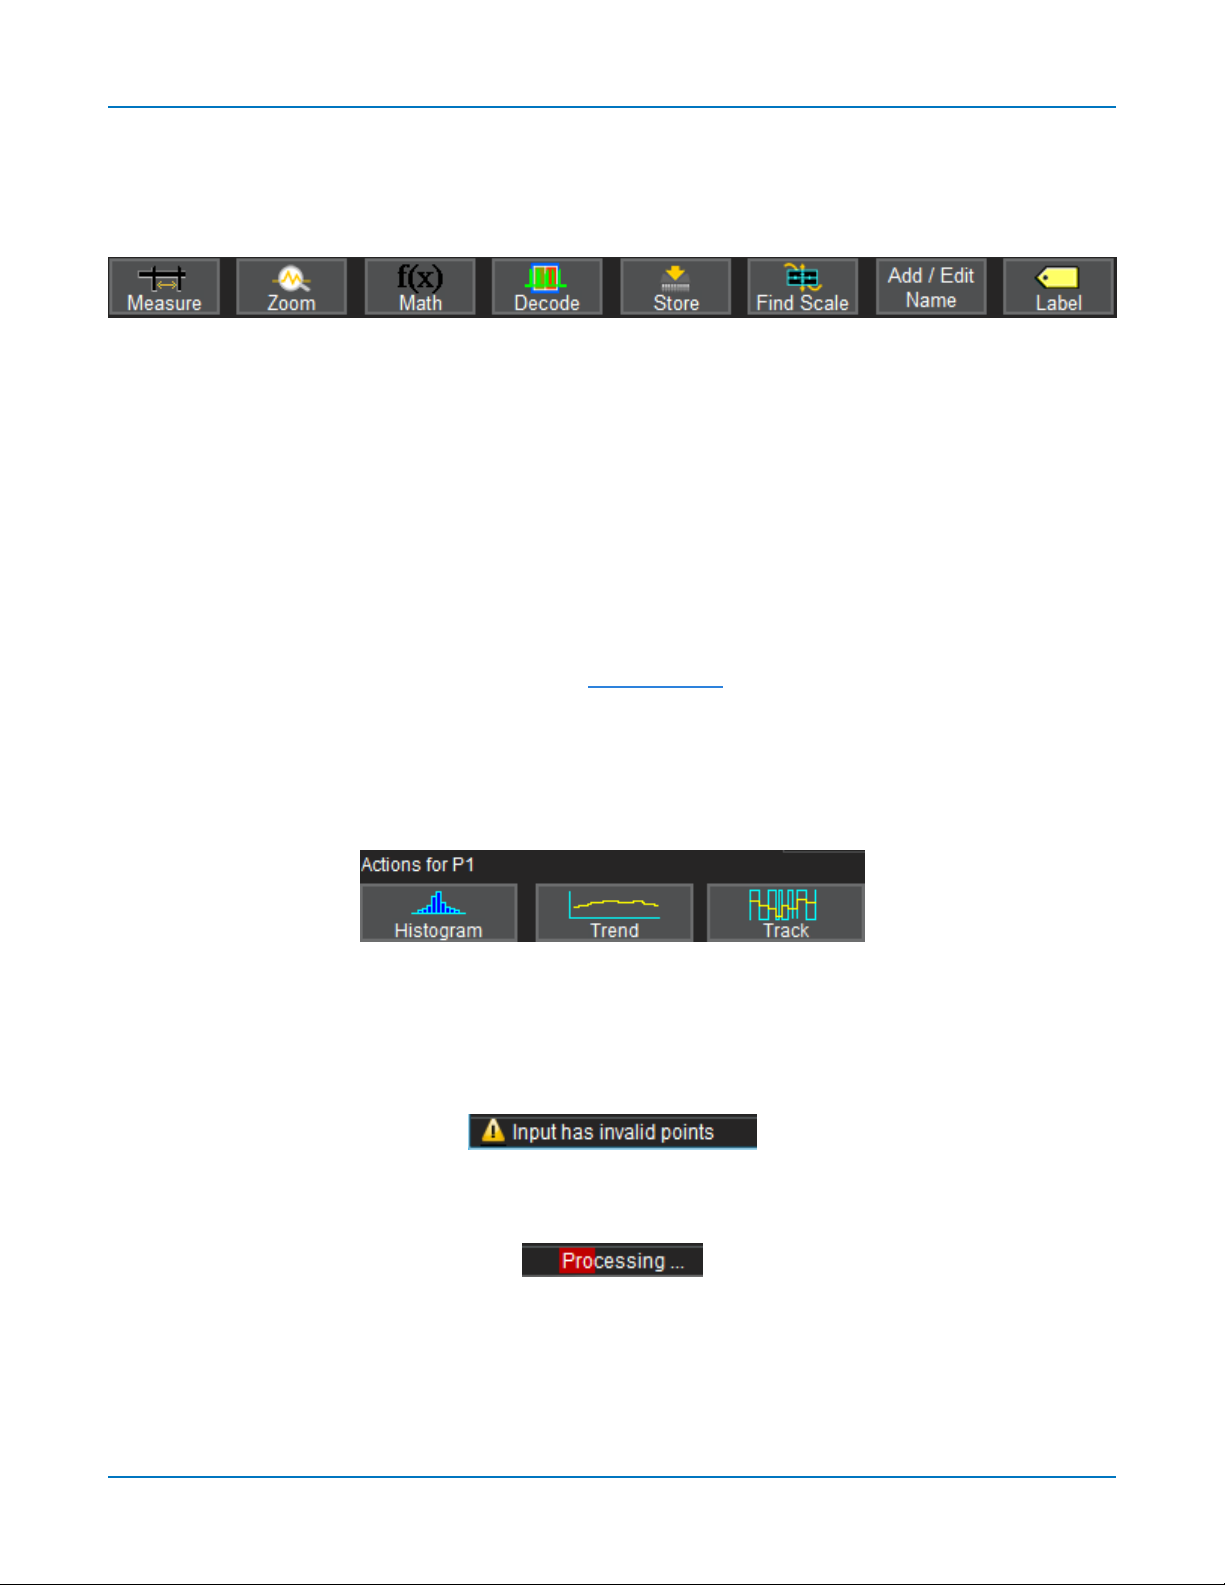
ActionToolbar
Severalsetup dialogscontaina toolbarat the bottom of thedialog.Thesebuttonsenable you toperform
commonplacetasks—suchasturningona measurement—without havingtoleavetheunderlyingdialog.
Toolbaractionsalwaysapplyto theactivetrace.
Measureopensthe Measurepop-up to set measurement parameters on theactivetrace.
Zoomcreatesazoomtrace of the active trace.
MathopenstheMath pop-up to applymathfunctionsto theactivetrace andcreate a new mathtrace.
Decodeopensthe mainSerialDecodedialogwhereyouconfigureandapplyserialdata decoders and
triggers.Thisbuttonisonlyactiveif you haveserialdata software optionsinstalled.
Storeloadstheactivetrace intothe corresponding memorylocation (C1,F1andZ1toM1;C2,F2and Z2
toM2,etc.).
FindScale performs a verticalscalingthat fitsthe waveform into the grid.
Add/Edit Nameopensthevirtualkeypadfor you toaliasthetrace.
Labelopensthe Labelpop-upto annotate the activetrace.
Histogram,Trend,and Trackbuttons appearin theAction toolbarat the bottom of the Parameter(Pn)
dialogs. Theyallow youto createaMath function to plot the parameter whileremainingonthe
measurement dialogs.
Message Bar
At thebottom of theoscilloscopedisplay isa narrow message bar. The current date andtime areshown
at the far right.Status,error,or other messages areshownat thefar left,where "TeledyneLeCroy"
normallyappears.
You willseetheword"Processing..."highlighted with red at the right of the messagebarwhenthe
oscilloscopeisprocessing yourlast acquisitionorcalculating.
Thiswillbeespeciallyevident when youchangean acquisition settingthat affectsthe ADCconfiguration
whilein Normalor Autotriggermode,suchaschangingtheVerticalScale,Offset,or Bandwidth. Traces
may briefly disappearfrom the display whiletheoscilloscopeisprocessing.
20
Page 27
Using MAUI
MAUI with OneTouch
Gestures liketouch,drag,swipe,pinch and flick canbe usedto createandchangesetupswith one touch.
Just asyouchangethe displaybyusingthesetupdialogs,youcan changethesetupsbymovingdifferent
displayobjects.Use the setup dialogstorefineOneTouchactionsto precisevalues.
Asyoudrag&drop objects,validtargetsareoutlinedwith a white box.Whenyou'removingoverinvalid
targets,you'llseethe "Null"symbol( Ø) under yourfinger tiporcursor.
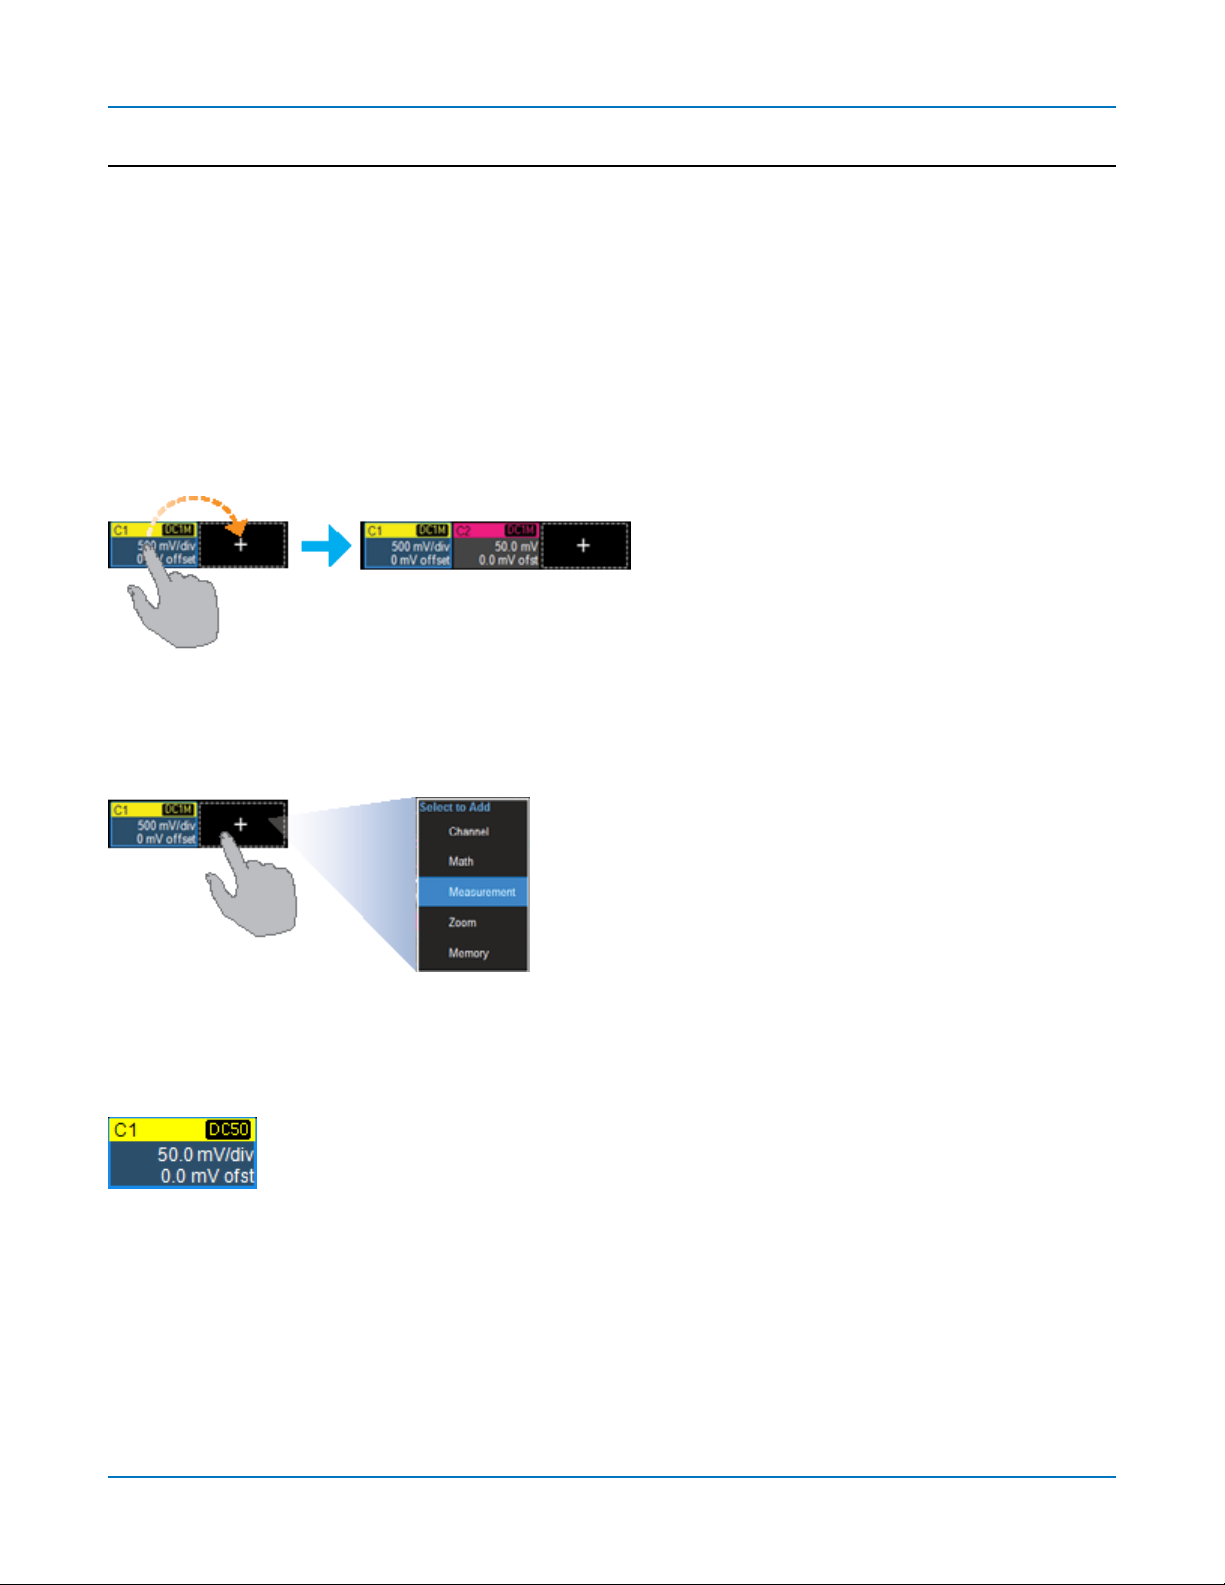
Turn On
Toturnona newchannel,math,memory,orzoomtrace,drag anydescriptor boxof the sametype tothe
Add New ("+")box.Thenext traceinthe serieswillbeaddedtothedisplayat thedefault settings.It isnow
theactivetrace.
If thereis nodescriptor box of thedesiredtype onthescreento drag,touch the AddNewboxandchoose
thetrace typefrom the pop-up menu.
ToturnontheMeasure table when it isclosed,touch the AddNew boxand chooseMeasurement.
Activate
Touch a trace or its descriptor box to activateit andbringit to theforeground.When the descriptorbox
appearshighlightedinblue,front panelcontrolsand touch screengesturesapplyto that trace.
21
Page 28
WaveRunner/MDA8000HDOscilloscopes Operator's Manual
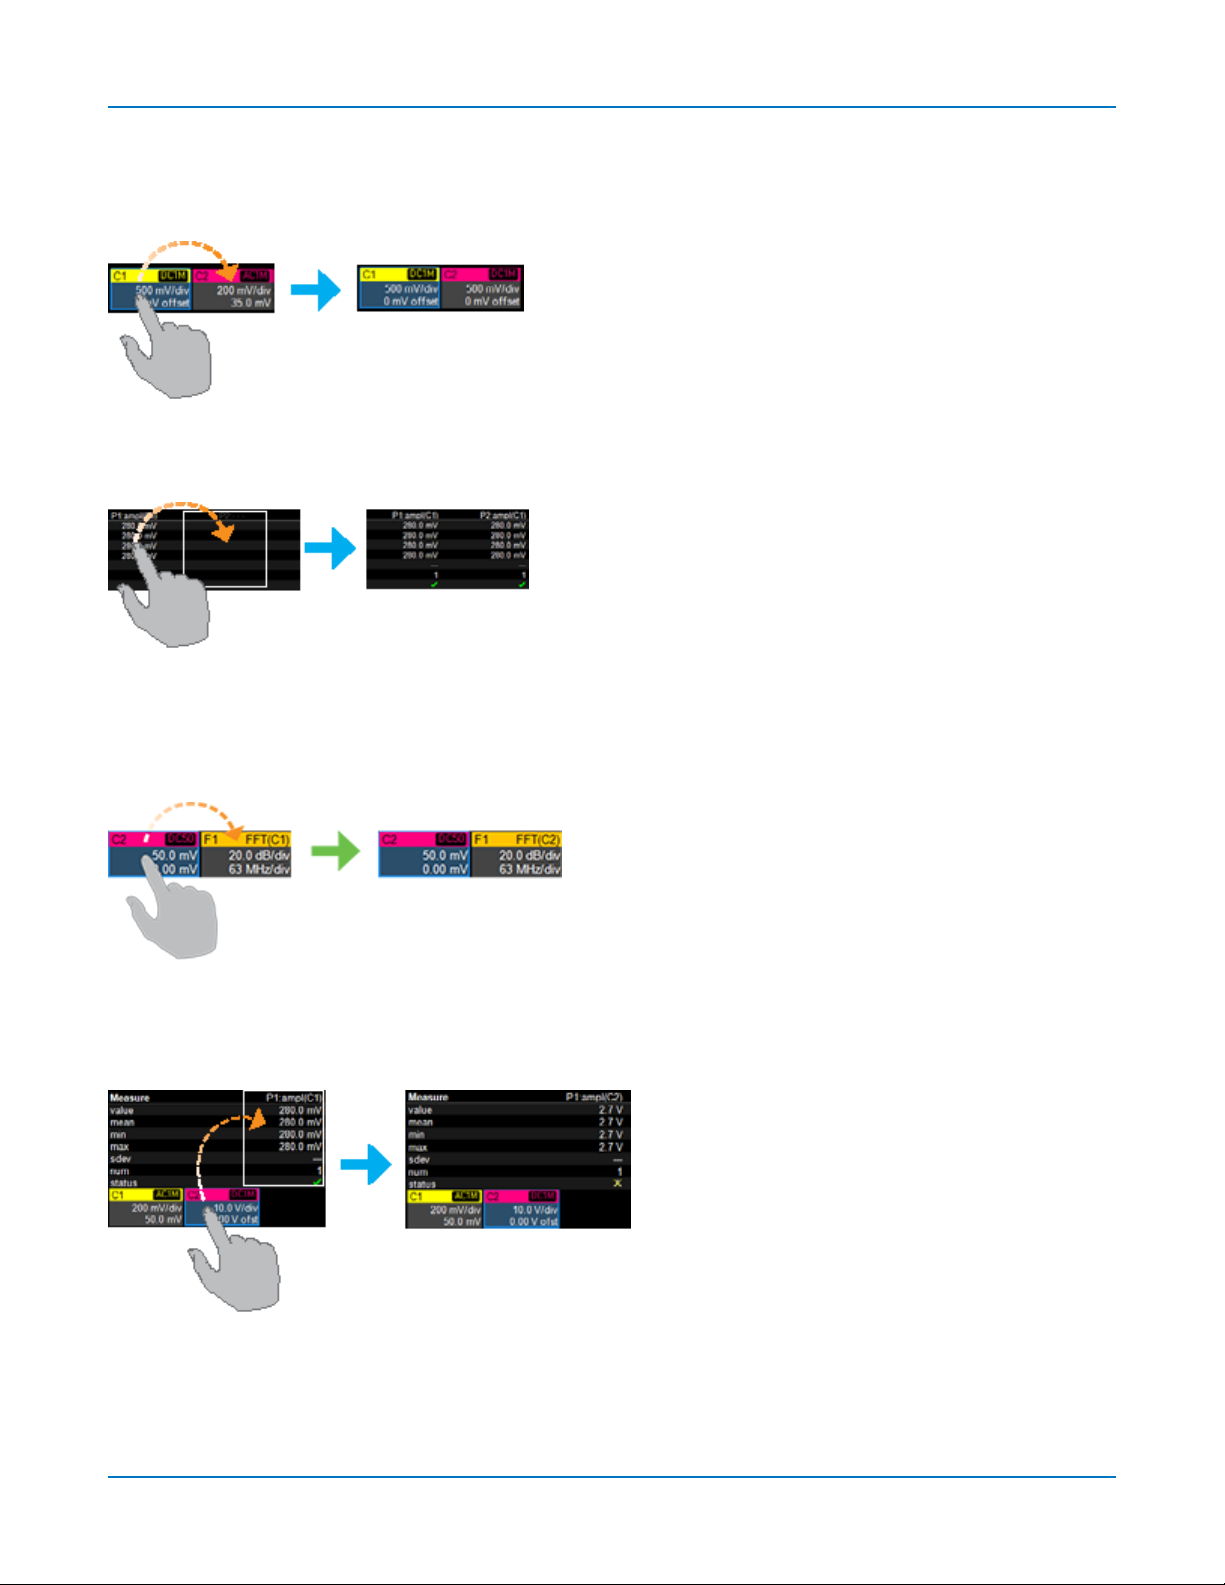
Copy Setups
Tocopythesetupofone traceto another of the same type(e.g.,channelto channel,math to math),drag-
and-dropthesourcedescriptor boxonto the target descriptor box.
Tocopythesetupofa measurement (Pn),drag-and-dropthe source column ontothetarget column of the
Measuretable.Youcando the same for a query(Qn)on thePass/Fail readout table.
Change Source
Tochange thesourceof atrace,drag-and-dropthedescriptor boxof the desiredsource ontothetarget
descriptor box.Youcan alsodrop it ontheSource fieldof the target setup dialog.
Tochange thesourceof ameasurement,drag-and-dropthedescriptor box of thedesiredsourceonto the
parameter (Pn)column of the Measuretable.Youcandothe same to a query(Qn) on thePass/Fail
readout table.
22
Page 29
Using MAUI
Position Cursors
Tochange cursormeasurementtime/level,drag cursormarkersto new positionsonthe grid.Thecursor
readout willupdate immediately.
Toplacehorizontalcursorson zooms or othercalculatedtraceswhere thesourceHorizontalScalehas
forced cursorsoff thegrid,drag thecursor readout from below the Timebasedescriptor to thegridwhere
youwish toplacethecursors.The cursorsare set ateither the 5(center) or the 2.5 and7.5 divisionsof the
grid.Cursorsonthe source tracesadjust position accordingly.
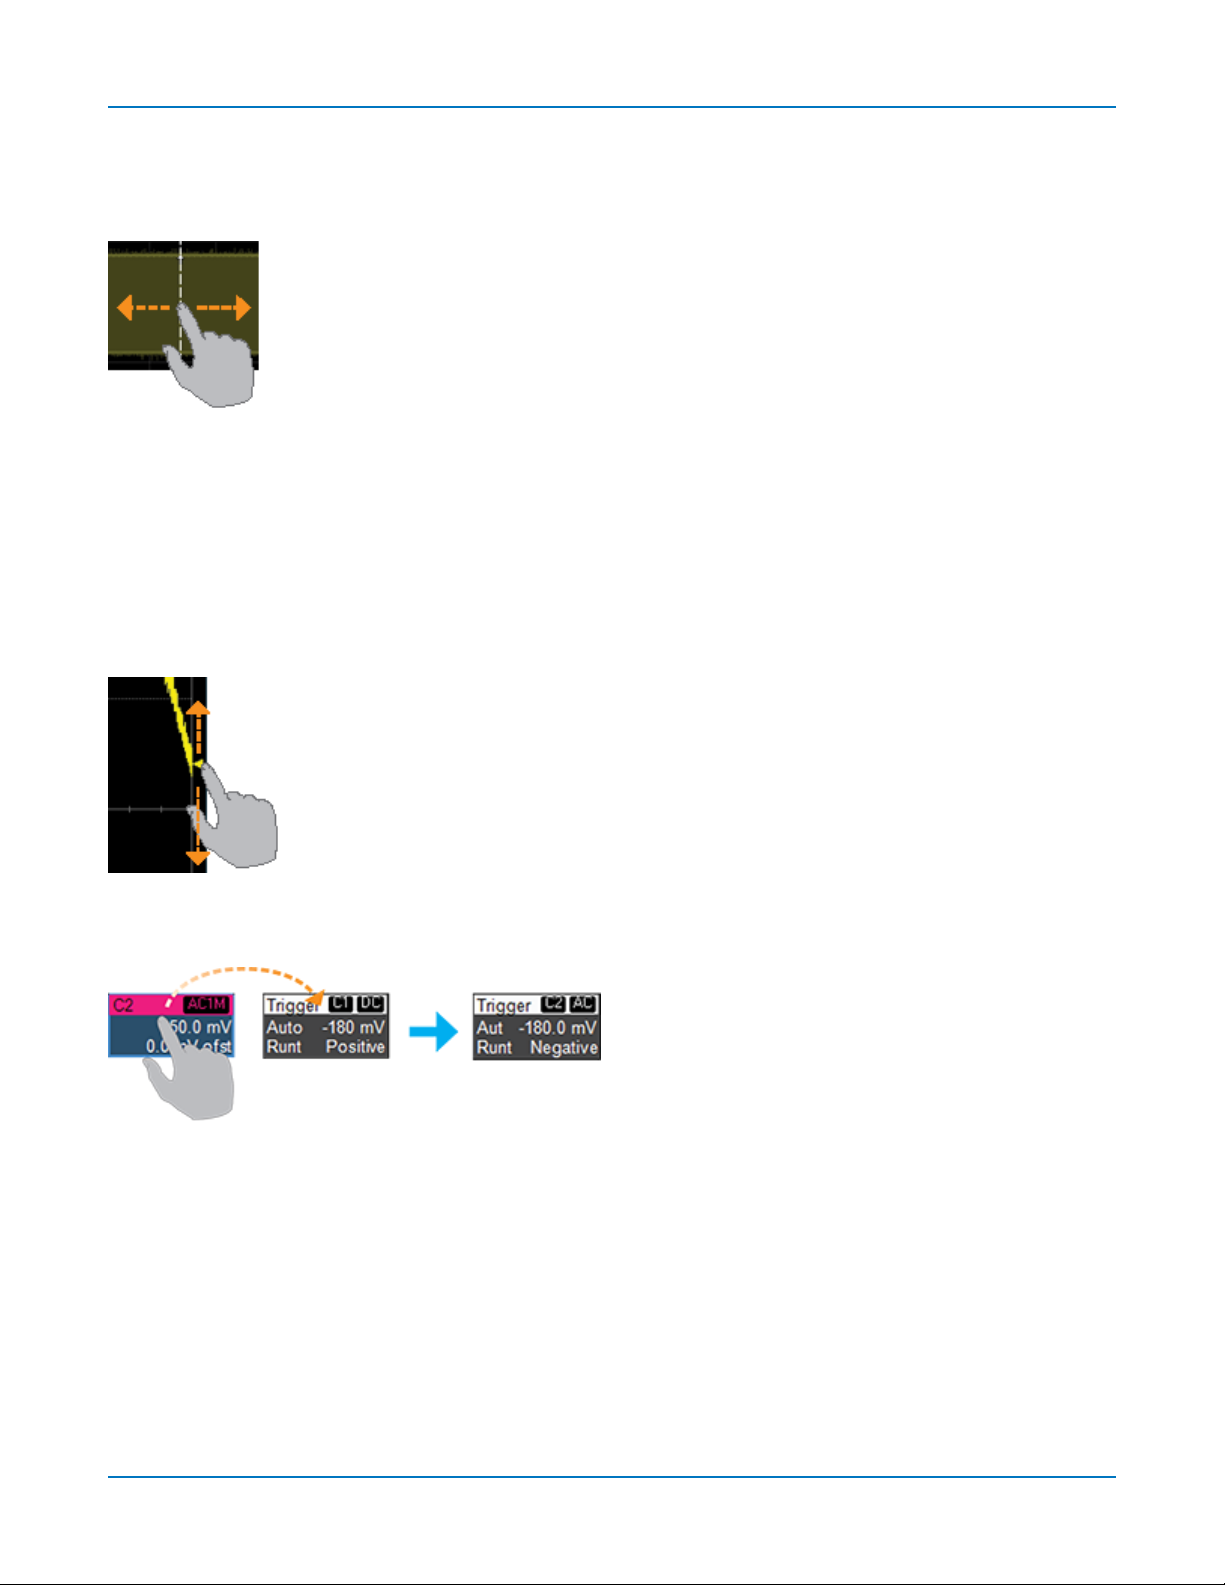
Change Trigger
Tochange thetriggerlevel,drag theTriggerLevelindicator to a new positiononthe Yaxis.The Trigger
descriptor boxwillshow the new voltage Level.
Tochange thetriggersource channel,drag-and-dropthedesiredchannel(Cn) descriptor box ontothe
Triggerdescriptor box.The triggerwillrevert to thecouplingandslope/polaritylast set onthat channel.
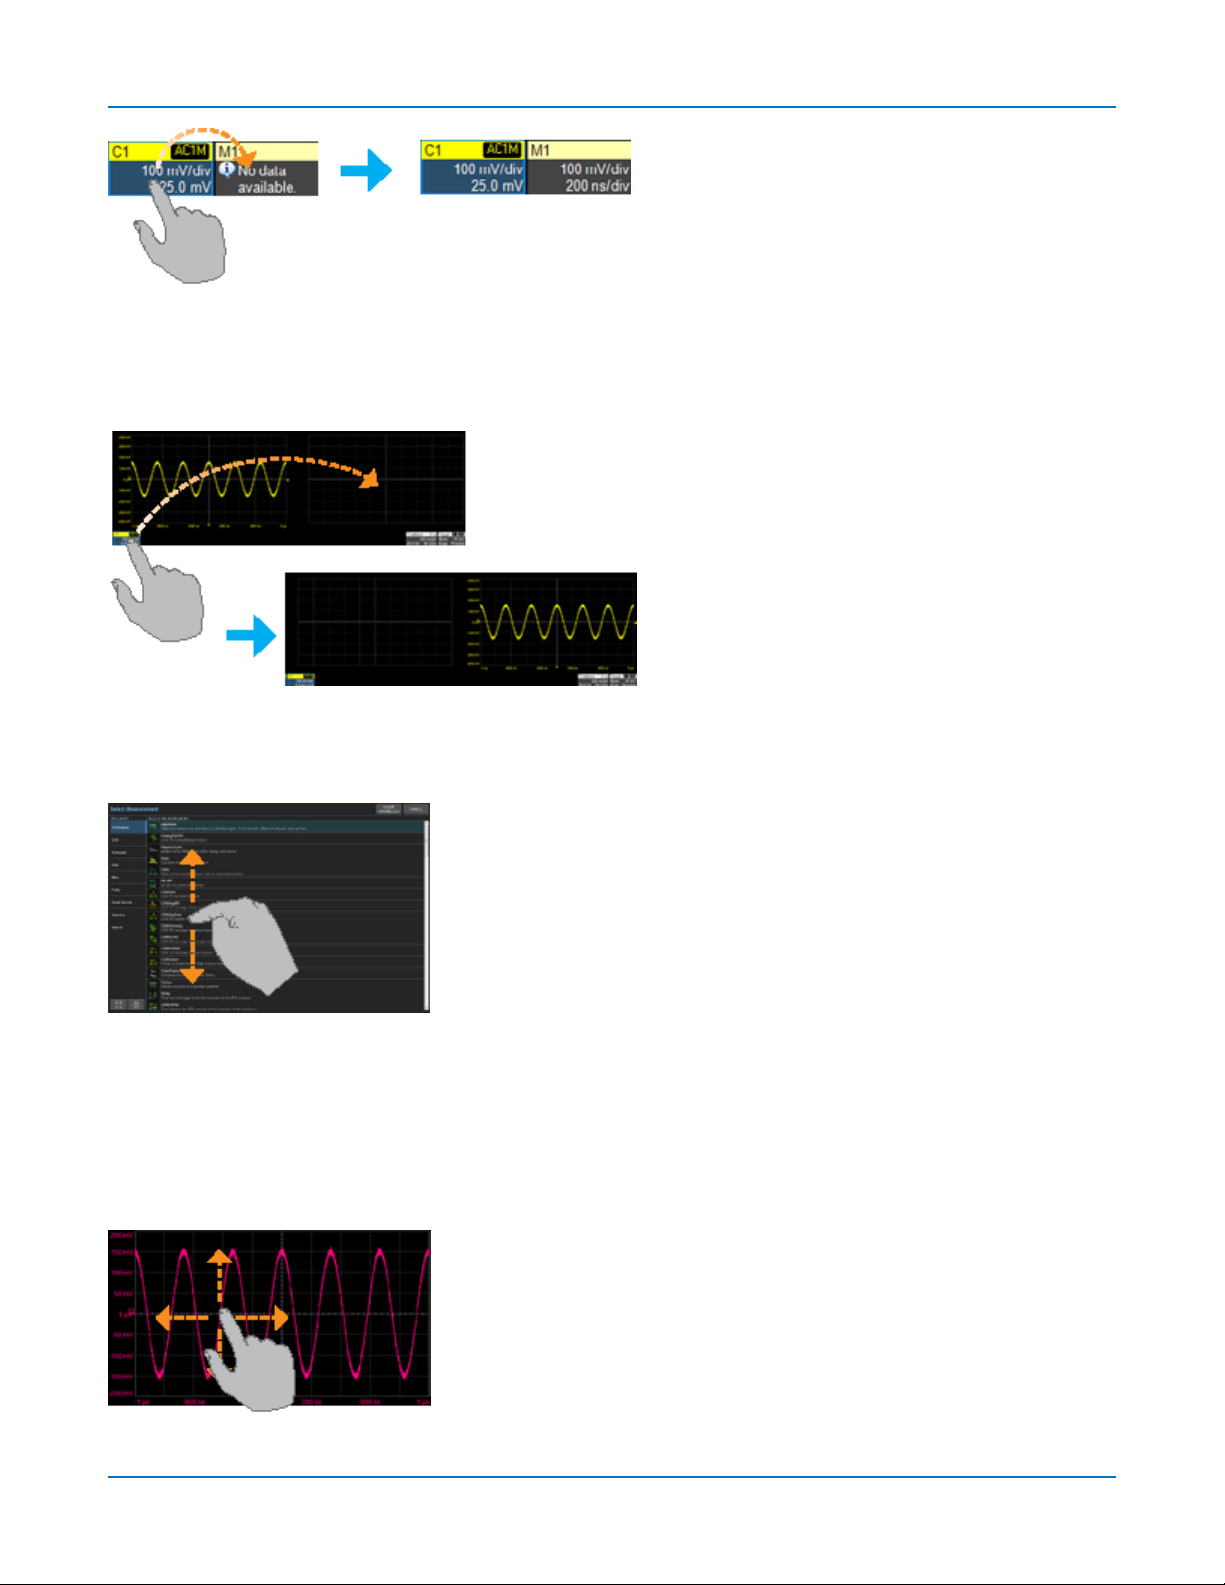
Store to Memory
Tostore a tracetointernalmemory,drag-and-dropits tracedescriptor box onto the target memory (Mn)
descriptor box.
23
Page 30
WaveRunner/MDA8000HDOscilloscopes Operator's Manual
Move Trace
Tomovea tracetoa different grid,drag-and-dropthe tracedescriptor boxonto the target grid. If youarein
amulti-tabbedQ-Scapedisplay mode,youcan movetracesbetweentabsthisway.
Scroll
Toscrolllonglistsofvaluesorreadout tables,swipethe selectiondialogor tableinan up or down direction.
Pan/Swipe Trace
Topana trace,activate it tobringit to theforefront,thendragthe waveform traceright/left or up/down.If
it is thesourceof any othertrace,that trace willmove,as well.
For channeltraces,the Timebasedescriptor box willshowthe new HorizontalDelayvalue.Forother
traces,thezoom factor controlsshow thenew Horizontal Center.
24
Page 31

Using MAUI
Tip:If you areusingthemulti-zoom feature,alltime-lockedtraces willpantogether.
Panningisan excellent wayto quicklymoveatrace intothe AnalysisZoneon >500 Mptsacquisitions.
Topanat anacceleratedrate,swipe the trace right/left orup/down.
Swipefrom thefar left of the screen toswitch "tabs"andshowthe Windowsdesktop. Swipefrom left
againtoreturnto the oscilloscopeapplication.
Turn Off
Toturnoffa trace,flick thetrace descriptor boxtowardthe bottom of thescreen.
Toturnoffa measureparameteror Pass/Fail query,flickthe Pnor Qncelltoward the bottom of the
screen.If it'sthe last activecellof the table,the tablewillclose.
25
Page 32

WaveRunner/MDA8000HDOscilloscopes Operator's Manual
Zoom
Tocreatea newchannelzoom trace,touchthendrag diagonally todraw a rectanglearoundthe portionof
thetrace youwant to zoom. Touch theZndescriptor boxtoopenthezoom factor controlsandadjust the
zoom exactly.
To"zoomin"on anytrace,unpinchtwo fingersoverthe tracehorizontally.
To"zoomout"on anytrace,pinch two fingersover thetrace horizontally.
Note:Pinchgesturesdo not create a separate zoom (Zn)trace,theyonlyadjust theHorizontal
Scale.Whenyoupinch a channel(Cn) trace,theTimebasefor allchannelschanges. If the trace is
thesource of anyother,allitsdependent traceschange,as well.
New Windows 10 Gestures
Windows 10 oscilloscopessupport new touch screengesturesfor accessingapplicationsandsettings:
l Swipefrom the left of thescreento switchapplicationsor show the desktop.Continue swipingto
return to MAUI.
l Swipefrom the right of the screento opentheActionCenter,from whereyoucanaccesssystem
settings.
26
Page 33

Using MAUI
Working With Traces
Traces arethevisiblerepresentationsof waveforms that appear on thedisplay grid.Theymayshow live
inputs(Cn,Digitaln),amath functionappliedtoawaveform (Fn),a storedmemoryof awaveform (Mn),a
zoom of awaveform (Zn),ortheprocessing results of specialanalysissoftware.
Traces areatouch screen object like anyother andcan be manipulated. Theycan bepanned,moved,
labeled,zoomed andcapturedindifferent visualformatsfor printingand reporting.
Each visible tracewillhaveadescriptor boxsummarizingits principalconfigurationsettings.See
OneTouch Helpfor moreinformationabout how you can usetracesandtracedescriptor boxesto modify
yourconfigurations.
Active Trace
Althoughseveraltracesmay beopen,onlyonetrace isactiveand canbe adjustedusingfront panel
controlsand touch screengestures.Ahighlighteddescriptor boxindicates whichtrace isactive.All
actionsapplyto that traceuntilyouactivate another. Touch the tracedescriptor boxtomake it theactive
trace (and theforegroundtrace in that grid).
Activetracedescriptor(left),inactivetracedescriptor (right).
Wheneveryouactivateatrace,thedialogat thebottom of thescreenautomaticallyswitchesto the
appropriate setupdialog.
Activedescriptorboxmatchesactivedialog tab.
Foreground Trace
Since multipletracescan be openedonthesamegrid,the traceshownon topof theothers isthe
foregroundtrace. Gridindicators(matchedtothe input channelcolor)representtheforegroundtrace.
Touch a trace or its descriptor box to bringit to the foreground.Thisalsomakesit the activetrace.
Notethat a foreground tracemaynot bethesame asthe activetrace.Atrace in aseparategridmay
subsequentlybecome theactivetrace,but theindicators onagivengridwillstillrepresent the foreground
trace inthat group.
27
Page 34

WaveRunner/MDA8000HDOscilloscopes Operator's Manual
Turning On/Off Traces
TurnOn/OffAnalogTrace
Toturn on a channeltrace,do anyof thefollowing:
l From thefront panel,presstheChannelbutton.
l From thetouch screen,chooseVertical> ChannelxSetup.
Toturn off atrace,pressthe front panelChannelbuttonasecondtime,orfrom thetouchscreen,doany
of the following:
l If the instrument has OneTouch,flick the tracedescriptor boxtowardthebottom of thescreen.
l Right clickon the descriptorboxandchooseOff.
l Touch the descriptorboxand clear the TraceOncheckboxon the setup dialog.
TurnOn/OffDigitalTrace
From the touch screen,chooseVertical>DigitalnSetupthen check Groupon the Digitaln dialog.
Turnoff the trace,clear theGroup checkbox.
TurnOn/OffZoomTrace
See Creating Zooms.
TurnOn/OffOtherTrace
Toturn on/off mathormemory traces,checkorclear theTrace Onboxon the respectivesetupdialogs.
You can alsotouch the AddNewboxandselect the tracetype,or draganother descriptorboxof that type
tothe AddNew box(e.g.,dragM1to AddNew to turnonathe next availablememory trace).
28
Page 35

Using MAUI
Adjusting Traces
Toadjust VerticalScaleandOffset,or HorizontalScaleandDelay,just activatethetrace
andusethefront panelknobs. To makeother adjustments—suchas units—touchthe
trace descriptor boxtwice to openthe appropriate setup dialog.
Many settingscan beadjusted byselecting from thepop-up
that appearswhenyou touch a control. Whenanentry fieldappears
highlightedinblueafter touching,it isactiveandcan be adjustedbyturning
thefront panelknobs. Fields that don't have adedicatedknob(asdo
Vertical Leveland Horizontal Delay)can bemodifiedusingthe Adjust knob.
If you havea keyboardinstalled,youcan typeentriesinan active
(highlighted) data entry field.Or,youcantouchagain,then"type"the entryby
touchingkeyson thevirtualkeypador keyboard.
Tousethevirtualkeypad,touchthe soft keysexactlyasyouwoulda
calculator. Whenyoutouch OK,thecalculatedvalueisenteredinthe field.
Measurementsandmath arecalculated ononlythecenter 500 Mpts of
acquisitionsgreaterthan500 Mptsinlength,known asthe analysis zone.Thisregionof the source traceis
indicated byshading appliedtotheoutsidearea,leaving the analysiszone"highlighted"byits absence.
Thearea of the analysis zonecanbeadjusted byusingHorizontalDelay andother methodsto shift the
desiredportionof thetrace intothe unshadedarea.SeeNavigatingLongAcquisitions.
Shadedarea indicatingedges of analysiszonebeing measured.
29
Page 36

WaveRunner/MDA8000HDOscilloscopes Operator's Manual
Labeling Traces
TheLabelfunctiongivesyoutheability to addcustom annotationstothe tracedisplay.
Onceplaced,labelscanbemovedto new positionsorhiddenwhileremaining
associatedwiththe trace.
CreateLabel
1. Select Labelfrom the context menu,or touchtheLabelActiontoolbarbutton onthetrace setup
dialog.
2. OntheTrace Annotationpop-up,touchAddLabel.
3. Enter the LabelText.
4. Optionally,enter the HorizontalPos.andVerticalPos.(in same unitsas thetrace) at which to place
thelabel.The default positionis0 nshorizontal.UseTrace VerticalPositionplacesthe label
immediatelyabovethetrace.
RepositionLabel
Drag-and-drop labelstoreposition them,or changethe positionsettingson theTrace Annotationpop-up.
Edit/RemoveLabel
On theTrace Annotationpop-up,select the Labelfrom thelist.Changethe settingsas desired,or touch
Remove Labeltodelete it.
ClearView labelsto hidealllabels. Theywillremaininthe list.
30
Page 37

Using MAUI
Moving Traces
You can movea tracefrom one gridtoanother bydraggingits descriptorboxto thedesiredgrid.Thisisa
convenientwaytoquicklyre-arrange tracesonthe display.
If you are inQ-Scapedisplaymode,youcan dragthedescriptor boxtoagrid on another tab,providedthe
gridisvisible whileyouare movingthetrace. Forexample,youcannot drag descriptors acrosstabsinQScapeSingle mode,becausethe target gridsaren't visible,but you caninQ-ScapeDualor Q-Scape
Mosaic modes.Thisistrue evenin extendeddisplay. Formoreinformation,seeDisplay.
See OneTouch Helpforwaysto pan traceswithinthesamegrid.
Naming Traces (Aliases)
Acustom namecan beaddedto themnemonic associated with a traceonitsdescriptor box,making the
oscilloscopeuserinterface moreintuitive.Thiscustom namewillappearinreports.
Note:Althoughthere isa 250 character logicallimit,we recommendkeeping namesto 10
charactersor less,ascharactersover thisnumberwillbe truncated on thedisplay. Custom aliases
applyonlytotheoscilloscopedisplay;usethe originaltrace mnemonic (C1-Cn,F1-Fn,etc.) to refer
totracesinremote control programs.
AddingName
1. Right-clickonthe tracedescriptor box todisplay thecontext menu,thenselect Add/EditName.
Tip:You can alsoselect Add/Edit Name from the traceAction toolbar.
2. Onthevirtualkeyboard,enterthenewname (alias)and clickOK.
Thealiaswillappearwhereverthistrace isreferencedonthe userinterface.Ontrace
descriptor boxes,the originaltrace labelwillappearabovethealias.
RemovingName
Toremoveanalias from the trace,open thetrace context menuandchooseRemoveName.
31
Page 38

WaveRunner/MDA8000HDOscilloscopes Operator's Manual
Zooming
Zooms magnifyaselected regionof atracebyalteringthe horizontaland/or vertical scalerelativeto the
sourcetrace. Zoomsmaybecreatedinseveralways,byusingeither thefront panelorthetouchscreen.
You can adjust zoomsthesameasanyother trace byusingthe front panel Verticaland Horizontal knobs
orthetouchscreenzoom factor controls.
Thecurrent settingsforeach zoom tracecan beseenon theZndialogs,whilethe Zoom dialogisa
convenientpanelfor turningon/off different zooms or changingthe zoom source.
TheMultiZoom featurelocksthe Horizontal Scaleand Center of thosetracesthat youchooseto includein
theMultiZoom group.Asyou changethescaleor positionof anytrace in thegroup,alltraceschangein
unison.Formore information,seeMultiZoom.
ThissectiondescribesthestandardZoom functionality of theX-Stream application.For adescription of
theMDAZoom+Gate feature,seetheMotor DriveAnalyzerSoftwareInstructionManual.
Zoom Dialog
Zoom controlsappearthroughout the oscilloscopesoftware whereverit is likelyyoumaywishto change
thedisplayscaleof a trace—sometimesas a maindialog,sometimesas a subdialog,aswhensettingup:
l MathtracesonFndialogs
l Memory traceson Mn dialogs
Todisplay theZoom dialog,chooseMath>Zoom Setupfrom the menubar.
ThemainZoom dialogcontainsselectionboxesfor turningon/off andchangingthe source of azoom.
Thereare alsooptionsto:
l Reset All,returnallzooms to x1magnification.
l QuickZoom,create a corresponding zoom trace for each openchanneltrace,same asusing the
front panelZoom button.
l Turn onMultiZoom for allactivezooms.
32
Page 39

Using MAUI
ZnDialog
Behind themain Zoom dialogis aseparatetabfor eachpotentialzoom trace (Z1-Zn). Each Zn dialog
reflectsthe centerandscalefor that zoom. Useit to adjust each zoom independently.
TraceControls
Trace Onshows/hidesthe zoom trace. It isselected bydefault whenthezoom iscreated.
Sourcelets youchangethe source of thiszoomtoanydigital,math or memorytrace whilemaintainingall
other settings.
SegmentControls
ThesecontrolsareusedonlyinSequenceSamplingMode.
ZoomFactorControls
l Out andInbuttonsincrease/decreasezoommagnificationandconsequentlychangetheHorizontal
and Vertical Scalesettings.Touch eitherbutton untilyou've achievedthe desiredlevel.
l Var.checkboxenableszoomingin singleincrements.
l HorizontalScale/divsets the time represented byeach horizontaldivision of the grid.It isthe
equivalent ofTime/divinchanneltraces,onlyunlikethat setting,it maydiffer for eachzoomtrace.
l VerticalScale/divsets the voltagelevelrepresentedby each vertical division of thegrid;it'sthe
equivalent ofV/divin channeltraces.
l Horizontal/VerticalCentersets thetime/voltage at thecenter of the grid.
l Reset Zoom returnsthe zoom to x1magnification.
33
Page 40

WaveRunner/MDA8000HDOscilloscopes Operator's Manual
Creating Zooms
Any typeof trace canbe zoomed bycreatinganewzoom trace(Zn)followingtheprocedureshere. Zoom
tracesopenin thenext empty grid,withthezoomedportionof thesourcetrace highlighted. If there areno
more available grids,zoomswillopeninthe same grid asthe source trace.
Note:On most instruments with OneTouch,tracescan be"zoomed"bypinching/unpinchingtwo
fingersoverthe trace,but thismethod doesnot create a separate zoom trace. With channel
traces,pinchingwillalter theacquisitiontimebaseandthescaleof alltraces. Createaseparate
zoom trace if youdonot wishto dothis.
Zoomedarea of original tracehighlighted.Zoom in newgridbelow.
QuickZoom
Use the front panelZoom buttonto quicklycreate onezoom tracefor eachdisplayedchanneltrace. Quick
zoomsarecreatedat the same vertical scale asthe source traceand10:1horizontalmagnification.The
MultiZoom featureisturnedon,and allthe new zooms are automaticallyaddedto theMultiZoom group.
Toturn off the quick zooms,presstheZoom buttonagain.
ManualZoom
To"rectanglezoom",touch-and-dragdiagonally to draw a rectanglearoundthe
part of the source trace youwishto magnify,thenchoosea destination:thesame
trace to rescalethesource,or a Zn location tocreate a new zoom trace.
Thezoom willexpandthe horizontalareato fit the fullwidth of the grid,whilethe
verticalarea willberescaledproportionally. Thedegreeof vertical andhorizontal
magnification,therefore,depends on thesizeof therectanglethat youdraw.
Alternatively,withOneTouch youcan draganyZn descriptorboxovertheAdd
Newbox,or touchthe AddNew boxand chooseZoom from the pop-up menu.The
next available zoom traceopenswith itsZn dialogdisplayed for youtomodify
scaleas needed.
Finally,youcan create a Zoom mathfunction.Thismethod creates anew Fntrace,rather thananewZn
trace,but itcan be rescaledinthe same manner.It is a way tocreate morezoomsthanyouhaveZn slots
availableonyourinstrument.
34
Page 41

Using MAUI
AdjustZoomScale
Thezoom'shorizontal units willdiffer from the signaltimebasebecausethe zoom isshowingacalculated
scale,not ameasuredlevel.Thisallowsyouto adjust thezoom factor usingthe front panelknobsor the
zoom factor controlshoweveryoulikewithout affecting thetimebase(a characteristic sharedwith math
andmemorytraces).
CloseZoom
Newzoomsare turnedonand visible by default. If thedisplay becomestoo crowded,youcanclosea
particularzoom and the zoom settingsaresavedinits Zn slot,readyto be turnedonagainwhendesired.
Toclosethe zoom,right-click(touch-and-holduntil thewhiteboxappears)on thezoom descriptorbox,
thenfrom the context menuchooseOff.
MultiZoom
TheMultiZoom featureunifiesthe Horizontal Scale(Time/div)settingof thosetracesthat you chooseto
includein theMultiZoom group.Thetracescan be zoomsor othertypesof calculated(asopposedto
acquired)time traces,such asmemoriesor math functions.Thisallowsyouto zoom in/out onseveral
tracesinunison,evenif they represent different sources,andmovetheentire grouptogether asone trace
isrepositionedby draggingor usingtheAutoScrollcontrols.
Note:Tracesthat cannot be inthesameMultiZoom group becausethey arenot time traces or are
different recordlengthsare excludedfrom selection.
Thedefault MultiZoom setstracestotheSameZoom Position(Horizontal Center). Youmayoptionally
choosean Independent Zoom Positioninorderto simultaneouslyview different partsof theacquisitionin
different traces,whilecontinuingto zoom andscrollinunison.
MultiZoom isautomaticallyenabledwhenyouusethe QuickZoom method,and allQuickZooms are
addedto theMultiZoom group.Thedescriptor boxesof thosetracesinthe grouparemarkedwithagreen
underline.
When MultiZoom isenabledmanuallyfrom the Zoom orMultiZoom dialogs,activezooms are
automaticallyaddedto the MultiZoom group,althoughother typesof calculated tracesmust beadded
manually.Asyouadd tracesto thegroupby checkingthe selectionboxonthe MultiZoom dialog,theyare
set to thesame Horizontal Scaleas thefirst tracethat was added tothegroup since MultiZoom waslast
enabled. Once the groupis set,modifyinganymemberof the groupusingthefront panelHorizontalknobs
ortouch screen Horizontal controlswillchangethe entiregroup.
Note:Sincezoomsare addedfirst,thelowest numberedzoom in the groupis usually the "master"
trace to whichallothersare rescaled,eventhoughit maynot appear at thetopof the list of eligible
tracesonthe MultiZoom dialog.When MultiZoom isusedwith decodedSerialData waveforms,
theresult tablefunctionality overridesthisbehavior,andzooms createdby touchingatablecell
willcenteronthat part of the acquisition.
MultiZoom doesnot affect theVerticalScaleandOffset of anytracesin theMultiZoom group.These
continueto be controlledindependentlyfor eachtrace.
35
Page 42

WaveRunner/MDA8000HDOscilloscopes Operator's Manual
SetUpMultiZoom
1. ChooseMath> Zoom Setup...toopenthe Zoom dialog.
2. ChecktheMultiZoombox.Allactivezooms areaddedto thegroupand rescaledto matchthefirst
activezoom in the list.
3. To modify the groupfurther byaddingor removingother typesof traces,openthe MultiZoom
dialogandselect all thetracesthat are Inthe MultiZoom group.
4. To changethe Zoom Positionof anytraceinthe group,select Independent,then openthe trace
dialog and changetheHorizontalCenter.
Note:Scrollingor dragginganyof the MultiZoom grouptraces willshift theHorizontal
Center of thistrace by thesame amount of Delayasthe others,however,it will remain
proximate to the center youset,whichcan be useful when wantingto stepthroughtwo
different sectionsof alongeracquisition.
ScrollWaveforms
TheAuto-Scrollcontrolsappear at theright of the MultiZoom dialog.Theywork similarlyto A/Vcontrolsto
allowyoutocontinuouslyscrollallthe selectedtraces intime-lockedstepsfrom the beginning to the end
of the acquisition.
36
Page 43

Acquisition
Acquisition
Theacquisitionsettingsincludeeverythingrequiredto produce a visibletraceonscreenandan acquisition
record that maybe savedfor laterprocessingandanalysis:
l Verticalaxisscaleat which toshowthe input signal,and probecharacteristics that affect the signal
l Horizontal axisscaleat whichto represent time,samplingmodeandsamplingrate
l Acquisitiontriggermechanism
Optionalacquisitionsettingsincludebandwidth filtersand pre-processingeffects,verticaloffset,and
horizontal triggerdelay,all of whichaffect theappearanceand positionof the waveform trace.
All current acquisitionsettingscanbeviewed throughthe variousStatusdialogs.Accessthem by
choosingtheStatusoptionfrom the Vertical,Timebaseor Triggermenus.
Auto Setup
Auto Setup configuresthe essentialacquisitionsettingsbasedonthefirst input signalit finds,startingwith
C1.If nothingisconnectedtoC1,it searchesC2 andsoforth untilit findsasignal.VerticalScale
(Volts/div),Offset,Timebase(Time/div),andTriggerare set toanEdge triggeronthe first,non-zero-level
amplitude,with theentire waveform visiblefor at least 10 cyclesover10 horizontaldivisions.
TorunAuto Setup:
1. Pressthefront panelAutoSetupbutton,or chooseAutoSetupfrom the Vertical,Timebase,or
Triggermenus(theseallperform thesame function).
2. To confirm,pressthe AutoSetupbutton again,or usethetouchscreendisplay.
AfterrunningAuto Setup,you'llseethewords"Auto Setup"next to anUndobutton at the far right of the
menu bar. Thisallowsyouto restore the settingsinplace prior to theAuto Setup.
Caution:Youwillundoallnew measurementsor math functiondefinitionsenteredsincethe Auto
Setup whenyouUndotheAuto Setup.
37
Page 44

WaveRunner/MDA8000HDOscilloscopes Operator's Manual
Vertical
Vertical,alsocalledChannel,settingsusuallyrelate to voltagelevelandcontroltracesalongtheYaxis.
Note:WhileDigitalsettingscanbeaccessedthroughtheVertical menuon MixedSignal
oscilloscopes,theyarehandledquitedifferently.SeeDigital.
Theamount ofvoltagedisplayedby oneverticaldivision of the grid,orVertical Scale(V/div),ismost
quicklyadjustedbyusingthe front panel Verticalknob.The Cn descriptor boxalwaysshowsthe current
VerticalScalesetting.
Detailedconfigurationfor each trace isdone ontheCndialogs.Once configured,channeltracescan be
quicklyturnedon/off ormodified usingtheChannelSetupdialog.
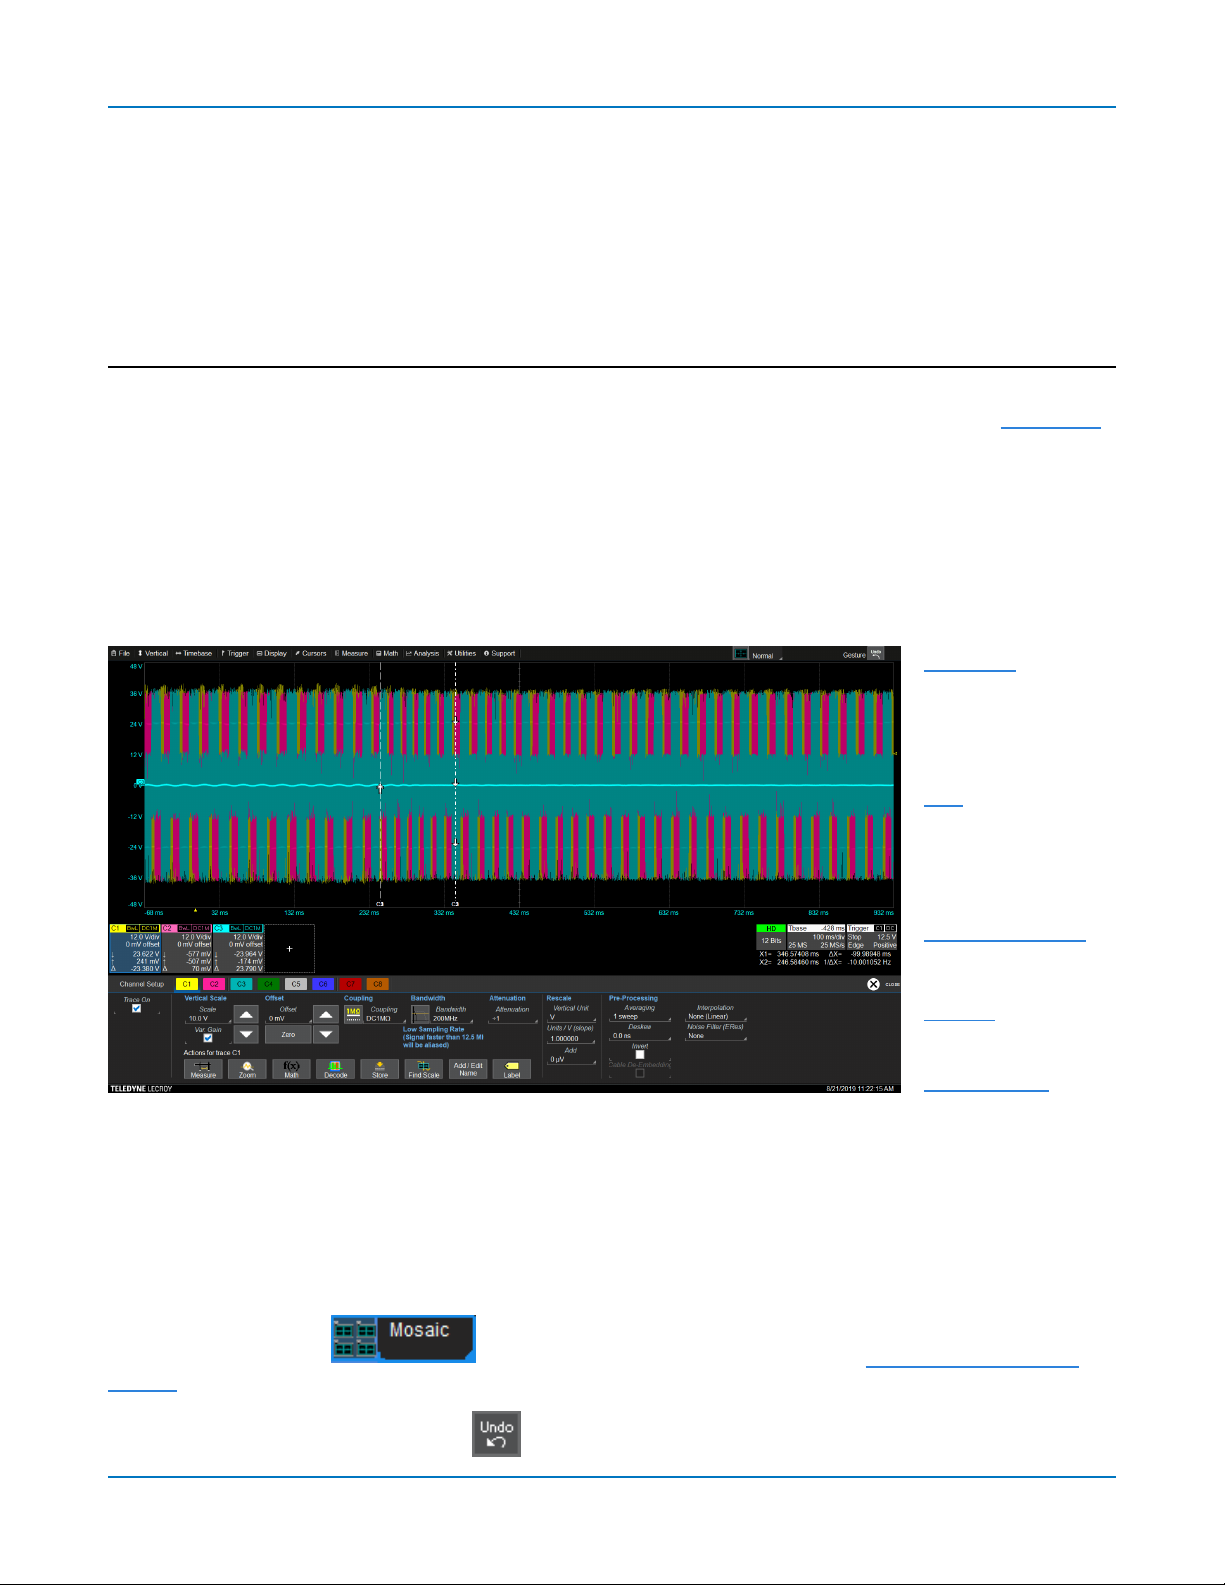
Channel Setup Dialog
Use the ChannelSetup dialogto quicklymakebasic Verticalsettingsfor allanaloginput channels.To
accessthe ChannelSetup dialog,chooseVertical> ChannelSetupfrom the menubar.
Toturn on/off the channeltrace,select/deselect the checkbox.
Tochangethe tracecolor,touch the colorblock,thenchoosethe new colorfrom the pop-up.
TochangeanyotherVerticalsettings,touchthe input fieldandenter thenew value.
You can alsotouch CopyChannelSetupand select thechannelsto CopyFromandCopyTo.
Tip:On instruments with OneTouch,youcancopysettingsfrom onechanneltoanother just by
draggingthe source channeldescriptorboxontothetarget channeldescriptorbox.
38
Page 45

Acquisition
Cn (Channel) Dialog
Full verticalsetupisdoneonthe Cn dialog.To accessit,chooseVertical>ChannelnSetupfrom the menu
bar,or touchtheChanneldescriptor box.
TheCndialogcontains:
l Verticalsettingsfor Scale(V/div),Offset,Coupling,Bandwidth,andprobeAttenuation
l Units/Rescalesettings
l Pre-processing settings,suchasNoiseFilter and Interpolation.
If aTeledyne LeCroy probeisconnected,itsProbedialogappearstotheright of theCn dialog.
VerticalSettings
TheTraceOncheckboxturnson/off the channeltrace.
VerticalScale sets thegain(sensitivity) inthe selectedVertical units,Voltsby default. Select Variable Gain
forfineadjustment or leavethe checkboxclearforfixed1,2,5,10-stepadjustments.
Offsetaddsa definedvalueof DCoffset tothesignalas acquiredbythe input channel.Thismaybehelpful
inorder to displaya signalon thegridwhilemaximizingthevertical height (gain)of thesignal. Anegative
valueof offset will"subtract"a DCvoltagevalue from the acquiredsignal(andmovethetrace down on the
grid)whereasa positivevaluewilldo theopposite. Touch ZeroOffsetto return tozero.
Avariety of Bandwidthfiltersareavailable.Tolimit bandwidth,select afilter from thisfield.
Couplingmaybeset to DC50 Ω,DC1M,AC1M or GROUND.
Caution:Themaximum input voltagedependson theinput used.Limits are displayedonthe body
of the instrument.Whenever thevoltageexceedsthislimit,the coupling modeautomatically
switchesto GROUND.Youthenhavetomanuallyreset the couplingtoits previousstate. While the
unit doesprovidethisprotection,damagecan stilloccur if extreme voltagesare applied.
ProbeAttenuation
Probe Attenuationvaluesfor third-party probesmaybeenteredmanually ontheCndialog. The instrument
willdetect it isa third-party probeanddisplaythesefields.
When a TeledyneLeCroyprobe isconnected to achannelinput,theAttenuationfieldbecomesa buttonto
accessthe Probedialog,a tab addedto the right of theCntab.Enter Attenuationon theProbe dialog.
39
Page 46

WaveRunner/MDA8000HDOscilloscopes Operator's Manual
RescaleSettings
Therescalesettingsprovidethesame capabilityasthe Rescalemathfunction(y=ax+b,wherethe original
valueisx,Units/Visa,andAddis b),onlyapplieddirectlyto the channeltrace rather thantoaseparate
functiontrace.
Enter the numberof unitsequalto1Volt inUnits/Vand anyadditiveconstant inAdd.
VerticalUnitsmay bechangedfrom Volts(V)to Amperes(A)or Otherunitsof measure.This isuseful
whenusingathird-partycurrent probe(whichisnot auto-detected) or whenprobingacrossa current
sensor/resistor.
Pre-ProcessingSettings
Pre-processingfunctionsmodifythe acquiredsignalpriorto display,math andmeasurement processing.
Averaging
Average performscontinuousaveraging,the repeated addition,withunequalweight,of successivesource
waveforms.It is particularlyusefulfor reducingnoiseon signalsdriftingveryslowlyin time or amplitude.
Themost recentlyacquiredwaveform hasmoreweight thanallthe previouslyacquiredones:the
continuousaverageisdominated bythestatisticalfluctuationsof the most recentlyacquiredwaveform.
Theweight of oldwaveforms inthecontinuousaveragegradually tendsto zero(followinganexponential
rule)at arate that decreasesasthe weight increases.Averagingisdisabledon>500 Mptsacquisitions.
Interpolation
Interpolate applies(Sinx)/x interpolationto the waveform. The selectionof None or Linearapplies Linear
interpolation,which inserts a straight linebetween sample pointsandis best usedto reconstruct straightedgedsignals such as squarewaves. (Sinx)/xinterpolation,ontheother hand,is suitablefor
reconstructingcurvedorirregularwave shapes,especiallywhenthe samplerateis3 to 5times the
system bandwidth.Chooseanupsamplefactorof 2 or more points. TheInterpolationsettingisdisabledon
>500 Mpts acquisitions.
Deskew
Deskew adjusts the horizontaltimeoffset bytheamount entered inordertocompensateforpropagation
delays causedbydifferent probes or cablelengths.Thevalid range isdependent on thecurrent timebase
setting.The Deskew pre-processingsettingandtheDeskewmath functionperform the same action.
ERes/ Noise Filter
NoiseFilterappliesEnhanced Resolution(ERes) filteringtoincreasevertical resolution,allowingyouto
distinguish closelyspaced voltage levels. The tradeoff isreducedbandwidth.EResfunctionssimilarlyto
smoothingthesignalwithasimple,moving-averagefilter. It isbest usedonsingle-shot acquisitions,
acqusitionswherethe datarecord isslowlyrepetitive(andyoucannot use averaging),or to reduce noise
whenyoursignalisnoticeablynoisybut youdonot needtoperform noise measurements.It alsomay be
usedwhen performing high-precision voltagemeasurementsand zoomingwithhighverticalgain,for
example.EResisdisabled on>500 Mptsacquisitions.
Inversion
Invert changestheapparent polarityof thesignal,substituting anequivalent negativevalue for a positive
one,andviceversa,sothat the waveform appearstobe"flipped"onscreen.
40
Page 47

Acquisition
Cable De-embedding
Thischeckboxappearsif youhavetheCableDe-embeddingoptioninstalled.CableDe-Embeddingallows
youto removethe effects of cablesusedinthetest setup. Select the checkbox,thenenter the
attenuationconstantsorcablecharacteristics (providedbythe cablemanufacturer) on theCableDeEmbeddingdialogthat appears. SeeCableDe-Embedding.
Probe Dialog
TheProbeDialogimmediatelytotheright of theCn dialogdisplaystheprobeattributes and(dependingon
theprobe type)allowsyouto controlthe probefrom the touch screen.
Caution:Removeprobesfrom the circuit under test beforeinitializingAuto Zeroor DeGauss.
Dependingonthe typeof probe youhaveconnected to thechannel,youwillsee anyof the following
controls:
PowerOninitiatespowertoactiveprobesviatheoscilloscopeinterface.
LED Active turnson AutoColorIDif theprobehasthisfeature.TheLEDonthe probebodywilllight inthe
color of thechannelto which theprobeisconnected.
AutoZerocorrectsfor DCoffset drifts that naturallyoccur from thermaleffectsinthe amplifierof active
probes.Teledyne LeCroy probesincorporate Auto ZerocapabilitytoremovetheDCoffset from the
probe's amplifieroutput to improve themeasurement accuracy.
TheDegausscontrol isactivated for some typesof probes(e.g.,current probes). Degaussingeliminates
residual magnetization from theprobecore causedbyexternalmagnetic fieldsor byexcessiveinput. It is
recommendedto alwaysDegauss probesprior to takinga measurement.
If usingaWaveLink probe,touchTipSelectand select thetype of tip/leadyouare using.
Note:Makingthetip selectionhere results intheamplifier andtipcombinationhavingthe
response calibratedforat thefactory.Failuretodo so mayresult in inaccuratemeasurements.
On oscilloscopesrunningMAUI version8.5.1.1or later,HVD3000 probesset attenuationrelativeto the
oscilloscope’sV/divsettingand the VoltageRange selection:
l AutoautomaticallyraisesattenuationwhenV/divis>7.9orlowersattenuationwhen V/divis<7.9,
allowingyouto properlyview theinput waveform.
l LocktoHighlocks attenuationto the highestsetting,regardless of the V/divsetting.Maintaininga
highattenuationwillallow smallsignals onlargervoltagewaveformsto be accuratelymeasured.
41
Page 48

WaveRunner/MDA8000HDOscilloscopes Operator's Manual
OscilloSYNC Acquisition
OscilloSYNC™technologyallowsyoutoviewand control theanaloginput channels of anytwo
WaveRunner/MDA8000HDoscilloscopesfrom oneoscilloscopedisplay. All16 channels are available for
acquisition,triggering,cursors,measurements,single-sourcemath functionsandother analysis tools,as
wellas most standardand Q-Scapedisplayfeatures.
Limitations
ThefollowingfeaturesaresupportedonlyonC1-C8followingsynchronization:
l Dual-source math functions
l Dual-source triggers,such asPattern and Qualified
l Traceannotation(on-gridlabeling only;aliasing is supportedonC9-C16)
ActivatingKey
OscilloSYNCrequirestheactivationof a free software licensekeyoneachoscilloscopethat youwishto
useasa"Main"display. Youcan onlyinitiatetheconnection,viewand control waveformsfrom Mains.The
keycanbe downloadedfrom ourwebsiteat:teledynelecroy.com/redeem/OscilloSYNC
Follow the usualprocedure for activatingsoftware options.Onlythe Maininstrumentsrequirea key.
Oncethe keyis activated,an OscilloSYNCSetupdialog and tabsfor C9-C16areaddedbehindthe
oscilloscopeChannelSetupdialog. Thesetabswillappearevenwhenthere isnophysicalconnectionto
another oscilloscope,althoughthechanneldescriptor boxeswillindicate that thereis"No dataavailable."
You can beginconfiguringchannelsC9-C16beforeorafter makingthe physicalconnection.Waveforms
willappearonce anacquisitionhasbeenmade followingsynchronization.
Note:Acquisitionmaybe stoppedor in processonthe Remote priortoconnecting.
Connecting/DisconnectingOscilloscopes
Toconnect the oscilloscopes,youmust supply:
l 2 standardBNCcables
l 1 standardEthernet cablefor a direct connection,or 2 Ethernet cablesto connect each machinetoa
networkaccesspoint
1. Connect one BNCcablefrom RemoteRefOutto MainRefIn.
2. Connect theother BNCcablefrom Remote AuxOut to MainAuxOut.
3. Connect theEthernet cablefrom RemoteENET to MainENET,or connect each of the
oscilloscopesto yournetworkindividually.
42
Note:Theonlyrequirement isthat both machinesare on thesame network,andthat the
Remote and Mainare accessibletoeach other.
Page 49

Acquisition
4. OntheMain,chooseVertical> OscilloSYNCSetup.The OscilloSYNCSetupdialog willappear.
5. If the oscilloscopesare connectedthroughthenetwork,enter theIPAddress/Hostname of the
Remote. Youcanskipthisstepif they aredirectlyconnected.
Tip:You can findthe IPAddressof theRemote machinebychoosingUtilities>Utilities
Setup >Remotefrom the Remotemenubar.
6. TouchConnect.
Assoonasthe Remote hasbeen discovered,anyacquisitiondataforRemotechannelsC1-C8willappear
inchannelsC9-C16 on theMain,andthe Connected boxwillbe checkedonthe OscilloSYNCSetupdialog.
You can usethe dialogto adjust settingsfor any of theremote channels.
Amessage willappearonthe Remoteindicating synchronization isin process.Initiateanyfurther
acquisitionor analysisfrom the Maininstrument.
Toendthe synchronization,just touch Disconnect oneither machine.TheMainwillretain thedisplayof
tabsC9-C16,but thedata willclearupon thenext acquisition.
Deskewing
Althoughtheintrachannelskewof the oscilloscopesisnegligible,youmay optionally deskewinputsto
account for propagation delayscausedby cablesbetweeninstruments,etc. To do this,we recommend:
1. With theoscilloscopessynchronized,usea splitter to input one half of arepetitivesignal(e.g.,sine
orsquarewave) toanyof channelsC1-C8 and theother half toanyof channelsC9-C16.
Tip:Ideally,onechannelshouldbe thetriggerchannel,andthe second anychannelfrom
theother oscilloscope.
2. Turn on bothchannels.Adjust the timebasesothat thefalling edgeof thepulses isclearlyvisible.
3. OntheOscilloSYNCSetup dialog,enteraTriggerSkewCorrectionvalueineither Remote (C9-C16)
orLocal(C1-C8),depending onwhich bankcontainsthe triggerchannel,sothat the fallingedgeof
theRemote oscilloscopepulsealignswith the fallingedgeof the Mainoscilloscopepulse.
43
Page 50

WaveRunner/MDA8000HDOscilloscopes Operator's Manual
Cable De-Embedding
Losses inthecablesusedin the test setupcan reduce the accuracyof yoursignal(e.g.,signalamplitude
andrisetime),aswellasintroduce Inter-SymbolInterference.Thesecableeffectscan dramaticallyalter
measurementsandpotentiallycreatemasktest violations.
CableDe-Embedding(available as anoptiononWaveRunner/MDA8000HD) allows youto quicklyspecify
thelosscharacteristics of thecables,typicallyfoundonthe cable'sdata sheet,and analyze your signal
withtheeffectsremoved.The compensated signalisa more accurate representationof what was
actuallytransmitted.
When CableDe-Embeddedisinstalledandselected from thechannelpre-processing settings,theCable
De-Embedding dialogwillappearfor you todescribethe cablebeingusedonthe channel.
1. TouchVertical> Channel# Setup... from the menubar,then ontheCndialog,check Cable De-
Embeddingto display the CableDe-Embeddingtab.
2. OntheCableDe-Embeddingdialog,touch Cable Specifiedbyandchooseeither:
l AttenuationConstants.Enterthecablelossmodelconstants inCableA1andCable A2.
l AttenuationTable.Enter the first set of FrequencyandAttenuationvalues.Touch Addto
continueaddingrowsasneeded.
Tip:Toedit a row in thetable,select it,changevalues,thentouch Change. Todeletea
row,select therow andtouch Delete.
3. Enter the CableLengthin inches.
4. TouchDelaySpecifiedbyandchoosefrom PropagationVelocity,NominalDelay,or Dielectric
Constant.Enterthevaluein thefieldof the same name.
5. ClickApplyto initiate thecablede-embeddingforthesignal on thischannel.
6. To savethiscableconfigurationforfuture use,touch File Name[DefaultCable]and enteraname.
44
Page 51

Acquisition
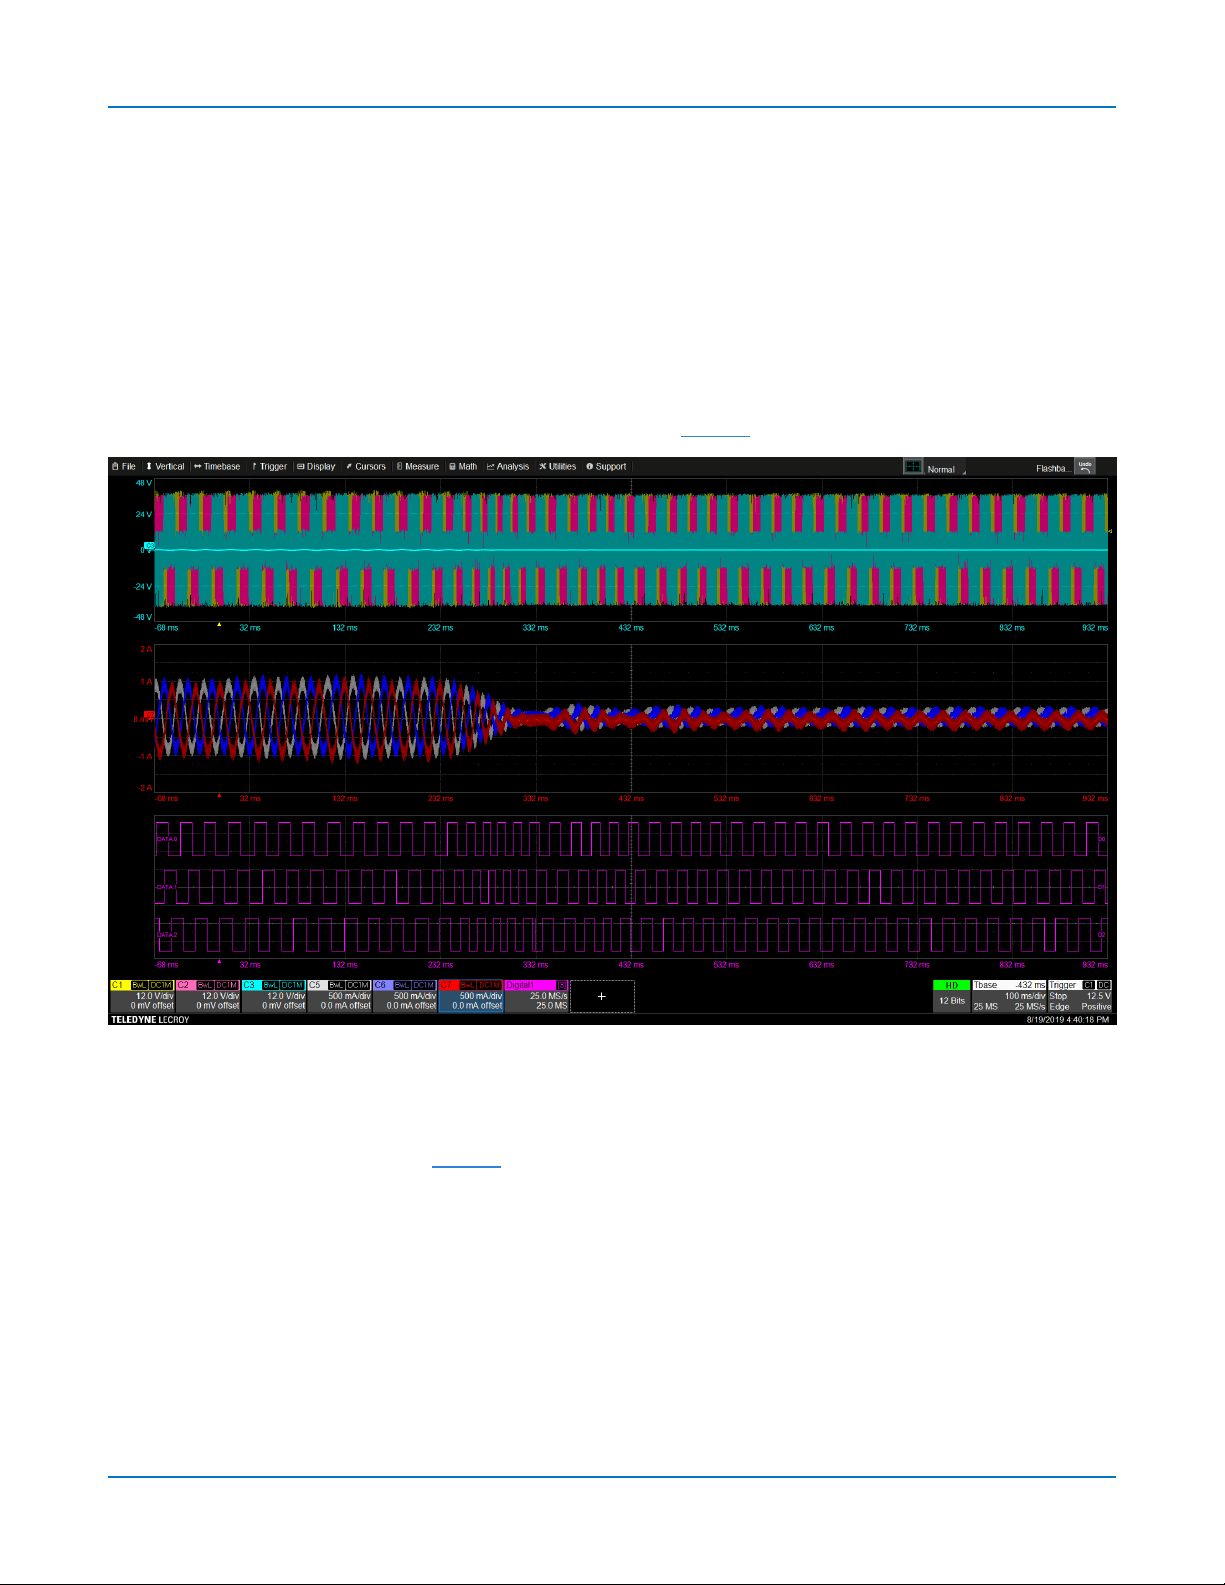
Digital (Mixed Signal)
When a MixedSignal device isconnected totheoscilloscope,digitalinput optionsare addedtothe Vertical
menu. Thereareset up dialogsfor eachpossibledigitalgroup,Digital1 to Digitaln,which correspondto
digitalbuses.Youchoosewhichlinesmake upeach digitalgroup,what theyarenamed,andhow they
appearon thedisplay.
Digital Traces
When a digital groupis enabled,digitalLine traces show which linesare high,low,or transitioningrelative
tothe threshold.Youcanalsoviewa digital Bustrace that collapses allthe linesinagroupintotheirHex
values.
Fourdigitallines displayedwith aVertical Position+4.0 (topof grid)anda GroupHeight 4.0divisions.
Dependingonyour input method,Height may bedefined bytheentiregroup orbytheindividualline.
Activity Indicators
Activity indicatorsappearat the bottom of the Digitaln dialogs. Theyshowwhich linesare High(uparrow),
Low(down arrow),or Transitioning (up anddown arrows) relativetotheLogic Thresholdvalue,providinga
quickview of which linesareof interest to display on screen.
45
Page 52

WaveRunner/MDA8000HDOscilloscopes Operator's Manual
Digital Setup Using Digital Leadset
Thedigitalleadset enablesinput of up-to-16 linesof digital
data. Physicallinescanbepreconfiguredintodifferent
logicalgroups,Digitaln,correspondingto a bus.The
transitionsfor each linemay beviewedthroughdifferent
displays.
Thedigitalleadset featurestwodigitalbankswith
separateThreshold and Hysteresiscontrols,makingit
possibletosimultaneouslyviewdata from different logic
families.
Initially,logicallinesare namedand numbered thesame
asthe physical leadtheyrepresent,althoughanylinecan
berenamedappropriatelyorre-assigned to anylead.
Connecting/DisconnectingtheLeadset
Thedigitalleadset connectsto the MixedSignal interface
onthe front of theinstrument.
Toconnect the leadset to theinstrument,pushthe
connector intotheMixedSignalinterfacebelowthe front
paneluntil youhear a click.
Toremovetheleadset,pressand holdthe buttonson
each sideof the connector,then pullout to release.
Each flyingleadhasasignal and agroundconnection.A
varietyof groundextendersand flyinggroundleadsare
availablefordifferent probing needs.
Toachieveoptimal signalintegrity,connect the groundat thetip of theflyingleadfor eachinput usedin
yourmeasurements.Useeithertheprovidedgroundextendersor ground flyingleadstomake theground
connection.
46
Page 53

DigitalGroupSetup
Toset up adigitalgroup:
1. From the menubar,chooseVertical>DigitalnSetup.
2. OntheDigitalnset updialog,checkthe boxesfor allthe linesthat comprisethe group.Touch the
Right andLeft Arrow buttons toswitch betweendigitalbanksas youmakelineselections.
Note:Groupscan includefrom oneto allof theleadsfrom anydigitalbank.
3. CheckViewGrouptostart the display.
4. Whenyou'refinishedon theDigitalndialog,openLogicSetupand choosetheLogic Familythat
applies to each digital bank,or set custom Threshholdand Hysteresisvalues.
Acquisition
DigitalDisplaySetup
Choosethetypeandpositionof the digital traces that appear on screen for each digital group.
1. ChooseaDisplayMode:
l Lines(default)showsa time-correlatedtrace indicatinghigh,low,and transitioningpoints
(relativeto the Threshold)for everydigital linein thegroup.The sizeandplacement of the
linesdependonthe numberof lines,the Vertical PositionandGroupHeight settings.
l Buscollapses thelinesina groupinto theirHexvalues.It appearsimmediatelybelow allthe
Linetraceswhenboth areselected.
l Line&Busdisplays bothtypesof digitaltrace.
2. In VerticalPosition,enter thenumber of divisions(positiveor negative)relativeto thezerolineof
thegrid where the display begins.The top of the first trace appearsat thisposition.
47
Page 54

WaveRunner/MDA8000HDOscilloscopes Operator's Manual
3. In GroupHeight,enter the totalnumber of griddivisionsthe entiredisplayshould occupy.Allthe
selected traces(LineandBus)willappearin thismuchspace.Individualtracesareresized to fit the
total number of divisionsavailable.
Toclosedigitaltraces,uncheck theGroupboxontheDigitalndialog.
Tip:Becausea new gridopensto accommodate eachenabled group,youmaywishto enable
groupsoneor two at atimewhentheyhavemanylinesto maximizethe totalamount of screen
spaceavailablefor each. Closingtheset up dialogswillalsoincreaseavailablescreenspace.
RenamingDigitalLines
Thelabelsusedto nameeach linecanbechangedto makethe userinterfacemore intuitive.
Touch Labeland select thetype:
l Data(default) appends"D."to the front ofeach linenumber.
l Addressappends"A."to the front of each linenumber.
l Customletsyou create yourown labelslinebyline.If usingCustom labels:
Touch theLine numberfieldbelowthecorrespondingcheckbox.If necessary,usethe Left/Right
Arrowbuttonstoswitch betweenbanks.
Use the virtualkeyboardtoenter the name,then pressOK.
RenumberingDigitalLines
Labelscan alsobe "swapped"betweenlines.Thisprocedurehelpsincaseswhere the physical lead
number isdifferent from thelogicallinenumberyouwouldliketo assigntothat input. It can savetime
havingto reattachleadsorreconfiguregroups.
Example:Agroupisset upfor lines0-4,but lead5wasaccidentallyattached to theprobingpoint. By
"swapping"line5 with line4,youdonot needtochangeeither thephysicalorthelogical setup.
1. Select aLabelof DataorAddress.
2. TouchtheLinenumberfieldbelowthecorresponding checkbox.If necessary,usethe Left/Right
Arrowbuttonstoswitch betweenbanks.
3. From the pop-up,choosethelinewith whichyou want to swap labels.
48
Page 55

Acquisition
Timebase
Timebase(Horizontal)settingscontroltracesalongtheXaxis. Thetimebaseissharedbyallchannels.
Thetime representedbyeachhorizontal division of thegrid,or Time/Division,ismost easilyadjusted using
thefront panelHorizontalknob.Full Timebaseset up isdone ontheTimebasedialog,accessedeitherby
choosingTimebase >HorizontalSetupfrom the menubar or by touchingthe Timebase descriptorbox.
Timebase Set Up
Use the Timebasedialogtoselect the SamplingMode,and Memory /SampleRate.You can alsouseit
insteadof the Front Paneltomodifythe Time/Divand horizontalDelay.
SamplingMode
TheSamplingMode determineshow the instrument samplesthe input signalandrendersit for display.
See SamplingModesfor a descriptionof eachtype.
TimebaseMode
Time/Divisionis thetime represented byone horizontaldivisionof the grid.Touch theUp/DownArrow
buttonsonthe Timebasedialogor turnthefront panelHorizontalknobtoadjust thisvalue.The overall
lengthof theacquisitionrecord isequalto 10 timesthe Time/Divisionsetting.
Delayis theamount of time relativeto thetriggerevent to displayonthe grid.Raising/loweringthe Delay
valuehastheeffect of shiftingthetrace to theright/left.Thisallowsyoutoisolate anddisplay a
time/event of interest that occurs beforeorafter the triggerevent.
l Pre-triggerDelay,enteredas a negativevalue,displaysthe acquisitiontime prior tothetriggerevent,
which occurs at time0 wheninReal Timesamplingmode.Pre-triggerDelaycan be set up to the
instrument'smaximum samplerecord length;how muchactualtime thisrepresents dependsonthe
timebase.At maximum pre-triggerDelay,thetriggerpoint is off thegrid(indicated bythe arrow at the
lowerright corner),andeverything youseerepresents10 divisionsof pre-triggertime.
l Post-triggerDelay,entered asapositivevalue,displays time followingthe triggerevent.Post-trigger
Delay cancoveramuch greater lapseof acquisitiontimethanpre-triggerDelay,uptotheequivalent
of 10,000 divisionsafter the triggerevent (it islimited at slower time/divsettingsandinRollmode).
At maximum post-triggerDelay,thetriggerpoint is off thegridfar left of thetime displayed.
Set toZeroreturns Delayto zero.
49
Page 56

WaveRunner/MDA8000HDOscilloscopes Operator's Manual
SamplingRate
Thesecontrolsspecify how the instrument sampleswhenin RealTime mode.
MaximumSample Pointsisthenumber of samplestakenperacquisitionwhenyouchooseto Set
Maximum Memory.It changesto show SamplingRate,thenumber of samplestakenpertime division,
whenusingaFixedSamplingRate.
Set Maximum Memory,the default settingon MAUI oscilloscopes,automaticallyadjusts the samplingrate
totake themaximum numberof samplespossible giventhe amount of pre-or post-triggerDelayandthe
Time/div,up to themaximum record length. Thisoptimizesthe sample rate for fast timebaseswhenin
RealTime mode.
FixedSamplingRateactivates theSamplingRatefieldfor youto set your ownrate.Theoscilloscopewill
usewhateverMemoryasrequiredfortheacquisitiontime,until noneremains.Loweringtherate can
extendtheacquisitionto accommodate slower timebasesor longerdelays.
Note:To avoidaliasing andotherwaveform distortions,it isadvisable(perNyquist) toacquireat a
samplerate at least twice the bandwidth of the input signal.Asamplerate 10 times the
acquisitionbandwidthmay bepreferableinorderto over samplefast signalrisetimesconsistent
withtheoscilloscopebandwidth.Thosewith higherspeedacquisitionsystemsmay needto
manuallyadjust Bandwidth,Time/div,SampleRate,and thenumber of ActiveChannelsto achieve
theoptimalresult.
On WaveRunner/MDA8000HD,if you set aFixed SampleRate of 10 GS/s,the system automatically
enters EnhancedSampleRate,applying 2 pts.Sinx/x interpolationto prevent aliasing. The codeE/ESRwill
appearon thedescriptor boxesof the activechannels.Youcanmanuallyapply5 pts.Sinx/xInterpolation
toanychannelonthe Cn dialog.
ActiveChannels
TheActiveChannelssettingsallowyouto combinetheacquisitioncapabilitiesof pairs of channels to
result infewerchannelswith increasedmemory.SeeActiveChannels.
NavigationReference
TheNavigationReferencesettingcontrolshow theoscilloscopebehaves when youadjust trace
HorizontalScale(Time/div)usingthesetupdialogs,front panel knob,or PinchZoom gesture:
Centered(50%)scalesdivisionsequally sothat whatever isat the center(50%) grid lineremainsat the
center of thedisplay. Other events movein reference to thecenter asTime/divchanges.Withthissetting,
thetrigger point couldpotentiallymoveoff thegrid asthe scalechanges.
LocktoTriggerscalesdivisions aroundthe triggerpoint.Thetriggerevent remainsin place asTime/div
changes,whileothereventsmoveinreference to the trigger.If thetrigger iscurrentlyplaced at timezero,
thiswillappearto behavethesame asCentered,but thedifference willbe apparent if you haveusedDelay
toshift thetriggerposition.
See NavigatingLongAcquisitions.
50
Page 57

Acquisition
Active Channels
When operatingat the fullchannelcount,allchannelsremainactivefor input at thestandardper channel
specification.To achievethe maximum possiblememory,choosea reduced channelcount under Active
Channelson the Timebasedialog,or chooseAutomode(Maximize).Thiswillinterleavethe acquisition
capabilitiesof different pairsof channelsto increaseperformance.
ReducedChannelModes
Reducingchannelsturnsoff onechannelineach pairof adjacent channels,leavingtheother available at
twice the standardmemory.Generally,within each bankof four channels,the "inner"two channelsareleft
active,whilethe"outer"channelsare turnedoff. C1can stillbe usedfor triggerinput (e.g.,inPattern
triggers),but not for waveform acquisition.
Example:On WaveRunner8000HD,selecting 4 ActiveChannelsturnsoff acquisitionon C1,C4,C5
andC8,whileC2,C3,C6 and C7 acquireat double the perchannelacquisitionmemory.
On 8-channeloscilloscopeswith twobanksof four channels(C1-C4 and C5-C8),a similar interleavingof
outer and innerpairsoccurswhen2ActiveChannelsis selected,leavingC3 andC6 activeat the maximum
possiblememory.
AutoMode(Maximize)
InAuto mode,theoscilloscopewillallot the maximum memory possible basedon the activity withineach
pairof channels. Aslong asonlyonechannelineach of thepairsisturned on,regardless of which number,
themaximum memoryfor the totalnumber of activechannelsisused.Turningon bothchannelsinany
pairhasthesameeffect asselectingthefullnumberof ActiveChannels,and each channelwillacquireat
thestandardspecification.
Likewise,for 8-channeloscilloscopes,turningona channelfrom bothpairsineither bankwilldrop the
memoryandsamplerate to that of 4ActiveChannels,evenif only two channelstotalare turnedon.
Example:WhenAuto isselected on WaveRunner8000HD,C1,C3,C5 andC7can alloperate at
twice the per channelmemory,theequivalent of4ActiveChannels. Howeveracombinationof C1,
C2,C5 andC7woulddropthe per channelmemory tothesameas8 activechannels,as woulda
combinationof C1,C3,C7 andC8.Becauseboth channels in a single pair are active,it is thesame
asselecting8 ActiveChannels. C1 and C3 canonlyoperate together at twice the perchannel
memory,becauseboth arewithinthe same bank,but C1 and C6 couldoperateat maximum
memory,astheyarenot onlyin different pairsbut in different banks.
Refer toAcquisitionSystem intheproduct datasheet for maximum memoryin each mode.
51
Page 58

WaveRunner/MDA8000HDOscilloscopes Operator's Manual
Sampling Modes
TheSamplingMode determineshow theinstrument samplestheinput signalandrendersit for display.
RealTimeSamplingMode
RealTime samplingmodeisa seriesof digitizedvoltagevaluessampledonthe input signalat auniform
rate. Thesesamplesare displayedasaseriesof measureddata valuesassociatedwithasingle trigger
event.Bydefault (with no Delay),the waveform is positionedso that thetriggerevent is time 0 onthe grid.
Therelationship between sample rate,memory,andtimecan be expressed as:
CaptureInterval =1/(SampleRateX Memory)
CaptureInterval/10=TimePer Division
Usually,on fast timebasesettings,themaximum samplerate isusedwhen inReal Timemode.Forslower
timebasesettings,thesamplerate isdecreasedso that the maximum number of data samplesis
maintainedovertime.
RollSamplingMode
Roll modedisplaysincoming points of slow timebaseacquisitionssothat the traceappearsto"roll"
continuouslyacrossthescreen from right to left. Theacquisitionis completewhenatriggerevent is
detected,at which point the next acquisitionbeginsimmediately.Parametersor math functionsare
updatedeverytime the rollmode bufferisupdated asnew databecomes available. Thisresetsstatistics
oneverystep of Rollmode that isvalidbecauseof newdata.
Timebasemust beset sufficiently slowtoenable Rollmodeselection;increaseTime/divto 100 ms/divor
more and increasesamplerate to 5 MS/sorlesstoactivate the Rollmodeoptionon the Timebasedialog.
OnlyEdge triggerissupported for Rollmode acquisitions.
Note:Rollmodesamplingisnot availablewhenusinganotherform of digitalinterleaving.If
processingtime isgreater than acquisitiontime,therollmodebuffer isoverwritten. The
instrument warns,"Channeldata isnot continuousinROLL mode!!!"and rollingstartsagain.
SequenceSamplingMode
InSequenceMode sampling,the completedwaveform consists of anumberof fixed-sizesegments. The
instrument usesthe TimebaseSequencesettingsto determinethe capture durationof eachsegment.
Thedesirednumber of segments,maximum segment length,andtotal available memory are usedto
determinethe actualnumberof samplesor segments,and time or points.
SequenceMode isidealwhencapturingmanyfast pulsesinquicksuccessionor when capturingfew
eventsseparatedby longtimeperiods. Theinstrument cancapture complicatedsequencesof events
overlargetime intervalsin finedetail,whileignoringthe uninterestingperiodsbetweentheevents.
Measurementscan be madeon selectedsegments usingthe fullprecisionof thetimebase.
52
Page 59

Acquisition
Sequence Mode Set Up
TheSequencedialogappearsonlywhenSequenceMode samplingis selected.Useit to definethe
number of fixed-sizesegmentsto be acquired.
1. From the menubar,chooseTimebase >HorizontalSetup...,thenSequenceSamplingMode.
2. OntheSequence tabunderAcquisitionSettings,enter the NumberofSegmentsto acquire.
3. To stopacquisitionin caseno validtriggerevent occurs withina certaintimeframe,check the
Enable Timeout box andprovideaTimeout value.
Note:Whileoptional,Timeout ensures that theacquisitioncompletesina reasonable
amount of time and control isreturned to theoperator/controllerwithout havingto
manuallystopthe acquisition,making it especiallyuseful for remote controlapplications.
4. TouchDisplaymode andselect asequencedisplay modefrom the pop-up menu:
Adjacent
Waterfall (cascaded)
Mosaic (tiled)
Overlay
Perspective
5. To seethetrigger times of thosesegments acquired,stop acquisitionandtouchShowSequence
Trigger Times.Thiswilllaunch the TriggerTime tabof theAcquisitionStatus dialogs.
53
Page 60

WaveRunner/MDA8000HDOscilloscopes Operator's Manual
ViewingSequenceSegments
When in Sequencesamplingmode,you canview individual segmentseasilyusingthefront panelZoom
button.Anew zoom of the channeltrace defaults to Segment 1.
You can viewother segmentsbychangingtheFirst andtotalNum(ber) of segmentsto be shown onthe
Zndialog. TouchtheZn descriptor boxto displaythedialog.
Tip:Bysettingthe Num to 1,youcan usethe front panel FineAdjust knob to scrollthrougheach
segment in order.
Channeldescriptorboxesindicate thetotalnumberof segments acquiredinsequence mode.Zoom
descriptor boxesshow the first segment displayedand totalnumberof segments displayed ([#] #). Aswith
allotherzoom traces,thezoomedsegments are highlighted onthesourcetrace.
Example:Youhaveacquired10 segments.Youchooseto display segments4to6—or,atotal of 3
segments beginning with segment 4. The Cn descriptorboxreads10. The Zn descriptorboxreads
[4]3Seg,meaningyouare displaying a totalof 3segments,starting with segment 4.
ViewSegmentTimeStamps
Toviewtimestampsforeach segment:
1. From the Sequencedialog,chooseShowSequenceTriggerTimes.
Or
From the menubar,chooseTimebase > AcquisitionStatus,thenopen Triggertime.
2. UnderShowStatusFor,chooseTime.
54
Page 61

Acquisition
Clock Source Settings
Anexternalreference clock(applied viathe REFIninput) isusedtosynchronize the instrument'sinternal
timebaseto an externalfrequencysource.Thisallowsmultipleinstruments to lock theirtimebasestoa
commonsource.
ReferenceClock
Thedefault settingisto usethe instrument'sInternal10 MHzclock. To usean externalreference clock:
1. Connect aclocksourceto the reference clock input usinga BNCcable.
2. GotoTimebase >HorizontalSetupandchooseReal-TimeSamplingMode.
3. OntheClockSource tabunder Reference ClockchooseExternal.
ClockFrequencies
Thesignaltypes,frequency ranges,andlevels acceptedfor an externalclock are modeldependent.See
theproduct datasheet at teledynelecroy.com.
55
Page 62

WaveRunner/MDA8000HDOscilloscopes Operator's Manual
Navigating Long Acquisitions
On acquisitions>500 Mpts inlength,measurementsandmathcalculationstakeplaceononlythecenter
500 Mpts of theacquisition—the"AnalysisZone".Thisareaismarkedonthe source channeltrace by grey
shading appliedoutsideof it (overthe part not analyzed). Youmayneedto repositionthe tracesothat the
portion youwishto analyze fallswithin theAnalysisZone.Also,youmaywishto shortenthe timeit takesto
complete a complexanalysisbyanalyzing onlythe most significant part of the acquisition.Thiscanbe
easilydoneusing Timebasecontrolsand/or Zoom.
NavigatingwithHorizontalDelay
Stopacquisition,thenturnthe HorizontalDelayknobuntilthe part of the trace youwishto analyzeiswithin
theAnalysisZone.
Tip:Panning/swipingisan excellent wayto addDelay andplacethetrace withintheAnalysisZone.
Shadingoversourcetraceshows edgesof AnalysisZoneonlongacquisition.
Truncated math tracerevealsextent of AnalysisZone.
Mathtracenowshowshowadding DelayshiftsAnalysisZone.
Note:Yournext acquisitionwillreflect anychangeto yourTimebasesettings. If youwishto
preserveyourinitialacquisitionsettings,savethesetup to internal memory beforenavigating,then
recallit before youresumeacquisition.
56
Page 63

NavigatingwithZoom
Stopacquisition,thencreate a zoom traceof theareayouwishto analyze.Apply mathand
measurementstothezoom ratherthanthe channeltrace.
Acquisition
Mathappliedto a zoom iscalculatedontheentiretrace(upto 500Mpts).
Highlightingonthesourcetraceshowsthezoomedareabeinganalyzed..
57
Page 64

WaveRunner/MDA8000HDOscilloscopes Operator's Manual
NavigationReference
ChangingtheNavigationReferencesettingcan alsohelptoreposition theacquiredtrace for analysis by
selectingfordifferent regions of thetrace to remaincenteredas theTime/divchanges:
Centered (50%) scalesdivisions equallysothat whatever isat the center (50%)gridlineremainsat the
center of thedisplay. Other events movein reference to thecenter asTime/divchanges.Withthissetting,
thetrigger point couldpotentiallymoveoff thegrid asthe scalechanges.
Timebaseat 2ms/divwith-6.5ms Delayshiftingthetriggerleft of thecenterof thegird.
Timebasechangedto1 ms/divwithNavigationReferenceset to Centered(50%).Notehowwiththissetting,thetriggerevent
hasshifted off thegridtotheleft astime"expands",butthecenter of traceremainsin thesameplace.
ANavigationReference of Lockto Triggerrescalesdivisions aroundthe triggerpoint.Thetriggerevent
remainsinplace as Time/divchanges,whileother events movein reference to the trigger.If thetrigger is
currentlyplacedat time zero,thiswillappear tobehavethe sameas Centered,but the differencewillbe
apparentif you haveusedDelay to shift the triggerposition.
Now,whenTimebasechanged to 1ms/div,thetriggerevent remainsat itscurrent position,buttherest of thetraceshiftsto
therightastime"expands."Thevaluesassociatedwith eachhorizontalgriddivisionaredifferent than when centered,
althoughTime/divisstill 1 ms/div.
58
Page 65

Acquisition
History Mode
History Modeallowsyouto reviewanyacquisitionsavedinthe history buffer,which automaticallystores
allacquisitionrecords until full.Not only canindividual acquisitionsbe restoredto the grid,youcan"scroll"
backward andforwardthroughthe historyat varyingspeedsto capture changesinthewaveformsover
time. ChooseTimebase > HistoryModeto accessthisfeature.
Each recordisindexedandtime-stamped,andyoucan choosetoviewthe absolute time of acquisitionor
thetimerelativetowhenyouenteredHistory Mode.In thelatter case,the last acquisition istime zero,and
allothersare stampedwith a negativetime. The maximum number of recordsstoreddependson your
acquisitionsettingsandthetotalavailablememory.
Entering History Modeautomaticallystopsnew acquisitions.ToleaveHistory Mode,restart acquisition by
pressing oneof thefront panelTriggerModebuttons.
Note:HistoryMode doesnot workwith SequenceModeacquisitions,Interpolationset ontheinput
channel,or anytypeof channelinterleaving.
Oscilloscopein Historymode.
59
Page 66

WaveRunner/MDA8000HDOscilloscopes Operator's Manual
ReplayAcquisitionHistory
Thisisagood way tobeginusingHistoryMode. Watchinga"movie"of the historyallowsyouto see
waveform changesthat areinvisibleduringreal-time acquisition.Select ViewHistoryto enablethe display,
thenusethebuttonsto navigate thehistoryof acquisitions.
l Top row buttonsscroll:Fast Backward,SlowBackward,SlowForward,Fast Forward.
l Bottom rowbuttonsstep:Backto Start,BackOne,Go to Index(row #),ForwardOne,ForwardtoEnd.
Press Pausewhenyouseesomethingof interest,thenusethe History tableto findtheexact Index.
Select SingleAcquisition
1. Select View Historyto enablethe display,andViewTable toshowthe indexof records.
2. Optionally,select toshowRelativeTimesonthe table.
3. To view individualacquisitions,select therow from the tableor enter itsIndexnumber on the
dialog.
60
Page 67

Acquisition
Trigger
Triggersdefinethe event aroundwhich digitizedinformation isdisplayed on the grid.
Different Trigger Typesare usedto select different events inthetriggersource waveforms:edgevoltages,
pulsewidths,high/low states,etc.Thesemaybe a singlechannelevent or acomplexpatternof events
acrossseveral channels. Oninstruments with MixedSignal capabilities,pattern triggerscanbeset on
analogchannels(includingthe ExternalTrigger input),digital linesor a mixof both.
Inadditionto the type,the TriggerMode determineshow theinstrument behavesasit encounters trigger
events:takeasingle acquisition andstop,holding on to thedisplay of thelast acquisition,orcontinuously
takeanddisplay acquisitions.
Inboth cases,whenthepreviousacquisitionhascompletedprocessing,theoscilloscopeisagainreadyto
acquireandthe READYindicatorislit.If,whileREADY,the triggercircuit detectsa signalthat matchesthe
triggerconditions,the oscilloscopetriggerson thenext matchingevent,andthe TRIG'Dindicator islit.
Unlessmodifiedby a pre-or post-trigger Delay,the triggerevent appearsat time 0 at the horizontalcenter
of the grid,anda periodof time equalto fivedivisions of thetimebaseis shownto the left and right of it.
Delay shifts theacquisition"window"on screen,displayingadifferent portion of thewaveform.
Anadditionalconditionof Holdoff bytime or events isavailableforEdgeand Patterntriggers,including
thosethat appear withinQualifiedtriggers.Holdoff arms thetriggeron thefirst matchingevent,inserts the
holdoff count,thentriggersonasubsequent event. Often,especiallywithrepetitivesignals,the initial
arming event appearsto theleft of the triggerin"negative"acquisitiontime.
Trigger Modes
TheTriggerModedetermineshow often theinstrument acquires.It isequivalent to how analog
oscilloscopes"sweep,"or refresh,thedisplay.TriggerMode canbe set from theTriggermenuorfrom the
front panelTriggercontrolgroup.
InSinglemode,whenyouchooseTrigger> Singleor pressthe front panel Single button,theoscilloscope
readies,arms,andtriggersprovided alltriggerconditions(includingHoldoff) are met. It thenstopsand
continuesto display thelast acquisitionuntil anew oneistaken.The oscilloscoperemainsarmedunless
manuallystoppedor triggered,andif a validtrigger doesnot occur,invoking Singleasecondtime willforce
atriggeranddisplay theacquisition.
InNormalmode,operationisthesameasin Single,except that thetriggerautomaticallyre-armsafter the
previous acquisitioniscomplete,anddata iscontinuously refreshedon thetouch screen.
Autooperates thesame asNormalmode,except that atriggerisforced if the triggerevent hasnot
occurredwithina preset timeout period.
Stopceasesacquisitionprocessing untilyouselect oneof theother three modes.Thearming andHoldoff
countersare cleared,evenif there hasnot yet beena trigger sincethepreviousacquisition.
61
Page 68

WaveRunner/MDA8000HDOscilloscopes Operator's Manual
Trigger Types
TheTriggerTypesetsthetriggering conditions.
BasicTypes
Edgetriggersupona achieving a certainvoltage levelinthe positiveornegativeslopeof the waveform.
Widthtriggersuponfindinga positive-ornegative-goingpulsewidth whenmeasuredat the specified
voltagelevel.
Patterntriggersuponauser-definedpatternof concurrent highandlow voltagelevelsonselected inputs.
InMixed-Signaloscilloscopes,it maybea digital logic patternrelativeto voltage levelsonanalogchannels,
orjust a digitallogicpattern omittinganyanaloginputs. Likewise,if your oscilloscopedoesnot haveMixedSignalcapability,thepattern can be set usinganalogchannelsalone.
Measurement isnot technicallya trigger,per se,but permitsthe instrument to stop and display acquisition
basedonapost-processingmeasurement result,similarto a trigger.
Serialtriggersonthe occurrenceof user-definedserialdata events.Thistypewillonlyappearif you have
installedprotocol-specific serialdatatriggeranddecodeoptions.
MultiStageTypes
MultiStagetriggersset one event that "qualifies"or arms,andanother that triggers. First select MultiStage
toshowallthetriggersinthe group.
QualFirst is onlyenabledwhen usingSequence samplingmode.It armsthe oscilloscopewhenthe Aevent
occursinthe first segment,thentriggersonallsubsequent Bevents,saving each as a SequenceMode
segment.
Qualifiedarms ontheAevent,thentriggersonthe Bevent. In Normal triggermode,it automaticallyresets
after the Bevent,andre-armsuponthe next matchingAevent.
SmartTriggers
Smart triggersallowyouto applyBooleanlogic conditionsto the basicsignal characteristicsof level,slope,
andpolarity to determine when totrigger.Firstselect Smart toshowall thetriggersinthe group.
Glitchtriggersuponfindinga pulse-width that islessthan a specifiedtimeorwithina specifiedtime range.
Window triggerswhena signalexits awindow definedbyvoltagethresholds.
Intervaltriggersupon findingaspecific timebetweentwoconsecutiveedgesof the same polarity. Useit
tocaptureintervalsthat fallshort of,or exceed,aspecified range.
Dropout triggerswhena signallossisdetected.The triggerisgeneratedat the endof thetimeout period
followingthelast triggersourcetransition.It isusedprimarilyinSingleacquisitionswith pre-triggerDelay.
Runttriggerswhena pulsecrossesa first threshold,but failsto crossa secondthreshold beforere-
crossingthe first. Otherdefiningconditionsfor thistriggerare the edge(triggersonthe slopeopposite to
that selected) andrunt width.
SlewRatetriggerswhentherisingor fallingedgeof apulsecrosses an upperanda lower level.Thepulse
edgemust crossthe thresholdsfaster or slower thana selected periodof time.
62
Page 69

Acquisition
Trigger Set Up
ToopentheTriggerdialog,pressthe front panelTriggerSetupbutton or touch the Triggerdescriptor box.
Different controlswillappeardependingontheTriggerTypeselected (e.g.,Slopefor Edgetriggers).
Completethesettingsshownafter making your selection.
Thetriggerconditionis summarizedin apreviewwindowat the far right oftheTriggerdialog.Refer to this
toconfirm your selectionsare producingthetrigger youwant.
Source
For most triggers,the Source isthe analogchannelor digitallineto inspect for the triggerconditions.
Pattern triggersmay utilize multiplesources(such asa mixof analoganddigital signals),and likewise
MultiStagetriggersmay usedifferent sourcesfor the armingand triggeringevents.
Tip:On instruments with OneTouch,thetrigger source canbe easilyset by draggingthedesired
channeldescriptor boxonto theTriggerdescriptor box.Notethat the triggercouplingand
slope/polarity willrevert towhateverwaslast set onthat channel.
Coupling
For analogtriggers,specify thetypeof signalCouplingat theinput:
l DC-Frequencycomponents arecoupledto the triggercircuit for highfrequencybursts,or wherethe
useof ACcouplingwouldshift the effectivetriggerlevel.
l AC-Capacitivelycoupled.DClevelsare rejected,andfrequenciesbelow50 Hzareattenuated.
l LFREJ-Coupledthrougha capacitivehigh-passfilternetwork,DCisrejectedandsignalfrequencies
below50 kHz are attenuated.Forstabletriggering on medium to highfrequency signals.
l HFREJ -DCcoupledto the triggercircuit,and a low-pass filter network attenuatesfrequenciesabove
50 kHz(usedfortriggering on low frequencies).
Slope/Polarity
For sometriggers,such asEdge,youwillbe askedto select thewaveform Slope(risingvs.falling) on which
thetriggeringevent mayoccur. Forothers,such asWidth,theequivalent selectionwillbePolarity(positive
vs.negative).
63
Page 70

WaveRunner/MDA8000HDOscilloscopes Operator's Manual
Level
For analogtriggers,enter the voltageLevelat whichthetriggeringcondition must occur. Usethe Find
Levelbuttonto set theleveltothe signalmean.
Triggertypesthat requiremultiplecrossingsto definethe triggeringcondition—suchasWindow,SlewRate
andRunt—willhaveUpperLeveland LowerLevelfields.
For digitalpatterntriggers,thelevelis determinedbythe LogicFamilythat is set on the digitalgroup.This
can alsobe specifiedby acustom (User-Defined)crossingThresholdand Hysteresis. Usually,therewillbe
aseparateLogic tab for thesesettings.
Hysteresis
For Edgetriggers,youmayselect to OptimizeforHF.When thisboxisunchecked,thetrigger circuit's
hysteresisisset quite highto eliminateanypotential triggerinstability from high-frequency noiseridingon
alow-frequencyinput signal.BecauseHFsignal amplitudestend to besmaller,the Optimizefor HFsetting
reducesthe hysteresisvalueto makethe triggermore sensitive.The effect thiswillhaveontrigger
behavior dependson thesignal'sspectralandnoisecontent rather than just fundamentalfrequency,soit's
overall effect is difficult toquantify.
Conditions(SmartTriggers)
Smart triggersallallow youto applyBooleanlogictorefine thetriggering conditionbeyondsimplyLevel
andSlope/Polarity.
Thevaluesthat satisfythe operatorsof LessThan,LessThanorEqualTo,GreaterThan,etc. canbeset by
enteringanUpperValueand/or LowerValue.
Insomecases,it ispossible to set a range of valuesthat satisfy thecondition. Dependingonthetrigger,
thevaluesmaybe InRangethat isboundedbythe upper/lowervalues,or Out Range.
Theextent of therangecanoften alsobe specifiedby usinga NominalandDelta value,rather thanan
absolute upperandlower value.In thiscase,the Nominalvaluesetsthecenter of therange,andtheDelta
determineshow manyunitsplus/minustheNominalvalueareincludedin therange.
For Dropout triggers,the default istoIgnoreOpposite Edge,setting thetriggerto dropout of the Positiveor
Negativeedgewithinthegiven timeframe. Deselectingit hastheeffect of settingthetriggerto dropout on
Both edges.
64
Page 71

Acquisition
Patterns
Atriggeringlogic pattern maybeset ondigitallines,analogchannels,oracombinationof both.
DigitalPattern
Adigitalpattern isset on a single bus (group)manuallyor byapplying a hexadecimalvalue,whilethe
remaininglinesare disabled ("Don't Care").
TheLogic Busmethodsimplifiespatternset up byutilizingdigitalgroupsyouhavealreadydefinedon the
DigitalSetupdialogs.Thesizeof Hexvalues willbelimitedto onlythoseappropriateforthegroup.
1. OntheTriggerdialog,select Patterntrigger type.Open the DigitalPatterndialog.
2. At the far right of thedialog,chooseeitherLogicBusor Logic.
3. Optionally,deselect FilterOut UnstableConditions.Thisdefault filter ignoresshort glitchesinlogic
state triggersthat last less than3.5ns.
4. If usingLogic Bus,touch Sourceand select thedigitalgroup. Anylinesthat are not inthisgroupwill
nowbedisabled.
5. To applya digital logic pattern,either:
l Enter thehexadecimalvalueof the patterninHexor Value.Lineswilltakea logical1,0,or X
("Don't Care") accordingto thepattern. Disabled lineswillremain X.
l Foreach activeline,touchDnandselect whetherit must beHighor Low compared tothe
logicthreshold.Alogical 1(High)or 0 (Low)nowappearsonthedialog.LeaveXforanyline
youwish toexcludefrom the pattern.Usethe Left/Right Arrowbuttonsto displaylinesin
other digital banks.
Note:Asanalternativeto 1 or 0,youmayset edgeconditionsonanyline.TouchDn and
choosethe edge.Edgeconditionsalwaysassume a logicalORin theoveralltriggercriteria.
6. If youhavenot alreadyset alogicthreshold,opentheLevelsdialogandselect a Logic Familyfor
each digitalbankfrom whichyou'veselected lines.Toset a custom logic threshold,chooseLogic
FamilyUserDefined,thenenter the Thresholdvoltageand Hysteresis.
Note:Digitallinesinherit the Logic Setup madewhendefiningdigital groups.However,you
can changethelogicthreshold on theLevelsdialog.Logic thresholdscan onlybe set per
leadbank,not individualline.
65
Page 72

WaveRunner/MDA8000HDOscilloscopes Operator's Manual
AnalogPattern
1. OntheTriggerdialog,select thePatterntriggertype.
2. Select theBooleanOperatorthat describesthe relationshipamonganaloginputs(e.g.,C1 must be
High ANDC2must be Low).
3. Foreachinput inthetrigger pattern,select what Stateit must beincomparedto the threshold
Level. Leave"Don't Care"for any input youwishto exclude.
4. Foreachinput includedin thetrigger,enter thevoltagethresholdLevel.
5. If you'veincludedtheEXT(ernal trigger) input in thepattern,openthe Exttaband enterthetrigger
Attenuation.
MeasurementTrigger
Measurement isnot technicallya trigger,but permitsthe instrument to stop anddisplay acquisitionbased
ona post-processingmeasurement result,similarto a trigger.The available measurementsdependon
yourmodelinstrument andtheoptionsinstalled,and each willoffer a different methodfor specifyingthe
"trigger"conditions,basedonthe typeof measurement.Generally,youwillbeableto specifya triggering
valueorrangeof values,andfor @levelparameters,thevoltagelevel at which themeasurement istaken.
1. Choosethe Source signalinput.
2. Choosethe signalTVStandard.To use acustom signal,alsoenter the Frame Rate,# of Fieldsper
line,# of Lines,and Interlace ratio.
3. Choosethe LineandFielduponwhich to trigger.
SerialTrigger
TheSerialtriggertype willappearif you haveinstalledserialdatatriggeranddecodeoptions.Select the
Serialtypethenthe desiredProtocolto openthe serialtrigger setup dialogs. Forsetupinstructions,see the
software instructionmanualat teledynelecroy.com/support/techlibunderManuals>SoftwareOptions.
Note:Certainsoftware serialtriggerscan onlybe input on certainchannels;the set up dialogwill
instruct youwhichchannelto use.Informationon the operation of hardware serialpattern triggers
can be obtainedfrom the HighSpeedSerialTriggersInstruction Manual.
66
Page 73

Acquisition
QualifiedTrigger
AQualified triggerarms ontheAevent,thentriggersonthe Bevent.InNormaltrigger mode,it
automaticallyresetsafter the Bevent,and re-armsuponthenext matchingAevent. Unlike a basic Edgeor
Pattern trigger with Holdoff,the Aand Bevents canoccurindifferent signals,allowingyouto use thestate
of one signalto"qualify"thetriggeron another.
On theTriggerdialog,select MultiStagetriggertypeandchooseQualified.
On theQualifieddialog,choosethe Aand Bevents.
Besidesan EdgeorPattern,twospecialconditionsmaybeselected asthe armingevent (A):
l State,an analogor digitalHigh/Low state ocurringon a singleinput.
l PatState,a patternof analogor digitalHigh/Low statesacrossmultipleinputs.
When Bis anEdgeor Pattern,usetheWhenBOccursbuttonsto addatime window to theconditions:
l AnyTimetriggersif Boccursany time after beingqualifiedbyA.
l LessThantriggersonlyif Boccurs beforethe timelimit once qualifiedbyA.
l GreaterThantriggersonlyif Boccurs after thetime limit oncequalified byA.
l Eventstriggersonthenext Bevent after the specifiedN Eventsoncequalified byA.
AswithregularHoldoff,thecountermay beginfrom the AcquisitionStart ortheLastTriggerTime.
Onceyou'veselected theAandBeventsonthe Qualifieddialog,set up the conditionson therespective
"Event"dialogsexactlyas youwoulda single-stage trigger.
QualFirstTrigger
TheQualFirst trigger,which isonlyusedinSequencesamplingmode,isset up exactlylikethe Qualified
trigger.QualFirst armsthe oscilloscopewhenthe Aevent occursinthe first segment,then triggerson all
subsequent Bevents,savingeach asaSequenceMode segment.
67
Page 74

WaveRunner/MDA8000HDOscilloscopes Operator's Manual
TriggerHoldoff
Holdoff iseither a periodof time or an event count that maybeset asanadditionalconditionfor Edge and
Pattern triggers.Holdoff disablesthe triggertemporarily,evenif the otherconditionsaremet. UseHoldoff
toobtainastabletriggerfor repetitive,composite waveforms. Forexample,if the numberordurationof
sub-signals isknown,youcan disablethem bysettinganappropriate Holdoff value.
Note:Qualified triggersoperateusing time or event conditionssimilar toHoldoff,but arm and
triggerdifferently.
HoldOff byTime
Thisisaperiodof time to wait after thearming event beforetriggering on the next event. The maximum
allowedtime is 20 seconds;the Holdoff time wouldotherwisebe limitedonlybythe input signal,the
coupling,andthe instrument'sbandwidth.
When a Holdoff bytime iscountedfrom the start of theacquisition,the oscilloscopereadies,armsonthe
first event,holdsfor the specifiedtime,thentriggerson the next event. After one fullacquisitionhas
completed,theoscilloscopeagainreadies,arms,holds,andtriggersfor thefollowingacquisition.
PositiveEdgetriggerwithHoldoff by timecounted fromthestart ofacquisition.
When a Holdoff bytime iscountedfrom the last trigger time,the oscilloscopeimmediatelyre-armsonthe
first event followingthe triggerandbeginscountingtheHoldoff,ratherthanwait to complete thefull
acquisition.The Holdoff count continuesevenduringthe verybrief timebetweenacquisitionswhilethe
oscilloscopeisprocessing. Assoonas theHoldoff issatisfiedandtheoscilloscopeisagainready,it triggers
onthe next event.There-armingandHoldoff mayoccurinone acquisition,andthe triggerinthe next.
PositiveEdgetriggerwithHoldoff by timecounted fromthelasttriggertime.
68
Page 75

Acquisition
Note:Becausethereisonlyone triggerperacquisition,the triggerevent willalwaysbelongstothe
newacquisition.Theprocessing timeshownhere isforpurposes of illustrationonly.
Regardless of wherein the acquisitionrecord the triggerevent wasfound(first edgeorlast),thedisplay
willshow timepre-andpost-triggerbasedon yourTime/DivandDelay settings.
HoldOff byEvents
Eventsrefersto the number of timesthe triggerconditionshavebeenmet followingthe armingevent.
For example,if theHoldoff istwo edgescountedfrom the start of theacquisition,the oscilloscopereadies,
arms on thefirst edge,holdsoff for thenext two,triggersonthe fourthedge,thencompletes the
acquisition.Becausethere must alwaysbea first armingedge,it appearsto be "Holdoff plusone."
PositiveEdgetriggerwithHoldoff by eventscountedfromstartof acquisition.
AswithHoldoff bytime,whena Holdoff byeventsiscounted from the last triggertime,theoscilloscoperearms immediatelyfollowingthe triggerand beginstheHoldoff count. If thecount is satisfiedby the time
theoscilloscopeis againready,the triggeroccursonthe next event atthestart of the new acquisition.
PositiveEdgetriggerwithHoldoff by eventscountedfromlasttriggertime.
69
Page 76

WaveRunner/MDA8000HDOscilloscopes Operator's Manual
Holdoff SetUp
ToaddHoldoff to anEdgeor Pattern trigger,touch theTriggerdescriptor boxor pressthefront panel
TriggerSetup button,then openthe Holdofftab.
Chooseto HoldoffbyTime(the clock)orEvents.
l If usingHoldoff byTime,entertheTime in Sto wait beforetriggering.
l If usingHoldoff byEvents,enter the number of Eventsto wait beforetriggering.
Chooseto Start Holdoff CounterOn:
l Current AcquisitionStarttime.
l Last TriggerTimefrom previous acquisition.
70
Page 77

Acquisition
Software Assisted Trigger
SoftwareAssisted Triggerisusedto find thetrigger-levelcrossing point closest to thehardwaretrigger
point. It thenadjusts thetime offset of the waveform so that it isaligned with the specifiedtriggerlevel
andslope.
Inthe followingfigure,thewhite traceisthe waveform at theinputtosoftware-assistedtrigger
processing.Theredtrace showsit after processing,alignedwith thetriggerpoint indicated bythe red
marker below thegrid.
Note:Thisfeature canonlybeusedwithanEdge triggertype inNormaltrigger mode.
]
1. From the menu,chooseTriggers>TriggerSetup,thentouchtheSoftware AssistedTriggertab.
2. TouchEnable.
3. Create a triggerwindowbyenteringaHysteresisvalue.Thisvaluesets a boundaryaboveandbelow
themaintriggerlevelto excludenoise.
4. ChooseAutoor Normalmode;thisdeterminesthetrigger behavior whentriggercrossings are not
foundinthetriggersource waveform.
l Automode allowsallwaveforms throughthe channel.
l Normalmodeallowswaveformsonlywithatriggercrossing within thehorizontal gateregion
throughthechannel.
5. Set StartandStoptime valuesontheHorizontalGatepart of the SoftwareAssisted Triggertab.
Thesevaluescontrolwhere inthe waveform thesoftware-assistedtriggerprocessing searchesfor
triggercrossings.
71
Page 78

WaveRunner/MDA8000HDOscilloscopes Operator's Manual
TriggerScan
TriggerScanisa debuggingtoolthat helps youquicklydiscoverwaveform anomaliesbyautomatingthe
processof building triggersdesigned to findrareeventsinan acquisition.
Triggerscantrainsthe system by lookingat acquiredwaveforms. Duringthetraining,TriggerScan
analyzesthewaveformstodeterminewhat waveforms normallylooklike.Using thisinformation,it
generatesa list of smart triggersdesignedto isolateabnormalsituations. Allacquisition settingsare
preservedin theTriggerScan setup filefor future use.
Afterloading the triggersetupsfrom the Trainer,TriggerScanscansnew acquisitionsfor rareeventsby
cyclingthedifferent triggers.Astriggersoccur,the waveformsare displayedon the screen. AutoSaving
waveform fileswitheach triggerallowsyouto capture the TriggerScan data.
TrainingTriggerScan
TheTriggerScanTrainerinspectsthe current acquisitionandautomaticallybuildsa list of triggersetups
that couldpotentiallybe usedto findeventsof interest.
Note:Runthe Trainerif youwant to changethetriggertypesor if youchangethechannelor
signal.Youmust acquireanddisplayat least 3cyclesof asignalbeforerunningtheTrainer.
1. TouchTrigger>TriggerSetup... from the menubar,then openthe TriggerScantab.
2. TouchtheTrainerbutton.
3. OntheTriggerScanTrainerpop-up,choosethe Source channelonwhich to trainand trigger,and
select allthetriggertypesyouwant to set up.
4. TouchtheStartTrainingbutton. Whentrainingiscomplete,a list of smart triggersetupsis
displayedinthe TriggerList.
ModifyingTriggerList
Follow thesestepsto changethe triggerscreatedbyTriggerScan.Once youhavefinalizedtheTrigger
List,youare readyto start scanning.
1. To add anew triggerto the list:Set up thenew triggeras desiredontheTriggerdialog.Then,back
onthe TriggerScandialog,touch the AddNewbuttonto appendthe new trigger totheTriggerList.
2. To replace a triggerwithonemanuallyset up ontheTriggerdialog:highlight the triggerinthe
TriggerList,then touch the UpdateSelectedbutton.
72
Page 79

Acquisition
3. To delete a triggerfrom thelist:highlight thetriggerin theTriggerList,then touch the Delete
Selectedbutton.Alltriggersetupscan be deletedinone stepby touchingtheDelete Allbutton.
4. Optionally:
l Enter aDwellTimethe time instrument should wait beforeloading the next trigger.
l CheckStopOnTrigger.Youcan usethistoisolate events astriggersfindthem.
SavingTriggerScanSetups
You can preservetheTriggerList by savingit toasetup file.The current TriggerList is not preserved after
exitingthe application unlessyoumanuallysaveit.
1. OntheTriggerScandialog,touch SetupFile Nameandenter a filename,or touch the Browse
button andselect alocation andfile name.
2. TouchtheSave Setup...button.
Toreloada savedTriggerList,touch theBrowse button,locating thefile,thentouchLoadSetup....
RunningTriggerScan
When the TriggerListisset,touch theStart Scanbuttononthe TriggerScandialog.The instrument
automaticallycyclesthrough allthe triggersin thelist.
Torunonlyasingle trigger,select it from the TriggerList andtouchLoadSelected. Thetriggersettingsare
copiedto the Triggerdialogandwillbe usedwhenyoustart acquisition.
73
Page 80

WaveRunner/MDA8000HDOscilloscopes Operator's Manual
74
Page 81

Display
Display
Displaysettingsaffect thenumberandstyleof gridsthat appear onscreenandsomeof the visual
characteristics of traces,such as persistence.
Theoscilloscopefeaturesamulti-griddisplay,whereeach separate gridrepresents the fullnumberof
4096 verticallevels. AutoGridModeisenabledbydefault.Thisfeatureaddsagrideachtime a new trace
isopened,untilno more gridsare available.There aredisplay optionstoshowall traces on aSingle Grid,or
tomanuallydividethedisplayinto different numbersandorientationsof grids.TheGridModeiconshows
what theresult of theselection willbe.
Q-ScapeDisplayModesdivide the screen into multi-tab displays,each of which canbe configuredwitha
different multi-griddisplay mode.
AQ-ScapeMosaic display.
75
Page 82

WaveRunner/MDA8000HDOscilloscopes Operator's Manual
Display Set Up
ToaccesstheDisplaydialog,chooseDisplay> DisplaySetup.
Q-Scape Display Mode
On instruments with Q-Scapedisplay,the Display Modedeterminesthenumber andlayout of display tabs.
See Q-ScapeDisplay.
Grid Mode
TheGridModesettingdeterminesthenumber andlayout of displaygrids,each of which representsthe
fullnumber of vertical levels. The selectioniconshowsthe number and arrangement of grids.
InNormalDisplay Mode,select oneGridMode.InQ-ScapeDisplayMode,select a GridModefor eachtab.
Grid Mode Number Orientation Notes
Auto
(default)
Single 1 landscape All traces share one grid
Dual 2 landscape One top, one bottom
Tandem 2 portrait One left, one right
Triplex 3 landscape Stacked top to bottom
Triad 3 portrait Left, center, right
Quad 4 landscape Stacked top to bottom
Quattro 4 landscape One in each quarter of screen
Octal 8 landscape Two columns of four stacked top to bottom
Octad 8 landscape Stacked top to bottom
Twelve 12 landscape Three columns of four stacked top to bottom
Sixteen 16 landscape Four columns of four stacked top to bottom
Twenty 20 portrait Five columns of four stacked top to bottom
XY 1 portrait Single XY type grid
XYSingle 2 portrait One VT grid left, one XY grid right
variable landscape Automatically adds or deletes grids as traces turned on/off, up to the maximum
supported
XYDual 3 variable Two VT grids left, one XYgrid right
Note:Additionalgridmodesmaybecomeavailablewiththeinstallationof software options.
76
Page 83

Display
Grid Intensity
Todim or brighten the backgroundgrid lines,touch GridIntensityandenter a valuefrom 0 to 100.
Gridontopsuperimposesthe gridoverthe waveform.
Note:Somewaveforms maybe hiddenfrom view with thegridon top.
Axislabelsdisplaythevalues represented byeachdivisionof thegrid,basedon yourvertical scale and
timebase.Turnedonbydefault,theymay appearas absolutevaluesor deltafrom center(0).Deselect the
checkboxtoremove them from the display.
Trace
Choosea linestylefor traces:solidLineor disconnectedsamplePoints.
When more data is available thancan actuallybe displayed giventhenumber of vertical levels,Trace
Intensity helpsto visualizesignificant eventsby applying an algorithm that dims lessfrequentlyoccurring
samples.Touch Intensityandenter a valuefrom 0 to 100.
Intensity40%(left)dimssamplesthatoccur≤40%of thetimetohighlight themorefrequent samples,
vs.intensity100%(right)whichshows allsamples thesame.
XY Plots
XYplots displaythephaseshift betweenotherwiseidentical signals. Theycan be usedto displayeither
voltageor frequencyon bothaxes,eachaxisnow correspondingto adifferent signalinput,ratherthana
different parameter. The shapeof the resultingpattern revealsinformationabout phase differenceand
frequencyratio.
Note:Theinputscan be anycombinationof channels,math functionsor memories,but both
sourcesmust have thesame X-axisscale.
ChooseanXYgrid modeand select thesourcesfor InputX andInputY.
77
Page 84

WaveRunner/MDA8000HDOscilloscopes Operator's Manual
Q-Scape Display
Q-Scapedividesthescreeninto multi-tab displays that caneachbeconfiguredwith different multi-grid
displaymodes.Manyof the same functionsyoucanperform inNormal mode,such as movingtraces by
drag-and-drop,youcan alsoperform inQ-Scape.Q-Scapeoscilloscopeshavean optionfor both the
DisplayMode andthe Grid Mode.
Display Mode
TheDisplay Modesettingdeterminesthe number and layoutof display tabs,eachof which caninturn
havedifferent numbersand stylesof gridswithinthem. ChooseeitherNormal(default),a singledisplay
withnotabs,oroneof the three Q-Scapedisplaymodes:
Q-ScapeSingle,a singleset of four tabsstacked
sothat only oneat atime isvisible.Each tab can
haveanystyleof gridmode,sameordifferent.
Q-ScapeDual,two setsof four stackedtabs.
Equivalent tabsin each set sharethe same grid
mode,but candisplaydifferent traces.Youcan
simultaneouslyviewone tabfrom each set,but
theymust be different numberedtabs(e.g.,Tab 1
from set oneandTab 3 from set two).
Q-ScapeMosaic,asingle set of fourtabs
arrangedsothat allareviewedsimultaneously.
Notethetab at the topof each display,which
distinguishesMosaic displaymodefrom Quad
gridmode.
78
Page 85

Display
InQ-Scapemodes,channel,math,memory,andzoom descriptors appearin thetabwherethe traceis
open,whileTimebaseand Triggerdescriptors remainoutsidethetabs,since theyare not associated with
anyonetrace.
Note:If youswitch from Normalmode into any Q-Scapemode,alltraceswillmovetoTab1,from
which youcan drag-and-dropto redistributethem to othergrids.In Q-ScapeSingle mode,youwill
not be ableto drag-and-droptracesacrosstabs,onlyto otherTab1grids.
Renaming Tabs
Thelabelsshown ontheQ-Scapetabs can be changedtosomethingdescriptiveof what is shownwithin
that displaytobetter orient you to complexscreenlayouts.
Torename Q-Scapetabsafter theyopen:
1. Touch-and-hold (right-click)onthe TabnuntilRename popsup.
2. TouchRename.
3. Enter the NewAlias,thentouch OK.
Extended Display
Note:The"ExtendGrids..."optiononlyappearswhenasecondmonitor is connected.Minimizethe
oscilloscopewindow anduse thestandardWindows Displaycontrolsto maketheinstrument the
primarydisplay. It should beextended,not duplicated.
Totake advantageof a second monitor displaywheninQ-Scapemode:
1. OntheDisplaydialog,select ExtendGridsOnto2ndMonitor.The Select Gridpop-upopens.
2. Switch to theExtendedDisplaysubmenuand choosea Gridstyle.Tab 1 andtheexternalmonitor
willsharethesamegridstyle.
Tip:Drag-and-drop descriptorboxesto place tracesonthe desiredgrids.Totakefulladvantageof
Q-Scapeon the largerdisplay,chooseFile >Windowedonthe instrument,thengrab the window
title baranddrag it to theexternalmonitor screen.Dragthe ExtendedDisplaywindowtothe
instrument screen.
79
Page 86

WaveRunner/MDA8000HDOscilloscopes Operator's Manual
Persistence Display
ThePersistencefeature retainswaveform traceson thedisplay for a set amount oftime beforeallowing
them to gradually"decay,"similarto the analog-style display of old,phosphorscreenoscilloscopes.The
displayisgeneratedbyrepeatedsamplingof eventsovertimeandthe accumulationof thesampleddata
into "persistencemaps".Statistical integrityispreservedbecausetheduration(decay)isproportionalto
thepersistencepopulation for each amplitudeortime combinationin thedata.
Thedifferent persistencemodesshowthemost frequent signalpathinthree-dimensionalintensitiesof
thesamecolor (Analog),or in a gradedspectrum of colors(Color).
Accessthe Persistencedialogfrom the DisplaydialogorbychoosingDisplay> PersistenceSetup.
Apply Persistence
1. CheckPersistenceOn.
2. To set upalltracestogether,touch AllLocked.Thisconstrainsallinput channels to thesame
persistencesettings.To set up tracesindividually,touchPerTrace.
3. Usethe buttonsto select apersistence mode:
InAnalogMode,asapersistencedata mapdevelops,different intensities
of the same colorareassignedtotherange betweenaminimum anda
maximum population.Themaximum populationautomaticallygetsthe
highest intensity,theminimum populationgets thelowest intensity,and
intermediate populationsget intensitiesinbetween theseextremes.The
informationin thelowerpopulations(forexample,down at the noiselevel)couldbe of greater
interest toyouthantherest. The Analog persistence view highlights thedistributionof data sothat
youcanexamineit indetail.
Color Modepersistenceworkson the same principleasAnalog
persistence,but instead usesthe entire colorspectrum to map signal
intensity:violet forminimum population,redformaximum population.In
thismode,alltracesuseallcolors,which ishelpfulfor comparing
amplitudesbyseekinglikecolorsamongthe traces.
3dMode persistence createsa topographicalview of your waveform from aselectionof shadings,
textures,and hues.The advantageof the topographicalview isthat areasof highest and lowest
intensity areshownas peaksandvalleys,inadditionto coloror brightness.Theshapeof the peaks
(pointedorflat) can revealfurtherinformationabout thefrequencyof occurrencesinyour
waveform. YouchoosetheQualityof the 3Ddisplay:
80
Page 87

Display
Solidquality canbeeithercolor or monochrome.Saturationisset at50%,
withhotter colorsindicatinghighest intensity.
Inthe monochromeviewof solid,the lightest areas indicate highest
intensity,correspondingtotheredareasinthe colorview.
Inshaded(projected light) quality,theshape of the pulsesisemphasized.
Thisqualityismonochromeonly.
Inwire framequality,linesof equalintensity are usedto construct the
persistencemap. Thisdisplaycanbe eithercolor or Monochrome.
In3d mode,XAxisRotationandYAxisRoationcan range180° from -90° to +90°. In the examples
above,the X-axisis rotated60° an theY-axis15°.
Tip:Toquicklyrotate the graph,graba corner of thepersistencemap anddragit inthe
desireddirection.
4. Select theSaturationlevelas a percentageof the maximum population.Allpopulationsabovethe
saturationpopulationareassignedthehighest colorintensity:that is,theyare saturated.At the
same time,allpopulationsbelowthe saturationlevelareassignedtheremainingintensities.Data
populationsaredynamicallyupdated asdata from newacquisitionsisaccumulated.Asaturation
levelof 100%spreadstheintensity variationacrossthe entiredistribution;at lowersaturationlevels
theintensitywillsaturate(becomebrighter) at the percentagevalue specified.Loweringthis
percentagecausesthepixels to besaturatedat alower populationand makesvisible thoseevents
rarelyseenat higher saturationlevels.
5. In Persistence Time,enter the durationof time (inseconds)after whichpersistencedata iserased
from the display.
6. Chooseto superimposethe last waveform over thepersistencedisplaybyselectingShowLast
Trace (not availablein 3d mode).
7. To displaypersistencetracesasa continuousline(insteadof a seriesof samplepoints),select Dot
Joined.
Remove Persistence
Toturn off persistence and returntotheregular trace style,clearPersistenceOn.
81
Page 88

WaveRunner/MDA8000HDOscilloscopes Operator's Manual
82
Page 89

Cursors
Cursors
Cursorsare markers(lines,cross-hairs,and arrows) that identifyhorizontal andvertical valueswhere they
intersect the XorYaxis.Usecursors tomake fast,accurate measurementsof pointson the waveform.
Cursor Types
Horizontal Cursors
Horizontalcursorsarepositionedat pointson the x-axisandwillmeasurethe source trace horizontal and
verticalvaluesat that point. Usually,theseare inunitsof time and Volts,but maybe whatever units are
currentlyconfiguredfor the trace. Oninstruments with OneTouch,theywillautomaticallyadjust position
toreflect differencesin thescaleof zoomsand source traceswhenyou dragthe cursorreadout from
belowthe Timebasedescriptor box ontothezoom trace grid or descriptorbox.
HorizontalRelativeCursors.
TheHorizontalAbs(olute)cursor displaysa singleline,X1.Thereadout below theTimebaseand Trigger
descriptors showsthe horizontalvaluewhere X1intersectsthe x-axis,inwhatever isthe x-axisunit of the
sourcetrace. The readout on thesourcetrace descriptor boxshows theverticalvaluewhereX1intersects
thesource trace,y@X1,in whateveristhe y-axisunit of thesource trace.
TheHorizontalRel(ative)cursor displays two lines:X1with thedown-pointingarrow,andX2withtheup-
pointingarrow.Thereadout belowtheTimebaseandTriggerdescriptorsalwaysshows:
83
Page 90

WaveRunner/MDA8000HDOscilloscopes Operator's Manual
l The valuewhere each cursorintersects thex-axis(X1andX2)
l The differenceof X2– X1(Dx)
l Fortimetraces,thefrequency inHzcalculated from thedelta time (1/(Dx).
When horizontalcursorsarenot tracking,theycanbemovedto any positionalongthex-axis individually.
Thehorizontal delta represents X2– X1,which willbea positivenumber solongasX2remainstotheright
of X1.If X2ismovedto theleft of X1,thiswillnow beanegativenumber.
Thereadout onthe source trace descriptor box dependsonwhich Showoptionisselected:
l Absoluteshowsthe verticalvalues whereX1andX2intersect the source trace.
l Delta showsthe difference inverticalvaluewhereeachcursor intersectsthe source trace(marked
bythe arrows),calculated as:
y@X2– y@X1 = Dy
When the X1arrow is higherthan theX2arrow,thiswillbe a negativenumber,asit represents a drop
(e.g.,in voltage),evenwhen X2ispositionedabovethezerolevel.WhentheX1arrow islowerthan
theX2arrow,thiswillbeapositivenumber,asit representsa rise.
l Abs+ Delta showsbothabsolute and delta readouts.
l Slope calculatesthedifference inverticalvalueover thedifferenceinhorizontalvaluerepresentedby
theslopefrom the X1arrow to theX2arrow,or:
Thevaluewillbe intelligentlyconverted to whateverunit isappropriate for the source trace.Likethe
Delta readout,it willbe positiveor negativedepending on the verticalposition of X2 relativetoX1,
regardless of itshorizontal position.
Horizontalcursorscan beplacedontraceswhosex-axis hasa dimensionother thantime,such asanFFT
oraTrend.Whenthereisat least onenon-time-domaintraceopen,the StandardCursorsdialogcontains
anX-Axiscontrolwhere youcan choosetheunitsto be measuredbythehorizontal cursors.Theoptions
willbe appropriate to thetypesof traces open;for example,if thereisanFFTtrace,there isan optionfor
Hz. Thecursorsare placed on thosetracesthat displayx-axisvaluesinthe selectedunits,ratherthan
thosewith anx-axisof time.
Vertical Cursors
Verticalcursorsintersect the y-axis andshow the verticalvalueat that point (e.g.,a voltage).These
cursorscan go"off trace"toshowvertical scale valuesthat are not represented inthe acquisition.Vertical
cursorshavenohorizontal readout below the Timebasedescriptor,astheydo not havean x-axiselement.
Astheyare set by divisions,they remainin thesamepositionand donot "readjust"withchangesin the
scaleof theunderlyingtraces.
84
Page 91

Cursors
VerticalRelativeCursors.
TheVerticalAbs(olute)cursor displays a singleline,Y1. Thereadout onthesourcetrace descriptorbox
showsthe verticalvalue at the point whereY1intersects the y-axis.
TheVerticalRel(ative)cursor displays two lines:thedashed-dottedlineisY1,andthe dashedlineisY2.As
withtheHorizontalRelativecursor,thereadout onthesourcetrace descriptorboxdependsontheShow
selection:
l Absoluteshowsthe verticalvalues whereY1andY2intersect the y-axis.
l Delta showsthe difference invalueof Y2– Y1(Dy).AslongasY2remainsbelowY1,thisisa negative
number,evenif Y2 ispositionedabovethezerolevel.If Y2 is movedaboveY1,it willbecomea
positivenumber.
l Abs+ Delta showsbothverticalreadouts.
Combination Cursors
TheBothRel(ative)optionplacesbothVertical RelativeandHorizontalRelativecursorstogether.The
verticalreadout onthesourcetrace descriptorwillbe the same asfortheVerticalRelativecursor and
depends on yourShow selection,whilethehorizontal readout below theTimebasedescriptor willbethe
same asfor the Horizontal Relativecursor.
85
Page 92

WaveRunner/MDA8000HDOscilloscopes Operator's Manual
Apply and Position Cursors
Toturnoncursors,either:
l From themenu bar,chooseCursorsandselect the desiredcursortype from thedrop-down list.
l On the front panel,pressthe Cursorbuttonto turn on cursors,thencontinuepressingtocycle
throughallthe cursortypes.Stopwhenthe desiredtypeisdisplayed.
Note:Theremust be atrace on thegridfor cursorsto execute,althoughacquisitionmay bein
processor stoppedwhenyou turnthem on.
Toturnoffcursors,either:
l From themenu bar,chooseCursors>Off.
l Continuecyclingthe Cursor buttonuntil youreach "Off"(thecursor linesdisappear).
Torepositiona cursor:
l Drag-and-dropthe cursormarkerto a new position.Indicators outsidethegridshow to whichtrace
thecursorbelongs whenyouhavemultipletracesononegrid.
Use the Positiondata entry controlsonthe StandardCursorsdialogto place cursorsprecisely.
l Alternatively,usethe Front PanelCursorknobs. The CoarseCursorknobadjustsabsolute cursors,
whilethe FineCursorknobadjusts relativecursors.If you'reusing the Both Relcursortype,pushing
theknobswilltogglebetween theHorizontalandVerticalcursors.With the correct cursorselected
(highlighted),turntheknobtoadjust the position.Otherwise,pushingthe knobwillreset the cursorto
thedefault position.
When there aremultipletracesonthe same grid,first bringthedesiredtrace totheforegroundby
touchingthe traceorits descriptorbox.The Cursorknobwillonlyoperate on theforegroundtrace.
On oscilloscopeswith OneTouch,if Horizontal cursorsare appliedtoasourcetrace but donot appearon
its dependenttraces (e.g.,azoom) becauseof differences inscale,drag-and-dropthe cursorreadout
from below the Timebasedescriptor boxonto the target trace descriptorbox.Thiswillapplythe cursorat
the5 (absolute) or 2.5 and7.5 (relative)division marksof the target traceandadjust the source trace
cursor accordingly.
Totrackcursors,movingbothlinestogether at aconsistent distance,checkTrackon theStandard
Cursorsdialog.Dragthe X1or Y1cursormarker,or select the set usingthe font panel controlsandturn the
Cursorknob.Thedeltareadoutsshould show littleor no changewhentracking,althoughabsolute
readoutswillchangedependingonthenew positionof the cursors.MovingtheX2or Y2cursorwillreset
therelativedistanceandthe delta,after whichyoucanagaintrack bymovingthe X1or Y1markers.
86
Page 93

Cursors
Standard Cursors Dialog
Thesecontrolscan be usedinstead of thefront panel controlsto turn on cursorsor to refinethe cursor
position.Accessthedialog by choosing Cursors> CursorsSetupfrom the menubar.
CursorType buttonsselect the typeof cursordisplayedonthe grid.
TheShowcontrolsdetermine what valuesareshownin theverticalreadoutwhen usingrelativecursors:
l Absoluteshowsspecific voltagesfor the two cursorlocations.
l Delta showsthe difference betweenthespecific voltagesat the cursorlocations.
l Abs+Deltashows boththe absolute anddeltareadouts.
l Slope (HorizontalRelativeonly)showsthe slopeof the waveform betweenthe cursorlocations.
Refer toCursorTypesforadetailedexplanationof what is shown with each option.
ThePositioncontrolsat theright-sideof the StandardCursorsdialogdisplaythecurrent cursorlocation
andcanbeusedtoset a new location.
l X1 and X2 setsthe positionof Horizontalcursors.They maybe enteredas timeorafractionof a
division.
l Y1 and Y2 setsthe positionof Verticalcursors,entered asa fractionof adivision.
Tracklocksrelativecursorlinesso theymovetogether,maintainingthesamedistance from eachother.
OnlymoveX1orY1to repositionthe cursors.MovingX2or Y2willchangetherelativedistance.
XY Cursors Dialog
If your Grid Modeselection includesan XYtrace display,an XYCursorsdialogappearsbehindthe
StandardCursorsdialog. Useit to exactlypositionand track cursorson XYtraces,thesameasyouusethe
settingson theStandardCursorsdialogfortime traces.The functionalityisthe same.
87
Page 94

WaveRunner/MDA8000HDOscilloscopes Operator's Manual
88
Page 95

Measure
Measure
Parametersaretoolsthat giveyouaccessto a widerange of waveform properties,such as Rise Time,
RMSvoltage andPeak-Peakvoltage.The instrument offersa quick selectionof standardparameters,or
youcancreate auser-definedset of parameters(MyMeasure)drawnfrom all availablemeasurements.
On instruments equippedwith CustomDSO(XDEV),custom scripts maybe usedto calculateaparameter.
Severalscripting"languages"are supported,depending on theapplication.Youcanfindtheseoptionsin
theCustom submenuof the MeasureSelector. Scriptsmay be imported or written inthe instrument's
Script Editorwindow. SeeUsingPScript for a descriptionof the process.
Parameter readouts are shownina dynamic Measuretablethat appears below thewaveform grids. All
activemeasurementscan beusedasinputsto other processes,such asPass/Fail tests,evenwhenthe
Measuretableishiddenfrom view. Thehistoryof a parametercan alsobe graphedas a histogram,track
ortrendfor statisticalanalysis.
Measurements arecalculatedandcanbeapplied to otherprocesses even whentheyarenot displayed.Intheimageat right,
theP1amplitudemeasurement isusedina Pass/Failtest,although theMeasuretableis hidden.
89
Page 96

WaveRunner/MDA8000HDOscilloscopes Operator's Manual
Measure Table
Thevaluerow of the Measuretableshows themeasurements takenfor each parameteronthe last
acquisition.Youmayoptionallycalculate anddisplay thestatisticalmean,min,maxandsdevof all
parameters.Statistics are calculated once per acquisitionandaccumulateovermultipleacquisitions,up
tothe twobillion valuelimit of themeasurement buffer.
Toquicklyset up the table,draganyconfiguredcellontoanemptycellof the Measuretable.Then,drag
thedescriptor boxof the tracetobe measuredontothenew parameter. Touch the cellto chooseanew
measurement ormakeanyothermodificationson thePndialog.
Closesetup dialogswhen theMeasuretableisdisplayed to maximizethe area availablefor viewing
waveforms.Thetable itself canbe usedto reopensetup dialogs. To opentheParameter Setup (Pn)
dialog,touchthe Pncellof the table.Touchthefar left Measurecolumn to openthe Measuredialogand
modifythe table.The tableisstatic whenusingstandardmeasurement sets,asthesecannot bechanged.
Symbolsin thestatusrow of theMeasuretableindicatethe following:
OK:validvaluereturned.
Warning:there isaproblem withthesignal or the setup that preventsmeasuring.Touchthe
parameter cellto seean explanationin themessagebar.
NoPulse/Insufficient Data:Thesoftwareisunableto determine topandbase.Thismayindicate
that there isinsufficient difference betweenthemaximum andminimum forthesoftware to
detect apulse,or theremay beaninsufficient numberof pointsin thevisible toporbaseof apulse,such
aswhencloselyexaminingastep response.
UnderflowCondition:The bottom most (negative)samplepoint ofthewaveform fallsbelow the
ADCrange.Probably,thebottom of the pulsesappear tobecut off.
OverflowCondition:The topmost (positive)samplepoint of thewaveform isabovetheADC
range.Probably,thetopof the pulsesappearto be cut off.
SimultaneousUnderflowandOverflow Condition:Bothconditionsarepresent at once.
90
Page 97

Measure
Measure Dialog
TheMeasureDialoggivesquickaccessto measurement features.Besides turningon/off parameters,use
theMeasuredialogto displaystatistics,histiconsandhelpmarkersforstandardanduser-defined
parameter sets. Youcanalsogate the standard parameter setsto limit the horizontalscopeof the
measurement. Allstandardparameterswillshare thesamegate. (Usethe Pndialogstoindividuallygate
user-definedparameters.)
Selecting Measurements
1. To opentheMeasuredialog,touchthe AddNewbox andselect Measurement,or chooseMeasure
>Measure Setupfrom the menubar.
2. CheckShowTable todisplay thereadout. Thisis not requiredtotakethe measurement.
3. Choosethe Std. Verticalor Std. Horizontalparameters.
Or,to turn onyourown parameters,chooseMyMeasure,thenselect the Oncheckboxnext to each
parameter youwishto display. Open the Pndialogstodefinenew parameters.
4. Optionally:
l Gate standardparameters byenteringtheposition (indivisions)of left andright gates.
l ShowHelpMarkers.
l AddStatisticsand Histiconstothe MeasureTable.
Touch ClearSweepsto reset all measurement countersandrestart allstatistics.
Touch ClearAllDefinitionstoreset allparametersto "None".
Caution:Definitionscannot be restoredafter clearing,youmust repeat parameterset up.
Standard Parameter Sets
Thepre-configuredstandardparameter setsavailableonthe Measuredialogare:
l StdVertical:Pk-Pk,Ampl,Max,Min,Sdev,Mean,Base,Top
l StdHorizontal:Rise,Fall,Period,Frequency,Width,Duty Cycle,Delay,NPoints
Toquicklybegina new set ofuser-definedparameters basedon thestandardverticalor horizontal sets,
touch QuickSetupsandchoosethe set to copy.Refinethe settingson the Pndialogs.
91
Page 98

WaveRunner/MDA8000HDOscilloscopes Operator's Manual
Statistics and Histicons
CheckingStatisticsOnon the Measuredialogaddsthe mean,min,max andsdevof each parameter to the
measuredvalueshownon theMeasuretable.
Statistics for each parameterarecalculatedonce peracquisitionandaccumulate untilyoueither Clear
Sweepsor themeasurement buffer isfull.TheNum rowof the Measuretableshows thetotal numberof
measurementsincludedin theStatistics calculation.If themeasurement isgated,the statisticsare
calculatedforonlythedata points betweenthegates,just asthe parameter valueitself willreflect the
limitsimposedbythegate.
Mean Theweightedmeanof the parameter calculatedover thenumber of times shown.
Min Theminimum value of the parameter measuredover the number of times shown.
Max Themaximum valueof theparameter measuredover thenumber of times shown.
Sdev Thepopulation standard deviationof theparameter calculated over thenumber of times
shown.
Num For anyparameter that computes onceonan entireacquisition,Num represents thenumber
of sweepsover whichthestatistics arecomputed.
For anyparameter that computes onevery eventwithinanacquisition,such as afullperiod,
Num represents thenumber of events per sweeptimes thenumber of sweeps computed.
Thus,for aSingleacquisition of five periods,theNum shown for any perperiodmeasurements will be5,as fivemeasurements were madeandthe statistics reflect thosefive
measurements.After anotherSingleacquisition,Num will be 10,or five measurements
times twosweeps.The statistics now reflect all 10 measurements.
Histiconsare miniaturehistograms of parameters that maybe addedto
theMeasuretablereadout. Thesethumbnailhistograms let you seeat a
glancethe statistical distributionof eachparameter. Check Histiconsonthe Measuredialog.
Tip:You can quicklydisplaya fullhistogram by touchingthehisticon youwant to enlarge.
92
Page 99

Measure
Gating Measurements
All measurementsare calculatedon onlythat portionof thewaveform tracethat is visible onthegrid and
withinthe measurement gates.On >500 Mptsacquisitions,measurements are alsolimitedtothecenter
500 Mpts of theacquisition.Anysettingthat movesthetrace outsidetheobservation window or makesit
appear"clipped"willaffect measurements.
Thedefault startingpositionsof themeasurement gate posts are0 div and10 div,which coincidewiththe
left andright edgesof thegrid,and theFirst andLast points. Therefore,the measurement gates initially
enclosethe entire visible acquisition.Bymovingthemeasurement gates,you canfocusthe measurement
onthe sectionof theacquisitionof greatest interest.For example,if you"gate"sixrisingedgesof a
waveform,calculationsareperformedonlyonthesixpulsesboundedby thegate posts.
Gates (vertical whitelines)limit thedata measured andvisiblychangemeasurement calculations.
Thequickestwaytoset a gateisto dragthegate posts from thefarleft andright of thegridto the desired
positions. Youcan refinethissettingto hundredthsof adivision byusingtheGate Start and Stopfields on
theMeasuredialogfor Standardparameter sets,or on the Gate subdialog for user-defined
parameters.TouchDefault to returnthemeasuregatestothe width of the grid.
93
Page 100

WaveRunner/MDA8000HDOscilloscopes Operator's Manual
Help Markers
Help Markersclarifymeasurementsbydisplayinglines,labelsand hysteresisbandsto markthe points
beingmeasuredonthe trace.For "@Level"parameters,markersmakeit easier to seewhereyour
waveform intersectsthechosenlevel.If youchangetheset of parameters displayed,themarkerswill
change,as well.
You can choosetouseSimple markers,which are onlythe lines,or Detailedmarkers,which includethe
measurement point labels.
You alsohavetheoption,bymeansof the AlwaysOncheckbox,to leavethemarkersdisplayedovertraces
after you haveclosedtheMeasuredialogs or readout table.
Note:Unlikeregularcursors,which are white andcan bemoved,helpmarkersare blueand only
augment thedisplay;theycannot be moved,andthey donot reset the measurement points. Some
optionalanalysissoftware packagesincludemarkersdesignedspeciallyforthat domainof
reference,which are documentedinthe optionmanual.
94
DetailedHelp Markers.
 Loading...