

Page 1
Hardware and Software User Manual
Revision Date: 12/14/2016
Page 2

TELEDYNE LECROY
Copyright © 2017 Teledyne LeCroy, Inc.
FTS, Frontline, Frontline Test System, ComProbe Protocol Analysis System and ComProbe are registered
trademarks of Teledyne LeCroy, Inc.
The following are trademarks of Teledyne LeCroy, Inc.
l ProbeSync™
The Bluetooth SIG, Inc. owns the Bluetooth® word mark and logos, and any use of such marks by Teledyne LeCroy,
Inc. is under license.
All other trademarks and registered trademarks are property of their respective owners.
i Frontline 802.11 Hardware & Software User Manual
Page 3

TELEDYNE LECROY
Contents
Chapter 1 Frontline Hardware & Software 1
1.1 What is in this manual 2
1.2 Computer Minimum System Requirements 2
1.3 Software Installation 2
Chapter 2 Getting Started 3
2.1 802.11 Hardware 3
2.1.1 Attaching Antennas 3
2.1.2 Connecting/Powering the Frontline 802.11 4
2.1.3 Setting Up for ProbeSync™ 5
2.2 Data Capture Methods 7
2.2.1 Opening Data Capture Method 7
2.2.2 Frontline® 802.11 Data Capture Method 9
2.2.3 Virtual Sniffing 10
2.3 Control Window 10
2.3.1 Control Window Toolbar 11
2.3.2 Configuration Information on the Control Window 12
2.3.3 Status Information on the Control Window 12
2.3.4 Frame Information on the Control Window 13
2.3.5 Control Window Menus 13
2.3.6 Minimizing Windows 17
Chapter 3 Configuration Settings 19
3.1 802.11 Configuration 19
3.1.1 Wi-Fi Scanner Hardware Settings 19
3.1.2 802.11 I/O Settings - Datasource 19
3.1.3 Wi-Fi Device - MAC Address Editor 35
3.2 Decoder Parameters 36
3.2.1 Decoder Parameter Templates 38
3.2.2 Wi-Fi Security Decoder Parameters 40
3.2.3 Adding or Changing TCP/UDP Port Assignments 42
3.2.4 Determining Master and Slave 43
Frontline 802.11 Hardware & Software User Manual ii
Page 4

TELEDYNE LECROY
3.3 Conductive Testing 43
3.3.1 802.11 WiFi Conductive Testing 44
Chapter 4 Capturing and Analyzing Data 47
4.1 Capture Data 47
4.1.1 Air Sniffing: Positioning Devices 47
4.1.2 Capturing Data to Disk - General Procedure 49
4.1.3 Capturing Using Frontline Wi-Fi Datasource with Wireshark® 51
4.1.4 Combining BPA 600, 802.11, and HSU with ProbeSync 54
4.1.5 Sodera & 802.11: Capturing with ProbeSync 56
4.1.6 Extended Inquiry Response 56
4.2 Protocol Stacks 57
4.2.1 Protocol Stack Wizard 58
4.2.2 Creating and Removing a Custom Stack 59
4.2.3 Reframing 60
4.2.4 Unframing 60
4.2.5 How the Analyzer Auto-traverses the Protocol Stack 61
4.2.6 Providing Context For Decoding When Frame Information Is Missing 62
4.3 Analyzing Protocol Decodes 62
4.3.1 The Frame Display 62
4.3.2 Coexistence View 97
4.4 Analyzing Byte Level Data 131
4.4.1 Event Display 131
4.4.2 The Event Display Toolbar 132
4.4.3 Opening Multiple Event Display Windows 133
4.4.4 Calculating CRCs or FCSs 133
4.4.5 Calculating Delta Times and Data Rates 134
4.4.6 Switching Between Live Update and Review Mode 134
4.4.7 Data Formats and Symbols 135
4.5 Data/Audio Extraction 139
4.6 Statistics 142
4.6.1 Statistics Window 142
iii Frontline 802.11 Hardware & Software User Manual
Page 5

TELEDYNE LECROY
4.6.2 Session, Resettable and Capture File Tabs 145
4.6.3 Copying Statistics To The Clipboard 146
4.6.4 802.11 Error Statistics 146
4.6.5 Graphs 146
4.6.5.2 Printing Error Graphs 147
Chapter 5 Navigating and Searching the Data 149
5.1 Find 149
5.1.1 Searching within Decodes 150
5.1.2 Searching by Pattern 152
5.1.3 Searching by Time 154
5.1.4 Using Go To 156
5.1.5 Searching for Special Events 157
5.1.6 Searching by Signal 158
5.1.7 Searching for Data Errors 162
5.1.8 Find - Bookmarks 164
5.1.9 Changing Where the Search Lands 165
5.1.10 Subtleties of Timestamp Searching 166
5.2 Bookmarks 166
5.2.1 Adding, Modifying or Deleting a Bookmark 166
5.2.2 Displaying All and Moving Between Bookmarks 167
Chapter 6 Saving and Importing Data 169
6.1 Saving Your Data 169
6.1.1 Saving the Entire Capture File 169
6.1.2 Saving the Entire Capture File with Save Selection 170
6.1.3 Saving a Portion of a Capture File 171
6.2 Adding Comments to a Capture File 171
6.3 Confirm Capture File (CFA) Changes 172
6.4 Loading and Importing a Capture File 172
6.4.1 Loading a Capture File 172
6.4.2 Importing Capture Files 173
6.5 Printing 173
Frontline 802.11 Hardware & Software User Manual iv
Page 6

TELEDYNE LECROY
6.5.1 Printing from the Frame Display/HTML Export 173
6.5.2 Printing from the Event Display 176
6.6 Exporting 177
6.6.1 Frame Display Export 177
6.6.2 Exporting a File with Event Display Export 177
Chapter 7 General Information 181
7.1 System Settings and Progam Options 181
7.1.1 System Settings 181
7.1.2 Changing Default File Locations 185
7.1.3 Side Names 187
7.1.4 Timestamping 188
7.2 Technical Information 191
7.2.1 Performance Notes 191
7.2.2 Progress Bars 192
7.2.3 Event Numbering 192
7.2.4 Useful Character Tables 192
7.2.5 DecoderScript Overview 195
7.2.6 Bluetooth low energy ATT Decoder Handle Mapping 195
Contacting Technical Support 196
Appendicies 199
Appendix A: Application Notes 200
A.1 ComProbe Automation Server: Why use it? 202
A.1.1 Automation Server Topology 203
A.1.2 Writing Automation Script 203
A.1.3 Running Automation Server Script 205
A.1.4 Saving Automation Captured Data 208
A.1.5 Keeping Track of Events 210
A.1.6 Automation Can Save Time and Money 210
v Frontline 802.11 Hardware & Software User Manual
Page 7

Chapter 1 Frontline Hardware & Software
Frontline Test Equipment family of protocol analyzers work with the following technologies.
l Classic Bluetooth
l Bluetooth low energy
l Dual Mode Bluetooth (simultaneous Classic and low energy)
l Bluetooth Coexistence: Bluetooth with 802.11 Wi-Fi
l Bluetooth HCI (USB, SD, High Speed UART)
l NFC
l 802.11 (Wi-Fi)
l SD
l HSU (High Speed UART)
The Frontline hardware interfaces with your computer that is running our robust software engine called the
ComProbe Protocol Analysis System or Frontline software. Whether you are sniffing the air or connecting directly
to the chip Frontline analyzers use the same powerful Frontline software to help you test, troubleshoot, and
debug communications faster.
Frontline software is an easy to use and powerful protocol analysis platform. Simply use the appropriate Frontline
hardware or write your own proprietary code to pump communication streams directly into the Frontline
software where they are decoded, decrypted, and analyzed. Within the Frontline software you see packets,
frames, events, coexistence, binary, hex, radix, statistics, errors, and much more.
This manual is a user guide that takes you from connecting and setting up the hardware through all of the
Frontline software functions for your Frontline hardware. Should you have any questions contact the Frontline
Technical Support Team.
Frontline 802.11 Hardware & Software User Manual 1
Page 8

TELEDYNE LECROY Chapter 1 Frontline Hardware & Software
1.1 What is in this manual
The Frontline User Manual comprises the following seven chapters. The chapters are organized in the sequence
you would normally follow to capture and analyze data: set up, configure, capture, analyze, save. You can read
them from beginning to end to gain a complete understanding of how to use the Frontline hardware and software
or you can skip around if you only need a refresher on a particular topic. Use the Contents, Index, and Glossary to
find the location of particular topics.
l Chapter 1 Frontline Hardware and Software. This chapter will describe the minimum computer
requirements and how to install the software.
l Chapter 2 Getting Started. Here we describe how to set up and connect the hardware, and how to apply
power. This chapter also describes how to start the Frontline software in Data Capture Methods. You will be
introduced to the Control window that is the primary operating dialog in the Frontline software.
l Chapter 3 Configuration Settings. The software and hardware is configured to capture data. Configuration
settings may vary for a particular Frontline analyzer depending on the technology and network being sniffed.
There are topics on configuring protocol decoders used to disassemble packets into frames and events.
l Chapter 4 Capturing and Analyzing Data. This Chapter describes how to start a capture session and how to
observe the captured packets, frames, layers and events.
l Chapter 5 Navigating and Searching the Data. Here you will find how to move through the data and how to
isolate the data to specific events, often used for troubleshooting device design problems.
l Chapter 6 Saving and Importing Data. When a live capture is completed you may want to save the captured
data for future analysis, or you may want to import a captured data set from another developer or for use in
interoperability testing. This chapter will explain how to do this for various data file formats.
l Chapter 7 General Information. This chapter provides advanced system set up and configuration information,
timestamping information, and general reference information such as ASCII, baudot, and EBCDIC codes. This
chapter also provides information on how to contact Frontline's Technical Support team should you need
assistance.
1.2 Computer Minimum System Requirements
Frontline supports the following computer systems configurations:
l Operating System: Windows 7/8/10
l USB Port: USB 2.0 High-Speed or or later
The Frontline software must operate on a computer with the following minimum characteristics.
l Processor: Core i5 processor at 2.7 GHz
l RAM: 4 GB
l Free Hard Disk Space on C: drive: 20 GB
1.3 Software Installation
Download the installation software from FTE.com. Once downloaded, double-click the installer and follow the
directions.
Use this link: http://www.fte.com/80211-soft.
2 Frontline 802.11 Hardware & Software User Manual
Page 9

Chapter 2 Getting Started
In this chapter we introduce you to the Frontline hardware and show how to start the Frontline analyzer software
and explain the basic software controls and features for conducting the protocol analysis.
2.1 802.11 Hardware
2.1.1 Attaching Antennas
When you remove the Frontline 802.11 from the box, the first step is to attach the antennas (Figure 2.1).
Figure 2.1 - Front Panel
1. Attach an antenna to each front panel connector.
Frontline 802.11 Hardware & Software User Manual 3
Page 10

TELEDYNE LECROY Chapter 2 Getting Started
Figure 2.2 - Frontline 802.11 with both antennas attached
2.1.2 Connecting/Powering the Frontline 802.11
Once you have attached the antennas, the next step is to power up and connect the Frontline 802.11 to the
computer.
1. Insert the power cable (DC connector) from the 12 volt AC adapter into the Power port on the Frontline
802.11 back panel (Figure 2.3).
Figure 2.3 - Back Panel - Power
2. Plug the 12 volt AC adapter into the AC power source. The front panel Power light illuminate (Figure 2.1).
3. Insert the USB cable into the USB port on the Frontline 802.11 back panel (Figure 2.4).
4 Frontline 802.11 Hardware & Software User Manual
Page 11
Chapter 2 Getting Started TELEDYNE LECROY
Figure 2.4 - Back Panel - USB
4. Insert the other end of the USB cable into the PC.
5. It may take as long as thirty seconds for Windows to recognize that the Frontline 802.11 hardware is
connected to the PC. The Activity light on the Frontline 802.11 front panel (Figure 2.1 will blink during this
period, when the light is steady, the Frontline 802.11 hardware is ready to communicate with the
Frontline software.
2.1.3 Setting Up for ProbeSync™
The Frontline 802.11 hardware has ProbeSync™ which allows for synchronization of Frontline hardware clocks
and timestamping. One Frontline device will act as the master device by providing the clock to the slave device
receiving the clock. Do not confuse "master" and "slave" with the Bluetooth device master and slave relationships.
Refer to the following tables.
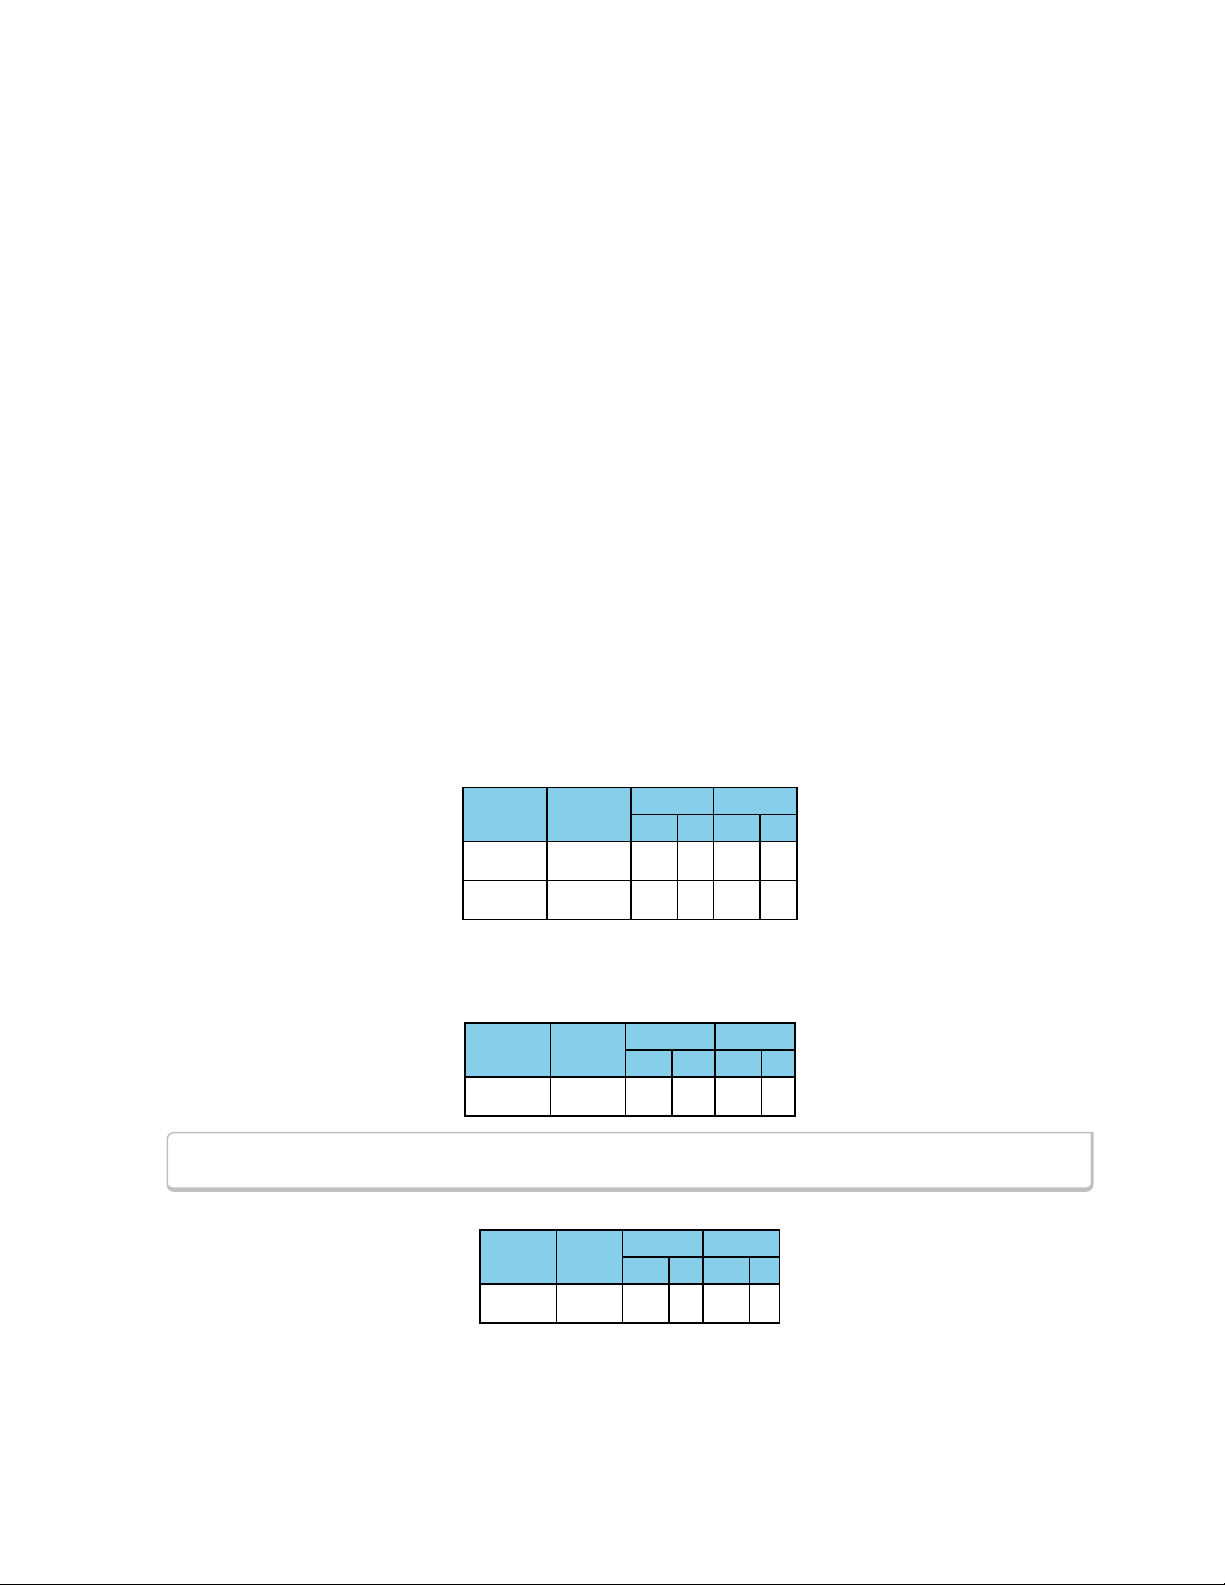
Table 2.1 - 802.111Synced to 802.11
802.111802.11
802.111802.11
2
OUT IN OUT IN
2
2
Master Slave X X
Slave Master X X
Table 2.2 - BPA 600 Synced to
802.11
BPA 600 802.11
BPA 600 802.11
OUT IN OUT IN
Master Slave X X
Note: The Frontline BPA 600 device must always be the master node in ProbeSync mode.
Table 2.3 - HSU Synced to 802.11
802.11 HSU
802.11 HSU
OUT IN OUT IN
Master Slave X X
Frontline 802.11 Hardware & Software User Manual 5
Page 12
TELEDYNE LECROY Chapter 2 Getting Started
Note: The Frontline HSU device must always be the slave node in ProbeSync mode, must
always be the last device in the ProbeSync daisy-chain configuration.
ProbeSync allows a Frontline Sodera and a 802.11 hardware to be connected together to run off of a common
clock, ensuring precise timestamp synchronization while capturing multiple wireless technologies such as
Bluetooth and 802.11. One device will act as the master device by providing the clock to the slave device
receiving the clock. The devices are connected in a daisy-chain configuration. Refer to the following table, to Rear
Panel Connectors, on page1, and to Connecting/Powering the Frontline 802.11 on page 4.
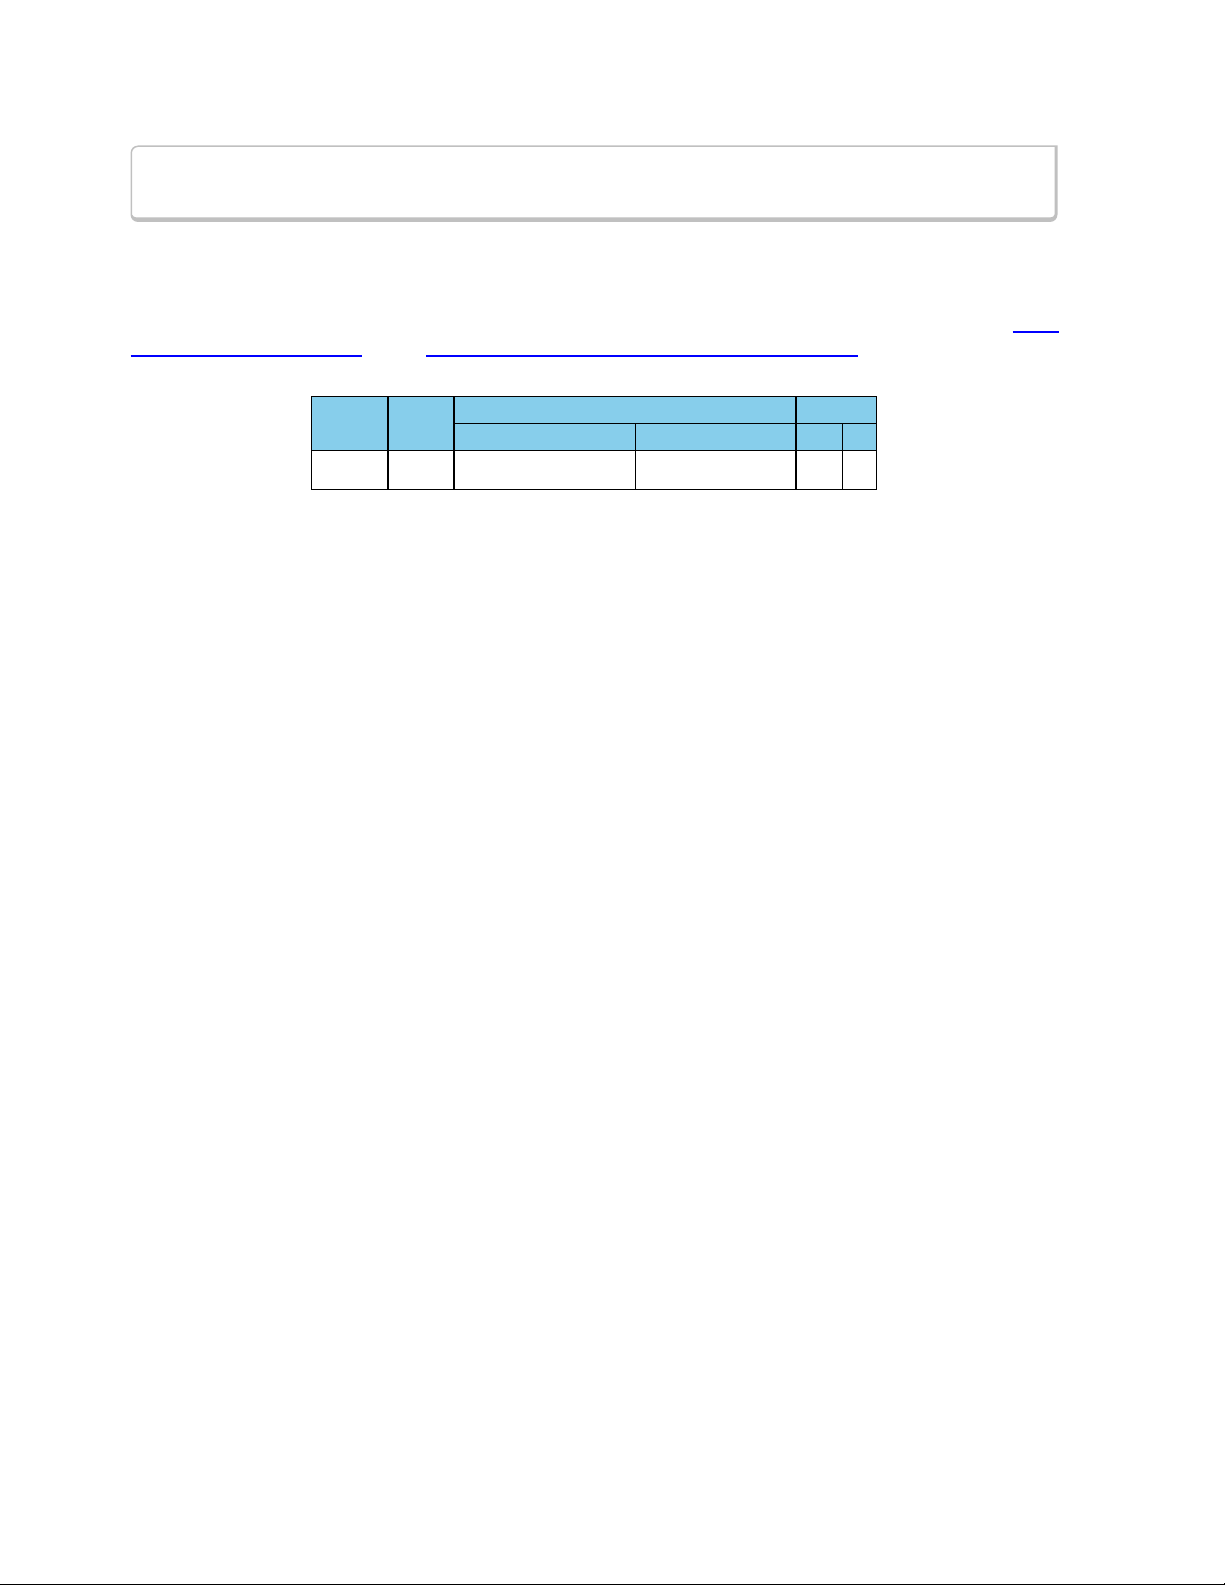
Table 2.4 - Sodera Synced to 802.11
Sodera 802.11
Master Slave X X
1. Using a CAT 5 Ethernet cable (less than 1.5 meters (4.9 feet)) insert one end to the master Frontline device
OUT jack.
2. Insert the other end of the cable into the slave Frontline device IN jack.
PROBESYNC OUT PROBESYNC IN OUT IN
Sodera 802.11
Figure 2.5 - Back Panel - ProbeSync with BPA 600
6 Frontline 802.11 Hardware & Software User Manual
Page 13

Chapter 2 Getting Started TELEDYNE LECROY
2.2 Data Capture Methods
This section describes how to load TELEDYNE LECROY Frontline Protocol Analysis System software, and how to
select the data capture method for your specific application.
2.2.1 Opening Data Capture Method
On product installation, the installer creates a folder on the windows desktop labeled "Frontline <version #>".
1. Double-click the " Frontline <version #>" desktop folder
This opens a standard Windows file folder window.
Figure 2.6 - Desktop Folder Link
2. Double-click on Frontline ComProbe Protocol Analysis System and the system displays the Select Data
Capture Method... dialog.
Note: You can also access this dialog by selecting Start > All Programs > Frontline
(Version #) > Frontline ComProbe Protocol Analysis System
Frontline 802.11 Hardware & Software User Manual 7
Page 14
TELEDYNE LECROY Chapter 2 Getting Started
Figure 2.7 - Example: Select Data Capture Method..., BPA 600
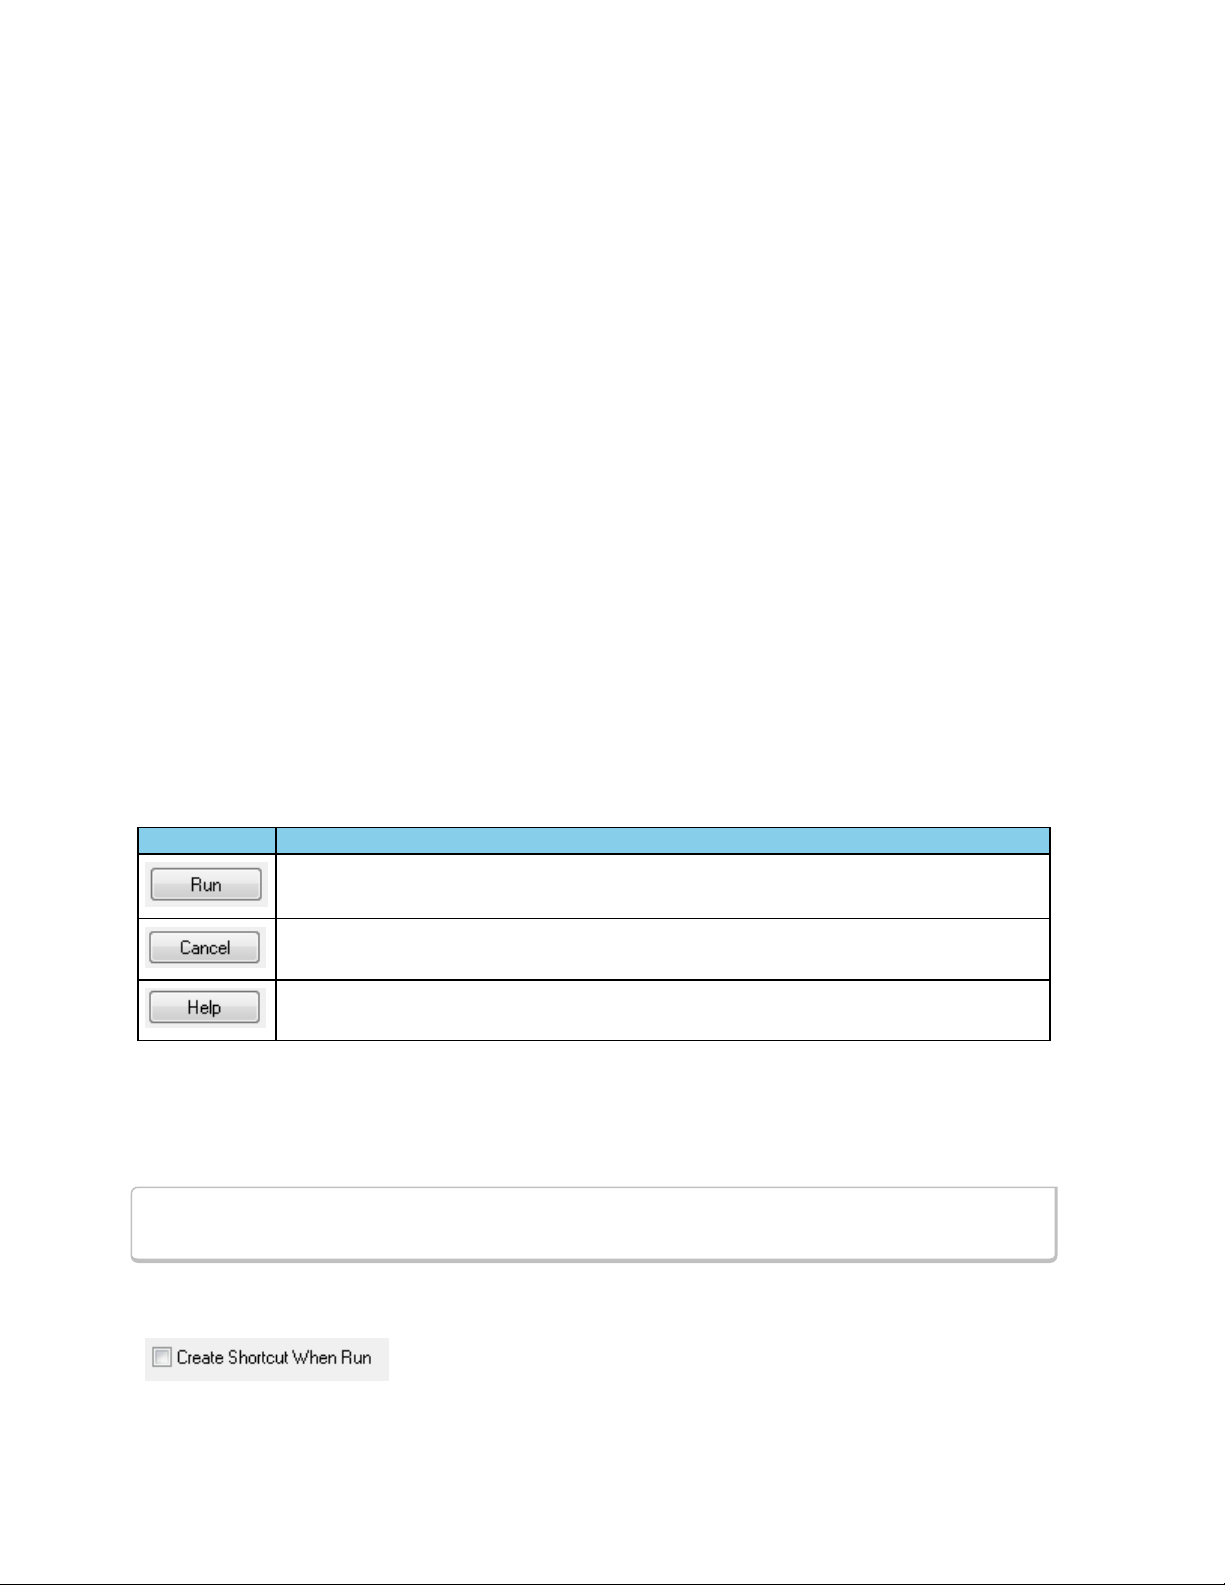
Three buttons appear at the bottom of the dialog; Run, Cancel, and Help.
Select Data Capture Method dialog buttons
Button Description
Becomes active when a capture method is selected. Starts the selected capture method.
Closes the dialog and exits the user back to the computer desktop.
Opens Frontline Help. Keyboard shortcut: F1.
3. Expand the folder and select the data capture method that matches your configuration.
4. Click on the Run button and the Frontline Control Window will open configured to the selected capture
method.
Note: If you don't need to identify a capture method, then click the Run button to start the
analyzer.
Creating a Shortcut
A checkbox labeled Create Shortcut When Run is located near the bottom
of the dialog. This box is un-checked by default. Select this checkbox, and the
8 Frontline 802.11 Hardware & Software User Manual
Page 15

Chapter 2 Getting Started TELEDYNE LECROY
system creates a shortcut for the selected method, and places it in the "Frontline ComProbe Protocol Analysis
System <version#>" desktop folder and in the start menu when you click the Run button. This function allows you
the option to create a shortcut icon that can be placed on the desktop. In the future, simply double-click the
shortcut to start the analyzer in the associated protocol.
Supporting Documentation
The Frontline <version #>directory contains supporting documentation for development (Automation,
DecoderScript™, application notes), user documentation (Quick Start Guides and the Frontline User Manual), and
maintenance tools.
2.2.2 Frontline®802.11 Data Capture Method
l 802.11
o
Requires one Frontline 802.11 hardware.
o
Captures 802.11 data on the selected channel.
Frontline 802.11 Hardware & Software User Manual 9
Page 16

TELEDYNE LECROY Chapter 2 Getting Started
l 802.11 Double
o
Requires two Frontline 802.11 hardware with ProbeSync™.
l 802.11 Triple
o
Requires three Frontline 802.11 hardware with ProbeSync™.
l 802.11 with USB
o
Requires one Frontline 802.11 and one Frontline USB hardware.
l 802.11 with USB and SD
o
Requires one Frontline 802.11, one Frontline USB, and one Frontline SD hardware.
2.2.3 Virtual Sniffing
The Virtual Sniffer is a live import facility within Frontline®software that makes it possible to access any layer in a
stack that the programmer has access to and feed this data into the Virtual Sniffer. Please refer to the “Show Live
Import Information“button on the Virtual Sniffer Datasource window in Frontline software. More information is
available in the Live Import Developer's Kit located in the Development Tools folder in Frontline Protocol Analysis
System desktop folder, and a white paper is available at Bluetooth Virtual Sniffing
l FTS Side
o
No hardware required.
o
Frontline software acquires data via user-developed software.
l IEEE 11073+
o
No hardware required
o
for sniffing data virtually from the continua Enabling Software Library (CESL) IEEE 11073 tester.
2.3 Control Window
The analyzer displays information in multiple windows, with each window presenting a different type of
information. The Control window opens when the Run button is clicked in the Select Data Capture Method
window. The Control window provides access to each Frontline analyzer functions and settings as well as a brief
overview of the data in the capture file. Each icon on the toolbar represents a different data analysis function.
10 Frontline 802.11 Hardware & Software User Manual
Page 17
Chapter 2 Getting Started TELEDYNE LECROY
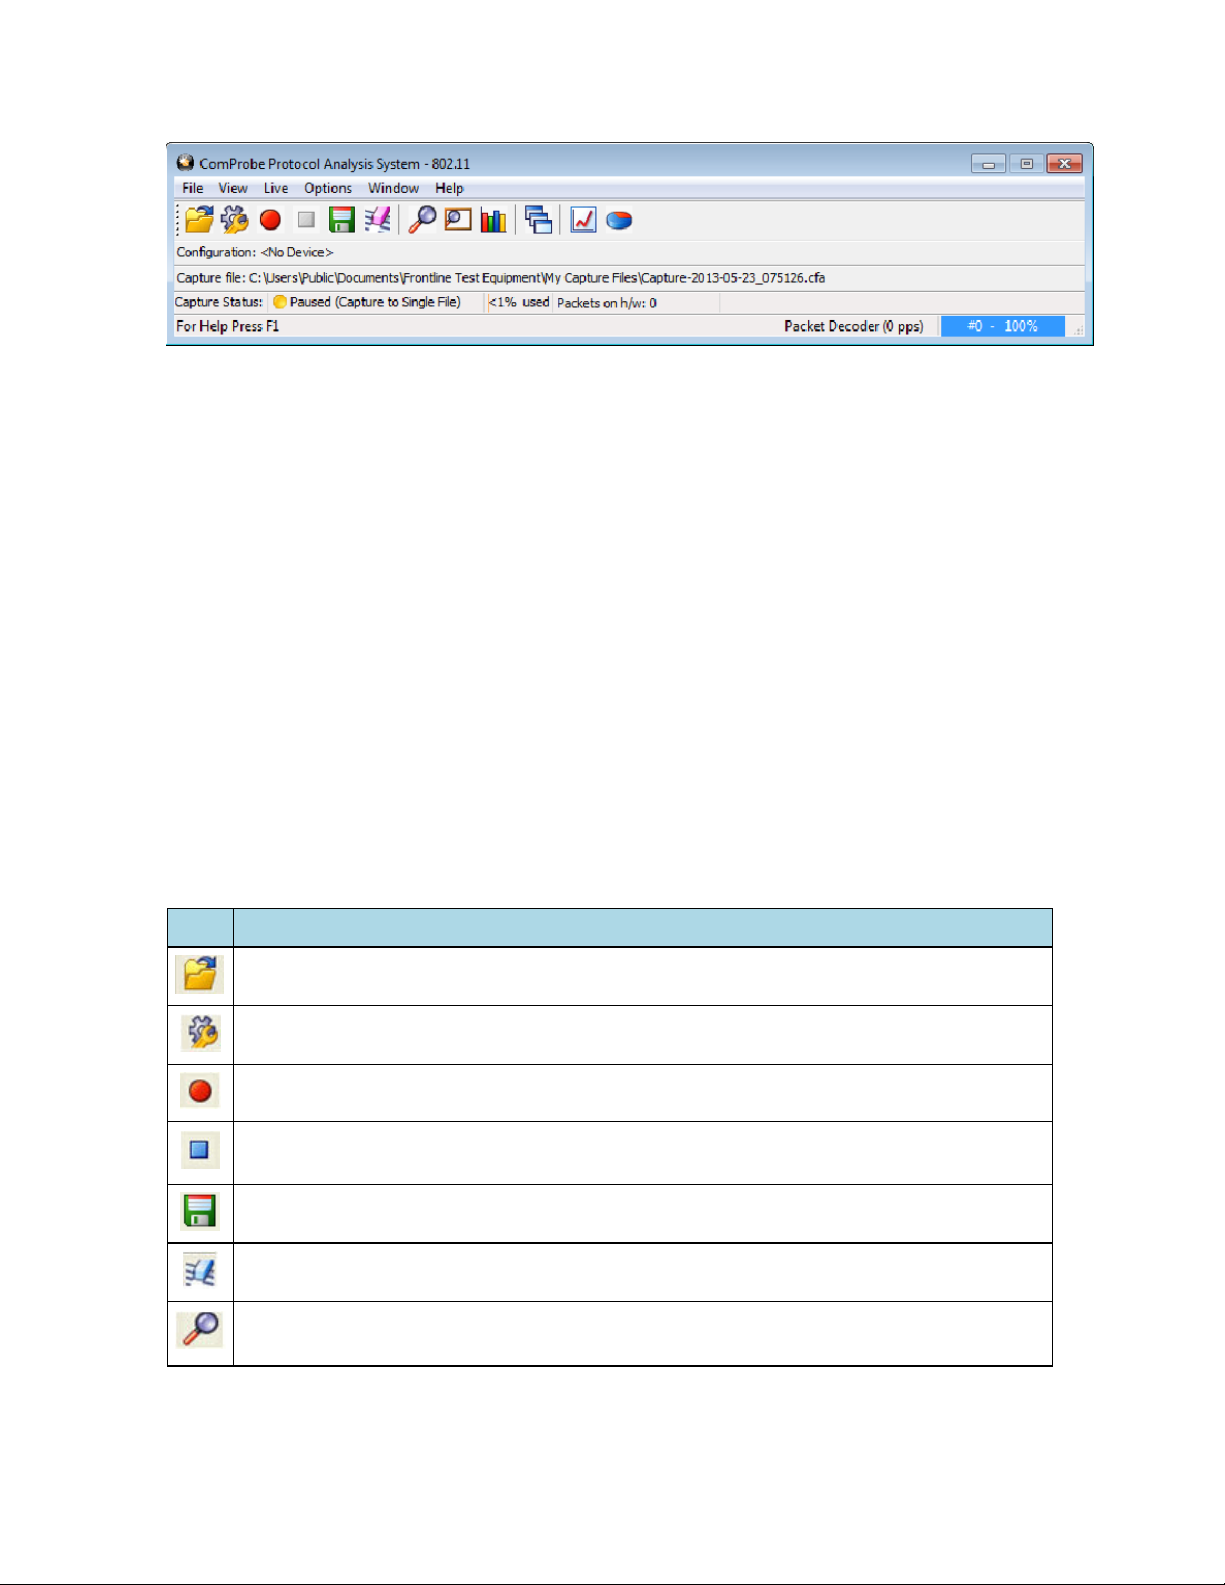
Figure 2.8 - Control Window
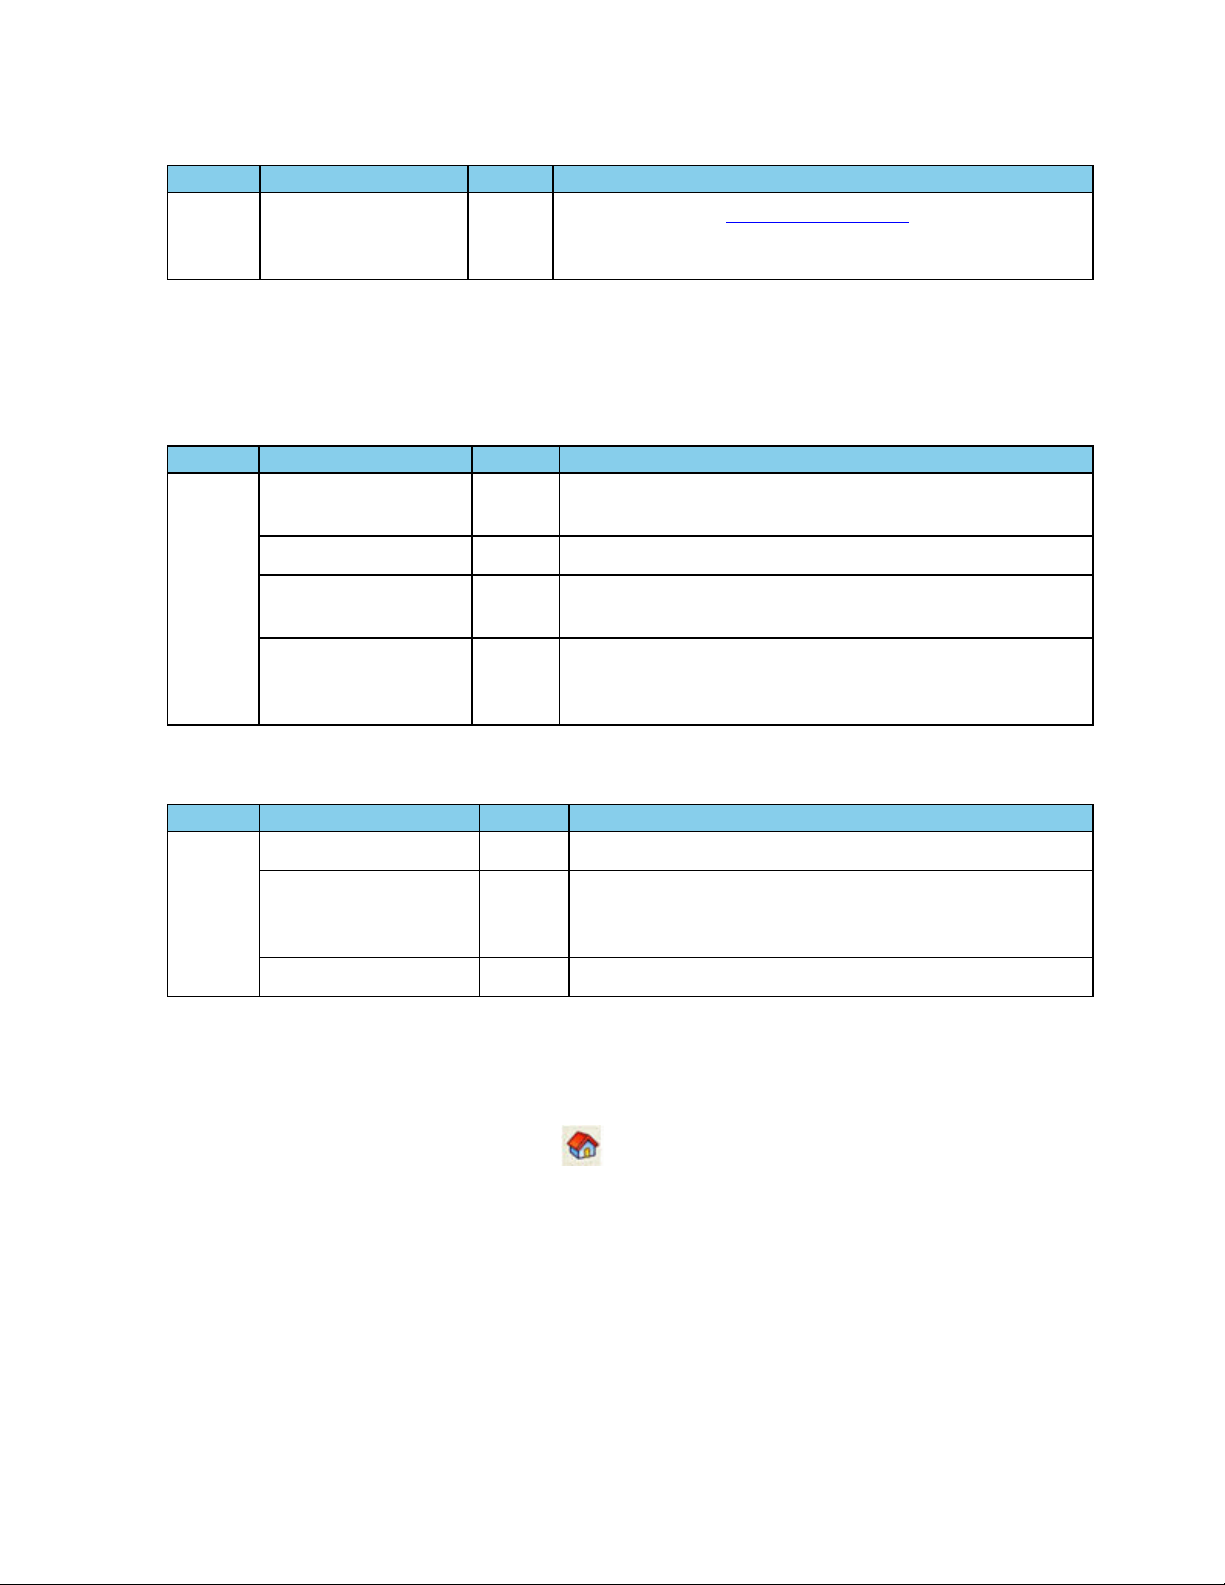
Because the Control window can get lost behind other windows, every window has a Home icon that brings
the Control window back to the front. Just click on the Home icon to restore the Control window.
When running the Capture File Viewer, the Control window toolbar and menus contain only those selections
needed to open a capture file and display the About box. Once a capture file is opened, the analyzer limits Control
window functions to those that are useful for analyzing data contained in the current file. Because you cannot
capture data while using Capture File Viewer, data capture functions are unavailable. For example, when
viewing Ethernet data, the Signal Display is not available. The title bar of the Control window displays the name of
the currently open file. The status line (below the toolbar) shows the configuration settings that were in use when
the capture file was created.
2.3.1 Control Window Toolbar
Toolbar icon displays vary according to operating mode and/or data displayed. Available icons appear in color,
while unavailable icons are not visible. Grayed-out icons are available for the Frontline hardware and software
configuration in use but are not active until certain operating conditions occur. All toolbar icons have
corresponding menu bar items or options.
Table 2.5 - Control Window Toolbar Icons
Icon Description
Open File - Opens a capture file.
I/O Settings - Opens settings
Start Capture - Begins data capture to disk
Stop Capture - Available after data capture has started. Click to stop data capture. Data can
be reviewed and saved, but no new data can be captured.
Save - Saves the capture file.
Clear - Clears or saves the capture file.
Event Display - (framed data only) Opens a Event Display, with the currently selected bytes
highlighted.
Frontline 802.11 Hardware & Software User Manual 11
Page 18
TELEDYNE LECROY Chapter 2 Getting Started
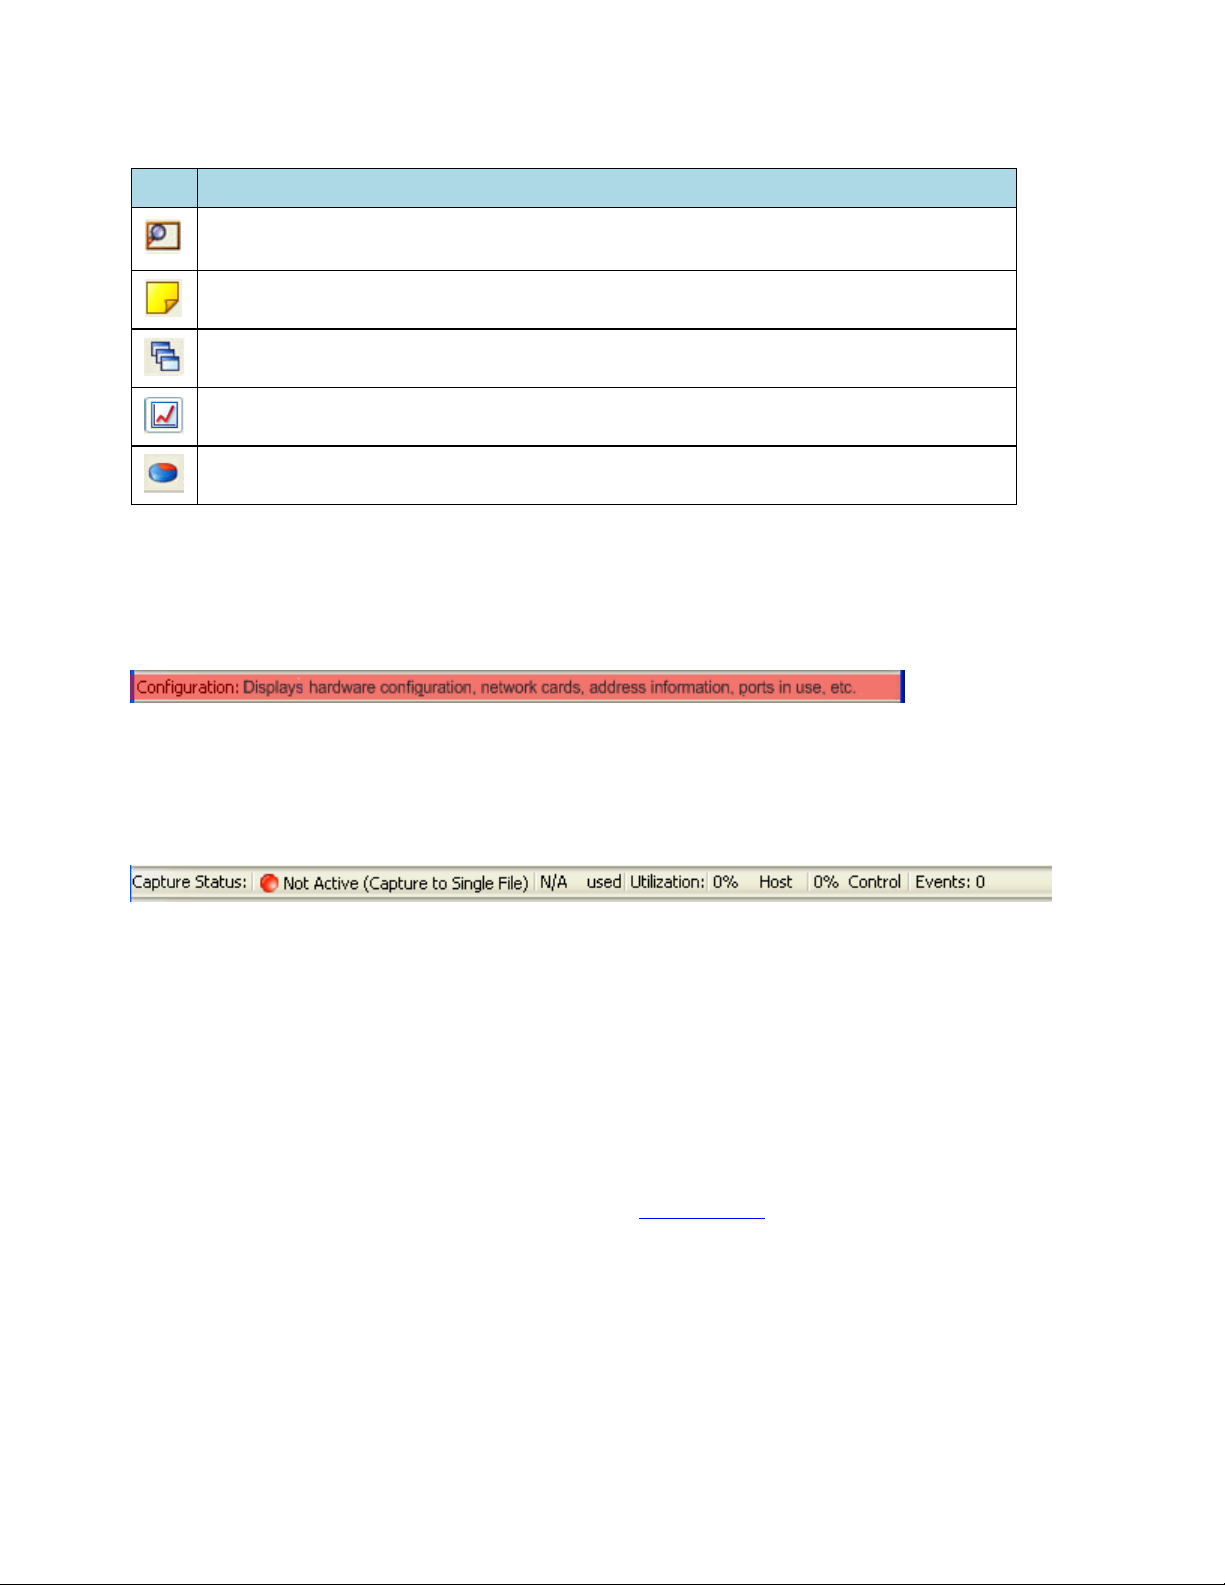
Table 2.5 - Control Window Toolbar Icons (continued)
Icon Description
Frame Display - (framed data only) Opens a Frame Display, with the frame of the currently
selected bytes highlighted.
Notes - Opens the Notes dialog.
Cascade - Arranges windows in a cascaded display.
Coexistence View - Opens the Coexistence View dialog.
Wi-Fi Error Statistics - Opens the Wi-Fi Error Statistics dialog.
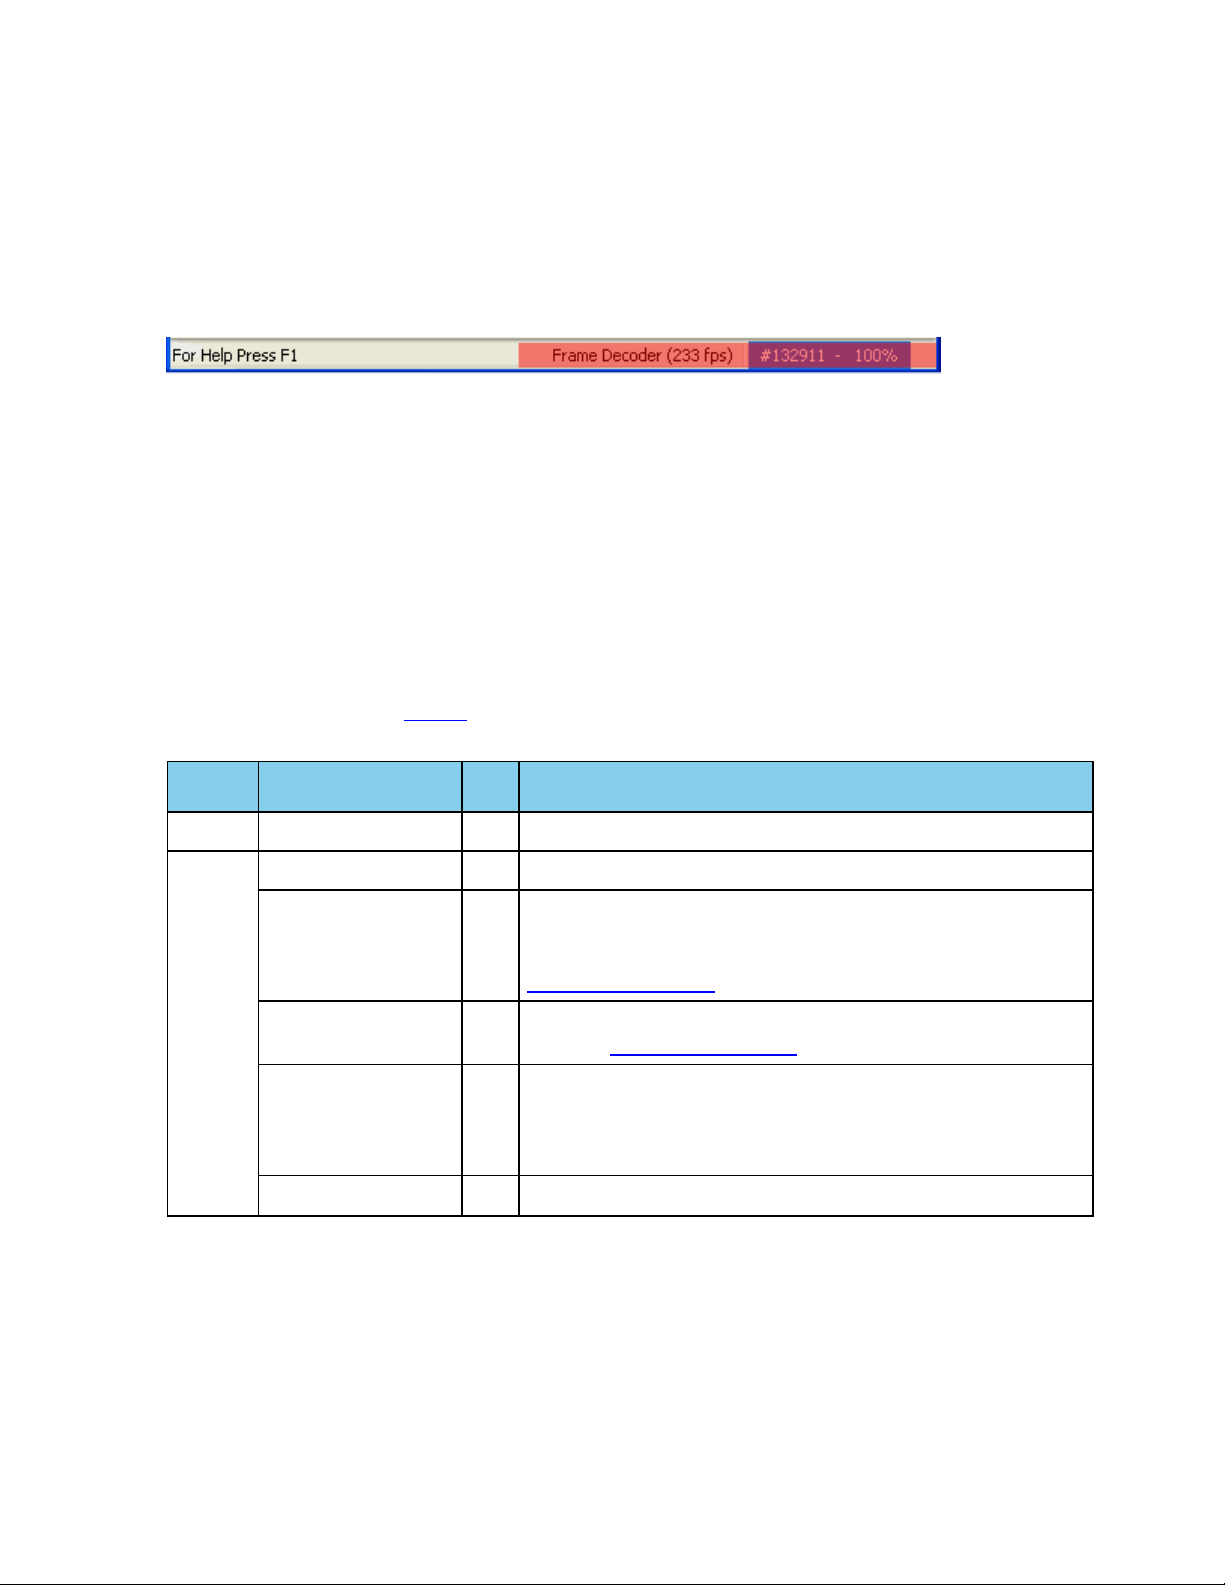
2.3.2 Configuration Information on the Control Window
The Configuration bar (just below the toolbar) displays the hardware configuration and may include I/O settings. It
also provides such things as name of the network card, address information, ports in use, etc.
2.3.3 Status Information on the Control Window
The Status bar located just below the Configuration bar on the Control window provides a quick look at current
activity in the analyzer.
l Capture Status displays Not Active, Paused or Running and refers to the state of data capture.
o
Not Active means that the analyzer is not currently capturing data.
o
Paused means that data capture has been suspended.
o
Running means that the analyzer is actively capturing data.
l
% Used
The next item shows how much of the buffer or capture file has been filled. For example, if you are
capturing to disk and have specified a 200 Kb capture file, the bar graph tells you how much of the capture
file has been used. When the graph reaches 100%, capture either stops or the file begins to overwrite the
oldest data, depending on the choices you made in the System Settings.
l
Utilization/Events
The second half of the status bar gives the current utilization and total number of events seen on the
network. This is the total number of events monitored, not the total number of events captured. The
12 Frontline 802.11 Hardware & Software User Manual
Page 19
Chapter 2 Getting Started TELEDYNE LECROY
analyzer is always monitoring the circuit, even when data is not actively being captured. These graphs
allow you to keep an eye on what is happening on the circuit, without requiring you to capture data.
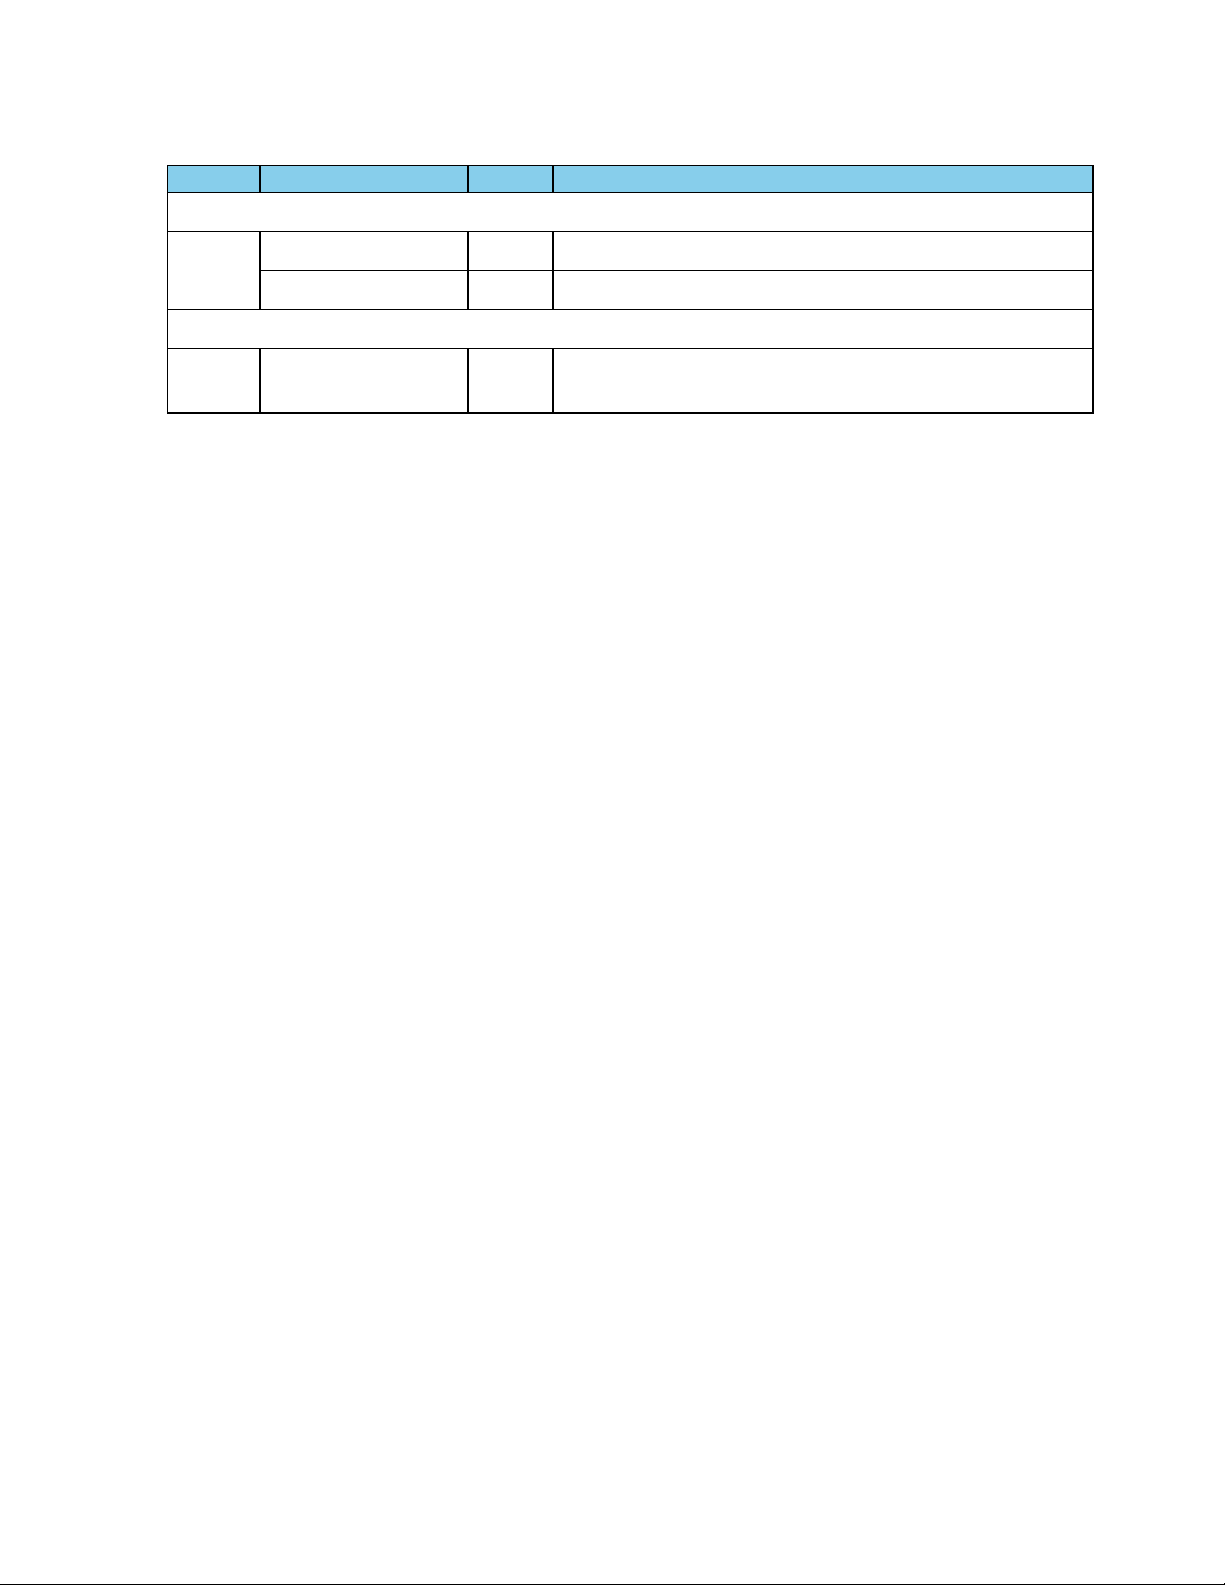
2.3.4 Frame Information on the Control Window
Frame Decoder information is located just below the Status bar on the Control window. It displays two pieces of
information.
l Frame Decoder (233 fps) displays the number of frames per second being decoded. You can toggle this
display on/off with Ctrl-D, but it is available only during a live capture.
l #132911 displays the total frames decoded.
l 100% displays the percentage of buffer space used.
2.3.5 Control Window Menus
The menus appearing on the Control window vary depending on whether the data is being captured live or
whether you are looking at a .cfa file. The following tables describe each menu.
Table 2.6 - Control Window File Menu Selections
Mode Selection
Live
Capture
File
Close
Go Live
Reframe
Hot
Key
Description
Closes Live mode.
Returns to Live mode
If you need to change the protocol stack used to interpret a
capture file and the framing is different in the new stack, you
need to reframe in order for the protocol decode to be correct. See
Reframing on page 60
Unframe
Recreate
Companion File
Removes start-of-frame and end-of-frame markers from your
data. See
Unframing on page 60
This option is available when you are working with decoders. If
you change a decoder while working with data, you can recreate
the ".frm file", the companion file to the ".cfa file". Recreating the
".frm file" helps ensure that the decoders will work properly.
Reload Decoders
The plug-ins are reset and received frames are decoded again.
Frontline 802.11 Hardware & Software User Manual 13
Page 20

TELEDYNE LECROY Chapter 2 Getting Started
Table 2.6 - Control Window File Menu Selections (continued)
Mode Selection
Live &
Capture
File
Open Capture File
Hot
Key
Ctrl--OOpens a Windows Open file dialog. at the default location
"...\Public Documents\Frontline Test Equipment\My Capture
Files\". Capture files have a .cfa extension.
Description
Save
Exit ComProbe
Protocol Analysis
System
Recent capture files A list of recently opened capture files will appear.
The View menu selections will vary depending on the Frontline analyzer in use.
Mode Selection Hot key Description
Live &
Capture
File
Event Display
Frame Display
Statistics
Coexistence View
Ctrl-SSaves the current capture or capture file. Opens a Windows
Save As dialog at the default location "...\Public
Documents\Frontline Test Equipment\My Capture Files\".
Shuts down the ComProbe Protocol Analysis System and all
open system windows.
Table 2.7 - Control Window View Menu Selections
CtrlShift-E
CtrlShift-M
CtrlShift-S
Opens the Event Display window for analyzing byte level
data.
Opens the Frame Display window for analyzing protocol level
data
Opens the Statistics Window that shows information about
packet throughput.
Opens the
simultaneously display Classic
energy, and 802.11 packets and thourghput.
Coexistence View window
that can
Bluetooth,Bluetooth
low
Wi-Fi Error
Statistics
Table 2.8 - Control Window Edit Menu Selections
Mode Selection
Capture
File
The Live menu selections will vary depending on the Frontline analyzer in use.
14 Frontline 802.11 Hardware & Software User Manual
Notes
CtrlShift-O
Opens the
number of packet errors.
Hot-
key
Opens the
comments to a capture file.
Wi-Fi Error Statistics window
Description
Notes window
that allows the user to add
that displays the
Page 21
Chapter 2 Getting Started TELEDYNE LECROY
Table 2.9 - Control Window Live Menu Selections
Mode Selection Hot-Key Description
The following two rows apply to all Frontline products except Set in Target.
Live
The following rows apply to all Frontline products
Live Clear Shift-
Start Capture
Stop Capture
Shift-F5 Begins data capture from the configured wireless devices.
F10 Stops data capture from the configured wireless devices.
Clears or saves the capture file.
F10
Frontline 802.11 Hardware & Software User Manual 15
Page 22

TELEDYNE LECROY Chapter 2 Getting Started
Table 2.9 - Control Window Live Menu Selections (continued)
Mode Selection Hot-Key Description
Live &
Capture
File
Hardware Settings
I/O Settings
0 - Classic
1 - Bluetooth low energy
0 - Classic
1 - Bluetooth low energy
System Settings
Directories...
Check for New
Releases at Startup
Side Names...
Protocol Stack...
Set Initial Decoder
Parameters...
AltEnter
Opens the System Settings dialog for configuring capture
files.
Opens the
the default file locations.
When this selection is enabled, the program automatically
checks for the latest Frontline protocol analyzer software
releases.
Opens the
of the slave and master wireless devices.
Opens the
protocol stack they want the analyzer to use when decoding
frames.
Opens the
may be times when the context for decoding a frame is
missing. For example, if the analyzer captured a response
frame, but did not capture the command frame, then the
decode for the response may be incomplete. The Set Initial
Decoder Parameters dialog provides a means to supply the
context for any frame. The system allows the user to define
any number of parameters and save them in templates for
later use.Each entry in the window takes effect from the
beginning of the capture onward or until redefined in the Set
Subsequent Decoder Parameters dialog. This selection is not
present if no decoder is loaded that supports this feature.
File Locations dialog
Side Names dialog
Select a Stack dialog
Set Initial Decoder Parameters window
where the user can change
used to customize the names
where the user defines the
. There
Set Subsequent
Decoder
Parameters...
Automatically
Request Missing
Decoder
Information
16 Frontline 802.11 Hardware & Software User Manual
Opens the
where the user can override an existing parameter at any
frame in the capture. Each entry takes effect from the
specified frame onward or until redefined in this dialog on a
later frame. This selection is not present if no decoder is
loaded that supports this feature.
When checked, this selection opens a dialog that asking for
missing frame information. When unchecked, the analyzer
decodes each frame until it cannot go further and it stops
decoding. This selection is not present if no decoder is loaded
that supports this feature.
Set Subsequent Decoder Parameters dialog
Page 23
Chapter 2 Getting Started TELEDYNE LECROY
Table 2.9 - Control Window Live Menu Selections (continued)
Mode Selection Hot-Key Description
Enable/Disable
Audio Expert
System
The Windows menu selection applies only to the Control window and open analysis windows: Frame Display,
Event Display, Message Sequence Chart, Bluetooth Timeline, Bluetooth low energy Timeline, and
Coexistence View. All other windows, such as the datasource, are not affected by these selections.
Table 2.10 - Control Window Windows Menu Selections
Mode Selection Hot-Key Description
Live &
Capture
File
Cascade
Close All Views
Ctrl-W Arranges open analysis windows in a cascaded view with
When enabled, the
it is not available. Only available when an Audio Expert
System licensed device is connected.
window captions visible.
Closes Open analysis windows.
Audio Expert System
is active, other wise
Minimize Control
Minimizes All
Frame Display
Event Display
Mode Selection Hot-Key Description
Live &
Capture
File
Help Topics
About Frontline
Protocol Analysis
System
Support on the Web
and
Table 2.11 - Control Window Help Menu Selections
When checked, minimizing the Control window also
minimizes all open analysis windows.
When these windows are open the menu will display these
selections. Clicking on the selection will bring that window to
the front.
Opens the Frontline Help window.
Provides a pop-up showing the version and release
information, Frontline contact information, and copyright
information.
Opens a browser to
fte.com
technical support page.
2.3.6 Minimizing Windows
Windows can be minimized individually or as a group when the Control window is minimized. To minimize
windows as a group:
1.
Go to the Window menu on the Control window.
2. Select Minimize Control Minimizes All. The analyzer puts a check next to the menu item, indicating
that when the Control window is minimized, all windows are minimized.
3. Select the menu item again to deactivate this feature.
4. The windows minimize to the top of the operating system Task Bar.
Frontline 802.11 Hardware & Software User Manual 17
Page 24

TELEDYNE LECROY Chapter 2 Getting Started
18 Frontline 802.11 Hardware & Software User Manual
Page 25

Chapter 3 Configuration Settings
In this section the Frontline software is used to configure an analyzer for capturing data .
3.1 802.11 Configuration
3.1.1 Wi-Fi Scanner Hardware Settings
The Hardware Settings dialog provides the ability to select a device to sniff/scan. The dialog only lists devices with
a MAC address that match the Frontline devices. To access the Hardware Settings dialog:
1. Select Hardware Settings from the Options menu on the 802.11 Control window.
Figure 3.1 - Wi-Fi Scanner Hardware Settings Dialog
2. Select a device from the drop-down list.
3. Select OK
If no devices are found, the list is blank.
Note: Upon launching the Air Sniffer, the first device in the drop-down is the default device.
3.1.2 802.11 I/O Settings - Datasource
1. Select I/O Settings from the Options menu on the Control window.
Frontline 802.11 Hardware & Software User Manual 19
Page 26

TELEDYNE LECROY Chapter 3 Configuration Settings
Figure 3.2 - 802.11 I/O Settings Dialog
There are several things to remember about I/O Settings:
l The I/O Settings are specific to the device selected in the Hardware Settings.
l Two 802.11 devices attached to a computer have different settings.
l Changing the settings changes the devices’ default settings.
l If a parameter is changed (e.g. Channel 1 is changed to 6), the new setting appears the next time the I/O
Settings dialog is opened for the device.
l The settings are saved when the OK button is pressed.
3.1.2.1 Settings
20 Frontline 802.11 Hardware & Software User Manual
Page 27

Chapter 3 Configuration Settings TELEDYNE LECROY
Figure 3.3 - 802.11 I/O Settings Settings Tab
The Settings dialog allows you to change and observe basic configuration values. These include the Channel,
Extension Channel, FCS Filter and Capture Type.
l Channel - Select the channel from the drop-down list. Channels have been extended to the 5Ghz range.
l Extension- allows you to extend the range of channels available
o
0 = Standard 1-14 Wi-Fi channels
o
-1 = Expanded channels below the standard range
o
+1 = Expanded channels above the standard range
l FCS Filter - The Frame Check Sequence filter indicates if the device should capture frames with an invalid
FCS. Select All Frames or Valid Frames
Clicking on the Scanner button will open the Wi-Fi Scanner dialog. This action is useful if you do not know the
channel to sniff. Once you have selected a channel in the Wi-Fi Scanner dialog and confirmed your selection the
selected channel will appear in Channel.
Frontline 802.11 Hardware & Software User Manual 21
Page 28

TELEDYNE LECROY Chapter 3 Configuration Settings
3.1.2.2 Status
Figure 3.4 - 802.11 I/O Settings Status Tab
The Status dialog provides current information about the ComProbe device. There are no settings for this dialog.
3.1.2.3 Capture Filters
The Capture Filters dialog allows you create, modify, and delete capture filters. The dialog initially displays the
existing MAC address Capture Filters.
l To activate the capture filters and to be able to create/modify additional filters, you first must select the
Enable MAC Address Capture Filters check box.
l You can select/deselect which filters are active by checking/unchecking the Enable checkbox in the first
column in the table.
l You can also select to ignore Management, Control, Data, and Reserved frame types by selecting one or
more the checkboxes.
22 Frontline 802.11 Hardware & Software User Manual
Page 29

Chapter 3 Configuration Settings TELEDYNE LECROY
Figure 3.5 - 802.11 I/O Settings Capture Filters Tab
To create a key, select one of the following options:
l Add New Address - displays a text box where you can enter the address
Frontline 802.11 Hardware & Software User Manual 23
Page 30

TELEDYNE LECROY Chapter 3 Configuration Settings
Figure 3.6 - 802.11 I/O Settings Capture Filters Add New Address Dialog
1. Enter a MAC Address in the text field.
2. Select the Include radio button to only capture packets with this MAC address.
3. Select the Exclude radio button to capture packets with other filters, but not ones with this MAC address.
4. Select one or more check boxes to identify which fields in the MAC Frame to include.
The MAC header for an 802.11 frame can contain up to 4 address fields. Most frames do not have that
many. In general, the first address is the intended receiver and the second address is the device that
transmits the frame. The third and fourth address fields depend on the context of the frame. Some of the
control type frames do not include the transmitter address but they may be determined from previous
frames.
5. Select OK to close the dialog.
Once you have MAC addresses on the main dialog, you can modify them using four options.
l Remove Address - Highlight an address that you want to delete and select Remove Address to remove it
from the list.
l Edit Address - Highlight an address that you want to edit and select Edit to bring up a dialog where you can
edit the address. The address and any of the prior settings may be changes. Click OK to save and close.
24 Frontline 802.11 Hardware & Software User Manual
Page 31

Chapter 3 Configuration Settings TELEDYNE LECROY
Figure 3.7 - 802.11 I/O Settings Capture Filters Edit MAC Address Dialog
l Move Address Up - moves the selected address up in the queue.
l Move Address Down - moves the selected address down in the queue.
3.1.2.4 Firmware Update
To take full advantage of the improvements to the ComProbe 802.11 with ComProbe Protocol Analysis System
you must update the firmware on the ComProbe.
Note: With the release of ComProbe Protocol Analysis System (CPAS) version
15.11.8698.9035 in December 2015, an update to the firmware is required upon installation of
the software. For that version, the full update requires three complete passes through the
update process followed by a power cycle of the ComProbe 802.11. Subsequent firmware
updates may not require three firmware update cycles. This procedure is designed to take you
through one to three firmware update cycles. Follow the procedure carefully, paying attention
to jumps around unnecessary steps, and you should have no difficulty updating the firmware.
1. This tab displays the current firmware version in the hardware. You can check for the firmware updates by
first noting the current version and then clicking on the Check For Updates button.
Frontline 802.11 Hardware & Software User Manual 25
Page 32

TELEDYNE LECROY Chapter 3 Configuration Settings
Figure 3.8 - 802.11 I/O Settings Firmware Update Tab
2. The Check for Updates dialog will open. If an update is available you can install it by clicking on the Start
Update button.
26 Frontline 802.11 Hardware & Software User Manual
Page 33

Chapter 3 Configuration Settings TELEDYNE LECROY
Figure 3.9 - 802.11 I/O Settings Firmware Check For Updates
3. When the update is complete, two situations can occur.
a. If more firmware updates are required the following dialog will appear. Click on OK, and continue
to step 4.
Figure 3.10 - 802.11 I/O Settings Check for Updates Again, second cycle.
b. If there are no more firmware updates, continue to step 15.
4. Click OK on the Check for Updates dialog.
5. Click Cancel on the I/O Settings dialog Settings tab (See Settings on page20). The ComProbe 802.11
will reset. Wait for a solid Activity LED on the ComProbe hardware .
6. Once the ComProbe 802.11 has reset, select I/O Settings from the Control Window Options menu.
7. Click on the I/O Settings dialog Firmware Update tab and then click on the Check for Updates
button. The Check for Updates dialog will appear.
Frontline 802.11 Hardware & Software User Manual 27
Page 34

TELEDYNE LECROY Chapter 3 Configuration Settings
Figure 3.11 - 802.11 I/O Settings Firmware Check For Updates, second cycle.
8. Click the Start Update button.
9. Again, when the update is complete, two situations can occur.
a. If there are more firmware updates the following dialog will be displayed. Click on OK and
continue to step 10.
Figure 3.12 - 802.11 I/O Settings Check for Updates Again, third cycle.
b. If there are no more firmware updates, continue to step 15.
10. Click OK on the Check for Updates dialog.
11. Click Cancel on the I/O Settings dialog Settings tab (See Settings on page20). The ComProbe 802.11
will reset. Wait for a solid Activity LED on the ComProbe hardware .
12. Once the ComProbe 802.11 has reset, select I/O Settings from the Control Window Options menu.
13. Click on the I/O Settings dialog Firmware Update tab and then click on the Check for Updates
button. The Check for Updates dialog will appear again.
28 Frontline 802.11 Hardware & Software User Manual
Page 35

Chapter 3 Configuration Settings TELEDYNE LECROY
Figure 3.13 - 802.11 I/O Settings Firmware Check For Updates, third cycle.
14. Click the Start Update button.
15. When the update is complete the OK button will be enabled. Click the OK button.
16. When the I/O Settings dialog appears, click the OK button. The ComProbe 802.11 will reset. Reset is
complete when the ComProbe 802.11 unit serial number appears in the Control Window Configuration
Information.
Figure 3.14 - ComProbe 802.11 Unit Reset Complete Indication
17. Remove power from the ComProbe 802.11 unit, and then reapply power. Wait until the Activity LED
comes back on and resume normal ComProbe operation. When the ComProbe 802.11 serial number
shows in the Control Window again, the firmware update is complete.
3.1.2.5 WiFi Security
With ComProbe 802.11, the WiFi decryption is not done in the datasource. It is done in the decoders, so you must
go to Set Initial Decoder Parameters to provide the security information to the decoder.
Frontline 802.11 Hardware & Software User Manual 29
Page 36

TELEDYNE LECROY Chapter 3 Configuration Settings
From the Control window, select SetInitial
Decoder Parameters... from the Options
menu.
In the Set Initial Decoder Parameters dialog,
select the Security tab. In the tab pane, select
the encryption method being using with your
device under test (DUT) by clicking on the radio
button in the Encrypted Data box.
There are three types of types of encrypted data on the security tab, each one
selectable via a radio button.
Table 3.1 - WiFi Encrypted Data Options
Option Description
WPA2
Bluetooth
AMP
Preshared
Key
Within the Set Initial Decoder Parameters... dialog Security tab, the fields available will depend on the
Encrypted Data option selected.
WPA2 (Wi-Fi Protected Access), and WEP (Wired Equivalent Privacy) data that is
transmitted over a 802.11 communications link. There are two values you have to enter for
the WPA2 and WEP to be decrypted properly.
Bluetooth
The
Mbps by using additional wireless radio technologies.
The pre-shared key is a 32-byte hex number.
alternative MAC/PHY (AMP) enables
Bluetooth
to support data rates up to 24
30 Frontline 802.11 Hardware & Software User Manual
Page 37

Chapter 3 Configuration Settings TELEDYNE LECROY
Note: When capturing both Bluetooth
and 802.11 data using the 802.11AMP
capture method, the ComProbe
software uses the link from the BR/EDR
connection. To automatically decode
802.11 AMP frames in this case, select
the Bluetooth AMP Encrypted Data,
but leave the Link Key field blank.
Table 3.2 - WiFi Encrypted Data Option Fields
Encrypted
Data
Option
Field Description
WPA2 WPA2
Bluetooth
AMP
PreShared
Key
Enter the required security data in to the active fields for the selected Encrypted Data option. Click the OK button
to set the decoder security parameters.
:
SSID
WEP
:
SSID
WEP
:
Passkey
BDR/EDR
Link Key
WEP
:
SSID
WEP
:
Passkey
Raw Hex
Key
WEP
:
SSID
WEP
:
Passkey
The station ID of the 802.11 communications link.
The station ID of the 802.11 communications link.
The shared passkey phrase used in communications.
Enter a hexadecimal value for the
Key.( See Note above).
The station ID of the 802.11 communications link.
The shared passkey phrase used in communications.
Enter a 32-byte hex number
The station ID of the 802.11 communications link.
The shared passkey phrase used in communications.
BR/EDR Link
Wi-Fi security settings are also presented in detail in the Decoder Parameters section (See Wi-Fi Security Decoder
Parameters on page40).
Frontline 802.11 Hardware & Software User Manual 31
Page 38

TELEDYNE LECROY Chapter 3 Configuration Settings
3.1.2.6 Device Scanner
3.1.2.6.1 Wi-Fi Device Scanner
1. On the I/O Settings dialog click on the Settings tab, and then click on the Scanner button. The Wi-Fi
Device Scanner dialog will open.
Figure 3.15 - 802.11 Device Scanner with no Devices Detected
2. On the Wi-Fi Device Scanner dialog Select the Start button or select Start Scanning from the
Control menu to begin populating the list .
The Wi-Fi Device Scanner dialog displays a list of discoverable Wi-Fi devices in a table. The devices are
identified by:
l MAC Address
l SSID
l Type
l Channel
l Frequency
l RSSI
l First Seen
l Last Seen
Note: You can select the Stop or Stop Scanning from the Configure menu anytime
to stop the device search.
32 Frontline 802.11 Hardware & Software User Manual
Page 39

Chapter 3 Configuration Settings TELEDYNE LECROY
Figure 3.16 - 802.11 Device Scanner with Devices Detected
3. Select the device.
4. Click on Select channel <no>, where
<no> is the channel number selected.
The Confirm Sniffing Channel
confirmation will appear. Click on Yes
will close the Wi-Fi Device Scanner
and the ComProbe analyzer will used the
selected channel.
File Menu
Under the File menu you can select Export to file which converts the information in the table to a text file.
1. Select Export to CSV file. The Save As menu appears
2. Select where you want to save the file in Save in.
3. Enter a File Name.
4. Select Save.
Configure
From the Configure menu you can select , ,Hardware Settings and I/O Settings
3.1.2.6.2 Wi-Fi Scanner Hardware Settings
The Hardware Settings dialog provides the ability to select a device to sniff/scan. The dialog only lists devices with
a MAC address that match the Frontline devices. To access the Hardware Settings dialog:
1. Select Hardware Settings from the Options menu on the 802.11 Control window.
Frontline 802.11 Hardware & Software User Manual 33
Page 40

TELEDYNE LECROY Chapter 3 Configuration Settings
Figure 3.17 - Wi-Fi Scanner Hardware Settings Dialog
2. Select a device from the drop-down list.
3. Select OK
If no devices are found, the list is blank.
Note: Upon launching the Air Sniffer, the first device in the drop-down is the default device.
3.1.2.6.3 Wi-Fi Device Scanner - I/O Settings
The Device Scanner I/O Settings dialog is used to set a listening time and to activate a probe request. To access the
I/O Settings dialog:
1. Select I/O Settings from the Configure menu on the Wi-Fi Device Scanner window.
Figure 3.18 - Wi-Fi Device Scanner I/O Settings Dialog
2. Scan Channels from: Pick a lower and upper limit to scan a specific subset of frequencies. By default all
channels are selected. Choosing a subset of frequencies to scan saves time and can be used when the user
is interested in scanning only a certain range of frequencies.
3. Enter an amount, in msecs, for Channel listen time.
Channel listen time is how long Frontline®802.11 will listen on a channel to discover devices before
moving on to the next channel.
4. Select Yes or No to choose whether to send a probe sync request.
34 Frontline 802.11 Hardware & Software User Manual
Page 41

Chapter 3 Configuration Settings TELEDYNE LECROY
Sometimes an Access Point will intentionally not send it’s SSID in a beacon to conceal it’s identity. Selecting
Yes for this option will send the MAC address, the SSID will be part of the Probe Response it sends back.
5. Select OK to save the options and close the dialog or Cancel to close the dialog without saving your
choices.
3.1.2.6.4 Device Scanner RSSI Values
The 802.11 specification does not provide a relationship between the RSSI value and the actual power value. Here
are the definitions from the specification.
1. RSSI in FHSS PHY: The RSSI is an optional parameter that has a value of 0 through RSSI Max. This parameter
is a measure by the PHY of the energy observed at the antenna used to receive the current PPDU. RSSI
shall be measured between the beginning of the SFD and the end of the PLCP HEC. RSSI is intended to be
used in a relative manner. Absolute accuracy of the RSSI reading is not specified.
2. RSSI in DSSS PHY: The RSSI shall be a measure of the RF energy received by the DSSS PHY. RSSI indications
of up to 8 bits (256 levels) are supported.
3. RSSI in OFDM PHY: The allowed values for the RSSI parameter are in the range from 0 through RSSI
maximum. This parameter is a measure by the PHY of the energy observed at the antenna used to receive
the current PPDU. RSSI shall be measured during the reception of the PLCP preamble. RSSI is intended to
be used in a relative manner, and it shall be a monotonically increasing function of the received power.
Different vendors implement these value in their own way. The ComProbe 802.11 uses an Atheros chipset which
provides RSSI values in the range of 0 to 128. The radio hardware in the ComProbe 802.11 has two receive chains
(one for each antenna). Each received packet has RSSI values for both antennas as well as the combined value.
The hardware provides the following five values:
1. rssi_ant00: Receive signal strength indicator of control channel chain 0.
2. rssi_ant01: Receive signal strength indicator of control channel chain 1.
3. rssi_ant10: Receive signal strength indicator of extension channel chain 0.
4. rssi_ant11: Receive signal strength indicator of extension channel chain 1
5. rssi_combined: Receive signal strenth indicator of combination of all active chains on the control and
extension channels.
All five of these values are shown in the PHY layer decoder for every packet. The Wi-Fi scanner shows the
combined value.
3.1.3 Wi-Fi Device - MAC Address Editor
If you know the MAC Address of the device you can enter it manually.
1. From the I/O Settings dialog select the "Edit" button.
2. On the MAC Address Editor enter the MAC Address for the device.
Frontline 802.11 Hardware & Software User Manual 35
Page 42

TELEDYNE LECROY Chapter 3 Configuration Settings
Figure 3.19 - Wi-Fi Direct MAC Address Editor
3. Enter a channel number in Listen Channel.
4. Select "OK".
The MAC Address appears on the I/O Settings dialog.
Once you close the dialog, the last MAC Address shown will appear when you reopen the dialog.
3.2 Decoder Parameters
Some protocol decoders have user-defined parameters. These are protocols where some information cannot be
discovered by looking at the data and must be entered by the user in order for the decoder to correctly decode
the data. For example, such information might be a field where the length is either 3 or 4 bytes, and which length
is being used is a system option.
There may be times when the context for decoding a frame is missing. For example, if the analyzer captures a
response frame but does not capture the command frame, then the decode for the response may be incomplete.
The Set Initial Decoder Parameters window allows you to supply the context for any frame. The dialog allows
you to define any number of parameters and save them in a template for later use
The decoder template function provides the capacity to create multiple templates that contain different
parameters. This capability allows you to maintain individual templates for each Bluetooth® network monitored.
Applying a template containing only those parameters necessary to decode transmissions particular to an
individual network, enhances the efficiency of the analyzer to decode data.
If you have decoders loaded which require decoder parameters, a window with one tab for every decoder that
requires parameters appears the first time the decoder is loaded.
For help on setting the parameters, click the Help button on each tab to get help information specific to that
decoder.
If you need to change the parameters later,
l Choose Set Initial Decoder Parameters... from the Options menu on the Control and Frame Display
windows.
36 Frontline 802.11 Hardware & Software User Manual
Page 43

Chapter 3 Configuration Settings TELEDYNE LECROY
Figure 3.20 - Select Set Initial Decoder Parameters... from Control window
The Set Initial Decoder Parameters window opens with a tab for each decoder that requires parameters.
Figure 3.21 - Tabs for each decoder requiring parameters.
l Each entry in the Set Initial Decoder Parameters window takes effect from the beginning of the capture
onward or until redefined in the Set Subsequent Decoder Parameters dialog.
Override Existing Parameters
The Set Subsequent Decoder Parameters dialog allows the user to override an existing parameter at any
frame in the capture where the parameter is used.
If you have a parameter in effect and wish to change that parameter
l Select the frame where the change should take effect
l Select Set Subsequent Decoder Parameters... from the Options menu, and make the needed
changes. You can also right-click on the frame to select the same option.
Frontline 802.11 Hardware & Software User Manual 37
Page 44

TELEDYNE LECROY Chapter 3 Configuration Settings
Figure 3.22 - Set Subsequent Decoder Parameters... from Control window
Figure 3.23 - Example: Set Subsequent Decode for Frame #52, RFCOMM
l Each entry in the Set Subsequent Decoder Parameters dialog takes effect from the specified frame
onward or until redefined in this dialog on a later frame.
l The Remove Override button will remove the selected decode parameter override.
l The Remove All button will remove all decoder overrides.
If you do not have decoders loaded that require parameters, the menu item does not appear and you don't need
to worry about this feature.
3.2.1 Decoder Parameter Templates
3.2.1.1 Select and Apply a Decoder Template
38 Frontline 802.11 Hardware & Software User Manual
Page 45

Chapter 3 Configuration Settings TELEDYNE LECROY
1.
Select Set Initial Decoder Parameters... from the Options menu on the Control window or
the Frame Display window.
2.
Click the Open Template icon in the toolbar and select the
desired template from the pop up list. The system displays the content
of the selected template in the Initial Connections list at the top of the
dialog
3. Click the OK button to apply the selected template and decoders'
settings and exit the Set Initial Decoder Parameters dialog.
3.2.1.2 Adding a New or Saving an Existing Template
Add a Template
A template is a collection of parameters required to completely decode communications between multiple
devices. This procedure adds a template to the system and saves it for later use:
1.
Click the Save button at the top of the Set Initial
Decoder Parameters dialog to display the Template
Manager dialog.
2. Enter a name for the new template and click OK.
The system saves the template and closes the Template
Manager dialog.
3. Click the OK button on the Set Initial Decoder Parameters
window to apply the template and close the dialog.
Save Changes to a Template
This procedure saves changes to parameters in an existing template.
1.
After making changes to parameter settings in a user defined template, click the Save button at the
top of the Set Initial Decoder Parameters window to display the Template Manager dialog.
2. Ensure that the name of the template is listed in the Name to Save Template As text box and click OK.
3. The system displays a dialog asking for confirmation of the change to the existing template. Click the Yes
button.
The system saves the parameter changes to the template and closes the Save As dialog.
4. Click the OK button on the Set Initial Decoder Parameters window to apply the template and close
the window.
Frontline 802.11 Hardware & Software User Manual 39
Page 46

TELEDYNE LECROY Chapter 3 Configuration Settings
3.2.1.3 Deleting a Template
1.
After opening the Set Initial Decoder Parameters window click the Delete button in the toolbar.
The system displays the Template Manager dialog with a list of saved templates.
2. Select (click on and highlight) the template marked for deletion and click the Delete button.
The system removes the selected template from the list of saved templates.
3. Click the OK button to complete the deletion process and close the Delete dialog.
4. Click the OK button on the Set Initial Decoder Parameters window to apply the deletion and close
the dialog.
3.2.2 Wi-Fi Security Decoder Parameters
On the Set Initial Decoder Parameters dialog, the security tab allows specifying a key for software decryption of
802.11 frames.
To access this dialog:
1. In the Options menu on the Control window and choose Set Initial Decoder Parameters.
2. Select the Security tab.
There are three types of types of encrypted data on the security tab, each one selectable via a radio button.
Table 3.3 - WiFi Encrypted Data Options
Option Description
WPA2
Bluetooth
AMP
Preshared
Key
Depending on which Encrypted Data type you select, the options for entering data on the rest of the dialog
varies.
WPA2 (Wi-Fi Protected Access), and WEP (Wired Equivalent Privacy) data that is
transmitted over a 802.11 communications link. There are two values you have to enter for
the WPA2 and WEP to be decrypted properly.
Bluetooth
The
Mbps by using additional wireless radio technologies.
The pre-shared key is a 32-byte hex number.
alternative MAC/PHY (AMP) enables
Bluetooth
Note: When capturing both Bluetooth
and 802.11 data using the 802.11AMP
capture method, the ComProbe
software uses the link from the BR/EDR
connection. To automatically decode
802.11 AMP frames in this case, select
the Bluetooth AMP Encrypted Data,
but leave the Link Key field blank.
to support data rates up to 24
40 Frontline 802.11 Hardware & Software User Manual
Page 47

Chapter 3 Configuration Settings TELEDYNE LECROY
Table 3.4 - WiFi Encrypted Data Option Fields
Encrypted
Data
Option
Field Description
WPA2 WPA2
SSID
WEP
SSID
WEP
Passkey
Bluetooth
AMP
PreShared
Key
BDR/EDR
Link Key
WEP
SSID
WEP
Passkey
Raw Hex
Key
WEP
SSID
WEP
Passkey
:
The station ID of the 802.11 communications link.
:
:
:
:
:
:
The station ID of the 802.11 communications link.
The shared passkey phrase used in communications.
A hexadecimal value for the
(See note See Note on the previous page).
The station ID of the 802.11 communications link.
The shared passkey phrase used in communications.
Enter a 32-byte hex number
The station ID of the 802.11 communications link.
The shared passkey phrase used in communications.
BR/EDR Link Key
.
Figure 3.24 - Decoder WiFi Security Tab
Frontline 802.11 Hardware & Software User Manual 41
Page 48

TELEDYNE LECROY Chapter 3 Configuration Settings
3.2.3 Adding or Changing TCP/UDP Port Assignments
TCP and UDP are Transport layer protocols in the IP protocol suite. These transport layer protocols use ports to
establish communication between application layer protocols. For example, all Web traffic uses the HTTP
protocol. HTTP is an application layer protocol that uses the standard TCP/UDP port 80. The Internet Assigned
Numbers Authority (IANA) is responsible for maintaining the list of standard port numbers and their assignments.
For an up-to-date listing of all standard TCP/UDP port assignments, visit www.iana.org.
When the analyzer reads a TCP, UDP or IPX packet, it infers the upper layer protocols by using pre-defined rules of
traversal. For example, if the packet has a TCP source or destination port number 80, then the upper layer
protocol is HTTP. These rules, which are built in to the software, determine the upper layers of the protocol stack
based on the source or destination port numbers in the packet. The built-in rules are based on the standard port
assignments. However, it is quite common to come across network systems in which upper layer protocols use
user-defined port numbers for both standard and custom protocols. In such cases, the analyzer users can tell the
software which port numbers are assigned to which protocols.
The analyzer autotraverses the stack from TCP, UDP and IPX based on the source or destination port number.
Many systems use user-defined port numbers for both standard and custom protocols. Here’s how to tell the
analyzer about a custom port assignment on the system you are monitoring.
Add a New Port Assignment
1.
Choose Set Initial Decoder Parameters from the Options menu on the Control window.
2. Click the TCP tab (or UDP or IPX for those protocols).
3. Choose the Single Port radio button
4. Enter the port number in the Port Number box.
5. In the Protocol drop-down list, choose the protocol to traverse to.
6. Click the Add button.
The system adds the new entry to the bottom of the port number list.
Modify an Existing Port Assignment
1. Choose Set Initial Decoder Parameters from the Options menu on the Control window.
2. Click the TCP tab (or UDP or IPX for those protocols).
3. Select (click on and highlight) the port assignment to modify.
4. Change the port number and/or choose the protocol to traverse to.
5. Select the Port Range radio button and specify the starting and ending port numbers. The range is
inclusive.
6. Click the Modify button.
The system displays the changes in port assignment.
42 Frontline 802.11 Hardware & Software User Manual
Page 49

Chapter 3 Configuration Settings TELEDYNE LECROY
Delete a Port Assignment
1. Choose Set Initial Decoder Parameters from the Options menu on the Control window.
2. Click the TCP tab (or UDP or IPX for those protocols).
3. Select (click on and highlight) the port assignment to delete.
4. Select Delete.
The system deletes the port assignment.
Move a Port Assignment
If you need to move an entry to ensure it is processed before or after another entry, select the entry in the list
and then click the Move Up or Move Down buttons.
Port Assignment Considerations
l The analyzer traverses an entry if either the source or destination port match.
l The analyzer processes port number entries in order from top to bottom.
3.2.4 Determining Master and Slave
In Bluetooth , the device that initiates the connection is always the master at connection time. You only need to
know the master and slave at connection time when setting up the I/O Settings. Afterward a role switch may
occur, but the analyzer automatically follows the role switch.
Note: You do not have to identify a Master address if you are using Firmware Version 62 or
newer.
Role Switches
After the connection has been made, a role switch can take place. A good example of why this happens would be
when a mouse connects to the PC. The mouse initiates the connection, so it is the master. After the connection is
made, a role switch occurs so that the PC becomes the master and the mouse becomes a slave. The role switch
takes place because the PC may be working with multiple devices at the same time, and as such, the PC would not
be a slave of more than one device.
Let us say that a link exists between a PC and a keyboard with the PC a master. If the mouse wants to become a
member of the link it initiates the connection. Since the mouse initiated the connection, it is the master of a new
link and the PC is the slave. The PC is still the master of the link between the PC and keyboard. A role switch now
occurs between the PC and the mouse, and the PC is now the master of a link with two slaves: the mouse and
keyboard.
3.3 Conductive Testing
Conductive testing could be used for many reasons, but the most common use is to isolate the Wi-Fi test setup
from the surrounding environment. Interference from radio frequency (RF) sources is the most common reason
for isolating the test from the environment. This is especially important when the environment contains RF
sources using the industrial, scientific, and medical (ISM) radio bands from 2.4 to 2.485 GHz that are the bands
used for Wi-Fi.
“Conductive” in this context means that you are not “air sniffing”, that is, capturing Wi-Fi transmissions on the
Frontline analyzer's antenna. The conductive test setup uses coaxial cable to directly connect the Device Under
Frontline 802.11 Hardware & Software User Manual 43
Page 50

TELEDYNE LECROY Chapter 3 Configuration Settings
Test (DUT) to the analyzer's antenna connectors. The coaxial cable provides the isolation from the environment
through shielding.
3.3.1 802.11 WiFi Conductive Testing
“Conductive” in this context means that you are not “air sniffing”, that is, capturing 802.11 transmissions on the
ComProbe 802,11 analyzer antenna. The conductive test setup uses coaxial cable to directly connect the DUT
(Device Under Test) to the analyzer antenna connectors. The coaxial cable provides the isolation from the
environment through shielding.
Test Equipment
The following equipment is required for the test setup. All cables, connectors and adapters, and attenuators
should be relatively flat from 2 GHz to 6 GHz.
1. Coaxial cable All cable must be 50Ω and should be double shielded.
2. Coaxial T-connectors, 50Ω.
3. RP.SMA adapters for connecting coaxial cable or attenuators to the antenna connectors, 50Ω.
4. AT1 - AT9: 20 dB attenuators, 50Ω.
5. Frontline 802.11 WiFi protocol analyzer.
6. Computer for running Frontline software.
Test Setup
Figure 3.25 below shows the 802,11 conductive test setup.
Figure 3.25 - Frontline 802.11 Conductive Test Setup for 3X3 MIMO
44 Frontline 802.11 Hardware & Software User Manual
Page 51

Chapter 3 Configuration Settings TELEDYNE LECROY
The above test setup if for 3X3 MIMO 802.11 devices. If not testing this configuration, the ANT3 connection to the
DUTs and the ComProbe 802.11 is not used.
Test Process
After connecting DUT1, DUT2, and the Frontline 802.11 , follow these steps to capture WiFi data.
1. Establish data transmission between DUT 1 and DUT 2.
2. Begin capture of the data with the Frontline 802.11 .
3. Conduct protocol analysis with the Frontline software on the personal computer or save the capture file
for future analysis.
Frontline 802.11 Hardware & Software User Manual 45
Page 52

TELEDYNE LECROY Chapter 3 Configuration Settings
46 Frontline 802.11 Hardware & Software User Manual
Page 53

Chapter 4 Capturing and Analyzing Data
The following sections describe the various ComProbe software functions that capture and display data packets.
4.1 Capture Data
4.1.1 Air Sniffing: Positioning Devices
When capturing over the air packets, proper positioning of the Frontline hardware and the Devices Under Test
(DUTs) will result in the best possible captures and will mitigate sources of path loss and interference. The
following procedures will help optimize the capture process especially if you are have problems obtaining reliable
…captures.
Problems with indoor radio propagation
Even in free space, it is well understood that radio frequencies attenuate over distance. The free-space rule-ofthumb dictates that radio energy decreases in strength by 20 dB by each 10-to-1 increase in range. In the realworld, the effects of objects in an outdoor environment cause reflection, diffraction, and scattering resulting in
greater signal losses. Indoors the situation can be worse. Reflections occur from walls and other large flat surfaces.
Diffraction occurs from objects with sharp edges. Scattering is produced from objects with rough surfaces and
from small objects. Also any object directly in the path of the radiation can present a hard or soft partition
depending on the partition's material properties. Path losses from partitions are difficult to estimate.
Estimating indoor propagation loss
One estimate of indoor path loss, based on path loss data from a typical building, provides a power rule.
At 2.4 GHz, the following relationship provides an approximate estimate of indoor path loss:
This approximation is expected to have a variance of 13 dB.
Mitigating path loss and interference
Bluetooth device design contributes to mitigating environmental effects on propagation through spread spectrum
radio design, for example. However, careful planning of the testing environment can also contribute to reliable
data capture process.
Frontline 802.11 Hardware & Software User Manual 47
Page 54

TELEDYNE LECROY Chapter 4 Capturing and Analyzing Data
The first step to ensuring reliable air-sniffing data capture is to understand the RF characteristics of the Devices
Under Test (DUTs). The Bluetooth Class, antenna types, and radiation patterns are all important factors that can
affect the placement of the DUTs and the Frontline hardware. Radiation patterns are rarely spherical, so
understanding your device's radiation patterns can greatly enhance successful data capture. Position devices to
avoid radiation attenuation by the surroundings.
This step is optional: Consider conductive testing to establish a baseline capture. Conductive testing isolates the
DUTs and analyzer from environmental effects.
The next step is to ensure that the testing environment is as clutter-free as possible.
l Line-of-sight obstructions should be eliminated between the Frontline hardware and the DUTs because they
cause a reduction in signal strength. Obstructions include, but are not limited to: water bottles, coffee cups,
computers, computer screens, computer speakers, and books. A clear, unobstructed line-of-sight is preferred
for DUT and Frontline hardware positioning.
l If using an analyzer connected to a computer, position the computer on an adjacent table or surface away
from the analyzer and DUTs, taking advantage of the cables' length. If this is not possible, position the
computer behind the analyzer as far away as possible. If using the Frontline FTS4BT, which is a dongle, either
use an extension USB cable or position the computer such that the dongle is positioned towards the DUTs.
l The preferred placement is positioning the DUTs and the Frontline hardware at the points of an equilateral
triangle in the same horizontal plane, i.e. placed on the same table or work surface. The sides of the triangle
should be between 1 and 2 meters for Bluetooth transmitter classes 1 and 2. The distance for transmitter class
3 should be 1/2 meter.
Figure 4.1 - Devices Equally Spaced in the Same Horizontal Plane
Finally, eliminate other RF sources.
l Wi-Fi interference should be minimized or eliminated. Bluetooth shares the same 2.4 GHz frequency bands as
Wi-Fi technology. Wi-Fi interference can cause loss of packets and poor captures. In a laboratory or testing
48 Frontline 802.11 Hardware & Software User Manual
Page 55

Chapter 4 Capturing and Analyzing Data TELEDYNE LECROY
environment do not place the DUTs and Frontline hardware in close proximity with Wi-Fi transmitting sources
such as laptops or routers. Turning off Wi-Fi on the computer running the Frontline software is recommended.
Poor Placement
A poor test configuration for the analyzer is placing the DUTs very close to each other and the analyzer far away.
The DUTs, being in close proximity to each other, reduce their transmission power and thus make it hard for the
analyzer to hear the conversation. If the analyzer is far away from DUTs, there are chances that the analyzer may
miss those frames, which could lead to failure in decryption of the data.
Obstacles in close proximity to or in between the analyzer and the DUTs can interfere and cause reduction in
signal strength or interference. Even small objects can cause signal scattering.
Figure 4.2 - Example: Poor Capture Environment
4.1.2 Capturing Data to Disk - General Procedure
Note: Capture is not available in Viewer mode.
1.
Click the Start Capture button to begin capturing to a file. This icon is located on the Control ,
Event Display, and Frame Display windows.
2. Files are placed in My Capture Files by default and have a .cfa extension. Choose Directories from the
Options menu on the Control window to change the default file location.
Note: For the Dashboard, when you capture to series of files, the window displays the
data from the beginning of the first capture, even when a new file in the series is
created. This is because the Dashboard is a "Session Monitor", which means that
even if you capture to a series of files, the data from the first file is always displayed.
The display does not refresh when a new capture file in a series is created.
Frontline 802.11 Hardware & Software User Manual 49
Page 56

TELEDYNE LECROY Chapter 4 Capturing and Analyzing Data
3. Watch the status bar on the Control window to monitor how full the file is. When the file is full, it begins
to wrap, which means the oldest data will be overwritten by new data.
4.
Click the Stop Capture icon to temporarily stop data capture. Click the Start Capture icon again to
resume capture. Stopping capture means no data will be added to the capture file until capture is
resumed, but the previously captured data remains in the file.
5.
To clear captured data, click the Clear icon .
l If you select Clear after selecting Stop Capture, a dialog appears asking whether you want to save
the data.
o
You can click Save File and enter a file name when prompted .
o
If you choose Do Not Save, all data will be cleared.
o
If you choose Cancel, the dialog closes with no changes.
l If you select the Clear icon while a capture is occurring:
o
The capture stops.
o
A dialog appears asking if you want to save the capture
o
You can select Yes and save the capture or select No and close the dialog. In either case, the
existing capture file is cleared and a new capture file is started.
o
If you choose Cancel, the dialog closes with no changes.
To see how to capture to a single file, choose System Settings from the Options menu on the Control window.
When live capture stops, no new packets are sniffed but there can still be packets that were previously sniffed but
not yet read by the ComProbe analyzer. This happens when packets are being sniffed faster than the ComProbe
analyzer can process them. These packets are stored either on the ComProbe hardware itself or in a file on the
PC. If there are remaining packets to be processed when live capture stops the Transferring Packets dialog
below is displayed showing the packets yet to be read by the ComProbe analyzer. The dialog shows the name of
each ComProbe hardware device, its process id in square brackets, and the number of packets remaining. These
stored packets are read until they’re exhausted or the user clicks the Discard button on the dialog.
Unlike 802.11, Bluetooth packets never come in faster than the datasource can process them. However, Bluetooth
packets must still be stored so that they can be read in chronological order with the 802.11 packets.
50 Frontline 802.11 Hardware & Software User Manual
Page 57

Chapter 4 Capturing and Analyzing Data TELEDYNE LECROY
Figure 4.3 - Packet Transfer Dialog
4.1.2.1 Frontline®802.11 with Wireshark
4.1.3 Capturing Using Frontline Wi-Fi Datasource with Wireshark
Note: This topic is provided as a courtesy to our customers who want to use Wireshark in
conjunction with the ComProbe 802.11 although the ComProbe software is fully capable of
performing the same functions as Wireshark. Frontline does not support or maintain third party
products. Should you have difficulty with your Wireshark product contact the manufacturer for
support or maintenance.
Click on the "ComProbe 802.11 with Wireshark" short cut to launch and start capturing the Wi-Fi packets. If you do
not see any packets on the Wireshark window then check the status message indication on the Wi-Fi
Datasource window to see if sniffing has stopped. Click on the Start button .
®
®
Frontline 802.11 Hardware & Software User Manual 51
Page 58

TELEDYNE LECROY Chapter 4 Capturing and Analyzing Data
Figure 4.4 - Datasource Stopped Sniffing
When the ComProbe 802.11 is sniffing the datasource will display the following message. Sniffing can be stopped
by clicking the Stop button .
Figure 4.5 - Datasource Sniffing
Figure 4.6 - Wireshark Capture Dialog
52 Frontline 802.11 Hardware & Software User Manual
Page 59

Chapter 4 Capturing and Analyzing Data TELEDYNE LECROY
Note: Whenever you give Start Capture command on Wireshark, the status message on the
Wi-Fi Datasource window should display "Please START capturing on the Wireshark." If it is
displaying a different message then you can use the Reset button on the Wi-Fi Datasource
window or select Reset or in the Sniffing menu to get back to this message.
Figure 4.7 - Wi-Fi Datasource Toolbar
Figure 4.8 - Wi-Fi Datasource Sniffing Menu
Once the Wi-Fi Datasource starts capturing packets and sending them to Wireshark, you can pause and resume
capturing using the Stop and Start toolbar buttons on the Wi-Fi Datasource toolbar or the Sniffing
menu. Note that the Restart command on the Wireshark window does not function. The workaround is to click
Reset on the Wi-Fi Datasource then click Start on the Wireshark Capture menu. Also the Wireshark
Capture Filters menu does not function, but you can use IO Settings menu on the Wi-Fi Datasource window or
Sniffing menu for setting filters.
Known Issues with Wireshark
l In Real Time capture mode (when you select Update list of packets in real time check-box in the Capture
Options dialog), if you move the Wireshark window around on the desktop or click on anything on the
Wireshark window, it freezes the desktop. You can unfreeze it by bringing up Windows Task Manager by
pressing Ctrl+Alt+Delete.
Frontline 802.11 Hardware & Software User Manual 53
Page 60

TELEDYNE LECROY Chapter 4 Capturing and Analyzing Data
Figure 4.9 - Wireshark Capture Options
l If you capture more than a few millions of packets, e.g. 4 million, Wireshark crashes.
4.1.4 Combining BPA 600, 802.11, and HSU with ProbeSync
ProbeSync™ allows multiple ComProbe analyzers to work seamlessly together and to share a common clock.
Clock sharing allows the analyzers to precisely synchronize communications stream and to display resulting
packets in a single shared view.
The ComProbe BPA 600, ComProbe 802.11, and ComProbe HSU analyzers have ProbeSync capability allowing
timestamp synchronization of captured data. Synchronizing the clock for these ComProbe devices used in
combination requires attention to the sequence of hardware connection. It is important to remember the
following key points.
l ComProbe devices are connected serially in a daisy-chain fashion. The combined length of all cables in the
chain cannot exceed 1.5 meters (4.5 ft.).
l The "master" ComProbe device provides the clock to the other devices. All other ComProbe devices are
"slaves" and received the clock from the "master" device.
l On ComProbe devices with an OUT and IN connector, the function of these connectors is dependent on if
they are a "master" or a "slave".
o
"master" device: OUT connector provides the clock to all "slave" devices. IN connector is not used.
o
"slave" device: IN connector receives the clock from the OUT connector of the prior device in the chain.
The OUT connector is just a pass-through connector on a "slave" device.
l BPA 600 is always the "master" device and the first device in the chain, if being used.
l HSU is always the last "slave" device in the chain, if being used.
l HSU maximum capture data rate is 6 Mbit/sec.
54 Frontline 802.11 Hardware & Software User Manual
Page 61

Chapter 4 Capturing and Analyzing Data TELEDYNE LECROY
Connecting ComProbe BPA 600, ComProbe 802.11, and ComProbe HSU devices in ProbeSync takes place in the
following steps.
1. Connect the ComProbe BPA 600 OUT connector to the ComProbe 802.11 IN connector.
2. Connect the ComProbe HSU Cat 5 cable to the ComProbe 802.11 OUT connector.
Each device datasource is setup individually to sniff their respective link. That is, you will see a separate
datasource window for the BPA 600 device, the 802.11 device, and the HSU device.
Data saved as a capture file will include data captured on each device.
Should the hardware be connected incorrectly, that is IN to IN or OUT to OUT, an error message will appear.
Follow the instructions in error message. To continue click on the OK button. The ComProbe device datasource
Status window will also display a warning message suggesting information sources.
Figure 4.10 - Incorrect ProbeSync Hardware Connection Error
Figure 4.11 - Incorrect ProbeSync Hardware Connection Message In Datasource Status
The BPA 600 datasource dialog Start Sniffing button initiates the capture for all connected ComProbe
802.11 and HSU devices. On the 802.11 and HSU receiving the clock—cable connected to IN— the Start
Sniffing button is disabled when using ProbeSync. In each ComProbe device's Control window status window
will announce the synchronizing function.
Frontline 802.11 Hardware & Software User Manual 55
Page 62

TELEDYNE LECROY Chapter 4 Capturing and Analyzing Data
Figure 4.12 - ProbeSync Synchronizing Device Status Message
Figure 4.13 - ProbeSync Synchronized Device Status Message
Data captured in the synchronized device will appear in the Frame Display, Event Display, Bluetooth
Timeline, Bluetooth low energy Timeline, and Coexistence View.
4.1.5 Sodera & 802.11: Capturing with ProbeSync
ProbeSync allows Frontline Sodera and 802.11 hardware to work seamlessly together and to share a common
clock. Clock sharing allows the analyzers to precisely synchronize communications streams and to display resulting
packets in a single shared view.
When configured for synchronization through ProbeSync, one Sodera device provides the clock to the other
device. The clock is provided by a provided CAT 5 cable between the master Sodera PROBESYNC OUT
connector—sending the synchronizing clock—to the slave device hardware ProbeSync IN connector—receiving
the clock.
When the Frontline software runs in ProbeSync mode, only the Sodera Control window and Sodera datasource
window will appear. Should the hardware be connected incorrectly, that is IN to IN or OUT to OUT, an error
message will appear in the Event Log pane.
Figure 4.14 - Incorrect ProbeSync Hardware Connection Message
The Sodera datasource window Record button initiates the capture for both devices.
Data captured in the synchronized device will appear in the Frame Display, Event Display, Bluetooth
Timeline, Bluetooth low energy Timeline, and Coexistence View. Data saved as a capture file during
analysis will include data captured on both devices.
4.1.6 Extended Inquiry Response
Extended Inquiry Response (EIR) is a tab that appears automatically on the Frame Display window when
you capture data.
56 Frontline 802.11 Hardware & Software User Manual
Page 63

Chapter 4 Capturing and Analyzing Data TELEDYNE LECROY
Figure 4.15 - Frame Display Extended Inquire Response
EIR displays extensive information about the Bluetooth® devices that are discovered as data is being captured. EIR
provides more information during the inquiry procedure to allow better filtering of devices before connection;
and sniff subrating, which reduces the power consumption in low-power mode.Before the EIR tab was created,
this type of information was not available until a connection was made to a device. Therefore, EIR can be used to
determine whether a connection can/should be made to a device prior to making the connection.
Note: If a Bluetooth device does not support Extended Inquiry Response, the tab displays
Received Signal Strength Indication (RSSI) data, which is less extensive than EIR data.
4.2 Protocol Stacks
Frontline 802.11 Hardware & Software User Manual 57
Page 64

TELEDYNE LECROY Chapter 4 Capturing and Analyzing Data
4.2.1 Protocol Stack Wizard
The Protocol Stack wizard is where you define the
protocol stack you want the analyzer to use when
decoding frames.
To start the wizard:
1. Choose Protocol Stack from the Options
menu on the Control window or click the
Protocol Stack icon on the Frame
Display.
2. Select a protocol stack from the list, and click
Finish.
Most stacks are pre-defined here. If you have special
requirements and need to set up a custom stack, see
Creating and Removing a Custom Stack on page 59.
1. If you select a custom stack (i.e. one that was defined by a user and not included with the analyzer), the
Remove Selected Item From List button becomes active.
2. Click the Remove Selected Item From Listbutton to remove the stack from the list. You cannot
remove stacks provided with the analyzer. If you remove a custom stack, you need to define it again in
order to get it back.
If you are changing the protocol stack for a capture file, you may need to reframe. See Reframing on page 60 for
more information.
You cannot select a stack or change an existing one for a capture file loaded into the Capture File Viewer (the
Capture File Viewer is used only for viewing capture files and cannot capture data). Protocol Stack changes can
only be made from a live session.
58 Frontline 802.11 Hardware & Software User Manual
Page 65

Chapter 4 Capturing and Analyzing Data TELEDYNE LECROY
4.2.2 Creating and Removing a Custom Stack
To create a custom stack:
1. Choose Protocol Stack from the
Options menu on the Control
window or click the Protocol Stack
icon on the Frame Display
toolbar.
2. Select Build Your Own from the list
and click Next.
3. The system displays an information
screen that may help you decide if you
need to define your own custom stack.
Defining a custom stack means that the
analyzer uses the stack for every
frame. Frames that do not conform to
the stack are decoded incorrectly.
Click Next to continue.
Select Protocols
1. Select a protocol from the list on the
left.
2. Click the right arrow button to move it
to the Protocol Decode Stack box
on the right, or double-click the
protocol to move it to the right.
3. To remove a protocol from the stack,
double-click it or select it and click the
left arrow button.
4. If you need to change the order of the
protocols in the stack, select the
protocol you want to move, and click
on the Move Up and Move Down buttons until the protocol is in the correct position.
5. The lowest layer protocol is at the top of the list, with higher layer protocols listed underneath.
Auto-traversal (Have the analyzer Determine Higher Layers)
If you need to define just a few layers of the protocol stack, and the remaining layers can be determined based on
the lower layers:
1. Click the All additional stack layers can be determined automatically button.
2. If your protocol stack is complete and there are no additional layers, click the There are no additional
stack layers button.
Frontline 802.11 Hardware & Software User Manual 59
Page 66

TELEDYNE LECROY Chapter 4 Capturing and Analyzing Data
3. If you select this option, the analyzer uses the stack you defined for every frame. Frames that do use this
stack are decoded incorrectly.
Save the Stack
1. Click the Add To Predefined List button.
2. Give the stack a name, and click Add.
In the future, the stack appears in the Protocol Stack List on the first screen of the Protocol Stack wizard.
Remove a Stack
1. Select it in the first screen and click Remove Selected Item From List.
2. If you remove the stack, you must to recreate it if you need to use it again.
Note: If you do not save your custom stack, it does appear in the predefined list, but applies to
the frames in the current session. However, it is discarded at the end of the session.
4.2.3 Reframing
If you need to change the protocol stack used to interpret a capture file and the framing is different in the new
stack, you need to reframe in order for the protocol decode to be correct. You can also use Reframe to frame
unframed data. The original capture file is not altered during this process.
Note: You cannot reframe from the Capture File Viewer .
To reframe your data, load your capture file, select a protocol stack, and then select Reframe from the File
menu on the Control window. Reframe is only available if the frame recognizer used to capture the data is
different from the current frame recognizer.
In addition to choosing to Reframe, you can also be prompted to Reframe by the Protocol Stack Wizard.
1. Load your capture file by choosing Open from the File menu on the Control window, and select the file
to load.
2. Select the protocol stack by choosing Protocol Stack from the Options menu on the Control window,
select the desired stack and click Finish.
3. If you selected a protocol stack that includes a frame recognizer different from the one used to capture
your data, the Protocol Stack Wizard asks you if you want to reframe your data. Choose Yes.
4. The analyzer adds frame markers to your data, puts the framed data into a new file, and opens the new
file. The original capture file is not altered.
See Unframing on page 60for instructions on removing framing from data.
4.2.4 Unframing
This function removes start-of-frame and end-of-frame markers from your data. The original capture file is not
altered during this process. You cannot unframe from the Capture File Viewer (accessed by selecting Capture File
60 Frontline 802.11 Hardware & Software User Manual
Page 67

Chapter 4 Capturing and Analyzing Data TELEDYNE LECROY
Viewer or Load Capture File to start the software and used only for viewing capture files).
To manually unframe your data:
1. Select Unframe from the File menu on the Control window. Unframe is only available if a protocol
stack was used to capture the data and there is currently no protocol stack selected.
In addition to choosing to Unframe, you can also be prompted to Unframe by the Protocol Stack Wizard.
1. Load your capture file by choosing Open from the File menu on the Control window.
2. Select the file to load.
3. Choose Protocol Stack from the Options menu on the Control window
4. Select None from the list
5. Click Finish. The Protocol Stack Wizard asks you if you want to unframe your data and put it into a new
file.
6. Choose Yes.
The system removes the frame markers from your data, puts the unframed data into a new file, and opens the
new file. The original capture file is not altered.
See Reframing on page 60 for instructions on framing unframed data.
4.2.5 How the Analyzer Auto-traverses the Protocol Stack
In the course of doing service discovery, devices ask for and receive a Protocol Descriptor List defining which
protocol stacks the device supports. It also includes information on which PSM to use in L2CAP, or the channel
number for RFCOMM, or the port number for TCP or UDP. The description below talks about how the analyzer
auto-traverses from L2CAP using a dynamically assigned PSM, but the principle is the same for RFCOMM channel
numbers and TCP/UDP port numbers.
The analyzer looks for SDP Service Attribute Responses or Service Search Attribute Responses carrying protocol
descriptor lists. If the analyzer sees L2CAP listed with a PSM, it stores the PSM and the UUID for the next protocol
in the list.
After the SDP session is over, the analyzer looks at the PSM in the L2CAP Connect frames that follow. If the PSM
matches one the analyzer has stored, the analyzer stores the source channel ID and destination channel ID, and
associates those channel IDs with the PSM and UUID for the next protocol. Thereafter, when the analyzer sees
L2CAP frames using those channel IDs, it can look them up in its table and know what the next protocol is.
In order for the analyzer to be able to auto-traverse using a dynamically assigned PSM, it has to have seen the SDP
session giving the Protocol Descriptor Lists, and the subsequent L2CAP connection using the PSM and identifying
the source and channel IDs. If the analyzer misses any of this process, it is not able to auto-traverse. It stops
decoding at the L2CAP layer.
For L2CAP frames carrying a known PSM (0x0001 for SDP, for example, or 0x0003 for RFCOMM), the analyzer
looks for Connect frames and stores the PSM along with the associated source and destination channel IDs. In this
case the analyzer does not need to see the SDP process, but does need to see the L2CAP connection process,
giving the source and destination channel IDs.
Frontline 802.11 Hardware & Software User Manual 61
Page 68

TELEDYNE LECROY Chapter 4 Capturing and Analyzing Data
4.2.6 Providing Context For Decoding When Frame Information Is Missing
There may be times when you need to provide information to the analyzer because the context for decoding a
frame is missing. For example, if the analyzer captured a response frame, but did not capture the command frame
indicating the command.
The analyzer provides a way for you to supply the context for any frame, provided the decoder supports it. (The
decoder writer has to include support for this feature in the decoder, so not all decoders support it. Note that not
all decoders require this feature.)
If the decoder supports user-provided context, three items are active on the Options menu of the Control
window and the Frame Display window. These items are Set Initial Decoder Parameters, Automatically
Request Missing Decoding Information, and Set Subsequent Decoder Parameters. (These items are
not present if no decoder is loaded that supports this feature.)
Set Initial Decoder Parameters is used to provide required information to decoders that is not context
dependent but instead tends to be system options for the protocol.
Choose Set Initial Decoder Parameters in order to provide initial context to the analyzer for a decoder. A
dialog appears that shows the data for which you can provide information.
If you need to change this information for a particular frame :
1. Right-click on the frame in the Frame Display window
2. Choose Provide <context name>.
Alternatively, you can choose Set Subsequent Decoder Parameter from the Options menu.
3. This option brings up a dialog showing all the places where context data was overridden.
4. If you know that information is missing, you can't provide it, and you don't want to see dialogs asking for it,
un-check Automatically Request Missing Decoding Information.
5. When unchecked, the analyzer doesn't bother you with dialogs asking for frame information that you don't
have. In this situation, the analyzer decodes each frame until it cannot go further and then simply stop
decoding.
4.3 Analyzing Protocol Decodes
4.3.1 The Frame Display
To open this window
Click the Frame Display icon on the Control window toolbar, or select Frame Display from the View
menu.
Frame Display Panes
The Frame Display window is used to view all frame related information. It is composed of a number of
different sections or "panes", where each pane shows a different type of information about a frame.
l Summary Pane - The Summary Pane displays a one line summary of each frame for every protocol found in
the data, and can be sorted by field for every protocol. Click here for an explanation of the symbols next to the
frame numbers.
62 Frontline 802.11 Hardware & Software User Manual
Page 69

Chapter 4 Capturing and Analyzing Data TELEDYNE LECROY
l Decode Pane - The Decode Pane displays a detailed decode of the highlighted frame. Fields selected in the
Decode Pane have the appropriate bit(s) or byte(s) selected in the Radix, Binary, Character , and Event
panes
l Radix Pane - The Radix Pane displays the logical data bytes in the selected frame in either hexadecimal,
decimal or octal.
l Binary Pane - The Binary Pane displays a binary representation of the logical data bytes.
l Character Pane - The Character Pane displays the character representation of the logical data bytes in either
ASCII, EBCDIC or Baudot.
l Event Pane - The Event Pane displays the physical data bytes in the frame, as received on the network.
By default, all panes except the Event Pane are displayed when the Frame Display is first opened.
Protocol Tabs
Protocol filter tabs are displayed in the Frame Display above the Summary pane.
l These tabs are arranged in separate color-
coded groups. These groups and their
colors are General (white), Classic Bluetooth
(blue), Bluetooth low energy (green),
802.11 (orange), USB (purple), NFC (brown)
and SD (teal). The General group applies to
all technologies. The other groups are
technology-specific.
l Clicking on a protocol filter tab in the General group filters in all packets containing that protocol regardless of
each packet’s technology.
l Clicking on a protocol filter tab in a technology-specific group filters in all packets containing that protocol on
that technology.
l A protocol filter tab appears in the General group only if the protocol occurs in more than one of the
technology-specific tab groups. For example, if L2CAP occurs in both Classic Bluetooth and Bluetooth low
energy , there will be L2CAP tabs in the General group, the Classic Bluetooth group, and the Bluetooth low
energy group.
Select the Unfiltered tab to display all packets.
There are several special tabs that appear in the Summary Pane when certain conditions are met. These tabs
appear only in the General group and apply to all technologies. The tabs are:
l Bookmarks appear when a bookmark is first seen.
l Errors appear when an error is first seen. An error is a physical error in a data byte or an error in the
protocol decode.
l Info appears when a frame containing an Information field is first seen.
The tabs disappear when the capture buffer is cleared during live capture or when decoders are reloaded, even if
one of the tabs is currently selected. They subsequently reappear as the corresponding events are detected.
Frontline 802.11 Hardware & Software User Manual 63
Page 70

TELEDYNE LECROY Chapter 4 Capturing and Analyzing Data
Comparing Frames
If you need to compare frames, you can open additional Frame Display windows by clicking on the Duplicate
View icon . You can have as many Frame Display windows open at a time as you wish.
Frame Wrapping and Display
In order to assure that the data you are seeing in Frame Display are current, the following messages appear
describing the state of the data as it is being captured.
l All Frame Display panes except the Summary pane display "No frame selected" when the selected frame is
in the buffer (i.e. not wrapped out) but not accessible in the Summary pane. This can happen when a tab is
selected that doesn’t filter in the selected frame.
l When the selected frame wraps out (regardless of whether it was accessible in the Summary pane) all Frame
Display panes except the Summary pane display "Frame wrapped out of buffer".
l When the selected frame is still being captured, all Frame Display panes except the Summary pane display
"Frame incomplete".
4.3.1.1 Frame Display Toolbar
The buttons that appear in the Frame Display window vary according to the particular configuration of the
analyzer. For controls not available the icons will be grayed-out.
Table 4.1 - Frame Display Toolbar Icons
Icon Description
Control – Brings the Control window to
the front.
Open File - Opens a capture file.
I/O Settings - Opens the I/O Settings
dialog.
Start Capture - Begins data capture to a
user designated file.
Stop Capture - Closes a capture file and
stops data capture to disk.
Save - Save the currently selected bytes
or the entire buffer to file.
Clear- Discards the temporary file and
clears the display.
Event Display – Brings the Event Display
window to the front.
Show Statistics - Opens Statistics dialog
64 Frontline 802.11 Hardware & Software User Manual
Page 71

Chapter 4 Capturing and Analyzing Data TELEDYNE LECROY
Table 4.1 - Frame Display Toolbar Icons(continued)
Icon Description
Duplicate View - Creates a second Frame
Display window identical to the first.
Apply/Modify Display Filters - Opens the
Display Filter dialog.
Quick Protocol Filter - brings up a dialog
box where you can filter or hide one or
more protocol layers.
Protocol Stack - brings up the Protocol
Stack Wizard where you can change the
stack used to decode framed data
Reload Decoders - When Reload
Decoders is clicked, the plug-ins are
reset and received frames are redecoded. For example, If the first frame
occurs more than 10 minutes in the past,
the 10-minute utilization graph stays
blank until a frame from 10 minutes ago or
less is decoded.
Find - Search for errors, string patterns,
special events and more.
Display Capture Notes - Brings up the
Capture Notes window where you can
view or add notes to the capture file.
Add/Modify Bookmark - Add a new or
modify an existing bookmark.
Display All Bookmarks - Shows all
bookmarks and lets you move between
bookmarks.
Coexistence View - Opens the
Coexistence View
Extract Data - Opens the Extract Data
dialog.
Audio Extraction - Opens the Audio
Extraction dialog.
Pie Chart - This icon displays a chart that
displays the number of frames with and
without errors.
Frontline 802.11 Hardware & Software User Manual 65
Page 72

TELEDYNE LECROY Chapter 4 Capturing and Analyzing Data
Table 4.1 - Frame Display Toolbar Icons(continued)
Icon Description
Reload Decoders - When Reload Decoders is clicked, the plug-ins are reset
and received frames are re-decoded. For example, If the first frame occurs
more than 10 minutes in the past, the 10-minute utilization graph stays blank
until a frame from 10 minutes ago or less is decoded.
Filter: Text giving the filter currently in
use. If no filter is being used, the text
reads "All Frames" which means that
nothing is filtered out. To see the text of
the entire filter, place the cursor over the
text and a ToolTip pops up with the full
text of the filter.
The following icons all change how the panes are arranged on the Frame
Display. Additional layouts are listed in the View menu.
Show Default Panes - Returns the panes
to their default settings.
Show Only Summary Pane - Displays
only the Summary pane.
Shall All Panes Except Event Pane Makes the Decode pane taller and the
Summary pane narrower.
Toggle Display Lock - Prevents the
display from updating.
Go To Frame
First Frame - Moves to the first frame in
the buffer.
Previous Frame - Moves to the previous
frame in the buffer.
Next Frame - Moves to the next frame in
the buffer.
Last Frame - Moves to the last frame in
the buffer.
Find on Frame Display only searches the
Decode Pane for a value you enter in the
text box.
66 Frontline 802.11 Hardware & Software User Manual
Page 73

Chapter 4 Capturing and Analyzing Data TELEDYNE LECROY
Table 4.1 - Frame Display Toolbar Icons(continued)
Icon Description
Find Previous Occurrence - Moves to the
previous occurrence of the value in the
Frame Display Find.
Find Next Occurrence - Moves to the next
occurrence of the value in the Frame
Display Find.
Cancel Current Search - Stops the
current Frame Display Find.
Summary Drop Down Box: Lists all the
protocols found in the data in the file. This
box does not list all the protocol decoders
available to the analyzer, merely the
protocols found in the data. Selecting a
protocol from the list changes the
Summary pane to display summary
information for that protocol. When a low
energy predefined Named Filter (like
Nulls and Polls) is selected, the
Summary drop-down is disabled.
Text with Protocol Stack: To the right of the Summary Layer box is some text
giving the protocol stack currently in use.
Note: If the frames are sorted in other than ascending frame number order, the order of the
frames in the buffer is the sorted order. Therefore the last frame in the buffer may not have the
last frame number.
4.3.1.2 Frame Display Status Bar
The Frame Display Status bar appears at the bottom of the Frame Display. It contains the following
information:
l Frame #s Selected: Displays the frame number or numbers of selected (highlighted) frames, and the total
number of selected frames in parentheses
l Total Frames: The total number of frames in the capture buffer or capture file in real-time
l Frames Filtered In: The total number of frames displayed in the filtered results from user applied filters in
real-time
Frontline 802.11 Hardware & Software User Manual 67
Page 74

TELEDYNE LECROY Chapter 4 Capturing and Analyzing Data
4.3.1.3 Hiding and Revealing Protocol Layers in the Frame Display
Hiding protocol layers refers to the ability to prevent a layer from being displayed on the Decode pane. Hidden
layers remain hidden for every frame where the layer is present, and can be revealed again at any time. You can
hide as many layers as you wish.
Note: Hiding from the Frame Display affects only the data shown in the Frame Display and not any
information in any other window.
There are two ways to hide a layer.
1. Right-click on the layer in the Decode pane, and choose Hide [protocol name] Layer In All Frames.
2. Click the Set Protocol Filtering button on the Summary pane toolbar. In the Protocols to Hide box
on the right, check the protocol layer(s) you want hidden. Click OK when finished.
To reveal a hidden protocol layer:
1. Right-click anywhere in the Decode pane
2. Choose Show [protocol name] Layer from the right-click menu, or click the Set Protocol Filtering
button and un-check the layer or layers you want revealed.
4.3.1.4 Physical vs. Logical Byte Display
The Event Display window and Event Pane in the Frame Display window show the physical bytes. In other
words, they show the actual data as it appeared on the circuit. The Radix, Binary and Character panes in the Frame
Display window show the logical data, or the resulting byte values after escape codes or other character altering
codes have been applied (a process called transformation).
As an example, bytes with a value of less than 0x20 (the 0x indicates a hexadecimal value) cannot be transmitted
in Async PPP. To get around this, a 0x7d is transmitted before the byte. The 0x7d says to take the next byte and
subtract 0x20 to obtain the true value. In this situation, the Event pane displays 0x7d 0x23, while the Radix pane
displays 0x03.
4.3.1.5 Sorting Frames
By default, frames are sorted in ascending numerical sequence by frame number. Click on a column header in the
Summary pane to sort the frames by that column. For example, to sort the frames by size, click on the Frame
Size column header.
An embossed triangle next to the header name indicates which column the frames are sorted by. The direction of
the triangle indicates whether the frames are in ascending or descending order, with up being ascending.
Note that it may take some time to sort large numbers of frames.
4.3.1.6 Frame Display - Find
Frame Display has a simple Find function that you can use to search the Decode Pane for any alpha numeric
value. This functionality is in addition to the more robust Search/Find dialog.
Frame Display Find is located below the toolbar on the Frame Display dialog.
68 Frontline 802.11 Hardware & Software User Manual
Page 75

Chapter 4 Capturing and Analyzing Data TELEDYNE LECROY
Figure 4.16 - Frame Display Find text entry field
Where the more powerful Search/Find functionality searches the Decode, Binary, Radix, and Character panes
on Frame Display using TImestamps, Special Events, Bookmarks, Patterns, etc.,
Figure 4.17 - Search/Find Dialog
Find on Frame Display only searches the Decode Pane for a value you enter in the text box.
To use Find:
1. Select the frame where you want to begin the search.
2. Enter a value in the Find text box.
Note: The text box is disabled during a live capture.
3.
Select Find Previous Occurrence to begin the search on frames prior to the frame you selected,
or Find Next Occurrence to begin the search on frames following the frame you selected.
Frontline 802.11 Hardware & Software User Manual 69
Page 76

TELEDYNE LECROY Chapter 4 Capturing and Analyzing Data
The next occurrence of the value (if it is found) will be highlighted in
the Decode Pane.
4. Select Find Previous Occurrence or Find Next Occurrence to
continue the search.
There are several important concepts to remember with Find.
l When you enter a search string and select Enter, the search moves forward.
l If you select Find Previous Occurrence, when the search reaches the first frame it will then cycle to the
last frame and continue until it reaches the frame where the search began.
l Shift + F3 is a shortcut for Find Previous Occurrence.
l If you select Find Next Occurrence, when the search reaches the last frame it will then cycle to the first
frame and continue until it reaches the frame where the search began.
l F3 is a shortcut for Find Next Occurrence.
l You cannot search while data is being captured.
l After a capture is completed, you cannot search until Frame Display has finished decoding the frames.
l Find is not case sensitive.
l The status of the search is displayed at
the bottom of the dialog.
l The search occurs only on the
protocol layer selected.
l To search across all the protocols on
the Frame Display, select the
Unfiltered tab.
l A drop-down list displays the search values entered during the current
session of Frame Display.
l The search is cancelled when you select a different protocol tab during a
search.
l You can cancel the search at any time by selecting the Cancel Current
Search button.
4.3.1.7 Synchronizing the Event and Frame Displays
The Frame Display is synchronized with the Event Display. Click on a frame in the Frame Display and the
corresponding bytes is highlighted in the Event Display. Each Frame Display has its own Event Display.
As an example, here's what happens if the following sequence of events occurs.
70 Frontline 802.11 Hardware & Software User Manual
Page 77

Chapter 4 Capturing and Analyzing Data TELEDYNE LECROY
1.
Click on the Frame Display icon in Control window toolbar to open the Frame Display.
2.
Click on the Duplicate View icon to create Frame Display #2.
3.
Click on Event Display icon in Frame Display #2. Event Display #2 opens. This Event
Display is labeled #2, even though there is no original Event Display, to indicate that it is synchronized
with Frame Display #2.
4. Click on a frame in Frame Display #2. The corresponding bytes are highlighted in Event Display #2.
5. Click on a frame in the original Frame Display. Event Display #2 does not change.
4.3.1.8 Working with Multiple Frame Displays
Multiple Frame Displays are useful for comparing two frames side by side. They are also useful for comparing all
frames against a filtered subset or two filtered subsets against each other.
l
To create a second Frame Display, click the Duplicate View icon on the Frame Display toolbar.
This creates another Frame Display window. You can have as many Frame Displays open as you wish.
Each Frame Display is given a number in the title bar to distinguish it from the others.
l
To navigate between multiple Frame Displays, click on the Frame Display icon in the Control window
toolbar.
A drop-down list appears, listing all the currently open Frame Displays.
l Select the one you want from the list and it comes to the front.
Note: When you create a filter in one Frame Display, that filter does not automatically
appear in the other Frame Display. You must use the Hide/Reveal feature to display a
filter created in one Frame Display in another.
Note: When you have multiple Frame Display windows open and you are capturing data, you
may receive an error message declaring that "Filtering cannot be done while receiving data
this fast." If this occurs, you may have to stop filtering until the data is captured.
4.3.1.9 Working with Panes on Frame Display
When the Frame Display first opens, all panes are displayed except the Event pane (To view all the panes,
select Show All Panes from the View menu).
l
The Toggle Expand Decode Pane icon makes the decode pane longer to view lengthy decodes
better.
l
The Show Default Panes icon returns the Frame Display to its default settings.
Frontline 802.11 Hardware & Software User Manual 71
Page 78

TELEDYNE LECROY Chapter 4 Capturing and Analyzing Data
l
The Show only Summary Pane icon displays on the Summary Pane.
To close a pane, right-click on the pane and select Hide This Pane from the pop-up menu, or de-select Show
[Pane Name] from the View menu.
To open a pane, right-click on the any pane and select Show Hidden Panes from the pop-up menu and select
the pane from the fly-out menu, or select Show [Pane Name] from the View menu.
To re-size a pane, place the cursor over the pane border until a double-arrow cursor appears. Click and drag on
the pane border to re-size the pane.
4.3.1.10 Frame Display - Byte Export
The captured frames can be exported as raw bytes to a text file.
1. From the Frame Display File menu select Byte Export....
Figure 4.18 - Frame Display File menu, Byte Export
2. From the Byte Export window specify the frames to export.
l All Frames exports all filtered-in frames including those scrolled off the Summary pane. Filtered-in
frames are dependent on the selected Filter tab above the Summary pane. Filtered-out frames are
not exported.
l Selected Frames export is the same as All Frames export except that only frames selected in the
Summary pane will be exported.
72 Frontline 802.11 Hardware & Software User Manual
Page 79

Chapter 4 Capturing and Analyzing Data TELEDYNE LECROY
Figure 4.19 - Byte Export dialog
Click the OK button to save the export. Clicking the Cancel button will exit Byte Export.
3. The Save As dialog will open. Select a directory location and enter a file name for the exported frames
file.
Figure 4.20 - Save As dialog
Click on the Save button.
The exported frames are in a text file that can be opened in any standard text editing application. The header
shows the export type, the capture file name, the selected filter tab, and the number of frames. The body shows
the frame number, the timestamp in the same format shown in the Frame Display Summary pane, and the
frame contents as raw bytes.
Frontline 802.11 Hardware & Software User Manual 73
Page 80

TELEDYNE LECROY Chapter 4 Capturing and Analyzing Data
Figure 4.21 - Sample Exported Frames Text File
4.3.1.11 Panes in the Frame Display
4.3.1.11.1 Summary Pane
The Summary pane displays a one-line summary of every frame in a capture buffer or file, including frame
number, timestamp, length and basic protocol information. The protocol information included for each frame
depends on the protocol selected in the summary layer box (located directly below the main toolbar).
On a two-channel circuit, the background color of the one-line summary indicates whether the frame came from
the DTE or the DCE device. Frames with a white background come from the DTE device, frames with a gray
background come from the DCE device.
Frame numbers in red indicate errors, either physical (byte-level) or frame errors. If the error is a frame error in
the displayed protocol layer, the bytes where the error occurred is displayed in red. The Decode Pane gives
precise information as to the type of error and where it occurred.
The Summary pane is synchronized with the other panes in this window. Click on a frame in the Summary
pane, and the bytes for that frame is highlighted in the Event pane while the Decode pane displays the full
decode for that frame. Any other panes which are being viewed are updated accordingly. If you use one pane to
select a subset of the frame, then only that subset of the frame is highlighted in the other panes.
Protocol Tabs
Protocol filter tabs are displayed in the Frame Display above the Summary pane.
l These tabs are arranged in separate color-coded groups. These groups and their colors are General (white),
Classic Bluetooth (blue), Bluetooth low energy (green), 802.11 (orange), USB (purple), and SD (brown). The
General group applies to all technologies. The other groups are technology-specific.
Figure 4.22 - Example Protocol Tags
74 Frontline 802.11 Hardware & Software User Manual
Page 81

Chapter 4 Capturing and Analyzing Data TELEDYNE LECROY
l Clicking on a protocol filter tab in the General group filters in all packets containing that protocol regardless of
each packet’s technology.
l Clicking on a protocol filter tab in a technology-specific group filters in all packets containing that protocol on
that technology.
l A protocol filter tab appears in the General group only if the protocol occurs in more than one of the
technology-specific tab groups. For example, if L2CAP occurs in both Classic Bluetooth and Bluetooth low
energy , there will be L2CAP tabs in the General group, the Classic Bluetooth group, and the Bluetooth low
energy group.
Select the Unfiltered tab to display all packets.
There are several special tabs that appear in the Summary pane when certain conditions are met. These tabs
appear only in the General group and apply to all technologies. The tabs are:
l Bookmarks appear when a bookmark is first seen.
l Errors appear when an error is first seen. An error is a physical error in a data byte or an error in the
protocol decode.
l Info appears when a frame containing an Information field is first seen.
The tabs disappear when the capture buffer is cleared during live capture or when decoders are reloaded, even if
one of the tabs is currently selected. They subsequently reappear as the corresponding events are detected.
The tabs disappear when the capture buffer is cleared during live capture or when decoders are reloaded, even if
one of the tabs is currently selected. They subsequently reappear as the corresponding events are detected.
Use the navigation icons, keyboard or mouse to move through the frames. The icons and move you to
the first and last frames in the buffer, respectively. Use the Go To icon to move to a specific frame number.
Placing the mouse pointer on a summary pane header with truncated text displays a tooltip showing the full
header text.
Figure 4.23 - Summary pane (right) with Tooltip on Column 5 (Tran ID)
4.3.1.11.2 Customizing Fields in the Summary Pane
You can modify the Summary Pane in Frame Display.
Summary pane columns can be reordered by dragging any column to a different position.
Frontline 802.11 Hardware & Software User Manual 75
Page 82

TELEDYNE LECROY Chapter 4 Capturing and Analyzing Data
Fields from the Decode pane can be added to the summary pane by dragging any Decodepane field to the
desired location in the summary pane header. If the new field is from a different layer than the summary pane a
plus sign (+) is prepended to the field name and the layer name is added in parentheses. The same field can be
added more than once if desired, thus making it possible to put the same field at the front and back (for example)
of a long header line so that the field is visible regardless of where the header is scrolled to.
An added field can be removed from the Summary pane by selecting Remove New Column from the rightclick menu.
The default column layout (both membership and order) can be restored by selecting Restore Default
Columns from the Format or right-click menus.
Changing Column Widths
To change the width of a column:
1. Place the cursor over the right column divider until the cursor changes to a solid double arrow.
2. Click and drag the divider to the desired width.
3. To auto-size the columns, double-click on the column dividers.
Hiding Columns
To hide a column:
1. Drag the right divider of the column all the way to the left.
2. The cursor changes to a split double arrow when a hidden column is present.
3. To show the hidden column, place the cursor over the divider until it changes to a split double arrow, then
click and drag the cursor to the right.
4. The Frame Size, Timestamp, and Delta columns can be hidden by right-clicking on the header and
selecting Show Frame Size Column, Show Timestamp Column, or Show Delta Column. Follow
the same procedure to display the columns again.
Moving Columns - Changing Column Order
To move a column :
1. Click and hold on the column header
2. Drag the mouse over the header row.
3. A small white triangle indicates where the column is moved to.
4. When the triangle is in the desired location, release the mouse.
Restoring Default Column Settings
To restore columns to their default locations, their default widths, and show any hidden columns
1. Right-click on any column header and choose Restore Default Column Widths, or select Restore
Default Column Widths from the Format menu.
76 Frontline 802.11 Hardware & Software User Manual
Page 83

Chapter 4 Capturing and Analyzing Data TELEDYNE LECROY
4.3.1.11.3 Frame Symbols in the Summary Pane
Table 4.2 - Frame Symbols
Symbol Description
A green dot means the frame was decoded successfully, and the protocol listed in the Summary
Layer drop-down box exists in the frame. No dot means the frame was decoded successfully, but the
protocol listed in the Summary Layer drop-down box does not exist in the frame.
A green circle means the frame was not fully decoded. There are several reasons why this might
happen.
l One reason is that the frame compiler hasn't caught up to that frame yet. It takes some time for
the analyzer to compile and decode frames. Frame compilation also has a lower priority than other
tasks, such as capturing data. If the analyzer is busy capturing data, frame compilation may fall
behind. When the analyzer catches up, the green circle changes to either a green dot or no dot.
l Another reason is if some data in the frame is context dependent and we don't have the context.
An example is a compressed header where the first frame gives the complete header, and
subsequent frames just give information on what has changed. If the analyzer does not capture the
first frame with the complete header, it cannot decode subsequent frames with partial header
information.
A magenta triangle indicates that a bookmark is associated with this frame. Any comments associated
with the bookmark appear in the column next to the bookmark symbol.
4.3.1.11.4 Decode Pane
The Decode pane (aka detail pane) is a post-process display that provides a detailed decode of each frame
transaction (sometimes referred to as a frame). The decode is presented in a layered format that can be
expanded and collapsed depending on which layer or layers you are most interested in. Click on the plus sign to
expand a layer. The plus sign changes to a minus sign. Click on the minus sign to collapse a layer. Select Show All
or Show Layers from the Format menu to expand or collapse all the layers. Layers retain their expanded or
collapsed state between frames.
Protocol layers can be hidden, preventing them from being
displayed on the Decode pane. Right-click on any protocol layer
and choose Hide [protocol name] from the right-click menu.
Each protocol layer is represented by a color, which is used to
highlight the bytes that belong to that protocol layer in the
Event, Radix, Binary and Character panes. The colors are not
assigned to a protocol, but are assigned to the layer.
The Event, Radix, Binary, Character and Decode panes are all synchronized with one another. Clicking on an
element in any one of the panes highlights the corresponding element in all the other panes.
Click the Toggle Expand Decode Pane icon to make the Decode pane taller. This allows for more of a
lengthy decode to be viewed without needing to scroll.
Frontline 802.11 Hardware & Software User Manual 77
Page 84

TELEDYNE LECROY Chapter 4 Capturing and Analyzing Data
4.3.1.11.5 Radix or Hexadecimal Pane
The Radix pane displays the logical bytes in the frame in either
hexadecimal, decimal or octal. The radix can be changed from
the Format menu, or by right-clicking on the pane and
choosing Hexadecimal, Decimal or Octal.
Because the Radix pane displays the logical bytes rather than
the physical bytes, the data in the Radix pane may be different
from that in the Event pane. See Physical vs. Logical Byte Display
for more information.
Colors are used to show which protocol layer each byte belongs
to. The colors correspond to the layers listed in the Decode
pane.
The Event, Radix, Binary, Character and Decode panes are all synchronized with one another. Clicking on an
element in any one of the panes highlights the corresponding element in all the other panes.
4.3.1.11.6 Character Pane
The Character pane represents the logical bytes in the frame
in ASCII, EBCDIC or Baudot. The character set can be
changed from the Format menu, or by right-clicking on the
pane and choosing the appropriate character set.
Because the Character pane displays the logical bytes rather
than the physical bytes, the data in the Character pane may
be different from that in the Event pane. See Physical vs.
Logical Byte Display for more information.
Colors are used to show which protocol layer each byte
belongs to. The colors correspond to the layers listed in the
Decode pane.
The Event, Radix, Binary, Character and Decode panes
are all synchronized with one another. Clicking on an element
in any one of the panes highlights the corresponding element in all the other panes.
4.3.1.11.7 Binary Pane
The Binary pane displays the logical bytes in the frame in binary.
Because the Binary pane displays the logical bytes rather than the physical bytes, the data in the Binary pane may
be different from that in the Event pane. See Physical vs. Logical Byte Display for more information.
Colors are used to show which protocol layer each byte belongs to. The colors correspond to the layers listed in
the Decode pane.
The Event, Radix, Binary, Character and Decode panes are all synchronized with one another. Clicking on an
element in any one of the panes highlights the corresponding element in all the other panes.
78 Frontline 802.11 Hardware & Software User Manual
Page 85

Chapter 4 Capturing and Analyzing Data TELEDYNE LECROY
4.3.1.11.8 Event Pane
The Event pane shows the physical bytes
in the frame. You can choose between
displaying only the data events or
displaying all events by clicking the All
Events icon .
Displaying all events means that special
events, such as Start of Frame, End of
Frame and any signal change events, are
displayed as special symbols within the
data.
The status lines at the bottom of the pane give the same information as the status lines in the Event Display
window. This includes physical data errors, control signal changes (if appropriate), and timestamps.
Because the Event pane displays the physical bytes rather than the logical bytes, the data in the Event pane may
be different from that in the Radix, Binary and Character panes. See Physical vs. Logical Byte Display for more
information.
Colors are used to show which protocol layer each byte belongs to. The colors correspond to the layers listed in
the Decode pane.
The Event, Radix, Binary, Character and Decode panes are all synchronized with one another. Clicking on an
element in any one of the panes highlights the corresponding element in all the other panes.
4.3.1.11.9 Change Text Highlight Color
Whenever you select text in the Binary, Radix, or
Character panes in Frame Display, the text is displayed
with a highlight color. You can change the color of the
highlight.
1. Select Change Text Highlight Color from the
Options menu. You can also access the option by
right clicking in any of the panes.
2. Select a color from the drop-down menu.
3. Click OK.
The highlight color for the text is changed.
Select Cancel to discard any selection. Select Defaults to return the highlight color to blue.
4.3.1.12 Protocol Layer Colors
4.3.1.12.1 Data Byte Color Notation
The color of the data in the panes specifies which layer of the protocol stack the data is from. All data from the
first layer is bright blue, the data from the second layer is green, the third layer is pink, etc. The protocol name for
each layer in the Decode pane is in the same color. Note that the colors refer to the layer, not to a specific
Frontline 802.11 Hardware & Software User Manual 79
Page 86

TELEDYNE LECROY Chapter 4 Capturing and Analyzing Data
protocol. In some situations, a protocol may be in two different colors in two different frames, depending on
where it is in the stack. You can change the default colors for each layer.
Red is reserved for bytes or frames with errors. In the Summary pane, frame numbers in red mean there is an
error in the frame. Also, the Errors tab is displayed in red. This could be a physical error in a data byte or an error
in the protocol decode. Bytes in red in the Radix, Character, Binary and Event panes mean there is a physical
error associated with the byte.
4.3.1.12.2 Red Frame Numbers and Bytes
Red is reserved for bytes or frames with errors. In the Summary pane, frame numbers in red mean there is an
error in the frame. This could be a physical error in a data byte or an error in the protocol decode.
4.3.1.12.3 Changing Protocol Layer Colors
You can differentiate different protocol layers in the Decode, Event, Radix, Binary and Character panes.
1. Choose Select Protocol Layer Colors from the Options menu to change the colors used.
The colors for the different layers is displayed.
2. To change a color, click on the arrow next to each layer and select a new color.
3. Select OK to accept the color change and return to Frame Display.
Select Cancel to discard any selection. Select Defaults to return the highlight colors to the default settings.
Figure 4.24 - Frame Display Protocol Layer Color Selector
4.3.1.13 Filtering
Filtering allows the user to control the display which capture frames are displayed. Filters fall into two general
categories:
1. Display filters allow a user to look at a subset of captured data without affecting the capture content.
Frames matching the filter criteria appear in the Frame Display; frames not matching the criteria will not
80 Frontline 802.11 Hardware & Software User Manual
Page 87

Chapter 4 Capturing and Analyzing Data TELEDYNE LECROY
appear.
2. Connection filters Two options are available.
a. A Bluetooth connection: Displays only the frames associated with a Classic Bluetooth link or a
Bluetooth low energy access address. A new Frame Display will open showing only the protocol
tabs, frames, summary, and events associated with that particular Bluetooth connection.
b. A specific wireless or wired technology. Displays all of the frames associated with:
l Classic Bluetooth
l Bluetooth low energy
l 802.11
l HCI
A new Frame Display will open showing only the protocol tabs, frames, summary and events
associated with the selected technology.
4.3.1.13.1 Display Filters
A display filter looks at frames that have already been captured. It looks at every frame in the capture buffer and
displays those that match the filter criteria. Frames that do not match the filter criteria are not displayed. Display
filters allow a user to look at a subset of captured data without affecting the capture content. There are three
general classes of display filters:
l Protocol Filters
l Named Filters
l Quick Filter
Protocol Filters
Protocol filters test for the existence of a specific single layer. The system creates a protocol filter for each
decoder that is loaded if that layer is encountered in a capture session.
There are also three special purpose filters that are treated as protocol filters:
l All Frames with Errors
l All Frames with Bookmarks
l All Special Information Nodes
Named Filters
l Named filters test for anything other than simple single layer existence. Named filters can be constructed that
test for the existence of multiple layers, field values in layers, frame sizes, etc., as well as combinations of
those things. Named filters are persistent across sessions.
l Named filters are user-defined. User-defined filters persist in a template file. User defined filters can be
deleted.
Frontline 802.11 Hardware & Software User Manual 81
Page 88

TELEDYNE LECROY Chapter 4 Capturing and Analyzing Data
Quick Filters
l Quick Filters are combinations of Protocol Filters and/or Named Filters that are displayed on the Quick Filter
tab.
l Quick Filters cannot be saved and do not persist across sessions.
l Quick Filters are created on the Quick Filter Dialog.
4.3.1.13.1.1 Creating a Display Filter
There are two steps to using a display filter. Define the filter conditions, and then apply the filter to the data set.
The system combines both filter definition and application in one dialog.
1.
Click the Display Filters icon on the Frame Display window or select Apply/Modify
Display Filters from the Filter menu to open the Set Condition dialog box. The Set Condition dialog is
self configuring which means that when you Select each frame under Conditions the following
displayed fields depend on your selection. With each subsequent selection the dialog fields will change
depending on you selection in that field.
Figure 4.25 - Example: Set Conditions Self Configuring Based on Protocol Selection
Figure 4.26 - Example: Set Conditions Self Configuring Based on Frame Range
2. Select Include or Exclude to add filtered data or keep out filtered data respectively.
3. Select the initial condition for the filter from the drop-down list.
82 Frontline 802.11 Hardware & Software User Manual
Page 89

Chapter 4 Capturing and Analyzing Data TELEDYNE LECROY
4. Set the parameters for the selected condition in the fields provided. The fields that appear in the dialog
box are dependent upon the previous selection. Continue to enter the requested parameters in the fields
provided until the condition statement is complete.
5. Click OK. The system displays the Save Named Condition dialog. Provide a name for the filter condition
or accept the default name provided by the system and click OK. Prohibited characters are left bracket '[',
right bracket ']' and equal sign '='. The Set Condition dialog box closes, creates a tab on the Frame
Display with the filter name, and applies the filter.
The filter also appears in the Quick Filtering and Hiding Protocols dialog.
When a display filter is applied, a description of the filter appears to the right of the toolbar in the Frame Display
windows.
Notes:
l The system requires naming and saving of all filters created by the user.
l The OK button on the Set Condition dialog box is unavailable (grayed out) until the condition selections are
complete.
l When you have multiple Frame Display windows with a display filter or filters, those filter do not automatically
appear in other Frame Display windows. You must use the Hide/Reveal feature to display a filter created in
one Frame Display in different Frame Display window.
4.3.1.13.1.2 Including and Excluding Radio Buttons
All filter dialog boxes contain an Include and an Exclude radio button. These buttons are mutually exclusive. The
Include/Exclude selection becomes part of the filter definition, and appears as part of the filter description
displayed to the right of the Toolbar.
Include: A filter constructed with the "Include" button selected, returns a data set that includes frames that meet
the conditions defined by the filter and omits frames that do not.
Exclude: A filter constructed with the "Exclude" button selected, returns a data set that excludes frames that
meet the conditions defined by the filter and consists of frames that do not.
4.3.1.13.1.3 Named Display Filters
You can create a unique display filter by selecting a data type on the Frame Display and using a right click menu.
When you create a Name Filter, it appears in the Quick Filtering dialog, where you can use it do customize the
data you see in the Frame Display panes.
1. Select a frame in the Frame Display Summary Pane.
2. Right click in the one of the data columns in the Summary Pane: CRC, NESN, DS, Packet Success,
Ethertype, Source Address, etc.
Frontline 802.11 Hardware & Software User Manual 83
Page 90

TELEDYNE LECROY Chapter 4 Capturing and Analyzing Data
3. Select Filter in (data type) = . The Filtering Results
dialog appears.
4. Enter a name for the filter
5. Select OK.
The filter you just created appears in the Named Filters section
of the Quick Filtering dialog.
4.3.1.13.1.4 Using Compound Display Filters
Compound filters use boolean logic to create complex and precise filters. There are three primary Boolean logic
operators: AND, OR, and NOT.
The AND operator narrows the filter, the OR operator broadens the filter, and the NOT operator excludes
conditions from the filtered results. Include parentheses in a compound filter to nest condition sets within larger
condition sets, and force the filter-processing order.
There are two steps to using a compound filter. Define the filter conditions, and then apply the filter to the data
set. The analyzer combines both filter definition and application in one dialog.
1.
Click the Display Filters icon on the Frame Display window or select Apply/Modify Display
Filters… from the filter menu to open the Set Condition dialog box.
2. Click the Advanced button on the Set Condition dialog box.
3. Select Include or Exclude radio button.
Now you can set the conditions for the filter.
4. Select the initial condition for the filter from the
combo box at the bottom of the dialog for Select
each frame.
5. Set the parameters for the selected condition in
the fields provided. The fields that appear in the
dialog box are dependent upon the previous
selection. Continue to enter the requested
parameters in the fields provided until the
conditions statement is complete.
Figure 4.27 - Two Filter Conditions Added with an AND Operator
84 Frontline 802.11 Hardware & Software User Manual
Page 91

Chapter 4 Capturing and Analyzing Data TELEDYNE LECROY
6.
Click the plus icon on the left side of the dialog box and repeat steps 4 and 5 for the next condition.
Use the up and down arrow icons on the left side of the dialog box to order your conditions, and
the delete button to delete conditions from your filter.
7. Continue adding conditions until your filter is complete.
8. Include parentheses as needed and set the boolean operators.
9. Click OK.
10. The system displays the Save Named Condition dialog. Provide a name for the filter condition or accept
the default name provided by the system and click OK.
Figure 4.28 - Save Named Filter Condition Dialog
The Set Condition dialog box closes, creates a tab on the Frame Display with the filter name, and applies the
filter.
When a display filter is applied, a description of the filter
appears to the right of the toolbar in the Frame
Display windows.
Note: The OK button on the Set Condition dialog box is unavailable (grayed out) until the
condition selections are complete.
4.3.1.13.1.5 Defining Node and Conversation Filters
There are two steps to using Node and Conversation display filter. Define the filter conditions, and then apply the
filter to the data set. The analyzer combines both filter definition and application in one dialog.
1.
Click the Display Filters icon on the Frame Display window or select Apply/Modify Display
Filters… from the filter menu to open the Set Condition dialog box.
2. From the Select each frame combo box choose frames with the conversation as the initial condition.
3. Select an address type—IP, MAC, TCP/UDB—from the Typecombo box (The address type selection
populates both Address combo boxes with node address in the data set that match the type selection).
Frontline 802.11 Hardware & Software User Manual 85
Page 92

TELEDYNE LECROY Chapter 4 Capturing and Analyzing Data
4. Select a node address from the first Address combo box.
5. Choose a direction arrow from the direction box . The left arrow filters on all frames
where the top node address is the destination, the right arrow filters on all frames
where the top node address is the source, and the double arrow filters on all frames
where the top node address is either the source or the destination.
6. If you want to filter on just one node address, skip step 7 and continue with step 8.
7. If you want to filter on traffic going between two address nodes (i.e. a conversation), select a node address
from the second Address combo box..
8. Click OK. The Set Condition dialog box closes and the analyzer applies the filter.
When a display filter is applied, a description of the filter appears to the right of the toolbar in the Frame Display
windows.
Note: The OK button is unavailable (grayed out) until the condition selections are complete.
4.3.1.13.1.6 The Difference Between Deleting and Hiding Display Filters
If you wish to remove a filter from the system permanently, then use the Delete procedure. However, if all you
want to do is remove a filter as a means to un-clutter the display, then use the Hide procedure.
Deleting a saved filter removes the filter from the current session and all subsequent sessions. In order to retrieve
a deleted filter, the user must recreate it using the Set Conditions dialog.
Hiding a filter merely removes the filter from the display. A hidden filter can be reapplied using the Show/Hide
procedure.
Deleting Saved Display Filters
1. Select Delete Display Filters from the Filter
menu in the Frame Display window to
open the Delete Named Condition dialog.
The system displays the Delete Named
Condition dialog with a list of all user defined
filters.
2. Select the filter to be deleted from the list.
3. Click the Delete button.
4. Click OK. The Delete Named Condition
dialog box closes and the system deletes the
filter.
Hiding and Revealing Display Filters
If a display filter is showing the following steps will hide
that filter but will not delete it.
86 Frontline 802.11 Hardware & Software User Manual
Page 93

Chapter 4 Capturing and Analyzing Data TELEDYNE LECROY
1.
Select Hide/Show Display
Filters… from the Filter menu on the
Frame Display window to open
the Hide/Show Filters dialog. The
system displays the Hide/Show
Filters dialog with a list of all user
defined filters.
2. Select the filter to be hidden from the
combo box.
3. Click the Hide button. The Hide button is only showing if the selected filter is currently showing in the
Frame Display.
4. Click OK. The Hide/Show Filters dialog box closes, and the system hides the filter and removes the filter
tab from the Frame Display.
If a display filter is hidden the following steps will reveal that filter in the Frame Display.
1.
Select Hide/Show Display Filters… from the Filter menu in the Frame Display window to
open the Hide/Show Filters dialog. The system displays the Hide/Show Filters dialog with a list of all
user defined filters.
2. Select the filter to be revealed from the combo box.
3. Click the Show button.
4. Click OK. The Hide/Show Filters dialog box closes and the system reveals the filter in the Frame
Display.
You can also open the Quick Filter dialog and check the box next to the hidden filter to show or hide a display
filter.
Figure 4.29 - Using Named Filters Section of Quick Filters to Show/Hide Filters
Note: When you have multiple Frame Display windows with a display filter or filters, those
filter do not automatically appear in other Frame Display windows. You must use the
Hide/Show dialog to display a filter created in one Frame Display in different Frame Display
window.
Frontline 802.11 Hardware & Software User Manual 87
Page 94

TELEDYNE LECROY Chapter 4 Capturing and Analyzing Data
4.3.1.13.1.7 Editing Filters
Modifying a Condition in a Filter
1.
Click the Display Filters icon on the Frame
Display window or select Apply/Modify Display
Filters… from the Filter menu to open the Set
Condition dialog box. The Set Condition dialog box
displays the current filter definition at the top of the dialog.
To display another filter, click the Open icon, and
select the filter from the pop-up list of all the saved filters.
2. Edit the desired parameter of the condition: Because the required fields for a condition statement depend
upon previously selected parameters, the Set Condition dialog box may display additional fields that were
not present in the original filter. In the event this occurs, continue to enter the requested parameters in
the fields provided until the condition statement is complete.
3. Click OK. The system displays the Save Named Condition dialog. Ensure that the filter name is
displayed in the text box at the top of the dialog, and click OK. If you choose to create an additional filter,
then provide a new name for the filter condition or accept the default name provided by the system and
click OK.) The Set Condition dialog box closes, and the system applies the modified filter.
Note: When a display filter is applied, a description of the filter appears to the right of the
toolbar in the Frame Display windows.
Deleting a Condition in a Filter
If a display filter has two or more conditions you can delete conditions. If there is only one condition set in the
filter you must delete the filter using Delete Display Filters… from the Filters menu.
1.
Click the Display Filters icon on the Frame Display window or select Apply/Modify Display
Filters… from the Filter menu to open the Set Condition dialog box. Click on the Advanced button to
show the condition in Boolean format. The dialog box displays the current filter definition. To display
another filter, click the Open icon, and select the filter from the pop-up list of all the saved filters.
88 Frontline 802.11 Hardware & Software User Manual
Page 95

Chapter 4 Capturing and Analyzing Data TELEDYNE LECROY
Figure 4.30 - Set Condition Dialog in Advanced View
2. Select the desired condition from the filter definition.
3.
Click the Delete Selected Line icon.
4. Edit the Boolean operators and parentheses as needed.
5. Click OK. The system displays the Save Named Condition dialog. Ensure that the filter name is
displayed in the text box at the top of the dialog, and click OK. (If you choose to create an additional filter,
then provide a new name for the filter condition or accept the default name provided by the system and
click OK.) The Set Condition dialog box closes, and the system applies the modified filter.
Note: When a display filter is applied, a description of the filter appears to the right of the
toolbar in the Frame Display windows.
Renaming a Display Filter
1.
Select Rename Display Filters… from the Filter menu in the Frame Display window to open
the Rename Filter dialog. The system displays the Rename Filter dialog with a list of all user defined
filters in the Filters combo box.
Figure 4.31 - Rename Filters Dialog
2. Select the filter to be renamed from the combo box.
Frontline 802.11 Hardware & Software User Manual 89
Page 96

TELEDYNE LECROY Chapter 4 Capturing and Analyzing Data
3. Enter a new name for the filter in the New Name box. Optionally click the Apply button and the new
name will appear in the Filters combo box and the New Name box will empty. This option allows you to
rename several filters without closing the Rename Filter dialog each time.
4. Click OK. The Rename Filter dialog box closes and the system renames the filter.
4.3.1.13.2 Connection Filtering
Connection Filtering allows the user to view a subset of the total available packets within the Frame Display. The
subset can include data from a single Bluetooth connection, or all of the BR/EDR packets, all of the low energy
packets, all of the 802.11 packets, or all of the HCI packets.
Bluetooth Applicability
A connection (device pair) is identified by
1. A Link for Classic Bluetooth,
2. An Access Address for Bluetooth low energy.
The link ID is a number that the ComProbe software assigns to identify a pair of devices in a BR/EDR connection. In
the Frame Display details pane, the Baseband layer contains the link ID field if the field’s value is not 0.
An Access Address is contained in every Bluetooth low energy packet. The Access Address identifies a connection
between a slave and a master or an advertising packet.
Connection filtering displays only the frames, protocols, summary, details, and events for the selected
connections.
Note: Connection Filters are not persistent across sessions.
4.3.1.13.2.1 Creating a Connection Filter
In the Frame Display there are four ways to create a connection filter.
From the Frame Display Filter menu
Click on the Frame Display Filter menu Connection Filter selection. From the drop down menu, select
Classic or Bluetooth low energy. The options are
l Classic Bluetooth:
o
All will filter in all Classic Bluetooth frames. You are in effect filtering out any Bluetooth low energy frames
and are selecting to filter in all the Classic Bluetooth links.
o
Links displays all the master-slave links. You can select only one link to filter in. The selected link will filter
in only the frames associated with that link.
l Bluetooth low energy:
o
All will filter in all Bluetooth low energy frames. You are in effect filtering out any Classic Bluetooth frames
and are selecting to filter in all Bluetooth low energy access addresses.
o
Access Addresses displays all the low energy slave device's access address. You can select only one
access address to filter. The selected link will filter in only the frames associated with that access address.
90 Frontline 802.11 Hardware & Software User Manual
Page 97

Chapter 4 Capturing and Analyzing Data TELEDYNE LECROY
l 802.11:
o
All will filter in all 802.11 frames. You are in effect filtering out any other technology frames.
l HCI:
o
All will filter in all HCI frames. You are in effect filtering out any other technology frames.
Figure 4.32 - Connection Filter from the Frame Display Menu
From the Frame Display toolbar
Right-click anywhere in the toolbar and select Connection Filter from the pop-up menu. The procedure for
creating a connection filter are identical as described in From the Frame Display Filter menu, above.
Figure 4.33 - Connection Filter from the Frame Display Toolbar right-click
From the Frame Display panes
Right-click anywhere in a Frame Display pane and select Connection Filter in the pop-up menu. The procedure
for creating a connection filter are identical as described in From the Frame Display Filter menu, above.
Frontline 802.11 Hardware & Software User Manual 91
Page 98

TELEDYNE LECROY Chapter 4 Capturing and Analyzing Data
Figure 4.34 - Connection Filter from the Frame Display Pane right-click
From the Frame Display frame selection
Select a frame in the summary pane. Right-click and select Connection Filter in the pop-up menu. The
procedure for creating a connection filter are identical as described in From the Frame Display Filter menu,
above.
If the frame you have selected is associated with a Classic Bluetooth link or a Bluetooth low energy access address,
an additional pop-up menu item will appear as shown in the example image below. This selection is a
predetermined filter based on your selection. In the example, frame "6471" is associated with "Link 4", so the
predetermined filter assumes that you may want create a connection filter for that link. Clicking on Connection
Filter Link = 4 will filter in "Link 4" frames without opening all the drop-down menus.
92 Frontline 802.11 Hardware & Software User Manual
Page 99

Chapter 4 Capturing and Analyzing Data TELEDYNE LECROY
Figure 4.35 - Connection Filter from frame selection right-click
Creating from any Frame Display window
A Connection Filter can be created from any open Frame Display window, and the filtering will always be applied
to the original captured data set.
4.3.1.13.2.2 Connection Filter Display
Once you have selected which connections to filter in, another Frame Display will open. The original Frame
Display will remain open, and can be minimized.
Note: The system currently limits the number of frame displays to 5. This limit includes any
Frame Displays opened using Duplicate View from the Toolbar (see Working with
Multiple Frame Displays on page 71)
The new Frame Display with the filtered connection frames will only contain the data defined by the filter criteria.
That is, the criteria could be a single link or data for a particular technology.
Frontline 802.11 Hardware & Software User Manual 93
Page 100

TELEDYNE LECROY Chapter 4 Capturing and Analyzing Data
Display Example 1: Bluetooth low energy Access Address selected
Figure 4.36 - Front Display: Filtered on Access Address 0x8e89bed6
In the figure above is an example Bluetooth low energy data set connection filtered on Access Address =
0x8e89bed6. The Frame Display in the front is the filtered data set. One way to note the difference between the
original and the filtered display is to observe the Protocol Tabs. In the filtered display there are four low energy
protocol tabs as compared to nine in the original display. This access address connection is not using five of the
protocols.
From any open Frame display the user can set another Connection Filter based on the original data set.
Display Example 2: All 802.11 data filtered in
In this example, there is a capture file with Classic Bluetooth, Bluetooth low energy, and 802.11. To view just the
802.11 data set, 802.11 = All is selected from the right-click pop up menu.
94 Frontline 802.11 Hardware & Software User Manual
 Loading...