

Page 1
Getting Started
Manual
WaveRunner® Xi-A
WaveRunner MXi-A
Series Oscilloscopes
Page 2

Page 3

WaveRunner® Xi-A / MXi-A
Series Oscilloscopes
Getting Started Manual
January 2013
Page 4

700 Chestnut Ridge Road
Chestnut Ridge, NY, 10977-6499
Tel: (845) 425-2000
Fax: (845) 578 5985
teledynelecroy.com
© 2013 Teledyne LeCroy, Inc. All rights reserved.
Unauthorized duplication of Teledyne LeCroy documentation materials other than for internal sales and
distribution purposes is strictly prohibited. However, clients are encouraged to distribute and duplicate
Teledyne LeCroy documentation for their own internal educational purposes.
WaveRunner and Teledyne LeCroy are registered trademarks of Teledyne LeCroy, Inc. Windows is a
registered trademark of Microsoft Corporation. Other product or brand names are trademarks or requested
trademarks of their respective holders. Information in this publication supersedes all earlier versions.
Specifications are subject to change without notice.
Warranty
NOTE: THE WARRANTY BELOW REPLACES ALL OTHER WARRANTIES, EXPRESSED OR IMPLIED, INCLUDING
BUT NOT LIMITED TO ANY IMPLIED WARRANTY OF MERCHANTABILITY, FITNESS, OR ADEQUACY FOR ANY
PARTICULAR PURPOSE OR USE. TELEDYNE LECROY SHALL NOT BE LIABLE FOR ANY SPECIAL, INCIDENTAL, OR
CONSEQUENTIAL DAMAGES, WHETHER IN CONTRACT OR OTHERWISE. THE CUSTOMER IS RESPONSIBLE FOR
THE TRANSPORTATION AND INSURANCE CHARGES FOR THE RETURN OF PRODUCTS TO THE SERVICE
FACILITY. TELEDYNE LECROY WILL RETURN ALL PRODUCTS UNDER WARRANTY WITH TRANSPORT PREPAID.
The oscilloscope is warranted for normal use and operation, within specifications, for a period of three years
from shipment. Teledyne LeCroy will either repair or, at our option, replace any product returned to one of
our authorized service centers within this period. However, in order to do this we must first examine the
product and find that it is defective due to workmanship or materials and not due to misuse, neglect,
accident, or abnormal conditions or operation.
Teledyne LeCroy shall not be responsible for any defect, damage, or failure caused by any of the following:
a) attempted repairs or installations by personnel other than Teledyne LeCroy representatives or b)
improper connection to incompatible equipment, or c) for any damage or malfunction caused by the use of
non-Teledyne LeCroy supplies. Furthermore, Teledyne LeCroy shall not be obligated to service a product
that has been modified or integrated where the modification or integration increases the task duration or
difficulty of servicing the oscilloscope. Spare and replacement parts, and repairs, all have a 90-day warranty.
The oscilloscope's firmware has been thoroughly tested and is presumed to be functional. Nevertheless, it is
supplied without warranty of any kind covering detailed performance. Products not made by Teledyne
LeCroy are covered solely by the warranty of the original equipment manufacturer.
922138-00 Rev A
January 2013
Page 5

Getting Started Manual
TABLE OF CONTENTS
Safety Instructions ..................................................................................................... 1
Symbols................................................................................................................... 1
Precautions ............................................................................................................. 2
Operating Environment .......................................................................................... 3
Cooling .................................................................................................................... 3
Cleaning .................................................................................................................. 3
Power Consumption ............................................................................................... 4
Power and Ground Connections ............................................................................. 4
Standby Power ........................................................................................................ 5
Calibration .............................................................................................................. 5
When Your Oscilloscope is Delivered ......................................................................... 6
Check that You Have Everything ............................................................................. 6
Maintenance Agreements ...................................................................................... 6
Windows License Agreement ................................................................................. 6
Power-Up and Installation ......................................................................................... 7
Power-Up ................................................................................................................ 7
Software ................................................................................................................. 7
Adding a New Option.............................................................................................. 7
Restoring Software ................................................................................................. 7
External Monitor..................................................................................................... 8
Hardware Connections ........................................................................................... 8
Software ................................................................................................................. 9
Adding a New Option.............................................................................................. 9
Video Setup ............................................................................................................ 9
Probes ..................................................................................................................... 12
Front Panel Controls ................................................................................................ 14
Front Panel Buttons and Knobs ............................................................................ 15
Trigger Controls .................................................................................................... 15
Horizontal Controls ............................................................................................... 16
Vertical Controls ................................................................................................... 16
Zoom Control Knobs ............................................................................................. 16
Special Features Controls ..................................................................................... 17
922138-00 Rev A i
B
Page 6

WaveRunner Xi-A and MXi-A Oscilloscopes
Understanding Display Information ......................................................................... 19
Top Menu Bar (File Menu) .................................................................................... 19
Grid Area ............................................................................................................... 20
Trace Descriptors .................................................................................................. 21
Dialog Boxes ......................................................................................................... 22
Message Bar ......................................................................................................... 22
Alternative Access Methods .................................................................................... 23
Top Menu Bar ....................................................................................................... 23
Mouse and Keyboard Operation .......................................................................... 23
Displaying Signals/Traces - Vertical Setup ................................................................ 24
Turn On Channels ................................................................................................. 24
Coupling ................................................................................................................ 25
Deskew ................................................................................................................. 25
Probe Attenuation ................................................................................................ 25
Bandwidth Limiting ............................................................................................... 26
Averaging Your Signal ........................................................................................... 26
Interpolation Settings ........................................................................................... 26
Noise Filtering (ERES) ............................................................................................ 26
Using Toolbar Shortcuts ....................................................................................... 26
Turning On Traces .................................................................................................... 28
Vertical Settings and Channel Controls .................................................................... 30
Adjusting Sensitivity ............................................................................................. 30
Adjusting the Waveform's Position ...................................................................... 31
Sampling Modes ...................................................................................................... 32
WaveStream/Intensity ............................................................................................. 32
Timebase Setup ....................................................................................................... 33
Combining Channels ............................................................................................. 33
Triggering ................................................................................................................. 35
Simple Triggers ..................................................................................................... 35
Standard Triggers .................................................................................................. 38
SMART Triggers ..................................................................................................... 39
Serial Trigger and Decode ........................................................................................ 40
Accessing Serial Decode Triggers .......................................................................... 40
Serial Decode and Decode Setup .......................................................................... 41
TriggerScan ........................................................................................................... 42
ii 922138-00 Rev A
Page 7

Getting Started Manual
Waveform Measurements ....................................................................................... 45
Measuring with Cursors ........................................................................................ 45
Cursors Setup ........................................................................................................ 46
Parameter Measurements ....................................................................................... 48
WaveScan™ Advanced Search and Analysis ............................................................. 50
WaveScan Signal Views ........................................................................................ 50
WaveScan Search Modes...................................................................................... 51
Parameter Measurements .................................................................................... 51
Sampling Mode ..................................................................................................... 51
Parameter Analysis .................................................................................................. 52
Trend Measurements ........................................................................................... 52
Track View ............................................................................................................ 52
JitterTrack View .................................................................................................... 52
Histograms ............................................................................................................... 53
Creating and Viewing a Histogram ....................................................................... 53
Display Formats ....................................................................................................... 58
Display Setup ........................................................................................................ 58
Persistence Setup ................................................................................................. 60
Zooming Waveforms ............................................................................................ 61
Turn Off Zoom ...................................................................................................... 63
Save and Recall ........................................................................................................ 64
Saving and Recalling Oscilloscope Settings ........................................................... 64
Saving and Recalling Waveforms .......................................................................... 66
Printing and File Management ................................................................................. 70
Printing ................................................................................................................. 70
Managing Files ...................................................................................................... 72
Documenting Your Work ......................................................................................... 73
Creating a LabNotebook Entry .............................................................................. 73
Waveform Math ...................................................................................................... 74
FFT Setup .............................................................................................................. 74
Pass/Fail Testing ................................................................................................... 76
Remote Control Operation....................................................................................... 84
Standards .............................................................................................................. 84
Program Messages ............................................................................................... 84
Automation ............................................................................................................. 85
Standards .............................................................................................................. 85
922138-00 Rev A iii
B
Page 8

WaveRunner Xi-A and MXi-A Oscilloscopes
Utilities .................................................................................................................... 86
Status .................................................................................................................... 86
Remote communication ....................................................................................... 86
Hardcopy .............................................................................................................. 88
Aux Output ........................................................................................................... 90
Setting the Date and Time .................................................................................... 91
Options ................................................................................................................. 92
Service .................................................................................................................. 92
Show Windows Desktop ....................................................................................... 92
Touch-Screen Calibration ..................................................................................... 93
Preferences ........................................................................................................... 93
Acquisition ............................................................................................................ 95
Acquisition Status ................................................................................................. 97
System Recovery ...................................................................................................... 98
About the Recovery Tool ...................................................................................... 98
Recovery Procedure.............................................................................................. 99
Restarting the Application after Recovery .......................................................... 101
Restarting the Operating System ........................................................................ 102
Reference .............................................................................................................. 104
Specifications ...................................................................................................... 104
Certifications ....................................................................................................... 104
Contact Teledyne LeCroy .................................................................................... 108
End-User License Agreement for Teledyne LeCroy X-Stream Software ............. 109
Windows® License Agreement ............................................................................ 117
iv 922138-00 Rev A
Page 9
Getting Started Manual
CAUTION of damage to instrument, or WARNING of hazard to
health. Attend to the accompanying information to protect
against personal injury or damage. Do not proceed until
conditions are fully understood and met.
WARNING. Risk of electro-shock.
Measurement ground connection.
Safety (protective) ground connection.
Alternating Current.
Safety Instructions
This section contains instructions that must be observed to keep the
instrument operating in a correct and safe condition. You are required to
follow generally accepted safety procedures in addition to the precautions
specified in this section. The overall safety of any system incorporating this
instrument is the responsibility of the assembler of the system.
Symbols
These symbols appear on the instrument's front or rear panels and in its
documentation to alert you to important safety considerations.
922138-00 Rev A 1B
Page 10

WaveRunner Xi-A and MXi-A Oscilloscopes
Precautions
Use proper power cord. Use only the power cord shipped with this
instrument and certified for the country of use.
Maintain ground. This product is grounded through the power cord
grounding conductor. To avoid electric shock, connect only to a
grounded mating outlet.
Connect and disconnect properly. Do not connect/disconnect probes or
test leads while they are connected to a voltage source.
Observe all terminal ratings. Do not apply a voltage to any input (C1, C2,
C3, C4 or EXT) that exceeds the maximum rating of that input. Refer to
the front of the oscilloscope for maximum input ratings.
Use only within operational environment listed. Do not use in wet or
explosive atmospheres.
Use indoors only.
Keep product surfaces clean and dry.
Do not block the cooling vents. Leave a minimum six-inch (15 cm) gap
between the instrument and the nearest object. Keep the underside
clear of papers and other objects.
Do not remove the covers or inside parts. Refer all maintenance to
qualified service personnel.
Do not operate with suspected failures. Do not use the product if any part
is damaged. Obviously incorrect measurement behaviors (such as
failure to calibrate) might indicate impairment due to hazardous live
electrical quantities. Cease operation immediately and sequester the
instrument from inadvertent use.
2 922138-00 Rev A
Page 11

Getting Started Manual
Operating Environment
Temperature: 5 to 40 °C
Humidity: Maximum relative humidity 80% for temperatures up to 31
decreasing linearly to 50% relative humidity at 40 °C.
Altitude: Up to 2,000 m
NOTE: Direct sunlight, radiators, and other heat sources should be taken into
account when assessing the ambient temperature.
°C
Cooling
The instrument relies on forced air cooling with internal fans and vents. Take
care to avoid restricting the airflow to any part of the oscilloscope. Around the
sides and rear, leave a minimum of 15 cm (6 inches) between the instrument
and the nearest object. At the bottom, the oscilloscope feet (up or down)
provide adequate clearance.
CAUTION. Do not block oscilloscope vents. Always keep the area
beneath the oscilloscope clear of paper and other items.
The instrument also has internal fan control circuitry that regulates the fan
speed based on the ambient temperature. This is performed automatically
after start-up.
Cleaning
Clean only the exterior of the oscilloscope using a damp, soft cloth. Do not use
harsh chemicals or abrasive elements. Under no circumstances submerge the
instrument or allow moisture to penetrate it. Avoid electric shock by
unplugging the power cord from the AC outlet before cleaning.
CAUTION. Do not attempt to clean internal parts. Refer to qualified
service personnel.
922138-00 Rev A 3B
Page 12

WaveRunner Xi-A and MXi-A Oscilloscopes
Power Consumption
The instrument operates from a single-phase, 100 to 240 V
power source at 50/60 Hz (+/-5%), or single-phase 100 to 120 V
power source at 400 Hz (+/-5%).
No manual voltage selection is required because the instrument automatically
adapts to line voltage.
Depending on the accessories installed (front panel probes, PC port plug-ins,
etc.), the instrument can draw up to 340 Watts (340 VA) max - all 4 channel
models and 290 Watts (290VA) - all 2 channel models. Power consumption
during Standby State: 12 watts – all models.
NOTE: The instrument automatically adapts itself to the AC line input within
the following ranges:
Voltage Range: 90 to 264 Vrms 90 to 132 Vrms
Frequency Range: 47 to 63 Hz 380 to 420 Hz
(+/-10%) AC
rms
(+/-10%) AC
rms
Power and Ground Connections
The instrument is provided with a grounded cord set containing a molded
three-terminal polarized plug and a standard IEC320 (Type C13) connector for
making a line voltage and a safety ground connection. The AC inlet ground
terminal is connected directly to the frame of the instrument. For adequate
protection against electrical shock hazard, the power cord plug must be
inserted into a mating AC outlet containing a safety ground contact. Use only
the power cord specified for this instrument and certified for the country of
use.
WARNING. Any interruption of the protective conductor inside or
outside of the scope, or disconnection of the safety ground terminal
creates a hazardous situation. Intentional interruption is prohibited.
The oscilloscope should be positioned to allow easy access to the socketoutlet. Power is completely removed from the oscilloscope by unplugging the
power cord from the AC outlet.
The power cord should be unplugged from the AC outlet if the instrument is
not used for an extended period of time.
4 922138-00 Rev A
Page 13

Getting Started Manual
CAUTION. The outer shells of the front panel terminals (CH1, CH2, CH3,
CH4, EXT) are connected to the instrument chassis, and therefore to the
safety ground.
WARNING. Interrupting the protective conductor inside or outside the
oscilloscope, or disconnecting the safety ground terminal, creates a
hazardous situation. Intentional interruption is prohibited.
Standby Power
The Power (Standby) button controls the operational state of the
oscilloscope. Press the button to switch the instrument On or into Standby
mode (Off).
Always use the Power button or the File > Shutdown menu option to execute a
proper shut down process and preserve settings before powering down.
Powering off does not disconnect the oscilloscope from the AC power supply.
The only way to fully power down the instrument is to shut down then unplug
the AC power cord from the outlet.
We recommend unplugging the instrument if it will be unused for a long
period of time.
Calibration
The recommended calibration interval is one year. Calibration should be
performed by qualified personnel only.
922138-00 Rev A 5B
Page 14

WaveRunner Xi-A and MXi-A Oscilloscopes
When Your Oscilloscope is Delivered
Check that You Have Everything
First, verify all items on the packing list or invoice copy have shipped. Contact
your nearest Teledyne LeCroy customer service center or national distributor
and report any missing or damaged items. We cannot be responsible for
replacement unless contacted immediately.
Maintenance Agreements
We offer a variety of services under the heading of Maintenance Agreements.
These give extended warranty and allow you to budget maintenance costs
after the initial three-year warranty has expired. Installation, training,
enhancements, and on-site repairs — among other services — are available
through special supplemental support agreements. Inquire at your Teledyne
LeCroy customer service center or national distributor.
Windows License Agreement
Teledyne LeCroy's agreement with Microsoft prohibits users from running
software on Teledyne LeCroy X-Stream oscilloscopes irrelevant to measuring,
analyzing, or documenting waveforms.
6 922138-00 Rev A
Page 15
Getting Started Manual
Power-Up and Installation
Power-Up
Press the power switch at the bottom-left, front of the oscilloscope to
turn power on or off. Hibernate mode is not supported.
CAUTION. Do not change the System standby and System hibernate
settings from Never (default) selections on the Windows® Power
Options screen.
Software
You can find out the oscilloscope's software and hardware configuration as
follows:
In the tool bar, touch Utilities. Then, in the dialog area, touch Status.
Adding a New Option
New software options can be added after purchasing a code and then enabling
the option on the oscilloscope. Call Teledyne LeCroy Customer Support to
place an order and receive the code.
Restoring Software
Restarting the Application
Upon initial power-up, the oscilloscope loads the instrument application
software automatically.
If you exit the application and want to reload it, touch the shortcut icon on the
desktop:
922138-00 Rev A 7B
Page 16
WaveRunner Xi-A and MXi-A Oscilloscopes
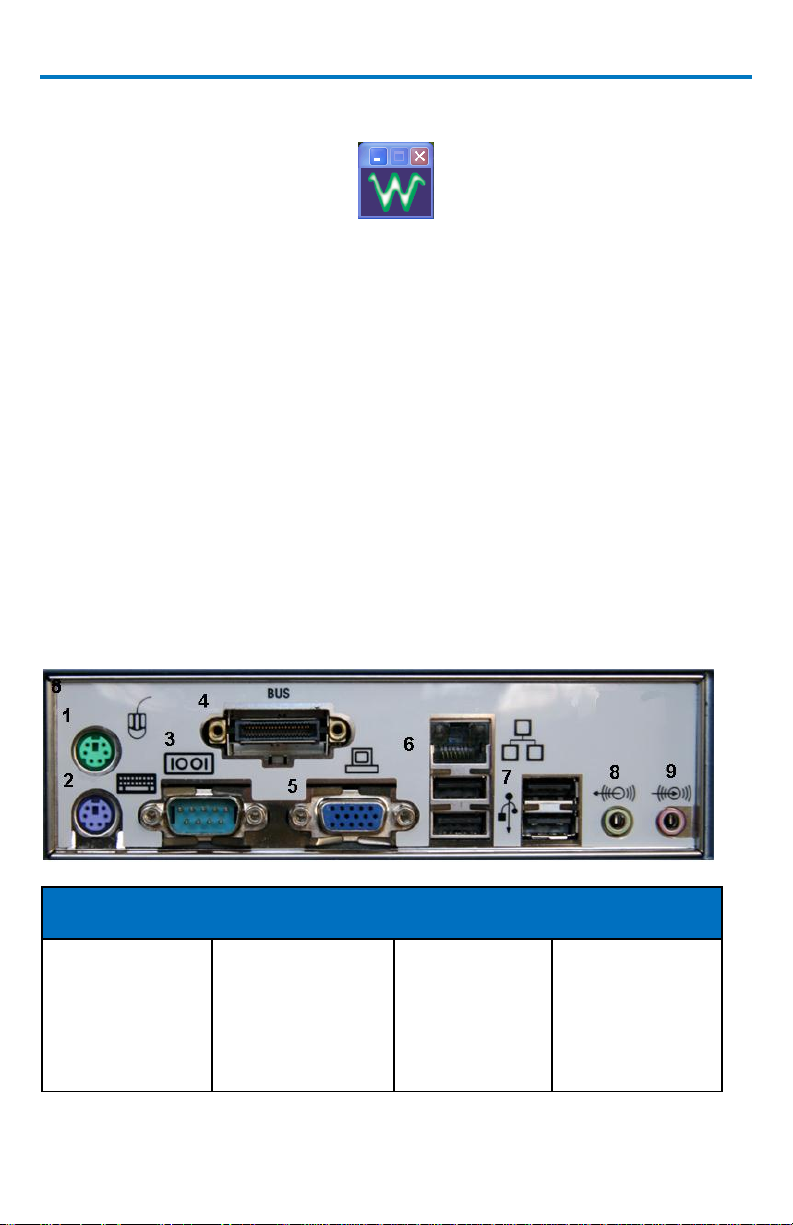
Numbers on the previous picture correspond as follows:
1. Mouse
3. RS-232-C Port
6. Ethernet Port
8. Speakers
2. Keyboard
4. Teledyne LeCroy
Bus (LBus)
7. USB Ports (4)
9. Line In
5. External VGA
Monitor
If you minimize the application, touch the desktop icon to maximize it:
Restarting the Operating System
If you need to restart the Windows® operating system, you must reboot the
oscilloscope by pressing the power switch, and then turning the power back
on after a ten-second wait.
External Monitor
Your WaveRunner Xi Series oscilloscope’s motherboard contains a dual-video
chip. This enables extension of the desktop over two monitors or to display a
clone of the oscilloscope screen on an external monitor.
For example, in extended mode, the scope can be showing the UI on the
internal monitor and another application like Excel® on the external monitor,
or vice versa. Or, turn the scope monitor off and view the scope UI only from
the external monitor if desired.
Hardware Connections
8 922138-00 Rev A
Page 17

Getting Started Manual
Minimize the oscilloscope UI by selecting File
Minimize.
Software
The oscilloscope’s hardware and software configuration can be seen as
follows:
In the menu bar, touch Utilities.
In the dialog area, touch Status.
Adding a New Option
New software options can be added after purchasing a code and then enabling
the option on the instrument. Call Teledyne LeCroy Customer Support to place
an order and receive the code.
Monitor Hookup
Connect the external monitor to the VGA port on the side of the instrument
(4).
Plug in the monitor's power cord, and turn on the monitor.
Video Setup
After the system boots, configure the monitors as follows:
NOTE: A mouse is required for dual monitor use.
922138-00 Rev A 9B
Page 18
WaveRunner Xi-A and MXi-A Oscilloscopes
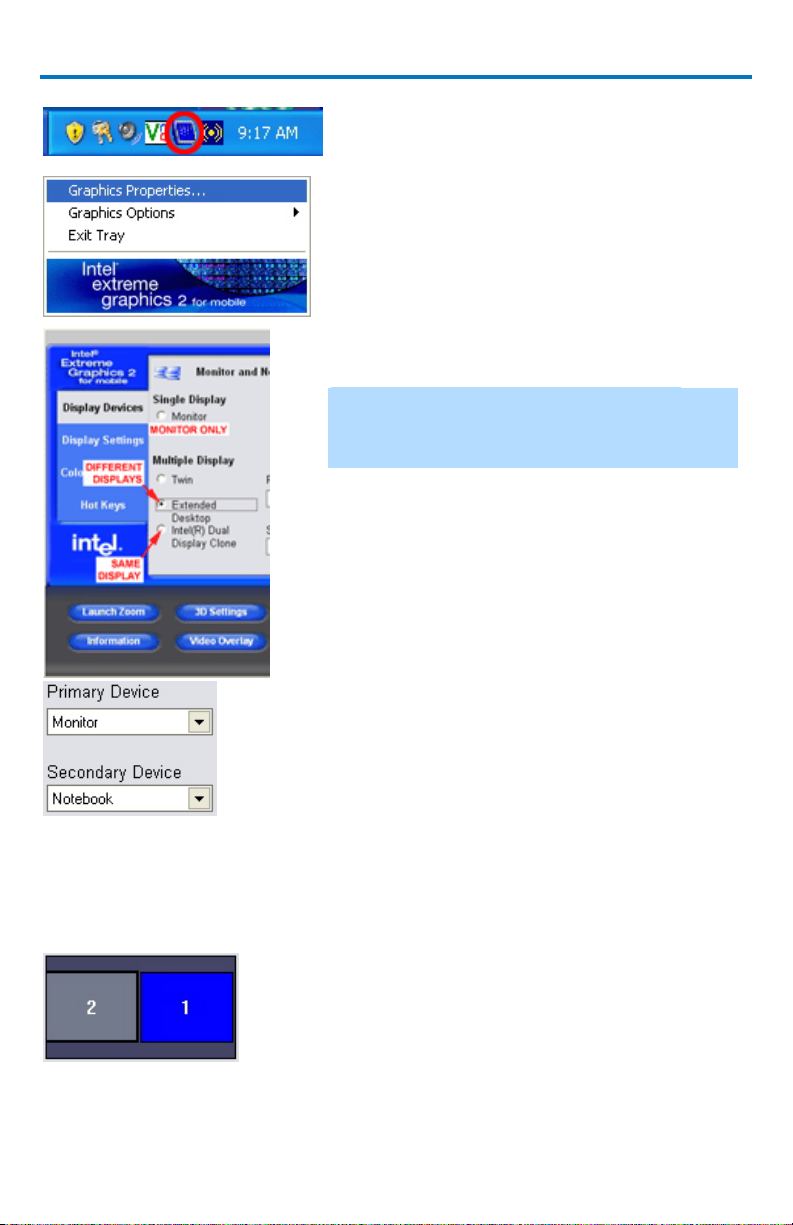
In the system tray portion of the task bar, click
the Intel® monitor icon.
From the Intel® extreme graphics2 for mobile
pop-up menu, select Graphics Properties…
From the Display Devices dialog, select a display
mode.
NOTE: In these dialogs the oscilloscope
monitor is referred to as Notebook, and the
external monitor as Monitor.
From the Primary Device drop-down menu, select
the primary display monitor (the one to show the
oscilloscope UI).
If the external monitor is considerably larger than
the oscilloscope’s monitor, you may want to make
it the primary device.
The monitor not selected as primary is
automatically shown in the Secondary Device
box.
This setting determines mouse
pointer movement from one
monitor to the other.
Drag and drop the monitor icons as desired. For
example, if the secondary monitor (2) is left of the
primary monitor (1), the monitor 2 icon should be
placed to the left of the monitor 1 icon.
The monitors may also be placed on top of the
other to arrange them vertically.
10 922138-00 Rev A
Page 19
Getting Started Manual
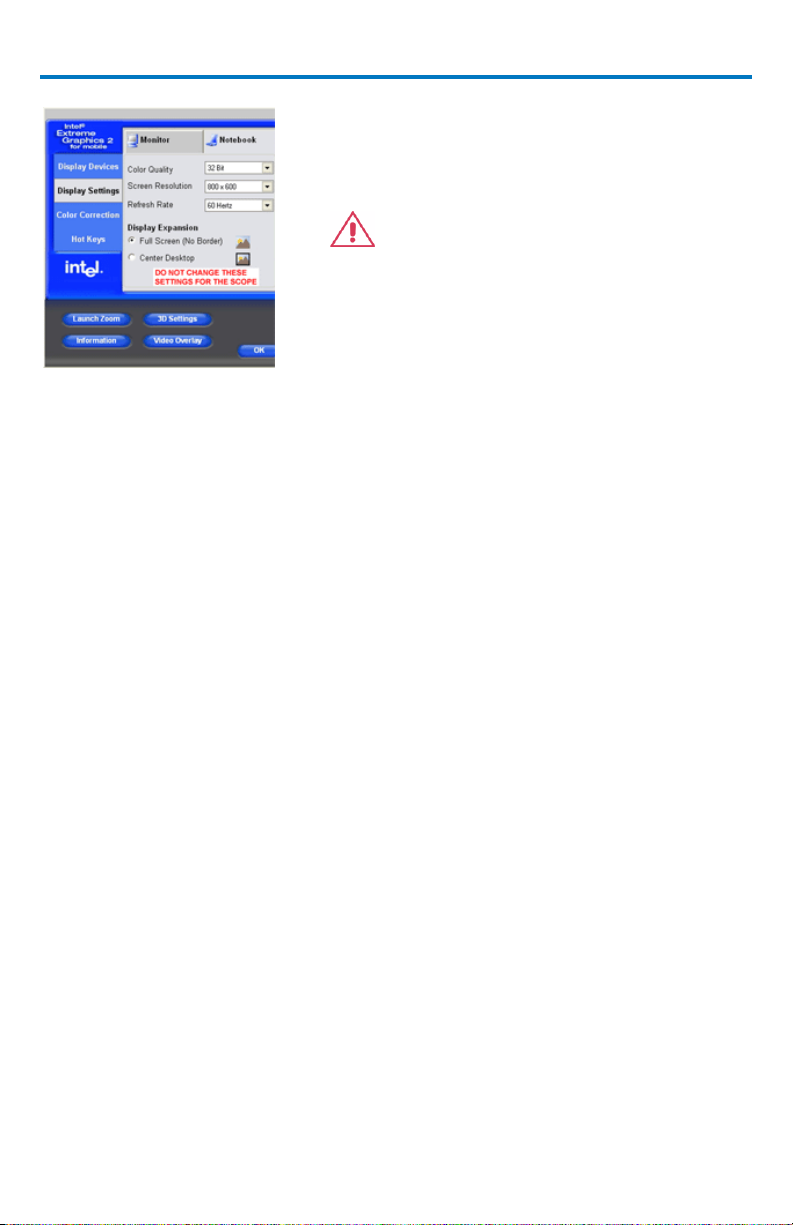
Click Display Settings and set the resolution
(screen area) and color palette for the external
monitor.
CAUTION. Do not change these
settings for the Notebook
(oscilloscope) monitor in order to maintain
proper oscilloscope display functionality.
Click OK.
922138-00 Rev A 11B
Page 20

WaveRunner Xi-A and MXi-A Oscilloscopes
Current
Probes
Current Probes measure the current passing through a wire. They do
not use the traditional probing style of placing a tip onto a test point.
Instead, a wire is placed inside of the jaw of the probe, which then
allows the probe to measure the current (in Amps).
Active
Probes
There are two different types of active probes: single-ended and
differential.
Single-ended: A single-ended active probe is associated with
measuring voltages at high frequencies. Measurement with an active
probe requires a test point and a ground point. The ground (also
called earth) acts as a zero reference for the test point measurement.
Differential: Differential active probes are like two probes in one.
Instead of measuring a test point in relation to a ground point (like
single-ended active probes), differential probes measure the
difference in voltage of a test point in relation to another test point.
Passive
Probes
Passive probes measure voltages at lower frequencies (<400 MHz).
They have higher input capacitance (input C) and do not need power
to operate (unlike active probes). At higher frequencies, higher input
capacitance loads the test circuit, attenuating the signal. This is why
active probes are used in high frequency applications. Passive probes
also measure voltage in reference to ground.
High
Voltage
Probes
These are active single ended probes that are designed to measure
high voltages (safely). They measure the voltage in reference to
ground.
Probes
Your WaveRunner Xi oscilloscope is supplied with one passive probe for each
channel. The supplied passive probe has a high-input resistance and low
capacitance make it ideal for general purpose probing of signals with
frequency content from DC through several hundred MHz. The supplied
passive probe has a large selection of connection accessories, supplied
standard with the probe and available from Teledyne LeCroy as optional
accessories.
Teledyne LeCroy also offers a variety of passive and active probes for use with
your WaveRunner Xi Series oscilloscope. Visit teledynelecroy.com for
specifications and ordering information.
12 922138-00 Rev A
Page 21
Getting Started Manual
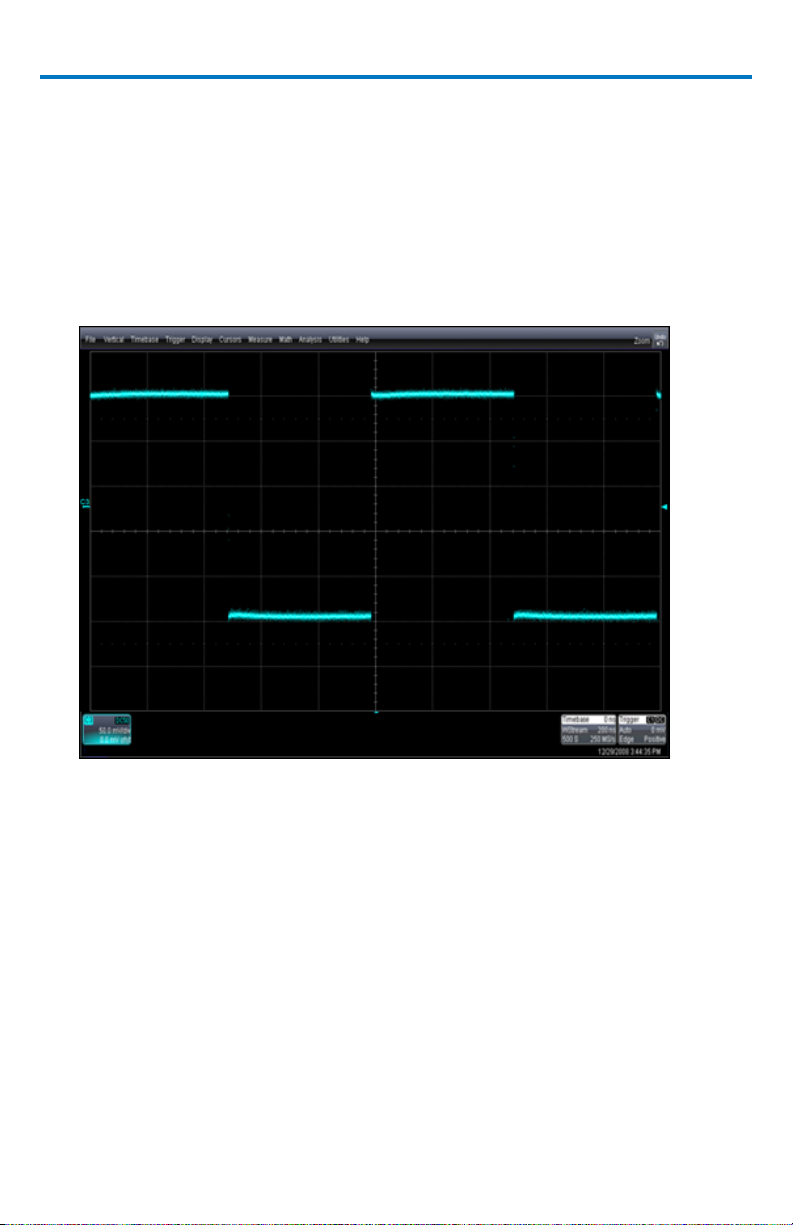
Passive probes must be compensated to flatten overshoot. This is
accomplished by means of a trimmer at the connector end of the probe.
Attach the connector end of supplied passive probe to any channel.
Connect the probe end to the CAL output connector at the front of the
oscilloscope.
Adjust the trim pot at the connector end of the probe until the square wave is
as flat as possible.
922138-00 Rev A 13B
Page 22
WaveRunner Xi-A and MXi-A Oscilloscopes
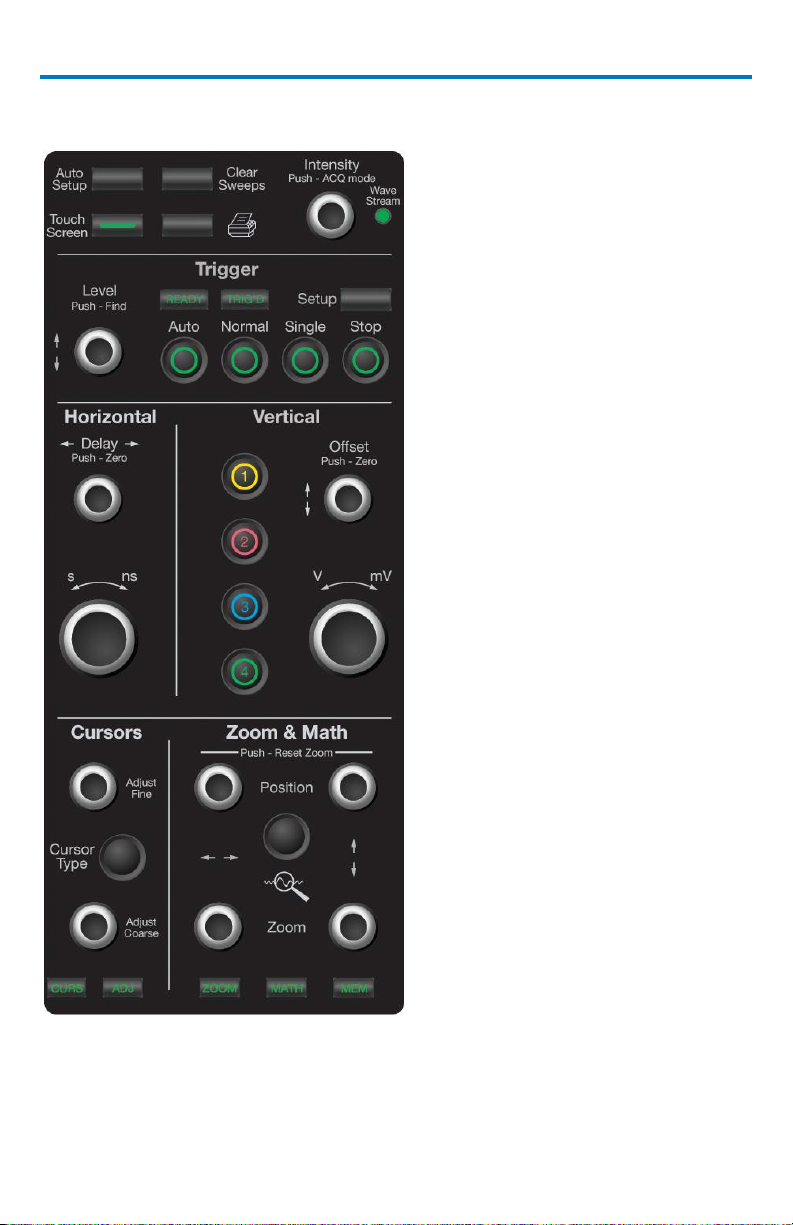
Front Panel Controls
14 922138-00 Rev A
Page 23
Getting Started Manual
Front Panel Buttons and Knobs
The control buttons of the WaveRunner Xi Series front panel are logically
grouped into analog and special function areas. Analog functions are included
in the Horizontal, Trigger, and Vertical groups of control buttons and knobs.
The following table provides an explanation of the front panel push buttons
and knobs:
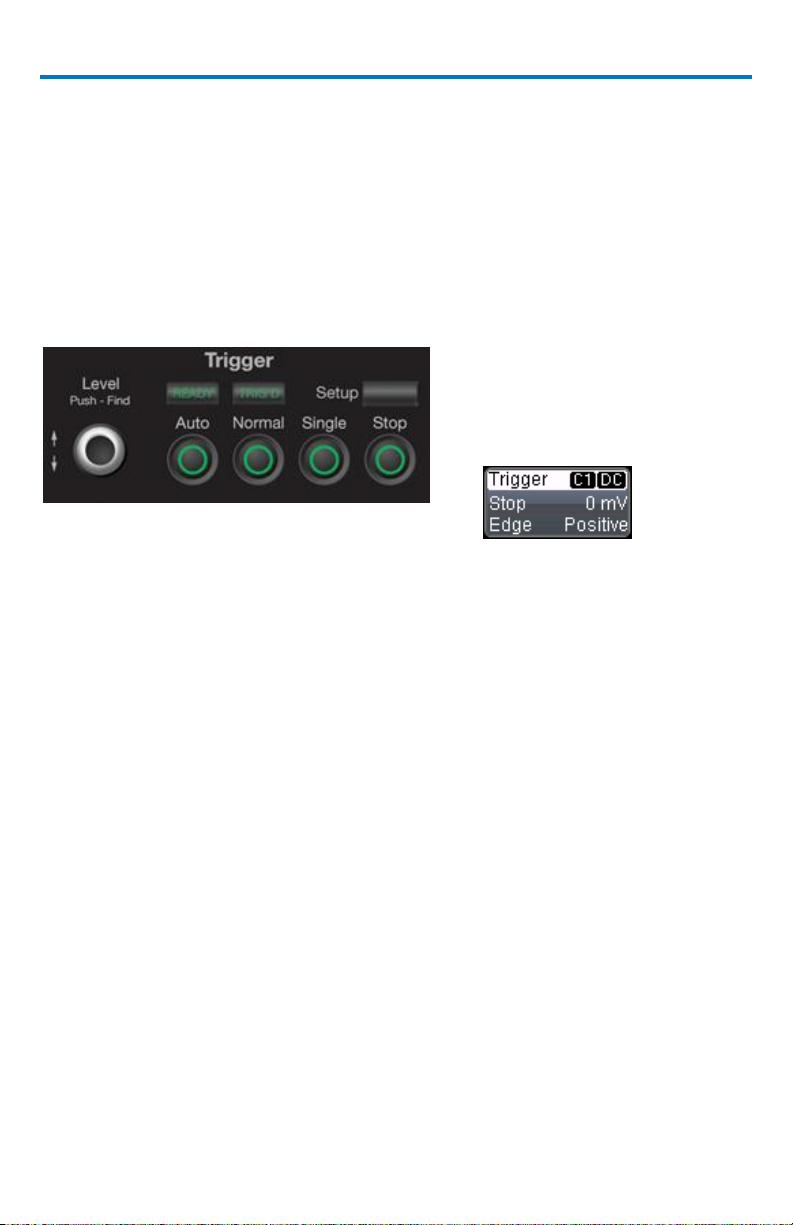
Trigger Controls
LEVEL - Selects the trigger
threshold level. The Level is
indicated in the Trigger
descriptor label:
Push the LEVEL knob to have the oscilloscope find the level automatically.
SETUP - Displays the trigger setup dialog. Push the button again to close the
dialog.
AUTO - Triggers the oscilloscope after a time-out, even if the trigger
conditions are not met.
NORMAL - Triggers the oscilloscope each time a signal is present that meets
the conditions set for the type of trigger selected.
SINGLE - Arms the oscilloscope to trigger once (single-shot acquisition)
when the input signal meets the trigger conditions set for the type of
trigger selected. If the oscilloscope is already armed, it forces a trigger.
STOP - Prevents the oscilloscope from triggering on a signal.
922138-00 Rev A 15B
Page 24
WaveRunner Xi-A and MXi-A Oscilloscopes
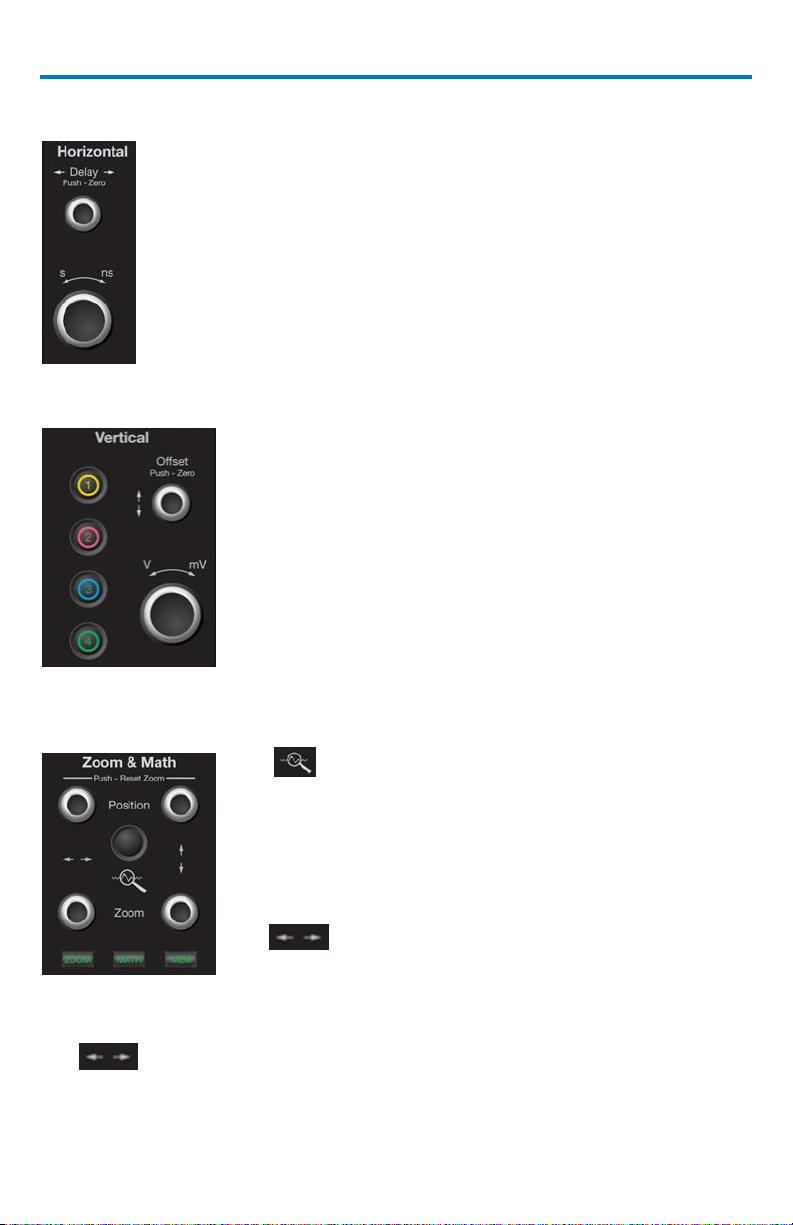
Horizontal Controls
DELAY - Horizontally positions the oscilloscope trace on the
display so you can observe the signal prior to the trigger time.
Push the button to reset the delay to zero. A second push
returns the delay to the previous setting. Delay adjusts the
pre- and post-trigger time.
TIME/DIVISION - Sets the time/division of the oscilloscope
timebase (acquisition system).
Vertical Controls
OFFSET - Adjusts the vertical offset of a channel.
VOLTS/DIV - Adjusts the Volts/Division setting (vertical
gain) of the channel selected.
CHANNEL BUTTONS - If the channel is already ON, the
channel button makes the channel active. If the
channel is OFF, the channel button turns the channel
ON. When the channel is active, the channel button
is lit, and the Offset and Volts/Div knobs are
dedicated to that channel.
Zoom Control Knobs
QUICKZOOM - Automatically displays magnified
views of up to four signal inputs on multiple grids.
With four input signals, the signals are displayed
along with four zoom traces, each on its own grid.
This button turns off all other traces and redefines all
math functions to be zooms of channels.
POSITION - Adjusts the horizontal position of a
zoom trace on the display. The zoom region is
highlighted in color on the source trace. Unlike Delay, the position is not
calibrated to the trigger position.
ZOOM - Adjusts the horizontal zoom (magnification factor) of the
selected zoom trace.
16 922138-00 Rev A
Page 25
Getting Started Manual
POSITION - Adjusts the vertical position of the selected zoom trace on
the display. Unlike Offset, the position is not calibrated to the 0 V
reference.
ZOOM - Adjusts the vertical zoom (magnification factor) of the selected
zoom trace on the display.
INDICATOR LAMPS - The three lamps at the bottom of the panel are lit
according to the kind of trace you are zooming, or whose position you are
adjusting: channel trace, math trace, or memory trace. The exact trace
that is active has a solidly colored descriptor label.
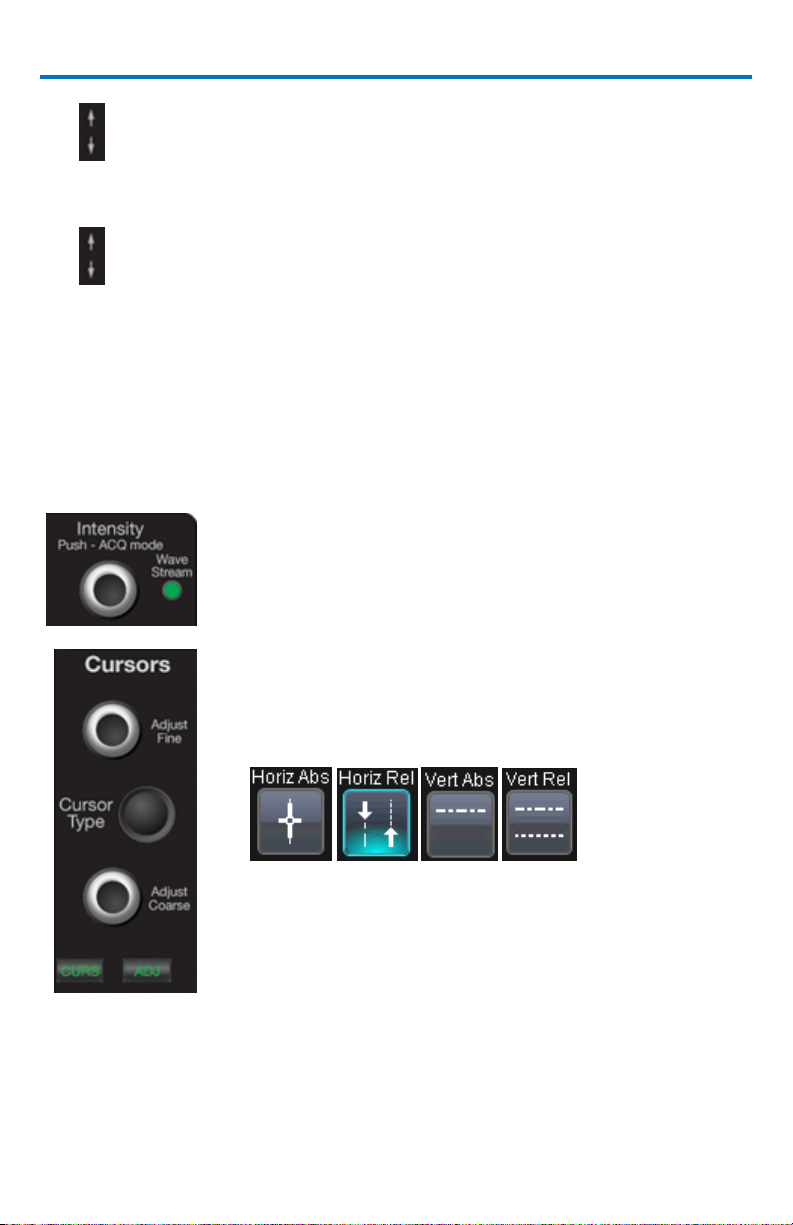
Special Features Controls
INTENSITY - This knob adjusts the intensity of your trace.
Pushing the button toggles between WaveStream fastviewing mode and real-time mode.
WAVESTREAM LAMP - This lamp lights when the
oscilloscope is displaying in WaveStream fast-viewing
mode.
CURSOR TYPE - This push button turns on the cursors,
then cycles through the four different cursor types with
each additional push:
ADJUST FINE - This dual-function knob controls the
placement of the top or left cursor. When the knob is
in Cursor mode, the CURS lamp is lit.
When you click in any data entry field in any dialog, the
knob automatically switches from cursor placement mode
to adjustment mode, and the ADJ lamp lights. This allows you to dial in
fine-grained values. When you close the dialog, the knob reverts to cursor
placement mode.
922138-00 Rev A 17B
Page 26

WaveRunner Xi-A and MXi-A Oscilloscopes
ADJUST COARSE - This dual-function knob controls the placement of the
bottom or right cursor. When the knob is in Cursor mode, the CURS lamp
is lit.
When you click in any data entry field in any dialog, the knob
automatically switches from cursor placement mode to adjustment mode,
and the ADJ lamp lights. This allows you to dial in coarse-grained values.
When you close the dialog, the knob reverts to cursor placement mode.
18 922138-00 Rev A
Page 27
Getting Started Manual
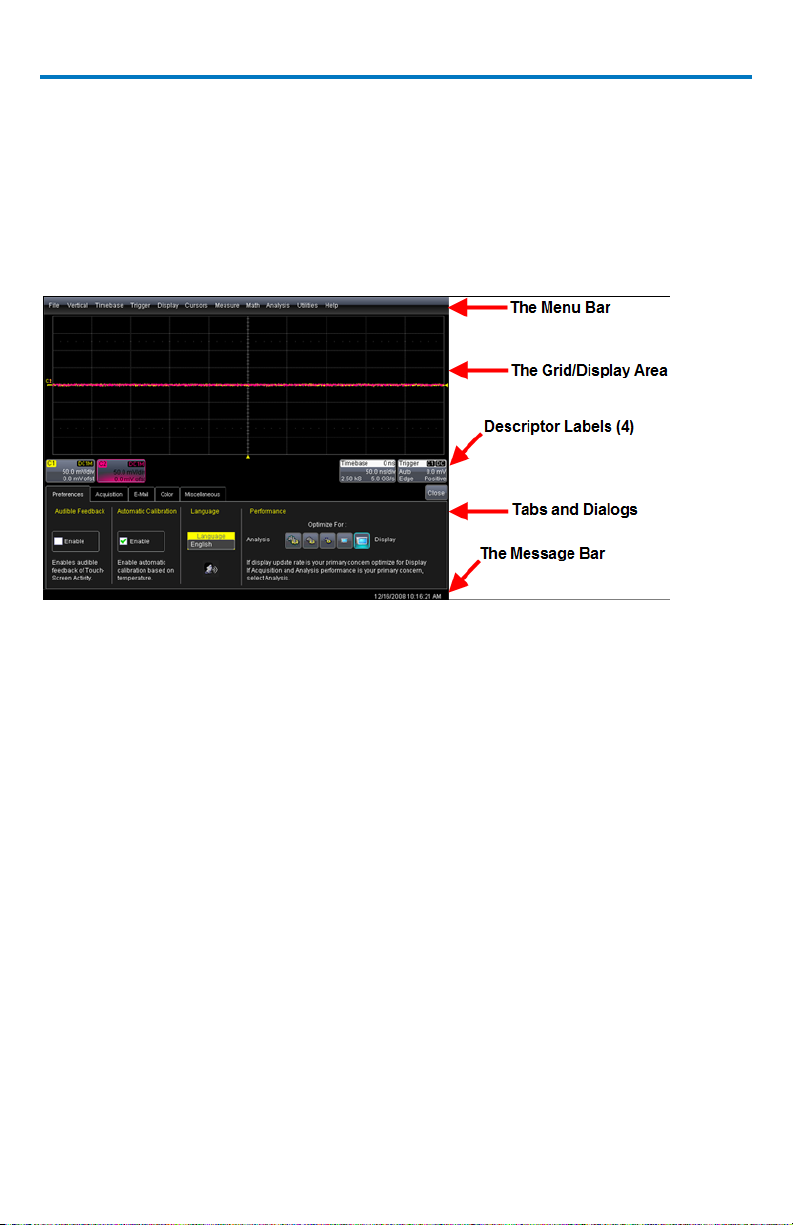
Understanding Display Information
The WaveRunner Xi-A oscilloscope’s display contains valuable information
about the current settings of your Vertical (channel), Horizontal (Timebase),
and Trigger controls. In addition, there are many shortcuts that are available
by using the touch screen capability of your display to quickly access
information or to open dialogs.
Top Menu Bar (File Menu)
The top menu bar provides access to various software dialogs. It is very similar
to the File menu on any Windows program. For common oscilloscope
operations, you don’t need to use the top menu bar (since you can access
most dialogs from the Front Panel or from the Descriptor Labels). However, it
is the only way to access setup or other dialogs for the following:
Display Setup
Save or Recall Waveform
Save or Recall Setups
Print Setup
Vertical (Channel), Horizontal, or Trigger Status
Memory (Reference Waveform) Setup
Pass/Fail Setup
Utilities and Preferences Setup
Help Access
922138-00 Rev A 19B
Page 28
WaveRunner Xi-A and MXi-A Oscilloscopes
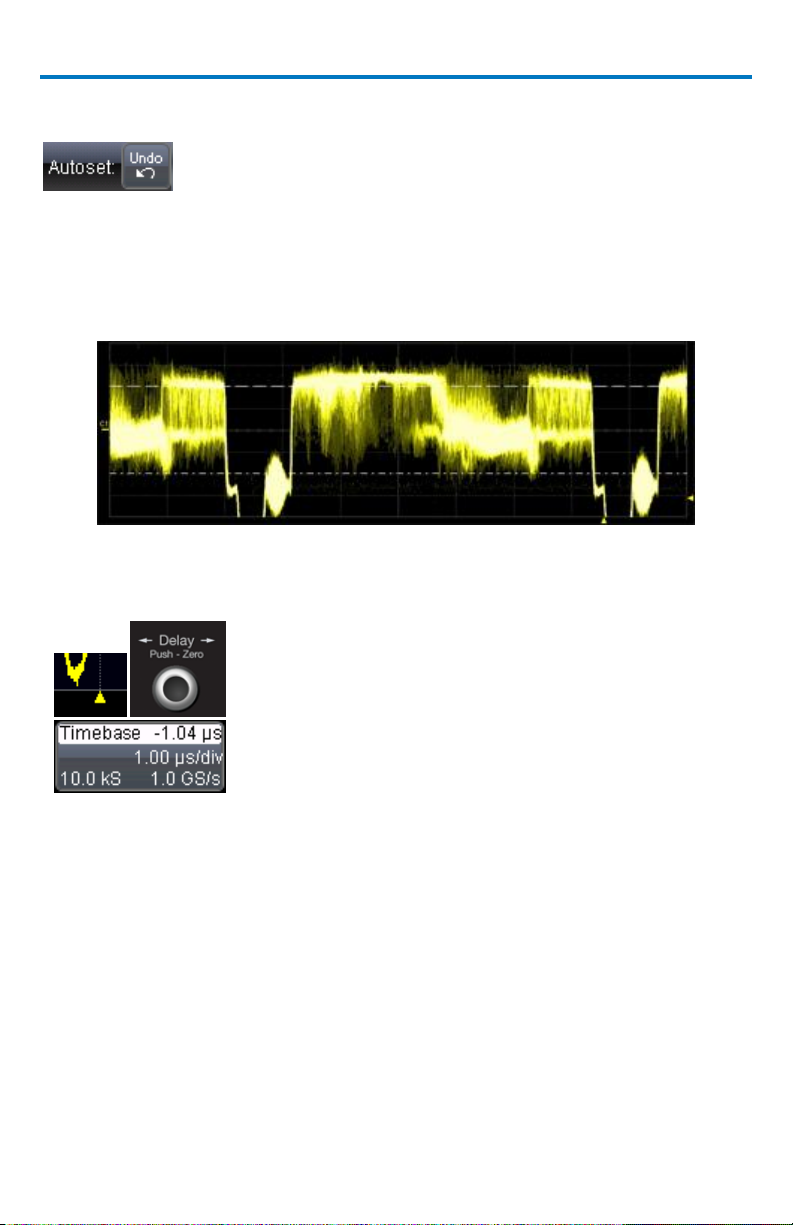
Trigger Delay - This indicator is located along
the bottom edge of the grid. Trigger delay
allows you to see the signal prior to the trigger
time.
All trigger delay values (including post-trigger
delay, shown here) are displayed in the
Timebase Descriptor Label. Zero delay is the
horizontal center of the oscilloscope display.
The default setting (Time) is for the delay to be
read out in seconds, and to move
proportionately when the timebase knob is
turned. If you want to set delay (Div) to a fixed
position on the grid and then have it stay fixed
as the timebase changes, go to Utilities,
Preferences, Acquisition.
At the right-hand end of the top menu bar is an Undo button.
This button appears after the AutoSetup front panel button is pressed, and
after Zooming. If you want to perform an Undo operation, it must be the very
next operation after you perform the Autosetup or Zoom operation.
Grid Area
The grid area is divided into 8 vertical divisions and 10 horizontal divisions just
like any other oscilloscope. There are several indicators on the grid to help you
understand the following:
20 922138-00 Rev A
Page 29
Getting Started Manual
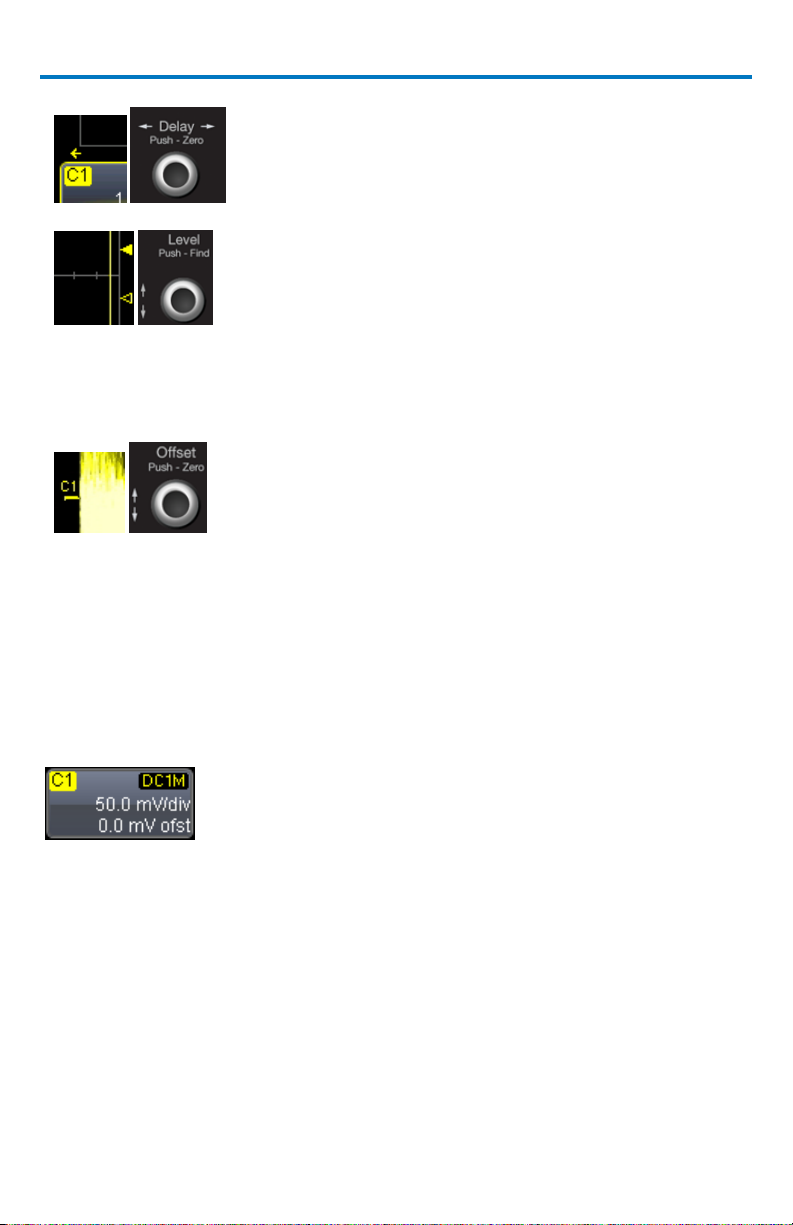
Post-trigger Delay - This is indicated by a left-
pointing arrow below-left of the grid. Pretrigger delay is indicated by a right-pointing
arrow below-right of the grid.
Trigger Level - This indicator is located at the
right edge of the grid. It tracks the trigger level
as you reposition the trace up or down, or
change scale. When triggering is stopped, a
hollow arrow indicates where the new level
ends up when triggering resumes.
Push the LEVEL knob to reset the level to 50%.
Zero Volts Level - This indicator is located at
the left edge of the grid. Change the zero volts
level by turning the VERTICAL OFFSET knob. Push
the knob to reset the indicator to the middle
of the grid.
Channel trace labels show the vertical settings for
the trace, as well as cursor information if cursors
are in use. In the title bar of the label are also
included indicators for (SinX)/X interpolation,
waveform inversion (INV), deskew (DSQ),
coupling, bandwidth limiting (BWL), and averaging
(AVG). These indicators have a long and short
form:
Trace Descriptors
Vertical and horizontal trace descriptor labels are displayed below the grid.
They provide a summary of your channel, timebase, and trigger settings.
Adjust these settings by touching the respective label (its corresponding setup
dialog is then shown).
922138-00 Rev A 21B
Page 30

WaveRunner Xi-A and MXi-A Oscilloscopes
Besides channel traces, math and memory trace
labels are also displayed. Labels are displayed only
for traces that are turned on.
As a visual aid, an active channel (i.e., the one
whose settings can be adjusted by the front panel
knobs) is displayed in solid color.
The title bar of the TimeBase label shows the
trigger delay setting. Time per division and
sampling information is given below the title bar.
The title bar of the Trigger label shows the trigger
mode: Auto, Normal, or Stopped. Below the title
bar is given the coupling (DC), trigger type (Edge),
source (C1), level (0 mV), and slope (Positive).
Shown below the Timebase and Trigger labels is
value information for horizontal cursors, including
the time between cursors and the frequency.
Dialog Boxes
The lower portion of the screen contains dialogs where information is shown,
selections are made, and data is input. Typically, the dialogs are organized into
tabular displays, subtabs, or pop-up dialogs. The dialog area is controlled by
touch screen buttons and front panel buttons.
The following Dialog Area controls also provide assistance when entering data:
Message Bar
The message bar continually displays the time and date. It also displays
oscilloscope status and error messages.
22 922138-00 Rev A
Page 31

Getting Started Manual
Alternative Access Methods
The front panel and display controls provide the most common ways to access
your oscilloscope’s capability. However, the instrument often gives you more
than one way to access dialogs and to make changes.
Top Menu Bar
If you prefer to drive the oscilloscope with the familiarity of Windows, you
might prefer to access dialogs from the menu bar at the top of the display.
This opens dialog boxes at the bottom of the screen, where adjustments can
be made.
The dialog area occupies the bottom one-third of the display. Expand the
signal display area by minimizing each dialog by touching the Close tab at the
right of the dialog box.
In some limited cases, the menu bar is the only way to access certain
functionality, but generally speaking, the most common oscilloscope
functionality can be controlled from the front panel.
Mouse and Keyboard Operation
In the procedures, we focus on touch-screen operation. But if you have a
mouse connected to the instrument, you can click on objects instead of
touching them. Likewise, if you have a keyboard connected, you can use it to
enter data instead of using the virtual keyboard provided by the instrument.
922138-00 Rev A 23B
Page 32

WaveRunner Xi-A and MXi-A Oscilloscopes
Displaying Signals/Traces - Vertical
Setup
Turn On Channels
Connect a signal to a channel (we’ll assume you connected to channel 1 in this
example and that the channel was not already ON).
Press the channel 1 button on the front panel to turn on channel 1. The button
lights and the descriptor label for that channel are shown.
If the signal is not on the grid, press the AUTO trigger button and adjust
Horizontal and Vertical front panel controls to adjust the settings and display
the signal, or simply press the AUTOSETUP button to quickly bring most
repetitive signals onto the grid.
If you need to change probe attenuation, coupling, or bandwidth limiting,
open the channel setup dialog for channel 1 by touching the descriptor label
for channel 1.
Press this button twice if it is not the active trace.
Or, use the Vertical Channel 1 Setup selection from the menu bar to open
the channel 1 setup dialog:
24 922138-00 Rev A
Page 33

Getting Started Manual
At this point, the following dialog is shown at the bottom of the display, and
the grid area shortens until this dialog is closed (by touching the Close button
on the upper right hand corner of this dialog).
Coupling
Coupling choices are as follows:
DC 50 Ω
GROUND
DC 1 MΩ
AC 1 MΩ
Select coupling by touching inside the Coupling field and choosing a coupling
mode from the pop-up menu.
NOTE: The coupling choices for a channel change if a ProBus probe is
connected to a channel.
Deskew
Deskew allows you to compensate for different lengths of cables, probes, or
anything else that might cause timing mismatches between signals. Connect
all probes to the desired channels, then probe a common signal with each
probe and adjust for timing differences using Deskew.
Probe Attenuation
If you use a Teledyne LeCroy ProBus compatible active probe, or a probe
compatible with Probe Ring, the attenuation is automatically set by the
oscilloscope. If it is not automatically set, select a value here by touching
inside the Probe Atten field selecting a value from the pop-up menu.
922138-00 Rev A 25B
Page 34

WaveRunner Xi-A and MXi-A Oscilloscopes
Opens a Measurement selection pop-up menu. You can then
select up to 6 parameters (measurements) for the active
channel from this menu without leaving the Channel Setup
Bandwidth Limiting
You may sometimes want to limit high frequency noise on a very low
bandwidth input signal. If this is the case, you can limit the channel bandwidth
to less than the full bandwidth of the oscilloscope. Select a different
bandwidth by touching inside the Bandwidth field and selecting a value from
the pop-up menu.
Averaging Your Signal
The WaveRunner Xi-A oscilloscope allows you the opportunity to continuously
average your signal to reduce signal noise and aid in signal evaluation. If you
want to use averaging, select a value here by touching inside the Averaging
field and entering a value up to 1 million sweeps on the pop-up keypad.
Interpolation Settings
Linear interpolation, which inserts a straight line between sample points, is
best used to reconstruct straight-edged signals such as square waves. (Sinx)/x
interpolation, on the other hand, is suitable for reconstructing curved or
irregular wave shapes, especially when the sample rate is 3 to 5 times the
system bandwidth.
Noise Filtering (ERES)
The instrument's enhanced resolution feature improves vertical resolution by
a fixed amount for each filter. This real increase in resolution occurs whether
or not the signal is noisy, or your signal is single-shot or repetitive.
The signal-to-noise ratio (SNR) improvement you gain is dependent on the
form of the noise in the original signal. The enhanced resolution filtering
decreases the bandwidth of the signal, filtering out some of the noise.
Using Toolbar Shortcuts
These toolbar shortcuts can be used to perform specific actions for the
channel corresponding to the current setup dialog.
For more information on Measure, Zoom, Math, and Memories (Reference
Waveforms), refer to the section dealing with that subject.
26 922138-00 Rev A
Page 35

Getting Started Manual
dialog. The parameter automatically appears below the grid.
Creates a zoom trace of the channel signal. The zoom trace
becomes active, and you can use the Vertical and Horizontal
controls to modify its scale and position.
Opens a Math selection pop-up menu. You can then select a
math function for the active channel from this menu without
leaving the Channel Setup dialog. The Math trace is then
displayed in its own grid.
Copies the channel trace into its corresponding Memory
(Reference Waveform) location. For instance, C1 is loaded
into M1, C2 is loaded into M2, etc.
Automatically performs a vertical scaling that fits the
waveform into the grid.
Opens a Labeling pop-up menu that allows user-defined
labels tied to the waveform.
1
Another example is these buttons that appear at the bottom of the Measure
Px1 dialogs. Each button opens a menu from which to choose a math trace (F1
to Fx) to display the functions named in the buttons:
By using these buttons you can remain in the Measure dialog to set up other
options.
The number of parameters and math traces available depends on the software options loaded on
your scope.
922138-00 Rev A 27B
Page 36

WaveRunner Xi-A and MXi-A Oscilloscopes
Turn on a channel trace by pushing a front panel
channel select button (displaying the trace label for
the corresponding input channel). While this turns
on the trace, it leaves the current dialog displayed.
If you want to also display the vertical setup dialog
for the channel trace, touch the trace label twice.
The first touch activates the channel, while the
second opens its setup dialog. The appearance of
the selected trace label becomes a solid color when
active:
Turn on a math function trace by touching Math
Math Setup... on the drop-down menu. Touch the
On checkbox for the trace you want to activate.
You can also turn on traces for math functions,
parameters, and memory traces without leaving the
Vertical Adjust dialog by touching the icons at the
bottom of the Vertical Adjust dialog.
Turning On Traces
28 922138-00 Rev A
Page 37

Getting Started Manual
Whenever you turn on a channel or math trace from the menu bar at the top
of the screen, the dialog at the bottom of the screen automatically switches to
the vertical setup or math setup dialog for that selection. You can then
configure your traces.
The channel or math trace number appears in the tab of the appropriate
dialog, signifying that all controls and fields are dedicated to the selected
trace:
922138-00 Rev A 29B
Page 38

WaveRunner Xi-A and MXi-A Oscilloscopes
Touch Vertical Channel 1, for example, from the
menu bar.
Touch inside the Trace On checkbox to display the
trace. Or, use the VERTICAL front panel buttons to
turn it on.
Turn the volts per division knob. Or you can touch
inside the Volts/Div field and type in a value using
the pop-up keypad.
The voltage that you set is displayed in the
Volts/Div field and in the trace descriptor label.
Vertical Settings and Channel Controls
Adjusting Sensitivity
30 922138-00 Rev A
Page 39

Getting Started Manual
Turn the vertical offset adjust knob directly above
the channel button whose waveform you want to
move vertically. Or you can touch inside the Offset
field and type in a value on the pop-up keypad. Set
the vertical offset to zero by pressing the vertical
offset adjust knob for the channel you want to
adjust.
Adjusting the Waveform's Position
922138-00 Rev A 31B
Page 40

WaveRunner Xi-A and MXi-A Oscilloscopes
WaveStream Mode - This fast viewing mode provides
brightness-graded intensity with a decay time similar to the
action of phosphor on an analog screen. WaveStream mode
operates at up to 10 GS/s with an update rate up to 8000
waveforms/second for better capture of higher frequency
abnormal events.
Real Time Mode - A single-shot (real time) acquisition is a
series of digitized voltage values sampled on the input signal
at a uniform rate.
Sequence Mode - In sequence mode, the complete
waveform consists of a number of fixed-size segments
acquired in single-shot mode
Roll Mode - This mode is invoked automatically for slow
acquisitions when the time per division is 200 ms/div or
greater. Roll mode samples at 2 MS/s (depending on
memory availability).
RIS Mode - Random Interleaved Sampling is an acquisition
technique that allows effective sampling rates higher than
the maximum single-shot sampling rate. It is used on
repetitive waveforms with a stable trigger
The INTENSITY knob adjusts the brightness
of your trace. Pushing the button toggles
between WaveStream fast-viewing mode
and real-time mode.
Sampling Modes
Depending on your timebase, the following sampling modes are available:
WaveStream/Intensity
32 922138-00 Rev A
Page 41

Getting Started Manual
Set up the timebase by using the front panel
Horizontal controls, just as for analog oscilloscopes.
Ch 1 & Ch 3
10 GS/s
Ch 1 & Ch 4
10 GS/s
Ch 2 & Ch 3
10 GS/s
Ch 2 & Ch 4
10 GS/s
Timebase Setup
Combining Channels
Channels can be combined to increase sample rate or memory (WaveRunner
44Xi can only be interleaved to maximize memory, not sample rate) in order to
capture and view a signal in all its detail. When you combine channels,
uncombined channels like EXT BNC remain available for triggering, even
though they are not displayed.
In 2-channel operation, channels 2 and 3 are active. In Auto operation, you can
use channel 1 or 2, and channel 3 or 4. On the paired channels the maximum
sampling rate is doubled and the record length is greatly increased:
As you can see, sampling can be maximized to 10 GS/s for any combination of
two channels, except a combination of channels 1 and 2, or channels 3 and 4,
which yield 5 GS/s. The basic rule is to choose either channel 1 or 2 for your
first input, or either channel 3 or 4 for the second input.
Refer to Acquisition Modes in the specifications for maximum sample rates.
922138-00 Rev A 33B
Page 42

WaveRunner Xi-A and MXi-A Oscilloscopes
Touch the Timebase descriptor label.
Under Active Channels, touch 4, 2 or
Auto. The maximum sample rate is
shown alongside each button.
34 922138-00 Rev A
Page 43

Getting Started Manual
Turn the Delay knob in the HORIZONTAL control
group to adjust the trigger's horizontal position.
Or, touch inside the Delay field in the timebase
setup dialog and enter a value, using the pop-up
keypad.
The trigger location is shown by a marker below
the grid
Post-trigger delay is indicated by a left-pointing
arrow below-left of the grid.
The time value is given in the title line of the
TimeBase label below-right of the grid.
Triggering
Simple Triggers
Edge Trigger on Simple Signals
The instrument uses many waveform capture techniques that trigger on
features and conditions that you define. These triggers fall into two major
categories:
Standard Triggers - activated by basic waveform features or conditions
such as a positive or negative slope, and hold-off
SMART Triggers - sophisticated triggers that enable you to use basic or
complex conditions for triggering.
Use Edge Triggers for simple signals, and the SMART Triggers for signals with
rare features, like glitches.
Controlling Edge Triggering
Horizontal:
922138-00 Rev A 35B
Page 44

WaveRunner Xi-A and MXi-A Oscilloscopes
Turn the LEVEL knob in the TRIGGER control group to
adjust the vertical threshold of the trigger or the
highlighted trace. Level defines the source voltage at
which the trigger generates an event: a change in the
input signal that satisfies the trigger conditions.
Alternatively, on the Trigger dialog, touch the Level
field and provide a value (using the pop-up numeric
keypad).
Quickly set a level of zero volts by pushing the Level
button on the front panel.
Push the front panel trigger SETUP button.
Touch the Edge trigger button.
Touch inside the Source field and select an input
from the pop-up menu.
C1 through C4 are abbreviations for Channel 1
through Channel 4.
Ext and Ext/10 allow you to trigger on the External
Input of the oscilloscope. Ext input is +/-0.5 V.
Ext/10 input is
+/-5.0 V.
Line is for triggering on the Positive or Negative
Vertical:
Edge Trigger Setup
36 922138-00 Rev A
Page 45

Getting Started Manual
excursion of the AC power line.
Touch inside the Level field. In the pop-up numeric
keypad, enter a value in millivolts or use the
up/down buttons to increase or decrease the value
in increments of 1 mV. Or move the slider bar to
increase or decrease the values. See Dialog Menu
section for more information on the slider bar.
Touch inside the Coupling field and select a coupling
type.
o DC – All the signal’s frequency components
are coupled to the trigger circuit for high
frequency bursts or where the use of AC
coupling would shift the effective trigger
level.
o AC – The signal is capacitively coupled. DC
levels are rejected, and frequencies below 50
Hz are attenuated.
o LFREJ - The signal is coupled through a
capacitive high-pass filter network, DC is
rejected and signal frequencies below 50 kHz
are attenuated. For stable triggering on
medium-to-high frequency signals.
o HFREJ - Signals are DC coupled to the trigger
circuit and a low-pass filter network
attenuates frequencies above 50 kHz. This is
used for triggering on low frequencies.
Choose Positive, Negative, or Window slope.
Window slope sets a threshold above and below the
trigger level beyond which the signal must pass to
generate a trigger. The slope can be either positive or
negative.
922138-00 Rev A 37B
Page 46

WaveRunner Xi-A and MXi-A Oscilloscopes
Select the holdoff by touching the Holdoff tab, then
the Time or Events button. Using the pop-up
numeric keypad, enter a value and specify the unit of
time, or use the up/down buttons to increase or
decrease the time value in increments of 200 ps. Or,
touch one of the preset value buttons.
Edge
Use Edge trigger for simple, repetitive signals. This trigger is
activated by basic waveform features or conditions such as a
positive or negative slope, and hold-off
Width
Width trigger allows you to define a positive or negative-going
pulse width bounded by a voltage level, above or below where a
trigger occurs. Or you can specify a pulse width and voltage
range, in or outside where a trigger occurs.
Qualified
The Qualified (A-B) trigger allows arming of the trigger on Event
A and triggering on Event B. If the arming event is a Pattern that
occurs once (Pattern) or that occurs and stays satisfied
(PatState), then the triggering event can be an Edge, Width,
Glitch, or Interval condition. This functionality is identical to
Teledyne LeCroy's previous Qualify and State triggers, but
presented in a different UI.
Pattern
Pattern trigger enables triggering on a logical combination
(pattern) of five inputs: CH1, CH2, CH3, CH4, EXT. You have a
choice of four Boolean operators (AND, NAND, OR, NOR), and
you can stipulate the high or low voltage logic level for each
input independently.
TV
TV triggers provide stable triggering on standard or custom
composite video signals. Use them on PAL, SECAM, or NTSC
systems. Use CUSTOM setup for other standards. Standard HDTV
trigger supports 1080i, 1080p, and 720p formats.
Serial
Standard Triggers
38 922138-00 Rev A
Page 47

Serial trigger allows a serial trigger condition to be set from
within the oscilloscope, using an easy-to-understand interface.
NOTE: Teledyne LeCroy offers a wide range of optional serial
data triggering capabilities for serial data standards like I2C, SPI,
UART, CAN and LIN.
SMART Triggers
Glitch
Glitch trigger is a simpler form of Width trigger. Use Glitch
trigger when you want to define a fixed pulse-width time or
time range only. Glitch trigger makes no provision for
voltage levels or ranges.
Interval
While Glitch trigger performs over the width of a pulse,
Interval trigger performs over the width of an interval: the
signal duration (the period) separating two consecutive
edges of the same polarity (positive to positive or negative
to negative). Use interval trigger to capture intervals that
fall short of, or exceed, a given time limit. In addition, you
can define a width range to capture any interval that is
itself inside or outside the specified range, i.e. it can be
used as an Exclusion trigger by interval.
Dropout
Used primarily in single-shot applications, and usually with
a pre-trigger delay, Dropout trigger can detect lost signals.
The trigger is generated at the end of the timeout period
following the last trigger source transition. You can select a
timeout period from 2 ns to 20 s.
Runt
The runt trigger is programmed to occur when a pulse
crosses a first threshold line and fails to cross a second
threshold line before recrossing the first. You can select
both voltage thresholds within a time range of 100 ps to 20
s. Other defining conditions for this trigger are the edge
(triggers on the slope opposite to that selected) and runt
width.
SMART Triggers are defined as follows:
Getting Started Manual
922138-00 Rev A 39B
Page 48

WaveRunner Xi-A and MXi-A Oscilloscopes
Slew Rate
Slew rate trigger activates a trigger when the rising or
falling edge of a pulse crosses two threshold levels: an
upper level and a lower level. The pulse edge must cross
the thresholds faster or slower than a selected period of
time. You can select both thresholds within a range of 2 ns
to 20 s.
Serial Trigger and Decode
A variety of Serial Data standards, such as Inter-IC (I2C) , Serial Peripheral
Interface (SPI), Controller Area Network (CAN), Local Interconnect Network
(LIN), and UART-RS-232 govern communication between microprocessors and
peripherals. The serial triggers are integrated into the oscilloscope - no
external hardware is used - and is selected through the normal oscilloscope
trigger menus. I2C, SPI, CAN, LIN, UART-RS-232 signals are input to the
oscilloscope through normal passive or active probes, such as Teledyne
LeCroy’s ZS Series of high impedance active probes. Decoding is accessed from
the Analysis pull-down menu in the menu bar. The decoding is overlaid on top
of the appropriate channel, and is intuitively presented and color-coded for
quick understanding. Included is a Search capability for specific messages and
a table to display protocol data in summary form underneath the oscilloscope
grid.
Accessing Serial Decode Triggers
Serial triggers can be accessed in two ways:
Touch the Trigger Descriptor Box in the lower right hand corner of the
oscilloscope display.
OR
Touch Trigger → Trigger Setup from the Menu Bar. On the Trigger dialog,
touch Serial on the Type section.
Select the appropriate serial trigger. The menu automatically changes to a
different tab in the Trigger dialog reflecting the selected standard.
40 922138-00 Rev A
Page 49

Getting Started Manual
1. Touch Analysis Serial Decode... from the
menu bar.
The Serial Decode summary dialog is shown and
provides access to Decode Setup.
2. Touch the Channel or Memory Descriptor Box to
open the respective dialog box, and touch the
Decode button in the bottom toolbar.
Serial Decode and Decode Setup
These dialogs provide the ability to set the oscilloscope up for protocol
decoding of serial data messages, with display of the protocol data overlaid on
the signal. They also allow quick and easy access to oscilloscope zooming,
searching, table display, and table export.
The serial decode and decode setup dialogs are accessed in any the following
ways:
922138-00 Rev A 41B
Page 50

WaveRunner Xi-A and MXi-A Oscilloscopes
3. Touch a Channel, Memory, or Math trace to
open a pop-up dialog that displays a shortcut to
the Decode Setup dialog box
Please refer to the Low Speed Serial Data Trigger manual or the Online Help
on your oscilloscope for Serial Trigger information and details.
TriggerScan
TriggerScan is a debugging tool that helps you quickly find rare waveform
glitches and anomalies. With TriggerScan, you can build a list of trigger setups
to look for rare events and automatically sequence through each one.
TriggerScan can use any type of trigger setup available including edge, width,
and qualify as well as Smart Triggers (such as, glitch and runt triggers).
TriggerScan automates two key processes in triggering rare events:
1. Trains the system by looking at normal acquired waveforms. During
the training, the oscilloscope analyzes the waveforms to determine
what waveforms normally look like. Using this information, it
generates a list of smart trigger setups to trigger on abnormal
situations.
2. Loads the smart trigger setups from the Trainer and cycles through
these. As triggers occur, they are overlaid on the screen. All acquisition
settings are preserved and you can use all the functions of the
oscilloscope to find the root cause of these anomalies including,
WaveScan, Histograms, and advanced analysis.
Training TriggerScan
The TriggerScan Trainer inspects a currently acquired waveform and
automatically builds a list of common trigger setups used to find rare events.
42 922138-00 Rev A
Page 51

Getting Started Manual
PLEASE NOTE THE FOLLOWING:
You must acquire and display at least 3 cycles of a signal before running the
Trainer. You should run the Trainer if you want to change the trigger types or if
you change the channel or signal.
1. Touch Trigger Trigger Setup from the menu bar.
2. On the Trigger dialog, click the TriggerScan tab.
3. Touch inside the Source data entry field and select a channel as the
source for the training.
4. Touch the Trainer button.
5. On the TriggerScan Trainer Setup window, choose the types of
triggers the Trainer should use to train the system and then touch the
Start Training button. The training begins. When it is complete, a list of
smart trigger setups is displayed in the Trigger List.
Starting TriggerScan
After you have run the Trainer, the Trigger List displays a list of smart trigger
setups. You can add or remove trigger setups. You can also update the
selected smart trigger setup. Once you have made any changes to the Trigger
List, you are ready to start scanning.
1. Touch Trigger Trigger Setup from the menu bar.
2. On the Trigger dialog, click the TriggerScan tab.
3. To add a new trigger setup, touch the Trigger tab and set up the new
trigger. Then, touch the Add New button.
4. To delete a trigger setup, highlight the setup in the Trigger List and
touch the Delete Selected button.
NOTE: If you want to delete all trigger setups in the Trigger List,
touch the Delete All button.
5. To replace the selected trigger with the current trigger setup, highlight
the setup in the Trigger List and touch the Update Selected button.
6. Once you have made any changes to the Trigger List, touch Start Scan.
The oscilloscope automatically sequences through all the trigger
setups.
922138-00 Rev A 43B
Page 52

WaveRunner Xi-A and MXi-A Oscilloscopes
PLEASE NOTE THE FOLLOWING:
You can tune the dwell time that the scope will wait before loading
the next trigger setup using the Dwell Time data entry field.
If you have Persistence display mode enabled, all trigger events are
recorded on the display. Refer to the Persistence Setup topic for
instructions on enabling Persistence display mode.
If you want TriggerScan to stop when the scope triggers next, check the Stop
On Trigger checkbox. You can use this to isolate specific trigger setups.
Saving TriggerScan Setups
You should save TriggerScan setups once you have made any modifications to
the Trigger List. The current Trigger List will not be preserved after exiting the
application unless you save it.
On the TriggerScan dialog, touch inside the Setup File Name data entry field
and enter a file name using the pop-up keypad.
OR
Touch the Browse button and select a location and file name.
Finally, make sure you touch the Save Setup button.
NOTE: You can load previously saved TriggerScan setups by touching the
Browse button, locating the file, and then clicking Load Setup.
44 922138-00 Rev A
Page 53

Getting Started Manual
Absolute
Each cursor locates a point on the waveform. The cursor values
can be read in the descriptor label for the trace. Use the Position
fields at the right side of the dialog to place the cursors precisely.
Delta
This is the difference in Y values. The value can be read in the
descriptor label for the trace.
Abs+Delta
Displays absolute and delta cursors together.
Slope
This gives the slope between cursors.
Waveform Measurements
Measuring with Cursors
Overview
Cursors are important tools that aid you in measuring signal values. Cursors
are markers — lines, cross-hairs, or arrows — that you can move around the
grid or the waveform itself. Use cursors to make fast, accurate measurements
and to eliminate guesswork. There are two basic types:
Horizontal (Time or Frequency) cursors are lines that you move
horizontally along the waveform. Place them at a desired location along
the time axis to read the signal’s amplitude at the selected time.
Vertical (Voltage) cursors are lines that you move vertically on the grid to
measure the amplitude of a signal.
Cursor Measurement Icons
The Show icons depict what is being measured for each measurement mode.
922138-00 Rev A 45B
Page 54

WaveRunner Xi-A and MXi-A Oscilloscopes
If there are non-time-domain waveforms displayed,
a menu is shown offering choices of x-axis units: s or
Hz, for example.
Cursor information is displayed in the channel,
math, zoom, and memory trace descriptor labels. It
is also displayed below the Timebase and Trigger
descriptor labels:
Touch Cursors Off, Horizontal Abs, Horizontal Rel,
Vertical Abs, or Vertical Rel from the menu bar.
The cursors shown assume previous setup positions.
If you want to change their position or measurement
mode touch Cursors Cursors Setup from the menu
bar.
Touch Cursors Cursors Setup from the menu
bar. The Standard Cursors dialog opens.
In the dialog area, touch the Cursors On checkbox
to display them.
Cursors Setup
Quick Display
At any time, you can change the display of cursor types (or turn them off)
without invoking the Cursors Setup dialog, as follows:
Full Setup
46 922138-00 Rev A
Page 55

Getting Started Manual
Touch one of the Horizontal or Vertical mode
buttons: Relative or Absolute.
If you chose a Relative mode, also touch a readout
parameter button: Y position, delta Y, Y position
plus delta, or slope.
If you chose a Relative mode, touch inside the
Position 1 and Position 2 fields and type in a value
for each cursor. You can also use the Cursors
knobs on the front panel to place the cursors. If
you chose an Absolute mode, do the same for
your single cursor.
If you chose a Relative mode and you would like
both cursors to move in unison as you adjust the
position, touch the Track check box to enable
tracking.
Push the front panel Cursor Type button to
quickly change the type of cursors in use.
922138-00 Rev A 47B
Page 56

WaveRunner Xi-A and MXi-A Oscilloscopes
mean
Mean
sdev
Standard deviation
max
Maximum
min.
Minimum
ampl
Amplitude
pkpk
Peak-to-peak
freq
Frequency
period
Period
width
Width
rise
Risetime
fall
Fall time
duty
duty cycle
Parameter Measurements
Waveform analysis typically begins with the measurement of parameters.
Parameter measurement tools determine a wide range of waveform
properties. Use them to automatically calculate many attributes of your
waveform, like rise time, rms voltage, and peak-to-peak voltage, for example.
There are parameter modes for the amplitude and time domains, custom
parameter groups, and parameters for pass and fail testing. You can make
common measurements on one or more waveforms.
Measure Modes
The selections for Measure Mode allow you to quickly apply parameters for
standard vertical and standard horizontal setups, and custom setups.
Pass and fail parameters can be customized, too. You can accumulate and
display statistics on each parameter's average, lowest, highest, and standard
deviation.
Standard Vertical Parameters
These are the default Standard Vertical Parameters:
Standard Horizontal Parameters
These are the default Standard Horizontal Parameters:
48 922138-00 Rev A
Page 57

Getting Started Manual
A green check mark means that the oscilloscope is returning a
valid value.
A crossed-out pulse means the oscilloscope is unable to determine
top and base. However, the measurement could still be valid.
A downward pointing arrow indicates an underflow condition.
An upward pointing arrow indicates an overflow condition.
An upward-and-downward pointing arrow indicates an underflow
and overflow condition.
You can turn on statistics by checking the
Statistics On checkbox in the Measure main
dialog. A table of values is then displayed below
the grid.
Custom Measurements with My Measure
You can choose to customize up to six parameters by touching My Measure
and then selecting the measurements desired.
Status Symbols
Below each parameter appears a symbol that indicates the status of the
parameter, as follows:
Statistics
922138-00 Rev A 49B
Page 58

WaveRunner Xi-A and MXi-A Oscilloscopes
WaveScan™ Advanced Search and
Analysis
Teledyne LeCroy’s WaveScan Advanced Search and Analysis tool can be used
in the following ways:
Capture and Search - Take a single acquisition, set a search mode, and
apply a filter (i.e., create a search condition).
Scan - Set a search mode, apply a filter, and take multiple acquisitions to
scan for unusual events (i.e., create a software condition for a hardware
trigger).
Analyze - Use ScanOverlay and ScanHisto to further analyze the filtered
events.
You can select from more than 20 search modes (frequency, rise time, runt,
duty cycle, etc.), apply a search condition (slope, level, threshold, hysteresis),
and begin scanning in a post-acquisition environment. Since the scanning
modes are not simply copies of the hardware triggers, the capability is much
greater.
For instance, there is no frequency trigger in any oscilloscope, yet WaveScan
allows frequency to be quickly scanned for.
You can accumulate a data set of unusual events that are separated by hours
or days, enabling faster debugging. The events are time stamped and indexed
in a table from which you can select them for viewing individually.
You can also set actions to occur automatically when unusual events are
found: stop the acquisition, emit an audible beep, output a pulse, print the
screen, save the waveform, or create a LabNotebook entry.
Refer to your oscilloscope’s on-line Help for more information about
WaveScan.
WaveScan Signal Views
WaveScan provides several views of your signal:
Source view highlights all occurrences of edges that meet your criteria.
Zoom view allows you to expand a waveform feature vertically and
horizontally. This can be used to apply further processing, to store it, or to
50 922138-00 Rev A
Page 59

Getting Started Manual
apply a descriptive label to the feature.
Scan Histogram provides a statistical view of edges meeting your search
criteria.
Scan Overlay places all captured edges one on top of the other in a
separate grid. You can apply persistence in this view.
NOTE: The number of grids displayed varies from one to three grids depending
on which views are enabled. WaveScan handles this function automatically,
and there is no option to move traces from one grid to another, as would be
the case under normal (non-WaveScan) operation.
WaveScan Search Modes
Search modes are used to locate anomalies during acquisition.
Edge - for detecting the occurrence of edges, selectable slope, and level
Non-monotonic - for detecting threshold re-crosses, selectable slope,
hysteresis, and level
Runt - for detecting pulses that fail to cross a threshold, selectable
polarity, and thresholds
Measurement - for defining a measurement with a filtering (search or
scan) criteria
Parameter Measurements
In WaveScan, parameter measurements are used to set up a filtering (search
or scan) criteria. When WaveScan finds an event that meets the measurement
and filter criteria, it highlights the area (search and scan) and (optionally) can
perform an action (scan).
The number of parameters available depends on the options loaded on your
instrument. Measurements are made only on the events defined by your filter
(search criteria). A Filter Wizard is provided to quickly set up a measurement
to find rare events, such as ±1, 3, or 5 sigma.
Sampling Mode
Whenever WaveScan is enabled, the instrument reverts to Real-time sampling
mode.
922138-00 Rev A 51B
Page 60

WaveRunner Xi-A and MXi-A Oscilloscopes
Parameter Analysis
Trend Measurements
A trend of a measurement parameter is a line graph with a measurement
point from each subsequent signal acquisition plotted on the graph.
Touch Measure Measure Setup… from the menu bar.
Touch one of parameter tabs P1 through P6.
Touch inside the Source1 field and select an input waveform from the pop-up
menu.
Touch inside the Measure field and select a parameter from the pop-up menu.
Touch the Trend button at the bottom of the dialog.
Track View
A Track View of a measurement parameter is a unique and specialized graph
that is time correlated to the signal being measured. The Track View applies to
a single-shot acquisition and plots the variation of a parameter (such as width)
for each cycle in time-correlated sequence with the waveform. Track View lets
you locate a problematic signal feature including width, period, amplitude, and
more.
Set up a Track View by following the previous steps, except touch the Track
button at the bottom of the dialog.
JitterTrack View
A JitterTrack View is similar to a Track View but is applicable to a specialized
set of timing parameter measurements used to analyze cycle-to-cycle timing
variation, including clock jitter, and to aid in tracking the variation to its
source. JitterTrack is available with the optional XMAP or JTA2 WaveShape
Analysis packages.
52 922138-00 Rev A
Page 61

Getting Started Manual
Histograms
Creating and Viewing a Histogram
NOTE: The number of sweeps comprising a histogram is displayed in the
bottom line of the trace descriptor label.
Single Parameter Histogram Setup
From Measure Dialog
1. Touch Measure Measure Setup from the menu bar.
2. Touch the My Measure button.
3. Touch one of tabs P1 through Px.
4. Touch inside the Source1 field and select an input waveform from the
pop-up menu.
5. Touch inside the Measure field and select a parameter from the pop-
up menu.
6. Touch the Histogram button at the bottom of the dialog.
7. Select a math trace in which to place the resulting histogram, and then
close the pop-up menu.
922138-00 Rev A 53B
Page 62

WaveRunner Xi-A and MXi-A Oscilloscopes
8. Touch the math trace label for the math trace you just created.
9. In the dialog to the right, touch the Histogram tab.
10. Under Buffer, touch inside the #Values field and enter a value.
11. Under Scaling, touch inside the #Bins field and enter a value from 20
to 2000.
12. Touch the Find Center and Width button to center the histogram. Or
touch inside the Center, then the Width, fields and enter a value using
the pop-up numeric keypad.
54 922138-00 Rev A
Page 63

Getting Started Manual
From Math Dialog
1. Touch Math Math Setup from the menu bar.
2. Touch one of function tabs F1 through Fx. The number of math traces
available depends on the software options loaded on your
oscilloscope.
3. Touch the Graph button.
4. Touch inside the Source1 field and select a source from the pop-up
menu.
5. Touch inside the Measurement field and select a parameter from the
pop-up menu.
6. Touch inside the Graph with field and select Histogram from the pop-
up menu.
7. In the dialog to the right, touch the Histogram tab.
8. Under Buffer, touch inside the #Values field and enter a value.
922138-00 Rev A 55B
Page 64

WaveRunner Xi-A and MXi-A Oscilloscopes
9. Under Scaling, touch inside the #Bins field and enter a value from 20
to 2000.
10. Touch the Find Center and Width button to center the histogram.
Or touch inside the Center, then the Width, fields and enter a value
using the pop-up numeric keypad.
11. Touch inside the Vertical Scale field and select Linear or Linear
Constant Max from the pop-up menu:
A linear histogram continues growing as values accumulate.
A linear-constant-maximum histogram continually rescales itself
and remains well within the grid.
Viewing Thumbnail Histograms
Histicons are miniature histograms of parameter
measurements that appear below the grid. These thumbnail
histograms let you see at a glance the statistical distribution of each
parameter.
Touch Measure then one of the Measure Mode buttons: Std Vertical, Std
Horizontal, or My Measure from the menu bar.
Touch the Histicons checkbox to display thumbnail histograms below the
selected parameters.
NOTE: For measurements set up in My Measure, you can quickly display an
enlarged histogram of a thumbnail histogram by touching the Histicon you
want to enlarge. The enlarged histogram is shown superimposed on the trace
it describes. This does not apply to Std Vertical or Std Horizontal
measurements.
56 922138-00 Rev A
Page 65

Getting Started Manual
Persistence Histogram
You can create a histogram of a persistence display also by cutting a horizontal
or vertical slice through the waveform. You also decide the width of the slice
and its horizontal or vertical placement on the waveform.
This math operation is different from the Histogram math operation and is not
affected by Center and Width settings made there.
1. Touch Math Math Setup on the menu bar.
2. Touch one of function tabs F1 through Fx The number of math traces
available depends on the software options loaded on your
oscilloscope.
3. Touch inside the Source1 field and select a source from the pop-up
menu.
4. Touch inside the Operator1 field and select Phistogram from the
Select Math Operator menu.
5. To the right of the trace dialog, touch the Phistogram tab, then touch
inside the Slice Direction field and select Horizontal or Vertical slice
from the pop-up menu.
6. Touch inside the Slice Center field and enter a value, using the pop-up
keypad.
7. Touch inside the Slice Width field and enter a value, using the pop-up
keypad. You can also use the Clear Sweeps and Center Cursor buttons
for convenience.
NOTE: You can use the front panel Adjust knobs in the Cursors group to move
the Slice Center line and the Slice Width boundary lines.
922138-00 Rev A 57B
Page 66

WaveRunner Xi-A and MXi-A Oscilloscopes
Touch Display Display Setup on the menu bar.
Touch one of the Grid combination buttons. Auto
automatically adds or deletes grids as you select
more or fewer waveforms to display.
Touch inside the grid Intensity field and enter a value
from 0 to 100 using the pop-up keypad.
Touch the Grid on top checkbox if you want to
superimpose the grid over the waveform. Depending
on the grid intensity, some of your waveform may be
hidden from view when the grid is placed on top.
Undo by un-checking the Grid on top checkbox.
Touch the Axis labels checkbox to permanently
display the values of the top and bottom grid lines
(calculated from volts/div) and the extreme left and
right grid lines (calculated from the timebase).
Choose a line style for your trace: solid Line or
Points. You can also set the Intensity percentage of
your trace.
Persistence Trace Range
This math operation has a field where you can enter the percent of the
persistence trace population to use in creating a new waveform.
Persistence Sigma
This math operation has a field where you can enter a scale, measured in
standard deviations, by which to create a new waveform.
Display Formats
Display Setup
58 922138-00 Rev A
Page 67

Getting Started Manual
Touch the Timebase descriptor label.
In the Timebase dialog, touch the Sequence mode
button.
Select the Sequence tab. Under Acquisition Settings,
touch inside the Num Segments field and enter a
value from 2 to 500.
Under Touch inside the Timeout field and enter a
value from 10 ms to 100 s. Then check the Enable
Timeout checkbox.
Under Display Settings, touch inside the Display
Mode field and select a mode from the pop-up
menu.
Sequence Mode Display
Set up a Sequence Mode display by first enabling Sequence mode in the
Timebase Horizontal dialog. A Num Segments value must also be provided as
follows:
NOTE: The maximum value that you can enter for Starting at depends on the
Num Segments value you entered under Acquisition Settings. It also depends
on the Num Seg Displayed value you entered. For example, if you had entered
a value of 500 in Num Segments, and a value of 10 in Num Seg Displayed, the
maximum value you can enter as a starting segment is 491so that 10 segments
can be seen.
922138-00 Rev A 59B
Page 68

WaveRunner Xi-A and MXi-A Oscilloscopes
When you select Analog mode from the Persistence dialog, each
channel is assigned a single color. As a persistence data map
develops, different intensities of that color are assigned to the
range between a minimum and a maximum population. The
maximum population automatically gets the highest intensity, the
minimum population gets the lowest intensity, and intermediate
populations get intensities in between these extremes.
See the on-line Help for more information.
Color mode persistence, selected by touching Color, works on the
same principle as the Analog persistence feature, but instead uses
the entire color spectrum to map signal intensity: violet for
minimum population, red for maximum population. A saturation
level of 100% spreads the intensity variation across the entire
distribution. At lower saturation levels, the intensity saturates
(becomes the brightest color) at the percentage value specified.
Lowering this percentage causes the pixels to be saturated at a
lower population, and makes visible those rarely hit pixels not
seen at higher percentages.
By selecting 3d, you can create a topographical view of your
waveform from a selection of shadings, textures, and hues. The
advantage of the topographical view is that areas of highest and
lowest intensity are shown as peaks and valleys, in addition to
color or brightness. The shape of the peaks (pointed or flat) can
reveal further information about the frequency of occurrences in
your waveform.
Persistence Setup
The analog Persistence feature displays your waveform and reveals its
anomalies for a repetitive signal. Use Persistence to accumulate on-screen
points from many acquisitions to see your signal change over time. The
instrument persistence modes show the most frequent signal path threedimensionally in intensities of the same color, or graded in a spectrum of
colors.
Saturation Level
3-Dimensional Persistence
60 922138-00 Rev A
Page 69

Getting Started Manual
The instrument also gives you the ability to turn the X and Y axes
of the waveform through 180° of rotation from -90° to +90°.
The Zoom button appears as a standard button at the bottom
of the channel Cx Vertical Adjust setup dialog if you want to
create a zoom trace of your input waveform. The zoom trace
created by this method is designated Z1 to Z4.
The front panel QuickZoom button creates multiple zooms,
one for each displayed input channel. The zoom traces created
by this method are designated Z1 to Z4.
At any time, you can also zoom a portion of a waveform, or
multiple waveforms, by touching and dragging a rectangle
around any part of the input waveform. The zoom trace sizes
itself to fit the full width of the grid. The degree of
magnification, therefore, depends on the size of the rectangle
that you draw.
When you zoom a waveform by this method, a representation
of the zoomed area is shown in a thumbnail preview in the Zx
dialog.
Show Last Trace
For most applications, you may not want to show the last trace because it is
superimposed on top of your persistence display. Resolve this by turning off
Show Last Trace by touching the checkbox. However, if you are doing mask
testing and want to see where the last trace is falling, turn Show Last Trace on.
Zooming Waveforms
922138-00 Rev A 61B
Page 70

WaveRunner Xi-A and MXi-A Oscilloscopes
Touch the channel trace label for a displayed channel.
Touch the Zoom button at the bottom of the Cx
Vertical Adjust dialog. A zoom trace of the selected
channel (one of Z1 to Z4) is created on a separate
grid.
Vary the zoom degree by touching Zx trace label (just
created). The setup dialog for the zoom trace opens.
It shows the current horizontal and vertical zoom
factors.
If you want to increase or decrease horizontal or
vertical zoom in small increments, touch the Var.
checkbox to enable variable zooming. Now, with each
touch of the zoom control buttons, the degree of
magnification changes by a small increment.
You can zoom in or out using large, standard
increments when touching zoom control buttons by
leaving the Var. checkbox unchecked. Set exact
horizontal or vertical zoom factors by touching inside
the Horizontal Scale/div field and providing a timeper-div value (with the pop-up numeric keypad). Now,
touch inside the Vertical Scale/div field and enter a
value.
Reset the zoom to x1 magnification by touching Reset
Zoom in the dialog. Turn off the zoom trace by
touching the QuickZoom button or un-checking the
Trace On checkbox.
Zooming a Single Channel
62 922138-00 Rev A
Page 71

Zooming by Touch-and-Drag
Touch and drag a rectangle around any part of an
input channel waveform, math trace, or memory
trace, or any combination of these. If all traces are
channel traces, zooms designated Z1 to Z4 appear in a
separate grid automatically.
If the traces are non-channel, or a combination of
channel traces and math or memory traces, a
Rectangle Zoom Wizard appears. Select the traces to
be zoomed on the pop-up.
Channel zooms are shown on a separate grid. The
zoom of the math or memory trace appears on the
same grid as the source trace.
Turn the front panel zoom Position knobs to adjust
the vertical and horizontal position of the zoom.
Turn the front panel Zoom knobs to control the
vertical and horizontal magnification factor of the
zoom.
Getting Started Manual
Turn Off Zoom
Touch the trace label for the zoom you want to turn off.
Touch the Trace On checkbox to delete the check mark and disable the zoom
trace.
922138-00 Rev A 63B
Page 72

WaveRunner Xi-A and MXi-A Oscilloscopes
Touch File Save Setup… on the menu bar.
Or, press the Save/Recall front panel button,
and then touch the Save Setup tab.
Save To File by touching inside the Save
panel to file field and providing the path to
the destination folder. Or, by touching
Browse, navigating to the destination folder,
and then choosing Save Now.
Save Internal Setups on the oscilloscope's
hard drive by touching inside a SetupX field
and using the pop-up keyboard to provide a
file name. After touching the Save button,
the file is put in D:\Internal Setups, and the
current date is displayed above the field.
Save and Recall
Saving and Recalling Oscilloscope Settings
You can save or recall settings to or from hard disk, floppy disk, or LAN
locations.
Saving Oscilloscope Settings
64 922138-00 Rev A
Page 73

Recalling Oscilloscope Settings
Touch File Recall Setup… on the menu
bar.
Recall From File by touching inside the
Recall panel from file field and using the
pop-up keyboard to provide the path to the
source folder. Or by touching Browse to
navigate to the source folder, and then
choosing Recall Now.
Recall settings from the D:\ Internal Setups
folder on the oscilloscope's hard drive by
touching Recall next to the file for retrieval.
Getting Started Manual
922138-00 Rev A 65B
Page 74

WaveRunner Xi-A and MXi-A Oscilloscopes
Touch File Recall Setup… on the menu bar.
Touch the button under Recall Default.
Touch File Save Waveform... from the menu bar.
On the Save Waveform dialog, touch the Save To
Memory or File button.
Recalling Default Settings
Saving and Recalling Waveforms
Saving Waveforms
66 922138-00 Rev A
Page 75

Getting Started Manual
Touch inside the Source field and select a source
from the pop-up menu. The source can be any trace.
For example, a channel (C1C4), math function (F1F4),
or a waveform stored in non-volatile RAM (M1M4).
Touch inside the Trace Title field if you want to
change the default name of your waveforms. Use the
pop-up keyboard to type in the new name.
NOTE: You can change the name but not the
sequence number.
If you are saving to file, touch the Data Format field
and select a format type from the pop-up menu.
If you select ASCII or Excel, also touch the
SubFormat field and select either Time Data or Time
& Ampl. Then touch the Delimiter field and select a
delimiter character from the pop-up menu: comma,
space, semicolon, or tab.
Touch the Browse button for the Save file in
directory field and browse to the location where you
want the file saved.
The file name is assigned automatically and is shown
below the field.
Touch Save Now.
CAUTION. If you use a name that ends in a number instead of a letter,
the instrument may truncate the number. This is because, by design,
the first waveform is automatically numbered 0, the second 1, etc. For
example, if you want to use waveform name XYZ32 but it is not preceded by
waveforms XYZ0 through XYZ31, the waveform is renumbered with the next
available number in the sequence.
If you need to use a number in your waveform's name, it is recommended that
you append an alpha character at the end of the number: XYZ32a, for
example.
922138-00 Rev A 67B
Page 76

WaveRunner Xi-A and MXi-A Oscilloscopes
Touch File Recall Waveform... from the menu bar.
On the Recall Waveform dialog, touch the Recall
From button.
If you selected Memory, touch inside the Source field
and select a memory location: M1 to M4.
If you selected File, touch inside the Destination field
and select a memory location in which to store the
file.
Touch inside the Show only files field and select an area to limit the search to:
channels, math functions, or memory.
Auto Save
You can also enable Auto Save from this dialog by touching one of the Auto
Save buttons:
Wrap (old files overwritten) or Fill (no files overwritten).
CAUTION. If you select Fill, you can quickly use up all disk space on
your hard disk.
Recalling Waveforms
68 922138-00 Rev A
Page 77

Getting Started Manual
Touch inside the Recall files from
directory field and enter the path,
using the pop-up keyboard. Or
touch the Browse button to
navigate to the file.
Touch inside the Next file will be recalled from field and enter the path, using
the pop-up keyboard. Or touch the Browse button to navigate to the file.
Touch Recall Now.
922138-00 Rev A 69B
Page 78

WaveRunner Xi-A and MXi-A Oscilloscopes
Touch File Print Setup... from the menu bar. The
Utilities Hardcopy dialog opens.
In the dialog area, touch the Printer icon.
Printing and File Management
The instrument gives you the ability to output files to a printer or plotter, to
print to file, or to e-mail your files. Any Windows XP supported printer is
supported by your instrument.
Printing
Printer Setup
Under Colors, touch the Use Print Colors checkbox if you want the traces
printed on a white background. A white background saves printer toner.
Change printer colors in the Preference dialog.
Touch inside the Select Printer field. From the touch pad pop-up choose the
printer you want to print to. Touch the Properties button to see your printer
setup.
Touch the icon for the layout Orientation you want: portrait or landscape.
Touch the Grid Area Only checkbox if you do not need to print the dialog area
and you only want to show the waveforms and grids.
70 922138-00 Rev A
Page 79

Getting Started Manual
Touch File Print Setup... on the menu bar. The
Utilities Hardcopy dialog opens.
In the Hardcopy dialog, touch the Printer icon, then
the Add Printer button.
Touch Add a printer in the Printers and Faxes window.
Follow the instructions displayed in the Add Printer Wizard.
Printing
You can print in one of three ways:
Press the Printer button on the front panel
Touch File Print on the menu bar.
Touch the Print button in the Hardcopy dialog
Adding Printers and Drivers
NOTE: If you want to add a printer driver, the driver must first be loaded on
the oscilloscope.
922138-00 Rev A 71B
Page 80

WaveRunner Xi-A and MXi-A Oscilloscopes
Changing the Default Printer
If you want to change the default printer, minimize the instrument application
by touching File Minimize from the menu bar.
Touch the Start button in the task bar at the bottom of the screen.
Select Controls, then Printers and Faxes.
Touch the printer you want to set as the default printer, then touch File, Set as
Default Printer.
Managing Files
Use the instrument's utilities to create waveform files on optional floppy disk,
internal hard drive, or network drives.
Hard Disk Partitions
The instrument's hard disk is partitioned into drive C: and drive D:. Drive C:
contains the Windows operating system and the instrument application
software. Drive D: is intended for data files.
72 922138-00 Rev A
Page 81

Getting Started Manual
LabNotebook entries are easily created by selecting
LabNotebook from the File menu, then clicking the
Create button.
Several annotation tools and colors are then put at
your disposal to mark up your waveform. When you
click Done, your mark-ups and oscilloscope settings
are saved together in a database resident on the
instrument.
Click the Create Report button to generate a
hardcopy format that you can save to a network
drive or external media. Or click the E-mail button
to send the report to another location. Use the
Flashback feature at any time to recall a Notebook
entry, including oscilloscope setup, for further
study.
Documenting Your Work
The WaveRunner Xi LabNotebook feature simplifies the way waveforms,
screen captures, and oscilloscope setup files are saved and documented.
LabNotebook also provides an easy way to recall your settings with the
Flashback feature. And it lets you create reports, showing your screen images,
in pdf, html, or rtf output formats.
Creating a LabNotebook Entry
922138-00 Rev A 73B
Page 82

WaveRunner Xi-A and MXi-A Oscilloscopes
Touch Math Math Setup on the menu
bar.
Touch a Math function trace button in the
Math dialog: F1 through Fx. Select FFT
from the pop-up menu.
Touch the Single, Dual, Graph, or Web Edit
(function of a function) button if the FFT is
to be of the result of another math
operation.
Touch inside the Source1 field and select a
channel, memory, or math trace on which
to perform the FFT. Touch inside the
Operator1 field: Select FFT from the popup menu if you selected Single function.
Select another math function from
Operator1 if you selected Dual function.
Then touch inside the Operator2 field and
select FFT from the pop-up menu.
Waveform Math
FFT Setup
74 922138-00 Rev A
Page 83

Getting Started Manual
Touch the FFT tab in the right-hand dialog.
Choose whether to Truncate2 or Zero-fill3
the trace display.
Touch the Suppress DC checkbox if you
want to make the DC bin go to zero.
Otherwise, leave it unchecked.
Touch inside the Output type field, and
make a selection from the pop-up menu.
Touch inside the Window field and select a
window type.
Touch inside the Algorithm field and select
either Least Prime4 or Power25 from the
pop-up menu.
2
3
4
When the FFT transform size does not match the record length, you can truncate the record and
perform an FFT on the shorter record. This increases the resolution bandwidth.
Zero-fill is useful when the source data for the FFT comes from a math operation that shortens the
record. This is commonly encountered in filtering operations like enhanced resolution. The missing
data points are replaced by data values, whose amplitudes are interpolated to fit between the last
data point and the first data point in the record. This guarantees that there is not a first-order
discontinuity in the filled data. Since the data at the end of the record is "filled" data, it is advisable
to select a weighting window other than rectangular to minimize the effect of the fill on the resulting
spectrum.
The default algorithm is a least primes algorithm that computes FFTs on transform sizes having
lengths that can be expressed as factors of 2N*5K. This is very compatible with the record lengths
encountered in the oscilloscope, which are often multiples of 1, 2, 4, 5, or 10. or Power of 2 The
other choice is a power of two algorithm where the record lengths are in the form of 2N. The power
of 2 algorithm generally runs faster than the least primes algorithm. The price that is paid is a
record length that is not the same as the acquired signal. The power-of-two FFT uses the first 2N
points of the record. For example, if you acquire 500 points in your trace, the power-of-two FFT
would only use the first 256 points.
922138-00 Rev A 75B
Page 84

WaveRunner Xi-A and MXi-A Oscilloscopes
5
Pass/Fail Testing
Comparing Parameters
First, touch Analysis Pass/Fail Setup from the menu bar.
Each Pass/Fail input (Qx) can compare a different parameter result to a userdefined limit (or statistical range) under a different condition. The conditions
are represented by these comparison operators:
At the touch of a button, test results can also be compared to these standard
statistical limits:
current mean
mean + 1 SD
mean + 3 SD
In Dual Parameter Compare mode, you can compare parameter results
measured on two different waveforms. You can set your test to be true if Any
waveform or All waveforms fit the criterion stipulated by the comparison
condition. Your setup is conveniently shown in the Summary box of the Qx
dialog. For example:
The other choice is a power of two algorithm where the record lengths are in the form of 2N. The
power of 2 algorithm generally runs faster than the least primes algorithm. The price that is paid is a
record length that is not the same as the acquired signal. The power-of-two FFT uses the first 2N
points of the record. For example, if you acquire 500 points in your trace, the power-of-two FFT
would only use the first 256 points.
76 922138-00 Rev A
Page 85

Getting Started Manual
Save
Saves the waveform to the location that you specify.
Stop
Stops the test.
Alarm
Emits a beep.
Pulse
Emits a variable width and amplitude pulse.
Hardcopy
Prints an image of the display, saves it to file, or
sends an e-mail.
Mask Tests
You have the choice to do mask testing by using an existing mask, or by using a
mask created from your actual waveform, with vertical and horizontal
tolerances that you define. Existing masks can be loaded from a USB memory
stick or from a network.
You can set your mask test to be True for waveforms All In, All Out, Any In, or
Any Out. For example, if you select All In, the test is False if even a single
waveform falls outside the mask.
Masks that you create from your waveform can be confined to just a portion
of the trace by use of a measure gate. (See Measure Gate for an explanation of
how this feature works.)
Actions
By touching the Stop Test checkbox in the Actions dialog, you can set up the
test to end after a predetermined number of sweeps that you decide.
You can also decide the actions to occur upon your waveforms' passing or
failing, by selecting one or all of the following:
The selection Pulse causes a pulse to be output through the Aux Out
connector at the front of the oscilloscope. This pulse can be used to trigger
another oscilloscope. You can set the amplitude and width of the pulse as
described in Auxiliary Output Signals under Utilities.
922138-00 Rev A 77B
Page 86

WaveRunner Xi-A and MXi-A Oscilloscopes
All True
All False
Any True
Any False
All Q1 to Q4 Or All Q5 to Q8
Any Q1 to Q4 And Any Q5 to Q8
Depending on your oscilloscope model, you can configure up to 8 pass/fail
conditions. The Boolean conditions to determine if your waveform passes are
as follows:
Setting Up Pass/Fail Testing
Initial Setup
Touch Analysis Pass/Fail Setup from the menu bar.
Touch the Actions tab.
Touch the Enable Actions checkbox. This causes the actions you select to
occur depending on your waveform's passing or failing a test.
78 922138-00 Rev A
Page 87

Getting Started Manual
Touch the Summary View to enable a line of text that shows concisely the
status of your last waveform and keeps a running count of how many sweeps
have passed.
Touch inside the Pass If field, and select a Boolean condition from the pop-up
menu.
If you want to set up the test to end after a finite number of sweeps, touch the
Stop Test checkbox. Then touch inside the After field and enter a value, using
the pop-up numeric keypad.
Under If, touch either the Pass or Fail button to set the actions to
occur upon your waveform's passing or failing the test.
Under Then, touch the actions you want to occur: stop test, sound
alarm, print result, emit pulse, or save the waveform. If you want to
have the results printed and your oscilloscope is not equipped with a
printer, be sure that the it is connected to a local or network printer. See
Printing.
If you want to save your waveform automatically, touch the Save Setup. This
takes you out of the current dialog and opens the Save Waveform dialog.
Refer to the Saving and Recalling Waveforms section of this manual for more
details.
Test your Pass/Fail conditions by touching the Force Actions Once button.
Press the Clear All button to quickly uncheck all checkboxes if you want to
change your selections.
922138-00 Rev A 79B
Page 88

WaveRunner Xi-A and MXi-A Oscilloscopes
Comparing a Single Parameter
Touch Analysis Pass/Fail Setup from the menu bar.
Touch one of the Q tabs. A setup dialog for the position is shown.
Touch inside the Source1 field and select a source from the pop-up menu.
Touch inside the Condition field in the main dialog and select
ParamCompare. A ParamCompare setup dialog opens to the right of
the main dialog.
80 922138-00 Rev A
Page 89

Getting Started Manual
Touch inside the Compare Values field and select All or Any from
the pop-up menu.
By selecting All, the test is true only if every waveform falls within
the set limit. By selecting Any, the test is true if just one waveform
falls within the limit.
Touch inside the Condition field in the ParamCompare mini-dialog and select
a math operator from the pop-up menu.
Touch inside the Limit field and enter a value, using the pop-up numeric
keypad. This value takes the dimensions of the parameter that you are testing.
For example, if you are testing a time parameter, the unit is seconds. If you
chose either WithinDeltaPct or WithinDeltaAbs from the Condition menu,
you also have the choice of setting the limit by means of the statistical buttons
at the bottom of the ParamCompare dialog:
922138-00 Rev A 81B
Page 90

WaveRunner Xi-A and MXi-A Oscilloscopes
Comparing Dual Parameters
Set up Dual Parameters by following the previous steps in the
Comparing a Single Parameter topic, except you selecting the Dual
Param Compare condition.
Setting Up Mask Testing
Touch Analysis Pass/Fail Setup… from the menu bar.
Touch a Q tab. A setup dialog for the position is shown.
Touch inside the Source1 field and select a source from the pop-up menu.
Touch inside the Condition field in the main dialog and select Mask Test.
82 922138-00 Rev A
Page 91

Getting Started Manual
From the Test mini-dialog, make a selection in the Test is True when group of
buttons.
This selection means, for example, that if you select All In, the test is False if
even a single waveform falls outside the mask.
From Show Markers, choose whether or not to have mask
violations displayed.
If you are loading a pre-existing mask, touch the Load Mask
tab, then the File button. You can then enter the file name
or browse to its location.
If you want to make a mask from your waveform, touch the
Make Mask tab.
Touch inside the Ver Delta and Hor Delta fields and enter boundary values,
using the pop-up numeric keypad.
Touch the Browse button to create a file name and location for the mask if
you want to save it.
Touch the Gate tab, then enter values in the Start and Stop fields to constrain
the mask to a portion of the waveform. Or, you can simply touch and drag the
Gate posts, which initially are placed at the extreme left and right ends of the
grid.
922138-00 Rev A 83B
Page 92

WaveRunner Xi-A and MXi-A Oscilloscopes
6
Remote Control Operation
Refer to the Remote Control Manual supplied on CD with your oscilloscope for
more information.
You can fully control your instrument remotely by using either the optional
GPIB (General Purpose Interface Bus) port or the LAN communication port on
the oscilloscope's rear panel, shown below. The only actions for which you
must use the front panel controls are the powering up of the oscilloscope and
the setting of remote control addresses.
Standards
Teledyne LeCroy remote control commands conform to the GPIB IEEE 488.26
standard. This may be considered an extension of the IEEE 488.1 standard,
which deals mainly with electrical and mechanical issues. Teledyne LeCroy
also supports LXI (LAN eXtensions for Instrumentation) over the LAN port.
Program Messages
You control the oscilloscope remotely using program messages that consist of
one or more commands or queries. The program messages you send from the
external controller to the oscilloscope must conform to precise format
structures. The oscilloscope executes all program messages sent in the correct
form, but ignores the ones with errors.
ANSI/IEEE Std. 488.2–1987, IEEE Standard Codes, Formats, Protocols, and Common
Commands. The Institute of Electrical and Electronics Engineers, Inc., 345 East 47th Street, New
York, NY 10017 USA
84 922138-00 Rev A
Page 93

Getting Started Manual
Automation
Refer to the Automation Manual supplied on CD with your oscilloscope for
more information.
In addition to supporting the familiar ASCII-based remote commands that have
been used to control all Teledyne LeCroy oscilloscopes for many years, all of
the Windows-based X-Stream instruments fully-support control by
Automation interfaces based on Microsoft’s Component Object Model (COM).
Using COM, the controlling application can run directly on the instrument
without requiring an external controller. Alternatively, it can run using
Microsoft’s distributed COM standard (DCOM) on a networked computer.
Standards
Automation is a Microsoft technology, formerly referred to as OLE
Automation, primarily used to enable cross-application macro programming. It
is based upon the Component Object Model (COM), which is similar in nature
to CORBA, more commonly found in the UNIX world.
An application that exposes Automation Objects is referred to as an
Automation Server. Automation Objects expose Automation Interfaces to the
controlling Automation Client. This manual describes these Automation
objects and interfaces in detail.
It is important to note that Automation itself is not software language
dependent. Meaning, it can be used from any programming language that
supporting COM. Teledyne LeCroy’s usage concentrates mainly on the use of
Automation from the Visual Basic Script (VBScript) language. This is largely
because it is one of the easiest to use, it is the language that X-Stream
instruments use for setup files, and the VBScript interpreter is installed by
default on all X-Stream instruments. So, this is all available without having to
purchase any additional software.
922138-00 Rev A 85B
Page 94

WaveRunner Xi-A and MXi-A Oscilloscopes
Utilities
Status
The status read-only dialog displays system information including serial
number, firmware version, and installed software and hardware options.
Accessing the Status Dialog
Touch Utilities Utilities Setup… from the menu bar.
Touch the Status tab.
Remote communication
The Remote dialog is where you can select a network communication
protocol, establish network connections, and configure the Remote Control
Assistant log. The choice of communication protocols is limited to TCPIP and
GPIB.
PLEASE NOTE THE FOLLOWING:
GPIB is an option and requires a GPIB card to be installed in a card slot
at the rear of the oscilloscope.
The instrument uses Dynamic Host Configuration Protocol (DHCP) as
its addressing protocol. Therefore, it is not necessary to set up an IP
address if your network supports DHCP. If it does not, you can assign a
static address in the standard Windows 2000 network setup menu.
The Remote Control Assistant monitors communication between your PC and
oscilloscope when you are operating the instrument remotely. You can log all
events or errors only. This log can be invaluable when you are creating and
debugging remote control applications.
Remote Communication Setup
If you are connecting the oscilloscope to a network, first contact your
Information Systems administrator. If you are connecting the oscilloscope
directly to your PC, connect a GPIB or Ethernet cable between them.
86 922138-00 Rev A
Page 95

Getting Started Manual
Touch Utilities Utilities Setup… from the menu bar.
Touch the Remote tab.
Make a Port selection: TCPIP (transmission control protocol/Internet protocol)
or GPIB (general purpose interface bus). If you do not have a GPIB card
installed, the GPIB selection is not accessible.
If you are using GPIB, set a GPIB address by touching inside the GPIB Address
field and entering an address.
Touch the Net Connections button. The Windows Network Connections
screen is shown.
Touch Create a new connection and use the Windows Network Connection
Wizard to make a new connection. Or, touch Local Area Connection to
reconfigure the oscilloscope's connection (if it is already connected to the
network).
Configuring the Remote Control Assistant Event Log
Touch Utilities Utilities Setup… from the menu bar.
Touch the Remote tab.
Touch inside the Log Mode field and select Off, Errors Only, or Full Dialog
from the pop-up menu.
Export the contents of the event log to an ASCII text file by touching the Show
Remote Control Log button. The Event Logs popup window is shown. Touch
inside the DestFilename field and provide a file name. Now, touch the Export
to Text File button.
922138-00 Rev A 87B
Page 96

WaveRunner Xi-A and MXi-A Oscilloscopes
Hardcopy
Printing
Refer to Printing under the File Management topic (page 70).
Clipboard
This selection prints to the clipboard so you can paste a file into another
application (like MS Word, for example).
Printing from the Clipboard
Touch Utilities Utilities Setup… from the menu bar.
Touch the Hardcopy tab.
Under Colors, touch the Use Print Colors checkbox if you want the traces
printed on a white background. A white background saves printer toner.
Touch the Grid Area Only checkbox if you do not need to print the dialog area
and you only want to show the waveforms and grids.
Touch the Print Now button.
File
Choose File if you want to output the screen image to storage media such as
floppy drive or hard drive. When outputting to floppy disk, be sure to use a
preformatted disk.
Printing to a File
Touch Utilities Utilities Setup... from the menu bar.
Touch the Hardcopy tab, then the File icon.
Touch inside the File Format field and select a graphic file format from the
pop-up menu.
88 922138-00 Rev A
Page 97

Getting Started Manual
Under Colors, touch the Use Print Colors checkbox if you want the traces
printed on a white background. A white background saves printer toner.
Touch inside the Directory field and type the path to the folder you want to
print to, using the pop-up keyboard. Or, touch the Browse button and
navigate to the folder.
Touch inside the File Name field and enter a name for the display image, using
the pop-up keyboard.
Touch the Grid Area Only checkbox if you do not need to print the dialog area
and you only want to show the waveforms and grids.
Touch the Print Now button.
E-Mail
The instrument also gives you the option to e-mail your screen images, using
either the MAPI or SMTP protocols. Before you output to e-mail from the
Utilities dialog, you first have to set up the e-mail server and recipient address
in Preference Setup.
Sending E-mail
Touch Utilities Utilities Setup... from the menu bar.
Touch the Hardcopy tab, then the E-mail button.
Touch inside the File Format field and select a graphic file format from the
pop-up menu.
Under Colors, touch the Use Print Colors checkbox if you want the traces
printed on a white background. A white background saves printer toner.
Touch the Prompt for message to send with mail checkbox if you want to
include remarks with the image.
Touch the Grid Area Only checkbox if you do not need to print the dialog area
and you only want to show the waveforms and grids.
Touch the Print Now button.
922138-00 Rev A 89B
Page 98

WaveRunner Xi-A and MXi-A Oscilloscopes
Square Wave
Trigger Out - can be used to trigger another
oscilloscope
DC level - a reference level
Trigger Enabled - can be used as a gating
function to trigger another instrument when the
oscilloscope is ready
Pass/Fail - allows you to set a pulse duration
from 1 ms to 500 ms. This pulse occurs when
pass/fail testing is active and conditions are met.
Aux Output Off - turns off the auxiliary output
signal
Aux Output
In addition to a calibration signal, the following signals can be output through
the AUX OUTPUT connector:
Auxiliary Output Setup
Touch Utilities Utilities Setup... from the menu bar.
Touch the Aux Output tab.
If you simply want a 1 kHz, 1 V square wave, touch the button so labeled.
If you want a specialized output, touch one of the buttons under Use Auxiliary
Output For.
Touch inside the Amplitude field and enter a value, using the pop-up numeric
keypad. If you want a TTL level signal, touch the TTL Level checkbox. The
Amplitude field becomes unavailable.
If you selected Square Wave, touch inside the Frequency field and enter a
value, using the pop-up keypad. You can set a value from 5.0 Hz to 5 MHz.
If you selected Pass/Fail, touch inside the Pulse Duration field and enter a
value from 1 ms to 500 ms, using the pop-up numeric keypad.
90 922138-00 Rev A
Page 99

Getting Started Manual
Setting the Date and Time
The instrument gives you the choice of manually setting the time and date or
getting it from the Internet. If you elect to get the time and date from the
Internet, you need to have the oscilloscope connected to the Internet through
the LAN connector on the rear panel. You can also set time zones and daylight
savings time.
Manually Setting the Date and Time
Touch Utilities Utilities Setup... from the menu bar.
Touch the Date/Time tab.
Touch inside each of the Hour, Minute, Second, Day, Month, and Year fields
and enter a value, using the pop-up numeric keypad.
Touch the Validate Changes button.
Setting the Date and Time from the Internet
The Simple Network Time Protocol (SNTP) is used.
Ensure that the oscilloscope is connected to the Internet through the LAN
connector at the rear of the instrument.
Touch Utilities Utilities Setup... from the menu bar .
Touch the Date/Time tab.
Touch the Set from Internet button.
Setting the Date and Time from Windows
Touch Utilities Utilities Setup... from the menu bar .
Touch the Date/Time tab.
Touch the Windows Date/Time button
Use the Time & Date Properties window to configure the time, including time
zone.
922138-00 Rev A 91B
Page 100

WaveRunner Xi-A and MXi-A Oscilloscopes
Touching the Show Windows Desktop button in the
main Utilities dialog minimizes the instrument
application to reveal the underlying desktop.
Maximize the application by touching the shortcut
icon
Options
Use this dialog to add or remove software options. For information about
software options, contact your local Teledyne LeCroy Sales and Service office,
or visit our Web site at http://teledynelecroy.com/options.
Options that you purchase, such as JTA2, add performance to you instrument.
This added performance is seen in the new math functions or parameters that
you can choose from when doing Measure or Math setups.
Service
This button provides access to service dialogs, which are for the sole use of
Teledyne LeCroy service personnel. A security code is required to gain access.
Show Windows Desktop
92 922138-00 Rev A
 Loading...