

Page 1
2403 Walsh Avenue, Santa Clara, CA 95051-1302 Tel: +1/408.727.6600 Fax: +1/408.727.6622
CATC
™
USB Chief
™
Bus & Protocol Analyzer
User’s Manual
ForUSBChiefSoftwareVersion1.3
Manual Version 1.7
9 November, 2001
Page 2

Document Disclaimer
The information contained in this document has been carefully checked and is believed to be reliable.
However, no responsibility can be assumed for inaccuracies that may not have been detected.
CATC reserves the right to revise the information presented in this document without notice or
penalty.
Changes or Modifications
Any change or modification not expressly approved by CATC voids the user’s authority to operate
this equipment.
Trademarks and Servicemarks
CATC, NetMate, Advisor, Chief, FireInspector, Inspector, Detective, Traffic Generator, BusEngine,
USB4DOS, UPT, HPT, UHT, Galaxy, and Andromeda are trademarks of Computer Access
Technology Corporation.
Microsoft, Windows, Windows 98, Windows 2000, Windows ME and Windows NT are registered
trademarks of Microsoft Inc.
All other trademarks are property of their respective companies.
Copyright
Copyright © January 2001, Computer Access Technology Corporation (CATC); All Rights
Reserved.
This document may be printed and reproduced without additional permission, but all copies should
contain this copyright notice.
FCC Conformance
This equipment has been tested and found to comply with the limits for a Class A digital device,
pursuant to Part 15 of the FCC Rules. These limits are designed to provide reasonable protection
against harmful interference when the equipment is operated in a commercial environment. This
equipment generates, uses, and can radiate radio frequency energy and, if not installed and used in
accordance with the instruction manual, may cause harmful interference to radio communications.
Operation of this equipment in a residential area is likely to cause harmful interference in which case
the user will be required to correct the interference at his own expense. The end user of this product
should be aware that any changes or modifications made to this equipment without the approval of
CATC could result in the product not meeting the Class A limits, in which case the FCC could void
the user's authority to operate the equipment.
EU Conformance
This equipment complies with the EMC Directive 89/336/EEC and the Low Voltage Directive 73/
23/EEC, and their associated amendments for Class A Information Technology Equipment. It has
been tested and found to comply with EN55022:1995 Class A and EN61000-4-2:1995, EN61000-43:1995, EN61000-4-4:1995,and EN60950:1992. In a domestic environment this product may cause
radio interference in which case the user may be required to take adequate measures.
Part number: 730-0010-00
2
Page 3

CATC
Chief User’s Manual
Ve rs io n 1 .7
Chapter1:Overview ...................................................... 1
Chapter2:QuickInstallation ............................................... 3
SettingUptheUSBChiefAnalyzer...................................... 3
InstallingtheUSBChiefSoftware....................................... 3
MakingaUSBRecording.............................................. 3
CapturingYourFirstCATCTrace....................................... 4
TraceViewFeatures............................................ 4
Chapter3:Upgrades ...................................................... 7
SoftwareUpgrades................................................... 7
BusEngineandFirmwareUpgrades...................................... 8
DownloadingNewCode......................................... 8
UpgradingtheBusEngine........................................ 8
UpgradingtheFirmware......................................... 9
UpgradingfromChieftoChiefPlus............................... 10
Chapter4:DetailedInstallation ............................................ 13
SystemFeatures .................................................... 13
RecordingFeatures.................................................. 13
SystemComponents/PackingList ...................................... 14
Stand-AloneUnit ............................................. 14
USBChiefSystemSetup ............................................. 16
ACPowerSource............................................. 18
External Interface Breakout Board ................................ 19
PCConnection ............................................... 19
Record&GenerateUSBPort.................................... 20
Secondary Record USB Port..................................... 20
PC-for-AnalysisRequirements......................................... 20
USBChiefProgramInstallation........................................ 21
LoadingtheUSBChiefDrivers.................................. 21
InstallingtheUSBChiefProgram ................................ 21
MakingaUSBRecording....................................... 22
USBChiefProgramStartup........................................... 23
StartingtheUSBChiefProgramfromtheDesktop................... 23
StartingtheUSBChiefProgramfromitsDirectory................... 23
Software,Firmware,andBusEngineRevisions............................ 24
Tool Tips and Context-Sensitive Help ................................... 24
Chapter5:RecordingOptions.............................................. 27
GeneralRecordingOptions ........................................... 27
Recordingtype............................................... 27
Options ..................................................... 28
BufferSize .................................................. 28
TriggerPosition .............................................. 28
Optionsname ................................................ 29
iii
Page 4

CATC
Chief User’s Manual
Ve rs io n 1 .7
TraceFileName&Path........................................ 29
EventsRecordingOptions ............................................ 30
PacketIdentifiers ............................................. 30
TokenPatterns ............................................... 31
FramePatterns ............................................... 31
DeviceRequests.............................................. 32
DataPattern.................................................. 33
Bus Conditions ............................................... 33
Errors ...................................................... 34
ExternalSignals .............................................. 34
ActionsRecordingOptions............................................ 35
UsingtheBlueDotMenus...................................... 36
SettingExternalTriggers ....................................... 36
OutputSignalingPinAssignments................................ 36
TokenEventSequencing ....................................... 37
Filter Out/In ................................................. 37
Setting Counters .............................................. 37
ElasticArrow ................................................ 38
SavingRecordingOptions ............................................ 39
RecordingBusData ................................................. 39
Chapter6:DisplayOptions................................................ 41
GeneralDisplayOptions.............................................. 42
ColorDisplayOptions ............................................... 43
FormatsDisplayOptions ............................................. 44
Filters Display Options ............................................... 45
HideFields.................................................. 45
HidePackets................................................. 45
HideTransactions............................................. 45
AdvancedHide............................................... 45
SavingDisplayOptions .............................................. 47
Chapter7:ReadingaCATCTrace ......................................... 49
TraceViewFeatures................................................. 49
SetMarker......................................................... 50
EditorClearMarker................................................. 51
ViewRawBits ..................................................... 51
MeasureTimefromTrigger........................................... 52
MeasureTimefromMarker........................................... 53
Searchforthenext… ................................................ 54
ExpandedandCollapsedDataFormats .................................. 54
ViewDataBlock.................................................... 55
HidePacketsandFields .............................................. 56
FromtheToolBar............................................. 56
From the User-Defined Hide Window ............................. 56
SwitchtoTransactionsView .......................................... 58
iv
Page 5

CATC
Chief User’s Manual
Ve rs io n 1 .7
ViewDecodedTransactions........................................... 60
ExpandedandCollapsedTransactions............................. 60
SwitchtoTransferView.............................................. 61
ViewDecodedTransfers ............................................. 62
ExpandedandCollapsedTransfers................................ 63
DecodingofProtocol-SpecificFieldsinTransactions/Transfers............... 64
Chapter8:DecodeRequests ............................................... 65
GeneralOptions .................................................... 65
USBRequest................................................. 65
DecodingClassRequests....................................... 66
Decoding Vendor Requests ..................................... 66
DecodingUSBRequests........................................ 67
Decoding Class- and Vendor-Specific Descriptors ................... 67
Creating a New Class or Vendor Definition File ........................... 67
Class/Vendor Decoding Options . . ..................................... 69
Request Recipient to Class/Vendor Decoding ....................... 69
Class/Vendor Endpoint Decoding . ..................................... 71
Chapter9:OtherFeatures................................................. 75
Search............................................................ 75
GotoTrigger ................................................ 75
GotoPacket................................................. 75
GotoMarker................................................. 76
Goto....................................................... 76
Find... ...................................................... 80
FindNext ................................................... 83
ChangeDirection ............................................. 83
Right-ClickShortcutsWindow......................................... 84
Power and Connection Settings . . . ..................................... 84
EditComment...................................................... 85
Export Packets ..................................................... 86
PacketstoText(PacketViewFormat)............................. 86
PacketstoText(GeneratorTextFileFormat) ....................... 87
Data........................................................ 88
Alternate Access to the Export Data Window ....................... 89
Reports ........................................................... 89
FileInformation .............................................. 89
ErrorSummary............................................... 90
TimingandBusUsageCalculator ................................ 92
TransactionSummary.......................................... 92
Chapter10:TrafficGeneration(HostEmulation) ............................. 95
PreparingtheUSBChiefforTrafficGeneration........................... 95
TextFileFormatforTrafficGenerationInput....................... 95
GeneratingUSBTraffic .............................................. 98
v
Page 6

CATC
Chief User’s Manual
Ve rs io n 1 .7
SettingUptheGenerator ....................................... 98
Generating Traffic Without a Device Connected ..................... 99
OpeningaTrafficGenerationFile................................ 99
Exporting a Traffic Generation File .............................. 100
StartTrafficGeneration ....................................... 102
RepeatMode................................................ 102
StopTrafficGeneration ....................................... 102
Chapter11:SecondaryChannelRecording.................................. 105
Secondary Recording Main Display Window ............................ 107
Secondary Recording File Options . .................................... 107
SaveAs.................................................... 107
Print....................................................... 108
Export ..................................................... 108
Secondary Setup Options ............................................ 109
GeneralRecordingOptions .................................... 109
EventsRecordingOptions ..................................... 109
ActionsRecordingOptions..................................... 110
Secondary Report Options ........................................... 110
Secondary Recording File Information............................ 110
Secondary Recording Timing Calculations ........................ 110
Secondary Recording Transaction Summary ....................... 111
Search........................................................... 111
SearchIn................................................... 111
View............................................................ 112
StatusBarSearchStatus....................................... 112
HidePrimary................................................ 112
Hide Secondary.............................................. 112
Appendix.............................................................. 113
External Interface Breakout Board . .................................... 113
Setting Up the External Interface Breakout Board ................... 113
USBCurrentMeasure......................................... 115
PrototypeReworkArea ....................................... 115
The Main Display Windows .......................................... 117
ViewOptions ..................................................... 118
ToolBar ......................................................... 119
StatusBar ........................................................ 119
RecordingProgress........................................... 120
RecordingStatus............................................. 120
RecordingActivity........................................... 121
SearchStatus................................................ 121
ZoomIn.................................................... 121
ZoomOut .................................................. 122
NoWrap................................................... 122
HideDevices................................................ 122
vi
Page 7

CATC
Chief User’s Manual
Ve rs io n 1 .7
USB Chief Keyboard Shortcuts . . . .................................... 123
HowtoContactCATC................................................... 125
WarrantyandLicense ................................................... 125
vii
Page 8

CATC
Chief User’s Manual
Ve rs io n 1 .7
viii
Page 9

Chief User’s ManualCATC Version 1.7
Chapter 1: Overview
The CATC USB Chief Bus & Protocol Analyzer is an invaluable development and
test tool for designers involved with the Universal Serial Bus (USB). When
connected to any USB branch, the USB Chief Analyzer can monitor the bus
activity and display information about the recorded packets. The easy-to-use USB
Chief program operates in the Windows 95® (OSR 2.1), Windows 98®, Windows
98SE®, and Windows 2000® environments.
The USB Chief Analyzer consists of the Bus & Protocol Analyzer unit and USB
Chief software. Not to be confused with the USB bus being monitored, the
Analyzer unit itself is configured and controlled by a personal computer through
a USB port. The Analyzer is connected to a USB branch with a non-intrusive, high
impedance tap. It listens and records relevant signals on the bus and is also capable
of transmission.
The USB Chief Analyzer supports the Universal Serial Bus, version 1.1. The USB
industry standard refers to a cable bus that supports data exchange between a host
computer and a wide range of simultaneously accessible peripherals. The attached
peripherals share USB bandwidth through a host-scheduled, token-based
protocol. The bus allows peripherals to be attached, configured, used, and
detached while the host and other peripherals are in operation.
Please refer to the Universal Serial Bus Specification, version 1.1 for details on
the protocol. The USB specification is available from the USB Implementers
Forum (USB-IF) at
USB Implementers Forum
1730 SW Skyline Blvd. Suite 203
Portland, OR 97221
Tel: +1/503.296.9892
Fax: +1/503.297.1090
Web: http://www.usb.org/
1
Page 10

Chief User’s ManualCATC Version 1.7
2
Page 11

Chief User’s ManualCATC Version 1.7
Chapter 2: Quick Installation
The USB Chief Bus & Protocol Analyzer components and software are easily
installed and quickly ready to run on most personal computer systems. You can
begin making USB recordings after following these initial steps. However, if you
are new to personal computers and protocol Analyzers, if you are unsure about
what to do after reading the Quick Installation instructions, or if your Analyzer
does not work after you follow these instructions, read through the subsequent
sections in this manual.
Setting Up the USB Chief Analyzer
Step 1 Connect the AC power cable to the rear of the Analyzer.
Step 2 Turn on the power switch on the rear of the Analyzer.
Step 3 Insert the first diskette for your operating system.
Step 4 Connect the USB port on the back of the Analyzer to the PC for analysis
using the LONG (6’) USB cable.
Step 5 Connect the USB host (or hub) and the device being analyzed to the
primary USB port on the front of the Analyzer (Record & Generate)
using the
SHORTER (3’) USB cables.
Step 6 Follow the on-screen Plug-and-Play instructions under Windows.
Step 7 Search the diskette for the USB Chief Bus & Protocol Analyzer drivers.
Installing the USB Chief Software
Step 1 Run the program a:\setup and follow the on-screen instructions.
Step 2 Launch the CATC USB Chief program from the CATC programs group.
Making a USB Recording
After installation, the software is configured to make a one-Mbyte snapshot
recording of your USB traffic.
To make this recording, follow these steps:
Step 1 Click on the Tool Bar.
After 1 Mbyte of traffic is recorded, the Analyzer uploads the data and
displays the packets.
To upload and display less than one Mbyte of traffic,
Step 2 Click on the Tool Bar at any time before recording automatically
terminates.
When the recording session is finished, the bus traffic is saved to the hard
drive as a file named data.usb or whatever name you assign as the
default filename.
3
Page 12
Chief User’s ManualCATC Version 1.7
To save a current recording for future reference, follow these steps:
Step 3 Select Save As under File on the Menu Bar.
OR
Click on the Tool Bar.
You see the standard Save As screen.
Step 4 Give the recording a unique name and save it to the appropriate directory.
Capturing Your First CATC Trace
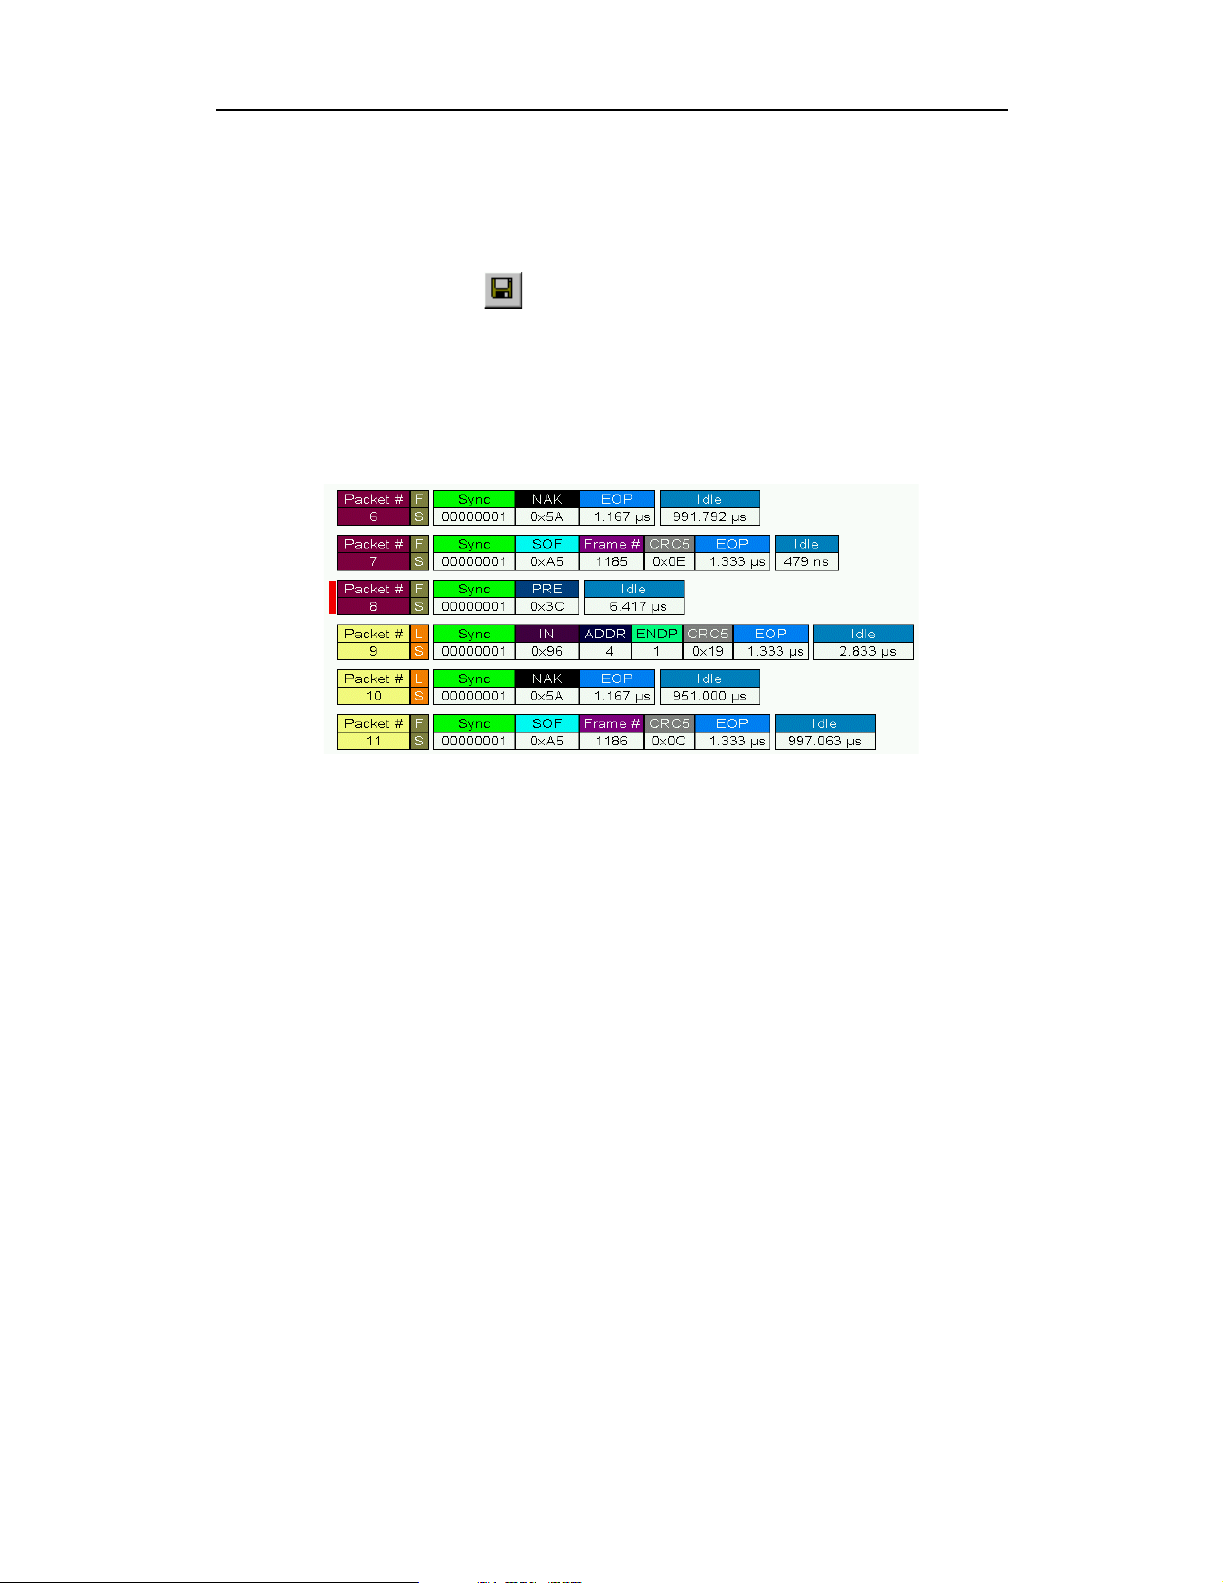
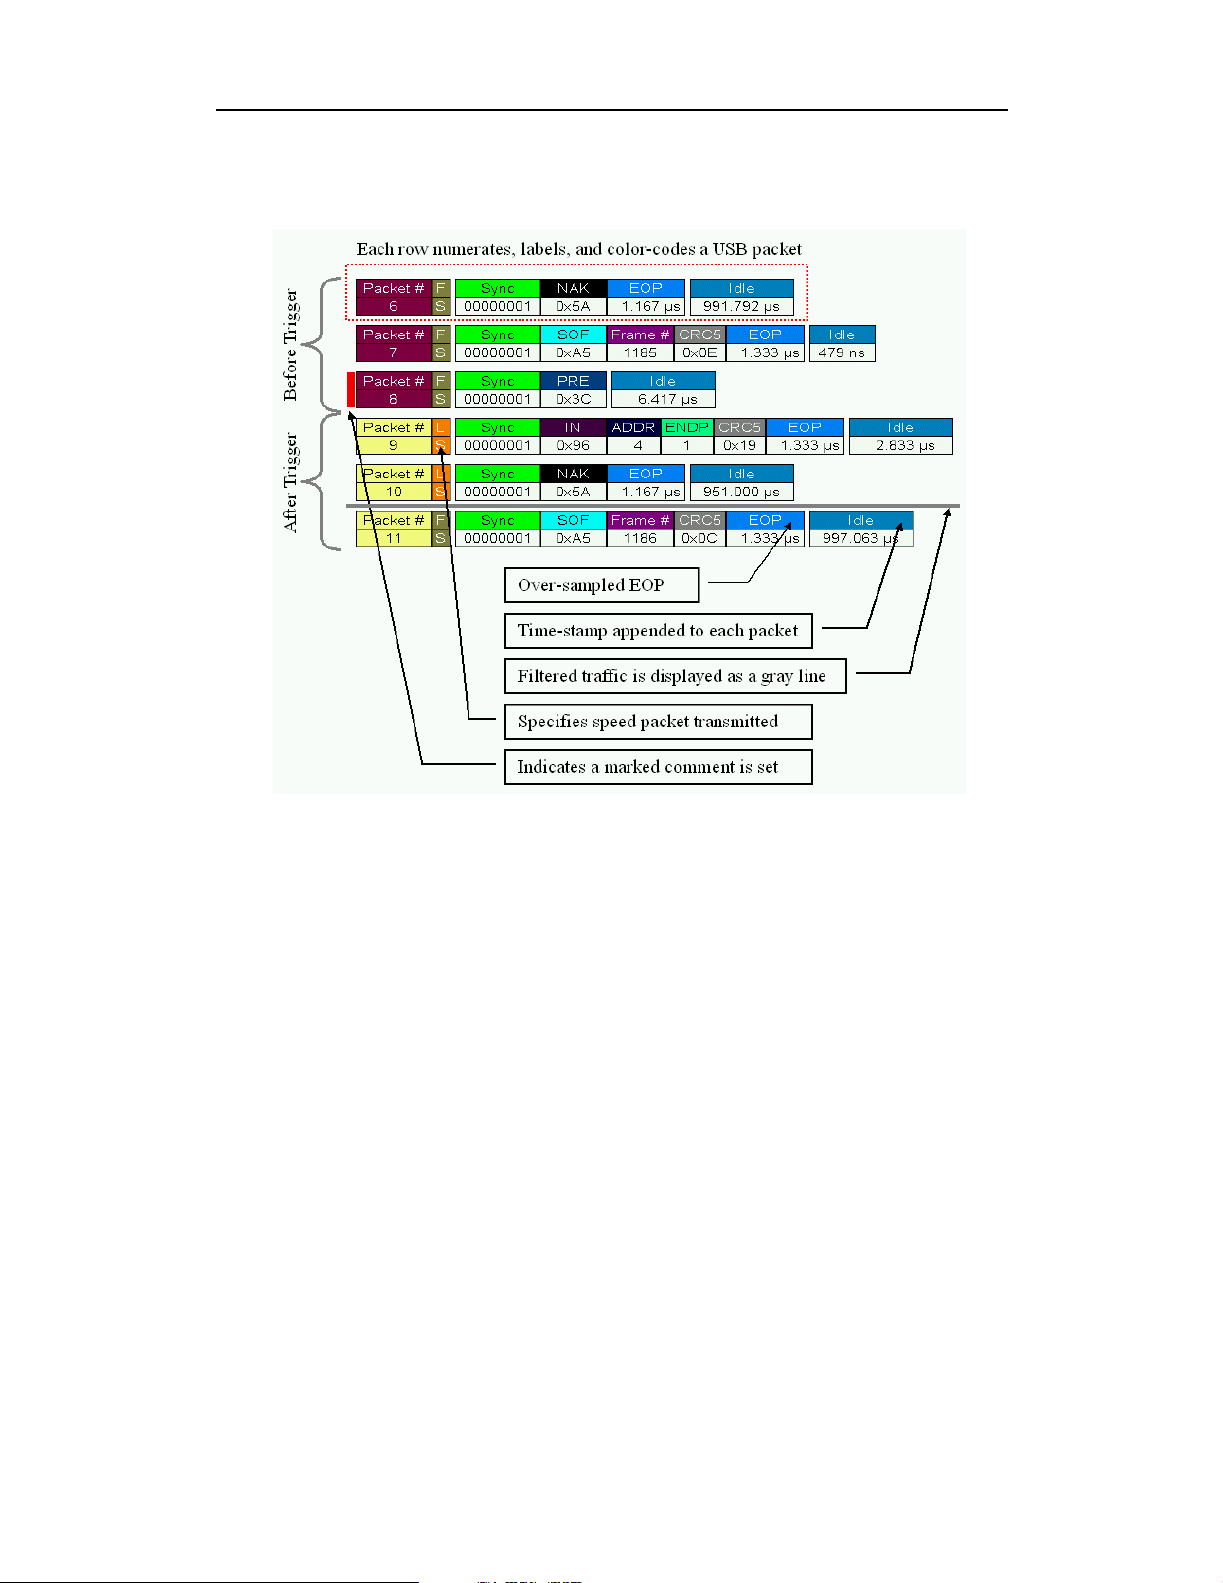
Trace View Features
• The USB Chief packet view display makes extensive use of color and graphics
to fully document the captured traffic.
• Packets are shown on separate rows, with their individual fields both labeled
and color coded.
• Packets are numbered (sequentially, as recorded), time-stamped (with a
resolution of 83.3ns), and highlighted to show the transmitted speed
(low-speed or full-speed).
• Display formats can be named and saved for later use.
• Pop-up Tool Tips annotate packet fields with detailed information about their
contents
• Data fields can be collapsed to occupy minimal space in the display (which can
in turn be zoomed in and out to optimize screen utilization).
• The display software can operate independent of the hardware and so can
function as a stand-alone Trace Viewer that may be freely distributed.
4
Page 13
Chief User’s ManualCATC Version 1.7
5
Page 14

Chief User’s ManualCATC Version 1.7
6
Page 15
Chief User’s ManualCATC Version 1.7
Chapter 3: Upgrades
From time to time as modifications are made to the Analyzer, it is necessary to
update the Chief for optimal performance. These changes require that you be
familiar with the procedures for updating the three portions of the Analyzer: the
software, the firmware, and the BusEngine. If you haven’t already done so, you
may also want to upgrade from USB Chief to Chief Plus so that you can use your
Analyzer to generate traffic.
You can check the version of USB Chief you are running by selecting About USB
Chief from the Help menu.
Software Upgrades
When a new software release is available, it is posted on the Support page of the
CATC website at www.catc.com/support.html.
To update the software, follow these steps:
Step 1 In the About USB Chief screen, verify which version of USB Chief
Software you are currently running.
Step 2 Find the latest released software version on the CATC website under
Support.
If you are running the latest version of the software, no further action is
needed.
If you are not running the latest version, continue to Step 3.
Step 3 Click on the first link to download the zipped Disk 1 files for your
operating system.
Step 4 ClickonthesecondlinktodownloadthezippedDisk2files.
Step 5 Unzip the files into your choice of directory.
Step 6 Click Start,thenRun, and browse to where you unzipped the files.
Step 7 Select the program named Setup and click Open.
Step 8 Click OK to run the Setup and begin the installation.
Step 9 Follow the on-screen instructions to complete the installation.
Step 10 Read the Readme file for important information on changes in the
release.
7
Page 16
Chief User’s ManualCATC Version 1.7
BusEngine and Firmware Upgrades
To update the BusEngine and the USB Chief Analyzer Firmware, follow these
steps:
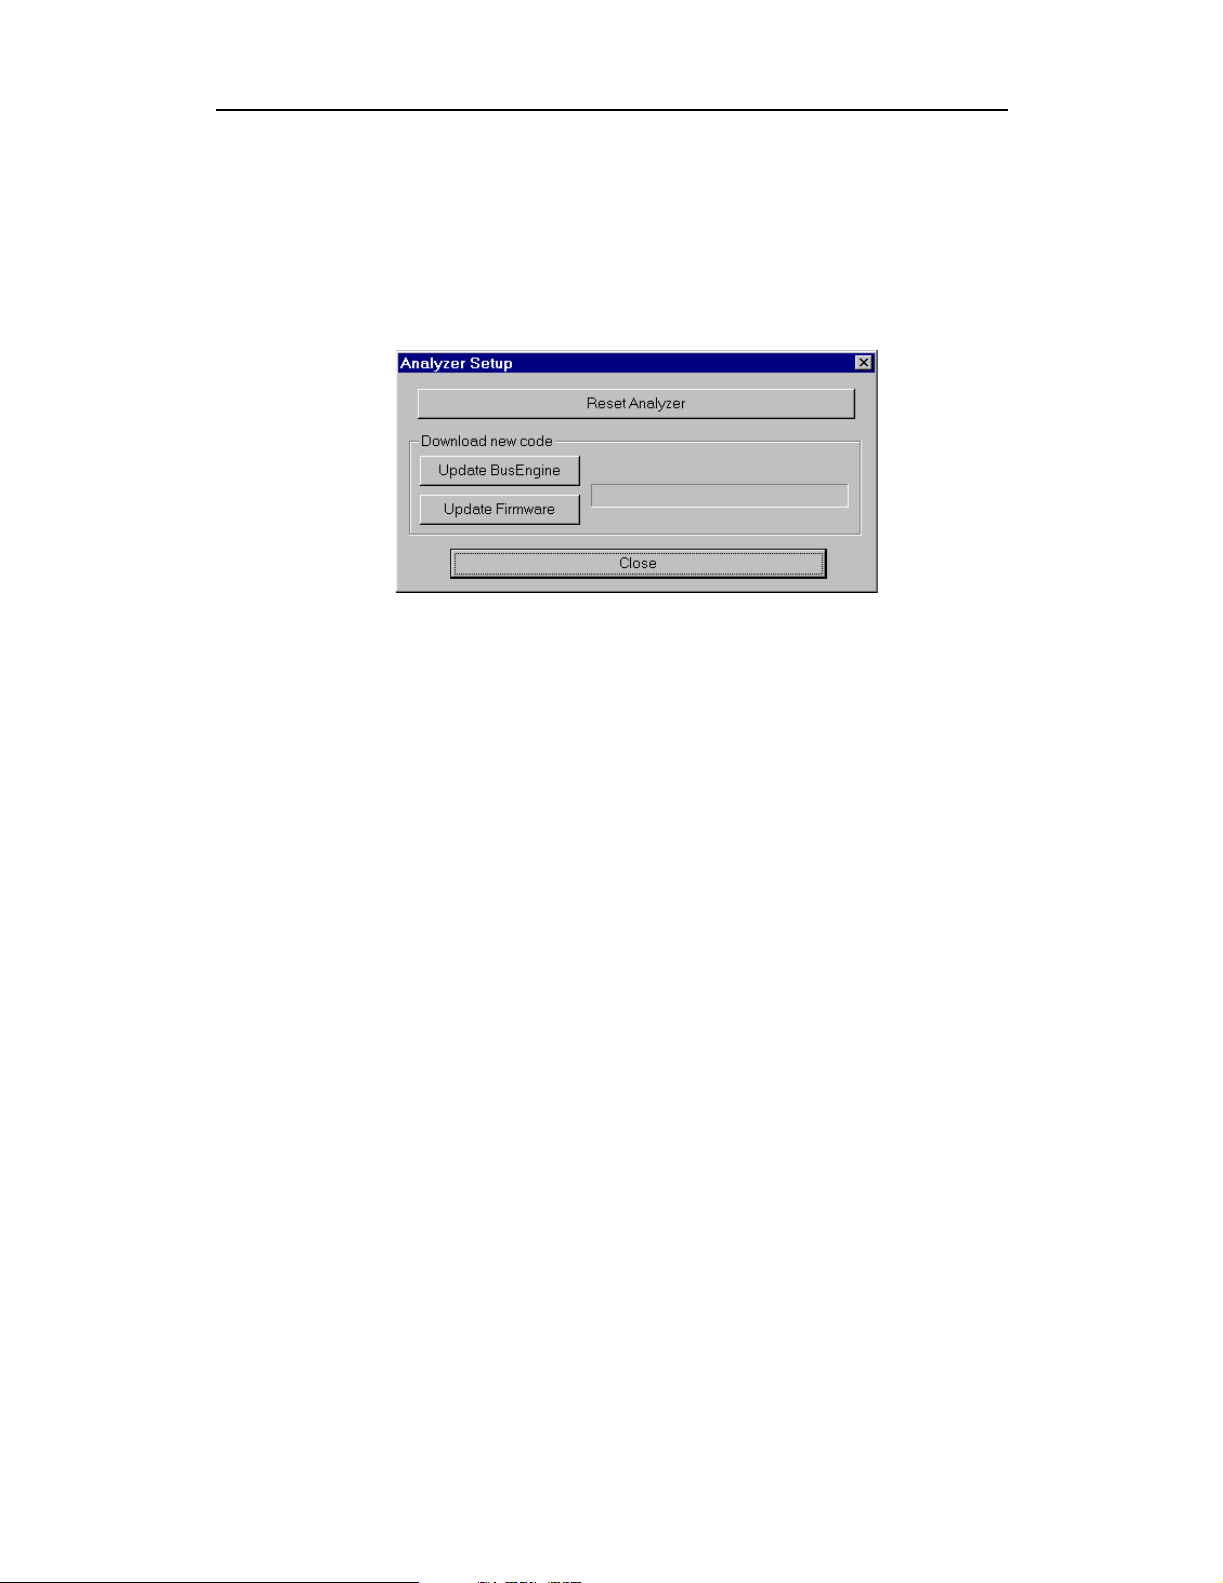
Step 1 From the Setup menu, select Analyzer.
The Analyzer Setup window appears:
Step 2 Click Reset Analyzer
The Analyzer resets, performs self-diagnostics, and returns to service.
Note The self-diagnostics should complete about five seconds after the trigger LED
lights. If the diagnostics fail, the trigger LED blinks on and off continually,
indicating faulty hardware. If this occurs, contact CATC for customer support.
Downloading New Code
The BusEngine core is the heart of the USB Chief Analyzer. Using state-of-the-art
PLD technology, it incorporates both the high speed recording engine and the
configureable building blocks that implement data/state/error detections,
triggering, capture filtering, external signal monitoring, and event counting and
sequencing. Both the BusEngine program and the Firmware that manages the
internal microcontroller are fully field upgradeable.
Upgrading the BusEngine
Within a new software release, it may be necessary to update the Analyzer’s
BusEngine hardware for proper operation. The Readme file lets you know if this
is necessary.
To update the BusEngine, follow these steps:
Step 1 Click Update BusEngine on the Analyzer Setup screen.
8
Page 17
Chief User’s ManualCATC Version 1.7
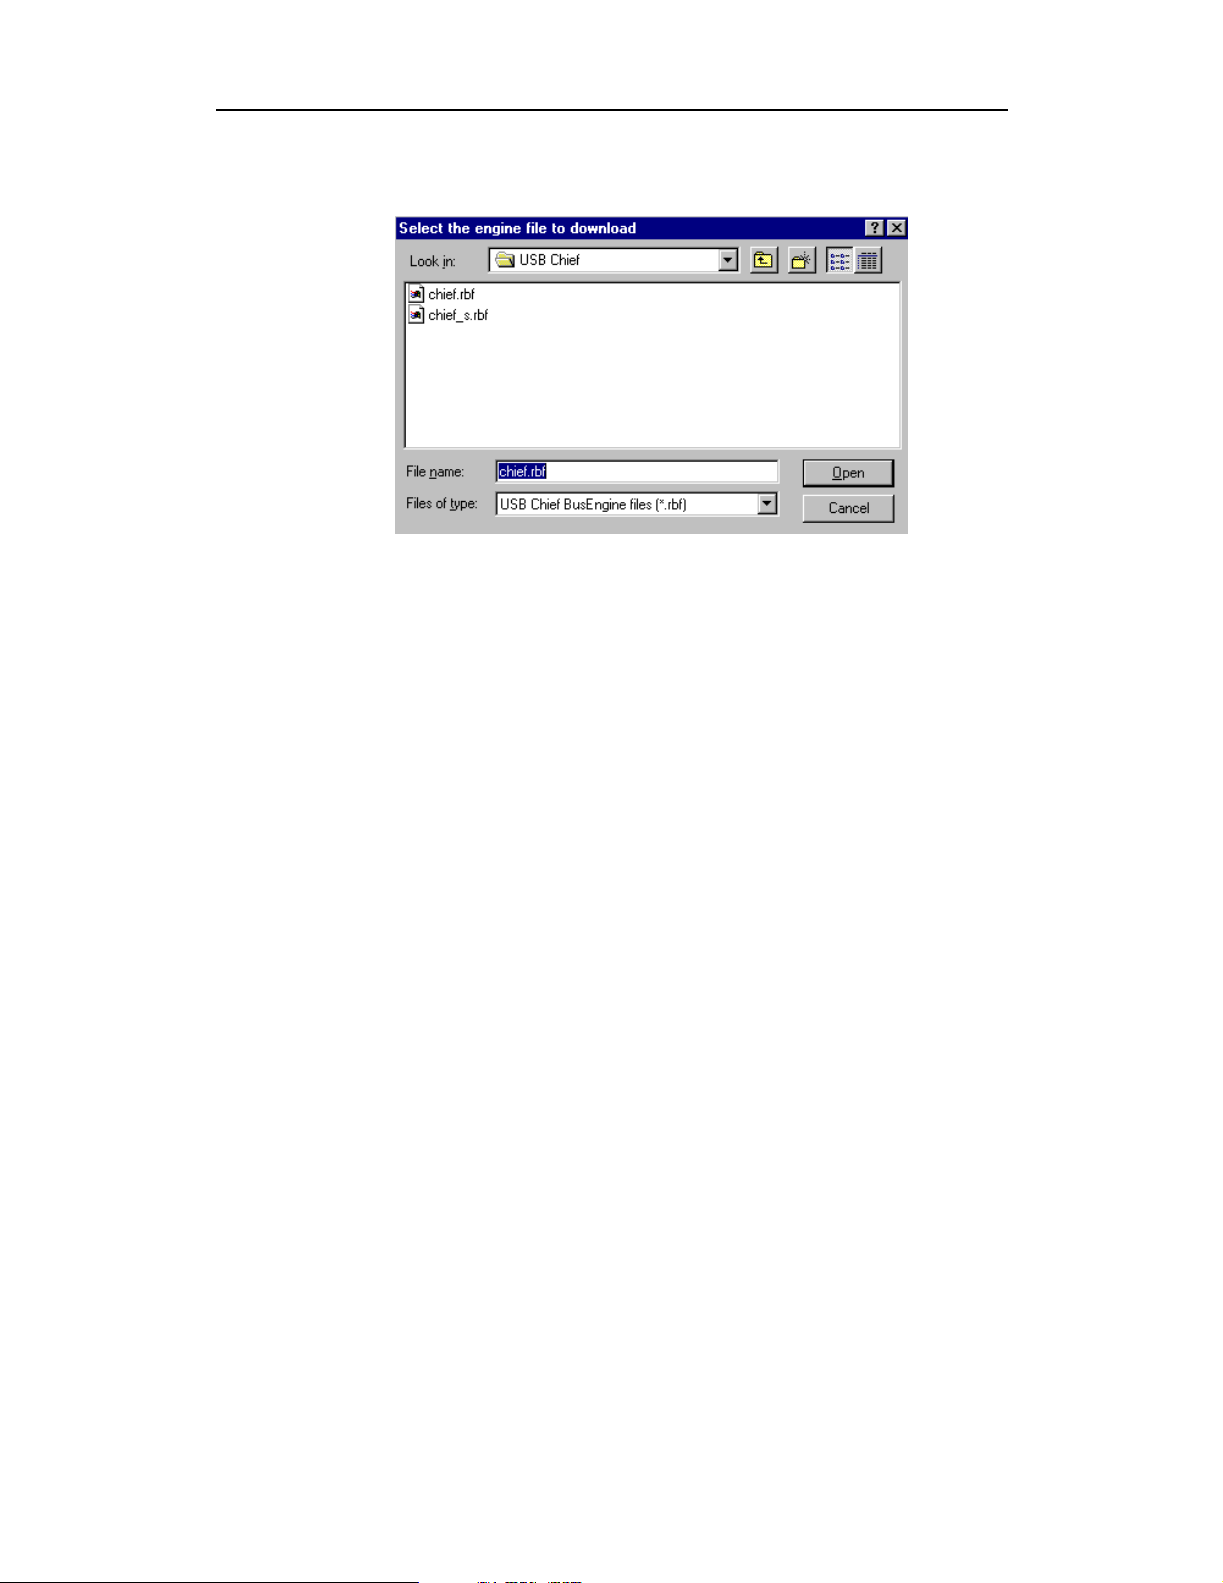
The Select engine file window appears:
The program has already automatically searched for the correct file and
displays it in the File name field.
Note The most current Primary BusEngine file (chief.rbf), Secondary Channel
BusEngine file (chief_s.rbf), and Firmware file (chieffw.ihx) were copied to your
\CATC\USB Chief directory when you installed the program.
Step 2 Click Open.
It is not necessary to restart the Analyzer. Once upgraded, the Analyzer takes
approximately 15 seconds to reinitialize, with Time Remaining displayed on the
screen. During this time the Trigger LED is on, indicating that power-on
diagnostics are being run. If there is a hardware failure, the Trigger LED continues
to blink after initialization is complete. If this occurs, contact CATC for customer
support.
Upgrading the Firmware
Within a new software release, it may also be necessary to upgrade the Analyzer’s
firmware for proper operation. The Readme file informs you if this is necessary.
To upgrade the firmware, follow these steps:
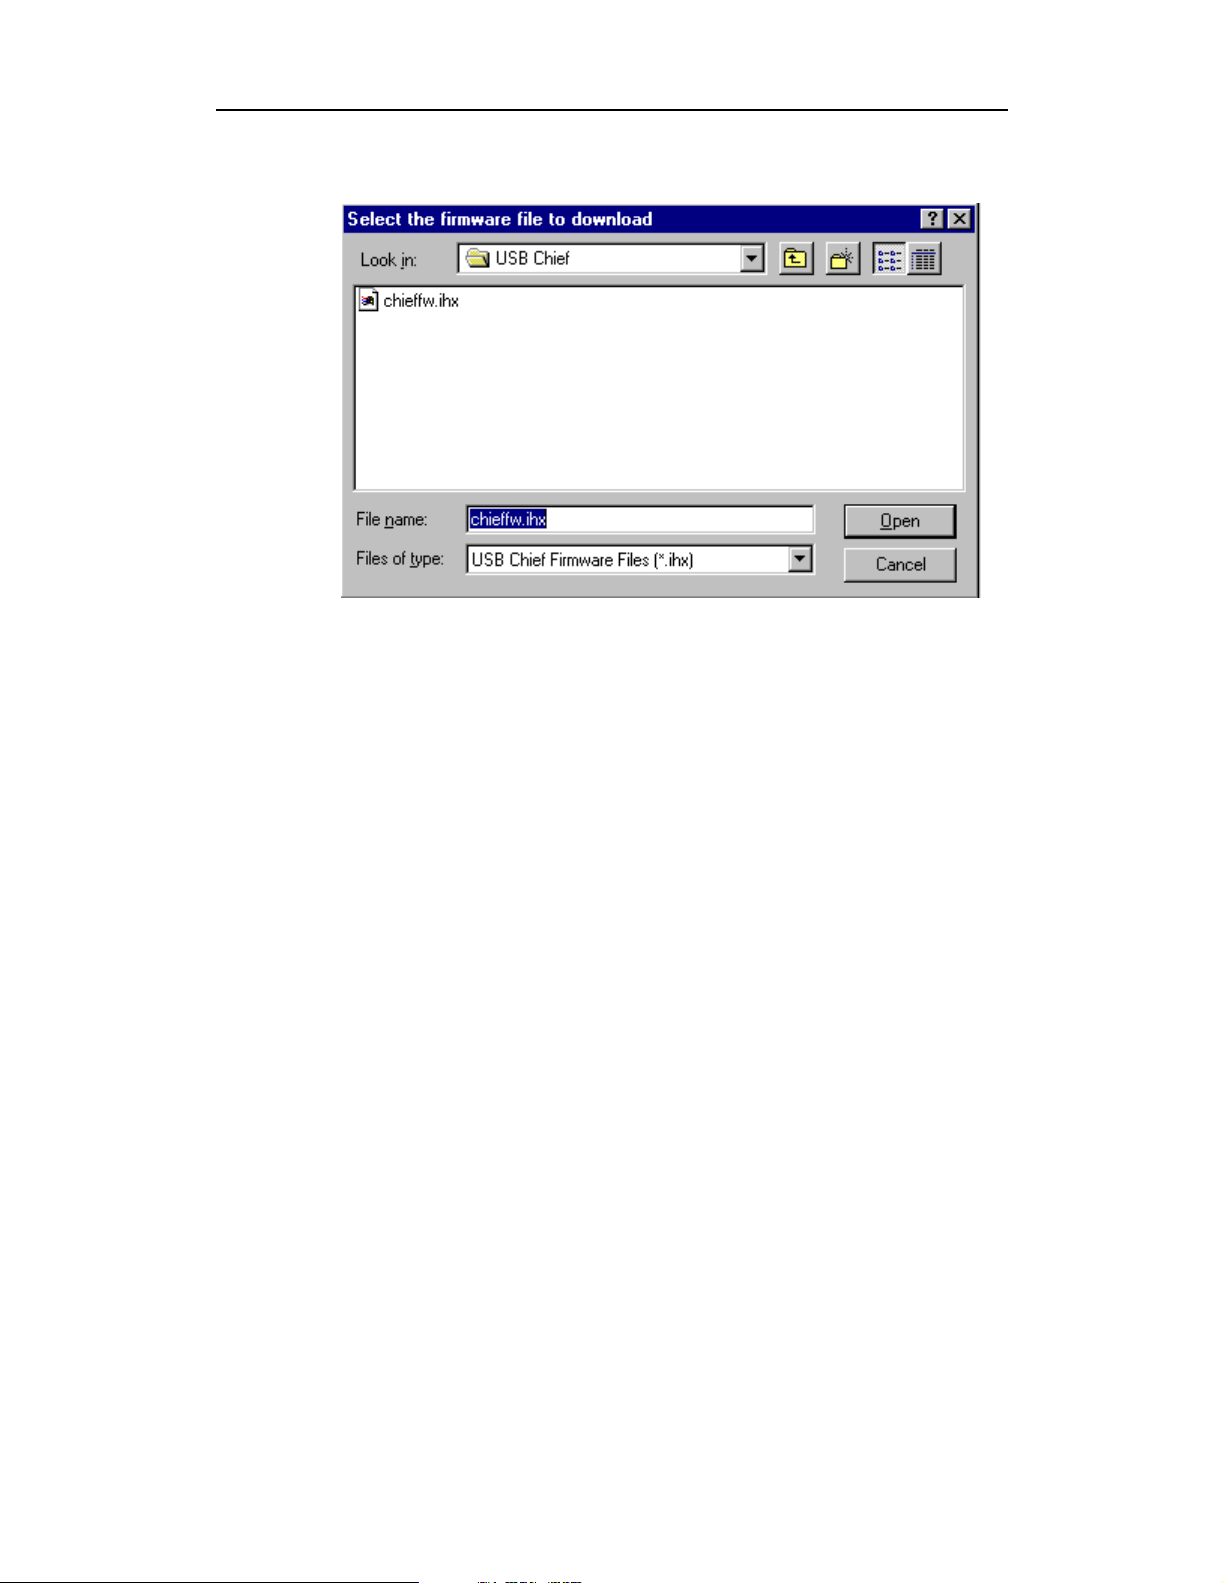
Step 1 Click Upgrade Firmware on the Analyzer Setup screen.
The Select firmware file window appears:
9
Page 18
Chief User’s ManualCATC Version 1.7
The program has already automatically searched for the correct file and
displays it in the File name field.
Step 2 Click Open.
The Analyzer upgrades the Firmware.
Step 3 Unplug the USB cable from the back of the Analyzer box and then
reinsert it so the new Firmware upgrade can take effect.
Upgrading from Chief to Chief Plus
Traffic Generation (Host Emulation) is an optional feature of the USB Chief
Analyzer and requires hardware support. Each unit is capable of supporting
Traffic Generation and must be upgraded only once to enable this additional
feature. Once upgraded, your USB Chief Analyzer becomes a USB Chief Plus
Analyzer.
10
Page 19
Chief User’s ManualCATC Version 1.7
To upgrade your Analyzer for Traffic Generation, follow these steps:
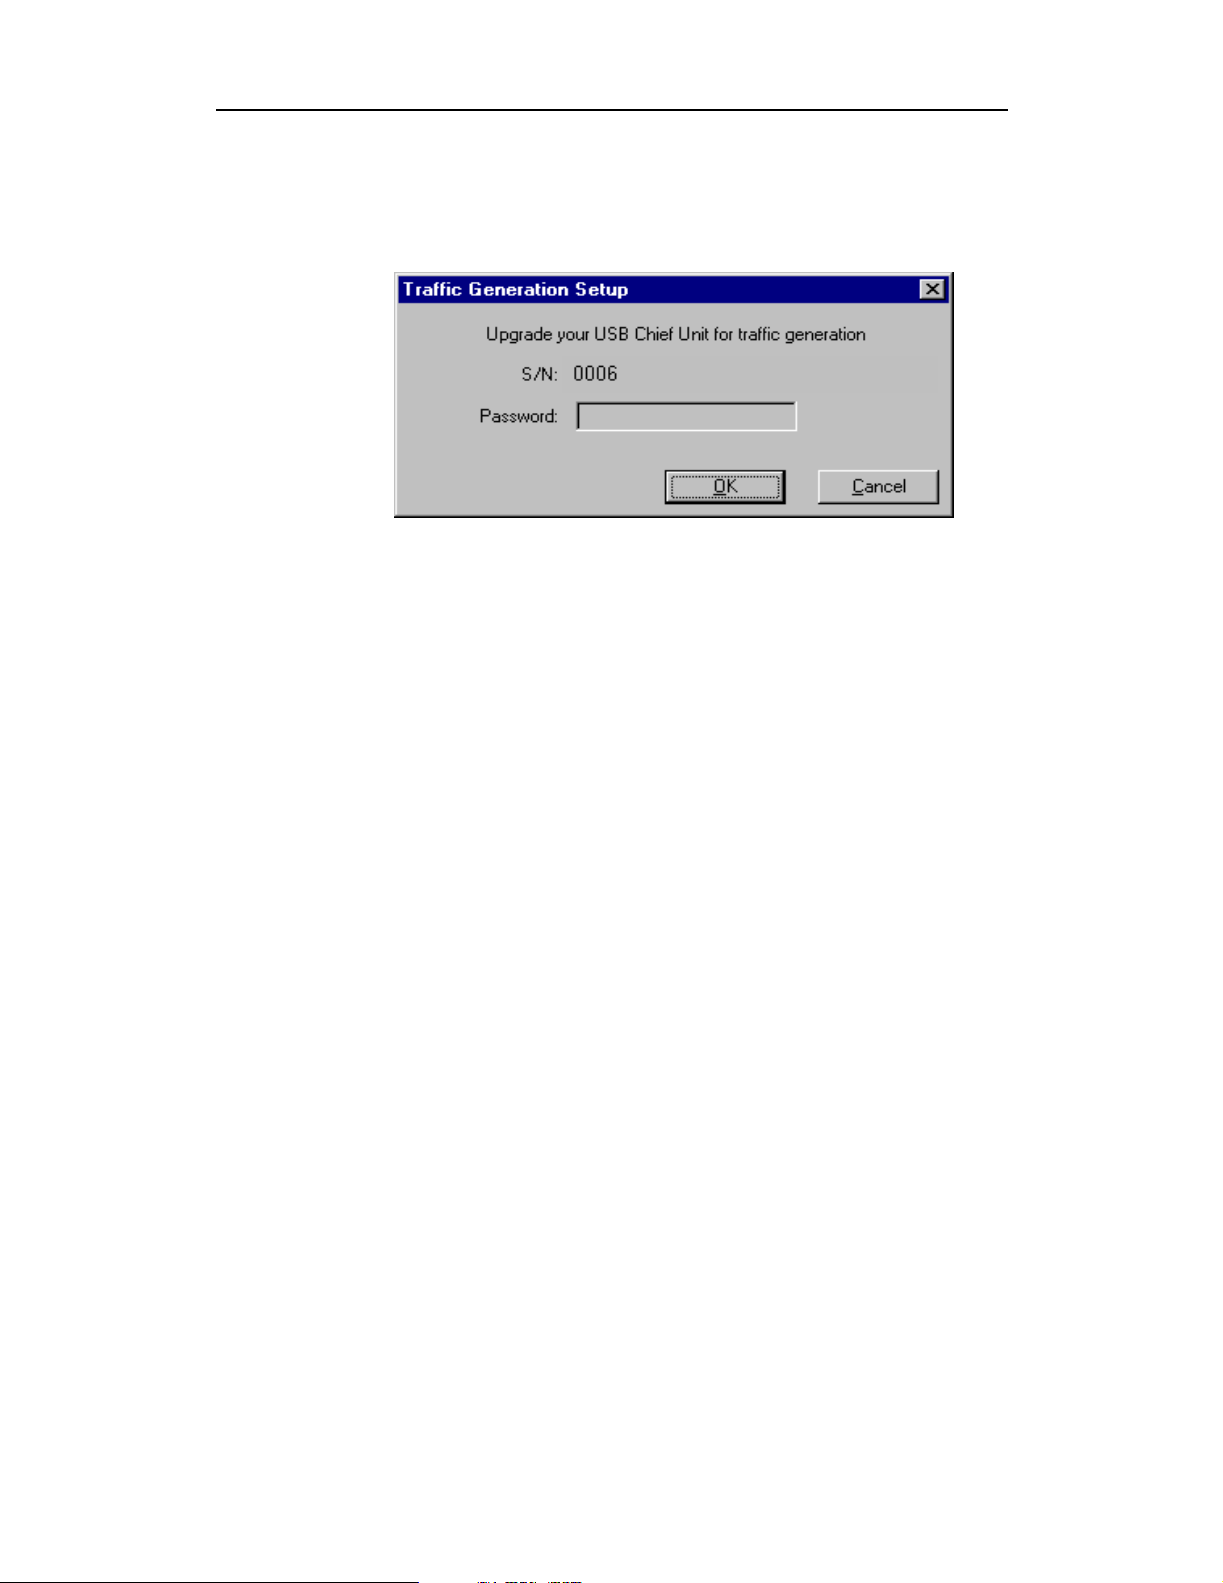
Step 1 From the Setup menu, select Traffic Generation .
The Traffic Generation Setup window appears:
Step 2 In the Password field, enter the password supplied by CATC .
If your unit has already been upgraded, the dialog will notify you of this and a
password will not be necessary.
11
Page 20

Chief User’s ManualCATC Version 1.7
12
Page 21

Chief User’s ManualCATC Version 1.7
Chapter 4: Detailed Installation
System Features
• Third generation Analyzer, backward compatible with Inspector
Detective
• Modular system architecture with field upgradeable firmware & recording
engine
™
†
Trace files
• Fully USB version 1.1 compliant
• One year warranty and hotline customer support
• Expanded 128MB of physical data recording memory
†
• New secondary recording channel to aid in the development of hub devices
• High speed USB connection to desktop or portable host PC
• Convenient access to measure device current, detect bad device power, and
scope USB D+/D- signals
†
• High impedance tap that inserts non-intrusively into any branch of a USB
system
• Convenient detach device switch that saves time and reduces USB
cable/connector wear for multiple connects and disconnects to the host
• Detection and alert for every potential bus error, protocol violation, and
combinations thereof
• High resolution, accurate time stamping of bus packets, timing measurement,
and analysis functions
†
™
and
†
†
†
• The popular CATC Trace graphical display of bus packets, transactions, and
transfers
• Extensive search and packet hiding capabilities
• Enhanced device class decoding plus user-defined protocol decoding
†
†
†
• Software operation as stand-alone Trace Viewer
• Built-in USB bus Traffic Generation (“Plus” model only)
†
new or enhanced feature not available in the Detective or Inspector Analyzer
Recording Features
• Versatile triggering—bit-wise value and mask data patterns up to eight bytes
wide for SETUP transactions and data packets
• Advanced triggering with event counting and sequencing
• Triggering on multiple error conditions—PID bad, bit stuffing bad, CRC bad,
end-of-packet bad, babble, loss of activity, frame length violation, time-out or
turn-around violation, data toggle violation
13
†
†
†
Page 22

Chief User’s ManualCATC Version 1.7
• Real-time traffic capture filtering
• Automatic detection and capture of full- and low-speed traffic
†
new or enhanced feature not available in the Detective or Inspector Analyzer
System Components/Packing List
• One stand-alone USB Chief Analyzer unit with AC power cord
• One External Interface Breakout Board with a 37-pin ribbon cable
• Three USB cables: two 3-foot (1-meter) cables and one 6-foot (2-meter) cable
• USB Chief software program installation diskette(s)
• Product documentation including on-line help
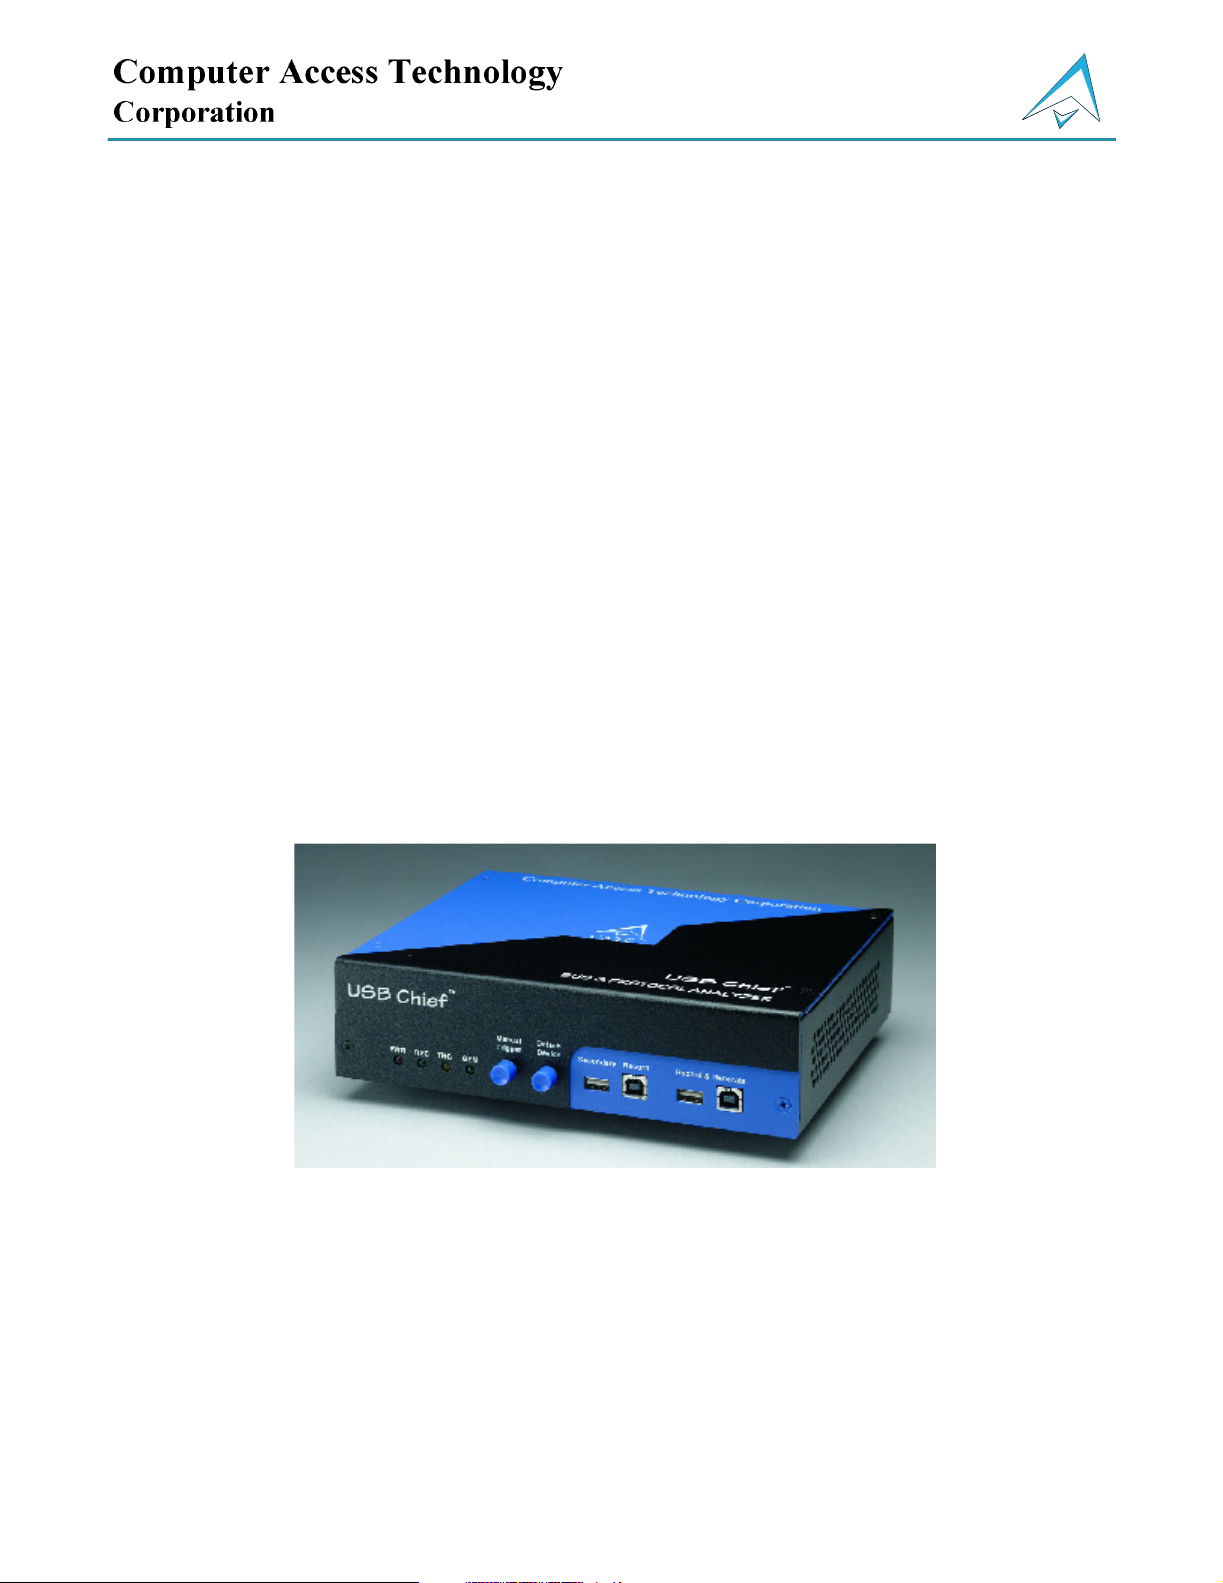
Stand-Alone Unit
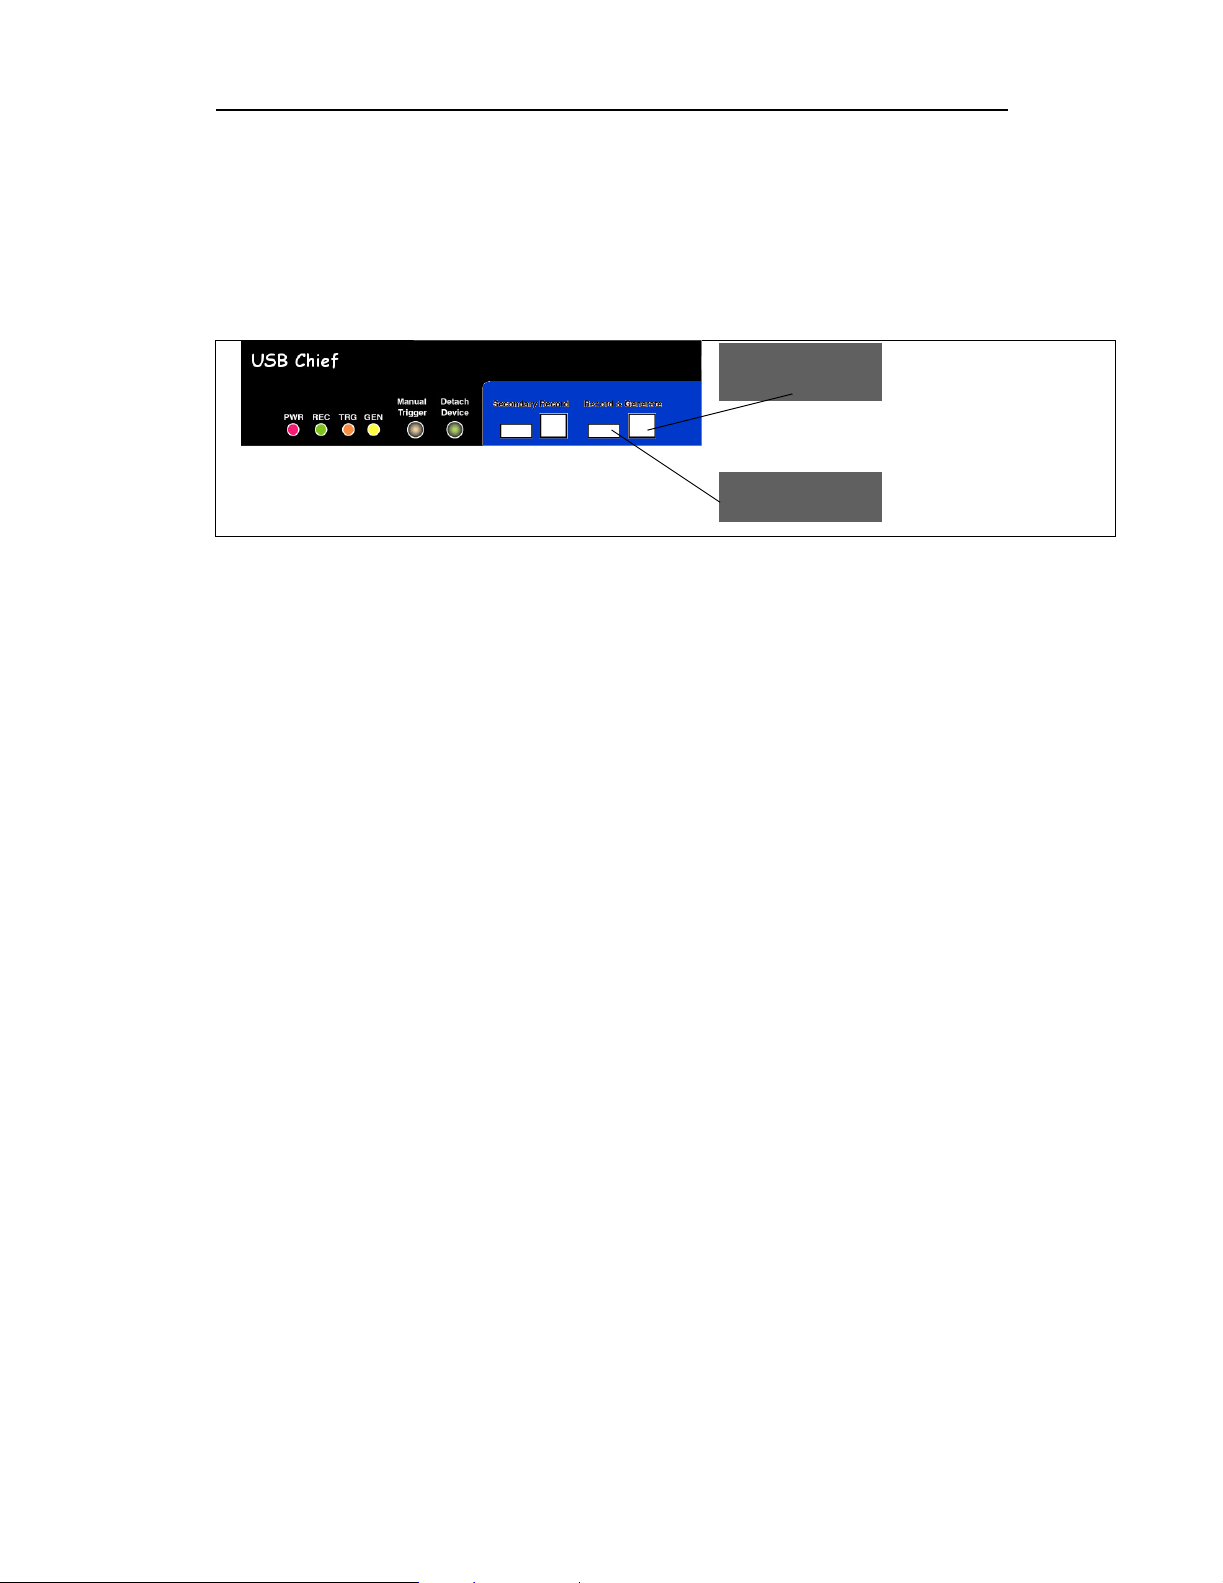
The USB Chief Analyzer has several user-accessible controls on its front and rear
panels.
Figure 1: Front Panel
†
†
• Red PWR (power) indicator LED (lights when the unit power is switched on)
• Green REC (recording) LED (lights when the unit is recording)
• Yellow TRG (triggered) LED (lights when the unit triggers an event)
— Also lights during power-on testing and blinks when the hardware is faulty
• Yellow GEN (generate) LED (lights when the unit is generating traffic)
• Manual Trigger push-button (allows a manual Trace capture)
— After beginning a recording session, press the Manual Trigger switch to
force a Trigger condition. The session completes when a specified
post-Trigger amount of bus data is recorded or when you manually stop a
recording session.
• Detach Device push-button (allows a momentary disconnection of the device
from the host on the primary port).
— This is especially useful when the traffic of interest occurs during device
enumeration. Use the Detach Device switch shortly after starting
recording to capture a Trace of the device’s enumeration.
• Two USB ports, Record & Generate (Primary Port) and Secondary Record
(Secondary Port), each with a type "A" and a type "B" connector
— (Record & Generate) records and generates traffic
— (Secondary Record) records only
14
Page 23
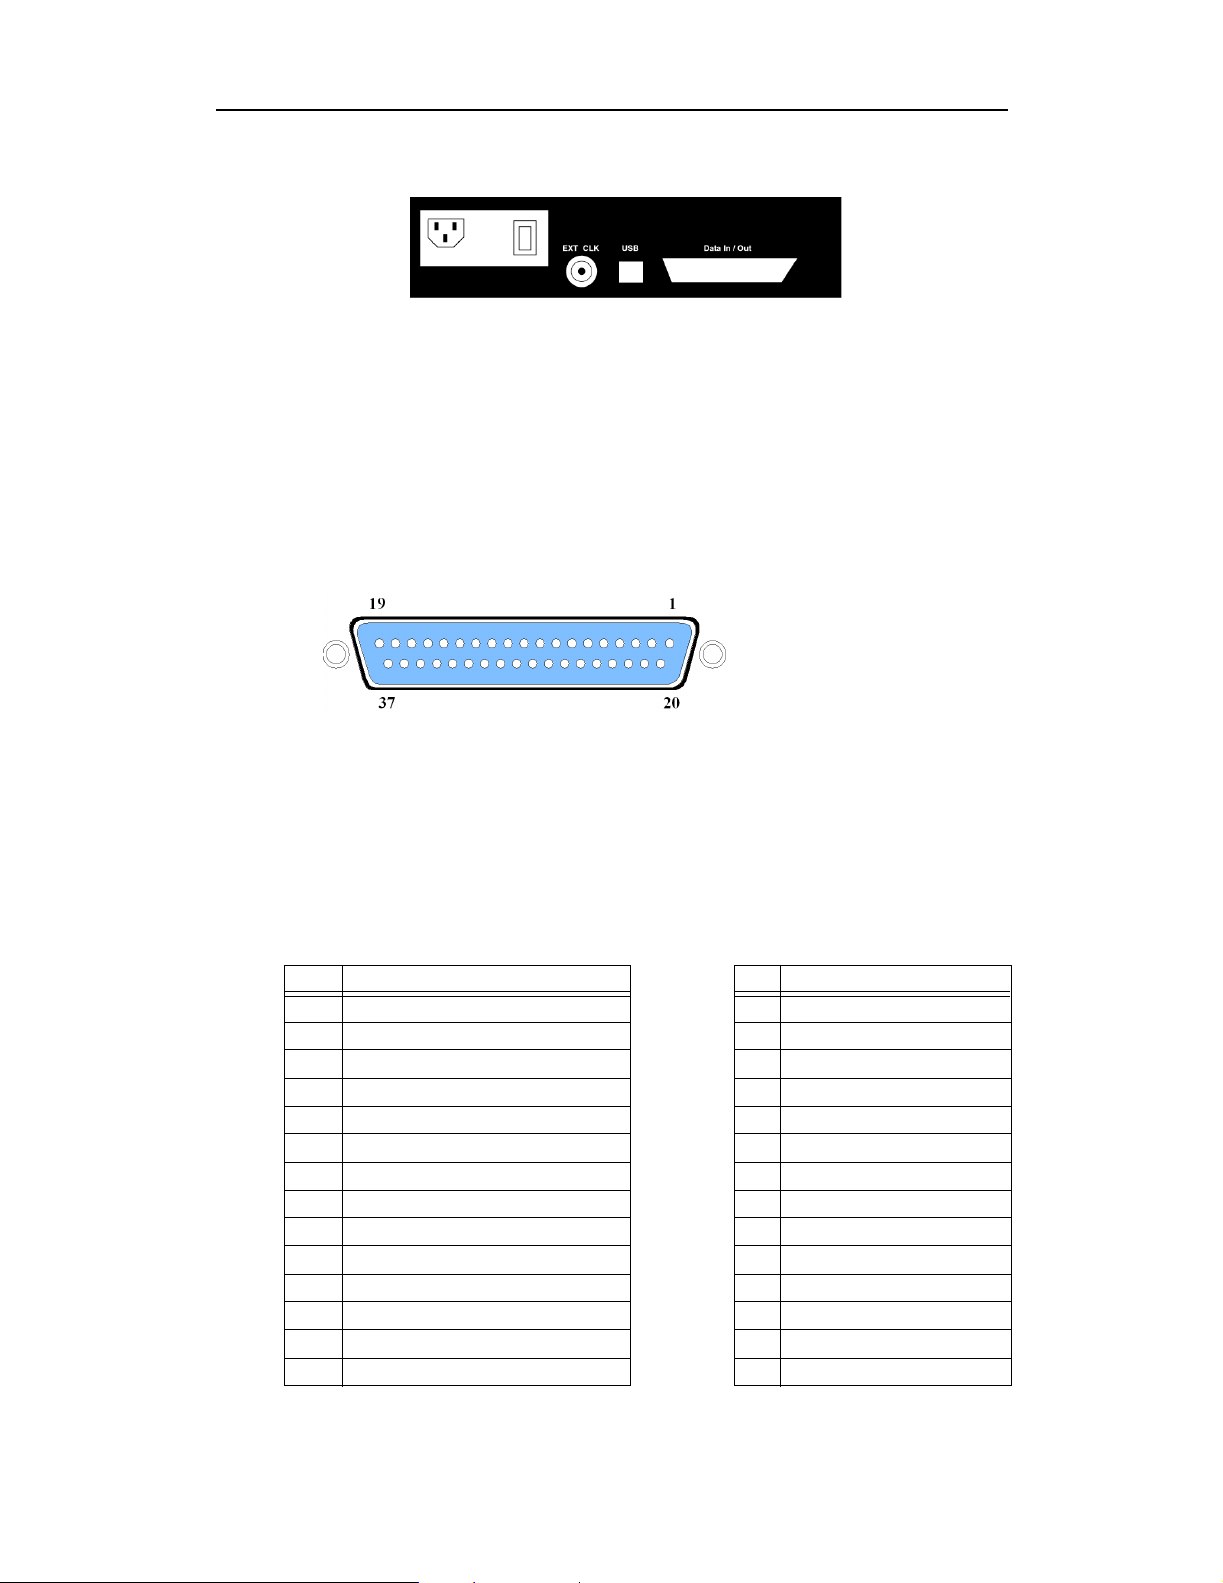
Figure 2: Rear Panel
• Wide range AC connector module
— Power socket
— Enclosed fuse
— Power on/off switch
• External Clock (EXT CLK) input for future enhancement
• USB type “B” host computer connector
• Data In/Out DB-37 (37-pin) external interface connector
Figure 3: Data In/Out Connector
Chief User’s ManualCATC Version 1.7
Use the 37-pin Data In/Out connector located on the rear of the USB Chief
Analyzer box to connect the External Interface Breakout Board.
Table 1 lists the pin-out and signal descriptions for the Data In/Out connector.
Signal inputs (IN x) function under the control of the USB Chief program and may
be set as active-low or active-high in Recording Options. Signal inputs 0 through
3 can be recorded optionally along with USB traffic and displayed in a CATC
Trace. Signal outputs (OUT x) function under the control of the USB Chief
program and are used to link any events to an external signal.
Table 1: Data In/Out Connector – Pin-Out
Pin Signal Description Pin Signal Description
1 5V, 500mA DC source 20 Ground
2 TRIGGER OUT (active low) 21 Ground
3 Not connected 22 Ground
4 IN 0 – Signal input 23 Ground
5 IN 1 – Signal input 24 Ground
6 IN 2 – Signal input 25 Ground
7 IN 3 – Signal input 26 Ground
8 IN 4 – Signal input 27 Ground
9 TRIGGER IN 28 Ground
10 CURRENT MEASURE + 29 Ground
11 CURRENT MEASURE - 30 Ground
12 OUT 0 – Signal output 31 Ground
13 OUT 1 – Signal output 32 Ground
14 OUT 2 – Signal output 33 Ground
15
Page 24

Chief User’s ManualCATC Version 1.7
Pin Signal Description Pin Signal Description
15 OUT 3 – Signal output 34 Ground
16 OUT 4 – Signal output 35 Ground
17 OUT 5 – Signal output 36 Ground
18 GATED VP 37 Ground
19 GATED VM
USB Chief System Setup
The USB Chief Analyzer functions with any personal computer using the
Windows 95 (OSR 2.1), Windows 98, Windows 98SE, or Windows 2000
operating systems and equipped with a functional USB interface. The Analyzer is
a stand-alone unit configured and controlled through a personal computer USB
port. It can be used with portable computers for field service and maintenance as
well as with desktop units in a development environment. It is easily installed by
connecting a cable between the computer’s USB port and the Analyzer’s USB
port.
16
Page 25
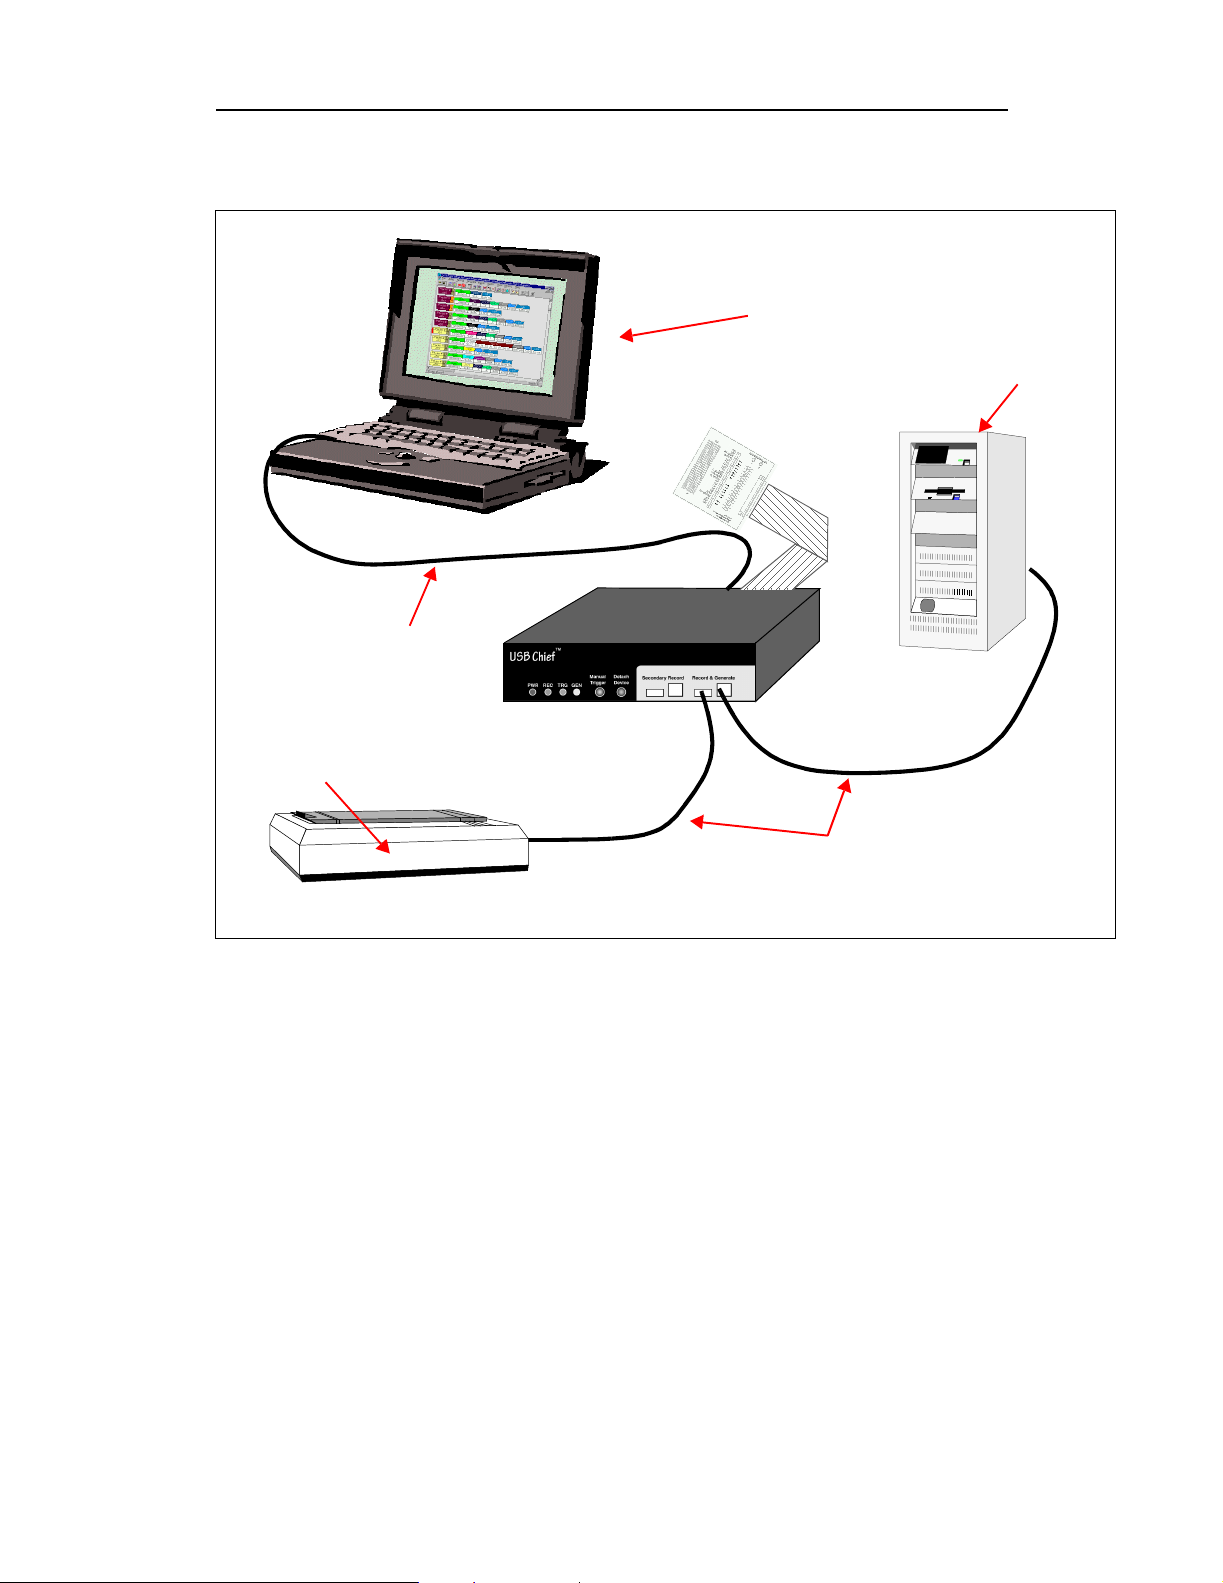
USB Chief
PC Connection
Chief User’s ManualCATC Version 1.7
USB Chief
PC for Analysis
USB Host
External Events
USB Device
USB
Under Analysis
The USB Chief Analyzer provides on-the-fly detection of and triggering on such
events as specific user-defined bus conditions, packets matching any Packet
Identifier (PID), packets matching a Token or Setup transaction, data patterns, and
many abnormal (error) bus conditions. Whether recording manually or with a
specified trigger condition, the USB Chief Analyzer continuously records the bus
data in a wrap-around fashion until manually stopped or until the Trigger Event is
detected and a specified post-Trigger amount of bus data is recorded.
Upon detection of a triggering event, the Analyzer continues to record data up to
a point specified by the user. Real-time detection of events can be individually
enabled or disabled to allow triggering on events as they happen. This includes
predefined exception or error conditions and a user-defined set of trigger events.
The unit can also be triggered by an externally supplied signal. An external DB-37
connector provides a path for externally supplied data or timing information to be
recorded along with bus traffic.
17
Page 26

Chief User’s ManualCATC Version 1.7
Real-time event detection information is available via an external DB-37
connector and makes many control, timing, and recovered signals available
externally. These signals can be probed and used by other circuitry.
The USB Chief software provides powerful search functions that enable
investigation of particular bus events and allow the software to identify and
highlight specific events. In addition to immediate analysis, you can print any part
of the data. Use the Save As feature to save the data on disk for later viewing. The
program also provides a variety of timing information and data analysis reports.
The USB Chief Analyzer is designed to work with either desktop or laptop
computers equipped with a functional USB interface. To set up the system
hardware,
• Connect the Analyzer to an AC power source.
• Connect the External Interface Breakout Board to the Data In/Out connector
(optional).
• Connect to the personal computer via USB.
• Connect the USB host and the device being analyzed to the Record &
Generate USB port.
AC Power Source
Step 1 Connect the Analyzer box to a 120-volt or 240-volt supply using the
provided power cord.
Note The Analyzer is capable of supporting supply voltages between 100-volt and
240-volt, thus supporting all known supply voltages around the world.
Step 2 Use the power switch located on the rear panel to turn the Analyzer unit
on and off.
Note At power-on, the Analyzer initializes itself in approximately ten seconds and
performs an exhaustive self-diagnostic that lasts about five seconds. The Trigger
LED illuminates during the power-on testing and turns off when testing is
finished. If the diagnostics fail, the trigger LED blinks continuously, indicating a
hardware failure. If this occurs, call CATC Customer Support for assistance.
18
Page 27

Chief User’s ManualCATC Version 1.7
External Interface Breakout Board
The External Interface Breakout Board is an accessory that allows convenient
access to several potentially useful TTL output and input signals. It also offers a
simple way to connect logic analyzers or other tools to the Analyzer unit. Four
ground pins and one 5-volt pin are provided.
The Breakout Board connects via a ribbon cable to the Data In/Out connector
located on the rear of the Analyzer box. Each pin is isolated by a 100Ωseries
resistor and a buffer inside the Analyzer box.
For more detailed information on the Breakout Board installation and setup,
please refer to External Interface Breakout Board in the Appendix.
PC Connection
Use the LONGEST (6-foot/2-meter) of the three USB cables provided to connect
the host computer to the USB Chief Analyzer box.
19
Page 28
Chief User’s ManualCATC Version 1.7
Record & Generate USB Port
The USB Bus uses keyed connectors so that the type ‘A’ connector joins a cable
directed to downstream devices or to a hub and the type ‘B’ connector joins a cable
directed to an upstream host controller or to a hub. A USB hub is used to join
multiple devices to an upstream host controller and therefore has both type ‘A’
and type ‘B’ connectors.
USB Host
USB Device
The Record & Generate port has both type ‘A’ and type ‘B’ connectors so the
Analyzer can conveniently tap a USB branch. To connect your USB branch for
analysis, use the two SHORT (3-foot/1-meter) USB cables to insert the Analyzer
in place of the existing cable. Connect one cable to the type ‘A’ connector and join
it downstream to your device or hub. Connect the other cable to the type ‘B’
connector and join it upstream to your host or hub.
Note The USB Chief Bus & Protocol Analyzer is not a hub device; it connects to a USB
branch by inserting a non-intrusive, high impedance tap. Because of the poor
signal quality in the middle of a USB cable, CATC recommends using the shortest
possible cables so that the total length of both cables together is less than 6 feet.
The USB cables provided with your Analyzer meet this requirement. When longer
cables are used, the Analyzer may record incorrect data.
Secondary Record USB Port
When connected, the Secondary Record port taps another USB branch and records
bus traffic in the same fashion as the primary port. This port allows the
simultaneous recording of traffic on two USB branches. The USB Chief analyzes
the traffic from both ports and presents the analysis in a unified view.
Note When recording on both the Primary and the Secondary Channels, Generate is
disabled.
PC-for-Analysis Requirements
• x86-based personal computer (386 minimum, Pentium MMX, or Pentium II
recommended)
• USB connection to the computer (unless using the PC only as a viewer)
• Microsoft Windows 95(OSR 2.1), Windows 98, Windows 98SE, or Windows
2000 for recording and viewing traffic
20
Page 29

Chief User’s ManualCATC Version 1.7
• Microsoft Windows 95 or any later Windows system, including NT4.0, for
viewing traffic only
• Minimum of 16MB physical RAM; 32 MB recommended for viewing
transactions
• At least 10 MB hard disk space, plus additional memory for recordings (as
much as 200MB when recording a full buffer size)
• Monitor resolution at least 800x600 with thousands of colors
USB Chief Program Installation
The CATC USB Chief software is provided on two 3½ inch diskettes and requires
a Windows 95 (OSR 2.1), Windows 98, Windows 98SE, or Windows 2000
operating system.
Note The USB Chief program also operates on earlier versions of Windows 95 or
Windows NT (4.0) systems in a Trace View mode. That is, it may be used to view,
analyze, and print data that was collected and saved on another system.
There are different installations for Windows 95 and Windows 98/2000 because
of the difference in the Plug-and-Play drivers that automatically load when an
active USB device is detected. Use the diskette(s) appropriate for the operating
system on your computer.
Loading the USB Chief Drivers
Step 1 Insert the USB Chief program floppy for your operating system labeled
Disk 1 of 2 into the a: drive.
Step 2 Power-on the USB Chief Analyzer.
Step 3 Connect the USB cable to the rear of the Analyzer and to the personal
computer.
The host operating system detects the Analyzer and begins to install the
driver.
Step 4 Follow the installation instructions provided on your screen and insert
the USB Chief program floppy labeled Disk 2 of 2 into the a: drive when
prompted.
Note When Windows prompts you for a file, browse to the CATC floppy in the a: drive.
Installing the USB Chief Program
Step 1 Insert the USB Chief program floppy into the a: drive on your computer.
Step 2 Click Start.
Step 3 Click Run.
21
Page 30

Chief User’s ManualCATC Version 1.7
Yo u s ee t he Run screen.
Step 4 Click Browse.
Yo u s ee t he Browse screen.
Step 5 Select the a: drive.
Step 6 Click Setup.exe
Step 7 Click Open.
YoureturntotheRun screen.
Step 8 Click OK.
The CATC USB Chief Install Wizard automatically installs the necessary files to
the computer’s hard drive. USB Chief software is installed in the c:\Program
Files\CATC\USB Chief directory unless you specify otherwise. Follow the
installation instructions on your screen.
Making a USB Recording
After installation, the software is configured to make a one-Mbyte snapshot
recording of your USB traffic.
To make this recording,
Step 1 Click on the Tool Bar.
After 1 Mbyte of traffic is recorded, the Analyzer uploads the data and
displays the packets.
To upload and display less than one Mbyte of traffic,
Step 2 Click on the Tool Bar at any time before recording automatically
terminates.
When the recording session is finished, the bus traffic is saved to the hard
drive as a file named data.usb or whatever name you assign as the
default filename.
To save a current recording for future reference,
Step 3 Select Save As under File on the Menu Bar.
OR
Click on the Tool Bar.
You see the standard Save As screen.
Step 4 Give the recording a unique name and save it to the appropriate directory.
22
Page 31

Chief User’s ManualCATC Version 1.7
USB Chief Program Startup
You can start the USB Chief program from the Desktop or from the installed
directory. The program always begins with its main screen active:
The software may be used with or without the Analyzer box. When used without
an Analyzer box attached to the computer, the program functions in a Trace
Viewer mode to view, analyze, and print captured protocol traffic.
Files created with the CATC Detective and CATC Inspector can also be viewed
with the Trace Viewer. Opening a file created with either of these Analyzers
displays a screen asking if you want to convert the old file to the new format under
the name convert.usb.
When the program is used with the USB Chief Bus & Protocol Analyzer attached
to the computer, you can monitor and analyze the activity of your USB branch
from the primary or secondary USB ports on the front of the Analyzer.
Starting the USB Chief Program from the Desktop
Step 1 Click Start.
Step 2 Select Programs.
Step 3 Select CATC.
Step 4 Click CATC USB Chief.
Starting the USB Chief Program from its Directory
Step 1 Go to the \CATC\USB Chief subdirectory.
Step 2 Double-click
23
Page 32

Chief User’s ManualCATC Version 1.7
Software, Firmware, and BusEngine Revisions
The Readme.txt file on the first installation disk and in the installed directory
gives last-minute updates about the current release. Included with each release are
the most recent downloadable images of the Firmware and the BusEngine. The
Readme.txt file lists the latest versions and informs you if new Firmware or a new
BusEngine needs to be updated in your hardware.
Once the Analyzer has completed the self diagnostics and is connected to the PC,
you can check the latest revision of the software and BusEngine:
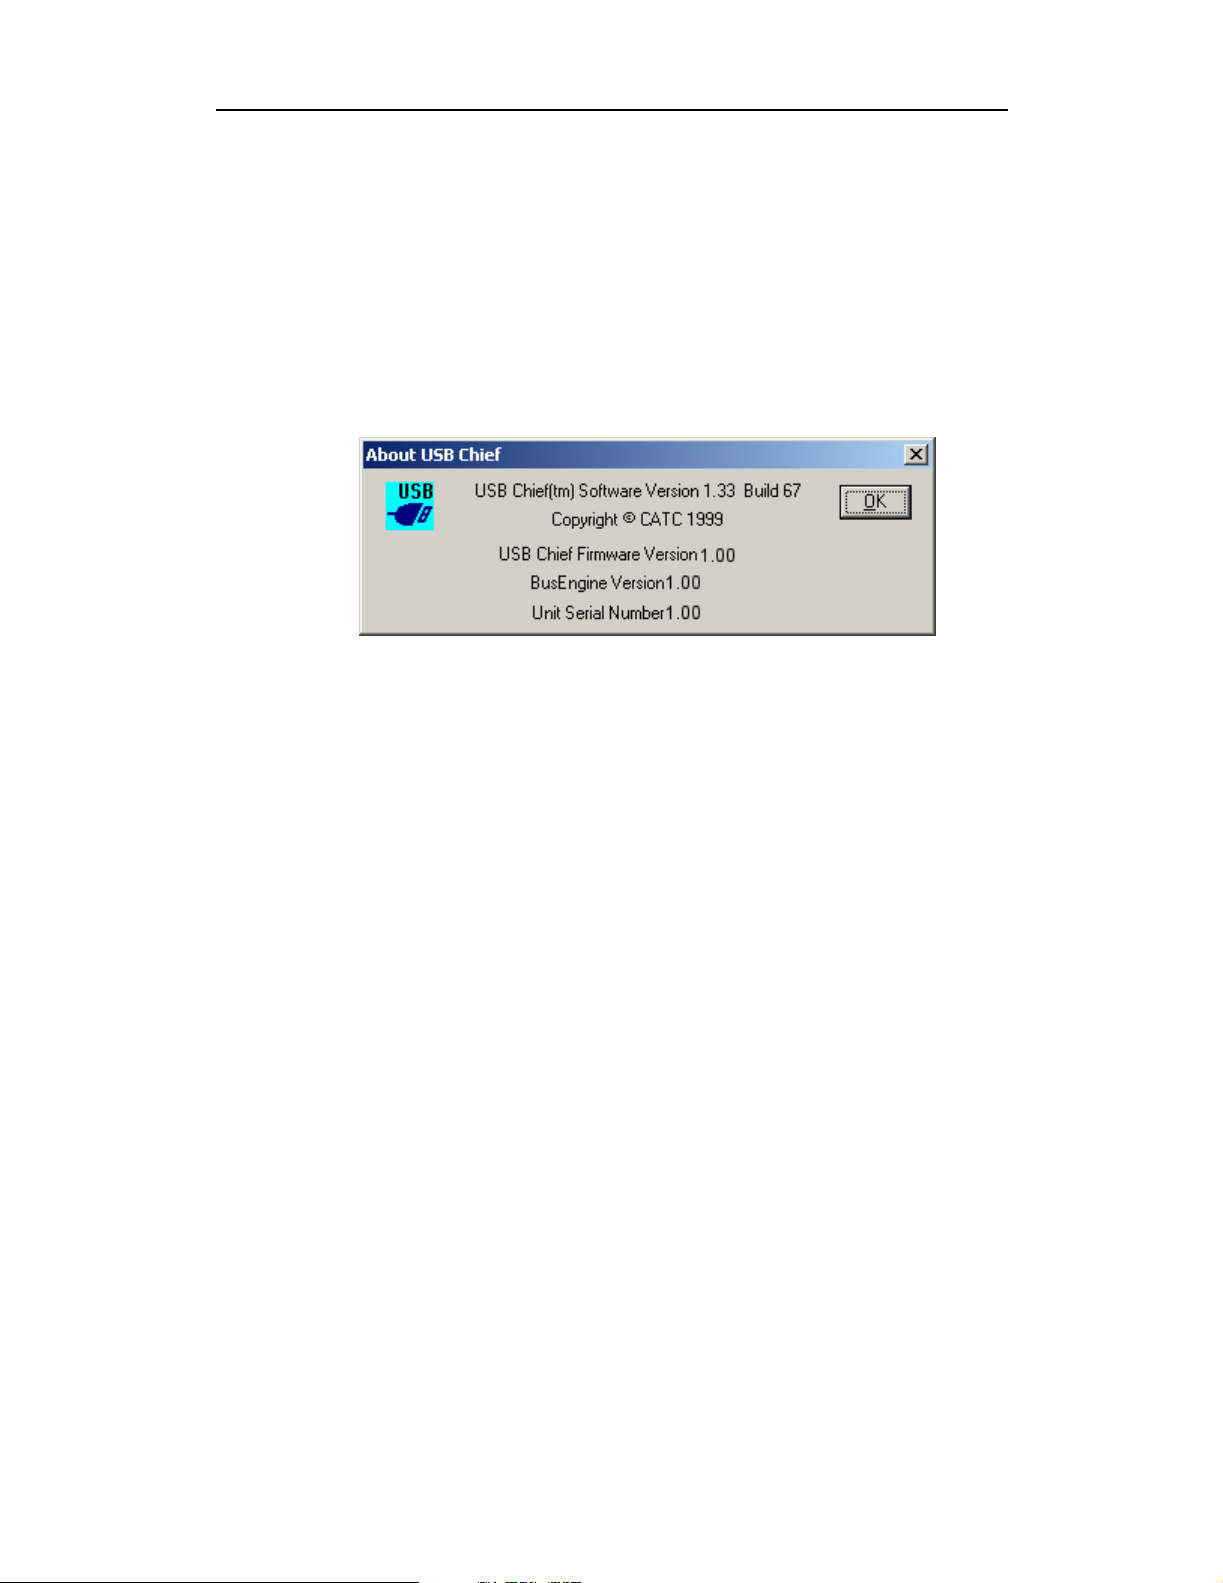
• Selecting About USB Chief… in the Help Menu.
The About USB Chief screen details revisions of the following software and
hardware:
• USB Chief Software Version
(Shown here is USB Chief.exe application run under Windows.)
• USB Chief Firmware Version
(Shown here is the Boot ROM Version.)
• BusEngine Version
(Shown here is Version 1.30.)
• Unit Serial Number
(Indicates that traffic generation is enabled.)
Note When contacting CATC for technical support, please have available all the
revisions reported in the About USB Chief window.
Tool Tips and Context-Sensitive Help
Throughout the application, tool tips and context-sensitive help provide useful
information.
To display a tool tip,
Step 1 Position the mouse pointer over an item.
The tool tip displays in a short moment if present.
Step 2 Right-click over the item of interest.
24
Page 33

Chief User’s ManualCATC Version 1.7
The following prompt appears:
Step 3 Left-click What’s This?
If context-sensitive help is available, you see information about the item
in question. If it is not available, you see a message that no help is
available for this topic.
Tool tips can also be found over the Tool Bar and in areas of the packet view
screen. In the absence of a tool tip, context-sensitive help is available in most
dialog windows.
25
Page 34

Chief User’s ManualCATC Version 1.7
26
Page 35

Chief User’s ManualCATC Version 1.7
Chapter 5: Recording Options
Use RecordingOptions to create and change various features that control the way
information is recorded by the USB Chief Analyzer.
From the Setup menu, select Recording Options.
OR
Click on the Tool Bar.
General Recording Options
The General Recording Options allow you to select or adjust the following
features:
Recording type
• Snapshot: Recording continues until the selected buffer size is filled.
Recording begins manually when you click on the Tool Bar.
Recording ends when the selected buffer size is filled.
• Manual Trigger: Recording continues in a circular manner within the limits
set by the buffer size.
Recording begins manually when you click on the Tool Bar.
Recording ends when you click on the Tool Bar or press the Manual
Trigg er on the front of the Analyzer after a defined amount of data has been
recorded following the manual Trigger Event.
27
Page 36

Chief User’s ManualCATC Version 1.7
• Event Trigger: Recording continues in a circular manner within the limits set
by the buffer size until an event is detected on the USB bus that meets the
Trigger conditions specified in the Triggering Options and a defined amount
of data has been recorded after the Trigger Event.
Recording begins when you click on the Tool Bar.
Options
• Truncate Data Fields to 8 bytes: All data fields are truncated after the first
eight bytes.
Use this feature if you’re more concerned with recording many packets than
with collecting more data. This operation is performed by hardware to avoid
using up the Analyzer’s physical memory with non-essential data.
• Beep When Trigger Occurs: The computer connected to the USB Chief
beeps when a Trigger condition is first detected.
• Save External Interface Signals: You can save signals captured from an
external device connected to the External Interface Breakout Board.
• Reserve Memory for Traffic Generation: Half the recording memory must
be set aside for traffic generation patterns.
• Don’t automatically display recorded file: Prevents USB Chief from
automatically displaying a recorded file.
Buffer Size
You can adjust the size of the recording buffer from 0.1 megabytes to 128
megabytes.
The Recording type option determines how this buffer is used. Although thereare
128 megabytes of physical memory in the Analyzer, the efficiency of the
recording ranges from 2:1 to 4:1 ratios of physical memory to actual USB traffic.
Shorter USB packets yield a less efficient recording. The non-traffic portion of
physical memory is utilized for control and timing information.
Note The scale is not linear and affords more granularity in the smaller buffer sizes.
Trigger Position
You can adjust the amount of recording to be done post-Trigger or select where
you want the Trigger located within the defined buffer. You can adjust the
Triggering Position between 1and 99% post-Trigger. Trigger Position is
available only when Manual Trigger or Event Trigger is selected as Recording
type.
As an example, if the buffer size is set to 16MB, then for the following Trigger
Position settings, the amount of pre- and post-Trigger data is
• 95% post-triggering: 0.8MB pre-trigger, 15.2MB post-trigger
28
Page 37

Chief User’s ManualCATC Version 1.7
• 75% post-triggering: 4MB pre-trigger, 12MB post-trigger
• 50% post-triggering: 8MB pre-trigger, 8MB post-trigger
• 25% post-triggering: 12MB pre-trigger, 4MB post-trigger
• 5% post-triggering: 15.2MB pre-trigger, 0.8MB post-trigger
Note When a Trigger occurs, recording continues until the post-Trigger amount of the
buffer is filled.
Options name
This field displays a comment associated with the *.rec file containing the current
Recording Options values. You can also create and store your unique Recording
Options for future use.
To create a new Recording Options file, follow these steps:
Step 1 Enter a comment for the new file in the Options name field.
Step 2 Click Save...
Yo u s ee t he Save As window.
Step 3 Specify a filename (*.rec)
Step 4 Click Save.
Trace File Name & Path
Step 1 Click Trace File Name & Path.
Step 2 In the Save As… window, enter the recording file name *.usb for all
subsequent recordings. The default recording file name is data.usb.
29
Page 38

Chief User’s ManualCATC Version 1.7
Events Recording Options
The Event triggering and filtering options allow you to set specific parameters for
each Event Group. When an Event Group is selected, a field appears that allows
you to select specific conditions within the corresponding Event Group. As details
are selected, other Event Group details may fade since there are limited hardware
resources in the Analyzer. Information about the resources available is displayed
below the Event Group details. When a detail is faded, it is inactive and cannot be
selected. If an Event Group remains inactive, the current version of the application
or BusEngine does not support it.
Click the Events tabontheRecording Options window.
Packet Identifiers
Step 1 Select Packet Identifiers under Event Groups.
Step 2 In the Packet Identifier (PID) field, select up to two packet types to use
as a Recording Trigger.
30
Page 39

Chief User’s ManualCATC Version 1.7
Token Pat terns
Step 1 Select Token Patterns under Event Groups.
Step 2 In the Token Patterns fields, specify up to three combinations of
Address/Endpoint with any of the token PIDs. They can be triggered on
or filtered in/out. The first two can be sequenced to enable one another.
Frame Patterns
Step 1 Select Frame Patterns under Event Groups.
Step 2 Identify frame patterns you want either to filter out of a Trace View or to
use as a Trigger.
Step 3 Select either All Start of Frame packets (SOF) to be filtered out or
specify the Frame Number of a frame to trigger on.
31
Page 40

Chief User’s ManualCATC Version 1.7
Device Requests
Step 1 Select Device Request under Event Groups.
Step 2 To define a pattern for the USB setup transaction data phase, click Edit.
The Specify pattern for USB Device window appears.
Step 3 Alter the pattern either Bit-by-bit or through the use of hexadecimal
Mask and Match values.
32
Page 41

Chief User’s ManualCATC Version 1.7
Data Pattern
Step 1 Select Data Pattern under Event Groups.
Step 2 Define a Data Pattern with a length of up to 8 bytes to be used to trigger
on.
Bus Conditions
Step 1 Select Bus Conditions under Event Groups.
Step 2 Select any or all of the available special bus signals to use as a Trigger.
33
Page 42

Chief User’s ManualCATC Version 1.7
Errors
Step 1 Select Errors under Event Groups.
Step 2 Use any combination of the listed packet/signaling/protocol errors as a
Trigger.
External Signals
Step 1 Select External Signals under Event Groups.
Step 2 If desired, use pins 10-14 on the USB Chief Breakout Board as Trigger
Inputs for the Analyzer from your hardware. If you hook up any of these
pins, you must check the corresponding Trigger Input number in this
Event Group to enable it as a Trigger.
Step 3 If desired, enable or disable Trigger Inputs 0 through 4 from the External
Interface Breakout Board. These inputs may also be set as Active-Low
or Active-High signals.
34
Page 43

Chief User’s ManualCATC Version 1.7
Note Using the Active-High setting requires care because the Trigger Input signals on
external interface board are pulled up internally in the Analyzer. Your External
Trigger source should drive the input signal low before starting recording or the
Analyzer will immediately detect a Trigger Event due to the signal pull-ups.
Actions Recording Options
Use the Actions screen to set the Trigger, Filter Out/In, Restart,andCount
options that define the rules for data recording sessions.
The Restart and Count options allow you to configure and control the order in
which selected events trigger the Analyzer or filter the recording and to begin the
sequencing again.
Click the Actions tabontheRecording Options screen.
The Actions screen provides a graphic representation of the ways in which events
selected on the Event Groups screen are used during recording. The screen is
roughly divided into three fields:
• The field on the right displays the Trigger, Filter Out/In, and Restart Action
buttons, which are always present.
• The field in the center displays two Count Action buttons, which are always
present.
• The field on the left displays Event buttons representing any Events (Packet
Identifier, Token Patterns, and so on) you selected from the Event Groups list
on the Events Recording Options screen. Their presence is tied directly to
your selections.
35
Page 44

Chief User’s ManualCATC Version 1.7
Using the Blue Dot Menus
Within the Actions screen, you can configure the external signals and Counters by
clicking the blue dot in the upper left corner of each button. Once you have made
your settings, you can save them for later use or you can set them as your default
settings.
Setting External Triggers
Use the blue dot found on all Event buttons (except Frame Patterns and External
Signals) to set the parameters for External Triggers.
Click the blue dot in the upper left corner of an Event button.
— Enable/Disable External Trigger Output: Allows the event to be used
for other actions such as Triggering, Filtering, or Restarting (toggles
between Enable and Disable).
— Enable External Trigger Output Only: Makesthe event an output signal
only which cannot be used for other actions. To clear External Trigger
Output Only, you must drag the elastic arrow to an Action button. (See
the section on Elastic Arrow.)
— External Trigger Form: Allows you to select low pulse, high pulse, or
toggle as the form for your External Trigger.
Output Signaling Pin Assignments
Clicking the blue dot in the upper left corner of each Events button enables one of
each of the following events to appear as an output signal on its corresponding
output pin on the External Interface Breakout Board.
Table 2: Output Signaling—Pin Assignments
Pin Signal Description
14 OUT 0 Errors
15 OUT 1 Bus Conditions
16 OUT 2 First Token Pattern
17 OUT 3 First Packet Identifier
18 OUT 4 Device Requests
19 OUT 5 Data Pattern
36
Page 45

Chief User’s ManualCATC Version 1.7
Token Event Sequencing
You can set the Analyzer to trigger only after it detects a specific sequence of
events. The Analyzer looks for the occurrence of the first token event and, once
that has taken place, begins looking for the second event. The Trigger occurs after
the second event takes place.
You can also set an event to trigger a Restart. If the Restart event occurs after the
first Token event in a sequence but before the second, the Analyzer restarts its
search for the first event.
This feature enables designers to designate a specific sequence of events that must
occur before the Analyzer begins capturing data (triggers), thus pinpointing
certain types of events for recording.
Filter Out/In
To set up events from the Token and Frame Event Groups to be used to filter a
recording,
Step 1 Click the blue dot on Filter Out.
Step 2 Use this menu to toggle the selection between Filter Out and Filter In.
• Filter In records ONLY those packets related to the specified event.
• Filter Out records all packets EXCEPT those related to the specified event.
Note Only events from the Token and Frame Event Groups can be used to filter a
recording.
Setting Counters
Use the Count Blue Dot menu to define how many times an event must occur
before it triggers a recording. For greater flexibility of triggering, you can use two
Counters to count up to fifteen occurrences of an event.
To s et a Co unter,
Step 1 Click on the blue dot in the upper left corner of the Count button.
37
Page 46

Chief User’s ManualCATC Version 1.7
Step 2 Click Change Counter Value
Step 3 Enter an input value to tell the Analyzer how many times this event must
occur before it triggers a recording.
Step 4 Click OK.
You may connect as many Event buttons to a Counter as you like. However, the
Counter does not treat each event as a discrete specification but treats them all as
one event.
As an example, look at the specifications set in the following screen:
Counter 1 has been set to trigger four events after 15 occurrences. But the Counter
does not count 15 occurrences for EACH event. It counts ALL events as they
happen to occur until it reaches a total of 15 and then triggers.
Elastic Arrow
The Actions screen has a unique property, an elastic arrow that allows you to
maneuver easily between the Event buttons and the Actions buttons to set the
options that define the rules for data recording sessions. The arrow is anchored to
an Event button and attached to the mouse pointer on your screen; as you move
the mouse pointer, the arrow stretches to follow your movement
To use the arrow to connect an Event Group to an Action:
Step 1 Left-click on the Event button.
38
Page 47

Chief User’s ManualCATC Version 1.7
The elastic arrow appears.
Step 2 Drag the arrow to the desired Action button.
Step 3 Left-click again.
The arrow is replaced with a black line connecting the Event button to
the Action button.
Saving Recording Options
To complete your Recording Options settings, use the features at the bottom of the
Recording Options screen. These features remain the same no matter which of
the three Recording Options screens you are working in.
• Click Save to save the currently specified Recording Options for use in future
recording sessions. Any file name can be specified, though use of the .rec is
recommended; if no extension is specified, .rec is added by default.
• Click Load to load a previously saved *.rec file, thus restoring a previous set
of Recording Options.
• The Save as Default function is equivalent to the Save function, specifying the
file name default.rec. Whenever you start up the Analyzer, it automatically
loads the default.rec file if one exists.
• Click OK to apply any changes and close this dialog box.
• Click Cancel to cancel any immediate changes you have made and exit the
Recording Options menu.
Recording Bus Data
To start recording USB traffic once the appropriate Recording Options have been
set,
Step 1 Select Start under Record on the Menu Bar
39
Page 48

Chief User’s ManualCATC Version 1.7
OR
Click on the Tool Bar.
Your recording session can continue until it has finished naturally or you may
need to stop manually by clicking on the Tool Bar, depending on how you
set the Recording Options.
To manually stop recording,
Step 2 Select Stop under Record on the Menu Bar
OR
Click on the Tool Bar.
Note The manual Stop Recording feature is primarily of use when recording low-speed
traffic, which can take a long time to fill the recording buffer.
When the recording session is finished, the bus traffic is saved to the hard drive as
a file named data.usb or whatever name you assign as the default filename.
To save a current recording for future reference,
Step 3 Select Save As under File on the Menu Bar.
OR
Click on the Tool Bar.
You see the standard Save As screen.
Step 4 Give the recording a unique name and save it to the appropriate directory.
40
Page 49

Chief User’s ManualCATC Version 1.7
Chapter 6: Display Options
Use the Display Options menu to specify the way CATC Trace information is
displayed.
To open the Display Options menu, do one of the following”
Select Display Options under Setup on the Menu Bar
OR
Click on the Tool Bar
OR
Right-click anywhere on a Trace view screen and select Display Options from the
drop-down menu.
The Display Options window appears.
41
Page 50

Chief User’s ManualCATC Version 1.7
General Display Options
Use the General Display Options to specify the basic appearance of a Trace View.
• Zoom Level: Adjustable in discrete increments from 10% to 200% percent.
• Enable Tool Tips: Select to enable tool tips with explanation text to pop up
when you position your cursor over various fields in the Trace View.
• No Wrap: Inhibits carriage returns in packets when they exceed the width of
the window.
• Show Transactions: Combines packets into individual transactions.
• Show Transfers: Combines transactions into individual transfers.
• Hide Primary: Shows only those Traces from Secondary Channel Recording.
• Hide Secondary: Shows only those Traces from Primary Channel Recording.
• Time Presentation: Select Show Time-Stamp, Idle Time, or Idle in Bit Time.
• End-Of-Packet Time: Select Show Time or Show in Bit Time.
• Error Scan upon Open: Controls the scan for Babble Errors, Frame Errors,
and Data Toggle Errors.
• Display Configuration Name:ACommentfieldassociatedwiththe*.opt file
containing the current Display Options values. You can also create and store
your unique Display Options for future use.
To create a new Display Options file, follow these steps:
Step 1 Enter a comment for the new file in the Display Configuration Name
field.
Step 2 Click Save...
Yo u s ee t he Save As window.
Step 3 Specify a filename (*.opt).
Step 4 Click Save.
42
Page 51

Chief User’s ManualCATC Version 1.7
Color Display Options
Step 1 Click the Colors tab on the Display Options window.
Step 2 Use this menu to customize the colors associated with each field in the
Trace View. You can experiment with this option to achieve the color
combination best suited to a particular graphic system. A brighter color
might be appropriate for a specific field that should stand out in the
display (e.g. the PID Types).
Note The color of an Invalid Data (packet error) field cannot be changed; it is
permanently set to red.
Two color fields are provided for packet number displays to differentiate between
pre-Trigger traffic and post-Trigger traffic.
• The packet that causes the Trigger and all the packets before it are colored with
the - color.
• The packet that follows a Trigger is colored with the + color.
• All packets are colored with a + color when there is no Trigger.
Use the color buttons labeled + and - under the Packet # section of the Colors
screen to select a Trigger color.
To select or change a color, follow these steps:
Step 1 Click the appropriate color button.
43
Page 52

Chief User’s ManualCATC Version 1.7
The color palette appears.
Step 2 Use this palette to choose the desired color for the PID Types, CRCs,
Addressing, Framing, Data, Speed, Packet #, Bus Conditions, and Idle.
Formats Display Options
Step 1 Click the Formats tabontheDisplay Options window.
Step 2 Select a number format corresponding to the column labels along the top
of the screen for each number field that labels the rows along the left of
the screen. The number format changes in the respective location in the
packet view window. You can also select the bit ordering to be displayed.
Not every number format is available for every number field.
44
Page 53

Chief User’s ManualCATC Version 1.7
Filters Display Options
Step 1 Click the Filters tab on the Display Options window.
Step 2 Use the Filters window to filter (hide) various fields, packets, and
transactions from the Trace View screen. You can modify these settings
anyway you wish to display a specific area of a Trace.
Hide Fields
Choose this option to display or remove the listed fields from the Trace View.
Hide Packets
Choose this option to display or remove the listed packets from the Trace View.
Hide Transactions
Choose this option to display or hide NAK’ed transactions.
Advanced Hide
Use Advanced Hide to establish extremely narrow criteria for hiding Trace
elements.
Step 1 Select User Defined under Advanced Hide.
Step 2 Click Edit.
45
Page 54

Chief User’s ManualCATC Version 1.7
The User-Defined Hide window:
TheUser-DefinedHidewindowhastwotabs,onetospecifywhicheventstohide
and the other to set general criteria for how to hide them. The Events tab is always
displayed in front when this screen opens.
Step 1 Use the Event Groups option to specify which events and which error
types you want to hide.
Step 2 Click the General tab.
The General User-Defined Hide window appears.
Step 3 Use The General option to perform a combination of complex events.
You can hide selected packets using these criteria:
• Union: Hide all packets that match ANY of the specified events.
46
Page 55

Chief User’s ManualCATC Version 1.7
• Intersection: Hide all packets that match ALL of the specified
events.
• Exclusion: Hide all packets that DO NOT match (opposite to the
intersection or union).
Saving Display Options
To complete your Display Options settings, use the features at the bottom of the
Display Options screen. These features remain the same no matter which of the
four Display Options screens you are working in.
• Click Save to save the currently specified Display Options for use in future
sessions. Any file name can be specified, but you must use the .opt extension.
If no extension is specified, .opt is added by default.
• Click Load to load a previously saved *.opt file, thus restoring a previous set
of Display Options.
• The Save as Default function is equivalent to the Save function, specifying the
file name default.opt. Whenever you start up the Analyzer, it automatically
loads the default.opt file if one exists.
• Click OK to apply any changes you have made to Display Options and close
this dialog box.
• Click Cancel to cancel any immediate changes you have made and exit the
Display Options menu.
• Click Apply to apply yourchanges while keeping the Display Options window
open.
47
Page 56

Chief User’s ManualCATC Version 1.7
48
Page 57

Chief User’s ManualCATC Version 1.7
Chapter 7: Reading a CATC Trace
Trace View Features
• The USB Chief packet view extensively uses color and graphics to fully
document the captured traffic.
• Packets are shown on separate rows, with their individual fields both labeled
and color coded.
• Packets are numbered (sequentially, as recorded), time-stamped (with a
resolution of 83.3ns), and highlighted to show the transmitted speed
(low-speed or full-speed).
• Display formats can be named and saved for later use.
• Pop-up Tool Tips annotate packet fields with detailed information about their
contents.
• Data fields can be collapsed to occupy minimal space in the display (which can
in turn be zoomed in and out to optimize screen utilization).
• The display software can operate independent of the hardware and so can
function as a stand-alone Trace Viewer that may be freely distributed.
49
Page 58

Chief User’s ManualCATC Version 1.7
Set Marker
Note The Set Marker works in conjunction with the Go to Marker feature.
You can define a unique Marker for each packet.
To place a marker on a packet,
Step 1 Left-click on Packet # for the packet you wish to mark.
Yo u s ee t he Packet menu:
Step 2 Select Set Marker.
Step 3 In the Edit Marker Comment window, enter your comment.
Step 4 Click OK.
50
Page 59

Chief User’s ManualCATC Version 1.7
A marked packet is indicated by a vertical red bar along the left edge of the packet
#block:
Edit or Clear Marker
To clear or edit the comments associated with a packet marker,
Step 1 Left-click on Packet # for the chosen packet.
Step 2 To edit the Marker Comment, select Edit Marker Comment.
The Edit marker comment window appears.
Step 3 Edit the comment as desired.
Step 4 Click OK.
OR
Step 5 To clear a Marker, click Clear Marker.
The vertical red Marker bar disappears.
View Raw Bits
You can expand a specific packet to view the raw bits in detail.
To view the raw bits,
Step 1 Left-click on Packet # for the packet you wish to view.
Yo u s ee t he Packet menu:
Step 2 Select View Raw Bits.
51
Page 60

Chief User’s ManualCATC Version 1.7
The Raw Bits View for that packet appears.
Note You can also display the Raw Bits View by double-clicking on Packet #.
Along the top of the Raw Bits View is a linear strip of the logical bit values with
corresponding field demarcations. Bit stuffing is displayed in color. Below the
logical bit values is a representation of the D+/D- signaling complete with NRZ
encoding. A scroll bar assists in navigation of larger packets. Two buttons below
the scroll bar, Next Stuff Bit and Next Stuff Bit Error, are used to find bit
stuffing in larger packets.
Note Due to a limitation with Windows 98 and Windows 95, the Raw Bits View is
limited to roughly the first 100 bytes.
Measure Time from Trigger
You can make a quick measurement from a specific packet to the Trigger Position.
To measure from a packet,
Step 1 Left-click on Packet # for the packet you want to measure.
Step 2 Select Time from Trigger.
52
Page 61

Chief User’s ManualCATC Version 1.7
The Timing and Bus Calculations window appears.
Step 3 Enter the necessary data to select the values to be calculated.
Step 4 Click Calculate.
Measure Time from Marker
You can make a quick measurement from a specific packet to any previously
entered marker.
Step 1 Click on Time from Marker.
The All Markers window appears.
Step 2 Select the Marker you want to measure to.
Step 3 Click OK.
53
Page 62

Chief User’s ManualCATC Version 1.7
Search for the next…
Within a Trace View, you can search from one PID for the next occurrence of the
same PID. For example, if you search from an SOF packet, you are taken to the
next SOF packet. The PID field follows the Sync field in the Trace View.
To search for the next occurrence of the same PID, follow these steps:
Step 1 Left-click on the PID field immediately following Sync.
Step 2 Select Search for the next SOF Packet Identifier.
The Trace View is repositioned with the next occurrence of that PID at
the top of your screen.
Expanded and Collapsed Data Formats
You can expand a Data field to view it in greater detail or collapse it when you
want a more compact view. The Expand/Collapse Data feature operates as a
toggle. So when one format is active, the other appears as an option on the
Expand/Collapse drop-down menu.
To expand or collapse a specific Data field,
Step 1 Left-click on Data in the Data packet you want to expand or collapse.
If your Data Trace View is currently expanded, the Collapse Data menu
appears.
54
Page 63

Chief User’s ManualCATC Version 1.7
If your Data Trace View is currently collapsed, the Expand Data menu
appears.
Note that you can choose to expand or collapse
• Only the Data in the selected Data packet
OR
• All Data Fields in the Trace View.
Step 2 Select the desired Expand Data or Collapse Data menu item.
The Trace View is repositioned with the selected packet(s) adjusted in
the format you have specified.
It is not necessary to use the Expand/Collapse Data menu to shift
between expanded and collapsed views of a specific Data packet:
Step 3 Double-click DATA in the Data packet you want to view to toggle back
and forth between collapsed and expanded views.
View Data Block
The View Data Block feature displays a text window containing the data block
for a DATA packet. Use this feature to select and copy portions of the data for
pasting into other Windows programs.
To display a Data Block,
Step 1 Left-click DATA in the Data packet you want to view.
Step 2 Select View Data Block.
55
Page 64

Chief User’s ManualCATC Version 1.7
The Data Block for the selected packet appears.
Hide Packets and Fields
You can hide Start-of-Frame (SOF), NAKed transactions, and other packets that
may be uninteresting in a given context from a Trace View.
From the Tool Bar
You can hide Start-of-Frame (SOF) and NAKed transactions directly from the
Tool Bar:
• Click to hide all SOF packets.
• Click to hide all NAKed transactions.
From the User-Defined Hide Window
To hide all types of packets other than SOF and NAKed,
Step 1 Click in the Tool Bar.
Yo u s ee t he User-Defined Hide Error screen:
Step 2 Click OK.
56
Page 65

Chief User’s ManualCATC Version 1.7
Yo u s ee t he User-Defined Hide-Events window:
The window always displays with the User-Defined Hide-Events tab in
front.
Step 3 In the Events window, select the packets to be hidden.
Step 4 Click the General tab.
Yo u s ee t he User-Defined Hide-General menu:
Step 5 From the General menu, select any multiple events you want to hide.
Step 6 Click OK.
57
Page 66

Chief User’s ManualCATC Version 1.7
Yo u s ee t he Display Options Filter window:
Step 7 Set the desired Hide Fields and Hide Packets criteria.
Step 8 Click Apply to see and edit your changes in the Trace View before
exiting the Filters screen.
Whenyouaresatisfiedwithyourselections,
Step 9 Click OK.
For a more detailed explanation of how to use display filters, see Display
Options.
Switch to Transactions View
A Tra nsaction is defined in the USB specification as the delivery of service to an
endpoint. This consists of a token packet, an optional data packet, and an optional
handshake packet. The specific packets that make up the transaction vary based
upon the transaction type.
The program default display mode is Packet View. Before you can view decoded
transactions, you must switch from Packet View to Transactions View.
To select Transactions View,
Step 1 Right-click from anywhere on the Trace View screen.
You see this drop-down menu:
Step 2 Select Show USB transactions.
The Trace View screen is re-drawn to display Transactions.
58
Page 67

Chief User’s ManualCATC Version 1.7
Note This menu selection will display a checkmark next to Show USB transactions
when you have selected it. When you want to switch back to Packet View mode,
right-click anywhere in the trace window and then left-click on Show USB
transactions.
You can also switch to Transaction View from the Menu Bar:
Step 1 From the Setup menu, select Display Options.
The Display Options General window appears:
Step 2 Check Show Transactions.
Step 3 Click OK.
59
Page 68

Chief User’s ManualCATC Version 1.7
View Decoded Transactions
Once you set Display Options, the Trace View screen is re-drawn to display
decoded transactions in the colors and format you selected.
When you instruct the Analyzer to display USB transactions, the components of
each transaction are collected from the current recording and are grouped and
indented below each decoded transaction. Each row shows a transaction with a
unique numeration, a label, and color-coded decoding of important data.
Expanded and Collapsed Transactions
You can expand a specific transaction to view its parts, which are grouped and
indented below the transaction.
To expand a transaction, follow these steps:
Step 1 Left-click on the transaction number you wish to view.
Yo u s ee t he Expand Transaction menu:
Step 2 Select Expand This Transaction.
The screen displays the selected transaction in expanded format.
Note The Expand/Collapse transaction feature operates as a toggle: when one format is
active, the other appears as an option on the Expand/Collapse drop-down menu.
To collapse a transaction, perform the same operation and select Collapse This
Trans ac tion.
Note that you can choose to expand or collapse
60
Page 69

Chief User’s ManualCATC Version 1.7
• Only the selected Transaction
OR
• All Transactions.
It is not necessary to use the Expand/Collapse Transactions menu to shift
between expanded and collapsed views of a transaction:
• Double-click in the Transaction number field to toggle back and forth between
collapsed and expanded views.
Switch to Transfer View
A Trans fe r is defined in the USB specification as one or more transactions
between a software client and its function. USB transfers can be one of four kinds:
Control, Interrupt, Bulk, and Isochrononous. USB Chief is capable of displaying
all four types.
The default display mode is Packet View. Before you can view decoded transfers,
you must switch from Packet View (or Transaction View) to Transfer View.
To select Transfer View,
Step 1 Right-click from anywhere on the Trace View screen.
You see this drop-down menu:
Step 2 Select Show USB transfers.
The Trace View screen is re-drawn to display Transfers.
Note Selecting Show USB transfers adds a checkmark next to this menu item. If you
want to return to Packet View, open the menu and reselect Show USB transfers.
This action will remove the checkmark and return the display to Packet View.
You can also switch to Transfer View from the Menu Bar:
Step 1 From the Setup menu, select Display Options.
61
Page 70

Chief User’s ManualCATC Version 1.7
The Display Options window appears:
Step 2 Check Show Transfers.
Step 3 Click OK.
View Decoded Transfers
Once you set Display Options, the Trace View screen is re-drawn to display
decoded transfers in the colors and format you selected.
When you instruct the Analyzer to display USB transfers, the components of each
transfer are collected from the current recording and are grouped below each
decoded transfer. Each transfer row shows a transfer with a unique numeration, a
label, and color-coded decoding of important data.
62
Page 71

Chief User’s ManualCATC Version 1.7
Expanded and Collapsed Transfers
You can expand a specific transfer to view its parts, which are grouped and
indented below the transfer.
To expand a transfer,
Step 1 Left-click on the transfer number you wish to view.
Yo u s ee t he Expand Transfer menu:
Step 2 Select Expand This USB Transfer.
The screen displays the selected transfer in expanded format.
Note The Expand/Collapse transfer feature operates as a toggle: when one format is
active, the other appears as an option on the Expand/Collapse drop-down menu.
To collapse a transfer, perform the same operation and select Collapse This USB
Trans fe r.
Note that you can choose to expand or collapse
• Only the selected Transfer
OR
• All Transfers.
It is not necessary to use the Expand/Collapse Transfers menu to shift between
expanded and collapsed views of a transfers:
• Double-click in the Transfer number field to toggle back and forth between
collapsed and expanded views.
63
Page 72

Chief User’s ManualCATC Version 1.7
Decoding of Protocol-Specific Fields in Transactions/Transfers
When transfers or transactions are displayed, the fields in setup transactions or
control, interrupt, and Bulk transfers by default do not get decoded and are shown
in hexidecimal values. The exceptions are setup transactions and control transfers
for standard USB device requests which are always decoded.
In order to show specific decoding for class- and vendor-specific device requests
and endpoints, you have to use the decoding association mechanism that is
described in Chapter 9 on decoding. When you have performed the association,
you will see the protocol-specific fields of transfers and transactions decoded in
the trace view.
64
Page 73

Chief User’s ManualCATC Version 1.7
Chapter 8: Decode Requests
General Options
Commands are transferred on USB using special control transfers called USB
Device Requests. The Analyzer can decode Device Requests as they are defined
in the USB specifications and various Device Class and Vendor specifications.
USB Request
Each USB Device Request is sent using a Control Transfer. Each Control Transfer
starts with a SETUP transaction.
To decode a USB Device Request, follow these steps, left-click once in the
SETUP field of the packet that starts the Request.
The Standard Request window appears.
Shown here is a GET_DESCRIPTOR Standard Request.
65
Page 74

Chief User’s ManualCATC Version 1.7
Decoding Class Requests
When you select Decode Class Request, you Tthe Decode Class Request
drop-down menu appears:
The drop-down menu lists the Classes whose definitions are contained in the
Analyzer.
Step 1 Select the Class which agrees with the Setup Address selected.
The Decode Request window (similar to the one below) appears. This
window provides you with definitions for the individual fields of the
Request and the returned data.
ShownhereisasampleGET_STATUS Hub Class Request.
Decoding Vendor Requests
Decoding a Vendor Request is the same as decoding a Class Request except that
you use Vendor Request definitions rather than Class Request definitions.
66
Page 75

Chief User’s ManualCATC Version 1.7
Decoding USB Requests
When your Decoding request does not belong to any of the defined Decoding
groups (Standard, Class, or Vendor),
• Select Decode USB Request from the Request menu.
Yo u T he USB Decode Request window appears.
This window provides definitions for the individual fields of the Request and the
returned data.
Decoding Class- and Vendor-Specific Descriptors
The decoding of Descriptors is organized in a way that is very similar to the
decoding of Requests. The Definition text files for Descriptors have a .dsc
extension. All Definition files are listed in the descriptors.lst file. Please refer to
the set of .dsc files provided by CATC for examples of how to add Descriptor
Decoding files to the application.
Creating a New Class or Vendor Definition File
Decoding for a set of Class or Vendor Requests is defined in a special text file with
a .req extension. The Analyzer currently has Decoding Definition files for
• Standard Requests (standard.req)
67
Page 76

Chief User’s ManualCATC Version 1.7
• Hub Class (hub.req)
• HID Class (hid.req)
• Printer Class (printer.req)
• Communications Class (communication.req)
• Audio Class (audio.req)
• Bluetooth USB HCI commands and events (bluetooth.req)
The file shown below, hub.req, is an example of one of the Request decoding
groups supplied with the USB Chief software.
The Analyzer also includes a sample of a Vendor Request definition file
(vendor.req).
To add your own Class or Vendor Request definition, follow these steps:
Step 1 Create and edit your own Request Definition file (for example,
my_vendor_commands.req).
Note To learn to write such a file, review the Request (.req)filesprovidedbyCATC.
Step 2 Add the name of your Request file to the request.lst file.
Step 3 Click Setup.
Your decoding menu in the Class/Vendor List appears.
68
Page 77

Chief User’s ManualCATC Version 1.7
Class/Vendor Decoding Options
This interface allows you to permanently assign a class or vendor decoding for an
address and/or endpoint or interface in a Trace file. Once assigned, the decoding
occurs automatically when you choose to display transactions. You see the
Decode Class menu for whichever Class type you have selected.
Request Recipient to Class/Vendor Decoding
To assign a decoding group to a request recipient, follow these steps:
Step 1 Left-click once in the packet’s SETUP field.
Yo u s ee t he Decode Request menu:
Step 2 Select Request Recipient to Class/Vendor Decoding.
The Request Recipient window appears:
The Request Recipient field shows all the USB Class and Vendor Request
Recipients found in the Trace file. Displayed on the right are the names of
Class/Vendor decoding groups currently assigned to recipients. If no decoding is
assigned for a recipient, nothing is displayed next to the address.
69
Page 78

Chief User’s ManualCATC Version 1.7
Step 3 To select a recipient for which to assign or modify its Class/Vendor
decoding, display the Class/Vendor Decoding Groups drop-down
menu.
The drop-down menu lists the defined Class/Vendor request decoding
groups.
Step 4 In the Request Recipient field, highlight a Recipient.
Step 5 From the Class/Vendor Decoding Groups drop-down menu, select the
decoding group you want to assign to the highlighted Recipient
OR
Select No Decoding if you do not want any specific decoding.
Step 6 Click Assign to Recipient.
The name of the selected decoding group appears next to the selected
Address in the Request Recipient field.
Step 7 Click OK.
70
Page 79

Chief User’s ManualCATC Version 1.7
Class/Vendor Endpoint Decoding
Some usb endpoints can transfer formatted data that is defined in various device
class or vendor specifications.
USB Chief provides the same decoding capabilities for data sent on endpoints as
for device requests. You can define decoding for endpoints by adding
EndpointData contruct to your .req file (see examples in hub.req and
bluetooth.req.)
To assign a Class/Vendor Endpoint decoding, follow these steps:
Step 8 Left-click once in the packet’s IN or OUT fieldtoopenthefollowing
menu:
Step 9 Select Request Recipient to Class/Vendor Decoding
71
Page 80

Chief User’s ManualCATC Version 1.7
Step 10 ClickonthetabmarkedEndpoints.
The Endpoint field shows all the Endpoints found in the Trace file.
Displayed on the right are the names of Class/Vendor Decoding that are
currently assigned to Endpoints.
Step 11 To select an endpoint for which to assign or modify its Class/Vendor
decoding,, display the Class/Vendor Decoding Groups drop-down
menu
Step 12 In the Endpoint field, highlight an address, Endpoint, and Field.
Step 13 From the Class/Vendor Endpoint Decoding drop-down menu, select
the type of decoding you want
72
Page 81

Chief User’s ManualCATC Version 1.7
OR
Select No Decoding if you don’t want any specific decoding.
Step 14 Click Assign to Endpoint.
The name of the selected decoding type appears next to the selected
Address in the Endpoint field.
Step 15 Click OK.
Step 16 To decode, left-click the field marked IN or OUT.
Step 17 Select Decode as Hub Status Change Endpoint
A text box opens that displays the Hub Status Change Endpoint.
73
Page 82

Chief User’s ManualCATC Version 1.7
74
Page 83

Chief User’s ManualCATC Version 1.7
Chapter 9: Other Features
Search
The Search feature provides several options for searching through recorded
traffic, allowing you to find specific packets based on triggering status, packet
number, marking, or content.
To view the Search options,, click Search in the Menu bar to display the following
drop-down menu:
Go to Trigger
Note Go to Trigger is enabled only when a traffic file is the result of a Trigger.
To display a Trigger Event, select Go to Trigger under Search on the Menu Bar.
The Trace View is repositioned with the first packet following the Trigger event
(or the packet that caused the Trigger) at the top of your screen.
Go to Packet
To display a specific packet, follow these steps
Step 1 Select Go to Packet under Search on the Menu Bar.
The Go to Packet window appears.
Step 2 Enter the number of the packet you want to display.
75
Page 84

Chief User’s ManualCATC Version 1.7
Step 3 Click OK.
The Trace View is repositioned with the selected packet at the top of your
screen.
Go to Marker
To instruct the Analyzer to display a marked packet, follow these steps:
Step 1 From the Search menu, select Go to Marker to display the drop-down
menu listing the marked packets in that Trace View.
Step 2 Select the desired packet from the displayed list.
The Trace View is repositioned with the selected packet at the top of your
screen.
Note The Go to Marker feature functions in conjunction with the Set Marker feature.
The comments within the parentheses following each marked packet are added or
edited with the Set Marker feature. Please refer to Set Marker in Reading a
CATC Trace.
Go to
The Go To feature takes you directly to an event in a Trace.
Step 1 From the Search menu, select Go To under Search.
Step 2 Select the event you want to go to and enter the necessary information.
76
Page 85

Chief User’s ManualCATC Version 1.7
• Packet IDs (PIDs)
Select the type of packet you want to go to.
• Bus Conditions
Define the Bus conditions and speeds.
• Addr & EndP
77
Page 86

Chief User’s ManualCATC Version 1.7
Select and search an address and endpoint combination from the
recording. You can also search only IN, OUT, or SETUP
transactions.
• Frame
Search for a Frame by number, search for all empty Frames, or search
for all non-empty frames.
• Data Length
Select and search data length in bytes from the recording.
78
Page 87

Chief User’s ManualCATC Version 1.7
• Error
(a) Select any or all of the listed error types.
(b) Click Search to find the first error.
To find subsequent errors,
(c) Select Find Next under Search on the Menu Bar
from a Trace View
OR
Click in the Tool Bar.
• Data Pattern
Search for a pattern of up to ten hex bytes in data.
79
Page 88

Chief User’s ManualCATC Version 1.7
• Device Request
(a) Enter information in binary (i.e., 1 or 0).
(b) Enter “X” when you don’t care about the binary value.
(c) Enter Mask and Match values in hexadecimal. When selecting a
hexadecimal value, take care to select values so that a 1-bit equals a
“care” value.
(d) Click OK when you have completed editing these values.
• User Data
Select a Value or Don’t Care forthefirstfourExternalUserData
signals from the Breakout Board.
Find...
The Find feature allows you to set complex search criteria for finding a specific
event.
Step 1 Select Find... under Search on the Menu Bar
OR
Click in the Tool Bar.
80
Page 89

Chief User’s ManualCATC Version 1.7
The User-Defined Find Events window appears.
Step 2 Use the Events options to designate specific packets you want to search
for.
While the setups for most of the options in the Event Groups window are easily
understood, the Token Patterns option is a bit more complex and warrants a brief
description.
Selecting/Deselecting Token Patterns
To establish a Token Pattern for the Find operation,
Step 1 Select Token Patterns on the Events tab.
The Token Patterns window appears:
Step 2 Highlight an Address/Endpoint combination in the Tokens window.
81
Page 90

Chief User’s ManualCATC Version 1.7
Step 3 Select any combination of Setup, In,orOut Tokens.
Step 4 Click Assign.
S, I, O or a combination thereof next to the highlighted
Address/Endpoint under Token s appear.
Step 5 Repeat this process until you have set as many Token Patterns as you
want.
Note To deselect a Token, reverse the process described above in Step 3 and deselect
Toke ns.
After you have completed your Event Groups settings, you are ready to make your
general settings.
Step 1 Click the General tab.
Step 2 Use the General options to set a combination of search criteria of
multiple events:
• Union: Hide all packets that match ANY of the specified events.
• Intersection: Hide all packets that match ALL of the specified
events.
• Exclusion: Hide all packets that DO NOT match (opposite to the
intersection or union).
82
Page 91

Chief User’s ManualCATC Version 1.7
Find Next
To apply the previous Find parameters to the next search, select Find Next under
Search on the Menu Bar.
OR
Click on the Tool Bar.
Change Direction
To change your search direction, follow these steps:
Step 1 Click Search on the Menu Bar.
The Search Direction feature operates as a toggle between Forward (Ctrl+F)
and Backward (Ctrl+B). When you display the Search menu, the current search
direction is displayed in the menu item. (In the example above, the Search
Direction is Forward.)
Step 2 Select Search Direction Forward (or Backward).
The menu disappears and the search proceeds in the selected direction.
When a search reaches the beginning or end of a recording, the Search window is
displayed:
Use this window to instruct the Analyzer to
• Continue searching from the opposite end of the recording (Wrap Search).
• Continue searching in the reverse direction.
• Cancel the search.
83
Page 92

Chief User’s ManualCATC Version 1.7
Right-Click Shortcuts Window
Right-click anywhere on a Trace View screen to display a menu containing
several useful shortcuts to frequently-used program features:
Power and Connection Settings
Use the Power and Connection settings to control the device current and voltage
measurement features.
To alter power and connection settings, select Power and Connection from the
Setup menu.
The Power and Connection window appears.
The Power and Connection window gives direct access to the upstream and
downstream connections on the Primary Record & Generate channel. This
window is mode-less and stays on top, allowing you to record and perform other
operations.
Closing the Power and Connection window returns the settings to the default.
This ensures that you have more direct control over the connections in the
hardware and do not mistakenly leave the power, device, or host disconnected. To
use the Analyzer with the connections in a non-default setting, leave the Power
and Connection window open or minimized.
84
Page 93

Chief User’s ManualCATC Version 1.7
Use the Power and Connection window to control these settings:
• Device Power
— Current Measure: When On, the cable power towards the downstream
connection is passed through the current measure terminals on the
Breakout Board.
— Voltage Detection: Indicates good or bad voltage at the downstream
connection. The voltage must be at least 4.15V to indicate good.
• Device Connection
— Detach: Breaks the downstream connection.
— Attach: Reconnects the downstream connection.
— Unplug/Replug: Simulates a two-second detachment and reattachment of
the downstream connection.
— Internal Termination: When the downstream connection is detached, you
can control an appearance of a device to the upstream host controller by
terminating the bus inside the USB Chief.
D+ Pull Up: Simulates a full-speed device.
D- Pull Up: Simulates a low-speed device.
• Host Connection
— Detach: The upstream connection is broken and proper termination is
connected downstream to the device. When the host connection is
detached, the USB Chief supplies power to your device. This setting is
essential in preparing your setup for USB traffic generation.
— Attach: The upstream connection is reestablished.
When the host connection is detached, your device enters a suspend state after 3ms
(since no SOFs are being transmitted) and the bus termination floats to the idle
state.
Edit Comment
You can create, view, or edit the 100-character comment field associated with
each Trace file.
Step 1 Select Edit Comment under File on the Menu Bar.
The Edit comment for trace file window appears.
Step 2 Create, view, or edit the comment.
85
Page 94

Chief User’s ManualCATC Version 1.7
Step 3 Click OK.
Export Packets
Use the Export Packets feature to convert a Packet to text or generator format. You
can use the information either to review past traffic output or to generate traffic in
order to test your designs under realistic conditions.
To display the Export screen, select Export from the File menu.
You can export packets in the following text formats:
• Packets to Text (Packet View Format)
• Packets to Text (Generator Text File Format)
• Data
Packets to Text (Packet View Format)
Use this option when you want to print only the text version of the packet
information without the accompanying graphic display.
Note If the current view of a selected trace has been set to show USB transactions, the
program displays a warning when you attempt to export data in the text format.
This is a reminder that the exported data will be packets only, not transactions.
To export Packets to Text (Packet View Format), follow these steps:
Step 1 Select Packets to Text (Packet View Format) from the Export
drop-down menu.
86
Page 95

Chief User’s ManualCATC Version 1.7
The Save packets in text format window appears.
Step 2 Enter the numbers of the first and last packets in the series you want to
save.
Step 3 Click OK.
The information is entered in a table-like structure with packet number
as an index containing all the field information about the packet view
display.
Packets to Text (Generator Text File Format)
Export packets to text in the Generator Text File format when you want to capture
an actual series of Host packets to use for testing with other devices. This format
enables you to build a Generator file without having to start from scratch.
This option enables you to do the following:
• Remove Device Traffic from the file and export only Host Traffic.
• Generate the Host Traffic (Host Emulation) to determine if the device under
test generates its own traffic correctly.
To export Packets to Text (Generator Text File Format), follow these steps:
Step 1 Select Packets to Text (Generator Text File Format) from the Export
drop-down menu.
The Export to Generator Text window appears.
Step 2 Enter the numbers of the first and last packets in the series you want to
save.
Note The device packets are removed from the exported generator text. This is essential
in creating a generator text file that can be used to handshake with your device.
87
Page 96

Chief User’s ManualCATC Version 1.7
Step 3 You can regenerate the frame numbers and to remove NAKed
transactions.
Once the generator text file is exported, you may need to edit the file and adjust
idle time to properly anticipate the responses from your device.
Data
Export packets in Data format if you need only the information contained in Data
blocks.
To export Data, follow these steps:
Step 1 From the File menu, select Export then Data.
The Export Data window appears.
Step 2 Enter the requested information.
• Addr and EndP
Enter the address and endpoint as decimal values to export data from
a specific device. When the EndP is left blank, data from all the
endpoints of the device address are included.
• Specify Token PIDs
Indicate a token to export data specific to a transaction type.
• Acknowledgments
Qualify Handshake—Indicate a transaction with a qualified
handshake to export the correct data.
- ACK—Export acknowledged data
- NAK—Export data not acknowledged
- none—Export isochronous data with no handshake
• Don’t Print Data Headers
Data packets are normally demarcated by text headers that indicate
the packet number and other transaction information. Use this option
to export data without these text headers only when a specific
address, endpoint, and token transaction are indicated.
• Save Options
88
Page 97

Chief User’s ManualCATC Version 1.7
• Text or Binary
Specified size limit
• Te xt
Alternate Access to the Export Data Window
You can also access the Export Data dialog box from the Trace View.
Step 1 Left-click once in the packet’s IN or OUT field.
One of these menus (depending on whether you clicked on IN or Out)
appears:
Step 2 Select Export Data.
Reports
The Report menu provides several reports to assist you in analyzing USB traffic
recorded by the Analyzer.
File Information
To display a File Information report,
• From the Report menu, select File Information.
OR
Click in the Tool Bar.
The File Information window appears.
89
Page 98

Chief User’s ManualCATC Version 1.7
The File Information report provides valuable information about how the
recording was made, what the buffer settings were, what the trigger options were,
and what version of all the Analyzer hardware was used to make the recording.
Error Summary
To display an Error Summary,
From the Report menu, select Error Summary.
OR
Click in the Tool Bar.
The Error Summary window appears.
90
Page 99

Chief User’s ManualCATC Version 1.7
The Error Summary details all errors analyzed throughout the Trace recording.
• Navigate to an error within the recording by clicking the number of the packet
containing the error.
• Use the arrows to cycle though each occurrence of a particular error.
Babble Errors
While most of the errors reported in an Error Summary are self-evident, Babble
Errors warrant special mention. Failures can occur if a device on the bus doesn’t
end its transmission before the end of the frame, or if it continues to drive a
constant J or K state on the bus with no end of packet (EOP).
• The Babble Start error identifies packets that began too late to be completed
within the frame and illegally ran over into the following frame.
• The Babble End error identifies packets that didn’t have an EOP and therefore
caused a loss of activity (LOA).
91
Page 100

Chief User’s ManualCATC Version 1.7
Timing and Bus Usage Calculator
From the Report menu, select Timing Calculations.
OR
Click in the Tool Bar.
The Timing and Bus Usage Calculator appears.
Use the Timing and Bus Usage Calculator to set options for Bus Utilization, Time
Usage, Bandwidth, and Advanced Filtering.
Transaction Summary
Step 1 From the Report menu, select Transaction Summary.
(There is no corresponding button on the Tool Bar for this feature.)
Step 2 In the Transaction Report window, enter the values in the From Packet
and To Packet fields.
Step 3 Click OK.
92
 Loading...