

Page 1
Getting Started
Manual
WaveSurfer® MXs-B
Oscilloscopes
Page 2

Page 3

WaveSurfer® MXs-B
Series Oscilloscopes
Getting Started Manual
January, 2013
Page 4

700 Chestnut Ridge Road
Chestnut Ridge, NY, 10977-6499
Tel: (845) 425-2000
Fax: (845) 578 5985
teledynelecroy.com
© 2013 Teledyne LeCroy, Inc. All rights reserved.
Unauthorized duplication of Teledyne LeCroy documentation materials other than for
internal sales and distribution purposes is strictly prohibited. However, clients are
encouraged to distribute and duplicate Teledyne LeCroy documentation for their own
internal educational purposes.
WaveSurfer and Teledyne LeCroy are registered trademarks of Teledyne LeCroy, Inc.
Windows is a registered trademark of Microsoft Corporation. Other product or brand names
are trademarks or requested trademarks of their respective holders. Information in this
publication supersedes all earlier versions. Specifications are subject to change without
notice.
Warranty
NOTE: THE WARRANTY BELOW REPLACES ALL OTHER WARRANTIES, EXPRESSED OR IMPLIED,
INCLUDING BUT NOT LIMITED TO ANY IMPLIED WARRANTY OF MERCHANTABILITY, FITNESS,
OR ADEQUACY FOR ANY PARTICULAR PURPOSE OR USE. TELEDYNE LECROY SHALL NOT BE
LIABLE FOR ANY SPECIAL, INCIDENTAL, OR CONSEQUENTIAL DAMAGES, WHETHER IN
CONTRACT OR OTHERWISE. THE CUSTOMER IS RESPONSIBLE FOR THE TRANSPORTATION
AND INSURANCE CHARGES FOR THE RETURN OF PRODUCTS TO THE SERVICE FACILITY.
TELEDYNE LECROY WILL RETURN ALL PRODUCTS UNDER WARRANTY WITH TRANSPORT
PREPAID.
The oscilloscope is warranted for normal use and operation, within specifications, for a
period of three years from shipment. Teledyne LeCroy will either repair or, at our option,
replace any product returned to one of our authorized service centers within this period.
However, in order to do this we must first examine the product and find that it is defective
due to workmanship or materials and not due to misuse, neglect, accident, or abnormal
conditions or operation.
Teledyne LeCroy shall not be responsible for any defect, damage, or failure caused by any of
the following: a) attempted repairs or installations by personnel other than Teledyne LeCroy
representatives or b) improper connection to incompatible equipment, or c) for any damage
or malfunction caused by the use of non-Teledyne LeCroy supplies. Furthermore, Teledyne
LeCroy shall not be obligated to service a product that has been modified or integrated
where the modification or integration increases the task duration or difficulty of servicing
the oscilloscope. Spare and replacement parts, and repairs, all have a 90-day warranty.
The oscilloscope's firmware has been thoroughly tested and is presumed to be functional.
Nevertheless, it is supplied without warranty of any kind covering detailed performance.
Products not made by Teledyne LeCroy are covered solely by the warranty of the original
equipment manufacturer.
922172-00 Rev A
January 2013
Page 5

Getting Started Manual
TABLE OF CONTENTS
Welcome .................................................................................................. 1
Safety Instructions .................................................................................... 2
Symbols.................................................................................................. 2
Precautions ............................................................................................ 2
Operating Environment ......................................................................... 3
Cooling ................................................................................................... 3
Cleaning ................................................................................................. 4
Power ..................................................................................................... 4
When Your Oscilloscope is Delivered ........................................................ 5
Check that You Have Everything ............................................................ 5
Maintenance Agreements ..................................................................... 5
Software ................................................................................................... 6
Adding a New Option............................................................................. 6
Restarting the Application ..................................................................... 6
Rebooting the Oscilloscope ................................................................... 6
Windows® License Agreement .............................................................. 6
Basic Controls ........................................................................................... 7
Front Panel ............................................................................................ 7
Vertical Controls .................................................................................... 8
Horizontal Controls ................................................................................ 9
Trigger Controls ..................................................................................... 9
AutoSetup Button ................................................................................ 10
Measure, Zoom, and Math Quick Buttons .......................................... 10
Cursor Knobs and Buttons ................................................................... 10
Adjust Knob ......................................................................................... 11
Print Button ......................................................................................... 11
Clear Sweeps........................................................................................ 11
Touch Screen ....................................................................................... 11
Intensity/Acquisition Mode ................................................................. 11
Probe and Signal Connection Interfaces .............................................. 12
Display Dashboard .................................................................................. 13
Menu Bar ............................................................................................. 14
Grid Area .............................................................................................. 15
922172-00 Rev A i
Page 6

WaveSurfer MXs-B Oscilloscope
Descriptor Labels .................................................................................. 17
Message Bar ......................................................................................... 18
Alternative Access Methods ................................................................. 18
Turning on Channels and Traces .............................................................. 19
Vertical Setup ......................................................................................... 20
Coupling................................................................................................ 20
Deskew ................................................................................................. 20
Probe Attenuation ................................................................................ 20
Bandwidth Limiting .............................................................................. 21
Averaging Your Signal ........................................................................... 21
Interpolation Settings ........................................................................... 21
Noise Filtering (ERES) ........................................................................... 21
Using Shortcut Toolbar ......................................................................... 21
TimeBase ................................................................................................ 22
Timebase Setup and Control ................................................................ 22
Sampling Modes ................................................................................... 23
Single-shot Sampling Mode .................................................................. 23
Sequence Sampling Mode – Working with Segments .......................... 24
RIS Sampling Mode - For Higher Sampling Rates ................................. 26
Roll Mode ............................................................................................. 26
WaveStream Fast Viewing Mode / Intensity ........................................ 27
Triggering ................................................................................................ 28
Overview .............................................................................................. 28
Trigger Terms ....................................................................................... 28
Trigger Setup ........................................................................................ 29
Basic Triggers ........................................................................................ 33
SMART Triggers .................................................................................... 34
Serial Trigger and Decode (Optional) ................................................... 35
Viewing Waveforms ................................................................................ 37
Display Setup ........................................................................................ 37
Zooming your Channels ........................................................................ 37
Analyzing Waveforms ............................................................................. 42
Measuring with Cursors ....................................................................... 42
Turning On Cursors ............................................................................... 43
ii 922172-00 Rev A
Page 7

Getting Started Manual
Cursor Types ........................................................................................ 43
Reading Cursor Information ................................................................ 45
Measuring with Parameters ................................................................... 46
Overview .............................................................................................. 46
Setting Up Parameter(s) ...................................................................... 46
Understanding Parameter Displays ..................................................... 48
Parameter Gates (Windows) ............................................................... 50
Measurement Statistics ....................................................................... 50
Turning Off Parameters ....................................................................... 51
WaveScan™ Advanced Search and Analysis ............................................ 51
Introduction to WaveScan ................................................................... 51
Working with Sampling Modes ............................................................ 61
Using the Math Trace ............................................................................. 64
Overview .............................................................................................. 64
Description of math functions ............................................................. 65
Setting up a Math Trace ...................................................................... 67
Using Dual Operators........................................................................... 68
Math Descriptor Label ......................................................................... 69
Zooming Math ..................................................................................... 69
Toolbar Shortcuts ................................................................................ 70
Pass/Fail Testing ..................................................................................... 71
Overview .............................................................................................. 71
Mask Tests ........................................................................................... 71
Actions ................................................................................................. 71
Setting Up Pass/Fail Testing................................................................. 72
Mask Testing Setup .............................................................................. 73
Saving and Recalling Waveforms ......................................................... 74
Overview .............................................................................................. 74
Saving and Recalling Memories ........................................................... 74
Saving and Recalling Waveform Data .................................................. 76
Saving Screen Images .......................................................................... 78
Saving and Recalling Setups ................................................................. 81
Sharing Data & Communicating .............................................................. 82
Overview .............................................................................................. 82
922172-00 Rev A iii
Page 8

WaveSurfer MXs-B Oscilloscope
Standard outputs .................................................................................. 83
Documenting Your Work Using LabNotebook ..................................... 84
Connecting to a Network ..................................................................... 84
Sending E-mail from the Oscilloscope .................................................. 85
Controlling and Viewing Remotely ....................................................... 85
Accessing the Desktop .......................................................................... 86
Annotating Image Files / Creating Labels ............................................. 86
Saving Data Files and Images ............................................................... 87
Creating Reference Waveforms (Memories)........................................ 87
Printing ................................................................................................. 88
Print Management ............................................................................... 88
Utilities and Preferences ......................................................................... 90
Overview .............................................................................................. 90
Status .................................................................................................... 90
Remote Communication ...................................................................... 90
Aux Output ........................................................................................... 92
Setting the Date and Time .................................................................... 93
Options ................................................................................................. 94
Service .................................................................................................. 94
Show Windows Desktop ....................................................................... 94
Touch-Screen Calibration ..................................................................... 94
Preferences .......................................................................................... 95
Acquisition Status ................................................................................. 97
Remote Control Operation ................................................................... 97
Automation .......................................................................................... 98
Standards.............................................................................................. 98
System Recovery .................................................................................. 99
Software Recovery Application .......................................................... 100
Reference .............................................................................................. 102
Certifications ...................................................................................... 102
Contact Teledyne LeCroy .................................................................... 106
X-Stream Software End-User License Agreement .............................. 107
Windows® License Agreement ............................................................ 115
iv 922172-00 Rev A
Page 9

Getting Started Manual
922172-00 Rev A 1
Welcome
Thank you for purchasing a Teledyne LeCroy product. This Operator's
Manual includes important safety and installation information for your
WaveSurfer Oscilloscope, along with operating procedures for capturing,
viewing, and analyzing waveforms.
This WaveSurfer Manual is organized in the following manner:
Hardware (physical features) and Basic Controls
Viewing Waveforms, includes instructions on setting up the Display
Vertical and Horizontal Settings, Sampling Modes, and Triggering
Analyzing Waveforms using parameter Measurements, Math
functions, and Reference Waveforms
Saving and Recalling oscilloscope setups, waveforms, .CSV files, and
waveform images. This section also provides procedures to recall
factory settings.
Reference section including certification and contact information.
When oscilloscope is delivered, verify that all items on the packing list or
invoice copy have been shipped to you. Contact your nearest Teledyne
LeCroy customer service center or national distributor if anything is missing
or damaged. If you do not contact us immediately, we cannot be
responsible for replacement. Contact us for support if you have any
difficulties using the product. You can also refer to additional support
materials at teledynelecroy.com.
We truly hope these materials provide increased comprehension when
using Teledyne LeCroy's fine products.
Sincerely,
David C. Graef
Teledyne LeCroy
Vice President and Chief Technology Officer
Page 10
WaveSurfer MXs-B Oscilloscopes
2 922172-00 Rev A
CAUTION of damage to instrument, or WARNING of hazard to
health. Attend to the accompanying information to protect
against personal injury or damage. Do not proceed until
conditions are fully understood and met.
WARNING. Risk of electro-shock.
Measurement ground connection.
Safety (protective) ground connection.
Alternating Current.
Safety Instructions
This section contains instructions that must be observed to keep the
instrument operating in a correct and safe condition. You are required to
follow generally accepted safety procedures in addition to the precautions
specified in this section.
The overall safety of any system incorporating this instrument is the
responsibility of the assembler of the system.
Symbols
These symbols appear on the instrument's front or rear panels and in its
documentation to alert you to important safety considerations.
Precautions
Use proper power cord. Use only the power cord shipped with this
instrument and certified for the country of use.
Maintain ground. This product is grounded through the power cord
grounding conductor. To avoid electric shock, connect only to a
grounded mating outlet.
Connect and disconnect properly. Do not connect/disconnect
probes or test leads while they are connected to a voltage source.
Page 11

Getting Started Manual
922172-00 Rev A 3
Observe all terminal ratings. Do not apply a voltage to any input
(C1, C2, C3, C4 or EXT) that exceeds the maximum rating of that
input. Refer to the front of the oscilloscope for maximum input
ratings.
Use only within operational environment listed. Do not use in wet
or explosive atmospheres.
Use indoors only.
Keep product surfaces clean and dry.
Do not block the cooling vents. Leave a minimum six-inch (15 cm)
gap between the instrument and the nearest object. Keep the
underside clear of papers and other objects.
Do not remove the covers or inside parts. Refer all maintenance to
qualified service personnel.
Do not operate with suspected failures. Do not use the product if
any part is damaged. Obviously incorrect measurement behaviors
(such as failure to calibrate) might indicate impairment due to
hazardous live electrical quantities. Cease operation immediately
and sequester the instrument from inadvertent use.
Operating Environment
Temperature: 10 to 40 °C.
Humidity: Maximum relative humidity 80 % for temperatures up to 31 °C
decreasing linearly to 50 % relative humidity at 40 °C (or at the upper
operational temperature limit).
Altitude: Up to 10,000 ft (3,048 m) at or below 25 °C.
Cooling
The instrument relies on forced air cooling with internal fans and vents.
Take care to avoid restricting the airflow to any part of the oscilloscope.
Around the sides and rear, leave a minimum of 15 cm (6 inches) between
the instrument and the nearest object. At the bottom, the oscilloscope feet
(up or down) provide adequate clearance.
CAUTION. Do not block oscilloscope vents. Always keep the area
Page 12

WaveSurfer MXs-B Oscilloscopes
4 922172-00 Rev A
beneath the oscilloscope clear of paper and other items.
The instrument also has internal fan control circuitry that regulates the fan
speed based on the ambient temperature. This is performed automatically
after start-up.
Cleaning
Clean only the exterior of the oscilloscope using a damp, soft cloth. Do not
use harsh chemicals or abrasive elements. Under no circumstances
submerge the instrument or allow moisture to penetrate it. Avoid electric
shock by unplugging the power cord from the AC outlet before cleaning.
CAUTION. Do not attempt to clean internal parts. Refer to qualified
service personnel.
Power
Power Consumption
The instrument operates from a single-phase, 100 to 240 V
power source at 50/60 Hz (+/-5%), or single-phase 100 to 120 V
AC power source at 400 Hz (+/-5%).
No manual voltage selection is required because the instrument
automatically adapts to line voltage.
Depending on the accessories installed (front panel probes, PC port plugins, etc.), the instrument can draw up to 340 W (340 VA) max – all 4
channel models and 290 W (290 VA) max – all 2 channel models.
(+/-10%) AC
rms
(+/-10%)
rms
Power and Ground Connections
The instrument is provided with a grounded cord set containing a molded
three-terminal polarized plug and a standard IEC320 (Type C13) connector
for making line voltage and safety ground connection.
The AC inlet ground is connected directly to the frame of the instrument.
For adequate protection again electric shock, connect to a mating outlet
with a safety ground contact.
WARNING. Interrupting the protective conductor inside or outside
the oscilloscope, or disconnecting the safety ground terminal,
creates a hazardous situation. Intentional interruption is prohibited.
Page 13

Getting Started Manual
922172-00 Rev A 5
Standby Power
The Power (Standby) button controls the operational state of the
oscilloscope. Press the button to switch the instrument On or into Standby
mode (Off). Always use the Power button or the File > Shutdown menu
option to execute a proper shut down process and preserve settings before
powering down.
Powering off does not disconnect the oscilloscope from the AC power
supply. The only way to fully power down the instrument is to shut down
then unplug the AC power cord from the outlet.
We recommend unplugging the instrument if it will be unused for a long
period of time.
When Your Oscilloscope is Delivered
Check that You Have Everything
First, verify that all items on the packing list or invoice copy have been
shipped to you. Contact your nearest Teledyne LeCroy customer service
center or national distributor if anything is missing or damaged. If there is
something missing or damaged, and you do not contact us immediately, we
cannot be responsible for replacement.
Maintenance Agreements
We offer a variety of services under the heading of Maintenance
Agreements. These give extended warranty and allow you to budget
maintenance costs after the initial three-year warranty has expired.
Installation, training, enhancements, and on-site repairs, among other
services, are available through special supplemental support agreements.
Inquire at your Teledyne LeCroy customer service center or national
distributor.
Page 14
WaveSurfer MXs-B Oscilloscopes
6 922172-00 Rev A
Software
Find out the oscilloscope's software and hardware configuration by
choosing Utilities → Status from the menu bar.
Adding a New Option
New software options can be added after purchasing a code and then
enabling the option on the oscilloscope. Call Teledyne LeCroy Customer
Support to place an order and receive the code.
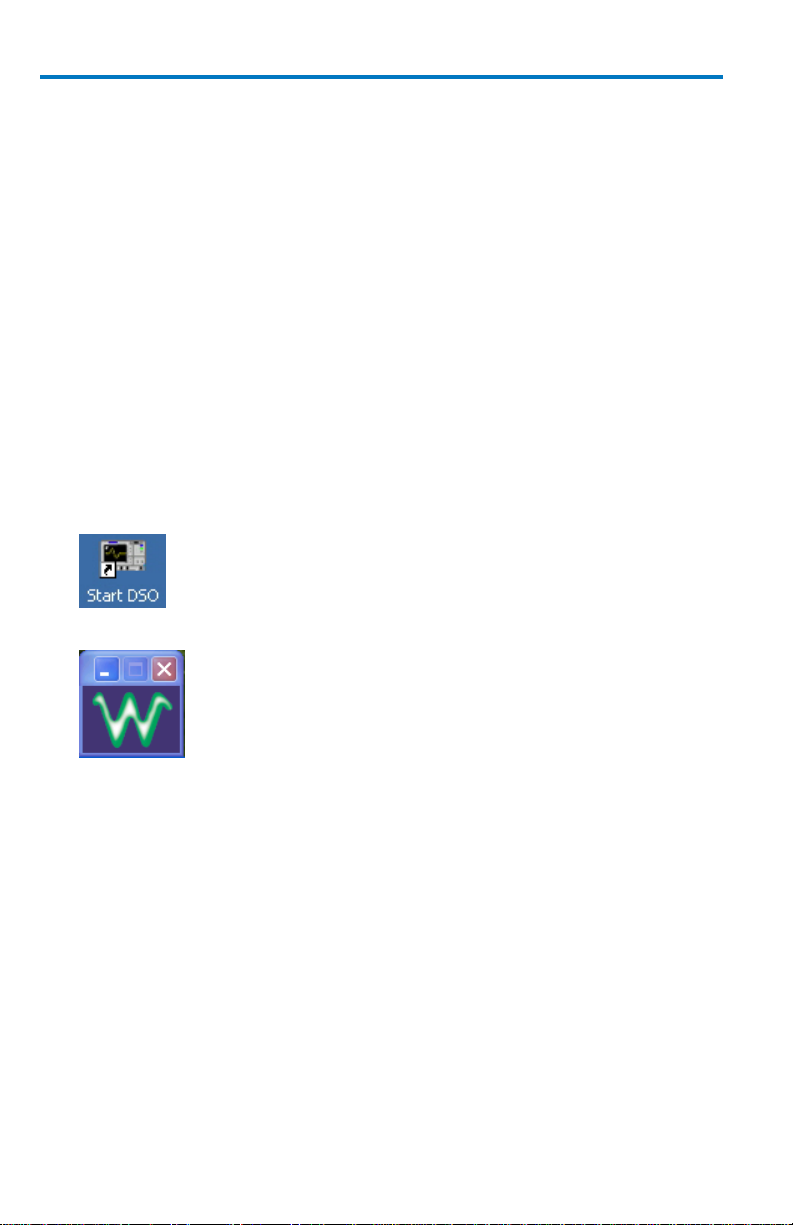
Restarting the Application
Upon initial power-up, the oscilloscope loads the instrument application
software automatically.
If you exit the application and want to reload it, touch the shortcut icon
on the desktop:
If you minimize the application, touch the desktop icon to maximize it:
Rebooting the Oscilloscope
If you need to restart the Windows® operating system, you must reboot
the oscilloscope by pressing the power switch, and then turning the power
back on after a ten-second wait.
Windows® License Agreement
Teledyne LeCroy's agreement with Microsoft prohibits users from running
software on Teledyne LeCroy oscilloscopes that is not relevant to
measuring, analyzing, or documenting waveforms.
Page 15
922172-00 Rev A 7
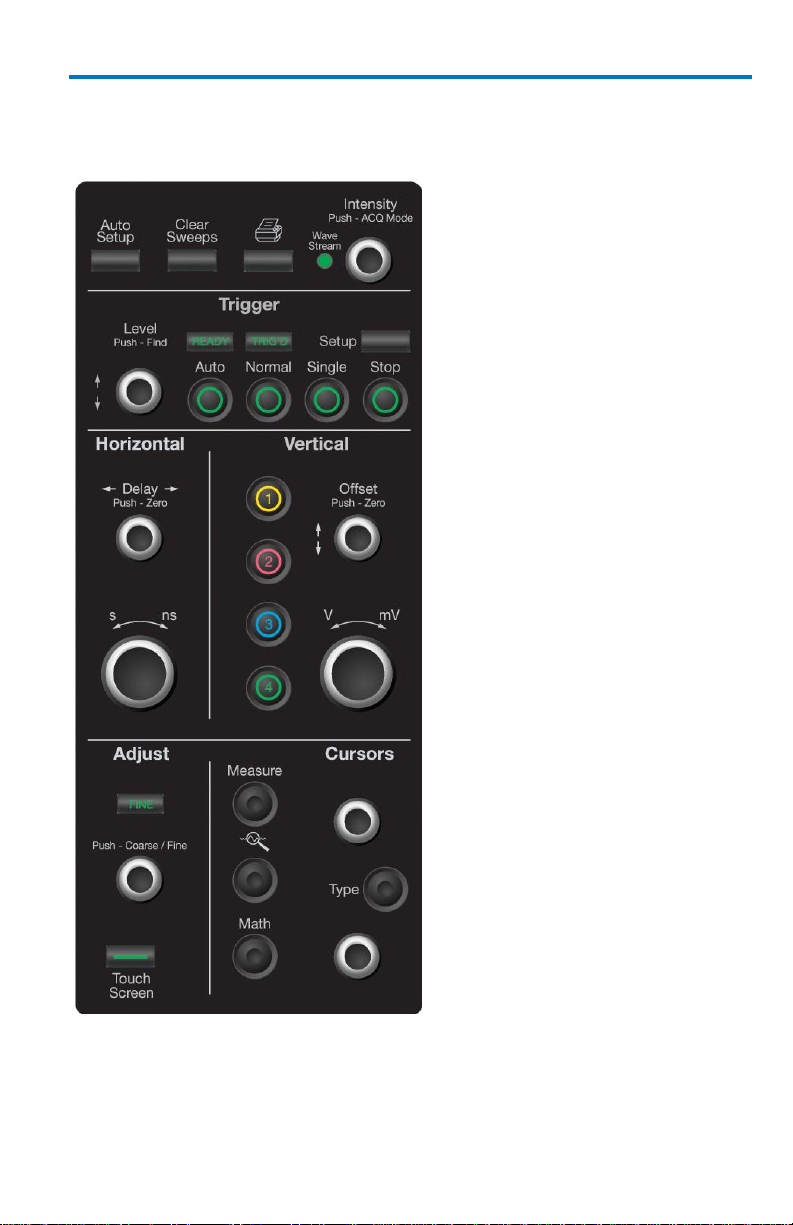
Basic Controls
Front Panel
Getting Started Manual
The WaveSurfer MXs-B front
panel is designed to allow you to
operate basic oscilloscope
functions without having to open
software dialogs. Use the
Horizontal and Vertical controls as
you would for any other
oscilloscope. This topic provides
descriptions of the various
controls.
Page 16
WaveSurfer MXs-B Oscilloscopes
8 922172-00 Rev A
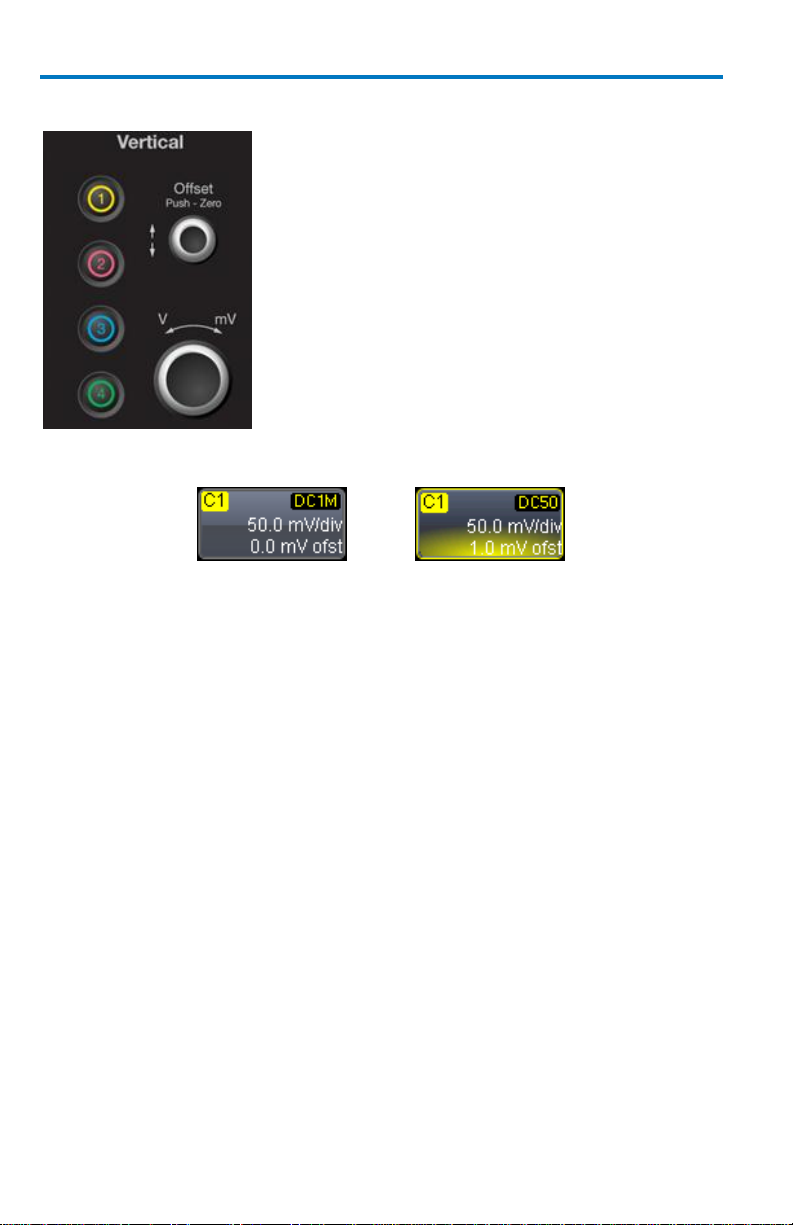
Vertical Controls are multiplexed for each
channel. The lighted channel button indicates
which channel the controls are active for.
Turn channels ON by pressing the
corresponding channel button.
Channels are made active by pressing the
channel button again.
Turn channels OFF by pressing the channel
button (activating it), and then pressing again
to turn it OFF.
Inactive Channel
Active Channel
Vertical Controls
When a channel is active, its descriptor label changes appearance.
When a channel is turned OFF, the next channel in sequence becomes the
active channel.
If no front panel channel buttons are lit, it means either that no channels
are turned ON, or that a Math, Zoom, or Memory trace is active. In that
case, the vertical offset and sensitivity knobs adjust the vertical position
and vertical scale of the Math, Zoom, or Memory (Reference Waveform)
trace.
Page 17
922172-00 Rev A 9
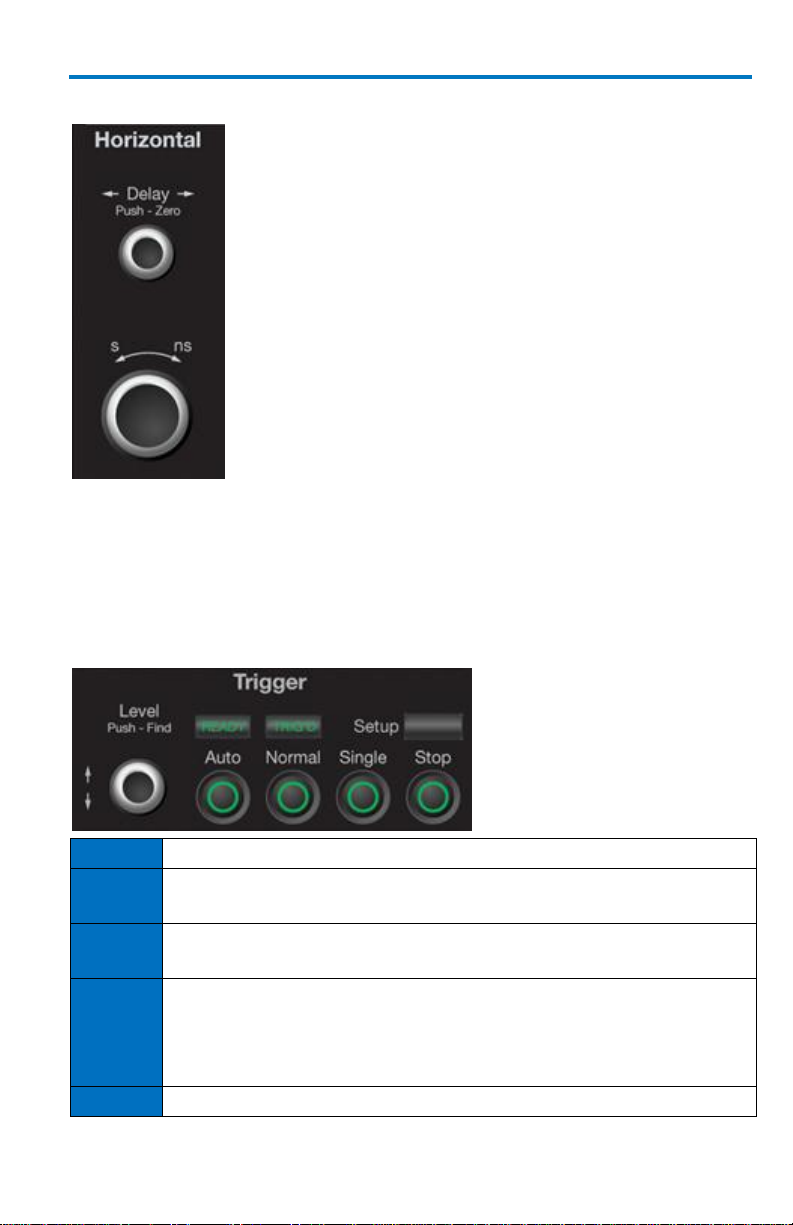
Horizontal Controls
Set up the timebase by using the front panel Horizontal
controls, just as for analog oscilloscopes. The
WaveSurfer MXs-B oscilloscope allocates memory as
needed to maintain the highest sample rate possible for
the timebase setting.
The WaveSurfer MXs-B oscilloscope can acquire in
either Real-Time up to 5 GS/s per channel, Random
Interleaved Sampling (RIS, up to 50 GS/s), or Roll mode
(up to 5 MS/s).
At certain very low time/division settings, the
oscilloscope defaults to RIS mode of operation to
maintain the highest sample rate.
At long time/division settings, the oscilloscope defaults
to Roll mode operation so the signal shown on the
screen are not delayed by the long acquisition time.
Maximum sample rate in Roll mode operation is 5 MS/s.
Stop
Cancels the capture in Auto, Normal, or Single trigger mode
Auto
Triggers the oscilloscope after a time-out, even if the trigger
conditions are not met.
Normal
Triggers the oscilloscope each time a signal is present that
meets the conditions set for the type of trigger selected.
Single
Arms the oscilloscope to trigger once (single-shot acquisition)
when the input signal meets the trigger conditions set for the
type of trigger selected. If the oscilloscope is already armed, it
forces a trigger.
Setup
Displays the Trigger setup screen.
Getting Started Manual
Trigger Controls
Page 18
WaveSurfer MXs-B Oscilloscopes
10 922172-00 Rev A
Automatically sets timebase, trigger, and sensitivity to
display a wide range of repetitive signals.
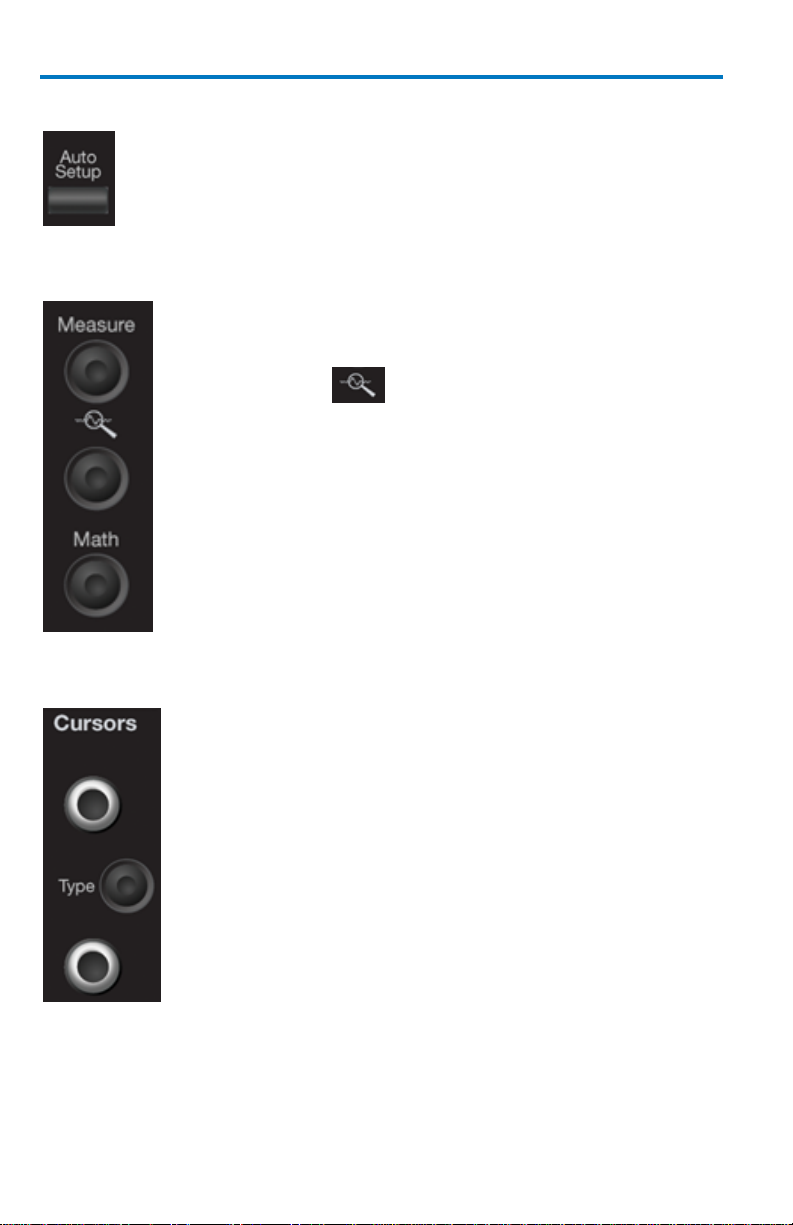
Measure – Press once to open the measure dialog.
Press again to close the dialog.
QuickZoom – Press once to create zooms of all
displayed channels. Press again to unzoom.
Math – Press once to turn on the Math trace, and
display the Math Setup dialog. Press again to close the
dialog.
The WaveSurfer MXs-B oscilloscope has dedicated dual
cursor knobs for cursor control. Cursors always default
to a relative state (two cursors ON).
Knobs – Rotate to adjust cursor position. If Cursors are
OFF, rotating either knob turns Cursors ON. At this
point, push in the button to set it as the default
position.
Type Button – Pressing the Type button once turns
Cursors ON to Horizontal (Time) measurements.
Pressing the button again changes it to Vertical
(Amplitude) measurements. Pressing it a third time
turns the Cursors OFF.
AutoSetup Button
Measure, Zoom, and Math Quick Buttons
Cursor Knobs and Buttons
Page 19
922172-00 Rev A 11
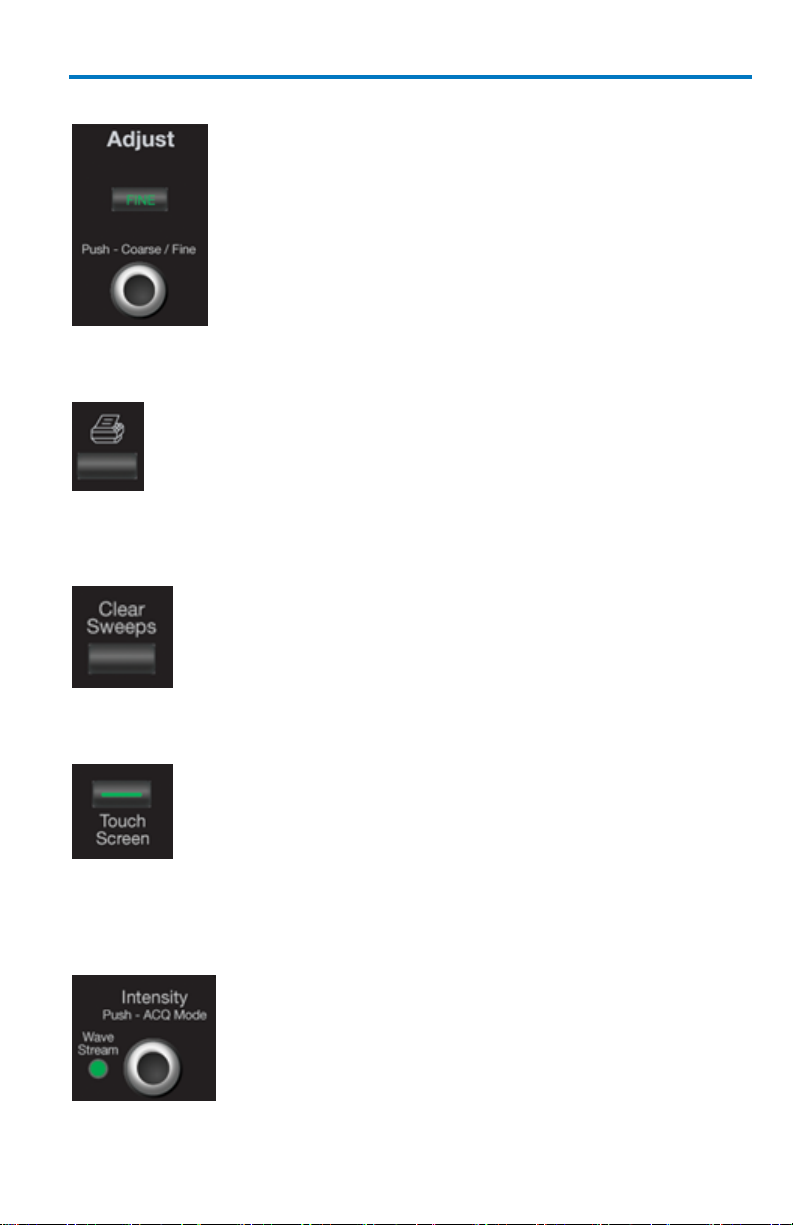
Adjust Knob
The adjust knob can be used to make adjustments to a
value when a dialog is open and the selected control
has a yellow highlight.
Push the knob in to toggle between coarse and fine
adjustments.
This button can be programmed to print the screen to
a file, a printer, or the clipboard. It can also send the
file as an e-mail attachment. Select the instrument and
format it under the Utilities Hardcopy dialog.
Clears data from multiple sweeps (acquisitions)
including: persistence displays, parameter
(measurement) statistics, and averaged traces.
The Touch Screen lighted pushbutton indicates if the
oscilloscope touch screen is operational. If the button
is lighted, the touch screen is ON. If the button is not
lighted, the touch screen is turned OFF. The button
toggles between these two states.
The INTENSITY knob adjusts the brightness of your
trace. Pushing the button toggles between
WaveStream fast-viewing mode (indicator lamp on)
and real-time mode (lamp off).
Print Button
Clear Sweeps
Getting Started Manual
Touch Screen
Intensity/Acquisition Mode
Page 20

WaveSurfer MXs-B Oscilloscopes
12 922172-00 Rev A
Current Probes
Available from 30 A to 500 A.
Active Probes
Single-ended to >1 GHz.
Differential Probes
Differential from 15 MHz to >1 GHz.
Passive Probes
The PP009 and PP011 passive probes guarantee full
instrument bandwidth at the probe tip. Other passive
probes can be used with performance limitations.
High Voltage Probes
For measuring up to 20 kV.
Probe and Signal Connection Interfaces
Teledyne LeCroy WaveSurfer MXs-B oscilloscopes contain probe interfaces
that provide a complete measurement solution from probe tip to
oscilloscope display. All probe interfaces permit automatic recognition of
connected probes. For active single-ended and differential voltage probes
and current probes, these interfaces upload data regarding the
attenuation, offset and units from the probe EEPROM's.
The Teledyne LeCroy WaveSurfer MXs-B oscilloscopes include ProBus
probe interfaces. The ProBus interface offers both 50 Ω/1 MΩ input
impedance and provides probe power and control for a wide range of
probes such as high impedance passive probes, high impedance active
probes, current probes, high voltage probes, and differential probes.
Probe Calibration
The passive probe supplied with your WaveSurfer MXs-B oscilloscope is
calibrated for the WaveSurfer MXs-B input impedance. If using other
passive probes with your WaveSurfer MXs-B oscilloscope, be sure to
calibrate them using the 1 kHz square wave signal available on the AUX
OUT terminal before using them for signal measurements.
Teledyne LeCroy offers a variety of other passive and active probes for use
with your WaveSurfer MXs-B Series oscilloscope. Visit teledynelecroy.com
for specifications and ordering information.
Page 21
Getting Started Manual
922172-00 Rev A 13
Passive Probe Compensation
Passive probes must be compensated to flatten overshoot. This is
accomplished by means of a trimmer at the connector end of the probe.
Attach the connector end of your passive probe to any channel.
Connect the probe end to the CAL output connector at the front of the
oscilloscope. Ground the probe.
Adjust the trim pot at the connector end of the probe until the square
wave is as flat as possible.
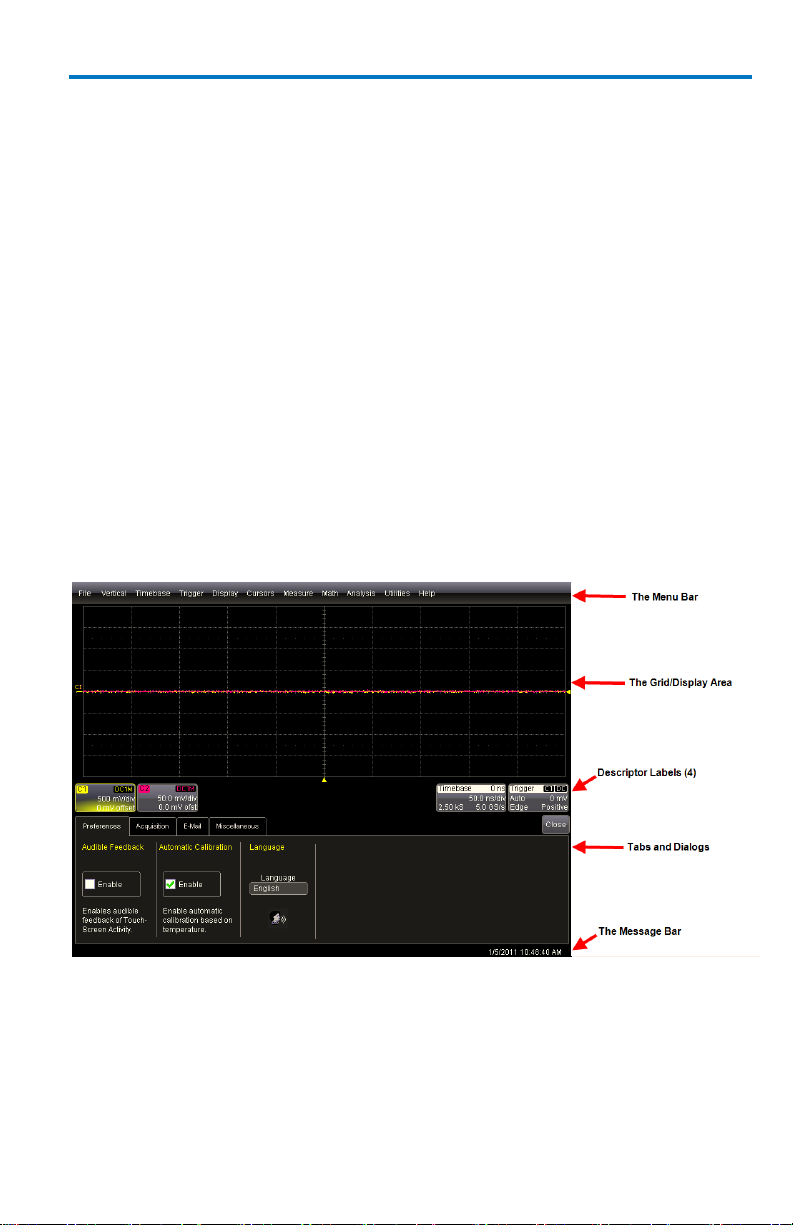
Display Dashboard
The WaveSurfer MXs-B oscilloscope’s display contains valuable information
about the current settings of your Vertical (channel), Horizontal
(Timebase), and Trigger controls. In addition, there are many shortcuts that
are available by using the touch screen capability of your display to quickly
access information or to open dialogs.
Page 22

WaveSurfer MXs-B Oscilloscopes
14 922172-00 Rev A
Menu Bar
The top menu bar provides access to various software dialogs. It is very
similar to the File menu on any Windows program. For common
oscilloscope operations, you don’t need to use the top menu bar (since you
can access most dialogs from the Front Panel or from the Descriptor
Labels). However, it is the only way to access setup or other dialogs for the
following:
Display Setup
Save or Recall Waveform
Save or Recall Setups
Print Setup
Vertical (Channel), Horizontal, or Trigger Status
Memory (Reference Waveform) Setup
Pass/Fail Setup
Utilities and Preferences Setup
At the right-hand end of the top menu bar is an Undo button.
This button appears after the AutoSetup front panel button is pressed, and
after Zooming. If you want to perform an Undo operation, it must be the
very next operation after you perform the Autosetup or Zoom operation.
Page 23
Getting Started Manual
922172-00 Rev A 15
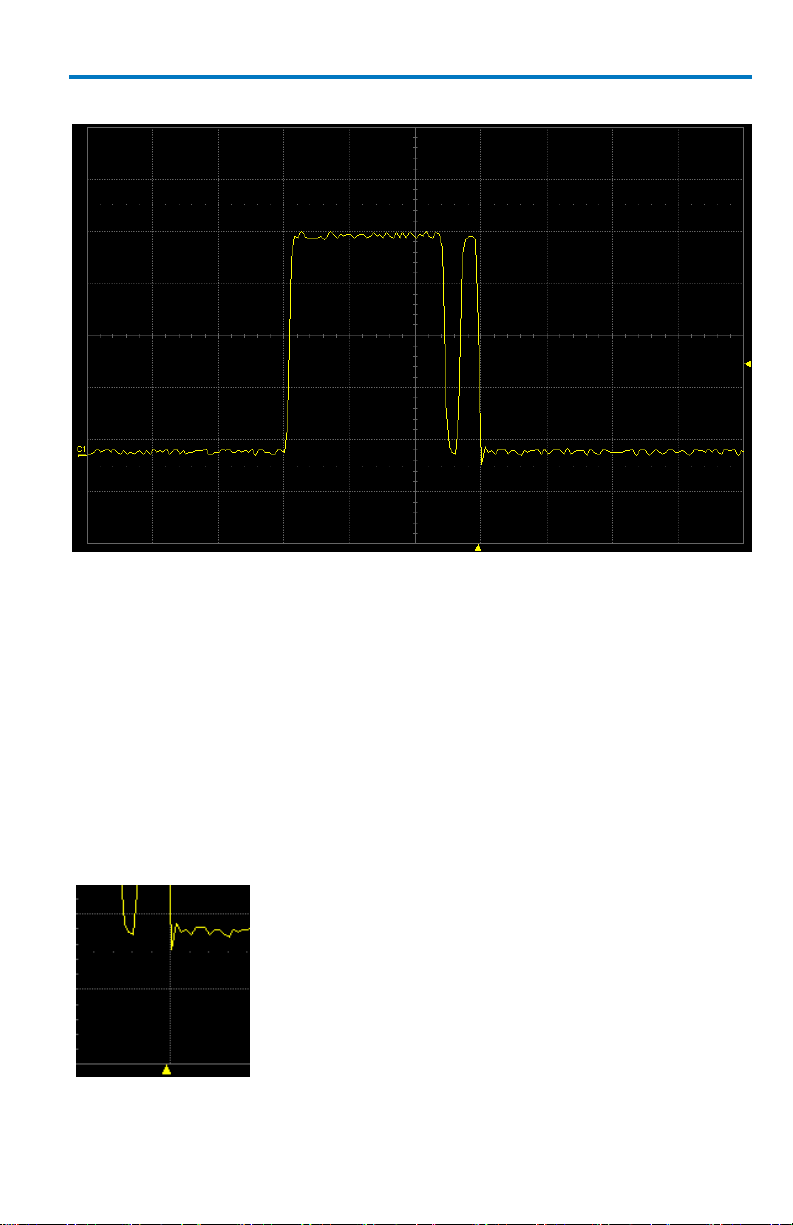
The trigger delay Indicator is a color-coded triangle
that is positioned horizontally on the grid.
Trigger delay horizontally positions the
oscilloscope trace on the display so you can
observe the signal prior to the trigger time. It
adjusts the pre- and post-trigger time.
Grid Area
The grid area is divided into 8 vertical divisions and 10 horizontal divisions.
There are several indicators on the grid to help you understand the
following:
Trigger Delay setting
Trigger Level Setting
Trace Zero Level
These indicators are color-coded to the same color as the channel that the
oscilloscope is currently set to trigger on.
Trigger Delay Indicator
Page 24
WaveSurfer MXs-B Oscilloscopes
16 922172-00 Rev A
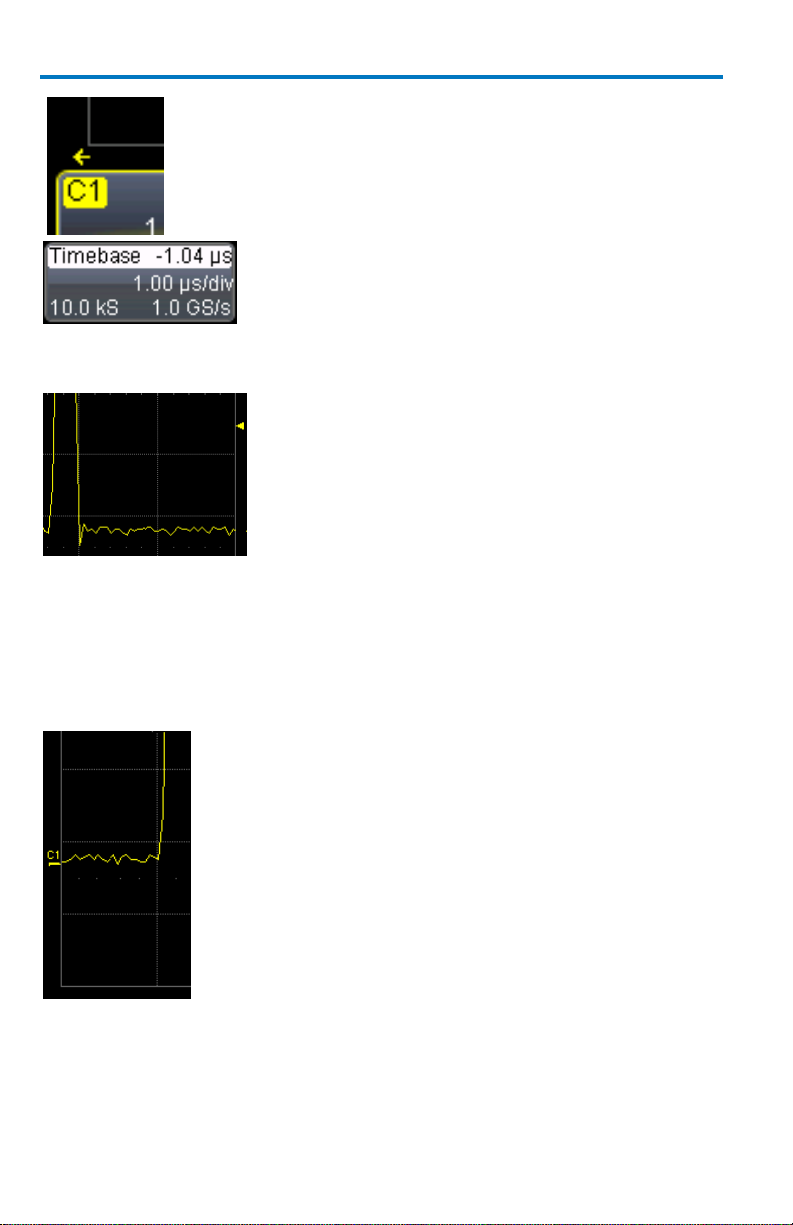
Post-trigger delay is indicated by a color-coded
arrow pointing to the left.
All trigger delay values (including post-trigger
delay, shown here) are displayed in the timebase
descriptor label.
The trigger level Indicator is a color-coded triangle
that is positioned vertically on the grid.
In Stop trigger mode, the solid triangle also appears
with a hollow triangle of the same color if the level
is changed at that time. The hollow triangle
indicates what the trigger level is for the next valid
trigger.
The trigger level indicator is not shown if the
triggering channel is not displayed.
The zero volts level indicator is a color-coded label
that is positioned vertically on the grid.
Change the zero level by using the front panel
OFFSET knob in the VERTICAL control area. Rotate
this knob to adjust, or push to set to zero volts.
Push again to toggle back to the previous offset
setting.
Trigger Level Indicator
Zero Level Indicator
Page 25
922172-00 Rev A 17
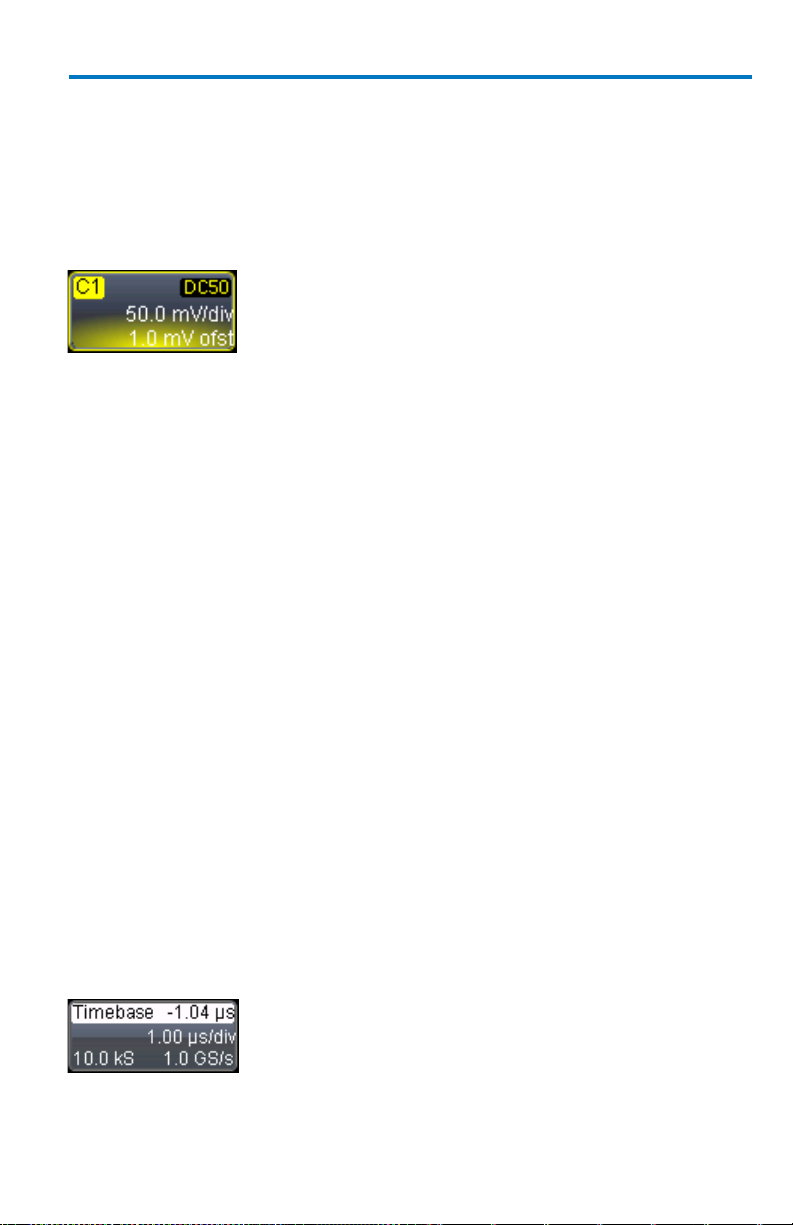
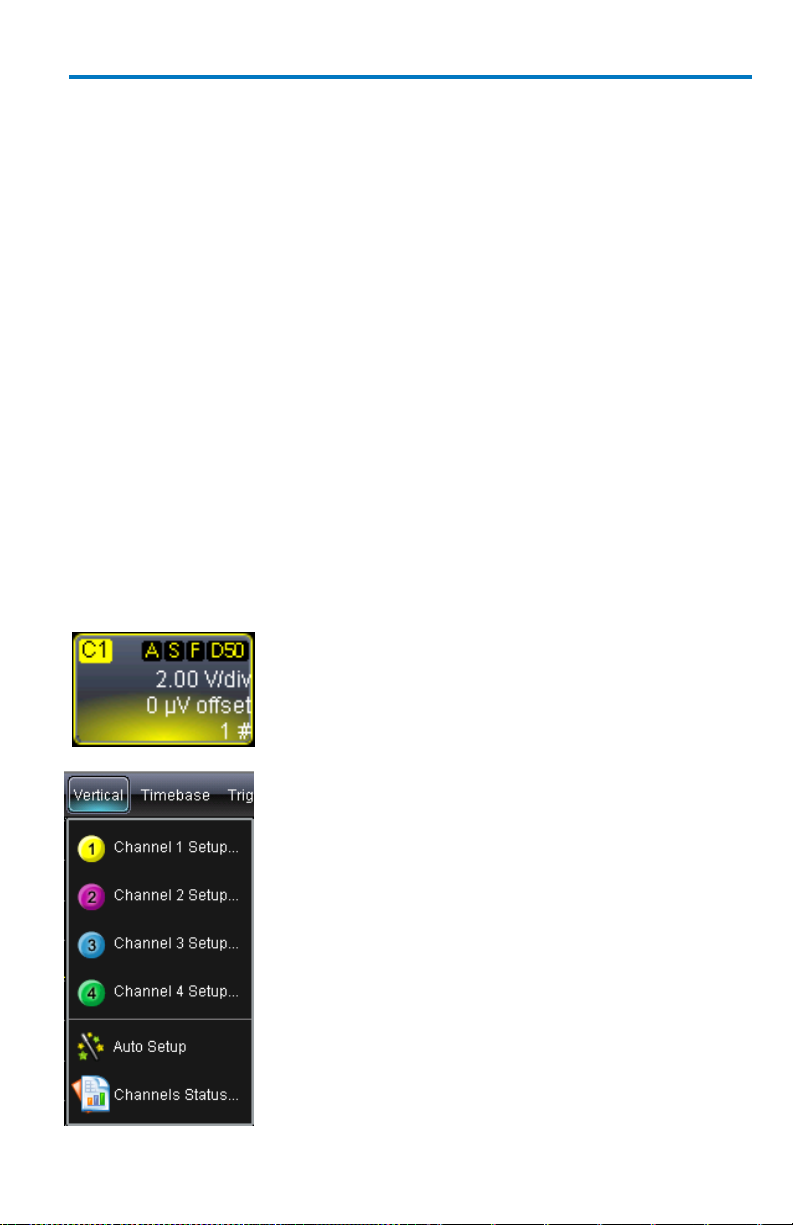
Descriptor Labels
Channel trace labels show the vertical settings for
the signal. The title bar (colored area) of the label
shows the channel number on the far left.
Other information is indicated on the title bar, as
follows:
Coupling (AC 1M, DC 1M, DC 50, GND)
Deskew (DSQ) set to non-zero value
Bandwidth Limiting (BWL) ON
Averaging (AVG) ON
Interpolation
Inversion
Probe attenuation
Enhanced Resolution (ERES) ON
Some of these indicators may be abbreviated if
several are on at one time.
Touch a channel descriptor label once to make the
front panel vertical controls active for that channel.
Touch it again to open the software dialog for
further adjustment.
If cursors are ON, cursor information for this channel
appears on this trace label.
The title bar of the TimeBase (Horizontal) label
shows the trigger delay setting at the far right. Time
per division, sample rate, and number of samples
are indicated below the title bar.
Information is contained in rectangular boxes called descriptor labels.
These labels contain status information, and also act as shortcuts to the full
dialog when you touch them. Channel descriptor labels are displayed only
for channels that are turned on. Timebase and trigger descriptor labels are
always displayed.
Getting Started Manual
Page 26

WaveSurfer MXs-B Oscilloscopes
18 922172-00 Rev A
Touch the timebase descriptor label once to open
the software dialog for further adjustment.
The title bar of the Trigger label shows the triggered
channel and the trigger coupling at the far right.
Trigger mode (Stopped), trigger type (Edge), level (0
mV), and slope (Positive) are indicated below the
title bar.
Touch the trigger descriptor label once to open the
software dialog for further adjustment.
Descriptor labels are also displayed for the math trace, zoom traces, and
memory (reference waveform) traces. These descriptor labels are only
displayed when their traces are turned ON.
Message Bar
At the bottom of the oscilloscope display is a narrow message bar. The
current date and time are displayed at the far right. Status, error, or other
messages are also shown in this area.
Alternative Access Methods
The front panel and display controls provide the most common ways to
access your oscilloscope’s capability. However, the instrument often gives
you more than one way to access dialogs and to make changes.
Top Menu Bar
If you prefer to drive the oscilloscope with the familiarity of Windows, you
might prefer to access dialogs from the menu bar at the top of the display.
This opens dialog boxes at the bottom of the screen, where adjustments
can be made.
The dialog area occupies the bottom one-third of the display. Expand the
signal display area by minimizing each dialog by touching the Close tab at
the right of the dialog box.
In some limited cases, the menu bar is the only way to access certain
functionality, but generally speaking, the most common oscilloscope
functionality can be controlled from the front panel.
Page 27
Getting Started Manual
922172-00 Rev A 19
Mouse and Keyboard Operation
In the procedures, we focus on using the front panel for common
operations, and the touch screen for making selections. But, if you have a
mouse connected to the instrument, you can click on objects instead of
touching them. Likewise, if you have a keyboard connected, you can use it
to enter data instead of using the virtual keyboard provided by the
instrument.
Turning on Channels and Traces
Connect a signal to a channel (we’ll assume you connected to channel 1 in
this example and that the channel was not already ON).
Press the channel 1 button on the front panel to turn on channel 1. The
button lights and the descriptor label for that channel are shown.
If the signal is not on the grid, press the AUTO trigger button and adjust
Horizontal and Vertical front panel controls to adjust the settings and
display the signal, or simply press the AUTOSETUP button to quickly bring
most repetitive signals onto the grid.
If you need to change probe attenuation, coupling,
or bandwidth limiting, open the channel setup dialog
for channel 1 by touching the descriptor label for
channel 1. Press this button twice if it is not the
active trace.
Or, use the Vertical Channel 1 Setup selection
from the menu bar to open the channel 1 setup
dialog.
Page 28
WaveSurfer MXs-B Oscilloscopes
20 922172-00 Rev A
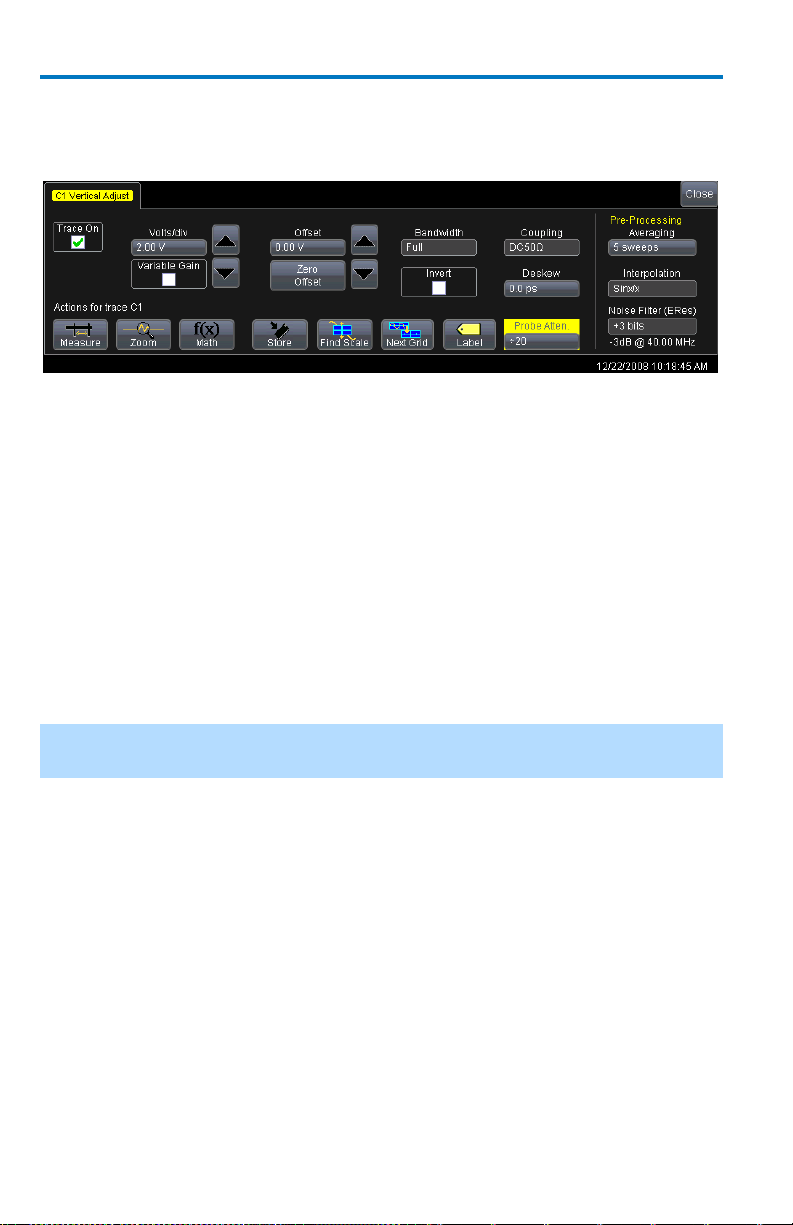
At this point, the following dialog is shown at the bottom of the display,
and the grid area shortens until this dialog is closed (by touching the Close
button on the upper right hand corner of this dialog).
Vertical Setup
Coupling
Coupling choices are as follows:
DC 50 Ω
GROUND
DC 1 MΩ
AC 1 MΩ
Select coupling by touching inside the Coupling field and choosing a
coupling mode from the pop-up menu.
NOTE: The coupling choices for a channel change if a ProBus probe is
connected to a channel.
Deskew
Deskew allows you to compensate for different lengths of cables, probes,
or anything else that might cause timing mismatches between signals.
Connect all probes to the desired channels, then probe a common signal
with each probe and adjust for timing differences using Deskew.
Probe Attenuation
If you use a Teledyne LeCroy ProBus compatible active probe, or a probe
compatible with Probe Ring, the attenuation is automatically set by the
oscilloscope. If it is not automatically set, select a value here by touching
inside the Probe Atten field selecting a value from the pop-up menu.
Page 29

Getting Started Manual
922172-00 Rev A 21
Bandwidth Limiting
You may sometimes want to limit high frequency noise on a very low
bandwidth input signal. If this is the case, you can limit the channel
bandwidth to less than the full bandwidth of the oscilloscope. Select a
different bandwidth by touching inside the Bandwidth field and selecting a
value from the pop-up menu.
Averaging Your Signal
The WaveSurfer MXs-B oscilloscope allows you the opportunity to
continuously average your signal to reduce signal noise and aid in signal
evaluation. If you want to use averaging, select a value here by touching
inside the Averaging field and entering a value up to 1 million sweeps on
the pop-up keypad.
Interpolation Settings
Linear interpolation, which inserts a straight line between sample points, is
best used to reconstruct straight-edged signals such as square waves.
(Sinx)/x interpolation, on the other hand, is suitable for reconstructing
curved or irregular wave shapes, especially when the sample rate is 3 to 5
times the system bandwidth.
Noise Filtering (ERES)
The instrument's enhanced resolution feature improves vertical resolution
by a fixed amount for each filter. This real increase in resolution occurs
whether or not the signal is noisy, or your signal is single-shot or repetitive.
The signal-to-noise ratio (SNR) improvement you gain is dependent on the
form of the noise in the original signal. The enhanced resolution filtering
decreases the bandwidth of the signal, filtering out some of the noise.
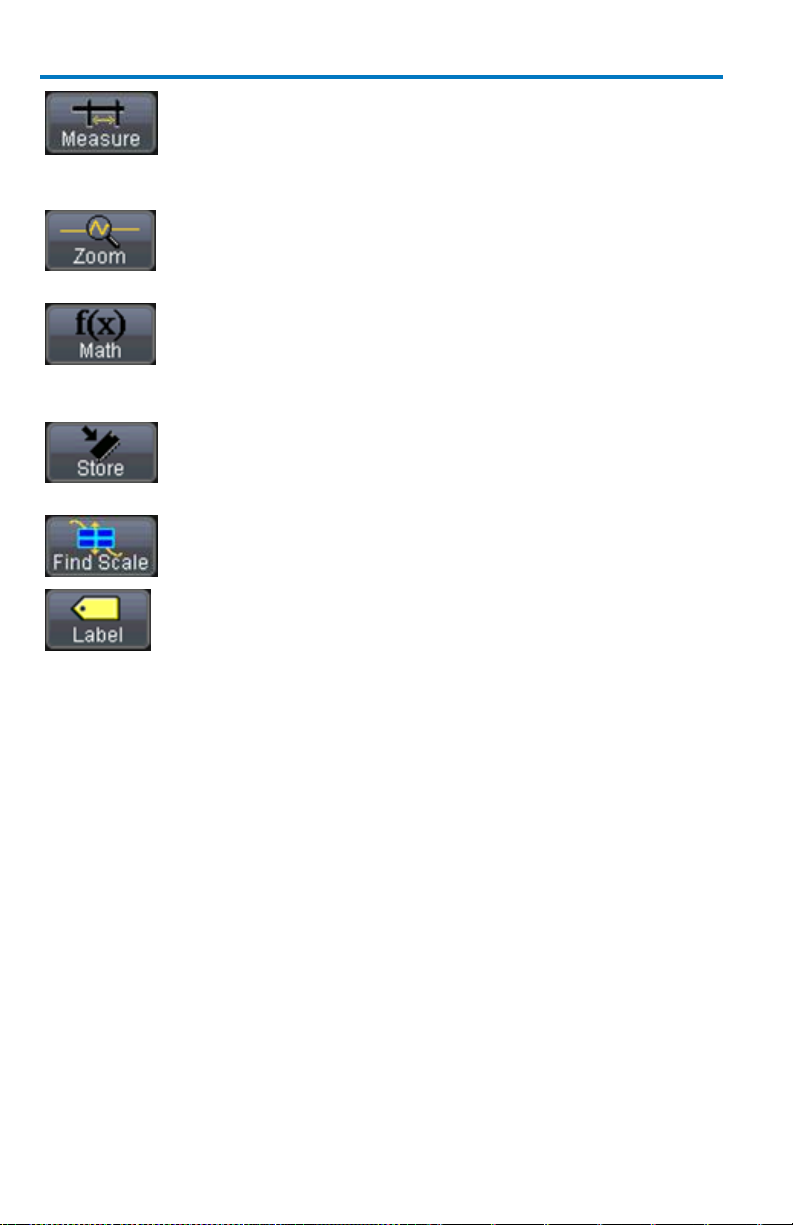
Using Shortcut Toolbar
These shortcut buttons can be used to perform specific actions for the
channel corresponding to the current setup dialog.
For more information on Measure, Zoom, Math, and Memories (Reference
Waveforms), refer to the section dealing with that subject.
Page 30
WaveSurfer MXs-B Oscilloscopes
22 922172-00 Rev A
Opens a Measurement selection pop-up menu. You can then
select up to 6 parameters (measurements) for the active
channel from this menu without leaving the Channel Setup
dialog. The parameter automatically appears below the grid.
Creates a zoom trace of the channel signal. The zoom trace
becomes active, and you can use the Vertical and Horizontal
controls to modify its scale and position.
Opens a Math selection pop-up menu. You can then select a
math function for the active channel from this menu without
leaving the Channel Setup dialog. The Math trace is then
displayed in its own grid.
Copies the channel trace into its corresponding Memory
(Reference Waveform) location. For instance, C1 is loaded
into M1, C2 is loaded into M2, etc.
Automatically performs a vertical scaling that fits the
waveform into the grid.
Opens a Labeling pop-up menu that allows user-defined
labels tied to the waveform.
TimeBase
Timebase Setup and Control
Set up the Timebase by using the front panel Horizontal controls or the
Timebase menu bar, trace descriptor label and dialog box.
1. Touch Timebase → Horizontal Setup on the menu bar. The
Timebase dialog is shown.
2. Touch inside the Time/Division data entry field and enter a value.
3. Touch inside the Delay data entry field and enter a value.
Page 31

Getting Started Manual
922172-00 Rev A 23
WaveStream Mode - This fast viewing mode provides
brightness-graded intensity with a decay time similar to the
action of phosphor on an analog screen. WaveStream mode
operates at up to 10 GS/s with an update rate up to 22,000
waveforms/second for better capture of higher frequency
abnormal events.
Real Time Mode - A single-shot (real time) acquisition is a
series of digitized voltage values sampled on the input signal
at a uniform rate.
Sequence Mode - In sequence mode, the complete waveform
consists of a number of fixed-size segments acquired in singleshot mode
Roll Mode - This mode is invoked automatically for slow
acquisitions when the time per division is 100 ms/div or
greater. Roll mode samples at 5 MS/s (depending on memory
availability).
RIS Mode - Random Interleaved Sampling is an acquisition
technique that allows effective sampling rates higher than the
maximum single-shot sampling rate. It is used on repetitive
waveforms with a stable trigger
Sampling Modes
Depending on your timebase, the following sampling modes are available:
Single-shot Sampling Mode
Basic Capture Technique
A single-shot acquisition is a series of digitized voltage values sampled on
the input signal at a uniform rate. It is also a series of measured data values
associated with a single trigger event. The acquisition is typically stopped a
defined number of samples after this event occurs: a number determined
by the selected trigger delay and measured by the timebase. The
waveform's horizontal position (and waveform display in general) is
determined using the trigger event as the definition of time zero.
You can choose either a pre- or post-trigger delay. Pre-trigger delay is the
time from the left-hand edge of the display grid forward to the trigger
Page 32

WaveSurfer MXs-B Oscilloscopes
24 922172-00 Rev A
event, while post-trigger delay is the time back to the event. You can
sample the waveform in a range starting well before the trigger event up to
the moment the event occurs. This is 100% pre-trigger, and it allows you to
see the waveform leading up to the point at which the trigger condition
was met and the trigger occurred. (The instrument offers up to the
maximum record length of points of pre-trigger information.) Post-trigger
delay, on the other hand, allows you to sample the waveform starting at
the equivalent of 10,000 divisions after the event occurred.
On fast timebase settings, the maximum single-shot sampling rate is used.
But for slower timebases, the sampling rate is decreased and the number
of data samples maintained.
The relationship between sample rate, memory, and time can be simply
defined as:
Capture Interval = 1/Sample Rate X Memory
and
Capture Interval/10 = Time Per Division
Sequence Sampling Mode – Working with
Segments
Using Sequence Mode, you can store up to 15,000 triggered events as
segments into the oscilloscope's memory. This is ideal when capturing
many fast pulses in quick succession or when capturing few events
separated by long time periods. The instrument can capture complicated
sequences of events over large time intervals in fine detail, while ignoring
the uninteresting periods between the events. You can also make time
measurements between events on selected segments using the full
precision of the acquisition timebase.
Sequence mode offers a number of unique capabilities:
You can acquire up to four channels simultaneously.
You can minimize dead time between trigger events for consecutive
segments.
You can view time stamps for acquisitions.
You can zoom segments or used them as input to math functions.
Page 33

Getting Started Manual
922172-00 Rev A 25
You can combine sequence mode with an advanced trigger to isolate
a rare event, capture all instances over hours or days, and
view/analyze each afterwards.
You can use Sequence mode in remote operation to take full
advantage of the instrument's high data-transfer capability.
In Sequence mode, the complete waveform consists of a number of fixedsize segments acquired in single-shot mode (see the instrument
specifications for the limits). The oscilloscope uses the sequence timebase
setting to determine the capture duration of each segment as 10 x
time/div. With this setting, the oscilloscope uses the desired number of
segments, maximum segment length, and total available memory to
determine the actual number of samples or segments, and time or points.
For more information on sequence sampling mode, see Working with
Sampling Modes.
How the instrument captures segments
Page 34

WaveSurfer MXs-B Oscilloscopes
26 922172-00 Rev A
RIS Sampling Mode - For Higher Sampling
Rates
RIS (Random Interleaved Sampling) is an acquisition technique that allows
effective sampling rates higher than the maximum single-shot sampling
rate. It is used on repetitive waveforms with a stable trigger. The maximum
effective RIS sampling rate is achieved by making multiple single-shot
acquisitions at maximum real-time sample rate. The bins thus acquired are
positioned approximately 20 ps (50 GS/s) apart. The process of acquiring
these bins and satisfying the time constraint is a random one. The relative
time between ADC sampling instants and the event trigger provides the
necessary variation.
The instrument requires multiple triggers to complete an acquisition. The
number depends on the sample rate: the higher the sample rate, the more
triggers are required. It then interleaves these segments (in the following
graphic) to provide a waveform covering a time interval that is a multiple of
the maximum single-shot sampling rate. However, the real-time interval
over which the instrument collects the waveform data is much longer, and
depends on the trigger rate and the amount of interleaving required.
Roll Mode
Roll mode displays, in real time, incoming points in single-shot acquisitions
that have a sufficiently low data rate. The oscilloscope rolls the incoming
data continuously across the screen until a trigger event is detected and
the acquisition is complete. The parameters or math functions connected
to each channel are updated every time the roll mode buffer is updated, as
if new data is available. This resets statistics on every step of Roll mode
that is valid because of new data.
Page 35

Getting Started Manual
922172-00 Rev A 27
WaveStream fast viewing mode provides
brightness-graded intensity with a decay time
similar to the action of phosphor on an analog
screen. WaveStream mode operates at up to 5
GS/s with an update rate up to 22,000
waveforms/second for better capture of higher
frequency abnormal events.
The INTENSITY knob adjusts the brightness of your
trace. Pushing the button toggles between
WaveStream fast-viewing mode and real-time
mode.
WaveStream Fast Viewing Mode / Intensity
Page 36

WaveSurfer MXs-B Oscilloscopes
28 922172-00 Rev A
Triggering
Overview
The oscilloscope uses many waveform capture techniques that trigger on
features and conditions that you define. These triggers fall into two major
categories:
Edge activated by basic waveform features or conditions such as a positive
or negative slope, and hold-off
SMART Trigger® sophisticated triggers that enable you to use basic or
complex conditions for triggering.
Use Edge Triggers for simple signals, and the SMART Triggers for signals
with rare features, like glitches.
This Getting Started Manual contains information on setting up the Edge
Trigger. Reference the online Help for information on setting up and using
SMART Triggers.
Trigger Terms
Trigger Delay - the amount of time that the oscilloscope trigger is
adjusted from a zero value. You can adjust the oscilloscope’s
trigger position from 0-100% pre-trigger (left to right on the grid),
or from 0-10,000 divisions (in time units) of post-trigger.
Coupling – the type of signal coupling at the input of the trigger
source: AC, DC, LFREJ, HFREJ
Page 37

Getting Started Manual
922172-00 Rev A 29
The trigger delay Indicator is a color-coded
triangle that is positioned horizontally on the grid.
Trigger delay horizontally positions the
oscilloscope trace on the display so you can
observe the signal prior to the trigger time. Delay
adjusts the pre- and post-trigger time. Pre-trigger
delay is adjustable from 0-100%
Post-trigger delay is indicated by a color-coded
arrow pointing to the left. Post-trigger delay is
adjustable from 0-10,000 divisions (calculated in
time)
All trigger delay values (including post-trigger
delay, shown here) are displayed in the Timebase
Descriptor Label.
Level – the threshold at which the trigger will occur, specified in
volts.
Slope – the direction of the trigger voltage transition used for
generating a particular trigger.
Trigger Setup
Trigger Delay
Zero delay is the horizontal center of the oscilloscope display.
Change trigger delay by using the DELAY front panel knob in the
HORIZONTAL control area. Rotate the knob to adjust, or push to zero.
Page 38

WaveSurfer MXs-B Oscilloscopes
30 922172-00 Rev A
The trigger level indicator is a color-coded triangle
that is positioned vertically on the grid.
In Stop trigger mode, the solid triangle also appears
with a hollow triangle of the same color if the level
is changed at that time. The hollow triangle
indicates what the trigger level is for the next valid
trigger.
NOTE: The Trigger Level indicator is not shown if the
triggered channel is not displayed.
Change trigger level using the front panel knob in
the Trigger Control area. Rotate the knob to adjust,
or push to set to 50% of the signal level.
Trigger Level Indicator
Trigger level is specified in volts and remains unchanged when you change
the vertical gain settings or offset.
The amplitude and range of the trigger level are limited as follows:
± 4.1 screen divisions with a channel as the trigger source
± 0.5 V with EXT as the trigger source
± 5 V with EXT/10 as the trigger source
None with LINE as the trigger source (zero crossing is used).
Edge Trigger Set Up
1. Touch the trigger descriptor label at the bottom right of the
display.
Or, touch Trigger Trigger Setup on the menu bar.
The following dialog appears at the bottom of the display.
Page 39

Getting Started Manual
922172-00 Rev A 31
2. Touch inside the Source field in the Setup section and select an
input from the pop-up menu:
C1 through C4 are abbreviations for Channel 1 through Channel 4.
Ext and Ext/10 allow triggering on the External Input of the
oscilloscope. Ext input is +/-0.5V. Ext/10 input is+/-5.0V.
Line is for triggering on the Positive or Negative excursion of the AC
power line (not available when using battery or DC input power).
3. Select a trigger coupling from the Coupling section. Coupling refers
to the type of signal coupling at the input of the trigger circuit. You
can choose from these coupling types:
DC - All the signal’s frequency components are coupled to the trigger
circuit for high frequency bursts or where the use of AC coupling
would shift the effective trigger level.
AC - The signal is capacitively coupled. DC levels are rejected, and
frequencies below 50 Hz are attenuated.
LFREJ - The signal is coupled through a capacitive high-pass filter
network, DC is rejected and signal frequencies below 50 kHz are
attenuated. For stable triggering on medium to high frequency
signals.
HFREJ - Signals are DC coupled to the trigger circuit, and a low-pass
filter network attenuates frequencies above 50 kHz (which is used for
triggering on low frequencies).
4. Change the trigger Level by adjusting the front panel trigger level
knob.
Page 40

WaveSurfer MXs-B Oscilloscopes
32 922172-00 Rev A
5. Select a trigger Slope from the Slope section:
Positive and Negative slope refers to the voltage change direction for
triggering.
Window defines a region whose boundaries extend above and below
the selected trigger level. A trigger event occurs when the signal
leaves this window region in either direction and passes into the
upper or lower region (as follows). The next trigger occurs when the
signal passes into the window region.
Either – Use this selection to trigger when positive or negative
voltage change directions occur.
Explanation of Window trigger operation
Trigger Holdoff
Holdoff is an optional, additional condition of Edge trigger. It can be set
either as a period of time or as an event count. Holdoff disables the trigger
circuit for a given period of time or events after the last trigger occurred.
Events are the number of occasions on which the trigger condition is met.
The trigger occurs again when the holdoff elapses and the edge trigger’s
other conditions (for level, slope, etc.) are met.
Use holdoff to obtain a stable trigger on complex, but repetitive,
waveforms. For example, if there is a signal with multiple edges prior to the
edge you wish to trigger on, you could set the holdoff to equal the number
of edges preceding the desired triggering edge.
Refer to the Online Help for more information about holdoff setup.
Page 41

922172-00 Rev A 33
Basic Triggers
Edge
Use Edge trigger for simple, repetitive signals. This trigger is
activated by basic waveform features or conditions such as a
positive or negative slope, and hold-off
Width
Width trigger allows you to define a positive or negative-going
pulse width bounded by a voltage level, above or below which a
trigger occurs. Or, you can specify a pulse width and voltage
range, within or outside of which a trigger occurs.
Qualified
The Qualified (A-B) trigger allows arming of the trigger on Event
A and triggering on Event B. If the arming event is a Pattern that
occurs once (Pattern) or that occurs and stays satisfied
(PatState), then the triggering event can be an Edge, Width,
Glitch, or Interval condition. This functionality is identical to
Teledyne LeCroy's previous Qualify and State triggers, but
presented in a different UI.
Pattern
Pattern trigger enables triggering on a logical combination
(pattern) of five inputs: CH1, CH2, CH3, CH4, and EXT. You have a
choice of four Boolean operators (AND, NAND, OR, NOR), and
you can stipulate the high or low voltage logic level for each
input independently.
NOTE: When used with an optional Mixed Signal module the
pattern trigger supports 18 or 36 digital channels along with the
analog oscilloscope channels.
TV TV triggers provide stable triggering on standard or custom
composite video signals. Use them on PAL, SECAM, or NTSC
systems. Support for HDTV triggering on 1080i, 1080p, and 720p
formats is included. Use CUSTOM setup for other standards.
Serial
Serial trigger allows a serial trigger condition to be set from
within the oscilloscope, using an easy-to-understand interface.
NOTE: Teledyne LeCroy offers a wide range of optional serial
data triggering capabilities for serial data standards like I2C, SPI,
UART, CAN, LIN, FlexRay, MIL-STD-1553, ARINC 429, MIPI D-PHY,
DigRF, USB, and I2S.
Getting Started Manual
Page 42

WaveSurfer MXs-B Oscilloscopes
34 922172-00 Rev A
Glitch
Glitch trigger is a simpler form of Width trigger. Use Glitch trigger
for defining only fixed pulse-width times or time ranges. Glitch
trigger makes no provision for voltage levels or ranges.
Interval
While Glitch trigger performs over the width of a pulse, Interval
trigger performs over the width of an interval: the signal duration
(the period) separating two consecutive edges of the same
polarity (positive to positive or negative to negative). Use interval
trigger to capture intervals falling short of or exceeding a given
time limit. In addition, you can define a width range to capture
any interval that is itself inside or outside the specified range, i.e.
it can be used as an Exclusion trigger by interval.
Dropout
Used primarily in single-shot applications, and usually with a pretrigger delay, Dropout trigger can detect lost signals. The trigger
is generated at the end of the timeout period following the last
trigger source transition. You can select a timeout period from
2 ns to 20 s,
Runt
The runt trigger is programmed to occur when a pulse crosses a
first threshold line and fails to cross a second threshold line
before recrossing the first. You can select both voltage thresholds
within a time range of 100 ps to 20 s. Other defining conditions
for this trigger are the edge (triggers on the slope opposite to
that selected) and runt width.
Slew
Rate
Slew rate trigger activates a trigger when the rising or falling edge
of a pulse crosses two threshold levels: an upper level and a
lower level. The pulse edge must cross the thresholds faster or
slower than a selected period of time. You can select both
thresholds within a range of 2 ns to 20 s.
SMART Triggers
SMART Triggers are as follows:
Page 43

Getting Started Manual
922172-00 Rev A 35
Serial Trigger and Decode (Optional)
Optional WaveSurfer MXs-B capabilities support triggering and decoding of
many serial data protocols. Please refer to the Teledyne LeCroy website for
a list of supported standards.
The serial triggers are integrated into the oscilloscope. All serial triggers
are selected through the normal oscilloscope trigger menus. Serial data
signals are input to the oscilloscope through probes.
Decoding is accessed from the Analysis pull-down menu in the menu bar.
The decoding is overlaid on top of the appropriate channel, and is
intuitively presented and color-coded for quick understanding. Included is a
Search capability for specific messages and a table to display protocol data
in summary form underneath the oscilloscope grid.
Accessing Serial Decode Triggers
Serial triggers can be accessed in two ways:
Touch the Trigger Descriptor Box in the lower right hand corner of the
oscilloscope display.
OR
Touch Trigger → Trigger Setup from the Menu Bar. On the Trigger dialog,
touch Serial on the Type section.
Select the appropriate serial trigger. The menu automatically changes to a
different tab in the Trigger dialog reflecting the selected standard.
Page 44

WaveSurfer MXs-B Oscilloscopes
36 922172-00 Rev A
Touch Analysis Serial Decode... from the
menu bar.
The Serial Decode summary dialog is shown
and provides access to Decode Setup.
Touch the Channel or Memory Descriptor Box
to open the respective dialog box, and touch
the Decode button in the bottom toolbar.
Touch a Channel, Memory, or Math trace to
open a pop-up dialog that displays a shortcut
to the Decode Setup dialog box
Serial Decode and Decode Setup
These dialogs provide the ability to set the oscilloscope up for protocol
decoding of serial data messages, with display of the protocol data overlaid
on the signal. They also allow quick and easy access to oscilloscope
zooming, searching, table display, and table export.
The serial decode and decode setup dialogs are accessed in any of the
following ways:
Please refer to the Low Speed Serial Data Trigger manual or the Online
Help on your oscilloscope for Serial Trigger information and details.
Page 45

Getting Started Manual
922172-00 Rev A 37
Grid
Combination
Buttons
Touch one of the Grid combination buttons (for example, Single,
XY, XYSingle). Autogrid automatically adds or deletes grids as
you select more or fewer waveforms to display.
Grid
Touch inside the Grid Intensity data entry field to choose the
intensity.
Touch the Axis labels checkbox to permanently display the
values of the top and bottom grid lines (calculated from volts/div)
and the extreme left and right grid lines (calculated from the
timebase).
Trace
Choose a line style for your trace: solid Line or Points.
Viewing Waveforms
Display Setup
NOTE: Not all grid styles are available on all instruments.
To set up your display, touch Display →Display Setup on the menu bar.
Zooming your Channels
Teledyne LeCroy offers extremely powerful, yet simple to use, zooming
capability in the WaveSurfer MXs-B oscilloscope. The large, bright 10.4”
display with touch screen lends itself very well to quickly creating zooms,
and seeing how they relate to the original channels.
There are a number of different ways to zoom in a WaveSurfer MXs-B
oscilloscope:
Drawing a box around the zoom area, using either your finger or a
mouse/pointing tool.
Using the front panel QuickZoom button.
Using the software toolbar Zoom button in the Channel dialog.
The operating behavior for all three methods is basically the same, with
some minor differences.
Page 46

WaveSurfer MXs-B Oscilloscopes
38 922172-00 Rev A
You can draw a box around the area that you wish
to zoom simply by dragging your finger, stylus, or
mouse pointer around the area of the waveform or
waveforms that you want to zoom. Zoom traces are
created instantly in a separate grid.
UNDO your zoom by touching the UNDO button in
the upper-right corner of the display.
You can also use touch screen zoom to change the
zoom scale of an existing Zoom, Math, or Memory
(reference waveform) trace.
When you zoom a waveform by this method, a
representation of the zoom area appears in a
thumbnail Preview in the Zx dialog (lower-right).
In all cases, the zoomed channels are displayed in a separate half-height
grid at the bottom of the display (separate from the channels). If you also
have a Math trace showing when you zoom, three grids are then shown on
the display, each at one-third height.
Comparison is made easy as the zoomed traces are nearly the same color
as the original channel traces. The zoomed area is shown in white on the
original channel trace. All zooms share a common horizontal zoom scale
and position. Each zoom has an independent vertical zoom capability. All
zooms are calculated to 16-bit vertical resolution. Therefore, you can
vertically scale the zoom traces and still maintain very high resolution when
viewing signal detail.
Creating Zooms
There are three ways to create zooms of your channels.
TOUCH SCREEN ZOOMING
Page 47

922172-00 Rev A 39
FRONT PANEL QUICKZOOM BUTTON
Individually turn off a Zoom trace by touching the Zoom
descriptor label, open the Zoom trace dialog, and then
uncheck the ON checkbox.
UNDO your zoom at any time by pressing the front panel
QuickZoom button again.
NOTE: A Zoom is not automatically created for channels
turned ON after QuickZoom is displayed.
Press the toolbar Zoom button in the Cx Vertical Adjust
dialog for the channel trace you want to zoom. A Zoom
trace is created for the selected channel.
UNDO your zoom by pressing the Undo button in the upperright corner of the display, or pressing the front panel
QuickZoom button again.
Getting Started Manual
TOOLBAR ZOOM
Page 48

WaveSurfer MXs-B Oscilloscopes
40 922172-00 Rev A
Zoom Descriptor Label
When a Zoom trace is ON, there is a descriptor label on
the display for it, much like for the channels, math
trace, and memories (reference waveforms).
The top line contains information about the Zoom
trace (in this case, it’s a Zoom of Channel 1).
The 2
The 3
If the descriptor label appears to have a spotlight on it
from below (shown right), the Zoom trace is ACTIVE,
which means that the Horizontal and Vertical front
panel controls are set to adjust that specific zoom
trace, and not any of the channels. In this case, the scale and position of
the Zoom trace can be changed by adjusting the horizontal and vertical
controls on the front panel.
NOTE: The Horizontal scales and position is the same for all Zoom traces,
but Vertical scale and position can be adjusted individually.
If the Zoom trace is inactive, and you wish to make it active, simply touch
the descriptor label once and it becomes active. This also opens the Zoom
trace dialog.
nd
line contains vertical scaling information.
rd
line contains horizontal scaling information.
NOTE: When a Zoom trace is active, no channel buttons are lit. This
indicates that a Zoom trace may be currently active.
Adjusting Zoom Scale and Position
USING FRONT PANEL CONTROLS
It is easy to adjust your Zoom trace’s scale and position. The WaveSurfer
MXs-B oscilloscope multiplexes the Vertical and Horizontal Front Panel
controls to control the zoom scale and position. This is done automatically
after you have created the zoom trace, and remains this way until you
make a Channel, Math trace, or Memory (reference waveform) active.
If the Zoom trace you wish to adjust is not active, touch
the descriptor label once to make it active.
Page 49

922172-00 Rev A 41
Then, use the front panel horizontal and
Panel Control
Zoom Control Action
Delay
Zooms horizontal position
Timebase
Zooms horizontal scale
Offset
Zooms vertical position
Gain / Sensitivity
Zooms vertical scale
Push – Zero Delay
Resets horizontal zoom to 10:1 scale, and resets
to default horizontal position
Push – Zero Offset
Resets vertical zoom to 1:1 scale, and resets to
default vertical position
vertical controls to adjust position and scale.
The operation of the knobs feels natural. Use
the following table as a guide.
NOTE: When a Zoom trace is active, no channel
buttons are lit. This indicates that a Zoom trace
may be currently active.
Using Zoom Dialog Controls
You can also use the Zoom dialog controls to adjust
zoom. Touch the descriptor label to open the Zoom
dialog.
Getting Started Manual
Then use the on-screen zoom controls to change the horizontal and vertical
position and scale.
Horizontal scale adjustments always apply to all waveforms.
Page 50

WaveSurfer MXs-B Oscilloscopes
42 922172-00 Rev A
Opens a Measurement selection pop-up menu. You can then
select a parameter (measurement) for the Zoom trace from
this menu without leaving the Zoom Setup dialog. The
parameter automatically appears below the grid.
Loads the Zoom trace into its corresponding Memory
(Reference Waveform) location (for instance, Z1 is stored
into M1; Z2 is stored into M2, etc.).
Opens a Labeling pop-up menu that allows you to create
labels tied into the waveform.
Using Toolbar Shortcuts
These toolbar shortcuts can be used to perform specific actions for each
Zoom trace.
Analyzing Waveforms
Measuring with Cursors
Overview
Cursors are important tools that help when measuring signal values.
Cursors can be moved around on the waveform to identify specific voltage
and time values on the waveform. Use cursors to make fast, accurate
measurements and to eliminate guesswork.
The cursor controls contain two dedicated cursor knobs and a Type button.
The Type button turns cursors ON (if they are not already ON), then toggles
between Horizontal (Time) cursors, Vertical (Amplitude) cursors, and OFF.
If an FFT Math trace is ON, a Horizontal (Frequency) selection is added to
the toggle list.
When cursors are ON, they provide measurements for every waveform
displayed. The lone exception is when a Math FFT is ON, which requires a
selection of Horizontal (Frequency) for cursors to be placed on that
waveform. Place cursors on a Zoom waveform by moving the cursors into
the zoom portion of the original channel signal.
Page 51

922172-00 Rev A 43
Turning On Cursors
Cursors automatically turn on when either knob is rotated.
Or, you can press the TYPE button to turn cursors ON, and
then toggle through the various cursor types.
Cursor Types
Horizontal (Time)
Horizontal (Time) cursors are moved left and right along
the waveform. Place them at a desired location along
the time axis to read the signal’s time and amplitude
information at the selected location.
Getting Started Manual
Vertical (Amplitude)
Vertical cursors are lines that you move up and
down on the grid to measure the amplitude of a
signal.
Page 52

WaveSurfer MXs-B Oscilloscopes
44 922172-00 Rev A
Horizontal (Frequency)
Horizontal (Frequency) cursors are moved left and right
along the FFT Math trace. Place them at a desired
location along the frequency axis to read the signal’s
frequency and amplitude at the selected location.
Changing Cursor Type
Pressing the Type button between the cursor knobs
toggles the Cursors from one type to another, and
ultimately to OFF, without requiring a cursor setup
dialog to be opened.
Tracking Cursors
Lock the cursors together by checking the Track
checkbox on the Cursors dialog (Cursors Cursor
Setup… from menu bar).
This sets the cursors to move in unison while adjusting
their position.
Page 53

Getting Started Manual
922172-00 Rev A 45
Reading Cursor Information
Cursor information is displayed in two different places on the WaveSurfer
MXs-B oscilloscope display.
Descriptor Labels
The Descriptor Labels for Channels, Math, Zoom, and
Memory traces contain both absolute and relative
amplitude (voltage) cursor information.
Cursor Table
The cursor table underneath the Timebase
and Trigger descriptor labels appears when
Horizontal (Time) or Horizontal (Frequency) cursors are turned on. This
table contains the common absolute and relative information for the two
cursors, and frequency information (if Horizontal cursors are selected).
If the display is in XY Mode, XY cursor information is shown underneath the
XY display.
Page 54

WaveSurfer MXs-B Oscilloscopes
46 922172-00 Rev A
Measuring with Parameters
Overview
Parameters are pre-programmed measurements that eliminate the need to
set up cursors for standardized measurements, like rise time, fall time,
peak-peak amplitude, etc. Use them to automatically calculate many
attributes of your waveform. You can make common measurements on
one or more waveforms, and display up to six parameter measurements at
one time. You can also display statistics for your measurements, or apply
gating to the measurement area.
The WaveSurfer MXs-B oscilloscope uses pre-defined algorithms to
determine the top, base, 10% level, etc. of the waveform in order to make
automatic measurements. These algorithms are in accordance with IEEE
standards.
If, for some reason, a parameter is unable to be calculated correctly, a
warning symbol is shown underneath the measurement. This indicates to
proceed with caution.
In the WaveSurfer MXs-B oscilloscope, some parameter measurements
(like Mean) produce a single value for all the data between the measure
gates. Others (like Rise Time) are always calculated for every value in an
acquisition. However, the value displayed is always the last value in the
acquisition. Use statistics if you desire more information about the
distribution of measurements in the acquisition.
Setting Up Parameter(s)
1. Press the Measure front panel button
Or, select Measure Measure Setup from the menu bar.
The following dialog is then shown on the lower display.
Page 55

Getting Started Manual
922172-00 Rev A 47
2. The default status has parameters turned OFF, and all are
undefined (None). Touch either the icon or touch in the None area
to show the Select Measurement dialog:
3. Touch any of the icons to select the desired measurement. Scroll
down through the list using the slider bar on the right side of the
pop-up menu.
Once the parameter is selected, it appears on the display
underneath the grid, as follows:
Page 56

WaveSurfer MXs-B Oscilloscopes
48 922172-00 Rev A
4. The channel source defaults to C1. Touch inside the Source field to
select a different source (a channel, a math function, a memory, or
a zoom).
5. Add additional parameter measurements to the display by
selecting other parameters (labeled as P1 through P6) as previously
described.
6. Close the measure dialog by either pressing the front panel
Measure button again, or touching Close on the on-screen dialog.
Understanding Parameter Displays
The Parameter Display Format
Understanding the information in the parameter displays is easy. The
following table explains what each abbreviation means, following the
parameter display from left to right, and top to bottom.
Page 57

Getting Started Manual
922172-00 Rev A 49
P1, P2,
P3, P4,
P5, P6
The number of the parameter measurement. P means Parameter.
Each parameter is uniquely identified.
Name
In the example in step 3 (above), max is the parameter name, short
for maximum. A brief definition of each parameter is included in the
measurement selection dialog box.
(source)
The source can be a channel (Cx), a zoom trace (Zx), a math trace
(Math), or a memory (reference waveform) (Mx)
value
The last measured value in the acquisition.
status
An indication of whether the parameter was calculated correctly. A
green check mark means that the measurement was performed
correctly. Reference the following table for information on other status
symbols.
A green check mark means the oscilloscope is returning a valid
value.
A crossed-out pulse means the oscilloscope is unable to
determine top and base. However, the measurement could still
be valid.
A downward pointing arrow indicates an underflow condition
(signal below the grid area).
An upward pointing arrow indicates an overflow condition
(signal above the grid area).
An upward-and-downward pointing arrow indicates an
underflow and overflow condition (signal below and above the
grid area).
The format is Px:Name(source) with value and status contained as follows:
Status Symbols
Below each parameter appears a symbol that indicates the status of the
parameter, as follows:
Page 58

WaveSurfer MXs-B Oscilloscopes
50 922172-00 Rev A
Sometimes you might want a parameter measurement on a
specific portion of your signal, and ignore all other portions.
When this is the case, you can use Measure Gate. Measure
Gate is controlled in the Measure dialog, and is set in grid
divisions.
Set the gate by touching the Start field to highlight the
control (shows in yellow), and then use the adjust knob to
dial the location of the start gate. Repeat the same process
for the Stop gate. Measure gates remain on the display
provided the Start gate is not equal to 0 divisions, and the
Stop gate is not equal to 10 divisions.
View measurement statistics by checking the box next to On
under Statistics in the Measure dialog.
If a measurement is displayed, statistics are also shown (as
follows).
Parameter Gates (Windows)
Measurement Statistics
After you add a parameter measurement, you can look at statistics of that
parameter measurement, and acquire an understanding of how that
measurement changes with time.
Statistics accrue with each additional trigger until pressing Clear Sweeps
(either on the front panel or in the Measure dialog), or changing a control
(e.g. Volts/Div).
Most statistical values (mean, minimum, max, standard deviation) are selfexplanatory. Num is the number of measurements in the statistical sample.
Value and Status are defined in Understanding Parameter Displays
(previous).
Page 59

Getting Started Manual
922172-00 Rev A 51
Histicons are miniature histograms of parameter
measurements that appear below the grid. These
thumbnail histograms let you see at a glance the
statistical distribution of each parameter.
Viewing Thumbnail Histograms
Turning Off Parameters
You can turn all parameters OFF by touching the Turn All Off button in the
Measure dialog. This also redefines all the parameter definitions to NONE.
WaveScan™ Advanced Search and
Analysis
Introduction to WaveScan
WaveScan enables you to search for unusual events in a single capture, or
to scan for an event in many acquisitions over a long period of time. You
can select from more than 20 search modes (frequency, rise time, runt,
duty cycle, etc.), apply a search condition (slope, level, threshold,
hysteresis), and begin scanning in a post-acquisition environment. Since the
scanning modes are not simply copies of the hardware triggers, but
"software triggers," the capability is much greater.
For instance, there is no “frequency” trigger in any oscilloscope, yet
WaveScan allows frequency to be quickly scanned for. You can accumulate
a data set of unusual events that are separated by hours or days, enabling
faster debugging. The events are time stamped and indexed in a table from
which you can select them for viewing individually.
You can also set actions to occur automatically when unusual events are
found: stop the acquisition, emit an audible beep, output a pulse, print the
screen, or save the waveform.
Page 60

WaveSurfer MXs-B Oscilloscopes
52 922172-00 Rev A
Signal Views
WaveScan provides distinct views of your signal:
Source view highlights all occurrences of edges that meet your
criteria.
Zoom view allows you to expand a waveform feature vertically and
horizontally; to apply further processing; to store it, or to apply a
descriptive label to the feature.
NOTE: The number of grids displayed varies from depending on which
views are enabled. WaveScan handles this function automatically
Search Modes
Search modes are used to locate anomalies during acquisition.
Edge - for detecting the occurrence of edges; selectable slope and
level
Non-monotonic - for detecting threshold re-crosses; selectable
slope, hysteresis, and level
Runt - for detecting pulses that fail to cross a threshold; selectable
polarity and thresholds
Measurement - for filtering and performing parameter
measurements
Page 61

Getting Started Manual
922172-00 Rev A 53
Parameter Measurements
Besides parameter measurements made during acquisition, postacquisition measurements can also be made. The number of parameters
available depends on the options loaded on your instrument.
Measurements are made only on the events defined by your filter (search
criteria). A Filter Wizard is provided to quickly establish statistical criteria
such as ±1, 3, or 5 sigma.
Sampling Mode
Whenever WaveScan is enabled, the instrument reverts to Real-time
sampling mode.
SOURCE VIEW
The top trace on the screen is the source (channel, math, memory) trace.
This trace shows all captured edges and highlights those that fit your search
criteria. For example, in this figure we are searching for slow rising edges
that fall outside a time window:
In this acquisition, WaveScan has located eleven edges that fit the search
criteria (filter) of greater than 1.2 ns with a delta of 50 ps. Each of the
found edges is highlighted with a red rectangle, and indexed to a table
entry at left. Rise time values are also included in the table.
Level Markers
Markers are provided on the source trace to show measurement criteria
such as level and thresholds. In the example above, the level markers
indicate 10% and 90% for the standard Rise Time parameter measurement.
Level markers are displayed only while the scope is in WaveScan mode.
Once the WaveScan Enable checkbox is unchecked, the level markers
disappear.
Page 62

WaveSurfer MXs-B Oscilloscopes
54 922172-00 Rev A
Zoom View
An individual edge can be zoomed by selecting it from the table of found
events at the left of the screen. You can also scroll through the table using
the Prev/Next scroll buttons in the Search dialog, or select an event by
touching inside the Idx field and entering an index number, using the popup keypad.
Front panel ZOOM controls can be used to vary the magnification and
position of the zoomed trace. Or, you can use the on-screen In/Outbuttons.
In Zoom View, you can also apply further processing, store, or apply a
descriptive label to the zoom trace.
Page 63

Getting Started Manual
922172-00 Rev A 55
Edge Mode
This search mode locates all edges in an acquisition and presents them
time-stamped in a table. You can select positive, negative, or both edges.
When the acquisition is stopped, scan filters contained in Measurements
mode can be applied to the edges to find specific characteristics.
A level marker, corresponding to 50% in this case, is displayed in the source
trace at top.
As with other search modes, a trigger action can be set for Edge mode also.
Non-monotonic Mode
The Non-monotonic search mode looks for edges that cross a threshold
more than once between high and low levels. All events that meet the
criteria of slope, hysteresis, and level are presented in a table and
highlighted in the source trace. The value displayed in the table is the
difference of the max. and min. of the non-monotonicity.
This can be confirmed with cursors:
Page 64

WaveSurfer MXs-B Oscilloscopes
56 922172-00 Rev A
The hysteresis value is used to eliminate noise. A non-monotonicity is
detected only when its amplitude is greater than the hysteresis. Therefore,
when setting a hysteresis level, set a value that is greater than the
amplitude of the noise.
Runt Mode
This search mode looks for pulses that fail to transit a given region. You can
search for positive-going or negative-going runts, or both. An adjustable
hysteresis band is provided to eliminate noise.
In the case of negative-going runt pulses, the value displayed in the table is
the difference (delta) of the high level of the signal and the runt amplitude,
i.e., where the runt bottoms out.
This can be confirmed by placing cursors on the runt pulse and reading the
delta Y value in the trace labels:
Page 65

Getting Started Manual
922172-00 Rev A 57
In the case of positive-going runt pulses, the value displayed in the table is
the absolute value of the amplitude of the runt pulse:
Page 66

WaveSurfer MXs-B Oscilloscopes
58 922172-00 Rev A
Measurement Mode
This search and scan mode lets you apply filters to your acquisitions to
highlight only the features of interest. Post-acquisition, you can apply other
filters to the acquisition, or make different parameter measurements on it.
For example, in this acquisition a Rise time (10-90%) parameter
measurement is applied to fast edges during acquisition. We are interested
only in edges with a rise time slower than 37 ns. Therefore, the Greater
Than filter method is selected, with a value of 37 ns; four edges pass during
acquisition:
Page 67

Getting Started Manual
922172-00 Rev A 59
SCAN FILTERS
But, now we want to look at fall times greater than 45.5 ns; 3 falling edges
from the same acquisition pass this new filter:
You can also decide how anomalous the features located should be by
using the Filter Wizard to select the average value as the limit, to search
for rarest events, or to apply statistical criteria.
FILTER WIZARD
You can decide how anomalous the features searched or scanned for
should be by using the average value as the limit, by searching for rarest
events, or by applying statistical criteria: ±1, 3, or 5 sigma.
In the following example, there were several slow edges in a repetitive
waveform. For each filtering method selectable from the wizard, the rise
time used as the filter limit and delta are calculated automatically.
Page 68

WaveSurfer MXs-B Oscilloscopes
60 922172-00 Rev A
FILTER METHODS
While the Filter Wizard provides a quick way to apply filtering criteria
automatically, the Filter Method menu and related fields let you manually
set up filtering criteria. And unlike the Filter Wizard selections, which are
restricted to absolute deltas, the Filter Method menu also offers deltas as
percentages:
Page 69

Getting Started Manual
922172-00 Rev A 61
Working with Sampling Modes
Sequence Mode Setup
When setting up Sequence Mode, you define the number of fixed-size
segments acquired in single-shot mode (see the instrument specifications
for the limits).
The oscilloscope uses the sequence timebase setting to determine the
capture duration of each segment. Along with this setting, the oscilloscope
uses the number of segments, maximum segment length, and total
available memory to determine the actual number of samples or segments,
and time or points.
1. Touch Timebase → Horizontal Setup on the menu bar.
2. Click the Sequence tab.
3. Under Acquisition Settings, touch inside the Number of Settings
data entry field and enter the number of segments you want to
display.
NOTE: The number of segments you choose to display can be less
than the total number of segments in the waveform. For example, in
the pop-up images above, the number of display segments is 10, but
the total number of segments entered in the timebase dialog's
Number of Segments field is 100.
Page 70

WaveSurfer MXs-B Oscilloscopes
62 922172-00 Rev A
4. Touch the Enable Timeout checkbox.
5. Touch inside the Timeout data entry field and enter a timeout value.
NOTE: Use the sequence mode timeout to automatically interrupt
the sequence acquisition if the timeout value is exceeded without a
valid trigger. The timeout period accounts for instances when a
Number of Segments miscount occurs for some reason and the
oscilloscope waits indefinitely for an unforthcoming segment.
During that time, no oscilloscope functions are accessible. By means
of a timeout value, however, the acquisition will be completed, the
waveform displayed, and control of the oscilloscope returned to the
user after the timeout has elapsed.
5. Under Display Settings, touch inside the Display mode field, and
select a sequence mode display from the pop-up menu.
6. Touch the SINGLE trigger front panel button.
NOTE: Once a single acquisition has started, you can interrupt the
acquisition at any time by pressing the SINGLE front panel button a
second time or by pressing the STOP front panel button. In this case,
the segments already acquired will be retained in memory.
Zooming Segments in Sequence Mode
You can zoom individual segments easily using the QUICKZOOM front panel
button. When you zoom, the zoom traces default to Segment 1. Channel
descriptors indicate the total number of segments acquired. Zoom
descriptors indicate [Seg #] and #Segments in the Zoom.
You can scroll through the segments using ZOOM front panel position knob.
1. Touch the front panel Quickzoom button.
2. Turn the ZOOM front panel position knob to scroll through the
segments.
3. To vary the degree of zoom, touch the newly created Zx trace label.
The setup dialog for the zoom (Z1 to Z4) opens. It shows the current
horizontal and vertical zoom factors.
4. If you want to increase or decrease your horizontal or vertical zoom
in small increments, touch the Var. checkbox to enable variable
zooming. Now with each touch of the zoom control buttons, the
degree of magnification changes by small increments.
Page 71

Getting Started Manual
922172-00 Rev A 63
OR
If you want to zoom in or out in large standard increments with each
touch of the zoom control buttons, leave the Var. checkbox
unchecked.
OR
If you want to set exact horizontal or vertical zoom factors, touch
inside the Horizontal Scale/div data entry field and enter a time-per-
div value, using the pop-up numeric keypad. Then touch inside the
Vertical Scale/div field and enter a voltage value.
Viewing Time Stamps
You can view time stamps for each segment. To view time stamps, from the
Sequence tab select Show Sequence Trigger Times.
Page 72

WaveSurfer MXs-B Oscilloscopes
64 922172-00 Rev A
Using the Math Trace
Overview
Math allows you to perform simple and complex mathematical calculations
on your signal, or on a zoom or memory (reference waveform). The
oscilloscope can be operating in any acquisition mode (Real-Time, RIS, or
Roll Mode) when Math is created.
Math traces are defined with an Operator and a Source. Examples of
Operators include Add, Subtract, Multiply, Divide, and FFT. Sources are
channels, zoom traces, or memories (reference waveforms). Some
Operators require two sources, and some only one source. The oscilloscope
shows how many sources you need to define when you choose the
Operator.
Math is always displayed in a separate half-height grid at the bottom of the
display, separate from your other traces. This makes it easier to interpret
Math information if the math scale is different from the channel scales. If
you also have Zoom traces showing when you turn the Math trace ON,
three grids are shown on the display, each at one-third the height.
Each Math trace can also be zoomed without setting up a separate zoom
trace. This reduces a step, and gives you more capability to understand the
exact feature of interest without having to create another trace. Simply use
the zoom controls in the Math dialog, or use the Vertical and Horizontal
controls for position and scale change in both axes when the Math trace is
active.
One powerful feature about WaveSurfer MXs-B Math traces is that they are
calculated to 16-bit vertical resolution. Therefore, you can vertically zoom
the Math trace and still maintain very high resolution when viewing the
zoomed trace.
Page 73

Getting Started Manual
922172-00 Rev A 65
Description of math functions
The WaveSurfer MXs-B oscilloscope contains several Math operators as
standard, plus an FFT function. Descriptions are provided as follows:
Standard Math
Absolute Value – calculates the absolute value of a waveform.
Average – calculates either a summed or continuous average up
to 1 million sweeps (user selectable).
Derivative – calculates the derivative of adjacent samples.
Difference (Subtract) – subtracts two waveforms.
Envelope – calculates highest and lowest vertical values of a
waveform at each horizontal value for a given number of
acquisitions (sweeps).
Enhanced Resolution (ERES) – noise reduction and smoothing
filter specified by number of additional bits.
Fast Fourier Transform (FFT) – computes a power frequency
spectrum of an FFT with Rectangular, Von Hann, Flat Topp,
Hamming, Blackman-Harris, and Hanning windows, and
capability to calculate up to 1 Mpts. Also allows FFT Averaging through use
of 2nd Math Operator.
Floor - calculates the lowest vertical values of a waveform at
each horizontal value for a given number of acquisitions
(sweeps).
Integral – calculates the linearly rescaled integral (with multiplier
and adder) of a waveform input.
Invert – inverts the waveform.
Page 74

WaveSurfer MXs-B Oscilloscopes
66 922172-00 Rev A
Product (Multiply) – Multiplies two waveforms.
Ratio (Divide) – Calculates the ratio of two waveforms.
Reciprocal – calculates the reciprocal of the waveform.
Rescale – allows user-defined rescaling, including user defined
units.
Roof - calculates the highest vertical values of a waveform at
each horizontal value for a given number of acquisitions
(sweeps).
Square – calculates the square of the waveform.
Square Root – calculates the square root of the waveform.
Sum (Add) – Adds two waveforms.
Zoom – Produces a zoom of the input waveform
Page 75

Getting Started Manual
922172-00 Rev A 67
Setting up a Math Trace
1. Press the Math front panel button
Or, touch Math Math Setup… from the Menu Bar.
The following dialog is shown on the lower display with the Math trace
ON and the last selected Math Operator chosen as the current
operator.
2. Change the currently defined Operator by touching either the icon or
inside the Operator area to bring up the following pop-up menu (if you
ordered the MathSurfer Advanced Math option, you would have more
selections than shown):
Page 76

WaveSurfer MXs-B Oscilloscopes
68 922172-00 Rev A
3. Touch any of the icons to select the math operator (function) that you
desire. Scroll down through the list using the scroll bar on the rights
side of the pop-up menu.
4. Once the Operator is selected, the pop-up menu closes and the Math
trace is re-defined.
Using Dual Operators
If you have purchased the MathSurfer Advanced Math option (standard on
WaveSurfer MXs-A), you can select a second Operator. Do this by selecting
Dual from the Single/Dual button selection.
A second Operator is shown. Make changes to it the same way as with the
first operator.
Two Operators can be helpful in some situations. For instance, you can
compute an FFT, and then Average the FFT result over many computations
by making the first Operator an FFT and the second operator an Average
function. Or, you can make the second Operator a Rescale function to
change units and rescale information for a non-standard calculation.
The channel source defaults to C1. Touch inside the source field to select a
different source (a channel, a memory, or a zoom).
Close the Math dialog by either pressing the front panel Math button
again, or touching Close on the on-screen dialog.
Page 77

Getting Started Manual
922172-00 Rev A 69
1. Touch the descriptor label to make it
active.
2. Then, use the front panel horizontal
and vertical controls to adjust
position and scale. The operation of
the knobs feels natural. Use the
following table as a guide.
NOTE: When Math trace is active, no
channel buttons are lit. This indicates that
the Math trace may be currently active.
Math Descriptor Label
When a Math trace is ON, there is a descriptor label on
the display for it, much like for the channels, zooms, and
memories (reference waveforms).
The top line contains information about how the Math trace is defined
(in this case, it’s an FFT of Channel 1).
The 2
The 3
nd
line contains vertical scaling information.
rd
line contains horizontal scaling information.
If the descriptor label is a solid color (as follows), then
the Math trace is ACTIVE, which means that the
Horizontal and Vertical front panel controls are set to
adjust the Math trace, and not any of the channels. In
this case, the scale and position of the Math trace can be changed by
adjusting the horizontal and vertical controls on the front panel.
If the Math trace is not ACTIVE, and you wish to make it ACTIVE, simply
touch the descriptor label once and it becomes active and the Math dialog
opens.
Zooming Math
Math traces have zoom capability built in, so it is easy to change the scale
and position of the Math trace, as required. Zoom the channel as follows:
Page 78

WaveSurfer MXs-B Oscilloscopes
70 922172-00 Rev A
Panel Control
Zoom Control Action
Delay
Zooms horizontal position
Timebase
Zooms horizontal scale
Offset
Zooms vertical position
Gain / Sensitivity
Zooms vertical scale
Push – Zero Delay
Resets horizontal zoom to 10:1 scale, and
resets to default horizontal position
Push – Zero Offset
Resets vertical zoom to 1:1 scale, and resets
to default vertical position
1. Touch the descriptor label twice to
open the Math dialog.
2. Then use the Zoom dialog on the
right to change the horizontal and
vertical position and scale.
Opens a Measurement selection pop-up menu. You can then
select a parameter (measurement) for the Math trace from
this menu without leaving the Math Setup dialog. The
parameter automatically appears below the grid.
Loads the Math trace into its corresponding Memory
(Reference Waveform) location (Memory 1, or abbreviated as
M1).
Opens a Labeling pop-up menu that allows you to create
labels tied to the waveform.
Using Math Dialog Zoom Controls
Toolbar Shortcuts
These buttons can be used to perform specific actions for the Math Trace.
Page 79

Getting Started Manual
922172-00 Rev A 71
Pass/Fail Testing
Overview
The WaveSurfer MXs-B oscilloscope’s pass/fail testing is designed for basic
determination of whether a signal is within an industry-standard or userdefined mask. Several unique views are provided to make it easy to
understand when the signal is falling outside of its desired range.
Mask Tests
You have the choice to do mask testing by using an existing mask, or by
using a mask created from your actual waveform, with vertical and
horizontal tolerances that you define. Existing masks can be loaded from a
floppy disk or from a network.
You can set your mask test to be True for waveforms All In, All Out, Any In,
or Any Out. For example, if you select All In, the test is False – even if a
single waveform falls outside the mask.
Masks that you create from your waveform can be confined to just a
portion of the trace by use of a measure gate. (See Measure Gate for an
explanation of how this feature works.)
Actions
You can decide the actions to occur upon your waveform’s passing or
failing, by selecting one or all of the following:
stop
audible alarm
print image of display
emit pulse
save waveform
The selection Pulse causes a pulse to be output through the Aux Out
connector. This pulse can be used to trigger another oscilloscope. You can
set the amplitude and width of the pulse as described in Auxiliary Output
Signals.
Page 80

WaveSurfer MXs-B Oscilloscopes
72 922172-00 Rev A
Setting Up Pass/Fail Testing
Touch Analysis Pass/Fail Analysis from the menu bar.
The following dialog is shown on the lower display area.
Select a Source for the mask test.
Touch either the Pass or Fail button to set the actions to occur upon your
waveform's passing or failing the test.
Touch the actions you want to occur: stop test, sound alarm, print result,
emit pulse, or save the waveform. If you want to have the results printed,
be sure that the oscilloscope is connected to a local or network printer. See
Printing.
If you want to save your waveform automatically, touch the Save Setup.
This exits the current dialog and opens the Save Waveform dialog. Refer to
the Saving and Recalling Signals section for more details.
Page 81

Getting Started Manual
922172-00 Rev A 73
Mask Testing Setup
1. From the Test dialog (right side of the screen), choose one of the Test
is True when buttons:
A selection means (for example, if you select All In) the test is False if
even a single waveform falls outside the mask.
2. From Show Markers, choose whether or not to have mask violations
displayed.
3. If you are loading a pre-existing mask, touch the Load Mask tab, then
the File button. You can then enter the file name or browse to its
location.
4. If you want to make a mask from your waveform, touch the Make
Mask tab.
5. Touch inside the Ver Delta and Hor Delta fields and enter boundary
values, using the pop-up numeric keypad.
6. Touch the Browse button to create a file name and location for the
mask if you want to save it.
7. Touch the Gate tab, then enter values in the Start and Stop fields to
constrain the mask to a portion of the waveform. Or, you can simply
touch and drag the Gate posts, which initially are placed at the extreme
left and right ends of the grid.
Page 82

WaveSurfer MXs-B Oscilloscopes
74 922172-00 Rev A
Saving and Recalling Waveforms
Overview
There are several ways to save and recall your signals:
Save your Channel signal, Math trace, or Zoom trace to a Memory
location (Reference Waveform).
Save your Channel signal, Math trace, or Zoom trace as Data.
Save your Channel signal, Math trace, or Zoom trace as a Screen
Image.
Memories (Reference Waveforms)
Memories are saved in non-volatile RAM on the WaveSurfer MXs-B
oscilloscope. Saving to a memory is quick and easy. It is the ideal way to
save data for quick comparison with another waveform.
Waveform Data
Waveform Data is usually saved in a binary or ASCII format (though other
formats are available). The data can be recalled on the same oscilloscope,
or transferred to another oscilloscope or other program (like Excel,
MATLAB, or Mathcad) for further processing. If recalled on an oscilloscope,
it would be recalled in a Memory (reference waveform) trace.
Screen Image
Screen images can be saved in a number of different image formats, and
saved to a file, printed, or sent as an e-mail attachment. Screen images are
not actual oscilloscope data, and cannot be recalled into the oscilloscope.
Saving and Recalling Memories
Fastest Way to Store and Display
Being able to compare a current acquisition with a reference trace is a very
fundamental oscilloscope need. The WaveSurfer MXs-B oscilloscope has
made it easy to save a channel, math trace, or zoom trace to a memory
location.
Page 83

Getting Started Manual
922172-00 Rev A 75
Touch the Channel, Math, or Zoom descriptor label
twice to open the dialog for the trace that you desire to
save to a reference location.
Touch the Store button in the toolbar at the bottom of
the dialog.
1. Choose Math Memory Setup
from the menu bar.
2. Choose a Memory location from
the Memory Setup dialog. In this
example, we’ll choose M1.
3. Choose a waveform to save into
this memory. In this example, we’ll
choose to save C1 into this M1
memory location.
After you’ve selected the
waveform to save into memory,
touch Copy Now.
The M1 memory trace contains the
C1 waveform present at the time
of the save, the M1 trace is turned
ON, and the descriptor label is
active. The position and scale can
be changed with the front panel
controls, just like a zoom trace.
The trace is saved to its corresponding Memory trace (C1 to M1, C2 to M2,
etc., Z1 to M1, Z2 to M2, etc., Math to M1) and displayed on the grid. The
memory trace has a descriptor label, a dialog, etc. like all other traces. It
can even be zoomed and repositioned on the grid.
Page 84

WaveSurfer MXs-B Oscilloscopes
76 922172-00 Rev A
Opens a Measurement selection pop-up menu. You can then
select a parameter (measurement) for the Memory trace
from this menu without leaving the Memory Setup dialog.
The parameter automatically appears below the grid.
Clears the memory of the stored trace.
Opens a Labeling pop-up menu that allows you to create
labels tied to the memory.
1. Choose File Save Waveform from the
menu bar.
2. Choose to save the Waveform Data to a File
3. Choose a source of the data that you want to
save, and choose a file name for the data file.
CAUTION. If you use a name that ends in
a number instead of a letter, the
instrument may truncate the number. This is
because, by design, the first waveform is
automatically numbered 0, the second 1, etc.
Using Memory Toolbar Shortcuts
These toolbar shortcuts can be used to perform specific actions for the
Memory Traces.
Saving and Recalling Waveform Data
Saving Waveform Data
Page 85

Getting Started Manual
922172-00 Rev A 77
4. Choose a data format. If you select ASCII or
Excel, also touch the SubFormat field and
select either Time Data or Time & Ampl. Then
touch the Delimiter field and select a
delimiter character from the pop-up menu:
comma, space, semicolon, or tab.
5. Choose a directory and file name to store the
file to (this could be a USB memory storage
device, or the oscilloscope internal hard drive:
6. Then touch the Save Now button in the
dialog.
Page 86

WaveSurfer MXs-B Oscilloscopes
78 922172-00 Rev A
bar.
memory location to store the file into. If you
wish, check the Show on Recall box to turn the
memory ON and display the waveform instantly.
field and enter the path, using the pop-up
keyboard. Or touch the Browse button to
navigate to the file.
waveform data file.
You can send images to a hard copy printer, to storage
media (like the internal hard drive or a USB memory
stick), as an e-mail attachment, or as a clipboard file
for copying into other programs.
You can define the front panel Print button to
automatically save, print, or e-mail the file with just
one button push
You can also annotate (add labels) to your screen
images before saving them so as to make your
documentation job easier. Use the toolbar Label
button to create and add labels independently to each
Waveform.
Recalling Waveform Data
Saving Screen Images
Page 87

Getting Started Manual
922172-00 Rev A 79
Choose File if you want to save the screen image to storage media,
such as a USB memory stick or the internal hard drive.
The instrument also gives you the option to e-mail your screen
images, using either the MAPI or SMTP protocols. Before you send
an e-mail, you must first be connected to an e-mail server and must
set up the e-mail server and recipient address in Preference Setup.
Saving the Screen Image to a File
1. Touch Utilities Utilities Setup... from the menu bar.
2. Touch the Hardcopy tab, then the File icon.
3. Touch inside the File Format data entry field and select a graphic
file format from the pop-up menu.
4. Under Colors, touch the Use Print Colors checkbox if you want the
traces printed on a white background. A white background saves
printer toner.
5. Touch inside the Directory data entry field and type the path to the
folder you want to print to, using the pop-up keyboard. Or touch
the Browse button and navigate to the folder.
6. Touch inside the File Name data entry field and enter a name for
the display image, using the pop-up keyboard.
7. Touch the Grid Area Only checkbox if you do not need to print the
dialog area and you only want to show the waveforms and grids.
8. Touch the Print Now button, or use the front panel Print button to
save the file.
Sending the Screen Image as an E-mail Attachment
1. Touch Utilities Utilities Setup... from the menu bar.
2. Touch the Hardcopy tab, then the E-mail button.
3. Touch inside the File Format data entry field and select a graphic
file format from the pop-up menu.
Page 88

WaveSurfer MXs-B Oscilloscopes
80 922172-00 Rev A
Choose Printer if you want to print the screen image to an external
printer
4. Under Colors, touch the Use Print Colors checkbox if you want the
traces printed on a white background. A white background saves
printer toner.
5. Touch the Prompt for message to send with mail checkbox if you
want to include remarks with the image.
6. Touch the Grid Area Only checkbox if you do not need to print the
dialog area and you only want to show the waveforms and grids.
7. Touch the Print Now button.
Printing the Screen Image to a Printer
1. Touch File Print Setup... from the menu bar. The Utilities
Hardcopy dialog opens.
2. In the dialog area, touch the Printer icon.
3. Under Colors, touch the Use Print Colors checkbox if you want the
traces printed on a white background. A white background saves
printer toner. (You can change the printer colors in the Preferences
- Color dialog).
4. Touch inside the Select Printer field. From the touch pad pop-up
choose the printer you want to print to. Touch the Properties
button to see your printer setup.
5. Touch the icon for the layout Orientation you want: portrait or
landscape.
6. Touch the Grid Area Only checkbox if you do not need to print the
dialog area and you only want to show the waveforms and grids.
7. Touch the Print Now button, or use the front panel Print button to
print the file.
Page 89

Getting Started Manual
922172-00 Rev A 81
Choose Clipboard if you want to save the screen image to the
clipboard so you can paste a file into another application (like MS
Word, for example).
Choose File Save Setup from menu bar.
Choose to save the Waveform Data as an Internal
Setup temporary location in RAM or to a File on
the hard drive or external storage device.
Touch Save Now to save the file.
Saving the Screen Image to a Clipboard
1. Touch Utilities Utilities Setup... from the menu bar.
2. Touch the Hardcopy tab.
3. Under Colors, touch the Use Print Colors checkbox if you want the
traces printed on a white background. A white background saves
printer toner.
4. Touch the Grid Area Only checkbox if you do not need to print the
dialog area and you only want to show the waveforms and grids.
5. Touch the Print Now button, or use the front panel Print button to
save the file.
Saving and Recalling Setups
Overview
You can save or recall settings to or from hard disk, USB key, or LAN
locations. This can be very helpful if you repeat the same types of tasks
over and over again, or if you share the scope with many people.
Saving Oscilloscope Settings as a Setup File
Page 90

WaveSurfer MXs-B Oscilloscopes
82 922172-00 Rev A
Choose File Recall Setup from the menu bar.
Choose to recall the Setup from an Internal
Setup temporary location in RAM or from a File
on the hard drive or external storage device.
Touch Recall Now to save the file.
Choose File Recall Setup from the menu
bar.
Touch the button under Recall Default Setup.
Recalling Oscilloscope Settings from a Setup File
Recalling Default Oscilloscope Settings
Sharing Data & Communicating
Overview
The WaveSurfer MXs-B oscilloscope provides you with many powerful tools
to communicate your results to others and to increase your productivity.
Some examples include:
E-mail images to co-workers or customers directly from the
oscilloscope.
Allow annotation of image files directly on the oscilloscope.
Save images and data files to the oscilloscope hard drive or
network drive.
Download images and files quickly to a USB memory stick.
Create an archive of perfect signals for comparison during board
validation (using traces stored on the hard drive).
Print to any printer.
Be controlled or viewed from a remote location using off-the-shelf
software tools.
Page 91

Getting Started Manual
922172-00 Rev A 83
The WaveSurfer MXs-B oscilloscope uses WindowsXP, so you are probably
aware of the basic philosophy of minimizing the program, saving to
directories, and opening other programs on the oscilloscope. This makes it
easier to intuitively operate the WaveSurfer MXs-B oscilloscope.
Standard outputs
The WaveSurfer MXs-B oscilloscope is standard with the following:
100BaseT Ethernet
Front-Mounted USB port (not pictured)
Side-mounted USB ports (qty. 4)
9-pin serial port
SVGA output
Teledyne LeCroy Bus (LBus) Interface
Page 92

WaveSurfer MXs-B Oscilloscopes
84 922172-00 Rev A
LabNotebook entries are easily created by
selecting LabNotebook from the File menu,
then clicking the Create button.
Several annotation tools and colors are then
put at your disposal to mark up your
waveform. When you click Done, your markups and oscilloscope settings are saved
together in a database resident on the
instrument.
Click the Create Report button to generate a
hardcopy format that you can save to a
network drive or external media. Or click the
E-mail button to send the report to another
location. Use the Flashback feature at any
time to recall a Notebook entry, including
oscilloscope setup, for further study.
Documenting Your Work Using LabNotebook
The LabNotebook feature simplifies the way waveforms, screen captures,
and oscilloscope setup files are saved and documented. LabNotebook also
provides an easy way to recall your settings with the Flashback feature.
And it lets you create reports, showing your screen images, in pdf, html, or
rtf output formats.
Connecting to a Network
The WaveSurfer MXs-B oscilloscope’s standard 10/100 Base-T Ethernet
port allows quick and easy connection to a network. Using DHCP (Dynamic
Host Configuration Protocol), provided the network does not have a
firewall, plug the network cable into the WaveSurfer MXs-B scope’s
Ethernet port, and a network address is self-assigned.
If the network does have a firewall, your IT department can assist you in
connecting to the network using familiar Windows setup routines.
Because your oscilloscope runs on a Windows-based PC platform, it is wise
to protect it from viruses, as with any PC on a corporate network. It is
Page 93

Getting Started Manual
922172-00 Rev A 85
crucial that the oscilloscope be kept up to date with Windows Critical
Updates, and that anti-virus software be installed and continually updated.
Visit teledynelecroy.com/dsosecurity for more information regarding
Windows Service Pack compatibility with Teledyne LeCroy operating
software, and related matters.
Sending E-mail from the Oscilloscope
It is very easy to send an e-mail of an image directly from the oscilloscope
by pressing a single front panel button. Reference the previous section
Sending the Screen Image as an Email Attachment.
Controlling and Viewing Remotely
Use Windows NetMeeting, VNC, pcAnywhere, or a similar program to
control the oscilloscope remotely or share screen information in real-time
with others located anywhere in the world, or just down the hallway.
All of these programs may be loaded and configured on the WaveSurfer
MXs-B oscilloscope as if the WaveSurfer MXs-B was a standard PC.
Page 94

WaveSurfer MXs-B Oscilloscopes
86 922172-00 Rev A
You can access the WaveSurfer MXs-B oscilloscope’s
(Windows) desktop by touching File Minimize.
This minimizes the oscilloscope allowing access to
other Windows programs like File Explorer, Paint,
Internet Explorer, etc.
When minimized, the oscilloscope program appears
as a follows in the lower right hand corner of the
display. Touch on the icon to maximize the program
to full screen size.
Accessing the Desktop
Annotating Image Files / Creating Labels
Any channel, math trace, zoom trace, or memory (reference waveform) can
be annotated or labeled. These labels are attached to the waveform and
can be positioned anywhere on the waveform. Note the following:
Label placement adjusts depending on vertical and horizontal
adjustments to the trace.
When a screen image is saved to disk, these labels are part of the
screen image.
By using labels, you eliminate extra work in a separate program.
Labels contribute to your co-worker or customer understanding of
your work.
1. Open the dialog for the channel, math, zoom, or memory that you
want to label.
2. Touch the Label button in the toolbar.
3. Touch the Add Label button in the pop-up menu.
Page 95

Getting Started Manual
922172-00 Rev A 87
4. Create Label Text by using the pop-up keyboard. You may also
change Horizontal Position of each label, Remove Label, and turn
labels on/off by checking or un-checking the View Labels checkbox.
Saving Data Files and Images
You can save raw data files by selecting File Save Waveform and then
choosing data format, locations, etc. before finally choosing Save Now.
Images can be saved by choosing File in Utilities, Hardcopy, selecting a File
Format, File Name, Directory location, etc.), and then pressing the Print
icon in the dialog or on the front panel.
Please refer to the Saving the Screen Image to a File topic for more
information.
Once saved (on a USB memory stick, USB storage device, or oscilloscope
hard drive), the image file can be easily cut and paste into other programs,
like Word, Excel, Paint, etc.
Creating Reference Waveforms (Memories)
If you wish to compare a waveform to another waveform, you can save
them into Memories. Up to 4 memories can be stored in non-volatile RAM
at a time. You can display all 4 memories at once, if desired.
If you wish to store more than 4 waveforms at a time, you can Save
Waveform Data (accessed from the File menu), and then Recall Waveform
Data (also accessed from the File menu) into a Memory trace.
Reference the chapter on Saving and Recalling Signals for more
information.
Page 96

WaveSurfer MXs-B Oscilloscopes
88 922172-00 Rev A
Printing
Since the WaveSurfer MXs-B oscilloscope runs on a WindowsXP platform,
you can connect any WindowsXP compatible printer to the oscilloscope,
following standard Windows setup routines for installing a new printer.
Reference the chapter on Print Management for more detailed
information. In addition, there is information on setting the front panel
Print button in the chapter Saving and Recalling Signals section Printing
the Screen Image to a Printer.
Print Management
The instrument gives you the ability to output files to a printer or plotter,
to print to file, or to e-mail your files. Any Windows XP supported printer is
supported by your instrument.
Setting Up the Printer
1. Touch File Print Setup... from the menu bar. The Utilities Hardcopy
dialog opens.
In the dialog area, touch the Printer icon.
Under Colors, touch the Use Print Colors checkbox if you want the
traces printed on a white background. A white background saves
printer toner. Change the printer colors in the Preference dialog.
Touch inside the Select Printer field. From the touch pad pop-up
choose the printer you want to print to. Touch the Properties button to
see your printer setup.
Touch the icon for the layout Orientation you want: portrait or
landscape.
Touch the Grid Area Only checkbox if you do not need to print the
dialog area and you only want to show the waveforms and grids.
Page 97

Getting Started Manual
922172-00 Rev A 89
Printing from the Oscilloscope
2. You can print in one of three ways:
3. Press the printer button on the front panel.
4. Touch File Print from the menu bar.
5. Touch the Print Now button in the Hardcopy dialog
Adding Printers and Drivers
NOTE: If you want to add a printer driver, the driver must first be loaded on
the oscilloscope.
1. Touch File Print Setup... from the menu bar. The Utilities Hardcopy
dialog opens.
2. In the dialog area, touch the Printer icon.
3. Touch the Add Printer button. The Print screen is then shown.
4. Touch the Properties button to change printer properties such as
number of copies.
Changing the Default Printer
1. Change the default printer by minimizing the instrument application by
touching File Minimize from the menu bar.
2. Touch the Start button in the task bar at the bottom of the screen.
3. Select Settings Printers.
4. Touch the printer you want to set as the default printer, then touch
File, Set as Default Printer.
Page 98

WaveSurfer MXs-B Oscilloscopes
90 922172-00 Rev A
Utilities and Preferences
Overview
The Utilities and Preferences dialogs are accessed from the menu bar’s
Utilities selection. Utilities and Preferences contain setup and other
information that doesn’t need to be changed or accessed frequently.
Other items are located in the various top menu bar drop-downs.
Most of the following entries correspond to labeled tabs on the Utilities
dialog.
Status
The status read-only dialog displays system information including serial
number, firmware version, and installed software and hardware options.
To access Status, from the menu bar, choose Utilities.
Now, touch the Status tab on the Utilities dialog.
Remote Communication
The Remote dialog is where you can select a network communication
protocol, establish network connections, and configure the Remote Control
Assistant log. The choice of communication protocols is currently limited to
TCPIP.
NOTE: The instrument uses Dynamic Host Configuration Protocol (DHCP) as
its addressing protocol. Therefore, it is not necessary to set up an IP
address if your network supports DHCP. If it does not, you can assign a
static address in the standard Windows network setup dialog. Consult with
your IT department. The local firewall may make it difficult for you to do
this on your own.
The Remote Control Assistant monitors communication between your PC
and oscilloscope when you are operating the instrument remotely. You can
log all events or errors only. This log can be invaluable when you are
creating and debugging remote control applications.
Page 99

Getting Started Manual
922172-00 Rev A 91
Remote Communication Setup
If you are connecting the oscilloscope to a network, first contact your
Information Systems administrator. If you are connecting the oscilloscope
directly to your PC, connect an Ethernet cable between them.
1. Touch Utilities Utilities Setup... from the menu bar.
2. Touch the Remote tab.
3. Make a Port selection:TCPIP (transmission control protocol/Internet
protocol) is the only supported port at this time.
4. Press the Net Connections button. The Windows Network and Dial-up
Connections screen is shown.
5. Touch Make New Connection and use the Windows Network
Connection Wizard to make a new connection. Or, touch Local Area
Connection to reconfigure the oscilloscope's connection if it is already
connected to the network.
Configuring the Remote Control Assistant Event Log
1. Touch Utilities Utilities Setup... from the menu bar.
2. Touch the Remote tab.
3. Touch inside the Log Mode data entry field.
4. Select Off, Errors Only, or Full Dialog from the pop-up menu.
5. Export the contents of the event log to an ASCII text file by touching
the Show Remote Control Log button. The Event Logs pop-up is
shown. Touch inside the DestFilename data entry field and use the
pop-up keyboard to provide a file name. Now, touch the Export to Text
File button.
Page 100

WaveSurfer MXs-B Oscilloscopes
92 922172-00 Rev A
Aux Output Off - turns off the auxiliary output signal
Trigger Out - can be used to trigger another oscilloscope
Trigger Enabled - can be used as a gating function to trigger
another instrument when the oscilloscope is ready
Pass/Fail - allows pulse duration setup from 1 ms to 500
ms. Generates a pulse when pass/fail testing is active and
conditions are met.
Aux Output
The following signals can be output through the AUX OUTPUT coaxial
connector on the back of the WaveSurfer MXs-B oscilloscope (this coaxial
connector is not labeled).
Setting Up Auxiliary Output
1. Touch Utilities Utilities Setup... from the menu bar.
2. Touch the Aux Output tab.
3. Touch one of the buttons under Use Auxiliary Output For.
4. If you selected Pass/Fail, touch inside the Pulse Duration field and
enter a value from 1 ms to 500 ms, using the pop-up numeric keypad.
NOTE: The CAL output on the front of the WaveSurfer MXs-B oscilloscope is
always set to a 1V / 1 kHz square wave.
 Loading...