

Page 1

3385 Scott Blvd., Santa Clara, CA 95051-3115 Tel: +1/408.727.6600 Fax: +1/408.727.6622
CATC IBTracer 4X
™
InfiniBand Protocol Analyzer
User’s Manual
Manual Version 1.2
For Software SW Version 2.2
1 November, 2002
Page 2

IBTracer 4X Protocol Analyzer User’s ManualCATC SW Version 2.2
Document Disclaimer
The information in this document has been carefully checked and is
believed to be reliable. However, no responsibility can be assumed for
inaccuracies that may not have been detected.
CATC reserves the right to revise the information in this document without
notice or penalty.
Trademarks and Servicemarks
CATC, Merlin, Advisor, Chief, FireInspector, IBTracer, USBTracer,
SATrace r, Traffic Generator, BusEngine, UPT, HPT, and UHT are
trademarks of Computer Access Technology Corporation.
Microsoft, Windows, Windows NT, Windows 98SE, Windows ME, and
Windows XP are registered trademarks of Microsoft Inc.
All other trademarks are property of their respective companies.
Copyright
Copyright © 2002, Computer Access Technology Corporation (CATC); All
Rights Reserved.
This document may be printed and reproduced without additional
permission, but all copies should contain this copyright notice.
FCC CONFORMANCE STATEMENT
This equipment has been tested and found to comply with the limits for a
Class A digital device, pursuant to Part 15 of the FCC Rules. These limits
are designed to provide reasonable protection against harmful interference
when the equipment is operated in a commercial environment. This
equipment generates, uses, and can radiate radio frequency energy and, if
not installed and used in accordance with the instruction manual, may cause
harmful interference to radio communications. Operation of this equipment
in a residential area is likely to cause harmful interference in which case the
user will be required to correct the interference at his own expense. The end
user of this product should be aware that any changes or modifications made
to this equipment without the approval of CATC could result in the product
not meeting the Class A limits, in which case the FCC could void the user's
authority to operate the equipment.
ii
Page 3

IBTracer Protocol Analyzer User’s ManualCATC SW Version 2.2
EU CONFORMANCE STATEMENT
This equipment complies with the EMC Directive 89/336/EEC and the Low
Voltage Directive 73/23/EEC, and their associated amendments for Class A
Information Technology Equipment. It has been tested and found to comply
with EN55022 and EN55024 (EN61000-4-2, EN61000-4-3, EN61000-4-4,
EN61000-4-5, EN61000-4-6, EN61000-4-11, EN61000-3-2,
EN61000-3-3), and EN605950.
Part number: 730-0031-00
iii
Page 4

IBTracer 4X Protocol Analyzer User’s ManualCATC SW Version 2.2
iv
Page 5

IBTracer 4X Protocol Analyzer User’s ManualCATC SW Version 2.2
CONTENTS
Chapter1 Overview.....................................1
GeneralDescription ...............................................1
Features .........................................................3
General ...................................................3
DisplayOptions ............................................4
IBTracerBusEngine.........................................4
Specifications.....................................................5
Package...................................................5
PowerRequirements.........................................5
Environmental Conditions . ...................................5
Switches ..................................................5
LEDs ....................................................5
ProbingCharacteristics.......................................5
RecordingMemorySize .....................................5
BasicTriggerEvents.........................................6
Certification ...............................................6
Chapter2 QuickInstallation..............................7
PCRequirements..................................................7
SettingUptheAnalyzer.............................................7
InstallingtheSoftware..............................................8
YourFirstInfiniBandRecording......................................8
CapturingYourFirstCATCTrace .............................10
TraceViewFeatures........................................10
Chapter3 DetailedInstallation...........................11
System Components/Packing List . . ..................................11
TheInstalledIBTracer4XUnit......................................11
LEDandButtonDescriptions.................................11
IBTracer4XSystemSetup..........................................13
ACPowerSource.................................................13
PCConnection...................................................14
InfiniBandCableConnection........................................14
ExternalInterfaceBreakoutBoard....................................14
Pin-OutsfortheDataIn/OutConnector.........................14
PrototypeReworkArea......................................16
IBTracerProgramInstallation.......................................16
Loading the USBTracer USBDrivers ..........................16
Installing the USBTracer ApplicationProgram ..................17
IBTracerProgramStartup ..........................................17
MakingaRecording...............................................18
Chapter4 Updates.....................................19
Software,Firmware,andBusEngineRevisions..........................19
SoftwareUpdates.................................................20
iii
Page 6

IBTracer 4X Protocol Analyzer User’s ManualCATC SW Version 2.2
LicenseInformation...............................................20
UpdatingtheSoftwareLicense................................20
BusEngineandFirmwareUpdates....................................21
UpdatingtheBusEngine.....................................21
UpdatingtheFirmware......................................21
AutomaticUpdates.........................................22
ManualUpdates ...........................................23
ManuallyUpdatingtheFirmware..............................25
ResettingtheAnalyzer.............................................25
Chapter5 SoftwareOverview............................27
TheMainDisplayMenus...........................................27
ViewOptions....................................................29
ResettingtheToolbar .......................................29
ToolBar..................................................31
StatusBar.......................................................32
RecordingProgress.........................................32
RecordingStatus...........................................33
AnalyzerStatus............................................34
SearchStatus..............................................34
ZoomIn..................................................34
ZoomOut................................................34
ToolTips........................................................34
IBTracerAnalyzerKeyboardShortcuts................................35
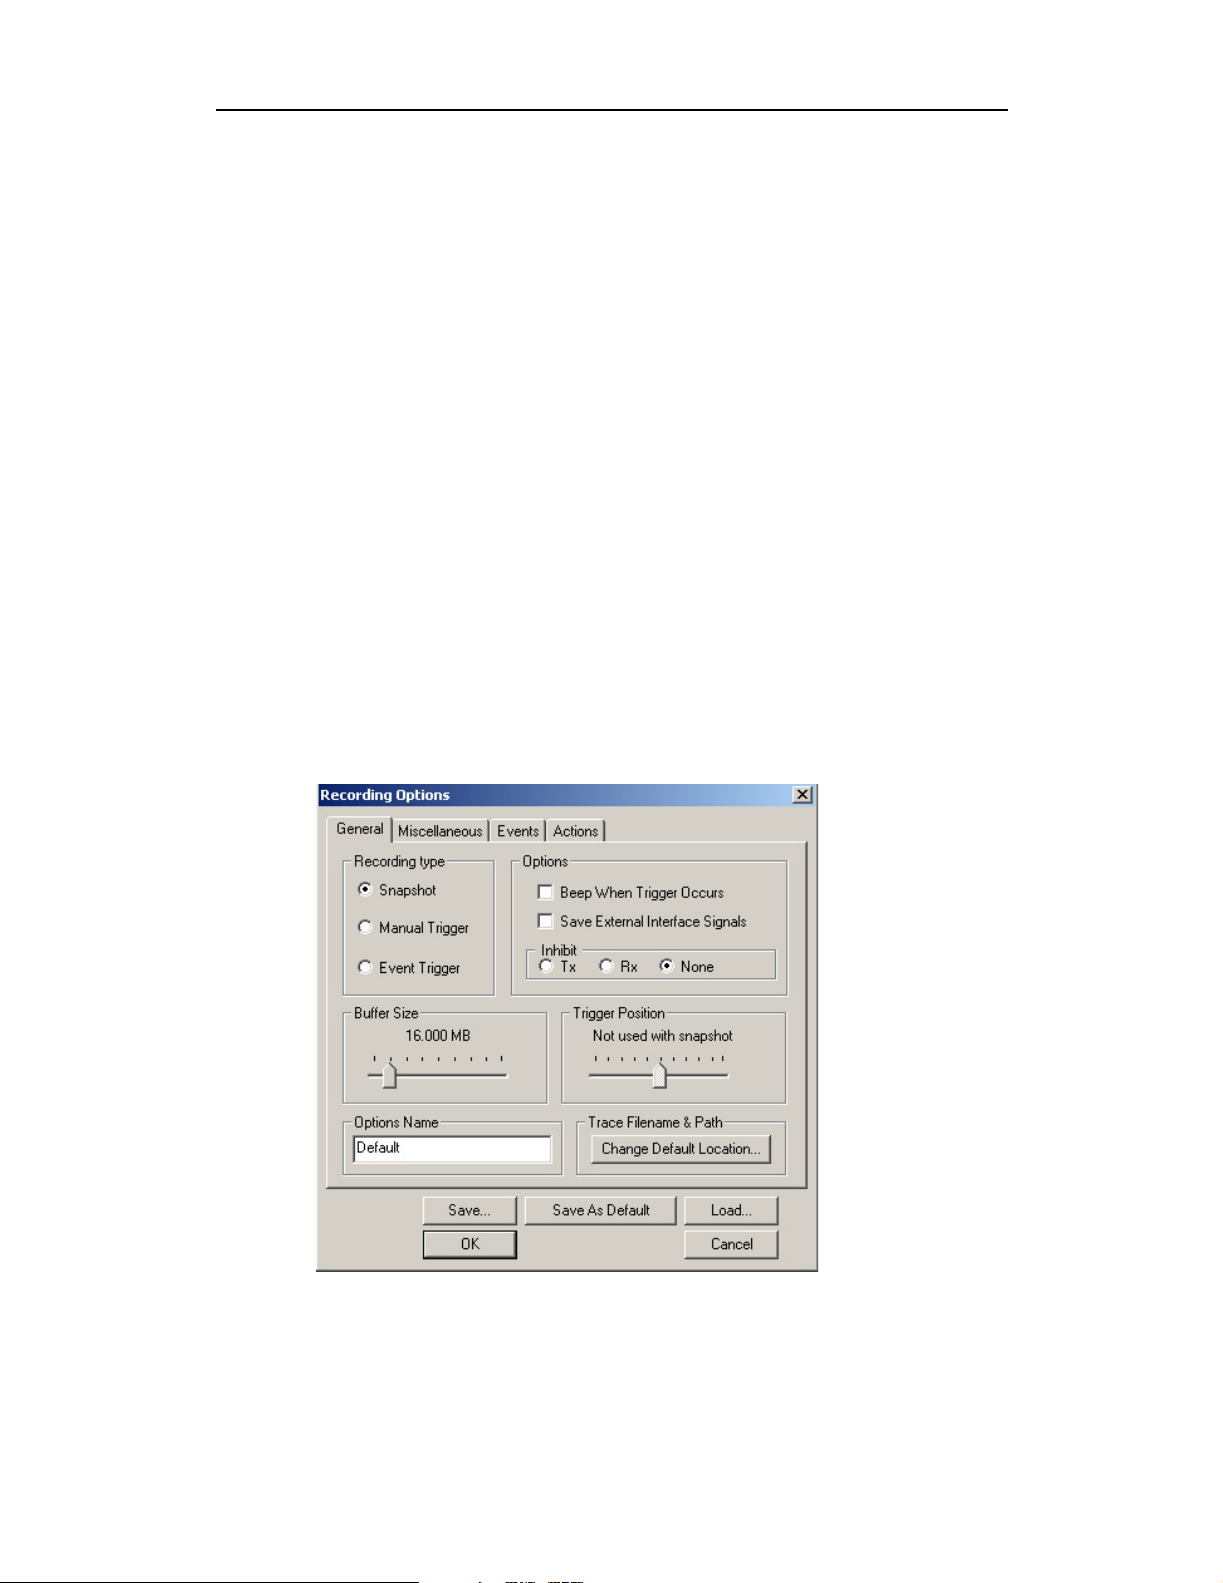
Chapter6 RecordingOptions............................37
OpeningtheRecordingOptionsDialogBox............................37
RecordingOptions-General........................................38
Recordingtype ............................................38
Options ..................................................39
BufferSize ...............................................39
TriggerPosition............................................39
RecordingOptions-Miscellaneous...................................40
1x/4xMode...............................................40
PhysicalLaneOrder........................................41
Resolve Reliable Connections . . ..............................42
RecordingOptions-Events.........................................42
EventsOptions ............................................42
RecordingOptions-Actions........................................53
EventSequences...........................................54
EventCounts..............................................54
ActionsWindowLayout.....................................55
ConnectingEventstoActions.......................................56
TriggeringfromanEventinaSet ....................................59
CreatinganEventSequence.........................................59
CountingEvents..................................................60
TriggeringExternalOutput .........................................62
iv
Page 7

IBTracer 4X Protocol Analyzer User’s ManualCATC SW Version 2.2
Cabling ..................................................62
SettingExternalOutputOptions...............................63
SpecifyingPulseSignalOutputs...............................64
SettingMultipleConditionswithCounters.............................64
SequencingwithCounters ...................................65
Linking Two Events to Two or More Counters . . . ................66
FilteringTraffic ..................................................66
RestartingSequencesandCounters...................................67
RestartingaSequence.......................................67
RestartingaCount..........................................67
SavingRecordingOptions..........................................68
RecordingInfiniBandTraffic........................................68
TrainingRetry ...................................................69
Chapter7 DisplayOptions ..............................71
GeneralDisplayOptions ...........................................71
SavingandLoadingDisplayOptions .................................72
ColorDisplayOptions.............................................73
FormatsDisplayOptions...........................................75
Hiding..........................................................76
CompoundHiding ................................................77
Headers.........................................................79
Chapter8 ReadingaCATCTrace........................81
TraceViewFeatures...............................................81
SetMarker......................................................81
EditorClearMarker ..............................................82
ExpandedandCollapsedFieldFormats................................84
Chapter9 DecodingTraffic..............................87
DecodingandDisplayingTraffic.....................................87
DecodingViatheToolbar....................................87
DecodingViatheDisplayOptionsDialogBox ...................88
DecodingAssignments.............................................89
ToolTips........................................................89
Expanding&CollapsingTraffic .....................................90
MADFormats ...................................................90
MAD,SAandSRPDecoderScriptFiles...............................90
Hiding/DisplayingFieldsviaDecoderScriptFiles ................91
DecodingAssignments.............................................91
Viewing Details about MAD, Subnet Administration and SRP Fields . .......92
ViewingMADorSRPFields.................................92
ViewingSubnetAdministrationfields..........................94
ViewingSAAttributes......................................97
Chapter10 OtherFeatures..............................99
Search..........................................................99
GotoTrigger..............................................99
v
Page 8

IBTracer 4X Protocol Analyzer User’s ManualCATC SW Version 2.2
GotoPacket..............................................99
GotoMarker.............................................100
Goto...................................................100
Find....................................................106
FindNext ...............................................107
DisplayingRaw10bCodes ........................................108
EditComment ..................................................110
FileInformation.................................................110
ErrorSummary..................................................111
TimingCalculations..............................................112
TrafficSummary ................................................114
BusUtilization..................................................114
RealTimeStatistics..............................................118
ExportingPacketsandData........................................120
ResolvingReliableConnections ....................................122
Breaking a Connection .....................................123
CreatingaConnection......................................123
VerificationScripts...............................................123
EditingandCreatingScripts.................................125
Chapter11 HowtoContactCATC.......................127
vi
Page 9
IBTracer 4X Protocol Analyzer User’s ManualCATC SW Version 2.2
1. Overview
The CATC IBTracer™ 4X Protocol Analyzer is the ideal tool for analyzing
InfiniBand link data. Development Engineers will rely on IBTracer 4X
Analyzer to resolve software, firmware, and hardware problems
encountered in the development of InfiniBand host channel adapters,
switches, and other devices. Test and Quality Assurance Engineers will use
IBTracer to verify the correct operation of InfiniBand products and
compliance to the standard. Anyone involved with InfiniBand can use
IBTracer software as a stand-alone viewer to understand the InfiniBand
protocol and to facilitate system level discussions and problem resolution of
applications employing InfiniBand technology.
Please refer to the InfiniBand Specification, version 1.0 for details on the
InfiniBand protocol. The InfiniBand specification is available from the
InfiniBand TA at its web site http://www.infinibandta.org/
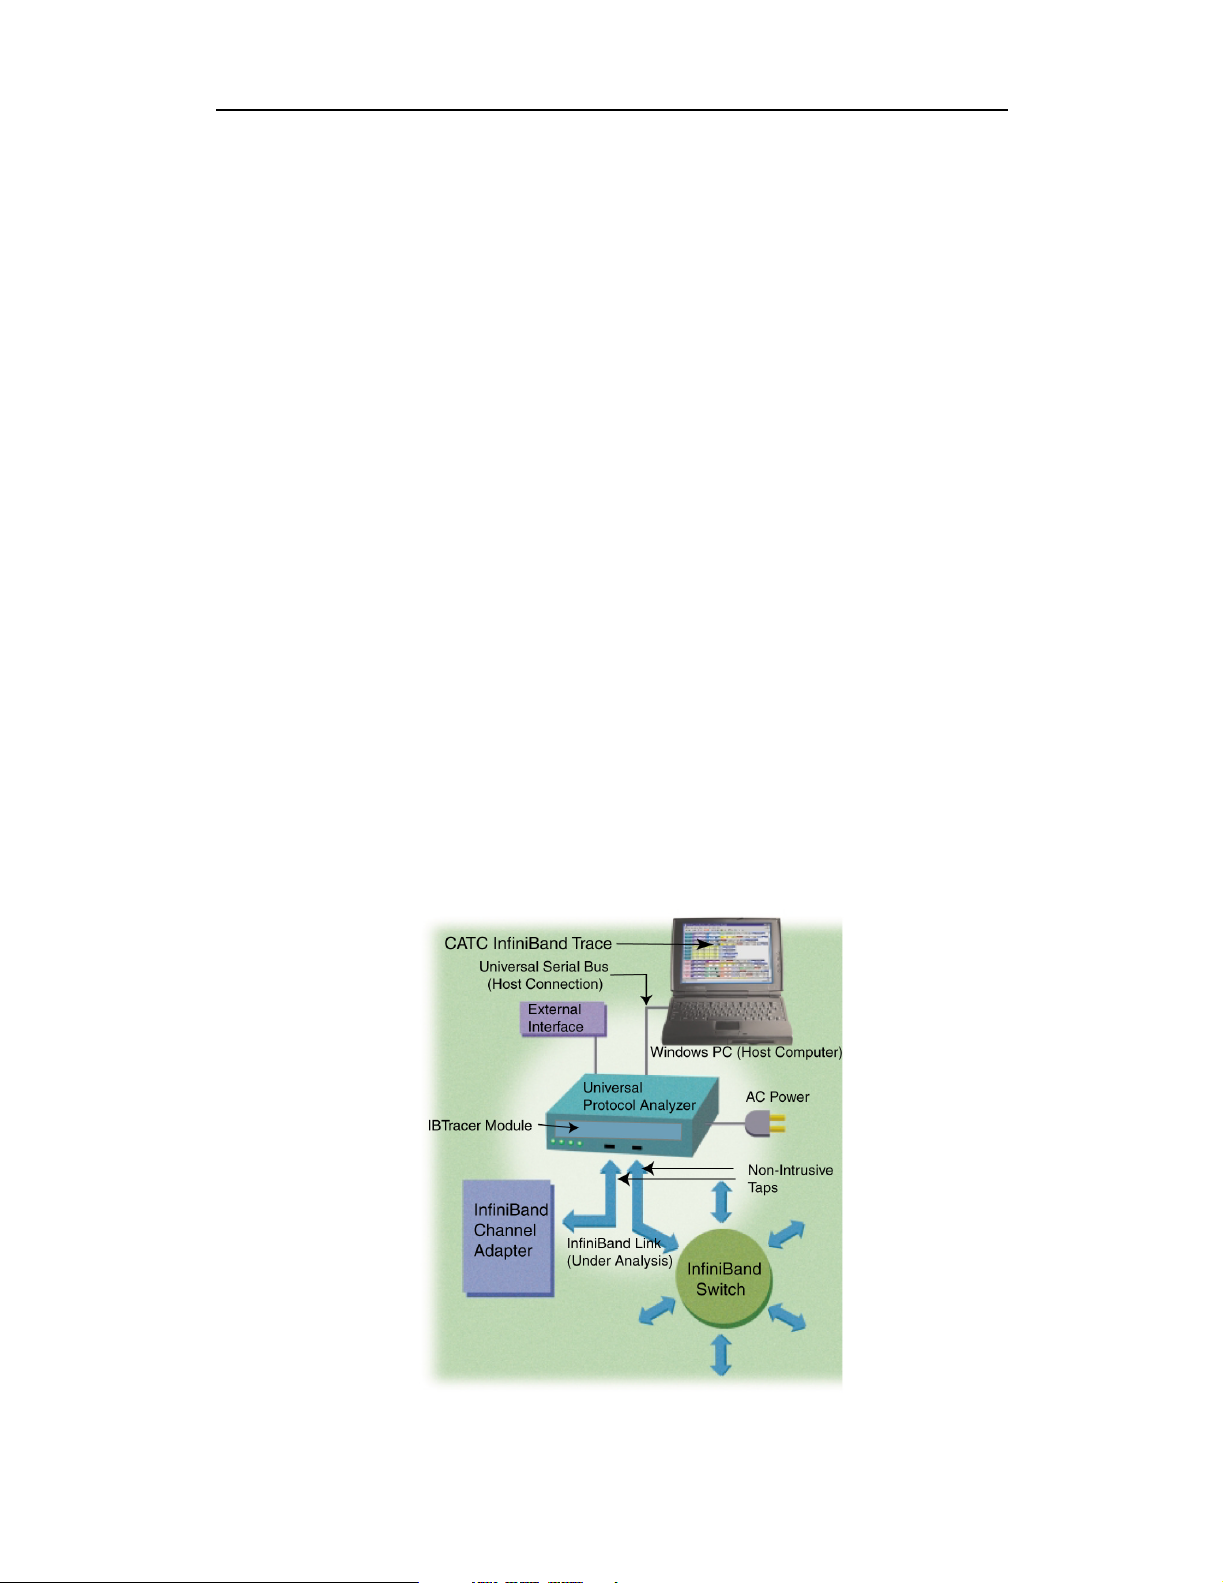
1.1 General Description
IBTracer 4X hardware module installs into the CATC Universal Protocol
Analyzer System (UPAS) 10000. The UPAS 10000 is a base system
designed to accommodate different protocol modules.
Together, IBTracer and the UPAS connect to a portable or desktop PC. This
PC runs the user interface for administering the Analyzer and displaying
traces.
1
Page 10

IBTracer 4X Protocol Analyzer User’s ManualCATC SW Version 2.2
IBTracer 4X is a non-intrusive testing tool for the InfiniBand architecture
providing traffic capture and analysis. Hardware triggering allows real-time
events to be captured. Hardware filtering allows the different types of
packets to be filtered in or out of the recording. Filtering allows users to
focus recordings on events of interest and to preserve recording memory so
that the recording time can be extended.
Recorded data is presented in colored graphics in a trace viewer application.
This application has advanced search and viewing capabilities that allow the
user to quickly locate specific data, errors, and other desired conditions,
thereby focussing the user’s attention on events of interest.
IBTracer 4X Protocol Analyzer functions with any personal computer using
the Windows 98SE, Window 2000, Windows ME, or Windows XP
operating systems and equipped with a functional USB interface.
IBTracer 4X provides on-the-fly detection of and triggering on such events
as Packet Headers and Errors. Whether recording manually or with a
specified trigger condition, IBTracer continuously records the link data in a
wrap-around fashion until manually stopped or until the Trigger Event is
detected and a specified amount of post-Trigger link data is recorded.
Upon detection of a triggering event, the analyzer continues to record data
up to a point specified by the user. Real-time detection of events can be
individually enabled or disabled to allow triggering on events as they
happen. This includes predefined exception or error conditions and a
user-defined set of trigger events. The unit can also be triggered by an
externally supplied signal. An external DB-25 connector provides a path for
externally supplied data or timing data to be recorded along with traffic.
This DB-25 connector also provides a path for IBTracer 4X to transmit
externally two control, timing, or recovered signals for purposes of probing
and use by other circuitry.
The IBTracer software provides powerful search functions that enable
investigation of particular events and allow the software to identify and
highlight specific events. In addition to immediate analysis, you can print
any part of the data. Use the Save As feature to save the data on disk for later
viewing. The program also provides a variety of timing information and
data analysis reports.
2
Page 11

IBTracer 4X Protocol Analyzer User’s ManualCATC SW Version 2.2
1.2 Features
General
• Upgradeable firmware and recording engine
• Software operates stand-alone on any Microsoft Windows 98SE or later
computer as a "Trace Viewer"
• Link and data packets are displayed and fully decoded
• Training sequences are displayed
• Transport level functions are fully decoded with a graphical illustration
of the comprised packets and messages
• Errors at the physical, link, and transport levels are highlighted in red
• Online help
Physical Components
•IBTracer 4X plug-in module
•UPAS/IBTracer 4X can be administered by any desktop or portable
Microsoft Windows-based computer with USB capability
• Convenient Plug-and-Play USB installation
• Taps non-intrusively between two 10 Gbit/sec InfiniBand ports using
two standard cables
• External interface for probing and monitoring auxiliary digital signals
and for cross triggering between other test instruments
Recording Options
• Record up to 2 Gbyte of InfiniBand data, timing and control information
• Three recording modes: Snapshot, Manual Trigger, and Event Trigger
• Selectable recording buffer size and trigger position
• Record the full data rate of a single 4X, 10 Gbit/sec InfiniBand link
• Trigger on InfiniBand conditions like link training sequences or power
off disconnect events
• Trigger on a comprehensive list of error conditions, such as running
disparity, bad packets, or bad variant or invariant CRCs
• Trigger on a sequence of packets to capture messages and transport level
events
• Optionally filter captured data
• Breakout board data
• Counters
3
Page 12

IBTracer 4X Protocol Analyzer User’s ManualCATC SW Version 2.2
Display Options
• Extensive use of color and graphics within the trace
• Packet errors and protocol violations are highlighted in red
• Packet color clearly indicates position before or after the trigger point
• Packets can be marked with text annotations that become tool-tips for
future reference
• Tool-tips with complete definitions of most fields
• Search, show, or hide only the data of interest using InfiniBand-specific
criteria
• Packets are accurately time-stamped (1 symbol time or 4 ns resolution)
• Measure time, throughput, or responsiveness between packet markers or
relative to the trigger position
IBTracer BusEngine
CATC’s BusEngine™ Technology is at the heart of the new IBTracer 4X
Analyzer. The revolutionary BusEngine core uses state-of-the-art Field
Programmable Gate Array (FPGA) technology and incorporates both the
real-time recording engine and the configurable building blocks that
implement data/state/error detection, triggering, capture filtering, external
signal monitoring and event counting and sequencing. Like the
flash-memory-based firmware that controls its operation, all BusEngine
logic is fully field upgradeable, using configuration files that can be
downloaded from the CATC website.
4
Page 13

IBTracer 4X Protocol Analyzer User’s ManualCATC SW Version 2.2
1.3 Specifications
IBTracer is a hardware module that installs into the Universal Protocol
Analyzer System. The following specifications describe a combined
IBTracer 4X Universal Protocol Analyzer System.
Package
Connectors: AC power connection
Host connection (USB2.0, type "B")
Recording Channel
Power Requirements
90-254 VAC, 47-63 Hz, 165W maximum (universal input)
Environmental Conditions
Operating Range: 0 to 40 °C (32 to 104 °F)
Storage Range: -20 to 80 °C (-4 to 176 °F)
Humidity: 10 to 90%, non-condensing
Switches
Power: On/off
Manual Trigger: When pressed forces a trigger event
LEDs
Status: Illuminated when the analyzer is powered on.
Probing Characteristics
Connection: receptacles
Standard cables
Recording Memory Size
2 GBytes for trace capture, timing, and control information.
5
Page 14

IBTracer 4X Protocol Analyzer User’s ManualCATC SW Version 2.2
Basic Trigger Events
Conditions: Training sequences, Link Packets, Data Packets
Cable disconnect/connect
PacketPatterns: VLT,LID,Opcode,QP,AETH,LRM,BTM,Data,
Immediate data, Sixteen aligned data bytes, MAD types
Errors: Invalid 10b codes
Wrong running disparity of 10b codes
End of bad packet
Packet delimiters violations
Certification
FCC (Class A), CE Mark
6
Page 15

IBTracer 4X Protocol Analyzer User’s ManualCATC SW Version 2.2
2. Quick Installation
IBTracer 4X is a factory-installed hardware module that is sold as part of
the CATC Universal Protocol Analyzer System 10000 (UPAS).
The UPAS 10000 together with the IBTracer 4X module and associated
software are easily installed on most Windows-based personal computer
systems. You can begin making InfiniBand™ recordings after following
these initial steps. However, if you are unsure about what to do after reading
the Quick Installation instructions, or if your analyzer does not work after
you follow these instructions, read through the sections in this manual.
2.1 PC Requirements
IBTracer 4X is administered by a PC. This PC needs to have the following
features in order to be able to communicate with the Analyzer:
• A USB port (USB 2.0 recommended). All communications between the
PC and the analyzer pass across a USB cable. If the PC is being used only
as a trace viewer, then the USB port is not necessary.
• Microsoft Windows 98SE, Windows ME, Windows 2000, or
Windows XP for recording and viewing traffic.
• Physical RAM should be a minimum of 128 MB. The amount you use
should be at least equal to the amount of your largest recording. For
example, if you plan to make 2-Gbyte recordings, then your PC should
have 2048 MB of RAM.
2.2 Setting Up the Analyzer
Step 1 Remove the IBTracer 4X/UPAS from its shipping container.
The IBTracer 4X module will already be installed in the UPAS.
Step 2 Connect the AC power cable to the rear of the UPAS.
Step 3 Connect the USB cable between the USB port on the back of the
Analyzer and a USB port on the PC.
Step 4 Turn on the power switch located on the rear of the Analyzer.
Step 5 Insert the IBTracer 4X CD into the PC that will be controlling the
analyzer.
Step 6 Follow on-screen Plug-and-Play instructions for the automatic
installation of the IBTracer Analyzer as a USB device on your PC
(the IBTracer CD includes the required USB files).
7
Page 16
IBTracer 4X Protocol Analyzer User’s ManualCATC SW Version 2.2
2.3 Installing the Software
Step 1 Run the setup program (for example,Start>Run>d:\setup)and
follow the on-screen instructions to install the IBTracer application
on the analyzing PC hard disk.
Step 2 To start the application, launch the CATC IBTracer 4X program
from the Start Menu: Start>Programs>CATC>IBTracer.
2.4 Your First InfiniBand Recording
After installing and launching the software, you can test IBTrace r 4X by
following these steps:
Step 1 Plug in a InfiniBand cable to each of the two ports on the IBTracer
4X module, and then connect the other ends to the device under test.
Step 2 Select Recording Options under Setup on the Menu Bar.
Step 3 Select the General tab.
The following dialog box will open showing factory default settings
such as “Snapshot” and 16 Mbytes buffer size. For your first
recording, you can leave these settings unchanged.
Step 4 Click OK to activate the recording options you selected.
Step 5 Turn on the InfiniBand devices that are to be tested and cause them
to generate InfiniBand traffic.
8
Page 17

IBTracer 4X Protocol Analyzer User’s ManualCATC SW Version 2.2
Step 6 Click on the Tool Bar.
IBTracer 4X starts to record the InfiniBand traffic immediately.
After 4 Mbytes of traffic is recorded, the analyzer will upload the
data and display the packets in the trace window.
Step 7 If you wish to terminate the recording before the snapshot
automatically completes, click on the Tool Bar.
When the recording session is finished, the traffic is uploaded from
the Analyzer to the hard drive on your PC as a file named data.ibt
or whatever name you assigned as the default filename. While the
file is being uploaded, you should see a white progress bar at the
bottom of the screen. When the bar disappears, it indicates that the
data has been uploaded to disk.
Step 8 To save a current recording for future reference, select File > Save
As on the Menu Bar.
OR
Click on the Tool Bar.
You see the standard Save As screen.
Step 9 Give the recording a name and save it to the appropriate directory.
9
Page 18
IBTracer 4X Protocol Analyzer User’s ManualCATC SW Version 2.2
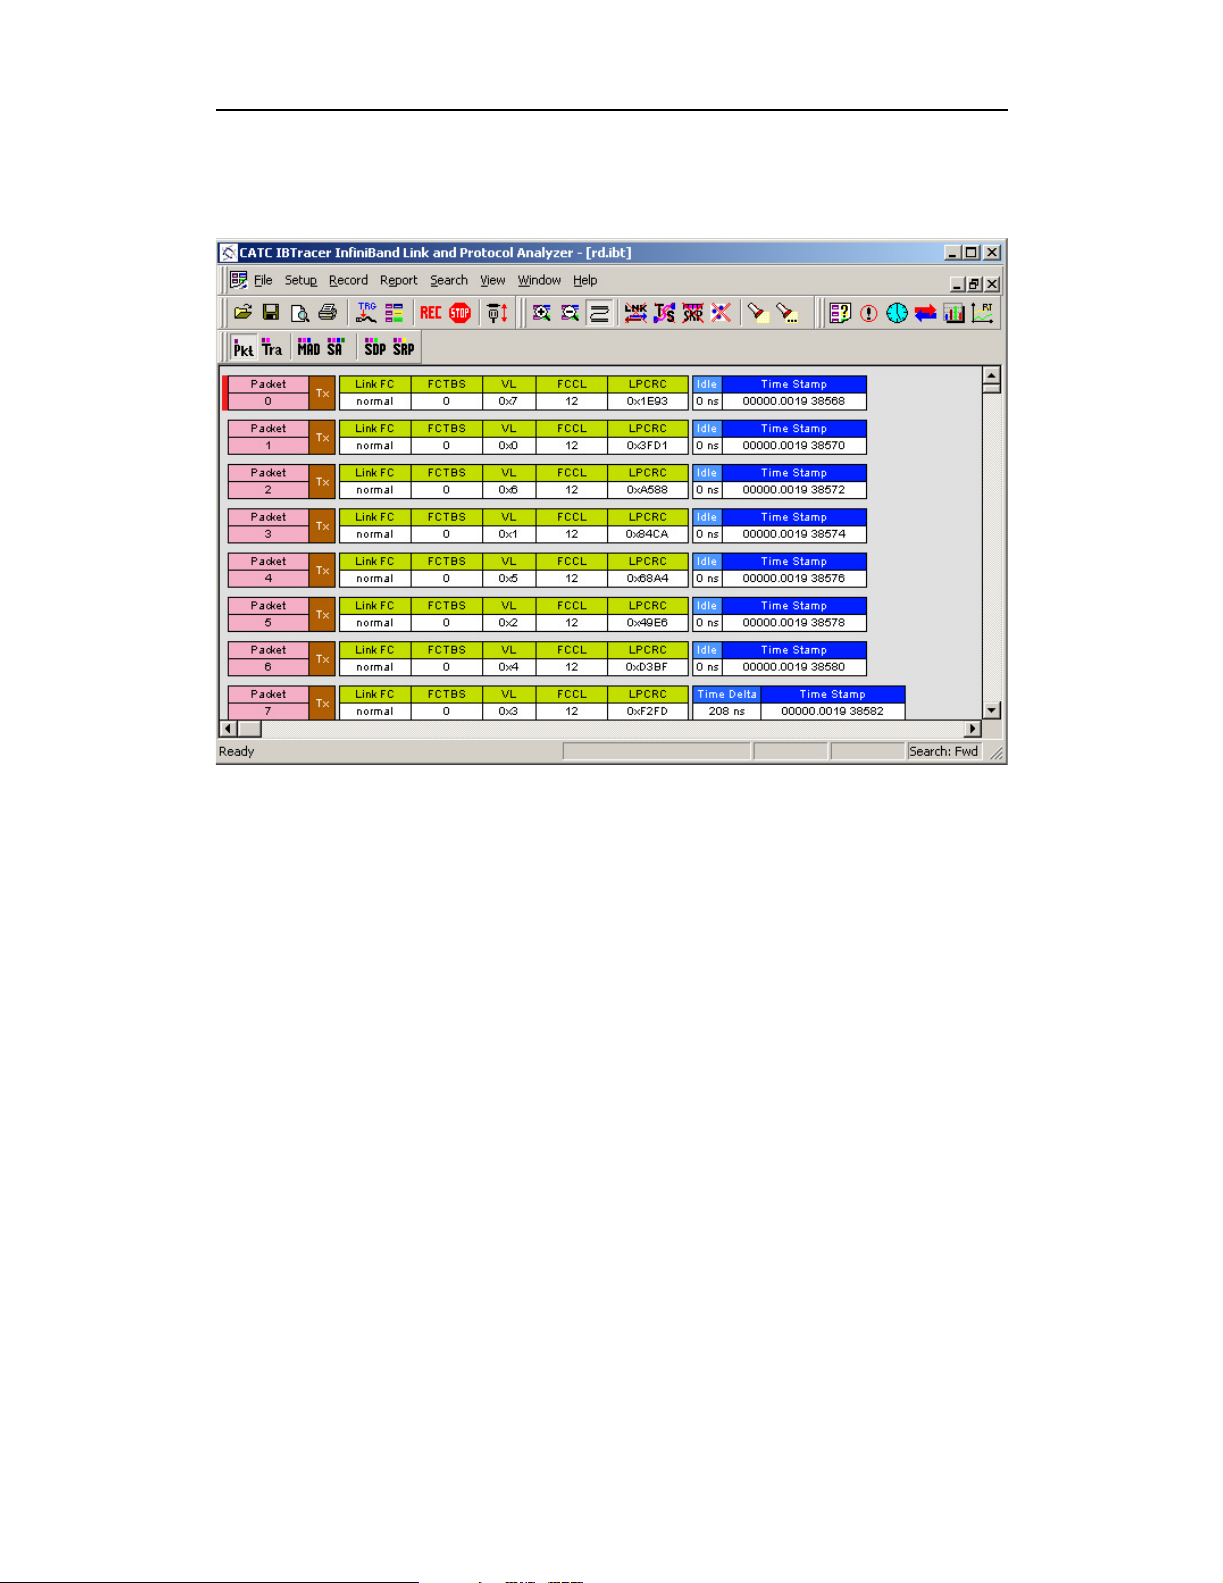
Capturing Your First CATC Trace
After a few moments, the recording will end and the results will display.
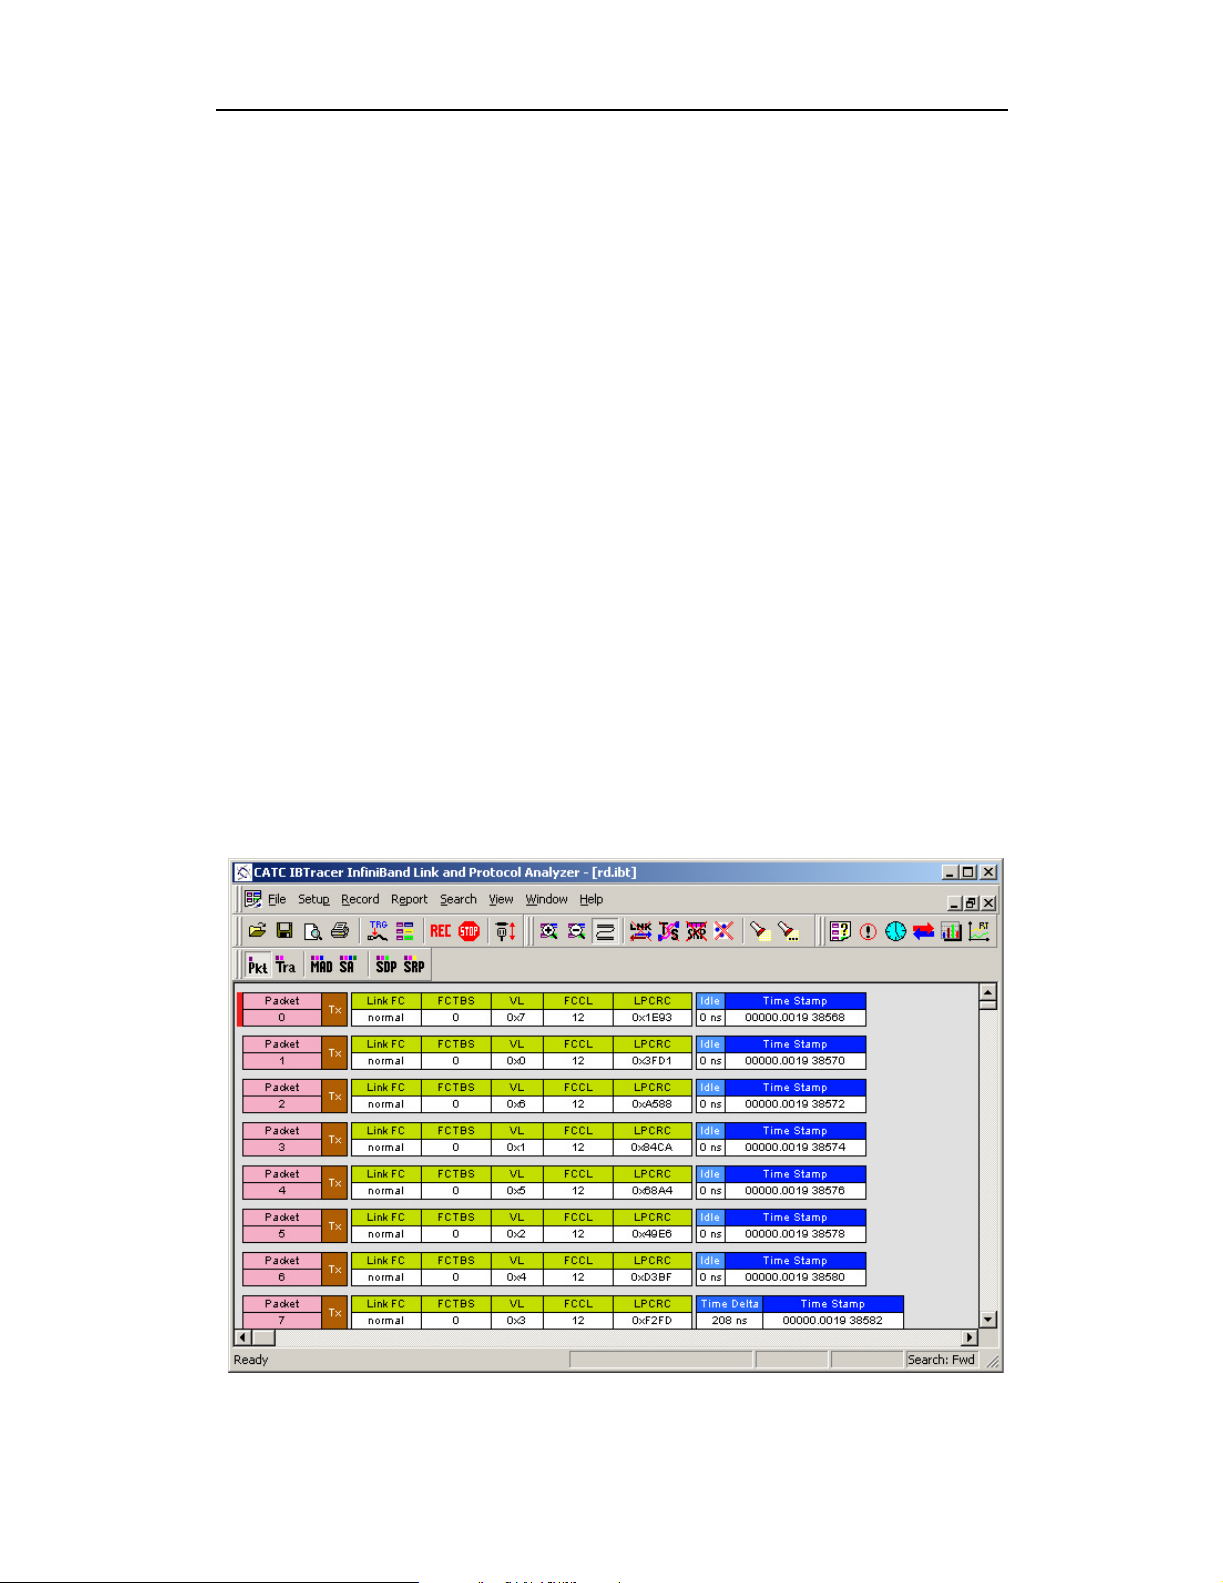
Trace View Features
•TheIBTracer packet view display uses color and graphics
extensively to fully document the captured traffic.
• Packets are shown on separate rows, with their individual fields
both labeled and color coded.
• Packets are numbered sequentially, as recorded and time-stamped
with a resolution of 1 symbol time or 4 ns.
• Display formats can be named and saved for later use.
• Pop-up Tool Tips annotate packet fields with detailed
information about their contents.
• Data fields can be collapsed to occupy minimal space in the
display (which can in turn be zoomed in and out to optimize
screen utilization).
• The display software can operate independent of the hardware
and thus can function as a stand-alone Trace Viewer that can be
freely distributed.
10
Page 19
IBTracer 4X Protocol Analyzer User’s ManualCATC SW Version 2.2
3. Detailed Installation
3.1 System Components/Packing List
• One stand-alone IBTracer 4X Analyzer module
• One Universal Protocol Analyzer System 10000 Chassis
• One USB cable
• One 6-foot (2-meter) 4x to 4x cable
• Two 6-foot (2-meter) Infiniband 4x to 1x cables
• One DB-25 parallel cable
• One UPAS External Breakout Board
•IBTracer 4X software program installation CD-ROM
• Product documentation
3.2 The Installed IBTracer 4X Unit
If you purchased an IBTracer 4X module with a UPAS, the IBTracer 4X
module will arrive inserted into the UPAS. Upon power up, the installed
IBTracer 4X Analyzer will activate the user-accessible controls and LEDs
on the front and rear panels of the UPAS.
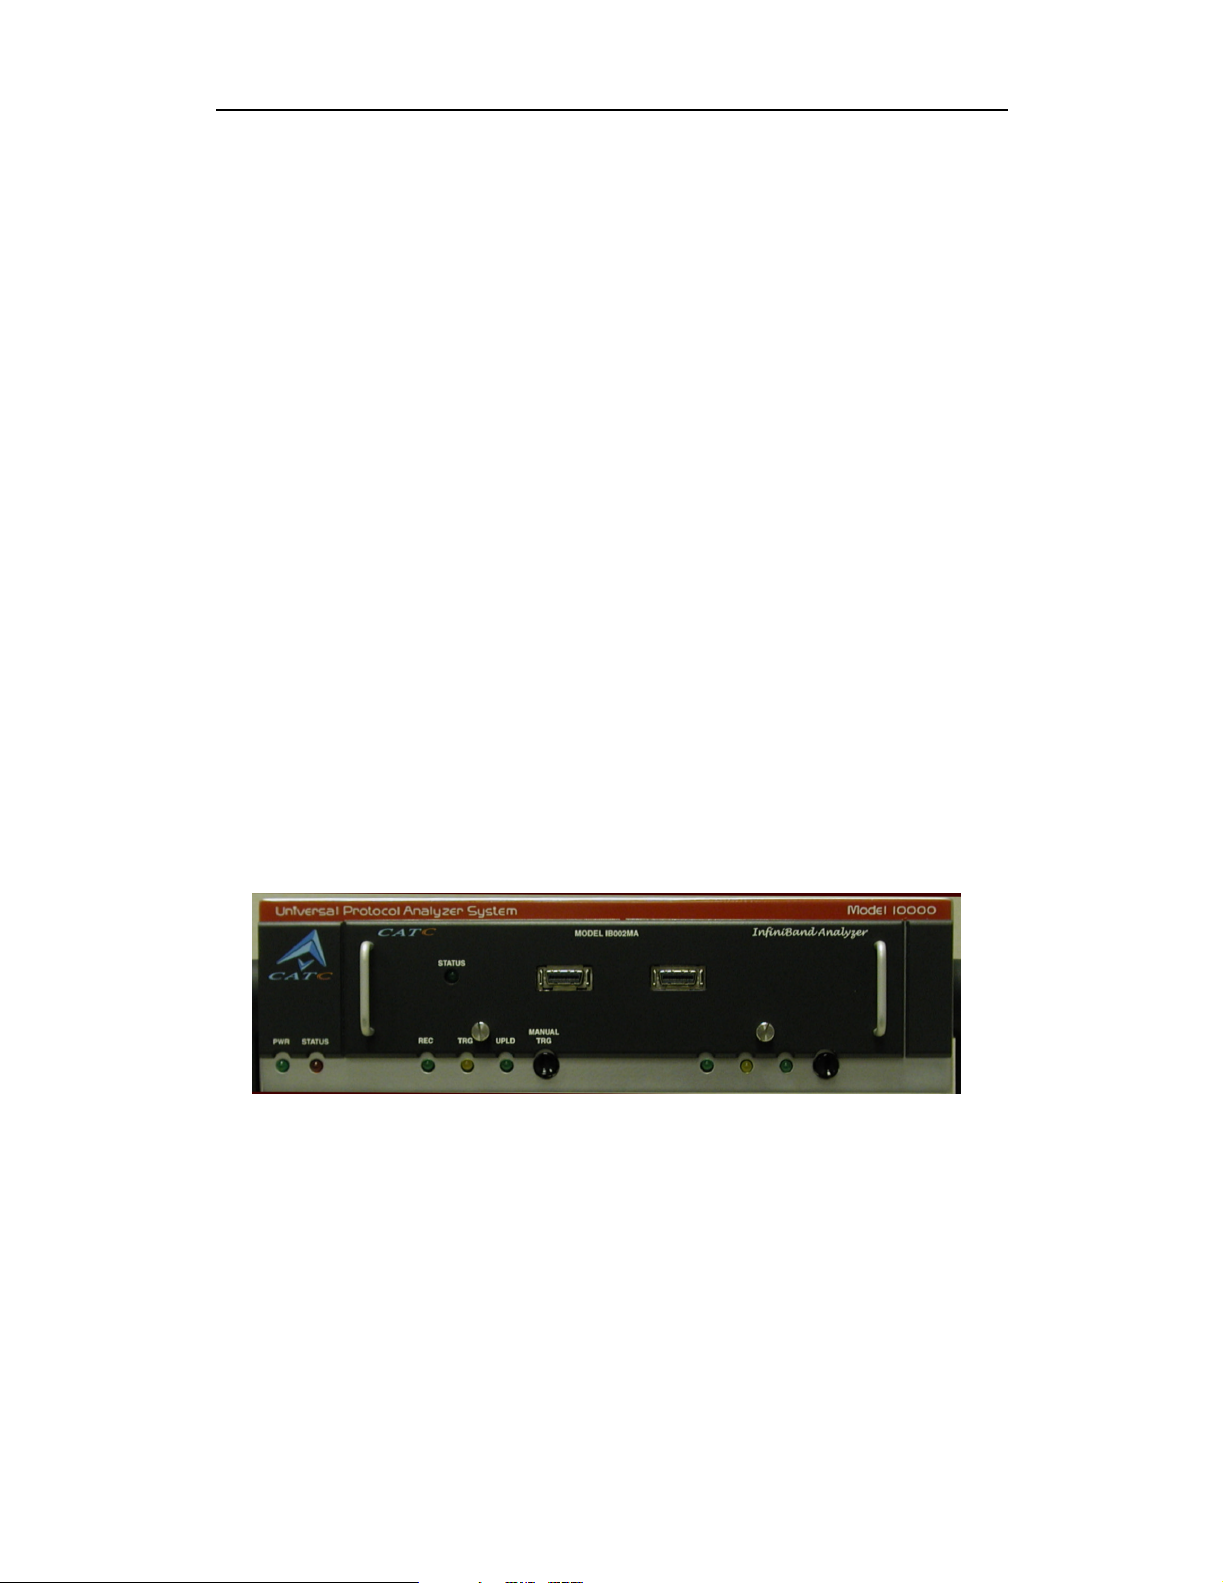
Figure 1: Front Panel
LED and Button Descriptions
If you look at the front panel, you will see LEDs, buttons, and connectors.
Left-most LEDs
•GreenPWR (power) indicator LED for UPAS (lights when the unit
power is switched on).
•RedStatus indicator LED for UPAS (lights during the boot up).
11
Page 20
IBTracer 4X Protocol Analyzer User’s ManualCATC SW Version 2.2
Center-most LEDs and Button
The LEDs and button on the UPAS enclosure function in conjunction with
the IBTracer 4X module inserted above it.
•GreenREC (recording) LED (lights when the unit is recording).
• Orange TRG (triggered) LED (lights when the unit triggers an event).
•GreenUPLD (Upload) (lights when unit is uploading data to PC).
• MANUAL TRG (Manual Trigger) push-button (allows a manual Trace
capture).
Right-most LEDs and Button
The LEDs and button under the right module slot are reserved for future
releases of hardware modules.
•GreenREC (recording) LED (lights when the unit is recording).
• Orange TRG (triggered) LED (lights when the unit triggers an event
TRG also lights during power-on testing and will be turned off at the end
of the power on cycle. If the LED blinks at the end of this cycle, the
hardware is faulty).
•GreenUPLD (Upload) LED (lights when unit is uploading data to PC).
• MANUAL TRG push-button (allows a manual Trace capture).
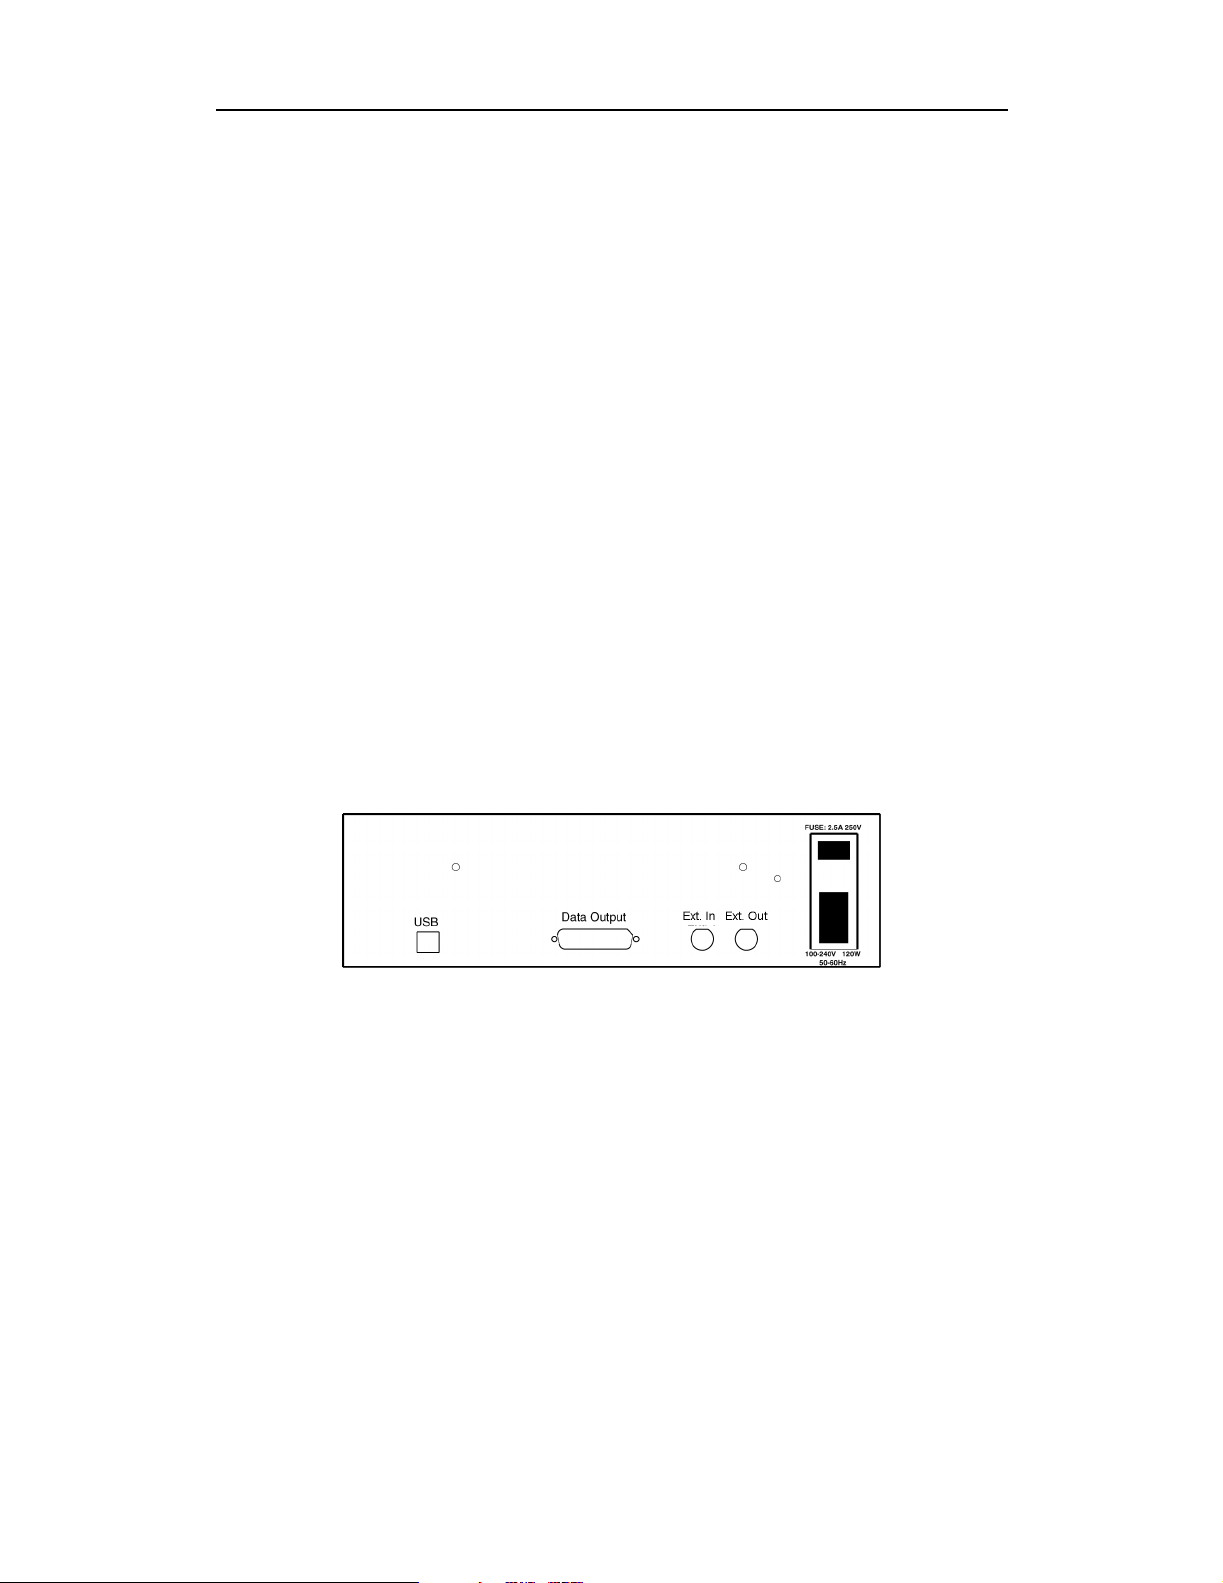
Figure 2: Universal Protocol Analyzer Rear Panel and its connectors
• Wide range AC connector module
— Power socket
— Enclosed 5x20 mm 2.0A 250 V fast acting glass fuse
Warning: For continued protection against fire, replace fuse only with the
type and rating specified above.
— Power on/off switch
• Two External Ports marked Ext. In and Ext. Out
• USB 2.0 type B host computer connector
• Data In/Out DB-25 (25-pin) external interface connector
12
Page 21

IBTracer 4X Protocol Analyzer User’s ManualCATC SW Version 2.2
Warning: Do not open the UPAS enclosure. There are no
user-serviceable parts inside. Refer servicing to CATC.
3.3 IBTracer 4X System Setup
IBTracer 4X and UPAS are connected via USB to a desktop or laptop PC.
The PC, in turn, is used to administer the Analyzer and display traces.
To set up the Analyzer and PC,
Step 1 If needed, insert the IBTracer 4X module into the UPAS.
Step 2 Connect the UPAS to an AC power source.
Step 3 Connect the Analyzer to the analyzing PC via USB.
Step 4 Connect InfiniBand cables to the devices under test.
Step 5 Install IBTracer software.
Step 6 Create a recording.
3.4 AC Power Source
Step 1 Connect the Analyzer box to a 100-volt to 240-volt, 50 Hz to 60 Hz,
165 W power outlet using the provided power cord.
Note The Analyzer is capable of supporting supply voltages between
100-volt and 240-volt, 50 Hz or 60 Hz, thus supporting all
known supply voltages around the world.
Step 2 Use the power switch located on the rear panel to turn the analyzer
unit on and off.
Note At power-on, the Analyzer initializes itself in a few seconds and
then performs an exhaustive self-diagnostic that lasts about 20
seconds. The Status LED illuminates during the power-on
testing and turns off when testing is finished. If the diagnostics
fail, the Status LED blinks, indicating a hardware failure. If this
occurs, call CATC Customer Support for assistance.
13
Page 22

IBTracer 4X Protocol Analyzer User’s ManualCATC SW Version 2.2
3.5 PC Connection
Use the USB cable provided to connect the host computer to the UPAS.
• At least 20 MB hard disk space is required, plus additional memory for
recordings (as much as 2 Gbytes or more when recording a full buffer
size).
• Monitor resolution is at least 800x600 with thousands of colors.
3.6 InfiniBand Cable Connection
CATC provides two 1x-to-4x InfiniBand cables and one 4x InfiniBand
cable. The 1x-to-4x cables are actually 1x cables with 4x connectors. These
cables allow you to connect 1x devices to IBTracer 4x.
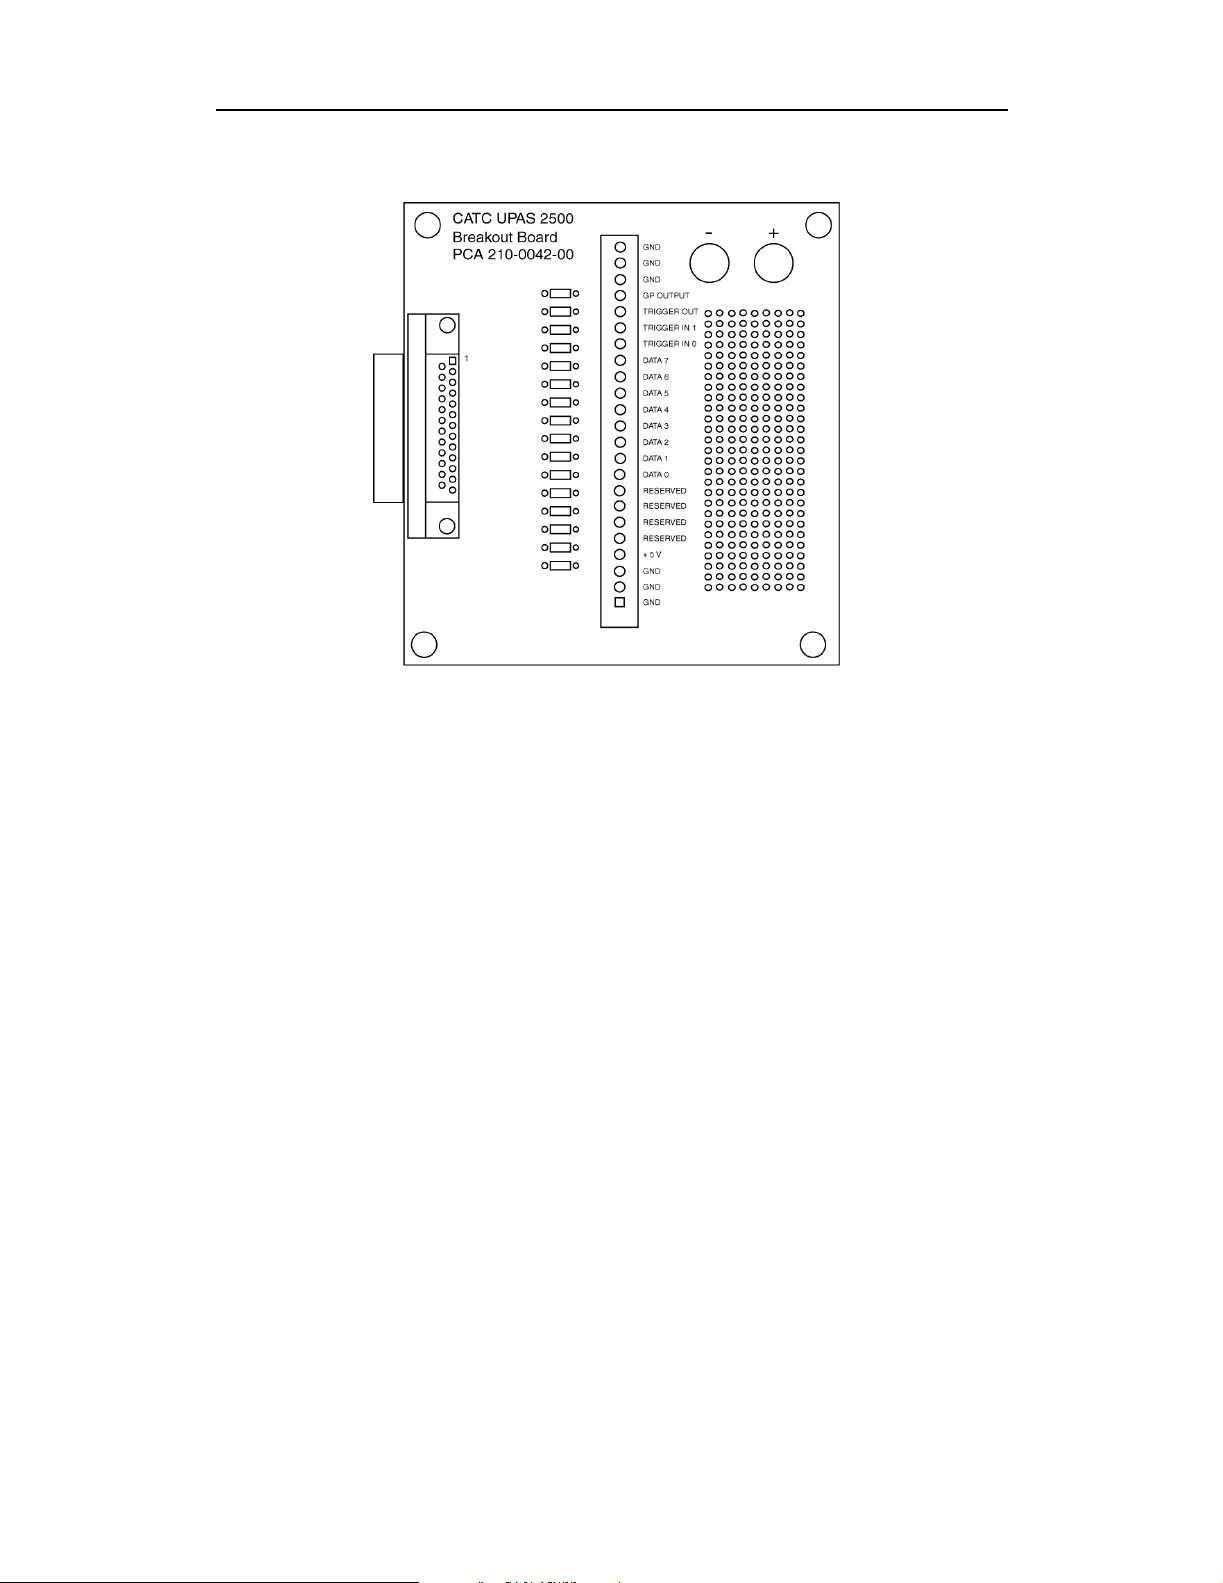
3.7 External Interface Breakout Board
The External Interface Breakout Board is an accessory that allows
convenient access to several potentially useful standard, LVTTL output and
input signals. It also offers a simple way to connect logic analyzers or other
tools to the IBTracer 4X Analyzer unit. Six ground pins and one 5-volt pin
are provided.
The Breakout Board connects via a cable to the Data In/Out connector
located on the rear of the analyzer box. Each signaling pin on the breakout
board is isolated by a 100Ω series resistor.
Figure 3: Data In/Out Cable Connector
Pin-Outs for the Data In/Out Connector
The following table lists the pin-out and signal descriptions for the Data
In/Out connector. This pin-out is for a cable connector that connects to the
breakout board.
14
Page 23

IBTracer 4X Protocol Analyzer User’s ManualCATC SW Version 2.2
Data In/Out Connector – Pin-Out
Pin Signal Name Signal Description
1RSV Reserved
2 GND Ground
3 GP OUT General Purpose Output
4 TRG IN 1 Trigger In 1
5 GND Ground
6DATA6 Data6
7DATA4 Data4
8DATA3 Data3
9DATA1 Data1
10 GND Ground
11 RSV Reserved
12 RSV Reserved
13 +5V +5 Volts, 250 mA DC Source
14 RSV Reserved
15 GND Ground
16 TRG OUT Trigger Out
17 TRGIN0 TriggerIn0
18 DATA 7 Data 7
19 DATA 5 Data 5
20 GND Ground
21 DATA 2 Data 2
22 DATA 0 Data 0
23 GND Ground
24 RSV Reserved
25 RSV Reserved
Note (*) Pins 4 and 17 have the same function: they allow external
signals to be used to cause triggering or recording. Pins 3 and 16
are used to transmit output signals.
15
Page 24
IBTracer 4X Protocol Analyzer User’s ManualCATC SW Version 2.2
Figure 4: External Interface Breakout Board
Prototype Rework Area
The Breakout Board contains a prototype rework area for making custom
circuits for rapid development. The area consists of plated-through holes, 20
columns wide by 27 rows long. The top row of holes is connected to GND
and the bottom row is connected to +5V. The remaining holes are not
connected. Use the rework area to insert custom components and wire-wrap
their respective signal, power, and ground pins.
3.8 IBTracer Program Installation
The CATC IBTracer software is provided on CD-ROM and requires a
Windows 98SE, Windows 2000, Windows ME, or Windows XP operating
system.
Note The USBTracer program can be installed on any Windows 98SE
or later operating system (including NT 4.0) as a "Trace
Viewer." That is, it may be used to view, analyze, and print data
that was collected and saved on another system even if it does
not have an Analyzer attached.
Loading the USBTracer USB Drivers
Step 1 Insert the USBTracer program CD-ROM into your PC.
16
Page 25
IBTracer 4X Protocol Analyzer User’s ManualCATC SW Version 2.2
Step 2 Power-on the USBTracer Analyzer.
Step 3 Connect the USB cable to the rear of the analyzer and to the personal
computer.
The host operating system detects the Analyzer and begins to install
the USB driver.
Note When Windows prompts you for a file, browse to the CATC CD.
If this is a first time installation, the ctcupa10.sys (UPAS) and
ib4trcer.sys (USB) drivers must also be installed.
Installing the USBTracer Application Program
Run setup.exe from the USBTracer CD-ROM.
The CATC USBTracer Install Wizard automatically installs the necessary
files to the computer’s hard drive. USBTracer software is installed in the
C:\Program Files\CATC\IBTracer directory unless you specify otherwise.
Follow the installation instructions on your screen.
3.9 IBTracer Program Startup
You can start the IBTracer program from the desktop or from the installed
directory. The program always begins with its main screen active:
17
Page 26

IBTracer 4X Protocol Analyzer User’s ManualCATC SW Version 2.2
When the program is used with the USBTracer Protocol Analyzer attached
to the computer, you can set trigger conditions, record, monitor, and analyze
the activity of your InfiniBand device or fabric. When used without the
Analyzer, the software serves as a Trace Viewer for viewing traces made on
other systems.
3.10 Making a Recording
After installation, the software is configured to make a Snapshot recording
of InfiniBand traffic.
To make your first recording of this traffic,
Step 1 Connect InfiniBand cables to both InfiniBand connectors on the
front panel of the IBTracer 4X module and plug the other ends into
the device under test.
Step 2 Cause the device under test to generate InfiniBand traffic.
Step 3 Click on the Tool Bar.
After 16 Mbytes of traffic is recorded, the analyzer will upload the
data and display the packets.
To terminate the recording before Inquiry timeout occurs,
Step 4 Click on the Tool Bar at any time before recording
automatically terminates.
When the recording session is finished, the traffic is saved to the
hard drive as a file named data.ibt or whatever name you assign as
the default filename.
To save a current recording for future reference,
Step 5 Select Save As under File on the Menu Bar.
OR
Click on the Tool Bar.
You see the standard Save As screen.
Step 6 Give the recording a unique name and save it to the appropriate
directory.
18
Page 27
IBTracer 4X Protocol Analyzer User’s ManualCATC SW Version 2.2
4. Updates
As modifications are made to the IBTracer Analyzer, it is necessary to
update the IBTracer software, firmware, and/or BusEngine optimal
performance. Updates can be performed either automatically or manually.
This chapter describes both procedures.
4.1 Software, Firmware, and BusEngine Revisions
The Readme.txt file on the first installation disk or CD-ROM and in the
installed directory gives last-minute updates about the current release.
Included with each release are the most recent downloadable images of the
Firmware and the BusEngine. The Readme.txt file lists the latest versions
and informs you if new Firmware or a new BusEngine needs to be updated
in your hardware.
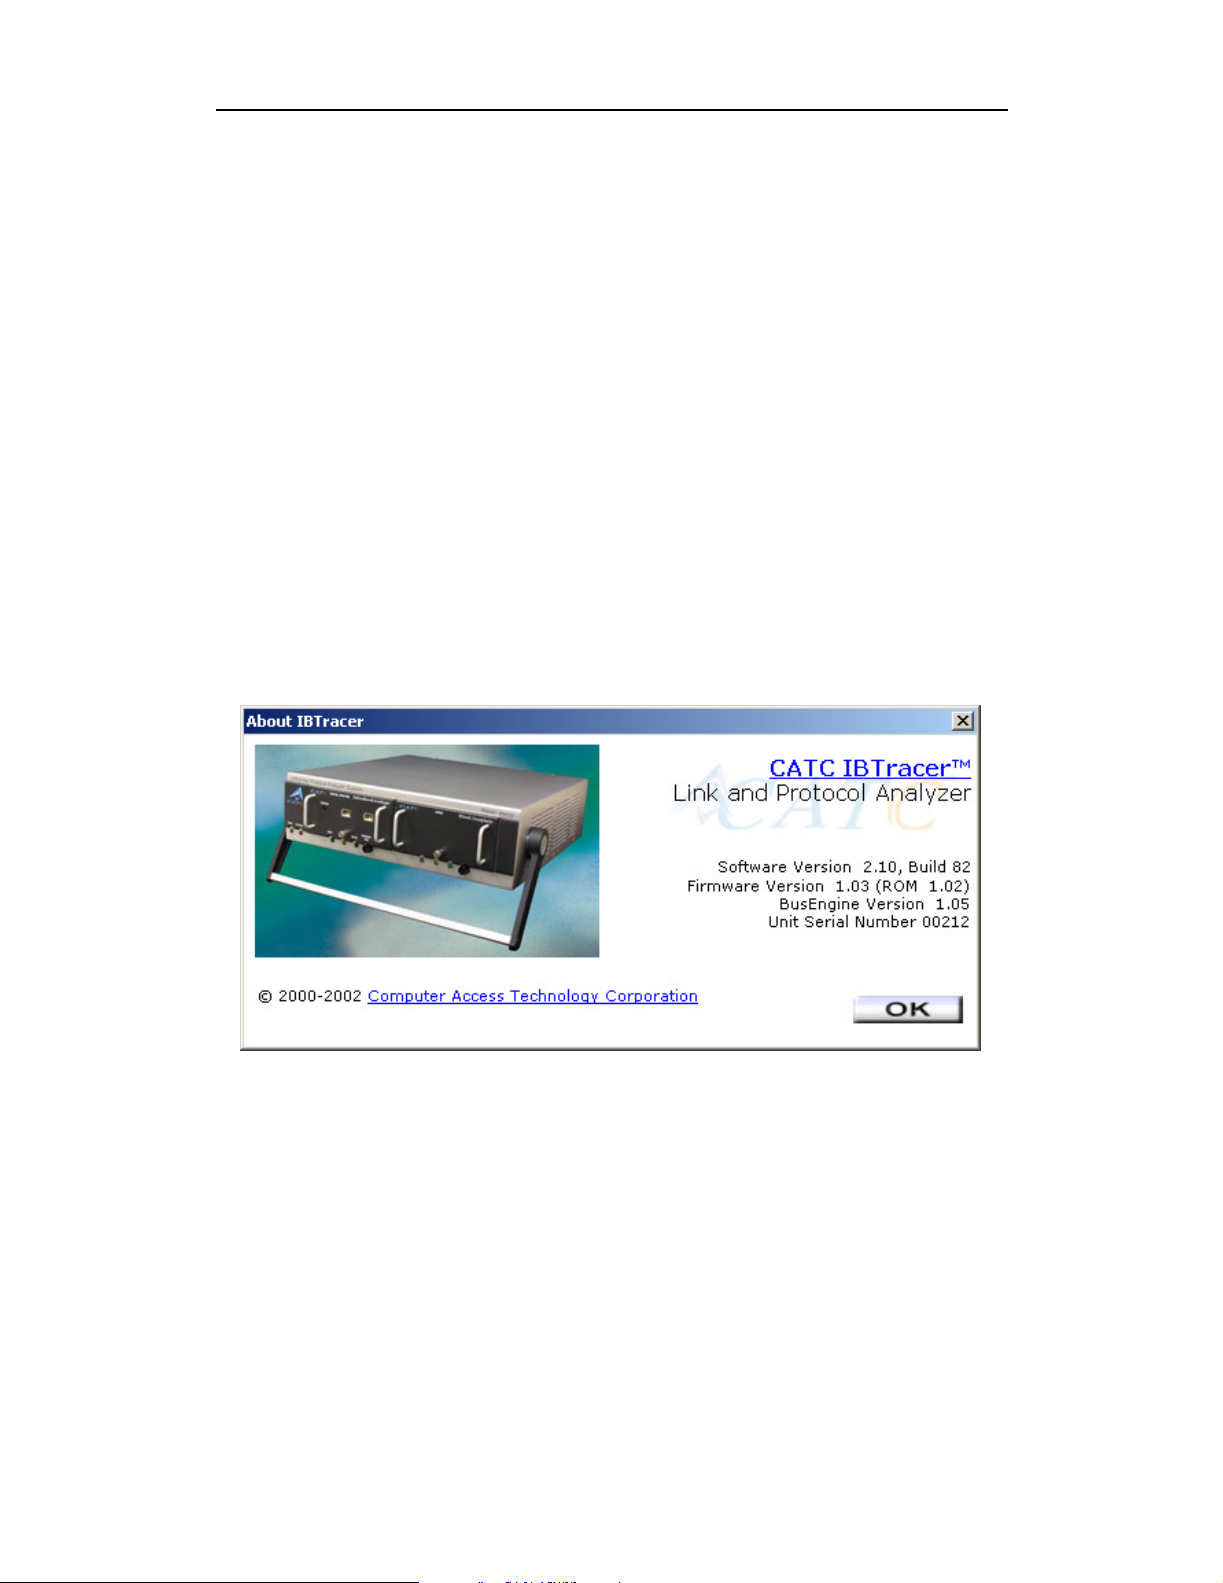
Once the Analyzer has completed the self diagnostics and is connected to
the PC, you can check the latest revision of the software and BusEngine by
selecting About IBTracer from the Help menu:
About IBTracer details revisions of the following software and hardware:
•IBTracer Software Version
•IBTracer Firmware & ROM Versions
• BusEngine Version
• Unit Serial Number
Note When contacting CATC for technical support, please have available
all the revisions reported in the About IBTracer... window.
19
Page 28

IBTracer 4X Protocol Analyzer User’s ManualCATC SW Version 2.2
4.2 Software Updates
When a new IBTracer software release is available, it is posted on the
Support page of the CATC website at www.catc.com/support.html.
To update the IBTracer software,
Step 1 In the About IBTracer screen,verifywhichversionofIBTracer
Software you are currently running.
Step 2 Find the latest released software version on the CATC website under
www.catc.com/support.
If you are running the latest version of the software, no further
action is needed.
If you are not running the latest version, continue to Step 3.
Step 3 Click on the first link to download the zipped Disk 1 files for your
operating system.
Step 4 Unzip the files into your choice of directory.
Step 5 Click Start, then Run, and browse to where you unzipped the files.
Step 6 Select the program named Setup and click Open.
Step 7 Click OK to run the Setup and begin the installation.
Step 8 Follow the on-screen instructions to complete the installation.
Step 9 Read the Readme file for important information on changes in the
release.
4.3 License Information
Licensing information for IBTracer canbeviewedbyselectingDisplay
License Information from the Help menu. The License window provides
maintenance expiration and features data for IBTracer.
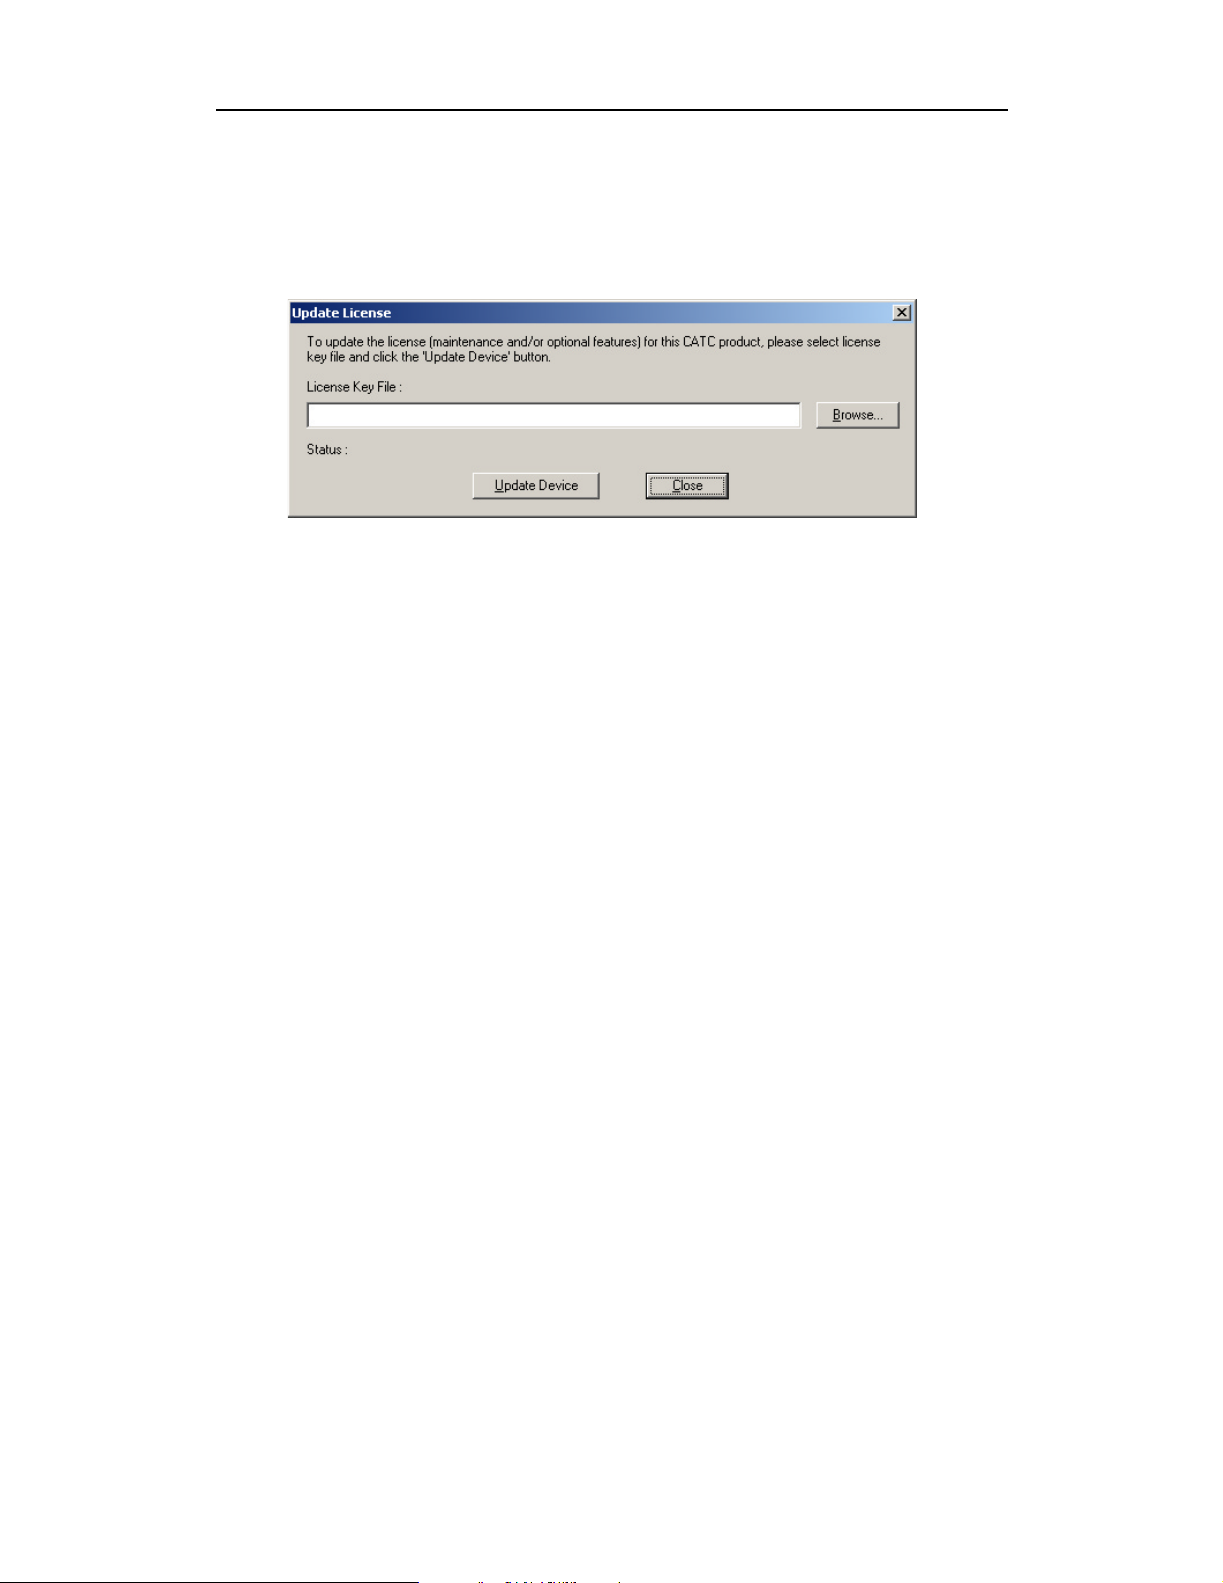
Updating the Software License
License keys are necessary to enable software maintenance and SDP and
SRP decoding. If they are not enabled, a message appears if an attempt is
made to access these features, stating that a license key is necessary to in
order to use the features.
20
Page 29
IBTracer 4X Protocol Analyzer User’s ManualCATC SW Version 2.2
To access these tools, a License Key must be obtained by CATC. Once the
License Key is obtained, follow these steps to install it:
Step 1 From the Help menu, select Update License. The Update License
dialog appears.
Step 2 Enter the path and filename for the License key or use the Browse
button to navigate to the directory that contains the License Key.
Step 3 Select the *.lic file, and then click Update Device.
4.4 BusEngine and Firmware Updates
BusEngine and Firmware updates often need to be performed when you
update the IBTracer software. These updates can be performed
automatically or manually. Both processes are described.
Updating the BusEngine
The BusEngine core is the heart of the IBTracer Analyzer. Using FPGA
technology, the BusEngine incorporates both the high speed recording
engine and the configurable building blocks that implement data/state/error
detections, triggering, capture filtering, external signal monitoring, and
event counting and sequencing. Both the BusEngine program and the
Firmware that manages the internal microcontroller are fully field
updateable.
Within a new software release, it may be necessary to update the Analyzer’s
BusEngine hardware for proper operation. The Readme file lets you know
if this is necessary.
Updating the Firmware
Within a new software release, it may also be necessary to update the
Analyzer’s firmware for proper operation. The Readme file informs you if
this is necessary.
21
Page 30
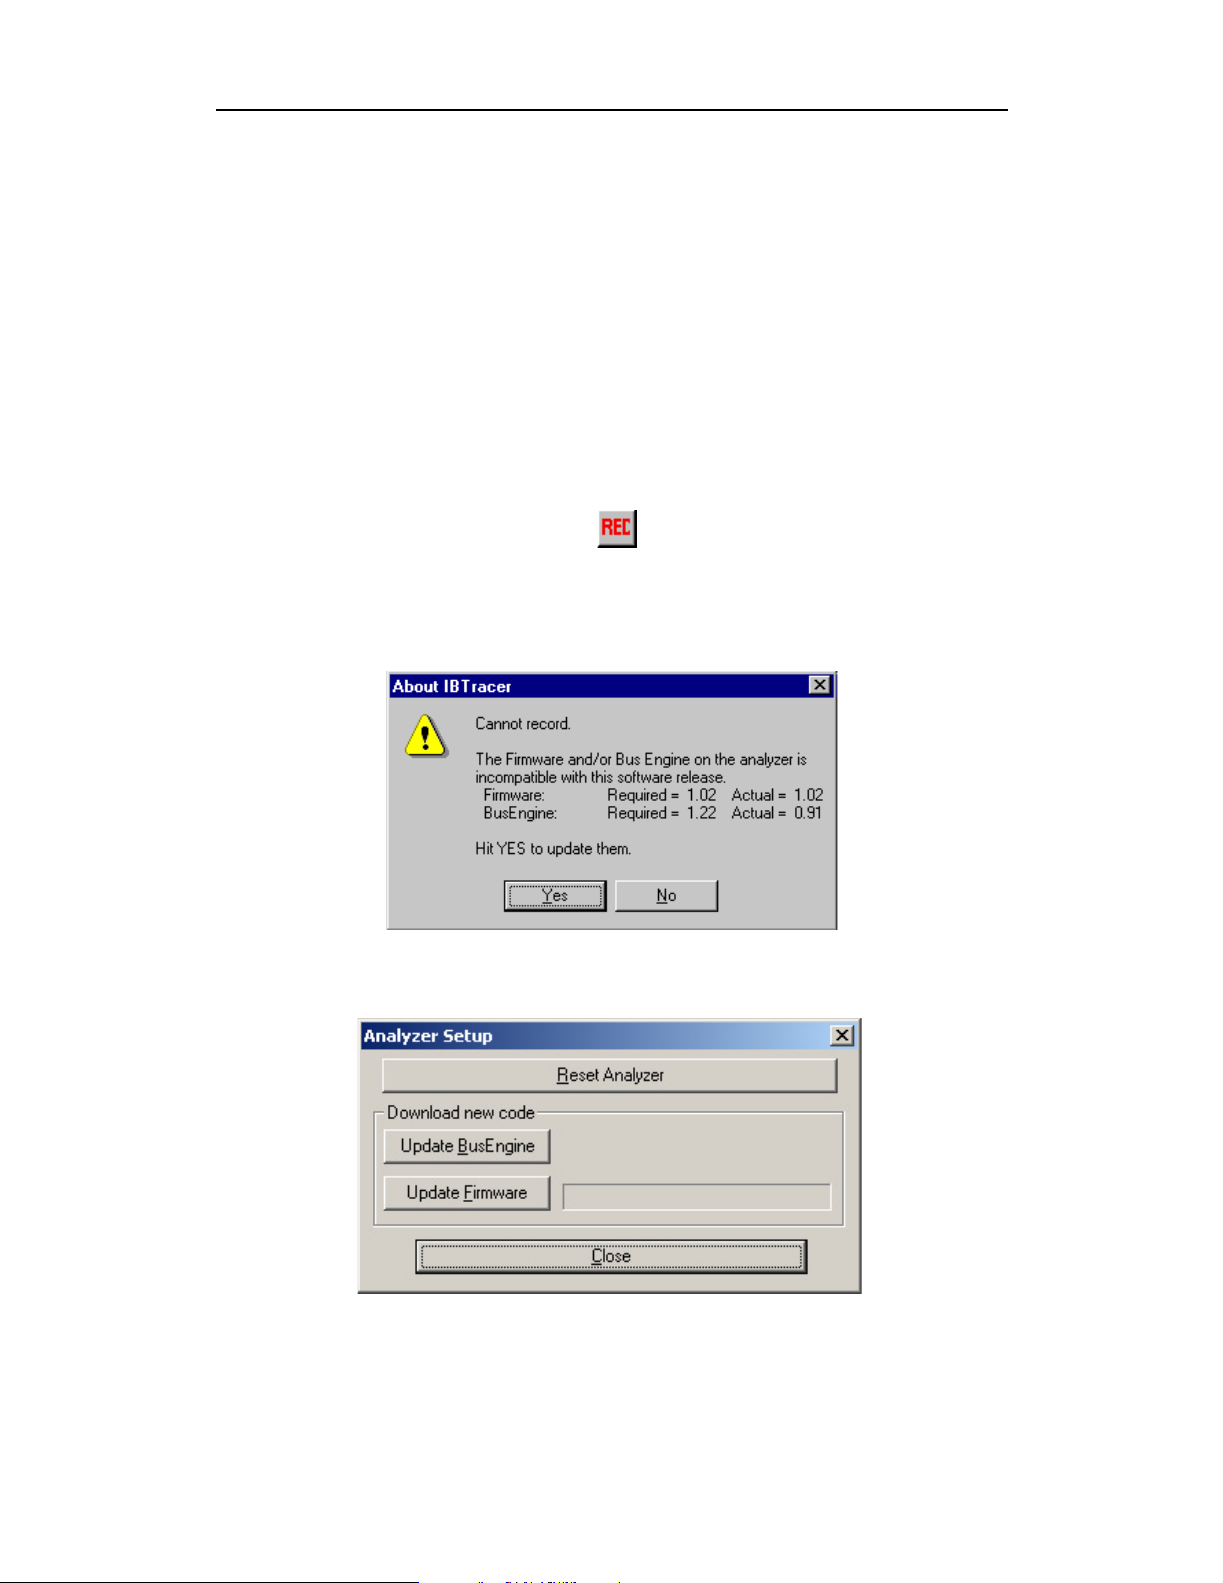
Automatic Updates
When the IBTracer software is updated, the software may become
incompatible with the BusEngine and Firmware. If a recording is attempted,
IBTracer displays a warning message and then automatically begins an
update process for the BusEngine and Firmware. If preferred, you can abort
this update and do the steps manually, as described later in this chapter.
To automatically update the BusEngine and Firmware,
Step 1 If needed, update the IBTracer software using the steps outlined in
"Software Updates" described above.
Step 2 Turn on the Analyzer.
Step 3 On the toolbar, click the button.
Because the BusEngine and/or the Firmware are incompatible with
the current IBTracer software version, an error message will appear
displaying your current versions and indicating what versions you
need to install.
IBTracer 4X Protocol Analyzer User’s ManualCATC SW Version 2.2
Step 4 Click Yes.
The above window closes and the Analyzer Setup window opens.
Step 5 Click Update BusEngine or Update Firmware on the Analyzer
Setup screen.
22
Page 31

IBTracer 4X Protocol Analyzer User’s ManualCATC SW Version 2.2
You can select only one item at this point. If both the BusEngine and
the Firmware need to be updated, the update will complete for the
first item and then return to the above screen so the second update
can be performed.
If you are running Windows 98SE, you will get the following
message when the second update is completed:
Step 6 Power cycle IBTracer to complete the update.
Note You must power cycle the analyzer for all BusEngine updates.
Manual Updates
You can manually update the IBTracer BusEngine by following these steps:
Step 1 Select Analyzer under Setup on the Menu Bar.
23
Page 32

IBTracer 4X Protocol Analyzer User’s ManualCATC SW Version 2.2
You s ee t he Analyzer Setup screen:
To update the BusEngine,
Step 2 Click Update BusEngine on the Analyzer Setup screen.
You s ee t he Select engine file window:
The program has already automatically searched for the correct file
and displays it in the File name field.
Note The most current BusEngine file (ib4trcrbe.bin) was copied to
\CATC\IBTracer directory when you installed the program.
your
Step 3 Click Open.
Step 4 Power cycle the Analyzer.
Re-initialization takes a couple of minutes.
24
Page 33

IBTracer 4X Protocol Analyzer User’s ManualCATC SW Version 2.2
Manually Updating the Firmware
To manually update the firmware,
Step 1 Click Update Firmware on the Analyzer Setup screen.
You s ee t he Select firmware file window:
The program has already automatically searched for the correct file
and displays it in the File name field.
Step 2 Click Open.
The Analyzer updates the Firmware.
Step 3 Unplug the USB cable from the back of the Analyzer unit and then
reinsert it so the new Firmware update can take effect.
4.5 Resetting the Analyzer
The Analyzer Setup window contains a reset button at the top of the
window. Its function is the equivalent of power cycling the Analyzer.
25
Page 34

IBTracer 4X Protocol Analyzer User’s ManualCATC SW Version 2.2
It is not necessary to restart the Bus & Protocol Analyzer Analyzer. The Bus
& Protocol Analyzer Analyzer takes approximately 25 seconds to
reinitialize. During this time the UPAS Status LED is on, indicating that
power-on diagnostics are being run. If there is a hardware failure, the
Trigger LED will blink after initialization is complete. If this occurs, contact
CATC for customer support.
26
Page 35

IBTracer 4X Protocol Analyzer User’s ManualCATC SW Version 2.2
5. Software Overview
5.1 The Main Display Menus
While some of the analyzer’s Main Display window options are familiar,
many contain options specific to the analyzer program.
Table 1: Main Display Pull-Down Menus
Menu Function
File
Open… Opens a trace file.
C
lose Closes the current file.
Save A
s… Saves all or a specified range of packets from the current file with a
specified name.
P
rint… Prints part or all of the current trace file.
Print Prev
Pr
E
dit Comment… Creates or edits the Trace file comment field.
Export
Last File Lists the last files that were opened.
Ex
Setup
Display Options… Provides the control of various display options such as color, formats,
ecording
R
Options
A
nalyzer… Allows the operator to reset the Analyzer or update the BusEngine and
Record
Start Causes the Analyzer to begin recording InfiniBand activity.
Stop
Report
File Information Summarizes key facts, such as the number of packets and triggering
Error Summary Displays an error summary of the current trace file and allows you to
Timing Calculation Starts the calculator dialog for calculating various timing and
Traffic Summary Summarizes in table format the number and types of packets that were
Bus Utilization Opens a window with graphs of bus usage for the open trace.
iew Displays an on-screen preview before printing.
int Setup… Sets up your current or new printer.
>> Saves all or part of a trace to a text file or to a.dat file.
it Exits the IBTracer program.
and filters.
Provides setup options for recording, triggering events, and filtering
…
events.
Firmware.
Causes the Analyzer to stop recording InfiniBand activity.
setup.
go to a specific packet, and save the error file to a uniquely named file.
bandwidth parameters in the recording file.
transferred during the recording.
27
Page 36

IBTracer 4X Protocol Analyzer User’s ManualCATC SW Version 2.2
Menu Function
Search
Go to Trigger Positions the display to the first packet following the trigger event.
Go to
acket/Operation/
P
MAD...
Go to M
Go to » Enables searching for specific events using a cascade of pop-up menus.
Find Allows complex searches.
Find N
Search Direction Allows you to specify a forward or backward search of a trace file.
arker » Positions the display to a previously marked packet.
ext Repeats the previous Find operation. Also use F3 to find next.
Positions the display to the indicated packet, Operation, or MAD.
View
Toolbars Displays list of available toolbars. Has a customize command for
creating.
S
tatus Bar Switches display of the Status Bar on or off.
Real-Time Statistics Allows viewing of statistical data as it happens.
Expand Allows field headers to be expanded.
Collapse Allows packet headers to be collapsed.
Show/Hide Allows different types of packets to be hidden or displayed.
Compound
Show/Hide
Zoom In Zoom in increases the size of the displayed elements.
Zoom Out Zoom out decreases the size of the displayed elements.
Wrap Allows the display to wrap.
Decoding
Assignments
Resolve Reliable
Connections
Packets Level View packet level.
Transport Functions
Level
MADs Level View/Hide MADs Level.
SADM Level View/Hide Subnet Administration Level.
Lets you selectively show or hide multiple items from the trace.
Opens a dialog box for creating or editing protocol assignments to
connections.
Opens a dialog box for resolving Unresolved Reliable connections
within the open trace.
View/Hide Transports Functions Level.
SDP Level View/Hide Sockets Direct Protocol Level.
SRP Level View/Hide SCSI RDMA Level.
28
Page 37

IBTracer 4X Protocol Analyzer User’s ManualCATC SW Version 2.2
Menu Function
indow
W
New Window Switches display of the Tool Bar on or off.
C
ascade Displays all open windows in an overlapping arrangement.
ile Displays all open windows in a side-by-side arrangement.
T
Arrange Icons Arranges minimized windows at the bottom of the display.
indows Displays a list of open windows.
W
Help
Help Topics Displays online help.
Update License Displays a dialog box for entering updated license information.
Display License
Information
bout IBTracer Displays version information about IBTracer.
A
Displays version information about IBTracer 4X, its firmware, and
BusEngine.
5.2 View Options
You can hide, display or reset
toolbars by selecting View >
Toolbars from the menu bar.
Resetting the Toolbar
From time to time (such as
following a software upgrade) it is
possible for the buttons on the
toolbar to not match their intended function.
To reset the toolbar,
Step 1 Select View >Toolbars from the menu bar.
29
Page 38

IBTracer 4X Protocol Analyzer User’s ManualCATC SW Version 2.2
Step 2 Select Customize from the sub-menu.
The following dialog box will open.
Step 3 Select the Toolbars tab.
The following dialog box will open.
Step 4 Click the Reset All button.
The toolbar resets to the factory defaults.
30
Page 39

IBTracer 4X Protocol Analyzer User’s ManualCATC SW Version 2.2
Tool Bar
The Tool Bar provides access to the most popular program functions. Tool tips
describe icon functionality as the mouse arrow is moved over the icon/item.
Open file Apply User Defined Hiding
Save As Find
Preview Find Next
Print… Error Summary
Setup Record Options Timing Calculations
Setup Display Options Traffic Summary
Start Recording Bus Utilization
Stop Recording Display Real-Time Statistics
Break and Restore IB Link File Information Report
Zoom In
Zoom Out View/Hide Transport Functions Level
Wrap View/Hide MAD Level
Hide Link Packets View/Hide Subnet Administration Level
Hide Training Sequences View/Hide Sockets Direct Protocol Level
View Packet Level
Hide Skips View/Hide SCSI RDMA Level
31
Page 40

IBTracer 4X Protocol Analyzer User’s ManualCATC SW Version 2.2
5.3 Status Bar
The Status Bar is located at the bottom of the main display window.
Depending on the current activity, the bar can be divided into as many as
four segments.
Recording Progress
When you begin recording, the left-most segment of the Status Bar displays
a Recording Progress Indicator:
As recording progresses, the Progress Indicator changes to reflect the
recording progress graphically:
• In the Progress Indicator, a black vertical line illustrates the
location of the Trigger Position you selected in Recording
Options.
— Pre-Trigger progress is displayed in the field to the left of the
Trigger Position in the before-Trigger color specified in the
Display Options.
— When the Trigger Position is reached, the progress indicator
wiggles as it waits for the trigger.
— After the trigger occurs, the field to the right of the Trigger
Position fills in the post-Trigger color specified in the Display
Options.
— When recording is complete, the upper half of the progress
indicator fills in white, indicating the progress of the data
upload to the host computer.
You should be aware of two exceptional conditions:
• If a Trigger event occurs during the before-Trigger recording, the
before-Trigger color changes to the after-Trigger color to indicate
that not all the expected data was recorded pre-Trigger.
32
Page 41

• When you click Stop before or after a Trigger event, the Progress
Bar adjusts accordingly to begin uploading the most recently
recorded data.
If you wish to abort an upload that is in progress, click the Stop button
again.
The Progress Bar fills with color in proportion to the specified size and
actual rate at which the hardware is writing and reading the recording
memory. However, the Progress Indicator is normalized to fill the space
within the Status Bar.
Recording Status
During recording activity, the current Recording Status is temporarily
displayed in the next segment. When you activate the Record function, this
segment flashes one of the following messages (depending on the selected
Recording Options):
IBTracer 4X Protocol Analyzer User’s ManualCATC SW Version 2.2
— Trigger?
— Triggered!
— Uploading
After recording stops,
— The flashing message changes to Uploading data–x% done
(x% indicates the percentage completion of the data
uploading process).
— The traffic data is copied to disk (overwriting any previous
version of this file) using the default file name data.ibt or a
new name specified in the Recording options.
To abort the upload process,
Press Esc on your keyboard
OR
Again click in the Tool Bar.
You are prompted to choose whether to keep the partially uploaded
data or to throw it away.
When the data is saved, the Recorded Data file appears in the main display
window and the Recording Status window is cleared.
• If the recording resulted from a Trigger Event, the first packet
following the Trigger (or the packet that caused the Trigger) is
initially positioned second from the top of the display.
33
Page 42

• If the recording did not result from a Trigger Event, the display
Analyzer Status
The third segment in the status bar displays analyzer status. During
uploading, this segment displays the percent of the upload process
completed.
Note If packets are filtered from the recording or data are truncated,
the recording activity is reduced.
Search Status
The rightmost segment displays the current search direction: Fwd (forward)
or Bwd (backward).
Zoom In
IBTracer 4X Protocol Analyzer User’s ManualCATC SW Version 2.2
begins with the first packet in the traffic file.
Zoom In increases the size of the displayed elements, allowing fewer (but
larger) packet fields per screen.
Click on the Tool Bar.
Zoom Out
Zoom Out decreases the size of the displayed elements, allowing more (but
smaller) packet fields per screen.
Click on the Tool Bar.
5.4 Tool Tips
Throughout the application, tool tips provide useful information.
To display a tool
tip, position the
mouse pointer
over an item. The
tool tip displays in
a short moment if present. Tool tips can also be found over the Tool Bar and
in areas of the packet view screen.
34
Page 43

IBTracer 4X Protocol Analyzer User’s ManualCATC SW Version 2.2
5.5 IBTracer Analyzer Keyboard Shortcuts
The following table shows the keyboard shortcuts available in IBTracer.
Table 2: Keyboard Shortcuts
Key Combination Operation
Ctrl+O Open the file
Ctrl+P Print
Ctrl+S Save the file
Ctrl+Home Jump to first packet
Ctrl+End Jump to last packet
F3 Find Next
F6 Next Pane
Shift+F6 Previous Pane
Ctrl+B Search Backward
Ctrl+F Search Forward
Shift+Insert Paste
Ctrl+Home Jump to first packet
Ctrl+R Start recording
Ctrl+T Stop recording
35
Page 44

IBTracer 4X Protocol Analyzer User’s ManualCATC SW Version 2.2
36
Page 45

IBTracer 4X Protocol Analyzer User’s ManualCATC SW Version 2.2
6. Recording Options
The Recording Options dialog box controls how IBTracer records
InfiniBand data. At the top of the Recording Options dialog box are four
tabs that provide access to dialog boxes called General, Miscellaneous,
Events, and Actions. Using these dialog boxes, you can configure IBTracer
to create event triggers, increase or decrease memory allocation for
recording, and interact with other InfiniBand devices in different ways.
6.1 Opening the Recording Options Dialog Box
From the Setup menu, select Recording Options...
The Recording Options window appears displaying the General tab.
The Recording Options window has four tabs marked
• General
• Miscellaneous
• Events
• Actions
37
Page 46

IBTracer 4X Protocol Analyzer User’s ManualCATC SW Version 2.2
6.2 Recording Options - General
The General tab opens a window shown in the previous illustration made up
of four main boxes marked Recording Type, Buffer Size, Trigger Position,
and Options.
Recording type
The Recording Type box presents three options that
allow you to set how IBTracer begins and ends a
recording. The options are: Snapshot, Manual Trigger,
and Event Trigger.
Snapshot
Fixed-length recording whose size is determined by the "Buffer Size" box
in the Recording Options dialog or by a manual click of the Stop button.
Recording begins by clicking on the Tool Bar and ends when either the
selected buffer size is filled or you press the Stop button.
Manual Trigger
Recording whose Trigger point is caused by pressing the Trigger button on
the front panel.
Recording is begun by pressing on the Tool Bar. Recording continues
in a circular manner within the limits set by the buffer size. Recording ends
when is clicked on the Tool Bar or the Trigger button is pressed on the
analyzer's front panel. If you press the Trigger button, recording will
continue until the post-trigger memory has been filled.
Event Trigger
Recording whose Trigger is defined by a specific event or events. Before
recording begins, you define the event trigger in the Events Recording
Options dialog box (accessible by selecting Setup> Recording Options
>Events from the menu). You begin the recording by clicking on the
Tool Bar. Recording continues in a circular manner within the limits set by
the buffer size. Once the trigger event occurs, some post-trigger recording
occurs, then the recording ends.
Note In this mode, the recording can be stopped manually in the same
way as for "manual trigger" mode.
38
Page 47

IBTracer 4X Protocol Analyzer User’s ManualCATC SW Version 2.2
Options
The Options box contains the
following:
Beep When Trigger Occurs
CausesthePCtobeepwhena
trigger event has occurred.
Save External Interface Signals
Causes the analyzer to save external interface signals from a break-out
board as fields in the trace.
Inhibit
Allows you to block the IBTracer reception of transmit and/or receive link
activity. When a direction is inhibited, none of the other recording events
will be detected.
Buffer Size
The Buffer Size box has a slide bar for adjusting the
recording buffer size from 1.6 megabytes to
2048 MB.
The Recording Type option determines how this
buffer is used. Although there are 2048 MB of physical memory in the
Analyzer, the efficiency of the recording ranges from 2:1 to 4:1 ratios of
physical memory to actual InfiniBand traffic. Shorter InfiniBand packets
yield a less efficient recording. The non-traffic portion of physical memory
is utilized for control and timing information.
You must have an equivalent amount of physical memory on the computer
controlling the IBTracer analyzer.
Note The scale is not linear andaffords more granularity in the smaller
buffer sizes.
Trigger Position
The Trigger Position slide bar sets the amount of preand post-trigger recording. It also allows adjustment
of the location of the trigger within the defined buffer.
You can adjust the Triggering Position between 1 and
99% post-Trigger. Trigger Position is available only
when Manual Trigger or Event Trigger is selected as Recording type.
39
Page 48

IBTracer 4X Protocol Analyzer User’s ManualCATC SW Version 2.2
As an example, if the buffer size is set to 16MB, then for the following
Trigger Position settings, the amount of pre- and post-Trigger data is
• 95% post-triggering: 0.8MB pre-trigger, 15.2MB post-trigger
• 75% post-triggering: 4MB pre-trigger, 12MB post-trigger
• 50% post-triggering: 8MB pre-trigger, 8MB post-trigger
• 25% post-triggering: 12MB pre-trigger, 4MB post-trigger
• 5% post-triggering: 15.2MB pre-trigger, 0.8MB post-trigger
Note When a Trigger occurs, recording continues until the post-Trigger
amount of the buffer is filled.
6.3 Recording Options - Miscellaneous
The Miscellaneous tab presents options for setting the recording speed and
the Resolve Reliable Connections dialog box.
1x/4x Mode
This setting lets you configure the recording speed. The selection you make
forces a change in the physical layer. There are three choices: Autodetect,
1x Mode,and4x Mode.
Note To change from one mode to another, first press the
Disconnect/Connect Link button. The analyzer can only switch
modes after it has detected a Disconnect event on the link.
40
Page 49

IBTracer 4X Protocol Analyzer User’s ManualCATC SW Version 2.2
Auto Detect - This option causes the analyzer determine the speed of traffic
and record it accordingly.
Note When in Auto Detect mode, if the link becomes disconnected for
any reason (for example, by unplugging the connector, by clicking
the Disconnect/Connect button, or by the polling process), the
analyzer will produce a "hybrid" recording. The first part of this
hybrid recording will always be in 1x mode. If the analyzer detects
a 4x link, it will eventually switch to 4x mode recording.
Note When the analyzer switches from 1x to 4x in Autodetect mode,
the packet before and/or after the transition might include errors
due to the transition itself.
1x Mode - Forces the analyzer to record traffic at 1x speed. This option
activates only one physical lane. If used with a 4x device, 1x Mode
will force the device to downgrade its link to1x and record the
resulting 1x traffic.
4x Mode - Forces the analyzer to record traffic at 4x speed. When 4x is
selected, all four lanes are physically active.
Physical Lane Order
Physical Lane Order options let you set the way the analyzer view lane order
in a 4x link. These options do not affect the link itself. There are three
settings for each channel:
Auto-detect - Allows the analyzer to determine lane order and to record
accordingly.
Normal - Forces the analyzer to record traffic as normal.
Reversed - Forces the analyzer to record traffic as reversed.
Note If a link is forced into an incorrect state (for example, if a normal
link is configured as reversed), then only skips will be recorded.
Skips are recorded because, from a lane order perspective, they are
symmetrical in composition.
Note To change the lane order, select one of the Lane Order options,
then click OK. Afterwards, press the Disconnect/Connect Link
button to break the link. The analyzer can only switch lane order
after has detected a Disconnect event on the link.
41
Page 50

IBTracer 4X Protocol Analyzer User’s ManualCATC SW Version 2.2
ResolveReliableConnections
This option causes the Resolve Reliable Connections dialog box to open
automatically any time traffic is recorded where the analyzer is not able to
resolve connections by itself - for example, if a recording were begun after
connections were already established. The Resolve Reliable Connections
dialog box lets you manually assign connections.
6.4 Recording Options - Events
If you have selected Event Trigger mode under the General tabinthe
Recording Options screen, you can now select specific InfiniBand events
using the Events tab on the Recording Option Screen. You can also use the
Actions tab to define specific event sequences that will trigger IBTracer 4X
to record an InfiniBand session.
In addition, the Events and Actions screens allow you to specify which
packets you want to include or exclude from the recording.
Events Options
Click the Events tabontheRecording Options screen.
You s ee t he Event Groups window:
42
Page 51

IBTracer 4X Protocol Analyzer User’s ManualCATC SW Version 2.2
The Events window allows you to set event conditions for errors and/or a
variety of packet characteristics.
Clicking a check box causes further options to display in the right side of the
window.
43
Page 52

Header Fields
Clicking "Header Fields" causes edit fields to appear for setting conditions
for Virtual Lanes (VL), DLID, SLID, Queued pairs and pull down menus
for OpCode and Ack types.
IBTracer 4X Protocol Analyzer User’s ManualCATC SW Version 2.2
Step 1 Select a Virtual Lane number from VL the drop-down list:
44
Page 53

IBTracer 4X Protocol Analyzer User’s ManualCATC SW Version 2.2
Step 2 From the OpCode list, choose RC, UC, RD, UD, or Any:
RC = Reliable Connection
UC = Unreliable Connection
RD = Reliable Datagram
UD = Unreliable Datagram
Any = Any connection/datagram
Step 3 From the second list, select one of the available choices:
Step 4 Choose and ACK type:
ACK = Acknowledged
NAK = Negative Acknowledged
RNR NAK = Receiver not ready
Step 5 For ACK, enter information in the Syndrome bits field and
optionally check the "MSN Valid" (Message Sequence Number)
box:
45
Page 54

IBTracer 4X Protocol Analyzer User’s ManualCATC SW Version 2.2
Step 6 For NAK, select an item in the NAK code drop-down list:
Step 7 For RNR, select a delay from the drop-down list:
46
Page 55

Errors
IBTracer 4X Protocol Analyzer User’s ManualCATC SW Version 2.2
Clicking "Errors" causes the checkboxes to appear for setting conditions for
triggering based on packet/signaling/protocol errors. You can select one or
a combination of errors.
Header Patterns
Clicking "Header Patterns" causes fields to appear for setting conditions for
signalling based on header patterns.
47
Page 56

When you click an Edit button, a window opens that allows you to edit the
patterns on a bit-by-bit or a hex mask and match basis. The following
example is for LRH patterns, the edit windows are different from one
pattern to another.
ImmDt Pattern
Clicking "ImmDt Pattern" causes an button to appear that allows you to edit
the ImmDt Pattern bit by bit.
IBTracer 4X Protocol Analyzer User’s ManualCATC SW Version 2.2
48
Page 57

When you click the Edit button, a window opens that allows you to enter
patterns on a bit-by-bit or hex mask and match basis.
MAD Pattern
Clicking "MAD Pattern" allows you to edit the MAD Pattern on a bit-by-bit
basis.
IBTracer 4X Protocol Analyzer User’s ManualCATC SW Version 2.2
49
Page 58

Data Pattern
Clicking Data Pattern allows you to edit the Data Pattern on a bit-by-bit
basis.
IBTracer 4X Protocol Analyzer User’s ManualCATC SW Version 2.2
Enter a pattern of up to 16 words (256 bits) in the box located above the Edit
button. This will set the Analyzer to trigger on the first instance of the
pattern anywhere within the first 256 bits of the payload.
To define one or more patterns in specific locations within the payload, click
the Edit button. A pattern editor will open that will let you enter data
patterns on a bit by bit basis for up to eight dwords.
50
Page 59

Breakout Board Data
Clicking "Breakout Board Data" causes a text field to appear that allows you
to specify a pattern for the matching bits for the pins marked Data0 through
Data7 on the UPAS breakout board. To use the breakout board, you will
need to connect a DB-25 RS-232 cable to the connection marked Data
In/Out on the back of the UPAS. Then use alligator clips to connect the data
pins on the breakout board to the RS 232 cable.
IBTracer 4X Protocol Analyzer User’s ManualCATC SW Version 2.2
51
Page 60

Special Trigger
Clicking "Special Trigger" causes check boxes to appear on the right for
setting triggers on special types of events such as Data Packets and Link
Packets. You can select one or a combination of events.
IBTracer 4X Protocol Analyzer User’s ManualCATC SW Version 2.2
Special Filter
Clicking "Special Filter" causes check boxes to appear on the right for
setting filters on special types of events such as Data Packets and Link
Packets. You can select one or a combination of events to remove from trace
recording.
52
Page 61

IBTracer 4X Protocol Analyzer User’s ManualCATC SW Version 2.2
6.5 Recording Options - Actions
The Actions screen is used to configure the type of action that the analyzer
will perform when key events are encountered in the trace. The Actions
window is like a chalk board - it graphically displays events and actions as
buttons, and lets you establish relationships between them.
You can create simple or complex configurations in the Actions window.
Simple configurations involve a single event and action - such as the
example above. This example reads: "Trigger when the specified error
occurs."
Complex configurations involve multiple events. Multiple events can be
combined in different ways to create event sequences and event counts.
53
Page 62

Event Sequences
An event sequence is two or more events (up to six) that are strung in a series
to a trigger button.
Event Counts
An event count is an Event button connected to a Counter button. An event
count is a search for multiple instances of an event - such as six Errors. To
create an Event count, you click on an Event button and then click on one of
the counters on the right side of the window. As soon as you click on the
counter, the Counter button repositions itself directly below the associated
Event button. To set the counter to a particular value, click the blue dot in
the corner of the button and enter a value (for details see “Counting Events”
on page 60.)
IBTracer 4X Protocol Analyzer User’s ManualCATC SW Version 2.2
54
Page 63

IBTracer 4X Protocol Analyzer User’s ManualCATC SW Version 2.2
Actions Window Layout
The Actions window displays three groups of buttons that can be connected
by dragging the mouse: Event buttons, Action buttons, and Counters.
Event
Buttons
Counters
Action
Buttons
Event Buttons
Event buttons represent the events you selected in the Events window.
These buttons are created automatically when you make your choices in the
Events window. If no events are selected, no Event buttons will appear.
By default, Event buttons are connected to the Trigger button.
Action Buttons
Buttons marked Trigger, Filter In, Filter Out, and Restart are Action
buttons. These buttons determine the outcome of an event.
Trigger Button - Triggers the end of the recording when an event occurs.
Filter In and Filter Out Buttons - Tells the Analyzer to filter in or out
Restart -ThisbuttonisusedtorestartCounts and Event Sequences. See
events from the recording. Filtering lets you exclude unwanted
traffic so that you can preserve recording memory and thereby
increase amount of desired traffic in your trace.
below for an explanation of Counts and Event Sequences.
55
Page 64

IBTracer 4X Protocol Analyzer User’s ManualCATC SW Version 2.2
Counter Buttons
Buttons marked Count1 and Count2 are counters. Counters are used to
create triggers based on several occurrences of the same packet type.
Counters let you create configurations such as "Trigger following the 6th
Error."
Counters only work with triggers. You cannot connect a counter to the
Filter In or Filter Out buttons or to the Restart button.
6.6 Connecting Events to Actions
Event buttons can be linked to Action buttons by clicking on an Event
button and then clicking on an Action button. A line will join the newly
associated buttons.
The following steps show how to connect Event and Action buttons:
Step 1 Open the Events tab and select a single event.
Step 2 Click the Actions tab.
The Event you selected will display as a button on the left side of
the Actions window. By default, this button will be connected to
56
Page 65

IBTracer 4X Protocol Analyzer User’s ManualCATC SW Version 2.2
the Trigger button. The configuration below reads "Trigger when a
a packet with the specified header pattern occurs."
Step 3 Click on the Event button.
The elastic arrow appears.
57
Page 66

IBTracer 4X Protocol Analyzer User’s ManualCATC SW Version 2.2
Step 4 Drag the arrow to the desired Action button.
Step 5 With the pointer over the desired Action button, click the left mouse
button again.
The arrow is replaced with a black line, and the Event button is now
connected to the Action button.
Note: Not all events can be connected to the Filter or Restart
buttons (for example, Errors).
If an Event button is linked to a counter and then to a Trigger, it indicates
that the analyzer should trigger following a count of several instances of the
event. The number of times that the analyzer should count the event is
determined by the number visible in the counter button. You set this number
by clicking the blue dot in the counter and entering a value.
58
Page 67

IBTracer 4X Protocol Analyzer User’s ManualCATC SW Version 2.2
6.7 Triggering from an Event in a Set
When you select several events in the Events window, the Actions window
will display the events as shown below. Each Event button will have its own
connection to the Trigger button. In this configuration, the Analyzer will
trigger a recording from any one of these events.
See the following example:
To trigger on an event in a set, follow these steps:
Step 1 From the Events window, select two or more events.
Step 2 Open the Actions window. The events will display as shown above.
6.8 Creating an Event Sequence
When multiple events are selected in the Events window, you create what is
called an event sequence. An event sequence is the stringing together of
events so that the analyzer triggers on the selected sequence in the specified
order.
59
Page 68

IBTracer 4X Protocol Analyzer User’s ManualCATC SW Version 2.2
In the following example, the Analyzer is told to trigger when a packet
occurs with an Immediate Data Pattern, followed by a packet with an LRH
pattern, followed finally by a packet with a Header Pattern:
To create an event sequence, follow these steps:
Step 1 From the Events window, select two or more events.
Step 2 Click the Actions tab. The events you selected appear in the Actions
window with separate lines connecting to the Trigger button.
Step 3 To sequence the buttons, click an event button. An elastic arrow
appears.
Step 4 Point the arrow to another Event button. The Event buttons move
next to each other in sequence, as shown in the example above.
6.9 Counting Events
Counters count multiple occurrences of an event. When the analyzer is
configured for counting, it searches for multiple occurrences of an event
such as an error and triggers when the last event in the count occurs.
When a counter is in use in the Actions window, the counter
button will be relocated below its associated Event button
and then connected by a line to the Trigger button. The
Counter will display a number that indicates the number of
events that the Counter is set to look for.
The buttons marked Count1 and Count2 provide a way of triggering after
a number of events have passed, such as "Trigger after the 20th error."
60
Page 69

IBTracer 4X Protocol Analyzer User’s ManualCATC SW Version 2.2
Counters have blue dots in their top left corner that provide access to pop-up
menus. The menus provide the means of setting the counter value. The
counter can be set between 1 and 65,535.
To connect an event to a counter, follow these steps:
Step 1 Click the Event tab and select an Event such as Error.
Selecting an event causes an Event button to automatically appear
in the Actions tab.
Step 2 Click the Actions tab.
The tab displays an event button that is connected to the Trigger
button on the right.
Step 3 Click the Event button.
An arrow appears that connects the Event button to your mouse
pointer.
Step 4 Click one of the two counters.
61
Page 70

IBTracer 4X Protocol Analyzer User’s ManualCATC SW Version 2.2
The event automatically connects to the Counter button and then
connects to the Trigger button.
Step 5 Click the blue dot in top right corner of your selected counter.
A pop-up menu opens. This menu lets you
configure the counter.
Step 6 Choose Change Counter Value.
Step 7 Set the counter to a value of your choice,
and click OK.
6.10 Triggering External Output
The Actions window has options enabling the analyzer to send an output
signal through a BNC cable or an RS-232 cable and breakout board to an
external device such as an oscilloscope.
Cabling
To set up the analyzer for signal output, you will first need to connect the
analyzer to the external device using a BNC or RS-232 cable.
Using a BNC Cable
If using a BNC cable, connect the external device to one end of the cable
and connect the other end of the cable to the output connector marked "Ext.
2" on the back of the analyzer.
62
Page 71

IBTracer 4X Protocol Analyzer User’s ManualCATC SW Version 2.2
Using an RS-232 25 pin Cable
If using an RS-232 cable, you will also need to use a CATC breakout board
and alligator cables. Connect alligator cables from the external device to
one or more Data pins on a breakout board. Then connect a 25-pin RS-232
cable from the breakout board to the 25-pin connector on the back of the
analyzer marked "DATA IN/OUT."
Once the analyzer is connected, you will need to configure the Recording
Options so the analyzer will send an output signal.
Setting External Output Options
To configure the analyzer for signal output, perform the following steps:
Step 1 If it is not already open, open the Actions window.
You should see Event buttons on the left side of the screen
representing the events you selected in the Events window.
Step 2 Click the blue dot on an event button representing the
event you wish to cause an output signal. For example,
if you want the analyzer to send an output signal when it sees an
error, to trigger an output signal based on an error, click on the blue
dot in the Error button.
The following menu appears:
The menu offers three choices:
Enable External General Purpose Output - This
option causes an output signal to be generated AND
triggers the end of the recording. When selected, a small arrow
appears on the event button, indicating that output signalling has
been enabled. Also present is a line between the event button and
the trigger button. This line indicates that the analyzer is set to
trigger the end of its recording.
63
Page 72

IBTracer 4X Protocol Analyzer User’s ManualCATC SW Version 2.2
Enable External General Purpose Output Only - This option
causes an output signal to be generated without triggering the end
of the recording. When enabled, a small arrow on the event button
indicates that the analyzer is configured to send an output signal.
You will see that the no line between the selected event button to
the trigger button - this indicates that the analyzer will continue
recording without triggering.
External Output Form - This option presents a menu with options
for setting the form of the output signal. Your choices are:
•PulseLow-Causes the Analyzer to transmit a 0.2-volt,
67-nanosecond signal.
• Pulse High - Causes the Analyzer to transmit a 3.2-volt,
67-nanosecond signal. This is the default format.
• Toggle - Causes the Analyzer to send a signal that toggles
with each trigger event between a continuous
3.2-volt signal and a continuous 0.2-volt signal.
Step 3 Choose "Enable External General Purpose Output" or "Enable
General Purpose Output."
A small arrow will appear on the selected event button.
Specifying Pulse Signal Outputs
Once Output signalling has been enabled, you can configure the output
signal to Pulse Low, Pulse High,orToggle.
To configure the output signal, follow these steps:
Step 1 Click the blue dot on an event button that has a small arrow attached.
Step 2 In the resulting menu, choose External Output Form.
Step 3 Choose Pulse Low, Pulse High, or Toggle.
6.11 Setting Multiple Conditions with Counters
You can create multiple event conditions by linking a counter to multiple
events or by linking two counters to two or more events.
64
Page 73

IBTracer 4X Protocol Analyzer User’s ManualCATC SW Version 2.2
Sequencing with Counters
When two or more Events are connected together and then to a counter, a
condition is created such as the one shown below. This example reads:
"When a packet occurs with a Local Routing Header (LRH) followed by six
MADs with data patterns, trigger the end of the recording."
To link two or more Events to a counter,
Step 1 Select two or more events in the Events window (Recording Options
> Events).
Step 2 Click the Actions tab.
Step 3 Click one of the event buttons. An elastic arrow will appear on your
mouse pointer.
Step 4 Click one of the Counters. The Counter button will move directly
under the Event button.
Step 5 Click another Event button. An elastic arrow will appear on your
mouse pointer.
Step 6 Click the Counter button that is below the first Event button.
65
Page 74

IBTracer 4X Protocol Analyzer User’s ManualCATC SW Version 2.2
Linking Two Events to Two or More Counters
If an Event is linked to Count1 and a second event is linked to Count2,it
creates an "or" condition. The example below reads "Trigger when Count1
OR Count2 has reached their specified values."
6.12 Filtering Traffic
Filtering lets you exclude unwanted traffic so you can preserve recording
memory and increase the amount of desired traffic in the trace. You have
two options: Filter In, which lets you filter traffic into the recording and
thereby exclude other traffic, and Filter Out, which lets you filter traffic out
of the recording.
Note: Some events, such as errors, cannot be filtered.
How Filtered Out Traffic Is Indicated in the Trace
When traffic is filtered out, a horizontal line appears in the trace where the
item was removed.
How to Use Filters
To filter an event in or out from a recording, follow these steps:
Step 1 From the Events window, select one or more events.
Step 2 Click the Actions tab to open the Actions window.
Step 3 Click an Event button, then click the button marked Filter In or
Filter Out.
A line will connect the Event button to the Filter In or Filter Out
button.
The selected event will now be set for filtering.
66
Page 75

IBTracer 4X Protocol Analyzer User’s ManualCATC SW Version 2.2
6.13 Restarting Sequences and Counters
The Restart button is used to create conditional statements with sequences
and counts.
When an event is linked to the Restart button, the Analyzer
restarts any counting or sequencing it is performing if that
event is found.
Restarting a Sequence
For example, in the illustration below the Analyzer is told: "Trigger
following a sequence of a MAD, a packet with an Immediate Data pattern,
followed by a packet with a Local Routing Header (LRH). However, if an
error occurs during the sequence, restart the search."
Restarting a Count
The Restart button can be used to restart counting. If an Event count has
been defined, adding a link between another event and the Restart button
tells the analyzer to restart the count any time the Restart event has been
found. This is best explained with an example. In the screenshot below, the
67
Page 76

IBTracer 4X Protocol Analyzer User’s ManualCATC SW Version 2.2
analyzer is configured to trigger following the sixth MAD with a
user-defined data pattern, but if an error occurs anywhere during the count,
restart the count.
6.14 Saving Recording Options
To complete your Recording Options settings, use the features at the bottom
of the Recording Options screen. These features remain the same no matter
which of the three Recording Options screens you are working in.
•ClickSave to save the currently specified Recording Options for
use in future recording sessions. Any file name can be specified,
though use of the .rec is recommended. If no extension is
specified, .rec is added by default.
•ClickLoad to load a previously saved *.rec file, thus restoring a
previous set of Recording Options.
•TheSave as Default function is equivalent to the Save function,
specifying the file name default.rec. Whenever you start up the
Analyzer, it automatically loads the default.rec file if one exists.
•ClickOK to apply any changes and close this dialog box.
•ClickCancel to cancel any immediate changes you have made
and exit the Recording Options menu.
6.15 Recording InfiniBand Traffic
To start recording InfiniBand traffic once the appropriate Recording
Options have been set,
Step 1 Select Record >Start from the Menu Bar
OR
68
Page 77

IBTracer 4X Protocol Analyzer User’s ManualCATC SW Version 2.2
Click on the Tool Bar.
Your recording session can continue until it has finished naturally or you
may need to stop manually by clicking on the Tool Bar, depending on
how you set the Recording Options.
To manually stop recording,
Step 2 Select Record >Stop from the Menu Bar
OR
Click on the Tool Bar.
Note The manual Stop Recording feature is primarily of use when
recording low-volume traffic, which can take a long time to fill
the recording buffer.
When the recording is finished, the traffic is uploaded to the hard drive and
then saved as a file named data.ibt or whatever name you assign as the
default filename.
To save a current recording for future reference,
Step 3 Select File >Save As from the Menu Bar.
OR
Click on the Tool Bar.
You see the standard Save As screen.
Step 4 Give the recording a unique name and save it to the appropriate
directory.
6.16 Training Retry
To initiate a training retry, click the button. Use this feature when you
are unable to establish a connection or an active link. You should also use
this feature when changing the recording speed (Recording Options >
Miscellaneous > 1x/4x Mode). The analyzer can only switch modes after
has detected a Disconnect event on the link.
69
Page 78

IBTracer 4X Protocol Analyzer User’s ManualCATC SW Version 2.2
70
Page 79

IBTracer 4X Protocol Analyzer User’s ManualCATC SW Version 2.2
7. Display Options
Use the Display Options menu to specify the way CATC Trace information
is displayed.
To open the Display Options menu,
• Select Display Options under Setup on the Menu Bar
OR
• Click on the Tool Bar
Yo u see t he Display Options window:
The Display Options window always opens with the screen for the General
tab displayed.
7.1 General Display Options
Use the General Display Options to specify the basic appearance of a Trace
View.
• Zoom Level: Adjustable in discrete increments from 10% to
200% percent.
• Enable Tool Tips: Select to enable tool tips with explanation text
to pop up when you position your cursor over various fields in the
Trace View.
71
Page 80

IBTracer 4X Protocol Analyzer User’s ManualCATC SW Version 2.2
• Wrap: Inhibits carriage returns in packets when they exceed the
width of the window.
• Idle Time Presentation:CausesIBTracer to display Idle Time
in one of two formats:
• Show Idle Time
• Show Idle in Symbol Time (1 symbol = 4ns)
• Point-of-View: Allows you to swap the transmit and receive
directions in a trace (packets labeled as 'Transmit' will become
labeled as 'Receive' and vice versa).¨ Swapping is also allowed in
the Tx/Rx cell in the Trace View.
• Fonts: Lets you define the appearance of Field and Data text.
• Trace Viewing Level: Lets you display the following elements in
the CATC trace: Packets, Transport functions, Management
Datagrams, Subnet Administration, Sockets Direct Protocol,
SCSI RDMA Protocol.
7.2 Saving and Loading Display Options
To save your Display Options settings for future use,
Step 1 Click Save to save the currently specified Display Options for use in
future sessions. Any file name can be specified, but you must use the
.opt extension. If no extension is specified, .opt isaddedbydefault.
Step 2 Click OK to apply any changes you have made to Display Options
and close this dialog box.
•ClickCancel to cancel any immediate changes you have made
and exit the Display Options menu.
•TheSave as Default function is equivalent to the Save function,
specifying the file name default.opt. Whenever you start up the
analyzer, it automatically loads the default.opt file if one exists.
To load Display Options,
Step 1 Click Load.
A dialog box will open with a list of previously saved Display
Options.
Step 2 Select a previously saved *.opt file.
Step 3 Click Apply to apply your changes.
72
Page 81

IBTracer 4X Protocol Analyzer User’s ManualCATC SW Version 2.2
7.3 Color Display Options
• Click the Colors tab on the Display Options screen.
You s ee t he Colors screen:
Use this menu to customize the colors associated with each field in the Trace
View. You can experiment with this option to achieve the color combination
best suited to a particular graphic system. A brighter color might be
appropriate for a specific field that should stand out in the display (e.g. the
Packet Types).
Note The colors of the following packet types cannot be changed:
Invalid Data (packet error) field (red) and Softbit Errors
(yellow.)
Two color fields are provided for packet number displays to differentiate
between pre-Trigger traffic and post-Trigger traffic.
• The packet that causes the Trigger and all the packets before it are
colored with the - color.
• The packet that follows a Trigger is colored with the + color.
• All packets are colored with a + color when there is no Trigger.
73
Page 82

IBTracer 4X Protocol Analyzer User’s ManualCATC SW Version 2.2
Use the color buttons labeled + and - under the Packet # section of the
Colors screen to select a Trigger color.
To select or change a color,
• Click the appropriate color button.
You see the color palette:
Use this palette to choose the desired color for fields within the trace such
as Routing Headers, Base Transport Headers, CRC, and Packet #.
74
Page 83

IBTracer 4X Protocol Analyzer User’s ManualCATC SW Version 2.2
You can also customize colors.
Step 1 Click the Custom tab.
Step 2 Click your mouse pointer in the color spectrum on the desired color.
Step 3 Drag the triangle on the vertical bar to the desired shade.
Step 4 Click OK.
7.4 Formats Display Options
The Formats tab allows numerical data to be displayed in different formats.
For example, you can change the format of a field from hexadecimal to
binary.
• Click the Formats tabontheDisplay Options screen.
75
Page 84

IBTracer 4X Protocol Analyzer User’s ManualCATC SW Version 2.2
You s ee t he Formats window:
Click an item to display its current format characteristics and to display
formatting buttons. Use the formatting buttons to change the format of the
selected item.
7.5 Hiding
Use the Hiding window to hide various fields, packets, messages, and
protocols from the Trace View screen. The Hiding tab in the Display
Options window offers added advantage of hiding specific fields, by
default, for all recordings. Use the Show/Hide option under the View menu
to hide specific fields for the active recording.
• Click the Hiding tabontheDisplay Options screen.
76
Page 85

IBTracer 4X Protocol Analyzer User’s ManualCATC SW Version 2.2
You s ee t he Hiding window:
Hiding Skips
The "Hide Skips" checkbox allows you to hide skips in a trace.
Hiding Link Packets
The "Hide Link Packets" checkbox allows you to hide link packets in a
trace.
Hiding Training Sequences
The "Hide Training Sequences 1 and 2 checkboxes allow you to hide
training sequences in a trace.
Note Once Display Options have been set, they can be saved for future
use with the Save command described in “Saving and Loading
Display Options” on page 72.
7.6 Compound Hiding
The Compound Show/Hide command lets you selectively show or hide
multiple items from the trace.
This command is accessible from the menu bar:
Step 1 Select View > Compound Show/Hide.
77
Page 86

IBTracer 4X Protocol Analyzer User’s ManualCATC SW Version 2.2
A context-sensitive menu will open presenting a list of all the
Infiniband elements in the trace.
The menu will remain open and allow you to select multiple items. It
will not close until you select Apply.
Note Select as many fields and packet types from the fly-out
sub-menus as needed.
Step 2 Select the type of action that you want performed:
• Hide Checked - This option will cause all selected items to be
hidden from the trace.
• Show Checked - This option will cause all selected items to be
displayed and all unselected items to be hidden from the trace.
• Show All - This option will display all items in the trace.
Step 3 Click Apply. At that point, the menu will close and the packet types
you have selected will be hidden or displayed.
78
Page 87

Note You can show or hide these selected fields at any point by
clicking the button (Apply Compound Hiding)onthe
toolbar.
To hide or show Link Packets, click in the toolbar.
To hide or show Training Sequences, click in the toolbar.
7.7 Headers
The Headers tab in the Display Options dialog box allows you to select the
types of fields that are displayed in headers.
IBTracer 4X Protocol Analyzer User’s ManualCATC SW Version 2.2
A pull-down menu marked Select IBA Packet Header will let you select
the type of header you wish to configure. When you select a header type,
checkboxes will appear representing the fields within the header. Selecting
a checkbox and then clicking OK will cause those fields to display in the
trace. For example, if you select LRH from the menu, then select the
checkboxes marked DLID and SLID, the DLID and SLID fields will display
in the LRH headers (shown below left). If you select all of the checkboxes,
all fields within the header will display (shown bottom right).
Two views of the same header. In the left example, only two fields are displayed. In the right,
all fields are displayed.
79
Page 88

IBTracer 4X Protocol Analyzer User’s ManualCATC SW Version 2.2
The Move Up and Move Down buttons will let you change the order
of the selected headers.
The Restore LRH Headers and Restore Defaults for All Headers
buttons allows you to restore the headers the default display.
80
Page 89

IBTracer 4X Protocol Analyzer User’s ManualCATC SW Version 2.2
8. Reading a CATC Trace
8.1 Trace View Features
•TheIBTracer packet view display uses color and graphics
extensively to fully document the captured traffic.
• Packets are shown on separate rows, with their individual fields
both labeled and color coded.
• Packets are numbered (sequentially, as recorded), time-stamped,
and highlighted to show the device status (master or slave).
• Display formats can be named and saved for later use.
• Pop-up Tool Tips annotate packet fields with detailed
information about their contents.
• Several fields such as Data fields can be collapsed to occupy
minimal space in the display.
• The display software can operate independent of the hardware
and so can function as a stand-alone Trace Viewer that may be
freely distributed.
8.2 Set Marker
You can define a unique Marker for each packet operation on a MAD.
To place a marker on a packet,
Step 1 Left-click on Packet # for the packet you wish to mark.
81
Page 90

IBTracer 4X Protocol Analyzer User’s ManualCATC SW Version 2.2
You s ee t he Packet menu:
Step 2 Select Set Marker.
You s ee t he Edit Marker Comment window where you can enter a
unique comment about this packet.:
Step 3 Enter your comment.
Step 4 Click OK.
A marked packet is indicated by a vertical red bar along the left edge of the
packet # block:
8.3 Edit or Clear Marker
To clear or edit the comments associated with a packet marker,
Step 1 Left-click on Packet # for the chosen packet.
82
Page 91

IBTracer 4X Protocol Analyzer User’s ManualCATC SW Version 2.2
You s ee t he Packet menu:
To edit the Marker Comment,
Step 2 Select Edit marker.
You s ee t he Edit marker comment window:
Step 3 Edit the comment as desired.
Step 4 Click OK.
To clear a Marker,
Step 5 Click Clear marker.
The vertical red Marker bar disappears.
83
Page 92

IBTracer 4X Protocol Analyzer User’s ManualCATC SW Version 2.2
8.4 Expanded and Collapsed Field Formats
Fields that have small triangles in their top left corners can be expanded to
display greater detail or collapsed to a compact view. There are three ways
to toggle between the two views.
Left-clicking the Small Arrows in the Header and Data Fields
Some fields have small arrow in their top-left corners that allow the field to
be expanded or collapsed.
Left-facing
arrow will
collapse data
Expanded Data
Double-Clicking
You can also expand or collapse a header or data field by double-clicking
anywhere in the field.
Using the Shortcut Menu
If you left-click on a data or header field, a menu will open for expanding or
collapsing data fields.
Step 1 Left-click on Data in the Data packet you want to expand or
collapse.
If your Data Trace View is currently expanded, you see the Collapse
Data menu:
Right-facing
arrow will
expand data
Collapsed
data
84
Page 93

IBTracer 4X Protocol Analyzer User’s ManualCATC SW Version 2.2
If your Data Trace View is currently collapsed, you see the Expand
Data menu:
Note You can choose to expand or collapse only the Data in the
selected Data packet OR All Data Fields in the Trace View.
Step 2 Select the desired Expand Data or Collapse Data menu item.
The Trace View is repositioned with the selected packet(s) adjusted
in the format you have specified.
Note For headers, the same mechanism works for groups of cells.
Vertical arrows are used for expanding and collapsing transport
functions and higher level units. Click and hold applies to
collapse and expand actions for elements in all views.
85
Page 94

IBTracer 4X Protocol Analyzer User’s ManualCATC SW Version 2.2
86
Page 95

IBTracer 4X Protocol Analyzer User’s ManualCATC SW Version 2.2
9. Decoding Traffic
IBTracer has six decode levels: Packets, Transport Functions, Management
Datagrams, Subnet Administration transaction level, Sockets Direct
Protocol level, and SCSI RDMA Protocol level. The first two decode levels
have a hierarchical relationship: Transport Functions are composed of
packets.
The IBTracer default decode/display level is packet, which means that
InfiniBand packets will be displayed when you first view a trace.
9.1 Decoding and Displaying Traffic
You can decode and display traffic through the toolbar or by selecting a
decode level from the Display Options dialog box.
Decoding Via the Toolbar
The decode buttons on the toolbar perform the following functions:
Pkt (Display Packets)
Tra (Display Transport Functions)
MAD (Display Management Datagrams)
Subnet Administration (Display Packet Level)
Socket Direct Protocol (Display Packet Level)
SCSI RDMA Protocol (Display Packet Level)
To display, for example, Transport Functions, click .
Note Once a decode has been performed, it might be necessary
to scroll through the display to find the decoded MADs
or Transport Functions. You can shorten your search by
first clicking the Hide Link and Hide Training
Sequences buttons.
87
Page 96

IBTracer 4X Protocol Analyzer User’s ManualCATC SW Version 2.2
Decoding Via the Display Options Dialog Box
The Display Options dialog box has options for issuing decode commands.
To issue a command,
Step 1 Fromthemenubar,select
Setup>Display Options.
Step 2 From the checkboxes under Trace Viewing Level, select the the
desired level of decoding. Your choices are:
• Packets
• Transport Functions
• Management Datagrams
• Subnet Administration
• Sockets Direct Protocol
• SCSI RDMA Protocol
88
Page 97

IBTracer 4X Protocol Analyzer User’s ManualCATC SW Version 2.2
9.2 Decoding Assignments
When opening trace files that contain unrecognized connections, IBTracer
will open the decoding assignments dialog. This dialog allows users to
assign vendor unique or proprietary connections to a higher level protocol
for proper display in the CATC Trace protocol view.
To see these events as SRP/SDP operations within your trace, select each
connection and assign to either the SDP or SRP protocol by pressing the
appropriate assignment button. Choose Unassign to keep the connection
undefined.
Note: The Unrecognized Connections dialog will continue to appear until
you have manually removed the --???-- from the right-hand column.
Manually assigning SDP, SRP or Unassigned to all the unrecognized
connections appearing within this window removes the --???-- from the
right-hand column.
9.3 Tool Tips
Additional information about fields can be attained by positioning your
mouse pointer over a field of interest. A tool tip will appear that will provide
details about the field. In some cases, there can be a considerable amount
of information available.
89
Page 98

IBTracer 4X Protocol Analyzer User’s ManualCATC SW Version 2.2
9.4 Expanding & Collapsing Traffic
Management Datagrams and Transport Functions can
be "opened" to reveal their constituent packets by
double-clicking the first cell in of a Transport Function
or MAD or by clicking once on the small arrow on that same cell. The
packets will then display below the message. The following screenshot
shows an example of a message and its packets.
9.5 MAD Formats
Management
Datagram
Transport
Function
Packet
Management datagrams are displayed as a separate decode level - this fact
needs some explanation. Because a MAD is an unreliable datagram
composed of a single packet, CATC could have elected to display MADs as
a decode within the packet level or as a decode within the Transport
Function level. CATC chose to display MADs as their own level in order
to present MAD data more clearly.
9.6 MAD, SA and SRP Decoder Script Files
IBTracer uses decoder script files to decode MADs, Subnet Administration
transactions, and SCSI RDMA protocol transactions. Decoder script files
are automatically read when the IBTracer software is started. Thereafter,
when MAD, SA, or SRP traffic is encountered, the Analyzer software is
able to decode the traffic.
Decoder script files are shipped with IBTracer and located in the
IBTracer\Scripts directory.
Users may edit the decoder scripts or create new ones to decode vendor-and
application-specific classes and attributes.
NOTE: Details about how to edit CATC decoder scripts or write your own
are provided in the manual CATC Scripting Language Reference Manual
for IBTracer and MAD Decoders available from CATC.
90
Page 99

IBTracer 4X Protocol Analyzer User’s ManualCATC SW Version 2.2
Hiding/Displaying Fields via Decoder Script Files
IBTracer MAD decoder script files control how MADs, SA transactions,
and SCSI RDMA transactions are displayed as a CATC Trace. The view
settings in the scripts may be edited to either reveal or hide particular fields
when the header cells are expanded or collapsed. For instance, it may be
desirable to have a field visible even when its header cell is collapsed; on
the other hand, cells can also be defined so that they are revealed only when
the header cell is expanded.
9.7 Decoding Assignments
The Decoding Assignments dialog box allows you to change the protocol
assignments for manually assigned SDP and SRP connections. SDP and
SRP decoding are licensed options that are included with IBTracer 4x.
Step 1 From the View menu, select Decoding Assignments.
Step 2 Select a connection from the list.
Step 3 Click the appropriate button on the right.
Step 4 RepeatStep2andStep3asmanytimesasitisnecessary.
Step 5 Click OK.
91
Page 100

IBTracer 4X Protocol Analyzer User’s ManualCATC SW Version 2.2
9.8 Viewing Details about MAD, Subnet Administration and SRP Fields
You can get details about MADs, Subnet Administration transactions, and
SRP transactions, by clicking on a transaction within the trace and selecting
View MAD fields, View SADM Transaction Fields,orView SRP
Operation fields from the pop-up menu. A dialog box will open with
details about the selected transaction. This dialog box will let you search,
save, and reformat the displayed data.
Viewing MAD or SRP Fields
The dialog boxes for viewing details about MADs and SRP transactions are
the same. The following steps describe viewing details about MADs.
Step 1 Click on a MAD to open a pop-up menu:
Step 2 Select View MAD Fields.
92
 Loading...