

Page 1

Service Manual
WFM700 Series
Waveform Monitors
071-0915-04
This document applies to firmware version 1.3.0
and above.
Warning
The servicing instructions are for use by qualified
personnel only. To avoid personal injury, do not
perform any servicing unless you are qualified to
do so. Refer to all safety summaries prior to
performing service.
www.tektronix.com
Page 2

Copyright © Tektronix, Inc. All rights reserved.
Tektronix products are covered by U.S. and foreign patents, issued and pending. Information in this publication supercedes
that in all previously published material. Specifications and price change privileges reserved.
Tektronix, Inc., P.O. Box 500, Beaverton, OR 97077
TEKTRONIX and TEK are registered trademarks of Tektronix, Inc.
Page 3

Warranty 2
Tektronix warrants that this product will be free from defects in materials and workmanship for a period of one (1)
year from the date of shipment. If any such product proves defective during this warranty period, Tektronix, at its
option, either will repair the defective product without charge for parts and labor, or will provide a replacement in
exchange for the defective product. Parts, modules and replacement products used by Tektronix for warranty work
may be new or reconditioned to like new performance. All replaced parts, modules and products become the
property of Tektronix.
In order to obtain service under this warranty, Customer must notify Tektronix of the defect before the expiration
of the warranty period and make suitable arrangements for the performance of service. Customer shall be
responsible for packaging and shipping the defective product to the service center designated by Tektronix, with
shipping charges prepaid. Tektronix shall pay for the return of the product to Customer if the shipment is to a
location within the country in which the Tektronix service center is located. Customer shall be responsible for
paying all shipping charges, duties, taxes, and any other charges for products re turned to any other locations.
This warranty shall not apply to any defect, failure or damage caused by improper use or improper or inadequate
maintenance and care. Tektronix shall not be obligated to furnish service under this warranty a) to repair damage
resulting from attempts by personnel other than Tektronix representatives to install, repair or service the product;
b) to repair damage resulting from improper use or c onnection to incompatible equipment; c) to repair any
damage or malfunc tion caused by the use of non-Tektronix supplies; or d) to service a product that ha s been
modified or integrated with other products when the effect of such modification or integration increases the time
or difficulty of servicing the product.
THIS W ARRANTY IS GIVEN BY TEKTRONIX WITH RESPECT TO THE PRODUCT IN LIEU OF ANY
OTHER WARRANTIES, EXPRESS OR IMPLIED. TEKTRONIX AND ITS VENDORS DISCLAIM ANY
IMPLIED WARRANTIES OF MERCHANT ABILITY OR FITNESS FOR A PARTICULAR PURPOSE.
TEKTRONIX’ RESPONSIBILITY TO REPAIR OR REPLACE DEFECTIVE PRODUCTS IS THE SOLE AND
EXCLUSIVE REMEDY PROVIDED TO THE CUSTOMER FOR BREACH OF THIS WARRANTY.
TEKTRONIX AND ITS VENDORS WILL NOT BE LIABLE FOR ANY INDIRECT, SPECIAL, INCIDENT AL,
OR CONSEQUENTIAL DAMAGES IRRESPECTIVE OF WHETHER TEKTRONIX OR THE VENDOR HAS
ADVANCE NOTICE OF THE POSSIBILITY OF SUCH DAMAGES.
Page 4

Page 5

Table of Contents
General Safety Summary vii...................................
Service Safety Summary ix....................................
Preface xi...................................................
Manual Content xi.................................................
Manual Conventions xi..............................................
Related User Documents xii..........................................
Related Reference Documents xiii......................................
Contacting Tektronix xiv.............................................
Theory of Operation
Operating Conditions 1--1.............................................
Overview 1--1.......................................................
Individual Module Descriptions 1--2.....................................
Diagrams 1--7.......................................................
Performance Verification
Prerequisites 2--1....................................................
Test Equipment Required 2--2..........................................
Performance Verification Conditions 2--4.................................
Self Tests 2--4.......................................................
Functional Tests 2--6.................................................
Performance Tests 2--9................................................
WFM700 Audio (Option DG) Performance Verification Procedure 2--50.........
WFM700/WFM7M Input Module Test Record 2--57.................
WFM700/WFM7A Input Module Test Record 2--63..................
WFM700/WFM7HD Input Module Test Record 2--67................
WFM700 Audio Module (Option DG) Test Record 2--71..............
Adjustment Procedures
Adjustments 3--1..............................................
Manual Adjustment Procedures 3--3.....................................
Instrument Driven Procedures 3--11......................................
WFM700 Series Waveform Monitors S ervice Manual
i
Page 6

Table of Contents
Maintenance
General Maintenance 4--1......................................
Firmware Upgrades 4--1..............................................
Preventing ESD 4--2.................................................
Inspection and Cleaning 4--3...........................................
Removal and Installation Procedures 4--7.........................
Cabinet 4--8........................................................
Chassis Cover 4--9...................................................
Plug-In Modules 4--11.................................................
Power Supply 4--18...................................................
Front End Assembly 4--19..............................................
Fans 4--22...........................................................
Fan Assembly 4--23...................................................
Main Circuit Board 4--25...............................................
Troubleshooting 4--27...........................................
Check for Problems 4--27..............................................
Diagnostics 4--30.....................................................
LED Fault Codes 4--32................................................
Troubleshooting Trees 4--33............................................
Repackaging Instructions 4--41...................................
Replaceable Parts
Replaceable Parts 5--1..........................................
Parts Ordering Information 5--1.........................................
Module Servicing 5--2................................................
Using the Replaceable Parts List 5--2....................................
ii
WFM700 Series Waveform Monitors S ervice Manual
Page 7

List of Figures
Table of Contents
Figure 1--1: WFM700 signal flow block diagram 1--8................
Figure 1--2: Control flow block diagram 1--9.......................
Figure 2--1: Signal data paths performance verification screen one 2--12.
Figure 2--2: Signal data p ath s performance verification screen two 2--12.
Figure 2--3: Serial video output level performance verification
screen 2--17................................................
Figure 2--4: SD PIX MON output level performance screen 2--18.......
Figure 2--5: HD pix G/Y video output level performance screen 2--20...
Figure 2--6: HD pix B/Pb and R/Pr video output level performance
screen 2--21................................................
Figure 2--7: SD pix video output level performance screen 2--22........
Figure 2--8: HD GBR frequency response performance screen 2--26.....
Figure 2--9: SD GBR frequency response performance screen 2--28.....
Figure 2--10: Eye vertical scale reference level screen 2--30............
Figure 2--11: Eye vertical scale performance screen 2--31..............
Figure2--12:Eyetimebasejitterperformancescreen 2--35............
Figure 2--13: Eye clock recovery bandwidth performance screen 2--37..
Figure 2--14: Eye clock recovery bandwidth performance screen 2--42..
Figure 2--15: Jitter gain check performance screen 2--45..............
Figure 2--16: Eye pattern display signal bandwidth performance
screen 2--47................................................
Figure 3--1: Adjustment locations on the video module 3--3...........
Figure 3--2: Serial out amplitude adjustment screen 3--5.............
Figure 3--3: SD PIX monitor adjustment screen 3--6.................
Figure 3--4: SD PIX G/Y output adjustment screen 3--8..............
Figure 3--5: SD PIX B/Pb and R/Pr output adjustment screen 3--8.....
Figure 3--6: HD PIX G/Y output adjustment screen 3--10.............
Figure 3--7: HD PIX B/Pb and PIX R/Pr output adjustment screen 3--10
Figure 3--8: Calibration routines menu 3--11........................
Figure 3--9: Eye vertical scale reference amplitude screen 3--13........
Figure 3--10: Eye vertical scale adjustment screen 3--14...............
Figure 3--11: SD Jitter gain adjustment screen 3--16..................
Figure 3--12: HD Jitter gain adjustment screen 3--18.................
WFM700 Series Waveform Monitors S ervice Manual
iii
Page 8

Table of Contents
Figure 3--13: Eye loop BW one UI adjustment screen 3--18............
Figure 3--14: Jitter HPF adjustment screen 3--23....................
Figure 4--1: Cabinet attaching screws 4--8.........................
Figure 4--2: WFM700 chassis cover, showing screws to loosen
and remove 4--10............................................
Figure 4--3: Plug-in module retaining screws 4--11...................
Figure 4--4: Grounding clip between two video modules 4--12..........
Figure 4--5: Removing a plug-in module 4--13.......................
Figure 4--6: WFM700 rear panel showing slot numbers 4--15..........
Figure 4--7: Inserting a module into the chassis 4-- 16.................
Figure 4--8: Installing the grounding clip between two video
modules 4--17...............................................
Figure 4--9: Front panel assembly 4--20............................
Figure 4--10: Keyboard access 4--21...............................
Figure 4--11: Fan assembly mounting 4--24.........................
Figure 4--12: Main circuit board securing screws 4--25................
Figure 4--13: Primary troubleshooting procedure 4--34...............
Figure 4--14: LED fault troubleshooting tree 1 4--35..................
Figure 4--15: LED fault troubleshooting tree 2 4--36..................
Figure 4--16: Blank screen troubleshooting tree 4--37.................
Figure 4--17: Front panel buttons and touch panel troubleshooting
tree 4--38..................................................
Figure 4--18: Diagnostics errors troubleshooting tree 4--39............
Figure 4--19: Audio (Option DG) diagnostics errors troubleshooting
tree 4--40..................................................
Figure 5--1: WFM700 replaceable circuit boards and cables 5--8......
Figure 5--2: WFM700 power supply assembly and rear panel
(B010999 and below) 5--10....................................
Figure 5--3: WFM700 replaceable chassis parts 5--13.................
Figure 5--4: WFM700 Audio board option DG 5--15..................
iv
WFM700 Series Waveform Monitors S ervice Manual
Page 9

List of Tables
Table of Contents
Table 2--1: T est equipment for performance verification 2--2.........
Table 3--1: Test equipment for adjustment procedures 3--2...........
Table 4--1: External inspection check list 4--4......................
Table 4--2: Internal inspection check list 4--5......................
Table 4--3: Tools required for module removal 4--7.................
Table 4--4: Failure symptoms and possible causes 4--27...............
Table 4--5: LED fault codes 4--32.................................
WFM700 Series Waveform Monitors S ervice Manual
v
Page 10

Table of Contents
vi
WFM700 Series Waveform Monitors S ervice Manual
Page 11

General Safety Summary
Review the following safety precautions to avoid injury and prevent damage to
this product or any products connected to it. To avoid potential hazards, use this
product only as specified.
Only qualified personnel should perform service procedures.
To Avoid Fire or
Personal Injury
Use Proper Power Cord. Use only the power cord specified for this product and
certified for the country of use.
Ground the Product. This product is grounded through the grounding conductor
of the power cord. To avoid electric shock, the grounding conductor must be
connected to earth ground. Before making connections to the input or output
terminals of the product, ensure that the product is properly grounded.
Observe All Terminal Ratings. T o avoid fire or shock hazard, observe all ratings
and markings on the product. Consult the product manual for further ratings
information before making connections to the product.
Do not apply a potential to any terminal, including the common terminal, that
exceeds the maximum rating of that terminal.
Replace Batteries Properly. Replace batteries only with the proper type and rating
specified.
Do Not Operate Without Covers. Do not operate this product with covers or panels
removed.
Use Proper Fuse. Use only the fuse type and rating specified for this product.
Avoid Exposed Circuitry. Do not touch exposed connections and components
when power is present.
Do Not Operate With Suspected Failures. If you suspect there is damage to this
product, have it inspected by qualified service personnel.
Do Not Operate in Wet/Damp Conditions.
Do Not Operate in an Explosive Atmosphere.
Keep Product Surfaces Clean and Dry.
Provide Proper Ventilation. Refer to the manual’s installation instructions for
details on installing the product so it has proper ventilation.
WFM700 Series Waveform Monitors S ervice Manual
vii
Page 12

General Safety Summary
Symbols and Terms
Terms in this Manual. These terms may appear in this manual:
WARNING. Warning statements identify conditions or practices that could result
in injury or loss of life.
CAUTION. Caution statements identify conditions or practices that could result in
damage to this product or other property.
Terms on the Product. These terms may appear on the product:
DANGER indicates an injury hazard immediately accessible as you read the
marking.
WARNING indicates an injury hazard not immediately accessible as you read the
marking.
CAUTION indicates a hazard to property including the product.
Symbols on the Product. The following symbols may appear on the product:
CAUTION
Refer to Manual
WARNING
High Voltage
Protective Ground
(Earth) Terminal
viii
WFM700 Series Waveform Monitors S ervice Manual
Page 13

Service Safety Summary
Only qualified personnel should perform service procedures. Read this Service
Safety Summary and the General Safety Summary before performing any service
procedures.
Do Not Service Alone. Do not perform internal service or adjustments of this
product unless another person capable of rendering first aid and resuscitation is
present.
Disconnect Power. To avoid electric shock, switch off the instrument power, then
disconnect the power cord from the mains power.
Use Care When Servicing With Power On. Dangerous voltages or currents may
exist in this product. Disconnect power, remove battery (if applicable), and
disconnect test leads before removing protective panels, soldering, or replacing
components.
To avoid electric shock, do not touch exposed connections.
WFM700 Series Waveform Monitors S ervice Manual
ix
Page 14

Service Safety Summary
x
WFM700 Series Waveform Monitors S ervice Manual
Page 15

Preface
Manual Content
Manual Conventions
This is the service manual for the WFM700HD, WFM700A, and WFM700M
multi-format, multi-standard waveform monitors.
Read this preface to learn how this manual is structured, what conventions it
uses, and where you can find other i nformation related to servicing this product.
This manual contains only information related to servicing the WFM700
instrument. For information related to installing and operating the instrument or
for a list of instrument specifications, refer to the appropriate user document as
described in Related User Documents on the following page.
Be sure to read the introductions to all procedures. These introductions provide
important information needed to do the service correctly, safely, and efficiently.
Module
Plug-in Module
Replaceable Parts
Safety
This manual uses certain conventions that you should become familiar with
before attempting service.
The term module refers to a collection of items that are replaceable as a unit. A
module may contain electrical and mechanical assemblies, circuit boards, and
interconnecting cables.
The term Plug-in Module refers to the units that plug into the Main board.
This manual refers to any field-replaceable assembly or mechanical part by its
name or generically as a replaceable part. In general, a replaceable part is any
circuit board or assembly that is listed in t he Replaceable Parts section.
Symbols and terms related to safety appear in the General Safety Summary found
at the beginning of this manual.
Be sure to read both the General Safety Summary and Service Safety Summary
before performing any service to this instrument.
WFM700 Series Waveform Monitors S ervice Manual
xi
Page 16

Preface
Related User Documents
The following related English user documents are available if you need more
information about operating the instrument. These documents are located on the
WFM700 User Documentation CD-ROM or can be downloaded from the
Tektronix, Inc. Web site (www.tektronix.com).
H WFM700 User Manual. This document provides the basic information you
H WFM700 Series T echnical Reference (English). Contains the following
need to install and operate the instrument. Included is a listing of the options
and accesories available for the instrument.
technical information about the instrument:
H Electrical and physical specifications, including a list of certifications
and compliances
H Descriptions of each menu selection, the status displays, and the Option
DG audio displays
Non-English Language
Documents
H Instructions for operating the instrument using remote control, including
the ground closure, Web server , and SNMP interfaces
H Procedures for checking the basic functions of the instrument, for
upgrading the instrument firmware, and for performing the user-service
tasks such as cleaning and maintenance, cabinet and rack adapter
installation, and module installation or replacement
H WFM700 Release Notes. This document describes new features provided by
a firmware release and also describes problems or behaviors that you might
encounter while using the waveform monitor.
H WFM700 Series SNMP MIB Reference (English). Describes the syntax of the
variables and traps for remotely controlling the instrument over a network
using SNMP.
The following non-English language documents are available:
H WFM700 Series User Documentation Package (Japanese). Contains a
printed Japanese language user manual and the CD-ROM described on the
previous page.
H WFM700 Series User Documentation Package (Korean). Contains a
printed Korean language user manual and the CD-ROM described on the
previous page.
xii
WFM700 Series Waveform Monitors S ervice Manual
Page 17

Related Reference Documents
The following related reference documents are available at the Tektronix, Inc.
website (www.tektronix.com):
H Preventing Illegal Colors. This application note describes how the Diamond,
Arrowhead, and Lightning displays on the waveform monitor can be used to
help prevent the undesired impact of color gamut violations and to simplify
the assessment of proper gamut compliance.
H Understanding Colors and Gamut. This poster provides a large visual
display of how the Diamond, Arrowhead, and Lightning displays on the
waveform monitor can be used to help prevent the undesired impact of color
gamut violations.
H A Guide to Standard and High Definition Digital Measurements. This book
is a primer for understanding the basics for making standard and high-definition, digital-video measurements.
H Audio Monitoring. This application note describes balanced and unbalanced
audio signals, and explains the physical and electrical characteristics and the
specific strength and weaknesses of the different digital audio signal formats.
Preface
H Monitoring Surround Sound Audio. This application note describes the
basics of 5.1-channel surround sound audio and how to use the Surround
Sound display to visualize key audio-level and phase relationships in this
audio format.
WFM700 Series Waveform Monitors S ervice Manual
xiii
Page 18

Preface
Contacting Tektronix
Phone 1-800-833-9200*
Address Tektronix, Inc.
Department or name (if known)
14200 SW Karl Braun Drive
P.O. Box 500
Beaverton, OR 97077
USA
Web site www.tektronix.com
Sales support 1-800-833-9200, select option 1*
Service support 1-800-833-9200, select option 2*
Technical support www.tektronix.com/support
1-800-833-9200, select option 3*
6:00 a.m. -- 5:00 p.m. Pacific Standard Time
* This phone number is toll free in North America. After office hours, please leave a voice mail
message.
Outside North America, contact a Tektronix sales office or distributor; see the Tektronix Web
site for a list of offices.
xiv
WFM700 Series Waveform Monitors S ervice Manual
Page 19

Theory of Operation
Page 20

Page 21

Theory of Operation
This chapter contains a module-level description of the WFM700 instrument.
Two block diagrams are provided to aid the descriptions. Figure 1--1 on
page 1--8 shows the signal flow of the instrument and Figure 1-- 2 on page 1 --9
shows the control flow.
Operating Conditions
The electrical specifications of the instrument are listed in the WFM700 Series
Technical Reference document and apply over an ambient temperature range of
+0 _Cto+40_C. The rated accuracies are valid when the instrument is
calibrated in an ambient temperature range of +20 _Cto+30_C.
Overview
The WFM700 accepts either SD (Standard Definition) or HD (High Definition)
serial video data at the input connectors of an installed Input Module (in either
slots 1 or 2 of the WFM700 mainframe). The applied video signal i s sent to SD
and HD equalizers (to compensate for signal degradation due to cable loss) and
to the eye sampler. The compensated serial video signal is converted to parallel
video and a clock signal is recovered. The parallel signal is further processed to
extract the embedded audio signal, detect the video format, and generate an RGB
Analog video signal. The embedded audio is encoded into AES signals that are
sent to the optional Audio module by way of the audio bus.
The parallel video signal is sent to the Real-time Display module on a digital
bus, 10 bits for SD video and 20 bits for HD video. The RGB video is sent to the
Reference module on the analog bus for component video output at the P IX G/Y,
PIX B/Pb, and PIX R/Pr connectors and the VGA PIX MON connector.
The Real-Time Display module accepts the parallel video signal from the
selected Input Module. The video signal is processed to display the information
in various forms on the raster display. The output from the Real-Time Display
module is sent to the Main Interface board via LVDS pairs. There the video
signal is added with text and graticule information from the VGA controller. The
combined video signal is sent to the LCD and the EXT VGA output connector.
Timing is accomplished by using the clock and TRS (timing reference signal)
from the video input signal. A clock and and TRS (from an analog video signal)
can be input via the External Reference module using the AUX IN connector.
WFM700 Series Waveform Monitors S ervice Manual
1- 1
Page 22

Theory of Operation
Communication between modules and the CPU is accomplished via the Main
Interface board using two main control busses (PCI and Serial) and two RS232
connections. The Input Modules and Real-Time Display module use the PCI bus.
The Reference Module uses the Serial bus. The Front Panel uses RS232 to
communicate with the CPU which interprets the information and sends the
commands to the appropriate modules. The CPU also communicates with the
Environmental Controller (on the Main Interface board) via an RS232 connection.
Power for the WFM700 is provided by the power supply module. The power
supply module accepts line input voltages within the range of 100 VAC to
240 VAC. Anytime line input voltage is supplied to the power supply module, a
+5 V housekeeping supply is activated, providing power to the front panel
ON/STBY switch and to the Environmental Controller (EC) on the Main
Interface board. Pressing the ON/STBY button activates the main power supply
(within the Power Supply module), providing power to the entire instrument and
modules.
Once the power supply stabilizes, the CPU module polls all slots (via the PCI
bus and Serial Control bus) to determine the installed modules.
Individual Module Descriptions
The following descriptions provide more detail about the individual functions of
each instrument board or module.
Front Panel Processor
LCD and Backlight
The Front Panel Processor board sends all front panel actions (including the
touch screen) to the CP U board via the RS232 Bus.
The LCD panel displays the video output from the Main Interface board via the
VGA Mux. The Backlight board supplies the high voltage necessary to drive the
backlight for the LCD panel.
1- 2
WFM700 Series Waveform Monitors S ervice Manual
Page 23

Theory of Operation
Input Module
The Input module is comprised of two circuit boards, a Mezzanine board and an
Input board.
The Mezzanine board provides two terminating serial inputs, each supporting
either SD (SMPTE 259M) or HD (SMPTE 292M) SDI signals. A mux selects
between the two inputs and sends the signal to an eye pattern sampler block and
a serial receiver block (equalizing the signal). The eye pattern sampler block
implements a 3 GHz equivalent-time sampler to allow viewing the input eye
pattern. The equalized SD or HD signal and the eye pattern data samples are sent
to the Input board.
On the Input board, an SD or HD serial-to-parallel block provides clock recovery
and serial-to-parallel conversion of the selected input. An FPGA block multiplexes between the eye sampler output and serial receiver block output (depending on instrument mode), implements any needed waveform conditioning (such
as ancillary data extraction), and outputs the parallel signal (20 bits for HD
mode, 10 bits for SD mode) to the Real-Time Display (RTD) board. The FPGA
block also extracts up to eight channels of audio signal which is put on the audio
bus for future use.
A DAC block creates a picture monitor signal which is output through the VGA
PIX MON connector and the component video connectors (PIX G/Y, PIX B/Pb,
PIX R/Pr) on the Reference Module.
External Connectors
H INPUT A. Digital input for signal to be monitored. For WFM700HD, this
can only accept 1.485 Gb/s and 1.4835 Gb/s High Definition serial video.
For the WFM700A and WFM700M, this input can accept HD and 270 Mb/s
Standard Definition video. This is a 75 8 terminating input.
H INPUT B. Digital input for signal to be monitored. For WFM700HD, this
can only accept 1.485 Gb/s and 1.4835 Gb/s High Definition serial video.
For the WFM700A and WFM700M, this input can accept HD and 270 Mb/s
Standard Definition video. This is a 75 8 terminating input.
H SD PIX MON. This output is a copy of the PIX G/Y, B/Pb, R/Pr pix mon
output, but in reclocked SD serial digital format. It is operational only for
SD input formats.
H SERIAL OUT. Provides an equalized and buffered version of the selected
signal input (Video Input A or B).
H JITTER OUT. (WFM700M only) Provides a 75 8 output signal from the
jitter demodulator. This signal is only valid when the instrument is in Jitter
mode. Any signal present on this output at other times is not a calibrated
jitter signal.
WFM700 Series Waveform Monitors S ervice Manual
1- 3
Page 24

Theory of Operation
Reference Module
The External Reference module provides synchronization for the WFM700
instrument, allowing you to sync the display to an analog video input. The
Reference Module accepts PAL and NTSC signals with bi-level sync (SD) or
tri-level sync (HD) input, so that timing of the SDI input signals can be
compared to the analog sync reference. The External Reference module
automatically detects the input standard. The Reference Board timing signals are
available to both the Input Module and Real-Time-Display Module.
The sync signal from the External Reference module is embedded in a data
stream of 27 MHz (for SD video), and 74.25 MHz or 74.1758 MHz (for HD
video). This data stream is called the TR S signal, and contains H, V, and F
information. The External Reference module acts as a data hub or router for TRS
(timing reference signal) signals to and from the input modules (slots 0 or 1) and
the Real-Time Display module.
External Connectors
H REF IN LOOP-THROUGH. Compensated for 75 8 impedance; requires
proper termination at one end of the loop-through connector or at the
receiver in a monitored system. Provides for connection of an external
synchronization signal such as black burst or composite video.
H AUX IN. Future capability.
H VGA PIX MON. A copy of the PIX G/Y, B/Pb, R/Pr pix mon outputs. This
allows using an inexpensive VGA monitor for non-critical HD applications.
Most computer monitors will not lock to 50 Hz vertical rates or to Standard
Definition line rates, so this may not work in all applications.
H PIX G/Y, B /Pb, R/Pr. Provides three 75 8 component signal outputs to drive
a component picture monitor. You can set the output format to YPbPr or
RGB.
H AUX OUT 1 / AUX OUT 2. Future capability.
1- 4
WFM700 Series Waveform Monitors S ervice Manual
Page 25

Theory of Operation
Main Interface Board
The Main Interface board provides signal paths and communication paths
between all modules.
H PCI Bus and Serial Control Bus are used for control and data transfer. Both
go to all slots. The PCI Bus is typically used for modules requiring
high-speed performance and communication between modules without the
use of the CPU board. The Serial Control Bus is used for modules requiring
less control and speed.
H The Timing Bus is used to distribute the TRS signal to the Input Modules
and the RTD board.
H The Audio Bus routes the digital audio signal (extracted from the video
serial input) to the module slots for use by future modules.
H The Video Bus routes the parallel video signal (with clock and sync signals)
to the RTD slot from the two Input slots.
The Main Interface board provides power distribution, contains thermal sensors,
and contains the Environmental Controller (EC). The EC monitors the front
panel ON/STBY switch to control the main power supply (in the Power Supply
module) and monitors all low voltage power sensors for inaccurate voltage
levels.
The VGA Controller routes the video signal to both the LCD and the EXT VGA
output. This output can be used to drive an external monitor to produce the same
display as seen on the LCD.
External Connectors
H EXT VGA. Provides an exact copy of the LCD screen to drive an external
monitor.
WFM700 Series Waveform Monitors S ervice Manual
1- 5
Page 26

Theory of Operation
CPU Board
Real Time Display (RTD)
Board
The CPU board receives commands from the Front Panel (buttons, knobs, and
touch screen) via RS232 connections, then transmits instructions to the other
modules via the PCI bus and Serial bus. The CPU also defines the operation of
the video channels (but is not in the video signal path). All text and graticule
information for the LCD panel is generated by the CPU board and sent to the
LCD via the VGA Mux on the Main Interface board.
External Connectors
H REMOTE. 9 pin subminiature D-type connector used as a Ground Closure
interface for remote control.
H USB. This connector is not used and was removed for CPU board versions
671-4528-04 (SN B019999 and below) and 671-5751-03 (SN B024089 and
above).
H ETHERNET. (10/100 Base T). 10/100 Mbit/sec Ethernet interface. Used for
downloading firmware upgrades.
Real Time Display board receives the parallel digital video signal from the Input
module and processes the video data to display the information in various forms
on the raster display. The different forms of display consist of sweeps (overlay or
parade), x y (vectors, lighting, diamond, ect.), and picture monitor. The RTD
board handles either standard definition (SD) or high definition (HD) data. Only
one channel is processed at a time.
The RTD is divided into two logical sections. The first section, the DSP engine,
performs signal processing and routing operations to create standard waveform
monitor displays. The second section, the rasterizer engine, performs attack and
decay operations to simulate an analog CRT phosphor screen. The rasterizer also
has the ability to partition multiple displays into separate windows.
The RTD accepts a 10 or 20-bit data stream (SD or HD) from either of two input
slots. A polyphase interpolator increases the data rate and fills gaps in the data.
The higher data rate allows the rasterizer to plot more pixels per second to
improve the display quality. The Measurement Processing block produces
various waveform displays such as Parade, Vector, and Diamond and also
performs gain, offsetting, and filtering operations. It outputs pairs of numbers
used by the Rasterizer and its companion memory to build a display map.
Memory values are incremented or decremented depending on these number
pairs, varying pixel display brightness according to frequency of occurrence,
similar to a phosphor screen. A Picture Mode Processing block allows a raster
picture display of the input signal, suitably adjusted to the 640x480 VGA display
format. The Rasterizer output is applied to the color LCD display after it is
combined with any text and graticules from the VGA controller.
1- 6
WFM700 Series Waveform Monitors S ervice Manual
Page 27

Theory of Operation
Audio Module (Option DG)
The Audio board receives serial audio data in AES/EBU format from the
selected Input module, or from the AES I/O connectors if they are configured as
inputs. When configured as outputs, the AES I/O connectors supply AES/EBU
serial audio de-embedded from the selected video input. The selection of
extracted embedded audio groups takes place within the Input module.
AES/EBU signals from the selected source are processed to extract channel
status, validity, and parity bits. The audio data is examined for clip and mute
conditions, and word length (active bits) and peak values are determined. Audio
data is up-sampled to 192 kb/sec for further processing.
DSP processors compute audio level according to the configured level meter
ballistic. The CPU periodically polls the Audio Module to get the current audio
levels, and then draws the corresponding bars via the VGA controller. Other data
concerning audio (clip, mute, channel status etc) is communicated in a similar
fashion from the Audio Module to the CPU for display, data logging, or alarm
activation.
A DSP processor creates a Lissajous image that is periodically transferred
directly to the VGA controller via the PCI bus.
External Connectors
H AES 1-2 I/O / AES 3-4 I/O / AES 5-6 I/O / AES 7-8 I/O. Four AES/EBU
format, AES-3id compatible inputs or outputs. As outputs, they supply serial
audio de-embedded from the selected video input. As inputs, they can be
selected for complete processing and display in place of embedded audio.
Power Supply Module
Diagrams
The power supply module accepts line input voltages within the range of
100 VAC t o 240 VAC. Anytime line input voltage is supplied to the power
supply module, a +5 V housekeeping supply is activated, providing power to the
front panel ON/STBY switch and to the Environmental Controller (EC) on the
Main Interface board. The EC continuously polls the front panel ON/STBY
switch. Pressing the front panel ON/STBY button instructs the EC to activate a
relay in the power supply module, activating the Main Power supply. The Main
Power supply provides +5 V, +3.3 V, +12 V and --12 V to the circuits and other
modules via the Main Interface board. The EC monitors all power supply
voltages and shuts down the Main Power supply if a problem is detected.
Figure 1--1 on page 1-- 8 is a block diagram of the signal flow of the instrument.
Figure 1--2 on page 1--9 is a block diagram of the control flow.
WFM700 Series Waveform Monitors S ervice Manual
1- 7
Page 28
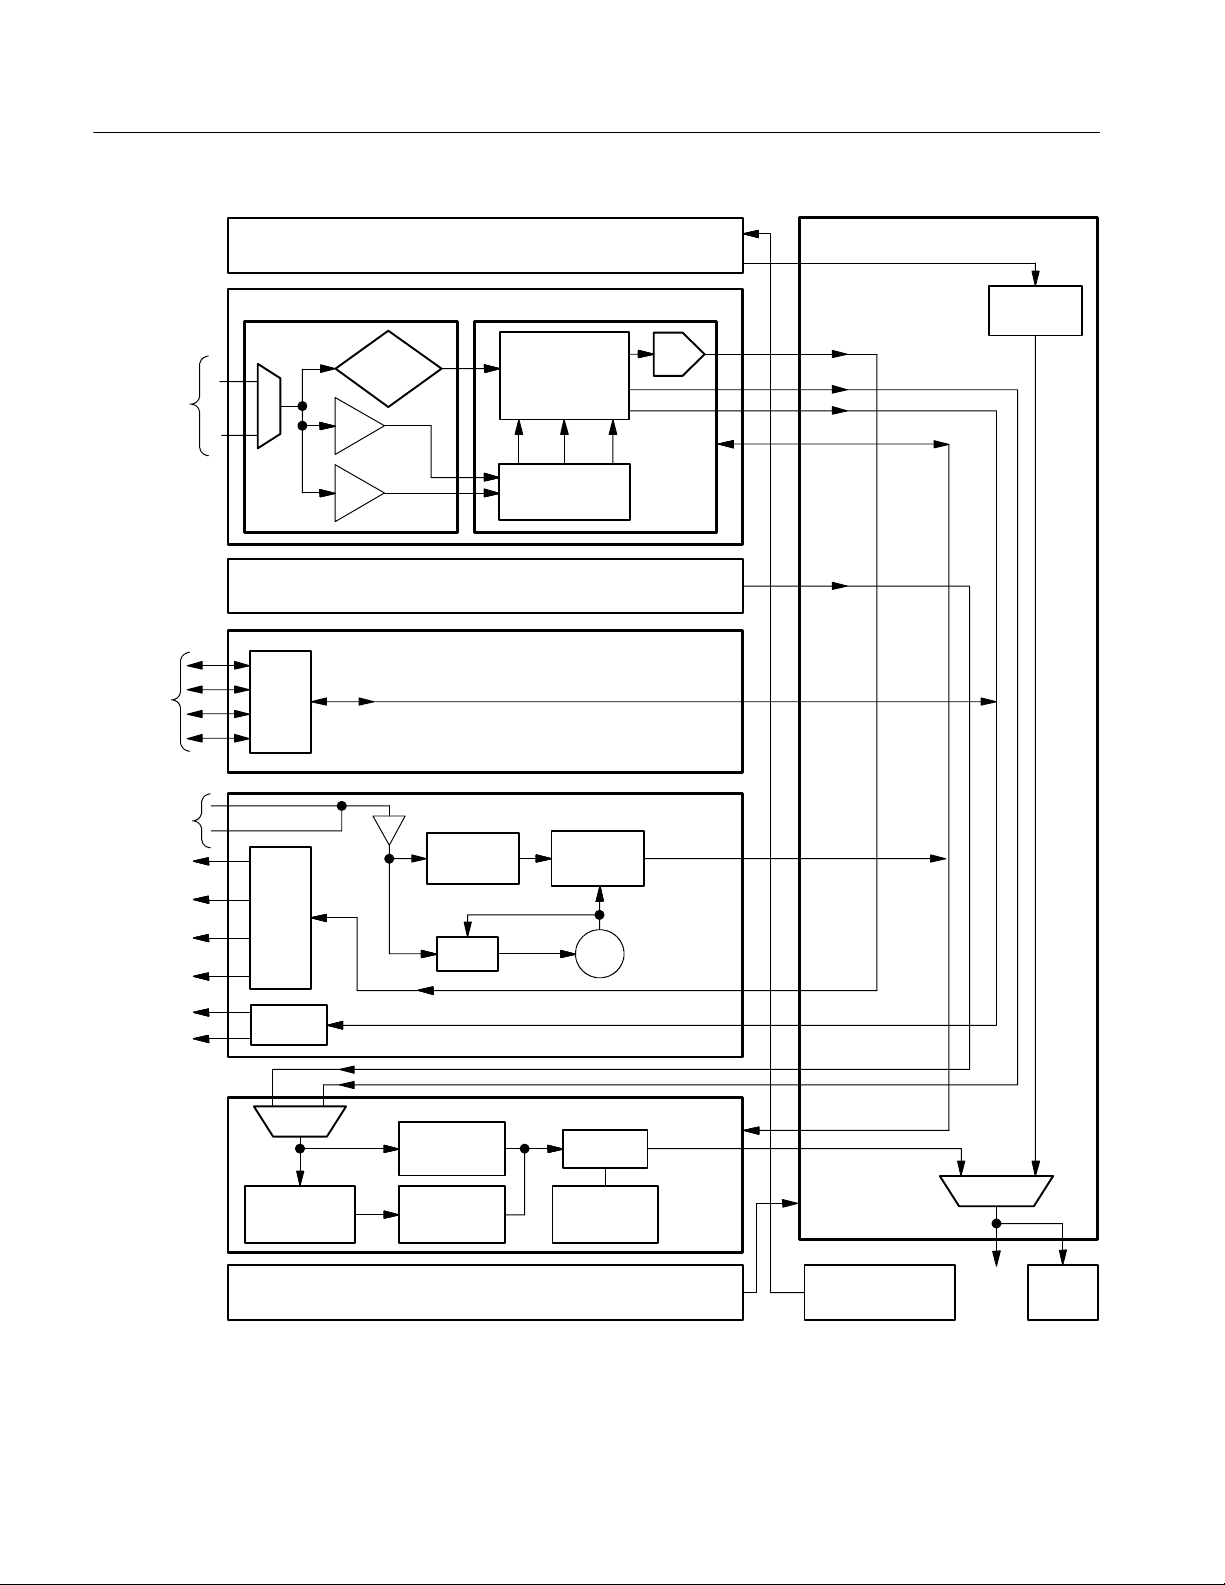
Theory of Operation
HD/SD
Serial In
AES
I/O
Ref In Loop
Through
VGA PIX Mon
PIX G/Y
PIX B/Pb
PIX R/Pr
A
B
Mezzanine
Board
I/O
Buffers
I/O
Buffers
Sampler
EQ
EQ
Eye
CPU
Board
SD
HD
Second
Input slot
Sync
Stripper
PLL Osc
FPGA for
Full-Speed Data
Massaging
HD SDClk
Serial to Parallel
Conversion
Generation
Input Module
Reference Module
TRS
DAC
HD/SD
Input
Board
Audio
Analog Bus
Main Interface Board
VGA
Controller
20 Bits at 75 MHz
plus clock and sync
Aux Out 1
Aux Out 2
Selector
Selector
Measurement
Processing
Picture Mode
Processing
Polyphase
Interpolator
Power Supply
Module
Figure 1- 1: WFM700 signal flow block diagram
1- 8
Audio Bus
RTD Module
Rasterizer
Fast Static
Memory
Timing Bus
Front panel controls
and touch screen
VGA MUX
output
WFM700 Series Waveform Monitors S ervice Manual
VGA
LCD
Panel
Page 29
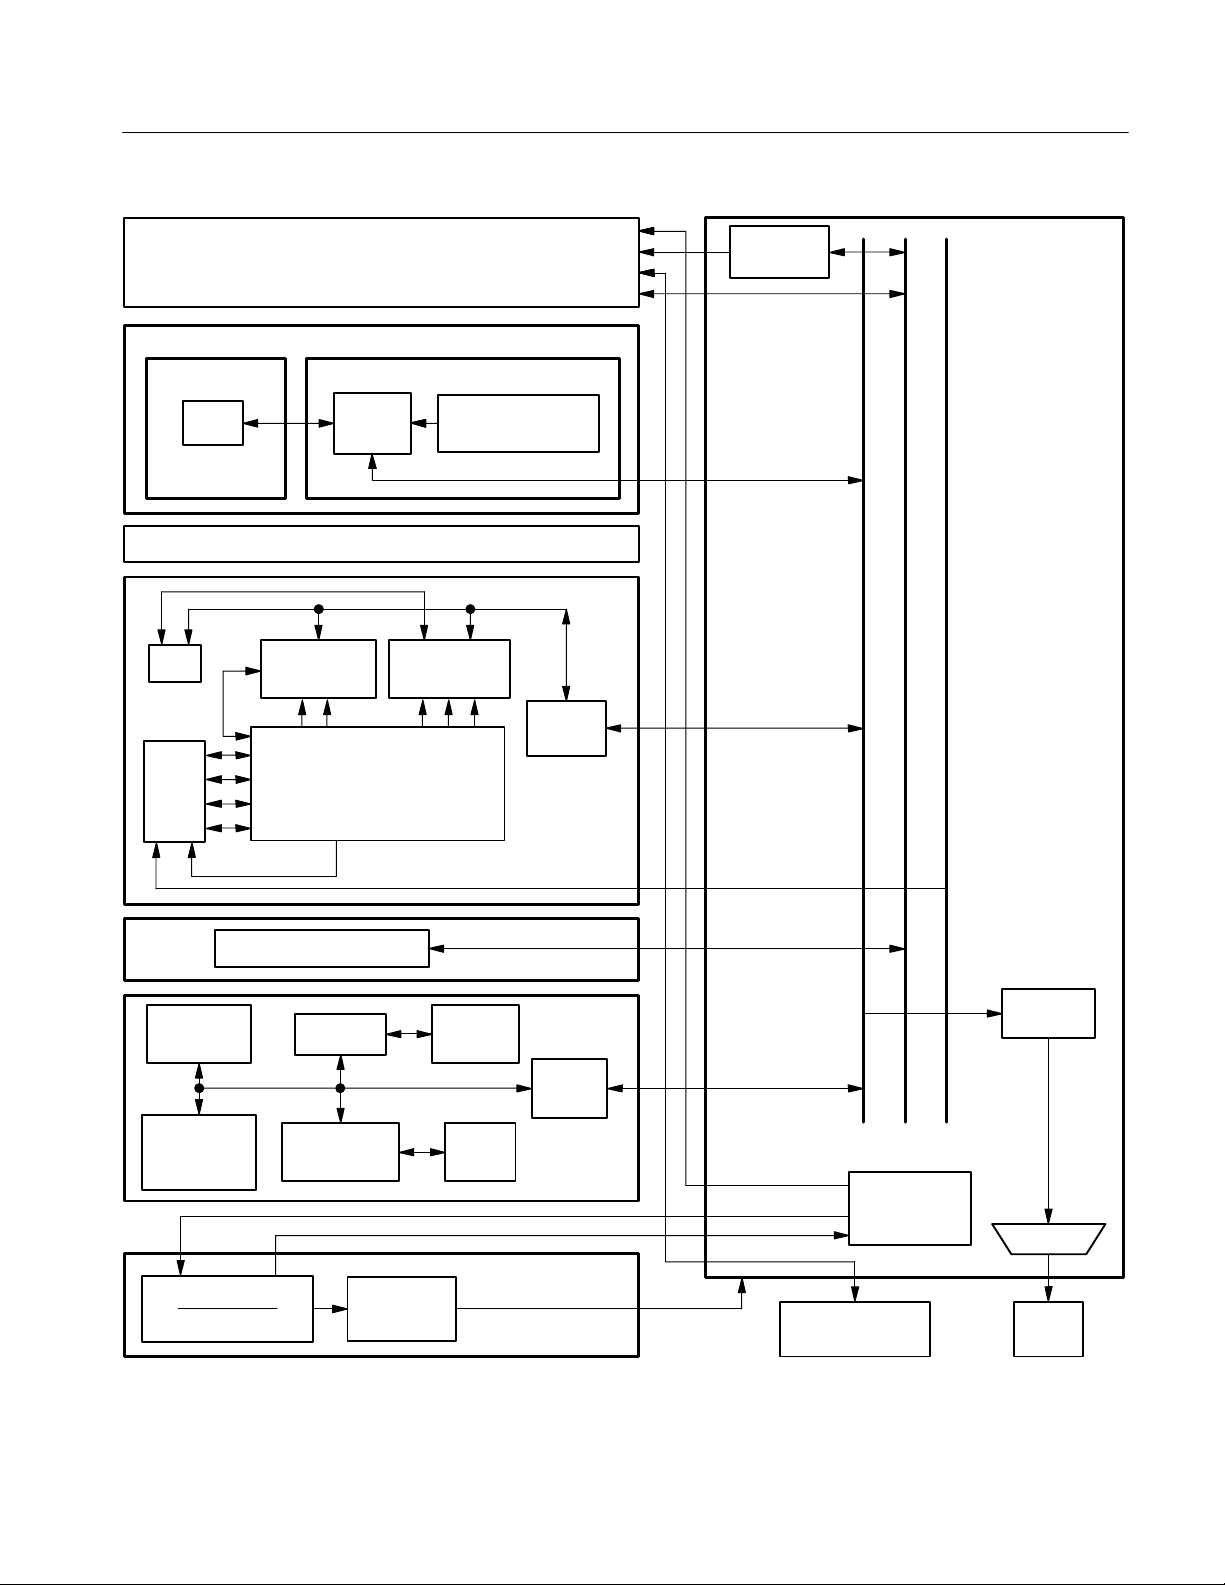
Theory of Operation
CPU Board
Input Module
Mezzanine Board HD/SD Input Board
RAM
Control
I/O
Buffers
PLD
PCI
Interface
Second Input slot
DSP 0
Bars, Control
Hardware Processing
AES Receivers, Rate Converters,
FPGA
FPGA for Full-Speed
Data Massaging
Audio Module
DSP 1
Bars, Lissajous
PCI
Interface
Serial Bus
Multiplexer
Main Interface Board
PCI Bus
Audio Bus
Serial Control Bus
Control
TRS Generation and control
Measurement
Processing
Logic Devices
Polyphase
Interpolator
Housekeeping Supply
Power Relay
Rasterizer
Recursive and
Pix Processing
Main Power
Supply
Figure 1- 2: Control flow block diagram
Reference Module
Fast Static
Memory
SDRAM
Power Supply Module
RTD Module
PCI
Interface
RS232
On-Off
RS232
Front panel controls
and touch screen
Environmental
Controller “EC”
VGA
Controller
VGA MUX
LCD
Panel
WFM700 Series Waveform Monitors S ervice Manual
1- 9
Page 30

Theory of Operation
1- 10
WFM700 Series Waveform Monitors S ervice Manual
Page 31

Performance Verification
Page 32

Page 33

Performance Verification
This section contains three procedures to verify the operation of all models of the
WFM700 waveform monitor. This includes the Video modules (WFM7HD,
WFM7A, and WFM7M) and the Audio module (WFM7DG). Please disregard
checks that do not apply to the module type you are testing.
H Self Tests use the internal diagnostic routines to verify proper power-up,
modules recognized and operating, and signal paths. No external equipment
is required for these tests.
H Functional Tests verify that the waveform monitor and its installed modules
are operating correctly.
H Performance Tests verify that the waveform monitor and all its installed
modules meet the performance requirements listed in the Specifications
section of the WFM700 Series Technical Reference document. This section
also includes checks for operating parameters that are specified as typical but
are not guaranteed. Firmware version 1.3 or above is required to perform all
performance tests.
H Test Records are provided at the end of this chapter to record the results of
each performance test that checks a warranted characteristic.
Prerequisites
Before doing the performance verification procedures, note the following
prerequisites:
H Personnel — Users should be familiar with the operation of all test
equipment and the WFM700.
H Two V ideo Modules — The verification procedures must be performed on
both video modules if two are installed in the WFM700. Complete the entire
performance procedures on one video module at a time.
H Audio Module — The verification procedure for the Option DG Audio
module must be performed if the module is installed in the WFM700.
H Warm-up Period — Turn on the WFM700 and allow a 20-minute warm-up
period in an environment that meets the operating range specifications for
temperature and humidity. Verification of warranted characteristics done
before the operating temperature has stabilized might cause errors.
Also turn on other required test equipment and allow them to warm up for
their recommended time periods.
WFM700 Series Waveform Monitors S ervice Manual
2- 1
Page 34

Performance Verification
Test Equipment Required
Table 2--1 lists the test equipment required to perform all of the performance
verification procedures. Some equipment may not be necessary for your
waveform monitor. The procedures describe the input signal characteristics
necessary to perform the test. Where external test equipment is required, refer to
your test equipment’s user manual for instructions to obtain the correct signal.
Table 2- 1: Test equipment for performance verification
Test equipment Requirements Example
HD serial digital video
test signal generator
SD serial digital video
test signal generator
Analog video test signal generator
1080i 59.94 100% color bars
1080i 59.94 10-bit shallow ramp matrix
1080i 59.94 0% flat field
1080i 59.94 75% SMPTE color bars
1080i 59.94 100/0/100/0 color bars
1080i 59.94 100/0/75/0 color bars
1080i 50 100% color bars
1080i 60 100% color bars
720p 59.94 100% color bars
1080i 59.94 100% sweep 1 -- 30 MHz
1080i 59.94 100% flat field
1080i 59.94 20 -- 30 MHz multiburst
525-format 100% color bars
525-format 10-bit shallow ramp matrix
525-format 0% flat field
525-format 75% color bars
525-format 100% flat field
525 line 60% multiburst
PAL black
1080i 50 black
1080i 60 black
720p 59.94 black
Tektronix TG2000 with HDVG1
module
Tektronix TG2000 with DVG1
module
Tektronix TG2000 with AVG1
module
WFM700
Opt.
1
A HD M
D D D D
D D D
D D D
DG
RF generator 20 MHz to 2.5 GHz
<1 dB level flatness
10 Hz to 100 kHz phase modulation with < 3%
setting error
Sinewave generator Capable of 0.8 V
Digital audio generator/
analyzer
Test oscilloscope 2 GHz vertical bandwidth Tektronix TDS794 D D D D
35 kHz to 96 kHz sample rate range, jitter
measurement per AES--3 (1997)
at6MHzintoa508 load Rohde & Schwarz SMT03 Opt
p-p
2- 2
Rohde & Schwarz SMT03 Opt
SM--B2
50 8 N-to-BNC adapter
SM--B2
Rohde & Schwarz UPL06 Opt
B22, B29
D D D
WFM700 Series Waveform Monitors S ervice Manual
D
D
Page 35

Performance Verification
Table 2- 1: Test equipment for performance verification (cont.)
WFM700
1
Test equipment
RequirementsTest equipment
Requirements
Example
Example
VGA monitor with
cable
Autotransformer Output range 90 V to 264 V D D D
75 8 coaxial cables
(2 required)
General purpose digital video
Male-to-male BNC connectors
Belden 8281 D D D D
36 inches long
1
D D D
Opt.
DG
MHDA
75 8 coaxial cable
(1 required)
Low loss digital video
Male-to-male BNC connectors
Belden 1695A D D D
18 inches long
50 8 coaxial cables
(2 required)
Precision
Male-to-male BNC connectors
36 inches long
Tektronix part number
012-0482-00
D D D D
1.5% impedance and attenuation accuracy Tektronix AMT75 D D D
75 8-to-50 8 adapter
(for test oscilloscope
input)
Wideband
50 8-to-75 8 matching pad
90 meters and 325
meters of 75 8 cable
0to2.5GHz,
Rohde & Schwarz RAM D
N connectors,
75 8 N-to-BNC adapter
Low loss cable. Cable simulators can be used
Belden 8281 D D D
as substitutes as follows:
SD Cable Simulator Faraday SC75A800 B--G Cable
D D
Clone
HD Cable Simulator Faraday FFC Kit D D D
Return loss bridge 75 8 test port
50 8 input and output ports
Wide Band Engineering
A57TUC with male 75 8 BNC
D D D D
test port
Calculator Logarithmic function D D D D
1
You may need additional cables and adapters, depending on the actual test equipment you use.
WFM700 Series Waveform Monitors S ervice Manual
2- 3
Page 36

Performance Verification
Performance Verification Conditions
NOTE. Menu selections in the WFM700 Waveform Monitor differ between
firmware versions. The Performance Verification procedures assume you have
the latest firmware version installed in your instrument.
The following conditions must be met prior to doing these procedures:
1. The WFM700 Waveform Monitor must have been operating continuously
for twenty (20) minutes in an environment that meets the operating range
specifications for temperature and humidity.
2. Connect the WFM700 Waveform Monitor and the test equipment to the
same AC power circuit or to a common power strip if you are unsure of the
AC power circuit distribution.
Self Tests
This procedure uses i nternal routines to verify that the waveform monitor
functions and passes its internal self tests. No test equipment or hookups are
required.
1. Press the PRESET button.
2. Touch the -- m o r e -- soft key, then touch the Restore Factory soft key.
NOTE. Restoring factory settings overrides the current instrument state but does
not alter calibration or presets.
3. Press the CONFIG front panel button.
4. Touch System and then Diagnostics.
5. Touch Diagnostics, then View Diagnostic Log.
6. Touch **Erase** NVRAM Log to clear the log file.
7. Touch Back to Diags Menu.
8. Touch Run Full Powerup Diagnostics.
9. Touch Back to Diags Menu.
2- 4
10. Touch View Diagnostics Log.
11. CHECK the diagnostics log pages to verify that there are no red FAIL
messages.
WFM700 Series Waveform Monitors S ervice Manual
Page 37

Performance Verification
12. Touch **Erase** NVRAM Log to clear the log file.
13. Touch Back to Diags Menu.
14. Touch Run Internal Digital Path Diagnostics.
15. Read the screen text, and then touch Continue to acknowledge that a reboot
will be required. The diagnostic test will run.
16. CHECK for the following display properties:
a. Verify that four ramp patterns (bars) appear on the display as gray, blue,
green, and red.
b. Verify that each ramp pattern has brightness steps approximately every
1/16 inch.
c. Verify there are no color bands in the gray ramp display.
17. Press the flashing SELECT button to return to the diagnostics menu.
18. Touch View Diagnostics Log.
19. CHECK the diagnostics log pages to verify that there are no red FAIL
messages.
20. Touch **Erase** NVRAM Log to clear the log file.
STOP. Unless the WFM700 has the optional Audio module (Option DG), skip
down to step 28 to complete this procedure.
21. Touch Back to Diags Menu.
22. Touch Run Audio Path Diagnostics.
23. Read the screen text, and then touch Continue to acknowledge that a reboot
will be required. The diagnostic test will run.
24. Touch the Back to Diags Menu.
25. Touch View Diagnostics Log.
26. CHECK the diagnostics log pages to verify that there are no red FAIL
messages.
27. Touch **Erase** NVRAM Log to clear the log file.
28. Cycle the power to reboot the WFM700.
29. Press the PRESET button and touch the –more-- soft key.
30. Touch the Restore Factory soft key.
WFM700 Series Waveform Monitors S ervice Manual
2- 5
Page 38

Performance Verification
Functional Tests
These functional tests provide tests to check basic functionality of the inputs and
general operation prior to starting the Performance Tests. A more exhaustive
check of all functions and buttons is provided in the Technical Reference.
Preliminary Setup and
Test
The Preliminary Setup performs the following tasks:
H Sets the waveform monitor to a known state
H Provides instructions for test equipment setup used throughout the
Functional Tests
H Provides a preliminary check of the video input path and display
1. Press the PRESET button.
2. Touch the -- m o r e -- soft key, then touch the Restore Factory soft key.
Restoring factory settings overrides the current instrument state but does not
alter calibration or presets.
3. Connect a serial digital output from the HD video generator to INPUT A
using a 75 8 cable.
4. Set the HD video generator for a 1080i 59.94 100% color bars signal.
5. Connect a serial digital output from the SD video generator to INPUT B
using a 75 8 cable.
6. Set the SD video generator for a 525-format 100% color bars signal.
7. Press the INPUT button and touch the Input A soft key.
HD Input and Embedded
Audio Detection
2- 6
8. CHECK that an HD color bar signal is displayed.
9. Press the DISPLAY button. Adjust the Trace Settings, Graticule Settings,
and Readouts & Backlight settings for best viewing.
This procedure checks the input detection and audio disembedding data paths for
high definition video.
1. Press the WFM button.
2. Press the INPUT button and touch the Input A soft key.
3. Disable or disconnect the HD video generator signal to INPUT A.
4. CHECK that the red IInput UnlockedI message is displayed.
WFM700 Series Waveform Monitors S ervice Manual
Page 39

Performance Verification
5. Enable or reconnect the HD video generator signal to INPUT A.
6. CHECK that the red IInput UnlockedI message is gone.
7. Set the HD video generator for 2 groups of embedded audio, starting with
group 1.
8. Press the STATUS button.
9. Touch the Display soft key.
10. Touch the Session soft key and then touch the Done soft key.
11. Option DG only: Touch the Video Session soft key if necessary to select
Video Session.
12. CHECK that the embedded audio status reads as follows:
Embedded Audio: PPPP PPPP ---- ----
SD Input and Embedded
Audio Detection (WFM7A,
WFM7M only)
This procedure checks the input detection and audio disembedding data paths for
standard definition video.
1. Press the WFM button.
2. Press the INPUT button and touch the Input B soft key.
3. Disable or disconnect the SD video generator signal to INPUT B.
4. CHECK that the red IInput UnlockedI message is displayed.
5. Enable or reconnect the SD video generator signal to INPUT B.
6. CHECK that the red IInput UnlockedI message is gone.
7. Set the SD video generator for 2 groups of embedded audio, starting with
group 1.
8. Press the STATUS button.
9. Touch the Display soft key.
10. Touch the Session soft key and then touch the Done soft key.
11. Option DG only: Touch the Video Session soft key if necessary to select
Video Session.
12. CHECK that the embedded audio status reads as follows:
Embedded Audio: PPPP PPPP ---- ----
WFM700 Series Waveform Monitors S ervice Manual
2- 7
Page 40

Performance Verification
VGA Outputs
This procedure checks VGA PIX MON and EXT VGA outputs.
1. Connect a VGA monitor to the VGA PIX MON output.
2. Press the INPUT button and touch the Input A soft key.
3. Press the CONFIG button.
4. Touch the Video Inputs/Outputs soft key, then Next Menu.
5. Touch the Output Active for HD soft key.
6. Touch the RGB soft key.
7. CHECK that color bars are correctly displayed on the VGA monitor.
NOTE. Some VGA monitors do not synchronize correctly to color bars with
tri-level sync. If the picture is not locked, select a flat field signal from the
generator, then switch back to color bars.
8. Move the VGA monitor cable from the VGA PIX MON output to the EXT
VGA output.
9. CHECK that the external VGA display matches the display on the LCD.
10. Disconnect the test setup.
2- 8
WFM700 Series Waveform Monitors S ervice Manual
Page 41

Performance Tests
Performance Verification
The Performance Tests verify that the WFM700 waveform monitor (all models)
meets the warranted characteristics listed in the Specifications section of the
WFM700 Series T echnical Reference document. Characteristics with typical
specifications (not warranted) are also checked.
NOTE. WFM700 firmware version 1.3 or above is required to perform all tests in
this section. Verify the firmw are version and update if needed.
Power Source Ra nge
This test checks for stable operation over a varied AC input range.
Performance Requirement. This test verifies performance characteristics and is
listed in the test record.
1. Connect the AC power cord from the WFM700 to the variable
autotransformer.
2. Power on both the autotransformer and the WFM700.
3. Connect the HD video generator to INPUT A using a 75 8 cable.
4. Set the HD video generator for a 1080i 59.94 100% Sweep1–30MHz
signal.
5. Press the INPUT button and select Input A.
6. Vary the autotransformer from 90 V to 264 V.
7. CHECK for a stable display and no error indications over the entire voltage
range.
8. Set autotransformer to 90 V.
9. Press the ON/STBY button to power off the WFM700.
10. Press the ON/STBY button to power on the WFM700.
11. CHECK that the WFM700 re-starts and after boot-up the HD color bar signal
is displayed.
12. Return the autotransformer setting to local nominal mains voltage.
WFM700 Series Waveform Monitors S ervice Manual
2- 9
Page 42

Performance Verification
Signal Data Paths
This test checks the digital data paths.
Performance Requirement. This test verifies performance characteristics and is
listed in the test record.
The following characteristics are directly checked:
H Vertical Measurement Accuracy, YPbPr
H Vector Vertical Gain Accuracy
The following characteristics are indirectly checked:
H Frequency Response
H Sweep Accuracy and Linearity
H Vector Horizontal Gain Accuracy
H Vector Display to Graticule Registration
H Lightning and Diamond Vertical Gain Accuracy
H Arrowhead Signal to Graticule Registration
H Arrowhead Composite Limit Cursor Accuracy and Detection Level
Accuracy
1. Ensure that the Self Tests on page 2--4 have been performed and passed.
2. Connect the HD video generator to INPUT A using a 75 8 cable.
3. Press the INPUT button and select Input A.
4. Set the HD video generator for a 1080i 59.94 10-bit Shallow Ramp Matrix
signal.
5. Press the WFM button.
6. Touch Pr and Pb to turn off the color difference signals.
NOTE. The Y component must be on to allow both the Pr and Pb components to
be turned off.
2- 10
WFM700 Series Waveform Monitors S ervice Manual
Page 43

Performance Verification
7. CHECK that the steps in the displayed ramps are monotonic (all steps are in
the same direction) and approximately one pixel high. See Figure 2--1.
NOTE. If the steps are 4 pixels high, it may be that the input signal has only 8
bits of resolution.
8. Press the GAIN button.
9. Touch Gain: 10x.
10. CHECK that the steps in the ramps are 0.7 mV to 0.9 mV. (Use the voltage
cursors for this measurement.) See Figure 2--2.
11. Press the WFM button.
12. Touch Pb to turn on the Pb component.
13. Touch Y to turn off the Y component.
14. Press the GAIN button.
15. Touch Gain: 1x.
16. CHECK for step direction and height by repeating steps 7 through 10 above.
17. Press the WFM button.
18. Touch Y and Pr to turn these components back on. All components should
be on (Y, Pb, and Pr).
WFM700 Series Waveform Monitors S ervice Manual
2- 11
Page 44

Performance Verification
Cursors adjusted to
measure one step
Figure 2- 1: Signal data paths performance verification screen one
2- 12
Figure 2- 2: Signal data paths performance verification screen two
WFM700 Series Waveform Monitors S ervice Manual
Page 45

Performance Verification
Stop here for WFM7HD. The Signal Data Path procedure is now finished for the
WFM7HD Input Module. Continue with this check if testing a WFM7A or
WFM7M Input Module.
19. Connect the SD video generator to INPUT B using a 75 8 cable.
20. Set the SD video generator for a 525-format 10-bit shallow ramp matrix
signal.
21. Press the INPUT button and select Input B.
22. Press the WFM button.
23. Touch Pr and Pb to turn off the color difference signals.
NOTE. The Y component must be on to allow both the Pr and Pb components to
be turned off.
24. CHECK that the steps in the displayed ramps are monotonic (all steps are in
the same direction) and approximately one pixel high. See Figure 2--1.
NOTE. If the steps are 4 pixels high, it may be that the input signal has only 8
bits of resolution.
25. Press the GAIN button.
26. Touch Gain: 10x.
27. Press the CLR MENU button.
28. CHECK that the steps in the ramps are 0.7 mV to 0.9 mV. (Use the voltage
cursors for this measurement.)
29. Press the WFM button.
30. Touch Pr and Pb to turn these components back on. All components should
be on (Y, Pb, and Pr).
31. Press the GAIN button.
32. Touch Gain: 1x.
WFM700 Series Waveform Monitors S ervice Manual
2- 13
Page 46

Performance Verification
HD LCD Pixel Defects
(WFM7HD only)
This step checks for defective display pixels with a HD video signal.
Performance Requirement. This test verifies performance characteristics and is
listed in the test record.
1. Connect the HD video generator to INPUT A using a 75 8 cable.
2. Set the HD video generator for a 1080i 59.94 100% flat field signal.
3. Press the INPUT button and select Input A.
4. Press the PICTURE button.
5. Count any pixels stuck low (not white).
6. Change the HD video generator signal to 0% flat field.
7. Count any pixels stuck high (not black).
8. CHECK the total number of pixels counted in steps 5 and 7 is less than six.
NOTE. If the bad pixel count exceeds six, perform the procedure again. If a pixel
fails for both black and white signals, count it only once.
SD LCD Pixel Defects
(WFM7A and WFM7M
only)
This step checks for defective display pixels with a SD video signal.
Performance Requirement. This test verifies performance characteristics and is
listed in the test record.
1. Connect the SD video generator to INPUT B using a 75 8 cable.
2. Set the SD video generator for a 525--format 100% flat field signal.
3. Press the INPUT button and select Input B.
4. Press the PICTURE button.
5. Count any pixels stuck low (not white).
6. Change the SD video generator signal to 0% flat field.
7. Count any pixels stuck high (not black).
8. CHECK the total number of pixels counted in steps 5 and 7 is less than six.
NOTE. If the bad pixel count exceeds six, perform the procedure again. If a pixel
fails for both black and white signals, count it only once.
2- 14
WFM700 Series Waveform Monitors S ervice Manual
Page 47

Performance Verification
Error Detection Data
Paths
This test checks data paths and error detection.
Performance Requirement. This test verifies performance characteristics and is
listed in the test record.
The following characteristics are directly and indirectly checked:
H Data Integrity
H RGB Gamut error Detection Level Limits
H RGB Gamut error Detection Level Accuracy
1. Connect the HD video generator to INPUT A using a 75 8 cable.
2. Set the HD video generator for a 1080i 59.94 0% flat field signal. Enable
Error Detection and Handling (EDH) if necessary.
3. Press the INPUT button and select Input A.
4. Press the STATUS button.
5. Touch the Display soft key.
6. Touch the Alarm Status soft key and then touch the Done soft key.
7. Touch the Serial Alarms soft key.
8. CHECK that the Embedded CRC status reads:
292M Y CRC error Status:OK
292M C CRC error Status:OK
9. Touch the General Alarms soft key.
10. CHECK that gamut errors read as follows:
RGB Gamut Error Status: OK
Composite Gamut Error Status: OK
11. Set the HD video generator for a 1080i 59.94 SMPTE color bars signal.
12. CHECK that gamut errors read as follows:
RGB Gamut Error Status: Alarm
Composite Gamut Error Status: OK
13. Set the HD video generator for a 1080i 59.94 100% color bars signal.
14. CHECK that gamut errors read as follows:
RGB Gamut Error Status: OK
Composite Gamut Error Status: Alarm
WFM700 Series Waveform Monitors S ervice Manual
2- 15
Page 48

Performance Verification
Serial Video Output
This test checks the serial video output signal into a 75 8 load.
Performance Requirement. This test verifies performance characteristics and is
listed in the test record.
1. Connect the SD video generator to INPUT B using a 75 8 cable.
2. Set the SD video generator for a 525-format 100% color bars signal.
3. Connect the SERIAL OUT to the 75 8 input of the test oscilloscope using a
75 8 cable. Use a 75 8-to-50 8 adapter on the input of the test oscilloscope
if necessary.
4. Press the INPUT button and select Input B.
I
NOTE. If testing a WFM7HD, a display message will report
standard
I
. This will not affect the test.
unsupported
5. Measure the signal amplitude on the test oscilloscope and note this measurement. The following substeps will help obtain a measurable display on the
test oscilloscope.
a. Ensure that the termination is correct on the test oscilloscope.
b. Set the vertical scale to 200 mV/div, horizontal scale to 5 ns/div, and the
trigger position to 90%.
c. Set the display style to dots.
d. Set the trigger level to zero, and to neglect glitches of either polarity for
widths to 30 ns.
e. The oscilloscope display should show a few random transitions followed
by 30 ns with no transitions. This is followed by the triggering transition. See Figure 2--3.
f. When measuring, disregard signal noise. Measure the waveform
amplitude from the centers of the high and low levels in the region from
5 ns to 10 ns before the triggering transition.
g. Note the signal amplitude.
6. Calculate the percent amplitude error with the formula below using the
measured value from step 5.
Amplitude Error
Æ
Measured mV 800 mV
8
É
7. CHECK that the calculated error is between5%.
2- 16
WFM700 Series Waveform Monitors S ervice Manual
Page 49

Performance Verification
Measure amplitude before
triggering transition
Figure 2- 3: Ser ial video output level performance verification screen
SD PIX MON Output Level
This test checks the SD PIX MON output level into 75 8 load.
Performance Requirement. This test verifies performance characteristics and is
listed in the test record.
1. Connect the SD video generator to INPUT B using a 75 8 cable.
2. Set the SD video generator for a 525-format 100% color bars signal.
3. Connect the SD PIX MON output to the 75 8 input of the test oscilloscope
using a 75 8 cable. Use a 75 8-to-50 8 adapter on the input of the test
oscilloscope if necessary .
4. Press the INPUT button and select Input B.
NOTE. A WFM7HD will report
I
unsupported standardI. This will not affect the
results of this check.
5. Measure the signal amplitude on the test oscilloscope. The following
substeps will help obtain a measurable display on the test oscilloscope. Note
this measurement.
a. Ensure that the termination is correct on the test oscilloscope. Use a
converter if necessary.
WFM700 Series Waveform Monitors S ervice Manual
2- 17
Page 50

Performance Verification
b. Set the vertical scale to 200 mV/div, horizontal scale to 5 ns/div, and the
trigger position to 90%.
c. Set the display style to dots.
d. Set the trigger level to zero, and to neglect glitches of either polarity for
widths to 30 ns.
e. The oscilloscope display should show a few random transitions followed
by 30 ns with no transitions. This is followed by the triggering transition. See Figure 2--4.
f. When measuring, disregard signal noise. Measure the waveform
amplitude from the centers of the high and low levels in the region from
5 ns to 10 ns before the triggering transition.
g. Note the measurement.
6. Calculate the percent amplitude error using the formula:
Æ
Percent Amplitude Error
Measured mV 800 mV
8
7. CHECK that the calculated error is within5%.
Measure amplitude before
triggering transition
É
2- 18
Figure 2- 4: SD PIX MON output level performance screen
WFM700 Series Waveform Monitors S ervice Manual
Page 51

Performance Verification
PIX Video Output Level
This step checks the active video and of black (blanking) levels.
Performance Requirement. This test verifies performance characteristics and is
listed in the test record.
1. Connect the HD video generator to INPUT A using a 75 8 cable.
2. Press the INPUT button and select Input A.
3. Set the HD video generator for a 1080i 59.94 100% color bars signal.
4. Connect the PIX G/Y output to the 75 8 input of the test oscilloscope using
a758 cable. Use a 75 8-to-50 8 adapter on the input of the test oscillo-
scope if necessary.
5. Press the CONFIG button.
6. Touch the Video Inputs/Outputs soft key, then Next Menu.
7. Touch the Output Active for HD soft key, then YPbPr.
8. Press the CONFIG button twice to exit menu.
9. Set the test oscilloscope to view the first color bar. The following oscillo-
scope settings normally provide a usable display.
Vertical Scale 100 mV/div
Vertical Position –3.5 div
Horizontal Scale 1 us/div
Horizontal Trigger Position 50%
Trigger Slope Rising edge
Trigger Level 500 mV
10. Measure the amplitude between the black level and the first color bar and
note the measurement. See Figure 2--5.
11. Calculate the percent amplitude error using the formula:
Amplitude Error
Æ
Measured Amplitude mV 700 mV
7
É
12. CHECK that the calculated error is between 5%.
13. Measure the amplitude of the black level (the level preceding the first color
bar step) referenced to ground on the test oscilloscope. Note the measurement. See Figure 2--5.
14. CHECK that the black level is between 25 mV.
WFM700 Series Waveform Monitors S ervice Manual
2- 19
Page 52

Performance Verification
First color bar
Ground reference
Black level
Figure 2- 5: HD pix G/Y video output level performance screen
15. Move the cable from the PIX G/Y to the PIX B/Pb connector.
16. Set the test oscilloscope to view the signal. The following oscilloscope
settings normally provide a usable display.
Vertical Scale 100 mV/div
Horizontal Scale 10 us/div
Horizontal Trigger Position 10%
Trigger Slope Rising edge
Trigger Level 300 mV
17. Measure the peak-to-peak amplitude of the waveform displayed on the
oscilloscope. See Figure 2--6.
18. Calculate the percent amplitude error using the formula:
Amplitude Error
Æ
Measured Amplitude mV 700 mV
7
É
2- 20
19. CHECK that the calculated error is between 5%.
20. Measure the black level (the widest horizontal step) referenced to ground on
the test oscilloscope. Change test oscilloscope settings as needed to obtain
the best display. See Figure 2--6.
21. CHECK that the black level is between 25 mV.
WFM700 Series Waveform Monitors S ervice Manual
Page 53

Performance Verification
22. Move the cable from the PIX B/Pb to the PIX R/Pr connector.
23. Repeat steps 17 through 21.
Pk - Pk
level
Ground reference
Black
level
Figure 2- 6: HD pix B/Pb and R/Pr video output level performance screen
Stop here for WFM7HD. The PIX Video Output Level procedure is now finished
for the WFM7HD Input Module. Continue with this check if testing a WFM7A
or WFM7M Input Module.
24. Connect the SD video generator to INPUT B using a 75 8 cable.
25. Press the INPUT button and select Input B.
26. Set the SD video generator for a 525-format 100% color bars signal.
27. Connect the PIX G/Y output to the 75 8 input of the test oscilloscope using
a758 cable. Use a 75 8-to-50 8 adapter on the input of the test oscillo-
scope if necessary.
28. Press the CONFIG button.
29. Touch the Video Inputs/Outputs soft key, then Next Menu.
30. Touch the Output Active for SD soft key, then YPbPr.
31. Press the CONFIG button twice to exit the menu.
WFM700 Series Waveform Monitors S ervice Manual
2- 21
Page 54

Performance Verification
32. Set the test oscilloscope to view the first color bar. The following oscilloscope settings normally provide a usable display.
Vertical Scale 100 mV/div
Vertical Position –3.5 div
Horizontal Scale 5 us/div
Horizontal Trigger Position 50%
Trigger Slope Rising edge
Trigger Level 500 mV
33. Measure the amplitude between the black level and the first color bar and
note the measurement. See Figure 2--7.
34. Calculate the percent amplitude error using the formula:
Amplitude Error
Æ
Measured Amplitude mV 700 mV
7
É
35. CHECK that the calculated error is between 5%.
36. Measure the black level (the level preceding the first color bar step)
referenced to ground on the test oscilloscope. Change test oscilloscope
settings if needed. Note the measurement. See Figure 2--7.
37. CHECK that the black level is between 25 mV.
First color bar
2- 22
Ground reference
Black level
Figure 2- 7: SD pix video output level performance screen
WFM700 Series Waveform Monitors S ervice Manual
Page 55

Performance Verification
38. Move the cable from the PIX G/Y to the PIX B/Pb connector.
39. Set the test oscilloscope to view the signal. The following oscilloscope
settings normally provide a usable display.
Vertical Scale 100 mV/div
Horizontal Scale 10 us/div
Horizontal Trigger Position 10%
Trigger Slope Rising edge
Trigger Level 300 mV
40. Measure the peak-to-peak amplitude of the waveform displayed on the
oscilloscope. See Figure 2--6 on page 2--21.
41. Calculate the percent amplitude error using the formula:
External Reference
Amplitude Error
Æ
Measured Amplitude mV 700 mV
7
É
42. CHECK that the calculated error is between 5%.
43. Measure the black level (the widest horizontal step) referenced to ground on
the test oscilloscope. Change test oscilloscope settings as needed to obtain
the best display. See Figure 2--6.
44. CHECK that the black level is between 25 mV.
45. Move the cable from the PIX B/Pb to the PIX R/Pr connector.
46. Repeat steps 40 through 44.
47. Disconnect the cable from the PIX R/Pr connector.
This test checks for stable operation with external reference signals.
Performance Requirement. This test verifies performance characteristics and is
listed in the test record.
1. Connect the output from the analog video generator to one of the REF IN
connectors using a 75 8 cable.
2. Connect a 75 8 termination to the remaining REF IN connector.
3. Set the analog video generator for a PAL black signal.
4. Connect the output from the HD video generator to INPUT A using a 75 8
cable.
5. Set the HD video generator for a 1080i 50 100% color bars signal.
WFM700 Series Waveform Monitors S ervice Manual
2- 23
Page 56

Performance Verification
6. Press the DISPLAY button and touch the Thumbnail Picture soft key (to
turn off the thumbnail picture).
7. Press the WFM button.
8. Press the INPUT button and select Input A.
9. Touch the Reference: soft key so that Reference is set to External.
10. CHECK that the displayed waveform remains locked to the external
reference.
NOTE. The waveform is considered locked if the color bar steps are distinct and
I
the red
The appearance of the displayed waveform depends on the phase or frequency
difference between the HD video generator and the analog video generator. A
phase difference causes a horizontal shift of the waveform, while a frequency
difference causes the waveform to slowly roll horizontally.
UnlockedImessage is not present.
11. Set the analog video generator for a 1080i 60 black signal.
12. Set the HD video generator for a 1080i 60 100% color bars signal.
13. CHECK that the displayed waveform remains locked to the external
reference.
14. Set the analog video generator for a 720p 59.94 black signal.
15. Set the HD video generator for a 720p 59.94 100% color bars signal.
16. CHECK that the displayed waveform remains locked to the external
reference.
17. Touch the Reference: soft key so that Reference is set to Internal.
18. Disconnect the analog video generator.
2- 24
WFM700 Series Waveform Monitors S ervice Manual
Page 57

Performance Verification
GBR Frequency Response
This test checks the typical performance of the PIX G/Y, PIX B/Pb, and PIX
R/Pr outputs.
Typical Operation Check. This test checks for typical output levels. Typical values
are not guaranteed characteristics and are not listed in the test record.
1. Connect the output from the HD video generator to INPUT A using a 75 8
cable.
2. Set the HD video generator for a 1080i 59.94 20--30 MHz Multiburst signal.
3. Set the HD video generator Pb and Pr amplitudes to 0 (off).
4. Connect the PIX G/Y output to the 75 8 input of the test oscilloscope. Use
a758-to-50 8 adapter on the input of the test oscilloscope if necessary .
5. Press the CONFIG button.
6. Touch the Video Inputs/Outputs soft key, then Next Menu.
7. Touch the Output Active for HD soft key.
8. Touch the RGB soft key.
9. Press the CONFIG button twice to exit the menu.
10. Press the INPUT button and select Input A.
11. Set the test oscilloscope to view the signal packets. The following oscillo-
scope settings normally provide a usable display.
Vertical Scale 100 mV
Horizontal Scale 5 us/div
Horizontal Trigger Position 10%
Trigger Level 100 mV
NOTE. When making the following measurements, disregard the spiking on the
packet waveforms.
12. Measure the signal amplitude of the reference level before the first packet.
Note the Reference measurement. See Figure 2--8.
13. Measure the amplitude of the smallest packet. Note the Smallest Packet
measurement. See Figure 2--8.
WFM700 Series Waveform Monitors S ervice Manual
2- 25
Page 58

Performance Verification
Reference level
Packets
Figure 2- 8: HD GBR frequency response performance screen
14. Calculate the percent amplitude variation using the formula:
Amplitude Variation 100
Æ
Smallest Packet Reference
Reference
É
15. CHECK that the calculated measurement is between 10% (typical).
16. Measure the amplitude of the largest packet. Note the Largest Packet
measurement. See Figure 2--8.
17. Calculate the percent amplitude variation using the formula:
Amplitude Variation 100
Æ
Largest Packet Reference
Reference
É
18. CHECK that the calculated measurement is between 10% (typical).
19. Move the cable from the PIX G/Y to the PIX B/Pb connector.
20. Repeat steps 12 through 18.
2- 26
21. Move the cable from the PIX B/Pb to the PIX R/Pr connector.
22. Repeat steps 12 through 18.
WFM700 Series Waveform Monitors S ervice Manual
Page 59

Performance Verification
Stop here for WFM7HD. The GBR Frequency Response procedure is now finished
for the WFM7HD Input Module. Continue with this check if testing a WFM7A
or WFM7M Input Module.
23. Connect the SD video generator to INPUT B using a 75 8 cable.
24. Set the SD video generator for a 525 line 60% Multiburst signal.
25. Set the SD video generator Pb and Pr amplitudes to 0 (off).
26. Connect the PIX G/Y output to the 75 8 input of the test oscilloscope using
a758 cable. Use a 75 8-to-50 8 adapter on the input of the test oscillo-
scope if necessary.
27. Press the CONFIG button.
28. Touch the Video Inputs/Outputs soft key, then Next Menu.
29. Touch the Output Active for SD soft key.
30. Touch the RGB soft key.
31. Press the CONFIG button twice to exit the menu.
32. Press the INPUT button and select Input B.
33. Set the test oscilloscope to view the signal packets. The following oscillo-
scope settings normally provide a usable display.
Vertical Scale 100 mV
Horizontal Scale 5 us/div
Horizontal Trigger Position 0%
Trigger Level 100 mV
NOTE. When making the following measurements, disregard the spiking on the
packet waveforms.
34. Measure the signal amplitude of the reference levels before the first packet.
Note the Reference measurement. See Figure 2--9.
35. Measure the amplitude of the smallest packet. Note the Smallest Packet
measurement. See Figure 2--9.
WFM700 Series Waveform Monitors S ervice Manual
2- 27
Page 60

Performance Verification
Reference level
Packets
Figure 2- 9: SD GBR frequency response performance screen
36. Calculate the percent amplitude variation using the formula:
Amplitude Variation 100
Æ
Smallest Packet Reference
Reference
É
37. CHECK that the calculated measurement is between 10% (typical)
38. Measure the amplitude of the largest packet. Note the Largest Packet
measurement. See Figure 2--9.
39. Calculate the percent amplitude variation using the formula:
Amplitude Variation 100
Æ
Largest Packet Reference
Reference
É
40. CHECK that the calculated measurement is between 10% (typical)
41. Move the cable from the PIX G/Y to the PIX B/Pb connector.
42. Repeat steps 34 through 40.
2- 28
43. Move the cable from the PIX B/Pb to the PIX R/Pr connector.
44. Repeat steps 34 through 40.
45. Disconnect the test setup.
WFM700 Series Waveform Monitors S ervice Manual
Page 61

Performance Verification
Cable Loss
Accommodation
This test checks for error-free operation with 0 to 30 dB signal loss.
Performance Requirement. This test verifies performance characteristics and is
listed in the test record.
1. Set the HD video generator for a 1080i 59.94 100% color bars signal.
2. Connect 90 meters of 75 8 cable from the HD video generator to INPUT A.
NOTE. You can substitute the 90 meters of cable with an HD cable simulator set
for 90 meters.
3. Press the INPUT button and select Input A.
4. Press the STATUS button.
5. Touch the Display soft key.
6. Touch the Session soft key and then touch the Done soft key.
7. Touch the Video Session soft key.
8. CHECK that no Embedded CRC Y or C errors messages occur in an interval
of 10 seconds.
9. Disconnect the test setup.
Stop here for WFM7HD. The Cable Loss procedure is now finished for the
WFM7HD Input Module. Continue with this check if testing a WFM7A or
WFM7M Input Module.
10. Set the SD video generator for a 525-format 75% color bars signal.
11. Connect 325 meters of 75 8 cable from the SD video generator to
INPUT B.
NOTE. You can substitute the 325 meters of cable with an SD cable simulator set
for 325 meters.
12. Press the INPUT button and select Input B.
13. Press the STATUS button.
14. Touch the Video Session soft key.
15. CHECK that no Embedded CRC Y or C errors messages occur in an interval
of 10 seconds.
16. Disconnect the test setup.
WFM700 Series Waveform Monitors S ervice Manual
2- 29
Page 62

Performance Verification
Eye Vertical Scale
(WFM7M only)
This test checks the Eye vertical deflection factor. This procedure is only
applicable for a WFM7M Input Module.
Performance Requirement. This test verifies performance characteristics and is
listed in the test record.
1. Connect the SD video generator to the 75 8 input of the test oscilloscope
using a 75 8 cable. Use a 75 8-to-50 8 adapter on t he input of the test
oscilloscope if necessary .
2. Set the SD video generator for a 525-format 100% color bars signal.
3. Set the test oscilloscope to view the signal. The following oscilloscope
settings normally provide a usable display.
Vertical Scale 200 mV
Horizontal Scale 2 ns/div
Horizontal Trigger Position 10%
Trigger Level 100 mV
4. Measure the amplitude of the signal on the test oscilloscope. Note this
measurement as the Reference Amplitude. See Figure 2--10 for measurement
points.
2- 30
Measure signal,
disregard peaks and dips
Figure 2- 10: Eye vertical scale reference level screen
WFM700 Series Waveform Monitors S ervice Manual
Page 63

Performance Verification
5. Move the signal from the test oscilloscope to INPUT B.
6. Press the INPUT button and select Input B.
7. Press the EYE button and touch the 3Eyesoft key (3Eyeselected).
8. Press the CURSOR button and touch the Voltage soft key (Voltage
selected).
9. Measure the signal amplitude displayed on the WFM700 using the voltage
cursors. Position the cursors where the waveform is unaffected by overshoot
or ringing. See Figure 2--11.
10. Calculate scale error using the formula:
Displayed Amplitude --- Reference Amplitude
Scale Error 100
11. CHECK that the calculated scale error is between 5%.
Æ
Reference Amplitude
É
Measure signal,
disregard peaks and dips
12. Disconnect the test setup.
Figure 2- 11: Eye vertical scale performance screen
WFM700 Series Waveform Monitors S ervice Manual
2- 31
Page 64

Performance Verification
Input Return Loss
This test checks the signal return loss. Performance is checked indirectly.
Performance Requirement. This test verifies performance characteristics and is
listed in the test record.
1. Install the 50 8 N-to-BNC adapter on the RF generator output.
2. Connect the RF generator output to the input port of the Return Loss Bridge
using a 50 8 cable.
3. Connect the output of the Return Loss Bridge to the 50 8 input of the test
oscilloscope using a 50 8 cable. Do not connect the test port of the Bridge at
this time.
4. Set the RF generator as follows:
Frequency 900 MHz
Phase Modulation OFF
Frequency Modulation OFF
Output Power +7.0 dBm
RF Output ON
5. Adjust the test oscilloscope to obtain a stable display of the 900 MHz sine
wave from the RF generator.
6. Measure the amplitude of the signal on the test oscilloscope. Note this
measurement as the reference level.
7. Connect the test port of the Return Loss Bridge directly to INPUT A. Do not
use any cables or adapters.
8. Press the INPUT button and select Input A.
9. Measure the amplitude of the signal on the test oscilloscope. Note this as the
A Reflection level.
10. Calculate the return loss with the formula below using the measured values
from steps 6 and 9.
Reference
Input A Return Loss 20 log10
11. CHECK that the calculated return loss is >25 dB for Input A.
Æ
A Reflection
É
2- 32
WFM700 Series Waveform Monitors S ervice Manual
Page 65

Performance Verification
12. Move the Return Loss Bridge test port from Input A to Input B.
13. Select Input B.
14. Measure the amplitude of the signal on the test oscilloscope. Note this as the
B Reflection level.
15. Calculate the return loss with the formula below using the measured values
from steps 6 and 14.
Reference
Input B Return Loss 20 log10
16. CHECK that the calculated return loss is >25 dB for Input B .
17. Disconnect the test setup.
Æ
B Reflection
É
Jitter Noise Floor (WFM7M
only)
This test checks the Jitter Noise Floor.
Typical Operation Check. This test checks for typical operation. Typical values are
not guaranteed characteristics and are not listed in the test record.
NOTE. If this test is performed out of sequence or the sequence of tests has been
interrupted (such as power off or input from another module was selected),
perform the steps in this note to prepare the instrument to continue testing.
a. Connect the SD video generator to INPUT B usinga758 cable.
b. Set the SD video generator for a 525-format 100% color bar signal.
c. Press the INPUT button and select Input B.
d. Press the EYE button.
1. Install the 50 8 N-to-BNC adapter on the RF generator output.
2. Connect the RF generator output to INPUT A using a 75 8 cable. Imped-
ance matching is not important for this test.
3. Set the RF generator as follows:
Frequency 741.7582 MHz
Output Level 0 dB
Frequency Modulation OFF
Phase Modulation OFF
RF Output ON
WFM700 Series Waveform Monitors S ervice Manual
2- 33
Page 66

Performance Verification
4. Press the INPUT button and select Input A.
5. Press the EYE button and then touch the Display soft key.
6. Touch the Jitter soft key and then touch the Done soft key.
7. Touch the Hi Pass Filter: soft key and set to 100 kHz.
8. CHECK that the Measured Jitter is approximately 30 ps (typical).
9. Touch the Hi Pass Filter: soft key and set to 10 kHz.
10. CHECK that the Measured Jitter is approximately 60 ps (typical).
11. Change the RF generator settings as follows:
Frequency 135.0 MHz
12. Touch the Hi Pass Filter: soft key and set to 10 Hz.
13. CHECK that the Measured Jitter is approximately 200 ps (typical).
Eye Time Base Jitter
(WFM7M only)
This test checks the Eye Time Base Jitter.
Typical Operation Check. This test checks for typical operation. Typical values are
not guaranteed characteristics and are not listed in the test record.
NOTE. If this test is performed out of sequence or the sequence of tests has been
interrupted (such as power off or input from another module was selected),
perform the steps in this note to prepare the instrument to continue testing.
a. Connect the SD video generator to INPUT B usinga758 cable.
b. Set the SD video generator for a 525-format 100% color bar signal.
c. Press the INPUT button and select Input B.
d. Press the EYE button.
1. Install the 50 8 N-to-BNC adapter on the RF generator output.
2. Connect the RF generator output to INPUT A using a 75 8 cable. Imped-
ance matching is not important for this test.
3. Set the RF generator as follows:
Frequency 741.7582 MHz
Output Level 0 dB
Frequency Modulation OFF
Phase Modulation OFF
RF Output ON
2- 34
WFM700 Series Waveform Monitors S ervice Manual
Page 67

Performance Verification
4. Press the INPUT button and select Input A.
5. Press the EYE button, touch the Eye soft key and select 3Eye.
6. Touch the Clock BW: soft key and set to 1kHz.
7. Press the DISPLAY button.
8. Touch the Trace Settings soft key, then select Waveform and adjust the
waveform value to +20 using the General Purpose Knob.
9. Use the Time cursors to measure the width of the point where a rising edge
crosses a falling edge. S ee Figure 2--12.
10. CHECK that the measured value is approximately 0.07 ns (typical).
11. Change the RF generator settings as follows:
Frequency 135.0 MHz
12. Use the Time cursors to measure the width of the point where a rising edge
crosses a falling edge. S ee Figure 2--12.
13. CHECK that the measured value is approximately 0.15 ns (typical).
Measure width
of crossing
Figure 2- 12: Eye time base jitter performance screen
WFM700 Series Waveform Monitors S ervice Manual
2- 35
Page 68

Performance Verification
Eye Pattern Display Jitter
Attenuation Error (WFM7M
only)
This test checks the jitter error (for frequencies greater than 2 times the Clock
BW setting). This procedure is only applicable for a WFM7M Input Module.
Performance Requirement. This test verifies performance characteristics and is
listed in the test record.
NOTE. If this test is performed out of sequence or the sequence of tests has been
interrupted (such as power off or input from another module was selected),
perform the steps in this note to prepare the instrument to continue testing.
a. Connect the SD video generator to INPUT B usinga758 cable.
b. Set the SD video generator for a 525-format 100% color bar signal.
c. Press the INPUT button and select Input B.
d. Press the EYE button.
e. Press the INPUT button and select Input A.
1. Install the 50 8 N-to-BNC adapter on the RF generator output.
2. Connect the RF generator output to INPUT A using a 75 8 cable. Imped-
ance matching is not important for this test.
3. Set the RF generator as follows:
Frequency 741.7582 MHz
Output Level 0 dB
Frequency Modulation OFF
LFGEN2 Frequency 40 Hz
LFGEN2 Waveshape SINE
Phase Modulation Source LF2
Phase Deviation 1.57 RADIANS
RF Output ON
Phase Modulation ON
4. Press the EYE button.
5. Touch the Clock BW: soft key. On the resulting screen, touch the 10 Hz soft
key and then the Done soft key.
6. Touch the 3Eyesoft key (3Eyeselected).
2- 36
WFM700 Series Waveform Monitors S ervice Manual
Page 69

Performance Verification
7. Adjust the RF generator phase deviation in 0.01 radian steps until the
displayed waveform shows exactly 1 UI phase modulation. Note the phase
deviation. See Figure 2--13.
NOTE. 1 UI phase modulation is achieved when the peak positive phase
modulation exactly overlaps the peak negative modulation. The result is that the
sine wave is brighter where the peak positive and negative phase modulations
overlap. Slowly adjust the RF generator phase deviation to become familiar w ith
the appearance of 1 UI phase modulation.
Under one UI phase
modulation achieved
One UI phase
modulation achieved
Over one UI phase
modulation achieved
Figure 2- 13: Eye clock recovery bandwidth performance screen
WFM700 Series Waveform Monitors S ervice Manual
2- 37
Page 70

Performance Verification
8. Calculate percent amplitude error using the formula:
1.57 --- Phase Deviation
Amplitude Error 100
9. CHECK that the calculated amplitude error is between –10% and +10%.
10. Set Clock BW to 100 Hz.
11. Adjust the RF generator settings as follows:
LFGEN2 Frequency 400 Hz
12. Adjust the RF generator phase deviation in 0.01 radian steps until the
displayed waveform shows exactly 1 UI phase modulation. Note the phase
deviation. See Figure 2--13.
13. Calculate percent amplitude error using the formula:
Amplitude Error 100
Æ
1.57 --- Phase Deviation
Æ
1.57
1.57
É
É
14. CHECK that the calculated amplitude error is between –10% and +10%.
15. Set the Clock BW to 1kHz.
16. Change the RF generator settings as follows:
LFGEN2 Frequency 4000 Hz
17. Adjust the RF generator phase deviation in 0.01 radian steps until the
displayed waveform shows exactly 1 UI phase modulation. Note the phase
deviation. See Figure 2--13.
18. Calculate percent amplitude error using the formula:
1.57 --- Phase Deviation
Amplitude Error 100
19. CHECK that the calculated amplitude error is between –10% and +20%.
20. Press the WFM button to exit eye clock BW mode.
Æ
1.57
É
2- 38
WFM700 Series Waveform Monitors S ervice Manual
Page 71

Performance Verification
Jitter Display High Pass
Filter (WFM7M only)
This test checks the jitter high pass filter attenuation at the selected frequency.
This procedure is only applicable for a WFM7M Input Module.
Performance Requirement. This test verifies performance characteristics and is
listed in the test record.
NOTE. If this test is performed out of sequence or the sequence of tests has been
interrupted (such as power off or input from another module was selected),
perform the steps in this note to prepare the instrument to continue testing.
a. Connect the SD video generator to INPUT B usinga758 cable.
b. Set the SD video generator for a 525-format 100% color bar signal.
c. Press the INPUT button and select Input B.
d. Press the EYE button.
e. Press the INPUT button and select Input A.
1. Install the 50 8 N-to-BNC adapter on the RF generator output.
2. Connect the RF generator output to INPUT A using a 75 8 cable. Imped-
ance matching is not important for this test.
3. Set the RF generator as follows:
Frequency 741.7582 MHz
Output Level 0 dB
Frequency Modulation OFF
LFGEN2 Frequency 10 Hz
LFGEN2 Waveshape SINE
Phase Modulation Source LF2
Phase Deviation 6.28 RADIANS
RF Output ON
Phase Modulation ON
4. Press the EYE button and then touch the Display soft key.
5. Touch the Jitter soft key and then touch the Done soft key.
6. Touch the Hi Pass Filter: soft key and set to 10 Hz.
7. Read the Measured Jitter amplitude (in UI) displayed on screen.
8. Calculate the jitter response in db using the formula:
Measured Jitter
Jitter Response 20 log10
9. CHECK that the calculated response is between –2 dB and –4 dB.
Æ
4UI
É
WFM700 Series Waveform Monitors S ervice Manual
2- 39
Page 72

Performance Verification
10. Set Hi Pass Filter to 1kHz.
11. Change RF generator settings as follows:
LFGEN2 Frequency 1 kHz
12. Repeat steps 7 through 9.
13. Set Hi Pass Filter to 10 kHz.
14. Change RF generator settings as follows:
LFGEN2 Frequency 10 kHz
15. Repeat steps 7 through 9.
16. Change RF generator settings as follows:
LFGEN2 Frequency 100 kHz
17. Set Hi Pass Filter to 1kHz.
18. Adjust the RF generator deviation for a Jitter reading of 4.0 UI.
19. Set Hi Pass Filter to 100 kHz.
20. Repeat steps 7 through 9.
2- 40
WFM700 Series Waveform Monitors S ervice Manual
Page 73

Performance Verification
Eye Clock Recovery
Bandwidth (WFM7M only)
This test checks the Eye Clock recovery Bandwidth. This procedure is only
applicable for a WFM7M Input Module.
Performance Requirement. This test verifies performance characteristics and is
listed in the test record.
NOTE. If this test is performed out of sequence or the sequence of tests has been
interrupted (such as power off or input from another module was selected),
perform the steps in this note to prepare the instrument to continue testing.
a. Connect the SD video generator to INPUT B usinga758 cable.
b. Set the SD video generator for a 525-format 100% color bar signal.
c. Press the INPUT button and select Input B.
d. Press the EYE button.
e. Press the INPUT button and select Input A.
1. Install the 50 8 N-to-BNC adapter on the RF generator output.
2. Connect the RF generator output to INPUT A using a 75 8 cable. Imped-
ance matching is not important for this test.
3. Press the EYE button and then touch the Display soft key.
4. Touch the Eye soft key and then touch the Done soft key.
NOTE. If an adapter is needed to obtain the correct cable connectors, they should
be installed at the generator, not on the WFM700.
5. Set the RF generator as follows:
Frequency 741.7582 MHz
Output Level 0 dBm
Phase Modulation OFF
Frequency Modulation OFF
RF Output ON
6. Touch the Clock BW: soft key. On the resulting screen, touch the 100 Hz
soft key and then the Done soft key.
7. Touch the 3Eyesoft key (3Eyeselected).
8. The displayed waveform should be two overlapping sine waves 180 degrees
out of phase. See Figure 2--14.
WFM700 Series Waveform Monitors S ervice Manual
2- 41
Page 74

Performance Verification
Figure 2- 14: Eye clock recovery bandwidth performance screen
9. Adjust the RF generator to add phase modulation to the signal as follows:
LFGEN2 Frequency 10 kHz
LFGEN2 Waveshape SINE
Phase Modulation Source LFGEN2
Phase Deviation 1.57 RADIANS
Phase Modulation ON
10. The displayed waveform should fill in with 1 unit interval (UI) of phase
modulation. See Figure 2--13.
NOTE. 1 UI phase modulation is achieved when the peak positive phase
modulation exactly overlaps the peak negative modulation. The result is that the
sine wave is brighter where the peak positive and negative phase modulations
overlaps. Slowly adjust the RF generator phase deviation to become familiar
with the appearance of 1 UI phase modulation.
11. Adjust the RF generator settings as follows:
LFGEN2 Frequency 100 Hz
Phase Deviation 2.22 RADIANS
12. Adjust the RF generator LF2 frequency in 1 Hz steps until the displayed
waveform shows exactly 1 UI phase modulation. Note the LF2 frequency
setting. See Figure 2--13 on page 2--37.
2- 42
WFM700 Series Waveform Monitors S ervice Manual
Page 75

Performance Verification
13. Calculate the percentage of frequency error using the formula:
Frequency Error LF2 frequency 100
14. CHECK that the calculated frequency error is between –10% and +10%.
15. Set the Clock BW to 10 Hz.
16. Adjust RF generator settings as follows:
LFGEN2 Frequency 10 Hz
17. Adjust the RF generator LF2 frequency in 0.1 Hz steps until the displayed
waveform shows exactly 1 UI phase modulation. See Figure 2--13 on
page 2--37. Note the LFGEN2 frequency setting.
18. Calculate the percentage of frequency error using the formula:
Frequency Error 10 ÆLF2 frequency 10
É
19. CHECK that the calculated frequency error is between –10% and +10%.
20. Set Clock BW to 1kHz.
21. Adjust the RF generator settings as follows:
LFGEN2 Frequency 1 kHz
22. Adjust the RF generator LF2 frequency in 10 Hz steps until the displayed
waveform shows exactly 1 UI phase modulation. See Figure 2--13 on
page 2--37. Note the LFGEN2 frequency setting.
23. Calculate percent frequency error using the formula:
Frequency Error 0.1 ÆLF2 frequency 1000
É
24. CHECK that the calculated frequency error is between –10% and +10%.
25. Press the WFM button to exit Eye mode.
WFM700 Series Waveform Monitors S ervice Manual
2- 43
Page 76

Performance Verification
Jitter Gain Check (WFM7M
only)
This test checks the jitter display and JITTER OUT scale factors.
Typical Operation Check. This test checks for typical operation. Typical values are
not guaranteed characteristics and are not listed in the test record.
NOTE. If this test is performed out of sequence or the sequence of tests has been
interrupted (such as power off or input from another module was selected),
perform the steps in this note to prepare the instrument to continue testing.
a. Connect the SD video generator to INPUT B usinga758 cable.
b. Set the SD video generator for a 525-format 100% color bar signal.
c. Press the INPUT button and select Input B.
d. Press the EYE button.
1. Install the 50 8 N-to-BNC adapter on the RF generator output.
2. Connect the RF generator output to INPUT A using a 75 8 cable. Imped-
ance matching is not important for this connection.
3. Set the RF generator as follows:
Frequency 741.7582 MHz
Output Level 0 dB
Frequency Modulation OFF
LFGEN2 Frequency 10 kHz
LFGEN2 Waveshape SQUARE
Phase Modulation Source LFGEN2
Phase Deviation 3.14 RADIANS
RF Output ON
Phase Modulation ON
2- 44
4. Connect the JITTER OUT to the 75 8 input of the test oscilloscope using a
75 8 cable. Use a 75 8-to-50 8 adapter on the input of the test oscilloscope
if necessary.
5. Press the INPUT button and select Input A.
6. Press the EYE button and then touch the Display soft key.
7. Touch the Jitter soft key and then touch the Done soft key.
8. Touch the Hi Pass Filter: soft key and set to 10 Hz.
9. Set the oscilloscope controls to produce a stable display. Limit the band-
width setting to reduce displayed noise for better results. See Figure 2--15.
WFM700 Series Waveform Monitors S ervice Manual
Page 77

Figure 2- 15: Jitter gain check performance screen
Performance Verification
10. Measure the amplitude of the 10 kHz square wave on the test oscilloscope.
Note the measurement.
11. Calculate the JITTER OUT scale factor error percentage using the formula:
Jitter Out Scale Factor Error
Æ
Measured Amplitude mV 200 mV
2
É
12. CHECK that the calculated error is 10% (typical).
13. Read the Measured Jitter amplitude in UI on the WFM700 display.
14. Calculate the HD jitter gain error in percentage using the formula:
HD Jitter Gain Error ÆMeasured Jitter UI 2UIÉ 50
15. CHECK that the calculated error is 10% (typical).
16. Change RF generator settings as follows:
Frequency 135.0 MHz
17. Allow the display to settle for several seconds.
18. Read the Measured Jitter amplitude in UI on the WFM700 display.
WFM700 Series Waveform Monitors S ervice Manual
2- 45
Page 78

Performance Verification
19. Calculate the SD jitter gain error percentage using the formula:
SD Jitter Gain Error ÆMeasured Jitter UI 2UIÉ 50
20. CHECK that the calculated error is 10% (typical).
21. Disconnect the test setup.
EyePatternDisplaySignal
Bandwidth (WFM7M only)
This test checks the eye pattern signal bandwidth. This procedure is only
applicable for a WFM7M Input Module.
Performance Requirement. This test verifies performance characteristics and is
listed in the test record.
1. Press the CONFIG button.
2. Touch the Calibration soft key and then Next Menu.
3. Touch the Eye Sig BW Test soft key and then the Start Eye Sig BW Test
soft key. This puts the WFM700 in Eye Bandwidth mode and starts the test.
4. Touch the Input# softkey, select Input A, then touch Done.
5. Install the wide band 50 8-to-75 8 matching pad and a 75 8 N-to-BNC
adapter on the RF generator output.
6. Connect the RF generator output to INPUT A using the 75 8 18 inch low
loss cable.
NOTE. The WFM700 inputs are terminated into 75 8. Impedance matching is
necessary for this test.
2- 46
CAUTION. Avoid excess str ess on the BNC connections. If adapters and/or
terminations are installed on the inputs of the WFM700, provide support to the
cable assembly.
WFM700 Series Waveform Monitors S ervice Manual
Page 79

Performance Verification
7. Set the RF generator as follows:
FREQUENCY 20 MHz
PHASE MODULA TION OFF
FREQUENCY MODULATION OFF
OUTPUT LEVEL 6 dBm
RF OUTPUT ON
8. Press the CURSOR button and touch Voltage cursors (Voltage selected).
9. Using the SELECT button and the General Purpose Knob, set cursor 1 to
--400 mV and cursor 2 to +400 mV.
10. Set the RF generator output level so that the displayed signal amplitude
matches the cursors. It may be necessary to adjust the vertical position. The
display is an unsynchronized waveform. See Figure 2--16.
NOTE. When setting and measuring unsynchronized signal amplitude, position
the cursors halfway from the dark background to the bright central area of the
waveform. It is important to position the cursor in the waveform noise consistently. Do not change display brightness or ambient lighting between measurements.
Measure pk-pk between
the bright central areas
11. Set the RF generator frequency to 2.5 GHz.
12. Measure the waveform amplitude using the cursors and note the delta
measurement.
Figure 2- 16: Eye pattern display signal bandwidth performance screen
WFM700 Series Waveform Monitors S ervice Manual
2- 47
Page 80

Performance Verification
13. While observing waveform amplitude, adjust the RF generator frequency
down to 500 MHz (in 10 MHz steps). If the waveform amplitude falls below
the cursors set in the previous step (step 12), re-adjust the cursors to the new
minimum level.
14. Calculate the high frequency response using the formula:
Measured Minimum
High Frequency Response 20 log10
15. CHECK that the calculated high frequency response is between 0 and –3 dB.
16. Set the RF generator frequency to 50 kHz.
17. Measure the waveform amplitude using the cursors and note the measure-
ment.
18. Calculate the low frequency response using the formula:
Low Frequency Response 20 log10
Æ
Æ
800 mV
Measured Minimum
800 mV
É
É
19. CHECK that the calculated low frequency response is between 0 and –3 dB.
20. Move the input cable assembly from Input A to Input B.
21. Press the CURSOR button to exit cursor mode.
22. Touch the Input# soft key, touch Input B, then touch Done.
23. Repeat steps 7 through 19 for Input B.
24. Press the CURSOR button to exit cursor mode.
25. Touch Exit to exit Eye Bandwidth mode.
NOTE. Most front panel buttons are disabled while in the Eye Sig BW Test mode.
You must use the Exit soft key to return instrument functions.
26. Disconnect the test setup.
2- 48
WFM700 Series Waveform Monitors S ervice Manual
Page 81

Performance Verification
Restore to Factory
Settings
Follow these steps to restore the WFM700 to the factory settings when finished
with the Performance Verification procedures.
1. Press the CONFIG button.
2. Touch the Audio Inputs/Outputs soft key and then Next Menu.
3. Touch the AES Connectors soft key, then Input.
4. Touch the Top Menu soft key.
5. Press the PRESET button.
6. Touch the -- m o r e -- soft key, then touch the Restore Factory soft key.
Restoring factory settings overrides the current instrument state.
WFM700 Series Waveform Monitors S ervice Manual
2- 49
Page 82

Performance Verification
WFM700 Audio (Option DG) Performance Verification Procedure
The following tests verify that the Audio module (Option DG) for the WFM700
waveform monitor (all models) meets the warranted characteristics listed in the
Specifications section of the WFM700 Series Technical Reference document.
Characteristics with typical specifications (not warranted) are also checked.
Return Loss
This test verifies that the return loss of the AES Inputs and Outputs.
Performance Requirement. This test verifies performance characteristics and is
listed in the test record.
1. Install the 50 8 N-to-BNC adapter on the sinewave generator output.
2. Connect the RF generator output to the input port of the Return Loss Bridge
using a 50 8 cable.
3. Connect the output of the Return Loss Bridge to the 50 8 input of the test
oscilloscope using a 50 8 cable. Do not connect the test port of the Bridge at
this time.
4. Set the sinewave generator as follows:
Frequency 6 MHz
Phase Modulation OFF
Frequency Modulation OFF
Output Power +2.0 dBm (0.8 V p-p)
RF Output ON
5. Adjust the test oscilloscope to obtain a stable display of the 6 MHz sine
wave from the RF generator. The following oscilloscope settings normally
provide a usable display.
2- 50
Vertical Scale 50 mV
Horizontal Scale 100 ns/div
Bandwidth Limit On
6. Measure the amplitude of the signal on the test oscilloscope. Note this
measurement as the reference level.
NOTE. The reference level should be between 150 mV and 200 mV. Adjust the
output level of the RF generator if necessary to obtain the correct output level.
WFM700 Series Waveform Monitors S ervice Manual
Page 83

Performance Verification
7. Press the CONFIG button.
8. Touch the Audio Inputs/Outputs soft key and then Next Menu.
9. Touch the AES Connectors soft key and then Input.
10. Press the AUDIO button.
11. Press the INPUT button, then touch Audio In: and select External AES.
12. Connect the test port of the Return Loss Bridge directly to the AES 1--2 I/O
connector. Do not use any cables or adapters.
13. Measure the amplitude of the signal on the test oscilloscope. Note this as the
Reflection level.
14. Calculate the return loss with the formula below using the measured values
from steps 6 and 13.
Reference
Input Return Loss 20 log10
Æ
Reflection
É
Input Amplitude and
Sample Rate Range
15. CHECK that the calculated return loss is >25 dB.
16. Move the return loss bridge to each of the remaining AES I/O connectors
and repeat steps 12 through 15.
17. Disconnect the test setup.
This test verifies that each AES input locks to an input signal.
Performance Requirement. This test verifies performance characteristics and is
listed in the test record.
1. Connect the digital audio generator unbalanced (UNBAL) output to
AES 1--2 I/O using a 75 8 cable.
2. Set the digital audio generator as follows:
Frequency 1 kHz
Output Level --20 dB FS Audio Tone
Sample Frequency 96 kHz
Unbalanced V
p-p
2.000 V (Carrier Level)
WFM700 Series Waveform Monitors S ervice Manual
2- 51
Page 84

Performance Verification
3. Press the CONFIG button.
4. Touch the Audio Inputs/Outputs soft key, then Next Menu.
5. Touch the Audio Program Type soft key, then Stereo Pairs.
6. Press the AUDIO button.
7. Touch the Meter Scaling: soft key and select Default.
8. CHECK for an indication of –20 dB FS and no error messages in the
corresponding bars.
9. Move the audio generator output to each of the remaining AES I/O
connectors and repeat step 8 for each connector.
10. Set the digital audio generator as follows:
Unbalanced V
p-p
0.2000 V (Carrier Level)
11. CHECK for an indication of –20 dB FS and no error messages in the
corresponding bars.
12. Move the audio generator output to each of the remaining AES I/O
connectors and repeat step 11 for each connector.
13. Set the digital audio generator as follows:
Sample Frequency 35 kHz
14. CHECK for an indication of –20 dB FS and no error messages in the
corresponding bars.
15. Move the audio generator output to each of the remaining AES I/O
connectors and repeat step 14 for each connector.
16. Set the digital audio generator as follows:
Unbalanced V
p-p
2.000 V (Carrier Level)
17. CHECK for an indication of –20 dB FS and no error messages in the
corresponding bars.
18. Move the audio generator output to each of the remaining AES I/O
connectors and repeat step 17 for each AES I/O connector.
2- 52
19. Disconnect the test setup.
WFM700 Series Waveform Monitors S ervice Manual
Page 85

Performance Verification
Output Amplitude, Rise
Time and Fall Time
This test verifies the amplitude and the rise and fall times of each AES output
Performance Requirement. This test verifies performance characteristics and is
listed in the test record.
1. Connect the HD video generator to INPUT A using a 75 8 cable.
2. Set the HD video generator for a 1080i 59.94 100% color bars signal.
3. Set the HD video generator for 2 groups of embedded audio, starting with
group 1.
4. Connect the AES 1--2 I/O output to the 75 8 input of the test oscilloscope
using a 75 8 cable. Use a 75 8-to-50 8 adapter on the input of the test
oscilloscope if necessary .
5. Press the CONFIG button.
6. Touch the Audio Inputs/Outputs soft key, then Next Menu.
7. Touch the AES Connectors soft key, then Output.
8. Select Input 1A. (Select Input 2A if checking a second Input Module in
slot 2.)
9. Set the test oscilloscope to view the signal. The following oscilloscope
settings normally provide a usable display.
Vertical Scale 200 mV/div
Horizontal Scale 100 ns/div
Horizontal Trigger Position 30%
Trigger Slope Rising edge
Trigger Level 0 mV
10. CHECK that the amplitude of the waveform displayed on the oscilloscope is
between 0.9 V and 1.1 V.
11. Change the oscilloscope horizontal scale to 20 ns/div.
12. CHECK that the rise time of the waveform displayed on the oscilloscope is
between 30 ns and 44 ns.
13. Change the oscilloscope to trigger on the falling edge.
14. CHECK that the fall time of the waveform displayed on the oscilloscope is
between 30 ns and 44 ns.
15. Move the cable to each of the remaining AES I/O connectors and repeat
steps 9 through 14 for each AES I/O connector.
16. Disconnect the test setup.
WFM700 Series Waveform Monitors S ervice Manual
2- 53
Page 86

Performance Verification
SD Output Jitter
(WFM7A, WFM7M only)
This test measures jitter at each AES output.
Typical Operation Check. This test checks for typical operation. Typical values are
not guaranteed characteristics and are not listed in the test record.
1. Connect the SD video generator to INPUT A using a 75 8 cable.
2. Set the SD video generator for a 525-format 100% color bars signal.
3. Set the SD video generator for 2 groups of embedded audio, starting with
group 1.
4. Connect AES 1--2 I/O to the digital audio analyzer unbalanced (UNBAL)
input using a 75 8 cable.
5. Set the audio analyzer for measurement of jitter per AES3--1992 (or 1997).
6. Allow the jitter reading to settle for a few second.
7. CHECK for a typical Jitter Peak abs reading of less than 3.5 ns over an
interval of at least 5 seconds.
8. Move the cable to each of the remaining AES I/O connectors and repeat
step 7 for each AES I/O connector.
HD Output Jitter
(WFM7HD only)
9. Disconnect the test setup.
This test measures jitter at each AES output.
Typical Operation Check. This test checks for typical operation. Typical values are
not guaranteed characteristics and are not listed in the test record.
1. Connect the HD video generator to INPUT A using a 75 8 cable.
2. Set the HD video generator for a 1080i 59.94 100% color bars signal.
3. Set the HD video generator for 2 groups of embedded audio, starting with
group 1.
4. Connect AES 1--2 I/O to the digital audio analyzer unbalanced (UNBAL)
input using a 75 8 cable.
5. Set the audio analyzer for measurement of jitter per AES3--1992 (or 1997).
6. Allow the jitter reading to settle for a few second.
7. CHECK for a typical Jitter Peak abs reading of less than 3.5 ns over an
interval of at least 5 seconds.
2- 54
WFM700 Series Waveform Monitors S ervice Manual
Page 87

Performance Verification
8. Move the cable to each of the remaining AES I/O connectors and repeat
step 7 for each AES I/O connector.
9. Disconnect the test setup.
Restore to Factory
Settings
Follow these steps to restore the WFM700 to the factory settings when finished
with the Performance Verification procedures.
1. Press the CONFIG button.
2. Touch the Audio Inputs/Outputs soft key and then Next Menu.
3. Touch the AES Connectors soft key, then Input.
4. Touch the Top Menu soft key.
5. Press the PRESET button.
6. Touch the -- m o r e -- soft key, then touch the Restore Factory soft key.
Restoring factory settings overrides the current instrument state.
WFM700 Series Waveform Monitors S ervice Manual
2- 55
Page 88

Performance Verification
2- 56
WFM700 Series Waveform Monitors S ervice Manual
Page 89

WFM700/WFM7M Input Module Test Record
Photocopy this form and use it to record the performance test results. If your
instrument also contains the optional Audio module (Option DG), photocopy
that test record to record the performance test results for the Audio module.
Test Record
Instrument Serial Number: Certificate Number:
Input Module Serial Number:
Temperature: Relative Humidity %:
Date of Calibration: Technician:
Performance Test Minimum Incoming Outgoing Maximum
Power Source Range
Stable display from 90 V to 264 V Pass N/A
Re-start at 90 V Pass N/A
Signal Data Paths
High Definition
Y component ramp is monotonic Pass N/A
Y component ramps step size 0.7 mV 0.9 mV
Pb component ramp is monotonic Pass N/A
Pb component ramps step size 0.7 mV 0.9 mV
Pr component ramp is monotonic Pass N/A
Pr component ramps step size 0.7 mV 0.9 mV
Standard Definition
Y component ramp is monotonic Pass N/A
Y component ramps step size 0.7 mV 0.9 mV
Pb component ramp is monotonic Pass N/A
Pb component ramps step size 0.7 mV 0.9 mV
Pr component ramp is monotonic Pass N/A
Pr component ramps step size 0.7 mV 0.9 mV
SD LCD Pixel Defects (WFM7A and WFM7M only)
Number of bad pixels N/A 6
WFM700 Series Waveform Monitors S ervice Manual
2- 57
Page 90

WFM700/WFM7M Input Module Test Record
Test Record (cont.)
Instrument Serial Number: Certificate Number:
Input Module Serial Number:
Temperature: Relative Humidity %:
Date of Calibration: Technician:
Performance Test MaximumOutgoingIncomingMinimum
Error Detection Data Paths
1080i 59.94 0% flat field
Embedded CRC status reads:
Embedded CRC: SMPTE 292 Y:OK C:OK
1080i 59.94 0% flat field
Gamut errors read as follows:
RGB Gamut Error X OK
Composite Gamut Error X OK
1080i 59.94 SMPTE color bars
Gamut errors read as follows:
RGB Gamut Error X Alarm
Composite Gamut Error X OK
1080i 59.94 100% color bars
Gamut errors read as follows:
RGB Gamut Error X OK
Composite Gamut Error X Alarm
Serial Video Output
Calculated error -- 5 % +5%
SD PIX MON Output Level
Calculated error -- 5 % +5%
Pass N/A
Pass N/A
Pass N/A
Pass N/A
2- 58
WFM700 Series Waveform Monitors S ervice Manual
Page 91

WFM700/WFM7M Input Module Test Record
Test Record (cont.)
Instrument Serial Number: Certificate Number:
Input Module Serial Number:
Temperature: Relative Humidity %:
Date of Calibration: Technician:
Performance Test MaximumOutgoingIncomingMinimum
PIX Video Output Level
High Definition
PIX G/Y calculated amplitude error -- 5 % +5%
PIX G/Y black level -- 2 5 m V +25 mV
PIX B/Pb calculated amplitude error -- 5 % +5%
PIX B/Pb black level -- 2 5 m V +25 mV
PIX R/Pr calculated amplitude error -- 5 % +5%
PIX R/Pr black level -- 2 5 m V +25 mV
Standard Definition
PIX G/Y calculated amplitude error -- 5 % +5%
PIX G/Y black level -- 2 5 m V +25 mV
PIX B/Pb calculated amplitude error -- 5 % +5%
PIX B/Pb black level -- 2 5 m V +25 mV
PIX R/Pr calculated amplitude error -- 5 % +5%
PIX R/Pr black level -- 2 5 m V +25 mV
External Reference
1080i 50 100% color bars
Display remains locked to the external reference Pass N/A
1080i 60 100% color bars
Display remains locked to the external reference Pass N/A
720p 59.94 100% color bars
Display remains locked to the external reference Pass N/A
Cable Loss Accommodation
HIgh Definition
No embedded CRC Y or C errors messages Pass N/A
Standard Definition
No embedded CRC Y or C errors messages Pass N/A
WFM700 Series Waveform Monitors S ervice Manual
2- 59
Page 92

WFM700/WFM7M Input Module Test Record
Test Record (cont.)
Instrument Serial Number: Certificate Number:
Input Module Serial Number:
Temperature: Relative Humidity %:
Date of Calibration: Technician:
Performance Test MaximumOutgoingIncomingMinimum
Eye Vertical Scale
Calculated scale error -- 5 % +5%
Input Return Loss
Input A
Calculated return loss >25 dB N/A
Input B
Calculated return loss >25 dB N/A
Eye Pattern Display Jitter Attenuation Error
Calculated amplitude error
10 Hz Clock BW --10% +10%
100 Hz Clock BW --10% +10%
1 kHz Clock BW --10% +20%
Jitter Display High Pass Filter
Calculated jitter response
Generator at 6.28 RADIANS Phase Deviation
10 Hz Hi Pass Filter –4 dB –2 dB
1 kHz Hi Pass Filter –4 dB –2 dB
100 kHz Hi Pass Filter –4 dB –2 dB
Generator set to produce 4 UI jitter with Hi Pass Filter at
1kHz
100 kHz Hi Pass Filter –4 dB –2 dB
Eye Clock Recovery Bandwidth
Calculated frequency error
Clock BW at 100 Hz –10% +10%
Clock BW at 10 Hz –10% +10%
Clock BW at 1 kHz –10% +10%
2- 60
WFM700 Series Waveform Monitors S ervice Manual
Page 93

WFM700/WFM7M Input Module Test Record
Test Record (cont.)
Instrument Serial Number: Certificate Number:
Input Module Serial Number:
Temperature: Relative Humidity %:
Date of Calibration: Technician:
Performance Test MaximumOutgoingIncomingMinimum
Eye Pattern Display Signal Bandwidth
Calculated frequency response
Input A
2.5 GHz to 500 MHz -- 3 d B 0dB
50 kHz -- 3 d B 0dB
Input B
2.5 GHz to 500 MHz -- 3 d B 0dB
50 kHz -- 3 d B 0dB
WFM700 Series Waveform Monitors S ervice Manual
2- 61
Page 94

WFM700/WFM7M Input Module Test Record
2- 62
WFM700 Series Waveform Monitors S ervice Manual
Page 95

WFM700/WFM7A Input Module Test Record
Photocopy this form and use it to record the performance test results. If your
instrument also contains the optional Audio module (Option DG), photocopy
that test record to record the performance test results for the Audio module.
Test Record
Instrument Serial Number: Certificate Number:
Input Module Serial Number:
Temperature: Relative Humidity %:
Date of Calibration: Technician:
Performance Test Minimum Incoming Outgoing Maximum
Power Source Range
Stable display from 90 V to 264 V Pass N/A
Re-start at 90 V Pass N/A
Signal Data Paths
High Definition
Y component ramp is monotonic Pass N/A
Y component ramps step size 0.7 mV 0.9 mV
Pb component ramp is monotonic Pass N/A
Pb component ramps step size 0.7 mV 0.9 mV
Pr component ramp is monotonic Pass N/A
Pr component ramps step size 0.7 mV 0.9 mV
Standard Definition
Y component ramp is monotonic Pass N/A
Y component ramps step size 0.7 mV 0.9 mV
Pb component ramp is monotonic Pass N/A
Pb component ramps step size 0.7 mV 0.9 mV
Pr component ramp is monotonic Pass N/A
Pr component ramps step size 0.7 mV 0.9 mV
SD LCD Pixel Defects
Number of bad pixels N/A 6
WFM700 Series Waveform Monitors S ervice Manual
2- 63
Page 96

WFM700/WFM7A Input Module Test Record
Test Record (cont.)
Instrument Serial Number: Certificate Number:
Input Module Serial Number:
Temperature: Relative Humidity %:
Date of Calibration: Technician:
Performance Test MaximumOutgoingIncomingMinimum
Error Detection Data Paths
1080i 59.94 0% flat field
Embedded CRC status reads:
Embedded CRC: SMPTE 292 Y:OK C:OK
1080i 59.94 0% flat field
Gamut errors read as follows:
RGB Gamut Error X OK
Composite Gamut Error X OK
1080i 59.94 SMPTE color bars
Gamut errors read as follows:
RGB Gamut Error X Alarm
Composite Gamut Error X OK
1080i 59.94 100% color bars
Gamut errors read as follows:
RGB Gamut Error X OK
Composite Gamut Error X Alarm
Serial Video Output
Calculated error -- 5 % +5%
SD PIX MON Output Level
Calculated error -- 5 % +5%
Pass N/A
Pass N/A
Pass N/A
Pass N/A
2- 64
WFM700 Series Waveform Monitors S ervice Manual
Page 97

WFM700/WFM7A Input Module Test Record
Test Record (cont.)
Instrument Serial Number: Certificate Number:
Input Module Serial Number:
Temperature: Relative Humidity %:
Date of Calibration: Technician:
Performance Test MaximumOutgoingIncomingMinimum
PIX Video Output Level
High Definition
PIX G/Y calculated amplitude error -- 5 % +5%
PIX G/Y black level -- 2 5 m V +25 mV
PIX B/Pb calculated amplitude error -- 5 % +5%
PIX B/Pb black level -- 2 5 m V +25 mV
PIX R/Pr calculated amplitude error -- 5 % +5%
PIX R/Pr black level -- 2 5 m V +25 mV
Standard Definition
PIX G/Y calculated amplitude error -- 5 % +5%
PIX G/Y black level -- 2 5 m V +25 mV
PIX B/Pb calculated amplitude error -- 5 % +5%
PIX B/Pb black level -- 2 5 m V +25 mV
PIX R/Pr calculated amplitude error -- 5 % +5%
PIX R/Pr black level -- 2 5 m V +25 mV
External Reference
1080i 50 100% color bars
Display remains locked to the external reference Pass N/A
1080i 60 100% color bars
Display remains locked to the external reference Pass N/A
720p 59.94 100% color bars
Display remains locked to the external reference Pass N/A
Cable Loss Accommodation
HIgh Definition
No embedded CRC Y or C errors messages Pass N/A
Standard Definition
No embedded CRC Y or C errors messages Pass N/A
WFM700 Series Waveform Monitors S ervice Manual
2- 65
Page 98

WFM700/WFM7A Input Module Test Record
Test Record (cont.)
Instrument Serial Number: Certificate Number:
Input Module Serial Number:
Temperature: Relative Humidity %:
Date of Calibration: Technician:
Performance Test MaximumOutgoingIncomingMinimum
Input Return Loss
Input A
Calculated return loss >25 dB N/A
Input B
Calculated return loss >25 dB N/A
2- 66
WFM700 Series Waveform Monitors S ervice Manual
Page 99

WFM700/WFM7HD Input Module Test Record
Photocopy this form and use it to record the performance test results. If your
instrument also contains the optional Audio module (Option DG), photocopy
that test record to record the performance test results for the Audio module.
Test Record
Instrument Serial Number: Certificate Number:
Input Module Serial Number:
Temperature: Relative Humidity %:
Date of Calibration: Technician:
Performance Test Minimum Incoming Outgoing Maximum
Power Source Range
Stable display from 90 V to 264 V Pass N/A
Re-start at 90 V Pass N/A
Signal Data Paths
High Definition
Y component ramp is monotonic Pass N/A
Y component ramps step size 0.7 mV 0.9 mV
Pb component ramp is monotonic Pass N/A
Pb component ramps step size 0.7 mV 0.9 mV
Pr component ramp is monotonic Pass N/A
Pr component ramps step size 0.7 mV 0.9 mV
HD LCD Pixel Defects
Number of bad pixels N/A 6
WFM700 Series Waveform Monitors S ervice Manual
2- 67
Page 100

WFM700/WFM7HD Input Module Test Record
Test Record (cont.)
Instrument Serial Number: Certificate Number:
Input Module Serial Number:
Temperature: Relative Humidity %:
Date of Calibration: Technician:
Performance Test MaximumOutgoingIncomingMinimum
Error Detection Data Paths
1080i 59.94 0% flat field
Embedded CRC status reads:
Embedded CRC: SMPTE 292 Y:OK C:OK
1080i 59.94 0% flat field
Gamut errors read as follows:
RGB Gamut Error X OK
Composite Gamut Error X OK
1080i 59.94 SMPTE color bars
Gamut errors read as follows:
RGB Gamut Error X Alarm
Composite Gamut Error X OK
1080i 59.94 100% color bars
Gamut errors read as follows:
RGB Gamut Error X OK
Composite Gamut Error X Alarm
Serial Video Output
Calculated error -- 5 % +5%
SD PIX MON Output Level
Calculated error -- 5 % +5%
Pass N/A
Pass N/A
Pass N/A
Pass N/A
PIX Video Output Level
High Definition
PIX G/Y calculated amplitude error -- 5 % +5%
PIX G/Y black level -- 2 5 m V +25 mV
PIX B/Pb calculated amplitude error -- 5 % +5%
PIX B/Pb black level -- 2 5 m V +25 mV
PIX R/Pr calculated amplitude error -- 5 % +5%
PIX R/Pr black level -- 2 5 m V +25 mV
2- 68
WFM700 Series Waveform Monitors S ervice Manual
 Loading...