

Page 1

User Manual
WFM 601A, WFM 601E & WFM 601M
Serial Digital Component Waveform Monitors
071-0103-01
This document supports firmware version 1.00
and above.
Page 2

Copyright T ektronix, Inc. All rights reserved.
T ektronix products are covered by U.S. and foreign patents, issued and pending. Information in this publication supercedes
that in all previously published material. Specifications and price change privileges reserved.
Printed in the U.S.A.
T ektronix, Inc., P.O. Box 1000, Wilsonville, OR 97070–1000
TEKTRONIX and TEK are registered trademarks of T ektronix, Inc.
Page 3

WARRANTY
T ektronix warrants that the products that it manufactures and sells will be free from defects in materials and workmanship for
a period of three (3) years from the date of shipment. If a product proves defective during this warranty period, T ektronix, at
its option, either will repair the defective product without charge for parts and labor, or will provide a replacement in
exchange for the defective product.
In order to obtain service under this warranty, Customer must notify Tektronix of the defect before the expiration of the
warranty period and make suitable arrangements for the performance of service. Customer shall be responsible for packaging
and shipping the defective product to the service center designated by T ektronix, with shipping charges prepaid. Tektronix
shall pay for the return of the product to Customer if the shipment is to a location within the country in which the T ektronix
service center is located. Customer shall be responsible for paying all shipping charges, duties, taxes, and any other charges
for products returned to any other locations.
This warranty shall not apply to any defect, failure or damage caused by improper use or improper or inadequate maintenance
and care. T ektronix shall not be obligated to furnish service under this warranty a) to repair damage resulting from attempts
by personnel other than T ektronix representatives to install, repair or service the product; b) to repair damage resulting from
improper use or connection to incompatible equipment; c) to repair any damage or malfunction caused by the use of
non-T ektronix supplies; or d) to service a product that has been modified or integrated with other products when the effect of
such modification or integration increases the time or difficulty of servicing the product.
THIS WARRANTY IS GIVEN BY TEKTRONIX IN LIEU OF ANY OTHER WARRANTIES, EXPRESS OR
IMPLIED. TEKTRONIX AND ITS VENDORS DISCLAIM ANY IMPLIED WARRANTIES OF
MERCHANTABILITY OR FITNESS FOR A P ARTICULAR PURPOSE. TEKTRONIX’ RESPONSIBILITY T O
REP AIR OR REPLACE DEFECTIVE PRODUCTS IS THE SOLE AND EXCLUSIVE REMEDY PROVIDED TO
THE CUSTOMER FOR BREACH OF THIS WARRANTY. TEKTRONIX AND ITS VENDORS WILL NOT BE
LIABLE FOR ANY INDIRECT , SPECIAL, INCIDENTAL, OR CONSEQUENTIAL DAMAGES IRRESPECTIVE
OF WHETHER TEKTRONIX OR THE VENDOR HAS ADVANCE NOTICE OF THE POSSIBILITY OF SUCH
DAMAGES.
Page 4

Service Assurance
If you have not already purchased Service Assurance for this product, you may do so at any time during the product’s
warranty period. Service Assurance provides Repair Protection and Calibration Services to meet your needs.
Repair Protection extends priority repair services beyond the product’s warranty period; you may purchase up to three years
of Repair Protection.
Calibration Services provide annual calibration of your product, standards compliance and required audit documentation,
recall assurance, and reminder notification of scheduled calibration. Coverage begins upon registration; you may purchase up
to five years of Calibration Services.
Service Assurance Advantages
Priced well below the cost of a single repair or calibration
A void delays for service by eliminating the need for separate purchase authorizations from your company
Eliminates unexpected service expenses
For Information and Ordering
For more information or to order Service Assurance, contact your T ektronix representative and provide the information
below . Service Assurance may not be available in locations outside the United States of America.
Name VISA or Master Card number and expiration
Company date or purchase order number
Address Repair Protection (1,2, or 3 years)
City , State, Postal code Calibration Services (1,2,3,4, or 5 years)
Country Instrument model and serial number
Phone Instrument purchase date
Page 5

Table of Contents
Getting Started
Operating Basics
General Safety Summary ix. . . . . . . . . . . . . . . . . . . . . . . . . . . . . . . . . . . .
Preface xi. . . . . . . . . . . . . . . . . . . . . . . . . . . . . . . . . . . . . . . . . . . . . . . . . . .
Getting Started 1–1. . . . . . . . . . . . . . . . . . . . . . . . . . . . . . . . . . . . . . . . . . . .
Product Description 1–1. . . . . . . . . . . . . . . . . . . . . . . . . . . . . . . . . . . . . . . . . . . . . . .
Accessories 1–2. . . . . . . . . . . . . . . . . . . . . . . . . . . . . . . . . . . . . . . . . . . . . . . . . . . . . .
Installation 1–5. . . . . . . . . . . . . . . . . . . . . . . . . . . . . . . . . . . . . . . . . . . . . . . .
Included Accessories 1–5. . . . . . . . . . . . . . . . . . . . . . . . . . . . . . . . . . . . . . . . . . . . . .
Hardware Installation 1–5. . . . . . . . . . . . . . . . . . . . . . . . . . . . . . . . . . . . . . . . . . . . . .
Connecting Power 1–11. . . . . . . . . . . . . . . . . . . . . . . . . . . . . . . . . . . . . . . . . . . . . . . .
Installing the Waveform Monitor in a Serial Video System 1–12. . . . . . . . . . . . . . . .
Functional Check 1–15. . . . . . . . . . . . . . . . . . . . . . . . . . . . . . . . . . . . . . . . . . .
Required Equipment 1–15. . . . . . . . . . . . . . . . . . . . . . . . . . . . . . . . . . . . . . . . . . . . . . .
Initial Equipment Connections 1–16. . . . . . . . . . . . . . . . . . . . . . . . . . . . . . . . . . . . . . .
Functional Check Procedure 1–17. . . . . . . . . . . . . . . . . . . . . . . . . . . . . . . . . . . . . . . .
Functional Overview 2–1. . . . . . . . . . . . . . . . . . . . . . . . . . . . . . . . . . . . . . . .
Front Panel Overview 2–1. . . . . . . . . . . . . . . . . . . . . . . . . . . . . . . . . . . . . . . . . . . . .
Using the Menus 2–5. . . . . . . . . . . . . . . . . . . . . . . . . . . . . . . . . . . . . . . . . . . . . . . . .
Rear Panel Connectors 2–6. . . . . . . . . . . . . . . . . . . . . . . . . . . . . . . . . . . . . . . . . . . . .
Reference
Reference 3–1. . . . . . . . . . . . . . . . . . . . . . . . . . . . . . . . . . . . . . . . . . . . . . . . .
Audio Display (WFM 601A Only) 3–1. . . . . . . . . . . . . . . . . . . . . . . . . . . . . . . . . . .
Bowtie Display 3–5. . . . . . . . . . . . . . . . . . . . . . . . . . . . . . . . . . . . . . . . . . . . . . . . . . .
Calibration 3–7. . . . . . . . . . . . . . . . . . . . . . . . . . . . . . . . . . . . . . . . . . . . . . . . . . . . . .
Configure Menus 3–8. . . . . . . . . . . . . . . . . . . . . . . . . . . . . . . . . . . . . . . . . . . . . . . . .
CR T Settings 3–12. . . . . . . . . . . . . . . . . . . . . . . . . . . . . . . . . . . . . . . . . . . . . . . . . . . .
Cursors 3–13. . . . . . . . . . . . . . . . . . . . . . . . . . . . . . . . . . . . . . . . . . . . . . . . . . . . . . . . .
Digital List (WFM 601M Only) 3–14. . . . . . . . . . . . . . . . . . . . . . . . . . . . . . . . . . . . . .
Digital Waveform (WFM 601M Only) 3–16. . . . . . . . . . . . . . . . . . . . . . . . . . . . . . . .
Eye Display (WFM 601E and WFM 601M Only) 3–19. . . . . . . . . . . . . . . . . . . . . . . .
Filter Menu 3–27. . . . . . . . . . . . . . . . . . . . . . . . . . . . . . . . . . . . . . . . . . . . . . . . . . . . . .
Gain Menu 3–28. . . . . . . . . . . . . . . . . . . . . . . . . . . . . . . . . . . . . . . . . . . . . . . . . . . . . .
Gamut Displays 3–29. . . . . . . . . . . . . . . . . . . . . . . . . . . . . . . . . . . . . . . . . . . . . . . . . .
Graticule Measurements 3–34. . . . . . . . . . . . . . . . . . . . . . . . . . . . . . . . . . . . . . . . . . . .
Jitter Measurement Display (WFM 601M Only) 3–37. . . . . . . . . . . . . . . . . . . . . . . . .
Line Select 3–39. . . . . . . . . . . . . . . . . . . . . . . . . . . . . . . . . . . . . . . . . . . . . . . . . . . . . .
Multiple Display 3–41. . . . . . . . . . . . . . . . . . . . . . . . . . . . . . . . . . . . . . . . . . . . . . . . . .
Parade Display 3–41. . . . . . . . . . . . . . . . . . . . . . . . . . . . . . . . . . . . . . . . . . . . . . . . . . .
Picture Display 3–42. . . . . . . . . . . . . . . . . . . . . . . . . . . . . . . . . . . . . . . . . . . . . . . . . . .
Presets 3–43. . . . . . . . . . . . . . . . . . . . . . . . . . . . . . . . . . . . . . . . . . . . . . . . . . . . . . . . .
Ref Mode 3–44. . . . . . . . . . . . . . . . . . . . . . . . . . . . . . . . . . . . . . . . . . . . . . . . . . . . . . .
WFM 601A, WFM 601E & WFM 601M User Manual
i
Page 6

Table of Contents
Appendices
Serial Status 3–44. . . . . . . . . . . . . . . . . . . . . . . . . . . . . . . . . . . . . . . . . . . . . . . . . . . . .
Sweep 3–52. . . . . . . . . . . . . . . . . . . . . . . . . . . . . . . . . . . . . . . . . . . . . . . . . . . . . . . . . .
Vector Display Modes 3–53. . . . . . . . . . . . . . . . . . . . . . . . . . . . . . . . . . . . . . . . . . . . .
Video In 3–58. . . . . . . . . . . . . . . . . . . . . . . . . . . . . . . . . . . . . . . . . . . . . . . . . . . . . . . .
Waveform Display 3–58. . . . . . . . . . . . . . . . . . . . . . . . . . . . . . . . . . . . . . . . . . . . . . . .
Appendix A: Specifications A–1. . . . . . . . . . . . . . . . . . . . . . . . . . . . . . . . . . .
Appendix B: Remote Operation B–1. . . . . . . . . . . . . . . . . . . . . . . . . . . . . . .
RS–232 Connector B–1. . . . . . . . . . . . . . . . . . . . . . . . . . . . . . . . . . . . . . . . . . . . . . . .
Remote Connector B–1. . . . . . . . . . . . . . . . . . . . . . . . . . . . . . . . . . . . . . . . . . . . . . . .
Appendix C: Remote Command Set C–1. . . . . . . . . . . . . . . . . . . . . . . . . . .
Cable Measurement Commands C–3. . . . . . . . . . . . . . . . . . . . . . . . . . . . . .
SLM:CABle <B8281 | B1694 | B1505> (WFM 601E and WFM 601M Only) C–3.
SLM:SOURCE? (WFM 601E and WFM 601M Only) C–4. . . . . . . . . . . . . . . . . . . .
SLM:RCVR? (WFM 601E and WFM 601M Only) C–4. . . . . . . . . . . . . . . . . . . . . .
SLM:LEVEL? (WFM 601E and WFM 601M Only) C–5. . . . . . . . . . . . . . . . . . . . .
SLM:LENGTH? (WFM 601E and WFM 601M Only) C–5. . . . . . . . . . . . . . . . . . . .
Configuration Commands C–6. . . . . . . . . . . . . . . . . . . . . . . . . . . . . . . . . . .
REFErence: MODE <INT | EXT> C–6. . . . . . . . . . . . . . . . . . . . . . . . . . . . . . . . . . .
ARROWhead:LIMIT :PAL <MV_700 | MV_950> C–7. . . . . . . . . . . . . . . . . . . . . . .
ARROWhead:LIMIT :NTSC <IRE_100 | IRE_110 | IRE_120 | IRE_131> C–7. . . .
ARROWhead:FORMat <NTSC | PAL | AUTO> C–8. . . . . . . . . . . . . . . . . . . . . . . .
GAMut:GRATicule <ARROWhead | DIAmond> C–8. . . . . . . . . . . . . . . . . . . . . . .
GAMut:ALarm:TRIGger <NONE | CMPST | RGB | BOTH> C–9. . . . . . . . . . . . . .
GAMut:ALarm:DISPlay <SCRN | PICT | BOTH> C–9. . . . . . . . . . . . . . . . . . . . . .
STANDard <LINES_525 | LINES_625 | AUTO> C–10. . . . . . . . . . . . . . . . . . . . . . .
VECtor:BARS <B100 | B75> C–10. . . . . . . . . . . . . . . . . . . . . . . . . . . . . . . . . . . . . . .
VECtor:GRATicule <LTNG | VECtor> C–11. . . . . . . . . . . . . . . . . . . . . . . . . . . . . . .
SERial:MENU <STATUS | FORM | CABLE> C–11. . . . . . . . . . . . . . . . . . . . . . . . . .
SERial:DISPlay <RGB | YPbPr> C–12. . . . . . . . . . . . . . . . . . . . . . . . . . . . . . . . . . . .
SERial:MONitor <GBR | YPbPr> C–12. . . . . . . . . . . . . . . . . . . . . . . . . . . . . . . . . . .
SERial:EAVSAV <PASS | STRIP> C–13. . . . . . . . . . . . . . . . . . . . . . . . . . . . . . . . . . .
SERial:ALarm:<error type> <alarm setting> C–13. . . . . . . . . . . . . . . . . . . . . . . . . . .
UIMENU:<command> <options> C–14. . . . . . . . . . . . . . . . . . . . . . . . . . . . . . . . . . .
Cursor Commands C–16. . . . . . . . . . . . . . . . . . . . . . . . . . . . . . . . . . . . . . . . .
CURsor:SELect <VOLT | TIME | VOLT_TIME | MARK | NONE> C–16. . . . . . . . .
CURsor:CONTROL <VOLT | TIME> C–17. . . . . . . . . . . . . . . . . . . . . . . . . . . . . . . .
MC:<ONE | TWO | THREE> <marker position> C–17. . . . . . . . . . . . . . . . . . . . . . .
<VC | TC>:<ONE | TWO> <voltage level | timing range> C–18. . . . . . . . . . . . . . . .
<TC | VC>:TRACK <ON | OFF> C–19. . . . . . . . . . . . . . . . . . . . . . . . . . . . . . . . . . . .
Digital Waveform and Digital List Commands C–20. . . . . . . . . . . . . . . . . .
DGTL? (WFM 601M Only) C–20. . . . . . . . . . . . . . . . . . . . . . . . . . . . . . . . . . . . . . . .
DGTL:REGion? (WFM 601M Only) C–21. . . . . . . . . . . . . . . . . . . . . . . . . . . . . . . . .
DGTL:DATA? (WFM 601M Only)
DGTL:DATA:V#? C–21. . . . . . . . . . . . . . . . . . . . . . . . . . . . . . . . . . . . . . . . . . . . .
DGTL:VDATA? (WFM 601M Only) C–22. . . . . . . . . . . . . . . . . . . . . . . . . . . . . . . . .
DGTL:VIDmode <VIDEO | DATA> (WFM 601M Only) C–23. . . . . . . . . . . . . . . . .
DGTL:FReeze <ON | OFF> (WFM 601M Only) C–23. . . . . . . . . . . . . . . . . . . . . . . .
DGTL:BASE <HEX | DECIMAL | BINARY> (WFM 601M Only) C–24. . . . . . . . .
ii
WFM 601A, WFM 601E & WFM 601M User Manual
Page 7

Table of Contents
Display Commands C–25. . . . . . . . . . . . . . . . . . . . . . . . . . . . . . . . . . . . . . . . .
DISPlay:SINGLE <display mode> C–25. . . . . . . . . . . . . . . . . . . . . . . . . . . . . . . . . . .
DISPlay:INTENSITY:<display mode>:<line select mode> <intensity> C–26. . . . . .
DISPlay:INTENSITY:READ <intensity> C–27. . . . . . . . . . . . . . . . . . . . . . . . . . . . .
DISPlay:INTENSITY:AUDIO <intensity> (WFM 601A Only) C–28. . . . . . . . . . . .
DISPlay:PIXC <contrast range> C–28. . . . . . . . . . . . . . . . . . . . . . . . . . . . . . . . . . . . .
DISPlay:PIXB <blackness range> C–28. . . . . . . . . . . . . . . . . . . . . . . . . . . . . . . . . . .
DISPlay:TRACEROT <tracerotate> C–29. . . . . . . . . . . . . . . . . . . . . . . . . . . . . . . . . .
DISPlay:SCALEillum <scale> C–29. . . . . . . . . . . . . . . . . . . . . . . . . . . . . . . . . . . . . .
DISPlay:FOCUS:<line select mode> <range> C–30. . . . . . . . . . . . . . . . . . . . . . . . . .
Error Commands C–31. . . . . . . . . . . . . . . . . . . . . . . . . . . . . . . . . . . . . . . . . . .
ESR? C–31. . . . . . . . . . . . . . . . . . . . . . . . . . . . . . . . . . . . . . . . . . . . . . . . . . . . . . . . . . .
ALLEV? C–31. . . . . . . . . . . . . . . . . . . . . . . . . . . . . . . . . . . . . . . . . . . . . . . . . . . . . . . .
Eye Pattern Commands C–33. . . . . . . . . . . . . . . . . . . . . . . . . . . . . . . . . . . . .
EYe:DISPlay < FLAT | EQEYE> (WFM 601M Only) C–33. . . . . . . . . . . . . . . . . . . .
EYe:MODE <OVERLAY | EYE10> (WFM 601E and WFM 601M Only) C–33. . . .
EYe:CLOckhpf <E10HZ | E100HZ | E1000HZ> (WFM 601E and
WFM 601M Only) C–34. . . . . . . . . . . . . . . . . . . . . . . . . . . . . . . . . . . . . . . . . . . .
Gain Commands C–35. . . . . . . . . . . . . . . . . . . . . . . . . . . . . . . . . . . . . . . . . . .
GAIN:AUDIO <DBU0 | DBU4 | DBU8 | DBU12> (WFM 601A Only) C–35. . . . .
GAIN:W_V_STATE <x1 | x5 | x10> C–35. . . . . . . . . . . . . . . . . . . . . . . . . . . . . . . . .
GAIN:<WFM | VEC>:VAR:STATE <ON | OFF> C–36. . . . . . . . . . . . . . . . . . . . . . .
GAIN:<WFM | VEC>:VAR:VALUE <gain> C–36. . . . . . . . . . . . . . . . . . . . . . . . . . .
GAIN:LTNG:VAR:<VERT | HORZ>:STATE <ON | OFF> C–37. . . . . . . . . . . . . . . .
GAIN:LTNG:VAR:<VERT | HORZ>:VALUE <gain> C–37. . . . . . . . . . . . . . . . . . .
Input Commands C–38. . . . . . . . . . . . . . . . . . . . . . . . . . . . . . . . . . . . . . . . . . .
INput:SOUrce <SERIALA | SERIALB> C–38. . . . . . . . . . . . . . . . . . . . . . . . . . . . . .
INput:CHANnel <CH1 | CH2 | CH3> C–39. . . . . . . . . . . . . . . . . . . . . . . . . . . . . . . .
INput:PBPROFFSet <MV_0 | MV_350> C–39. . . . . . . . . . . . . . . . . . . . . . . . . . . . . .
Jitter Measurement Commands C–40. . . . . . . . . . . . . . . . . . . . . . . . . . . . . . .
JITter:HPFILter <J10HZ | J1000HZ | J10KHZ | J100KHZ> (WFM 601M Only) C–40
JITter:UNITS <SEC | UI | OFF> (WFM 601M Only) C–40. . . . . . . . . . . . . . . . . . . .
JITter:<ALIGNMENT | TIMING >? (WFM 601M Only) C–41. . . . . . . . . . . . . . . . .
Line Select Commands C–42. . . . . . . . . . . . . . . . . . . . . . . . . . . . . . . . . . . . . .
LINESelect:<command> <options> C–42. . . . . . . . . . . . . . . . . . . . . . . . . . . . . . . . . .
Position Commands C–44. . . . . . . . . . . . . . . . . . . . . . . . . . . . . . . . . . . . . . . . .
POSition:VER Tical:<display mode> <range>
POSition:HORZ:<display mode> <range> C–44. . . . . . . . . . . . . . . . . . . . . . . . .
Preset Commands C–46. . . . . . . . . . . . . . . . . . . . . . . . . . . . . . . . . . . . . . . . . .
PREset:REcall <PRESETn | FACTORY > C–46. . . . . . . . . . . . . . . . . . . . . . . . . . . . .
PREset:STORE <PRESETn> C–46. . . . . . . . . . . . . . . . . . . . . . . . . . . . . . . . . . . . . . .
PREset:NAMES:<PRESETn> “any string” C–47. . . . . . . . . . . . . . . . . . . . . . . . . . . .
Sweep Commands C–48. . . . . . . . . . . . . . . . . . . . . . . . . . . . . . . . . . . . . . . . . .
SWEEP:TIMING <ONEL | TWOL | ONEF | TWOF> C–48. . . . . . . . . . . . . . . . . . .
SWEEP:TIMING <ONEL | ONEF> C–49. . . . . . . . . . . . . . . . . . . . . . . . . . . . . . . . . .
SWEEP:MAG <OFF | ON> C–49. . . . . . . . . . . . . . . . . . . . . . . . . . . . . . . . . . . . . . . .
System Commands C–50. . . . . . . . . . . . . . . . . . . . . . . . . . . . . . . . . . . . . . . . .
MENU <FILT er | CURsor | LINESelect | CONFIG | GAIN | CRT | CLear |
SERial> C–50. . . . . . . . . . . . . . . . . . . . . . . . . . . . . . . . . . . . . . . . . . . . . . . . . . . .
WFM 601A, WFM 601E & WFM 601M User Manual
iii
Page 8

Table of Contents
Glossary Index
FILTer <FLAT | DIFF | LP> C–51. . . . . . . . . . . . . . . . . . . . . . . . . . . . . . . . . . . . . . . .
AFC <ON | OFF> C–51. . . . . . . . . . . . . . . . . . . . . . . . . . . . . . . . . . . . . . . . . . . . . . . .
POR T:ECHO <ON | OFF> C–52. . . . . . . . . . . . . . . . . . . . . . . . . . . . . . . . . . . . . . . . .
ROTEST <ON | OFF> C–52. . . . . . . . . . . . . . . . . . . . . . . . . . . . . . . . . . . . . . . . . . . .
SNID? C–53. . . . . . . . . . . . . . . . . . . . . . . . . . . . . . . . . . . . . . . . . . . . . . . . . . . . . . . . . .
CALSignal:ENable <OFF | ON> C–53. . . . . . . . . . . . . . . . . . . . . . . . . . . . . . . . . . . .
Remote Command Processing Code C–55. . . . . . . . . . . . . . . . . . . . . . . . . . .
Appendix D: User Service D–1. . . . . . . . . . . . . . . . . . . . . . . . . . . . . . . . . . . .
Cleaning or Replacing the Fan Filter D–1. . . . . . . . . . . . . . . . . . . . . . . . . . . . . . . . . .
Fuse Replacement D–1. . . . . . . . . . . . . . . . . . . . . . . . . . . . . . . . . . . . . . . . . . . . . . . .
Graticule Light Replacement D–2. . . . . . . . . . . . . . . . . . . . . . . . . . . . . . . . . . . . . . . .
Cleaning D–3. . . . . . . . . . . . . . . . . . . . . . . . . . . . . . . . . . . . . . . . . . . . . . . . . . . . . . . .
Replacing the CRT Filter D–3. . . . . . . . . . . . . . . . . . . . . . . . . . . . . . . . . . . . . . . . . . .
iv
WFM 601A, WFM 601E & WFM 601M User Manual
Page 9

List of Figures
Table of Contents
Figure 1–1: Dimensions of the 1700F00 plain cabinet 1–6. . . . . . . . . . . . .
Figure 1–2: 1700F02 portable cabinet 1–7. . . . . . . . . . . . . . . . . . . . . . . . . .
Figure 1–3: Rear view of the waveform monitor in a 1700F02 cabinet 1–8
Figure 1–4: The 1700F05 rack cabinet holds two instruments 1–9. . . . . .
Figure 1–5: 1700F05 cabinet showing utility drawer and blank panel 1–10
Figure 1–6: Monitoring the video bit stream of a serial receiver 1–12. . . .
Figure 1–7: Monitoring serial digital signals around
a routing switcher 1–13. . . . . . . . . . . . . . . . . . . . . . . . . . . . . . . . . . . . . . .
Figure 1–8: Eye Pattern display of a termination with good
return loss 1–14. . . . . . . . . . . . . . . . . . . . . . . . . . . . . . . . . . . . . . . . . . . . .
Figure 1–9: Eye Pattern display of a termination with poor
return loss 1–14. . . . . . . . . . . . . . . . . . . . . . . . . . . . . . . . . . . . . . . . . . . . .
Figure 1–10: Initial equipment connections 1–16. . . . . . . . . . . . . . . . . . . . .
Figure 1–11: Initial display in the Waveform display mode 1–18. . . . . . . .
Figure 1–12: Channel 1 of Color bar with CRT adjustments visible 1–19.
Figure 1–13: Eye Pattern display mode 1–20. . . . . . . . . . . . . . . . . . . . . . . .
Figure 1–14: Jitter display mode 1–21. . . . . . . . . . . . . . . . . . . . . . . . . . . . . .
Figure 1–15: Vector display for 100% Color bar signal 1–22. . . . . . . . . . .
Figure 1–16: Lightning display for 100% Color bar signal 1–22. . . . . . . .
Figure 1–17: Arrowhead gamut display 1–23. . . . . . . . . . . . . . . . . . . . . . . .
Figure 1–18: Diamond gamut display 1–24. . . . . . . . . . . . . . . . . . . . . . . . . .
Figure 1–19: Video digital waveform 1–25. . . . . . . . . . . . . . . . . . . . . . . . . . .
Figure 1–20: Data digital waveform 1–26. . . . . . . . . . . . . . . . . . . . . . . . . . .
Figure 1–21: Typical Audio display with small phase error 1–26. . . . . . . .
Figure 2–1: WFM 601M front panel 2–1. . . . . . . . . . . . . . . . . . . . . . . . . . .
Figure 2–2: WFM 601A and WFM 601E front panels 2–2. . . . . . . . . . . .
Figure 2–3: Elements of the waveform monitor menu controls 2–5. . . . .
Figure 2–4: Rear panel of the waveform monitor 2–6. . . . . . . . . . . . . . . .
Figure 3–1: A signal from one channel only 3–1. . . . . . . . . . . . . . . . . . . . .
Figure 3–2: X and Y signal in phase with equal amplitudes 3–2. . . . . . . .
Figure 3–3: Signals out of phase with equal amplitudes 3–2. . . . . . . . . . .
Figure 3–4: Signals out of phase with unequal amplitudes 3–3. . . . . . . . .
Figure 3–5: Signals with reverse polarity and equal amplitudes 3–3. . . .
Figure 3–6: Signals with a phase error of 90 degrees and
equal amplitudes 3–3. . . . . . . . . . . . . . . . . . . . . . . . . . . . . . . . . . . . . . . .
Figure 3–7: Typical Audio display pattern with small phase error 3–4. .
WFM 601A, WFM 601E & WFM 601M User Manual
v
Page 10

Table of Contents
Figure 3–8: Typical Bowtie display on the waveform monitor 3–5. . . . . .
Figure 3–9: Bowtie waveform showing a timing error in CH 3 3–6. . . . .
Figure 3–10: Bowtie waveform showing gain error in CH 3 3–6. . . . . . . .
Figure 3–11: Configure menu for WFM/VEC showing
the selection knob 3–8. . . . . . . . . . . . . . . . . . . . . . . . . . . . . . . . . . . . . . .
Figure 3–12: Map of functions available in the Configure menu 3–9. . . .
Figure 3–13: Example of the Digital List display 3–14. . . . . . . . . . . . . . . . .
Figure 3–14: Data List display mode in the Video mode 3–15. . . . . . . . . . .
Figure 3–15: Digital Waveform display in the VIDEO mode 3–16. . . . . . .
Figure 3–16: Digital Waveform display in DATA mode 3–17. . . . . . . . . . .
Figure 3–17: Digital Waveform display showing X5 gain on CH 1 (Y)
waveform 3–18. . . . . . . . . . . . . . . . . . . . . . . . . . . . . . . . . . . . . . . . . . . . . .
Figure 3–18: Overlay Eye display 3–20. . . . . . . . . . . . . . . . . . . . . . . . . . . . .
Figure 3–19: 10-EYE triggered display 3–21. . . . . . . . . . . . . . . . . . . . . . . . .
Figure 3–20: Connections for measuring a serial source 3–22. . . . . . . . . . .
Figure 3–21: Timing Cursors alignment for measuring 20–80%
rise time 3–24. . . . . . . . . . . . . . . . . . . . . . . . . . . . . . . . . . . . . . . . . . . . . . .
Figure 3–22: Construction of the Diamond display 3–29. . . . . . . . . . . . . . .
Figure 3–23: Out-of-gamut signals on a Diamond display 3–30. . . . . . . . .
Figure 3–24: NTSC and PAL Arrowhead gamut displays 3–31. . . . . . . . .
Figure 3–25: Waveform measurement graticule 3–34. . . . . . . . . . . . . . . . .
Figure 3–26: Graticule for K-factor measurements 3–35. . . . . . . . . . . . . . .
Figure 3–27: Example of the Jitter display 3–37. . . . . . . . . . . . . . . . . . . . . .
Figure 3–28: Parade display of YPbPr shown in Line Select mode
(15H only) 3–40. . . . . . . . . . . . . . . . . . . . . . . . . . . . . . . . . . . . . . . . . . . . .
Figure 3–29: Parade display of Y and Pb signals 3–41. . . . . . . . . . . . . . . . .
Figure 3–30: Example of the Picture display 3–42. . . . . . . . . . . . . . . . . . . .
Figure 3–31: Serial STATUS display for firmware V2.X 3–45. . . . . . . . . .
Figure 3–32: Serial STATUS display for firmware V1.X 3–47. . . . . . . . . .
Figure 3–33: Serial format display showing the FORMAT screen 3–48. . .
Figure 3–34: Serial format display showing the Cable screen 3–49. . . . . .
Figure 3–35: Connection for point-to-point error measurements 3–50. . .
Figure 3–36: Vector display relationship of the Pr and Pb signals 3–53. . .
Figure 3–37: Vector display graticule 3–54. . . . . . . . . . . . . . . . . . . . . . . . . .
Figure 3–38: Construction of the Lightning display 3–55. . . . . . . . . . . . . .
Figure 3–39: Lightning graticule showing interchannel timing errors 3–56
Figure B–1: Pin assignments for the RS-232 connector B–1. . . . . . . . . . .
Figure B–2: Pin assignments for the REMOTE connector B–2. . . . . . . .
Figure D–1: Graticule light bulb replacement D–2. . . . . . . . . . . . . . . . . . .
vi
WFM 601A, WFM 601E & WFM 601M User Manual
Page 11

List of Tables
Table of Contents
Table 3–1: List of measured and actual rise times for the
waveform monitor 3–25. . . . . . . . . . . . . . . . . . . . . . . . . . . . . . . . . . . . . .
Table A–1: Electrical specifications A–1. . . . . . . . . . . . . . . . . . . . . . . . . . .
Table A–2: CRT display A–8. . . . . . . . . . . . . . . . . . . . . . . . . . . . . . . . . . . .
Table A–3: AC power source A–9. . . . . . . . . . . . . . . . . . . . . . . . . . . . . . . .
Table A–4: Environmental characteristics A–9. . . . . . . . . . . . . . . . . . . . . .
Table A–5: Physical characteristics A–9. . . . . . . . . . . . . . . . . . . . . . . . . . .
Table A–6: Safety standards A–10. . . . . . . . . . . . . . . . . . . . . . . . . . . . . . . . .
Table A–7: Safety certification compliance A–10. . . . . . . . . . . . . . . . . . . . .
Table A–8: Certifications and compliances A–11. . . . . . . . . . . . . . . . . . . . .
Table B–1: Remote connector pin assignments and functions B–2. . . . . .
Table C–1: Symbols used in this section C–1. . . . . . . . . . . . . . . . . . . . . . . .
Table C–2: SERial:ALarm: commands and options C–14. . . . . . . . . . . . . .
Table C–3: UIMENU: commands and options C–15. . . . . . . . . . . . . . . . . .
Table C–4: Voltage and Timing Cursor positioning commands
and options C–18. . . . . . . . . . . . . . . . . . . . . . . . . . . . . . . . . . . . . . . . . . . .
Table C–5: Voltage and Timing Cursor tracking commands and
options C–19. . . . . . . . . . . . . . . . . . . . . . . . . . . . . . . . . . . . . . . . . . . . . . . .
Table C–6: DISPLay:SINGLE commands C–25. . . . . . . . . . . . . . . . . . . . . .
Table C–7: DISPlay:INTENSITY command options C–27. . . . . . . . . . . . .
Table C–8: DISPLay:FOCUS command options C–30. . . . . . . . . . . . . . . .
Table C–9: Typical ALLEV? responses to detected system errors. C–32. .
Table C–10: LINESelect: commands and options C–42. . . . . . . . . . . . . . . .
Table C–11: POSition:VERTical commands and options C–45. . . . . . . . .
Table C–12: POSition:HORZ commands and options C–45. . . . . . . . . . . .
Table C–13: FILTer command options C–51. . . . . . . . . . . . . . . . . . . . . . . . .
WFM 601A, WFM 601E & WFM 601M User Manual
vii
Page 12

Table of Contents
viii
WFM 601A, WFM 601E & WFM 601M User Manual
Page 13

General Safety Summary
Review the following safety precautions to avoid injury and prevent damage to
this product or any products connected to it.
Only qualified personnel should perform service procedures.
To avoid potential hazards, use this product only as specified.
Injury Precautions
Product Damage
Precautions
Use Proper Power Cord. To avoid fire hazard, use only the power cord specified
for this product.
Avoid Electric Overload. To avoid electric shock or fire hazard, do not apply a
voltage to a terminal that is outside the range specified for that terminal.
Ground the Product. This product is grounded through the grounding conductor
of the power cord. To avoid electric shock, the grounding conductor must be
connected to earth ground. Before making connections to the input or output
terminals of the product, ensure that the product is properly grounded.
Do Not Operate Without Covers. To avoid electric shock or fire hazard, do not
operate this product with covers or panels removed.
Use Proper Fuse. To avoid fire hazard, use only the fuse type and rating specified
for this product.
Do Not Operate in Wet/Damp Conditions. To avoid electric shock, do not operate
this product in wet or damp conditions.
Do Not Operate in an Explosive Atmosphere. To avoid injury or fire hazard, do not
operate this product in an explosive atmosphere.
Use Proper Power Source. Do not operate this product from a power source that
applies more than the voltage specified.
Provide Proper Ventilation. To prevent product overheating, provide proper
ventilation.
Do Not Operate With Suspected Failures. If you suspect there is damage to this
product, have it inspected by qualified service personnel.
Symbols and Terms
WFM 601A, WFM 601E & WFM 601M User Manual
T erms in this Manual. These terms may appear in this manual:
WARNING. Warning statements identify conditions or practices that could result
in injury or loss of life.
ix
Page 14
General Safety Summary
CAUTION. Caution statements identify conditions or practices that could result in
damage to this product or other property.
T erms on the Product. These terms may appear on the product:
DANGER indicates an injury hazard immediately accessible as you read the
marking.
WARNING indicates an injury hazard not immediately accessible as you read the
marking.
CAUTION indicates a hazard to property including the product.
Symbols on the Product. The following symbols may appear on the product:
Certifications and
Compliances
DANGER
High Voltage
Protective Ground
(Earth) T erminal
ATTENTION
Refer to Manual
Double
Insulated
Refer to the specifications section for a listing of certifications and compliances
that apply to this product.
x
WFM 601A, WFM 601E & WFM 601M User Manual
Page 15

Preface
About This Manual
This manual describes the capabilities of the WFM 601A, WFM 601E, and
WFM 601M Serial Digital Component Waveform Monitors and their features
and specifications.
To get started, refer to the first section, Getting Started. This section shows you
how to install and configure the waveform monitor for use in your operating
environment. For detailed information about a feature, refer to the third section,
Reference.
This manual is composed of the following sections:
Getting Started provides a product description, installation instructions, and a
functional check procedure. Standard and optional accessories are also listed.
Operating Basics briefly describes the front panel controls and rear panel
connections.
Related Manuals
Reference provides an alphabetized reference for all display modes and
configurable features of the waveform monitor.
Appendices provides additional information including the specifications,
remote control interfaces, and maintenance procedures.
The following related document is also available.
The WFM 601A, WFM 601E, and WFM 601M Service Manual
(070–9836-XX) describes how to service the waveform monitors. This
optional manual may be ordered separately.
Complete and mail the Warranty Reply Card packaged with this manual to ensure
that you receive notifications of firmware or hardware upgrades.
WFM 601A, WFM 601E & WFM 601M User Manual
xi
Page 16

Preface
Contacting Tektronix
Product
Support
Service
Support
For other
information
To write us Tektronix, Inc.
For application-oriented questions about a Tektronix measurement product, call toll free in North America:
1-800-TEK-WIDE (1-800-835-9433 ext. 2400)
6:00 a.m. – 5:00 p.m. Pacific time
Or contact us by e-mail:
tm_app_supp@tek.com
For product support outside of North America, contact your
local Tektronix distributor or sales office.
Contact your local Tektronix distributor or sales office. Or visit
our web site for a listing of worldwide service locations.
http://www.tek.com
In North America:
1-800-TEK-WIDE (1-800-835-9433)
An operator will direct your call.
P.O. Box 1000
Wilsonville, OR 97070-1000
xii
WFM 601A, WFM 601E & WFM 601M User Manual
Page 17

Getting Started
Page 18

Page 19

Getting Started
Product Description
This section presents information you need to set up your waveform monitor and
to check that it is functional. This section contains the following information:
Product Description gives an overview of the product capabilities.
Accessories lists the standard and optional accessories.
Installation describes how to set up the waveform monitor for use.
Functional Check gives a procedure to verify the primary functions of your
waveform monitor.
The waveform monitors measure and display 4:2:2 component serial digital
signals. A waveform monitor displays serial digital signals as the familiar
component signals, as an Eye pattern, as digital data or in a variety of standard
measurement modes. Use the EDH (Error Detection and Handling) system and
the suite of automated checks of the serial digital format to verify data integrity.
Refer to Appendix A: Specifications for details of the waveform monitor
performance.
Features
The waveform monitors offers the following features:
Two 270 Mbit serial component loop-through inputs
Digital video standards SMPTE 259M, ITU-R BT.656, and ITU–R BT.601
RGB and Y-P
Eye Pattern display with Timing and Voltage Cursors on the WFM 601E and
the WFM 601M
Jitter demodulator with numeric jitter readout and video correlated jitter
waveform display on the WFM 601M
Parade or Waveform display of Y, P
Digital Waveform and Data displays with Data-cursor correlation between
display modes on the WFM 601M
RGB and composite Gamut checks with Diamond and Arrowhead displays
Field, line, and word (WFM 601M only) select with readout and bright up of
selected lines on Picture Monitor Out (Y or G Channel)
display format for 525 and 625 line signals
B-PR
, and PR component signals
B
WFM 601A, WFM 601E & WFM 601M User Manual
1–1
Page 20

Getting Started
SMPTE RP-165 standard EDH indicator for presence
Embedded Audio indentification
Analog audio Lissajous display on the WFM 601A
Source signal level meter and cable-length readout on the WFM 601E and
the WFM 601M
Lightning and Vector displays
Reclocked Serial Component Digital output following A/B switching
Video Reference: Internal Serial Component signal (follows A/B switching)
or external composite
Accessories
Standard Accessories
Menus
Calibrator
An expanded feature set is available through the menus. You select menu items
with multi-use bezel buttons and knobs. When you select a menu item, such as
Voltage Cursors, on-screen labels show the current function of the bezel buttons
and knobs.
The waveform monitors provide an internal calibrator signal to set both vertical
and horizontal gain. The calibrator signal is a 700 mV, 100 kHz signal. Press the
CONFIG button and use the bezel knob to select the Calibrate menu. Press the
CAL SIG button to turn on the calibrator signal.
The waveform monitor is shipped with several standard accessories. These
standard accessories and any optional accessories are listed here.
The following accessory items are included with this product:
1 User Manual, this manual (071-0103–XX)
1 Power Cord: United States and Japan only (161–0216–XX)
1–2
1 Replacement Fuse Cartridge: 3AG, 2A, 250 V, fast-blow (159–0021–00)
3 Replacement Graticule Light Bulbs (150–0168–00)
3 Replacement Air Filters for Fan (378–0415–00)
2 75 W High-frequency, End-line Terminations: 26 dB to 300 MHz
(011–0163–00)
1 Smoke Grey CRT Filter, installed on instrument (378–0258–00)
WFM 601A, WFM 601E & WFM 601M User Manual
Page 21

Getting Started
Options
Optional Accessories
The following options are available when ordering a waveform monitor.
Power Cord Options. If you do not specify a power cord option, the waveform
monitor is shipped with a North American 125 V power cord and one replacement fuse. The following power cord options are available when purchasing your
waveform monitor.
Power cords for use in North America are UL listed and CSA certified. Cords for
use in areas other than North America are approved by at least one test house
acceptable in the country to which the product is shipped.
Option A1. Power, Universal Europe, 220 V/16 A (Locking Power Cord)
Option A2. Power, United Kingdom, 240 V/15 A (Power Cord)
Option A3. Power, Australia, 240 V/10 A (Power Cord)
Option A4. Power, North America, 250 V/10 A (Power Cord)
Option A5. Power, Swiss, 240 V/6 A (Power Cord)
The following items can be ordered with the monitor or purchased through a
Tektronix field office or distributor. When ordering, include both the name and
part number (if available) of the option.
WFM 601A, WFM 601E, and WFM 601M Service Manual. (070-9836-XX) Provides
module-level troubleshooting information plus information to help identify
components, such as schematics, component locaters, and a complete parts list.
Front Panel Cover. The front panel cover protects the display face from damage
and dust.
1700F00 Plain Cabinet. This rack mount cabinet is half-rack width, made of
durable metal and painted silver-gray. Ventilating holes in the top, bottom, and
sides of the cabinet help dissipate heat.
1700F02 Carrying Case. This portable cabinet is similar to the 1700F00, but it has
rubber feet, a carrying handle, a flipstand, and a front cover.
1700F05 Side-by-Side Rack Adapter . The 1700F05 allows you to mount two
half-rack width instruments in a standard 19-inch rack.
WFM 601A, WFM 601E & WFM 601M User Manual
1–3
Page 22

Getting Started
1700F06 Blank Panel. When you use only one side of a 1700F05 enclosure, insert
a 1700F06 Blank Panel in the unused side to improve appearance and air flow.
1700F07 Utility Drawer . When you use only one side of a 1700F05, install the
1700F07 utility drawer in the unused side to provide storage and improve
appearance and air flow. The drawer opens and closes freely, unless latched for
transport.
1–4
WFM 601A, WFM 601E & WFM 601M User Manual
Page 23

Installation
Included Accessories
Hardware Installation
This section provides instructions for installing the waveform monitor into a
standard rack or one of the optional cases. At installation time, save the shipping
carton and packing materials (including the anti-static bag) in case you need to
ship the instrument.
The waveform monitor is shipped with several accessory items which may be
required for normal use. For more information on accessories, refer to page 1–2.
Because operating environments vary, the waveform monitor is not shipped with
a cabinet unless you have ordered one. All qualification testing for the waveform
monitor was performed in a 1700F00 cabinet. To guarantee compliance with
specifications, you should operate the waveform monitor in one of the cabinets
described here.
Cabinets
The cabinets offered for the waveform monitor provide EMI shielding, protect
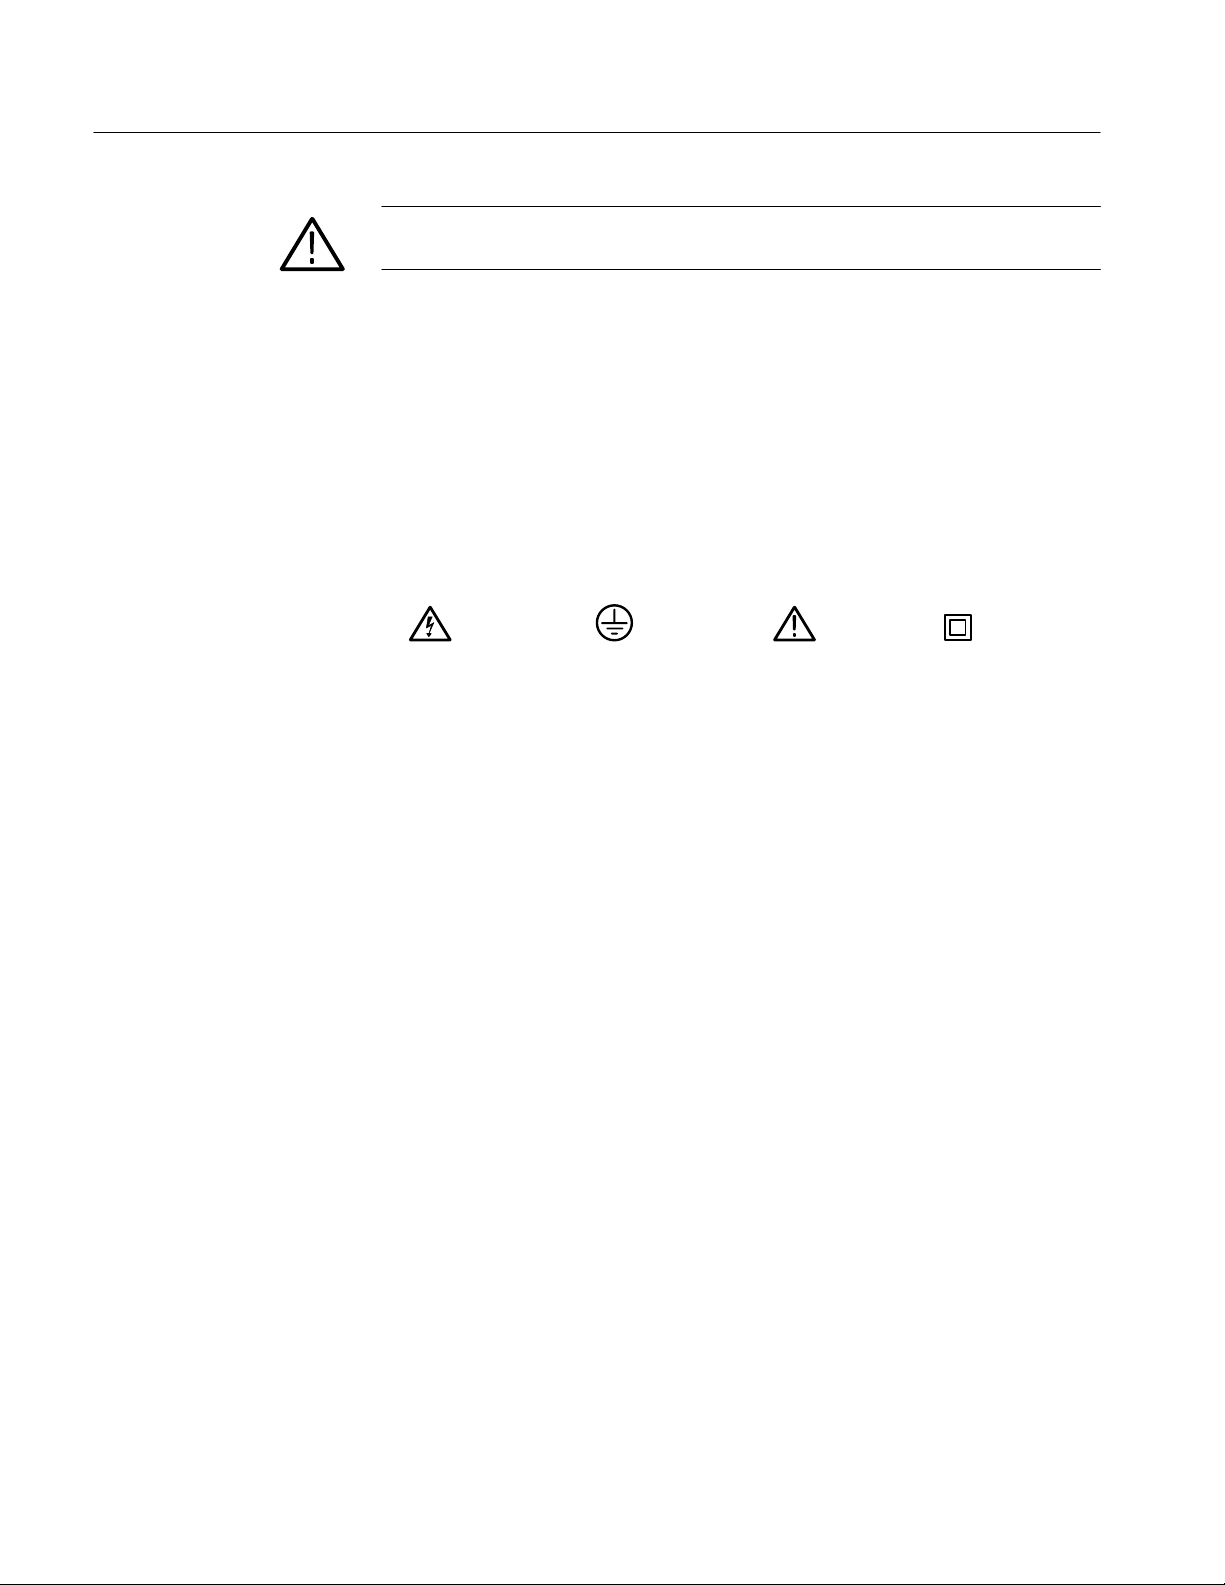
against electrical shock, and protect against the accumulation of dust. Figure 1–1
shows the plain cabinet, option 1700F00. A rear panel fan supplies filtered,
cooling air which exits through the cabinet vent holes. Restricting the air flow
through the vents or the rear fan can lead to an excessive internal temperature.
NOTE. To meet EMI emission specifications, the waveform monitor must be
installed in a Tektronix 1700F00, 1700F02, or 1700F05 enclosure. The enclosure
front edges must securely contact the conductive front bezel on all four sides.
WFM 601A, WFM 601E & WFM 601M User Manual
1–5
Page 24
Installation
21 cm
(8.25 in)
42.7 cm
(16.2 in)
13 cm
(5.1 in)
Figure 1–1: Dimensions of the 1700F00 plain cabinet
The optional 1700F00 cabinet is the basic element for all of the cabinets. The
1700F02 Portable carrying case is an enhanced version of the 1700F00 cabinet,
as is the 1700F05 side-by-side rack mount assembly. All cabinets are available
from your Tektronix representative.
1–6
WFM 601A, WFM 601E & WFM 601M User Manual
Page 25
Installation
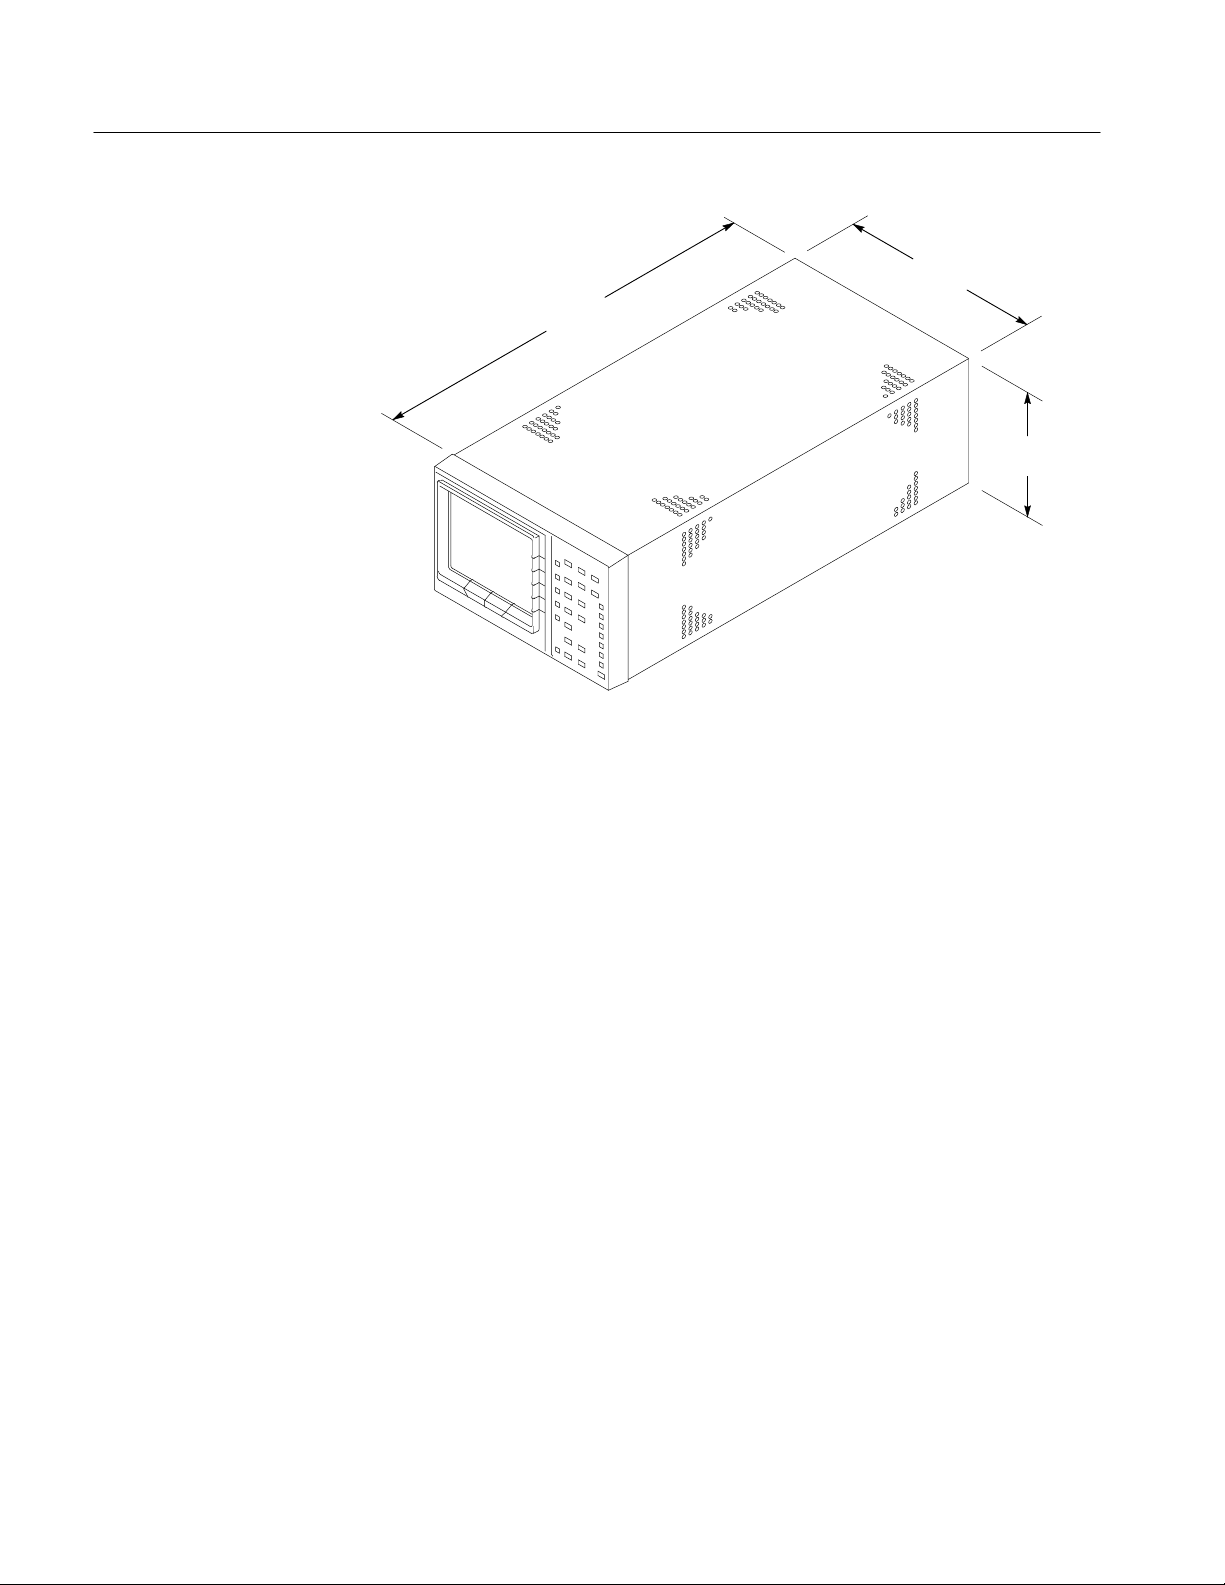
The portable cabinet, 1700F02, is shown in Figure 1–2. The 1700F02 has a
handle, four feet, and a flip-up stand. The mounting hole sizes and spacing are
different from those of the 1700F00.
21 cm
42.7 cm
(16.2 in)
(8.25 in)
13 cm
(5.1 in)
Figure 1–2: 1700F02 portable cabinet
WFM 601A, WFM 601E & WFM 601M User Manual
1–7
Page 26

Installation
Installing the Waveform
Monitor in a Cabinet
Secure the waveform monitor in a cabinet using two 6-32 Pozidriver screws.
Figure 1–3 shows the location of these screws on the rear panel.
CAUTION. Do not carry a waveform monitor in a cabinet without installing the
rear panel mounting screws. Without the mounting screws, there is nothing to
keep the waveform monitor in its cabinet.
Cabinet securing
screws
Figure 1–3: Rear view of the waveform monitor in a 1700F02 cabinet
1–8
WFM 601A, WFM 601E & WFM 601M User Manual
Page 27

Installation
Rack Adapter
The optional 1700F05 side-by-side rack adapter, shown in Figure 1–4, consists of
two attached cabinets. Use it to mount the waveform monitor and another
half-rack width instrument, such as an analog component monitor, in a standard
19-inch rack.
You can adjust the rack adapter so that the waveform monitor is aligned with
other equipment in the rack. See Figure 1–4.
48.2 cm
(19 in)
13.2 cm
(5.3 in)
Mounting
holes
Mounting
holes
43.9 cm
(17.3 in)
Figure 1–4: The 1700F05 rack cabinet holds two instruments
WFM 601A, WFM 601E & WFM 601M User Manual
Front panel
alignment holes
1–9
Page 28
Installation
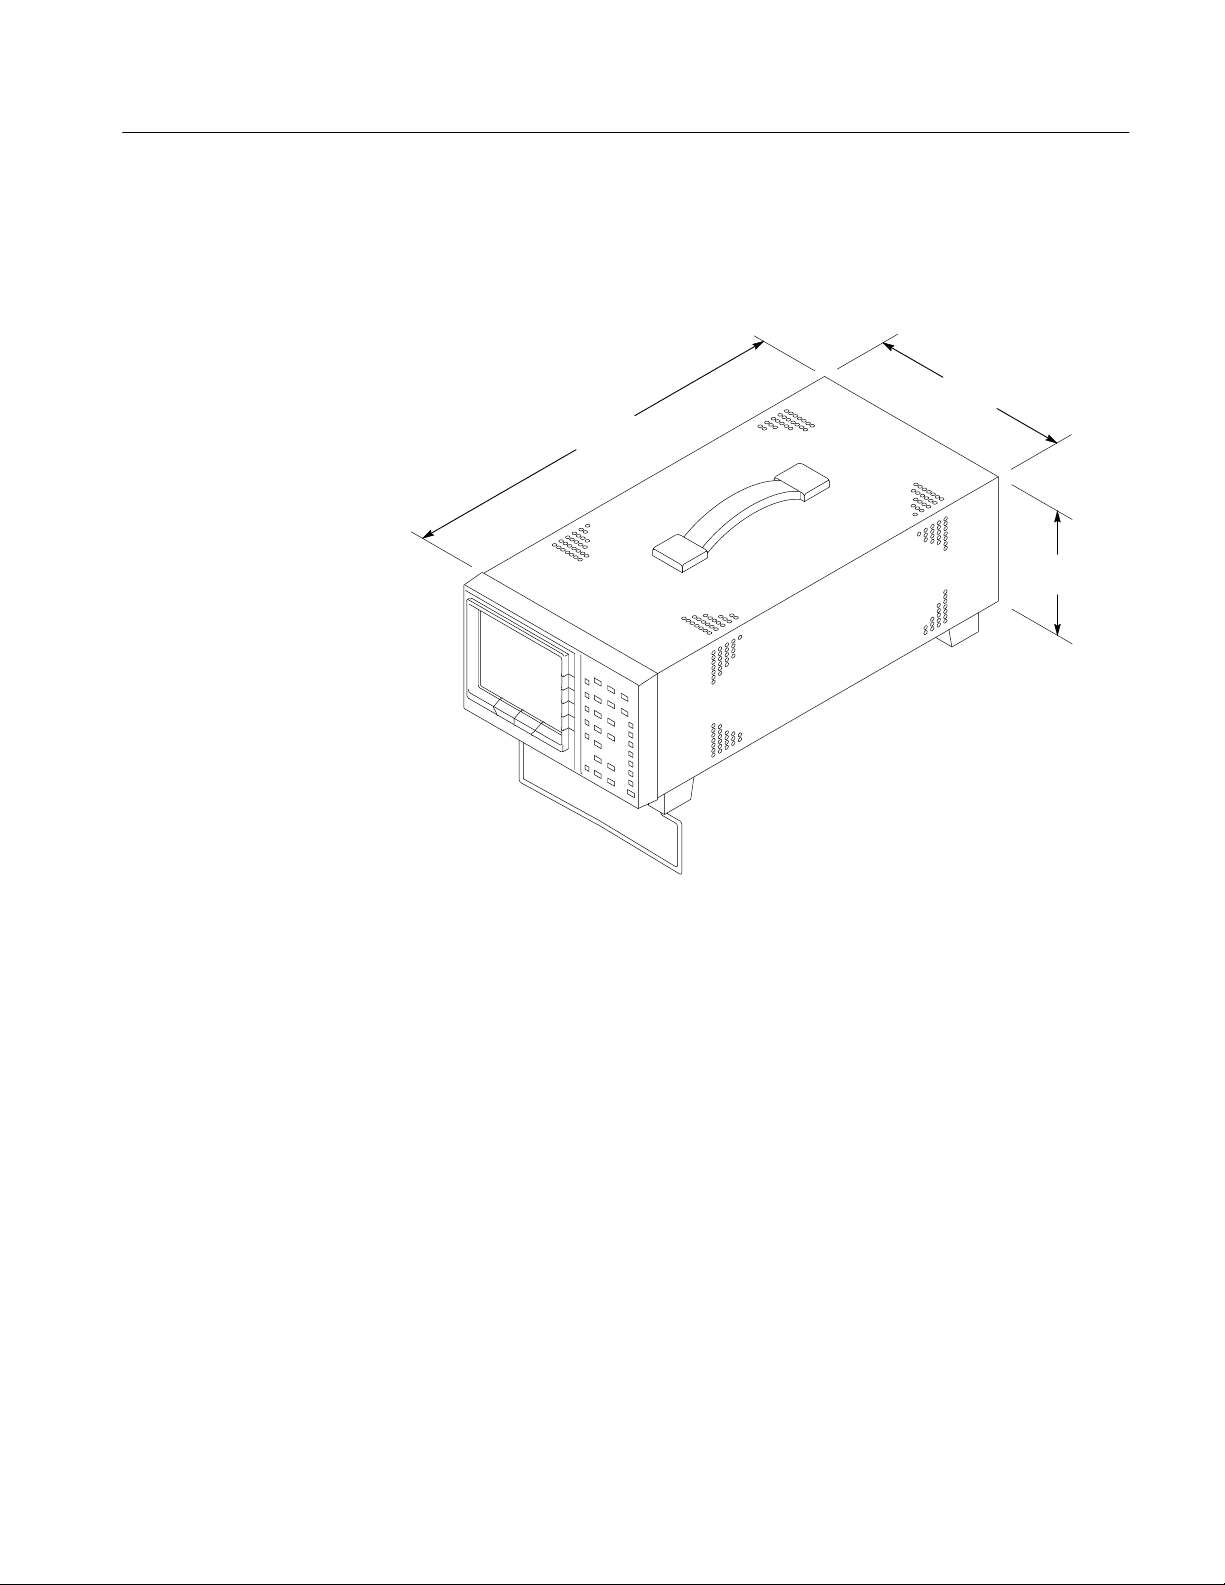
If you are using only one side of the rack adapter, insert a blank panel (1700F06)
or an accessory drawer (1700F07) in the unused section to improve airflow and
appearance. Figure 1–5 shows the blank panel and drawer.
1700F05
Repackaging for
Shipment
1700F07
1700F06
Figure 1–5: 1700F05 cabinet showing utility drawer and blank panel
To ship the waveform monitor to a Tektronix Service Center for service, follow
these instructions:
1. Attach a tag to the waveform monitor showing the name of the owner, the
complete address, the phone number, the instrument serial number and a
description of the required service.
2. Repackage the instrument in the original packaging materials. If the original
packaging materials are not available, follow these instructions:
a. Obtain a carton of corrugated cardboard having inside dimensions at
least six inches greater than the dimensions of the instrument. Use a
shipping carton that has a test strength of at least 275 pounds.
b. Surround the instrument with a protective bag (anti-static preferred). For
instruments that are not in a cabinet, wrap a cardboard piece around the
bagged instrument to protect internal components.
1–10
WFM 601A, WFM 601E & WFM 601M User Manual
Page 29

Connecting Power
Installation
c. Pack dunnage or urethane foam between the instrument and the carton. If
using Styrofoam kernels, overfill the box and compress when closing the
lid. You need three inches of cushioning on all sides of the instrument.
3. Seal the carton with shipping tape or industrial staples.
The waveform monitor operates from a single-phase power source with the
neutral conductor at or near earth ground. The line conductor is fused for
over-current protection. A protective ground connection through the grounding
conductor in the power cord is essential for safe operation.
WARNING. When power is supplied, line voltage will be present in the waveform
monitor, even if the POWER switch is set to STANDBY
.
AC Power Requirements
The waveform monitor operates from an AC line frequency of 50 or 60 Hz, over
the range of 90–250 Volts, without the need for configuration, except the power
cord. Refer to page 1–2 for the power cord options. The typical power draw is
75 W. Refer to Appendix A: Specifications for additional information on power
and environmental requirements.
WFM 601A, WFM 601E & WFM 601M User Manual
1–11
Page 30
Installation
Installing the Waveform Monitor in a Serial Video System
The serial digital monitor can operate almost anywhere in the distribution system
due to its high impedance, bridging, loop-through inputs. This section describes
two types of connections and presents useful information on line termination.
Most serial equipment employs a receiver that regenerates an output signal, such
as the receiver shown in Figure 1–6. Routing the incoming serial signal through
one of the waveform monitor loop-though inputs and connecting the output of
the serial receiver to the other loop-through input allows you to compare the
incoming signal and the regenerated output signal.
Waveform Monitor
(rear panel)
Serial source
Regenerated
serial output
Serial receiver
Output
SER A
Loop-through input
SER B
Loop-through input
Serial video
output signal
Figure 1–6: Monitoring the video bit stream of a serial receiver
Input
1–12
WFM 601A, WFM 601E & WFM 601M User Manual
Page 31

Installation
You can use the waveform monitor to check serial digital signals around a
routing switcher. It is possible to look at all the inputs to the switcher with the use
of a patch panel and the serial monitor as shown in Figure 1–7.
Waveform Monitor
(rear panel)
Serial video output signal
Line Termination
SER A
Loop-through input
SER B
Loop-through input
Patch panel
Serial
sources
Serial router
Output
Figure 1–7: Monitoring serial digital signals around a routing switcher
The waveform monitor uses passive loop-through serial inputs, similar in concept
to those used in baseband video equipment. Accordingly, the loop-through must
be terminated externally. It is important that this external termination meet
accuracy and return loss requirements.
If the waveform monitor is installed to monitor an operating link, the destination
receiver and the connecting cable serve as the termination. This monitoring
connection is best because it checks the performance of the entire serial path. The
return loss of the waveform monitor is sufficiently high that, in most cases, the
destination receiver sets the system return loss.
In cases where the waveform monitor is placed at the end of a link, a BNC
termination must be installed on one side of the loop-through connector. The
termination must be 75 W and DC coupled (good return loss extends to DC).
Return loss should exceed 25 dB from 10 kHz to 270 MHz. The supplied 75 W
terminators meet these requirements.
A terminator can be inspected for return loss problems using the WFM 601M or
WFM 601E waveform monitor and a serial source with low aberrations, such as
the Tektronix TG 2000 mainframe with a DVG1 Generator module. Connect the
generator serial output to one side of the waveform monitor loop-through
connector and install the terminator on the other side. Select the EYE mode and
observe the Eye Pattern, paying particular attention to leading edge aberrations.
WFM 601A, WFM 601E & WFM 601M User Manual
1–13
Page 32

Installation
Figure 1–8 shows the Eye Pattern with a good return loss terminator. Figure 1–9
shows the distorted Eye Pattern of a terminator having only 13 dB return loss
(capacitive) at 100 MHz. Terminations with aberrations under 10% are acceptable.
Figure 1–8: Eye Pattern display of a termination with good return loss
1–14
Figure 1–9: Eye Pattern display of a termination with poor return loss
Compatibility of BNC Center Pins. Most video equipment BNC connectors,
whether 50 or 75 W, use a 50 W standard center pin. Some laboratory 75 W BNC
connectors use a smaller diameter center pin. The BNC connectors on the
WFM 601M are designed to work with the 50 W standard (large diameter) center
pins.
Do not use connectors or terminators with the smaller center pins. They could
cause intermittent connections.
WFM 601A, WFM 601E & WFM 601M User Manual
Page 33

Functional Check
The following procedure provides a basic operational check of the waveform
monitor. Only instrument functions, not measurement quantities or specifications,
are checked in this procedure. Therefore, a minimum amount of test equipment is
required.
WARNING. To avoid personal injury, be sure that a cabinet is installed on the
instrument.
All checks are made with the cabinet installed. The cabinet, an optional
accessory, must be installed on the instrument to avoid personal injury, maintain
proper environment for the instrument, keep dust out, and provide proper EMI
shielding.
If the Functional Check reveals improper operation or an instrument malfunction,
check the connections to and the operation of the test equipment. If it is operating
normally and the failure is repeatable, send the waveform monitor to qualified
service personnel for repair or adjustment.
For a complete check of the instrument performance, refer qualified service
personnel to the Performance Verification Procedure in the Service manual.
Required Equipment
The following equipment is required to perform this procedure:
Digital Component Television Signal Generator (1)
Provides 100% Color Bar signal.
For example: The Tektronix TG 2000 Signal Generation Platform with a
DVG1 module.
Function generator (1) (for WFM 601A only)
For example: Tegam FG 503
Coaxial Cable (1)
42-inch, 75 W, RG6 cable (Tektronix Part No. 012-0159-00) or equivalent
75 W Terminator (1)
End-line (Tektronix Part No. 011-0163-00)
WFM 601A, WFM 601E & WFM 601M User Manual
1–15
Page 34

Functional Check
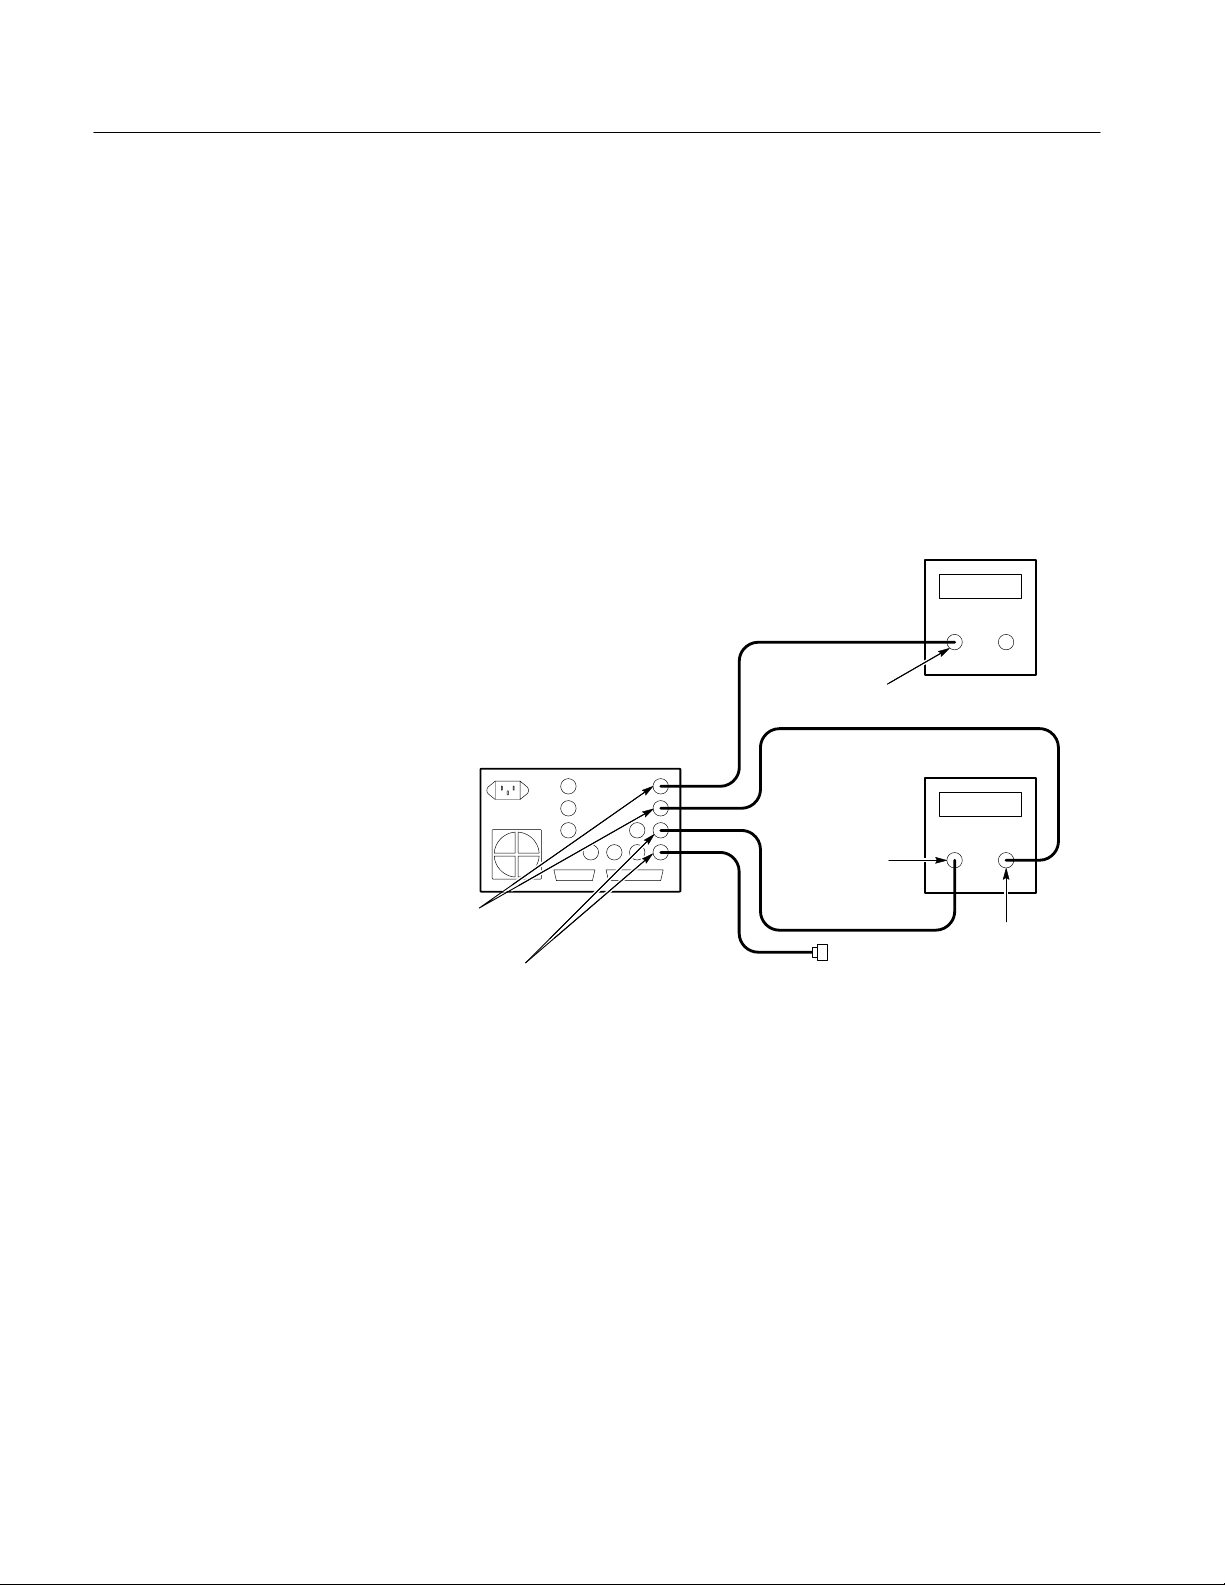
Initial Equipment Connections
Figure 1–10 shows how to configure a signal generator and the waveform
monitor to preform the Functional Check procedure.
Waveform Monitor
(rear panel)
75 terminator
SER A
Loop-through input
Signal
generator
Output
Figure 1–10: Initial equipment connections
Follow these steps to configure the test equipment.
1. Ensure the waveform monitor is enclosed in a cabinet before connecting AC
power.
2. Connect the waveform monitor to an appropriate AC power source.
3. Connect the component serial digital output of the signal generator to one
side of the SER A input.
1–16
4. Terminate the other side of the loop-through the SER A input with the 75 W
terminator.
5. For the WFM 601A only, connect one of the Function Generator audio
outputs to pins 8 and 9 of the REMOTE 25-pin connector; connect the other
output to pins 10 and 11. See Appendix B: Remote Operation for more
information on configuring the waveform monitor’s remote connector for
audio input. Ensure that the generator amplitude is a nominal 5 V, but not
greater than 8 Vpeak.
This procedure does not check the monitor outputs (MON OUT). To check these
outputs, connect a GBR or YPbPr analog component monitor and check for the
Color bar pattern during the procedure.
WFM 601A, WFM 601E & WFM 601M User Manual
Page 35

Functional Check Procedure
Perform the following steps to check the basic functions.
WARNING. A shock hazard exists in the waveform monitor when it has no cabinet
and it is connected to AC power. Always install the waveform monitor in a
cabinet before use.
1. Perform steps listed under Initial Equipment Connections.
2. Set the video generator to produce a 100% Color Bar signal and to enable its
output.
3. Press the front-panel power switch on the waveform monitor. Check that the
indicator beside the switch lights up indicating ON.
4. Check that the CRT and graticule light up. When you apply power, the
waveform monitor restores its last settings.
Functional Check
5. Initialize the waveform monitor settings. The waveform monitor contains a
factory Preset that restores the instrument to factory settings.
a. Press the PRESET MENU button.
b. Select the FACTORY setting by turning the bezel knob under the list of
presets to highlight FACTORY
c. Press the bezel button adjacent to RECALL to load the factory preset.
d. Check for the Waveform display mode with one channel of the Color Bar
signal displayed. Your display should look similar to Figure 1–11.
WFM 601A, WFM 601E & WFM 601M User Manual
1–17
Page 36

Functional Check
@ 525/2:1
10S/DIV
Figure 1–11: Initial display in the Waveform display mode
1–18
WFM 601A, WFM 601E & WFM 601M User Manual
Page 37

Functional Check
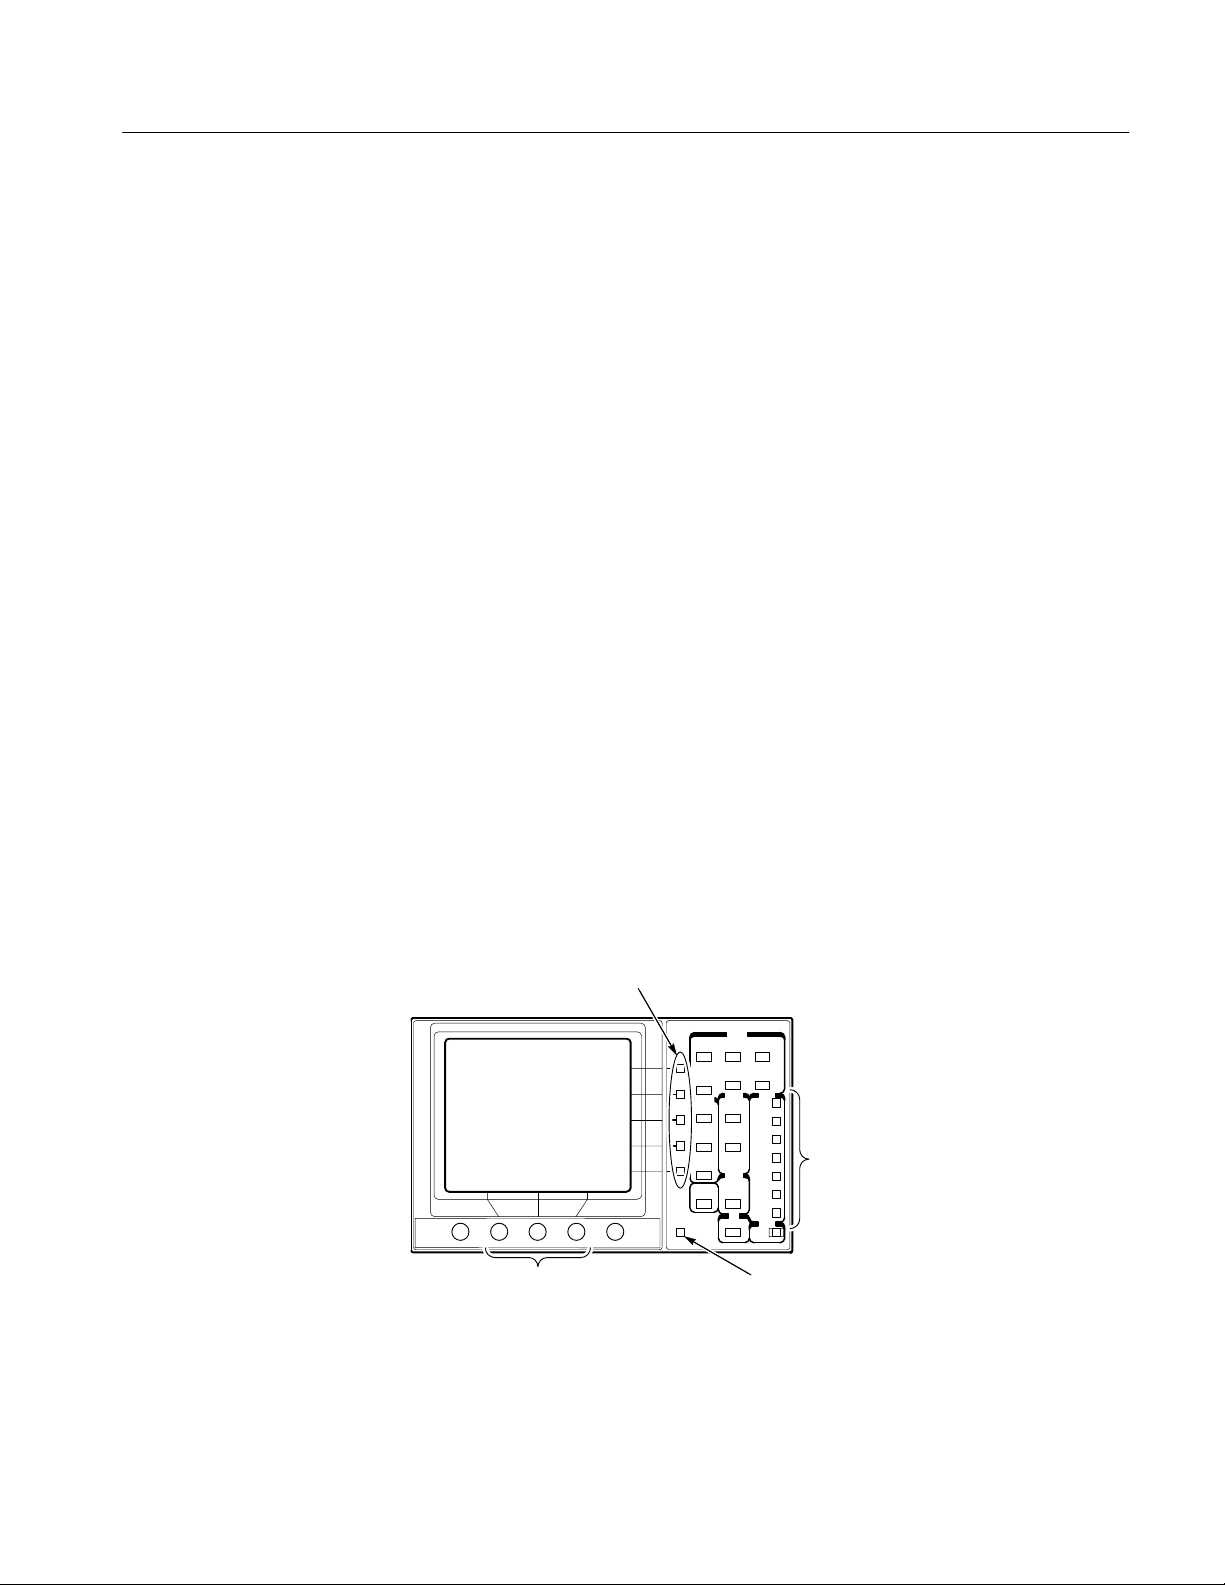
6. Check the display brightness controls.
a. Press the CRT MENU button. The display controls should appear as
shown in Figure 1–12.
b. Check that you can position the waveform by adjusting the VERT and
HORIZ POS bezel knobs. Leave the signal horizontally centered and
with the waveform bottom on the 0 V line.
@ 525/2:1
FOCUS SCALE INTENSITY
10S/DIV
DISPLAY
READOUT
TRACE
RD TEST
ON OFF
Figure 1–12: Channel 1 of a color bar signal with CRT adjustments visible
c. Use the bezel knobs under the CRT to adjust the focus, brightness of the
graticule scale, and intensity of the trace. Adjust the display controls to
the desired viewing levels.
d. Press the top bezel button to select READOUT. Adjust the readout
intensity to the desired level.
e. Exit the CRT menu by pressing the CRT button. The changes made while
the menu was displayed remain in effect.
WFM 601A, WFM 601E & WFM 601M User Manual
1–19
Page 38

Functional Check
7. Check the Eye Display mode. (WFM 601E and WFM 601M only)
a. Press the EYE/JITTER button to select the Eye display mode. The
indicator next to EYE should light.
b. Check that the waveform is triggered to produce an Eye display like that
in Figure 1–13. The degree of noise on the Eye waveform is determined
by the video generator and connecting cables.
c. Press the lower bezel button to change from FLAT mode to EYE EQ
mode. You should hear the click of a relay and the display will change
slightly as the equalization circuit modifies the waveform.
d. Press the bezel button again to return to the FLAT mode.
100mV/DIV
OVERLAY
Figure 1–13: Eye Pattern display mode
1nS/DIV
EYE
EQ EYE
1–20
8. Check the Jitter display mode. (WFM 601M only)
a. Press the EYE/JITTER button to select the Jitter display mode. The
indicator next to JITTER should light.
b. The Jitter display should resemble that shown in Figure 1–14. Your jitter
readout values may differ from those in Figure 1–14. Jitter values are
affected by the quality of the signal source and connecting cables.
WFM 601A, WFM 601E & WFM 601M User Manual
Page 39

Functional Check
1 UI/DIV
JITTER (P-P)
TIMING
0.10UI
Figure 1–14: Jitter display mode
10S/DIV
10HZ
10HZ HPF
0.10UI
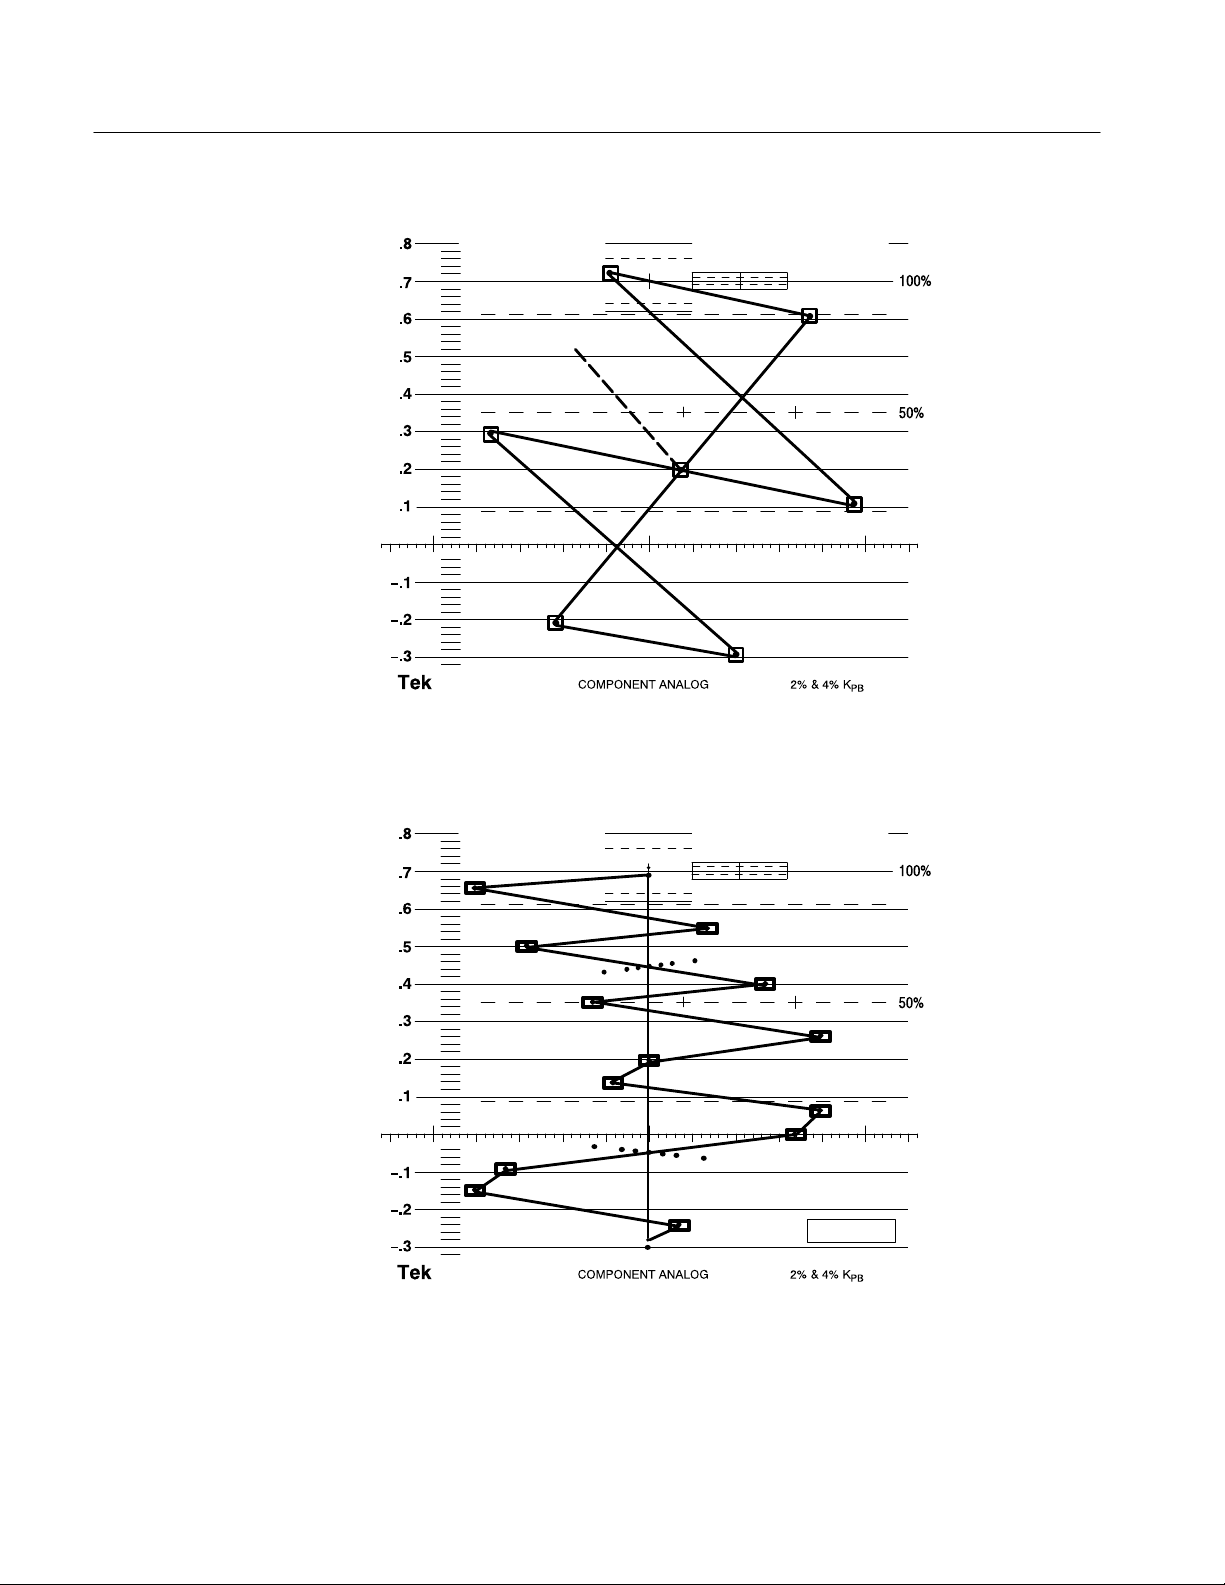
9. Check the Vector display modes.
a. Press the VECTOR/GAMUT button to select the Vector mode. The
indicator next to VECTOR should light.
b. Check that the display looks like the Vector display pictured in Fig-
ure 1–15.
c. If the display does not appear as illustrated, ensure that the generator is
set to output a 100% Color Bar signal.
d. Press the bezel button labeled VECTOR/LIGHTNING to select the
Lightning display.
e. Check that the display looks like the Lightning display pictured in
Figure 1–16.
WFM 601A, WFM 601E & WFM 601M User Manual
1–21
Page 40
Functional Check
@ 525/2:1
100% BARS
I
Figure 1–15: Vector display for a 100% Color Bar signal
10S/DIV
@ 525/2:1
Y
L
G
R
B
G
C
C
M
B
R
M
Y
L
VECTOR
LIGHTNING
Figure 1–16: Lightning display for a 100% Color Bar signal
1–22
WFM 601A, WFM 601E & WFM 601M User Manual
Page 41

Functional Check
10. Check the Gamut display modes.
a. Press the VECTOR/GAMUT button to select the GAMUT display mode.
The indicator next to GAMUT should light up.
b. If the bezel button labeled DIAMOND/ARROWHEAD does not have
Arrowhead selected, press that bezel button to select ARROWHEAD.
c. Check that the display looks like the Arrowhead gamut display in
Figure 1–17.
@ 525/2:1
Y
| C |
Figure 1–17: Arrowhead gamut display
ARROWHEAD
DIAMOND
WFM 601A, WFM 601E & WFM 601M User Manual
1–23
Page 42

Functional Check
d. Press the bezel button again to select the Diamond display mode.
e. Check that the display looks like the Diamond gamut display in
Figure 1–18.
@ 525/2:1
ARROWHEAD
DIAMOND
Figure 1–18: Diamond gamut display
11. Check the Digital Waveform display modes. (WFM 601M only)
a. Press the DGTL WFM/DGTL LIST button to select the Digital
Waveform display mode. The indicator next to DGTL WFM should light
up.
b. If the bezel button labeled VIDEO/DATA does not have VIDEO
selected, press that bezel button to select VIDEO.
1–24
c. Check that the display looks like the Video digital waveform display in
Figure 1–19.
WFM 601A, WFM 601E & WFM 601M User Manual
Page 43

Functional Check
@ 525/2:1
F1: 50
SMP 271
SMP 271
ACTIVE
ACTIVE
LINE SEL SAMPLE
Y’ 840 d
Figure 1–19: Video digital waveform
10S/DIV
VIDEO
DATA
UPDATE
FREEZE
NEXT FIELD
HEX
HEX
DECIMAL
DECIMAL
BINARY
BINARY
d. Press the bezel button again to select the DATA display mode.
e. Check that the display looks like the Data digital waveform display in
Figure 1–20.
WFM 601A, WFM 601E & WFM 601M User Manual
1–25
Page 44

Functional Check
@ 525/2:1
F1: 50
SMP 271
ACTIVE
LINE SEL SAMPLE
DATA 840 d
Figure 1–20: Data digital waveform
10S/DIV
VIDEO
DATA
UPDATE
FREEZE
NEXT FIELD
HEX
DECIMAL
BINARY
12. Check the Audio display mode. (WFM 601A only)
a. Set the function generator for a sine wave at 1 kHz and 10 Vpk-pk or less
amplitude.
b. Press the ANALOG AUDIO button. The AUDIO button indicator should
light.
c. Check that the display looks like the Audio display in Figure 1–21.
1/2
1dB
40°
20°
1–26
Figure 1–21: T ypical Audio display with small phase error
WFM 601A, WFM 601E & WFM 601M User Manual
Page 45

Operating Basics
Page 46

Page 47

Functional Overview
This section provides an overview of the front-panel features and rear-panel
connectors for the waveform monitor
Front Panel Overview
Figures 2–1 and 2–2 show the front panels of the three waveform monitors. A
brief discussion of each feature follows the illustrations. For detailed information, refer to section 3, Reference.
Figure 2–1: WFM 601M front panel
WFM 601A, WFM 601E & WFM 601M User Manual
2–1
Page 48

Functional Overview
WFM 601A front panel WFM 601E front panel
DISPLAY and VIDEO
DISPLAY Buttons
Figure 2–2: WFM 601A and WFM 601E front panels
Six buttons in the DISPLAY or VIDEO DISPLAY area control the type of
display. Most buttons represent two related types of displays. Press a button to
select one of its two displays. Press the button again to select the other. When
you select a display type, the indicator beside it lights up.
EYE. Displays the serial input signal as an Eye pattern display. For the
WFM 601M, you can choose standard or equalized Eye displays with a bezel
button.
EQ EYE . (WFM 601E only) Displays the input signal as an equalized Eye pattern
display, which is useful when the signal has been degraded by long transmission
lines.
JITTER. (WFM 601M only) Displays the peak-to-peak jitter measurement over a
specified bandwidth. The display includes the demodulated jitter waveform for
measurement.
VECTOR. Displays the component signals as either conventional Vector or
Lightning mode. Vector mode plots the chrominance signals, P
and Pr, against
b
each other to show their phase and amplitude relationships. The Lightning mode
shows amplitude and timing relationships between the luminance and chromi-
2–2
WFM 601A, WFM 601E & WFM 601M User Manual
Page 49

Functional Overview
nance signals. The top of the display plots Y against P
against P
.
r
while the bottom plots Y
b
GAMUT. Displays the video signal in Diamond or Arrowhead gamut displays.
Diamond mode evaluates RGB signals for gamut limit violations. Arrowhead
display plots Y versus chrominance magnitude to show adherence to composite
gamut limits. A gamut error message appears at the lower-left when an RGB or
Composite gamut error is detected. Turn this alarm on or off in the CONFIG
menu.
WAVEFORM. Displays the video signal as voltage versus time. Any or all of the
three channels can be displayed from a single video line.
PARADE. Displays up to three channels of the serial video signal in succession.
MULTIPLE. Allows two display modes to be active at the same time. The
Waveform or Parade can be displayed with either Vector, Lightning, or Diamond.
PICTURE. Displays the video signal source. When Line Select is on, the selected
line is highlighted to identify where it is in the video picture.
AUDIO ANALOG
(WFM 601A Only)
BOWTIE. Displays a bowtie test signal to determine timing differences between
the three component signals, Y, P
, and Pr. The external video source must
b
generate a Bowtie test signal.
DGTL WFM. (WFM 601M only) Displays the displays digital word values as a
waveform. The data values are not interpolated to generate the waveform.
DGTL LIST. (WFM 601M only) Displays the sequential data values in a list. Data
may be in linear data sequence or as groups of four values as they appear in the
multiplexed data stream: C
, Y, CR, Y’.
B
Displays the stereo analog audio input as a Lissajous pattern. The size of the
opening in the pattern is relative to the phase error between the X and Y audio
channels. The Lissajous pattern will take one of three general forms: a line, an
ellipse, or a circle.
WFM 601A, WFM 601E & WFM 601M User Manual
2–3
Page 50

Functional Overview
Bezel Knobs
Bezel Buttons
VIDEO IN
SWEEP
The center three knobs located below the CRT have multiple functions. Your
selection of DISPLAY or MENU functions or items from on-screen menus
determine the current function of each knob. A label adjacent to the knob
indicates its current function. The outside knobs are permanently assigned to
control vertical and horizontal trace position.
The five bezel buttons along the right side of the CRT have multiple functions.
Your selection of DISPLAY modes, MENU functions, or on-screen items from
the displayed menus determine the current function of each button. A label
adjacent to each button indicates its current selection. The buttons either step
through a list of two or more items or turn a function on or off.
Allows you to turn on or off CH 1 (Y/R), CH 2 (P
select the serial digital signal from input SERIAL A or B. At least one input and
one channel are always on.
The two Sweep buttons select the waveform monitor sweep rate and horizontal
magnification.
LINE / FIELD. Toggles through four sweep rates: 1-Line (5 ms/div), 2-Line
(10 ms/division), 1-Field, and 2-Field. Selections are limited in some display
modes.
/G), and CH 3 (PR/B) and to
B
SERIAL
REF (Reference)
MENU
MAG. Provides horizontal magnification of waveform signals. Use the Horizontal
Position bezel knob to move left or right on through the waveform.
Displays a status screen providing EDH error statistics and format error
reporting, including ANC data errors and line/field length errors. This area
includes two indicators.
EDH DET. Lights up when the incoming serial digital signal has the SMPTE
RP165 specified Error Detection and Handling (EDH) signal.
ALARM. Lights up when a serial video data or format error occurs or when a
serial signal is not detected.
Selects either internal serial digital or external composite video input for the
instrument synchronization reference.
Provides access to configuration and measurement functions that affect the
DISPLAY mode. Press a MENU button to display that menu and enable the
2–4
WFM 601A, WFM 601E & WFM 601M User Manual
Page 51
Functional Overview
associated functions. Press the button again to exit the menu and disable the
function.
POWER
CLEAR MENU
Using the Menus
Puts the waveform monitor into the standby or operational state.
Turns off the MENU function readouts without affecting the menu settings. Also,
provides access to alternative displays in some display modes.
The instrument has a set of front-panel selectable MENU buttons that call up
CRT readout menus. These menus operate in conjunction with the five bezel
buttons along the side of the CRT and the three knobs directly beneath it. See
Figure 2–3.
Enabled menu selections are surrounded by a rectangle to indicate that they are
active.
Pressing the CLEAR MENU button turns off the menu readout while leaving the
functions associated with the current Display mode.
Pressing a MENU button when its menu is displayed turns off both the menu
readout and, in most cases, disables the function. By selecting Line Select,
Cursor, Filter, or Gain, the last settings are returned. For example, if X5 was
active when you last used the Gain menu, returning to the Gain menu restores X5
gain.
Display menus
with their
optional selections
Bezel knobs
Figure 2–3: Elements of the waveform monitor menu controls
WFM 601A, WFM 601E & WFM 601M User Manual
Bezel buttons
Menu selection buttons
Menu clear
2–5
Page 52

Functional Overview
Rear Panel Connectors
Figure 2–4 shows the rear panel of the waveform monitor. A brief discussion of
each connector follows the illustration.
Power Connector
Power connector
The waveform monitor is designed to operate from a single-phase power source
with the neutral conductor at or near earth ground. Only the line conductor is
fused for over-current protection. A protective ground connection through the
grounding conductor in the power cord is essential for safe operation.
WARNING. Dangerous potentials are present on the Power circuit board. Do not
connect power to the waveform monitor if it is not enclosed in a prescribed
cabinet.
The waveform monitor operates from an AC line frequency of 50 and 60 Hz,
over the range of 90–250 VAC, without the need for configuration. Refer to
Appendix A: Specifications for additional information on power and environmental requirements.
Figure 2–4: Rear panel of the waveform monitor
2–6
WFM 601A, WFM 601E & WFM 601M User Manual
Page 53

Functional Overview
Loop-Through Inputs
Coaxial Outputs
There are three passive loop-through inputs located on the rear panel. All are
compensated for 75 W impedance and require proper termination at one end of
the loop-through connector or at the receiver in a monitored system.
SER A and SER B. Provides for connection of two 270 Mb serial component data
signals. These inputs have minimal impact on the monitored serial data path.
EXT REF. Provides for connection of an external synchronization signal such as
black burst or composite video.
Five rear panel connections drive signals into a 75 W environment.
MON OUT (Y/G, P
drive a component picture monitor. You can set the output format to YP
/B, PR/R). Provides three 75 W component signal outputs to
B
BPR
or
GBR. Invalid input signals cause a blinking highlight of the monitor display at
the line where the error occurs. This gamut error highlight or “bright-up” signal
is present on the Y (or G) output and is controlled in the CONFIG menu.
SERIAL OUT. Provides a reclocked version of the selected signal input (SER A or
SER B).
Multi-Pin Connectors
JITTER OUT. (WFM 601M only) Provides a 75 W output signal from the jitter
demodulator. The Jitter high-pass filter (JITTER HPF) selection does not affect
this signal. You can view the jitter waveform on the waveform monitor using the
JITTER display mode.
Two multi-pin connectors provide control using a PC or other controller. Refer to
Appendix B for pin assignment information for these connectors.
RS-232. This 9-pin subminiature D-type connector provides a serial interface for
remote control and calibration.
REMOTE. This 25-pin subminiature D-type connector provides limited remote
control functions.
WFM 601A, WFM 601E & WFM 601M User Manual
2–7
Page 54

Functional Overview
2–8
WFM 601A, WFM 601E & WFM 601M User Manual
Page 55

Reference
Page 56

Page 57
Reference
This section provides detailed information on the waveform monitor functions.
The topics are organized alphabetically. Most topics are named after the front
panel labels and button names.
Audio Display (WFM 601A Only)
The Audio display allows you to measure stereo audio phase errors of 20 kHz
analog stereo audio signals. Connect the audio signals to the Remote Connector
described in Appendix B on page B–2.
Correct phasing between two audio channels is quickly verified by the degree of
separation in the pattern shown on the display. Amplitudes are verified by the
direction of the pattern’s axis.
Audio amplitude and phase is monitored using a calibrated X/Y Lissajous
display. Using this display you can verify that the program audio will be properly
reproduced on both monaural and stereo receivers.
Lissajous Patterns
Any oscilloscope, including a vectorscope, that has identical X and Y amplifiers
can make accurate stereo audio phase measurements. When identical signals of
equal amplitude are input, the display pattern produced will be a Lissajous
pattern. The opening of the Lissajous pattern is relative to the phase error
between the signals. The remainder of this section discusses some of the
Lissajous patterns generated by the waveform monitor.
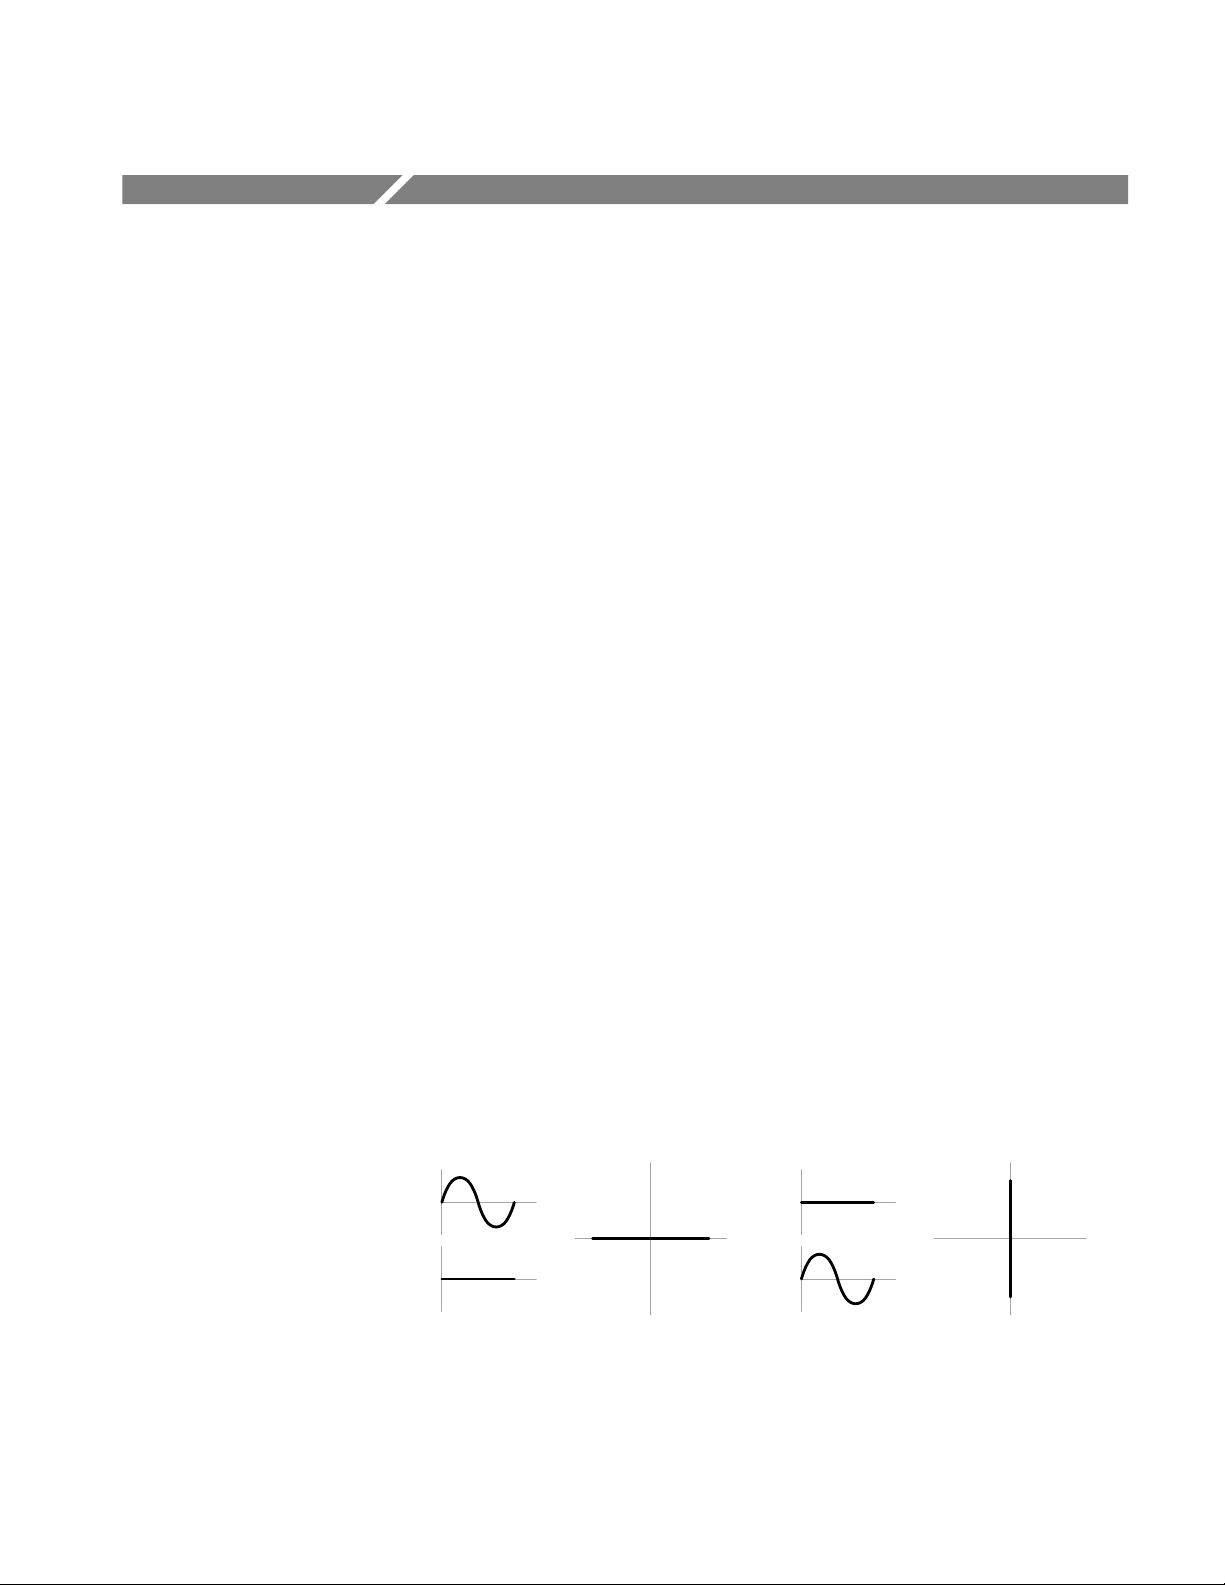
Figure 3–1 depicts an input audio signal from one channel. The figure on the left
depicts input from the X channel only, which produces a line pattern along the X
axis of an XY plot. Similarly, a line pattern along the Y axis of an XY plot
indicates an input audio signal from the Y channel only, as shown in the figure
on the right.
X
=
Y
Figure 3–1: A signal from one channel only
X
=
Y
WFM 601A, WFM 601E & WFM 601M User Manual
3–1
Page 58

Reference
Figure 3–2 depicts an input audio signal in which the X and Y channels are in
perfect phase and have equal amplitudes.
X
=
=
Y
Figure 3–2: X and Y signal in phase with equal amplitudes
Figure 3–3 depicts an input audio signal in which the X and Y channels are out
of phase by some amount but have equal amplitudes. The pattern is an ellipse
rather than an line, which indicates the signals are out of phase. The axis of the
ellipse lies terminates in the target boxes, which indicates that the amplitudes are
equal.
X
=
=
Y
Figure 3–3: Signals out of phase with equal amplitudes
3–2
WFM 601A, WFM 601E & WFM 601M User Manual
Page 59

Reference
Figure 3–4 depicts signals out of phase with unequal amplitudes. The figure on
the left shows a signal in which the X channel amplitude is greater than the Y
channel. The figure on the right depicts a signal with a larger Y channel
amplitude.
X
=
Y
Figure 3–4: Signals out of phase with unequal amplitudes
Figure 3–5 depicts an input audio signal in which the X and Y channels are
reversed (reversed polarity) with equal amplitudes.
X
==
Y
Figure 3–5: Signals with reverse polarity and equal amplitudes
X
===
Y
If the phase error between the X and Y channels is exactly 90 degrees and the
amplitudes are equal, the pattern of the audio signal input is a circle. See
Figure 3–6.
X
=
=
Y
Figure 3–6: Signals with a phase error of 90 degrees and equal amplitudes
WFM 601A, WFM 601E & WFM 601M User Manual
3–3
Page 60

Reference
Measuring Phase Error
The electronic graticule of the Analog Audio Display has scales for measuring
stereo audio phase and amplitude errors. The dashed diagonal line is the
measurement axis for errors less than 90 degrees and is terminated in amplitude
targets that correspond to the length of the X and Y axes. The boxes surrounding
the crosshairs are equal to amplitude errors of 1/2 and 1 dB, respectively.
Phase error is measured as degrees of phase shift and is relative to the minor axis
of the ellipse pattern displayed on the CRT. To determine the phase error, read the
value of the electronic graticule where the ellipse is tangent to the scale of the
electronic graticule.
1/2
1dB
40°
20°
Adjusting the Audio Gain
Figure 3–7: T ypical Audio display pattern with small phase error
The waveform monitor has four graticule calibrations available: 0, +4, +8, and
+12 dBu. To adjust these levels use the following procedure.
1. While in the Audio display mode, press the GAIN menu button.
2. Press one of the bezel buttons to select the appropriate calibration level.
3–4
WFM 601A, WFM 601E & WFM 601M User Manual
Page 61
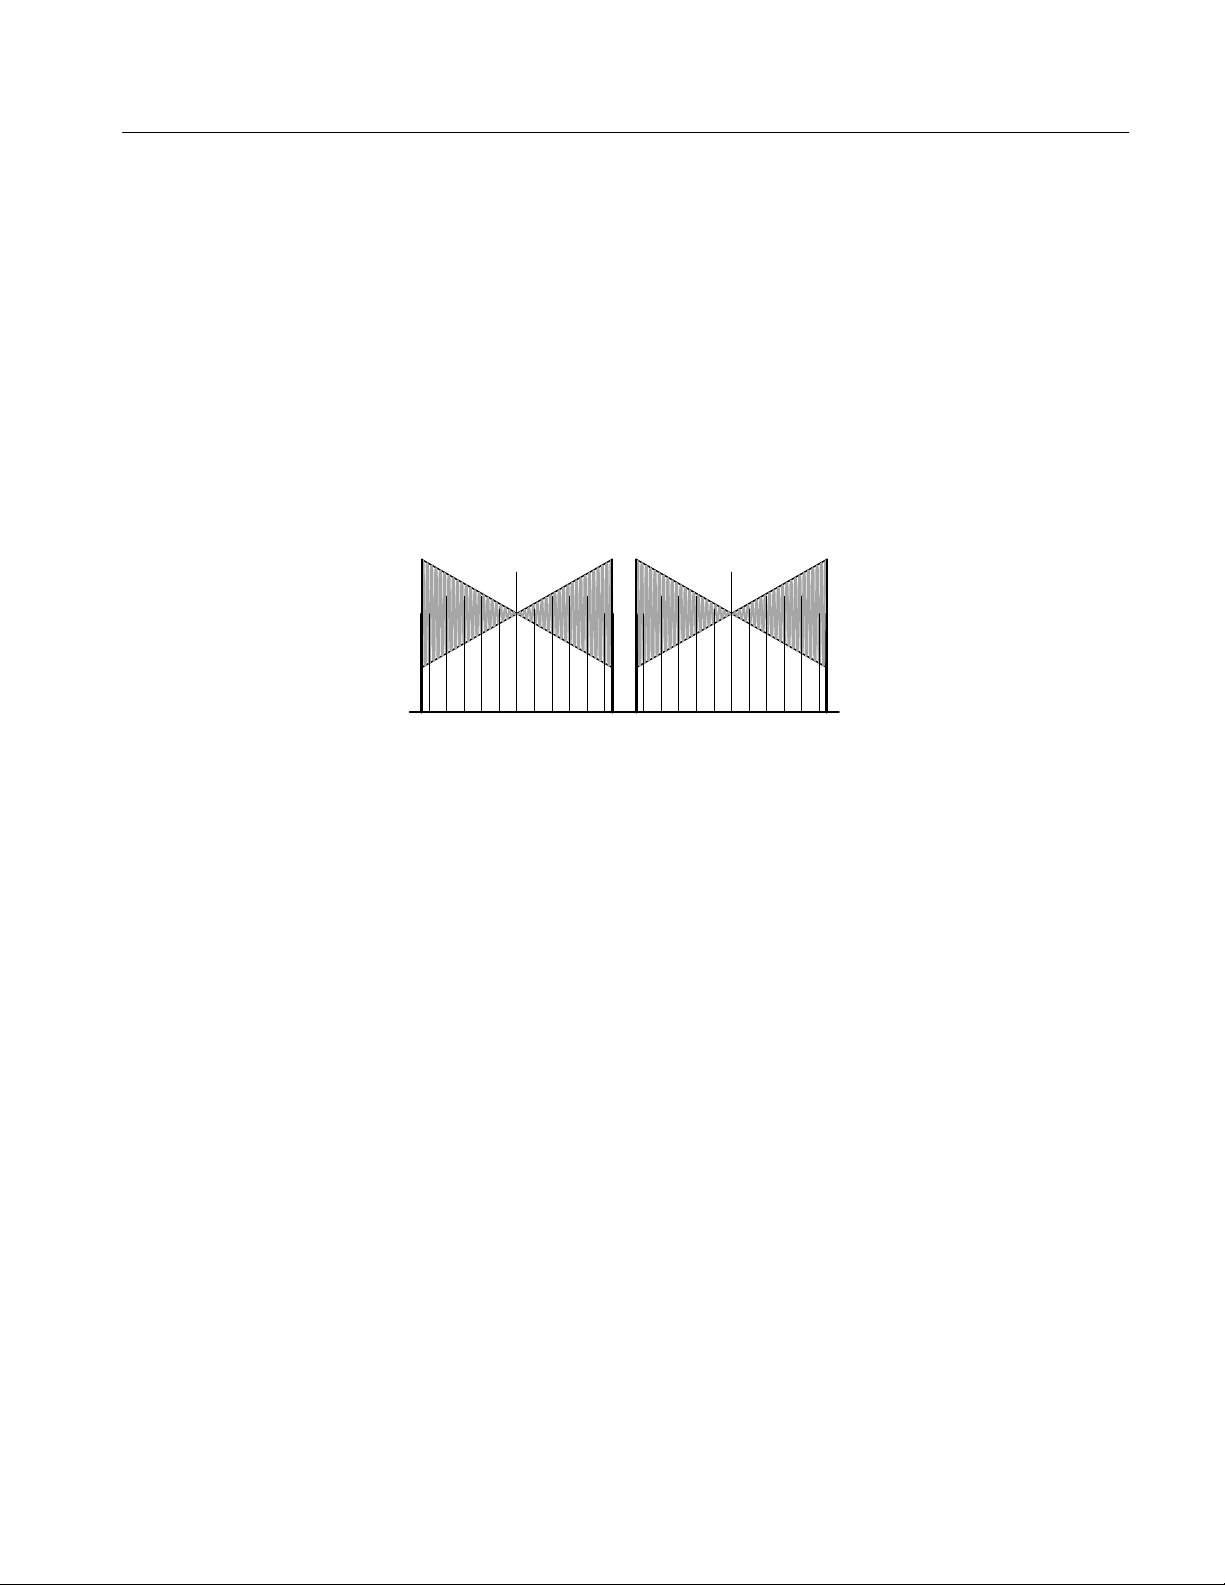
Bowtie Display
Reference
The Bowtie display evaluates the relative amplitude and timing between the three
video channels. This display requires a special test signal from the monitored
source. See Figure 3–8. The Tektronix TG 2000 Waveform Generator can
produce a bowtie signal with 20 ns time marks, which aid in signal evaluation.
The signal is a 500 kHz sinewave on CH 1 (luminance) and 502 kHz sine waves
on CH 2 (Pb) and CH 3 (Pr).
The display is made up of two separate waveforms as shown in Figure 3–8. The
left waveform always compares CH 1 to CH 2. The right waveform always
compares CH 1 to CH 3.
Figure 3–8: T ypical Bowtie display on the waveform monitor
WFM 601A, WFM 601E & WFM 601M User Manual
3–5
Page 62

Reference
Timing Measurement
The timing measurement is based on alignment of the center marker and the null
point at the center of the waveform. The generator provides a center marker,
which is centered on the null point when interchannel timing is correct. A shift of
the null to the left or right indicates a difference in the relative timing. If the null
shifts two full time markers, the relative timing error between channels would be
40 ns. If the null is to the left of the center marker, the color difference channel is
advanced relative to the luminance channel. When either of the nulls is shifted to
the right, that color difference signal is delayed relative to the luminance channel.
In Figure 3–9, the chrominance channel—CH 3 (Pr)—is advanced relative to the
luminance channel by 20 ns.
Shifted null point
Figure 3–9: Bowtie waveform showing a timing error in CH 3
Relative Gain Check
Although you can use Waveform or Lightning displays to determine channel
timing, the Bowtie method provides better resolution of channel timing and is the
easiest to use.
The bowtie measurement provides a method to determine whether the relative
channel gain is correct. If the gains are not equal, the center null point will not be
a complete null. Figure 3–10 shows a Bowtie display with an incomplete null in
the right waveform. If the gain error is in CH 1, neither waveform has a complete
null. If CH 2 gain is off, the left waveform will not null completely, but the right
one will. If the gain is off for CH 3, as in Figure 3–10, the left waveform will be
normal and the right one will not reach a complete null.
Incomplete null
Figure 3–10: Bowtie waveform showing gain error in CH 3
3–6
WFM 601A, WFM 601E & WFM 601M User Manual
Page 63

Calibration
Reference
Instrument gain may require adjustment for special monitoring applications or to
ensure the best precision for cursor or graticule signal measurements. Follow
these procedures to set the vertical and horizontal gain.
Setting Vertical Gain
Setting Horizontal Gain
1. Press the WAVEFORM/PARADE button to select the Waveform display.
2. Press the CONFIG menu button and use the bezel knob to select the
CALIBRATE submenu. Press the bezel buttons to set CAL SIG on and
GAIN CAL on
3. Use the VERT POS control to place the calibrator signal between the 0 V
reference and 0.7 graticule lines. The amplitude of the calibration signal is
exactly 700 mV.
4. If the RESET V CAL readout is on, press the adjacent bezel button to turn it
off. Pressing the RESET V CAL bezel button reinstates the gain setting
established at the last calibration.
5. Check to see that the calibrator signal is now displayed at exactly 700 mV. If
the gain is off, adjust the gain for exactly 700 mV with the V CAL bezel
knob. Press the GAIN CAL button if the V CAL knob is not available.
1. Press the Waveform/PARADE button to select the Waveform display.
2. Press the CONFIG menu button and use the bezel knob to select the
CALIBRATE submenu. Press the bezel buttons to set CAL SIG on and
GAIN CAL on
.
.
3. If the RESET H CAL readout is on, press the adjacent bezel button to turn it
off. Pressing the RESET H CAL bezel button reinstates the gain setting
established at the last calibration.
4. Press the SWEEP LINE/FIELD button to select the 2 Line sweep mode
(10 ms/div) and check for one full cycle per major division.
5. If the gain is off slightly, adjust the horizontal gain with the H CAL bezel
knob. If the H CAL knob is not available, press the GAIN CAL button.
WFM 601A, WFM 601E & WFM 601M User Manual
3–7
Page 64

Reference
Configure Menus
The Configure menu provides configuration selections for all display modes and
some external signals. Press the CONFIG MENU button at any time to enter the
Configure menu. Figure 3–11 shows a sample Configure menu and the bezel
knob used to select from the list of Configure menus. Figure 3–12 provides a
map of all Configure menu functions.
COLOR BARS
75% 100%
WFM/VEC
GAMUT
EYE PATTERN
JITTER
SER ALARM
FORMAT
CALIBRATE
WFM AS
RGB YPBPR
PBPR OFFSET
0 mV
350 mV
EAV-SAV
PASS STRIP
Figure 3–11: Configure menu for WFM/VEC showing the selection knob
Turning the knob causes a selection box to scroll through the menu list. The
selections assigned to the bezel buttons change as you scroll through the list of
Configure menus. Press the CONFIG button again to remove the Configure
menu.
3–8
WFM 601A, WFM 601E & WFM 601M User Manual
Page 65

Reference
WFM/VEC
GAMUT
EYE PATTERN (WFM 601E and WFM 601M only)
JITTER (WFM 601M only)
SER ALARM
FORMAT
CALIBRATE
MISSING VID
OFF ALARM
FULL FIELD
CRC ERROR
OFF ALARM
ACTIVE PIC
CRC ERROR
OFF ALARM
FMT ERROR
OFF ALARM
CAL SIG
ON OFF
GAIN CAL
ON OFF
JITTER HPF
10 Hz
1kHz
10kHz
100kHz
READOUT
UI
SEC
OFF
MON OUT AS
GBR YPBPR
STANDARD
525/2:1
625/2:1
AUTO
SYNC
DIRECT
AFC
Figure 3–12: Map of functions available in the Configure menu
MODE
OVERLAY
10 EYE
CLOCK BW
10 Hz
100 Hz
1 kHz
GAMUT CHECK
OFF CMPST
RGB BOTH
ALARM DISP
SCREEN
PIX MON
BOTH
GAMUT (IRE)
100 110
120 131
LIMIT
FORMAT
NTSC
PAL
AUTO
COLOR BARS
75% 100%
WFM AS
RGB YPBPR
PBPR OFFSET
0 mV
350 mV
EAV -SAV
PASS STRIP
Configure Menu
Description
The following list describes the items in each Configure menu.
WFM/VEC. Contains choices for the Waveform, Parade, Vector, and Lightning
video displays.
COLOR BARS. Selects either 75% or 100% graticules for the Lightning and
Vector modes.
WFM AS. In Waveform or Parade modes, determines if channels 1, 2, and 3
are displayed in their native Y, P
, Pr format (YPbPr) or transcoded to R, G,
b
B (RGB). WFM AS does not affect the picture monitor output signal (MON
OUT).
PBPR OFFSET. Allows adding a 350 mV positive offset to the P
and P
b
r
channels to facilitate comparison with the Y channel. Does not affect the
transcoded RGB display or the picture monitor out signal.
EAV-SAV. Determines what data is passed to the D/A converters. In Strip
mode, only digital signals between the SAV and EAV (start and end of active
region) sync words are passed to the D/A converters and subsequently to the
display and the picture monitor output. In Pass mode all digital data is sent to
the converters.
WFM 601A, WFM 601E & WFM 601M User Manual
3–9
Page 66

Reference
GAMUT. Configures conditions and error indicators for the gamut error alarm.
GAMUT CHECK. Determines whether RGB, Composite (CMPST), or both
types of gamut errors trigger the gamut alarm. RGB indicates when the R, G,
or B signals are less than 0 mV or greater than 700 mV. CMPST indicates
when the sum of luminance and peak chrominance exceed the level selected
with GAMUT (IRE). Use ALARM DISP to determine the indicator of the
gamut alarm.
ALARM DISP. Determines how the gamut alarm is indicated. In SCREEN
mode, a gamut error message appears in the lower left of the CRT. In PIX
MON mode, the portion of the video picture that exceeds gamut, blinks in a
highlighted or bright-up mode on the picture monitor output.
GAMUT. Sets the level used for the CMPST gamut alarm. For NTSC, the
levels are 100, 110, 120 and 131 IRE. For PAL, the levels are 700 mV and
950 mV. Use GAMUT CHECK to pick the CMPST alarm.
LIMIT FORMAT. Determines if the gamut limit check is for PAL or NTSC
format signals. AUTO mode automatically determines the input format.
EYE P ATTERN. Selects the display mode and attenuation of low-frequency jitter
for the EYE and EQ EYE display modes.
MODE. Selects between OVERLAY and 10-EYE trigger modes. Overlay
displays all bits of a serial word at each eye location. The 10-EYE mode
displays all ten bits of the serial signal at ten fixed locations.
CLOCK BW. Selects between 10 Hz, 100 Hz, and 1 kHz filters to suppress
low-frequency jitter.
JITTER. Configures the Jitter measurement with a high pass filter and the units of
the readout.
JITTER HPF. Selects from high pass filters 10 Hz, 1 kHz, 10 kHz, and
100 kHz. The selection appears in the jitter readout box and in the upper
right corner of the CRT, just below the horizontal deflection factor.
READOUT. Determines whether the jitter measurement is in the units UI
(unit intervals) or seconds or if the readout is off.
3–10
WFM 601A, WFM 601E & WFM 601M User Manual
Page 67

Reference
SER ALARM. Selects which events cause the Alarm indicator to light. The
front-panel Alarm light can be activated by up to four different serial video
conditions. Press the adjacent bezel buttons to turn these alarms on or off.
When an alarm condition occurs, the Alarm light stays on for a minimum of one
second. If selected alarm conditions occur at a frequency greater than once per
second, the Alarm light stays on continuously.
When any of the following conditions are enabled and a condition occurs, the
alarm indicator turns on:
MISSING VID. The input serial signal level drops below a preset threshold
(determined by the serial receiver).
FULL FIELD CRC ERROR. The transmitted cyclical redundancy checksum
(CRC) does not match the actual CRC for the last video field.
ACTIVE PIC CRC ERROR. The transmitted CRC does not match the actual
CRC for the last active picture region.
FMT ERROR. A serial format error occurs.
FORMAT. Selects the format of the picture monitor out signal and the scanning
standard expected by the waveform monitor.
MON OUT AS. Configures the analog component picture monitor out signal
as either Y, P
, Pr, (YPbPr) or as GBR. Composite sync is added to the Y or
b
G channel.
STANDARD. Selects the scanning standard, from either 525/2:1 or 625/2:1,
that the waveform monitor expects at the SER A and B inputs. This choice
affects the monitor sweep rates and the line selector. In AUTO mode, the
monitor selects either 525 or 625 line operation based on the detected field
rate (60 Hz or 50 Hz).
SYNC. Selects either Direct or AFC synchronization of the internal timing.
The Direct mode uses the 27 MHz word clock as extracted from the serial
digital signal. This mode passes any signal jitter on to other internal
operations and to the MON OUT video signals. The AFC mode uses a
phase-locked loop circuit to produce a stable clock. The phase-locked loop
averages small-phase differences in the clock. The AFC mode is best in most
situations. Use the Direct mode when large, low-frequency jitter is present in
your system.
WFM 601A, WFM 601E & WFM 601M User Manual
3–11
Page 68

Reference
CALIBRATE. Allows minor adjustment to the vertical and horizontal gain
calibration prior to making amplitude measurements. To adjust gain, you need a
700 mV, 100 kHz signal. Use a known external reference signal or the internal
calibrator signal. Selections for the CALIBRATE menu are only present when in
the Waveform or Parade display modes.
CAL SIG. Turns on or off the internal 700 mV calibrator signal. The
calibrator signal is synchronized in order to provide an accurate 100 kHz
timing standard. If the calibrator signal varies significantly from 700 mV
when RESET V CAL is not visible, then the waveform monitor may require
calibration.
GAIN CAL. Enables or disables the V CAL and H CAL controls. The
V CAL knob adjusts vertical gain and the H CAL knob adjusts the horizontal
gain. To return the gain to its original calibrated setting, press the RE-
SET V CAL or H CAL bezel buttons.
In addition, the following software version information appears:
Software Version Number. The lower right corner of the CRT shows the
version number for the instrument software preceded by a “V”.
CRT Settings
How to Recover from
Minimal Readout Intensity
Coprocessor Code Version. The lower right corner of the CRT shows the
version number of the serial coprocessor code preceded by a “C”.
The CRT menu provides control of trace parameters and readout intensity. To
access the CRT menu at any time, press the MENU CRT button. Press the top
bezel button to access the Display, Readout and Trace controls. Use the assigned
bezel knobs to adjust the display. You can control the following functions from
the CR T menu:
Focus. Sets the sharpness of the waveform trace.
Scale. Sets the intensity of the side lights that illuminate the etched graticule.
Intensity. Sets the trace intensity or brightness separately from the readout.
Readout Intensity. Sets the readout intensity or brightness.
Trace Rotation. Adjusts the rotation of the trace.
Readout intensity can be turned below the minimum viewing level, which makes
all CRT menus disappear. If this happens, press the CRT menu button and note
that the menu comes up at a reduced intensity. Pressing the top CRT bezel button
once moves the cursor to READOUT and reduces the intensity again. At this
3–12
WFM 601A, WFM 601E & WFM 601M User Manual
Page 69

Cursors
Reference
point, turn the bezel knob next to the HORIZ POS knob clockwise to increase the
readout intensity.
Press the CRT button to exit the CRT menu.
Cursors allow you to measure the amplitude or time difference between
waveform features. Cursors usually provide better measurement resolution than
is possible measuring against the etched graticule. Press the CURSOR MENU
button to display the Cursor menu.
Cursor Menu Features
The Cursor menu allows you to choose Voltage Cursors, Time Cursors, Markers,
or both Voltage and Time cursors. When Voltage and Time cursors are active, the
three bezel knobs control cursor 1, cursor 2, and cursor tracking. The difference
in the settings of cursor 1 and cursor 2, is reported with CRT readout as DV or
DT. In the Both mode (V+T), use the CONTROL bezel button to alternate
between voltage and time cursor control. Tracking locks the cursors at their
current separation and lets you move them together.
Markers provide adjustable screen reference points with no associated readout.
Markers may be positioned vertically, but not horizontally. The three markers are
identified by the type of dashed lines:
Mark 1 has long dashes.
Mark 2 has double dashes.
Mark 3 has short dashes.
Pressing the CLEAR MENU button removes the cursor selections, but the
cursors, difference readout (voltage or time), and control assignments remain
active and on screen. To restore the Cursor menu, press the CURSOR menu
button again. To turn off the cursors, press the CURSOR button when the Cursor
menu is displayed (two presses when the Cursor menu is not displayed).
Variable Gain and Sweep
with Cursors
WFM 601A, WFM 601E & WFM 601M User Manual
The Cursors are tied to the trace scaling. Hence, cursor measurements are
accurate with Gain set to X5, X10, or Variable Gain.
The various sweep modes are compatible with the Time Cursors. You can make
Time Cursor measurements in any of the Sweep modes: 1-Line, 2-Line, 1-Field,
or 2-Field. You may need to brighten the cursors and the trace by pressing the
CRT MENU button and adjusting the intensity.
Time Cursors measurements are possible with MAG on, though both cursors may
be off screen. The measurements are accurate, even though you cannot see the
3–13
Page 70

Reference
Time Cursors. Use the HORIZ POS knob to pan left or right to the cursor
locations.
Digital List (WFM 601M Only)
The Digital List display lists the data values in sequence as they occur in the
digital component video signal. Press the DGTL WFM/DGTL LIST button to
enter the Digital List mode. Figure 3–13 shows an example of the Digital List
display. You can use the data cursor, assigned to a bezel knob, to scroll through
the data. The location of the data cursor in the Digital List display is correlated
with the data cursor in the Digital Waveform and Parade display modes.
Video/Data Selection
The Video/Data bezel button chooses between two displays. Figure 3–13 shows
the DATA mode. Figure 3–14 shows the VIDEO mode with the same data values
as those in Figure 3–13. The VIDEO mode groups the samples in the order in
which they occur in the data stream, C
Y’. The label above the grouped list
bYCr
indicates this order.
@ 525/2:1
DATA
F1: 80
SMP1160
ACTIVE
2FE h
30D h
2FE h
30D h
2FE h
30D h
2FE h
324 h
2FD h
324 h
312 h
374 h
364 h
374 h
3A6 h
VIDEO
DATA
UPDATE
FREEZE
NEXT FIELD
HEX
DECIMAL
BINARY
3–14
LINE SEL SAMPLE
Figure 3–13: Example of the Digital List display
WFM 601A, WFM 601E & WFM 601M User Manual
Page 71

Reference
Data Format
Press the fourth bezel button to select the base used for displayed data from
hexadecimal (h), decimal (d), or binary (b). The characters (h, d, or b) following
the data indicates its base.
@ 525/2:1
Cb Y Cr Y’
F1: 80
SMP1160
ACTIVE
2FE h
30D h
2FE h
30D h
2FE h
30D h
2FE h
324 h
2FD h
324 h
312 h
374 h
364 h
374 h
3A6 h
VIDEO
DATA
UPDATE
FREEZE
NEXT FIELD
HEX
DECIMAL
BINARY
Freeze/Update
Line Select Settings
LINE SEL SAMPLE
Figure 3–14: Data List display mode in the Video mode
Press the second bezel button to select between active, video data and frozen
data. Frozen data is not updated with current values from the video data stream.
The Freeze mode stores six lines with three lines from each field. Use the Next
Field bezel button to switch between fields.
In the Digital List display, Line Select is set to Sample by default. Use the bezel
knobs labeled LINE and SAMPLE to select video lines and samples within a
line. The current field and line appear at the upper left on the CRT. Use the Next
Field bezel button to alternate between fields in a frame. The Sample knob
scrolls to the end of the line then returns to the beginning of the line.
WFM 601A, WFM 601E & WFM 601M User Manual
3–15
Page 72

Reference
Digital Waveform (WFM 601M Only)
The Digital Waveform display shows the component data samples as a waveform. Press the DGTL WFM/DGTL LIST button to enter the Digital Waveform
mode. Figure 3–15 shows an example of the Digital Waveform display. You can
use the data cursor, assigned to a bezel knob, to scroll through the data waveform. The data cursor remains centered while the data scrolls by. The location of
the data cursor on the Digital Waveform display is correlated with the data cursor
in the Digital List Display and with the sample select indicator or “blivit” in the
Waveform and Parade Displays. For more information on the data cursor, refer to
Line Select on page 3–39. The value of the current sample on each waveform
appears above the waveform. The character (h, d, or b) following the value
indicates its base.
@ 525/2:1
F1: 80
SMP1163
ACTIVE
->Y’ 786 d
Video/Data Selection
Cb 804 d
Cr 804 d
LINE SEL SAMPLE
Figure 3–15: Digital Waveform display in the VIDEO mode
Use the VIDEO/DATA bezel button to select the format of the digital waveform.
Figure 3–15 shows the VIDEO mode and Figure 3–16 shows the DATA mode.
Note the DATA label at the top of the data cursor in Figure 3–16.
The VIDEO mode displays the three video component channels, YC
bCr
, as
separate waveforms. Any or all of the three channels may be displayed at one
time. The channels are correctly time aligned so the data cursor shows the current
sample values for each. Note that Y and Y’ samples are interleaved to create the
CH 1 waveform. As you move the data cursor through the CH 1 data, the label
3–16
WFM 601A, WFM 601E & WFM 601M User Manual
Page 73

Reference
will switch between Y and Y’. The symbol “–>” indicates the currently selected
sample. The offset or broken data cursor seen in Figure 3–15 indicates that the Y’
sample is selected and it is not aligned (nonco-sited) with the C
The Y sample is aligned or co-sited with C
and Cr channels and its data cursor
b
and Cr channels.
b
appears in line. Use the Video mode when selecting samples in the active picture
area.
The DATA mode displays the samples in sequence as they are received
(Cb,Y,Cr,Y’). Use the Data mode to view sync words (EAV and SAV) and
ancillary data.
Output Monitor Signals
The data cursor creates intersecting horizontal and vertical highlighted (or bright
up) lines on the analog video output to indicate where in the video signal the data
cursor is located. When you move the data cursor to the end of a line, the output
picture shifts to show you the horizontal sync region. Likewise, when you move
to the beginning or end of a frame, the vertical sync region shifts to the center of
the screen. As you scroll through line samples, watch the location of the
highlighted line on the output monitor. By doing so, you can correlate changes in
the video signal with changes in the digital data values. To use the cross-hair
cursor in the horizontal and vertical blanking regions, set EAV–SAV to PASS in
the Configure WFM/VEC menu.
@ 525/2:1
F1: 176
SMP 543
ACTIVE
DATA 274 h
10S/DIV
LINE SEL SAMPLE
Figure 3–16: Digital Waveform display in DATA mode
WFM 601A, WFM 601E & WFM 601M User Manual
3–17
Page 74
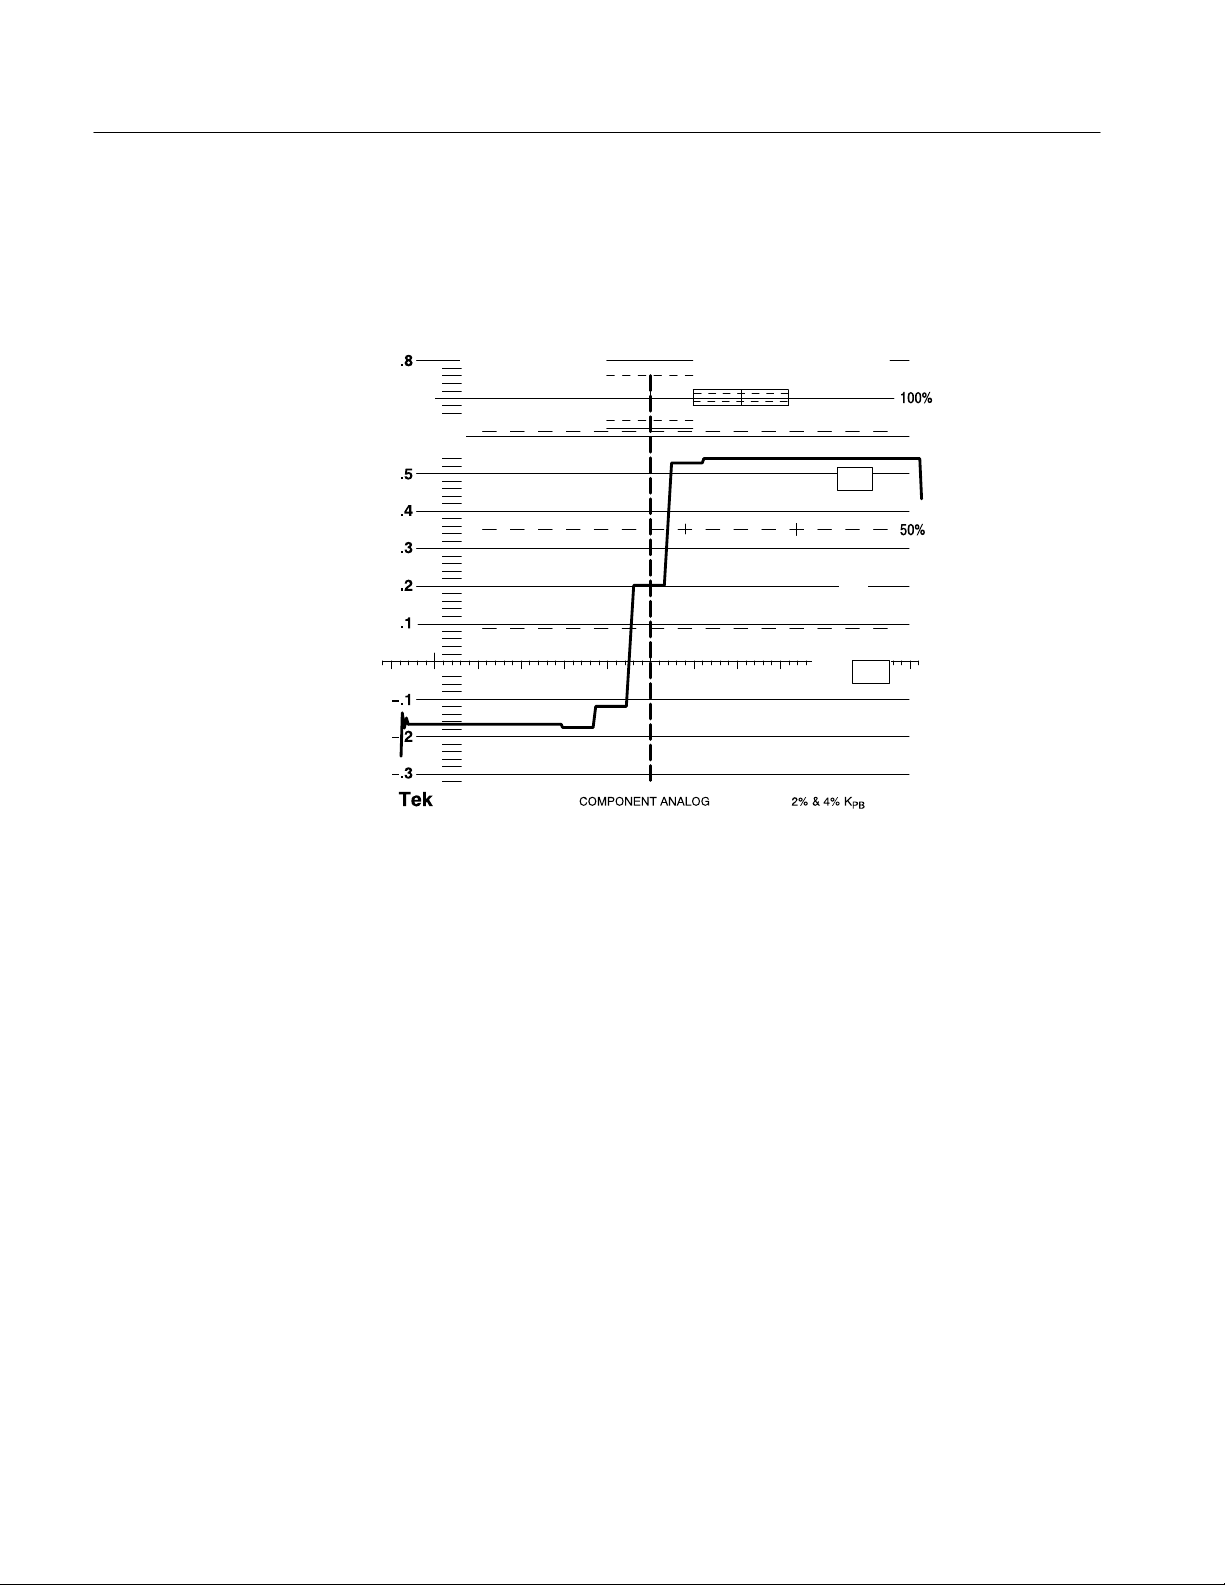
Reference
Gain Interactions
Use the GAIN MENU function to magnify the vertical gain of a single channel
by X5 or X10. Figure 3–17 shows CH 1 with X5 gain. Note the data cursor
readout is for the “Y” channel with a value of 868 decimal.
@ 525/2:1
F1: 80
SMP1165
SMP 271
ACTIVE
ACTIVE
Y 868 d
X1
X5
X10
VARIABLE
ON OFF
Line Select Settings
LINE SEL SAMPLE
Figure 3–17: Digital Waveform display showing X5 gain on CH 1 (Y) waveform
Choosing the Digital Waveform display forces Line Select to the Sample mode.
Line Select in the Sample mode assigns two bezel knobs to select video lines and
samples within a line. The current field and line readout appear at the upper left
on the CRT. Press the Next Field bezel button to alternate between fields in a
frame. The Sample knob scrolls to the end of the line then returns to the
beginning of the line.
3–18
WFM 601A, WFM 601E & WFM 601M User Manual
Page 75

Eye Display (WFM 601E and WFM 601M Only)
The Eye pattern display presents a voltage-versus-time waveform composed of
multiple sweeps of the serial bit stream. You can measure the amplitude, rise
time, aberrations, and jitter of the serial signal using the Eye pattern display.
Select either the Serial A or B input for display and measurement. You can also
choose to display the raw signal data (FLAT) or perform receiver equalization
(EQ EYE) on the signal before display.
Use the cursors to measure parameters of the Eye display. Refer to page 3–22 for
instructions on using the cursors to measure the Eye display.
Reference
EYE and EQ EYE Modes
The EYE and EYE EQ modes allow measurement in short and long transmission
line environments, respectively.
On the WFM 601E, press the EYE/EQ EYE button to select the EYE or EQ EYE
modes.
On the WFM 601M, press EYE/JITTER button to select the EYE mode. Press
the lower bezel button to alternate between the EYE and EQ EYE modes. If the
EYE/EQ EYE selection is not visible when the EYE display is active, press the
CLEAR MENU button.
The EYE mode directly displays the serial signal applied to the rear panel
loop-through input. This mode is best for directly monitoring a serial digital
source or a short length of cable. When monitoring a signal near the end of a long
cable run, the EYE mode might show what appears to be a band of noise. Use the
EQ EYE mode to restore the signal shape and amplitude before display.
The EQ EYE mode is best used to measure signals degraded by transmission
through a long cable. The EQ EYE mode applies receiver equalization to the
serial signal to restore it. Because equalization enhances the signal and causes
signal peaking, it is best used to check signal continuity. You should regard EQ
EYE display measurements as uncalibrated and merely qualitative.
For the best measurements, use the EYE mode whenever possible. Use EQ EYE
when the EYE mode fails to provide a useful signal.
Clock BW Filters
WFM 601A, WFM 601E & WFM 601M User Manual
Both EYE pattern displays can attenuate low frequency jitter using one of three
clock-recovery filters. Select from the 10 Hz, 100 Hz, and 1 kHz filters. Use
these Clock BW filters to separate the medium and high frequency jitter from
low frequency jitter. The filter frequencies indicate the –3 dB point. To access the
filters, press the CONFIG button and select the EYE PATTERN menu. The
10 Hz and 1 KHz filters allow jitter measurements according to the SMPTE
RP-184 standard.
The selected clock bandwidth filter appears in a readout field directly below the
horizontal deflection factor.
3–19
Page 76

Reference
Trigger Modes
Two trigger or sweep modes are available with the Eye display: OVERLAY and
10-EYE.
OVERLAY. In OVERLAY mode, all bits of a serial word are overlaid at each eye
location. Because numerous transitions for the data bits are overlaid, each eye
crossing shows the timing jitter in the video system. Figure 3–18 shows the
Overlay Eye display. Approximately three eyes are displayed and the horizontal
scale is 1 ns/div.
100 mV/DIV
OVERLAY
1 nS/DIV
10 Hz
Figure 3–18: Overlay Eye display
3–20
WFM 601A, WFM 601E & WFM 601M User Manual
Page 77

Reference
10 EYE. In 10-EYE mode, every tenth bit of the serial signal appears at a fixed
location on the display. Figure 3–19 shows the 10-EYE mode. Approximately
10 eyes are displayed per horizontal sweep, and the horizontal scale is 3 ns/div.
In the 10-Eye more, you can observe events that are correlated with the serial
word rate or horizontal line rate. In this mode, you can also observe systematic
errors that affect certain bits in the data word.
100 mV/DIV
10–EYE
3 nS/DIV
10 Hz
Figure 3–19: 10-EYE triggered display
To select the trigger mode, press the CONFIG button and use the bezel knob to
select the EYE PATTERN menu. Press the DISPLAY bezel button to select
OVERLAY or 10 EYE. The trigger mode is indicated by a readout in the upper
left corner of the CRT. The trigger modes are available with both EYE and EYE
EQ displays.
Gain
The calibrated vertical gain for the EYE and EQ EYE modes is 100 mV/div. You
can expand the vertical scale by selecting X5, X10, or Variable gain. The vertical
scale is displayed in the upper left corner of the CRT screen. Press the GAIN
button to access the X5, X10, and Variable Gain gain selections. When Variable
Gain is enabled, a “>” appears in front of the deflection factor to indicate the
uncalibrated condition.
WFM 601A, WFM 601E & WFM 601M User Manual
3–21
Page 78

Reference
Eye Pattern
Measurements
This section describes how to measure parameters of the Eye pattern to verify
standard signal specifications for serial digital transmission. The measurements
discussed here are amplitude, aberrations, rise time, and jitter. Figure 3–20
illustrates the initial equipment connections.
Waveform Monitor
(rear panel)
75 terminator
SER A
Loop-through input
Serial source
Output
Figure 3–20: Connections for measuring a serial source
Setup for Measurements. Perform the following steps in preparation for the Eye
pattern measurements. Figure 3–20 illustrates the equipment connections.
1. Connect the serial source to the monitor with a 75 W cable two meters or less
in length. Use high quality, low loss coaxial cable, such as Belden 8281.
2. Connect a 75 W terminator with at least 25 dB return loss to 300 MHz on the
other end of the loop-through input.
3. Set the serial source to output a 100% Color Bar signal.
4. Press the EYE/JITTER button to select the Eye Pattern display.
5. Press the GAIN MENU button and select 1X vertical gain.
6. Adjust the vertical position so the bottom of the waveform rests on the –.1 V
line.
Measuring Amplitude. Measuring the signal amplitude can help you determine if
the signal amplitude is too low due to cable losses or other system problems. This
procedure shows you how to measure the signal amplitude using both the
graticule and the Voltage Cursors. To measure the signal amplitude, follow these
steps:
1. Perform the initial settings for Eye measurements described on page 3–22.
2. Select the desired input channel (SER A or B).
3–22
WFM 601A, WFM 601E & WFM 601M User Manual
Page 79

Reference
3. Use either the OVERLAY or 10-EYE display mode. Press the CONFIG
MENU button and select the EYE PATTERN menu to choose OVERLAY or
10-EYE.
4. Set CLOCK BW, in the Config EYE menu, to 1kHZ in order to reduce the
effects of time jitter, which can obscure the amplitude measurement.
5. For graticule measurement, select X1 vertical gain and make sure that
variable gain is off. At X1 gain, the scale is 100 mV/div.
6. Use the VERT POS knob to position the waveform bottom at the 0 V line. If
the waveform exceeds 800 mV, position its bottom at the –.1, –.2, or –.3 V
line. Measure the amplitude at a horizontal part of the waveform top line.
7. Enable the Voltage Cursors.
8. Position one cursor at the top horizontal part of the waveform; ignore any
overshoot on the rising edge.
9. Position the second cursor at the bottom of the waveform; ignore any
undershoot. The Voltage Cursor readout gives the signal amplitude.
10. For Cursor measurements, you can use any gain setting, including variable
gain, since the waveform and the cursors are equally affected by the gain
setting. Use higher gain settings, such as X5, to help match the cursor to the
waveform.
Signal sources should measure 800 mV
10%. Signal amplitudes outside this
p-p
range can degrade receiver performance.
Measuring Aberrations. Serial sources should produce good signal transitions with
a minimum of overshoot and ringing. Automatic equalizer circuits in receivers
may be sensitive to aberrations greater than 10%.
To measure aberrations, perform the following steps:
1. Perform the initial settings for Eye measurements described on page 3–22.
2. Enable the Voltage Cursors.
3. Place one cursor at the peak of the overshoot and the other at the bottom of
the topline of the waveform. Include any ringing (the oscillation following
overshoot) in the measurement. Essentially, you are measuring the thickness
of the top line of the waveform.
4. Perform the same cursor measurement on the bottom line thickness,
including any undershoot and ringing.
5. Aberrations at the top or bottom line should not exceed 10% of the signal
amplitude.
WFM 601A, WFM 601E & WFM 601M User Manual
3–23
Page 80

Reference
The Eye display bandwidth of the waveform monitor is 450 MHz, so it can not
display aberrations faster than this. Most receiver circuits are also bandwidth
limited and usually ignore fast transients. This common bandwidth makes the
waveform monitor a good indicator of problem sources in systems.
Measuring Rise Time. Rise time measurements provide a check on the performance of sources and signal degradation by cabling.
To measure rise time, perform the following steps:
1. Perform the initial settings for Eye measurements described on page 3–22.
2. Select Variable Gain and size the waveform to 10 major divisions.
3. Use the Vert Pos bezel knob to position the bottom of the trace at the –.3 line
and check that the top is aligned with the .7 V line.
4. Enable the Timing Cursors.
5. Align the cursors as shown in Figure 3–21. The first cursor is at the crossing
of the rising edge and –.1 V line. The second cursor is at the crossing of the
rising edge and the .5 V line. Use the horizontal MAG for greater accuracy
when adjusting the cursors.
6. The indicated t time value is the standard 20 – 80% rise time measurement.
>100mV/DIV
OVERLAY
.8
.7
.6
.5
.4
.3
.2
.1
–.1
–.2
–.3
T
.8nS
0.5nS/DIV
1 kHz
100%
50%
Figure 3–21: Timing Cursors alignment for measuring 20–80% rise time
3–24
WFM 601A, WFM 601E & WFM 601M User Manual
Page 81

Reference
Calculating Actual Rise Time. The waveform monitor Eye display has a bandwidth
of 450 MHz which equates to a 20 – 80% rise time of 500 ps. Consider this finite
rise time when you measure the displayed rise time. You can calculate the actual
rise time of the source being measured using the following formula:
T
R(source)
T
R(source)
T
R(measured)
Ǹ
=
(T
R(measured)
)2–(0.5ns)
= the actual 20 – 80% rise time of the source (in ns);
= the 20 – 80% rise time measured on the waveform monitor (in ns)
2
Table 3–1 lists actual rise times for a number of rise time values measured with
the waveform monitor.
T able 3–1: List of measured and actual rise times for the
waveform monitor
20–80% rise time measured Actual 20–80% rise time
640 ps 400 ps
710 ps 500 ps
780 ps 600 ps
860 ps 700 ps
900 ps 750 ps
940 ps 800 ps
1.0 ns 900 ps
1.1 ns 1.0 ns
1.2 ns 1.1 ns
1.3 ns 1.2 ns
1.4 ns 1.3 ns
1.5 ns 1.4 ns
1.6 ns 1.5 ns
WFM 601A, WFM 601E & WFM 601M User Manual
3–25
Page 82

Reference
Measuring Jitter. The Eye display in Overlaid mode provides a quick way to
measure timing jitter. The WFM 601M waveform monitor also provides an
automated Jitter measurement described on page 3–37.
Timing jitter is the deviation of signal transitions compared to those of a
reference clock. Ideally, all data bit transitions occur at equal intervals. In real
systems, factors such as noise, pulse distortion, and variations in bit patterns
cause timing jitter. Jitter results in Eye closure along the time axis, narrowing the
window in which the data values can be accurately determined. Data errors result
when the Eye becomes too narrow.
Jitter is characterized by both its magnitude and frequency. Signal transitions
deviate from their ideal position by a peak amount and at one or more frequencies, depending on the sources. The frequency of the jitter is important in
determining its effect on the system. Typically, only high frequency jitter affects
data recovery. But low frequency jitter can affect time-critical operations such as
signal multiplexing and D/A conversion.
The waveform monitor provides three bandwidth filters: 10 Hz, 100 Hz, and
1 kHz. These filters only show jitter terms above the selected filter frequency.
For example, with 1 kHz selected, 50 Hz jitter is heavily attenuated while 10 kHz
jitter appears unattenuated.
To measure timing jitter with the waveform monitor, perform the following steps:
1. Perform the initial settings for Eye measurements described on page 3–22.
2. Choose the OVERLAY display mode (located in the EYE PATTERN
CONFIGure menu). In this mode, each of the ten bits of a scrambled serial
word are overlaid in the same location, showing peak jitter at each eye
crossing.
3. Select the appropriate BW Limit filter. Take two measurements: one with the
10 Hz filter, showing total broadband jitter, and one with the 1 kHz filter,
which removes the low-frequency jitter.
4. Enable the Timing Cursors.
5. Position the cursors to measure the Eye zero-crossing point.
6. Set Gain to X5 for better vertical resolution; use SWEEP MAG for better
horizontal resolution.
Suggested limits for jitter are 740 ps p-p over one horizontal line, measured with
the 1 kHz BW Limit filter. If composite D/A conversion is planned, use the
10 Hz BW Limit filter and the same 740 ps p-p limit.
To date, many of the jitter problems in systems have been the result of genlocking clocks to other references such as the horizontal synchronization pulse.
Reference jitter transferred by genlocks into a serial system is typically between
20 and several hundred hertz. Also, the phase detection process used by the
3–26
WFM 601A, WFM 601E & WFM 601M User Manual
Page 83

Reference
genlock can add noise, which results in jitter in the 10 Hz to 1 kHz range. By
using the appropriate BW Limit filter, genlock jitter can be included or rejected
from a jitter measurement.
Observing Word Correlated Behavior . The Eye Pattern display in 10-Eye mode
allows you to analyze word correlated jitter. When video is serialized, a 270 MHz
serial clock is derived from the 27 MHz rate parallel word clock. Often there is
slight phase modulation of the serial clock between the transitions of the parallel
clock producing jitter at data-bit transitions. This jitter is not random; it is
correlated to the parallel word rate. Also, the video pattern applied to the
serializer changes at a 27 MHz rate or at an integer fraction of this rate. Any
video pattern related effects in the serial system typically appear at fixed data-bit
locations with respect to the parallel word.
In the Eye display10-EYE mode, the trigger is on the parallel word boundaries,
with 10 Eyes shown per sweep. Parallel word and tv-line correlated behavior can
be seen in this mode. If a serial system has a disturbance that appears related to
video patterns, either word or tv-line, use the 10-EYE mode in either EYE or EQ
EYE to analyze the problem. Use the Line Select function to place the area of
interest in the Eye pattern display.
Filter Menu
The Filter menu provides selection of input signal filters for the Waveform and
Parade display modes. The three available filters are FLAT (unfiltered), LPASS
(1 MHz low pass filter), and the DIFF (differentiated steps filter).
Pressing CLEAR MENU turns off the filter selection readout. To turn off the
Filter selection and leave the Filter menu, press the FILTER button (press the
button twice if the Filter menu is not displayed). Leaving the FILTER menu
returns the monitor to the unfiltered (FLAT) setting.
WFM 601A, WFM 601E & WFM 601M User Manual
3–27
Page 84

Reference
Gain Menu
The GAIN menu allows you to expand the display vertically by set levels or to
vary it continuously. The expanded waveform lets you inspect a waveform
feature or more precisely position a cursor for a measurement.
Press the GAIN MENU button to access the Gain menu. Use the fixed bezel
buttons to select from the gain settings of X1, X5, X10, and Variable gain. Gain
is useful in all display modes except PICTURE mode. In Vector displays,
variable gain changes both horizontal and vertical gain equally. Lightning and
Diamond displays have both horizontal and vertical variable gain.
CLEAR MENU turns off all of the menu readout, except the VAR GAIN label.
Variable gain remains active as long as the front-panel GAIN indicator is lit.
To turn Gain off, press the GAIN button once (twice if the Gain menu is not
visible). When you quit the Gain menu, Variable gain returns to the calibrated
setting and Vertical gain returns to X1.
3–28
WFM 601A, WFM 601E & WFM 601M User Manual
Page 85

Gamut Displays
Reference
The waveform monitor features two types of gamut displays. The Diamond
display checks video signals for proper RGB gamut. The Arrowhead display
checks composite-coded video signals. Both gamut, or signal limit, displays can
trigger an alarm when the input signal exceeds a gamut limit.
Press the VECTOR/GAMUT button to select GAMUT. Use the bottom bezel
button to select either the Diamond or Arrowhead display mode. This selection
may not be visible when other MENU functions, such as GAIN, are active. Press
the CLEAR SCREEN button to remove other function menus.
Diamond Display
The Diamond display is very effective at showing the relationship between the R,
G, and B signal video signals. The waveform monitor converts the Y, P
and P
b,
r
components recovered from the serial signal to R, G, and B to form the Diamond
display. Figure 3–22 shows how the Diamond plot is developed.
Ultimately all color video signals are coded as RGB for display on a picture
monitor. To predictably display all three components, they must lie between peak
white, 700 mV, and black, 0 V. Picture monitors handle excursions outside the
standard range (gamut) in different ways.
+700 mV
Legal G and B space
Green
0 V +700 mV
Green
Blue
Red
G
+700 mV0 V
G
B
R
Legal G and R space
+700 mV
X–Y plot Diamond plot
Figure 3–22: Construction of the Diamond display
WFM 601A, WFM 601E & WFM 601M User Manual
3–29
Page 86

Reference
Checking RGB Gamut. For a signal to be in gamut, all signal vectors must lie
within the G-B and G-R diamonds. Conversely, if a vector extends outside the
diamond, it is out of gamut. The direction of an excursion out of gamut indicates
which signal is excessive. Errors in green amplitude affect both diamonds
equally, while blue amplitude errors affect only the top diamond and red errors
affect only the bottom diamond. You can set an alarm to indicate when the signal
exceeds the RGB gamut. For information on setting the gamut alarm, refer to
Gamut Alarms on page 3–33.
The intensity of a vector indicates its duration. A momentary out-of-gamut
condition appears as a faint trace. Long duration violations show as a bright
trace. Figure 3–23 gives some sample out-of-gamut signals on the Diamond
display.
On the Diamond Display, monochrome signals appear as vertical lines. Nonlinear
component processing, such as from a gamma corrector that alters white balance,
can cause deviations along the vertical axis.
As with the lightning display, bending of the transitions indicates timing delays.
When a color bar signal is applied, the vertical axis becomes an indicator of
delay errors.
3–30
Example A:
R – Ok
G > 700 mV
B – Ok
Example B:
R – Ok
G – Ok
B > 700 mV
Figure 3–23: Out-of-gamut signals on a Diamond display
WFM 601A, WFM 601E & WFM 601M User Manual
Example C:
R – Ok
G – Ok, 350 mV
B < 0 mV
Page 87

Reference
Arrowhead Gamut
The Arrowhead gamut display plots luminance (Y) against chrominance (C) to
check if the composite signal adheres to standard gamut. Figure 3–24 shows
NTSC and PAL Arrowhead displays (75% Color bars) and indicates the values of
the graticule lines. The arrow-head shape of the graticule results from overlaying
the standard limits for luminance and luminance plus peak chrominance.
NTSC display
Y Ampl
Y
100 IRE
120 IRE
| C |
131 IRE
NTSC
120 IRE
–40 IRE
Current alarm
level setting
Alarm level
cursor
C Ampl
P AL display
Y Ampl
700 mV
Y
| C |
C Ampl
950 mV
PAL
700 mV
–300 mV
Figure 3–24: NTSC and PAL Arrowhead gamut displays
Current alarm
level setting
Alarm level
cursor
WFM 601A, WFM 601E & WFM 601M User Manual
3–31
Page 88

Reference
Signals exceeding the luminance amplitude gamut extend above the top
horizontal limit (top electronic graticule line). Signals exceeding the luminance
plus peak chrominance amplitude gamut extend beyond the upper and lower
diagonal limits. The bottom horizontal line shows the minimum allowed
luminance level of 7.5 IRE for NTSC and 0 mV for PAL. See Figure 3–24.
Graticule Format. The electronic graticule is different for PAL and NTSC formats.
Use the CONFIG GAMUT menu to select the Limit Format. The AUTO
selection in the Gamut Configure menu determines the correct graticule from
your input signal. A field rate of 60 Hz indicates NTSC and 50 Hz indicates PAL.
NTSC and P AL Limit Cursors. The alarm limit cursor sets the upper amplitude
point at which an alarm is triggered. In Figure 3–24, the NTSC limit cursor is set
to 120 IRE, as indicated at the upper right of the Arrowhead graticule. Set the
NTSC limit cursor to 100, 110, 120, or 131 IRE to fit your operating practices.
Likewise set the PAL limit cursor to 700 mV or 950 mV. Use the CONFIG
GAMUT menu to set the gamut level.
For information on setting the gamut alarm, refer to Gamut Alarms on
page 3–33.
Checking Composite Gamut. The Arrowhead display provides an automated
check on adherence to RGB or composite gamut standards with the Alarm
feature discussed on page 3–33. To perform an automated gamut check, enable
the alarm and set the level. The automated check alerts you whenever the signal
exceeds the set limit.
Another useful Arrowhead function is a measure of how well the active video
signal is using the dynamic range of video channel. A properly adjusted signal
should be centered in the arrowhead graticule and have transitions that approach
all the limits.
3–32
WFM 601A, WFM 601E & WFM 601M User Manual
Page 89

Reference
Gamut Alarms
The Gamut display modes can alert you whenever a signal exceeds a selected
limit. You can set alarm limits for both the Diamond RGB display and Arrowhead composite display. The alarm can take the form of an alarm message in the
lower left corner of the CRT or a flashing of the MON OUT signal.
To set either the RGB or composite alarm, follow these steps:
1. Press the CONFIG button and select the GAMUT menu.
2. Select the type of GAMUT CHECK from these choices:
CMPST (composite) for the Arrowhead display
RGB for the Diamond display. RGB mode checks the R, G, and B
signals for transitions below 0 mV and above 700 mV.
BOTH enables RGB and CMPST gamut checks.
3. Select the type of ALARM DISP (display) you want from:
SCREEN places an error message at the lower left of the CRT.
PIX MON flashes the analog output monitor signal in the area that
exceeds the limits.
BOTH enables both SCREEN and PIX MON alarm displays.
4. Set the adjustable limit cursor to 100, 110, 120, or 131 IRE for NTSC or
700 mV or 950 mV for PAL.
When an alarm condition occurs, a message appears or the monitor flashes for at
least one second. In addition, pin 16 of the Remote rear panel connector is pulsed
low. Refer to Remote Connector discussion on page B–2 for more information.
WFM 601A, WFM 601E & WFM 601M User Manual
3–33
Page 90
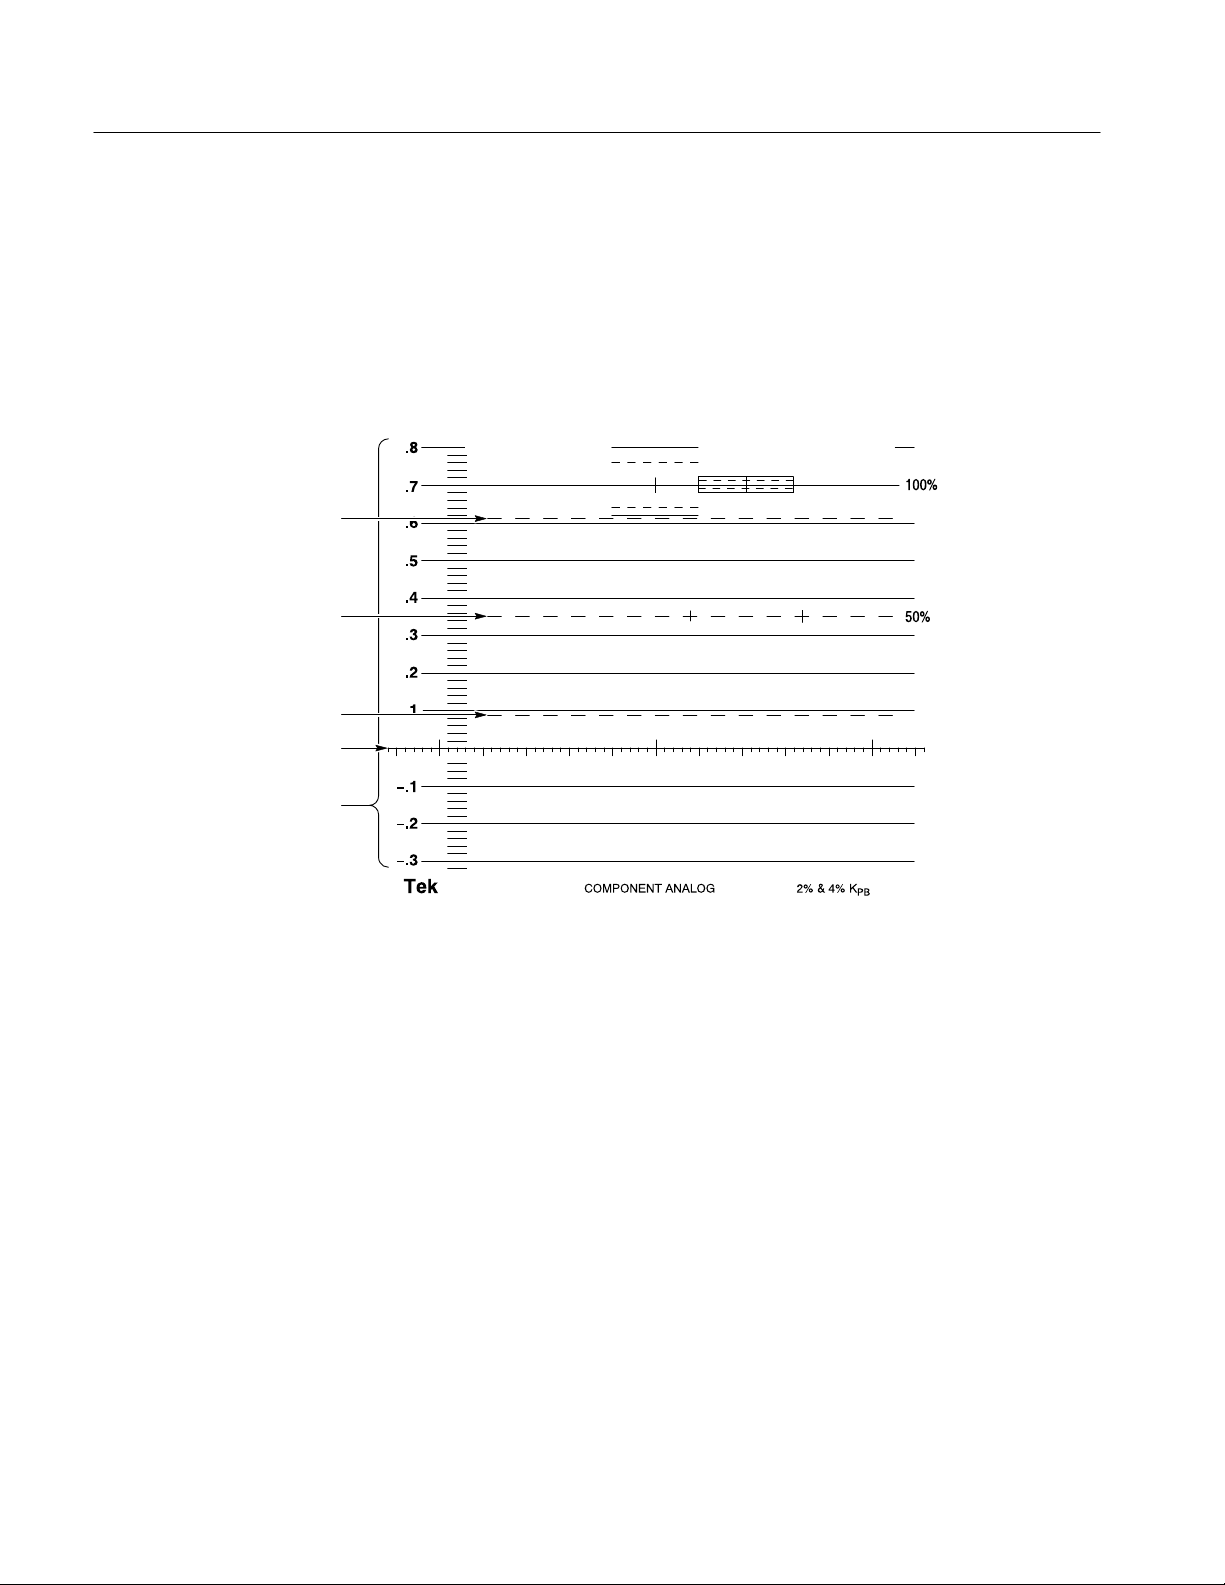
Reference
Graticule Measurements
The waveform monitor provides an internal etched graticule for waveform
measurements. The internal graticule scales are on the same plane as the CRT
phosphor to reduce parallax errors. You can adjust the graticule and trace
illumination in the CRT menu for viewing or photographing the display.
Figure 3–25 shows the etched graticule.
Upper limit for 75% color diff signals
Center line for 75% and 100%
color diff signals
Lower limit for 75% color diff signals
0 V horizontal reference
mV scale
Figure 3–25: Waveform measurement graticule
Vertical Scale
This etched scale facilitates direct Waveform and Parade measurements. The
vertical scale is marked in millivolts (mV) and extends from –300 mV to
+800 mV in 100 mV increments.
There are three dashed lines on the graticule used to measure the color difference
signals, Pb and Pr. The line at 50% amplitude is the center line for the color
difference signal measurements. The lines at 90 mV and 610 mV correspond to
the peak excursions for 75% color difference signals. 100% color difference
signals extend from the baseline (0 V) to 700 mV, centered on the 50% graticule
line.
3–34
WFM 601A, WFM 601E & WFM 601M User Manual
Page 91

Reference
K-Factor Graticule. A special graticule located at the top of the etched graticule
allows measurement of K-Factor line-time distortion. Figure 3–26 shows the
special graticule and how to align a 2T Bar waveform to measure time-line
distortion.
The graticule does not include the first and last 1 ms of the bar where short-time
distortions (ringing, overshoot, undershoot, etc.) occur. The solid outer box
equals a 4% K factor, while the dashed-line inner box equals a 2% K factor.
K-factor
graticule
Waveform
alignment
points
Figure 3–26: Graticule for K-factor measurements
To measure the K-factor distortion follow these steps:
1. Apply a 700 mV 2T bar signal with a 26 ms duration bar to the active Serial
input.
2. Adjust the waveform so its bottom is on the 0 V line and its top is on the
700 mV line. If necessary, adjust the Variable Gain in the GAIN menu so the
waveform spans the 0 V to 700 mV lines. Note the rising and falling edges of
the waveform must align with the marks on the 50% line.
3. After initial alignment, measure the largest deviation of the bar top (tilt or
rounding) using the K–factor graticule. You can expand the waveform by
setting Gain to X5. The K factor graticule lines then measure 0.8% and 0.4%
K factor.
WFM 601A, WFM 601E & WFM 601M User Manual
3–35
Page 92

Reference
2T Pulse to Bar. 2T pulse-to-bar measurements are made using the solid and
dashed lines located to the left of the K-Factor graticule. Setup is the same as for
K-Factor measurement. The 2T pulse-to-bar graticule lines are scaled according
to the following formula:
1 and 1
(1–4K)
Where:
K = 0.02 for 2% K Factor (using the dashed lines)
or
K = 0.04 for 4% K Factor (using the solid lines)
Set Gain to X5 to increase the resolution to 0.4% and 0.8%.
(1+4K)
Horizontal Scale
The horizontal reference line (0 V) is also referred to as the base line, 0 mV,
blanking level, and black level. The reference line has 12 major divisions. Main
marks at the 1st, 6th, and 11th divisions provide for timing and linearity
measurements, which should occur within the center ten divisions. When the
Sweep button is set to 1-Line, each major division represents 5 ms, and when set
to 2-Line sweep, each major division represents 10 ms. The current deflection
factor is displayed in the upper-right corner of the CRT.
Pressing the MAG button magnifies the sweep so the scale on the baseline equals
500 ns per major division for 1-Line sweep and 1 ms per major division in 2-Line
sweep. Use the HORIZ POS knob to view the waveform extremes when
magnified.
3–36
WFM 601A, WFM 601E & WFM 601M User Manual
Page 93

Jitter Measurement Display (WFM 601M Only)
The Jitter display mode provides an automatic peak-to-peak measure of time
jitter on the active SER A or B input signal. Selectable high-pass filters allow
you to distinguish between high and low frequency jitter. Figure 3–27 shows an
example of the Jitter display including a sample jitter waveform. The jitter mode
converts any phase modulation to amplitude and plots it against time. An
unfiltered version of the jitter waveform appears on the JITTER OUT BNC
connector on the rear-panel.
Jitter measurements appear in the Jitter measurement box. The left measurement
is Timing or wideband peak-to-peak jitter from 10 Hz to 5 MHz. The right
measurement gives filtered peak-to-peak jitter measured after the high-pass filter.
The selected high-pass filter is indicated above the filtered jitter measurement.
0.1 UI/DIV 2 FIELD
JITTER (P-P)
TIMING
0.16UI
10HZ HPF
0.17UI
10HZ
Reference
High-pass filter
Jitter p-p out of
high-pass filter
Figure 3–27: Example of the Jitter display
Wideband p-p
jitter
Jitter waveform
after the
high-pass filter
WFM 601A, WFM 601E & WFM 601M User Manual
3–37
Page 94

Reference
Jitter Demodulation
Jitter Measurement
Configuration
The Jitter measurement uses a demodulator method to determine signal jitter. The
serial clock is recovered from the input signal and multiplied (demodulated)
against a very stable oscillator, which translates any phase modulation (jitter) into
a DC value. The resulting DC values plotted against time is proportional to jitter
in the serial signal. This jitter waveform is passed through a high-pass filter and
applied to a peak detector. The peak detector measurement is presented in the
jitter measurement box seen in Figure 3–27. The demodulator can detect jitter up
to 5 MHz.
The Jitter measurement lets you pick one of four high-pass filters and set the
readout units. Press the CONFIG MENU button and select JITTER. Use the
JITTER HPF bezel button to select from the available filters: 10 Hz, 1 kHz,
10 kHz, and 100 kHz. The jitter readout displays in seconds (SEC) or unit
intervals (UI). Use the READOUT bezel button select the unit type or turn off
the readout.
You can display the jitter waveform using any of the LINE/FIELD sweep
selections. You can also use the Line Select function to view an individual line.
Vertical Gain and horizontal MAG are available to enhance your view of the
jitter waveform. Use the Voltage Cursors to measure specific parts of the jitter
waveform. The Jitter Config menu READOUT selection determines the units for
the Voltage Cursors.
3–38
WFM 601A, WFM 601E & WFM 601M User Manual
Page 95

Line Select
Reference
The Line Select menu lets you select the part of the extracted video signal to
display and measure. You can select one line, 15 lines, or a single sample on any
line in any field. The selected part is indicated on the MON OUT signals as
highlighted video.
A readout in the upper left of the CRT indicates the currently selected field, line,
and sample. For example, the display F1:22, SMP1441 means that field 1, line 22
and sample 1441 is selected. In 15 H mode, starting and ending line numbers are
given. In 525 line standard with field 2 selected, sequential line numbers appear
in parenthesis.
To set the Line Select mode, press the LIN SEL MENU button. The Line Select
menu appears offering control selections. Bezel knobs are assigned to select line
number and sample (in SAMPLE mode).
Field Selection
Line or Sample Selection
The bezel buttons FIELD and NEXT FIELD select the field from which the
selected line/sample is taken. Selecting ALL displays the same line number from
both fields in a frame. The “1 of 2” selection lets you choose a line from only one
field in a frame. Press the NEXT FIELD button repeatedly to cycle through the
fields in a frame.
The second bezel button allows selection of 1H, 15H, and SAMPLE
(WFM 601M only) display modes. In 1H mode, select a single horizontal line
from anywhere in a frame. On the output monitor, the single selected line will be
highlighted. When the selected line is near the top or bottom of the frame, the
output monitor signal shifts to show the vertical sync region.
In the 15H mode you select a range of lines using the bezel knob. On the output
monitor, a band of lines is highlighted. The output monitor signal does not shift
as with the 1H and SAMPLE modes.
In the SAMPLE mode, select a horizontal line and a specific sample on that line.
In the Waveform and Parade Displays, a rectangular marker or “blivit” shows the
selected sample on the waveform. On the output monitor, highlighted horizontal
and vertical lines intersect at the selected sample. In the SAMPLE mode, the
output monitor display shifts to show the sync region when your selection
approaches either end of a line or field. Selections in the sample mode are
correlated across most display modes, such as Digital Waveform, Digital Data,
Parade, and Waveform display. For example, you can align the blivit to the SAV
sample in the Parade mode, then switch to the Digital Waveform mode and see
the SAV value in the data stream.
WFM 601A, WFM 601E & WFM 601M User Manual
3–39
Page 96

Reference
A special condition exists in 15H mode when you select the PARADE or
WAVEFORM displays. The first line in the display corresponds with the LIN
SEL readout. The second is from the second line and the third is from the third
line in the sequence. See Figure 3–28. For more information on how line select
affects the Parade mode, refer to page 3–41.
Line 1 Line 2 Line 3
3–40
Figure 3–28: Parade display of YPbPr shown in Line Select mode (15H only)
The CLEAR MENU button removes the readout associated with the line
selection, but the line number readout and Line Sel control assignment remain
active on screen. To restore the menu readout, press the LINE SEL menu button
again. To turn off the function press the LINE SEL menu button when the menu
readout is displayed; press LIN SEL twice when the menu is not displayed.
WFM 601A, WFM 601E & WFM 601M User Manual
Page 97
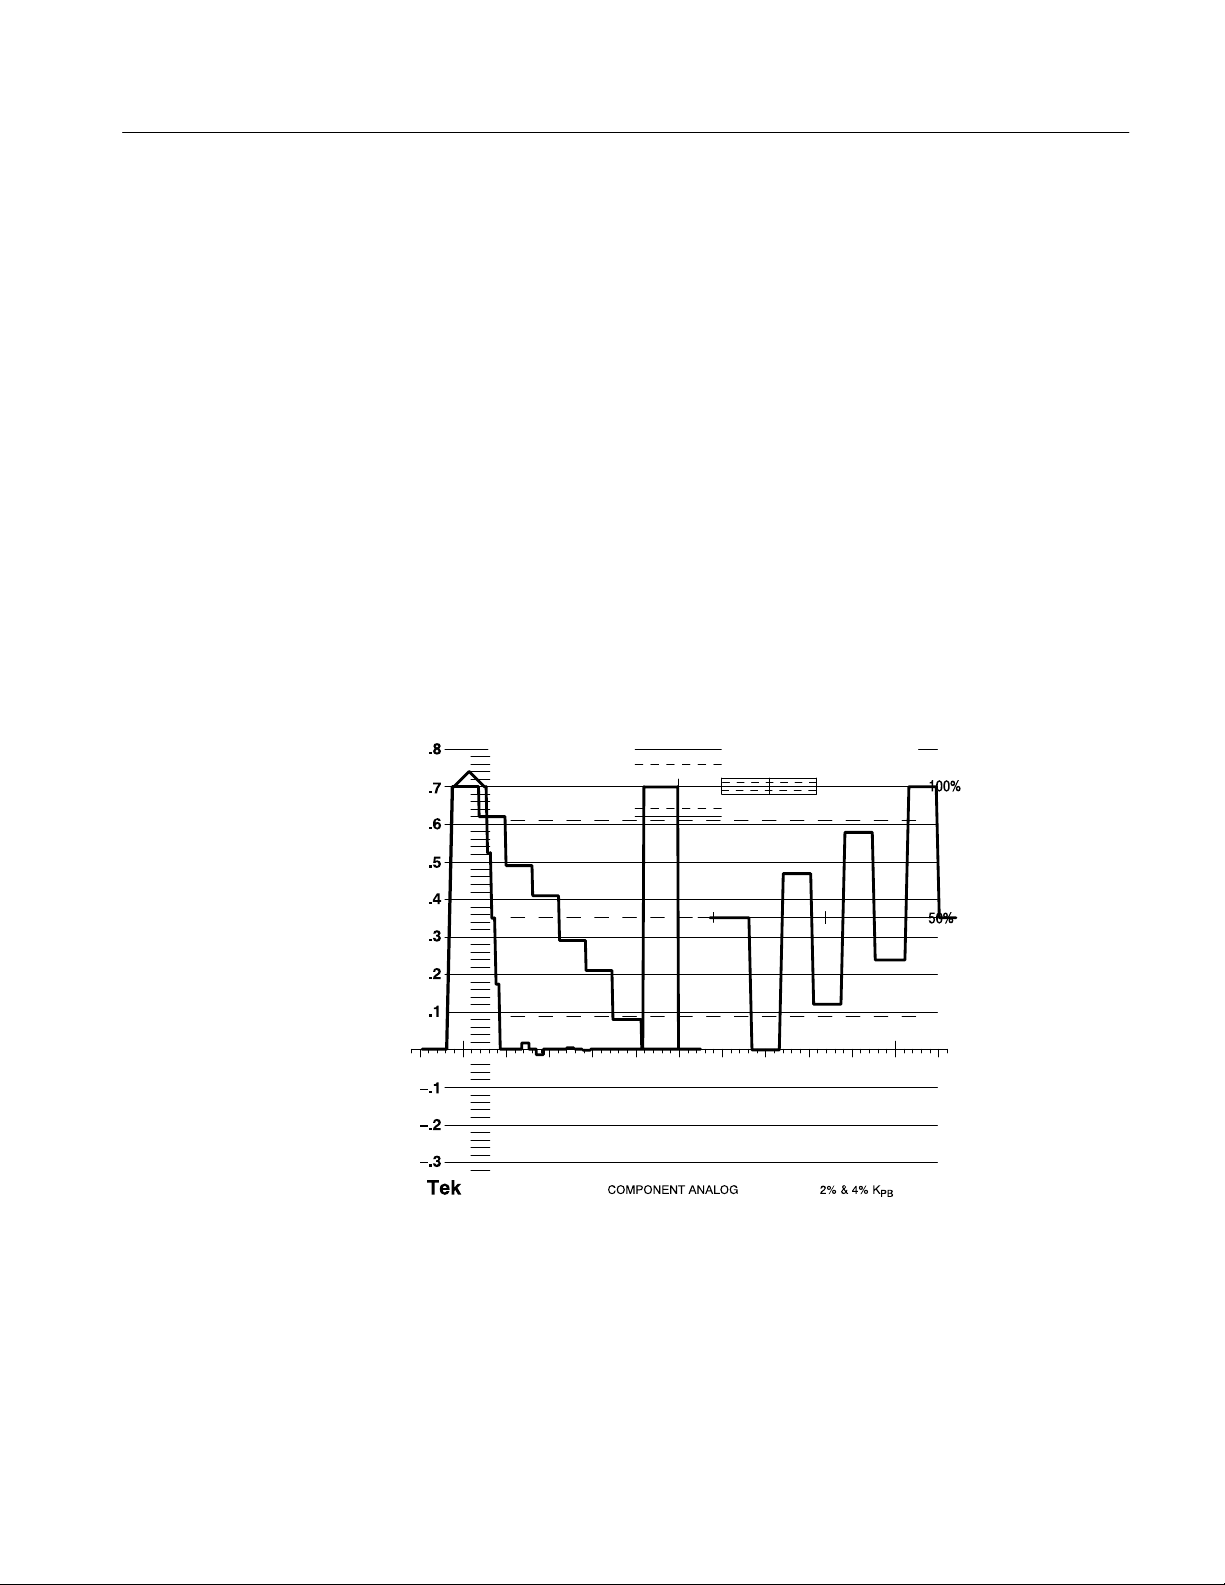
Multiple Display
Parade Display
Reference
The Multiple display allows you to overlay two display modes. When the
Waveform or Parade mode is displayed, you can add either the Vector, Lightning,
or Diamond displays. When you exit the Multiple display, the previous display is
restored.
Display the component signals Y (CH 1), Pb (CH2), and Pr (CH 3) using the
Parade display. You can choose to display one, two, or all three waveforms at
once. Measure the waveforms using the graticule or Cursors.
Gain and Sweep selections operate as in the Waveform display. Gain selections
are available to expand the waveforms vertically to aid in measurement. The
LINE/FIELD button alternates between one line and one field. The MAG
selection expands the horizontal scale, while still allowing you to take Cursor
timing measurements.
Figure 3–29: Parade display of Y and Pb signals
When Line Select is set to 1H and Ref is internal, the CH 1, CH 2, and CH 3
waveforms are all from the same line. When Line Select is set to 15H or Ref is
external, CH 1 is from line n, CH 2 is from line n+1, and CH 3 is from line n+2.
WFM 601A, WFM 601E & WFM 601M User Manual
3–41
Page 98

Reference
Picture Display
The Picture display shows a monochrome version of the video signal carried by
the serial digital input signal. Figure 3–30 shows an example of a color bar
signal. The Picture display lets you verify the signal source. When Line Select is
active, the highlight or “bright-up” of the selected line appears as it would on an
external analog monitor.
.8
.7
.6
.5
.4
.3
.2
.1
100%
50%
–.1
–.2
–.3
Tek
COMPONENT ANALOG
2% & 4% K
PB
Figure 3–30: Example of the Picture display
To adjust the Picture display, press the CRT MENU button and use the CONTRAST and BLACK LEVEL bezel knobs.
3–42
WFM 601A, WFM 601E & WFM 601M User Manual
Page 99

Presets
Reference
The Preset menu makes it possible to recall front-panel settings from a list of 10
stored front-panel presets. You can store up to nine front-panel presets at these
locations. The remaining one is factory programmed to help calibrate the
waveform monitor.
Preset Menu
Press the PRESET MENU button to access the list of the 10 presets. The list
appears over a bezel knob below the CRT. Rotating this knob moves the highlight
box up or down the list. Once the desired preset is selected, you can take one of
four actions:
RECALL. Sets the front panel to the stored settings previously stored into that
memory location.
STORE. Wipes out the currently stored settings, in the selected memory location,
and replaces them with the current front–panel settings.
RENAME. Allows you to change the name of the current preset selection using a
set of alpha-numeric characters and symbols.
RECOVER. Returns to the previously selected choice. For example, assume that
Preset 1 was the previous choice and Preset 8 has now been selected but not
recalled. Pressing RECOVER returns to Preset 1.
To restore the Preset menu, press the PRESET menu button again. To turn off the
Recall function, press CLEAR MENU or the PRESET menu button.
Rename Submenu
WFM 601A, WFM 601E & WFM 601M User Manual
Use the Preset Rename submenu to rename one of the nine Presets.
1. Rotate the Location bezel knob to select a character to change in the current
name.
2. Rotate the Letter bezel knob to scroll through the list of available characters.
The Location character changes as you scroll through the character list. The
blank character follows the letter Z.
3. When you are done, press the ACCEPT button to lock the selection.
4. Press the RETURN bezel button to return to the PRESET menu.
3–43
Page 100

Reference
Ref Mode
Serial Status
The REF button selects the synchronization reference. The default reference is
the currently selected serial digital input (SER A or B). Press the REF button
once to select the external reference input (EXT REF). The EXT indicator,
located just above the REF button, lights when the external reference is selected.
The EXT REF input is a 75 W loop-through input. The external reference signal
can be a black burst or composite video signal.
Press the REF button again to select the internal synchronization reference and
turn off the EXT indicator.
The Serial format display performs automatic checks on the serial digital signal
and provides descriptive status of the input signal. Two Serial format screens,
STATUS and FORMAT, display information about the serial signal. In addition,
the front-panel EDH indicator lights when the input signal contains valid EDH
information in accordance with the SMPTE RP-165 standard.
Press the SERIAL button (located below the Alarm indicator) to view the Serial
format screens. Figure 3–31 shows the STATUS screen. Press the DISPLAY
bezel button to select either the STATUS, FORMAT, or CABLE screen. V1.X
firmware instruments do not have the CABLE selection. Press the SERIAL
button to exit the Serial format display.
3–44
WFM 601A, WFM 601E & WFM 601M User Manual
 Loading...