

Page 1

How-to-Guide
SDI Eye and Jitter Measurements
WFM2300 Portable Waveform Monitor
Page 2

SDI Eye and Jitter Measurements How-to Guide
Table of Contents
Introduction ………………………………………………………………………… 3
Troubleshooting the SDI Signal Path …………………………….……………. 3
How to Configure Video Session Display ……………………….……………. 4
How to Configure SDI Status Display ……………………….………………… 5
Cable Stress Loop ……………………………………………….……………….. 7
How to Configure SDI Stress Loop Amplitude …………….………………… 9
How to Configure Eye Measurements ……………………….………………… 10
Enabling Pseudo Color Display …………………………….…………………... 12
Measuring Jitter within an SDI Signal …………………….…………………… 14
Enabling Infinite Persistence Mode …………………….……………………… 18
Conclusion ………………………………………………….……………………… 20
2 www.tektronix.com/wfm2300
Page 3

SDI Eye and Jitter Measurements How-to Guide
Serial Digital Interface (SDI) Physical Layer Monitoring
Reliable transmission of the SDI signal from point A to point B is dependent on a variety of factors such as:
Amplitude of the Signal
Overshoot
Undershoot
Jitter
Rise and Fall Time of the Transitions
These parameters are affected by the cable length, that over longer runs of cable will introduce amplitude
and frequency losses to the signal resulting in longer rise and fall times of the signal. Overshoot and
undershoot are typically a result of incorrectly terminated devices or panels which introduce reflections into
the signal. Additionally deformation of the cable can also introduce reflections into the signal along with cable
loss. Active devices may introduce jitter into the signal as the signal is processed or genlocked to a
reference signal. The first stage of troubleshooting a physical layer issue is to verify the link by using CRC
(Cyclic Redundancy Code) words to verify the link is error free. The Video Session display will shows
statistics of the CRC Errors.
Troubleshooting the SDI Signal Path
Error Free signal path, check for CRC (HD or 3G) or EDH (Error Detection Handling) if present
within SD-SDI signals. Use the video session of the WFM2300 to determine this.
Determine if the signal path has a safety margin by adding an additional length of cable or using
a stressing signal. Does the addition of the cable length or stress cause CRC issues or loss of
the signal? The cable simulator of the WFM2300 adds 20m of Belden 1694A cable along with
the ability to add an interfering signal or use the internal test signal generator with the
pathological test signal to stress the signal path.
Estimate the cable length of the signal path to determine if the receiving device is operating
within its specification, using the SDI Status displays of the WFM2300.
Check at various points along the transmission path to characterize the SDI signal.
Use the Eye displays of the WFM2300 to characterize the health and possible artifacts present
within the SDI signal along the signal path.
Use the Jitter thermometer within the eye, jitter and SDI status display of the WFM2300 to
determine the timing and alignment jitter present within the signal.
Use the Jitter display in two-field sweep to characterize the jitter within the signal and use the
high pass filters to determine the amount of jitter present within each frequency band.
3 www.tektronix.com/wfm2300
Page 4

SDI Eye and Jitter Measurements How-to Guide
How to Configure Video Session Display
1. Select one of the tiles (1, 2, 3 or 4) using the Display Select and press the STATUS button.
2. Push and Hold the STATUS button to display the Status menu.
3. Using the general knob or up/down arrow keys navigate to and select Display Type as shown in
Figure 1.
4. Press SEL to enter the submenu and navigate to Video Session to show a summary of video
parameters of the current video signal as shown in Figure 1.
Figure 1. Video Session Display.
For HD-SDI, Dual Link and 3G-SDI signals there is a CRC calculated every line with a value produce
one for Y Luma and one for C Chroma samples. This is shown in the lower statistics information of
Figure 1.
If the signal attached to the WFM2300 is error free then the Status will show OK in green.
If a CRC error occurs then this will show in the Video Session display in red and a count of the
number of values that have occurred during the session will be displayed.
In order to determine the error rate of CRC errored seconds, the user may need to monitor the signal
path for several minutes or hours. Within the Status menu for the Video Session display the user can
reset the duration of the session and the statistics will be reset too.
See Figure 1. Video Session menu All Sessions Reset)
NOTE:
For standard definition (SD-SDI) signals there is no embedded CRC check and instead an Error
Detection Handling ancillary packet must be inserted by the device in order to provide CRC check of
the signal.
4 www.tektronix.com/wfm2300
Page 5

SDI Eye and Jitter Measurements How-to Guide
If you see errors every minute or every second then this is an indication that the signal is getting close to the
digital cliff and there is a problem in recovering the clock and data of the signal within the receiver. Not all
receivers are identical and this can affect the devices ability to recover the clock and data.
The WFM2300 has been designed with a robust equalizer and receiver to allow the user to determine signal
issues. Some devices may fail before the WFM2300 and so it is important to check the manufacture’s
specification for cable length distance and type of cable. The SDI status display provides an estimated cable
length measurement based on selection of specific cable types.
NOTE:
Most manufacturers specify the performance of their equipment to a specific cable type typically Belden
8281 or Belden 1694A and it is recommend to select this cable type when estimating the cable length of
the device, even though the cable being used may not be this type of cable.
How to Configure SDI Status Display
1. Select one of the tiles (1, 2, 3 or 4) and press the STATUS button.
2. Push and Hold the STATUS button to enable the menu.
3. Using the up and down arrows to navigate to Display Type and press right arrow to select the
sub menu as shown in Figure 2.
4. Select SDI Status display to show a summary of physical layer parameters of the current video
signal as shown in Figure 3.
Figure 2. SDI Status Display Type menu.
5
www.tektronix.com/wfm2300
5
Page 6
SDI Eye and Jitter Measurements How-to Guide
NO
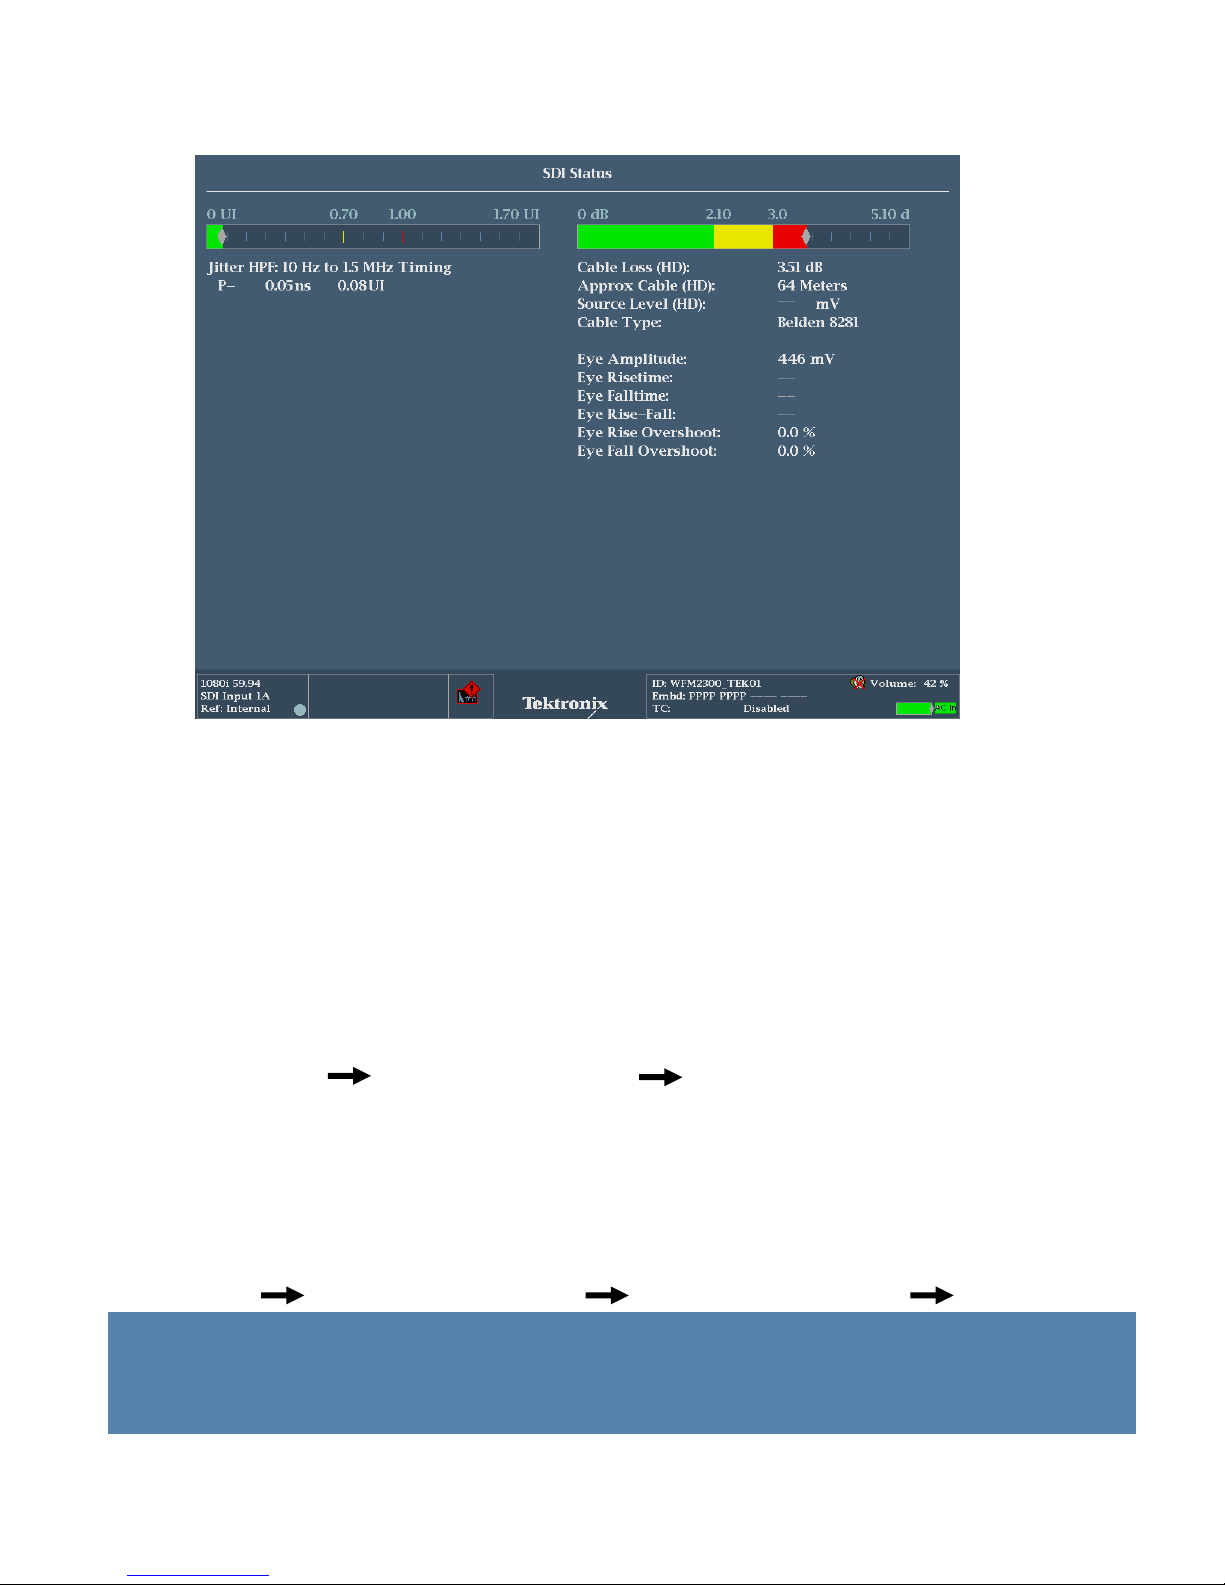
Figure 3. SDI Status Display showing physical layer measurement summary.
The SDI Status provides a summary of the physical layer measurements of the SDI input. Jitter and Cable
Loss Thermometer shows the value represented as a horizontal bar graph. The 0-170% scale is divided into
threshold regions, from 0 to 70% value is represented by the green area, the level 70-100% by a yellow area
and 100-170% by a red area. The measured value is also shown within the display.
Jitter – Measured Jitter using selected High Pass Filter
Cable Loss – Shows the signal loss in dB at the frequency specified
Approx Cable – Shows the approximate cable length, assuming a continuous run of the specified
cable type selected by the user.
Source Level – Shows the calculated launch amplitude of the signal source, assuming a continuous
run of cable.
Cable Type – Shows the cable type used to make physical layer measurements and is user selectable
within CONFIG Physical Layer Settings Cable Type.
Eye Amplitude – Shows the amplitude of the eye waveform
Eye Risetime – Shows the rise time of the eye waveform
Eye Falltime – Shows the fall time of the eye waveform
Eye Rise-Fall – Shows the delta of the rise and fall time of the eye waveform
Eye Rise Overshoot – Shows the percentage of the rise time overshoot of the eye waveform
Eye Fall Overshoot – Shows the percentage of the fall time overshoot of the eye waveform
The user can set the threshold for the jitter meter within the configuration menu
CONFIG Physical Layer Settings SMPTE XXX Thresholds Jitter Level
NOTE:
Physical layer measurements can only be performed on Channel A input, so ensure that Input A is
selected on the front panel.
6
www.tektronix.com/wfm2300
6
Page 7
SDI Eye and Jitter Measurements How-to Guide
Cable Stress Loop
To assist in checking the performance of a cable link the Cable Stress Loop can be used within the
WFM2300. This adds a simulated 20 meter length of 1694A cable between the I/O loop and can be
used in two ways.
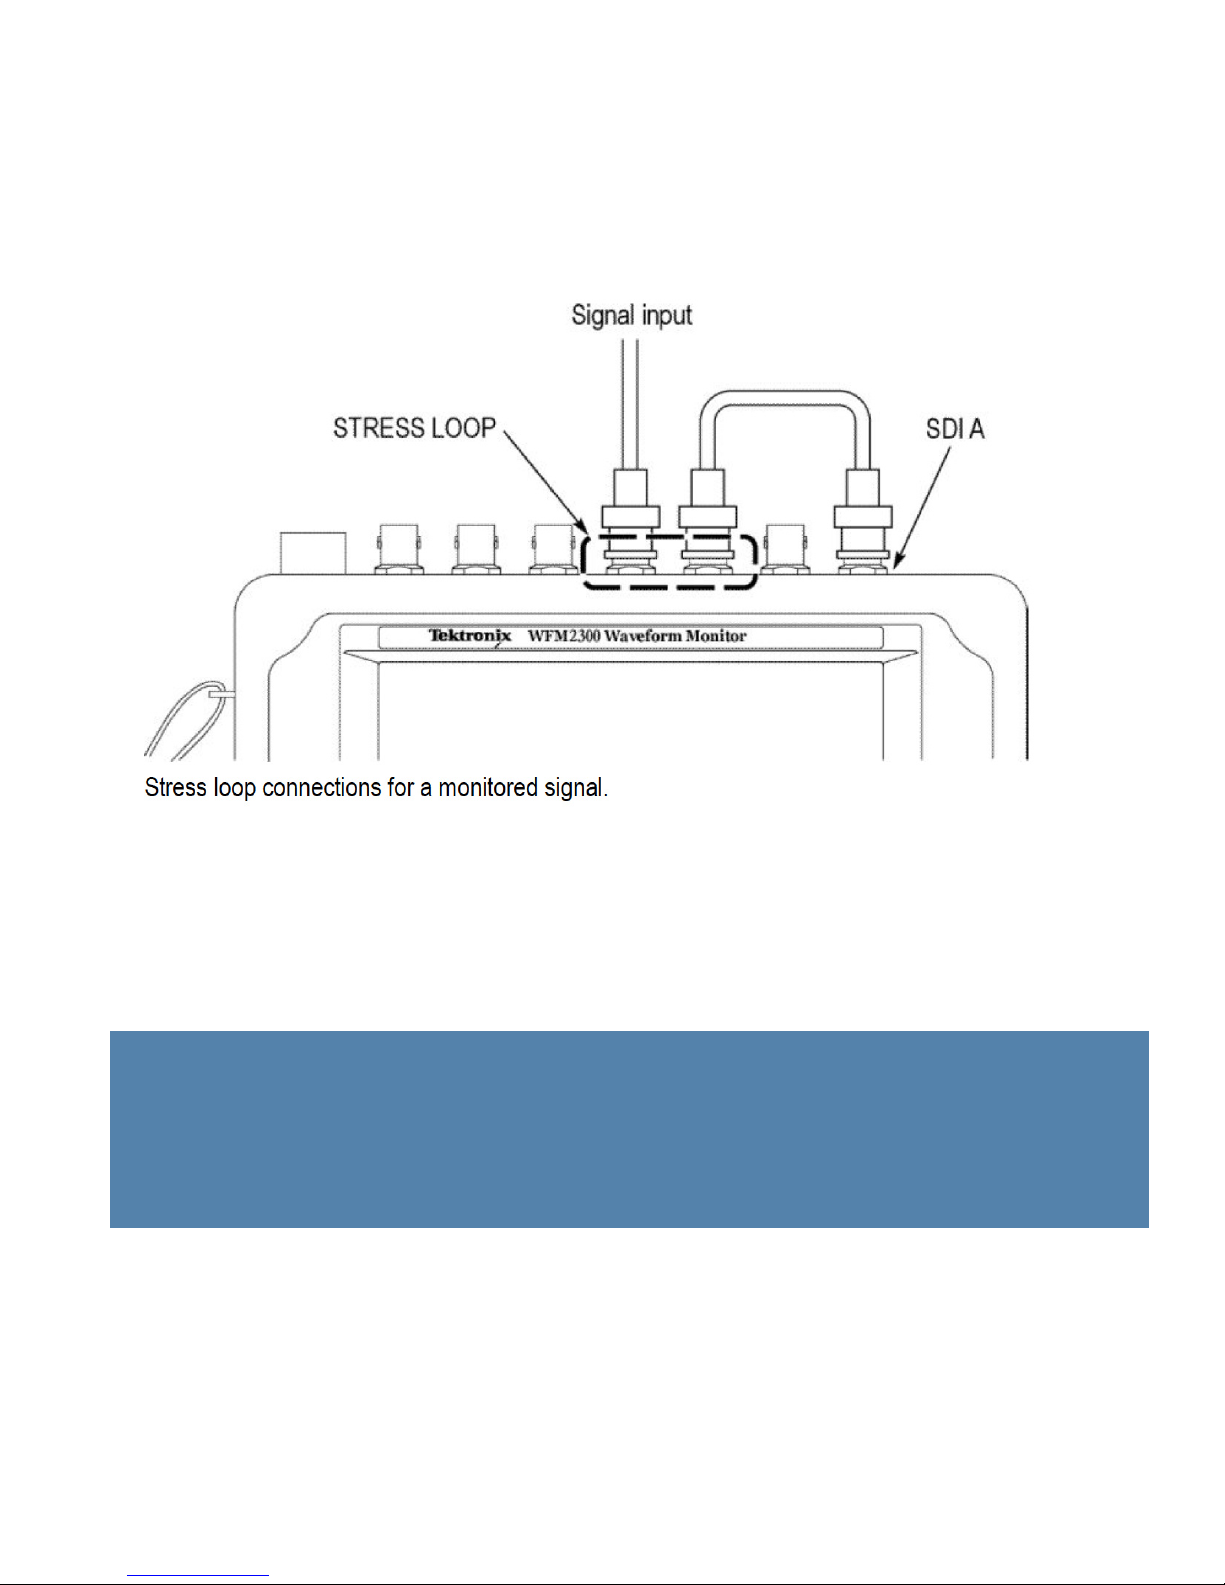
Figure 4. Monitored signal stress loop.
A monitored signal can be input to the stress loop as shown in Figure 4 and the additional simulated
length of cable is added to the signal before it is input into SDI A. Monitoring the video session display
allows the user to check that the signal is still error free with the additional length of cable. If the signal
is producing CRC errors every second or every minute then the signal is marginal and the user needs to
investigate further using the eye and jitter displays to determine the problem. The cable type may need
to be changed or a re-clocking Distribution Amplifier (DA) may have to be inserted in the link to
guarantee performance of the signal.
NOTE:
The Video Session display will shows CRC errors that are occurring within the transmission path.
In some cases these errors may not be visible on the internal picture display or on a large picture
monitor, since they may be one pixel sparkle effects (black, or white pixel errors) as the error rate
increases. This sparkle effect will become more pronounced, until lines or parts of the line start to
drop out. Finally, there is no picture at all or the devices freezes on the last frame before loss of the
signal.
7
www.tektronix.com/wfm2300
7
Page 8

SDI Eye and Jitter Measurements How-to Guide
The stress loop is bi-directional and can be used for input and output of SDI signal. The Test Signal
Generator or SDI output can be used to drive the stress loop as shown in Figure 5. In this case the
simulated 20 meters of Belden 1694A cable can be added to the generated SDI output and then applied
to the cable link to determine if the device at the end of the link can recover the clock and data from the
transmitted SDI signal. If the device fails to recover the signal then the stress loop can be removed and
the test signal generator output of the WFM2300 can be directly connected to the link to test the device
on a short run of cable. The user can then determine if the health of the link is suitable for the
transmission of the SDI signal or additional measures are needed to improve the signal transmission
such as changing the type of cable used or adding a re-clocking DA to the system.
Figure 5. Generator output via stress loop.
The stress loop can also add an interfering signal to the SDI signal to test the robustness of the receiver.
This can be configured in the PHY measurement menu.
8
www.tektronix.com/wfm2300
8
Page 9

SDI Eye and Jitter Measurements How-to Guide
How to Configure SDI Stress Loop Amplitude
1. Select one of the tiles (1, 2, 3 or 4) and press the PHY button.
2. Push and Hold the PHY button to enable the menu.
3. Using the up and down arrows to navigate to SDI Stress Loop Amplitude and press right arrow to
select the sub menu as shown in Figure 6.
4. Use the General knob to change the value between 0 mv to 300 mv.
Figure 6. SDI Stress Loop Amplitude with varying amplitudes.
By changing the amplitude value of the stress loop the user can determine if the device under test fails
at some value during the test and the robustness of the link and device within the system can be
determined.
NOTE:
The stress loop interfering signal is set to a frequency of 20MHz and causes varying vertical
offset in the eye display.
− This interfering signal is not actually jitter and therefore does not produce time or phase
modulation of the SDI signal of the eye or jitter display, since the bandwidth of clock
recovery within the instrument is 3MHz for 3G-SDI, 1.5MHz for HD and 300kHz for SD,
well below the frequency band of the interfering signal.
− The interfering signal is typically converted to jitter by the slicing action of the SDI
equalizer and therefore can be useful for checking the jitter margin of a device.
The WFM2300 is able to generate a non-stress SDI test signal like color bars (75% or 100%)
that are typically use to test the transmission link. Alternatively the Pathological test signal
generated by the WFM2300 is used to stress the phase lock loop or equalizer of the receiving
device to provide additional stress to the transmission link.
9
www.tektronix.com/wfm2300
9
Page 10

SDI Eye and Jitter Measurements How-to Guide
How to Configure Eye Measurements
1. Select one of the tiles (1, 2, 3 or 4) and press the PHY button.
2. Push and Hold the PHY button to enable the menu.
3. Using the up and down arrows to navigate to Display Type and press right arrow to select the sub
menu as shown in Figure 7.
4. Use the up and down arrows to select the Eye Display.
The Eye display provides a visual check on the characteristics of the received SDI signal and a variety
of information can be determined from the display and the measurement values.
The following displays can be used to identify common characteristics or problems with the SDI signal.
SMPTE standards provide specification for the launch amplitude of an SDI signal output from the device
Figure 7a. The test signal generator output of the WFM2300 was directly connected to the SDI A input
and direct measurements were made of the physical layer parameters in Figure 7b.
Figure 7a. Eye Launch Amplitude specifications.
Figure 7b. Generator output connected to SDI A.
10
www.tektronix.com/wfm2300
10
Page 11

SDI Eye and Jitter Measurements How-to Guide
Normally when evaluating the SDI signal at the end of a specific length of cable or through multiple
devices cable loss and jitter are introduced into the signal. Typically adding additional lengths of cable
produces cable loss reducing the amplitude and increasing the rise and fall time of the signal due to
frequency losses along the cable.
When the 20m of simulated Belden 1694A cable was added to the generator output, the amplitude of
the signal became lower and there was an increase in the rise and fall time of the transitions as shown
in Figure 8a.
Additional cable was added to the system as shown in Figure 8b and it becomes difficult to determine
the rise and fall of the transitions, although the amplitude and jitter of the signal can be measured.
Figure 8a. Addition of stress loop 20m Belden 1694A.
NOTE:
The addition of cable to the system does not increase the amount of jitter within the system.
Typically an active device will add jitter to the system.
When the eye display becomes noise-like and the transitions of rise and fall times are difficult
to determine visually, the recovery of the signal is dependent on the receiving devices
equalizer to recover the clock and data from the signal.
− The user should verify the status bar or video sessions display to confirm that the signal
path is error free and no CRC errors are present, as is this case of Figure 8b.
− The user can also add the stress loop to the system to see if the signal is still healthy with
the addition of the 20m of Belden 1694A cable.
Figure 8b. Long length of cable.
11
www.tektronix.com/wfm2300
11
Page 12

SDI Eye and Jitter Measurements How-to Guide
Enabling Pseudo Color Display
Normally the green or white trace color is used for the waveform displays but it can be useful to enable
the pseudo color display as shown in Figure 9 to highlight the intensity difference of those parts of the
trace that occur more frequently. A blue color is used for less frequently occurring parts of the trace with
cyan, green, yellow and the red showing increasing frequency of that part of the trace.
1. Press the CONFIG button to enter the configuration menu
2. Using the arrow key or general knob navigate to Display Settings as shown in Figure 9
3. Press SEL to enter sub menu and navigate to Waveform Color
4. Press SEL to enter sub menu and select Pseudo
Figure 9. Display Setting menu.
12
www.tektronix.com/wfm2300
12
Page 13

SDI Eye and Jitter Measurements How-to Guide
Overshoot within the eye display is likely due to reflection along the signal path and can be due to
incorrect terminations. Figure 10a show a large overshoot from the output of a device that was due to
reflections along the secondary output of the device. In this case the unterminated secondary output
was terminated with a 75-ohm termination in order to resolve this issue. The user will have to test the
signal at various points in the chain to determine from where the reflections are occurring, this could
occur at a patch panel, barrel connector or problem with a cable or connections.
Unequal rise and fall time of the transitions causes a shift in the 50% point of the eye display as shown
in Figure 10b. In this case the rise time is longer than the fall time of the signal and this caused a shift in
the cross point of the transition. This type of effect may occur with an optical to electrical converter or
other processing devices.
Figure 10a. Overshoot of eye display.
Both of these type of effects in of themselves do not cause a problem with recovery of the clock and
data, as you can see no CRC errors occurred in this signal. However these types of effects can
accumulate with other errors to lower the threshold of the signal and cause CRC errors to occur failure
of the transmission of the signal.
Figure 10b. Unequal Rise and Fall time.
13
www.tektronix.com/wfm2300
13
Page 14

SDI Eye and Jitter Measurements How-to Guide
Measuring Jitter within an SDI Signal
Jitter will be shown as deviation and widening of the transition within the eye display as shown in
Figure 11. This is caused by the transitions occurring at slightly different times.
Figure 11. Jitter shown within eye display.
1. Select one of the tiles (1, 2, 3 or 4) and press the PHY button.
2. Push and Hold the PHY button to enable the menu.
3. Using the up and down arrows to navigate to Display Type and press the right arrow to select the sub
menu.
4. Use the up and down arrows to select the Jitter Display.
5. Jitter can be observed at line or field rate by pushing the SWEEP button and toggling between line and
field sweep.
6. Push and Hold the SWEEP button to select the sweep mode and select 2Field to show the variation of
jitter over two video fields.
7. Push and Hold the GAIN button to change the gain to x1, x2, or x5 modes.
8. If additional gain is required the VAR Gain can be enable and increased to a maximum of ten times
gain if required as shown in Figure 12a
14
www.tektronix.com/wfm2300
14
Page 15
SDI Eye and Jitter Measurements How-to Guide
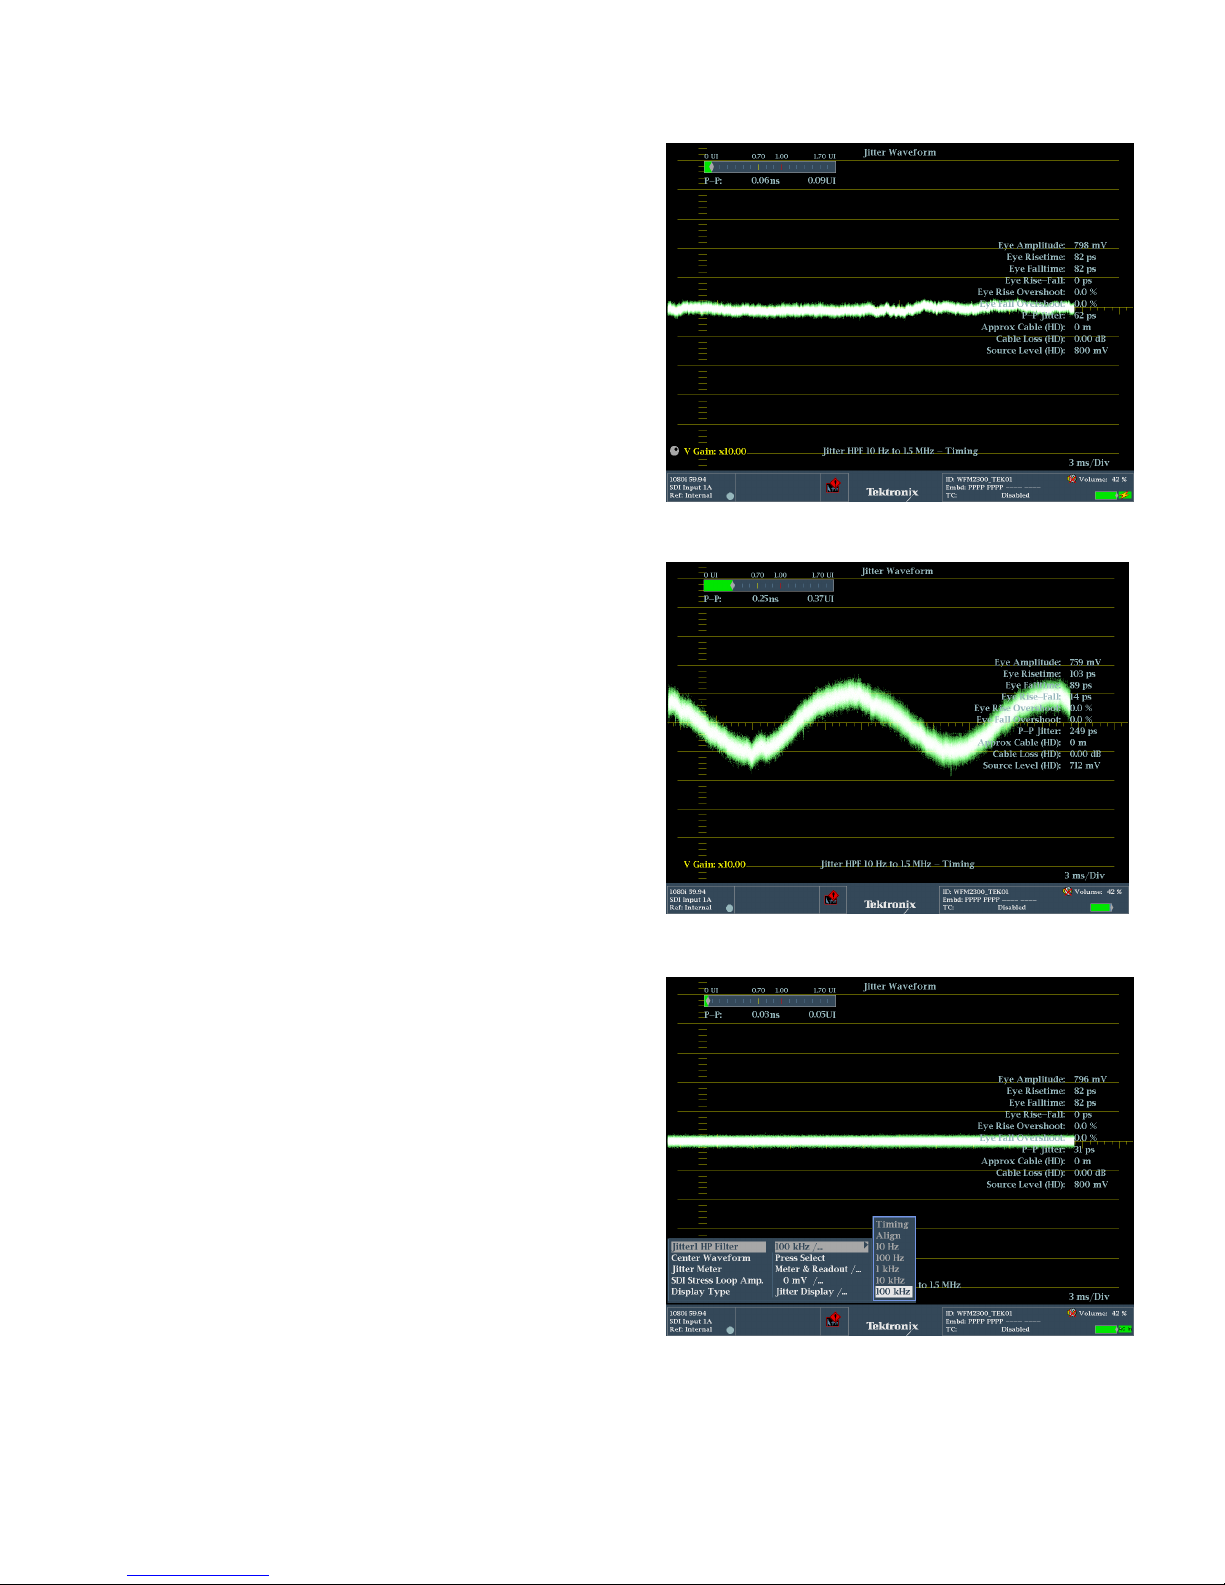
The jitter display can be used to evaluate the
types of jitter present in the signal. Relatively
low random jitter will produce a flat line within
the jitter display as shown in Figure 12a.
Vertical deviation of the jitter display shows
the amount of jitter present within the signal.
In Figure 12b a simple 60Hz sinusoidal jitter
has been added to the SDI signal and
produces a sine wave pattern within the jitter
display with an amplitude that represents the
amount of jitter present within the signal in
this case 0.37UI or 0.25ns.
Figure 12a and 12c jitter displays are from
the same signal with different filter selections
applied for the Jitter1 HP Filter. In Figure 12a
the Timing (10Hz) filter is used and shows a
value of 0.09UI. When the filter is changed to
100kHz (Alignment Jitter) the value is
reduced to 0.05UI.
In an active device typically more than one
frequency of jitter is present within the signal
and is a complex addition of various
frequency components typically at line and
field frequencies. The Jitter1 HP Filter can
be selected within the WFM2300 and various
filters can be selected between 10Hz and
100kHz. While changing the filter bandwidth
note the jitter value at each selection.
Typically most jitter will be present at line
and field rate so as the value of the filter is
increased to 10kHz or 100kHz the jitter value
should decrease.
1. Select one of the tiles (1, 2, 3 or 4) and
press the PHY button.
Figure 12a. Two Field Jitter display.
Figure 12b. Sinusoidal 60Hz jitter.
2. Push and Hold the PHY button to
enable the menu.
3. Using the up and down arrows to
navigate to Jitter1 HP Filter and press
right arrow to select the sub menu as
shown in Figure 12a.
4. Press SEL to enter the sub menu and
choose the jitter highpass filter (Timing,
Alignment, 10Hz, 100Hz, 1kHz, 10kHz,
100kHz).
15
www.tektronix.com/wfm2300
15
Figure 12c. Jitter HP Filter selection of 100kHz.
Page 16

SDI Eye and Jitter Measurements How-to Guide
Figure 13a. Jitter display with 10Hz HPF.
Figure 13b. Jitter display with 100Hz HPF.
Figures 13a and b show a HD-SDI signal from a tape machine and a variation of jitter across a two-field
sweep. Note that this signal is producing no CRC errors and is shown as an example of changing the Jitter1
HPF. When the 10Hz Timing filter is used the jitter meter shows a value of 0.3UI and you can see variation of
jitter at the field pulses and between blanking and the active line.
The Jitter1 HP filter was then changed to 100Hz as shown in Figure 13b. This jitter meter value drops to
0.21UI. Normally the phase lock loop (PLL) of an SDI device will track changes within a certain range at lower
frequencies related to line and field rate. At high frequencies it can be more difficult for the PLL to lock to
these large changes and this can cause unlocking of the PLL producing a disturbance to the clock and data
that will then produce errors. Therefore it is important to ensure there is minimal disturbance in the jitter
display at higher frequencies.
NOTE:
Jitter is represented in Unit Intervals (UI) where one unit interval is equal to the reciprocal of
the clock frequency of the SDI signal as shown in Figure 7a.
− For example an HD-SDI signal at 1.485Gb/s has a unit interval that is equal to 673.4ps
Timing Jitter is measured above 10Hz and therefore 10Hz and Timing selections within the
Jitter1 HP Filter are the same.
Alignment Jitter is measured at 1kHz for SD( Standard Definition) and at 100kHz for HD and
3G SDI signals
16
www.tektronix.com/wfm2300
16
Page 17

SDI Eye and Jitter Measurements How-to Guide
Figure 13c shows a jitter meter value of 0.16UI with a 1kHz high pass filter selected and Figure 13d shows
a jitter meter value of 0.09UI with a 100kHz high pass filter applied (Alignment).
In this case the jitter value has decreased as the HPF value has been increased and there is minimal jitter
within the Alignment HPF that means the PLL will be able to track this SDI signal to maintain the clock and
data of the signal.
Figure 13c. Jitter display with 1kHz HPF.
Figure 13d. Jitter display with 100kHz HPF.
There are certain circumstances when jitter is higher as the HPF is increased:
If there is a larger amount of jitter present when the 100kHz filter is selected then the PLL may have
problems tracking these changes and cause a disturbance to the clock and data that will produce errors
in the signal.
Another instance is if a jitter frequency is present at the passband of the high pass filter. The HP Filter
has a specific rolloff and jitter frequency present within the roll off bandwidth can be differentiated by the
filter and produce an increase in jitter value around this passband.
Jitter within the SDI signal arises from processing of active devices and can be due to signals that affect the
device’s phase lock loop such as noise from a power supply at 60Hz or a noisy video reference that is used to
genlock the device and affects the clock of the device. An MPEG decoder can also introduce jitter at the SDI
output if the program clock reference is not within limits and causes a disturbance to the clock within the
device.
17
www.tektronix.com/wfm2300
17
Page 18

SDI Eye and Jitter Measurements How-to Guide
Enabling Infinite Persistence Mode
The Eye and Jitter display are time varying trace displays and the infinite persistence mode of the WFM2300
can be used to determine the maximum variations within the eye or jitter displays.
To enable this function perform the following operation:
1. Select one of the tiles (1, 2, 3 or 4) and press the PHY button.
2. Select either the Eye or Jitter display
3. Press the DISPLAY button to bring up the menu
4. Use the up and down arrows to select the Infinite Persistence.
Press SEL to toggle the function On as shown in Figure 14
5.
Now the trace will build up over time until the trace is moved using the POS and General Knob
6.
controls or until the mode is turned Off.
Figure 14. Enabling Infinite Persistence within Display menu.
18
www.tektronix.com/wfm2300
18
Page 19

SDI Eye and Jitter Measurements How-to Guide
Using Infinite Persistence and cursors within the eye or jitter displays allows the user to see the maximum
variations of the SDI signal within the display. In some cases it may be observed that the jitter within the
jitter display or using the jitter meter is lower than that observed within the eye display trace. This is due
to the fact that the jitter display is bandwidth limited to the phase lock loop of the clock within the
instrument in order to represent the typical performance of a video device and to ensure a stable lock to
the SDI signal.
The eye display itself is not bandwidth limited and therefore may show more jitter or wander present
within the SDI signal as shown in Figure 15. In this case very low frequency jitter or wander that is
causing the trace to move within the display, produces large amounts of jitter within the eye. This is not
present within the Jitter display as the bandpass filter limits the frequency band of the resultant jitter. The
jitter meter shows 0.18ns of jitter whereas the measurement of total jitter in the eye display measures
0.217ns.
Figure 15. Using cursors within Infinite Persistence within Eye Display menu.
19
www.tektronix.com/wfm2300
19
Page 20

SDI Eye and Jitter Measurements How-to Guide
Conclusion
The status bar or the video session display provides information on the CRC errors that may be present
within the transmission link and provides the first indication that the SDI signal is getting close to the digital
cliff. The Stress Loop of the WFM2300 provides a 20m Belden 1694A cable simulation that can be added to
the link to ensure the addition of this simulated cable does not cause errors in the transmission link.
Additionally a stress signal can be added to the transmission of the SDI to see if this interfering signal causes
problems for the receiver.
Alternatively the user can select a pathological test signal to be generated from the WFM2300 to stress the
performance of the PLL or equalizer within the receiving device. The Eye and Jitter displays can be used to
inspect the performance of the SDI signal and determine possible problems within the link. While the SDI
Status displays provides a summary of the physical layer parameters and can be used to estimate the cable
length of the transmission path. Using these various techniques the physical layer characteristics of the
transmission path can be measured.
References
WFM2300 Waveform Monitors
Datasheets, fact sheets and additional product materials can be found at
http://www.tektronix.com/waveform-monitor/wfm2300
20
www.tektronix.com/wfm2300
20
Page 21

ASEAN / Australia (65) 6356 3900
Austria* 00800 2255 4835
Balkans, Israel, South Africa and other ISE Countries +41 52 675 3777
Central East Europe and the Baltics +41 52 675 3777
Central Europe & Greece +41 52 675 3777
Mexico, Central/South America & Caribbean 52 (55) 56 04 50 90
Middle East, Asia and North Africa +41 52 675 3777
People’s Republic of China 400-820-5835
Belgium* 00800 2255 4835
Brazil +55 (11) 3759 7627
Canada 1 (800) 833-9200
Denmark +45 80 88 1401
Finland +41 52 675 3777
France* 00800 2255 4835
Germany* 00800 2255 4835
Hong Kong 400-820-5835
Ireland* 00800 2255 4835
India +91-80-30792600
Italy* 00800 2255 4835
Japan 0120-441-046
Luxembourg +41 52 675 3777
Macau 400-820-5835
Mongolia 400-820-5835
The Netherlands* 00800 2255 4835
Norway 800 16098
Poland +41 52 675 3777
Portugal 80 08 12370
Puerto Rico 1 (800) 833-9200
Republic of Korea +822-6917-5000
Russia +7 (495) 7484900
Singapore +65 6356-3900
South Africa +27 11 206 8360
Spain* 00800 2255 4835
Sweden* 00800 2255 4835
Switzerland* 00800 2255 4835
Taiwan 886-2-2656-6688
United Kingdom* 00800 2255 4835
USA 1 (800) 833-9200
* If the European phone number above is not accessible, please call +41 52 675 3777
Contact List Updated March 2013
For Further Information
Tektronix maintains a comprehensive, constantly expanding
collection of application notes, technical briefs and other
resources to help engineers working on the cutting edge of
technology. Please visit www.tektronix.com
Copyright © 2014, Tektronix. All rights reserved. Tektronix products are covered by U.S. and foreign patents, issued and pending.
Information in this publication supersedes that in all previously published material. Specification and price change privileges
reserved. TEKTRONIX and TEK are registered trademarks of Tektronix, Inc. All other trade names referenced are the service
marks, trademarks or registered trademarks of their respective companies. 2/2014 25W-30137
 Loading...