


User Manual
VM100 & VM101
Video Measurement Sets
070-9522-05
This document supports firmware version 2.17
and above.

Copyright E Tektronix, Inc. All rights reserved. Printed in U.S.A.
Tektronix products are covered by U.S. and foreign patents, issued and
pending.
Information in this publication supersedes that in all previously published
material. Specifications and price change privileges reserved. The following
are registered trademarks: TEKTRONIX and TEK.
For product related information, phone: 800-TEKWIDE (800-835-9433),
ext. TV.
For further information, contact: Tektronix, Inc., Corporate Offices, P.O. Box
1000, Wilsonville, OR 97070–1000, U.S.A. Phone: (503) 627–7111; TLX:
192825; TWX: (910) 467–8708; Cable: TEKWSGT.

WARRANTY
T ektronix warrants that the products that it manufactures and sells will be free from defects
in materials and workmanship for a period of one (1) year from the date of shipment. If a
product proves defective during this warranty period, Tektronix, at its option, either will
repair the defective product without charge for parts and labor, or will provide a
replacement in exchange for the defective product.
In order to obtain service under this warranty , Customer must notify T ektronix of the defect
before the expiration of the warranty period and make suitable arrangements for the
performance of service. Customer shall be responsible for packaging and shipping the
defective product to the service center designated by Tektronix, with shipping charges
prepaid. Tektronix shall pay for the return of the product to Customer if the shipment is to
a location within the country in which the Tektronix service center is located. Customer
shall be responsible for paying all shipping charges, duties, taxes, and any other charges for
products returned to any other locations.
This warranty shall not apply to any defect, failure or damage caused by improper use or
improper or inadequate maintenance and care. Tektronix shall not be obligated to furnish
service under this warranty a) to repair damage resulting from attempts by personnel other
than Tektronix representatives to install, repair or service the product; b) to repair damage
resulting from improper use or connection to incompatible equipment; c) to repair any
damage or malfunction caused by the use of non-Tektronix supplies; or d) to service a
product that has been modified or integrated with other products when the effect of such
modification or integration increases the time or difficulty of servicing the product.
THIS WARRANTY IS GIVEN BY TEKTRONIX IN LIEU OF ANY OTHER
WARRANTIES, EXPRESS OR IMPLIED. TEKTRONIX AND ITS VENDORS
DISCLAIM ANY IMPLIED WARRANTIES OF MERCHANTABILITY OR
FITNESS FOR A PARTICULAR PURPOSE. TEKTRONIX’ RESPONSIBILITY
TO REPAIR OR REPLACE DEFECTIVE PRODUCTS IS THE SOLE AND
EXCLUSIVE REMEDY PROVIDED TO THE CUSTOMER FOR BREACH OF
THIS WARRANTY. TEKTRONIX AND ITS VENDORS WILL NOT BE LIABLE
FOR ANY INDIRECT, SPECIAL, INCIDENTAL, OR CONSEQUENTIAL
DAMAGES IRRESPECTIVE OF WHETHER TEKTRONIX OR THE VENDOR
HAS ADVANCE NOTICE OF THE POSSIBILITY OF SUCH DAMAGES.

Service Assurance
If you have not already purchased Service Assurance for this product, you may
do so at any time during the product’ s warranty period. Service Assurance
provides Repair Protection and Calibration Services to meet your needs.
Repair Protection extends priority repair services beyond the product’s
warranty period; you may purchase up to three years of Repair Protection.
Calibration Services provide annual calibration of your product, standards
compliance and required audit documentation, recall assurance, and reminder
notification of scheduled calibration. Coverage begins upon registration; you
may purchase up to five years of Calibration Services.
Service Assurance Advantages
H Priced well below the cost of a single repair or calibration
H Avoid delays for service by eliminating the need for separate purchase
authorizations from your company
H Eliminates unexpected service expenses
For Information and Ordering
For more information or to order Service Assurance, contact your Tektronix
representative and provide the information below. Service Assurance may not
be available in locations outside the United States of America.
Name VISA or Master Card number and expiration
Company date or purchase order number
Address Repair Protection (1,2, or 3 years)
City, State, Postal code Calibration Services (1,2,3,4, or 5 years)
Country Instrument model and serial number
Phone Instrument purchase date

Table of Contents
General Safety Summary x. . . . . . . . . . . . . . . . . . . . . . . . . . . .
Preface xiii. . . . . . . . . . . . . . . . . . . . . . . . . . . . . . . . . . . . . . . . . . . .
Manual Overview xiii. . . . . . . . . . . . . . . . . . . . . . . . . . . . . . . . .
Documentation Set xiv. . . . . . . . . . . . . . . . . . . . . . . . . . . . . . . .
Getting Started
Product Description 1–1. . . . . . . . . . . . . . . . . . . . . . . . . . . . . . .
Options 1–3. . . . . . . . . . . . . . . . . . . . . . . . . . . . . . . . . . . . . . . . .
Accessories 1–4. . . . . . . . . . . . . . . . . . . . . . . . . . . . . . . . . . . . .
Mechanical Installation 1–4. . . . . . . . . . . . . . . . . . . . . . . . . . . .
Custom Installation 1–5. . . . . . . . . . . . . . . . . . . . . . . . . . . . . . .
Rackmounting 1–5. . . . . . . . . . . . . . . . . . . . . . . . . . . . . . . . . . .
Electrical Installation 1–6. . . . . . . . . . . . . . . . . . . . . . . . . . . . . .
Power Source Requirements 1–6. . . . . . . . . . . . . . . . . . . . . . . .
Power On Procedure 1–6. . . . . . . . . . . . . . . . . . . . . . . . . . . . . .
First Time Operation 1–7. . . . . . . . . . . . . . . . . . . . . . . . . . . . . .
Configure the Measurements 1–9. . . . . . . . . . . . . . . . . . . . . . . .
Configure the Zero Carrier Reference Pulse Trigger Output 1–10
Configure the Signal Identification Range 1–11. . . . . . . . . . . . .
Configure the Full Field Start Line 1–11. . . . . . . . . . . . . . . . . . .
Configure the Reference 1–12. . . . . . . . . . . . . . . . . . . . . . . . . . .
Configure the Hum Measurement (VM100 Only) 1–12. . . . . . . .
Configure the Signal-to-Noise Ratio Filter 1–13. . . . . . . . . . . . .
Configure the Luminance Nonlinearity Mode 1–13. . . . . . . . . . .
Configure the Limit Table Selection 1–13. . . . . . . . . . . . . . . . . .
Configure for Printing 1–14. . . . . . . . . . . . . . . . . . . . . . . . . . . . .
Configure for Computer Communications 1–15. . . . . . . . . . . . .
Configure for Waveform Monitor Control Function 1–17. . . . . .
Configure the Date 1–18. . . . . . . . . . . . . . . . . . . . . . . . . . . . . . . .
Configure the Time 1–18. . . . . . . . . . . . . . . . . . . . . . . . . . . . . . .
Adjust the LCD View Angle 1–19. . . . . . . . . . . . . . . . . . . . . . . .
Display the Software Version Number 1–19. . . . . . . . . . . . . . . .
Calibration 1–20. . . . . . . . . . . . . . . . . . . . . . . . . . . . . . . . . . . . . .
VM100 & VM101 User Manual
i

Table of Contents
Operating Basics
Functional Overview 2–1. . . . . . . . . . . . . . . . . . . . . . . . . . . . . .
Front Panel Buttons and LCD Display 2–2. . . . . . . . . . . . . .
Menus 2–4. . . . . . . . . . . . . . . . . . . . . . . . . . . . . . . . . . . . . . .
Rear Panel Connectors 2–7. . . . . . . . . . . . . . . . . . . . . . . . . .
Tutorial 2–9. . . . . . . . . . . . . . . . . . . . . . . . . . . . . . . . . . . . . . . . .
Initial Setup 2–10. . . . . . . . . . . . . . . . . . . . . . . . . . . . . . . . . .
Instrument Configuration 2–11. . . . . . . . . . . . . . . . . . . . . . . .
Signal Identification 2–12. . . . . . . . . . . . . . . . . . . . . . . . . . . .
Signal Measurements 2–13. . . . . . . . . . . . . . . . . . . . . . . . . . .
Freezing the Measurement Activity 2–14. . . . . . . . . . . . . . . .
Storing Measurement Results 2–15. . . . . . . . . . . . . . . . . . . .
Printing Measurement and Signal Identification Results 2–17
Using Limits 2–19. . . . . . . . . . . . . . . . . . . . . . . . . . . . . . . . . .
Reference
General Feature Reference 3–1. . . . . . . . . . . . . . . . . . . . . . . . . . .
Signal Averaging 3–2. . . . . . . . . . . . . . . . . . . . . . . . . . . . . . . . .
Freezing the Measurement Activity 3–3. . . . . . . . . . . . . . . . . . .
Using Signal Identification 3–3. . . . . . . . . . . . . . . . . . . . . . . . .
Using Memory Functions 3–6. . . . . . . . . . . . . . . . . . . . . . . . . .
Printing Measurement Results 3–11. . . . . . . . . . . . . . . . . . . . . . .
Using the Waveform Monitor Control Function 3–14. . . . . . . . .
Using the Zero Carrier Reference Pulse Output 3–16. . . . . . . . .
Taking NTSC Measurements (VM100) 3–17. . . . . . . . . . . . . . . . .
Measuring Differential Phase 3–20. . . . . . . . . . . . . . . . . . . . . . . .
Measuring Differential Gain 3–22. . . . . . . . . . . . . . . . . . . . . . . .
Measuring YC Delay 3–24. . . . . . . . . . . . . . . . . . . . . . . . . . . . . .
Measuring YC Gain 3–26. . . . . . . . . . . . . . . . . . . . . . . . . . . . . . .
Measuring Signal-to-Noise Ratio 3–27. . . . . . . . . . . . . . . . . . . .
Measuring Frequency Response (FCC) 3–29. . . . . . . . . . . . . . . .
Measuring Frequency Response Detail 3–32. . . . . . . . . . . . . . . .
Measuring Group Delay 3–34. . . . . . . . . . . . . . . . . . . . . . . . . . . .
Measuring Sync Amplitude 3–35. . . . . . . . . . . . . . . . . . . . . . . . .
Measuring Burst Amplitude 3–36. . . . . . . . . . . . . . . . . . . . . . . . .
Measuring Bar Amplitude 3–37. . . . . . . . . . . . . . . . . . . . . . . . . .
Measuring 2T K-Factor 3–38. . . . . . . . . . . . . . . . . . . . . . . . . . . .
Measuring Luminance Nonlinearity 3–39. . . . . . . . . . . . . . . . . .
Measuring Hum 3–40. . . . . . . . . . . . . . . . . . . . . . . . . . . . . . . . . .
ii
VM100 & VM101 User Manual

Table of Contents
Taking PAL Measurements (VM101) 3–43. . . . . . . . . . . . . . . . . .
Measuring Differential Phase 3–46. . . . . . . . . . . . . . . . . . . . . . . .
Measuring Differential Gain 3–48. . . . . . . . . . . . . . . . . . . . . . . .
Measuring YC Delay 3–49. . . . . . . . . . . . . . . . . . . . . . . . . . . . . .
Measuring YC Gain 3–51. . . . . . . . . . . . . . . . . . . . . . . . . . . . . . .
Measuring Signal-to-Noise Ratio 3–52. . . . . . . . . . . . . . . . . . . .
Measuring Frequency Response (AVG) 3–54. . . . . . . . . . . . . . .
Measuring Frequency Response Detail 3–56. . . . . . . . . . . . . . . .
Measuring Group Delay 3–58. . . . . . . . . . . . . . . . . . . . . . . . . . . .
Measuring Sync Amplitude 3–59. . . . . . . . . . . . . . . . . . . . . . . . .
Measuring Burst Amplitude 3–60. . . . . . . . . . . . . . . . . . . . . . . . .
Measuring Bar Amplitude 3–61. . . . . . . . . . . . . . . . . . . . . . . . . .
Measuring 2T K-Factor 3–62. . . . . . . . . . . . . . . . . . . . . . . . . . . .
Measuring Luminance Nonlinearity 3–63. . . . . . . . . . . . . . . . . .
Measuring Hum 3–65. . . . . . . . . . . . . . . . . . . . . . . . . . . . . . . . . .
Appendices
Appendix A: Specifications A–1. . . . . . . . . . . . . . . . . . . . . . . . . . .
Terms Used in Specifications A–1. . . . . . . . . . . . . . . . . . . . . . . .
Performance Conditions A–1. . . . . . . . . . . . . . . . . . . . . . . . . . . .
Electrical Specifications A–2. . . . . . . . . . . . . . . . . . . . . . . . . . . .
Environmental Characteristics A–5. . . . . . . . . . . . . . . . . . . . . . .
Safety Standards and Certification A–6. . . . . . . . . . . . . . . . . . . .
Physical Characteristics A–8. . . . . . . . . . . . . . . . . . . . . . . . . . . .
Remote Control Port A–8. . . . . . . . . . . . . . . . . . . . . . . . . . . . . .
Appendix B: Remote Control B–1. . . . . . . . . . . . . . . . . . . . . . . . .
RS-232 Interface B–1. . . . . . . . . . . . . . . . . . . . . . . . . . . . . . . . .
SCPI B–4. . . . . . . . . . . . . . . . . . . . . . . . . . . . . . . . . . . . . . . . . . .
Remote Applications B–5. . . . . . . . . . . . . . . . . . . . . . . . . . . . . .
Commands and Queries B–6. . . . . . . . . . . . . . . . . . . . . . . . . . . .
Command Syntax B–6. . . . . . . . . . . . . . . . . . . . . . . . . . . . . . . . .
Entering Commands B–9. . . . . . . . . . . . . . . . . . . . . . . . . . . . . . .
Summary of Commands B–11. . . . . . . . . . . . . . . . . . . . . . . . . . .
Command Header B–7. . . . . . . . . . . . . . . . . . . . . . . . . . . . . .
Parameter B–8. . . . . . . . . . . . . . . . . . . . . . . . . . . . . . . . . . . .
Message Terminator and Message Separator B–9. . . . . . . . .
Command Characters B–10. . . . . . . . . . . . . . . . . . . . . . . . . . .
Abbreviating Commands B–10. . . . . . . . . . . . . . . . . . . . . . . .
Combining Commands B–10. . . . . . . . . . . . . . . . . . . . . . . . . .
Front Panel Commands B–12. . . . . . . . . . . . . . . . . . . . . . . . .
VM100 & VM101 User Manual
iii

Table of Contents
Command List B–25. . . . . . . . . . . . . . . . . . . . . . . . . . . . . . . . . . .
Appendix C: Performance Verification C–1. . . . . . . . . . . . . . . . .
General Information C–1. . . . . . . . . . . . . . . . . . . . . . . . . . . . . . .
Prerequisites C–2. . . . . . . . . . . . . . . . . . . . . . . . . . . . . . . . . . . . .
Equipment Requirements C–2. . . . . . . . . . . . . . . . . . . . . . . . . . .
Test Record C–4. . . . . . . . . . . . . . . . . . . . . . . . . . . . . . . . . . . . .
Performance Verification Procedure C–6. . . . . . . . . . . . . . . . . .
Appendix D: Error Messages D–1. . . . . . . . . . . . . . . . . . . . . . . . .
Measurement Commands B–12. . . . . . . . . . . . . . . . . . . . . . . .
Memory Commands B–14. . . . . . . . . . . . . . . . . . . . . . . . . . . .
Signal Change Commands B–15. . . . . . . . . . . . . . . . . . . . . . .
Configuration Commands B–17. . . . . . . . . . . . . . . . . . . . . . .
Report Measurements Commands B–23. . . . . . . . . . . . . . . . .
Help Commands B–23. . . . . . . . . . . . . . . . . . . . . . . . . . . . . . .
Glossary
Index
iv
VM100 & VM101 User Manual

List of Figures
Figure 2–1: Front panel 2–2. . . . . . . . . . . . . . . . . . . . . . . . . . .
Figure 2–2: LCD display characteristics 2–4. . . . . . . . . . . . .
Figure 2–3: The Meas, Mem, and Print menus 2–5. . . . . . . .
Figure 2–4: The CONFIG menu 2–6. . . . . . . . . . . . . . . . . . . .
Figure 2–5: Rear panel connectors 2–7. . . . . . . . . . . . . . . . .
Figure 2–6: Equipment setup for the tutorial 2–10. . . . . . . . .
Figure 2–7: Example of the initial SIG ID display 2–12. . . . .
Figure 2–8: Example of a SIG ID display with source
ID code 2–12. . . . . . . . . . . . . . . . . . . . . . . . . . . . . . . . . . . . .
Table of Contents
Figure 2–9: Example of differential phase measurement
results 2–13. . . . . . . . . . . . . . . . . . . . . . . . . . . . . . . . . . . . . .
Figure 2–10: Measurements saved to memory 2–15. . . . . . . .
Figure 2–11: Renaming a memory location 2–16. . . . . . . . . . .
Figure 2–12: Date and time stamp display 2–17. . . . . . . . . . .
Figure 2–13: Adding a title 2–18. . . . . . . . . . . . . . . . . . . . . . . .
Figure 2–14: Typical high-limit error display 2–19. . . . . . . . .
Figure 2–15: Limit Violation 2–20. . . . . . . . . . . . . . . . . . . . . .
Figure 3–1: Example of a SIG ID display with source
ID code 3–4. . . . . . . . . . . . . . . . . . . . . . . . . . . . . . . . . . . . .
Figure 3–2: Example of display after saving to memory 3–6
Figure 3–3: Renaming a memory location 3–7. . . . . . . . . . .
Figure 3–4: Date and time stamp display 3–8. . . . . . . . . . . .
Figure 3–5: Connecting to a printer 3–11. . . . . . . . . . . . . . . . .
Figure 3–6: Adding a title 3–12. . . . . . . . . . . . . . . . . . . . . . . . .
Figure 3–7: Cable pinout for waveform monitor control
function 3–14. . . . . . . . . . . . . . . . . . . . . . . . . . . . . . . . . . . . .
Figure 3–8: Example of differential phase measurement
results 3–17. . . . . . . . . . . . . . . . . . . . . . . . . . . . . . . . . . . . . .
VM100 & VM101 User Manual
v

Table of Contents
Figure 3–9: Differential phase measurement screen 3–21. . .
Figure 3–10: Differential gain measur ement screen 3–23. . . .
Figure 3–11: Chrominance-to-luminance delay
measurement screen 3–25. . . . . . . . . . . . . . . . . . . . . . . . . . .
Figure 3–12: Chrominance-to-luminance gain
measurement screen 3–26. . . . . . . . . . . . . . . . . . . . . . . . . . .
Figure 3–13: Signal-to-noise ratio measurement scr een 3–28
Figure 3–14: Frequency response measurement screen 3–30.
Figure 3–15: Frequency flag measurement results 3–32. . . . .
Figure 3–16: Frequency detail screen showing first
packet 3–33. . . . . . . . . . . . . . . . . . . . . . . . . . . . . . . . . . . . . .
Figure 3–17: Measurement scr een showing maximum
packet amplitude 3–33. . . . . . . . . . . . . . . . . . . . . . . . . . . . .
Figure 3–18: Group delay measur ement screen 3–34. . . . . . .
Figure 3–19: Sync amplitude measurement scr een 3–35. . . .
Figure 3–20: Burst amplitude measurement scr een 3–36. . . .
Figure 3–21: Bar amplitude measurement scr een 3–37. . . . .
Figure 3–22: 2T K-factor measur ement screen 3–38. . . . . . . .
Figure 3–23: Luminance nonlinearity measurement
screen 3–40. . . . . . . . . . . . . . . . . . . . . . . . . . . . . . . . . . . . . . .
Figure 3–24: Hum measurement scr een with ZCR pulse 3–41
Figure 3–25: Hum measurement scr een with no
ZCR pulse 3–41. . . . . . . . . . . . . . . . . . . . . . . . . . . . . . . . . . .
Figure 3–26: Example of differential phase
measurement results 3–43. . . . . . . . . . . . . . . . . . . . . . . . . .
Figure 3–27: Differential phase measur ement screen 3–47. .
Figure 3–28: Differential gain measur ement screen 3–49. . . .
Figure 3–29: Chrominance-to-luminance delay
measurement screen 3–50. . . . . . . . . . . . . . . . . . . . . . . . . . .
vi
Figure 3–30: Chrominance-to-luminance gain
measurement screen 3–51. . . . . . . . . . . . . . . . . . . . . . . . . . .
Figure 3–31: Signal-to-noise ratio measurement scr een 3–53
VM100 & VM101 User Manual

Table of Contents
Figure 3–32: Frequency response measurement screen 3–55.
Figure 3–33: Frequency flag measurement screen 3–56. . . . .
Figure 3–34: Frequency detail screen showing first
packet 3–57. . . . . . . . . . . . . . . . . . . . . . . . . . . . . . . . . . . . . .
Figure 3–35: Measurement scr een showing maximum
packet amplitude 3–57. . . . . . . . . . . . . . . . . . . . . . . . . . . . .
Figure 3–36: Group delay measur ement screen 3–58. . . . . . .
Figure 3–37: Sync amplitude measurement scr een 3–59. . . .
Figure 3–38: Burst amplitude measurement scr een 3–60. . . .
Figure 3–39: Bar amplitude measurement scr een 3–61. . . . .
Figure 3–40: 2T K-factor measur ement screen 3–62. . . . . . . .
Figure 3–41: Luminance nonlinearity measurement
screen 3–64. . . . . . . . . . . . . . . . . . . . . . . . . . . . . . . . . . . . . . .
Figure 3–42: Hum measurement scr een with ZCR pulse 3–65
Figure 3–43: Hum measurement scr een with no
ZCR pulse 3–66. . . . . . . . . . . . . . . . . . . . . . . . . . . . . . . . . . .
Figure B–1: Rear panel RS-232 serial port (female) B–2. . .
Figure B–2: Remote control wiring, VM10X to nine-pin
PC connector B–3. . . . . . . . . . . . . . . . . . . . . . . . . . . . . . . .
Figure B–3: Remote control wiring, VM10X to 25-pin
PC connector B–3. . . . . . . . . . . . . . . . . . . . . . . . . . . . . . . .
Figure B–4: Remote control wiring, VM10X to 25-pin
modem connector B–4. . . . . . . . . . . . . . . . . . . . . . . . . . . . .
Figure B–5: Examples of remote operation B–5. . . . . . . . . . .
Figure B–6: Tree hierarchy B–7. . . . . . . . . . . . . . . . . . . . . . . .
Figure B–7: Command header B–7. . . . . . . . . . . . . . . . . . . . .
Figure B–8: Command header with parameter B–8. . . . . . .
Figure C–1: Initial setup for the PV Procedure C–6. . . . . . .
VM100 & VM101 User Manual
vii

Table of Contents
List of Tables
Table 1–1: Power cord identification 1–3. . . . . . . . . . . . . . .
Table 1–2: Configuration parameters 1–7. . . . . . . . . . . . . . .
Table 1–3: Print parameters 1–15. . . . . . . . . . . . . . . . . . . . . .
Table 1–4: Computer interface parameters 1–16. . . . . . . . . .
Table 2–1: Equipment for tutorial 2–9. . . . . . . . . . . . . . . . .
Table 3–1: Additional signals identified by SIG ID
mode 3–5. . . . . . . . . . . . . . . . . . . . . . . . . . . . . . . . . . . . . . .
Table 3–2: Control function communications
parameters 3–15. . . . . . . . . . . . . . . . . . . . . . . . . . . . . . . . . .
Table 3–3: VITS signals used for NTSC measurements 3–19
Table 3–4: Packet frequencies for measuring frequency
response 3–30. . . . . . . . . . . . . . . . . . . . . . . . . . . . . . . . . . . .
Table 3–5: Test signals used for PAL measurements 3–45. .
Table A–1: Input signal requirements–VIDEO INPUT A–2
Table A–2: Input signal requirements–EXT REF A–2. . . . .
Table A–3: Measurement accuracy A–3. . . . . . . . . . . . . . . . .
Table A–4: Output A–5. . . . . . . . . . . . . . . . . . . . . . . . . . . . . .
Table A–5: AC power source A–5. . . . . . . . . . . . . . . . . . . . .
Table A–6: Environmental characteristics A–5. . . . . . . . . .
Table A–7: Certifications and compliances A–6. . . . . . . . . .
Table A–8: Physical characteristics A–8. . . . . . . . . . . . . . . .
Table A–9: Remote control port A–8. . . . . . . . . . . . . . . . . . .
Table B–1: RS-232 pin connections B–2. . . . . . . . . . . . . . . . .
Table B–2: Parameter types for syntax descriptions B–8. . .
viii
Table B–3: Front panel commands B–12. . . . . . . . . . . . . . . . .
Table B–4: Measurement commands B–13. . . . . . . . . . . . . . .
Table B–5: Memory commands B–14. . . . . . . . . . . . . . . . . . . .
Table B–6: Signal change commands B–15. . . . . . . . . . . . . . .
VM100 & VM101 User Manual

Table of Contents
Table B–7: Configuration commands B–17. . . . . . . . . . . . . . .
Table B–8: Report measurements commands B–23. . . . . . . .
Table B–9: Help commands B–23. . . . . . . . . . . . . . . . . . . . . . .
Table B–10: CONfig:LINe subcommands B–34. . . . . . . . . . .
Table B–11: CONfig:LINe available lines B–35. . . . . . . . . . .
Table B–12: CONfig:MEAs subcommands B–37. . . . . . . . . .
Table B–13: NEXTmeas subcommands B–76. . . . . . . . . . . . .
Table B–14: PREVmeas subcommands B–78. . . . . . . . . . . . .
Table B–15: REP subcommands B–83. . . . . . . . . . . . . . . . . . .
Table C–1: Test equipment C–3. . . . . . . . . . . . . . . . . . . . . . . .
Table D–1: Error messages for manual operation D–1. . . . .
Table D–2: Error messages for remote operation D–1. . . . .
VM100 & VM101 User Manual
ix

General Safety Summary
Review the following safety precautions to avoid injury and prevent
damage to this product or any products connected to it.
Only qualified personnel should perform service procedures.
If this equipment is used in any manner not specified, including
failure to follow any rating or direction for use, the protection
provided by the equipment may be impaired.
Injury Precautions
Use Proper Power Cord. To avoid fire hazard, use only the power cord
specified for this product.
Avoid Overvoltage. To avoid electric shock or fire hazard, do not apply
potential to any terminal, including the common terminal, that varies
from ground by more than the maximum rating for that terminal.
Ground the Product. This product is grounded through the grounding
conductor of the power cord. To avoid electric shock, the grounding
conductor must be connected to earth ground. Before making
connections to the input or output terminals of the product, ensure
that the product is properly grounded.
Do Not Operate Without Covers. To avoid electric shock or fire hazard,
do not operate this product with covers or panels removed.
Use Proper Fuse. To avoid fire hazard, use only the fuse type and
rating specified for this product.
Do Not Operate in Wet/Damp Conditions. To avoid electric shock, do not
operate this product in wet or damp conditions.
Do Not Operate in an Explosive Atmosphere. To avoid injury or fire
hazard, do not operate this product in an explosive atmosphere.
Product Damage Precautions
Use Proper Power Source. Do not operate this product from a power
source that applies more than the voltage specified.
Provide Proper Ventilation. To prevent product overheating, provide
proper ventilation.
x
VM100 & VM101 User Manual

General Safety Summary
Do Not Operate With Suspected Failures. If you suspect there is damage
to this product, have it inspected by qualified service personnel.
Safety Terms and Symbols
Terms in This Manual. These terms may appear in this manual:
WARNING. Warning statements identify conditions or practices that
could result in injury or loss of life.
CAUTION. Caution statements identify conditions or practices that
could result in damage to this product or other property.
Terms on the Product. These terms may appear on the product:
DANGER indicates an injury hazard immediately accessible as you
read the marking.
WARNING indicates an injury hazard not immediately accessible as
you read the marking.
CAUTION indicates a hazard to property including the product.
Symbols on the Product. These symbols may appear on the product:
DANGER
High Voltage
Protective Ground
(Earth) Terminal
ATTENTION
Refer to Manual
Double
Insulated
Certifications and Compliances
Refer to the specifications section for a listing of certifications and
compliances that apply to this product.
VM100 & VM101 User Manual
xi

General Safety Summary
xii
VM100 & VM101 User Manual

Preface
This is the user manual for the video measurement set. It contains
information about the NTSC (VM100
of the instrument. When operating instructions are different for
NTSC and PAL, you will receive complete instructions for each
version.
Manual Overview
You will find the following topics covered in this manual:
H Getting Started explains how to set up the video measurement set
for first-time operation. The section also provides a list of the
accessories and options you can purchase.
H Operating Basics explains the operation of each control,
indicator, and connector on the front and rear panels. The tutorial
helps first-time operators use many of the instrument features.
) and PAL (VM101) versions
H Reference provides a more detailed explanation of instrument
features and explains how to use each of the built-in signal
measurements.
H Appendix A: Specifications lists all instrument specifications and
certifications.
H Appendix B: Remote Control explains how to operate the video
measurement set using the RS-232 remote interface.
H Appendix C: Performance Verification explains how to verify the
video measurement set performance.
H Appendix D: Error Messages lists the error messages you might
receive when operating the video measurement set and gives the
actions you must take in response to each message.
VM100 & VM101 User Manual
xiii

Preface
Documentation Set
The VM100 and VM101 Video Measurement Sets are supported
by two manuals:
H The VM100 & VM101 Video Measurement Sets User Manual
(Tektronix part number 070-9522-XX) is included with each
instrument
H The VM100 & VM101 Video Measurement Sets Service Manual
(Tektronix part number 070-9288-XX) is an optional accessory
that you can purchase from Tektronix
xiv
VM100 & VM101 User Manual

Getting Started


Getting Started
This section provides the information you need to use the video
measurement set for the first time. Refer to the following sections to
prepare the instrument for operation:
H Product Description on page 1–1 describes the instrument
features
H Options on page 1–3 provides a list of the available options
H Accessories on page 1–4 describes the accessories that are
available for use with the video measurement set
H Mechanical Installation on page 1–4 describes different ways
for you to rackmount the video measurement set
H Electrical Installation on page 1–6 explains how to power on
the video measurement set
H First T ime Operation on page 1–7 explains how to configure the
video measurement set features for your application
Product Description
The Tektronix VM100 and VM101 Video Measurement Sets are
low-cost, automatic video measurement instruments. The VM100
measures NTSC signals and the VM101 measures PAL signals.
The video measurement sets are easy to operate. They use existing or
inserted test signals and take measurements consistent with
regulatory specifications. The video measurement sets allow you to
perform measurements that are useful for ensuring the quality of
your video signals.
The video measurement sets display measurement results on an
easy-to-read alphanumeric LCD screen with backlight. You can also
display measurement results on a serial printer or remote PC using
the RS-232 serial port.
VM100 & VM101 User Manual
1–1

Getting Started
The video measurement sets perform the following measurements
(on-screen labels are shown in parentheses):
H Differential Phase (DIFF PHASE)
H Differential Gain (DIFF GAIN)
H Chrominance-to-Luminance Delay (YC DELAY)
H Chrominance-to-Luminance Gain (YC GAIN)
H Signal-to-Noise Ratio (SNR WGT/FLAT)
H Frequency Response (FREQ FCC or AVG)
H Frequency Response Detail (FREQ FLAG, FREQ #1 through
H Group Delay (GRPDLYmax and GRPDLYmin)
FREQ #6) or (FRQmax and FRQmin)
H Sync Amplitude (SYNC AMPL)
H Burst Amplitude (BURST AMPL)
H Bar Amplitude (BAR AMPL)
H 2T K-Factor (2T K-FACTOR)
H Luminance Nonlinearity (LUM NON-LIN)
H Hum (HUM P-P, 50/60 Hz, and 100/120 Hz)
1–2
VM100 & VM101 User Manual

Options
You can purchase the video measurement set with one of the power
cord options shown in Table 1–1.
Table 1–1: Power cord identification
Getting Started
Plug Configuration
Normal Usage Option Number
North America
115 V
Europe
230 V
United Kingdom
230 V
Australia
230 V
Standard
A1
A2
A3
VM100 & VM101 User Manual
1–3

Getting Started
Accessories
When unpacking the video measurement set for the first time, check
inside the shipping carton for the following standard accessories:
H VM100 & VM101 Video Measurement Sets User Manual
(Tektronix part number 070-9522-XX)
H Power cable assembly, standard USA, 125 V (Tektronix part
number 161-0216-00)
H Replacement cushioning pads, six each (Tektronix part number
348-0844-00)
You can order optional accessories with the video measurement set
or purchase them through a Tektronix field office or distributor. The
following optional accessories are available:
H VM100 & VM101 Video Measurement Sets Service Manual
(Tektronix part number 070-9288-XX)
H RS-232 Cable, DCE to DTE
(Tektronix part number 174-1809-00)
H TVGF15 Mounting Kit
For use with a 1740A-series waveform monitor)
Mechanical Installation
The video measurement set requires no assembly. Please read the
following sections before installing the video measurement set into a
console or equipment rack.
NOTE. All qualification testing was performed with the factoryshipped cabinet installed. To guarantee compliance with specifications, operate the instrument only in the original cabinet.
1–4
VM100 & VM101 User Manual

Getting Started
Custom Installation
CAUTION. To avoid damage to the video measurement set, be sure to
attach it to a shelf that is strong enough to hold its weight
(4 lbs/1.81 kg).
For applications that require installation into consoles, the video
measurement set can be mounted with the front molding flush or
protruding from the console. Always allow approximately 3 inches
(7.6 cm) of rear panel clearance for cable and power cord
connections.
Rackmounting
The video measurement set is one-half-rack wide and one rack unit
high. It requires approximately 3 inches (7.6 cm) of rear panel
clearance for power cord and cable connections and 20 inches
(50.8 cm) in front of the rack for installation and removal.
You can order the following rackmounting kits from Tektronix:
H TVGF13 adapter (mounts two half-rack width instruments
side-by-side in a standard 19-inch rack)
H TVGF14 adapter (allows you to mount two half-rack width
instruments in a standard half-rack application)
NOTE. The video measurement set fits only in the lower portion of the
TVGF14 adapter.
VM100 & VM101 User Manual
1–5

Getting Started
Electrical Installation
This section explains how to connect the video measurement set to
an AC power source and how to recognize when the power on
sequence is complete. If you want to connect a printer, personal
computer (PC), or waveform monitor to the RS-232 serial port, refer
to page 1–14 and Appendix B: Remote Control for more information.
Power Source Requirements
WARNING. To avoid personal injury due to electrical shock, never
operate the video measurement set without the protective ground
connection by way of the grounding conductor in the power cord.
The video measurement set operates over the range of 90 V
250 V
apply more than 250 V
at either 50 Hz or 60 Hz. The power source should never
RMS
between the supply conductors or
RMS
rms
to
between either supply conductor and ground.
Power On Procedure
To power on the video measurement set, connect it to the AC power
source. There is no power switch.
The power on sequence completes in approximately 10 seconds.
After power on completes, check for the following conditions:
H The LCD display shows the message “No video present, or no
lock possible” (if no signals are connected to the rear panel
INPUT connector).
H The MEAS button indicator lights.
NOTE. The AVG button indicator lights at power on if the A VG
feature was in use when AC power was last disconnected.
1–6
VM100 & VM101 User Manual

First Time Operation
This section guides you through the configuration of each operating
parameter. (No configuration is necessary for basic operation.) Refer
to Table 1–2 for an overview of the parameters you can configure,
the location of the configuration instructions, and the factory default
values.
You can configure most parameters using a computer. Refer to
Appendix B: Remote Control for a listing of the remote commands.
T able 1–2: Configuration parameters
Getting Started
Parameter
MEASURE 1–9 SNR is ON; all other mea-
ZCR PULSE 1–10 VM100: Line 10
SIG ID RANGE 1–11 VITS
FULL FLD START 1–11 23
REF 1–12 INPUT
HUM (VM100 ONLY) 1–12 60HZ
SNR FILTER 1–13 WEIGHTD
LUM NON LIN 1–13 NORMAL
LIMITS 1–13 OFF
RS232 1–14 for printing
Page Number Factory Default Value
surements are OFF
VM101: Line 7
COMPUTER
1–15 for computer
1–17 for waveform
monitor operation
PRINTER RS232
BAUD RATE
STOP BITS
PARITY
FLOW CTL
VM100 & VM101 User Manual
1–14
9600
1
NONE
NONE
1–7

Getting Started
T able 1–2: Configuration parameters (cont.)
Parameter Factory Default ValuePage Number
COMPUTER RS232
BAUD RATE
STOP BITS
PARITY
FLOW CTL
REMOTE ADDR
1995 NOV 11 (Date)
YEAR
MONTH
DAY
10:13:18AM (Time)
HOUR
MINUTE
VIEW ANGLE 1–19 80
SW VER 1–19 Current software version
CALIBRATE 1–20 N/A
1–15
9600
1
NONE
NONE
0
1–18 Today’s date
1–18 Current time
1–8
Use the following procedures to customize the operation of your
video measurement set. Once you have configured the parameters,
the video measurement set powers on as you configured it. Refer to
Operating Basics if you need a detailed description of the front panel
buttons or the LCD display.
NOTE. The video measurement set uses the last setting that was saved
for each parameter if power is interrupted during configuration.
To exit the CONFIGURE menu at any time during these procedures,
press the MEAS, SIG ID, MEM, or PRINT buttons.
VM100 & VM101 User Manual

Getting Started
1.
NOTE. If the front panel has been locked with the REMLock remote
command, it can be unlocked by holding down the CONFIG button
and pressing the FREEZE button.
Configure the Measurements
The video measurement set performs a group of measurements when
you press the MEAS button. The display update rate depends upon
the number of measurements made and the presence of valid input
signals. You can customize this feature for your application by
selecting only the measurements you need.
NOTE. No new measurements are performed while the FREEZE or
CONFIG lights ar e on. The REPort and MEMory:SAVe commands
use the results that were present when either button was pressed.
The CONFIG button provides access to the instrument configuration.
Perform the following steps to choose measurements that will be
performed when you press the MEAS button or use the CONfig:MEAs:<subcommand> remote command on page B–37:
2. 3. 4. 5.
Press the
CONFIG
button.
Select
(default).
Press the ↵
enter button.
Select the
desired
measurement.
See list below.
Select or
. Repeat
steps 3 and 4
to configure
additional
measurements.
Press the
MEAS button
to exit.
VM100 & VM101 User Manual
1–9

Getting Started
The following measurements are available:
H Differential Phase (DIFF PHASE)
H Differential Gain (DIFF GAIN)
H Chrominance-Luminance Delay (YC DELAY)
H Chrominance-Luminance Gain (YC GAIN)
H Signal-to-Noise Ratio (SNR WGT/FLAT)
H Frequency Response (FREQ FCC or AVG and FREQ DETAIL)
H Group Delay (GRPDLYmax and GRPDLYmin)
H Sync Amplitude (SYNC AMPL)
H Burst Amplitude (BURST AMPL)
H Bar Amplitude (BAR AMPL)
H 2T K-Factor (2T K-FACTOR)
H Luminance Nonlinearity (LUM NON-LIN)
H Hum (HUM)
Configure the Zero Carrier Reference Pulse T rigger Output
The Zero Carrier Reference Pulse Trigger Output synchronizes a
demodulator when you take hum measurements. You can configure
the output to OFF or to any line from 10 – 20 (VM100) or 7 – 20
(VM101). See page 3–16 for information about using the Zero
Carrier Reference Pulse Trigger Output.
Perform the following steps to configure the Zero Carrier Reference
Pulse Trigger Output or use the CONfig:ZCRp remote command on
page B–45:
1. 2. 3. 4.
1–10
Press the CONFIG
button.
Select
.
Select or Line
10 – 20 (VM100)
or Line 7 – 20
(VM101).
Press the MEAS
button to exit.
VM100 & VM101 User Manual

Getting Started
Configure the Signal Identification Range
The SIG ID menu displays all of the test signals that are present in
the video signal applied to the INPUT connector . You can configure
the SIG ID range to match your system requirements (VITS, FULL,
or MAN). See page 3–3 for more information about SIG ID range
selection.
Perform the following steps to configure the SIG ID range or use the
CONfig:SIGnalid:RANge remote command on page B–42:
1. 2. 3. 4.
Press the CONFIG
button.
Select SIG ID
RANGE.
Select VITS,
FULL, or MAN.
Press the MEAS
button to exit.
NOTE. After you configure the signal identification range, the video
measur ement set reacquires the signal.
Configure the Full Field Start Line
You can configure the video line used for full field start (valid only
when the SIG ID range is FULL). With this feature you can view a
specific video line within the active area. See page 3–3 for more
information about SIG ID range selection.
Perform the following steps to configure the Full Field Start Line or
use the CONfig:SIGnalid:FULlfldstart remote command on
page B–40:
1. 2. 3.
Press the CONFIG
button.
Select FULL FLD
START.
VM100 & VM101 User Manual
Select 23 - 94
(VM100) or
23 – 39 (VM101).
4.
Press the MEAS
button to exit.
1–1 1

Getting Started
NOTE. After you configure the full field start line, the video
measur ement set reacquires the signal.
Configure the Reference
You can configure the video measurement set to use either an
internally generated sync reference or a signal connected to the
EXT REF rear panel input. For example, use an external reference if
the video input has no sync information.
Perform the following steps to configure the reference or use the
CONfig:REFerence remote command on page B–39:
1. 2. 3.
Press the CONFIG
button.
Select
CONFIGURE REF.
Select INPUT or
EXTERNAL.
4.
Press the MEAS
button to exit.
Configure the Hum Measurement (VM100 Only)
You can configure the hum measurement to match your power line
frequency (VM100 only). The video measurement set configuration
must match your power line frequency to produce accurate hum
measurement results.
Perform the following steps to configure the hum measurement or
use the CONfig:HUM remote command on page B–28:
1. 2. 3. 4.
1–12
Press the CONFIG
button.
Select HUM. Select 50HZ or
60HZ.
VM100 & VM101 User Manual
Press the MEAS
button to exit.

Getting Started
Configure the Signal-to-Noise Ratio Filter
The video measurement set provides weighted and flat filter
selections for taking signal-to-noise (SNR) measurements. You can
configure the filter type needed for your application.
Perform the following steps to configure the SNR filter or use the
CONfig:FILter remote command on page B–27:
1. 2. 3. 4.
Press the CONFIG
button.
Select
.
Select
or .
Press the MEAS
button to exit.
Configure the Luminance Nonlinearity Mode
The video measurement set provides normal and differentiated step
(diffstep) modes for taking the luminance nonlinearity (LUM
NON–LIN) measurements. You can configure the mode needed for
your application.
Perform the following steps to configure the luminance nonlinearity
mode or use the CONfig:LUM remote command on page B–36.
1. 2. 3. 4.
Press the CONFIG
button.
Select
.
Select or
.
Press the MEAS
button to exit.
Configure the Limit Table Selection
The video measurement set can compare each measurement to high
and low stored values. You can enable limit checking and select from
one of four tables of stored values. Use the RS-232 serial port to
change the limits from the factory default settings.
VM100 & VM101 User Manual
1–13

Getting Started
Perform the following steps to configure the limit table selection
1. 2. 3. 4.
Press the CONFIG
button.
Select LIMITS. Select OFF or
Table 1 to 4.
Press the MEAS
button to exit.
You can also use the remote command CONfig:LIMit described on
page B–30.
Configure for Printing
The video measurement set can drive a printer, computer, or
waveform monitor using the RS-232 serial port. To print the
measurement results, you need to configure the RS-232 serial port
for printer operation and then select the parameters that match your
printer.
Perform the following steps to configure the RS-232 serial port to
drive a printer:
1. 2. 3. 4.
1–14
Press the CONFIG
button.
Select
CONFIGURE
RS232.
Select PRINTER. Press the MEAS
button to exit.
NOTE. Refer to your printer manual to determine the settings for
baud rate, stop bits, parity , and flow control.
If the RS-232 serial port is not configured for printing, the PRINT
button does not respond when you press it.
VM100 & VM101 User Manual

Getting Started
Perform the following steps to configure the print parameters:
1. 2. 3. 4.
Press the CONFIG
button.
Select
CONFIGURE
PRINTER RS232.
Press the ↵ enter
button.
Select the desired
parameters. See
Table 1–3.
Press the MEAS
button to exit.
Table 1–3: Print parameters
Parameter
BAUD RATE 300, 600, 1200, 2400, 4800, 9600,
STOP BITS 1 or 2
PARITY NONE, EVEN, ODD
FLOW CTL NONE, XON/XOFF, HARDWARE
Choices
19.2K
Configure for Computer Communications
The video measurement set can drive a computer, printer, or
waveform monitor using the RS-232 serial port. To send the
measurement results to a computer or to set up for remote operation,
you need to configure the RS-232 serial port for computer operation
and then select the parameters that match your computer interface.
Perform the following steps to configure the RS-232 serial port to
drive a computer:
VM100 & VM101 User Manual
1–15

Getting Started
1. 2. 3.
Press the CONFIG
button.
Select
CONFIGURE
RS232.
Select COMPUTER. Press the MEAS
4.
button to exit.
NOTE. Refer to your computer manual to determine the settings for
baud rate, stop bits, parity , and flow control.
Perform the following steps to configure the computer interface
parameters:
1. 2. 3.
Press the CONFIG
button.
Select
CONFIGURE
COMPUTER
RS232. Press the
↵ enter button.
Select the desired
parameters. See
Table 1–4.
4.
Press the MEAS
button to exit.
1–16
NOTE. If COMPUTER was not selected at power on, you will experience
a short delay when scrolling through the CONFIGURE RS232 menu
choices.
T able 1–4: Computer interface parameters
Parameter
Choices
BAUD RATE 300, 600, 1200, 2400, 4800, 9600, 19.2K
STOP BITS 1 or 2
PARITY NONE, EVEN, ODD
VM100 & VM101 User Manual

Getting Started
T able 1–4: Computer interface parameters (Cont.)
Parameter Choices
FLOW CTL NONE, XON/XOFF, HARDWARE, RCDS
1
REMOTE ADDR
1
0-126
Configure for Waveform Monitor Control Function
The video measurement set can drive a computer, printer, or
1740A-series waveform monitor using the RS-232 serial port. The
waveform monitor control function allows you to simultaneously
view the waveform on a 1740A-series waveform monitor while the
video measurement set measures the signal parameters. See
page 3–14 for more detailed information about the waveform
monitor control function.
Perform the following steps to configure the RS-232 serial port to
drive a waveform monitor:
1. 2. 3. 4.
Press the CONFIG
button.
Select
CONFIGURE
RS232.
Select CONTROL. Press the MEAS
button to exit.
1
Do not use the RCDS or REMOTE ADDR parameters. They support a
custom application.
VM100 & VM101 User Manual
1–17

Getting Started
Configure the Date
The video measurement set keeps track of the date. Perform the
following steps to change the date setting or use the CONfig:DATe
remote command on page B–26:
1. 2. 3. 4.
Press the CONFIG
button.
Select
CONFIGURE
<DATE>. Press
the ↵ enter button.
Select the YEAR,
MONTH, and DAY.
See list below.
Press the MEAS
button to exit.
The following date parameters are available:
H YEAR: 00 to 99 selects 1990 through 2089
H MONTH: JAN through DEC
H DAY: 1 through 31
Configure the Time
The video measurement set keeps track of the time. Perform the
following steps to change the time setting or use the CONfig:TIMe
remote command on page B–44:
1. 2. 3. 4.
1–18
Press the CONFIG
button.
Select
CONFIGURE
<TIME>. Press
the ↵ enter button.
Select the HOUR
and MINUTE. See
list below.
The following time parameters are available:
H HOUR: 01AM to 12AM and 01PM to 12PM
H MINUTE: 00 to 59
VM100 & VM101 User Manual
Press the MEAS
button to exit.

Getting Started
Adjust the LCD View Angle
You can adjust the viewing angle of the LCD display for the best
readout with your lighting conditions. To change the viewing angle,
place the video measurement set in the lighting conditions where you
will use it and then perform the following steps or use the CONfig:LCDangle remote command on page B–29:
1. 2. 3.
Press the CONFIG
button.
Select
CONFIGURE
VIEW ANGLE.
Select 0 through
180 for best LCD
display.
4.
Press the MEAS
button to exit.
Display the Software V ersion Number
You can view the software version number for the operating system
installed in this video measurement set. Refer to this number if you
need to report a software problem or order a software upgrade. The
software version displayed here should correspond to the version
number(s) printed on the title page of this manual.
Perform the following steps to view the software version number or
use the CONfig:SWVersion? remote query on page B–43:
1. 2. 3.
Press the CONFIG
button.
VM100 & VM101 User Manual
Select CONFIGURE
SW VER.
Press the MEAS button to
exit.
1–19

Getting Started
Calibration
CAUTION. To ensure that the video measur ement set meets all
performance requirements, only qualified service personnel should
perform the adjustments.
Refer to the VM100 & VM101 Video Measurement Sets Service
Manual for test equipment requirements and detailed adjustment
instructions.
If you inadvertently enter the CALIBRATION menu, use the
following steps to exit the menu without changing internal video
measurement set settings:
1. 2.
Select ↵
.
Press the ↵ enter button
to exit the menu.
1–20
VM100 & VM101 User Manual

Operating Basics


Operating Basics
This section provides the information you need to use each control,
indicator, and connector on the front and rear panels. It is divided
into the following sections:
H The Functional Overview explains how to read the LCD display.
You will also find functional descriptions of each front panel
button and rear panel connector and a graphical view of the
menus.
H The Tutorial on page 2–9 guides you through basic instrument
operation and measurement procedures.
Functional Overview
This section contains basic operating instructions for the front panel
buttons and LCD display, the menus, and rear panel connectors.
Refer to the following pages for the information you need:
H Front panel buttons and LCD display (see page 2–2)
H Menus (see page 2–4)
H Rear panel connectors (see page 2–7)
VM100 & VM101 User Manual
2–1

Operating Basics
Front Panel Buttons and LCD Display
The front panel contains twelve buttons and an LCD display as
shown in Figure 2–1. There are seven function buttons, four arrow
buttons, and the enter button. A green LED indicator, located at the
center of each function button, lights to show when the associated
function is turned on. The arrow buttons are designated by
directional arrows. A carriage return symbol (↵) identifies the enter
button.
10
Figure 2–1: Front panel
Five of the function buttons (MEAS, SIG ID, MEM, PRINT, and
CONFIG) are exclusive to each other . This means that only one of
the functions can be active at a time. When you press another of
these buttons the previous function automatically turns off.
1 2 4
9 8 7 6
3
5
2–2
NOTE. If the front panel has been locked with the REMLock remote
command, it can be unlocked by holding down the CONFIG button
and pressing the FREEZE button.
The following descriptions refer to Figure 2–1.
1. MEAS. Press the measure button to display the results of
measurements the video measurement set performs on the LCD
display. Use the CONFIG menu to turn measurements ON or
OFF. Measurements must be ON to appear in the MEAS list.
VM100 & VM101 User Manual

Operating Basics
2. SIG ID. Press the signal identification button to display the name
and location of signals used for measurement when the SIG ID
range is set to VITS or FULL, and the source ID (when contained
in the signal).
3. AVG. Press this toggle switch to turn signal averaging on and off.
4. FREEZE. Press this toggle switch to turn the freeze feature on and
off. When FREEZE is turned on, all acquisition and measurement
activity stops so that you can view intermediate measurement and
signal ID results.
To disable the front panel lock feature, hold down the CONFIG
button and press FREEZE.
NOTE. No new measurements are performed while FREEZE is on.
The report and memory save commands return the result that was
present when FREEze was pressed.
5. Arrow Buttons. Press the up (↑) or down (↓) arrow buttons to
scroll through various LCD displays. Press the left (←) and right
(→) arrow buttons to change instrument parameters and to view
measurement results on other video lines.
6. Enter Button. Press the enter (↵) button to enter and exit the
CONFIG submenus and to control print and memory functions.
7. CONFIG. Press the configure button to access instrument
configuration menus and to view the instrument software version.
To disable the front panel lock feature, hold down the CONFIG
button and press FREEZE.
NOTE. No new measurements are performed while CONFIG is on.
The report and memory save commands return the result that was
present when CONFIG was pressed.
8. PRINT. Press the print button to print the current or saved
measurement data or to output results to a computer, using the
RS-232 serial port. You must configure the RS-232 serial port for
VM100 & VM101 User Manual
2–3

Operating Basics
printing and select the print parameters before using the print
function.
9. MEM. Press the memory button to save the current measurement
and SIG ID results in instrument memory and to access memory
management selections including ERASE, REPLACE, VIEW,
and RENAME.
10.LCD Display. The LCD display shows measurement readouts and
menu selections. Figure 2–2 shows examples of the text and
symbols you will see on the LCD display. The symbols help you
navigate quickly through the menu system using the arrow
buttons and the enter button. Dots (…) following the menu name
indicate that a menu has a submenu.
Arrow buttons
Enter button
Shows submenu
Figure 2–2: LCD display characteristics
Menus
The MEAS, SIG ID, MEM, PRINT, and CONFIG buttons allow
access to additional selections or measurement results. Figures 2–3
and 2–4 show the menu structure of the video measurement set. The
SIG ID menu is not shown because its contents depend upon the
input signal characteristics.
2–4
VM100 & VM101 User Manual

Operating Basics
Figure 2–3: The MEAS, MEM, and PRINT menus
VM100 & VM101 User Manual
2–5

Operating Basics
2–6
Figure 2–4: The CONFIG menu
VM100 & VM101 User Manual

Operating Basics
Rear Panel Connectors
There are seven connectors mounted on the video measurement set
rear panel. Refer to Figure 2–5 for descriptions.
1
Figure 2–5: Rear panel connectors
1. AC Power Connector. The AC power connector is a standard AC
plug receptacle for 120 or 240 VAC power mains. The plug is
compatible with each available power cord option.
2. ZERO CARRIER PULSE OUTPUT. The ZERO CARRIER PULSE
OUTPUT produces a reference pulse that triggers a demodulator .
Signal amplitude is 1.5 V
TTL compatible when driving a high impedance. This pulse is
compatible with the trigger inputs on the following Tektronix
Demodulators: DS1200, TDM5, 1450, 1340, and 1350.
2
5
when driving a 75 W load or
p-p
3 4
3. EXT REF. This high-impedance, loop-through input (two BNC
connectors) accepts external reference signals of composite video
or black burst (1 V
sync information. The input is AC coupled and compensated for
75 W. It is not internally terminated.
4. INPUT. This high-impedance, loop-through input (two BNC
connectors) accepts video input signals for the video measurement set. The input is AC coupled and compensated for 75 W. It
is not internally terminated.
VM100 & VM101 User Manual
). Use this input if the video input has no
p-p
2–7

Operating Basics
5. RS232 Port. This nine-pin subminiature D-type female connector
provides an RS-232 serial interface for printer and computer
communication. The port also provides the interface for the
waveform monitor control function. See Appendix B: Remote
Control for pin assignments and a listing of remote commands.
2–8
VM100 & VM101 User Manual

Tutorial
Operating Basics
The following tutorial shows how to use most of the video
measurement set features. See the Reference section, which begins
on page 3–1, for more detailed information on interpreting specific
measurements.
During the tutorial you will perform the following tasks:
H Configure the instrument
H Perform signal identification
H T ake signal measurements
H Use freeze mode
H Save measurement results
H Print measurement and signal identification results (optional)
The required equipment to perform the tutorial includes a signal
source such as a live video feed or the output of an NTSC or PAL TV
signal generator with inserted VITS. If you want to print the
measurement results, you will also need an ASCII printer with cable.
Table 2–1 shows the equipment needed to complete the tutorial.
Table 2–1: Equipment for tutorial
Item Description
Test Signal Generator Produces NTSC and PAL
Cable, Precision 75 W
Coaxial
Termination, 75 W 75 W, male BNC connector
Serial ASCII Printer with
Cable (optional)
Minimum Requirements Example
signals
75 W, 42 in, male-to-male
BNC connectors
Nine-pin subminiature D-type
male connector
Tektronix TSG95
Tektronix part number
012–0074–00
Tektronix part number
011–0102–01
General purpose printer
with serial port
VM100 & VM101 User Manual
2–9

Operating Basics
Initial Setup
1. Connect the test equipment as shown in Figure 2–6.
TV signal generator
Printer (optional)
VM10X(rear)
RS-232 cable
BNC cable
Figure 2–6: Equipment setup for the tutorial
2. Power on the video measurement set as follows:
a. Connect the video measurement set to the AC power
source.
b. Wait until you can read the LCD display (approximately
10 seconds).
3. Power on the TV signal generator and printer (if connected).
4. On the video measurement set, press the AVG button to turn
averaging on (LED lights).
NOTE. You will normally operate the video measurement set with
averaging turned on.
75 W
2–10
VM100 & VM101 User Manual

Operating Basics
Instrument Configuration
NOTE. If the video measurement set displays the message No video
present, or no lock possible, check the connection and quality
of the video signal before proceeding.
The video measurement set is ready to begin taking measurements
immediately after power on. For the purpose of this tutorial you must
change or verify some instrument parameters before proceeding:
1. Turn on all measurements within the CONFIGURE MEASURE…
menu as follows:
a. Press the CONFIG button.
NOTE. No new measurements are performed while CONFIG is on.
The REPort and MEMory:SAVe commands use the results that wer e
present when CONFIG was pressed.
b. Press the ↵ enter button to enter the CONFIG--MEAS
submenu.
c. Use the ← or → arrow button to select DIFF PHASE = On.
d. Use the ↓ arrow button to select DIFF GAIN.
e. Use the ← or → arrow button to select DIFF GAIN = On.
f. Repeat steps d and e for each measurement within the list.
See page 1–9 for a complete list of the measurements.
2. If you want to print the measurement results, configure the
RS-232 serial port for your printer. See page 1–14 for detailed
instructions.
NOTE. Be sure to match the video measurement set printer parameters to your printer. Refer to the manual for your printer for the
correct settings. Refer to Appendix B: Remote Control for a detailed
description of the RS-232 serial port pinout.
VM100 & VM101 User Manual
2–1 1

Operating Basics
Signal Identification
The SIG ID menu, used when the SIG ID range is set to VITS or
FULL, displays the name of the video signal that appears on a
specific line. Perform the following procedure to identify the signals
on each line of your test signal:
1. Press the SIG ID button. Check the display for the field 1:line 9
signal identification for VM100. For the VM101, if the SIG ID
range is VITS check for field1:line 5; if the SIG ID range is
FULL, check for field 1:line 23 (Figure 2–7).
Figure 2–7: Example of the initial SIG ID display
2. Use the ↓ or ↑ arrow buttons to scroll through the vertical
interval test signals.
Each time you press the arrow button the display shows the name
and location of the next VITS. The decoded source ID code, if
present, appears on the right side of the bottom readout line
(Figure 2–8).
Source
ID code
Figure 2–8: Example of a SIG ID display with source ID code
2–12
VM100 & VM101 User Manual

Operating Basics
Signal Measurements
The MEAS button displays the results of signal measurements.
Perform the following procedure to use the MEAS feature:
1. If the LED in the AVG button is not lit, press the AVG button.
Measurements are normally made with averaging turned on.
2. Press the MEAS button.
Measurement mode is now active (the LED in the MEAS button
lights). SIG ID mode turns off automatically when you turn on
measurement mode. The display shows the results of the first
available measurement (Figure 2–9).
Figure 2–9: Example of differential phase measurement results
3. Use the ↓ or ↑ arrow buttons to scroll through the measurement
screens.
While in the measurement mode the video measurement set takes
measurements continuously. You will only see the results of
measurements that are turned on. (You turned them all on at the
beginning of this tutorial).
In general, the top line of the display contains the measurement
type on the left and the measured value on the right. The bottom
line contains the location and name of the signal that was used to
take the measurement. The video measurement set automatically
finds the best available signal to use for taking each measurement. For more detailed information about specific measurements, see the Reference section.
4. Use the ← or → arrow buttons to view the measurement results
for each field, line, and signal on which the measurement is
made.
VM100 & VM101 User Manual
2–13

Operating Basics
In MANUAL SIGNAL IDENTIFICATION mode, you can
change signals for measurement quickly by turning FREEZE on
and holding the ← or → arrow button down; releasing the arrow
button will cause the new signal to be identified. Remember to
turn FREEZE off to resume measurement.
Each time you select a new signal, the video measurement set
first updates the field, line, and signal readouts at the bottom of
the display. After the field, line, and signal readouts update, you
must wait a few seconds for the new measurement results to
appear on the display. If only one signal is available the
measurement results do not change when you press the ← or →
arrow buttons.
NOTE. If you select a new signal for the DIFF PHASE and YC GAIN
measur ements, the new signal is automatically used for the
DIFF GAIN and YC DELAY measurements, respectively. The video
measur ement set performs all other measurements independently.
Freezing the Measurement Activity
The freeze feature stops all acquisition and measurement activity.
You can then view the intermediate results of your measurement.
1. If the LED in the MEAS button is not lit, press the MEAS button
to turn on the measurement mode.
2. Repetitively press the ↓ or ↑ arrow button until the signal-to-
noise ratio (SNR) results are displayed. Notice how the
measurement results change over time.
3. Press the FREEZE button to turn on the freeze feature. The
measurements results do not change any more.
NOTE. No new measurements are performed while FREEZE is on.
The REPort and MEMory:SAVe commands use the results that wer e
present when FREEZE was pressed.
2–14
VM100 & VM101 User Manual

Operating Basics
4. Press the FREEZE button to turn off the freeze feature.
Storing Measurement Results
The memory function allows you to store measurement and signal
identification results. During the following procedure you save
measurement results to memory, rename the memory location, view
the saved results, and erase the results from memory.
NOTE. When you press the MEM button, the measurement mode
automatically turns off.
1. Press the MEM button.
2. Press the ↵ enter button to save the latest measurement results
into a new memory location (Figure 2–10).
If the save is successful, the next screen allows you to rename the
saved memory. If you receive a message that indicates you are
not able to save the results, refer to page 3–9 for instructions to
clear the memory before proceeding.
Figure 2–10: Measurements saved to memory
NOTE. You do not need to change the name of the memory location.
To accept the default name (such as UNNAMED–06), simply press
the enter button to accept the default name.
You cannot use the same name for more than one memory location.
3. To rename the memory location, press the ↵ enter button.
VM100 & VM101 User Manual
2–15

Operating Basics
NOTE. When renaming a memory location, you cannot use the name
UNNAMED–XX where “XX” is any combination of characters.
4. Use the ↓ or ↑ arrow buttons to select the first character of the
new name (Figure 2–11).
Name of memory location
Figure 2–11: Renaming a memory location
5. Press the → arrow button to move the cursor to the right, then use
the ↓ or ↑ arrow buttons to select the next character .
6. Repeat step 5 until the new name is complete (you can enter up to
ten characters).
7. Press the ↵ enter button to accept the new name.
8. To view the stored measurement results, press the ↑ arrow button
to display the message PRESS ↵ TO VIEW MEMORY.
9. Repetitively press the ← or → arrow button to select the memory
location you named in step 7.
10.Press the ↵ enter button to view the selected memory.
The first display contains the date and time stamp for the
measurement results (Figure 2–12).
2–16
VM100 & VM101 User Manual

Operating Basics
Figure 2–12: Date and time stamp display
11. Use the ↓ arrow button to scroll through the measurement results
and the signal identification screens.
12.To exit view mode, press the ↵ enter button or the MEM button.
13.Press the ↑ arrow button to display the message ↵
.
14.Use the ← or → arrow button to select the memory location you
named in step 7.
15.Press the ↵ enter button to erase the selected memory.
16.Repeat steps 8 and 9 to verify the memory location has been
erased.
Printing Measurement and Signal Identification Results
You can send the measurement and signal identification results from
the video measurement set directly to a printer . Use the following
procedure to print your test results with a title:
NOTE. Be sure that you have configured the RS-232 serial port for
your printer. See page 1–14 for detailed instructions.
If the RS-232 serial port is not configured for a printer, the PRINT
button is inactive.
1. If you have not already done so, connect the video measurement
set to the printer.
2. Press the MEAS button to turn on the measurement mode.
3. On the video measurement set, press the PRINT button.
VM100 & VM101 User Manual
2–17

Operating Basics
The following message appears on the display: ↵
.
NOTE. You can print the measurement results without a title. To do
so, press the ↵ enter button now.
4. To add a title to your printout, press the ↓ arrow button until the
message ↵ is displayed.
5. To add the title press the ↵ enter button.
6. Use the ↓ or ↑ arrow buttons to select the first character of the
new name.
7. Press the → arrow button to move the cursor to the right; use the
↓ or ↑ arrow buttons to select the next character (Figure 2–13).
Title
Figure 2–13: Adding a title
8. Repeat step 7 until the title is complete (you can enter up to ten
characters).
9. Press the ↵ enter button to accept the title.
10.Press the ↵ enter button to print the current measurement results
with your title.
The message appears after printing completes
successfully.
11. Press the ↵ enter button or the PRINT button to remove the
message.
2–18
VM100 & VM101 User Manual

Operating Basics
Using Limits
Use the limit check feature to verify if the measurement results are
within specified limits. Limit violations are shown on the LCD
display or returned from a query via the RS-232 remote control
interface. Limit checking can be enabled or disabled from either the
front panel controls or the remote control interface. If a limit table is
in effect when a measurement is stored, the contents of the limit
table will be saved with the signal and measurement data,
Limits are only checked at the time of display, the time of reporting,
or when the signal memory is recalled. During front-panel operation,
a limit is not checked unless the measurement is currently displayed.
During remote-control operation, a limit is not checked unless a
measurement or report command is issued while the violation is
occurring.
Four limit tables containing different values can be loaded into the
video measurement set through the remote control interface. The
limit tables can be selected from the front-panel configuration menu
or by using the remote control CONfigure:LIMit command.
NOTE. Limit values cannot be modified or inspected from the front
panel.
Exceeded limits are indicated on the LCD display by either an ↑ or ↓
arrow before the measurement value. See Figure 2–14.
Figure 2–14: T ypical high-limit error display
When measurements are reported remotely, exceeded limits are
indicated by a > or < symbol placed to the right of the measurement
value, followed by the limit value that was violated. The symbol
VM100 & VM101 User Manual
2–19

Operating Basics
indicates that the measurement value is either greater than or less
than the high or low limit value. See Figure 2–15.
Up arrow precedes measurement readout
+3.0
Signal value
0.0
Down arrow precedes measurement readout
Figure 2–15: Limit Violation
This completes the Tutorial.
HIGH LIMIT
No arrow
LOW LIMIT
2–20
VM100 & VM101 User Manual

Reference


General Feature Reference
The Reference section provides advanced information about the
video measurement set features. It is divided into the following
subsections:
H General Feature Refer ence explains how to use the basic
instrument features that are controlled from the front panel
H Taking NTSC Measurements on page 3–17 explains how to take
each of the built-in NTSC measurements using a VM100
H Taking PAL Measurements on page 3–43 explains how to take
each of the built-in PAL measurements using a VM101
Within the General Feature Reference section you will find detailed
information about features you access from the front panel, including
the following:
H Signal Averaging on page 3–2 explains how to use the averaging
function
H Freezing the Measurement Activity on page 3–3 provides
detailed information about the freeze feature
H Using Signal Identification on page 3–3 explains how to use the
SIG ID feature
H Using Memory Functions on page 3–6 explains how to use each
memory function
H Printing Measurement Results on page 3–11 explains how to print
test results, or upload them to a computer
H Using the Waveform Monitor Control Function on page 3–14
explains how to view the waveform on a monitor while the video
measurement set takes measurements
H Using the Zero Carrier Reference Pulse Output on page 3–16
explains how to use the Zero Carrier Reference Pulse Output
VM100 & VM101 User Manual
3–1

General Feature Reference
Signal Averaging
The AVG button is an on-off toggle switch that affects all of the
measurements. An LED indicator located at the center of the button
lights when averaging is ON. Use averaging to reduce the effect of
noise on your signal measurements.
How Averaging Works
The video measurement set performs signal averaging by taking a
signal-to-noise measurement on the input signal using a quiet line.
From the signal-to-noise measurement, the video measurement set
determines how much averaging is needed to meet the measurement
accuracy specification for each measurement that is configured to
ON through the CONFIG menu. Higher signal-to-noise ratios require
less averaging. The video measurement set can then take measurements more quickly.
Display Update Rate
Averaging and the absence of necessary input signals are two factors
that affect the update rate of the display.
When averaging is OFF, the video measurement set does not take a
signal-to-noise measurement on the input signal. The result is a faster
display update rate.
NOTE. When averaging is turned OFF, high noise levels may reduce
measur ement accuracy.
Some measurements, such as group delay, require certain types of
input signals to the video measurement set. The display rate
decreases if the proper signals are missing and these measurements
are configured ON. Under these conditions the display rate is slower
when averaging is ON. To increase the display rate, turn averaging
OFF or configure to OFF the measurements that require additional
signals. See page 1–9 for configuration instructions.
3–2
VM100 & VM101 User Manual

Freezing the Measurement Activity
The FREEZE button is an on-off toggle switch. An LED indicator
located at the center of the button lights when freeze is ON.
Freeze mode stops all acquisition and measurement activity,
stabalizing the measurement results on the display. Use freeze to
view intermediate measurement and signal ID results when the signal
contains excessive noise or when changing VITS.
In MANUAL SIGNAL IDENTIFICATION mode, you can change
signals for measurement quickly by turning FREEZE on and holding
the ← or → arrow button down; releasing the arrow button will
cause the new signal to be identified. Remember to turn FREEZE off
to resume measurement.
General Feature Reference
NOTE. No new measurements are performed while FREEZE is on.
The REPort and MEMory:SAVe commands use the results that wer e
present when FREEze was pressed.
Using Signal Identification
The SIG ID menu displays the test signals within the VITS or FULL
signal identification range that are present in the video signal applied
to the INPUT connector. The SIG ID display (Figure 3–1) contains
the name, location, and when available, the decoded source ID code.
When using a Tektronix VITS 100 or VITS 200 inserter, you can use
this code to identify the channel from which saved or printed
measurements were taken.
NOTE. The SIG ID menu is not used if the MAN signal identification
range is selected. The signals can be identified by selecting each
field and line for the sync measurement.
VM100 & VM101 User Manual
3–3

General Feature Reference
Figure 3–1: Example of a SIG ID display with source ID code
SIG ID information is saved into memory with the measurement
results when using the MEM menu.
Using SIG ID
Press the SIG ID button to view the SIG ID menu. When SIG ID is
ON, an LED indicator located at the center of the button lights. Use
the ↓ or ↑ arrow buttons to scroll through the screens. After you view
the last screen in the list, the first SIG ID screen appears the next
time you press the ↓ arrow button. Refer to page 2–12 for step-bystep instructions on using SIG ID.
Source ID code
Customizing SIG ID
The CONFIG menu contains two parameters that customize the
SIG ID feature: SIG ID RANGE and FULL FLD START.
The SIG ID RANGE selections are VITS and FULL (full field).
VITS mode directs the video measurement set to take samples only
during the vertical interval. This is the normal operating mode for
performing in-service tests. FULL (full field) mode directs the video
measurement set to take samples of the active video lines. If you are
transmitting a full field test signal (when the channel is out of
service) use FULL mode to measure the signal.
When FULL mode is active the FULL FLD START parameter
allows you to configure the line on which to start taking measurements in field 1. Using this feature you can sample a specific line of
interest. Sampling occurs at the following intervals:
H VM100: every 13 lines
H VM101: every 16 lines
3–4
VM100 & VM101 User Manual

General Feature Reference
If you have a VM101 and need to sample line 73, select 25 as the
starting line. Samples will then occur on lines 41, 57, 73, 87, and so
on. Using the same example for the VM100, start on line 21 to
sample line 73. See page 1–11 for configuration instructions.
SIG ID Applications
For VM100 users, SIG ID verifies the presence of the closed caption
signal, as specified in the following federal regulation on telecommunications, 47 CFR w76.606, (Section b):
As of July 1, 1993, the operator of each cable television system
shall deliver intact closed captioning data contained on line 21 of
the vertical blanking interval, as it arrives at the head end or from
another origination source, to subscriber terminals and (when so
delivered to the cable system) in a format that can be recovered
and displayed by decoders meeting w15.119 of this chapter.
For VM100 and VM101 users, SIG ID identifies the signals in
Table 3–1 and the signals listed on page 3–19 (NTSC) and page 3–45
(PAL).
Table 3–1: Additional signals identified by SIG ID mode
NTSC Signals
Teletext, VITC, Closed Caption, Zero
Carrier Reference Pulse (ZCR Pulse),
Source ID (Tektronix VITS 100, VITS
200), Color Bars, Cable Sweep ,VIRS
P AL Signals
CCIR Line 331, VITC, Teletext,
Colour Bars, UK ITS II, Source ID
(Tektronix VITS 201)
VM100 & VM101 User Manual
3–5

General Feature Reference
Using Memory Functions
The MEM button provides access to 25 memory locations for storing
the current measurement and SIG ID results. Each saved memory
location is time and date stamped. Once you save the measurement
results, you can rename, view, replace, or erase the memory contents
or upload them to a computer . The following procedures explain how
to use the memory functions.
NOTE. No new measurements are performed while the FREEZE or
CONFIG lights ar e on. The REPort and MEMory:SAVe commands
use the results that were present when either button was pressed.
Saving Measurement Results to Memory
Use the following procedure to save measurement results to a new
memory location. If the save is successful, the next screen allows
you to rename the saved memory for easy identification.
1. Press the MEM button.
2. Press the ↵ enter button to store the latest measurement results
into new memory. Your display should resemble Figure 3–2.
Figure 3–2: Example of display after saving to memory
NOTE. The memory is full if the message MEMORY FULL, ERASE OR
REPLACE appears. You must erase or replace an existing memory
location before saving the current measurement results.
3–6
The complete name of the memory for the example in Figure 3–2 is
UNNAMED–06.
VM100 & VM101 User Manual

General Feature Reference
Renaming Saved Memory Locations
After saving measurement results to a new memory location, you can
accept the default name (UNNAMED–00 to UNNAMED–24) or
rename the memory location. Memory names can have up to ten
characters. Use the following procedure to rename a saved memory
location.
NOTE. You cannot use the same name for more than one memory
location, or the name UNNAMED–XX, where“XX” is any combination of characters.
1.
Press the MEM
button.
2. 3. 4.
Select ↵
.
Select the memory
location to be
renamed.
5. 6. 7.
Select the first character
of the new name
(Figure 3–3).
Select the next character.
Add characters until the
name is complete.
Press the ↵ enter button
to accept the new name.
Press the ↵ enter
button.
Name of memory location
Figure 3–3: Renaming a memory location
VM100 & VM101 User Manual
3–7

General Feature Reference
Viewing Memory Contents
After saving measurement results to a new memory location, you can
recall the results for viewing. The first display you will see is the
date and time stamp that shows when the measurement was taken
(Figure 3–4). Use the following procedure to view the memory
contents.
Figure 3–4: Date and time stamp display
1.
Press the
MEM button.
2. 3. 4. 5.
Select
↵ .
Select the
memory
location to
view.
Press the ↵
enter button.
Scroll through
the
measurement
results.
Replacing a Memory Location
You can replace a memory location with new measurement results.
You might use the replace function to update an existing memory
location or to replace an unwanted location with new data. Use the
following procedure to replace a memory location.
1.
Press the MEM
button.
2. 3.
Select ↵
.
Select the memory
location to replace.
4.
Press the ↵ enter
button to replace
the memory.
3–8
VM100 & VM101 User Manual

General Feature Reference
Erasing Memory Locations
You can erase the contents of a single memory location or all 25
memory locations at the same time. Use the following procedure to
erase one saved memory location.
1.
Press the MEM
button.
2. 3.
Select ↵
.
Select the memory
location to erase.
4.
Press the ↵ enter
button to erase the
memory location.
Use the following procedure to erase all saved memory locations.
1.
Press the MEM button. Select ↵
2. 3.
Press the ↵ enter button
.
two times to erase all
memory.
NOTE. After erasing all memory locations, you cannot perform the
view, rename, replace, and erase functions. The memory must contain
at least one saved memory location to perform these functions.
VM100 & VM101 User Manual
3–9

General Feature Reference
Uploading Memory Contents to a Computer
You can upload measurement results from the video measurement set
memory to a computer . Use the following procedure.
NOTE. Be sure that you have configured the video measurement set
RS-232 serial port for operation with your computer. See page 1–15
for detailed instructions.
1. Connect the video measurement set to your computer . Refer to
Appendix B: Remote Control for a detailed description of the
RS-232 serial port.
2. Run a terminal emulator or communication program on the
computer.
NOTE. To avoid data transfer problems, do not use a file transfer
protocol such as Kermit or XMODEM.
3. To upload memory contents send one of the following
commands:
To upload all memory contents send the command:
MEMory:RECall:ALL? (page B–67)
To upload all results saved in a specific memory location send the
command:
MEMory:RECall? <string> (page B–66)
To upload only the results of a one measurement saved in a
specific memory location send the command:
MEMory:RECall? <string> (page B–66)
4. Use the terminal emulator or communication program to capture
the results that are displayed on the PC screen.
3–10
VM100 & VM101 User Manual

Printing Measurement Results
Use the PRINT button to print current measurement and signal ID
results or the contents of a saved memory location. You can add a
title that appears on the printout.
NOTE. No new measurements are performed while the FREEZE or
PRINT lights are on. The REPort and MEMory:SAVe commands use
the results that were present when either button was pressed.
Before printing measurement results you need to connect the printer
to the RS-232 serial port on the video measurement set as shown in
Figure 3–5. If you need more detailed information about the RS-232
serial port, refer to RS-232 Interface on page B–1. You must also
configure the video measurement set RS-232 serial port for printer
operation, and select RS-232 parameters that match the printer
parameters. Refer to page 1–14 for configuration instructions.
General Feature Reference
NOTE. Be sure your printer has paper and is online before you print
measur ement results.
Printer
VM10X (rear)
RS-232 cable
Figure 3–5: Connecting to a printer
Printing Current Measurement Results
You can send the current measurement results directly to a printer.
Be sure to connect a signal to the video measurement set in order to
obtain current measurement results. Use the following procedure.
VM100 & VM101 User Manual
3–1 1
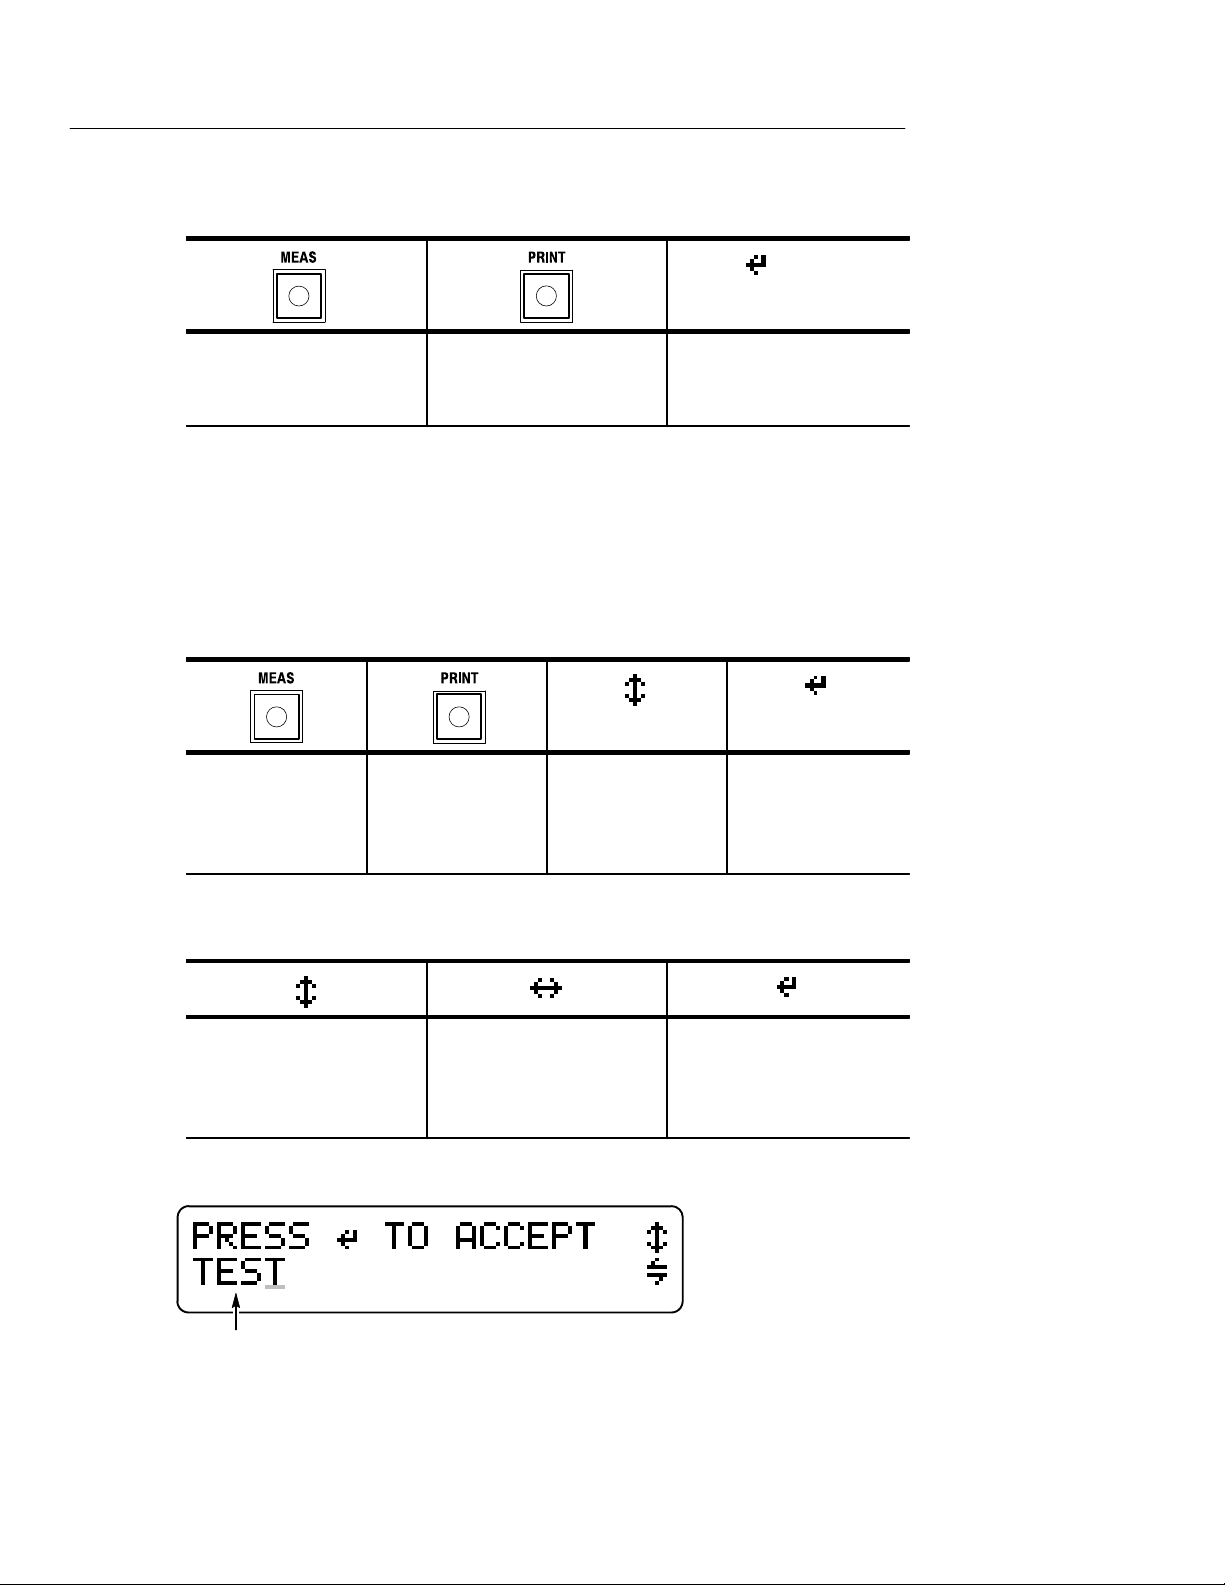
General Feature Reference
1.
Press the MEAS button to
turn on measurement
mode.
2.
Press the PRINT button. Press the ↵ enter button
3.
to start printing.
Adding a Title
Use the following procedure to add a title before you print the
current measurement results. Be sure to connect a signal to the video
measurement set in order to obtain current measurement results.
1.
Press the MEAS
button to turn on
measurement
mode.
2.
Press the PRINT
button.
3. 4.
Select ↵
.
Press the ↵ enter
button.
3–12
5. 6. 7.
Select the first character
of the title.
Title
Select the next character
(Figure 3–6). Add
characters until the title is
complete.
Figure 3–6: Adding a title
VM100 & VM101 User Manual
Press the ↵ enter button
two times to accept the
title and to start printing.

General Feature Reference
Printing Memory Locations
Use the following procedure to print the contents of one memory
location.
1.
Press the PRINT
button.
2. 3. 4.
Select ↵
.
Select the memory
location to print.
Press the ↵ enter
button to print the
memory contents.
Use the following procedure to print the contents of all memory
locations.
1.
Press the PRINT button. Select ↵
2. 3.
Press the ↵ enter button
.
to print the memory
contents.
VM100 & VM101 User Manual
3–13

General Feature Reference
Using the Waveform Monitor Control Function
The waveform monitor control function allows you to simultaneously view the waveform on a 1740A-series waveform monitor while
the video measurement set measures the signal parameters. The
video measurement set automatically sends line select commands to
the waveform monitor to control the monitor display. The resulting
waveform display is the video line where the video measurement set
is performing measurements.
NOTE. For your convenience, Tektronix offers a kit that pr ovides the
instructions and har dware needed to connect the video measurement
set and waveform monitor. After installing the kit, the video
measur ement set and waveform monitor are portable as a single unit.
See page 1–4 for ordering information.
RS-232 Connections for the Control Function
To connect the video measurement set to the 1740A-series waveform
monitor, use a cable with the pinouts shown in Figure 3–7.
Male end of cable
connects to VM10X
1
TX
6
7
8
9
2
RX
3
4
SIGNAL GND
5
Male end of cable
connects to waveform monitor
1
TX
RX
2
3
4
5
6
7
8
9
Figure 3–7: Cable pinout for waveform monitor control function
3–14
VM100 & VM101 User Manual

General Feature Reference
When you configure the video measurement set for control, it
automatically selects the communications settings shown in
Table 3–2:
T able 3–2: Control function communications parameters
Parameter
BAUD RATE 9600
STOP BITS 1
PARITY NONE
FLOW CTL NONE
Automatic Setting
Using the Control Function
Perform the following steps to use the control function:
1. Connect a cable between the RS-232 serial ports on the video
measurement set and waveform monitor. See Figure 3–7 for the
cable pinout requirements.
2. Power on the video measurement set and waveform monitor .
3. Using the CONFIG menu, configure the video measurement set
for the control function (see page 1–17 for detailed instructions).
4. Configure the waveform monitor remote control port for
9600 baud.
5. Set the waveform monitor display mode to Line Select.
6. Connect the video signal to the video measurement set and
waveform monitor input connectors.
7. On the video measurement set, press the MEAS button to cause
the waveform monitor to display the video signal.
Once configured, the waveform monitor automatically displays the
video line currently being measured by the video measurement set.
VM100 & VM101 User Manual
3–15

General Feature Reference
Using the Zero Carrier Reference Pulse Output
The video measurement set provides a zero carrier reference pulse
(ZCRP) trigger output through the rear panel BNC. Signal amplitude
is 1.5 V
driving a high impedance. The output signal is compatible with the
following Tektronix demodulators:
H TDM5 T elevision Demodulator (DS1200 System)
H 1340 T elevision Demodulator (System M)
H 1350 Television Demodulator
H 1450 Series Television Demodulator System
Connecting to a Demodulator
when driving a 75 W load or TTL-compatible when
p-p
To use the zero carrier reference pulse output signal, connect the
rear-panel BNC to the ZCRP trigger input of a demodulator. Use a
75 W coaxial cable. You must configure the demodulator to accept an
external trigger signal. Depending on your application, you must
configure the pulse to OFF or to a video line from 10 to 20 (VM100)
or 7 to 20 (VM101). Refer page 1–10 for configuration instructions.
Zero Carrier Reference Pulse Output Applications
The ZCRP output is often connected to a demodulator to take a hum
measurement according to the RS250 measurement technique. The
video measurement set trigger controls when the ZCR pulse from the
demodulator appears in the video signal.
3–16
VM100 & VM101 User Manual

Taking NTSC Measurements (VM100)
When you press the MEAS button, the video measurement set
performs a series of signal measurements. When measurements are
being taken, an LED indicator located at the center of the button is
lit. Shortly after pressing the MEAS button, the LCD display shows
the results of the first measurement (Figure 3–8). You can then press
the ↓ or ↑ arrow button to scroll through the measurement results
screens or press the ← or → arrow button to view the measurement
results for each field, line, and signal on which the measurement was
taken.
Figure 3–8: Example of differential phase measurement results
NOTE. Each time you select a new signal, wait a few seconds for the
measur ement results to appear on the display. If only one signal is
available the measurement results will not change.
In MANUAL SIGNAL IDENTIFICATION mode, you can change
signals for measurement quickly by turning FREEZE on and holding
the ← or → arrow button down; releasing the arrow button will
cause the new signal to be identified. Remember to turn FREEZE off
to resume measurement.
The video measurement set continues to take measurements as long
as the MEAS mode is ON. You can take the following NTSC signal
measurements:
H Differential Phase (DIFF PHASE)
H Differential Gain (DIFF GAIN)
VM100 & VM101 User Manual
3–17

T aking NTSC Measurements
H Chrominance-to-Luminance Delay (YC DELAY)
H Chrominance-to-Luminance Gain (YC GAIN)
H Signal-to-Noise Ratio (SNR WGT/FLAT)
H Frequency Response (FREQ FCC)
H Frequency Response Detail (FREQ FLAG, FREQ #1 through
FREQ #6) or (FRQmax and FRQmin)
H Group Delay (GRPDLYmax and GRPDLYmin)
H Sync Amplitude (SYNC AMPL)
H Burst Amplitude (BURST AMPL)
H Bar Amplitude (BAR AMPL)
H 2T K-Factor (2T K-FACTOR)
H Luminance Nonlinearity (LUM NON-LIN)
H Hum (HUM P-P, 50/60 Hz, and 100/120 Hz)
You can configure measurements ON or OFF using the CONFIG
menu. The video measurement set only performs measurements that
are configured ON. Refer to page 1–9 for configuration instructions.
The video measurement set requires an appropriate VITS on the
video input to take signal measurements. Table 3–3 lists the VITS in
order of their priority of selection. If the video measurement set
cannot detect an appropriate signal for a measurement, the
measurement will not be completed. Under these conditions, the
message appears on the LCD display. The
display update speed decreases if you take measurements when the
necessary VITS is not available. You can increase the display rate by
configuring unwanted measurements to OFF.
NOTE. The VITS used can be on any line from Field 1 Line 10 to 22,
and from Field 2 Line 10 to 22.
3–18
Line 9 is shown but is labelled “not used.”
VM100 & VM101 User Manual

T aking NTSC Measurements
Table 3–3: VITS signals used for NTSC measurements
Measurement
Differential Phase/Gain
(DIFF PHASE/DIFF GAIN)
Chroma-Luma Delay/Gain
(YC DELAY/ YC GAIN)
Signal-to-Noise Ratio
(SNR WGT/FLAT)
Frequency Response
(FREQ)
Group Delay
(GRPDLYmax/min)
Sync Amplitude
(SYNC AMPL)
Burst Amplitude
(BURST AMPL)
Bar Amplitude
(BAR AMPL)
Signals Used
FCC Composite, NTC7 Composite, Modulated
Ramp, Modulated 5/10-Step
FCC Composite, NTC7 Composite, Pulse & Bar,
Multipulse, Color Multipulse
Quiet Line, 0 Pedestal
Multiburst, NTC7 Combo, Philips GCR,
Sin(x)/x
Sin(x)/x, Philips GCR
Sync (bottom line of screen displays which video
line was used)
VM100 begins on field 1, line 10, and checks for
first available line with burst. Bottom line of
screen displays which signal was used.
FCC Composite, NTC7 Composite
2T K-Factor
(2T K-FACTOR)
Luminance Nonlinearity
(LUM)
Hum
(HUM)
VM100 & VM101 User Manual
FCC Composite, NTC7 Composite, Pulse & Bar,
Multipulse, Color Multipulse
Modulated 5-Step, Luminance Ramp, Luminance
5/10-Step, FCC Composite, NTC7 Composite
Measured during sync tip. Normalized to % using
ZCR Pulse if found in the vertical blanking
interval. Otherwise units are IRE.
3–19

Taking NTSC Measurements
Measuring Differential Phase
Differential phase distortion, often referred to as “diff phase” or
“dP,” is present if the chrominance phase of a signal is affected by
luminance level. This phase distortion results when a system is
unable to uniformly process the high-frequency chrominance
information at all luminance levels. Ideally, the measurement is
taken over a wide range (10% to 90%) of full-field average picture
levels.
When differential phase distortion is present, changes in hue occur
when the picture brightness changes. Colors may not be properly
reproduced, particularly in high-luminance parts of the picture.
Detailed Measurement Description
The video measurement set provides a precision differential phase
distortion measurement. You can verify compliance with the federal
regulation on telecommunications, 47 CFR w76.605,
(Section 12. iii):
The differential phase for the color subcarrier of the television
signal which is measured as the largest phase difference in
degrees between each segment of the chrominance signal and
reference segment (the segment at the blanking level of 0 IRE),
shall not exceed ± 10 degrees.
One of the following signals must be present at the input to measure
differential phase using the VM100:
H NTC7 Composite
H FCC Composite
H Modulated Ramp
H Modulated 5- or 10-Step Staircase
3–20
Measurement Results
Figure 3–9 shows an example of the DIFF PHASE measurement
results. The top line shows the measured results. The bottom line
shows the field, line, and signal type on which the measurement was
taken.
VM100 & VM101 User Manual

T aking NTSC Measurements
Figure 3–9: Differential phase measurement screen
The measurement result reflects the phase shift of the signal relative
to the first luminance level (zero). If you use a modulated staircase
signal (such as 5-step of FCC or NTC7 Composite signals, or
full-line modulated 5- or 10-step staircase), the error is measured at
each step (luminance level). If you use a ramp, six equal segments of
the ramp are averaged to produce the measurement result relative to
the first segment.
When the video measurement set cannot lock onto the color burst
signal, it displays an asterisk (*). Normally the video measurement
set locks to the color burst pulse. If burst lock is not possible, the
video measurement set uses sync lock to take the measurement.
Under these conditions the measurement accuracy may not be within
specifications.
Burst lock is not possible where no burst signal is present. You can
take a BURST AMPL measurement to determine if a burst signal is
present. If the measured burst amplitude is near zero, then burst is
not present. A normal burst amplitude level may indicate other
problems such as interference or scrambling.
VM100 & VM101 User Manual
3–21

T aking NTSC Measurements
Measuring Differential Gain
Differential gain, often referred to as “diff gain” or “dG,” is present
if the chrominance gain is affected by luminance level. This
amplitude distortion results when a system is unable to uniformly
process the high-frequency chrominance signal at all luminance
levels. Ideally, the measurement is taken over a wide range (10% to
90%) of full-field average picture levels.
When differential gain is present, color saturation has an unwarranted dependence on luminance level. Color saturation is often
improperly reproduced at high luminance levels.
Detailed Measurement Description
The video measurement set provides a precision differential gain
distortion measurement. You can verify compliance with the federal
regulation on telecommunications, 47 CFR w76.605, (Section 12. ii):
The differential gain for the color subcarrier of the television
signal, which is measured as the difference in amplitude between
the largest and smallest segments of the chrominance signal
(divided by the largest and expressed in percent), shall not exceed
± 20%.
NOTE. The definition becomes ambiguous when either the luminance
or chrominance pulse shapes are distorted.
One of the following signals must be present at the input to measure
differential gain using the VM100:
H NTC7 Composite
H FCC Composite
H Modulated Ramp
H Modulated 5- or 10-Step Staircase
3–22
VM100 & VM101 User Manual

T aking NTSC Measurements
Measurement Results
Figure 3–10 shows an example of the DIFF GAIN measurement
results. The top line shows the measured results. The bottom line
shows the field, line, and signal type on which the measurement was
taken. The measurement result shows the largest deviation from
reference chrominance (the chrominance portion superimposed on
0 IRE, expressed as percent of the largest chrominance amplitude).
Figure 3–10: Differential gain measurement screen
Signals such as NTC7 Composite (and some modulated ramps and
staircases) exceed 100 IRE prior to transmission. If the modulator
under test contains a clipping circuit (90% modulation), clipping
may occur on the fifth step of the NTC7 Composite and other 5-step
signals that exceed 100 IRE, and the ninth and tenth step of 10-step
signals. To avoid clipping, use the FCC Composite signal whenever
possible to take differential gain measurements.
VM100 & VM101 User Manual
3–23

T aking NTSC Measurements
Measuring YC Delay
Chrominance-to-luminance delay inequality (relative chrominance
time) is the difference between the time required for the chrominance
and luminance portions of the signal to pass through a system.
Delay distortion causes color smearing or bleeding; you will often
see it at the edges of objects in the picture. It may also cause poor
reproduction of sharp luminance transitions.
Detailed Measurement Description
The video measurement set provides a chrominance-to-luminance
delay measurement that verifies compliance with the federal
regulation on telecommunications, 47 CFR w76.605, (Section 12. i):
The chrominance-luminance delay inequality (or chroma delay),
which is the change in delay time of the chrominance component
of the signal relative to the luminance component, shall be within
170 nanoseconds.
One of the following signals must be present at the input to measure
chrominance-to-luminance delay using the VM100:
H NTC7 Composite
H FCC Composite
H Pulse & Bar with a modulated 12.5 T pulse
H Multipulse
H Color Multipulse
Measurement Results
Figure 3–11 shows an example of the YC DELAY measurement
results. The top line shows the measured delay, expressed in
nanoseconds. The bottom line shows the field, line, and signal type
on which the measurement was taken. The number is positive for
delayed chrominance and negative for advanced chrominance. A
perfect signal has no delay (0 ns).
3–24
VM100 & VM101 User Manual

T aking NTSC Measurements
Figure 3–11: Chrominance-to-luminance delay measurement screen
When the video measurement set cannot lock onto the color burst
signal, it displays an asterisk (*). Normally the video measurement
set locks to the color burst pulse. If burst lock is not possible, the
video measurement set uses sync lock to take the measurement.
Under these conditions the measurement accuracy may not be within
specifications.
Burst lock is not possible where no burst signal is present. You can
take a BURST AMPL measurement to determine if a burst signal is
present. If the measured burst amplitude is near zero, then burst is
not present. A normal burst amplitude level may indicate other
problems such as interference or scrambling.
NOTE. Frequency response aberrations that occur only in a narrow
band near the subcarrier frequency can affect the YC Delay
measur ement results.
VM100 & VM101 User Manual
3–25

T aking NTSC Measurements
Measuring YC Gain
Chrominance-to-luminance gain inequality (relative chrominance
level) is a function of the difference between the gain of the
chrominance and the luminance signal components as they pass
through a system.
Gain errors most commonly appear as attenuation or peaking of the
chrominance information. The resulting picture has incorrect color
saturation.
Detailed Measurement Description
One of the following signals must be present at the input to measure
chrominance-to-luminance gain using the VM100:
H NTC7 Composite
H FCC Composite
H Pulse & Bar with a modulated 12.5 T pulse
H Multipulse
H Color Multipulse
Measurement Results
Figure 3–12 shows an example of the YC GAIN measurement
results. The top line shows the measured results. The bottom line
shows the field, line, and signal type on which the measurement was
taken. The measurement result shows the ratio of chrominance gain
to luminance gain. A perfect signal has a 100% YC gain.
3–26
Figure 3–12: Chrominance-to-luminance gain measurement screen
VM100 & VM101 User Manual

Measuring Signal-to-Noise Ratio
Noise refers to the fluctuations that are present in any electrical
system. Noise can be either random or coherent. It comes from a
variety of natural and man-made sources. Although some noise is
always present, an excessive amount is undesirable because it
degrades or obscures the signal.
Signal amplitudes do not always remain constant as the video signal
is processed and transmitted. For this reason an absolute measurement of noise is not relevant; noise has a different affect on signals
of different amplitudes. The video measurement set measures
signal-to-noise ratio in decibels (dB) because it is the amount of
noise relative to the signal amplitude rather than the absolute amount
of noise that tends to cause problems.
Taking NTSC Measurements
Noisy pictures often appear grainy or snowy. You may see sparkles
of color, blurriness, and a general lack of picture resolution.
Equipment often has trouble synchronizing to extremely noisy
signals.
Detailed Measurement Description
One of the following signals must be present at the input to measure
signal-to-noise ratio using the VM100:
H Quiet line
H Black burst (setup)
H Pedestal
Measurement Results
Figure 3–13 shows an example of the SNR measurement results. The
top line shows the measured results displayed in dB; large values
indicate good signal quality. The bottom line shows the field, line,
and signal type on which the measurement was taken.
VM100 & VM101 User Manual
3–27

T aking NTSC Measurements
Figure 3–13: Signal-to-noise ratio measurement screen
The video measurement set uses an EIA RS250B noise filter for
noise weighting. The RMS noise amplitude from the filter is
referenced to 100 IRE; the reference is not the signal amplitude.
You can configure the video measurement set to use either a
weighted or flat filter when taking signal-to-noise measurements
(refer to page 1–13 for configuration instructions). Use the weighted
filter to provide additional weighting for low frequency noise that is
more visible at lower test frequencies. For example, you would use
this filter to estimate the image degradation due to noise. Use the flat
filter for applications that require equal spectral weighting for all
frequency components within the 5 MHz test bandwidth.
The following formula defines the S/N measurement:
100 IRE
SńN ratio dB + 20log
ǒ
RMS Noise
Ǔ
3–28
VM100 & VM101 User Manual

Measuring Frequency Response (FCC)
Frequency response measurements test the ability of a system to
uniformly transfer signal components of different frequencies
without affecting their amplitudes. This parameter , also known as
gain/frequency distortion or amplitude versus frequency response,
evaluates the system amplitude response.
The amplitude variation may be expressed in decibels (dB), percent,
or IRE. The reference amplitude (0 dB = 100%) is the white bar flag
or a low frequency. Measured frequency response results are only
meaningful if they contain three components:
H Measured amplitude
H Frequency at which the measurement was taken
T aking NTSC Measurements
H Reference amplitude
Frequency response problems cause a wide variety of picture
aberrations.
Detailed Measurement Description
One of the following signals must be present at the input to measure
frequency response using the VM100:
H Multiburst
H NTC7 Combo
H GCR
H Sin(x)/x
Table 3–4 shows the packet frequencies for the multiburst signals
that can be used.
VM100 & VM101 User Manual
3–29

T aking NTSC Measurements
Si
l
Ampli
e
T able 3–4: Packet frequencies for measuring frequency response
Packet Frequency (MHz)
gna
1410 Multiburst
Reduced
1410 Multiburst
Full
FCC Multiburst .5 1.25 2.0 3.0 3.58 4.1 60 IRE
TSG170 Multiburst .5 1.00 2.0 3.0 3.58 4.2 70 IRE
Cable Multiburst .5 1.25 2.0 3.0 3.75 4.0 60 IRE
NTC7 Combo .5 1.00 2.0 3.0 3.58 4.2 50 IRE
1st 2nd 3rd 4th 5th 6th
.5 1.25 2.0 3.0 3.58 4.1 60 IRE
.5 1.25 2.0 3.0 3.58 4.1 90 IRE
Measurement Results
Figure 3–14 shows an example of the FREQ (FCC) measurement
results. The top line shows the measured results expressed in dB.
The bottom line shows the field, line, and signal type on which the
measurement was taken.
tud
p-p
p-p
p-p
p-p
p-p
p-p
Flag (IRE)
10+60 IRE
10+90 IRE
40+60 IRE
10+60 IRE
60 IRE
50+50 IRE
3–30
Figure 3–14: Frequency response measurement screen
Multiburst or NTC7 Combo signals contain discrete frequency
packets. The VM100 uses the envelope of each packet to determine
the amplitude. It calculates the results using the FCC method. First
the video measurement set determines the average amplitude of the
six packets. It then finds the maximum and minimum amplitudes in
dB relative to the reference flag amplitude. The VM100 uses the
following formula calculate the measurement result which is
expressed in ±dB. A + indicates gain and a – indicates attenuation.
VM100 & VM101 User Manual

Frequency Response d B
If the input signal is sin(x)/x or GCR (ghost cancelling reference),
the VM100 takes a fine resolution, continuous frequency response
measurement.
NOTE. Use of a sin(x)/x signal may result in a lower signal-to-noise
ratio than other signals.
T aking NTSC Measurements
Max difference dB – Min difference dB
2
VM100 & VM101 User Manual
3–31

T aking NTSC Measurements
Measuring Frequency Response Detail
The video measurement set provides two types of frequency response
measurements. The basic frequency response measurement, which
appears in the CONFIG MEASURE menu as FREQ and in the
MEAS menu as FREQ (FCC), is described on page 3–29. The second
type of frequency response measurement is the frequency response
detail. It appears in the CONFIG MEASURE menu as FREQ
DETAIL.
The measurement results you see in the MEAS menu depend on the
signal type that you used. Multiburst and NTC7 Combo signals
contain discrete frequency packets. Sin(x)/x and GCR (ghost
cancelling reference) contain constant levels of energy over their
frequency range. For all signal types the top line of the measurement
results screen shows the measured results. The bottom line shows the
field, line, and signal type on which the measurement was taken.
Multiburst and NTC7 Combo Signals
If the video measurement set measures a signal with discrete
frequency packets, the flag (reference) amplitude is derived from the
multiburst bar amplitude. The FREQ FLAG screen (Figure 3–15)
shows the flag amplitude.
Figure 3–15: Frequency flag measurement results
The following six screens, beginning with FREQ #1, show the
amplitude of each successive packet measured relative to the flag
reference. The first packet measurement is shown in Figure 3–16.
3–32
VM100 & VM101 User Manual

T aking NTSC Measurements
Figure 3–16: Frequency detail screen showing first packet
Sin(x)/x and Philips
GCR Signals
If the video measurement set measures a swept signal, the frequency
detail measurement provides two screens: FRQmax and FRQmin.
The measurements (in dB) represent the maximum and minimum
frequency response of the signal relative to the amplitude of the
reference frequency (220 kHz). Following the measurement results
you will see the frequency where the maximum or minimum
amplitude was found (Figure 3–17). The frequency resolution is
limited to 112 kHz. The maximum frequency is 3.9 MHz for sin(x)/x
signals and 4.1 MHz for Philips GCR signals.
NOTE. The limit settings for FRQmin and FRQmax respond only to
the signal amplitude and not to the signal frequency.
Figure 3–17: Measurement screen showing maximum packet amplitude
VM100 & VM101 User Manual
3–33

Taking NTSC Measurements
Measuring Group Delay
The GRPDLY (group delay) measurement determines the relative
time delays (Max and Min) for the frequencies within the test signal.
Group delay distortion is present when signal components of
different frequencies experience different delays as they pass through
a system.
Group delay problems can cause a lack of vertical line sharpness due
to luminance pulse ringing, overshoot, or undershoot.
Detailed Measurement Description
One of the following signals must be present at the input to measure
group delay using the VM100:
H Philips
GCR
H Sin(x)/x
Measurement Results
Figure 3–18 shows an example of the GRPDLY measurement screen
for the maximum group delay. The top line shows the measured
results, expressed in nanoseconds. The bottom line shows the field,
line, and signal type on which the measurement was taken. You can
also view the results of the minimum GRPDLY measurement.
The video measurement set measures the maximum and minimum
group delay relative to the 220 kHz low frequency reference. The
maximum frequency used in the measurement is 3.8 MHz.
3–34
Figure 3–18: Group delay measurement screen
VM100 & VM101 User Manual

Measuring Sync Amplitude
The sync amplitude measurement is an average, peak-to-peak
measurement. Sync amplitude is an absolute measurement
referenced to 714 mV and expressed in IRE units.
The sync amplitude measurement provides a rough indication of
video signal quality. For example, sync amplitude measurements of
less than 40 IRE may indicate problems such as improper termination, sync compression, or AGC (system gain). A low ratio between
burst and sync might indicate chrominance attenuation.
Figure 3–19 shows an example of the SYNC AMPL measurement
screen. The top line shows the measured results. The bottom line
shows the field, line, and signal type on which the measurement was
taken.
Taking NTSC Measurements
Figure 3–19: Sync amplitude measurement screen
VM100 & VM101 User Manual
3–35

Taking NTSC Measurements
Measuring Burst Amplitude
The burst amplitude measurement is an absolute measurement
referenced to 714 mV and expressed in IRE units.
If burst is missing from the entire field, the measurement result is
very close to zero. For example, a monochrome signal has a
measured burst amplitude of approximately 0 IRE.
Figure 3–20 shows an example of the BURST AMPL measurement
screen. The top line shows the measured results. The bottom line
shows the field, line, and signal type on which the measurement was
taken.
Figure 3–20: Burst amplitude measurement screen
3–36
VM100 & VM101 User Manual
 Loading...