

Page 1

Tektronix TLA5201B Manual
Get Pricing & Availability at
ApexWaves.com
Call Today: 1-800-915-6216
Email: sales@apexwaves.com
https://www.apexwaves.com/analyzers/tektronix-inc/tla5000b/TLA5201B
Page 2

xx
Tektronix Logic Analyzer Family
ZZZ
Quick Start User Manual
www.tektronix.com
077-1575-03
Page 3

Copyright © Tektronix. All rights reserved. Licensed software products are owned by Tektronix or its subsidiaries or suppliers, and are
protected by na
tional copyright laws and international treaty provisions.
Tektronix pro
previously published material. Specifications and price change privileges reserved.
TEKTRONIX and TEK are registered trademarks of Tektronix, Inc.
MagniVu and TekLink are trademarks of Tektronix, Inc.
ducts are covered by U.S. and foreign patents, issued and pending. Information in this publication supersedes that in all
Contacting Tektronix
Tektronix, Inc.
14200 SW Karl Braun Drive
P.O. Box 500
Beaverton, OR 97077
USA
For product information, sales, service, and technical support:
In North America, call 1-800-833-9200.
Worldwide, visit www.tektronix.com to find contacts in your area.
Page 4

Warranty 2
Tektronix warrants that this product will be free from defects in materials and workmanship for a period of one (1) year from the date of
shipment. If any such product proves defective during this warranty period, Tektronix, at its option, either will repair the defective
product without charge for parts and labor, or will provide a replacement in exchange for the defective product. Parts, modules and
replacement products used by Tektronix for warranty work may be new or reconditioned to like new performance. All replaced
parts, modules and products become the property of Tektronix.
In order to obtain service under this warranty, Customer must notify Tektronix of the defect before the expiration of the warranty period
and make suitable arrangements for the performance of service. Customer shall be responsible for packaging and shipping the
defective product to the service center designated by Tektronix, with shipping charges prepaid. Tektronix shall pay for the return of the
product to Customer if the shipment is to a location within the country in which the Tektronix service center is located. Customer shall
be responsible for paying all shipping charges, duties, taxes, and any other charges for products returned to any other locations.
This warranty shall not apply to any defect, failure or damage caused by improper use or improper or inadequate m aintenance and
care. Tektronix shall not be obligated to furnish service under this warranty a) to repair damage resulting from attempts by personnel
other than Tektronix representatives to install, repair or service the product; b) to repair damage resulting from improper use or
connection to incompatible equipment; c) to repair any damage or malfunction caused by the use of non-Tektronix supplies; or
d) to service a product that has been modified or integrated with other products when the effect of such modification or integration
increases the time or difficulty of servicing the product.
THIS WARRANTY IS GIVEN BY TEKTRONIX WITH RESPECT TO THE PRODUCT IN LIEU OF ANY OTHER WARRANTIES,
EXPRESS OR IMPLIED. TEKTRONIX AND ITS VENDORS DISCLAIM ANY IMPLIED WARRANTIES OF MERCHANTABILITY OR
FITNESS FOR A PARTICULAR PURPOSE. TEKTRONIX’ RESPONSIBILITY TO REPAIR OR REPLACE DEFECTIVE PRODUCTS
IS THE SOLE AND E XCLU S IVE REMEDY PROVIDED TO THE CUSTOMER FOR BREACH OF THIS WARRANTY. T EKTRONIX
AND ITS VENDORS WILL NOT BE LIABLE FOR ANY INDIRECT, SPECIAL, INCIDENTAL, OR CONSEQUENTIAL DAMAGES
IRRESPECTIVE OF WHETHER TEKTRONIX OR THE VENDOR HAS ADVANCE NOTICE OF THE POSSIBILITY OF SUCH
DAMAGES.
Page 5

Warranty 9(b)
Tektronix warrants that the media on which this software product is furnished and the encoding of the programs on the media will be
free from defects in materials and workmanship for a period of three (3) months from the date of shipment. If any such medium or
encoding proves defective during the warranty period, Tektronix will provide a replacement in exchange for the defective medium.
Except as to the media on which this software product is furnished, this software product is provided “as is” without warranty of any
kind, either express or implied. Tektronix does not warrant that the functions contained in this software product will meet Customer’s
requirements or that the operation of the programs will be uninterrupted or error-free.
In order to obtain service under this warranty, Customer must notify Tektronix of the defect before the expiration of the warranty
period. If Tektronix is unable to provide a replacement that is free from defects in materials and workmanship within a reasonable
time thereafter, Customer may terminate the license for this software product and return this software product and any associated
materials for credit or refund.
THIS WARRANTY IS GIVEN BY TEKTRONIX WITH RESPECT TO THE PRODUCT IN LIEU OF ANY OTHER WARRANTIES,
EXPRESS OR IMPLIED. TEKTRONIX AND ITS VENDORS DISCLAIM ANY IMPLIED WARRANTIES OF MERCHANTABILITY OR
FITNESS FOR A PARTICULAR PURPOSE. TEKTRONIX’ RESPONSIBILITY TO REPLACE DEFECTIVE MEDIA OR REFUND
CUSTOMER’S PAYMENT IS THE SOLE AND EXCLUSIVE REMEDY PROVIDED TO THE CUSTOMER FOR BREACH OF
THIS WARRANTY. TEKTRONIX AND ITS VENDORS WILL NOT BE LIABLE FO R ANY INDIRECT, SPECIAL, INCIDENTAL, OR
CONSEQUENTIAL DAMAGES IRRESPECTIVE OF WHETHER TEKTRONIX OR THE VENDO R HAS ADVANCE NOTICE OF THE
POSSIBILITY OF SUCH DAMAGES.
Page 6

Table of Contents
Preface................................................................................................................................. ii
Key Features
Documentation ...................................................................................................................iii
Version Differences ..............................................................................................................iii
Basic Setup
Installation Documentation.......................................................................................................1
Connecting to a Network. . .. . .. . .. . .. .. . .. . .. . .. . .. . .. ... .. . .. . .. . .. . .. . .. ... ... .. . .. . .. . .. . .. .. . .. . .. . .. . .. . .. ... ... .. . .. . .. . .. . 1
Connectin
Connecting to Your Instrument . . .. . .. . .. . .. . .. ... ... .. . .. . .. . .. . .. . .. .. . .. . .. . .. . .. . .. ... ... .. . .. . .. . .. . .. . .. ... .. . .. . .. . .. . .. . . 2
Navigating the Logic Analyzer Windows .. ... .. . .. . .. . .. . .. . .. . .. ... ... .. . .. . .. . .. . .. . .. . .. ... ... .. . .. . .. . .. . .. . .. ... .. . .. . .. . .. 4
Basic Step
Data Window Overview .. . .. ... .. . .. . .. . .. . .. ... ... .. . .. . .. . .. . .. . .. ... ... .. . .. . .. . .. . .. . .. .. . .. . .. . .. . .. . .. ... ... .. . .. . .. . .. . .. . 7
Getting Acquainted with Your Instrument .. .. . .. . .. . .. . .. . .. .. . .. . .. . .. . .. . .. ... .. . .. . .. . .. . .. . .. ... .. . .. . .. . .. . .. . .. .. . .. . .. . .. . .. . ..8
Set the De
Configure the Setup Window . .. . .. . .. . .. ... ... ... .. . .. . .. . .. . .. . .. . .. . .. ... .. . .. . .. . .. . .. . .. . .. . .. ... ... ... .. . .. . .. . .. . .. . .. . .. . 8
Define the Trigger Window .. ... ... .. . .. . .. . .. . .. . .. .. . .. . .. . .. . .. . .. . .. ... ... .. . .. . .. . .. . .. . .. ... ... .. . .. . .. . .. . .. . .. ... .. . .. . . 13
Define th
Acquire Data.....................................................................................................................19
Using the Tabbed Trigger Window .. . .. . .. . .. ... .. . .. . .. . .. . .. . .. . .. . .. ... ... .. . .. . .. . .. . .. . .. . .. . .. ... ... ... .. . .. . .. . .. . .. . .. . 20
ing Data........................................................................................................................ 21
Analyz
Zooming Data ................................................................................................................... 21
Measure Waveform Data using Cursors ....................................................................................... 22
Using t
View Acquired Data with MagniVu High-Resolution Timing . .. . .. . .. .. . .. . .. ... .. . .. . .. ... .. . .. . .. .. . .. . .. . .. .. . .. . .. . .. .. . .. . 25
Managing Data.. . .. . .. .. . .. . .. . .. . .. . .. . .. . .. ... ... ... .. . .. . .. . .. . .. . .. . .. . .. ... ... ... .. . .. . .. . .. . .. . .. . .. . .. ... .. . .. . .. . .. . .. . .. ..... 27
g Setups................................................................................................................... 27
Savin
Loading Setups. . .. . .. ... ... .. . .. . .. . .. . .. . .. ... .. . .. . .. . .. . .. . .. ... .. . .. . .. . .. . .. . .. ... .. . .. . .. . .. . .. . .. ... ... .. . .. . .. . .. . .. . .. . 28
iView Integrated Measurements .....................................................................................................29
ecting the Logic Analyzer and the Oscilloscope . .. . .. . .. . .. . .. .. . .. . .. . .. . .. ... ... .. . .. . .. . .. . .. ... .. . .. . .. . .. . .. . .. .. . . 29
Conn
Acquiring the iView Data........................................................................................................ 31
Aligning the Oscilloscope Data with the Logic Analzyer Data . .. . .. . .. . .. ... ... .. . .. . .. . .. . .. ... .. . .. . .. . .. . .. .. . .. . .. . .. . .. .. 31
lication Examples................................................................................................................. 34
App
Triggering on a Glitch . . .. .. . .. . .. . .. .. . .. . .. . .. ... .. . .. . .. . .. .. . .. . .. . .. .. . .. . .. . .. ... .. . .. . .. . .. .. . .. . .. ... .. . .. . .. . .. ... .. . .. . 34
State Acquisition ................................................................................................................37
ggering on a Setup & H old Violation.. ... .. . .. . .. . .. . .. .. . .. . .. . .. ... ... .. . .. . .. . .. ... .. . .. . .. . .. . .. .. . .. . .. . .. ... ... .. . .. . .. 40
Tri
Specifications .........................................................................................................................42
Index
..................................................................................................................... ii
s........................................................................................................................... 1
g Probes to the System Under Test. . .. . .. ... ... ... ... .. . .. . .. . .. . .. . .. . .. . .. . .. . .. ... ... ... ... .. . .. . .. . .. . .. . .. . .. . . 1
s for Using a Logic Analyzer . ... ... .. . .. . .. . .. . .. ... .. . .. . .. . .. . .. ... ... .. . .. . .. . .. . .. ... ... .. . .. . .. . .. . .. ... .. . .. . .. 6
fault System .......................................................................................................... 8
e Waveform Window . .. . .. . .. ... ... ... .. . .. . .. . .. . .. . .. . .. . .. ... ... ... .. . .. . .. . .. . .. . .. . .. . .. .. . .. . .. . .. . .. . .. . .. . .. .. 15
he Data Measurement Window ......................................................................................... 24
Table of Content
s
TLA Quick Start User Manual i
Page 7
Preface
Preface
This manual describes the basic operation and concepts of the Tektronix Logic Analyzer series instruments. The TLA5000B
Series Logic Analyzers are stand-alone products and the TLA7000 Series Logic Analyzers are configurable modular
products. The TLA7000 Series Logic Analyzers can be configured with a variety of logic analyzer modules and serial
analyzer modules. All logic analyzers have integrated operation capabilities with Tektronix oscilloscopes. This manual
supports the following instruments:
TLA5000B Series Logic Analyzers (TLA5201B, TLA5202B, TLA5203B, TLA5204B)
TLA7000 Series Mainframes (TLA7012, TLA7016) and their associated modules
Key Features
The Tektronix Logic Analyzers can help you verify and debug hardware designs, processor and bus designs, and embedded
software a
nd hardware integration. Key features include:
34/68/102
500 ps (2 G
125 ps (8 G
difficult problems
Up to 235 MHz state acquisition analysis of synchronous digital circuits, TLA5000B series
Up to 800 MHz state acquisition analysis of synchronous digital circuits, TLA7Axx series
Up to 1400 MHz state acquisition analysis of synchronous digital circuits, TLA7Bxx series
Simultaneous state, high-speed timing and analog analysis through the same logic analyzer probe to pin-point elusive
faults without double probing, TLA7ACx series, TLA7Bxx series, and Tektronix oscilloscopes
Glitch and setup/hold violation triggering finds and displays elusive hardware problems
Transitional storage extends the signal analysis capture time
Connectorless probing system with 0.5 pF total capacitive loading eliminates the need for on-board connectors,
minim
onix also offers the TLA7S08 and TLA7S16 serial analyzer modules for PCI Express validation of silicon, computer
Tekt r
systems, and embedded systems. Key features include:
8- and 16-channel serial analyzer modules with 32 M 8b/10b symbols memory depth per channel
2.5 Gb/s and 5 Gb/s acquisition speeds for PCI Express 1.0 and PCI Express 2.0
/136 channel logic analyzers
Hz) 256 Mb deep timing analysis
Hz) MagniVu high resolution timing acquisition simultaneous with deep timing or state acquisition to find
izes intrusion on circuits, and is ideal for differential signal applications
Support for x1, x2, x4, x8, and x16 PCI Express links
ii TLA Quick Start User Manual
Page 8
Documentation
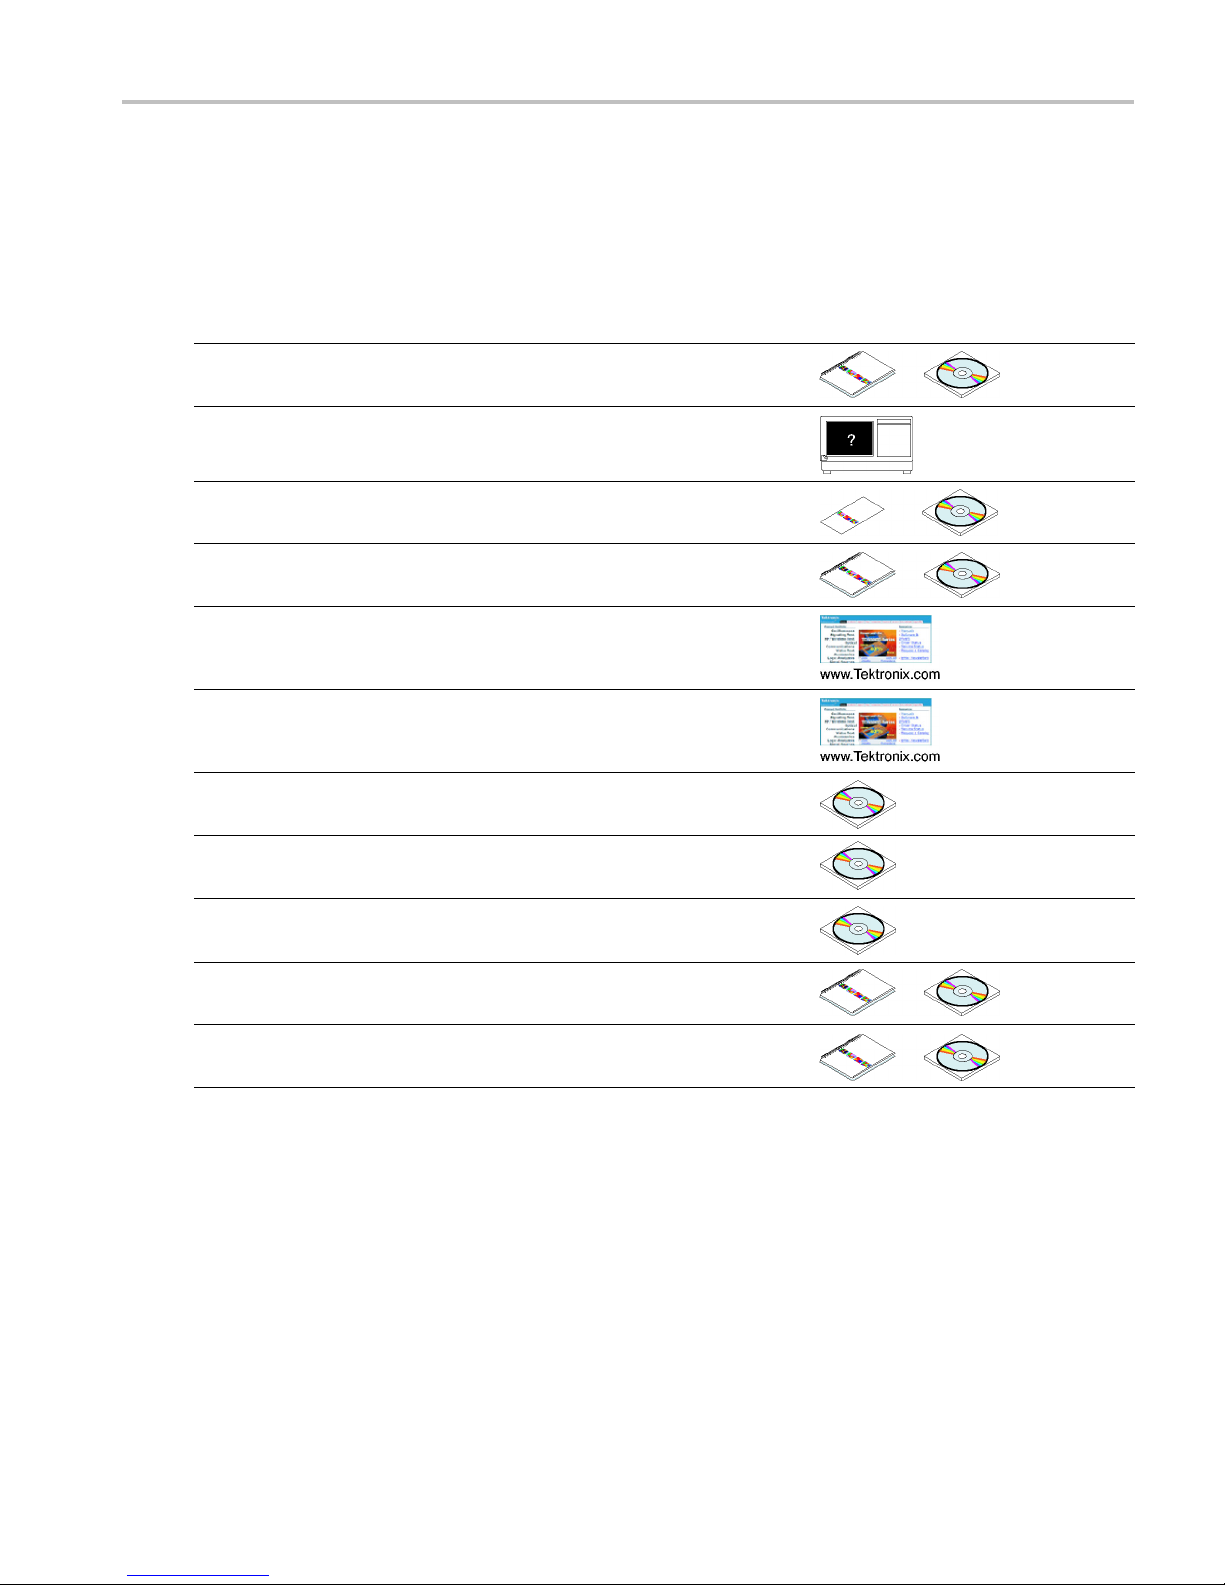
The following table lists related documentation, available as printed documents or as PDF documents on the TLA
Documentation CD and on the Tektronix Web site (www.tektronix.com). Other documentation, such as online help, is
available on the instrument.
Related Documentation
Item Purpose Location
TLA Quick Start User Manuals
Preface
High-level operational overview
Online Help
Installation Quick Reference Cards High-level installation information
Installation Manuals
XYZs of Logic Analyzers
Declassification and Securities
instructions
Application notes
t Specifications & Performance
Produc
Verification Procedures
TPI.NET Documentation
upgrade kits
Field
In-depth operation and UI help
Detailed first-time installation
ion
informat
Logic analyzer basics
Data security concerns specific
to sanitizing or removing memory
from Tektronix products
devices
Collection of logic analyzer application
specific notes
TLA Pro
performance verification procedures
Detailed information for controlling the
logic analyzer using .NET
Upgrade information for your logic
analyzer
duct s pecifi cations and
Optional Service Manuals Self-service documentation for
Version Differences
Some of the illustrations in this document may have different icons than your instrument due to differences in software
versions. Refer to the online help for the menu features of your software version.
TLA Quick Start User Manual iii
modules and mainframes
Page 9

Preface
iv TLA Quick Start User Manual
Page 10
Basic Setups
Installation Documentation
For installation instructions and descriptions of controls and connectors on your instrument, refer to the installation reference
card or installation manual that came with the instrument. (See page iii, Documentation.)
Connecting to a Network
The user interface operates under the Microsoft Windows® operating system. Before you connect to a network, Microsoft
recommend
s the following to ensure your instrument is protected:
Basic Setups
Useaninte
Install op
Use up-to-
See the in
rnet firewall
erating system updates regularly
date antivirus software
stallation manual for detailed instructions on connecting to a network.
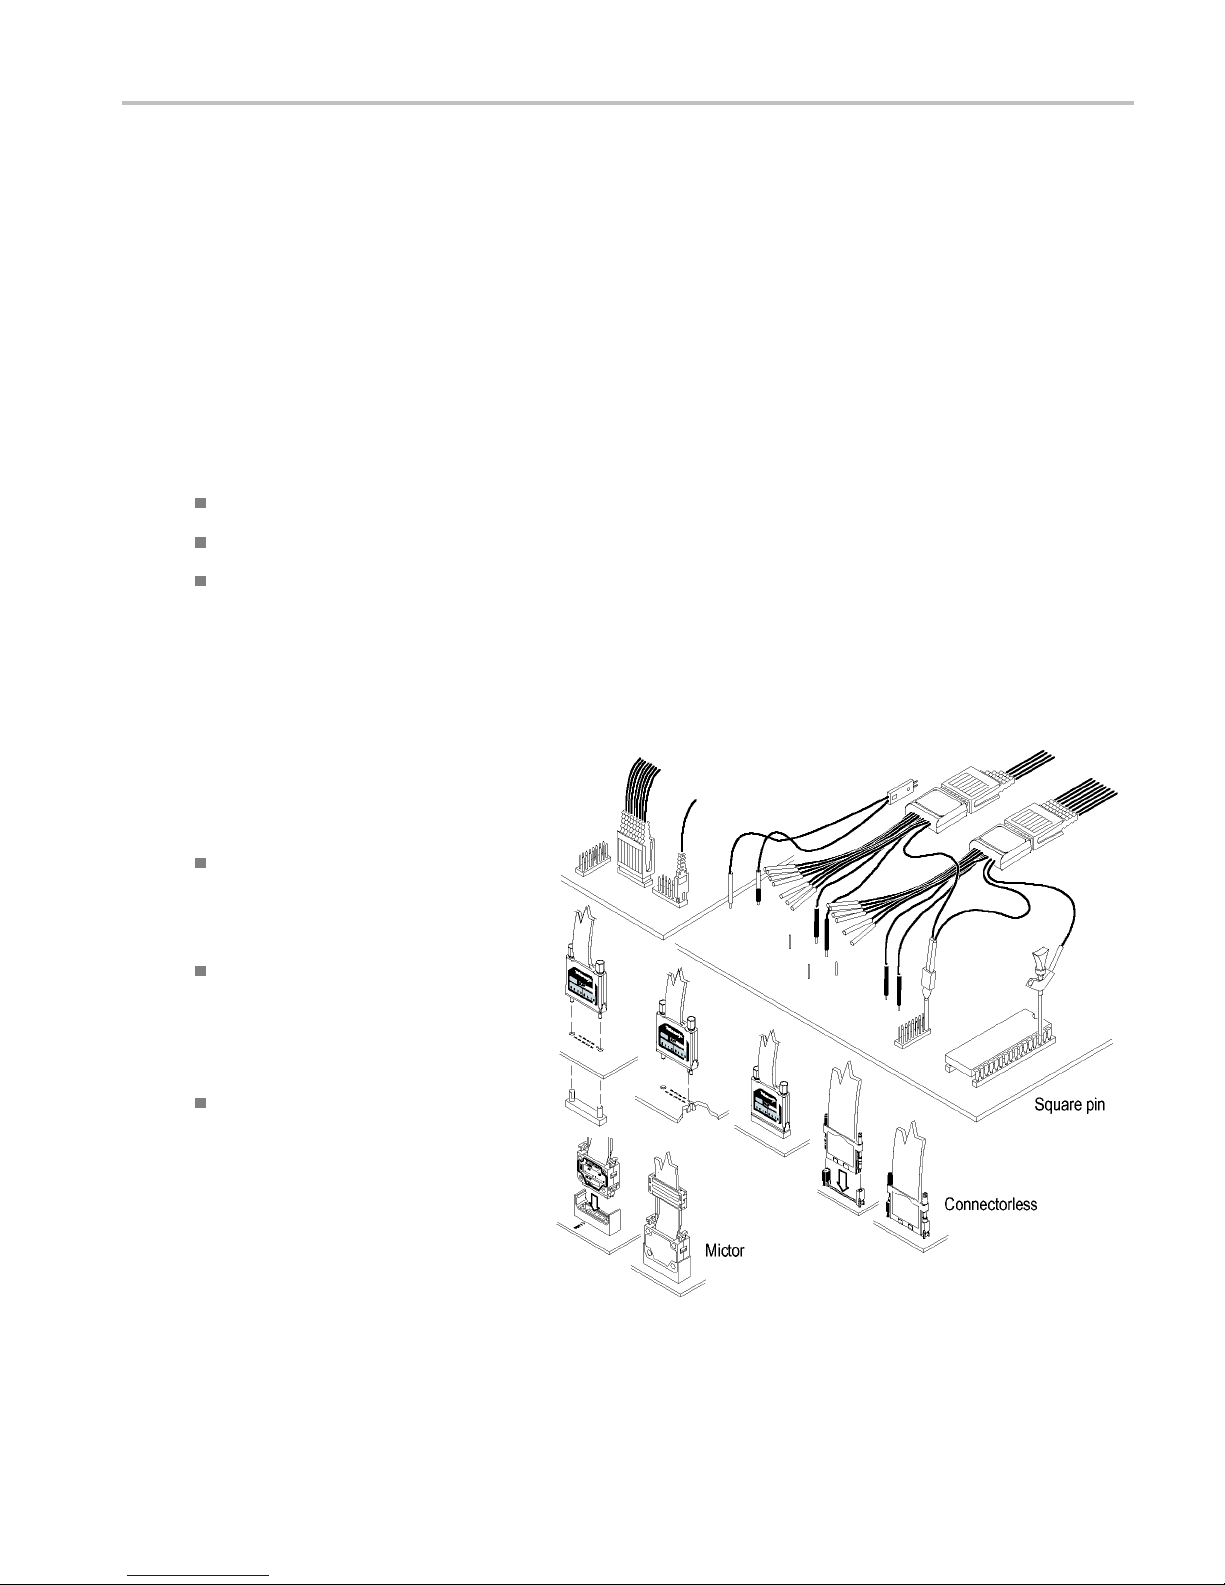
Connecting Probes to the System Under Test
The logic analyzer has different methods of
ing probes to the system under test.
connect
Refer to the illustration and connect your
probes to the system under test.
Square pin connectors. Use
l-purpose probes to connect to
genera
the system under test using square pin
connectors or square-pin adapters.
Connectorless compression
ctors. Use land pattern probes for
conne
applications that connect many channels
to connectorless compression contacts
e system under test.
on th
or connectors. Use Mictor
Mict
connector probes for applications
requiring many channels to be quickly
ected using Mictor connectors or
conn
Mictor adapters.
TLA Quick Start User Manual 1
Page 11
Basic Setups
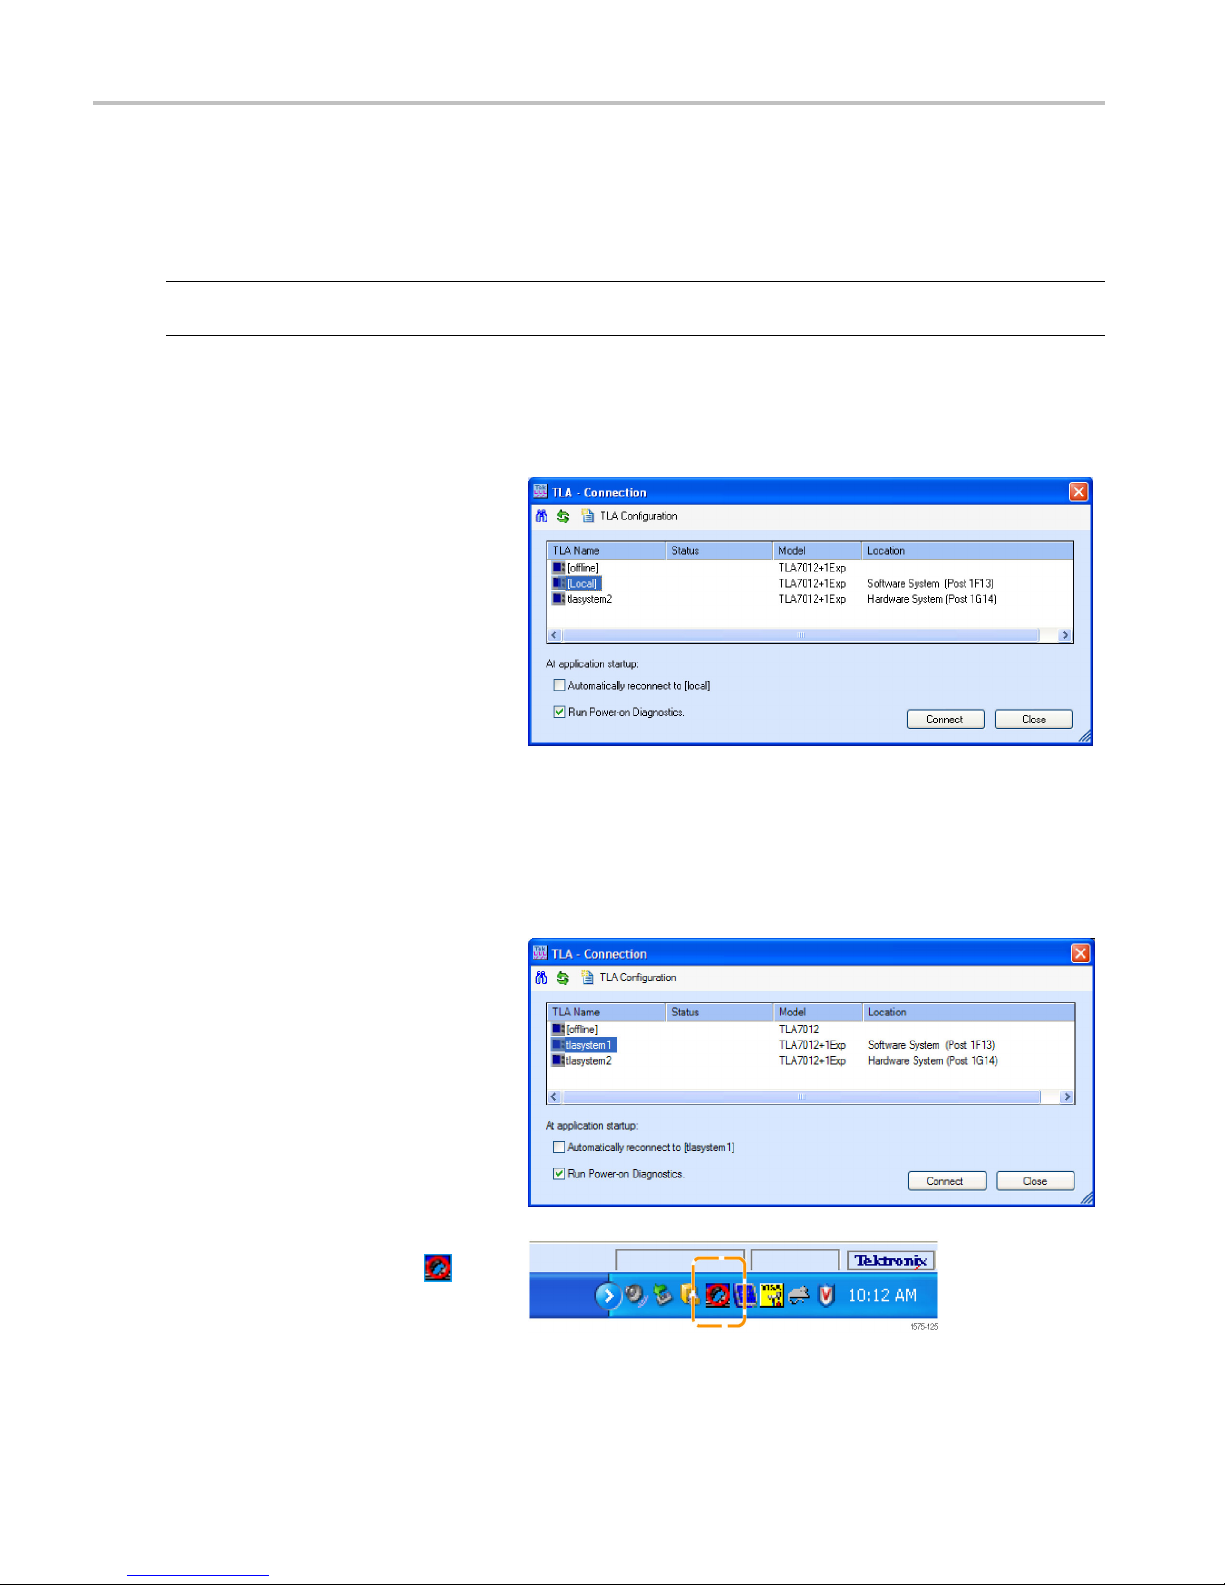
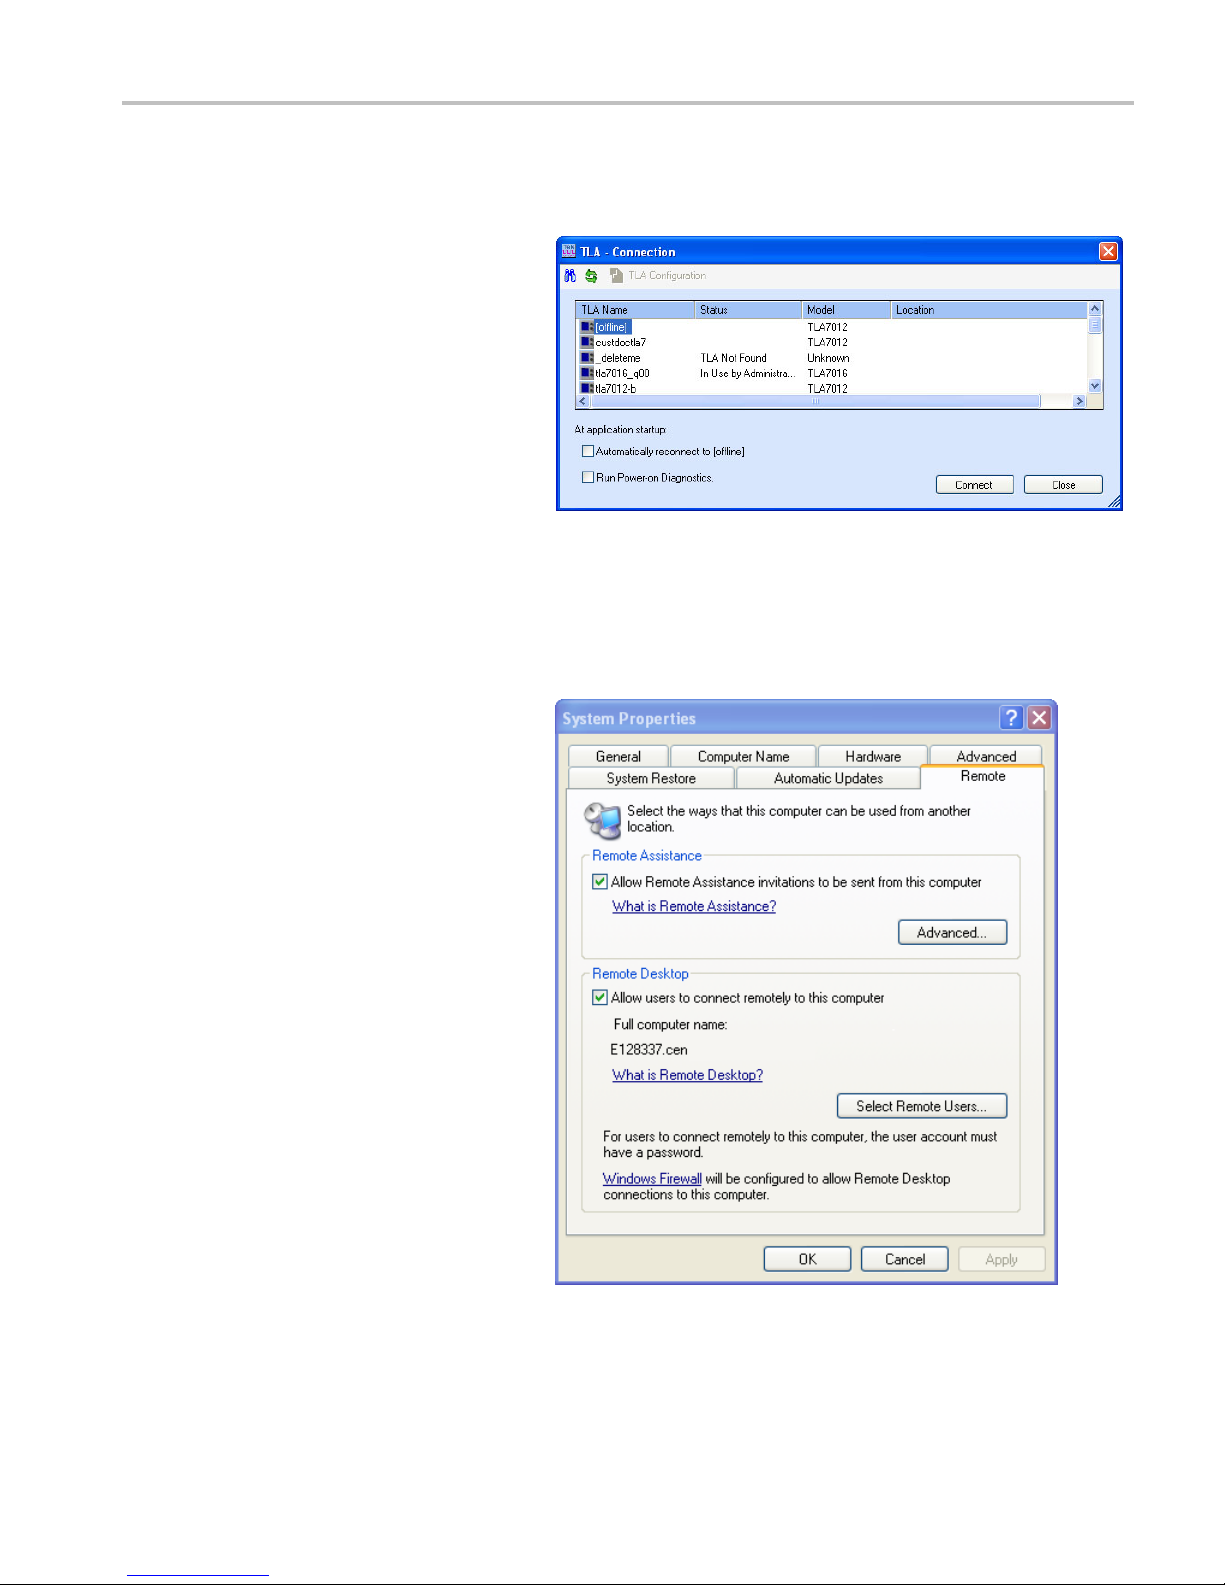
Connecting to Your Instrument
You can connect to your instrument as Remote Host, Remote Desktop, or Local.
To access the TLA Connection dialog box, start the TLA Application software on the instrument or on your PC.
NOTE. The TLA Connection dialog box appears when you start the instrument from a PC or when you restart the TLA
application without shutting down the instrument.
Local Connection
Choose a Local connection when you want to work directly on the instrument.
NOTE. Make sure that you s elect Local
instead of Offline when you want to connect
to your local instrument. Selecting Offline
does not connect you to an instrument.
Remote Host Connection
Connect as Remote Host when you want to run the application o n your PC to control the instrument remotely, and then
store the data locally on your PC.
NOTE. You must be connected to a LAN
to use R emote Host and the TLA Server
(TLA7012 and TLA5000B) must be running.
Refer to Controlling the Logic Analyzer
Remotely in the TLA7000 Series Logic
Analyzers Installation Manual for more
informationonconfiguring your instrument
for remote operation.
NOTE. To start the TLA Server on a
TLA7012 instrument, right-click the
Server) icon in the toolbar at the bottom right
side of the screen and select Start TLA
Server
(TLA
2 TLA Quick Start User Manual
Page 12
Basic Setups
Offline
You can work offline, without connecting to an instrument, to modify setups or view data files that you previously saved.
Click the TLA Application on the desktop and
then select Offline.
Remote Desktop
Connect as Remote Desktop when you want to run the application on the instrument from your PC and store the data
on the instrument.
To enable the Remote Desktop, ensure that
the Micro
dialog box on the instrument is setup as
shown.
See the M
http://www.microsoft.com for more
information on working remotely.
soft Windows System Properties
icrosoft Web site
TLA Quick Start User Manual 3
Page 13
Basic Setups
Navigating the L ogic Analyzer Windows
Tektronix provides several different ways of navigating the logic analyzer windows to accomplish your basic tasks. Choose
the one that works best for you.
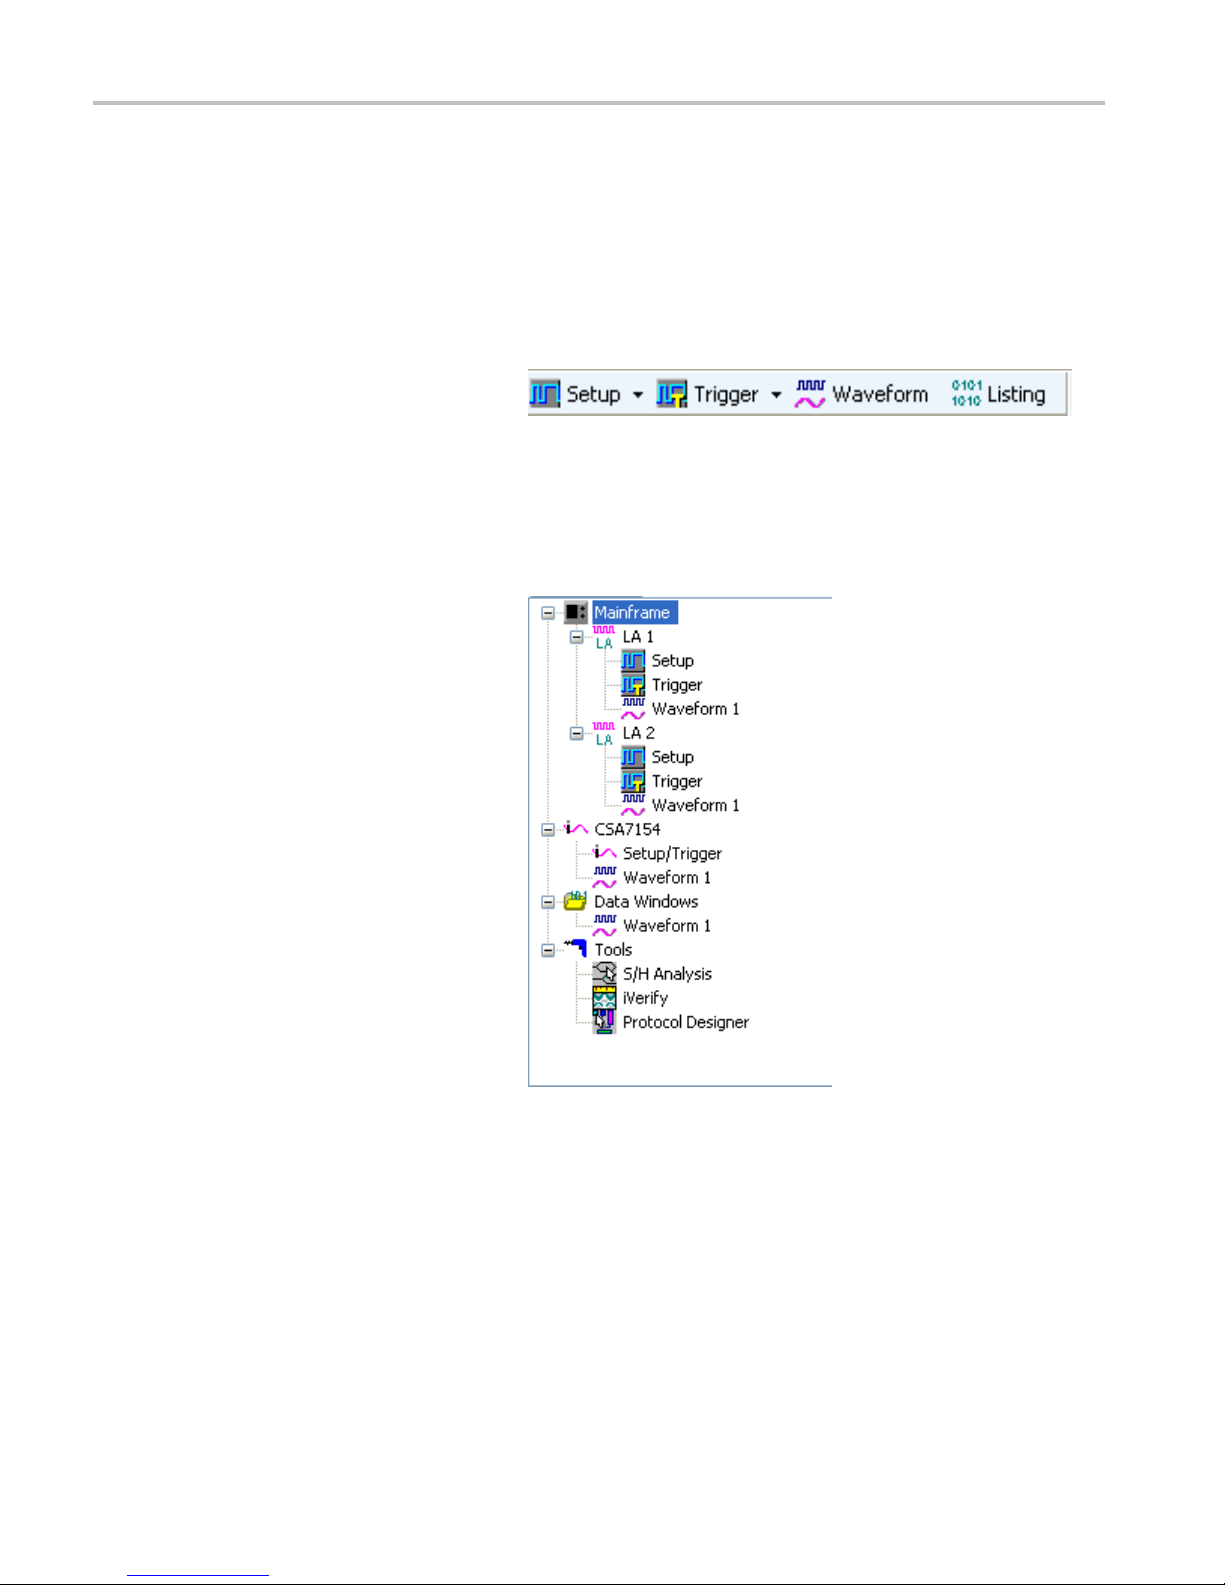
Toolbar Buttons
Use the toolbar buttons to quickly navigate between key windows while making the best use of screen space.
Click one of
Setup window, Trigger window, Waveform
window, or Listing window.
Toolbar Bu
Use the TLA Explorer to quickly access key windows from a tree structure.
The TLA Explorer shows all of the modules in
the logic analyzer and their subcomponents.
the buttons to quickly access a
ttons
4 TLA Quick Start User Manual
Page 14
Basic Setups
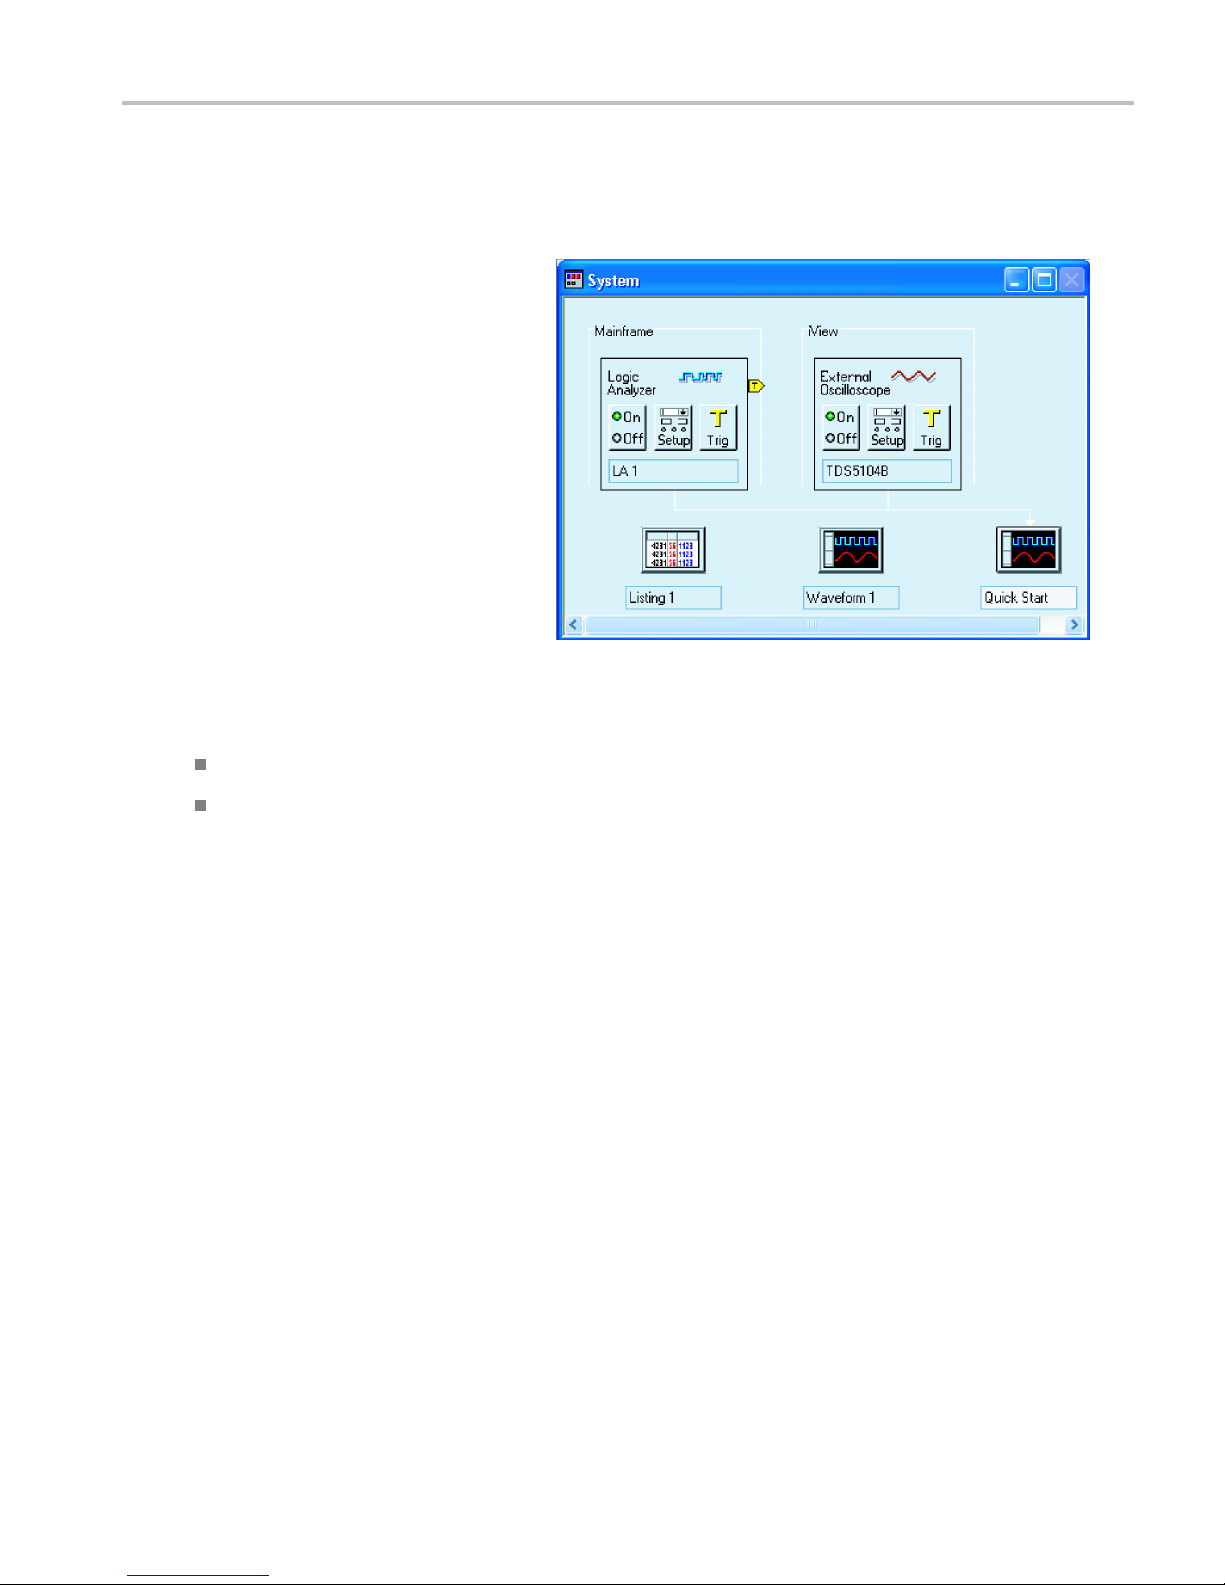
System Window
The System window shows a block diagram representation of the modules and data windows available with your logic
analyzer. Click an icon to open the related window.
Quick Tips
To open the System window, select System from the Window menu or press function key F9.
Use the front-panel buttons to navigate between windows on the TLA7012 Portable Mainframe.
TLA Quick Start User Manual 5
Page 15

Basic Setups
Basic Steps for Using a Logic Analyzer
The basic steps for using the logic analyzer are summarized below.
1. Use the Setup window to set up the logic analyzer signals, threshold voltages, clocking, and sampling, and samples per
signal
2. Specify triggering in the Trigger window.
3. Configure a Waveform window.
4. Acquire data.
5. Analyze the data in the Waveform or Listing window.
6 TLA Quick Start User Manual
Page 16
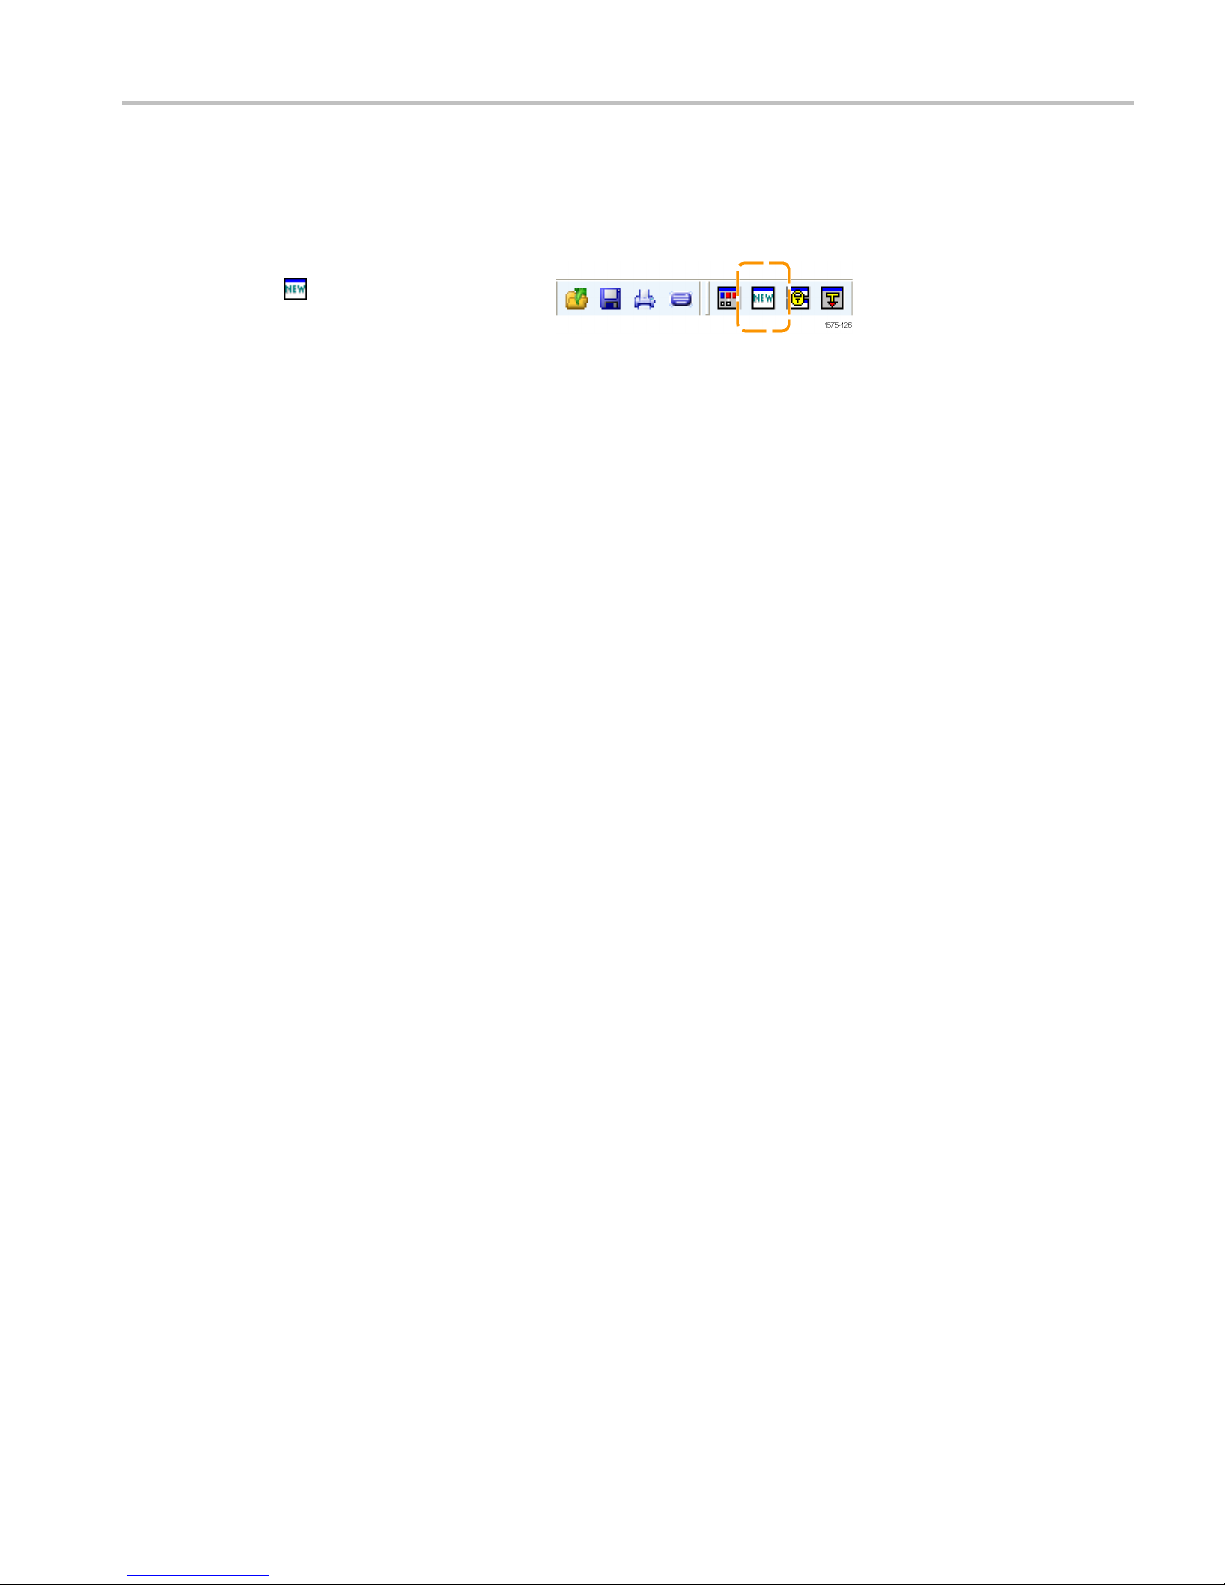
Data Window Overview
Use data windows to display and analyze data acquired by your instrument. The Waveform window is the default data
window. Create other data windows using the New Data Window wizard.
NOTE. To start the New Data Window
wizard click
Data Window from the Window menu.
in the toolbar or select New
Basic Setups
Waveform Wi
Use Waveform windows to display waveform data from the logic analyzer or from an external oscilloscope. Waveform
windows are best used for diagnosing timing problems, measuring hardware timing-related characteristics, and verifying
correct hardware operation by comparing recorded results against data sheet timing diagrams.
ndow
Listing Window
Use Listing windows to display acquired data in a state table display. Listing windows can be used for state machine debug
ions, tracing relative software execution, system optimization, and following data through a system design.
applicat
Histogram Window
Use Histogram windows to display acquired data as histograms. Histogram data is useful for evaluating the performance of
software, such as determining which routines or functions take most of the time perform ing certain tasks.
Source Window
Use Source windows with Listing windows to track the execution of source code in software applications.
h Window
Grap
Use Graph windows to display the results of acquired data in a graph or chart format.
Protocol Window
Protocol windows to display and analyze protocol data.
Use
TLA Quick Start User Manual 7
Page 17
Getting Acquain
ted with Your Instrument
Getting Acqua
The following sections show how to set up the logic analyze r and to do timing analysis using data from a simple D-type
flip-flop. Flip-flops serve as building blocks in digital systems. Although most flip-flops are buried inside complex ASICS and
other devices, they are useful for showing hardware debugging techniques using a logic analyzer. The examples in this
document use only a few channels to acquire data. However, you can use the same concepts with hundreds of channels.
inted with Your Instrument
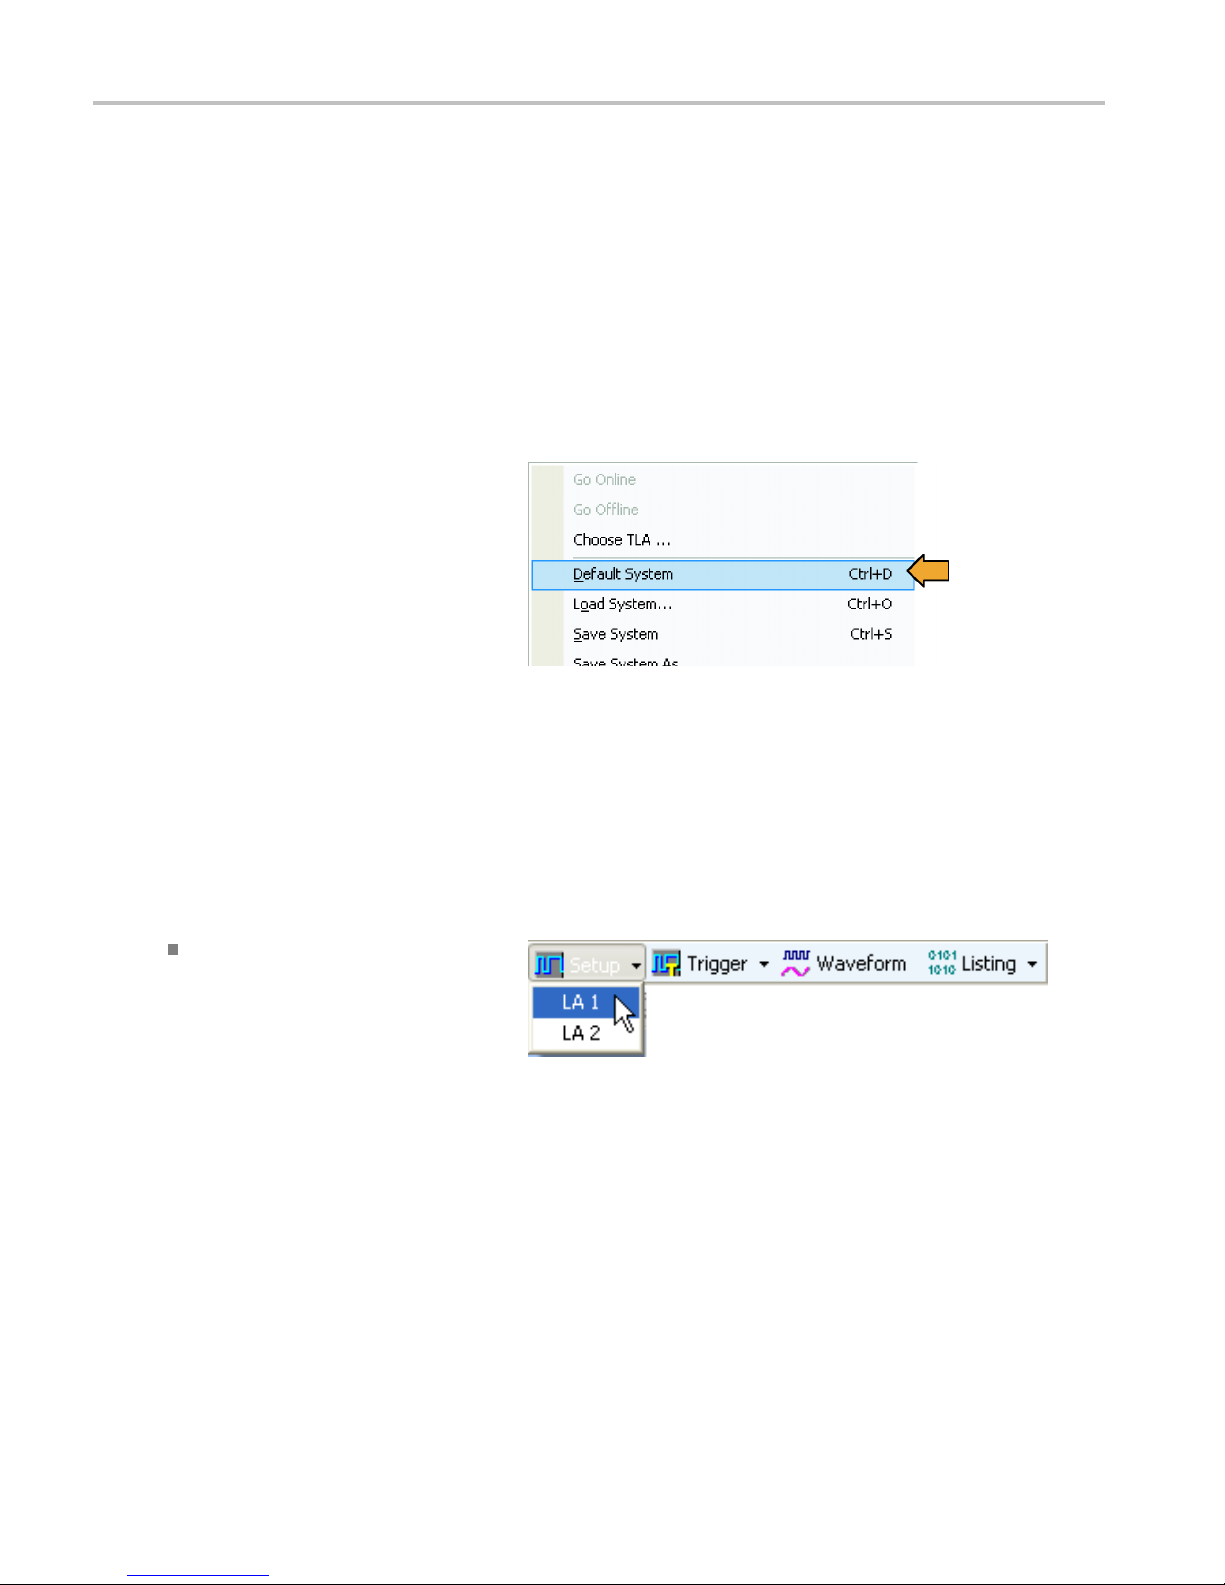
SettheDefaultSystem
Use the Default System setup to load the factory default settings.
1. Power on the instrument and wait for
the instru
tests.
2. Select Default System from the File
menu.
3. Click OK.
ment to complete the power-on
Configure the Setup Window
Use the following procedures to define data signals, to set the clocking, to set the probe threshold voltages, and to use
other features of the Setup window.
Open the Setup Window
Click the Setup button in the TLA toolbar
and to select the Setup window for your
instrument.
8 TLA Quick Start User Manual
Page 18

Getting Acquain
tedwithYourInstrument
Specify the Sampling Meth od
When you select asynchronous sampling, the logic analyzer selects when data is sampled (sample point). Asynchronous
sampling is also known as timing acquisition.
When you use synchronous sampling, the system-under-test specifies the sample point by an external clock. Synchronous
sampling is also known as state acquisition.
The following example uses asynchronous sampling.
1. Select Asynchronous.
2. Set sample period (or use default
setting).
3. Select the threshold voltage.
The threshold voltage is applied to all probe
channels. You can set threshold voltages for
individual channels in the bottom part of the
Setup window.
NOTE. If your logic analyzer has a support package installed, a custom clocking tab is available. The label on the tab is
the same as the support package.
TLA Quick Start User Manual 9
Page 19

Getting Acquain
Set the Storage O ptions
Use Storage to specify the length of each data acquisition and how to store the acquisition.
1. Select the number of samples to
store per signal. The selections vary
depending on your logic analyzer.
2. Select how to store the acquisition.
ted with Your Instrument
Select Samples to store samples
specified by the trigger actions.
Select 63-Sample Blocks to store
samples in bloc ks of 63 bits;
this is often recommended for
troubleshooting program flow.
Select Samples + Glitches to store
glitch data (Asynchronous sampling
only).
Select Samples + Violations (Setup
and hold violations) to store setup
and hold violations (Synchronous
and Custom sampling only).
10 TLA Quick Start User Manual
Page 20

Getting Acquain
Deskew the Probe Signals
When using Synchronous or Custom sampling, you might want to deskew the signals in your setup.
1. Set the deskew parameters.
2. Click Deskew to begin the deskew
process.
Create Groups
tedwithYourInstrument
Groups are
When you en
1. Enter a name for the group, for example,
2. Determine the probe section that you
logical collections of probe signals often related to busses on your system-under-test.
ter the Setup window the first time, an empty group card appears on the right side of the Setup window.
Address Bus.
want to use. For example, click A3 to
select the signals for section A3.
TLA Quick Start User Manual 11
Page 21

Getting Acquain
ted with Your Instrument
3. Drag selected s
ignals to the group card.
4. To create additional groups, click the
plus sign at the right edge of the Groups
column.
12 TLA Quick Start User Manual
Page 22

Getting Acquain
tedwithYourInstrument
Check Signal Activity
You can easily check for signal activity at the probe tips by looking at the Activity & Threshold indicators in the Setup
window. When there is signal activity, the indicators change from a 1 to a 0 with yellow in between. Each data and clock
signal has its own indicator.
Note the signals in the example:
The signal connected to A3(5) is low as
indicated by the zero (o).
The signal connected to A3(4) is high as
indicated by the one (1).
The signal connected to A3(3) is
transitioning as indicated in yellow..
NOTE. If the signals are inverted the zero
(O ) appears on top and the one (1) is on the
bottom.
If there is no probe activity, check for the following:
Check the probe connections.
Verify that the target system is powered on
Check the probe threshold voltages. (Click the Activity & Threshold indicators to open a dialog box to adjust the
threshold voltages.)
Define the Trigger Window
Use triggers to tell the logic analyzer when to acquire data and display the results in a data window.
1. Click t
he Trigger button in the TLA
toolbar and select the Trigger window for
your instrument.
TLA Quick Start User Manual 13
Page 23

Getting Acquain
ted with Your Instrument
2. In the Easy Trig
program from the list. For example,
select Trigger immediately to trigger
the instrumen
Use the area below the trigger program
list to enter more details for the trigger
programs, if
3. Click and dra
to the point in memory where you want
the instrument to trigger. The default
selection i
ger tab, select a trigger
t on any data.
needed.
gtheTrigger Pos indicator
s 50%.
Quick Tips
After you have acquired data, use the Ta bbed Trigger window to define simple trigger programs without having to close
the Waveform or Listing window.
Use EasyTrigger to define the trigger program for most applications; use PowerTrigger to customize the trigger program
for specific needs.
14 TLA Quick Start User Manual
Page 24

Define the Waveform Window
For most applications, y ou will define the data windows for your needs. For this example, you will use the Waveform window.
Open the Waveform Window
Click the Waveform button to open the
Waveform window.
Delete the Default Waveforms
1. Press the CTRL key and select each
waveform
name that you w ant to delete.
Getting Acquain
tedwithYourInstrument
TLA Quick Start User Manual 15
Page 25

Getting Acquain
ted with Your Instrument
2. Right-click an
Waveforms.
d select Delete
Quick Tip
Use the delete key on the keyboard to delete highlighted waveforms.
16 TLA Quick Start User Manual
Page 26

Getting Acquain
tedwithYourInstrument
Add Waveforms
Use the following steps to add the waveforms that you defined in the Setup window. (See page 11, Create Groups.)
1. Right-click in the waveform label area
and select Add Waveform.
2. Expand each group.
TLA Quick Start User Manual 17
Page 27

Getting Acquain
3. Press the Ctrl key while selecting each
signal that you want to add to the
Waveform wind
4. Click Add.
5. Click Close.
Quick Tip
Select By Name to add the probe signals to the Waveform window by their channel names. This is useful for groups
that hav
ted with Your Instrument
ow.
e only one channel.
18 TLA Quick Start User Manual
Page 28

Acquire Data
After you have defined all of the setups and connected the probes to the target system, you are ready to acquire data. You
can acquire a single sequence of data, or you can continuously acquire data.
Making a Single Acquisition
1. Click Run.
The Run button changes to Stop until the
instrument has met the trigger conditions
and has acquired the data. The button
changes back to Run after data has been
acquired.
2. If the instrument does not trigger, click
Status. Use the information in the dialog
box to see if the logic analyzer is waiting
for the trigger or if it has triggered and is
filling its acquisition memory.
When a trigger occurs, the instrument
displays the flip-flop Clock, Input, and
Output data in the Waveform window.
The trigger point is represented by the
red trigger marker (T).
Getting Acquain
tedwithYourInstrument
Quick Tip
To verify that the instrument is acquiring data during long periods of inactivity on the screen, check that the Tek icon in
the upper right corner of the screen is animated.
Making Repetitive Acquisitions
1. Click the Repetitive Run button to acquire
data repetitively. The icon changes from
an arrow to a loop.
2. Click Run. T he instrument will acquire
data until you click Stop or until you
click the Repetitive Run button again to
change back to single run mode.
TLA Quick Start User Manual 19
Page 29

Getting Acquain
ted with Your Instrument
Using the Tabbed Trigger Window
You can define a trigger program using the Tabbed Trigger window without closing the Waveform or Listing window. The
following example shows how to set up the instrument to trigger on a channel edge.
You can also use this procedure to quickly define other trigger programs. To acquire complex data, you can still use
the Power Trigger window.
1. Click Run.
Data must be present before you can use the
Tabbed Trigger window.
2. Click Trigger in the tabbed window.
3. Click and drag the Channel Edge icon
from the Tabbed Trigger window to the
waveform.
Output
The instrument will display the details of
the program in the Trigger Details area.
ails are s imilar to those in the
The det
Power Trigger window. You can edit any
of the details.
4. Click Run to acquire data and trigger
strument based on the new trigger
the in
program.
20 TLA Quick Start User Manual
Page 30

Analyzing Data
Your instrument has several tools for analyzing data, such as zooming data, measuring data, and viewing data with MagniVu
high-resolution timing. This section provides concepts and procedures for analyzing data in the Waveform window. Some of
these features also apply to the Listing window; refer to the online help for more details.
Zooming Data
To zoom data in the Waveform window:
1. Click and drag from left to right over the
area you want to zoom.
Analyzing Data
2. Click the Zoom In button a few times to
zoom the timing data samples.
Quick Tips
Click and drag from the right to the left to zoom to the previous selection.
Use the Zoom In and the Zoom Out buttons in the toolbar as an alternative method of zooming data.
Rearrange the toolbars, as needed, to access command buttons, if the command buttons appear off-screen.
TLA Quick Start User Manual 21
Page 31

Analyzing Data
Measure Waveform Data using Cursors
Use the Snap to Edge feature with cursors in the Waveform window to measure the time between waveforms.
1. Point the mouse at Cursor 1 over the
waveform that you want to measure.
2. Click and drag Cursor 1 toward a leading
or trailing edge of the waveform.
3. Release the mouse to snap the cursor to
the next waveform edge.
4. Repeat for Cursor 2.
22 TLA Quick Start User Manual
Page 32

5. If the Delta-time toolbar is turned off,
click
6. Read the time difference between the
two cursors.
.
Quick Tips
Analyzing Data
If the cursors do not appear in the Waveform window, use the right-click menu to move the cursors on screen (select
Move Cursor 1 Here ).
You can use the Snap to Edge feature with any of the user marks.
You can click to add multiple Delta-Time toolbars in the same Waveform window.
You can use the Delta-Time toolbar to measure time between any two marks. Select the marks from the drop-down
lists in the toolbar.
TLA Quick Start User Manual 23
Page 33

Analyzing Data
Using the Data Measurement Window
Use the Data Measurement window to quickly take measurements in the Waveform or Listing window.
1. Click Measurements.
2. Click and dr
Clock waveform, and release.
The selected measurement will be added
to the Data
bottom of the display.
3. Repeat for any other measurements.
4. Click the Statistics tabintheData
Measurement window to display the
results of the measurement along with
other statistics. Measurements are taken
on the existing data without having to
acquire new data.
ag the Period icon to the
Measurement window at the
24 TLA Quick Start User Manual
Page 34

Quick Tips
To take a measurement on new data, click Run.
To save the measurement data to a file, click the Export button in the Statistics tab of the Data Measurement window.
To select a measurement in the Waveform window, select the waveform label, right-click the waveform, select Add LA
Data Measurement, and then select a measurement from the list.
View Acquired Data with MagniVu High-Resolution Timing
Analyzing Data
MagniVu hig
details that you may not see using Deep timing. It is like having two logic analyzers in one. Using a single probe you can view
Deep timing data for long time spans and MagniVu high-resolution timing data for greater resolution at the area of interest.
The MagniVu high-resolution data is automatically acquired with each acquisition. However, the waveforms may not be
visible. T
1. Click below the waveform labels to
deselect all waveforms.
2. Click MagniVu to add the MagniVu data
to the Wav
The MagniVu timing waveforms are
added to the window in a different color.
h-resolution timing provides 125 ps sampling (500 ps sampling on TLA7N4 modules) on all waveforms to analyze
o add MagniVu timing waveforms:
eform window.
TLA Quick Start User Manual 25
Page 35

Analyzing Data
3. Click the Zoom Out button until you see
4. MoveCursor1toanareainthe
the entire MagniVu timing waveforms.
Note that the M
agniVu timing data is 16
K bits long as compared to the Deep
timing data. Deep timing lets you acquire
a large amoun
t of data; MagniVu timing
lets you focus on the details of the data.
Waveform window outside the range of
the MagniVu data.
26 TLA Quick Start User Manual
Page 36

5. Zoom on Cursor 1. The MagniVu button
indicates the MagniVu waveforms are
off screen.
Managing Data
6. Click the Magn
MagniVu data on-screen.
iVu button to center the
Quick Tip
Click the MagniVu button in the Listing or Waveform window to turn the MagniVu display on and off.
Managing Data
This section contains procedures for managing data, such as saving setups and loading saved setups.
Saving Setups
After defining your setup, you can save it for future use.
1. Select Save System As.
TLA Quick Start User Manual 27
Page 37

Managing Data
2. Select one of the following save options:
3. Enter a file name.
4. Click Save.
Quick Tips
Save all Acquired Data
Save only Unsuppressed Data
Don’t Save Acquired Data
Save often to avoid losing critical setups and data.
See the online help for details on saving setups.
Loading Setups
Use the following steps to load the setup that you saved under Getting Acquainted with Your Instrument. (See page 8.)
1. Select Load System.
28 TLA Quick Start User Manual
Page 38

2. Select the file name.
3. Click Open.
4. Click Yes when you are prompted to
confirm your actions.
iView Integrate
d Measurements
iView Inte
You can use the iView feature to connect an external Tektronix oscilloscope to the logic analyzer, acquire data from both
instruments, and display the results on the logic analyzer. This is useful for displaying the analog components of a signal in
the same data window as the digital components.
In the following examples the logic analyzer and the oscilloscope will acquire the same data. The logic analyzer captures
the digital components and the oscilloscope captures the analog components.
Use the following steps to set up the oscilloscope for these examples. Refer to the documentation that came with your
oscilloscope for operating instructions.
1. Connect the oscilloscope probe to the same signal source as the logic analyzer (for this example, connect to the
2. Power on the oscilloscope.
3. Press the Default Setup button on the oscilloscope, and then press the Autoset button. You should have a signal on
grated Measurements
Q output of the flip-flop).
the oscilloscope screen.
Connecting the Logic Analyzer and the Oscilloscope
After completing the oscilloscope and logic analyzer setups, use the iView wizard to connect the two instruments together.
TLA Quick Start User Manual 29
Page 39

iView Integrate
1. From the logic analyzer System
d Measurements
menu, select Add iView External
Oscilloscope
....
2. Follow the ins
of the iView wizard to do the following
steps:
Select the oscilloscope.
Connect the iView cable to the logic
analyzer.
Connect the
oscilloscope.
Verify the GPIB address of the
oscilloscope.
Identify where to display the
oscillosc
Specify t
Verify th
3. Click Fin
wizard.
tructions on each page
iView cable to the
ope data.
he triggering.
e connections and setups.
ish on the last page of the
Quick Tips
Start the iView wizard by clicking the iView icon in the Listing window or Waveform window. If you have a TLA7012
Portable Mainframe, start the iView wizard by pressing the front-panel iView button.
If the oscilloscope is properly connected to the logic analyzer when you start the iView wizard, the wizard will bypass
the connection instructions. Follow the on-screen instructions to finish the installation or to return to the start page of
the wizard.
The oscilloscope is added to the TLA
Explorer and to the System window.
30 TLA Quick Start User Manual
Page 40

Acquiring the iView Data
The next steps consist of acquiring the initial data, and then adjusting the data to properly view and analyze the data.
Acquire the Initial Data
1. Click M a gniView to turn on the MagniVu
waveforms.
2. Click iView to turn on the iView
waveforms.
If desired, delete any of the unused
oscilloscope waveforms.
3. Click Ru n to acquire and display
waveform data from both instruments.
Depending on the oscilloscope and your
Waveform window settings, you may
not see any waveform data from the
oscilloscope. If necessary, click the iView
button in the Waveform window to bring
the waveform on screen.
iView Integrate
d Measurements
Aligning the Oscilloscope Data with the Logic Analzyer Data
Complete the following steps to fine-tune the data alignment.
1. Zoom the display to measure the
time difference between the glitch in
the MagniVu waveform and in the
oscilloscope waveform:
2. Move Cursor 1 to the leading edge of the
glitch in the MagniVu waveform.
3. Click the oscilloscope waveform label
to allow you to read the voltage
measurements.
If the highlighted waveform is too bright,
click the area below the waveform labels
to turn the highlighting off (you may need
to resize the Waveform window to show
the label area with no labels).
4. Move Cursor 2 to the point on the
glitch where the waveform crosses the
threshold voltage as indicated by the
measurement readout.
5. Note the Delta Time value.
TLA Quick Start User Manual 31
Page 41

iView Integrate
6. Select Time Alignment . . . from the
d Measurements
Data menu.
7. Select the oscilloscope as the data
source.
8. Enter the offset value (Delta Time value)
into the Adjust time offset box.
9. Click OK.
32 TLA Quick Start User Manual
Page 42

iView Integrate
d Measurements
The oscillosco
with the logic analyzer data.
pe data is now time-aligned
Quick Tips
A positiv
analyzer data. A negative offset value will move the oscilloscope waveform to the left.
Click the iView button in the Waveform window or press iView button on the TLA7012 front panel to turn the iView
signals on and off.
e Adjust Time offset value will move the oscilloscope waveform in the display to the right with respect to the logic
TLA Quick Start User Manual 33
Page 43

Application Exa
mples
Application Examples
The examples in this section show how to use your instrument to do common logic analyzer tasks. These examples use the
basic setups with the flip-flop examples developed earlier in this document. (See page 8, Getting Acquainted with Your
Instrument.) Refer to the setups as needed to step through the application examples.
Triggering on a Glitch
Logic analyzers are useful for debugging elusive, intermittent problems, such as glitches. Use the following procedures to set
up the logic analyzer to trigger on a glitch.
Set up the G
1. Configure the Setup window and ensure
that Asynchronous is selected. (See
page 8, Confi
2. Open the
in the waveform label area, and select
Add Waveform . . ..
litch Trigger
gure the Setup Window.)
Waveform window, right-click
34 TLA Quick Start User Manual
Page 44

3. Select the groups (Clock, Input, and
Output for this example).
4. Click Add.
5. Click Close.
6. Click Run.
7. Click Trigger.
Application Exa
mples
TLA Quick Start User Manual 35
Page 45

Application Exa
8. Click and drag the Glitch icon from the
9. Select the groups that you want the logic
mples
Tabbed Trigger window to the Output
group wavefor
analyzer
m.
to trigger on. Clear any other
signals.
The signal where you dropped the G litch
icon is s
elected by default. You can
select the groups you want and avoid
triggering on signals that may contain
s that you do not care about.
glitche
10. Click R
11. Expand
un.
the Output group to see the
highlighted glitch on the Q waveform.
12. Click MagniVu.
The glitch data is highlighted in red
ry sample point for each signal
at eve
in the Deep timing waveforms. The
MagniVu timing waveforms show the
-resolution glitch data.
high
36 TLA Quick Start User Manual
Page 46

State Acquisition
You can use the logic analyzer for state data analysis; you can view the data in tabular form in the Listing window.
Define the Setup Window
State acquisition uses an external clock from the target system to tell the logic analyzer when to sample data.
1. Configure the signals in the Setup
window. (See page 8, Configure the Setup
Window.)
2. Select Synchronous.
3. Select the Single Clock source. For this
example, select CK0().
4. Select the rising edge of the clock.
5. Select Samples.
Application Exa
mples
Configure the Trigger
1. Define the setups for the Waveform
window. (See page 15, Define the
Waveform Window.)
You will use the Waveform window
setups to help define the trigger.
2. Click Trigger in the tabbed window.
3. Click and drag the Channel Edge icon
from the Tabbed Trigger window to the
Output waveform.
TLA Quick Start User Manual 37
Page 47

Application Exa
Acquire Data
1. Click Run.
mples
2. Zoom the data a
acquired data.
The LA1: Clock(0) waveform data
shows no changes because the data
is sampled on
Each tic mark of the S ample clock
waveform represents a clock edge.
The MagniVu high-resolution data
still displ
s necessary to view the
each rising clock edge.
ays timing data.
Configure the Listing Window
1. Click the
instrument in the TLA toolbar.
Listing window button for your
The listing window has no data in it. You
need to add the data columns to the
to see the data.
window
38 TLA Quick Start User Manual
Page 48

Application Exa
mples
2. Right-click in
the data area and select
Add Column.
3. Expand the
groups, press the Ctrl key
while selecting each column, and click
Add to add the columns to the Listing
window.
4. Click Clo
se.
5. Click and drag the Timestamp column to
the right of the last column. Timestamps
may be easier to read in this position.
Note the data in the Listing window.
The clock data appears as zeros
because the data is sampled on the
rising edge of the clock.
The Input and Output data appear as
ones and zeros.
The Timestamp column lists the time
between data samples.
The trigger point is halfway through the
data because the Trigger position was
set to 50%.
TLA Quick Start User Manual 39
Page 49

Application Exa
mples
Triggering on a Setup & Hold Violation
Use the Setup & Hold triggering to capture setup and hold violations. This example uses the same setups for the Setup
window as the previous example. (See page 37, State Acquisition.)
Define the Setup Window
1. Configure the signals in the Setup
window. (See page 8, Configure the
Setup Window.)
2. Select Synchronous.
3. Select the Single Clock source. For this
example, select CK0().
4. Select the rising edge of the clock.
5. Select Samples.
Configure the Trigger
1. Click Run.
2. Click Trigger.
3. Click and drag the Setup and Hold icon
from the Tabbed Trigger window to the
Input waveform.
40 TLA Quick Start User Manual
Page 50

4. Select the desired value for the Input
group/signal setup time.
5. Select the desired hold time.
Acquire and Measure the MagniVu High-Resolution Timing Data
1. Click Run.
Application Exa
mples
2. View the da
The instrument triggers on the rising
edge of the clock signal at the violation.
The setup a
highlighted in red for each setup and hold
violation on the Deep timing waveform.
Use the Ma
measure the actual details.
3. Zoom the data as necessary to see the
MagniVu waveforms.
4. Select System Trigger in the
Measure
5. Move Cu
transition.
6. Read the setup time from the D elta-Time
readout.
ta in the Waveform window.
nd hold violation area is
gniVutimingtoviewand
ment toolbar.
rsor 2 to the data input
TLA Quick Start User Manual 41
Page 51

Specifications
Specification
This section provides the warranted and mechanical specifications for the TLA5000B Series Logic Analyzers, TLA7000
Series Logic Analyzers, TLA7Bxx, TLA7ACx, and TLA7N4 Series Logic Analyzer. All specifications (marked with the.
symbol) are guaranteed and can be checked directly or indirectly at your nearest Tektronix location or by following the
procedures described in i ndividual service manuals or performance verification documents. Typical specifications are
provided for your convenience but are not guaranteed.
The performance limits in these specifications are valid under the following conditions:
The instrument must be in an environment with temperature, altitude, humidity, and vibration within the operating limits
described in these specifications.
Logic analyzer modules must be installed in a logic analyzer m ainframe.
The instrument must have had a warm-up period of at least 30 minutes.
The instrument must have been calibrated and adjusted at an ambient temperature between +20 °C and +30 °C.
Atmospheric characteristics
Characteristic Description
Temperature:
Operating and nonoperating
Relative Humidity:
Operating and nonoperating
Altitude:
Operating and nonoperating
1
TLA7Bxx and TLA7ACx series module operating temperature is +40 °C maximum.
2
TLA7012 operating temperature is 45 °C maximum due to the CD-RW DVD drive.
3
7Bxx series module relative humidity derates to approximately 57% at +40 °C.
TLA
4
TLA7Bxx and TLA7ACx series module operating humidity is 5% to 90% up to +30 °C, 75% from +30 to +40 °C, noncondensing. Maximum
wet-bulb temperature is +29.4 °C.
5
TLA7Bxx and TLA7ACx series module nonoperating humidity is 5% to 9 0% limited by a wet bulb temperature of +40 °C.
s
Operating (no media in floppy disk drive or DVD drive):
+5 °C to +50 °C, 15 °C/hr maximum gradient, noncondensing (derated 1 °C
per 305 m (1000 ft) above 1524 m (5000 ft) altitude)
12
Nonoperating (no media in floppy disk drive o r DVD drive):
–20 °C to +60 °C, 15 °C/hr maximum gradient, noncondensing
Operating (no media in floppy disk drive or DVD drive):
20% to 80% relative humidity, noncondensing. Maximum wet bulb temperature:
+29 °C (derates relative humidity to approximately 22% at +50 °C)
34
Nonoperating (no media in floppy disk drive o r DVD drive):
8% to 80% relative humidity, noncondensing. Maximum wet bulb temperature:
+29 °C (derates relative humidity to approximately 22% at +50 °C)
5
Operating:
To 3000 m (9843 ft), (derated 1 °C per 305 m (1000 ft) above 1524 m (5000 ft)
altitude
Nonoperating:
12190 m (40,000 ft)
42 TLA Quick Start User Manual
Page 52

Product Features
Specifications
Characteristi
CLK10 Frequency (mainframes)
TLA7012 mainframe slots
TLA7016 mainframe slots
MagniVu memory depth (samples per
channel)
c
Description
10 MHz ±100 PPM
4
13
2048 for TLA7N4 modules
16,000 for TLA7ACx modules and TLA5000B instruments
128,000 for TLA7Bxx modules
MagniVu sampling period
125 ps for TLA7ACx modules and TLA5000B instruments
500 ps for TLA7N4 modules
20 ps for TLA7Bxx modules
Data is asynchronously sampled and stored in a separate high-resolution memory.
The storage speed may be changed (by software) to 250 ps, 500 ps, or 1000 ps,
so that the MagniVu memory covers more time at a lower resolution.
Number of channels
TLA5201B 32 data and 2 clock
TLA5202B, TLA7AC2, TLA7BB2
TLA5203B
TLA5204B, TLA7N4
64 data and 4 clock
96 data, 4 clock, and 2 qualifier
128 data, 4 clock, and 4 qualifier
TLA7AC3, TLA7BB3 96 data and 6 clock/qualifier
TLA7AC4, TLA7BB4, TLA7BC4 128 data and 8 clock/qualifier
Acquisition memory depth
TLA5000B
TLA7ACx, TLA7Bxx
TLA7N4
2 M or optionally 8 M or 32 M samples (PowerFlex options)
64 M per channel, maximum
64 K or 256 K or 1 M or 4 M samples (PowerFlex options)
TLA Quick Start User Manual 43
Page 53

Specifications
Warranted Specifications
Characteristi
c
Description
Input parameters with probes
Threshold Accuracy
TLA5000B, TLA7N4 ±100 mV
TLA7ACx, TLA7Bxx ±(35 mV + 1% of the threshold voltage setting)
Channel-to-channel skew
TLA7N4
≤ 1.6 ns maximum (When merged, add 0.5 ns for the slave module.)
TLA5000B ≤ ±150 ps maximum
≤ 75 ps (Typical)
TLA7ACx
≤400 ps maximum
When merged, add the following for slave modules: 0.0 ns when data is acquired
on the slav
e modules through local clocks 125 ps when data is acquired on
the slave modules by the master modules’ clock and merge deskew has been
performed. 375 ps when data is acquired on the slave modules by the master
clock and merge deskew has NOT been performed.
ximum, module only (for P6800 and P6900 series probes, add ±60 ps)
TLA7Bxx
module’s
±40 ps ma
±20 ps (Typical), module only
Asynchr
onous sampling
Sampling period
1
test sampling rate for each logic analyzer goes to 50 ms in a 1–2–5
The fas
sequence
TLA7N4
4 ns, 250 MS, all channels
2 ns, 500 MS half channels
TLA7ACx, TLA5000B 2 ns, 500 MS, all channels
1000 MS, half channels
1ns,
500 ps 2000 MS, quarter channels
Bxx
TLA7
1.25 ns, 800 MS, all channels
625 ps, 1600 MS, all channels
ps, 3200 MS, half channels
313
157 ps, 6400 MS, quarter channels
Minimum recognizable word
(across all channels)
ynchronous sampling
S
2
Channel-to-channel skew + sample uncertainty
Example for a P6860 Probe and a 1.25 ns sample period: 160 ps + 1.25 ns =
45 ns
1.
Setup and hold window size (data and qualifiers)
TLA7N4
Maximum window size = Maximum channel-to-channel skew + (2 x sample
uncertainty) + 4 ns. Maximum setup time = User interface setup time + 0.8 ns.
Maximumholdtime=Userinterfaceholdtime+2ns
Maximum setup time for slave module of a merged pair = User interface setup
time + 0.8 ns
Maximum hold time for slave module of a merged pair = User interface hold time
+0.7ns
44 TLA Quick Start User Manual
Page 54

Warranted Specifications (cont.)
Characteristic Description
TLA5000B
TLA7ACx (single module) Maximum window size = Maximum channel-to-channel skew + (2 x sample
TLA7Bxx
Maximum s
ynchronous clock rate
TLA7N4
TLA5000
B
TLA7ACx 120 MHz in quarter-speed mode (8.3 ns minimum between active clock edges)
TLA7Bxx 750 MHz, one sample point per clock, all channels
Trigger System
Trigger State sequence rate
1
It is possible to use storage control and only store data when it has changed (transitional storage).
2
Applies to asynchronous sampling only. Setup and hold window specification applies to synchronous sampling only.
3
Software controls the selection between full-speed, half-speed, and quarter-speed modes.
4
This is a special mode and has some limitations such as the clocking state machine and trigger state machine only running at 500 MHz.
Maximum window size = Maximum channel-to-channel skew + (2 x sample
uncertainty) + system variation + 100 ps
uncertainty) + 100 ps Maximum setup time = User interface setup time + 75 ps
Maximum hold time = User interface hold time + 50 ps
220 ps maximum (180 ps Typical) single channel on single module
240 ps maximum (200 ps Typical) single channel on merged module
200 MHz i
n full-speed mode (5 ns minimum between active clock edges)
100 MHz in half-speed mode (10 ns minimum between active clock edges)
235 MHz in full speed mode (4.25 ns minimum between active clock edges)
235 MHz in half-speed mode (4.25 ns minimum between active clock edges)
450 MHz
800 MHz on half channels
in full-speed mode (2.2 ns minimum between active clock edges)
4
Software controls the selection between full-speed and half-speed modes.
750 MHz, four samples points per clock, half channels
MHz, one sample point per clock, all channels
1400
1400 MHz, two sample points per clock, half channels
Same rate as valid data samples received; 500 MHz maximum (TLA7Bxx,
800 MHz maximum)
Specifications
3
3
3
3
TLA Quick Start User Manual 45
Page 55

Specifications
Mechanical characteristics
Characteristi
c
Description
TLA5000B dimensions
Height
Width
Length
284.44 mm (11.200 in)
288.29 mm (11.350 in)
444.5 mm (17.500 in)
TLA7012 dimensions
Height (with feet) 29.46 cm (11.6 in)
Width
Depth
Height (
imensions
with feet)
TLA7016 d
Width
Depth
xx, TLA7ACx, and TLA7N4 dimensions
TLA7B
Height
Width
45.08 cm (17.75 in)
45.97 cm (18.1 in)
34.67 cm
42.42 c
67.31 c
262 mm
61 mm
(13.7 in)
m (16.7 in)
m (26.5 in)
(10.32 in)
(2.39 in) with merge connector in the recessed position
Width increases by 10.41 mm (0.41 in) with merge connector in the extended
position.
Length
373 mm (14.7 in)
Weight (TLA5000B and mainframes include empty accessory pouch, slot covers, and front cover)
TLA715
TLA721 and TLA7X M
TLA7012
TLA7016
TLA5201B
TLA5202B
TLA5203B
TLA5204B
13.9 kg (30 lbs 12 oz)
26.7 kg (58 lbs 11 oz), with benchtop controller
18.45 kg (40 lbs 12 oz)
24 kg (52 lbs 14 oz)
11.8kg(25lb15oz)
11.85kg(26lb2oz)
11. 9 kg (26 lb 4 oz)
12kg(26lb7oz)
TLA7AC2, TLA7BB2 2.282 kg (5 lb 0.5 oz)
TLA7AC3, TLA7BB3 2.381 kg (5 lb 4 oz)
TLA7AC4, TLA7BB4, TLA7BC4 2.438 kg (5 lb 6 oz)
TLA7N4
2.55 kg (5 lbs 10 oz)
46 TLA Quick Start User Manual
Page 56

Index
Index
A
Acquiring dat
iView, 31
Acquisition
state, 9
timing, 9
Activity indicators, 13
Adding an ex
Antivirus software, 1
a, 19
ternal oscilloscope, 29
B
Basic steps, 6
C
Clocking
Connecting, 2
Connection
Cursors
Custom sampling, 11
,9
See also Sampling
probes,
local, 2
Remote D
Remote Host, 2
measur
1
esktop, 3
ing data, 22
D
Data Measurement window, 24
indows, 7
Data w
Default system, 8
Delta-Time toolbar, 23
ew, 11
Desk
Documentation, iii
Drag and drop measurements, 24
E
y Trigger tab, 14
Eas
EasyTrigger, 14
External oscilloscope, 29
F
rewall, 1
Fi
G
Glitch data, 36
Glitch triggering, 34
Group card, 1
Groups
creating, 11
naming, 11
1
I
Instrument connection, 2
Instrument setups, 1
iView, 29
aligning data, 31
iView wizard, 29
L
window, 7
Listing
adding columns, 39
moving columns, 39
Loading
Local connection, 2
setups, 28
M
MagniVu button, 25
Vu timing, 25
Magni
viewing setup and hold
violations, 41
ring data, 22
Measu
Memory depth
setting, 10
N
ork, 1
Netw
New Data Window wizard, 7
O
offline, 3
fline operation, 3
Of
Opening
Setup window, 8
igger window, 13
Tr
Waveform window, 15
P
Power Trigger
PowerTrigger, 14
Probe
connections
threshold voltages, 9
Probe activity, 13
window, 20
,1
R
Related do
Remote Desktop, 3
Remote Host, 2
Repetitiv
Run button, 19
Run/Stop button, 19
cumentation, iii
e Run button, 19
S
g
Samplin
asynchronous, 9
Custom, 11
nous, 9
synchro
Saving setups, 27
Setup window
,11
deskew
group cards, 11
opening, 8
ng, 8
sampli
setting memory depth, 10
Signal Mapping area, 11
s
Setup
loading, 28
saving, 27
l Mapping area, 9, 11
Signa
Snap to Edge, 22
Specifications
spheric, 42
atmo
mechanical, 46
State acquisition, 9, 37
tus dialog box, 19
Sta
Storage options, 10
System Window, 5
T
bbed Trigger window, 14, 20, 36
Ta
Target system
connections, 1
TLA Quick Start User Manual 47
Page 57

Index
Threshold indicators, 13
Time offset, 33
Timing acquisition, 9
TLA Connection dialog box, 2
TLA Explorer,
Toolbar Buttons, 4
Trigger
defining, 13
Triggering
glitch, 34
setup and hol
4
d, 40
U
Using the logic analyzer, 6
W
Waveform window, 7
opening, 15
Waveforms
adding, 17
deleting, 15
Windows
Listing, 7, 38
Waveform, 7
opening, 15
Z
Zooming data
,21
48 TLA Quick Start User Manual
 Loading...