

Tektronix Tek UWB Spectral Analysis Help User manual

Tek UWB
Spectral Analysis
PrintedHelpDocument
www.tektronix.com
077-0033-02

Copyright © Tektronix. All rights reserved. Licensed software products are owned by Tektronix or its
subsidiaries or suppliers, and are protected by national copyright laws and international treaty provisions.
Tektronix products are covered by U.S. and foreign patents, issued and pending. Information in this
publication supersedes that in all previously published material. Specifications and price change privileges
reserved.
TEKTRONIX and TEK are registered trademarks of Tektronix, Inc.
Tek UWB Spectral Analysis Online Help Version 2.2.0, part number 076-0085-02.
Contacting T
Tektronix, Inc.
14200 SW Karl Braun Drive
P. O . B o x 50 0
Beaverton, OR 97077
USA
For product information, s ales, service, and technical support:
In North America, call 1-800-833-9200.
Worldwide, visit www.tektronix.com to find contacts in your area.
ektronix

Table of Contents
Preface
Conventions .. ................................ ................................ .................................. ..... 1
Updates through the Web Site............................ ................................ ......................... 1
Getting Started
Introduction and Product Description ....................... .................................. ................... 3
Compatibility.......... . . . . . . . . ............. . . . . . . ........... . . . . . . . . ........... . . . . . . . . ............ . . . . . . ........... 3
Requirements and Restrictions .................................................................................... 4
Limitations .......................................................................................................... 4
Starting the Software
Starting the Software .......................................................................................... 5
Returning to the TekScope Application ..................................................................... 6
Returning to the Software................................ ................................ ..................... 6
Exiting the Software...... . . . . . . . . ............ . . . . . . . . ............ . . . . . . . . ............ . . . . . . . ............. . . . . . 7
Table of Contents
Operating Basics
Software View
Application Data Files ........... .................................. ................................ ........... 9
Configuring the Tek UWB
Selecting the Analysis Type .................................................................................. 9
Selecting a Waveform for Analysis................. ................................ ........................ 11
Analyzing Waveform Files in Batch Mode ............................ ................................ .... 14
Selecting the Pulse/Packet ................................................................................... 15
Setting the Resolution Bandwidth . . . . . . . . .............. . . . . . . . . .............. . . . . . . . . .............. . . . . . . . . 17
Setting the Center Frequency ............ . . . . . . ........... . . . . . . . . ........... . . . . . . . . ............ . . . . . . ...... 18
Setting the Span........... . . . . . . . . ............ . . . . . . . . ............ . . . . . . . . ........... . . . . . . . . . ........... . . . . . 19
Saving the Downconverted Data .......................... ................................ .................. 20
Setting the Band Group ........... . . . . . . . . . .............. . . . . . . . . ............. . . . . . . . . . .............. . . . . . . . . 21
Setting the Time Frequency Codes ......... . . . . . . . . .............. . . . . . . . . .............. . . . . . . . . . ........... 22
Setting the Data Rate ....... . . . . . . ............ . . . . . . ........... . . . . . . . . ........... . . . . . . . ........... . . . . . . . . .. 23
Setting the Preamble Type . . . . . . ........... . . . . . . . . ............ . . . . . . ........... . . . . . . . . ........... . . . . . . . . .. 24
Setting the Payload Length . . . . . . ............ . . . . . . . ............. . . . . . . ........... . . . . . . . . . ............ . . . . . . 25
Analyzing th
Analyzing the Waveform ........ .................................. ................................ .......... 25
Viewing Plots
Voltage Versus Time.......................................... ................................ ................ 27
Spectrogram ............................... ................................ .................................. .. 28
Power Spectral Density ............................ .................................. ........................ 30
e Waveform
Tek UWB Spectral Analysis Printed Help Document i

Table of Contents
Constellation .................................................................................................. 31
EVM Versus Symbol ..................................... ................................ .................... 33
EVM Versus Subc
Using Plot Cursors............................ .................................. .............................. 35
Using Plot Zoom.............................................................................................. 36
Viewing Modulation Results History
Listing Window Data..................... ................................ ................................ .... 37
Saving the Results in .csv Format........................................................................... 37
Generating an
Clearing All the Results.................................... .................................. ................ 39
Tutorial
Capturing Live WiMedia RF..................................................................................... 41
Index
arrier .. .................................. ................................ .................. 34
d Saving Reports ............................................................................. 38
ii Tek UWB Spectral Analysis Printed Help Document

Preface Conventions
Preface
Conventions
The online help uses the following conventions:
When steps require a sequence of selections using the software interface, the ">" delimiter marks each
transition between a menu and an option. For example, File > Save.
DUT refers to the Device Under Test.
Three dots (...) following a menu item indicate that the menu item will open a submenu.
Updates through the Web Site
Periodic software upgrades may be available.
To check for u
1. Go to the Tektronix Web site (w
2. Enter the product name Tek U WB in the Search by keyword box to find the available software upgrades.
pgrades:
ww.tektronix.com/software) to link to the Software Downloads page.
Tek UWB Spectral Analysis Printed Help Document 1

Preface Updates through the Web Site
2 Tek UWB Spectral Analysis Printed Help Document

Getting Started Introduction and Product Description
GettingStarted
Introduction and Product Description
Excellent amplitude, phase flatness, and low phase noise make the DPO/DSA70000 series oscilloscopes
the ideal tool for engineers designing Ultra Wideband radios used in Certified Wireless USB, Wideband
Bluetooth, Wi
Tek UWB runs on the TDS series oscilloscopes with single shot bandwidth ≥7 GHz and DPO/DSA
series oscil
Tek UWB analyzes the complexity of wideband signals that change in frequency and amplitude with
time. It meas
presence of other traffic with time gating and packet/pulse finder within upto 200 Mpt record lengths.
Net, and DNLA consumer and computer systems.
loscopes with single shot bandwidth ≥2.5 GHz.
ures the distribution of signal power with frequency and analyzes specific signals in the
Quickly gen
Correlates the Frequency domain to Time domain with cursors linking the amplitude versus time,
frequency v
The Downconvert option allows for rapid generation of baseband data for further analysis in other
tools s uch
The WiMedia PHY Test option automatically detects all 10 Time Frequency Codes and eight data rates
directly f
Covers the digital down-conversion, demodulation, and analysis of all six WiMedia band groups.
Generates plots of EVM-vs-Symbol, EVM-vs-Subcarrier, and Constellation data.
Performs measurements outlined in the WiMedia PHY Test Spec 1.2 including EVM, cross correlation,
frequency tolerance, adjacent channel power ratio, spectral mask testing, and relative power ratios.
Report generator quickly documents the configuration information, measurement results, and plot
images.
Compatibility
erates Power Spectral Density and Spectrogram plots from acquired data.
ersus time, and power versus frequency.
as Tektronix RSA Vu and MATLAB.
rom the WiMedia RF waveforms for easy setup and analysis.
For information on instrument compatibility, refer to the Optional Applications Software on
Windows-Based Oscilloscopes Installation Manual (Tektronix part number 077-0067-XX) available
asaPDFontheDVD.
Tek UWB Spectral Analysis Printed Help Document 3

Getting Started Requirements and Restrictions
Requirements and Restrictions
The following are recommended for running Tek UWB:
TDS series oscilloscopes with single shot bandwidth ≥7 GHz and DPO/DSA oscilloscopes with single
shot bandwidth ≥2.5 GHz.
Oscilloscopes with single shot bandwidth of 7 GHz or greater for WiMedia signals in band group 1.
Analysis of higher band groups requires oscilloscopes with correspondingly higher bandwidths.
Coverage for all six WiMedia band groups will require a single shot bandwidth of at least 14 GHz.
Analysis of radar signals through X band and Ku band calls for real-time bandwidth beyond 16 GHz.
The DSA72004 oscilloscope with single shot bandwidth of 20 GHz and deep 200 Mpts record length
provides th
egreatestflexibility for analyzing such high speed signals.
Limitations
Proper analysis of WiMedia signals generally requires an acquisition sample rate of 20 GS/s or higher and
record len
sample rate is at least 250 MS/s with a record length of 100 Kpts or more.
When usin
for the application to run out of available memory with the operating system. This condition depends
on the number of other applications running, the length of the waveform being analyzed, and the type
of analysis that is being performed. If an out of memory error message is encountered, we recommend
using the time gating feature of the oscilloscope to reduce the amount of data being analyzed. To do
this, place the instrument cursors around the part of the captured waveform you want to analyze before
beginn
gths of 1 Mpts or more. This application will not even attempt WiMedia analysis unless the
g Tek UWB with very long captured waveforms (generally over 100 Mpts), it is possible
ing an analysis with Tek UWB.
4 Tek UWB Spectral Analysis Printed Help Document
Getting Started Starting the Software
StartingtheSoftware
Starting the Software
Depending on the type of oscilloscope that you have, you can start the software in one of the following
ways:
Select App > Ultra Wideband Spectral Analysis
Select Analyze > Ultra Wideband Spectral Analysis
The following screen indicates that the software is loading.
NOTE. Witho
ut a product license installed, Tek UWB allows five free trial sessions, after which the
application will operate in a restricted mode until a valid license is provided.
Tek UWB Spectral Analysis Printed Help Document 5
Getting Started Returning to the TekScope Application
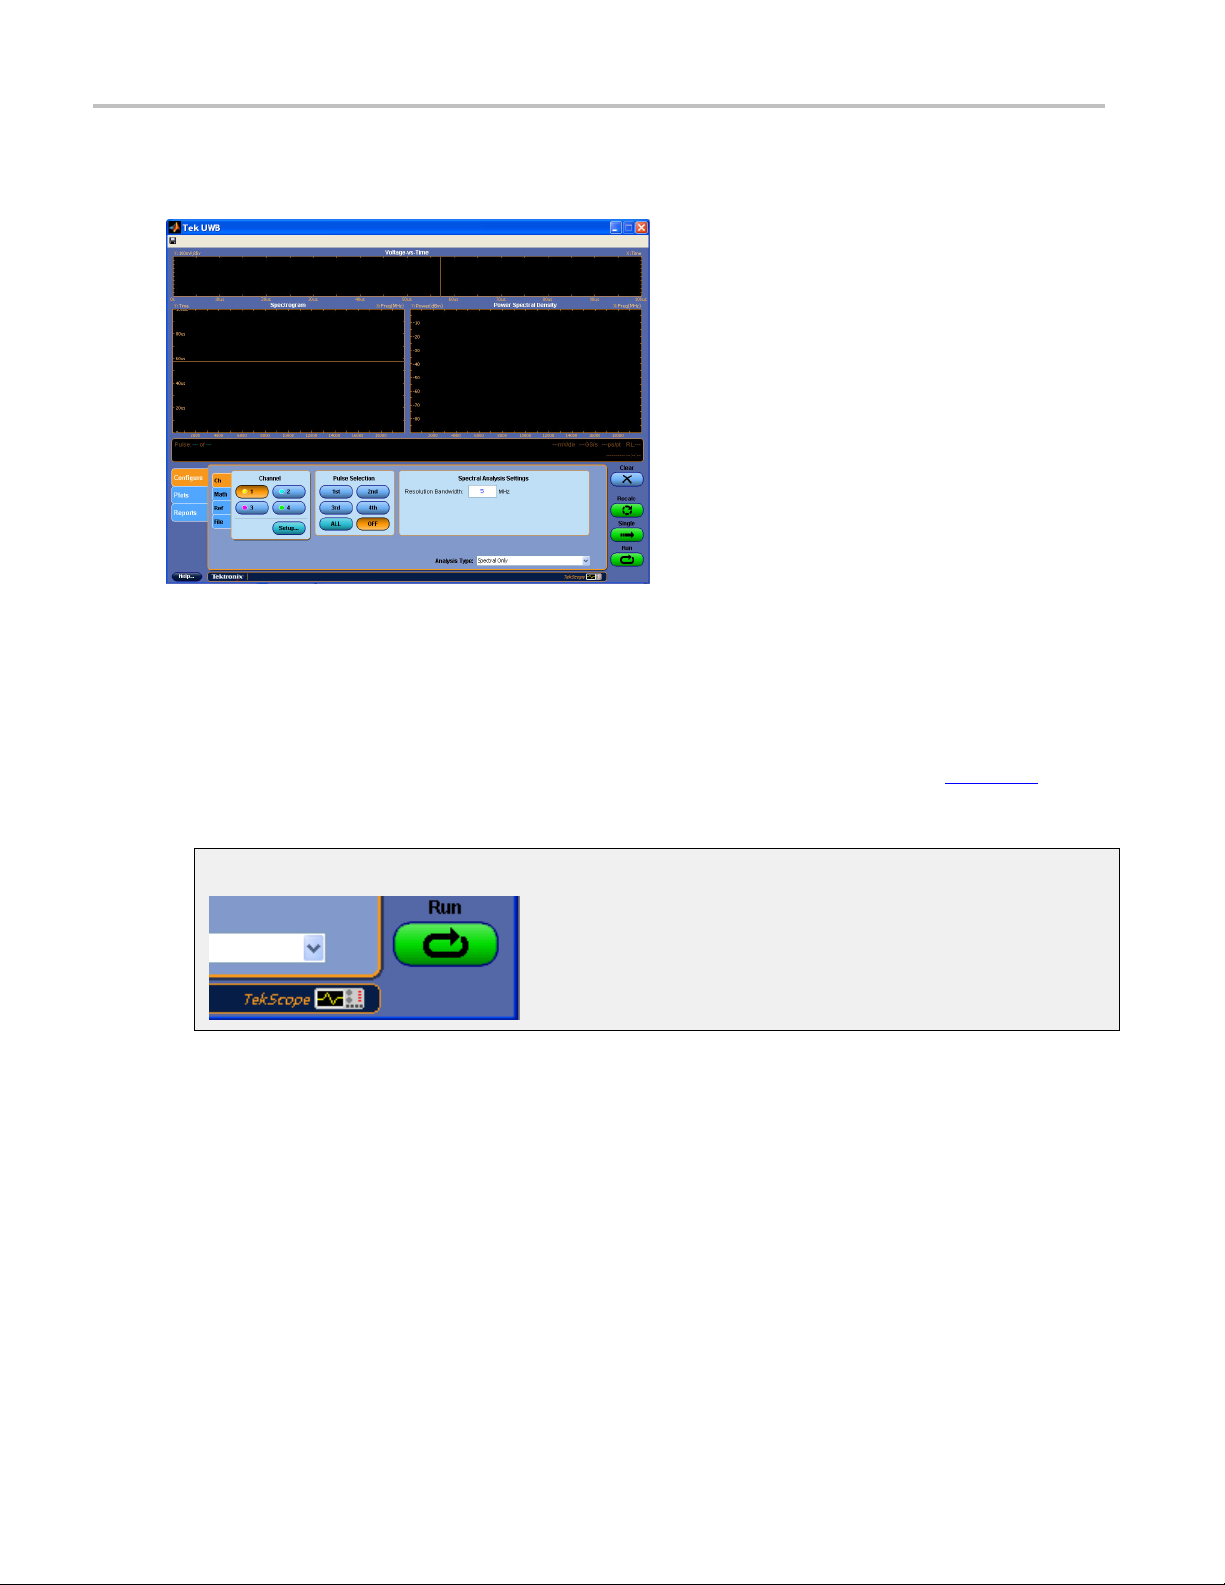
The oscilloscope displays the Tek UWB Ultra Wideband Spectral Analysis software with the analysis
type set to Spectral Only.
Returning to the TekScope Application
To return to the oscilloscope application from the Ultra Wideband application, click the TekScope icon
(near the lower right corner).
TekScope
icon
Returning to the Software
To return to the Ultra Wideband application, select Restore Application in the Analyze or Application
menu.
6 Tek UWB Spectral Analysis Printed Help Document

Getting Started Exiting the Software
Exiting the Software
To exit the software, click on the top-right of the software window.
Tek UWB Spectral Analysis Printed Help Document 7

Getting Started Exiting the Software
8 Tek UWB Spectral Analysis Printed Help Document

Operating Basics Application Data Files
OperatingBasics
SoftwareView
Application Data Files
The software uses the following data files:
File name extension Directory Description
.wfm
xxx
Configuringthe TekUWB
C:\Program Files\TekApplications\TekUWB\Waveforms\
To store the sample waveforms.
Selecting the Analysis Type
To set the analysis type for debugging radios, click the Config tab.
Configtab
Then select one of the available options in the Analysis Type: pane.
Analysis Type
Spectral Only (default): acquires and displays the Voltage versus Time. It calculates and displays
the power spectral density (PSD). In addition, it displays the PSD data as a spectrogram, showing the
harmonic content of the signal as a function of time. The resolution bandwidth used in these calculations
is user-definable.
Spectral + Downconversion: performs the same basic analysis as the Spectral Only option. In
addition, it performs a digital down-conversion step which allows you to create baseband data for further
analysis in other tools such as Tektronix RSA Vu and MATLAB.
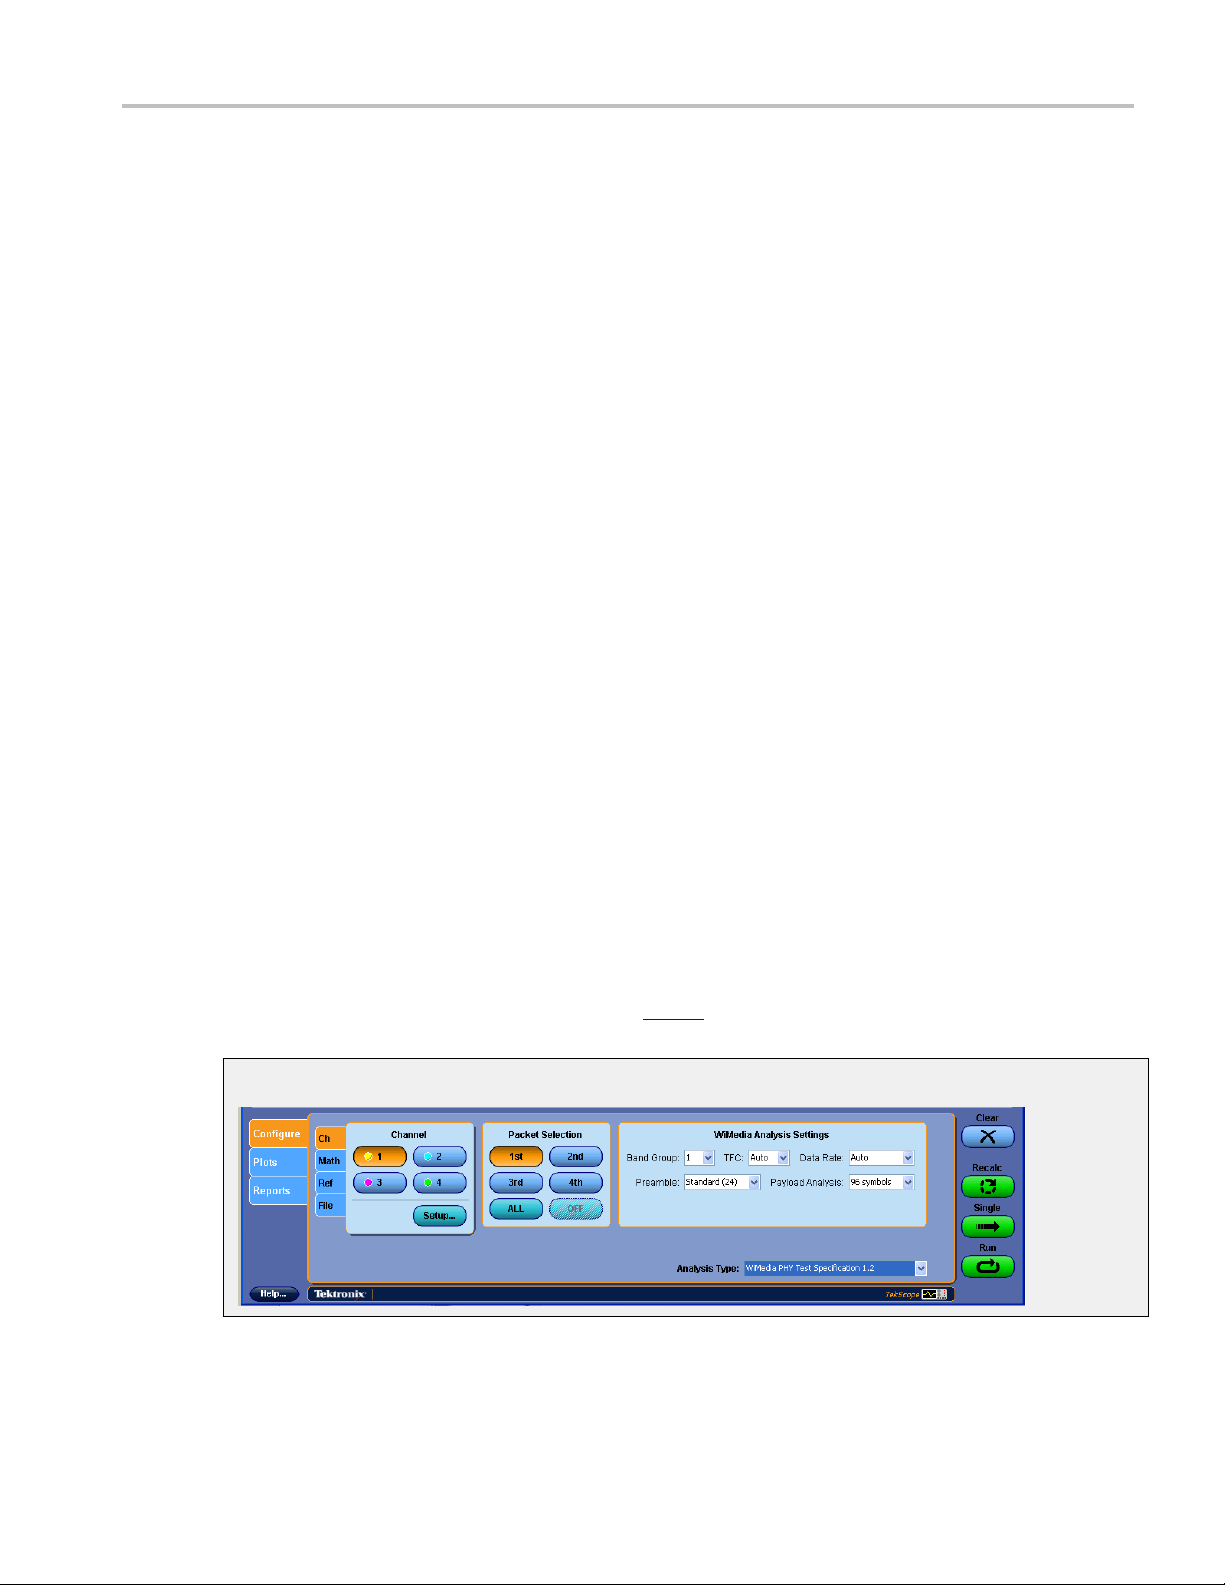
WiMedia PHY Test Specification 1.2:performsthesamebasicanalysisastheSpectralOnly
option. In addition, it performs a full modulation analysis according to the WiMedia PHY test specification
and displays three additional plots Constellation, EVM versus Symbol, and EVM versus Subcarrier.
Tek UWB Spectral Analysis Printed Help Document 9

Operating Basics Selecting the Analysis Type
WiMedia Analysis
Consider the following information when performing WiMedia analysis:
You should select the appropriate band group for the signal being studied by selecting a Band Group
button on the Configtab.
This application can auto-detect the TFC of the signal. However, if problems are encountered during
demodulation, you can override auto-detection by selecting the appropriate TFC in the TFC section
of the user i nterface.
This application can auto-detect the data rate. However, if problems are encountered during
demodulation, you can override auto-detection by selecting the appropriate data rate in the Data Rate
section of the user interface.
This application can auto-detect the preamble type. However, if problems are encountered during
demodulation, you can override auto-detection by selecting standard or burst.
Payload Analysis can be set to 96 symbols as mentioned in the WiMedia test specification or All
symbols.
The application displays and reports the following information:
A Power Spectral Density analysis separated by band with ACPR, mask test, and power measurements.
A Constellation plot and EVM analysis.
A plot of EVM by symbol.
AplotofE
An Information box (containing date, instrument setting, and similar data) includes additional
informat
A Results History.
A report of the Modulation Analysis including the plots.
Packet D
This application features a packet detector, which scans the waveform and tries to identify t he presence
of a fini
analyze using the Packet Selection buttons on the display:
te-duration signal. When multiple packets have been identified, you can select which packet to
1st, an
2nd, analyze second packet only
3rd, analyze third packet only
4th, analyze forth packet only
VM by subcarrier.
ion on modulation.
etection and Selection
alyze first packet only
All, analyze all packets in succession (100 maximum)
Off, analyze the entire waveform ignoring packets
10 Tek UWB Spectral Analysis Printed Help Document
Operating Basics Selecting a Waveform for Analysis
WiMedia Terminology
Band numbering
UWB spectrum.
Band groups. There are six band groups within the UWB spectrum. Band groups 1 to 5, each consisting
of three 528 MHz bands (except band group 5 which has only two bands) lie in sequence across the UWB
spectrum. Band group 6 also consists of three 528 MHz bands, but it straddles the frequency space of
band groups
Time Frequency Codes (TFC). There are 10 hopping patterns (TFCs) defined in the WiMedia standard.
Four patterns spread the coded information across three bands (Time-Frequency Interleaving or TFI).
Three patterns spread the coded information across two bands (TFI2). The remaining three patterns
transmit the coded information on a single band (Fixed Frequency Interleaving or FFI).
Common Phase Error (CPE). In the EVM calculation, CPE of the transmitter is corrected on a
symbol-by-symbol basis.
CPE filtering. CPE filtering analysis allows the EVM calculation to see the transmitter phase noise
impairments.
Error Voltage Measurement (EVM) calculation. EVM is calculated over the payload of the packet only. The
calculation includes initial channel estimation using the CE symbols, phase and timing estimation, and
correction using the pilot tones as well as estimating the frequency offset. The phase error is estimated
using pilot tones and the timing error, and common phase error is calculated. Timing error is corrected.
The CPE is applied to the CPE filter. For each data and pilot subcarrier, the Euclidean distance to the
st constellation point is calculated. The RMS error is calculated using the WiMedia equation.
close
. There are 14 bands (each 528 MHz wide) spanning the 3100 MHz to 10600 MHz
3 and 4.
Selecting a Waveform for Analysis
To select the source of the measurement, click the Config tab.
Configtab
Tek UWB Spectral Analysis Printed Help Document 11
 Loading...