

Page 1

TekExpress® M-PHY
Transmitter Automated Solution
Application Help
*P077068304*
077-0683-04
Page 2

Page 3

TekExpress® M-PHY
Transmitter Automated Solution
Application Help
Register now!
Click the following link to protect your product.
www.tek.com/register
*P077068304*
077-0683-04
Page 4

Copyright © Tektronix. All rights reserved. Licensed software products are owned by Tektronix or its subsidiaries or suppliers, and are
protected by national copyright laws and international treaty provisions. Tektronix products are covered by U.S. and foreign patents, issued
and pending. Information in this publication supersedes that in all previously published material. Specifications and price change privileges
reserved.
TEKTRONIX and TEK are registered trademarks of Tektronix, Inc.
Contacting Tektronix
Tektronix, Inc.
14150 SW Karl Braun Drive
P.O. Box 500
Beaverton, OR 97077
USA
For product information, sales, service, and technical support:
• In North America, call 1-800-833-9200.
• Worldwide, visit to www.tek.com find contacts in your area.
Page 5

Table of Contents
Table of Contents
Welcome....................................................................................................................................................................................... 7
Getting help and support...............................................................................................................................................................9
Product documents................................................................................................................................................................9
Conventions...........................................................................................................................................................................9
Technical support................................................................................................................................................................. 10
Getting started.............................................................................................................................................................................11
Hardware requirements........................................................................................................................................................11
Supported oscilloscopes and probes............................................................................................................................ 11
Minimum system requirements..................................................................................................................................... 11
Software requirements.........................................................................................................................................................12
Downloading and installing the software.......................................................................................................................12
Activate the license.......................................................................................................................................................12
View software version and license key details..............................................................................................................13
Setting up the test environment.................................................................................................................................................. 14
About setting up tests.......................................................................................................................................................... 14
Search instruments connected to the application................................................................................................................ 14
Deskew................................................................................................................................................................................ 15
Running tests.......................................................................................................................................................................16
Before you click start............................................................................................................................................................16
Pre-test checklist..................................................................................................................................................................17
Starting the application................................................................................................................................................................18
Operating basics..................................................................................................................................................................18
Run the application.......................................................................................................................................................18
Close the application.................................................................................................................................................... 19
Application controls..............................................................................................................................................................20
Options menu functions....................................................................................................................................................... 21
Configure email settings...................................................................................................................................................... 23
TekExpress instrument control settings............................................................................................................................... 24
Setup panel: Configure the test setup.........................................................................................................................................25
DUT: Set DUT settings.........................................................................................................................................................26
Embed / De-embed for Mid-bus probing.......................................................................................................................28
Test Selection: Select the tests............................................................................................................................................ 32
Acquisitions: Set waveform acquisition settings.................................................................................................................. 33
Signal validation overview.............................................................................................................................................34
Configuration: Set measurement limits for tests.................................................................................................................. 35
Limits Editor controls.....................................................................................................................................................37
Preferences: Set the test run preferences........................................................................................................................... 39
Status panel: View the test execution status...............................................................................................................................40
View test execution status....................................................................................................................................................40
View test execution logs.......................................................................................................................................................41
Results panel: View summary of test results...............................................................................................................................42
Filter the test results.............................................................................................................................................................42
Reports panel: Configure report generation settings.................................................................................................................. 43
Report configuration settings............................................................................................................................................... 43
TekExpress® M-PHY Transmitter Automated Solution Application Help 5
Page 6

Table of Contents
Configure report view settings............................................................................................................................................. 45
View a generated report.......................................................................................................................................................46
Saving and recalling test setup................................................................................................................................................... 47
Test setup files overview...................................................................................................................................................... 47
Save the configured test setup............................................................................................................................................ 47
Load a saved test setup.......................................................................................................................................................47
Select a pre-run session from the loaded test setup............................................................................................................47
Save the test setup with a different name............................................................................................................................48
SCPI Commands........................................................................................................................................................................ 49
About SCPI command......................................................................................................................................................... 49
Socket configuration for SCPI commands........................................................................................................................... 49
TEKEXP:*IDN?.................................................................................................................................................................... 55
TEKEXP:*OPC?...................................................................................................................................................................55
TEKEXP:ACQUIRE_MODE.................................................................................................................................................56
TEKEXP:ACQUIRE_MODE?...............................................................................................................................................56
TEKEXP:EXPORT...............................................................................................................................................................56
TEKEXP:INFO?................................................................................................................................................................... 56
TEKEXP:INSTRUMENT...................................................................................................................................................... 57
TEKEXP:INSTRUMENT?.................................................................................................................................................... 57
TEKEXP:LASTERROR?......................................................................................................................................................57
TEKEXP:LIST?.................................................................................................................................................................... 57
TEKEXP:MODE...................................................................................................................................................................58
TEKEXP:MODE?.................................................................................................................................................................58
TEKEXP:POPUP................................................................................................................................................................. 58
TEKEXP:POPUP?............................................................................................................................................................... 59
TEKEXP:REPORT...............................................................................................................................................................59
TEKEXP:REPORT?.............................................................................................................................................................59
TEKEXP:RESULT?.............................................................................................................................................................. 59
TEKEXP:SELECT................................................................................................................................................................60
TEKEXP:SELECT?..............................................................................................................................................................60
TEKEXP:SETUP..................................................................................................................................................................61
TEKEXP:STATE...................................................................................................................................................................61
TEKEXP:STATE?.................................................................................................................................................................61
TEKEXP:VALUE.................................................................................................................................................................. 61
TEKEXP:VALUE?................................................................................................................................................................ 62
Test Name............................................................................................................................................................................63
Command Parameters with Examples.................................................................................................................................65
References..................................................................................................................................................................................92
Application directories..........................................................................................................................................................92
File name extensions...........................................................................................................................................................92
View test-related files...........................................................................................................................................................93
Waveform naming conventions (pre-recorded mode)..........................................................................................................93
Index........................................................................................................................................................................................... 96
TekExpress® M-PHY Transmitter Automated Solution Application Help 6
Page 7

Welcome
Welcome
The Tektronix TekExpress M-PHY TX Automated Test software for MPHY40 and MPHY50 runs on Tektronix real-time oscilloscopes that
are based on Windows 10 computer operating systems. MPHY50 and MPHY40 Automated solution provides support for 100% of tests as
per Spec 5.0 & CTS 1.0 at revision 0.2 using TekExpress 5.0 framework, a state-of-the-art tool designed for automation. This solution is
designed for engineers doing verification and validation as per the CTS for HS – Gear1, Gear2, Gear3, Gear4, and Gear5 for MPHY50
and HS – Gear1, Gear2, Gear3, and Gear4 for MPHY40. It also supports ‘UFS4.0 Reference Clock’ measurements for both MPHY50 and
MPHY40 products.
Key features of M-PHY Transmitter testing include:
• 100% Test Coverage for all modes and data rates for HS – Gear1, Gear2, Gear3, Gear4, and Gear5 for MPHY50 and HS – Gear1,
Gear2, Gear3 and Gear4 for MPHY40.
• Application covers PWM and SYS modes. Supports ‘UFS4.0 Reference Clock’ measurements for both MPHY50 and MPHY40
products.
• M-PHY TX Automated User-defined mode allows modifying every parameter of different HS, UFS4.0 Ref Clock, PWM, and SYS tests,
for comprehensive debug analysis and characterization.
• Automated testing reduces the complexity of executing transmitter tests and enables you to test devices faster.
• Performance improvement in HS measurement execution compared to previous release.
• Selection of different Gears and Sub gears of HS, PWM, and SYS signals, large/small amplitudes, impedance terminated/unterminated.
• Full Contour Extrapolated eye diagram for BER analysis in steps at E-6 to E-12.
• HS Gear 1 Mask Dynamic Movement to provide optimum eye opening as per specification.
• Accumulation of 3 M UIs in a single acquisition reducing test times for analysis.
• Ability to embed/de-embed using filter files to enable mid bus probing.
• Support for tri mode probes for single ended and differential signaling probing using Industry lowest noise probe P76xx series.
• Manual mode testing for multi lanes.
TekExpress® M-PHY Transmitter Automated Solution Application Help 7
Page 8

Welcome
• Highly optimized setup performs Power Spectral Density (PSD) tests using oscilloscope-integrated algorithms uniquely and does not
require an external spectral analyzer or extra hardware to perform PSD measurements.
• Single printable report for all tests across different combinations provides pass/fail summary table, along with margin details, optional
waveform captures, and eye diagrams. Available in (.mht and pdf).
TekExpress® M-PHY Transmitter Automated Solution Application Help 8
Page 9

Getting help and support
Getting help and support
Product documents
Use the product documents for more information on the application functions, understand the theory of operation, how to remotely program
or operate the application, and do other tasks.
Table 1: TekExpress Application documents
To learn about Use this document
How to use the application
How to remotely control the instrument
Conventions
This application help uses the following conventions:
TekExpress M-PHY Tx Help
PDF version of this document can be downloaded from www.tek.com/downloads
Compiled HTML (CHM) version is integrated with the application. Press F1 key from the
keyboard to start the help.
Tektronix Part Number: 077-xxxx-xx
• The term "Application," and "Software" refers to the TekExpress M-PHY Tx application.
• The term “DUT” is an abbreviation for Device Under Test.
• The term “select” is a generic term that applies to the two methods of choosing a screen item (button control, list item): using a mouse
or using the touch screen.
• A Note identifies important information.
Table 2: Icons used in the help
Icon Description
This icon identifies important information
This icon identifies conditions or practices that could result in loss of data.
This icon identifies additional information that will help you use the application more
efficiently.
TekExpress® M-PHY Transmitter Automated Solution Application Help 9
Page 10

Getting help and support
Technical support
Tektronix values your feedback on our products. To help us serve you better, please send us your suggestions, ideas, or comments on
your application or oscilloscope. Contact Tektronix through mail, telephone, or the Web site. See Contacting Tektronix at the front of this
document for contact information.
When you contact Tektronix Technical Support, please include the following information (be as specific as possible):
General information
• All instrument model numbers
• Hardware options, if any
• Modules used
• Your name, company, mailing address, phone number, FAX number
• Please indicate if you would like to be contacted by Tektronix about your suggestion or comments.
Application specific information
• Software version number
• Description of the problem such that technical support can duplicate the problem
• If possible, save the setup files for all the instruments used and the application
• If possible, save the TekExpress setup files, log.xml, *.TekX (session files and folders), and status messages text file
TekExpress® M-PHY Transmitter Automated Solution Application Help 10
Page 11

Getting started
Getting started
Hardware requirements
Supported oscilloscopes and probes
The TekExpress M-PHY TX application runs HS, PWM, and SYS tests on the following Tektronix oscilloscope and probe configurations:
Table 3: TekExpress M-PHY TX [MPHY50 and MPHY40] – Supported Oscilloscopes
Model Description
DPO/MSO70000/DX/SX
DPO (Digital Phosphor Oscilloscope), or MSO (Mixed Signal Oscilloscope) Oscilloscopes with
Option DJA and Option DJAN (for BER Contours). Option SDLA64 is mandatory for Gear4 and
Gear5 Differential AC Eye measurements.
The following bandwidths are needed:
• 6 GHz and above is recommended for HS-Gear1
• 12.5 GHz and above is recommended for up to HS-Gear2
• 23 GHz and above is recommended for up to HS-Gear3
• 25 GHz and above is recommended for up to HS-Gear4
• 33 GHz and above is recommended for up to HS-Gear5
Table 4: Recommended probes for TekExpress M-PHY TX
Gear type Maximum Data rate Fixtured /RF connection
HS-Gear1
HS-Gear2 2.912 Gb/s P76xx
HS-Gear3 5.824 Gb/s P76xx
HS-Gear4 11.648 Gb/s P76xx
HS-Gear5 23.296 Gb/s P76xx
PWM Gears (G0 to G7)
SYS Gears
1
2
1.456 Gb/s P76xx
10 Kbps to 576 Mbps P7313
• 26 MHz
• 38.4 MHz
• 52 MHz
P7313
See also
Minimum system requirements
Minimum system requirements
The following table shows the minimum system requirements for an oscilloscope to run TekExpress.
1
RT (Resistively Terminated).
2
NT (Not Terminated).
TekExpress® M-PHY Transmitter Automated Solution Application Help 11
Page 12

Table 5: System requirements
Component Requirement
Oscilloscope Supported oscilloscopes and probes
Processor Same as the oscilloscope
Operating System
Memory Same as the oscilloscope
Hard Disk Same as the oscilloscope.
Display
Firmware TekScope v10.12 or later
Software
Same as the oscilloscope:
• Windows 10 64-bit
Same as the oscilloscope
• SDLA v3.0.13.12 or later
• DPOJET v10.4.0 or later
• Microsoft .NET 4.0 Framework
• Microsoft Internet Explorer 7.0 SP1 or later
• Adobe Reader 7.0 or equivalent software for viewing portable document format (PDF)
files
3
Getting started
Probes Supported oscilloscopes and probes
Software requirements
Downloading and installing the software
Complete the following steps to download and install the latest TekExpress M-PHY Tx application.
1. Go to www.tek.com.
2. Click Downloads. In the Downloads menu, select DOWNLOAD TYPE as Software and enter the application name in the MODEL OR
KEYWORD field and click SEARCH.
3. Select the latest version of software and follow the instructions to download the software. Copy the executable file into the
oscilloscope.
4. Double-click the executable and follow the on-screen instructions.
The software is installed at C:\Program Files\Tektronix\TekExpress\TekExpress MIPI_MPHY_TX.
5. Select Application > TekExpress M-PHY Tx from the Oscilloscope menu, to open the application.
Activate the license
Activate the license using the Option Installation wizard in the TekScope application:
3
If TekExpress is running on an instrument having a video resolution lower than 800x600 (for example, sampling oscilloscope), it is recommended that you connect a
secondary monitor. The secondary monitor must be configured and active before launching the application.
TekExpress® M-PHY Transmitter Automated Solution Application Help 12
Page 13

Getting started
1. In the TekScope application menu bar, click Utilities > Option Installation. The TekScope Option Installation wizard opens.
2. Push the F1 key on the oscilloscope keyboard to open the Option Installation help topic.
3. Follow the directions in the help topic to activate the license.
View software version and license key details
To view version information of the application, click Options > About TekExpress.
TekExpress® M-PHY Transmitter Automated Solution Application Help 13
Page 14

Setting up the test environment
Setting up the test environment
About setting up tests
Set up tests using the tabs in the Setup panel. Settings in the DUT tab use a top-down, left-to-right logic flow, so that any parameter that
affects or acts as a filter for other parameters appears either to the top of or to the left of the affected parameters.
Tests are saved when you save a test setup. To avoid overwriting test results, remember to assign a unique name to the test either before
running it or immediately after.
All listed tests are required for compliance testing.
See also
About test setups
Before you click Start
About running tests
Search instruments connected to the application
Use the TekExpress Instrument Control Settings dialog box to search the instruments (resources) connected to the application. The
application uses TekVISA to discover the connected instruments.
Note: The instruments required for the test setup must be connected and detected by the application, before running the test.
To refresh the list of connected instruments:
1. Select Options > Instrument Control Settings.
2. In the Search Criteria section of the Instrument Control Settings dialog box, select the connection types of the instruments to
search. Instrument search is based on the VISA layer, but different connections determine the resource type, such as LAN, GPIB, and
USB. For example, if you choose LAN, the search will include all the instruments supported by the TekExpress that are communicating
over the LAN.
3. Click Refresh. The TekExpress application searches for the connected instruments.
Search status of the instruments connected to LAN
4. When the search is complete, a dialog box lists the instrument-related details based on the search criteria. For example, for the Search
Criteria as GPIB, the application displays all the GPIB instruments connected to the application.
TekExpress Instrument Control Settings window.
TekExpress® M-PHY Transmitter Automated Solution Application Help 14
Page 15

Setting up the test environment
The details of the instruments are displayed in the Retrieved Instruments table. The time and date of instrument refresh is displayed in
the Last Updated field.
Deskew
If skew is present between positive and negative channels, then the channels need to be deskewed before being used for waveform
measurements. TekExpress M-PHY TX provides support for channel deskew using the following method:
1. Determine what the skew is for each channel.
2. From the TekScope menu, select Vertical > Deskew.
3. In the Deskew/Attenuation window, click the channel (1 – 4) button for the first channel to be deskewed.
4. Click in the Ch(x) Deskew Time entry field and enter the skew. The skew can be +ve or –ve.
5. Click the channel button for the next channel and repeat step 4.
6. After entering the skew for all the channels that require it, from the Options menu in TekExpress M-PHY TX, select Deskew.
7. In the Deskew and Attenuation dialog box, select the desired level:
• Less than 100 mV signal amplitude: Select this if the signal amplitude is such that the oscilloscope’s vertical setting is less than
100 mV/division.
• 100 mV or greater signal amplitude: Select this if the signal amplitude is such that the oscilloscope’s vertical setting is greater
than 100 mV/division.
Figure 1: Deskew
8. Click Set on Scope to set the stored deskew and attenuation values on oscilloscope.
TekExpress® M-PHY Transmitter Automated Solution Application Help 15
Page 16
Setting up the test environment
9. Click Read from Scope to read the deskew and attenuation values from the oscilloscope.
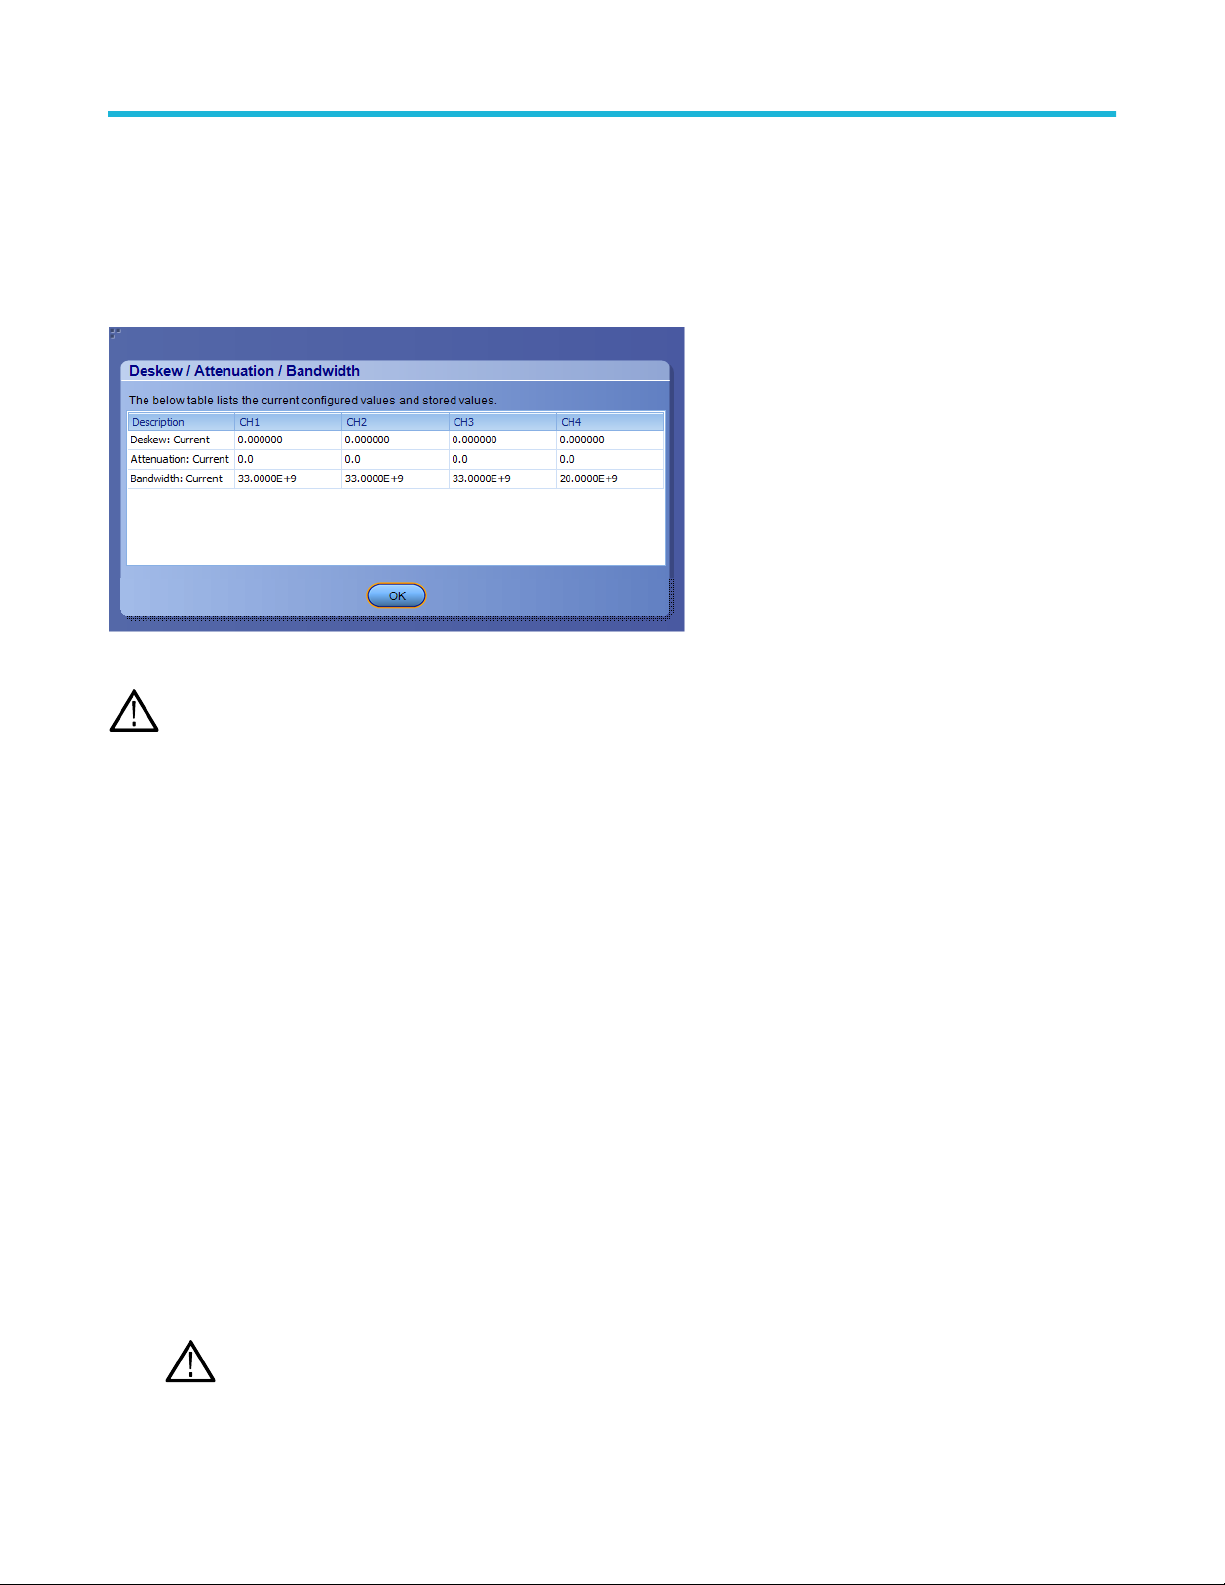
10. Click View values to view the deskew, attenuation, and bandwidth values.
11. When the status in the dialog box indicates the deskew is finished, click Close.
Each input channel has its own deskew settings. Deskew compensates individual channels for probes or cables of different lengths. The
instrument applies the delay values after each completed acquisition. The deskew values are saved as part of the instrument setup. The
deskew values for the selected channel are retained until you change the probe, you restore a saved setup, or you recall the factory setup.
Figure 2: Deskew-View values
Note: If you perform the de-embed settings, then performing the Deskew and Attenuation settings are not required.
Running tests
After selecting and configuring the test, review the pre-run checklist and then click Start to run the tests. While tests are running, you
cannot access the Setup or Reports panels. To monitor the test progress, switch back and forth between the Status panel and the Results
panel.
The application displays a report when the tests are complete. While the tests are running, other applications may display windows in the
background. The TekScope application takes precedence over other applications, but you can switch to other applications by using the Alt
+ Tab key combination. To keep the TekExpress M-PHY TX application on top, select Keep On Top from the M-PHY TX Options menu.
See also
Configure test parameters
About setting up tests
Before you click Start
Before you click start
Before you run tests for the first time, do the following:
1. Understand where your test files are stored on the instrument.
After you install and launch TekExpress M-PHY TX, it creates the following folders on the oscilloscope:
• \Program Files\Tektronix\TekExpress\ TekExpress MIPI_MPHY_TX
The Program Files folder for Windows 10 is for 64-bit.
Note:
• \My Documents\My TekExpress\ M-PHY TX
TekExpress® M-PHY Transmitter Automated Solution Application Help 16
Page 17

Setting up the test environment
• \My Documents\My TekExpress\M-PHY TX\ Untitled Session
Every time you launch TekExpress M-PHY TX, an Untitled Session folder is created in the M-PHY TX folder. The
Untitled Session folder is automatically deleted when you exit the M-PHY TX application (you are prompted to save
the session before exiting if it has not already been saved or if there are unsaved changes).
CAUTION: Do not directly edit or modify any of the session files or folders because this may result in loss of data or corrupted
session files. Each session has multiple files associated with it. When you save a session, the application creates a .TekX file,
and a folder named for the session that contains associated files, on the oscilloscope X: drive.
2. Review the pre-run checklist before you run a test.
See also
View test-related files
Application directories and file types
File name extensions
Pre-test checklist
Do the following before you click Start to run a test. If this is the first time you are running a test for a setup, refer to the information in
Before you click Start.
On the oscilloscope:
• Make sure that all the required instruments are properly warmed up (approximately 20 minutes).
• Perform Signal Path Compensation (SPC).
1. On the oscilloscope main menu, select the Utilities menu.
2. Select Instrument Calibration and run the SPC utility.
• Perform deskew on any cables.
In the M-PHY TX application:
1. Verify that the application is able to find the instrument. If it cannot, perform a search for connected instruments.
a. Select Setup > Test Selection. Select any test and then click Configure.
b. In the Configuration section, click Global Settings.
c. In the Instruments Detected section, click the drop-down arrow to the right of the listed instruments and make sure that the
instrument is listed.
2. Run the Deskew utility (Options > Deskew).
TekExpress® M-PHY Transmitter Automated Solution Application Help 17
Page 18

Starting the application
To start the TekExpress M-PHY Tx, select from the oscilloscope menu bar.Applications > TekExpress M-PHY Tx
Starting the application
During start, a "My TekExpress" folder is created in the Documents folder of the current user and gets mapped to "X" drive. When the
application is closed properly, the "X" drive gets unmapped. Session files are then stored inside the X:\M-PHY Tx folder. If this file is
not found, the application runs an instrument discovery program to detect connected instruments before starting TekExpress M-PHY Tx.
To keep the TekExpress M-PHY Tx application on top of any application, select Keep On Top from the options menu. If the application
goes behind the oscilloscope application, select Applications >TekExpress M-PHY Tx to bring the application to the front.
Operating basics
Run the application
To run the M-PHY TX application, do either of the following:
• Select Analyze > TekExpress M-PHY TX from the TekScope menu.
• Click any saved M-PHY session file.
When you open the application after installation, the application checks for a file called Resources.xml located in the My
TekExpress folder. If this file is not found, instrument discovery is performed before launching M-PHY TX. The Resources.xml
file contains information regarding instruments that are available on your network.
If the application license was not installed using the TekScope menu Utilities > Option Installation selection, you can open and demo the
application 10 times. Each time you open the application without supplying a valid license key, one of the free trials is used.
See also
Active the license
TekExpress® M-PHY Transmitter Automated Solution Application Help 18
Page 19

Starting the application
Close the application
Use the following method to exit the application:
Note: Using other methods to exit the application results in abnormal termination of the application.
1. Click on the application title bar.
2. Do one of the following:
• If you have an unsaved session or test setup open, you are asked to save it before exiting. To save it, click Yes. Otherwise click
No. The application closes.
• A message box appears asking if you really want to exit TekExpress. To exit, click Yes.
TekExpress® M-PHY Transmitter Automated Solution Application Help 19
Page 20

Application controls
This section describes the application controls with functionality and its details.
Table 6: Application control description
Item Description
Options menu Menu to display global application controls.
Test panel Controls that open tabs for configuring test settings and options.
Starting the application
Start / Stop button Use the Start button to start the test run of the measurements in the selected order. If prior
acquired measurements are not cleared, then new measurements are added to the existing
set. The button toggles to the Stop mode while tests are running. Use the Stop button to
abort the test.
Pause / Continue button Use the Pause button to pause the acquisition. When a test is paused, this button changes
as Continue.
Clear button Use the Clear button to clear all existing measurement results. Adding or deleting a
measurement, or changing a configuration parameter of an existing measurement, also
clears measurements. This is to prevent the accumulation of measurement statistics or
sets of statistics that are not coherent. This button is available only on Results panel.
Note: This button is visible only when there are results data on the panel.
Application window move icon Place the cursor over the top of the application window to move the application window to
the desired location
Minimize icon Minimizes the application.
Close icon Close the application.
Table continued…
TekExpress® M-PHY Transmitter Automated Solution Application Help 20
Page 21

Starting the application
Item Description
Mini view / Normal view Mini view displays the run messages with the time stamp, progress bar, Start / Stop button,
and Pause / Continue button. The application moves to mini view when you click the Start
button.
Options menu functions
To access the Options menu, click in the upper-right corner of the application. It has the following selections:
Table 7: Options menu settings
Menu Function
Default Test Setup Opens a new test setup with default configurations.
Open Test Setup Opens a previously saved test setup. Displays the list of previously saved test setup file
names. Make the selection and click OK to open the test setup.
Save Test Setup Saves the current test configurations with the specified file name.
Save Test Setup As Saves the current test setup with a different file name or file type.
Open Recent Displays the recently opened test setup file names. Make the selection and click OK to
open the test setup.
Instrument Control Settings
Keep On Top
Email Settings Configures email options for test run and result notifications.
Deskew Loads oscilloscope channel deskew settings into the application.
Help Displays the TekExpress M-PHY Tx help.
Table continued…
Detects, lists, and refreshes the connected instruments found on the specified connections
(LAN, GPIB, USB, Serial, Non-VISA Resources, TekLink, and VXI).
Always keeps the TekExpress M-PHY Tx application on top of all the applications.
TekExpress® M-PHY Transmitter Automated Solution Application Help 21
Page 22

Menu Function
About TekExpress
Displays the application name, version, and hyperlink to end the user license agreement.
Starting the application
TekExpress® M-PHY Transmitter Automated Solution Application Help 22
Page 23

Starting the application
Configure email settings
Use the Email Settings utility to get notified by email when a measurement completes or produces any error condition. Follow the steps to
configure email settings:
Figure 3: Email settings window
1. Select Options > Email Settings to open the Email Settings dialog box.
2. (Required) For Recipient email Address(es), enter one or more recipient email addresses. To include multiple addresses, separate
the addresses with commas.
3. (Required) For Sender’s Address, enter the email address used by the instrument. This address consists of the instrument name,
followed by an underscore, followed by the instrument serial number, then the @ symbol, and the email server ID. For example:
user@yourcompany.com.
4. (Required) In the Server Configuration section, type the SMTP Server address of the Mail server configured at the client location,
and the SMTP Port number, in the corresponding fields.
If this server requires password authentication, enter a valid login name, password, and host name in the corresponding fields.
If any of the above required fields are left blank, the settings will not be saved, and email notifications will not be sent.
Note:
5. In the Email Attachments section, select from the following options:
• Reports: Select to receive the test report with the notification email.
• Status Log: Select to receive the test status log with the notification email. If you select this option, then also select whether you
want to receive the full log or just the last 20 lines.
6. In the Email Configuration section:
• Enter a maximum file size for the email message. Messages with attachments larger than this limit will not be sent. The default is
5 MB.
• Enter the number in the Number of Attempts to Send field, to limit the number of attempts that the system makes to send a
notification. The default is 1. You can also specify a timeout period.
7. Select the Email Test Results When complete or on error check box. Use this check box to quickly enable or disable email
notifications.
8. To test your email settings, click Test Email.
9. To apply your settings, click Apply.
10. Click Close when finished.
TekExpress® M-PHY Transmitter Automated Solution Application Help 23
Page 24

Starting the application
TekExpress instrument control settings
Use the TekExpress Instrument Control Settings dialog box to search the instruments (resources) connected to the application. You
can use the Search Criteria options to search the connected instruments depending on the connection type. The details of the connected
instrument is displayed in the Retrieved Instruments window.
To access, click Options > Instrument Control Settings. Select GPIB as search criteria for TekExpress application and click Refresh.
The connected instruments displayed in the Retrieved Instruments window and can be selected for use under Global Settings in the test
configuration section.
Figure 4: TekExpress Instrument Control Settings window
See also
Options menu functions on page 21
TekExpress® M-PHY Transmitter Automated Solution Application Help 24
Page 25
Setup panel: Configure the test setup
Setup panel: Configure the test setup
The Setup panel contains sequentially ordered tabs that help you guide through the test setup and execution process.
TekExpress® M-PHY Transmitter Automated Solution Application Help 25
Page 26

Setup panel: Configure the test setup
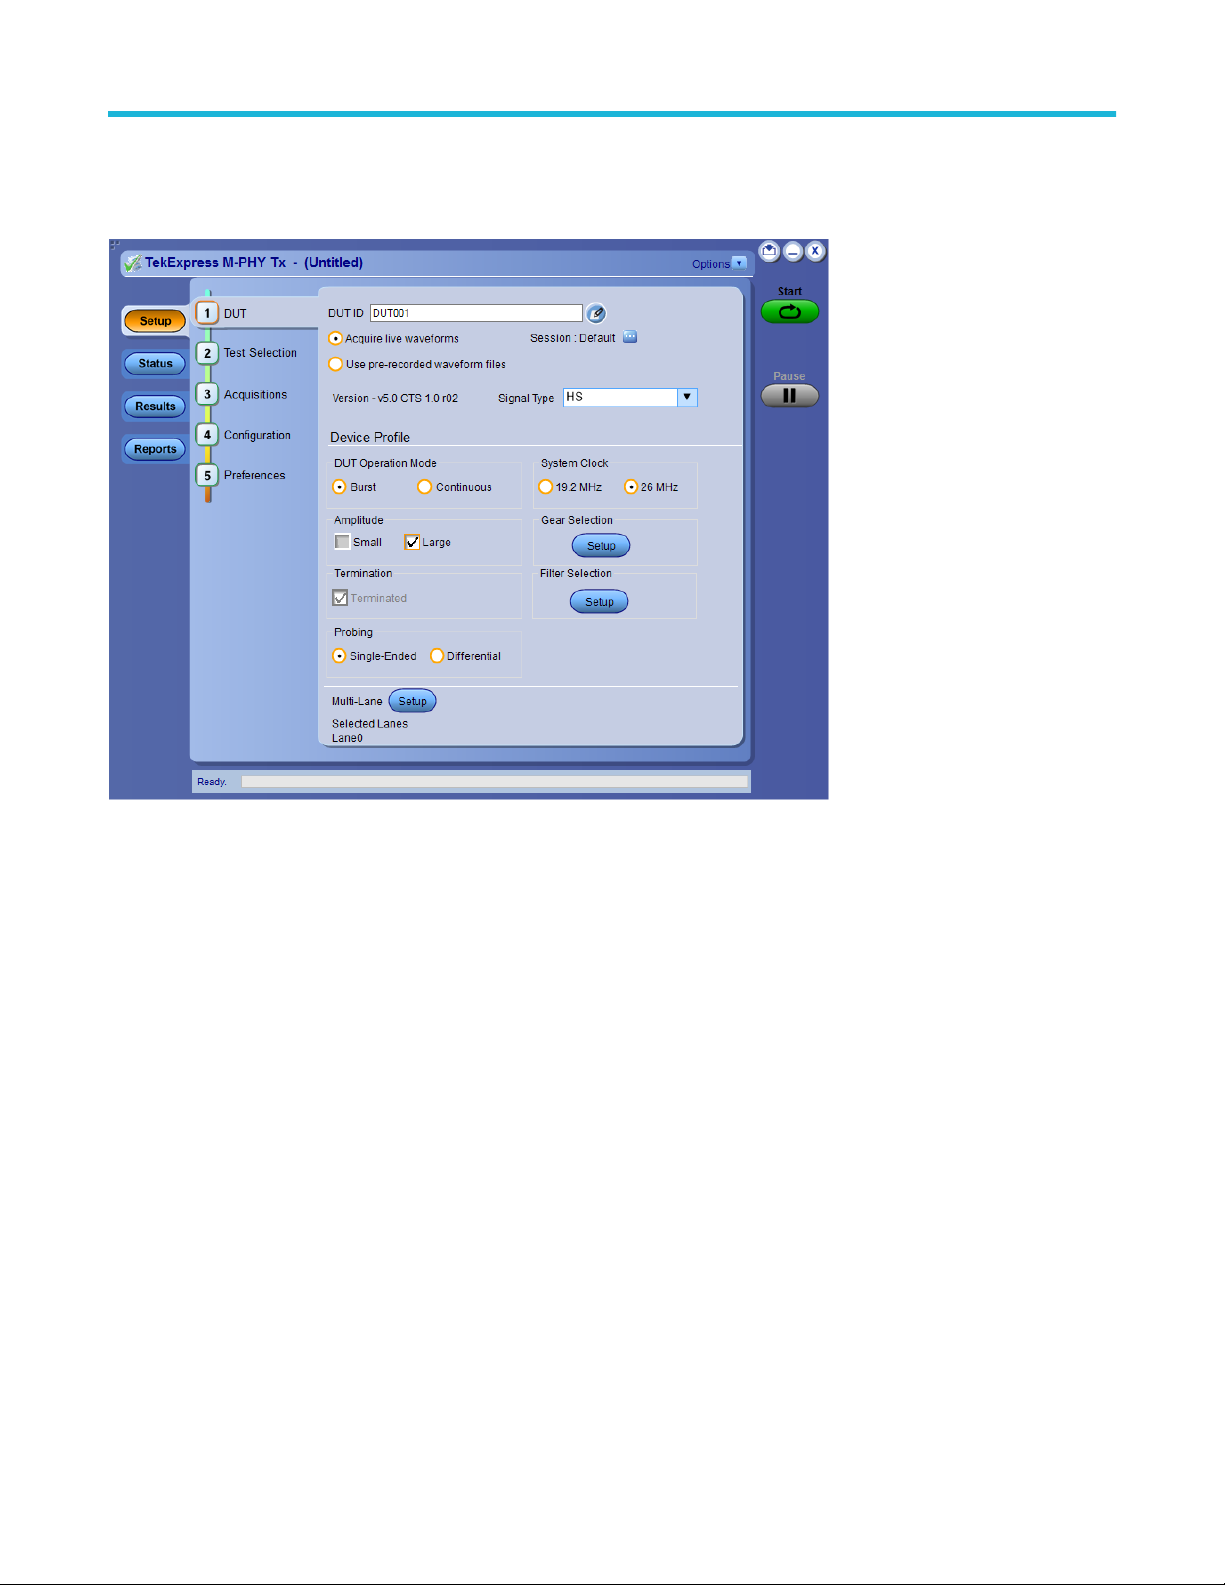
DUT: Set DUT settings
Use the DUT tab to select parameters for the device under test. These settings are global and apply to all tests of current session. DUT
settings also affect the list of available tests in the Test Selection tab.
Figure 5: DUT tab
Click Setup > DUT to access the DUT parameters:
Table 8: DUT tab configuration
Setting Description
DUT ID Adds an optional text label for the DUT to reports. The default value is DUT001.
The maximum number of characters supported is 32. You cannot use the
characters (.,..,...,\,/:?”<>|*) in an ID name.
Opens a comments dialog box which allows you to enter optional text to add to
Comments icon (to the right of the DUT ID field)
Acquire live waveforms Acquire active signals from the oscilloscope for testing.
Use pre-recorded waveform files Run an analysis on a saved run session file. Select a file from the Run Session
Session Lists saved run sessions (waveform acquisitions) on which you can perform
Table continued…
a report. You can enter a maximum number of 256 characters. Refer Configure
report view settings to enable or disable comments which displays on the test
report.
field.
analysis. Use in conjunction with the ‘Use pre-recorded waveform files’ control.
Note: Pre-recorded (saved) waveform file names follow a specific
naming syntax. To use your own waveform files (generated outside
TekExpress® M-PHY Transmitter Automated Solution Application Help 26
Page 27

Setup panel: Configure the test setup
Setting Description
of this application), name the waveform files appropriately.Waveform
naming conventions (pre-recorded mode)
Version Displays the latest version of M-PHY TX testing specification version.
Signal Type
• HS: High Speed
• PWM: Pulse Width Modulation
• SYS: System Clock
• UFS4 Ref Clk: Universal Flash Storage Reference Clock
DUT Operation Mode
Amplitude
Termination
Probing
System Clock
Gear Selection for HS If the System Clock is selected as 19.2 MHz then the Gear and Gear variation
For HS: Burst and Continuous
For PWM: Burst and Continuous
For SYS: Burst and Continuous
• Small
• Large
Note: You can select both of these settings.
• Terminated
• Non Terminated (It is not applicable for Signal Type - HS)
Note: You can select both of these settings.
• Single-Ended
• Differential
• 19.2 MHz
• 26 MHz
supported by the DUT parameters are:
• Gear 1A: 1.248
• Gear 1B: 1.4592
• Gear 2A: 2.496
• Gear 2B: 2.9184
• Gear 3A: 4.992
• Gear 3B: 5.8368
• Gear 4A: 9.984
• Gear 4B: 11.6736
• Gear 5A: 19.968
• Gear 5B: 23.3472
If the System Clock is selected as 26 MHz then the Gear and Gear variation
supported by the DUT parameters are:
Table continued…
TekExpress® M-PHY Transmitter Automated Solution Application Help 27
Page 28

Setting Description
• Gear 1A: 1.248
• Gear 1B: 1.456
• Gear 2A: 2.496
• Gear 2B: 2.912
• Gear 3A: 4.992
• Gear 3B: 5.824
• Gear 4A: 9.984
• Gear 4B: 11.648
• Gear 5A: 19.968
• Gear 5B: 23.296
Setup panel: Configure the test setup
Gear Selection for PWM
Frequency Selection for SYS Select one or more frequencies. Available frequencies are 26 MHz, 38.4 MHz,
Frequency Selection for UFS4 Ref Clk Select one or more frequencies. Available frequencies are 19.2 MHz, 26 MHz,
Filter Selection Click the Setup button to browse and select the filter files.
Multi-Lane Click the Setup button to select the number of lanes for testing. You can select
Select one or more Gears (0-7) relevant to your DUT PWM signal testing
requirements.
• Gear 0: 0.01-3 Mbps
• Gear 1: 3-9 Mbps
• Gear 2: 6-18 Mbps
• Gear 3: 12-36 Mbps
• Gear 4: 24-72 Mbps
• Gear 5: 48-144 Mbps
• Gear 6: 96-288 Mbps
• Gear 7: 192-576 Mbps
and 52 MHz.
38.4 MHz, and 52 MHz.
1/2/4/8 Lanes.
Note: The selected lanes can also be viewed on the DUT panel.
Embed / De-embed for Mid-bus probing
For M-PHY TX testing, measurements are specified at the TX pins. Many a times, users measure signals at the end of the channel to see
the effect at the RX pins or some test point in the middle of the channel (Mid-bus probing). For conformance testing, to ensure the values
meet the CTS, there would have a need to embed and/or de-embed channel to make measurements at the pin.
TekExpress® M-PHY Transmitter Automated Solution Application Help 28
Page 29

Setup panel: Configure the test setup
TekExpress Automated software allows you to do mid-bus probing via embedding/de-embedding signal path using filter files. You can use
the "Filter Setup" option in DUT panel to add the filters. This setting will be applied globally to all the measurements during acquisition.
DUT Operation Mode - HS Tests
Test Names Burst Continuous
Differential Single Ended Differential Single Ended
G1 G1 G3 G4 G5 G1 G2 G3 G4 G5 G1 G2 G3 G4 G5 G1 G2 G3 G4 G5
Test 1.1.1-HS-TX Unit Interval and
Frequency Offset
Test 1.1.2-HS-TX Common-Mode AC Power
Spectral Magnitude Limit
4
Test 1.1.3-HS-TX PREPARE Length √ √ √ √ √ √ √ √ √ √ x x x x x x x x x x
Test 1.1.4-HS-TX Common Mode DC Output
Voltage Amplitude
Test 1.1.5-HS-TX Differential DC Output
Voltage Amplitude
Test 1.1.6-HS-TX G1 and G2 Differential AC
Eye
Test 1.1.7-HS-TX G3, G4 and G5 Differential
AC Eye
Test 1.1.8-HS-TX 20-80% Rise and Fall
Times
Test 1.1.9-HS-TX Lane-Lane Output Skew
Table continued…
√ √ √ √ √ √ √ √ √ √ √ √ √ √ √ √ √ √ √ √
x x x x x √ x x x x x x x x x √ x x x x
x x x x x √ √ √ √ √ x x x x x x x x x x
√ √ √ √ √ √ √ √ √ √ x x x x x x x x x x
√ √ x x x √ √ x x x √ √ x x x √ √ x x x
x x √ √ √ x x √ √ √ x x √ √ √ x x √ √ √
√ √ √ √ √ √ √ √ √ √ x x x x x x x x x x
5
√ √ √ √ √ √ √ √ √ √ √ √ √ √ √ √ √ √ √ √
4
Informative test
TekExpress® M-PHY Transmitter Automated Solution Application Help 29
Page 30

Setup panel: Configure the test setup
Test Names Burst Continuous
Differential Single Ended Differential Single Ended
G1 G1 G3 G4 G5 G1 G2 G3 G4 G5 G1 G2 G3 G4 G5 G1 G2 G3 G4 G5
Test 1.1.10-HS-TX Slew Rate Control
6
Range
Test 1.1.11-HS-TX Slew Rate Monotonicity
Test 1.1.12-HS-TX Slew Rate Resolution
√ √ √ √ √ √ √ √ √ √ x x x x x x x x x x
6
√ √ √ √ √ √ √ √ √ √ x x x x x x x x x x
6
√ √ √ √ √ √ √ √ √ √ x x x x x x x x x x
Test 1.1.13-HS-TX Intra-Lane Output Skew x x x x x √ √ √ √ √ x x x x x √ √ √ √ √
Test 1.1.14-HS-TX Transmitter Pulse Width √ √ √ √ √ √ √ √ √ √ √ √ √ √ √ √ √ √ √ √
Test 1.1.15-HS-TX Total Jitter x x x x x x x x x x √ √ √ √ √ √ √ √ √ √
Test 1.1.16-HS-TX Short-Term Total Jitter x x x x x x x x x x √ √ √ √ √ √ √ √ √ √
Test 1.1.17-HS-TX Deterministic Jitter √ √ √ √ √ √ √ √ √ √ √ √ √ √ √ √ √ √ √ √
Test 1.1.18-HS-TX Short term Deterministic
√ √ √ √ √ √ √ √ √ √ √ √ √ √ √ √ √ √ √ √
Jitter
BER Eye Contour
4
x x x x x x x x x x √ √ √ √ √ √ √ √ √ √
DUT Operation Mode - PWM Tests (Burst Mode)
Test Name Differential Single Ended
G0 G1 G2 G3 G4 G5 G6 G7 G0 G1 G2 G3 G4 G5 G6 G7
Test 1.2.1-PWM-TX Transmit Bit Duration √ √ √ √ √ √ √ √ √ √ √ √ √ √ √ √
Test 1.2.2-PWM-TX Transmit Ratio √ √ √ √ √ √ √ √ √ √ √ √ √ √ √ √
Test 1.2.3-PWM-TX PREPARE Length √ √ √ √ √ √ √ √ √ √ √ √ √ √ √ √
Test 1.2.4-PWM-TX Common Mode DC Output Voltage
x x x x x x x x √ √ √ √ √ √ √ √
Amplitude
Test 1.2.5-PWM-TX Differential DC Output Voltage
√ √ √ √ √ √ √ √ √ √ √ √ √ √ √ √
Amplitude
Test 1.2.7-PWM-TX Maximum Differential AC Output
√ √ √ √ √ √ √ √ √ √ √ √ √ √ √ √
Voltage Amplitude
Test 1.2.8-PWM-TX 2080 Rise and Fall Times √ √ √ √ √ √ √ √ √ √ √ √ √ √ √ √
Test 1.2.9-PWM-TX Lane-to-Lane Skew √ √ √ √ √ √ √ √ √ √ √ √ √ √ √ √
Test 1.2.10-PWM-TX Transmit Bit Duration Tolerance √ √ √ √ √ √ √ √ √ √ √ √ √ √ √ √
Test 1.2.11-PWM-TX G0 Minor Duration √ x x x x x x x √ x x x x x x x
DUT Operation Mode - PWM Tests (Continuous Mode)
Test Name Differential Single Ended
G0 G1 G2 G3 G4 G5 G6 G7 G0 G1 G2 G3 G4 G5 G6 G7
Test 1.2.1-PWM-TX Transmit Bit Duration √ √ √ √ √ √ √ √ √ √ √ √ √ √ √ √
Table continued…
5
Supported only for multilane
6
Informative test for Gear2 and Gear3
TekExpress® M-PHY Transmitter Automated Solution Application Help 30
Page 31

Setup panel: Configure the test setup
Test Name Differential Single Ended
G0 G1 G2 G3 G4 G5 G6 G7 G0 G1 G2 G3 G4 G5 G6 G7
Test 1.2.2-PWM-TX Transmit Ratio x x x x x x x x x x x x x x x x
Test 1.2.3-PWM-TX PREPARE Length x x x x x x x x x x x x x x x x
Test 1.2.4-PWM-TX Common Mode DC Output Voltage
x x x x x x x x x x x x x x x x
Amplitude
Test 1.2.5-PWM-TX Differential DC Output Voltage
x x x x x x x x x x x x x x x x
Amplitude
Test 1.2.7-PWM-TX Maximum Differential AC Output
√ √ √ √ √ √ √ √ √ √ √ √ √ √ √ √
Voltage Amplitude
Test 1.2.8-PWM-TX 2080 Rise and Fall Times x x x x x x x x x x x x x x x x
Test 1.2.9-PWM-TX Lane-to-Lane Skew √ √ √ √ √ √ √ √ √ √ √ √ √ √ √ √
Test 1.2.10-PWM-TX Transmit Bit Duration Tolerance x x x x x x x x x x x x x x x x
Test 1.2.11-PWM-TX G0 Minor Duration x x x x x x x x x x x x x x x x
DUT Operation Mode - SYS Tests
Test Name Burst Continuous
Differential Single Ended Differential Single Ended
Test 1.3.1-SYS-TX Unit Interval and
√ √ √ √
Frequency Offset
7
Test 1.3.2-SYS-TX Ref Clock frequency
x x x x
Test 1.3.3-SYS-TX PREPARE Length √ √ x x
Test 1.3.4-SYS-TX Common Mode DC
x √ x x
Output Voltage Amplitude
Test 1.3.5-SYS-TX Differential DC Output
√ √ x x
Voltage Amplitude
Test 1.3.7-SYS-TX Maximum Differential AC
√ √ √ √
Output Voltage Amplitude
Test 1.3.8-SYS-TX 20-80% Rise and Fall
√ √ x x
Times
4
Test 1.3.9-SYS-TX Lane-to-Lane Skew
√ √ √ √
7
Clock Signal
TekExpress® M-PHY Transmitter Automated Solution Application Help 31
Page 32

Setup panel: Configure the test setup
Test Selection: Select the tests
Use the Test Selection tab to select the tests. The test measurements available depends on the settings selected in the DUT tab.
Figure 6: Test selection tab
Table 9: Test Selection tab configuration
Setting Description
Deselect All Deselects (clears) all tests.
Select Required Selects all test required to pass compliance.
Select All Selects all listed tests.
Test selection field Lists available test and if they are selected to run. Click in the box adjacent to a test
to select or unselect a test. Tests listed are affected by DUT tab selections (GEAR,
Continuous Mode, Burst Mode, Single-Ended, or Differential).
Test Description field Shows a description of the selected test.
Schematic Opens a connection diagram that shows the DUT test setup. Use the diagram to verify
the test setup before running the test.
TekExpress® M-PHY Transmitter Automated Solution Application Help 32
Page 33

Setup panel: Configure the test setup
Acquisitions: Set waveform acquisition settings
Use Acquisitions tab to view the test acquisition parameters. The contents displayed on this tab depends on the DUT type and the tests
selected.
Figure 7: Acquisition tab
Table 10: Acquisitions tab configuration
Setting Description
Refresh sources Updates the list of available channel sources as used by the Source
fields in the Device list. Click this button if you want to change the
channel connections in the test setup.
View Probes Displays the Source, Probe Type, and Probe models.
Acquisition and Save Options Save and Analyze Acquisitions in Sequence
Show Acquire Parameters When selected it shows the acquisition parameters in the test list.
Acquire Only When selected will not analyze after waveforms are acquired.
Delete Waveforms When selected will delete the waveforms after the analysis.
Signal Validation Select a Signal validation parameter (Signal validation is valid only
for Live acquisitions).
Table continued…
TekExpress® M-PHY Transmitter Automated Solution Application Help 33
Page 34

Setup panel: Configure the test setup
Setting Description
Prompt me if signal fails Select to open a dialog box when the application fails to acquire
a valid signal after a specified number of retries (as set in the
Configuration tab or fields). Select one of the three options in the
dialog box. Refer Signal validation overview on page 34 for more
details.
Skip test if signal fails Select to skip all tests that depend on an acquired signal that fails
signal validation. The comments section in the report file will show
the details as "User skipped acquisitions for this pattern".
Use signal as is - Don't Check Select to skip signal validation and use the signal as-is for testing.
The test results may not be as expected.
Note: In Pre-recorded mode, the acquisition table includes a column called "Waveform File Name." Use the fields in this column
to browse and select waveform files to load for analysis.
TekExpress M-PHY Tx application saves all acquisition waveforms to files by default. Waveforms are saved in a unique folder for each
session (a session is started when you click the Start button). The folder path is X:\TekExpress M-PHY Tx\Untitled
Session\<dutid>\<date>_<time>. Images created for each analysis, XML files with result values, reports, and other
information specific to that particular execution are also saved in this folder.
Saving a session moves the session file contents from the Untitled Session folder to the specified folder name and changes the session
name to the specified name.
Signal validation overview
Options displayed in Acquisition panel for Signal Validation are
• Prompt me if signal fails: Signal validation is performed on the acquired signal and if the validation fails, the application will attempt to
re-acquire the signal depending on the retry count set by you in the configuration menu. In case the validation still fails after exceeding
the retry count, a pop-up is displayed to select one of the following three options:
• Re-acquire: A fresh attempt is made to re-acquire the signal.
• Use Anyway: Current acquired signal is used for all the tests.
• Skip Test: Any test(s) that depend on this acquisition will be skipped and the same will be displayed in the report.
• Skip test if signal fails: Signal validation is performed on the acquired signal and if validation fails, any test(s) that depend on this
acquisition will be skipped and the same will be displayed in the report. The comments section in the report file will display the details
as 'User skipped acquisitions for this pattern'.
• Use signal as is - Don't Check: Signal validity will be skipped and no check will be made after the signal is acquired. The signal will
directly be used for testing and hence, the final results in report may not be as expected.
Signal validation checks the following signal parameters on each acquisition for the indicated measurement type:
• Data Rate (HS): If the difference between the measured and expected data rate is less than 2000 ppm, the signal is considered valid
for this parameter. The Data Rate check is mandatory for signal validation.
• MARKER0 (HS): If MARKER0 is present, the signal is considered valid for this parameter. The MARKER0 check is mandatory for
signal validation.
• CRPAT (HS): If one complete CRPAT (LLI specific) is present, then the signal is considered valid for this parameter. The CRPAT check
is not mandatory for signal validation.
TekExpress® M-PHY Transmitter Automated Solution Application Help 34
Page 35

Setup panel: Configure the test setup
Configuration: Set measurement limits for tests
Use Configuration tab to view and configure the Global Settings and the measurement configurations. The measurement specific
configurations available in this tab depends on the selections made in the DUT panel and Test Selection panel.
Table 11: Configuration tab: Common parameters
Settings Description
Limit Editor
Displays the upper and lower limits for the applicable measurement using different types of comparisons.
Figure 8: Configuration tab: Global Settings
TekExpress® M-PHY Transmitter Automated Solution Application Help 35
Page 36

Setup panel: Configure the test setup
Table 12: Configuration tab: Global Settings configuration
Setting Description
Compliance Mode Sets the global and measurement parameters of all measurements
to the values required to pass compliance testing. If you are in User
Define Mode, selecting compliance mode returns all global settings
and measurement parameters to their compliance default values.
Note: Save test setups made in the User Defined Mode
before changing to Compliance Mode, as the application
does not automatically save user defined changes or
prompt you to save settings before changing modes.
User Defined Mode Enables editing of the global and measurement parameters for
tests.
Limits Editor Opens the Limits Editor window where you can set high and low
limits for each test when in User Defined Mode. If you are in
Compliance Mode you can only view the default limit values. Limits
Editor
Global Settings
Instruments Detected
Click this tab to list the detected instrument(s) and any available
global parameters that you can set. The global settings apply to all
tests.
Voltage Term Setting
To select a different instrument, click on the instruments list in the
Instruments Detected area and select an instrument from the menu.
If you do not see the desired instrument in the list, refresh the list. If
the instrument is still not listed, verify that the instrument is powered
on, has correct network settings, and is connected to the network or
instrument.
TekExpress® M-PHY Transmitter Automated Solution Application Help 36
Page 37

Setup panel: Configure the test setup
Figure 9: Configuration tab: Measurement
Table 13: Configuration tab: Measurements configuration
Setting Description
Measurements
Lists all tests for the selected measurement type (HS or PWM
or SYS or UFS). Click on a measurement to view the available
parameters in the tabbed field below the list. The parameters and
parameter type tabs shown depend on the selected test.
Select User Defined Mode to edit test parameters.
Use the scroll bar in the parameters area to scroll through all
available parameters.
Note: Save test setups made in the User Defined Mode
before changing to Compliance Mode, as the application
does not automatically save user defined changes or
prompt you to save settings before changing modes.
Limits Editor controls
The Limits Editor window lets you set high and low limits for each test when in User Defined Mode.
In Compliance Mode limit settings can only be viewed and cannot be edited.
Note:
TekExpress® M-PHY Transmitter Automated Solution Application Help 37
Page 38

Setup panel: Configure the test setup
Figure 10: Limits Editor
Table 14: Limits Editor controls
Settings Description
Test Name The name of the test.
Details The limit test(s) that are part of the overall test suite.
Compare String Sets the comparison logic for the high or low limit test parameter. Click on this field and
select the appropriate comparison logic from the menu. There is a separate Compare
String field for each low limit and the high limit parameter.
Low Limit/High Limit The numeric value of the low or high limit parameter. Click in the field and enter a value.
The limit units are shown in the Description field for that limit test.
OK Click OK to close the Limits Editor window and return to the test configuration view.
Note: Save test setups made in the User Defined Mode before changing to
Compliance Mode, as the application does not automatically save user defined
changes or prompt you to save settings before changing modes.
Limits Editor warning
• Press the keyboard Esc button or click the X button (upper right corner of Limits Editor dialog box) to cancel or not save the current
edits.
• If you enter the wrong compare string or wrong value in a field, you cannot select or move to another cell until you enter a correct value
into the field in question.
• You cannot delete or clear a compare string or value once entered.
TekExpress® M-PHY Transmitter Automated Solution Application Help 38
Page 39

Setup panel: Configure the test setup
Preferences: Set the test run preferences
Use Preferences tab to set the application action on completion of a measurement. The Preferences tab has the feature to enable or
disable certain options related to the measurement execution.
Figure 11: Preferences tab
Refer the below table for the options available in the Preferences tab:
Table 15: Preferences tab settings
Setting Description
Execution Options
Show alert when new deskew values are configured on TekScope
Actions on Test Measurement Failure
On Test Failure, stop and notify me of the failure
Select to stop the test run on Test Failure, and to get notified via
email. By default, it is unselected. Click Email Settings to configure
the email settings to receive notifications.
TekExpress® M-PHY Transmitter Automated Solution Application Help 39
Page 40

Status panel: View the test execution status
Status panel: View the test execution status
The Status panel contains the Test Status and Log View tabs, which provides status on the test acquisition and analysis (Test Status) and
listing of test tasks performed (Log View tab). The application opens the Test Status tab when you start to execute the test. Select the
Test Status or the Log View tab to view these items while the test execution is in progress.
View test execution status
The tests are grouped and displayed based on the Clock and Data lane. It displays the tests along with the acquisition type, acquire, and
analysis status of the tests. In pre-recorded mode, Acquire Status is not valid.
The Test Status tab presents a collapsible table with information about each test as it is running. Use the symbols to expand (
collapse ( ) the table rows.
) and
Figure 12: Test execution status view in Status panel
Table 16: Test execution status table headers
Table Header Description
Test Name Displays the measurement name.
Acquisition Describes the type of data being acquired.
Acquire Status Displays the progress state of the acquisition:
• To be started
• In Progress
• Completed
Table continued…
TekExpress® M-PHY Transmitter Automated Solution Application Help 40
Page 41

Status panel: View the test execution status
Table Header Description
Analysis Status Displays the progress state of the analysis:
• To be started
• In Progress
• Completed
View test execution logs
The Test Status tab displays the detailed execution status of the tests. Also, displays each and every execution step in detail with its
timestamp information. The log details can be used to troubleshoot and resolve any issue/bug which is blocking the test execution process.
Figure 13: Log view in Status panel
Table 17: Status panel settings
Control Description
Message History Lists all the executed test operations and timestamp information.
Auto Scroll
Clear Log Clears all the messages from the log view.
Save
TekExpress® M-PHY Transmitter Automated Solution Application Help 41
Enables automatic scrolling of the log view as information is added to the log during the test execution.
Saves the log file into a text file format. Use the standard Save File window to navigate to and specify
the folder and file name to save the log text.
Page 42

Results panel: View summary of test results
Results panel: View summary of test results
When a test execution is complete, the application automatically opens the Results panel to display a summary of test results.
In the Results table, each test result occupies a row. By default, results are displayed in summary format with the measurement details
collapsed and with the Pass/Fail column visible.
Figure 14: Results panel with measurement results
Click icon on each measurement in the row to expand and to display the minimum and maximum parameter values of the
measurement.
Filter the test results
Each column in the result table can be customized and displayed by enabling or disabling any column as per your requirement. You can
change the view in the following ways:
• To remove or restore the Pass/Fail column, select Preferences > Show Pass/Fail.
• To collapse all expanded tests, select Preferences > View Results Summary.
• To expand all the listed tests, select View Results Details from the Preferences menu in the upper right corner.
• To enable or disable the wordwrap feature, select Preferences > Enable Wordwrap.
• To view the results grouped by lane or test, select the corresponding item from the Preferences menu.
• To expand the width of a column, place the cursor over the vertical line that separates the column from the column to the right. When
the cursor changes to a double-ended arrow, hold down the mouse button and drag the column to the desired width.
• To clear all test results displayed, click Clear.
TekExpress® M-PHY Transmitter Automated Solution Application Help 42
Page 43

Reports panel: Configure report generation settings
Reports panel: Configure report generation settings
Click Reports panel to configure the report generation settings and select the test result information to include in the report. You can use
the Reports panel to configure report generation settings, select test content to include in reports, generate the report, view the report,
browse for reports, name and save reports, and select report viewing options.
Report configuration settings
The Configuration tab describes the report generation settings to configure the Reports panel. Select report settings before running a test
or when creating and saving test setups. Report settings configured are included in saved test setups.
Figure 15: Report panel- Configuration tab
Table 18: Report configuration panel settings
Control Description
View Click to view the most current report.
Generate Report Generates a new report based on the current analysis results.
Save As Specify a name for the report.
Report Update Mode Settings
Generate new report Each time when you click Run and when the test execution is complete, it will create a new
report. The report can be in either .mht, .pdf, or .csv file formats.
Append with previous run session Appends the latest test results to the end of the current test results report. Each time when
you click this option and run the tests, it will run the previously failed tests and replace the
failed test result with the new pass test result in the same report.
Include header in appended reports Select to include header in appended reports.
Table continued…
TekExpress® M-PHY Transmitter Automated Solution Application Help 43
Page 44

Reports panel: Configure report generation settings
Control Description
Replace current test results Replaces the previous test results with the latest test results. Results from newly added
tests are appended to the end of the report.
In previous run, current session
In any run, any session Select to replace current test results in the report with the test result(s) in the selected run
Report Creation Settings
Report name
Select to replace current test results in the report with the test result(s) of previous run in
the current session.
session’s report. Click and select test result of any other run session.
Displays the name and path of the <Application Name> report. The default
location is at \My Documents>\My TekExpress\<Application
Name>\Reports. The report file in this folder gets overwritten each time you run
a test unless you specify a unique name or select to auto increment the report name.
To change the report name or location, do one of the following:
• In the Report Path field, type the current folder path and name.
• Double-click in the Report Path field and then make selections from the popup
keyboard and click Enter.
Be sure to include the entire folder path, the file name, and the file extension.
For example: C:\Documents and Settings\your user name\My
Documents\My TekExpress\<Application Name> \DUT001.mht.
Save as type
Auto increment report name if duplicate
Create report automatically at the end of the
run
View report after generating
Note: You cannot set the file location using the Browse button.
Open an existing report
Click Browse, locate and select the report file and then click View at the bottom of the
panel.
Saves a report in the specified file type, selected from the drop-down list. The report is
saved in .csv, .pdf, or .mht.
Note:
If you select a file type different from the default, be sure to change the report file
name extension in the Report Name field to match.
Sets the application to automatically increment the name of the report file if the application
finds a file with the same name as the one being generated. For example: DUT001,
DUT002, DUT003. This option is enabled by default.
Select to create the report with the settings configured, at the end of run.
Automatically opens the report in a Web browser when the test execution is complete. This
option is selected by default.
TekExpress® M-PHY Transmitter Automated Solution Application Help 44
Page 45

Reports panel: Configure report generation settings
Configure report view settings
The View Settings tab describes the report view settings to configure the Reports panel. Select report view settings before running a test
or when creating and saving test setups. Report settings configured are included in saved test setups.
Figure 16: Report panel-View settings tab
Table 19: Report panel view settings
Control Description
Contents To Save Settings
Include pass/fail info in details table Select to include pass/fail information in the details table of the report.
Include detailed results Select to include detailed results in the report.
Include plot images Select to include the plot images in the report.
Include setup configuration Sets the application to include hardware and software information in the summary box
at the top of the report. Information includes: the oscilloscope model and serial number,
the oscilloscope firmware version, and software versions for applications used in the
measurements.
Include complete application configuration Select to include the complete application configuration in the report.
Include user comments Select to include any comments about the test that you or another user have added in
the DUT tab of the Setup panel. Comments appear in the Comments section, below the
summary box at the beginning of each report.
TekExpress® M-PHY Transmitter Automated Solution Application Help 45
Page 46

View a generated report
Sample report and its contents
A report shows detailed results and plots, as set in the Reports panel.
Reports panel: Configure report generation settings
Figure 17: Report
Setup Information The summary box at the beginning of the report lists setup configuration information. This information
includes the oscilloscope model and serial number, optical module model and serial number, and software
version numbers of all associated applications.
Test Name Summary Table The test summary table lists all the tests which are executed with its result status.
Measurement The measurement table displays the measurement related details with its parameter value.
User comments If you had selected to include comments in the test report, any comments you added in the DUT tab are
shown at the top of the report.
TekExpress® M-PHY Transmitter Automated Solution Application Help 46
Page 47

Saving and recalling test setup
Saving and recalling test setup
Test setup files overview
Saved test setup information (such as the selected oscilloscope, general parameters, acquisition parameters, measurement limits,
waveforms (if applicable), and other configuration settings) are saved under the setup name at X:\TekExpress M-PHY Tx.
Use test setups to:
• Run a new session, acquire live waveforms, using a saved test configuration.
• Create a new test setup using an existing one.
• View all the information associated with a saved test, including the log file, the history of the test status as it executed, and the results
summary.
• Run a saved test using saved waveforms.
Save the configured test setup
You can save a test setup before or after running a test. You can create a test setup from already created test setup or using a default
test setup. When you save a setup, all the parameters, measurement limits, waveform files (if applicable), test selections, and other
configuration settings are saved under the setup name. When you select the default test setup, the parameters are set to the application’s
default value.
Select Options > Save Test Setup to save the opened setup.
Select Options > Save Test Setup As to save the setup with different name.
Load a saved test setup
To open (load) a saved test setup, do the following:
• Select Options > Open Test Setup.
• Select the setup from the list and click Open. Setup files are located at X:\TekExpress M-PHY Tx.
Select a pre-run session from the loaded test setup
Complete the following steps to load a test setup from a pre-run session:
1. Select Options > Open Test Setup.
2. Select a setup from the list and then click Open. Setup files are located at X:\TekExpress M-PHY Tx\.
3. Switch the mode to Pre-recorded waveform files in the DUT panel.
4. Select the required waveforms from the selected setup in the Acquisition tab and Run the required test.
TekExpress® M-PHY Transmitter Automated Solution Application Help 47
Page 48

Save the test setup with a different name
To create a test setup with a different name, follow the steps:
1. Select Options > Open Test Setup.
2. Select a setup from the list and then click Open.
3. Click application setup and modify the parameters.
4. Click application reports and modify the report options.
5. Select Options > Save Test Setup As.
6. Enter the test setup name and click Save.
Saving and recalling test setup
TekExpress® M-PHY Transmitter Automated Solution Application Help 48
Page 49

SCPI Commands
SCPI Commands
About SCPI command
You can use the Standard Commands for Programmable Instruments (SCPI) to communicate remotely with the TekExpress application.
Complete the TCPIP socket configuration and the TekVISA configuration in the oscilloscope or in the device where you are executing the
script.
Note: If you are using an external PC to execute the remote interface commands, then install TekVISA in the PC to make the
configurations.
Socket configuration for SCPI commands
This section describes the steps to configure the TCPIP socket configuration in your script execution device and the steps to configure the
TekVISA configuration in the oscilloscope to execute the SCPI commands.
TCPIP socket configuration
1. Click Start > Control Panel > System and Security > Windows Firewall > Advanced settings.
2. In Windows Firewall with Advanced Security menu, select Windows Firewall with Advanced Security on Local Computer >
Inbound Rules and click New Rule…
TekExpress® M-PHY Transmitter Automated Solution Application Help 49
Page 50

3. In New Inbound Rule Wizard menu
a. Select Port and click Next.
SCPI Commands
b. Select TCP as rule apply, enter 5000 for Specific local ports and click Next.
TekExpress® M-PHY Transmitter Automated Solution Application Help 50
Page 51

SCPI Commands
c. Select Allow the connection and click Next.
d. Select Domain, Private, Public checkbox and click Next.
TekExpress® M-PHY Transmitter Automated Solution Application Help 51
Page 52

SCPI Commands
e. Enter Name, Description (optional), and click Finish.
4. Check whether the Rule name is displayed in Windows Firewall with Advanced Security menu > Inbound Rules.
TekExpress® M-PHY Transmitter Automated Solution Application Help 52
Page 53

TekVISA configuration
1. Click Start > All Programs > TekVISA > OpenChoice Instrument Manager.
SCPI Commands
2. Click Search Criteria. In Search Criteria menu, click LAN to Turn-on. Select Socket from the drop-down list, enter the IP address of
the TekExpress device in Hostname and type Port as 5000. Click to configure the IP address with Port.
Enter the Hostname as 127.0.0.1 if the TekVISA and TekExpress application are in the same system, else enter the IP address of the
oscilloscope where the TekExpress application is running.
TekExpress® M-PHY Transmitter Automated Solution Application Help 53
Page 54

SCPI Commands
3. Click Search to setup the TCPIP connection with the host. Check whether the TCPIP host name is displayed in OpenChoice
Instrument Manager > Instruments.
4. Double-click OpenChoice Talker Listener and enter the Command *IDN? in command entry field and click Query. Check that the
Operation is successful and Talker Listener Readout displays the Command / Data.
TekExpress® M-PHY Transmitter Automated Solution Application Help 54
Page 55

SCPI Commands
TEKEXP:*IDN?
This command queries the active TekExpress application name running on the oscilloscope.
Syntax
TEKEXP:*IDN?\n
Inputs
NA
Outputs
Returns active TekExpress application name running on the oscilloscope.
TEKEXP:*OPC?
This command queries the execution status of the last executed command.
Syntax
TEKEXP:*OPC?\n
Inputs
NA
Outputs
0 - last command execution is not complete
1 - last command execution is complete
TekExpress® M-PHY Transmitter Automated Solution Application Help 55
Page 56

TEKEXP:ACQUIRE_MODE
This command sets the acquire mode as live or pre-recorded.
Syntax
TEKEXP:ACQUIRE_MODE {LIVE | PRE-RECORDED}\n
Inputs
{LIVE | PRE-RECORDED}
Outputs
NA
TEKEXP:ACQUIRE_MODE?
This command queries the acquire mode type.
Syntax
TEKEXP:ACQUIRE_MODE?\n
Inputs
SCPI Commands
NA
Outputs
{LIVE | PRE-RECORDED}
TEKEXP:EXPORT
This command returns all the bytes of data to the specified file.
Syntax Outputs
TEKEXP:EXPORT REPORT\n
TEKEXP:EXPORT WFM,"<FileName>"\n
TEKEXP:EXPORT IMAGE,"<FileName>"\n
Returns the report file in bytes
Returns the specified waveform file in bytes
Returns the specified image file in bytes
Inputs
FileName - Specifies the file name
TEKEXP:INFO?
This command queries the information about the file(s).
Syntax Outputs
TEKEXP:INFO?
REPORT\n
TEKEXP:INFO? WFM\n
TEKEXP:INFO? IMAGE\n
<ReportFileSize>,"<ReportFileName.mht>"
<WfmFile1Size>,"<WfmFileName1.wfm>";<WfmFile2Size>,"<WfmFileName2.wfm>";...
<Image1FileSize>,"<Image1FileName>";<Image2FileSize>,"<Image2FileName>" ;...
TekExpress® M-PHY Transmitter Automated Solution Application Help 56
Page 57

TEKEXP:INSTRUMENT
This command sets the value for the selected instrument type.
Syntax
TEKEXP:INSTRUMENT "<InstrumentType>",<Value>"\n
Inputs
InstrumentType
Value
Note: Check Command parameters list section for InstrumentType and Value parameters.
Outputs
NA
TEKEXP:INSTRUMENT?
This command queries the instrument selected for the specified instrument type.
SCPI Commands
Syntax
TEKEXP:INSTRUMENT? "<InstrumentType>"\n
Inputs
InstrumentType
Check Command parameters list section for InstrumentType parameters.
Note:
Outputs
Returns the instrument selected for the specified instrument type
TEKEXP:LASTERROR?
This command queries the last error string occurred for the current TCP session. If there are no errors since startup, or since the last call to
TEKEXP:LASTERROR?\n, this command returns an empty string.
Syntax
TEKEXP:LASTERROR?\n
Inputs
NA
Outputs
<string>
TEKEXP:LIST?
This command queries the list of available device, suite, test, version or instrument.
TekExpress® M-PHY Transmitter Automated Solution Application Help 57
Page 58

Syntax Outputs
TEKEXP:LIST? DEVICE\n
TEKEXP:LIST? SUITE\n
TEKEXP:LIST? TEST\n
TEKEXP:LIST? VERSION\n
TEKEXP:LIST?
INSTRUMENT,"<InstrumentType>"\n
Note: This command returns the list of items within double quotes (""). Iterate the receive procedure until the list ends with double
quotes otherwise the next query commands won’t work as expected.
Returns the list of available device(s) as comma separated values.
Returns the list of available suite(s) as comma separated values.
Returns the list of available test(s) as comma separated values.
Returns the list of available version(s) as comma separated values.
Returns the list of available instruments' for the given Instrument
type as comma separated values.
Inputs
InstrumentType
Note: Check Command parameters list section for InstrumentType parameters.
TEKEXP:MODE
SCPI Commands
This command sets the execution mode as compliance or user defined.
Syntax
TEKEXP:MODE {COMPLIANCE | USER-DEFINED}\n
Inputs
{COMPLIANCE | USER-DEFINED}
Outputs
NA
TEKEXP:MODE?
This command queries the execution mode type.
Syntax
TEKEXP:MODE?\n
Inputs
NA
Outputs
{COMPLIANCE | USER-DEFINED}
TEKEXP:POPUP
This command sets the response to the active popup shown in the application.
Syntax
TEKEXP:POPUP “<PopupResponse>”\n
TekExpress® M-PHY Transmitter Automated Solution Application Help 58
Page 59

Inputs
PopupResponse
Outputs
NA
TEKEXP:POPUP?
This command queries the active popup information shown in the application.
Syntax
TEKEXP:POPUP?\n
Inputs
NA
Outputs
Returns the active popup information in the application.
TEKEXP:REPORT
SCPI Commands
This command generates the report for the current session.
Syntax
TEKEXP:REPORT GENERATE\n
Inputs
GENERATE
Outputs
NA
TEKEXP:REPORT?
This command queries the queried header field value in the report.
Syntax
TEKEXP:REPORT? “<HeaderField>”\n
Inputs
HeaderField - Specifies to return the measured value for the indicated test.
Check Report for HeaderField parameters.
Note:
Outputs
Returns the queried header field value in the report
TEKEXP:RESULT?
This command queries the result available in report summary/details table.
TekExpress® M-PHY Transmitter Automated Solution Application Help 59
Page 60

Syntax Outputs
TEKEXP:RESULT? "<TestName>"\n
TEKEXP:RESULT?
"<TestName>","<ColumnName>"\n
TEKEXP:RESULT?
"<TestName>","<ColumnName>",<RowNumber
>\n
Return Pass/Fail status of the test.
Returns all the row values of the specified column for the test.
Returns the column value for the specified row number
Inputs
TestName - Specifies the name of the test for which to obtain the test result value.
ColumnName - Specifies the column name for the measurement
RowNumber - Specifies the row number of the measurement
Note: Check Results panel for TestName, ColumnName, and RowNumber parameters.
SCPI Commands
TEKEXP:SELECT
This command selects the device, suite, version, or test.
Syntax
TEKEXP:SELECT <string1>,<string2>,<string4>\n
TEKEXP:SELECT TEST,<string3>,<string4>\n
Inputs
<string1> = {DEVICE | SUITE | VERSION}
<string2> = {DeviceName | SuiteName | VersionName}
<string3> = {“<TestName>"| ALL| REQUIRED }
<string4> = {TRUE | FALSE}
Check Command parameters list section for DeviceName, SuiteName, VersionName, and TestName parameters.
Note:
Outputs
NA
TEKEXP:SELECT?
This command queries the name of the selected device, suite, version, or test.
Syntax
TEKEXP:SELECT? {DEVICE | SUITE | TEST | VERSION}\n
Inputs
{DEVICE | SUITE | TEST | VERSION}
TekExpress® M-PHY Transmitter Automated Solution Application Help 60
Page 61

Outputs
Returns the name of the selected device, suite, version, or test.
TEKEXP:SETUP
This command sets the value of the current setup.
Syntax Outputs
TEKEXP:SETUP DEFAULT\n
Restore to default Setup
SCPI Commands
TEKEXP:SETUP OPEN,"<SessionName>"\n
TEKEXP:SETUP SAVE\n
TEKEXP:SETUP SAVE,"<SessionName>"\n
Open the session
Saves the already existing modified session
Save the session
Inputs
SessionName - The name of the session
TEKEXP:STATE
This command sets the execution state of the application.
Syntax
TEKEXP:STATE {RUN | STOP | PAUSE | RESUME}\n
Inputs
{RUN | STOP | PAUSE | RESUME}
Outputs
NA
TEKEXP:STATE?
This command queries the current setup state.
Syntax Outputs
TEKEXP:STATE?
TEKEXP:STATE? SETUP
RUNNING | PAUSED | WAIT | ERROR | READY
SAVED | NOT_SAVED
TEKEXP:VALUE
This command sets the value of parameters of type General, Acquire, Analyze, or DUTID.
Syntax
TEKEXP:VALUE GENERAL,"<ParameterName>",“<Value>”\n
TEKEXP:VALUE ACQUIRE,“<TestName>","<AcquireType>", "<ParameterName>",“<Value>”\n
TEKEXP:VALUE ANALYZE,“<TestName>","<ParameterName>".“<Value>”\n
TekExpress® M-PHY Transmitter Automated Solution Application Help 61
Page 62

TEKEXP:VALUE DUTID,“<Value>”\n
TEKEXP:VALUE VERBOSE,{TRUE | FALSE}\n
TEKEXP:VALUE WFMFILE,<Test_Name>,<Aquire_Type>,<FilesName1$FileName2>\n
Inputs
ParameterName - Specifies the parameter name
TestName - Specifies the test name
AcquireType - Specifies the acquire type
Value - Specifes the value to set
FilesName1$FileName2 - Specifies the waveform file name
TRUE - Pop-ups are enabled
FALSE - Pop-ups are disabled
Note: Check Command parameters list section for ParameterName, AcquireType, and Value parameters.
Outputs
SCPI Commands
NA
TEKEXP:VALUE?
This command queries the value of the parameter for type General, Acquire, Analyze, or DUTID.
Syntax Outputs
TEKEXP:VALUE? GENERAL,"<ParameterName>"\n
TEKEXP:VALUE? ACQUIRE,“<TestName>",
"<AcquireType>","<ParameterName>"\n
TEKEXP:VALUE? ANALYZE,
“<TestName>","<ParameterName>"\n
TEKEXP:VALUE? DUTID\n
TEKEXP:VALUE?
WFMFILE,<Test_Name>,<Aquire_Type>\n
TEKEXP:VALUE? VERBOSE
Inputs
ParameterName - Specifies the parameter name
TestName - Specifies the test name
Returns the value of Parameter for type GENERAL
Returns the value of Parameter for type ACQUIRE
Returns the value of Parameter for type ANALYZE
Returns the DUTID value
Returns the waveform file name
Returns the verbose mode type
AcquireType - Specifies the acquire type
TRUE - Pop-ups are enabled
FALSE - Pop-ups are disabled
Check Command parameters list section for ParameterName and AcquireType parameters.
Note:
TekExpress® M-PHY Transmitter Automated Solution Application Help 62
Page 63

Outputs
Returns the value of Parameter for type GENERAL | ACQUIRE | ANALYZE | DUTID.
Test Name
Test Names for HS
Example to Select a Test TEKEXP:SELECT TEST,"Test 1.1.1-HS-TX Unit Interval and Frequency Offset",True
Example to check Test selection status TEKEXP:SELECT? TEST,"Test 1.1.1-HS-TX Unit Interval and Frequency Offset"
Example to Deselect a Test TEKEXP:SELECT TEST,"Test 1.1.1-HS-TX Unit Interval and Frequency Offset",False
Test Name
Test 1.1.1-HS-TX Unit Interval and Frequency Offset
Test 1.1.2-HS-TX Common-Mode AC Power Spectral Magnitude Limit
Test 1.1.3-HS-TX PREPARE Length
Test 1.1.4-HS-TX Common Mode DC Output Voltage Amplitude
Test 1.1.5-HS-TX Differential DC Output Voltage Amplitude
Test 1.1.6-HS-TX G1 and G2 Differential AC Eye
Test 1.1.7-HS-TX G3, G4 and G5 Differential AC Eye
Test 1.1.8-HS-TX 20-80% Rise and Fall Times
Test 1.1.9-HS-TX Lane-Lane Output Skew
Test 1.1.10-HS-TX Slew Rate Control Range
Test 1.1.11-HS-TX Slew Rate Monotonicity
Test 1.1.12-HS-TX Slew Rate Resolution
Test 1.1.13-HS-TX Intra-Lane Output Skew
Test 1.1.14-HS-TX Transmitter Pulse Width
Test 1.1.15-HS-TX Total Jitter
Test 1.1.16-HS-TX Short-Term Total Jitter
Test 1.1.17-HS-TX Deterministic Jitter
Test 1.1.18-HS-TX Short term Deterministic Jitter
BER Eye Contour
SCPI Commands
Test Names for SYS
Example to Select a Test TEKEXP:SELECT TEST,"Test 1.3.1-SYS-TX Unit Interval and Frequency Offset",True
Example to check Test selection status TEKEXP:SELECT? TEST,"Test 1.3.1-SYS-TX Unit Interval and Frequency Offset"
Example to Deselect a Test TEKEXP:SELECT TEST,"Test 1.3.1-SYS-TX Unit Interval and Frequency Offset",False
Test Name
Test 1.3.1-SYS-TX Unit Interval and Frequency Offset
Test 1.3.2-SYS-TX Ref Clock frequency
Test 1.3.3-SYS-TX PREPARE Length
Table continued…
TekExpress® M-PHY Transmitter Automated Solution Application Help 63
Page 64

Test Name
Test 1.3.4-SYS-TX Common Mode DC Output Voltage Amplitude
Test 1.3.5-SYS-TX Differential DC Output Voltage Amplitude
Test 1.3.7-SYS-TX Maximum Diffrential AC Output Voltage Amplitude
Test 1.3.8-SYS-TX 20-80% Rise and Fall Times
Test 1.3.9-SYS-TX Lane-Lane Output Skew
Test Names for PWM
Example to Select a Test TEKEXP:SELECT TEST,"Test 1.2.1-PWM-TX Transmit Bit Duration",True
Example to check Test selection status TEKEXP:SELECT? TEST,"Test 1.2.1-PWM-TX Transmit Bit Duration"
Example to Deselect a Test TEKEXP:SELECT TEST,"Test 1.2.1-PWM-TX Transmit Bit Duration",False
Test Name
Test 1.2.1-PWM-TX Transmit Bit Duration
Test 1.2.2-PWM-TX Transmit Ratio
Test 1.2.3-PWM-TX PREPARE Length
Test 1.2.4-PWM-TX Common Mode DC Output Voltage Amplitude
Test 1.2.5-PWM-TX Differential DC Output Voltage Amplitude
Test 1.2.7-PWM-TX Maximum Differential AC Output Voltage Amplitude
Test 1.2.8-PWM-TX 2080 Rise and Fall Times
Test 1.2.9-PWM-TX Lane-Lane Output Skew
Test 1.2.10-PWM-TX Transmit Bit Duration Tolerance
Test 1.2.11-PWM-TX G0 Minor Duration
SCPI Commands
Test Names for UFS4 Ref Clock
Example to Select a Test TEKEXP:SELECT TEST,"Frequency",True
Example to check Test selection status TEKEXP:SELECT? TEST,"Frequency"
Example to Deselect a Test TEKEXP:SELECT TEST,"Frequency",False
Test Name
Frequency
Frequency Error
Input High Voltage
Input Low Voltage
Input Clock Rise Time
Input Clock Fall Time
Duty Cycle
Random Jitter
Deterministic Jitter
TekExpress® M-PHY Transmitter Automated Solution Application Help 64
Page 65

SCPI Commands
Command Parameters with Examples
This section provides the parameters list for the SCPI commands.
General Parameters:
Parameter Names Example to set Example to query
DeskewAlertEnabled TEKEXP:VALUE
GENERAL,"DeskewAlertEnabled","True"
Report Update Mode TEKEXP:VALUE GENERAL,"Report Update
Mode","New"
Appviewmode TEKEXP:VALUE
GENERAL,"Appviewmode","Compliance"
Report Generation
Template Path
Report Settings:Column
Template
Create report at the end TEKEXP:VALUE GENERAL,"Create report at the
ComplianceMode TEKEXP:VALUE
Validate TEKEXP:VALUE GENERAL,"Validate","Default" TEKEXP:VALUE? GENERAL,"Validate"
Trace Variable TEKEXP:VALUE GENERAL,"Trace Variable","YES" TEKEXP:VALUE? GENERAL,"Trace Variable"
HS System Clock TEKEXP:VALUE GENERAL,"HS System
Probing Type TEKEXP:VALUE GENERAL,"Probing Type","Single-
DUT Type TEKEXP:VALUE GENERAL,"DUT Type","Type1" TEKEXP:VALUE? GENERAL,"DUT Type"
DUT Tracing TEKEXP:VALUE GENERAL,"DUT
RF Switch TEKEXP:VALUE GENERAL,"RF Switch","Excluded" TEKEXP:VALUE? GENERAL,"RF Switch"
Tek Fixture TEKEXP:VALUE GENERAL,"Tek Fixture","Excluded" TEKEXP:VALUE? GENERAL,"Tek Fixture"
Acquire Only TEKEXP:VALUE GENERAL,"Acquire Only","False" TEKEXP:VALUE? GENERAL,"Acquire Only"
Delete Waveforms TEKEXP:VALUE GENERAL,"Delete
Scope Bandwidth TEKEXP:VALUE GENERAL,"Scope Bandwidth","330" TEKEXP:VALUE? GENERAL,"Scope Bandwidth"
DUT Tracing Filter Path TEKEXP:VALUE GENERAL,"DUT Tracing Filter
RF Switch Filter Path TEKEXP:VALUE GENERAL,"RF Switch Filter
Table continued…
TEKEXP:VALUE GENERAL,"Report Generation
Template Path","INSTALL FOLDER\Report
Generator\TekExpress_Template_GroupByTestName.
xsl"
TEKEXP:VALUE GENERAL,"Report
Settings:Column Template","INSTALL
FOLDER\Report Generator\MPHYTXTekExpress_ReportColumnTemplate_MultiLane.xml"
end","True"
GENERAL,"ComplianceMode","True"
Clock","26MHz"
ended"
Tracing","Excluded"
Waveforms","False"
Path","<Path to the filter file *.flt>"
Path","<Path to the filter file *.flt>"
TEKEXP:VALUE? GENERAL,"DeskewAlertEnabled"
TEKEXP:VALUE? GENERAL,"Report Update Mode"
TEKEXP:VALUE? GENERAL,"Appviewmode"
TEKEXP:VALUE? GENERAL,"Report Generation
Template Path"
TEKEXP:VALUE? GENERAL,"Report
Settings:Column Template"
TEKEXP:VALUE? GENERAL,"Create report at the
end"
TEKEXP:VALUE? GENERAL,"ComplianceMode"
TEKEXP:VALUE? GENERAL,"HS System Clock"
TEKEXP:VALUE? GENERAL,"Probing Type"
TEKEXP:VALUE? GENERAL,"DUT Tracing"
TEKEXP:VALUE? GENERAL,"Delete Waveforms"
TEKEXP:VALUE? GENERAL,"DUT Tracing Filter
Path"
TEKEXP:VALUE? GENERAL,"RF Switch Filter Path"
TekExpress® M-PHY Transmitter Automated Solution Application Help 65
Page 66

SCPI Commands
Parameter Names Example to set Example to query
Tek Fixture Filter Path TEKEXP:VALUE GENERAL,"Tek Fixture Filter
Path","<Path to the filter file *.flt>"
Lane0 TEKEXP:VALUE GENERAL,"Lane0","Included" TEKEXP:VALUE? GENERAL,"Lane0"
Lane1 TEKEXP:VALUE GENERAL,"Lane1","Excluded" TEKEXP:VALUE? GENERAL,"Lane1"
Lane2 TEKEXP:VALUE GENERAL,"Lane2","Excluded" TEKEXP:VALUE? GENERAL,"Lane2"
Lane3 TEKEXP:VALUE GENERAL,"Lane3","Excluded" TEKEXP:VALUE? GENERAL,"Lane3"
Lane4 TEKEXP:VALUE GENERAL,"Lane4","Excluded" TEKEXP:VALUE? GENERAL,"Lane4"
Lane5 TEKEXP:VALUE GENERAL,"Lane5","Excluded" TEKEXP:VALUE? GENERAL,"Lane5"
Lane6 TEKEXP:VALUE GENERAL,"Lane6","Excluded" TEKEXP:VALUE? GENERAL,"Lane6"
Lane7 TEKEXP:VALUE GENERAL,"Lane7","Excluded" TEKEXP:VALUE? GENERAL,"Lane7"
DUT Operation Mode TEKEXP:VALUE GENERAL,"DUT Operation
Mode","Burst"
CRPAT TEKEXP:VALUE GENERAL,"CRPAT","Included" TEKEXP:VALUE? GENERAL,"CRPAT"
Termination TEKEXP:VALUE
GENERAL,"Termination","Terminated"
Acquire-Analyze
Sequence
Gear1 TEKEXP:VALUE GENERAL,"Gear1","Included" TEKEXP:VALUE? GENERAL,"Gear1"
HS Gear1A TEKEXP:VALUE GENERAL,"HS Gear1A","Included" TEKEXP:VALUE? GENERAL,"HS Gear1A"
HS Gear2A TEKEXP:VALUE GENERAL,"HS Gear2A","Excluded" TEKEXP:VALUE? GENERAL,"HS Gear2A"
HS Gear3A TEKEXP:VALUE GENERAL,"HS Gear3A","Excluded" TEKEXP:VALUE? GENERAL,"HS Gear3A"
HS Gear1B TEKEXP:VALUE GENERAL,"HS Gear1B","Excluded" TEKEXP:VALUE? GENERAL,"HS Gear1B"
HS Gear2B TEKEXP:VALUE GENERAL,"HS Gear2B","Excluded" TEKEXP:VALUE? GENERAL,"HS Gear2B"
HS Gear3B TEKEXP:VALUE GENERAL,"HS Gear3B","Excluded" TEKEXP:VALUE? GENERAL,"HS Gear3B"
HS Gear4A TEKEXP:VALUE GENERAL,"HS Gear4A","Excluded" TEKEXP:VALUE? GENERAL,"HS Gear4A"
HS Gear4B TEKEXP:VALUE GENERAL,"HS Gear4B","Excluded" TEKEXP:VALUE? GENERAL,"HS Gear4B"
HS Gear5A TEKEXP:VALUE GENERAL,"HS Gear5A","Excluded" TEKEXP:VALUE? GENERAL,"HS Gear5A"
HS Gear5B TEKEXP:VALUE GENERAL,"HS Gear5B","Excluded" TEKEXP:VALUE? GENERAL,"HS Gear5B"
Amplitude TEKEXP:VALUE GENERAL,"Amplitude","Large
Number of slew rates TEKEXP:VALUE GENERAL,"Number of slew
DUT control TEKEXP:VALUE GENERAL,"DUT control","Manual" TEKEXP:VALUE? GENERAL,"DUT control"
Signal Validation TEKEXP:VALUE GENERAL,"Signal
Email when test setup
change is needed
On Failure Stop and
Notify
Table continued…
TEKEXP:VALUE GENERAL,"Acquire-Analyze
Sequence","Save All Waveform Before Analysis"
Amplitude"
rates","4"
Validation","Prompt me if signal fails"
TEKEXP:VALUE GENERAL,"Email when test setup
change is needed","False"
TEKEXP:VALUE GENERAL,"On Failure Stop and
Notify","False"
TEKEXP:VALUE? GENERAL,"Tek Fixture Filter Path"
TEKEXP:VALUE? GENERAL,"DUT Operation Mode"
TEKEXP:VALUE? GENERAL,"Termination"
TEKEXP:VALUE? GENERAL,"Acquire-Analyze
Sequence"
TEKEXP:VALUE? GENERAL,"Amplitude"
TEKEXP:VALUE? GENERAL,"Number of slew rates"
TEKEXP:VALUE? GENERAL,"Signal Validation"
TEKEXP:VALUE? GENERAL,"Email when test setup
change is needed"
TEKEXP:VALUE? GENERAL,"On Failure Stop and
Notify"
TekExpress® M-PHY Transmitter Automated Solution Application Help 66
Page 67

Parameter Names Example to set Example to query
Lane0 Connected
to:Lane0:Differential
Lane0 Connected
to:Lane0+: Single Ended
Lane0 Connected
to:Lane0-: Single Ended
Lane1 Connected
to:Lane1:Differential
Lane1 Connected
to:Lane1+: Single Ended
Lane1 Connected
to:Lane1-: Single Ended
Lane2 Connected
to:Lane2:Differential
Lane2 Connected
to:Lane2+: Single Ended
Lane2 Connected
to:Lane2-: Single Ended
Lane3 Connected
to:Lane3:Differential
Lane3 Connected
to:Lane3+: Single Ended
Lane3 Connected
to:Lane3-: Single Ended
Lane4 Connected
to:Lane4:Differential
Lane4 Connected
to:Lane4+: Single Ended
Lane4 Connected
to:Lane4-: Single Ended
Lane5 Connected
to:Lane5:Differential
Lane5 Connected
to:Lane5-: Single Ended
Lane6 Connected
to:Lane6:Differential
Lane6 Connected
to:Lane6+: Single Ended
Lane6 Connected
to:Lane6-: Single Ended
Lane7 Connected
to:Lane7:Differential
Table continued…
TEKEXP:VALUE GENERAL,"Lane0 Connected
to:Lane0:Differential","CH1"
TEKEXP:VALUE GENERAL,"Lane0 Connected
to:Lane0+: Single Ended","CH1"
TEKEXP:VALUE GENERAL,"Lane0 Connected
to:Lane0-: Single Ended","CH3"
TEKEXP:VALUE GENERAL,"Lane1 Connected
to:Lane1:Differential","CH2"
TEKEXP:VALUE GENERAL,"Lane1 Connected
to:Lane1+: Single Ended","CH2"
TEKEXP:VALUE GENERAL,"Lane1 Connected
to:Lane1-: Single Ended","CH4"
TEKEXP:VALUE GENERAL,"Lane2 Connected
to:Lane2:Differential","CH3"
TEKEXP:VALUE GENERAL,"Lane2 Connected
to:Lane2+: Single Ended","CH1"
TEKEXP:VALUE GENERAL,"Lane2 Connected
to:Lane2-: Single Ended","CH3"
TEKEXP:VALUE GENERAL,"Lane3 Connected
to:Lane3:Differential","CH4"
TEKEXP:VALUE GENERAL,"Lane3 Connected
to:Lane3+: Single Ended","CH2"
TEKEXP:VALUE GENERAL,"Lane3 Connected
to:Lane3-: Single Ended","CH4"
TEKEXP:VALUE GENERAL,"Lane4 Connected
to:Lane4:Differential","CH1"
TEKEXP:VALUE GENERAL,"Lane4 Connected
to:Lane4+: Single Ended","CH1"
TEKEXP:VALUE GENERAL,"Lane4 Connected
to:Lane4-: Single Ended","CH3"
TEKEXP:VALUE GENERAL,"Lane5 Connected
to:Lane5:Differential","CH2"
TEKEXP:VALUE GENERAL,"Lane5 Connected
to:Lane5-: Single Ended","CH4"
TEKEXP:VALUE GENERAL,"Lane6 Connected
to:Lane6:Differential","CH3"
TEKEXP:VALUE GENERAL,"Lane6 Connected
to:Lane6+: Single Ended","CH1"
TEKEXP:VALUE GENERAL,"Lane6 Connected
to:Lane6-: Single Ended","CH3"
TEKEXP:VALUE GENERAL,"Lane7 Connected
to:Lane7:Differential","CH4"
TEKEXP:VALUE? GENERAL,"Lane0 Connected
to:Lane0:Differential"
TEKEXP:VALUE? GENERAL,"Lane0 Connected
to:Lane0+: Single Ended"
TEKEXP:VALUE? GENERAL,"Lane0 Connected
to:Lane0-: Single Ended"
TEKEXP:VALUE? GENERAL,"Lane1 Connected
to:Lane1:Differential"
TEKEXP:VALUE? GENERAL,"Lane1 Connected
to:Lane1+: Single Ended"
TEKEXP:VALUE? GENERAL,"Lane1 Connected
to:Lane1-: Single Ended"
TEKEXP:VALUE? GENERAL,"Lane2 Connected
to:Lane2:Differential"
TEKEXP:VALUE? GENERAL,"Lane2 Connected
to:Lane2+: Single Ended"
TEKEXP:VALUE? GENERAL,"Lane2 Connected
to:Lane2-: Single Ended"
TEKEXP:VALUE? GENERAL,"Lane3 Connected
to:Lane3:Differential"
TEKEXP:VALUE? GENERAL,"Lane3 Connected
to:Lane3+: Single Ended"
TEKEXP:VALUE? GENERAL,"Lane3 Connected
to:Lane3-: Single Ended"
TEKEXP:VALUE? GENERAL,"Lane4 Connected
to:Lane4:Differential"
TEKEXP:VALUE? GENERAL,"Lane4 Connected
to:Lane4+: Single Ended"
TEKEXP:VALUE? GENERAL,"Lane4 Connected
to:Lane4-: Single Ended"
TEKEXP:VALUE? GENERAL,"Lane5 Connected
to:Lane5:Differential"
TEKEXP:VALUE? GENERAL,"Lane5 Connected
to:Lane5-: Single Ended"
TEKEXP:VALUE? GENERAL,"Lane6 Connected
to:Lane6:Differential"
TEKEXP:VALUE? GENERAL,"Lane6 Connected
to:Lane6+: Single Ended"
TEKEXP:VALUE? GENERAL,"Lane6 Connected
to:Lane6-: Single Ended"
TEKEXP:VALUE? GENERAL,"Lane7 Connected
to:Lane7:Differential"
SCPI Commands
TekExpress® M-PHY Transmitter Automated Solution Application Help 67
Page 68

SCPI Commands
Parameter Names Example to set Example to query
Lane7 Connected
to:Lane7+: Single Ended
Lane7 Connected
to:Lane7-: Single Ended
Auto increment report
name if duplicate
Include Pass/Fail Results
Summary
Include Detailed Results TEKEXP:VALUE GENERAL,"Include Detailed
Report Settings:Include
Header In Appended
Reports
Include Plot Images TEKEXP:VALUE GENERAL,"Include Plot
Include Setup
Configuration
Include Complete
Application Configuration
Include User Comments TEKEXP:VALUE GENERAL,"Include User
Save As Type TEKEXP:VALUE GENERAL,"Save As Type","Web
View Report After
Generating
Report Path TEKEXP:VALUE GENERAL,"Report Path","X:\M-PHY
DUTID Comment TEKEXP:VALUE GENERAL,"DUTID
Link Widths TEKEXP:VALUE GENERAL,"Link Widths","1 Lane" TEKEXP:VALUE? GENERAL,"Link Widths"
Vterm Source TEKEXP:VALUE GENERAL,"Vterm Source","Auto" TEKEXP:VALUE? GENERAL,"Vterm Source"
Vterm Source (Vt) TEKEXP:VALUE GENERAL,"Vterm Source (Vt)","0" TEKEXP:VALUE? GENERAL,"Vterm Source (Vt)"
Acquisition Save Options TEKEXP:VALUE GENERAL,"Acquisition Save
PreRecorded Mode TEKEXP:VALUE GENERAL,"PreRecorded
View Probes TEKEXP:VALUE GENERAL,"View Probes","False" TEKEXP:VALUE? GENERAL,"View Probes"
Gear1 Pos Mask File Path TEKEXP:VALUE GENERAL,"Gear1 Pos Mask File
Table continued…
TEKEXP:VALUE GENERAL,"Lane7 Connected
to:Lane7+: Single Ended","CH2"
TEKEXP:VALUE GENERAL,"Lane7 Connected
to:Lane7-: Single Ended","CH4"
TEKEXP:VALUE GENERAL,"Auto increment report
name if duplicate","True"
TEKEXP:VALUE GENERAL,"Include Pass/Fail
Results Summary","True"
Results","True"
TEKEXP:VALUE GENERAL,"Report Settings:Include
Header In Appended Reports","False"
Images","True"
TEKEXP:VALUE GENERAL,"Include Setup
Configuration","True"
TEKEXP:VALUE GENERAL,"Include Complete
Application Configuration","False"
Comments","True"
Archive (*.mht;*.mhtml)"
TEKEXP:VALUE GENERAL,"View Report After
Generating","True"
Tx\Reports\DUT001.mht"
Comment","SomeText"
Options","Save and Analyze Acquisitions In
Sequence"
Mode","False"
Path","INSTALL FOLDER\Lib\Filter Files\P7520A
Gear1\SE Mode\Gear1_ch1.flt"
TEKEXP:VALUE? GENERAL,"Lane7 Connected
to:Lane7+: Single Ended"
TEKEXP:VALUE? GENERAL,"Lane7 Connected
to:Lane7-: Single Ended"
TEKEXP:VALUE? GENERAL,"Auto increment report
name if duplicate"
TEKEXP:VALUE? GENERAL,"Include Pass/Fail
Results Summary"
TEKEXP:VALUE? GENERAL,"Include Detailed
Results"
TEKEXP:VALUE? GENERAL,"Report
Settings:Include Header In Appended Reports"
TEKEXP:VALUE? GENERAL,"Include Plot Images"
TEKEXP:VALUE? GENERAL,"Include Setup
Configuration"
TEKEXP:VALUE? GENERAL,"Include Complete
Application Configuration"
TEKEXP:VALUE? GENERAL,"Include User
Comments"
TEKEXP:VALUE? GENERAL,"Save As Type"
TEKEXP:VALUE? GENERAL,"View Report After
Generating"
TEKEXP:VALUE? GENERAL,"Report Path"
TEKEXP:VALUE? GENERAL,"DUTID Comment"
TEKEXP:VALUE? GENERAL,"Acquisition Save
Options"
TEKEXP:VALUE? GENERAL,"PreRecorded Mode"
TEKEXP:VALUE? GENERAL,"Gear1 Pos Mask File
Path"
TekExpress® M-PHY Transmitter Automated Solution Application Help 68
Page 69

Parameter Names Example to set Example to query
Gear1 Neg Mask File
Path
Gear2 Pos Mask File Path TEKEXP:VALUE GENERAL,"Gear2 Pos Mask File
Gear2 Neg Mask File
Path
Gear3 Pos Mask File Path TEKEXP:VALUE GENERAL,"Gear3 Pos Mask File
Gear3 Neg Mask File
Path
Gear1 Diff Mask File Path TEKEXP:VALUE GENERAL,"Gear1 Diff Mask File
Gear2 Diff Mask File Path TEKEXP:VALUE GENERAL,"Gear2 Diff Mask File
Gear3 Diff Mask File Path TEKEXP:VALUE GENERAL,"Gear3 Diff Mask File
Gear0 TEKEXP:VALUE GENERAL,"Gear0","Included" TEKEXP:VALUE? GENERAL,"Gear0"
Gear5 TEKEXP:VALUE GENERAL,"Gear5","Excluded" TEKEXP:VALUE? GENERAL,"Gear5"
Gear6 TEKEXP:VALUE GENERAL,"Gear6","Excluded" TEKEXP:VALUE? GENERAL,"Gear6"
Gear7 TEKEXP:VALUE GENERAL,"Gear7","Excluded" TEKEXP:VALUE? GENERAL,"Gear7"
Gear0 Sample rate TEKEXP:VALUE GENERAL,"Gear0 Sample
Gear1 Sample rate TEKEXP:VALUE GENERAL,"Gear1 Sample
Gear2 Sample rate TEKEXP:VALUE GENERAL,"Gear2 Sample
Gear3 Sample rate TEKEXP:VALUE GENERAL,"Gear3 Sample
Gear4 Sample rate TEKEXP:VALUE GENERAL,"Gear4 Sample
Gear5 Sample rate TEKEXP:VALUE GENERAL,"Gear5 Sample
Gear6 Sample rate TEKEXP:VALUE GENERAL,"Gear6 Sample
Gear7 Sample rate TEKEXP:VALUE GENERAL,"Gear7 Sample
Table continued…
TEKEXP:VALUE GENERAL,"Gear1 Neg Mask File
Path","INSTALL FOLDER\Lib\Filter Files\P7520A
Gear1\SE Mode\Gear1_ch2.flt"
Path","INSTALL FOLDER\Lib\Filter Files\P7520A
Gear2\SE Mode\Gear2_ch1.flt"
TEKEXP:VALUE GENERAL,"Gear2 Neg Mask File
Path","INSTALL FOLDER\Lib\Filter Files\P7520A
Gear2\SE Mode\Gear2_ch2.flt"
Path","INSTALL FOLDER\Lib\Filter Files\P7520A
Gear3\SE Mode\Gear3_ch1.flt"
TEKEXP:VALUE GENERAL,"Gear3 Neg Mask File
Path","INSTALL FOLDER\Lib\Filter Files\P7520A
Gear3\SE Mode\Gear3_ch2.flt"
Path","INSTALL FOLDER\Lib\Filter Files\P7520A
Gear1\Diff Mode\Gear1_diff.flt"
Path","INSTALL FOLDER\Lib\Filter Files\P7520A
Gear2\Diff Mode\Gear2_diff.flt"
Path","INSTALL FOLDER\Lib\Filter Files\P7520A
Gear3\Diff Mode\Gear3_diff.flt"
rate","0.25"
rate","0.25"
rate","0.25"
rate","0.625"
rate","0.625"
rate","1.25"
rate","1.25"
rate","3.5"
TEKEXP:VALUE? GENERAL,"Gear1 Neg Mask File
Path"
TEKEXP:VALUE? GENERAL,"Gear2 Pos Mask File
Path"
TEKEXP:VALUE? GENERAL,"Gear2 Neg Mask File
Path"
TEKEXP:VALUE? GENERAL,"Gear3 Pos Mask File
Path"
TEKEXP:VALUE? GENERAL,"Gear3 Neg Mask File
Path"
TEKEXP:VALUE? GENERAL,"Gear1 Diff Mask File
Path"
TEKEXP:VALUE? GENERAL,"Gear2 Diff Mask File
Path"
TEKEXP:VALUE? GENERAL,"Gear3 Diff Mask File
Path"
TEKEXP:VALUE? GENERAL,"Gear0 Sample rate"
TEKEXP:VALUE? GENERAL,"Gear1 Sample rate"
TEKEXP:VALUE? GENERAL,"Gear2 Sample rate"
TEKEXP:VALUE? GENERAL,"Gear3 Sample rate"
TEKEXP:VALUE? GENERAL,"Gear4 Sample rate"
TEKEXP:VALUE? GENERAL,"Gear5 Sample rate"
TEKEXP:VALUE? GENERAL,"Gear6 Sample rate"
TEKEXP:VALUE? GENERAL,"Gear7 Sample rate"
SCPI Commands
TekExpress® M-PHY Transmitter Automated Solution Application Help 69
Page 70

SCPI Commands
Parameter Names Example to set Example to query
Gear0 Horizontal Scale
(us/div)
Gear1 Horizontal Scale
(us/div)
Gear2 Horizontal Scale
(us/div)
Gear3 Horizontal Scale
(us/div)
Gear4 Horizontal Scale
(us/div)
Gear5 Horizontal Scale
(us/div)
Gear6 Horizontal Scale
(us/div)
Gear7 Horizontal Scale
(us/div)
Lane5 Connected
to:Lane5+: Single Ended
Number of retries for
signal acquisition
Clock Lane TEKEXP:VALUE GENERAL,"Clock Lane","CH1" TEKEXP:VALUE? GENERAL,"Clock Lane"
Clock Source TEKEXP:VALUE GENERAL,"Clock
SYS 19.2MHz TEKEXP:VALUE GENERAL,"SYS
SYS 26MHz TEKEXP:VALUE GENERAL,"SYS 26MHz","Included" TEKEXP:VALUE? GENERAL,"SYS 26MHz"
SYS 38.4MHz TEKEXP:VALUE GENERAL,"SYS
SYS 52MHz TEKEXP:VALUE GENERAL,"SYS 52MHz","Excluded" TEKEXP:VALUE? GENERAL,"SYS 52MHz"
Automate with RF Switch TEKEXP:VALUE GENERAL,"Automate with RF
DUT Tracing Terminated TEKEXP:VALUE GENERAL,"DUT Tracing
RF Switch Terminated TEKEXP:VALUE GENERAL,"RF Switch
Tek Fixture Terminated TEKEXP:VALUE GENERAL,"Tek Fixture
DUT Tracing
Unterminated
RF Switch Unterminated TEKEXP:VALUE GENERAL,"RF Switch
Table continued…
TEKEXP:VALUE GENERAL,"Gear0 Horizontal Scale
(us/div)","2000"
TEKEXP:VALUE GENERAL,"Gear1 Horizontal Scale
(us/div)","2000"
TEKEXP:VALUE GENERAL,"Gear2 Horizontal Scale
(us/div)","2000"
TEKEXP:VALUE GENERAL,"Gear3 Horizontal Scale
(us/div)","800"
TEKEXP:VALUE GENERAL,"Gear4 Horizontal Scale
(us/div)","800"
TEKEXP:VALUE GENERAL,"Gear5 Horizontal Scale
(us/div)","160"
TEKEXP:VALUE GENERAL,"Gear6 Horizontal Scale
(us/div)","160"
TEKEXP:VALUE GENERAL,"Gear7 Horizontal Scale
(us/div)","64"
TEKEXP:VALUE GENERAL,"Lane5 Connected
to:Lane5+: Single Ended","CH3"
TEKEXP:VALUE GENERAL,"Number of retries for
signal acquisition","3"
Source","External"
19.2MHz","Excluded"
38.4MHz","Excluded"
Switch","False"
Terminated","Included"
Terminated","Excluded"
Terminated","Excluded"
TEKEXP:VALUE GENERAL,"DUT Tracing
Unterminated","Excluded"
Unterminated","Excluded"
TEKEXP:VALUE? GENERAL,"Gear0 Horizontal Scale
(us/div)"
TEKEXP:VALUE? GENERAL,"Gear1 Horizontal Scale
(us/div)"
TEKEXP:VALUE? GENERAL,"Gear2 Horizontal Scale
(us/div)"
TEKEXP:VALUE? GENERAL,"Gear3 Horizontal Scale
(us/div)"
TEKEXP:VALUE? GENERAL,"Gear4 Horizontal Scale
(us/div)"
TEKEXP:VALUE? GENERAL,"Gear5 Horizontal Scale
(us/div)"
TEKEXP:VALUE? GENERAL,"Gear6 Horizontal Scale
(us/div)"
TEKEXP:VALUE? GENERAL,"Gear7 Horizontal Scale
(us/div)"
TEKEXP:VALUE? GENERAL,"Lane5 Connected
to:Lane5+: Single Ended"
TEKEXP:VALUE? GENERAL,"Number of retries for
signal acquisition"
TEKEXP:VALUE? GENERAL,"Clock Source"
TEKEXP:VALUE? GENERAL,"SYS 19.2MHz"
TEKEXP:VALUE? GENERAL,"SYS 38.4MHz"
TEKEXP:VALUE? GENERAL,"Automate with RF
Switch"
TEKEXP:VALUE? GENERAL,"DUT Tracing
Terminated"
TEKEXP:VALUE? GENERAL,"RF Switch Terminated"
TEKEXP:VALUE? GENERAL,"Tek Fixture
Terminated"
TEKEXP:VALUE? GENERAL,"DUT Tracing
Unterminated"
TEKEXP:VALUE? GENERAL,"RF Switch
Unterminated"
TekExpress® M-PHY Transmitter Automated Solution Application Help 70
Page 71

SCPI Commands
Parameter Names Example to set Example to query
Tek Fixture Unterminated TEKEXP:VALUE GENERAL,"Tek Fixture
Unterminated","Excluded"
DUT Tracing Filter Path
Terminated
RF Switch Filter Path
Terminated
Tek Fixture Filter Path
Terminated
DUT Tracing Filter Path
Unterminated
RF Switch Filter Path
Unterminated
Tek Fixture Filter Path
Unterminated
Clock Connected
to:Clock:Differential
Clock Connected
to:Clock+: Single Ended
Clock Connected
to:Clock-: Single Ended
Signaling Mode TEKEXP:VALUE GENERAL,"Signaling Mode","HS" TEKEXP:VALUE? GENERAL,"Signaling Mode"
UFS4 19.2MHz TEKEXP:VALUE GENERAL,"UFS4
UFS4 26MHz TEKEXP:VALUE GENERAL,"UFS4
UFS4 38.4MHz TEKEXP:VALUE GENERAL,"UFS4
UFS4 52MHz TEKEXP:VALUE GENERAL,"UFS4
TEKEXP:VALUE GENERAL,"DUT Tracing Filter
Path Terminated","INSTALL FOLDER\Lib\Filter
Files\UFS\Ideal RC filter.flt"
TEKEXP:VALUE GENERAL,"RF Switch Filter Path
Terminated","<path to flt file>"
TEKEXP:VALUE GENERAL,"Tek Fixture Filter Path
Terminated","<Path to flt file>"
TEKEXP:VALUE GENERAL,"DUT Tracing Filter Path
Unterminated","<Path to the filter file *.flt>"
TEKEXP:VALUE GENERAL,"RF Switch Filter Path
Unterminated","<path to flt file>"
TEKEXP:VALUE GENERAL,"Tek Fixture Filter Path
Unterminated","<Path to flt file>"
TEKEXP:VALUE GENERAL,"Clock Connected
to:Clock:Differential","CH1"
TEKEXP:VALUE GENERAL,"Clock Connected
to:Clock+: Single Ended","CH1"
TEKEXP:VALUE GENERAL,"Clock Connected
to:Clock-: Single Ended","CH3"
19.2MHz","Excluded"
26MHz","Excluded"
38.4MHz","Excluded"
52MHz","Included"
TEKEXP:VALUE? GENERAL,"Tek Fixture
Unterminated"
TEKEXP:VALUE? GENERAL,"DUT Tracing Filter
Path Terminated"
TEKEXP:VALUE? GENERAL,"RF Switch Filter Path
Terminated"
TEKEXP:VALUE? GENERAL,"Tek Fixture Filter Path
Terminated"
TEKEXP:VALUE? GENERAL,"DUT Tracing Filter
Path Unterminated"
TEKEXP:VALUE? GENERAL,"RF Switch Filter Path
Unterminated"
TEKEXP:VALUE? GENERAL,"Tek Fixture Filter Path
Unterminated"
TEKEXP:VALUE? GENERAL,"Clock Connected
to:Clock:Differential"
TEKEXP:VALUE? GENERAL,"Clock Connected
to:Clock+: Single Ended"
TEKEXP:VALUE? GENERAL,"Clock Connected
to:Clock-: Single Ended"
TEKEXP:VALUE? GENERAL,"UFS4 19.2MHz"
TEKEXP:VALUE? GENERAL,"UFS4 26MHz"
TEKEXP:VALUE? GENERAL,"UFS4 38.4MHz"
TEKEXP:VALUE? GENERAL,"UFS4 52MHz"
Acquire Parameters:
Parameter Names Example to set Example to query
Trigger shared settings TEKEXP:VALUE ACQUIRE,"Deterministic
Jitter","UFS4-Ref-Clock","Trigger shared
settings","Shared"
Width Trigger Upper Limit
Gear5B
Width Trigger Upper Limit
Gear5B
Table continued…
TekExpress® M-PHY Transmitter Automated Solution Application Help 71
TEKEXP:VALUE ACQUIRE,"Test 1.1.1-HS-TX Unit
Interval and Frequency Offset","CRPAT","Width
Trigger Upper Limit Gear5B","3000"
TEKEXP:VALUE ACQUIRE,"Test 1.1.10-HS-TX Slew
Rate Control Range","CRPAT SlewRate","Width
Trigger Upper Limit Gear5B","3000"
TEKEXP:VALUE? ACQUIRE,"Deterministic
Jitter","UFS4-Ref-Clock","Trigger shared settings"
TEKEXP:VALUE? ACQUIRE,"Test 1.1.1-HS-TX Unit
Interval and Frequency Offset","CRPAT","Width
Trigger Upper Limit Gear5B"
TEKEXP:VALUE? ACQUIRE,"Test 1.1.10-HS-TX
Slew Rate Control Range","CRPAT SlewRate","Width
Trigger Upper Limit Gear5B"
Page 72

Parameter Names Example to set Example to query
Width Trigger Upper Limit
Gear5B
Width Trigger Upper Limit
Gear5B
Width Trigger Upper Limit
Gear5B
Width Trigger Upper Limit
Gear5B
Sample Rate Gear5B TEKEXP:VALUE ACQUIRE,"Test 1.1.9-HS-TX Lane-
Gear7 Width trigger upper
limit (UI)
Width trigger upper limit
(UI)
SYS 52MHz Width trigger
upper limit (UI)
SYS 52MHz Width trigger
upper limit (UI)
SYS 52MHz Width trigger
upper limit (UI)
TEKEXP:VALUE ACQUIRE,"Test 1.1.13-HS-TX Intra-
Lane Output Skew","CRPAT-Single-ended","Width
Trigger Upper Limit Gear5B","3000"
TEKEXP:VALUE ACQUIRE,"Test 1.1.2-HS-TX
Common-Mode AC Power Spectral Magnitude
Limit","CRPAT PSD-Single-ended","Width Trigger
Upper Limit Gear5B","3000"
TEKEXP:VALUE ACQUIRE,"Test 1.1.6-HS-TX G1
and G2 Differential AC Eye","CRPAT - 3M","Width
Trigger Upper Limit Gear5B","3000"
TEKEXP:VALUE ACQUIRE,"Test 1.1.7-HS-TX G3,
G4 and G5 Differential AC Eye","CRPAT - Eye","Width
Trigger Upper Limit Gear5B","3000"
Lane Output Skew","CRPAT-Lane-Lane","Sample
Rate Gear5B","100"
TEKEXP:VALUE ACQUIRE,"Test 1.2.1-PWM-TX
Transmit Bit Duration","CRPAT","Gear7 Width trigger
upper limit (UI)","15"
TEKEXP:VALUE ACQUIRE,"Test 1.2.9-PWM-TX
Lane-Lane Output Skew","CRPAT-Lane-Lane","Width
trigger upper limit (UI)","1"
TEKEXP:VALUE ACQUIRE,"Test 1.3.1-SYS-TX Unit
Interval and Frequency Offset","CRPAT","SYS 52MHz
Width trigger upper limit (UI)","2550"
TEKEXP:VALUE ACQUIRE,"Test 1.3.2-SYS-TX Ref
Clock frequency","CRPAT-Clock","SYS 52MHz Width
trigger upper limit (UI)","2550"
TEKEXP:VALUE ACQUIRE,"Test 1.3.9-SYS-TX Lane-
Lane Output Skew","CRPAT-Lane-Lane","SYS 52MHz
Width trigger upper limit (UI)","2550"
TEKEXP:VALUE? ACQUIRE,"Test 1.1.13-HSTX Intra-Lane Output Skew","CRPAT-Singleended","Width Trigger Upper Limit Gear5B"
TEKEXP:VALUE? ACQUIRE,"Test 1.1.2-HS-TX
Common-Mode AC Power Spectral Magnitude
Limit","CRPAT PSD-Single-ended","Width Trigger
Upper Limit Gear5B"
TEKEXP:VALUE? ACQUIRE,"Test 1.1.6-HS-TX G1
and G2 Differential AC Eye","CRPAT - 3M","Width
Trigger Upper Limit Gear5B"
TEKEXP:VALUE? ACQUIRE,"Test 1.1.7-HS-TX G3,
G4 and G5 Differential AC Eye","CRPAT - Eye","Width
Trigger Upper Limit Gear5B"
TEKEXP:VALUE? ACQUIRE,"Test 1.1.9-HS-TX LaneLane Output Skew","CRPAT-Lane-Lane","Sample
Rate Gear5B"
TEKEXP:VALUE? ACQUIRE,"Test 1.2.1-PWM-TX
Transmit Bit Duration","CRPAT","Gear7 Width trigger
upper limit (UI)"
TEKEXP:VALUE? ACQUIRE,"Test 1.2.9-PWM-TX
Lane-Lane Output Skew","CRPAT-Lane-Lane","Width
trigger upper limit (UI)"
TEKEXP:VALUE? ACQUIRE,"Test 1.3.1-SYS-TX Unit
Interval and Frequency Offset","CRPAT","SYS 52MHz
Width trigger upper limit (UI)"
TEKEXP:VALUE? ACQUIRE,"Test 1.3.2-SYS-TX Ref
Clock frequency","CRPAT-Clock","SYS 52MHz Width
trigger upper limit (UI)"
TEKEXP:VALUE? ACQUIRE,"Test 1.3.9-SYS-TX
Lane-Lane Output Skew","CRPAT-Lane-Lane","SYS
52MHz Width trigger upper limit (UI)"
SCPI Commands
Analyze Parameters:
Parameter Names Example to set Example to query
High pass filter (MHz) TEKEXP:VALUE ANALYZE,"Deterministic
Jitter","High pass filter (MHz)","1"
Clock recovery method TEKEXP:VALUE ANALYZE,"Deterministic
Jitter","Clock recovery method","Constant Clock-
Mean"
Clock edge TEKEXP:VALUE ANALYZE,"Deterministic
Jitter","Clock edge","RISE"
Jitter Method TEKEXP:VALUE ANALYZE,"Deterministic
Jitter","Jitter Method","DJ"
Table continued…
TekExpress® M-PHY Transmitter Automated Solution Application Help 72
TEKEXP:VALUE? ANALYZE,"Deterministic
Jitter","High pass filter (MHz)"
TEKEXP:VALUE? ANALYZE,"Deterministic
Jitter","Clock recovery method"
TEKEXP:VALUE? ANALYZE,"Deterministic
Jitter","Clock edge"
TEKEXP:VALUE? ANALYZE,"Deterministic
Jitter","Jitter Method"
Page 73

Parameter Names Example to set Example to query
Nominal Frequency TEKEXP:VALUE ANALYZE,"Frequency
Error","Nominal Frequency","AUTO"
Nominal Frequency Value TEKEXP:VALUE ANALYZE,"Frequency
Error","Nominal Frequency Value","19.2"
Ref Levels Autoset
Basetop Method
Filter ramp time (ms) TEKEXP:VALUE ANALYZE,"Input High
BIT Type TEKEXP:VALUE ANALYZE,"Input High Voltage","BIT
SSC Profile TEKEXP:VALUE ANALYZE,"Test 1.1.1-HS-TX
SSC Frequency Deviation TEKEXP:VALUE ANALYZE,"Test 1.1.1-HS-TX Unit
Low level TEKEXP:VALUE ANALYZE,"Test 1.1.1-HS-TX Unit
Mid level_absolute TEKEXP:VALUE ANALYZE,"Test 1.1.1-HS-TX
Low pass filter (F2) spec TEKEXP:VALUE ANALYZE,"Test 1.1.1-HS-TX Unit
Low pass filter (MHz) TEKEXP:VALUE ANALYZE,"Test 1.1.1-HS-TX Unit
Gating TEKEXP:VALUE ANALYZE,"Test 1.1.1-HS-TX Unit
High level_percentage TEKEXP:VALUE ANALYZE,"Test 1.1.10-HS-TX Slew
Mid level_percentage TEKEXP:VALUE ANALYZE,"Test 1.1.10-HS-TX Slew
Low level_percentage TEKEXP:VALUE ANALYZE,"Test 1.1.10-HS-TX Slew
Mid level TEKEXP:VALUE ANALYZE,"Test 1.1.11-HS-TX Slew
Low level_absolute TEKEXP:VALUE ANALYZE,"Test 1.1.11-HS-TX Slew
Hysteresis_absolute TEKEXP:VALUE ANALYZE,"Test 1.1.11-HS-TX Slew
Hysteresis_percentage TEKEXP:VALUE ANALYZE,"Test 1.1.12-HS-TX Slew
Table continued…
TEKEXP:VALUE ANALYZE,"Frequency","Ref Levels
Autoset Basetop Method","AUTO"
Voltage","Filter ramp time (ms)","0.25"
Type","ALLBITS"
Unit Interval and Frequency Offset","SSC
Profile","Included"
Interval and Frequency Offset","SSC Frequency
Deviation","Included"
Interval and Frequency Offset","Low level","10"
Unit Interval and Frequency Offset","Mid
level_absolute","0"
Interval and Frequency Offset","Low pass filter (F2)
spec","SECOND"
Interval and Frequency Offset","Low pass filter
(MHz)","2"
Interval and Frequency Offset","Gating","CURSOR"
Rate Control Range","High level_percentage","90"
Rate Control Range","Mid level_percentage","50"
Rate Control Range","Low level_percentage","10"
Rate Monotonicity","Mid level","50"
Rate Monotonicity","Low level_absolute","0"
Rate Monotonicity","Hysteresis_absolute","0.05"
Rate Resolution","Hysteresis_percentage","5"
TEKEXP:VALUE? ANALYZE,"Frequency
Error","Nominal Frequency"
TEKEXP:VALUE? ANALYZE,"Frequency
Error","Nominal Frequency Value"
TEKEXP:VALUE? ANALYZE,"Frequency","Ref Levels
Autoset Basetop Method"
TEKEXP:VALUE? ANALYZE,"Input High
Voltage","Filter ramp time (ms)"
TEKEXP:VALUE? ANALYZE,"Input High
Voltage","BIT Type"
TEKEXP:VALUE? ANALYZE,"Test 1.1.1-HS-TX Unit
Interval and Frequency Offset","SSC Profile"
TEKEXP:VALUE? ANALYZE,"Test 1.1.1-HS-TX Unit
Interval and Frequency Offset","SSC Frequency
Deviation"
TEKEXP:VALUE? ANALYZE,"Test 1.1.1-HS-TX Unit
Interval and Frequency Offset","Low level"
TEKEXP:VALUE? ANALYZE,"Test 1.1.1-HS-TX Unit
Interval and Frequency Offset","Mid level_absolute"
TEKEXP:VALUE? ANALYZE,"Test 1.1.1-HS-TX Unit
Interval and Frequency Offset","Low pass filter (F2)
spec"
TEKEXP:VALUE? ANALYZE,"Test 1.1.1-HS-TX Unit
Interval and Frequency Offset","Low pass filter (MHz)"
TEKEXP:VALUE? ANALYZE,"Test 1.1.1-HS-TX Unit
Interval and Frequency Offset","Gating"
TEKEXP:VALUE? ANALYZE,"Test 1.1.10-HS-TX
Slew Rate Control Range","High level_percentage"
TEKEXP:VALUE? ANALYZE,"Test 1.1.10-HS-TX
Slew Rate Control Range","Mid level_percentage"
TEKEXP:VALUE? ANALYZE,"Test 1.1.10-HS-TX
Slew Rate Control Range","Low level_percentage"
TEKEXP:VALUE? ANALYZE,"Test 1.1.11-HS-TX Slew
Rate Monotonicity","Mid level"
TEKEXP:VALUE? ANALYZE,"Test 1.1.11-HS-TX Slew
Rate Monotonicity","Low level_absolute"
TEKEXP:VALUE? ANALYZE,"Test 1.1.11-HS-TX Slew
Rate Monotonicity","Hysteresis_absolute"
TEKEXP:VALUE? ANALYZE,"Test 1.1.12-HS-TX
Slew Rate Resolution","Hysteresis_percentage"
SCPI Commands
TekExpress® M-PHY Transmitter Automated Solution Application Help 73
Page 74

Parameter Names Example to set Example to query
Skew TEKEXP:VALUE ANALYZE,"Test 1.1.13-HS-TX Intra-
Lane Output Skew","Skew","Included"
From Edge value TEKEXP:VALUE ANALYZE,"Test 1.1.13-HS-TX Intra-
Lane Output Skew","From Edge value","BOTH"
To Edge value TEKEXP:VALUE ANALYZE,"Test 1.1.13-HS-TX Intra-
Lane Output Skew","To Edge value","SAMEAS"
Hysteresis TEKEXP:VALUE ANALYZE,"Test 1.1.13-HS-TX Intra-
Lane Output Skew","Hysteresis","3"
Gear1A High pass filter
(MHz)
Gear1A Low pass filter
(F2) spec
Gear1A Low pass filter
(MHz)
Gear1B High pass filter
(F1) spec
Gear1B High pass filter
(MHz)
Gear1B Low pass filter
(F2) spec
Gear1B Low pass filter
(MHz)
Gear1B Filter ramp time
(ms)
Gear1B Filter blanking
time (ms)
Gear2A High pass filter
(F1) spec
Gear2A High pass filter
(MHz)
Gear2A Low pass filter
(F2) spec
Table continued…
TEKEXP:VALUE ANALYZE,"Test 1.1.13-HS-TX Intra-
Lane Output Skew","Gear1A High pass filter
(MHz)","1"
TEKEXP:VALUE ANALYZE,"Test 1.1.13-HS-TX Intra-
Lane Output Skew","Gear1A Low pass filter (F2)
spec","NONE"
TEKEXP:VALUE ANALYZE,"Test 1.1.13-HS-TX Intra-
Lane Output Skew","Gear1A Low pass filter
(MHz)","624"
TEKEXP:VALUE ANALYZE,"Test 1.1.13-HS-TX Intra-
Lane Output Skew","Gear1B High pass filter (F1)
spec","NONE"
TEKEXP:VALUE ANALYZE,"Test 1.1.13-HS-TX Intra-
Lane Output Skew","Gear1B High pass filter
(MHz)","1"
TEKEXP:VALUE ANALYZE,"Test 1.1.13-HS-TX Intra-
Lane Output Skew","Gear1B Low pass filter (F2)
spec","NONE"
TEKEXP:VALUE ANALYZE,"Test 1.1.13-HS-TX Intra-
Lane Output Skew","Gear1B Low pass filter
(MHz)","728.8"
TEKEXP:VALUE ANALYZE,"Test 1.1.13-HS-TX Intra-
Lane Output Skew","Gear1B Filter ramp time
(ms)","2"
TEKEXP:VALUE ANALYZE,"Test 1.1.13-HS-TX Intra-
Lane Output Skew","Gear1B Filter blanking time
(ms)","4"
TEKEXP:VALUE ANALYZE,"Test 1.1.13-HS-TX Intra-
Lane Output Skew","Gear2A High pass filter (F1)
spec","NONE"
TEKEXP:VALUE ANALYZE,"Test 1.1.13-HS-TX Intra-
Lane Output Skew","Gear2A High pass filter
(MHz)","1"
TEKEXP:VALUE ANALYZE,"Test 1.1.13-HS-TX Intra-
Lane Output Skew","Gear2A Low pass filter (F2)
spec","NONE"
TEKEXP:VALUE? ANALYZE,"Test 1.1.13-HS-TX
Intra-Lane Output Skew","Skew"
TEKEXP:VALUE? ANALYZE,"Test 1.1.13-HS-TX
Intra-Lane Output Skew","From Edge value"
TEKEXP:VALUE? ANALYZE,"Test 1.1.13-HS-TX
Intra-Lane Output Skew","To Edge value"
TEKEXP:VALUE? ANALYZE,"Test 1.1.13-HS-TX
Intra-Lane Output Skew","Hysteresis"
TEKEXP:VALUE? ANALYZE,"Test 1.1.13-HS-TX
Intra-Lane Output Skew","Gear1A High pass filter
(MHz)"
TEKEXP:VALUE? ANALYZE,"Test 1.1.13-HS-TX
Intra-Lane Output Skew","Gear1A Low pass filter (F2)
spec"
TEKEXP:VALUE? ANALYZE,"Test 1.1.13-HS-TX
Intra-Lane Output Skew","Gear1A Low pass filter
(MHz)"
TEKEXP:VALUE? ANALYZE,"Test 1.1.13-HS-TX
Intra-Lane Output Skew","Gear1B High pass filter (F1)
spec"
TEKEXP:VALUE? ANALYZE,"Test 1.1.13-HS-TX
Intra-Lane Output Skew","Gear1B High pass filter
(MHz)"
TEKEXP:VALUE? ANALYZE,"Test 1.1.13-HS-TX
Intra-Lane Output Skew","Gear1B Low pass filter (F2)
spec"
TEKEXP:VALUE? ANALYZE,"Test 1.1.13-HS-TX
Intra-Lane Output Skew","Gear1B Low pass filter
(MHz)"
TEKEXP:VALUE? ANALYZE,"Test 1.1.13-HS-TX
Intra-Lane Output Skew","Gear1B Filter ramp time
(ms)"
TEKEXP:VALUE? ANALYZE,"Test 1.1.13-HS-TX
Intra-Lane Output Skew","Gear1B Filter blanking time
(ms)"
TEKEXP:VALUE? ANALYZE,"Test 1.1.13-HS-TX
Intra-Lane Output Skew","Gear2A High pass filter (F1)
spec"
TEKEXP:VALUE? ANALYZE,"Test 1.1.13-HS-TX
Intra-Lane Output Skew","Gear2A High pass filter
(MHz)"
TEKEXP:VALUE? ANALYZE,"Test 1.1.13-HS-TX
Intra-Lane Output Skew","Gear2A Low pass filter (F2)
spec"
SCPI Commands
TekExpress® M-PHY Transmitter Automated Solution Application Help 74
Page 75

Parameter Names Example to set Example to query
Gear2A Low pass filter
(MHz)
Gear2A Filter ramp time
(ms)
Gear2A Filter blanking
time (ms)
Gear2B High pass filter
(F1) spec
Gear2B High pass filter
(MHz)
Gear2B Low pass filter
(F2) spec
Gear2B Low pass filter
(MHz)
Gear2B Filter ramp time
(ms)
Gear2B Filter blanking
time (ms)
Gear3A High pass filter
(F1) spec
Gear3A High pass filter
(MHz)
Gear3A Low pass filter
(F2) spec
Gear3A Low pass filter
(MHz)
Gear3A Filter ramp time
(ms)
Gear3A Filter blanking
time (ms)
Table continued…
TEKEXP:VALUE ANALYZE,"Test 1.1.13-HS-TX Intra-
Lane Output Skew","Gear2A Low pass filter
(MHz)","1248"
TEKEXP:VALUE ANALYZE,"Test 1.1.13-HS-TX Intra-
Lane Output Skew","Gear2A Filter ramp time
(ms)","2"
TEKEXP:VALUE ANALYZE,"Test 1.1.13-HS-TX Intra-
Lane Output Skew","Gear2A Filter blanking time
(ms)","4"
TEKEXP:VALUE ANALYZE,"Test 1.1.13-HS-TX Intra-
Lane Output Skew","Gear2B High pass filter (F1)
spec","NONE"
TEKEXP:VALUE ANALYZE,"Test 1.1.13-HS-TX Intra-
Lane Output Skew","Gear2B High pass filter
(MHz)","1"
TEKEXP:VALUE ANALYZE,"Test 1.1.13-HS-TX Intra-
Lane Output Skew","Gear2B Low pass filter (F2)
spec","NONE"
TEKEXP:VALUE ANALYZE,"Test 1.1.13-HS-TX Intra-
Lane Output Skew","Gear2B Low pass filter
(MHz)","1457.6"
TEKEXP:VALUE ANALYZE,"Test 1.1.13-HS-TX Intra-
Lane Output Skew","Gear2B Filter ramp time
(ms)","2"
TEKEXP:VALUE ANALYZE,"Test 1.1.13-HS-TX Intra-
Lane Output Skew","Gear2B Filter blanking time
(ms)","4"
TEKEXP:VALUE ANALYZE,"Test 1.1.13-HS-TX Intra-
Lane Output Skew","Gear3A High pass filter (F1)
spec","NONE"
TEKEXP:VALUE ANALYZE,"Test 1.1.13-HS-TX Intra-
Lane Output Skew","Gear3A High pass filter
(MHz)","1"
TEKEXP:VALUE ANALYZE,"Test 1.1.13-HS-TX Intra-
Lane Output Skew","Gear3A Low pass filter (F2)
spec","NONE"
TEKEXP:VALUE ANALYZE,"Test 1.1.13-HS-TX Intra-
Lane Output Skew","Gear3A Low pass filter
(MHz)","2496"
TEKEXP:VALUE ANALYZE,"Test 1.1.13-HS-TX Intra-
Lane Output Skew","Gear3A Filter ramp time
(ms)","2"
TEKEXP:VALUE ANALYZE,"Test 1.1.13-HS-TX Intra-
Lane Output Skew","Gear3A Filter blanking time
(ms)","4"
TEKEXP:VALUE? ANALYZE,"Test 1.1.13-HS-TX
Intra-Lane Output Skew","Gear2A Low pass filter
(MHz)"
TEKEXP:VALUE? ANALYZE,"Test 1.1.13-HS-TX
Intra-Lane Output Skew","Gear2A Filter ramp time
(ms)"
TEKEXP:VALUE? ANALYZE,"Test 1.1.13-HS-TX
Intra-Lane Output Skew","Gear2A Filter blanking time
(ms)"
TEKEXP:VALUE? ANALYZE,"Test 1.1.13-HS-TX
Intra-Lane Output Skew","Gear2B High pass filter (F1)
spec"
TEKEXP:VALUE? ANALYZE,"Test 1.1.13-HS-TX
Intra-Lane Output Skew","Gear2B High pass filter
(MHz)"
TEKEXP:VALUE? ANALYZE,"Test 1.1.13-HS-TX
Intra-Lane Output Skew","Gear2B Low pass filter (F2)
spec"
TEKEXP:VALUE? ANALYZE,"Test 1.1.13-HS-TX
Intra-Lane Output Skew","Gear2B Low pass filter
(MHz)"
TEKEXP:VALUE? ANALYZE,"Test 1.1.13-HS-TX
Intra-Lane Output Skew","Gear2B Filter ramp time
(ms)"
TEKEXP:VALUE? ANALYZE,"Test 1.1.13-HS-TX
Intra-Lane Output Skew","Gear2B Filter blanking time
(ms)"
TEKEXP:VALUE? ANALYZE,"Test 1.1.13-HS-TX
Intra-Lane Output Skew","Gear3A High pass filter (F1)
spec"
TEKEXP:VALUE? ANALYZE,"Test 1.1.13-HS-TX
Intra-Lane Output Skew","Gear3A High pass filter
(MHz)"
TEKEXP:VALUE? ANALYZE,"Test 1.1.13-HS-TX
Intra-Lane Output Skew","Gear3A Low pass filter (F2)
spec"
TEKEXP:VALUE? ANALYZE,"Test 1.1.13-HS-TX
Intra-Lane Output Skew","Gear3A Low pass filter
(MHz)"
TEKEXP:VALUE? ANALYZE,"Test 1.1.13-HS-TX
Intra-Lane Output Skew","Gear3A Filter ramp time
(ms)"
TEKEXP:VALUE? ANALYZE,"Test 1.1.13-HS-TX
Intra-Lane Output Skew","Gear3A Filter blanking time
(ms)"
SCPI Commands
TekExpress® M-PHY Transmitter Automated Solution Application Help 75
Page 76

Parameter Names Example to set Example to query
Gear4B High pass filter
(F1) spec
Gear3B High pass filter
(MHz)
Gear3B Low pass filter
(F2) spec
Gear3B Low pass filter
(MHz)
Gear3B Filter ramp time
(ms)
Gear3B Filter blanking
time (ms)
Gear4A High pass filter
(F1) spec
Gear4A High pass filter
(MHz)
Gear4A Low pass filter
(F2) spec
Gear4A Low pass filter
(MHz)
Gear4A Filter ramp time
(ms)
Gear4A Filter blanking
time (ms)
Gear3B High pass filter
(F1) spec
Gear4B High pass filter
(MHz)
Gear4B Low pass filter
(F2) spec
Table continued…
TEKEXP:VALUE ANALYZE,"Test 1.1.13-HS-TX Intra-
Lane Output Skew","Gear4B High pass filter (F1)
spec","NONE"
TEKEXP:VALUE ANALYZE,"Test 1.1.13-HS-TX Intra-
Lane Output Skew","Gear3B High pass filter
(MHz)","1"
TEKEXP:VALUE ANALYZE,"Test 1.1.13-HS-TX Intra-
Lane Output Skew","Gear3B Low pass filter (F2)
spec","NONE"
TEKEXP:VALUE ANALYZE,"Test 1.1.13-HS-TX Intra-
Lane Output Skew","Gear3B Low pass filter
(MHz)","2915.2"
TEKEXP:VALUE ANALYZE,"Test 1.1.13-HS-TX Intra-
Lane Output Skew","Gear3B Filter ramp time
(ms)","2"
TEKEXP:VALUE ANALYZE,"Test 1.1.13-HS-TX Intra-
Lane Output Skew","Gear3B Filter blanking time
(ms)","4"
TEKEXP:VALUE ANALYZE,"Test 1.1.13-HS-TX Intra-
Lane Output Skew","Gear4A High pass filter (F1)
spec","NONE"
TEKEXP:VALUE ANALYZE,"Test 1.1.13-HS-TX Intra-
Lane Output Skew","Gear4A High pass filter
(MHz)","1"
TEKEXP:VALUE ANALYZE,"Test 1.1.13-HS-TX Intra-
Lane Output Skew","Gear4A Low pass filter (F2)
spec","NONE"
TEKEXP:VALUE ANALYZE,"Test 1.1.13-HS-TX Intra-
Lane Output Skew","Gear4A Low pass filter
(MHz)","2496"
TEKEXP:VALUE ANALYZE,"Test 1.1.13-HS-TX Intra-
Lane Output Skew","Gear4A Filter ramp time
(ms)","2"
TEKEXP:VALUE ANALYZE,"Test 1.1.13-HS-TX Intra-
Lane Output Skew","Gear4A Filter blanking time
(ms)","4"
TEKEXP:VALUE ANALYZE,"Test 1.1.13-HS-TX Intra-
Lane Output Skew","Gear3B High pass filter (F1)
spec","NONE"
TEKEXP:VALUE ANALYZE,"Test 1.1.13-HS-TX Intra-
Lane Output Skew","Gear4B High pass filter
(MHz)","1"
TEKEXP:VALUE ANALYZE,"Test 1.1.13-HS-TX Intra-
Lane Output Skew","Gear4B Low pass filter (F2)
spec","NONE"
TEKEXP:VALUE? ANALYZE,"Test 1.1.13-HS-TX
Intra-Lane Output Skew","Gear4B High pass filter (F1)
spec"
TEKEXP:VALUE? ANALYZE,"Test 1.1.13-HS-TX
Intra-Lane Output Skew","Gear3B High pass filter
(MHz)"
TEKEXP:VALUE? ANALYZE,"Test 1.1.13-HS-TX
Intra-Lane Output Skew","Gear3B Low pass filter (F2)
spec"
TEKEXP:VALUE? ANALYZE,"Test 1.1.13-HS-TX
Intra-Lane Output Skew","Gear3B Low pass filter
(MHz)"
TEKEXP:VALUE? ANALYZE,"Test 1.1.13-HS-TX
Intra-Lane Output Skew","Gear3B Filter ramp time
(ms)"
TEKEXP:VALUE? ANALYZE,"Test 1.1.13-HS-TX
Intra-Lane Output Skew","Gear3B Filter blanking time
(ms)"
TEKEXP:VALUE? ANALYZE,"Test 1.1.13-HS-TX
Intra-Lane Output Skew","Gear4A High pass filter (F1)
spec"
TEKEXP:VALUE? ANALYZE,"Test 1.1.13-HS-TX
Intra-Lane Output Skew","Gear4A High pass filter
(MHz)"
TEKEXP:VALUE? ANALYZE,"Test 1.1.13-HS-TX
Intra-Lane Output Skew","Gear4A Low pass filter (F2)
spec"
TEKEXP:VALUE? ANALYZE,"Test 1.1.13-HS-TX
Intra-Lane Output Skew","Gear4A Low pass filter
(MHz)"
TEKEXP:VALUE? ANALYZE,"Test 1.1.13-HS-TX
Intra-Lane Output Skew","Gear4A Filter ramp time
(ms)"
TEKEXP:VALUE? ANALYZE,"Test 1.1.13-HS-TX
Intra-Lane Output Skew","Gear4A Filter blanking time
(ms)"
TEKEXP:VALUE? ANALYZE,"Test 1.1.13-HS-TX
Intra-Lane Output Skew","Gear3B High pass filter (F1)
spec"
TEKEXP:VALUE? ANALYZE,"Test 1.1.13-HS-TX
Intra-Lane Output Skew","Gear4B High pass filter
(MHz)"
TEKEXP:VALUE? ANALYZE,"Test 1.1.13-HS-TX
Intra-Lane Output Skew","Gear4B Low pass filter (F2)
spec"
SCPI Commands
TekExpress® M-PHY Transmitter Automated Solution Application Help 76
Page 77

Parameter Names Example to set Example to query
Gear4B Low pass filter
(MHz)
Gear4B Filter ramp time
(ms)
Gear4B Filter blanking
time (ms)
Gear5A High pass filter
(F1) spec
Gear5A High pass filter
(MHz)
Gear5A Low pass filter
(F2) spec
Gear5A Low pass filter
(MHz)
Gear5A Filter ramp time
(ms)
Gear5A Filter blanking
time (ms)
Gear5B High pass filter
(F1) spec
Gear5B High pass filter
(MHz)
Gear5B Low pass filter
(F2) spec
Gear5B Low pass filter
(MHz)
Gear5B Filter ramp time
(ms)
Gear5B Filter blanking
time (ms)
Table continued…
TEKEXP:VALUE ANALYZE,"Test 1.1.13-HS-TX Intra-
Lane Output Skew","Gear4B Low pass filter
(MHz)","2915.2"
TEKEXP:VALUE ANALYZE,"Test 1.1.13-HS-TX Intra-
Lane Output Skew","Gear4B Filter ramp time
(ms)","2"
TEKEXP:VALUE ANALYZE,"Test 1.1.13-HS-TX Intra-
Lane Output Skew","Gear4B Filter blanking time
(ms)","4"
TEKEXP:VALUE ANALYZE,"Test 1.1.13-HS-TX Intra-
Lane Output Skew","Gear5A High pass filter (F1)
spec","NONE"
TEKEXP:VALUE ANALYZE,"Test 1.1.13-HS-TX Intra-
Lane Output Skew","Gear5A High pass filter
(MHz)","1"
TEKEXP:VALUE ANALYZE,"Test 1.1.13-HS-TX Intra-
Lane Output Skew","Gear5A Low pass filter (F2)
spec","NONE"
TEKEXP:VALUE ANALYZE,"Test 1.1.13-HS-TX Intra-
Lane Output Skew","Gear5A Low pass filter
(MHz)","9984"
TEKEXP:VALUE ANALYZE,"Test 1.1.13-HS-TX Intra-
Lane Output Skew","Gear5A Filter ramp time
(ms)","2"
TEKEXP:VALUE ANALYZE,"Test 1.1.13-HS-TX Intra-
Lane Output Skew","Gear5A Filter blanking time
(ms)","4"
TEKEXP:VALUE ANALYZE,"Test 1.1.13-HS-TX Intra-
Lane Output Skew","Gear5B High pass filter (F1)
spec","NONE"
TEKEXP:VALUE ANALYZE,"Test 1.1.13-HS-TX Intra-
Lane Output Skew","Gear5B High pass filter
(MHz)","1"
TEKEXP:VALUE ANALYZE,"Test 1.1.13-HS-TX Intra-
Lane Output Skew","Gear5B Low pass filter (F2)
spec","NONE"
TEKEXP:VALUE ANALYZE,"Test 1.1.13-HS-TX Intra-
Lane Output Skew","Gear5B Low pass filter
(MHz)","11660"
TEKEXP:VALUE ANALYZE,"Test 1.1.13-HS-TX Intra-
Lane Output Skew","Gear5B Filter ramp time
(ms)","2"
TEKEXP:VALUE ANALYZE,"Test 1.1.13-HS-TX Intra-
Lane Output Skew","Gear5B Filter blanking time
(ms)","4"
TEKEXP:VALUE? ANALYZE,"Test 1.1.13-HS-TX
Intra-Lane Output Skew","Gear4B Low pass filter
(MHz)"
TEKEXP:VALUE? ANALYZE,"Test 1.1.13-HS-TX
Intra-Lane Output Skew","Gear4B Filter ramp time
(ms)"
TEKEXP:VALUE? ANALYZE,"Test 1.1.13-HS-TX
Intra-Lane Output Skew","Gear4B Filter blanking time
(ms)"
TEKEXP:VALUE? ANALYZE,"Test 1.1.13-HS-TX
Intra-Lane Output Skew","Gear5A High pass filter (F1)
spec"
TEKEXP:VALUE? ANALYZE,"Test 1.1.13-HS-TX
Intra-Lane Output Skew","Gear5A High pass filter
(MHz)"
TEKEXP:VALUE? ANALYZE,"Test 1.1.13-HS-TX
Intra-Lane Output Skew","Gear5A Low pass filter (F2)
spec"
TEKEXP:VALUE? ANALYZE,"Test 1.1.13-HS-TX
Intra-Lane Output Skew","Gear5A Low pass filter
(MHz)"
TEKEXP:VALUE? ANALYZE,"Test 1.1.13-HS-TX
Intra-Lane Output Skew","Gear5A Filter ramp time
(ms)"
TEKEXP:VALUE? ANALYZE,"Test 1.1.13-HS-TX
Intra-Lane Output Skew","Gear5A Filter blanking time
(ms)"
TEKEXP:VALUE? ANALYZE,"Test 1.1.13-HS-TX
Intra-Lane Output Skew","Gear5B High pass filter (F1)
spec"
TEKEXP:VALUE? ANALYZE,"Test 1.1.13-HS-TX
Intra-Lane Output Skew","Gear5B High pass filter
(MHz)"
TEKEXP:VALUE? ANALYZE,"Test 1.1.13-HS-TX
Intra-Lane Output Skew","Gear5B Low pass filter (F2)
spec"
TEKEXP:VALUE? ANALYZE,"Test 1.1.13-HS-TX
Intra-Lane Output Skew","Gear5B Low pass filter
(MHz)"
TEKEXP:VALUE? ANALYZE,"Test 1.1.13-HS-TX
Intra-Lane Output Skew","Gear5B Filter ramp time
(ms)"
TEKEXP:VALUE? ANALYZE,"Test 1.1.13-HS-TX
Intra-Lane Output Skew","Gear5B Filter blanking time
(ms)"
SCPI Commands
TekExpress® M-PHY Transmitter Automated Solution Application Help 77
Page 78

Parameter Names Example to set Example to query
Positive width TEKEXP:VALUE ANALYZE,"Test 1.1.14-HS-TX
Transmitter Pulse Width","Positive width","Included"
PLL Model Type TEKEXP:VALUE ANALYZE,"Test 1.1.15-HS-TX Total
Jitter","PLL Model Type","2"
Damping (m) TEKEXP:VALUE ANALYZE,"Test 1.1.15-HS-TX Total
Jitter","Damping (m)","700"
Loop bandwidth (MHz) TEKEXP:VALUE ANALYZE,"Test 1.1.15-HS-TX Total
Jitter","Loop bandwidth (MHz)","2"
Loop bandwidth Gear
1(MHz)
Loop bandwidth Gear
2(MHz)
Loop bandwidth Gear
3(MHz)
Loop bandwidth Gear
4(MHz)
Loop bandwidth Gear
5(MHz)
Nominal data rate TEKEXP:VALUE ANALYZE,"Test 1.1.15-HS-TX Total
Signal type TEKEXP:VALUE ANALYZE,"Test 1.1.15-HS-TX Total
RjDj Pattern type TEKEXP:VALUE ANALYZE,"Test 1.1.15-HS-TX Total
Arbitrary window length
(UI)
Repeating pattern length
(UI)
Population TEKEXP:VALUE ANALYZE,"Test 1.1.15-HS-TX Total
Target BER (1e-) TEKEXP:VALUE ANALYZE,"Test 1.1.15-HS-TX Total
TJBER TEKEXP:VALUE ANALYZE,"Test 1.1.16-HS-TX
TIE TEKEXP:VALUE ANALYZE,"Test 1.1.16-HS-TX
Ref levels TEKEXP:VALUE ANALYZE,"Test 1.1.16-HS-TX
Loop Bandwidth Type TEKEXP:VALUE ANALYZE,"Test 1.1.16-HS-TX
Known data pattern TEKEXP:VALUE ANALYZE,"Test 1.1.16-HS-TX
Table continued…
TEKEXP:VALUE ANALYZE,"Test 1.1.15-HS-TX Total
Jitter","Loop bandwidth Gear 1(MHz)","2"
TEKEXP:VALUE ANALYZE,"Test 1.1.15-HS-TX Total
Jitter","Loop bandwidth Gear 2(MHz)","4"
TEKEXP:VALUE ANALYZE,"Test 1.1.15-HS-TX Total
Jitter","Loop bandwidth Gear 3(MHz)","8"
TEKEXP:VALUE ANALYZE,"Test 1.1.15-HS-TX Total
Jitter","Loop bandwidth Gear 4(MHz)","8"
TEKEXP:VALUE ANALYZE,"Test 1.1.15-HS-TX Total
Jitter","Loop bandwidth Gear 5(MHz)","16"
Jitter","Nominal data rate","True"
Jitter","Signal type","DATA"
Jitter","RjDj Pattern type","Arbitrary"
TEKEXP:VALUE ANALYZE,"Test 1.1.15-HS-TX Total
Jitter","Arbitrary window length (UI)","5"
TEKEXP:VALUE ANALYZE,"Test 1.1.15-HS-TX Total
Jitter","Repeating pattern length (UI)","1270"
Jitter","Population","100"
Jitter","Target BER (1e-)","12"
Short-Term Total Jitter","TJBER","Included"
Short-Term Total Jitter","TIE","Included"
Short-Term Total Jitter","Ref levels","Percentage"
Short-Term Total Jitter","Loop Bandwidth
Type","JTFBW"
Short-Term Total Jitter","Known data pattern","False"
TEKEXP:VALUE? ANALYZE,"Test 1.1.14-HS-TX
Transmitter Pulse Width","Positive width"
TEKEXP:VALUE? ANALYZE,"Test 1.1.15-HS-TX Total
Jitter","PLL Model Type"
TEKEXP:VALUE? ANALYZE,"Test 1.1.15-HS-TX Total
Jitter","Damping (m)"
TEKEXP:VALUE? ANALYZE,"Test 1.1.15-HS-TX Total
Jitter","Loop bandwidth (MHz)"
TEKEXP:VALUE? ANALYZE,"Test 1.1.15-HS-TX Total
Jitter","Loop bandwidth Gear 1(MHz)"
TEKEXP:VALUE? ANALYZE,"Test 1.1.15-HS-TX Total
Jitter","Loop bandwidth Gear 2(MHz)"
TEKEXP:VALUE? ANALYZE,"Test 1.1.15-HS-TX Total
Jitter","Loop bandwidth Gear 3(MHz)"
TEKEXP:VALUE? ANALYZE,"Test 1.1.15-HS-TX Total
Jitter","Loop bandwidth Gear 4(MHz)"
TEKEXP:VALUE? ANALYZE,"Test 1.1.15-HS-TX Total
Jitter","Loop bandwidth Gear 5(MHz)"
TEKEXP:VALUE? ANALYZE,"Test 1.1.15-HS-TX Total
Jitter","Nominal data rate"
TEKEXP:VALUE? ANALYZE,"Test 1.1.15-HS-TX Total
Jitter","Signal type"
TEKEXP:VALUE? ANALYZE,"Test 1.1.15-HS-TX Total
Jitter","RjDj Pattern type"
TEKEXP:VALUE? ANALYZE,"Test 1.1.15-HS-TX Total
Jitter","Arbitrary window length (UI)"
TEKEXP:VALUE? ANALYZE,"Test 1.1.15-HS-TX Total
Jitter","Repeating pattern length (UI)"
TEKEXP:VALUE? ANALYZE,"Test 1.1.15-HS-TX Total
Jitter","Population"
TEKEXP:VALUE? ANALYZE,"Test 1.1.15-HS-TX Total
Jitter","Target BER (1e-)"
TEKEXP:VALUE? ANALYZE,"Test 1.1.16-HS-TX
Short-Term Total Jitter","TJBER"
TEKEXP:VALUE? ANALYZE,"Test 1.1.16-HS-TX
Short-Term Total Jitter","TIE"
TEKEXP:VALUE? ANALYZE,"Test 1.1.16-HS-TX
Short-Term Total Jitter","Ref levels"
TEKEXP:VALUE? ANALYZE,"Test 1.1.16-HS-TX
Short-Term Total Jitter","Loop Bandwidth Type"
TEKEXP:VALUE? ANALYZE,"Test 1.1.16-HS-TX
Short-Term Total Jitter","Known data pattern"
SCPI Commands
TekExpress® M-PHY Transmitter Automated Solution Application Help 78
Page 79

Parameter Names Example to set Example to query
DJDIRAC1 TEKEXP:VALUE ANALYZE,"Test 1.1.17-HS-TX
Deterministic Jitter","DJDIRAC1","Included"
High level_absolute TEKEXP:VALUE ANALYZE,"Test 1.1.17-HS-TX
Deterministic Jitter","High level_absolute","0"
Gear1A High pass filter
(F1) spec
Pattern file path TEKEXP:VALUE ANALYZE,"Test 1.1.18-HS-TX Short
Comparison string TEKEXP:VALUE ANALYZE,"Test 1.1.3-HS-TX
HS Prepare Length
Gear1A
HS Prepare Length
Gear1B
HS Prepare Length
Gear2A
HS Prepare Length
Gear2B
HS Prepare Length
Gear3A
HS Prepare Length
Gear3B
HS Prepare Length
Gear4A
HS Prepare Length
Gear4B
HS Prepare Length
Gear5A
HS Prepare Length
Gear5B
High level TEKEXP:VALUE ANALYZE,"Test 1.1.5-HS-TX
Eye high TEKEXP:VALUE ANALYZE,"Test 1.1.6-HS-TX G1
Eye low TEKEXP:VALUE ANALYZE,"Test 1.1.6-HS-TX G1
Period TEKEXP:VALUE ANALYZE,"Test 1.1.6-HS-TX G1
Mask hits TEKEXP:VALUE ANALYZE,"Test 1.1.6-HS-TX G1
Table continued…
TEKEXP:VALUE ANALYZE,"Test 1.1.17-HS-TX
Deterministic Jitter","Gear1A High pass filter (F1)
spec","NONE"
term Deterministic Jitter","Pattern file path",""
PREPARE Length","Comparison string","GE"
TEKEXP:VALUE ANALYZE,"Test 1.1.3-HS-TX
PREPARE Length","HS Prepare Length Gear1A","10"
TEKEXP:VALUE ANALYZE,"Test 1.1.3-HS-TX
PREPARE Length","HS Prepare Length Gear1B","10"
TEKEXP:VALUE ANALYZE,"Test 1.1.3-HS-TX
PREPARE Length","HS Prepare Length Gear2A","10"
TEKEXP:VALUE ANALYZE,"Test 1.1.3-HS-TX
PREPARE Length","HS Prepare Length Gear2B","10"
TEKEXP:VALUE ANALYZE,"Test 1.1.3-HS-TX
PREPARE Length","HS Prepare Length Gear3A","10"
TEKEXP:VALUE ANALYZE,"Test 1.1.3-HS-TX
PREPARE Length","HS Prepare Length Gear3B","10"
TEKEXP:VALUE ANALYZE,"Test 1.1.3-HS-TX
PREPARE Length","HS Prepare Length Gear4A","10"
TEKEXP:VALUE ANALYZE,"Test 1.1.3-HS-TX
PREPARE Length","HS Prepare Length Gear4B","10"
TEKEXP:VALUE ANALYZE,"Test 1.1.3-HS-TX
PREPARE Length","HS Prepare Length Gear5A","10"
TEKEXP:VALUE ANALYZE,"Test 1.1.3-HS-TX
PREPARE Length","HS Prepare Length Gear5B","10"
Differential DC Output Voltage Amplitude","High
level","90"
and G2 Differential AC Eye","Eye high","Included"
and G2 Differential AC Eye","Eye low","Included"
and G2 Differential AC Eye","Period","Included"
and G2 Differential AC Eye","Mask hits","Included"
TEKEXP:VALUE? ANALYZE,"Test 1.1.17-HS-TX
Deterministic Jitter","DJDIRAC1"
TEKEXP:VALUE? ANALYZE,"Test 1.1.17-HS-TX
Deterministic Jitter","High level_absolute"
TEKEXP:VALUE? ANALYZE,"Test 1.1.17-HS-TX
Deterministic Jitter","Gear1A High pass filter (F1)
spec"
TEKEXP:VALUE? ANALYZE,"Test 1.1.18-HS-TX
Short term Deterministic Jitter","Pattern file path"
TEKEXP:VALUE? ANALYZE,"Test 1.1.3-HS-TX
PREPARE Length","Comparison string"
TEKEXP:VALUE? ANALYZE,"Test 1.1.3-HS-TX
PREPARE Length","HS Prepare Length Gear1A"
TEKEXP:VALUE? ANALYZE,"Test 1.1.3-HS-TX
PREPARE Length","HS Prepare Length Gear1B"
TEKEXP:VALUE? ANALYZE,"Test 1.1.3-HS-TX
PREPARE Length","HS Prepare Length Gear2A"
TEKEXP:VALUE? ANALYZE,"Test 1.1.3-HS-TX
PREPARE Length","HS Prepare Length Gear2B"
TEKEXP:VALUE? ANALYZE,"Test 1.1.3-HS-TX
PREPARE Length","HS Prepare Length Gear3A"
TEKEXP:VALUE? ANALYZE,"Test 1.1.3-HS-TX
PREPARE Length","HS Prepare Length Gear3B"
TEKEXP:VALUE? ANALYZE,"Test 1.1.3-HS-TX
PREPARE Length","HS Prepare Length Gear4A"
TEKEXP:VALUE? ANALYZE,"Test 1.1.3-HS-TX
PREPARE Length","HS Prepare Length Gear4B"
TEKEXP:VALUE? ANALYZE,"Test 1.1.3-HS-TX
PREPARE Length","HS Prepare Length Gear5A"
TEKEXP:VALUE? ANALYZE,"Test 1.1.3-HS-TX
PREPARE Length","HS Prepare Length Gear5B"
TEKEXP:VALUE? ANALYZE,"Test 1.1.5-HS-TX
Differential DC Output Voltage Amplitude","High level"
TEKEXP:VALUE? ANALYZE,"Test 1.1.6-HS-TX G1
and G2 Differential AC Eye","Eye high"
TEKEXP:VALUE? ANALYZE,"Test 1.1.6-HS-TX G1
and G2 Differential AC Eye","Eye low"
TEKEXP:VALUE? ANALYZE,"Test 1.1.6-HS-TX G1
and G2 Differential AC Eye","Period"
TEKEXP:VALUE? ANALYZE,"Test 1.1.6-HS-TX G1
and G2 Differential AC Eye","Mask hits"
SCPI Commands
TekExpress® M-PHY Transmitter Automated Solution Application Help 79
Page 80

Parameter Names Example to set Example to query
Measurement point of UI
(%)
RT Gear1B LA Mask file
path 19.2MHz
RT Gear1B SA Mask file
path 19.2MHz
RT Gear2A LA Mask file
path
RT Gear2B LA Mask file
path
RT Gear2B LA Mask file
path 19.2MHz
RT Gear3A LA Mask file
path
RT Gear3B LA Mask file
path
RT Gear3B SA Mask file
path
Table continued…
TEKEXP:VALUE ANALYZE,"Test 1.1.6-HS-TX G1
and G2 Differential AC Eye","Measurement point of
UI (%)","50"
TEKEXP:VALUE ANALYZE,"Test 1.1.6-HS-TX G1
and G2 Differential AC Eye","RT Gear1B LA Mask
file path 19.2MHz","INSTALL FOLDER\Compliance
Suites\MIPI\M-PHY\Transmitter\HS\Mask
Files\Gear1B\G1B_1p4592G_LA_RT.msk"
TEKEXP:VALUE ANALYZE,"Test 1.1.6-HS-TX G1
and G2 Differential AC Eye","RT Gear1B SA Mask
file path 19.2MHz","INSTALL FOLDER\Compliance
Suites\MIPI\M-PHY\Transmitter\HS\Mask
Files\Gear1B\G1B_1p4592G_SA_RT.msk"
TEKEXP:VALUE ANALYZE,"Test 1.1.6-HS-TX G1
and G2 Differential AC Eye","RT Gear2A LA
Mask file path","INSTALL FOLDER\Compliance
Suites\MIPI\M-PHY\Transmitter\HS\Mask
Files\Gear2A\1.1.6_VDIFF_AC_LA_RT_G2A.msk"
TEKEXP:VALUE ANALYZE,"Test 1.1.6-HS-TX G1
and G2 Differential AC Eye","RT Gear2B LA
Mask file path","INSTALL FOLDER\Compliance
Suites\MIPI\M-PHY\Transmitter\HS\Mask
Files\Gear2B\1.1.6_VDIFF_AC_LA_RT_G2B.msk"
TEKEXP:VALUE ANALYZE,"Test 1.1.6-HS-TX G1
and G2 Differential AC Eye","RT Gear2B LA Mask
file path 19.2MHz","INSTALL FOLDER\Compliance
Suites\MIPI\M-PHY\Transmitter\HS\Mask
Files\Gear2B\G2B_2p9184G_LA_RT.msk"
TEKEXP:VALUE ANALYZE,"Test 1.1.7-HS-Tx G3,
G4 and G5 Differential AC Eye","RT Gear3A
LA Mask file path","INSTALL FOLDER\Compliance
Suites\MIPI\M-PHY\Transmitter\HS\Mask
Files\Gear3A\1.1.7_EYE_LA_RT_G3A.msk
TEKEXP:VALUE ANALYZE,"Test 1.1.7-HS-TX G3,
G4 and G5 Differential AC Eye","RT Gear3B
LA Mask file path","INSTALL FOLDER\Compliance
Suites\MIPI\M-PHY\Transmitter\HS\Mask
Files\Gear3B\1.1.7_EYE_LA_RT_G3B.msk"
TEKEXP:VALUE ANALYZE,"Test 1.1.7-HS-TX G3,
G4 and G5 Differential AC Eye","RT Gear3B
SA Mask file path","INSTALL FOLDER\Compliance
Suites\MIPI\M-PHY\Transmitter\HS\Mask
Files\Gear3B\1.1.7_EYE_SA_RT_G3B.msk"
TEKEXP:VALUE? ANALYZE,"Test 1.1.6-HS-TX G1
and G2 Differential AC Eye","Measurement point of
UI (%)"
TEKEXP:VALUE? ANALYZE,"Test 1.1.6-HS-TX G1
and G2 Differential AC Eye","RT Gear1B LA Mask
file path 19.2MHz"
TEKEXP:VALUE? ANALYZE,"Test 1.1.6-HS-TX G1
and G2 Differential AC Eye","RT Gear1B SA Mask
file path 19.2MHz"
TEKEXP:VALUE? ANALYZE,"Test 1.1.6-HS-TX G1
and G2 Differential AC Eye","RT Gear2A LA Mask
file path"
TEKEXP:VALUE? ANALYZE,"Test 1.1.6-HS-TX G1
and G2 Differential AC Eye","RT Gear2B LA Mask
file path"
TEKEXP:VALUE? ANALYZE,"Test 1.1.6-HS-TX G1
and G2 Differential AC Eye","RT Gear2B LA Mask
file path 19.2MHz"
TEKEXP:VALUE? ANALYZE,"Test 1.1.7-HS-TX G3,
G4 and G5 Differential AC Eye","RT Gear3A LA Mask
file path"
TEKEXP:VALUE? ANALYZE,"Test 1.1.7-HS-TX G3,
G4 and G5 Differential AC Eye","RT Gear3B LA Mask
file path"
TEKEXP:VALUE? ANALYZE,"Test 1.1.7-HS-TX G3,
G4 and G5 Differential AC Eye","RT Gear3B SA Mask
file path"
SCPI Commands
TekExpress® M-PHY Transmitter Automated Solution Application Help 80
Page 81

Parameter Names Example to set Example to query
RT Gear3B SA Mask file
path 19.2MHz
Gear3A Short(CH1) TEKEXP:VALUE ANALYZE,"Test 1.1.6-HS-TX
Gear3A Long(CH2) TEKEXP:VALUE ANALYZE,"Test 1.1.6-HS-TX
Gear3B Short(CH1) TEKEXP:VALUE ANALYZE,"Test 1.1.6-HS-TX
Gear3B Long(CH2) TEKEXP:VALUE ANALYZE,"Test 1.1.6-HS-TX
Gear3A Short TEKEXP:VALUE ANALYZE,"Test 1.1.6-HS-TX
Gear3A Long TEKEXP:VALUE ANALYZE,"Test 1.1.6-HS-TX
Gear3B Short TEKEXP:VALUE ANALYZE,"Test 1.1.6-HS-TX
Gear3B Long TEKEXP:VALUE ANALYZE,"Test 1.1.6-HS-TX
De-Emphasis 3.5dB TEKEXP:VALUE ANALYZE,"Test 1.1.6-HS-TX G1
De-Emphasis 6.0dB TEKEXP:VALUE ANALYZE,"Test 1.1.6-HS-TX G1
De-Emphasis 0dB TEKEXP:VALUE ANALYZE,"Test 1.1.6-HS-TX G1
Table continued…
TEKEXP:VALUE ANALYZE,"Test 1.1.6-HS-TX G1
and G2 Differential AC Eye","RT Gear3B SA Mask
file path 19.2MHz","INSTALL FOLDER\Compliance
Suites\MIPI\M-PHY\Transmitter\HS\Mask
Files\Gear3B\G3B_5p8368G_SA_RT.msk"
G1 and G2 Differential AC Eye","Gear3A
Short(CH1)","INSTALL FOLDER\Compliance
Suites\MIPI\M-PHY\Transmitter\HS\Filter
Files\Gear3A\ShortChannel_G3A.flt"
G1 and G2 Differential AC Eye","Gear3A
Long(CH2)","INSTALL FOLDER\Compliance
Suites\MIPI\M-PHY\Transmitter\HS\Filter
Files\Gear3A\LongChannel_G3A_G3A.flt"
G1 and G2 Differential AC Eye","Gear3B
Short(CH1)","INSTALL FOLDER\Compliance
Suites\MIPI\M-PHY\Transmitter\HS\Filter
Files\Gear3A\ShortChannel_G3B.flt"
G1 and G2 Differential AC Eye","Gear3B
Long(CH2)","INSTALL FOLDER\Compliance
Suites\MIPI\M-PHY\Transmitter\HS\Filter
Files\Gear3A\LongChannel_G3B.flt"
G1 and G2 Differential AC Eye","Gear3A
Short","Excluded"
G1 and G2 Differential AC Eye","Gear3A
Long","Excluded"
G1 and G2 Differential AC Eye","Gear3B
Short","Excluded"
G1 and G2 Differential AC Eye","Gear3B
Long","Excluded"
and G2 Differential AC Eye","De-Emphasis
3.5dB","Excluded"
and G2 Differential AC Eye","De-Emphasis
6.0dB","Excluded"
and G2 Differential AC Eye","De-Emphasis
0dB","Excluded"
TEKEXP:VALUE? ANALYZE,"Test 1.1.6-HS-TX G1
and G2 Differential AC Eye","RT Gear3B SA Mask
file path 19.2MHz"
TEKEXP:VALUE? ANALYZE,"Test 1.1.6-HS-TX G1
and G2 Differential AC Eye","Gear3A Short(CH1)"
TEKEXP:VALUE? ANALYZE,"Test 1.1.6-HS-TX G1
and G2 Differential AC Eye","Gear3A Long(CH2)"
TEKEXP:VALUE? ANALYZE,"Test 1.1.6-HS-TX G1
and G2 Differential AC Eye","Gear3B Short(CH1)"
TEKEXP:VALUE? ANALYZE,"Test 1.1.6-HS-TX G1
and G2 Differential AC Eye","Gear3B Long(CH2)"
TEKEXP:VALUE? ANALYZE,"Test 1.1.6-HS-TX G1
and G2 Differential AC Eye","Gear3A Short"
TEKEXP:VALUE? ANALYZE,"Test 1.1.6-HS-TX G1
and G2 Differential AC Eye","Gear3A Long"
TEKEXP:VALUE? ANALYZE,"Test 1.1.6-HS-TX G1
and G2 Differential AC Eye","Gear3B Short"
TEKEXP:VALUE? ANALYZE,"Test 1.1.6-HS-TX G1
and G2 Differential AC Eye","Gear3B Long"
TEKEXP:VALUE? ANALYZE,"Test 1.1.6-HS-TX G1
and G2 Differential AC Eye","De-Emphasis 3.5dB"
TEKEXP:VALUE? ANALYZE,"Test 1.1.6-HS-TX G1
and G2 Differential AC Eye","De-Emphasis 6.0dB"
TEKEXP:VALUE? ANALYZE,"Test 1.1.6-HS-TX G1
and G2 Differential AC Eye","De-Emphasis 0dB"
SCPI Commands
TekExpress® M-PHY Transmitter Automated Solution Application Help 81
Page 82

Parameter Names Example to set Example to query
Setup File TEKEXP:VALUE ANALYZE,"Test 1.1.6-HS-TX G1
and G2 Differential AC Eye","Setup File","AWG
Setup2.set"
Save Waveform TEKEXP:VALUE ANALYZE,"Test 1.1.6-HS-TX G1
and G2 Differential AC Eye","Save Waveform","False"
Enable Eye Rendering TEKEXP:VALUE ANALYZE,"Test 1.1.6-HS-TX G1
and G2 Differential AC Eye","Enable Eye
Rendering","True"
RT Gear1A LA Mask file
path
RT Gear1A SA Mask file
path
RT Gear1B LA Mask file
path
RT Gear1B SA Mask file
path
RT Gear2A SA Mask file
path
RT Gear2B SA Mask file
path
RT Gear2B SA Mask file
path 19.2MHz
Table continued…
TEKEXP:VALUE ANALYZE,"Test 1.1.7-HS-TX G3,
G4 and G5 Differential AC Eye","RT Gear1A
LA Mask file path","INSTALL FOLDER\Compliance
Suites\MIPI\M-PHY\Transmitter\HS\Mask
Files\Gear1A\1.1.7_VDIFF_AC_LA_RT_G1A.msk"
TEKEXP:VALUE ANALYZE,"Test 1.1.7-HS-TX G3,
G4 and G5 Differential AC Eye","RT Gear1A
SA Mask file path","INSTALL FOLDER\Compliance
Suites\MIPI\M-PHY\Transmitter\HS\Mask
Files\Gear1A\1.1.7_VDIFF_AC_SA_RT_G1A.msk"
TEKEXP:VALUE ANALYZE,"Test 1.1.7-HS-TX G3,
G4 and G5 Differential AC Eye","RT Gear1B
LA Mask file path","INSTALL FOLDER\Compliance
Suites\MIPI\M-PHY\Transmitter\HS\Mask
Files\Gear1B\1.1.7_VDIFF_AC_LA_RT_G1B.msk"
TEKEXP:VALUE ANALYZE,"Test 1.1.7-HS-TX G3,
G4 and G5 Differential AC Eye","RT Gear1B
SA Mask file path","INSTALL FOLDER\Compliance
Suites\MIPI\M-PHY\Transmitter\HS\Mask
Files\Gear1B\1.1.7_VDIFF_AC_SA_RT_G1B.msk"
TEKEXP:VALUE ANALYZE,"Test 1.1.7-HS-TX G3,
G4 and G5 Differential AC Eye","RT Gear2A
SA Mask file path","INSTALL FOLDER\Compliance
Suites\MIPI\M-PHY\Transmitter\HS\Mask
Files\Gear2A\1.1.7_VDIFF_AC_SA_RT_G2A.msk"
TEKEXP:VALUE ANALYZE,"Test 1.1.7-HS-TX G3,
G4 and G5 Differential AC Eye","RT Gear2B
SA Mask file path","INSTALL FOLDER\Compliance
Suites\MIPI\M-PHY\Transmitter\HS\Mask
Files\Gear2B\1.1.7_VDIFF_AC_SA_RT_G2B.msk"
TEKEXP:VALUE ANALYZE,"Test 1.1.7-HS-TX G3, G4
and G5 Differential AC Eye","RT Gear2B SA Mask
file path 19.2MHz","INSTALL FOLDER\Compliance
Suites\MIPI\M-PHY\Transmitter\HS\Mask
Files\Gear2B\G2B_2p9184G_SA_RT.msk"
TEKEXP:VALUE? ANALYZE,"Test 1.1.6-HS-TX G1
and G2 Differential AC Eye","Setup File"
TEKEXP:VALUE? ANALYZE,"Test 1.1.6-HS-TX G1
and G2 Differential AC Eye","Save Waveform"
TEKEXP:VALUE? ANALYZE,"Test 1.1.6-HS-TX G1
and G2 Differential AC Eye","Enable Eye Rendering"
TEKEXP:VALUE? ANALYZE,"Test 1.1.7-HS-TX G3,
G4 and G5 Differential AC Eye","RT Gear1A LA Mask
file path"
TEKEXP:VALUE? ANALYZE,"Test 1.1.7-HS-TX G3,
G4 and G5 Differential AC Eye","RT Gear1A SA Mask
file path"
TEKEXP:VALUE? ANALYZE,"Test 1.1.7-HS-TX G3,
G4 and G5 Differential AC Eye","RT Gear1B LA Mask
file path"
TEKEXP:VALUE? ANALYZE,"Test 1.1.7-HS-TX G3,
G4 and G5 Differential AC Eye","RT Gear1B SA Mask
file path"
TEKEXP:VALUE? ANALYZE,"Test 1.1.7-HS-TX G3,
G4 and G5 Differential AC Eye","RT Gear2A SA Mask
file path"
TEKEXP:VALUE? ANALYZE,"Test 1.1.7-HS-TX G3,
G4 and G5 Differential AC Eye","RT Gear2B SA Mask
file path"
TEKEXP:VALUE? ANALYZE,"Test 1.1.7-HS-TX G3,
G4 and G5 Differential AC Eye","RT Gear2B SA Mask
file path 19.2MHz"
SCPI Commands
TekExpress® M-PHY Transmitter Automated Solution Application Help 82
Page 83

Parameter Names Example to set Example to query
RT Gear3A SA Mask file
path
RT Gear3B LA Mask file
path 19.2MHz
RT Gear4A LA Mask file
path
RT Gear4A SA Mask file
path
RT Gear4B LA Mask file
path
RT Gear4B SA Mask file
path 19.2MHz
RT Gear4B SA Mask file
path
RT Gear4B LA Mask file
path 19.2MHz
RT Gear5A LA Mask file
path
Table continued…
TEKEXP:VALUE ANALYZE,"Test 1.1.7-HS-TX G3,
G4 and G5 Differential AC Eye","RT Gear3A
SA Mask file path","INSTALL FOLDER\Compliance
Suites\MIPI\M-PHY\Transmitter\HS\Mask
Files\Gear3A\1.1.7_EYE_SA_RT_G3A.msk"
TEKEXP:VALUE ANALYZE,"Test 1.1.7-HS-TX G3, G4
and G5 Differential AC Eye","RT Gear3B LA Mask
file path 19.2MHz","INSTALL FOLDER\Compliance
Suites\MIPI\M-PHY\Transmitter\HS\Mask
Files\Gear3B\G3B_5p8368G_LA_RT.msk"
TEKEXP:VALUE ANALYZE,"Test 1.1.7-HS-TX G3,
G4 and G5 Differential AC Eye","RT Gear4A
LA Mask file path","INSTALL FOLDER\Compliance
Suites\MIPI\M-PHY\Transmitter\HS\Mask
Files\Gear4A\1.1.7_EYE_LA_RT_G4A.msk"
TEKEXP:VALUE ANALYZE,"Test 1.1.7-HS-TX G3,
G4 and G5 Differential AC Eye","RT Gear4A
SA Mask file path","INSTALL FOLDER\Compliance
Suites\MIPI\M-PHY\Transmitter\HS\Mask
Files\Gear4A\1.1.7_EYE_SA_RT_G4A.msk"
TEKEXP:VALUE ANALYZE,"Test 1.1.7-HS-TX G3,
G4 and G5 Differential AC Eye","RT Gear4B
LA Mask file path","INSTALL FOLDER\Compliance
Suites\MIPI\M-PHY\Transmitter\HS\Mask
Files\Gear4B\1.1.7_EYE_LA_RT_G4B.msk"
TEKEXP:VALUE ANALYZE,"Test 1.1.7-HS-TX G3, G4
and G5 Differential AC Eye","RT Gear4B SA Mask
file path 19.2MHz","INSTALL FOLDER\Compliance
Suites\MIPI\M-PHY\Transmitter\HS\Mask
Files\Gear4B\G4B_11p6736G_SA_RT.msk"
TEKEXP:VALUE ANALYZE,"Test 1.1.7-HS-TX G3,
G4 and G5 Differential AC Eye","RT Gear4B
SA Mask file path","INSTALL FOLDER\Compliance
Suites\MIPI\M-PHY\Transmitter\HS\Mask
Files\Gear4B\1.1.7_EYE_SA_RT_G4B.msk"
TEKEXP:VALUE ANALYZE,"Test 1.1.7-HS-TX G3, G4
and G5 Differential AC Eye","RT Gear4B LA Mask
file path 19.2MHz","INSTALL FOLDER\Compliance
Suites\MIPI\M-PHY\Transmitter\HS\Mask
Files\Gear4B\G4B_11p6736G_LA_RT.msk"
TEKEXP:VALUE ANALYZE,"Test 1.1.7-HS-TX G3,
G4 and G5 Differential AC Eye","RT Gear5A
LA Mask file path","INSTALL FOLDER\Compliance
Suites\MIPI\M-PHY\Transmitter\HS\Mask
Files\Gear5A\1.1.7_EYE_LA_RT_G5A.msk"
TEKEXP:VALUE? ANALYZE,"Test 1.1.7-HS-TX G3,
G4 and G5 Differential AC Eye","RT Gear3A SA Mask
file path"
TEKEXP:VALUE? ANALYZE,"Test 1.1.7-HS-TX G3,
G4 and G5 Differential AC Eye","RT Gear3B LA Mask
file path 19.2MHz"
TEKEXP:VALUE? ANALYZE,"Test 1.1.7-HS-TX G3,
G4 and G5 Differential AC Eye","RT Gear4A LA Mask
file path"
TEKEXP:VALUE? ANALYZE,"Test 1.1.7-HS-TX G3,
G4 and G5 Differential AC Eye","RT Gear4A SA Mask
file path"
TEKEXP:VALUE? ANALYZE,"Test 1.1.7-HS-TX G3,
G4 and G5 Differential AC Eye","RT Gear4B LA Mask
file path"
TEKEXP:VALUE? ANALYZE,"Test 1.1.7-HS-TX G3,
G4 and G5 Differential AC Eye","RT Gear4B SA Mask
file path 19.2MHz"
TEKEXP:VALUE? ANALYZE,"Test 1.1.7-HS-TX G3,
G4 and G5 Differential AC Eye","RT Gear4B SA Mask
file path"
TEKEXP:VALUE? ANALYZE,"Test 1.1.7-HS-TX G3,
G4 and G5 Differential AC Eye","RT Gear4B LA Mask
file path 19.2MHz"
TEKEXP:VALUE? ANALYZE,"Test 1.1.7-HS-TX G3,
G4 and G5 Differential AC Eye","RT Gear5A LA Mask
file path"
SCPI Commands
TekExpress® M-PHY Transmitter Automated Solution Application Help 83
Page 84

Parameter Names Example to set Example to query
RT Gear5A SA Mask file
path
RT Gear5B LA Mask file
path
RT Gear5B SA Mask file
path 19.2MHz
RT Gear5B SA Mask file
path
RT Gear5B LA Mask file
path 19.2MHz
SDLA Settings File Path TEKEXP:VALUE ANALYZE,"Test 1.1.7-HS-TX G3, G4
Gear4AB Short(CH1)
(Continuous)
Gear4AB Long(CH2)
(Continuous)
Gear4AB
Package(Continuous)
Gear4AB Short(CH1)
(Burst)
Table continued…
TEKEXP:VALUE ANALYZE,"Test 1.1.7-HS-TX G3,
G4 and G5 Differential AC Eye","RT Gear5A
SA Mask file path","INSTALL FOLDER\Compliance
Suites\MIPI\M-PHY\Transmitter\HS\Mask
Files\Gear5A\1.1.7_EYE_SA_RT_G5A.msk"
TEKEXP:VALUE ANALYZE,"Test 1.1.7-HS-TX G3,
G4 and G5 Differential AC Eye","RT Gear5B
LA Mask file path","INSTALL FOLDER\Compliance
Suites\MIPI\M-PHY\Transmitter\HS\Mask
Files\Gear5B\1.1.7_EYE_LA_RT_G5B.msk"
TEKEXP:VALUE ANALYZE,"Test 1.1.7-HS-TX G3, G4
and G5 Differential AC Eye","RT Gear5B SA Mask
file path 19.2MHz","INSTALL FOLDER\Compliance
Suites\MIPI\M-PHY\Transmitter\HS\Mask
Files\Gear5B\G5B_23p3472G_SA_RT.msk"
TEKEXP:VALUE ANALYZE,"Test 1.1.7-HS-TX G3,
G4 and G5 Differential AC Eye","RT Gear5B
SA Mask file path","INSTALL FOLDER\Compliance
Suites\MIPI\M-PHY\Transmitter\HS\Mask
Files\Gear5B\1.1.7_EYE_SA_RT_G5B.msk"
TEKEXP:VALUE ANALYZE,"Test 1.1.7-HS-TX G3, G4
and G5 Differential AC Eye","RT Gear5B LA Mask
file path 19.2MHz","INSTALL FOLDER\Compliance
Suites\MIPI\M-PHY\Transmitter\HS\Mask
Files\Gear5B\G5B_23p3472G_LA_RT.msk"
and G5 Differential AC Eye","SDLA Settings File
Path","INSTALL FOLDER\Compliance Suites\MIPI\M-
PHY\Transmitter\HS\SDLAEqualizerSettings.csv"
TEKEXP:VALUE ANALYZE,"Test 1.1.7-HS-TX
G3, G4 and G5 Differential AC
Eye","Gear4AB Short(CH1)(Continuous)","INSTALL
FOLDER\Lib\SDLA\Associated_s4p_file.s4p
TEKEXP:VALUE ANALYZE,"Test 1.1.7-HS-TX
G3, G4 and G5 Differential AC
Eye","Gear4AB Long(CH2)(Continuous)","INSTALL
FOLDER\Lib\SDLA\Associated_s4p_file.s4p
TEKEXP:VALUE ANALYZE,"Test 1.1.7-HS-TX
G3, G4 and G5 Differential AC
Eye","Gear4AB Package(Continuous)","INSTALL
FOLDER\Lib\SDLA\Associated_s4p_file.s4p
TEKEXP:VALUE ANALYZE,"Test 1.1.7-HS-TX G3,
G4 and G5 Differential AC Eye","Gear4AB
Short(CH1)(Burst)","INSTALL FOLDER\Lib\Filter
Files\Gear4B\26\Ref1.flt"
TEKEXP:VALUE? ANALYZE,"Test 1.1.7-HS-TX G3,
G4 and G5 Differential AC Eye","RT Gear5A SA Mask
file path"
TEKEXP:VALUE? ANALYZE,"Test 1.1.7-HS-TX G3,
G4 and G5 Differential AC Eye","RT Gear5B LA Mask
file path"
TEKEXP:VALUE? ANALYZE,"Test 1.1.7-HS-TX G3,
G4 and G5 Differential AC Eye","RT Gear5B SA Mask
file path 19.2MHz"
TEKEXP:VALUE? ANALYZE,"Test 1.1.7-HS-TX G3,
G4 and G5 Differential AC Eye","RT Gear5B SA Mask
file path"
TEKEXP:VALUE? ANALYZE,"Test 1.1.7-HS-TX G3,
G4 and G5 Differential AC Eye","RT Gear5B LA Mask
file path 19.2MHz"
TEKEXP:VALUE? ANALYZE,"Test 1.1.7-HS-TX G3,
G4 and G5 Differential AC Eye","SDLA Settings File
Path"
TEKEXP:VALUE? ANALYZE,"Test 1.1.7-HS-TX G3,
G4 and G5 Differential AC Eye","Gear4AB Short(CH1)
(Continuous)"
TEKEXP:VALUE? ANALYZE,"Test 1.1.7-HS-TX G3,
G4 and G5 Differential AC Eye","Gear4AB Long(CH2)
(Continuous)"
TEKEXP:VALUE? ANALYZE,"Test 1.1.7-HS-TX G3,
G4 and G5 Differential AC Eye","Gear4AB
Package(Continuous)"
TEKEXP:VALUE? ANALYZE,"Test 1.1.7-HS-TX G3,
G4 and G5 Differential AC Eye","Gear4AB Short(CH1)
(Burst)"
SCPI Commands
TekExpress® M-PHY Transmitter Automated Solution Application Help 84
Page 85

Parameter Names Example to set Example to query
Gear4AB Long(CH2)
(Burst)
Gear4AB Package(Burst) TEKEXP:VALUE ANALYZE,"Test 1.1.7-HS-TX G3,
Gear4A De-embed
Filter(Continuous)
Gear4B De-embed
Filter(Continuous)
Gear4A De-embed
Filter(Burst)
Gear4B De-embed
Filter(Burst)
Gear4AB Short TEKEXP:VALUE ANALYZE,"Test 1.1.7-HS-TX G3,
Gear4AB Long TEKEXP:VALUE ANALYZE,"Test 1.1.7-HS-TX G3,
Include Gear4AB
Package
Include Gear4A Deembed Filter
Include Gear4B Deembed Filter
Run Continuous as per
spec
Manual Setting Mode TEKEXP:VALUE ANALYZE,"Test 1.1.7-HS-TX G3,
Table continued…
TEKEXP:VALUE ANALYZE,"Test 1.1.7-HS-TX G3,
G4 and G5 Differential AC Eye","Gear4AB
Long(CH2)(Burst)","INSTALL FOLDER\Lib\Filter
Files\Gear4B\26\Ref2.flt"
G4 and G5 Differential AC Eye","Gear4AB
Package(Burst)","INSTALL FOLDER\Lib\Filter
Files\Gear4B\26\Package.flt"
TEKEXP:VALUE ANALYZE,"Test 1.1.7-HS-TX G3, G4
and G5 Differential AC Eye","Gear4A De-embed
Filter(Continuous)","INSTALL
FOLDER\Lib\SDLA\DeEmbed\Associated_s4p_file.s4
p
TEKEXP:VALUE ANALYZE,"Test 1.1.7-HS-TX G3, G4
and G5 Differential AC Eye","Gear4B De-embed
Filter(Continuous)","INSTALL
FOLDER\Lib\SDLA\DeEmbed\Associated_s4p_file.s4
p
TEKEXP:VALUE ANALYZE,"Test 1.1.7-HS-TX G3,
G4 and G5 Differential AC Eye","Gear4A De-embed
Filter(Burst)",""
TEKEXP:VALUE ANALYZE,"Test 1.1.7-HS-TX G3,
G4 and G5 Differential AC Eye","Gear4B De-embed
Filter(Burst)",""
G4 and G5 Differential AC Eye","Gear4AB
Short","Included"
G4 and G5 Differential AC Eye","Gear4AB
Long","Included"
TEKEXP:VALUE ANALYZE,"Test 1.1.7-HS-TX G3,
G4 and G5 Differential AC Eye","Include Gear4AB
Package","Included"
TEKEXP:VALUE ANALYZE,"Test 1.1.7-HS-TX G3,
G4 and G5 Differential AC Eye","Include Gear4A De-
embed Filter","Excluded"
TEKEXP:VALUE ANALYZE,"Test 1.1.7-HS-TX G3,
G4 and G5 Differential AC Eye","Include Gear4B De-
embed Filter","Excluded"
TEKEXP:VALUE ANALYZE,"Test 1.1.7-HS-TX G3, G4
and G5 Differential AC Eye","Run Continuous as per
spec","Excluded"
G4 and G5 Differential AC Eye","Manual Setting
Mode","UI Selection"
TEKEXP:VALUE? ANALYZE,"Test 1.1.7-HS-TX G3,
G4 and G5 Differential AC Eye","Gear4AB Long(CH2)
(Burst)"
TEKEXP:VALUE? ANALYZE,"Test 1.1.7-HS-TX G3,
G4 and G5 Differential AC Eye","Gear4AB
Package(Burst)"
TEKEXP:VALUE? ANALYZE,"Test 1.1.7-HS-TX G3,
G4 and G5 Differential AC Eye","Gear4A De-embed
Filter(Continuous)"
TEKEXP:VALUE? ANALYZE,"Test 1.1.7-HS-TX G3,
G4 and G5 Differential AC Eye","Gear4B De-embed
Filter(Continuous)"
TEKEXP:VALUE? ANALYZE,"Test 1.1.7-HS-TX G3,
G4 and G5 Differential AC Eye","Gear4A De-embed
Filter(Burst)"
TEKEXP:VALUE? ANALYZE,"Test 1.1.7-HS-TX G3,
G4 and G5 Differential AC Eye","Gear4B De-embed
Filter(Burst)"
TEKEXP:VALUE? ANALYZE,"Test 1.1.7-HS-TX G3,
G4 and G5 Differential AC Eye","Gear4AB Short"
TEKEXP:VALUE? ANALYZE,"Test 1.1.7-HS-TX G3,
G4 and G5 Differential AC Eye","Gear4AB Long"
TEKEXP:VALUE? ANALYZE,"Test 1.1.7-HS-TX G3,
G4 and G5 Differential AC Eye","Include Gear4AB
Package"
TEKEXP:VALUE? ANALYZE,"Test 1.1.7-HS-TX G3,
G4 and G5 Differential AC Eye","Include Gear4A Deembed Filter"
TEKEXP:VALUE? ANALYZE,"Test 1.1.7-HS-TX G3,
G4 and G5 Differential AC Eye","Include Gear4B Deembed Filter"
TEKEXP:VALUE? ANALYZE,"Test 1.1.7-HS-TX G3,
G4 and G5 Differential AC Eye","Run Continuous as
per spec"
TEKEXP:VALUE? ANALYZE,"Test 1.1.7-HS-TX G3,
G4 and G5 Differential AC Eye","Manual Setting
Mode"
SCPI Commands
TekExpress® M-PHY Transmitter Automated Solution Application Help 85
Page 86

Parameter Names Example to set Example to query
SDLA Mode TEKEXP:VALUE ANALYZE,"Test 1.1.7-HS-TX G3, G4
and G5 Differential AC Eye","SDLA Mode","Auto"
Adc TEKEXP:VALUE ANALYZE,"Test 1.1.7-HS-TX G3, G4
and G5 Differential AC Eye","Adc","2"
fz TEKEXP:VALUE ANALYZE,"Test 1.1.7-HS-TX G3, G4
and G5 Differential AC Eye","fz","1.2(GHz)"
fp1 TEKEXP:VALUE ANALYZE,"Test 1.1.7-HS-TX G3, G4
and G5 Differential AC Eye","fp1","2.3(GHz)"
fp2 TEKEXP:VALUE ANALYZE,"Test 1.1.7-HS-TX G3, G4
and G5 Differential AC Eye","fp2","10(GHz)"
De-Emphasis 6.0dB
Gear3A/3B
De-Emphasis 3.5dB
Gear3A/3B
De-Emphasis 0dB
Gear3A/3B
De-Emphasis 6.0dB
Gear4A/4B
De-Emphasis 3.5dB
Gear4A/4B
De-Emphasis 0dB
Gear4A/4B
De-Emphasis 0dB
Gear5A/5B
De-Emphasis 3.5dB
Gear5A/5B
De-Emphasis 6.0dB
Gear5A/5B
Include Gear5AB
Reference Channel(Ch1)
Gear5AB Reference
Channel(Ch1) Path
Table continued…
TEKEXP:VALUE ANALYZE,"Test 1.1.7-HS-TX G3, G4
and G5 Differential AC Eye","De-Emphasis 6.0dB
Gear3A/3B","Included"
TEKEXP:VALUE ANALYZE,"Test 1.1.7-HS-TX G3, G4
and G5 Differential AC Eye","De-Emphasis 3.5dB
Gear3A/3B","Included"
TEKEXP:VALUE ANALYZE,"Test 1.1.7-HS-TX G3,
G4 and G5 Differential AC Eye","De-Emphasis 0dB
Gear3A/3B","Included"
TEKEXP:VALUE ANALYZE,"Test 1.1.7-HS-TX G3, G4
and G5 Differential AC Eye","De-Emphasis 6.0dB
Gear4A/4B","Included"
TEKEXP:VALUE ANALYZE,"Test 1.1.7-HS-TX G3, G4
and G5 Differential AC Eye","De-Emphasis 3.5dB
Gear4A/4B","Included"
TEKEXP:VALUE ANALYZE,"Test 1.1.7-HS-TX G3,
G4 and G5 Differential AC Eye","De-Emphasis 0dB
Gear4A/4B","Included"
TEKEXP:VALUE ANALYZE,"Test 1.1.7-HS-TX G3,
G4 and G5 Differential AC Eye","De-Emphasis 0dB
Gear5A/5B","Included"
TEKEXP:VALUE ANALYZE,"Test 1.1.7-HS-TX G3, G4
and G5 Differential AC Eye","De-Emphasis 3.5dB
Gear5A/5B","Included"
TEKEXP:VALUE ANALYZE,"Test 1.1.7-HS-TX G3, G4
and G5 Differential AC Eye","De-Emphasis 6.0dB
Gear5A/5B","Included"
TEKEXP:VALUE ANALYZE,"Test 1.1.7-HS-TX G3,
G4 and G5 Differential AC Eye","Include Gear5AB
Reference Channel(Ch1)","Included"
TEKEXP:VALUE ANALYZE,"Test 1.1.7-HS-TX G3, G4
and G5 Differential AC Eye","Gear5AB Reference
Channel(Ch1) Path","INSTALL
FOLDER\Lib\SDLA\Gear-5A-5B\Associated_s4p_file.
s4p
TEKEXP:VALUE? ANALYZE,"Test 1.1.7-HS-TX G3,
G4 and G5 Differential AC Eye","SDLA Mode"
TEKEXP:VALUE? ANALYZE,"Test 1.1.7-HS-TX G3,
G4 and G5 Differential AC Eye","Adc"
TEKEXP:VALUE? ANALYZE,"Test 1.1.7-HS-TX G3,
G4 and G5 Differential AC Eye","fz"
TEKEXP:VALUE? ANALYZE,"Test 1.1.7-HS-TX G3,
G4 and G5 Differential AC Eye","fp1"
TEKEXP:VALUE? ANALYZE,"Test 1.1.7-HS-TX G3,
G4 and G5 Differential AC Eye","fp2"
TEKEXP:VALUE? ANALYZE,"Test 1.1.7-HS-TX G3,
G4 and G5 Differential AC Eye","De-Emphasis 6.0dB
Gear3A/3B"
TEKEXP:VALUE? ANALYZE,"Test 1.1.7-HS-TX G3,
G4 and G5 Differential AC Eye","De-Emphasis 3.5dB
Gear3A/3B"
TEKEXP:VALUE? ANALYZE,"Test 1.1.7-HS-TX G3,
G4 and G5 Differential AC Eye","De-Emphasis 0dB
Gear3A/3B"
TEKEXP:VALUE? ANALYZE,"Test 1.1.7-HS-TX G3,
G4 and G5 Differential AC Eye","De-Emphasis 6.0dB
Gear4A/4B"
TEKEXP:VALUE? ANALYZE,"Test 1.1.7-HS-TX G3,
G4 and G5 Differential AC Eye","De-Emphasis 3.5dB
Gear4A/4B"
TEKEXP:VALUE? ANALYZE,"Test 1.1.7-HS-TX G3,
G4 and G5 Differential AC Eye","De-Emphasis 0dB
Gear4A/4B"
TEKEXP:VALUE? ANALYZE,"Test 1.1.7-HS-TX G3,
G4 and G5 Differential AC Eye","De-Emphasis 0dB
Gear5A/5B"
TEKEXP:VALUE? ANALYZE,"Test 1.1.7-HS-TX G3,
G4 and G5 Differential AC Eye","De-Emphasis 3.5dB
Gear5A/5B"
TEKEXP:VALUE? ANALYZE,"Test 1.1.7-HS-TX G3,
G4 and G5 Differential AC Eye","De-Emphasis 6.0dB
Gear5A/5B"
TEKEXP:VALUE? ANALYZE,"Test 1.1.7-HS-TX G3,
G4 and G5 Differential AC Eye","Include Gear5AB
Reference Channel(Ch1)"
TEKEXP:VALUE? ANALYZE,"Test 1.1.7-HS-TX G3,
G4 and G5 Differential AC Eye","Gear5AB Reference
Channel(Ch1) Path"
SCPI Commands
TekExpress® M-PHY Transmitter Automated Solution Application Help 86
Page 87

Parameter Names Example to set Example to query
Include Gear5AB Tx
Package
Gear5AB Tx Package
Path
Include Gear5AB Rx
Package
Gear5AB Rx Package
Path
Include Gear5AB Tx Tcoll TEKEXP:VALUE ANALYZE,"Test 1.1.7-HS-TX G3, G4
Gear5AB Tx Tcoll Path TEKEXP:VALUE ANALYZE,"Test 1.1.7-HS-TX G3, G4
Include Gear5AB Rx Tcoll TEKEXP:VALUE ANALYZE,"Test 1.1.7-HS-TX G3, G4
Gear5AB Rx Tcoll Path TEKEXP:VALUE ANALYZE,"Test 1.1.7-HS-TX G3, G4
Include Gear5A Deembed Filter
Include Gear5B Deembed Filter
Gear5A De-embed
Filter(Continuous)
Table continued…
TEKEXP:VALUE ANALYZE,"Test 1.1.7-HS-TX G3, G4
and G5 Differential AC Eye","Include Gear5AB Tx
Package","Included"
TEKEXP:VALUE ANALYZE,"Test 1.1.7-HS-TX G3, G4
and G5 Differential AC Eye","Gear5AB Tx Package
Path","INSTALL
FOLDER\Lib\SDLA\Gear-5A-5B\Associated_s4p_file.
s4p
TEKEXP:VALUE ANALYZE,"Test 1.1.7-HS-TX G3, G4
and G5 Differential AC Eye","Include Gear5AB Rx
Package","Included"
TEKEXP:VALUE ANALYZE,"Test 1.1.7-HS-TX G3, G4
and G5 Differential AC Eye","Gear5AB Rx Package
Path","INSTALL
FOLDER\Lib\SDLA\Gear-5A-5B\Associated_s4p_file.
s4p
and G5 Differential AC Eye","Include Gear5AB Tx
Tcoll","Included"
and G5 Differential AC Eye","Gear5AB Tx Tcoll
Path","INSTALL
FOLDER\Lib\SDLA\Gear-5A-5B\Associated_s4p_file.
s4p
and G5 Differential AC Eye","Include Gear5AB Rx
Tcoll","Included"
and G5 Differential AC Eye","Gear5AB Rx Tcoll
Path","INSTALL
FOLDER\Lib\SDLA\Gear-5A-5B\Associated_s4p_file.
s4p
TEKEXP:VALUE ANALYZE,"Test 1.1.7-HS-TX G3,
G4 and G5 Differential AC Eye","Include Gear5A De-
embed Filter","Excluded"
TEKEXP:VALUE ANALYZE,"Test 1.1.7-HS-TX G3,
G4 and G5 Differential AC Eye","Include Gear5B De-
embed Filter","Excluded"
TEKEXP:VALUE ANALYZE,"Test 1.1.7-HS-TX G3, G4
and G5 Differential AC Eye","Gear5A De-embed
Filter(Continuous)","INSTALL
FOLDER\Lib\SDLA\DeEmbed\Associated_s4p_file.s4
p
TEKEXP:VALUE? ANALYZE,"Test 1.1.7-HS-TX G3,
G4 and G5 Differential AC Eye","Include Gear5AB Tx
Package"
TEKEXP:VALUE? ANALYZE,"Test 1.1.7-HS-TX G3,
G4 and G5 Differential AC Eye","Gear5AB Tx
Package Path"
TEKEXP:VALUE? ANALYZE,"Test 1.1.7-HS-TX G3,
G4 and G5 Differential AC Eye","Include Gear5AB Rx
Package"
TEKEXP:VALUE? ANALYZE,"Test 1.1.7-HS-TX G3,
G4 and G5 Differential AC Eye","Gear5AB Rx
Package Path"
TEKEXP:VALUE? ANALYZE,"Test 1.1.7-HS-TX G3,
G4 and G5 Differential AC Eye","Include Gear5AB Tx
Tcoll"
TEKEXP:VALUE? ANALYZE,"Test 1.1.7-HS-TX G3,
G4 and G5 Differential AC Eye","Gear5AB Tx Tcoll
Path"
TEKEXP:VALUE? ANALYZE,"Test 1.1.7-HS-TX G3,
G4 and G5 Differential AC Eye","Include Gear5AB Rx
Tcoll"
TEKEXP:VALUE? ANALYZE,"Test 1.1.7-HS-TX G3,
G4 and G5 Differential AC Eye","Gear5AB Rx Tcoll
Path"
TEKEXP:VALUE? ANALYZE,"Test 1.1.7-HS-TX G3,
G4 and G5 Differential AC Eye","Include Gear5A Deembed Filter"
TEKEXP:VALUE? ANALYZE,"Test 1.1.7-HS-TX G3,
G4 and G5 Differential AC Eye","Include Gear5B Deembed Filter"
TEKEXP:VALUE? ANALYZE,"Test 1.1.7-HS-TX G3,
G4 and G5 Differential AC Eye","Gear5A De-embed
Filter(Continuous)"
SCPI Commands
TekExpress® M-PHY Transmitter Automated Solution Application Help 87
Page 88

Parameter Names Example to set Example to query
Gear5B De-embed
Filter(Continuous)
Gear5A De-embed
Filter(Burst)
Gear5B De-embed
Filter(Burst)
Enable Eye Rendering
Gear3A3B
Enable Eye Rendering
Gear4A4B
Enable Eye Rendering
Gear5A5B
Reference levels TEKEXP:VALUE ANALYZE,"Test 1.2.1-PWM-
Reference Level - High
(%)
Reference Level - Low
(%)
Reference Level Hysteresis (%)
High Pass Filter Spec (F1) TEKEXP:VALUE ANALYZE,"Test 1.2.1-PWM-TX
High Pass Frequency F1
(MHz)
LS Prepare Length Gear0 TEKEXP:VALUE ANALYZE,"Test 1.2.3-PWM-TX
LS Prepare Length Gear1 TEKEXP:VALUE ANALYZE,"Test 1.2.3-PWM-TX
LS Prepare Length Gear2 TEKEXP:VALUE ANALYZE,"Test 1.2.3-PWM-TX
Table continued…
TEKEXP:VALUE ANALYZE,"Test 1.1.7-HS-TX G3, G4
and G5 Differential AC Eye","Gear5B De-embed
Filter(Continuous)","INSTALL
FOLDER\Lib\SDLA\DeEmbed\Associated_s4p_file.s4
p
TEKEXP:VALUE ANALYZE,"Test 1.1.7-HS-TX G3,
G4 and G5 Differential AC Eye","Gear5A De-embed
Filter(Burst)",""
TEKEXP:VALUE ANALYZE,"Test 1.1.7-HS-TX G3,
G4 and G5 Differential AC Eye","Gear5B De-embed
Filter(Burst)",""
TEKEXP:VALUE ANALYZE,"Test 1.1.7-HS-TX G3, G4
and G5 Differential AC Eye","Enable Eye Rendering
Gear3A3B","True"
TEKEXP:VALUE ANALYZE,"Test 1.1.7-HS-TX G3, G4
and G5 Differential AC Eye","Enable Eye Rendering
Gear4A4B","True"
TEKEXP:VALUE ANALYZE,"Test 1.1.7-HS-TX G3, G4
and G5 Differential AC Eye","Enable Eye Rendering
Gear5A5B","True"
TX Transmit Bit Duration","Reference
levels","Percentage"
TEKEXP:VALUE ANALYZE,"Test 1.2.1-PWM-TX
Transmit Bit Duration","Reference Level - High
(%)","80"
TEKEXP:VALUE ANALYZE,"Test 1.2.1-PWM-TX
Transmit Bit Duration","Reference Level - Low
(%)","20"
TEKEXP:VALUE ANALYZE,"Test 1.2.1-PWM-TX
Transmit Bit Duration","Reference Level - Hysteresis
(%)","10"
Transmit Bit Duration","High Pass Filter Spec
(F1)","FIRST"
TEKEXP:VALUE ANALYZE,"Test 1.2.1-PWM-TX
Transmit Bit Duration","High Pass Frequency F1
(MHz)","4"
PREPARE Length","LS Prepare Length Gear0","10"
PREPARE Length","LS Prepare Length Gear1","9"
PREPARE Length","LS Prepare Length Gear2","8"
TEKEXP:VALUE? ANALYZE,"Test 1.1.7-HS-TX G3,
G4 and G5 Differential AC Eye","Gear5B De-embed
Filter(Continuous)"
TEKEXP:VALUE? ANALYZE,"Test 1.1.7-HS-TX G3,
G4 and G5 Differential AC Eye","Gear5A De-embed
Filter(Burst)"
TEKEXP:VALUE? ANALYZE,"Test 1.1.7-HS-TX G3,
G4 and G5 Differential AC Eye","Gear5B De-embed
Filter(Burst)"
TEKEXP:VALUE? ANALYZE,"Test 1.1.7-HS-TX G3,
G4 and G5 Differential AC Eye","Enable Eye
Rendering Gear3A3B"
TEKEXP:VALUE? ANALYZE,"Test 1.1.7-HS-TX G3,
G4 and G5 Differential AC Eye","Enable Eye
Rendering Gear4A4B"
TEKEXP:VALUE? ANALYZE,"Test 1.1.7-HS-TX G3,
G4 and G5 Differential AC Eye","Enable Eye
Rendering Gear5A5B"
TEKEXP:VALUE? ANALYZE,"Test 1.2.1-PWM-TX
Transmit Bit Duration","Reference levels"
TEKEXP:VALUE? ANALYZE,"Test 1.2.1-PWM-TX
Transmit Bit Duration","Reference Level - High (%)"
TEKEXP:VALUE? ANALYZE,"Test 1.2.1-PWM-TX
Transmit Bit Duration","Reference Level - Low (%)"
TEKEXP:VALUE? ANALYZE,"Test 1.2.1-PWM-TX
Transmit Bit Duration","Reference Level - Hysteresis
(%)"
TEKEXP:VALUE? ANALYZE,"Test 1.2.1-PWM-TX
Transmit Bit Duration","High Pass Filter Spec (F1)"
TEKEXP:VALUE? ANALYZE,"Test 1.2.1-PWM-TX
Transmit Bit Duration","High Pass Frequency F1
(MHz)"
TEKEXP:VALUE? ANALYZE,"Test 1.2.3-PWM-TX
PREPARE Length","LS Prepare Length Gear0"
TEKEXP:VALUE? ANALYZE,"Test 1.2.3-PWM-TX
PREPARE Length","LS Prepare Length Gear1"
TEKEXP:VALUE? ANALYZE,"Test 1.2.3-PWM-TX
PREPARE Length","LS Prepare Length Gear2"
SCPI Commands
TekExpress® M-PHY Transmitter Automated Solution Application Help 88
Page 89

Parameter Names Example to set Example to query
LS Prepare Length Gear3 TEKEXP:VALUE ANALYZE,"Test 1.2.3-PWM-TX
PREPARE Length","LS Prepare Length Gear3","7"
LS Prepare Length Gear4 TEKEXP:VALUE ANALYZE,"Test 1.2.3-PWM-TX
PREPARE Length","LS Prepare Length Gear4","6"
LS Prepare Length Gear5 TEKEXP:VALUE ANALYZE,"Test 1.2.3-PWM-TX
PREPARE Length","LS Prepare Length Gear5","5"
LS Prepare Length Gear6 TEKEXP:VALUE ANALYZE,"Test 1.2.3-PWM-TX
PREPARE Length","LS Prepare Length Gear6","4"
LS Prepare Length Gear7 TEKEXP:VALUE ANALYZE,"Test 1.2.3-PWM-TX
PREPARE Length","LS Prepare Length Gear7","3"
Gear1A Filter blanking
time (ms)
High pass filter (F1) spec TEKEXP:VALUE ANALYZE,"Test 1.3.1-SYS-TX Unit
Filter blanking time (ms) TEKEXP:VALUE ANALYZE,"Test 1.3.2-SYS-TX Ref
LS Prepare Length
19.2MHz
LS Prepare Length
26MHz
LS Prepare Length
38.4MHz
LS Prepare Length
52MHz
RT 19.2MHz LA Mask file
path
RT 19.2MHz SA Mask file
path
Table continued…
TEKEXP:VALUE ANALYZE,"Test 1.2.9-PWM-TX
Lane-Lane Output Skew","Gear1A Filter blanking time
(ms)","4"
Interval and Frequency Offset","High pass filter (F1)
spec","NONE"
Clock frequency","Filter blanking time (ms)","0.25"
TEKEXP:VALUE ANALYZE,"Test 1.3.3-SYS-TX
PREPARE Length","LS Prepare Length
19.2MHz","10"
TEKEXP:VALUE ANALYZE,"Test 1.3.3-SYS-TX
PREPARE Length","LS Prepare Length 26MHz","10"
TEKEXP:VALUE ANALYZE,"Test 1.3.3-SYS-TX
PREPARE Length","LS Prepare Length
38.4MHz","10"
TEKEXP:VALUE ANALYZE,"Test 1.3.3-SYS-TX
PREPARE Length","LS Prepare Length 52MHz","10"
TEKEXP:VALUE ANALYZE,"Test 1.3.7-SYS-
TX Maximum Diffrential AC Output
Voltage Amplitude","RT 19.2MHz LA Mask
file path","INSTALL FOLDER\Compliance
Suites\MIPI\M-PHY\Transmitter\SYS\Mask
Files\19.2MHz\1.3.7_T_EYE_TX_LA_RT_19.2.msk"
TEKEXP:VALUE ANALYZE,"Test 1.3.7-SYS-TX
Maximum Diffrential AC Output Voltage
Amplitude","RT 19.2MHz SA Mask
file path","INSTALL FOLDER\Compliance
Suites\MIPI\M-PHY\Transmitter\SYS\Mask
Files\19.2MHz\1.3.7_T_EYE_TX_SA_RT_19.2.msk"
TEKEXP:VALUE? ANALYZE,"Test 1.2.3-PWM-TX
PREPARE Length","LS Prepare Length Gear3"
TEKEXP:VALUE? ANALYZE,"Test 1.2.3-PWM-TX
PREPARE Length","LS Prepare Length Gear4"
TEKEXP:VALUE? ANALYZE,"Test 1.2.3-PWM-TX
PREPARE Length","LS Prepare Length Gear5"
TEKEXP:VALUE? ANALYZE,"Test 1.2.3-PWM-TX
PREPARE Length","LS Prepare Length Gear6"
TEKEXP:VALUE? ANALYZE,"Test 1.2.3-PWM-TX
PREPARE Length","LS Prepare Length Gear7"
TEKEXP:VALUE? ANALYZE,"Test 1.2.9-PWM-TX
Lane-Lane Output Skew","Gear1A Filter blanking time
(ms)"
TEKEXP:VALUE? ANALYZE,"Test 1.3.1-SYS-TX Unit
Interval and Frequency Offset","High pass filter (F1)
spec"
TEKEXP:VALUE? ANALYZE,"Test 1.3.2-SYS-TX Ref
Clock frequency","Filter blanking time (ms)"
TEKEXP:VALUE? ANALYZE,"Test 1.3.3-SYS-TX
PREPARE Length","LS Prepare Length 19.2MHz"
TEKEXP:VALUE? ANALYZE,"Test 1.3.3-SYS-TX
PREPARE Length","LS Prepare Length 26MHz"
TEKEXP:VALUE? ANALYZE,"Test 1.3.3-SYS-TX
PREPARE Length","LS Prepare Length 38.4MHz"
TEKEXP:VALUE? ANALYZE,"Test 1.3.3-SYS-TX
PREPARE Length","LS Prepare Length 52MHz"
TEKEXP:VALUE? ANALYZE,"Test 1.3.7-SYS-TX
Maximum Diffrential AC Output Voltage
Amplitude","RT 19.2MHz LA Mask file path"
TEKEXP:VALUE? ANALYZE,"Test 1.3.7-SYS-TX
Maximum Diffrential AC Output Voltage
Amplitude","RT 19.2MHz SA Mask file path"
SCPI Commands
TekExpress® M-PHY Transmitter Automated Solution Application Help 89
Page 90

Parameter Names Example to set Example to query
NT 19.2MHz LA Mask file
path
NT 19.2MHz SA Mask file
path
RT 26MHz LA Mask file
path
RT 26MHz SA Mask file
path
NT 26MHz LA Mask file
path
NT 26MHz SA Mask file
path
RT 38.4MHz LA Mask file
path
RT 38.4MHz SA Mask file
path
Table continued…
TEKEXP:VALUE ANALYZE,"Test 1.3.7-SYS-
TX Maximum Diffrential AC Output
Voltage Amplitude","NT 19.2MHz LA Mask
file path","INSTALL FOLDER\Compliance
Suites\MIPI\M-PHY\Transmitter\SYS\Mask
Files\19.2MHz\1.3.7_T_EYE_TX_LA_NT_19.2.msk"
TEKEXP:VALUE ANALYZE,"Test 1.3.7-SYS-TX
Maximum Diffrential AC Output Voltage
Amplitude","NT 19.2MHz SA Mask
file path","INSTALL FOLDER\Compliance
Suites\MIPI\M-PHY\Transmitter\SYS\Mask
Files\19.2MHz\1.3.7_T_EYE_TX_SA_NT_19.2.msk"
TEKEXP:VALUE ANALYZE,"Test 1.3.7-SYS-
TX Maximum Diffrential AC Output
Voltage Amplitude","RT 26MHz LA Mask
file path","INSTALL FOLDER\Compliance
Suites\MIPI\M-PHY\Transmitter\SYS\Mask
Files\26MHz\1.3.7_T_EYE_TX_LA_RT_26.msk"
TEKEXP:VALUE ANALYZE,"Test 1.3.7-SYS-
TX Maximum Diffrential AC Output
Voltage Amplitude","RT 26MHz SA Mask
file path","INSTALL FOLDER\Compliance
Suites\MIPI\M-PHY\Transmitter\SYS\Mask
Files\26MHz\1.3.7_T_EYE_TX_SA_RT_26.msk"
TEKEXP:VALUE ANALYZE,"Test 1.3.7-SYS-
TX Maximum Diffrential AC Output
Voltage Amplitude","NT 26MHz LA Mask
file path","INSTALL FOLDER\Compliance
Suites\MIPI\M-PHY\Transmitter\SYS\Mask
Files\26MHz\1.3.7_T_EYE_TX_LA_NT_26.msk"
TEKEXP:VALUE ANALYZE,"Test 1.3.7-SYS-
TX Maximum Diffrential AC Output
Voltage Amplitude","NT 26MHz SA Mask
file path","INSTALL FOLDER\Compliance
Suites\MIPI\M-PHY\Transmitter\SYS\Mask
Files\26MHz\1.3.7_T_EYE_TX_SA_NT_26.msk"
TEKEXP:VALUE ANALYZE,"Test 1.3.7-SYS-
TX Maximum Diffrential AC Output
Voltage Amplitude","RT 38.4MHz LA Mask
file path","INSTALL FOLDER\Compliance
Suites\MIPI\M-PHY\Transmitter\SYS\Mask
Files\38.4MHz\1.3.7_T_EYE_TX_LA_RT_38.4.msk"
TEKEXP:VALUE ANALYZE,"Test 1.3.7-SYS-TX
Maximum Diffrential AC Output Voltage
Amplitude","RT 38.4MHz SA Mask
file path","INSTALL FOLDER\Compliance
Suites\MIPI\M-PHY\Transmitter\SYS\Mask
Files\38.4MHz\1.3.7_T_EYE_TX_SA_RT_38.4.msk"
TEKEXP:VALUE? ANALYZE,"Test 1.3.7-SYS-TX
Maximum Diffrential AC Output Voltage
Amplitude","NT 19.2MHz LA Mask file path"
TEKEXP:VALUE? ANALYZE,"Test 1.3.7-SYS-TX
Maximum Diffrential AC Output Voltage
Amplitude","NT 19.2MHz SA Mask file path"
TEKEXP:VALUE? ANALYZE,"Test 1.3.7-SYS-TX
Maximum Diffrential AC Output Voltage
Amplitude","RT 26MHz LA Mask file path"
TEKEXP:VALUE? ANALYZE,"Test 1.3.7-SYS-TX
Maximum Diffrential AC Output Voltage
Amplitude","RT 26MHz SA Mask file path"
TEKEXP:VALUE? ANALYZE,"Test 1.3.7-SYS-TX
Maximum Diffrential AC Output Voltage
Amplitude","NT 26MHz LA Mask file path"
TEKEXP:VALUE? ANALYZE,"Test 1.3.7-SYS-TX
Maximum Diffrential AC Output Voltage
Amplitude","NT 26MHz SA Mask file path"
TEKEXP:VALUE? ANALYZE,"Test 1.3.7-SYS-TX
Maximum Diffrential AC Output Voltage
Amplitude","RT 38.4MHz LA Mask file path"
TEKEXP:VALUE? ANALYZE,"Test 1.3.7-SYS-TX
Maximum Diffrential AC Output Voltage
Amplitude","RT 38.4MHz SA Mask file path"
SCPI Commands
TekExpress® M-PHY Transmitter Automated Solution Application Help 90
Page 91

Parameter Names Example to set Example to query
NT 38.4MHz LA Mask file
path
NT 38.4MHz SA Mask file
path
RT 52MHz LA Mask file
path
RT 52MHz SA Mask file
path
NT 52MHz LA Mask file
path
NT 52MHz SA Mask file
path
Gear1A Filter ramp time
(ms)
TEKEXP:VALUE ANALYZE,"Test 1.3.7-SYS-
TX Maximum Diffrential AC Output
Voltage Amplitude","NT 38.4MHz LA Mask
file path","INSTALL FOLDER\Compliance
Suites\MIPI\M-PHY\Transmitter\SYS\Mask
Files\38.4MHz\1.3.7_T_EYE_TX_LA_NT_38.4.msk"
TEKEXP:VALUE ANALYZE,"Test 1.3.7-SYS-TX
Maximum Diffrential AC Output Voltage
Amplitude","NT 38.4MHz SA Mask
file path","INSTALL FOLDER\Compliance
Suites\MIPI\M-PHY\Transmitter\SYS\Mask
Files\38.4MHz\1.3.7_T_EYE_TX_SA_NT_38.4.msk"
TEKEXP:VALUE ANALYZE,"Test 1.3.7-SYS-
TX Maximum Diffrential AC Output
Voltage Amplitude","RT 52MHz LA Mask
file path","INSTALL FOLDER\Compliance
Suites\MIPI\M-PHY\Transmitter\SYS\Mask
Files\52MHz\1.3.7_T_EYE_TX_LA_RT_52.msk"
TEKEXP:VALUE ANALYZE,"Test 1.3.7-SYS-
TX Maximum Diffrential AC Output
Voltage Amplitude","RT 52MHz SA Mask
file path","INSTALL FOLDER\Compliance
Suites\MIPI\M-PHY\Transmitter\SYS\Mask
Files\52MHz\1.3.7_T_EYE_TX_SA_RT_52.msk"
TEKEXP:VALUE ANALYZE,"Test 1.3.7-SYS-
TX Maximum Diffrential AC Output
Voltage Amplitude","NT 52MHz LA Mask
file path","INSTALL FOLDER\Compliance
Suites\MIPI\M-PHY\Transmitter\SYS\Mask
Files\52MHz\1.3.7_T_EYE_TX_LA_NT_52.msk"
TEKEXP:VALUE ANALYZE,"Test 1.3.7-SYS-
TX Maximum Diffrential AC Output
Voltage Amplitude","NT 52MHz SA Mask
file path","INSTALL FOLDER\Compliance
Suites\MIPI\M-PHY\Transmitter\SYS\Mask
Files\52MHz\1.3.7_T_EYE_TX_SA_NT_52.msk"
TEKEXP:VALUE ANALYZE,"Test 1.3.9-SYS-TX Lane-
Lane Output Skew","Gear1A Filter ramp time
(ms)","2"
TEKEXP:VALUE? ANALYZE,"Test 1.3.7-SYS-TX
Maximum Diffrential AC Output Voltage
Amplitude","NT 38.4MHz LA Mask file path"
TEKEXP:VALUE? ANALYZE,"Test 1.3.7-SYS-TX
Maximum Diffrential AC Output Voltage
Amplitude","NT 38.4MHz SA Mask file path"
TEKEXP:VALUE? ANALYZE,"Test 1.3.7-SYS-TX
Maximum Diffrential AC Output Voltage
Amplitude","RT 52MHz LA Mask file path"
TEKEXP:VALUE? ANALYZE,"Test 1.3.7-SYS-TX
Maximum Diffrential AC Output Voltage
Amplitude","RT 52MHz SA Mask file path"
TEKEXP:VALUE? ANALYZE,"Test 1.3.7-SYS-TX
Maximum Diffrential AC Output Voltage
Amplitude","NT 52MHz LA Mask file path"
TEKEXP:VALUE? ANALYZE,"Test 1.3.7-SYS-TX
Maximum Diffrential AC Output Voltage
Amplitude","NT 52MHz SA Mask file path"
TEKEXP:VALUE? ANALYZE,"Test 1.3.9-SYS-TX
Lane-Lane Output Skew","Gear1A Filter ramp time
(ms)"
SCPI Commands
TekExpress® M-PHY Transmitter Automated Solution Application Help 91
Page 92

References
References
Application directories
You can find the application files at C:\Program Files\Tektronix\TekExpress M-PHY Tx. The application directory and associated files are
organized as follows:
The following table lists the default directory names and their usage:
Table 20: Application directories and usage
Directory names Usage
Bin Contains application libraries
Compliance Suites Contains test suite specific files
ICP Contains instrument and application specific interface libraries
Images Contains images of the application
Lib Contains utility files specific to the application
Licenses Contains all the license files
Report Generator Contains style sheets for report generation
Tools Contains instrument and application specific files
File name extensions
The TekExpress M-PHY Tx software uses the following file name extensions:
Table 21: File name extension
File name extension Description
*.TekX Application session files (the extensions may not be displayed)
*.py Python sequence file.
*.xml
*.csv
*.mht
*.pdf
*.xslt Style sheet used to generate reports
*.png Captured images
Test-specific configuration information (encrypted) files.
Application log files
Test result reports
Plot data
Test result reports (default)
Test reports can also be saved in HTML format
Test result reports
Application help document
TekExpress® M-PHY Transmitter Automated Solution Application Help 92
Page 93

References
View test-related files
Files related to tests are stored in My Documents\TekExpress M-PHY Tx\Untitled session folder. Each test setup in this folder has both a
test setup file and a test setup folder, both with the test setup name. The test setup file is preceded by the TekExpress icon.
Inside the test setup folder is another folder named for the DUT ID used in the test sessions. The default is DUT001.
Inside the DUT001 folder are the session folders and files. Each session also has a folder and file pair, both named for the test session
using the naming convention (date)_(time). Each session file is stored outside its matching session folder:
Each session folder contains image files of any plots generated from running the test session. If you selected to save all waveforms or ran
tests using prerecorded waveform files, these are included here.
The first time you run a new, unsaved session, the session files are stored in the Untitled Session folder located at X:\TekExpress M-PHY
Tx. When you name and save the session, the files are placed in a folder with the name that you specify. A copy of the test files stay in the
Untitled Session folder until you run a new test or until you close the application.
Waveform naming conventions (pre-recorded mode)
HS test output file name conventions
The following file name syntax is used for HS test output waveform files:
[Lanex]-[Source]-[AcquireType]-[Termination]-[Gear]-[Amplitude]-[SRn]-[RecordLength in M]-[SampleRate in G]-[Diff/SEPos/SENeg].wfm
Table 22: Waveform naming convention for HS signal type in TekExpress M-PHY Tx v10.2 and above
Test Name Acquistion Acquistion Name Waveform Naming in Pre-recorded mode for HS-Signal type
Differential Single Ended
Test 1.1.1 1 CRPAT Lane0-CH1-CRPAT-RT-Gear4A-LATest 1.1.3
Test 1.1.4
Test 1.1.5
Test 1.1.8
Test 1.1.14
Test 1.1.2 2 CRPAT PSD-Single-
ended
Test 1.1.6 3 CRPAT - 3M Not applicable for pre-recorded mode
Test 1.1.7 4 CRPAT - Eye Not applicable for pre-recorded mode
Table continued…
SR1-5M-100G-Diff.wfm
Not applicable for pre-recorded mode
Lane0-CH1-CRPAT-RT-Gear4A-LASR1-5M-100G-SEPos.wfm
Lane0-CH3-CRPAT-RT-Gear4A-LASR1-5M-100G-SENeg.wfm
TekExpress® M-PHY Transmitter Automated Solution Application Help 93
Page 94

Test Name Acquistion Acquistion Name Waveform Naming in Pre-recorded mode for HS-Signal type
Differential Single Ended
Test 1.1.9 5 CRPAT-Lane-Lane
Lane0-Lane1-CH2-CRPAT-Lane-LaneRT-Gear4A-LA-SR1-5M-100G-Diff
Lane0-Lane1-CH1-CRPAT-Lane-Lane-RTGear4A-LA-SR1-5M-100G-SEPos.wfm
References
Test 1.1.10 6 CRPAT SlewRate
Test 1.1.11
Test 1.1.12
Test 1.1.13 7 CRPAT-Single-
ended
Test 1.1.15 8 CRPAT
Test 1.1.16
Test 1.1.17
Test 1.1.18
Ber Eye
Contour
9 CRPAT - 3M Not applicable for pre-recorded mod
Lane0-Lane1-CH4-CRPAT-Lane-LaneRT-Gear4A-LA-SR1-5M-100G-Diff
Lane0-CH1-CRPATSlewRate-RTGear4A-LA-SR1-5M-100G-Diff.wfm
Lane0-CH1-CRPATSlewRate-RTGear4A-LA-SR2-5M-100G-Diff.wfm
Not applicable for differential mode
Lane0-CH1-CRPAT-RT-Gear4A-LASR1-10M-100G-Diff.wfm
Lane0-Lane1-CH3-CRPAT-Lane-Lane-RTGear4A-LA-SR1-5M-100G-SENeg.wfm
Lane0-Lane1-CH2-CRPAT-Lane-Lane-RTGear4A-LA-SR1-5M-100G-SEPos.wfm
Lane0-Lane1-CH4-CRPAT-Lane-Lane-RTGear4A-LA-SR1-5M-100G-SENeg.wfm
Lane0-CH1-CRPATSlewRate-RT-Gear4ALA-SR1-5M-100G-SEPos.wfm
Lane0-CH3-CRPATSlewRate-RT-Gear4ALA-SR1-5M-100G-SENeg.wfm
Lane0-CH1-CRPATSlewRate-RT-Gear4ALA-SR2-5M-100G-SEPos.wfm
Lane0-CH3-CRPATSlewRate-RT-Gear4ALA-SR2-5M-100G-SENeg.wfm
Lane0-CH1-CRPAT-Single-ended-RTGear4A-LA-SR1-5M-100G-SEPos.wfm
Lane0-CH3-CRPAT-Single-ended-RTGear4A-LA-SR1-5M-100G-SENeg.wfm
Lane0-CH1-CRPAT-RT-Gear4A-LASR1-10M-100G-SEPos.wfm
Lane0-CH3-CRPAT-RT-Gear4A-LASR1-10M-100G-SENeg.wfm
PWM test output file name conventions
The following file name syntax is used for PWM test output waveform files:
[LANEx] [CHy] [CRPAT] [Termination] [Gear] [Amplitude] [Horizontal Scale] [Resolution] [POS/NEG].wfm
The following are a few PWM file name examples:
Lane0 CH3 CRPAT RT Gear0 LA 2000usdiv 4000pspt POS.wfm
Lane0 CH3 CRPAT RT Gear0 LA 2000usdiv 4000pspt NEG.wfm
SYS test output file name conventions
The following file name syntax is used for SYS test output waveform files:
[LANEx] [CHy] [CRPAT] [Termination] [Gear] [Amplitude] [Horizontal Scale] [Resolution] [POS/NEG].wfm
In the pre recorded mode, the automation expects the waveforms to be provided in the same naming format.
TekExpress® M-PHY Transmitter Automated Solution Application Help 94
Page 95

References
Note: For Lane to Lane skew measurements in HS, PWM, and SYS (Test 1.1.9 - HS-TX Lane-to-Lane Skew, 1.2.9 - PWM-TX
Lane-to Lane Skew, and 1.3.9 -SYS-TX Lane-to-Lane Skew) uses inputs from two lanes. The following file name syntax is used
for Lane to Lane skew measurements for HS, PWM and SYS tests for output waveform file:
[LANEx] [LANEX1] [CHy] [CRPAT] [Termination] [Gear] [Amplitude] [Horizontal Scale] [Resolution] [POS/NEG].wfm
where X is reference lane (Lane0/L0) and X1 is another lane (Lane1, Lane2, Lane3...).
UFS4 test output file name conventions
The following file name syntax is used for UFS test output waveform files:
UFS4-[Source]-[AcquireType]-[Termination]-[Frequency]-[RecordLength in M]-[SampleRate in G]-[Diff/SEPos/SENeg].wfm
Table 23: Waveform naming convention for UFS4 Ref Clock signal type in TekExpress M-PHY Tx v10.2 and above
Test Name Acquistion Acquistion
Name
Frequency 1 UFS4-RefFrequency Error
Input High Voltage
Input Low Voltage
Input Clock Rise Time
Input Clock Fall Time
Duty Cycle
RJ
DJ
Clock
Waveform Naming in Pre-recorded mode for UFS4-Signal type
Differential Single Ended
UFS4-CH1-UFS4-Ref-ClockNT-52MHz-5M-25G-Diff.wfm
UFS4-CH1-UFS4-Ref-ClockNT-52MHz-5M-25G-SEPos.wfm
UFS4-CH3-UFS4-Ref-ClockNT-52MHz-5M-25G-SENeg.wfm
TekExpress® M-PHY Transmitter Automated Solution Application Help 95
Page 96

Index
A
About SCPI command 49
Acquisition tab
Acquisition 33
Activate the license
license 12
Application
exit 19
license 18
Application controls
Application controls menu 20
Application directories 92
C
Configuration tab
Configuration 35
Configure report view settings 45
Configure the test setup 25
Connected instruments
searching for 24
Contacting Tektronix 10
Conventions 9
D
Demo mode 18
Downloading and installing the software
Download the software
Install the software 12
DUT
DUT tab 26
DUT settings 26
H
Hardware requirements
Hardware 11
HS tests 11
I
Icons used
symbols 9
Instrument Control Settings 15
Instruments
discovering connected 24
K
Keep On Top 18
L
Launch the application 18
License 18
license key 13
load the saved test setup
load the test setup 47
Log view 41
Log View 40
M
measurement limits for tests 35
Minimum system requirements 11
My TekExpress folder
locating 16
E
Email notification and setup 23
Evaluation mode 18
Exiting the application 19
F
File name extensions 92
Filter the test results 42
G
Getting help and support 9
Getting started 11
GPIB 24
|
N
Non-VISA 24
O
Options menu
Instrument control settings 24
Keep On Top 18
Options menu functions 22
Oscilloscopes supported 11
P
Pre-run checklist 16, 17
Preferences menu 42
Page 97

Preferences tab
Preferences 39
probes supported 11
Product documents
TekExpress M-PHY Tx documents 9
PWM tests 11
R
recalling test setup 47
References 92
Remote commands 49
Report configuration settings 43
report generation settings
Configure report generation settings 43
Reports
receiving in email notifications 23
Reports panel 43
Results panel 42
Running tests 16
S
Save the configured test setup
Save the test setup 47
Save the test setup 48
Save the test setup with a different name 48
Saving test setup 47
SCPI command 49
SCPI commands
TEKEXP:*IDN? 55
TEKEXP:*OPC? 55
TEKEXP:ACQUIRE_MODE 56
TEKEXP:ACQUIRE_MODE? 56
TEKEXP:EXPORT 56
TEKEXP:INFO? 56
TEKEXP:INSTRUMENT 57
TEKEXP:INSTRUMENT? 57
TEKEXP:LASTERROR? 57
TEKEXP:LIST? 57
TEKEXP:MODE 58
TEKEXP:MODE? 58
TEKEXP:POPUP 58
TEKEXP:POPUP? 59
TEKEXP:REPORT 59
TEKEXP:REPORT? 59
TEKEXP:RESULT? 59
TEKEXP:SELECT 60
TEKEXP:SELECT? 60
TEKEXP:SETUP 61
TEKEXP:STATE 61
TEKEXP:STATE? 61
TEKEXP:VALUE 61
TEKEXP:VALUE? 62
SCPI Commands
SCPI Commands (continued)
SCPI 49
Search instruments connected
instruments connected to the application 15
Select a loaded test setup 47
Select a pre-run session loaded test setup 47
Select the tests 32
Setting up the test environment
test environment 14
Setup panel 25
Signal Path Compensation (SPC) 16
Socket configuration for SCPI commands
Socket configuration 49
Software requirements
Softwares 12
software version 13
Start the application 18
Status panel 40
Support 10
Supported instruments 11
Supported oscilloscopes 11
Supported probes 11
System requirements 11
T
Technical support 10
Tek Link 24
test execution status 40
Test groups 14
Test results
send by email 23
test run preferences 39
Test Selection
Test Selection tab 32
Test setup files overview
Test setup files 47
Test setup overview 14
Test Status 40
Tests
running 16
setting up 14
U
Untitled Session folder 16
V
View a report 46
View summary of test results
summary of test results 42
View test execution logs 41
View the test execution status 40
|
Page 98

W
waveform acquisition settings 33
|
 Loading...