

Page 1
TekExpress® Ethernet Electrical Testing Application
Application Help
*P 077163503 *
077-1635-03
Page 2

Page 3

TekExpress® Ethernet Electrical Testing Application
Application Help
Register now!
Click the following link to protect your product.
www.tek.com/register
*P 077163503 *
077-1635-03
Page 4

Copyright © Tektronix. All rights reserved. Licensed software products are owned by Tektronix or its subsidiaries or suppliers, and are
protected by national copyright laws and international treaty provisions. Tektronix products are covered by U.S. and foreign patents, issued
and pending. Information in this publication supersedes that in all previously published material. Specifications and price change privileges
reserved.
TEKTRONIX and TEK are registered trademarks of Tektronix, Inc.
Tektronix, Inc.
14150 SW Karl Braun Drive
P.O. Box 500
Beaverton, OR 97077
USA
For product information, sales, service, and technical support:
• In North America, call 1-800-833-9200.
• Worldwide, visit www.tek.com to find contacts in your area.
Page 5

Table of Contents
Table of Contents
List of Figures................................................................................................................................................................................8
List of Tables............................................................................................................................................................................... 10
Welcome......................................................................................................................................................................................11
Contacting Tektronix....................................................................................................................................................................12
Getting help and support.............................................................................................................................................................13
Conventions......................................................................................................................................................................... 13
Related documentation........................................................................................................................................................ 13
Technical support................................................................................................................................................................. 14
Getting started.............................................................................................................................................................................15
Minimum system requirements............................................................................................................................................ 15
Instruments and accessories required................................................................................................................................. 15
Installing the software.......................................................................................................................................................... 16
Application directories..........................................................................................................................................................16
File name extensions........................................................................................................................................................... 17
View software version.......................................................................................................................................................... 18
Operating basics......................................................................................................................................................................... 19
Launch the application......................................................................................................................................................... 19
Application panels overview.................................................................................................................................................19
Global application controls...................................................................................................................................................21
Application controls.......................................................................................................................................................21
Options menu overview................................................................................................................................................ 22
TekExpress instrument control settings........................................................................................................................ 23
View connected instruments.........................................................................................................................................24
Configure email settings............................................................................................................................................... 25
Setup panel..........................................................................................................................................................................26
Setup panel overview................................................................................................................................................... 26
Set DUT parameters.....................................................................................................................................................26
Select tests................................................................................................................................................................... 28
Set acquisition tab parameters..................................................................................................................................... 29
Set configuration tab parameters..................................................................................................................................30
Set preferences tab parameters................................................................................................................................... 54
Status panel......................................................................................................................................................................... 55
Status panel overview...................................................................................................................................................55
Results panel....................................................................................................................................................................... 56
Results panel overview.................................................................................................................................................56
View test-related files....................................................................................................................................................57
Plots panel........................................................................................................................................................................... 58
Plots panel overview.....................................................................................................................................................58
Reports panel.......................................................................................................................................................................59
Reports panel overview................................................................................................................................................ 59
Select report options.....................................................................................................................................................60
View a report.................................................................................................................................................................61
Report contents............................................................................................................................................................ 62
Running tests.............................................................................................................................................................................. 63
TekExpress® Ethernet Electrical Testing Application Application Help 5
Page 6

Table of Contents
1000BASE-T connection diagram........................................................................................................................................63
100BASE-T connection diagram..........................................................................................................................................78
10BASE-T connection diagram............................................................................................................................................82
Prerequisite..........................................................................................................................................................................85
Compensate the signal path......................................................................................................................................... 85
Running tests....................................................................................................................................................................... 86
View test results...................................................................................................................................................................86
Saving and recalling test setup................................................................................................................................................... 87
Test setup files overview...................................................................................................................................................... 87
Save a test setup................................................................................................................................................................. 87
Open (load) a saved test setup............................................................................................................................................87
Create a test setup from default settings............................................................................................................................. 87
Create a test setup using an existing one............................................................................................................................88
SCPI Commands........................................................................................................................................................................ 89
About SCPI command......................................................................................................................................................... 89
Socket configuration for SCPI commands........................................................................................................................... 89
TEKEXP:*IDN?.................................................................................................................................................................... 95
TEKEXP:*OPC?...................................................................................................................................................................96
TEKEXP:ACQUIRE_MODE.................................................................................................................................................96
TEKEXP:ACQUIRE_MODE?...............................................................................................................................................96
TEKEXP:EXPORT............................................................................................................................................................... 96
TEKEXP:INFO?................................................................................................................................................................... 97
TEKEXP:INSTRUMENT...................................................................................................................................................... 97
TEKEXP:INSTRUMENT?.................................................................................................................................................... 97
TEKEXP:LASTERROR?......................................................................................................................................................98
TEKEXP:LIST?.................................................................................................................................................................... 98
TEKEXP:MODE................................................................................................................................................................... 98
TEKEXP:MODE?................................................................................................................................................................. 99
TEKEXP:POPUP................................................................................................................................................................. 99
TEKEXP:POPUP?............................................................................................................................................................... 99
TEKEXP:REPORT...............................................................................................................................................................99
TEKEXP:REPORT?...........................................................................................................................................................100
TEKEXP:RESULT?............................................................................................................................................................ 100
TEKEXP:SELECT..............................................................................................................................................................100
TEKEXP:SELECT?............................................................................................................................................................101
TEKEXP:SETUP................................................................................................................................................................101
TEKEXP:STATE.................................................................................................................................................................101
TEKEXP:STATE?...............................................................................................................................................................102
TEKEXP:VALUE................................................................................................................................................................ 102
TEKEXP:VALUE?.............................................................................................................................................................. 103
Command parameters....................................................................................................................................................... 103
Examples............................................................................................................................................................................115
References................................................................................................................................................................................ 117
1000BASE-T and 1000BASE-T-Multi Pair......................................................................................................................... 117
1000BASE-T template................................................................................................................................................ 117
1000BASE-T peak voltage..........................................................................................................................................117
1000BASE-T droop.....................................................................................................................................................117
1000BASE-T jitter (with TX_TCLK).............................................................................................................................118
1000BASE-T jitter (without TX_TCLK)........................................................................................................................118
6
Page 7

Table of Contents
1000BASE-T distortion................................................................................................................................................119
1000BASE-T return loss............................................................................................................................................. 120
1000BASE-T CM voltage............................................................................................................................................120
100BASE-T........................................................................................................................................................................ 120
100BASE-T template.................................................................................................................................................. 120
100BASE-T differential output voltage........................................................................................................................120
100BASE-T signal amplitude symmetry..................................................................................................................... 121
100BASE-T rise and fall time......................................................................................................................................121
100BASE-T waveform overshoot................................................................................................................................121
100BASE-T Jitter........................................................................................................................................................ 121
100BASE-T return loss............................................................................................................................................... 121
100BASE-T duty cycle distortion................................................................................................................................ 122
10BASE-T.......................................................................................................................................................................... 122
10BASE-T MAU Ext....................................................................................................................................................122
10BASE-T MAU Int.....................................................................................................................................................122
10BASE-T TP_IDL......................................................................................................................................................122
10BASE-T link pulse...................................................................................................................................................123
10BASE-T differential voltage.....................................................................................................................................123
10BASE-T harmonic................................................................................................................................................... 123
10BASE-T return loss................................................................................................................................................. 123
10BASE-T jitter........................................................................................................................................................... 123
10BASE-T CM Voltage............................................................................................................................................... 124
Index......................................................................................................................................................................................... 125
TekExpress® Ethernet Electrical Testing Application Application Help 7
Page 8

List of Figures
List of Figures
Figure 1: Options menu...............................................................................................................................................................22
Figure 2: TekExpress Ethernet measurements........................................................................................................................... 28
Figure 3: Configuration tab: Global Settings............................................................................................................................... 31
Figure 4: Configuration tab: Measurements Settings..................................................................................................................31
Figure 5: Configuration tab: Bandwidth limiting...........................................................................................................................32
Figure 6: Connection diagram for SHORT Calibration ...............................................................................................................39
Figure 7: Configuration Panel to select Signal Source and to perform Return Loss Calibration ................................................40
Figure 8: Calibration panel before performing calibration .......................................................................................................... 41
Figure 9: Calibration panel after calibration is performed for OPEN, SHORT, and LOAD and then Apply ................................ 41
Figure 10: Connection diagram for SHORT Calibration .............................................................................................................42
Figure 11: Calibration output for SHORT calibration .................................................................................................................. 42
Figure 12: Connection diagram for OPEN Calibration ............................................................................................................... 43
Figure 13: Calibration output for OPEN calibration .................................................................................................................... 43
Figure 14: Calibration output for LOAD calibration .................................................................................................................... 44
Figure 15: Calibration output for LOAD calibration .................................................................................................................... 44
Figure 16: Return Loss Signal Source selection, with Do not use configuration.........................................................................45
Figure 17: AWG with Return Loss waveform loaded.................................................................................................................. 45
Figure 18: AFG with Return Loss waveforms loaded..................................................................................................................46
Figure 19: JigMatch calibration configuration panel....................................................................................................................47
Figure 20: Configuration Panel for selecting Signal Source and to perform JigMatch Calibration..............................................48
Figure 21: Connection diagram to measure Disturbing Signal using JigMatch ..........................................................................49
Figure 22: Disturber Compensation in JigMatch......................................................................................................................... 49
Figure 23: Connection diagram to measure linearities of Test Fixture using JigMatch .............................................................. 50
Figure 24: Test Fixture Compensation in JigMatch..................................................................................................................... 50
Figure 25: Connection diagram to measure linearities of the Test Fixture using JigMatch ........................................................ 51
Figure 26: Test Fixture Compensation in JigMatch..................................................................................................................... 51
Figure 27: JigMatch Signal Source selection, with "Do not use" configuration........................................................................... 52
Figure 28: AWG with Test Mode 1 waveform loaded.................................................................................................................. 52
Figure 29: AWG with Test Mode 4 waveform loaded.................................................................................................................. 53
Figure 30: AFG with Test Mode 1 waveform loaded................................................................................................................... 53
Figure 31: AFG with Test Mode 4 waveform loaded................................................................................................................... 54
Figure 32: Test status view..........................................................................................................................................................55
8
Page 9

List of Figures
Figure 33: Log view.....................................................................................................................................................................56
Figure 34: 1000BASE-T Template, Peak Volt, and Droop (Without Disturber) .......................................................................... 63
Figure 35: 1000BASE-T Template, Peak Volt, and Droop (With Disturber) ............................................................................... 64
Figure 36: Distortion with Disturber with Clock .......................................................................................................................... 65
Figure 37: Distortion with Disturber without Clock ..................................................................................................................... 66
Figure 38: Distortion without Disturber with Clock ..................................................................................................................... 67
Figure 39: Distortion without Disturber without Clock ................................................................................................................ 68
Figure 40: Master and Slave Jitter without Clock .......................................................................................................................69
Figure 41: Master Filtered Jitter with Clock - Connection 1 ....................................................................................................... 70
Figure 42: Master Filtered Jitter with Clock - Connection 2 ....................................................................................................... 71
Figure 43: Master Unfiltered Jitter with Clock ............................................................................................................................ 72
Figure 44: Slave Filtered Jitter with Clock - Connection 1 ......................................................................................................... 73
Figure 45: Slave Filtered Jitter with Clock - Connection 2 ......................................................................................................... 74
Figure 46: Slave Unfiltered Jitter with Clock .............................................................................................................................. 75
Figure 47: 1000BASE-T CM Voltage ......................................................................................................................................... 76
Figure 48: 1000BASE-T Transmitter Return Loss ......................................................................................................................77
Figure 49: 1000BASE-T Receiver Return Loss ......................................................................................................................... 78
Figure 50: 100BASE-T connection diagram for all tests except Return Loss ............................................................................ 79
Figure 51: 100BASE-T Transmitter Return Loss ........................................................................................................................80
Figure 52: 100BASE-T Receiver Return Loss ........................................................................................................................... 81
Figure 53: 10BASE-T MAU, Jitter, TP_IDL Load With TPM, Link Pulse Timing With TPM, and Link Pulse Load With TPM .... 82
Figure 54: 10BASE-T TP_IDL Load Without TPM, Jitter, Link Pulse Load Without TPM, Harmonic, and Link Pulse Timing
Without TPM , and Differential Voltage ........................................................................................................................83
Figure 55: 10BASE-T Transmitter Return Loss ..........................................................................................................................84
Figure 56: 10BASE-T Receiver Return Loss ............................................................................................................................. 85
TekExpress® Ethernet Electrical Testing Application Application Help 9
Page 10

List of Tables
List of Tables
Table 1: Product Information....................................................................................................................................................... 13
Table 2: System requirements.....................................................................................................................................................15
Table 3: Instruments and accessories required for Ethernet application.....................................................................................15
Table 4: Application directories and usage..................................................................................................................................17
Table 5: Application panels overview.......................................................................................................................................... 20
Table 6: Application controls description..................................................................................................................................... 21
Table 7: DUT tab settings............................................................................................................................................................27
Table 8: Test Selection tab settings.............................................................................................................................................28
Table 9: Acquisitions tab settings................................................................................................................................................ 30
Table 10: Configuration tab settings............................................................................................................................................32
Table 11: Return Loss test method configuration and bandwidth limiting....................................................................................33
Table 12: Measurements configuration for Analyze 1000BASE-T and 1000BASE-T-Multi Pair ................................................ 33
Table 13: Measurements configuration for Analyze 100BASE-T ............................................................................................... 34
Table 14: Measurements configuration for Analyze 10BASE-T ................................................................................................. 35
Table 15: Measurements configuration for Acquire 1000BASE-T ..............................................................................................36
Table 16: Measurements configuration for Acquire 100BASE-T.................................................................................................37
Table 17: Measurements configuration for Acquire for 10BASE-T .............................................................................................38
Table 18: Preferences tab settings..............................................................................................................................................54
Table 19: Status panel Log View controls................................................................................................................................... 56
Table 20: Report options............................................................................................................................................................. 60
Table 21: Parameter Name and Value for DUT tab ..................................................................................................................103
Table 22: Parameter Name and Value for Test Selection tab ...................................................................................................104
Table 23: Parameter Name and Value of Acquisitions .............................................................................................................107
Table 24: Parameter Name and Value for Preferences tab ......................................................................................................107
Table 25: Parameter Name and Value for Acquire (1000BASE-T)............................................................................................107
Table 26: Parameter Name and Value for Acquire (100BASE-T)..............................................................................................108
Table 27: Parameter Name and Value for Acquire (10BASE-T)................................................................................................109
Table 28: Parameter Name and Value for Analyze (1000BASE-T)........................................................................................... 111
Table 29: Parameter Name and Value for Analyze (100BASE-T).............................................................................................112
Table 30: Parameter Name and Value for Analyze (10BASE-T)...............................................................................................112
Table 31: Parameter Name and Value for General ...................................................................................................................114
10
Page 11

Welcome
Welcome
Welcome to the TekExpress® Ethernet Electrical Testing software application. The application provides more visibility into your Ethernet
designs with 1000BASE-T/100BASE-TX/10BASE-T PHY measurements as outlined in IEEE 802.3 Section 40, ANSI X3.263, and IEEE
802.3 Section 14 specific measurements for different Ethernet standards to the already existing rich tool set of generic jitter, timing, and
signal quality measurements in Tektronix Oscilloscope.
Key features:
• Solution offers most comprehensive Ethernet PHY test coverage supporting multiple speeds.
• Highly optimized, intuitive user interface flow that sets up the test configuration for easy ethernet electrical validation.
• Compliance and margin testing for accurate analysis and improved interoperability.
• Time-domain and frequency-domain measurements made with single analysis instrument.
• Jitter and timing measurements with and without filters.
• Amplitude and droop testing for transmitter performance.
• User-defined mode enables flexible parameter control for characterization and margin analysis. Detailed test reports with margin and
statistical information and analysis.
• Ability to modify limits of test parameters in TekExpress for debug and characterization.
• Ability to easily configure multiple test runs.
• Ability to preview test mode waveform prior to running the tests.
• Additional Peak Distortion Vs Phase Offset and Error Values Vs Symbol Number plots for 1000BASE-T distortion test.
• Plot panel is available to view the plot for Return Loss measurement.
TekExpress® Ethernet Electrical Testing Application Application Help 11
Page 12

Contacting Tektronix
Contacting Tektronix
Tektronix, Inc.
14150 SW Karl Braun Drive
P.O. Box 500
Beaverton, OR 97077
USA
For product information, sales, service, and technical support:
• In North America, call 1-800-833-9200.
• Worldwide, visit www.tektronix.com to find contacts in your area.
Copyright © Tektronix. All rights reserved. Licensed software products are owned by Tektronix or its subsidiaries or suppliers, and are
protected by national copyright laws and international treaty provisions. Tektronix products are covered by U.S. and foreign patents, issued
and pending. Information in this publication supersedes that in all previously published material. Specifications and price change privileges
reserved.
TEKTRONIX and TEK are registered trademarks of Tektronix, Inc.
Compiled Online Help Part number: 076-0459-01
12
Page 13

Getting help and support
Getting help and support
Conventions
Help uses the following conventions:
• The term "Application" and "Software" refers to the TekExpress Ethernet Electrical Testing Application.
• The term “DUT” is an abbreviation for Device Under Test.
• The term “select” is a generic term that applies to the different methods of choosing a screen item (button, control, list item): using a
mouse or using the touch screen.
Icon Meaning
This icon identifies important information.
This icon identifies conditions or practices that could result in loss of
data.
This icon identifies additional information that will help you use the
application more efficiently.
Related documentation
The following documentation is available as part of the TekExpress® Ethernet Electrical Testing Application.
Table 1: Product Information
Item Purpose Location
Help
PDF of help Printable version of the compiled help
Application operation and User Interface
help
PDF file that ships with TekExpress Ethernet
solution (TekExpress-Ethernet-SolutionSoftware-Printable-Help-EN-US.pdf).
You can download the PDF version of the
manual from the Tektronix website.
Part number: 077-1635-02
www.tek.com/en
TekExpress® Ethernet Electrical Testing Application Application Help 13
Page 14

Getting help and support
Technical support
Tektronix values your feedback on our products. To help us serve you better, please send us your suggestions, ideas, or comments on
your application or oscilloscope. Contact Tektronix through mail, telephone, or the Web site, www.tek.com
When you contact Tektronix Technical Support, please include the following information (be as specific as possible):
General Information
• All instrument model numbers
• Hardware options, if any
• Probes used
• Your name, company, mailing address, phone number, and FAX number
• Please indicate if you would like to be contacted by Tektronix about your suggestion or comments.
Application Specific Information
• Software version number
• Description of the problem such that technical support can duplicate the problem
• If possible, save the setup files for all the instruments used and the application.
• If possible, save the TekExpress setup files, log.xml, *.TekX (session files and folders), and status messages text file.
• If possible, save the waveform on which you are performing the measurement as a .wfm file.
14
Page 15
Getting started
Minimum system requirements
The following table shows the minimum system requirements to install and run the TekExpress Ethernet solution.
Table 2: System requirements
Component Description
Oscilloscope
MSO/DPO5000, DPO7000C and MSO/DPO70000C/DX/SX
Getting started
Firmware
Software
• Firmware Version: 10.10.1 or above for Windows 10
• Firmware 10.8.3 only for Windows 7
• IronPython 2.7.3 installed
• PyVisa 1.0.0.25 installed
• Microsoft .NET 4.0 Framework
• Microsoft Internet Explorer 7.0 SP1 or greater, or other Web
browser for viewing reports
• Adobe Reader software 7.0 or greater for viewing portable
document format (PDF) files
Instruments and accessories required
The following table lists the instruments and accessories required for this application.
Table 3: Instruments and accessories required for Ethernet application
Instrument/Accessory Model number Quantity
Oscilloscope
Arbitrary Function Generator
MSO/DPO5000, DPO7000C and MSO/
DPO70000C/DX/SX
AFG3000, AFG31102, AFG31152,
AFG31252
One
One
Arbitrary Waveform Generator
Table continued…
TekExpress® Ethernet Electrical Testing Application Application Help 15
• AWG520x
• AWG5000 Series
• AWG7000 Series
One
Page 16

Getting started
Instrument/Accessory Model number Quantity
Fixtures
TF-GBE-BTP
1000/100/10BASE-T Basic Test Package
(consists of test fixture PCB set and RJ45
interconnect cable).
One
Differential Probes
Note:
• TF-GBE-ATP fixture set contains TF-GBE-BTP and TF-GBE-JTC fixtures.
• TF-GBE-BTP fixture set contains TF-GBE-SIC.
• TF-GBE-BTP is required for Jitter-Slave test only.
• TPA-BNC adapter is required for P6247 and P6248 differential probes.
• For 1000BASE-T Slave jitter testing an additional differential probe is required.
• For 1000BASE-T-Multi Pair testing, additional two probes are required.
Installing the software
TF-GBE-JTC 103 meter
1000BASE-T jitter test channel cable
TF-GBE-SIC (Short 4-inch (0, 1-meter) RJ45
interconnect cable)
• TDP1500
• P6247
• P6248
• TDP3500
One
One
Two
Complete the following steps to download and install the latest Ethernet application. See Minimum system requirements for compatibility.
1. Go to www.tek.com.
2. Click Downloads. In the Downloads menu, select DOWNLOAD TYPE as Software and enter Ethernet in the MODEL OR KEYWORD
field and click SEARCH.
3. Select the latest version of software and follow the instructions to download. Copy the executable file to the oscilloscope.
4. Double-click the executable and follow the on-screen instructions. The software is installed at C:\Program
Files\Tektronix\TekExpress\TekExpress Ethernet.
5. Select Applications > TekExpress Ethernet from the TekScope menu to Launch the application.
Application directories
TekExpress Ethernet application
The TekExpress Ethernet application files are installed at the following location:
16
Page 17
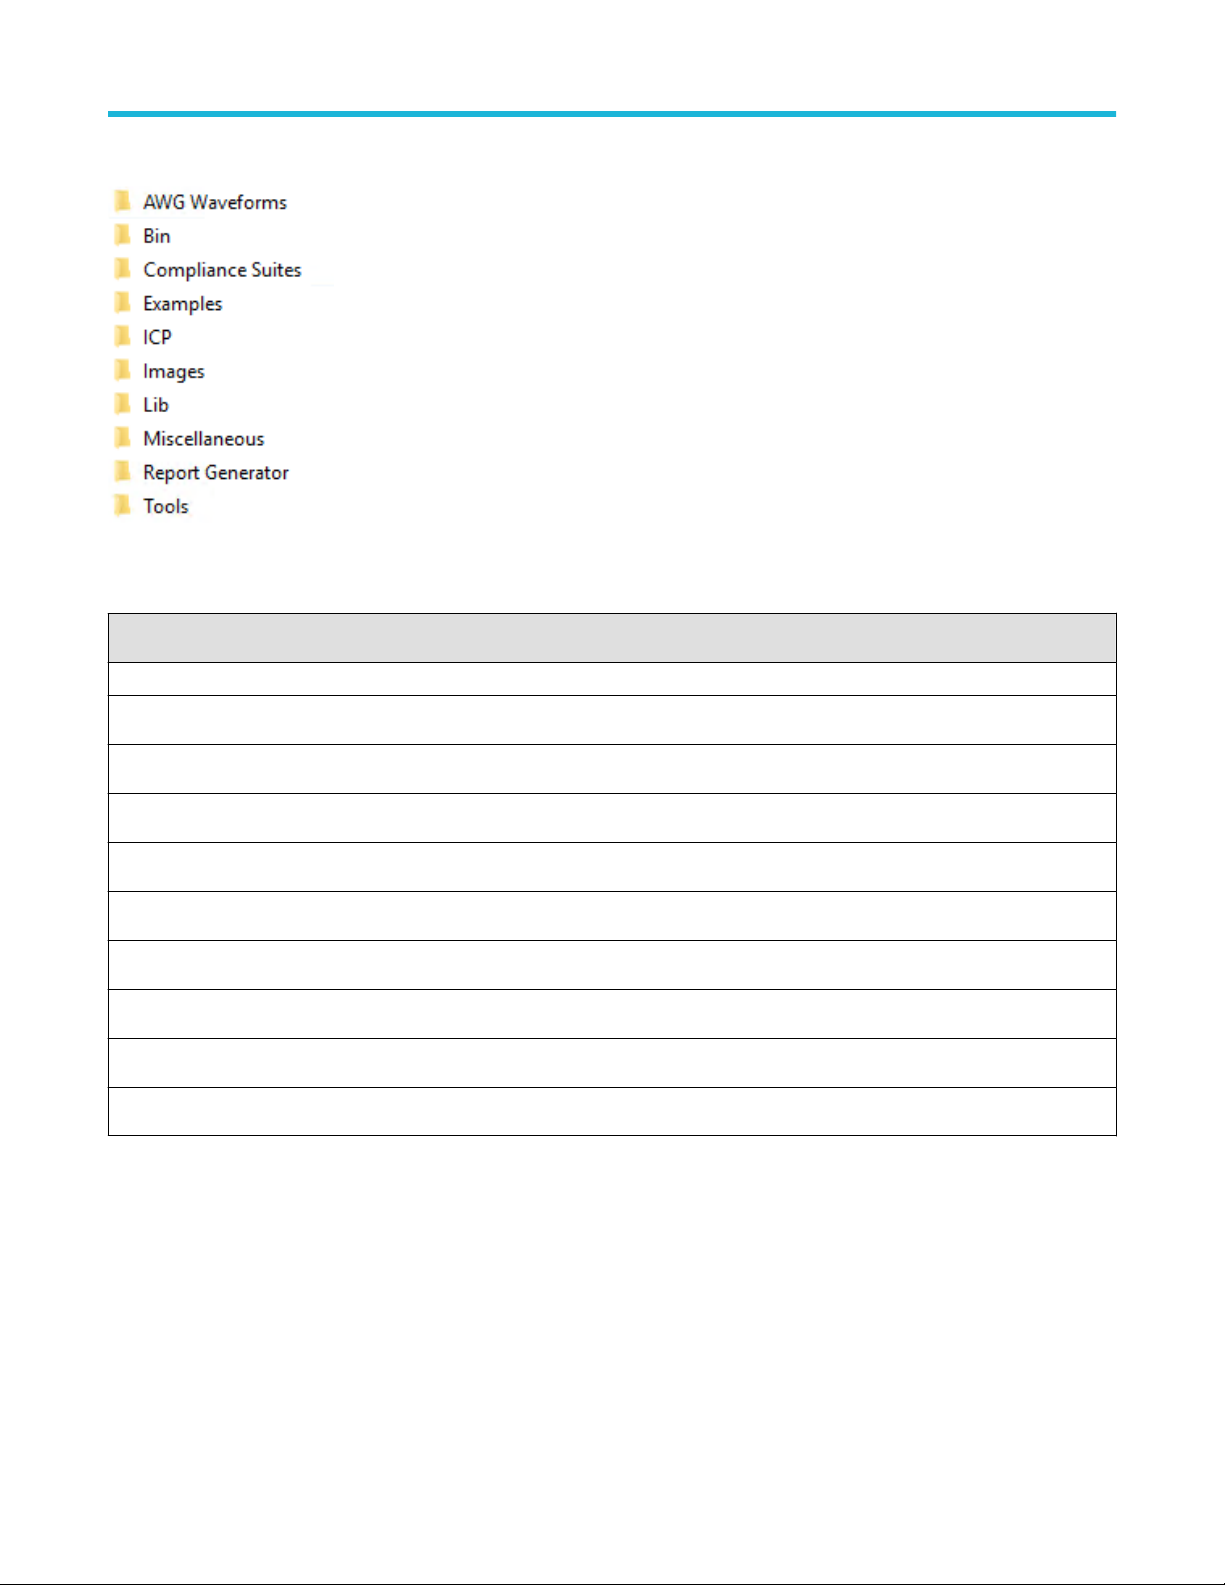
C:\Program Files\Tektronix\TekExpress\TekExpress Ethernet
The following table lists the application directory names and their purpose:
Table 4: Application directories and usage
Directory names Usage
Getting started
AWG Waveforms Contains waveform files
Bin Contains TekExpress Ethernet application libraries
Compliance Suites Contains compliance-specific files
Examples Contains examples for SCPI commands
ICP Contains instrument and TekExpress Ethernet application-specific interface libraries
Images Contains images of the TekExpress Ethernet application
Lib Contains utility files specific to the TekExpress Ethernet application
Miscellaneous Contains log files
Report Generator Contains style sheets for report generation
Tools Contains instrument and TekExpress Ethernet application-specific files
See also
View test-related files
File name extensions
File name extensions
The TekExpress Ethernet application uses the following file name extensions:
TekExpress® Ethernet Electrical Testing Application Application Help 17
Page 18
Getting started
File name extension Description
.TekX Application session files (the extensions may not be displayed)
.py Python sequence files
.xml Test-specific configuration information (encrypted) files
Application log files
.csv Test result reports
Plot data
.mht Test result reports (default)
Test reports can also be saved in HTML format
.pdf Test result reports
Application help documents
.xslt Style sheet used to generate reports
See also
View test-related files
Application directories
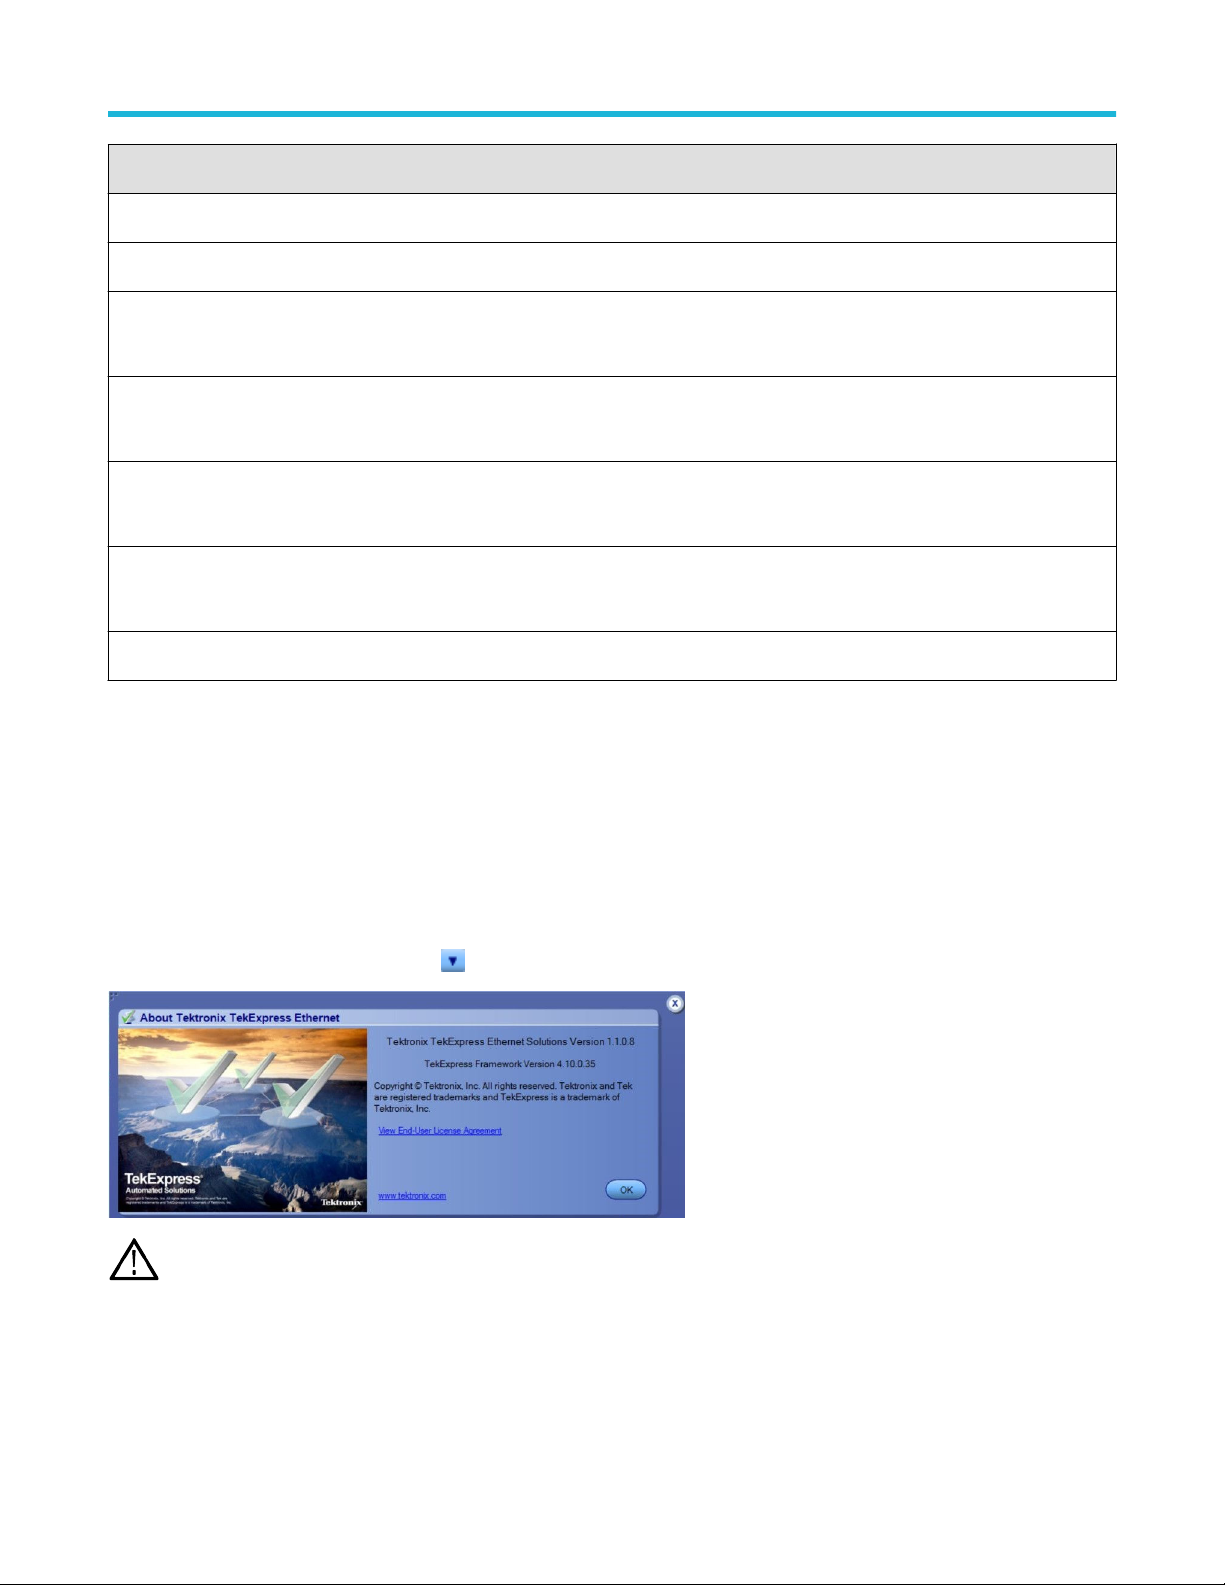
View software version
Use the following instructions to view version information for the application and for the application modules such as the Programmatic
Interface and the Programmatic Interface Client.
To view version information for Ethernet, click button in the TekExpress application and select About TekExpress.
This example shows a typical Version Details dialog box, and may not reflect the actual values as shown when you open
Note:
this item in the application.
18
Page 19

Operating basics
Launch the application
To launch the TekExpress Ethernet solution, select Applications > TekExpress Ethernet from the TekScope menu.
Operating basics
When you launch the application for the first time, the file C:\Users\<username>\My Documents\My
TekExpress\Ethernet\Resources.xml is mapped to drive X:. This file contains information about available networkconnected instruments. The session files are stored in X:\Ethernet\. If this file is not found, then the application runs Instrument
Discovery Program to detect the network-connected instruments before launching Ethernet solution.
If the application is behind the oscilloscope application, click Applications > TekExpress Ethernet to bring it to the front. To keep the
Ethernet application window on top, select Keep On Top from the Ethernet Options menu .
After installing the application, wait until the instruments gets discovered in the TEKVISA before launching the application.
Note:
See also
Application controls
Application panel overview
Application panels overview
TekExpress Ethernet solution uses panels to group Configuration, Results, and Reports settings. Click any button to open the associated
panel. A panel may have one or more tabs that list the selections available in that panel. Controls in a tab can change depending on
settings made in the same tab or another tab.
TekExpress® Ethernet Electrical Testing Application Application Help 19
Page 20
Operating basics
Table 5: Application panels overview
Panel Name Purpose
Setup panel The Setup panel shows the test setup controls. Click the Setup button to open this panel.
Use this panel to:
• Set DUT tab parameters
• Select tests
• Set acquisition tab parameters
• Set configuration tab parameters
• Set preferences tab parameters
Status panel View the progress and analysis status of the selected tests, and view test logs.
Results panel View the summary of test results and select result viewing preferences.
Plots panel View the plot for Return Loss measurement. Plot is displayed as a two dimensional plot for additional
measurement analysis.
Reports panel Browse for reports, save reports as specific file types, specify report naming conventions, select report
content to include (summary information, detailed information, user comments, setup configuration,
application configuration), and select report viewing options.
See also
Application controls
20
Page 21

Global application controls
Application controls
This section describes the application controls.
Table 6: Application controls description
Item Description
Options menu To select global application controls.
Test Panel buttons Controls that open tabs for configuring test settings and options.
Operating basics
Start / Stop button Use the Start button to start the test run of the measurements in the selected order. If prior acquired
measurements are not cleared, then new measurements are added to the existing set.
The button toggles to the Stop mode while tests are running. Use the Stop button to abort the test.
Pause / Continue button Use the Pause button to pause the acquisition. When a test is paused, this button toggles to Continue.
Clear button Use the Clear button to clear all existing measurement results. Adding or deleting a measurement, or
changing a configuration parameter of an existing measurement, also clears measurements. This is
to prevent the accumulation of measurement statistics or sets of statistics that are not coherent. This
button is available only on Results panel.
Application window move icon Place the cursor over the three-dot pattern in the upper left corner of the application window. When the
cursor changes to a hand, drag the window to the desired location.
Table continued…
TekExpress® Ethernet Electrical Testing Application Application Help 21
Page 22
Operating basics
Item Description
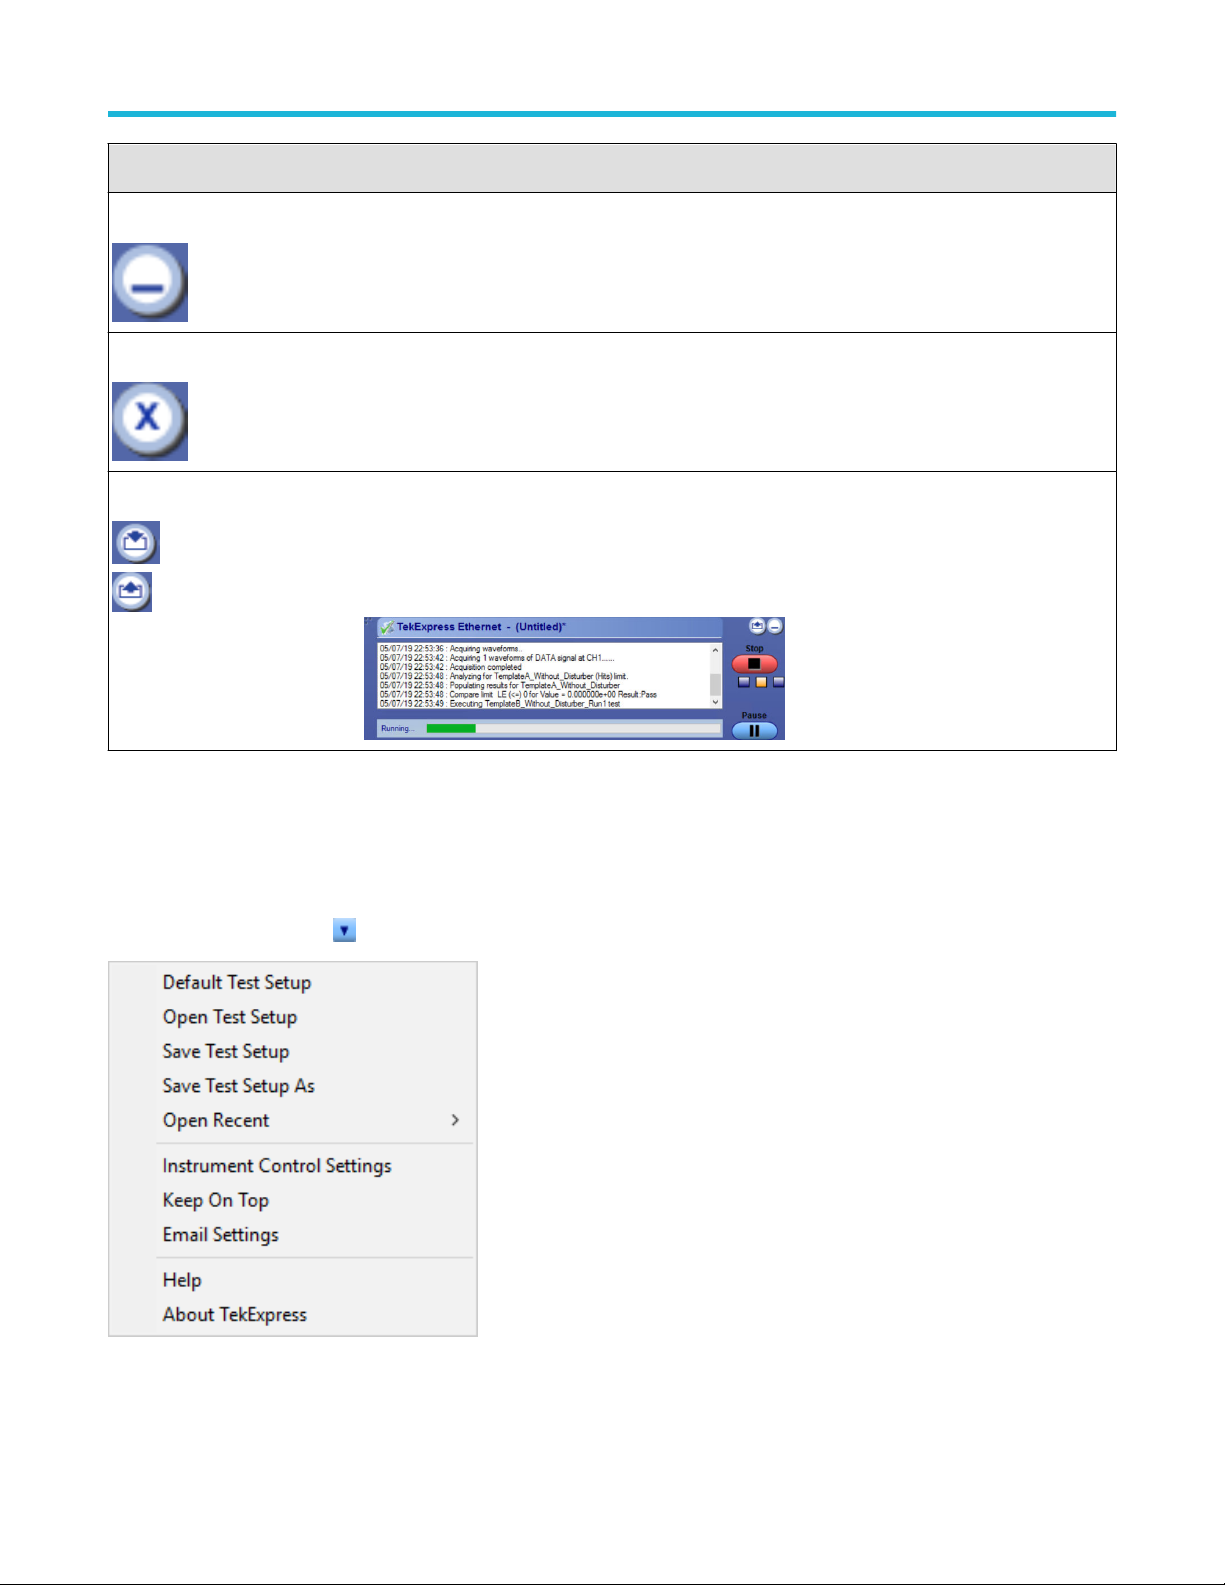
Minimize icon Click to minimize the application.
Close icon Click to close the application.
Mini view / Normal view Toggles the application between mini view and normal view.
Mini view displays the run messages with the time stamp, progress bar, Start / Stop button, and
Pause / Continue button.
The application moves to mini view when you click the Start button.
See also
Application panel overview
Options menu overview
To access Options menu, click in the upper-right corner of the application.
Figure 1: Options menu
22
Page 23

Menu Function
Default Test Setup Opens an untitled test setup with defaults selected.
Acquire Live Waveforms.
Data rate: 1000BASE-T.
Open Test Setup Opens a saved test setup.
Save Test Setup Saves the current test setup.
Save Test Setup As Saves the current test setup with a different file name or file type.
Open Recent Displays the recently opened test setups to open.
Operating basics
Instrument Control Settings
Keep On Top Keeps the TekExpress Ethernet application on top of all applications.
Email Settings
Help Displays the TekExpress Ethernet help.
About TekExpress • Displays application details such as software name, version number, and copyright.
Detects, lists, and refreshes the connected instruments found on specified connections (LAN, GPIB,
USB, and so on).
Use to configure email options for test run and result notification.
• Provides a link to the end-user license agreement.
• Provides a link to the Tektronix Web site.
See also
Application controls
TekExpress instrument control settings
Use TekExpress Instrument Control Settings dialog box to search the instruments (resources) connected to the application. You can use
the Search Criteria to search the connected instruments depending on the connection type. The details of the connected instrument is
displayed in the Retrieved Instruments window.
You can access this dialog box from the Options menu.
TekExpress® Ethernet Electrical Testing Application Application Help 23
Page 24

Operating basics
The connected instruments displayed here can be selected for use under Global Settings in the test configuration section.
Note: Select GPIB (Default) when using TekExpress Ethernet application.
See also
Options menu overview
View connected instruments
Use TekExpress Instrument Control Settings dialog box to search the instruments (resources) connected to the application. The application
uses TekVISA to discover the connected instruments.
The instruments required for the test setup must be connected and it must be recognized by the application before running
Note:
the test.
To refresh the list of connected instruments:
1. From the Options menu, select Instrument Control Settings.
2. In the Search Criteria section of the Instrument Control Settings dialog box, select the connection types of the instruments to search.
Instrument search is based on the VISA layer, but different connections determine the resource type, such as LAN, GPIB, and USB.
For example, if you choose LAN, the search will include all the instruments supported by TekExpress that are communicating over the
LAN.
3. Click Refresh. TekExpress searches for connected instruments.
24
Page 25

Operating basics
4. After searching, the dialog box lists the instrument-related details based on the search criteria. For example, For the Search Criteria as
LAN and GPIB, the application displays all LAN and GPIB instruments connected to the application.
The details of the instruments are displayed in the Retrieved Instruments table. The time and date of instrument refresh is displayed in the
Last Updated field.
See also
1000BASE-T-Multi Pair connection diagram
1000BASE-T connection setup
100BASE-T connection setup
10BASE-T connection setup
Configure email settings
Use the Email Settings utility to get notified by email when a measurement completes, or produces any error condition. Follow the steps to
configure email settings:
1. Select Options > Email Settings to open the Email Settings dialog box.
2. (Required) For Recipient email Address(es), enter one or more recipient email addresses. To include multiple addresses, separate
the addresses with commas.
3. (Required) For Sender’s Address, enter the email address used by the instrument. This address consists of the instrument name,
followed by an underscore, followed by the instrument serial number, then the @ symbol, and the email server ID. For example:
user@yourcompany.com.
4. (Required) In the Server Configuration section, type the SMTP Server address of the Mail server configured at the client location, and
the SMTP Port number, in the corresponding fields.
If this server requires password authentication, enter a valid login name, password, and host name in the corresponding fields.
If any of the above required fields are left blank, the settings will not be saved and email notifications will not be sent.
Note:
5. In the Email Attachments section, select from the following options:
• Reports: Select to receive the test report with the notification email.
TekExpress® Ethernet Electrical Testing Application Application Help 25
Page 26
Operating basics
• Status Log: Select to receive the test status log with the notification email. If you select this option, then also select whether you
want to receive the full log or just the last 20 lines.
6. In the Email Configuration section:
• Enter a maximum file size for the email message. Messages with attachments larger than this limit will not be sent. The default is
5 MB.
• Enter the number in the Number of Attempts to Send field, to limit the number of attempts that the system makes to send a
notification. The default is 1. You can also specify a timeout period.
7. Select the Email Test Results When complete or on error check box. Use this check box to quickly enable or disable email
notifications.
8. To test your email settings, click Test Email.
9. To apply your settings, click Apply.
10. Click Close when finished.
Setup panel
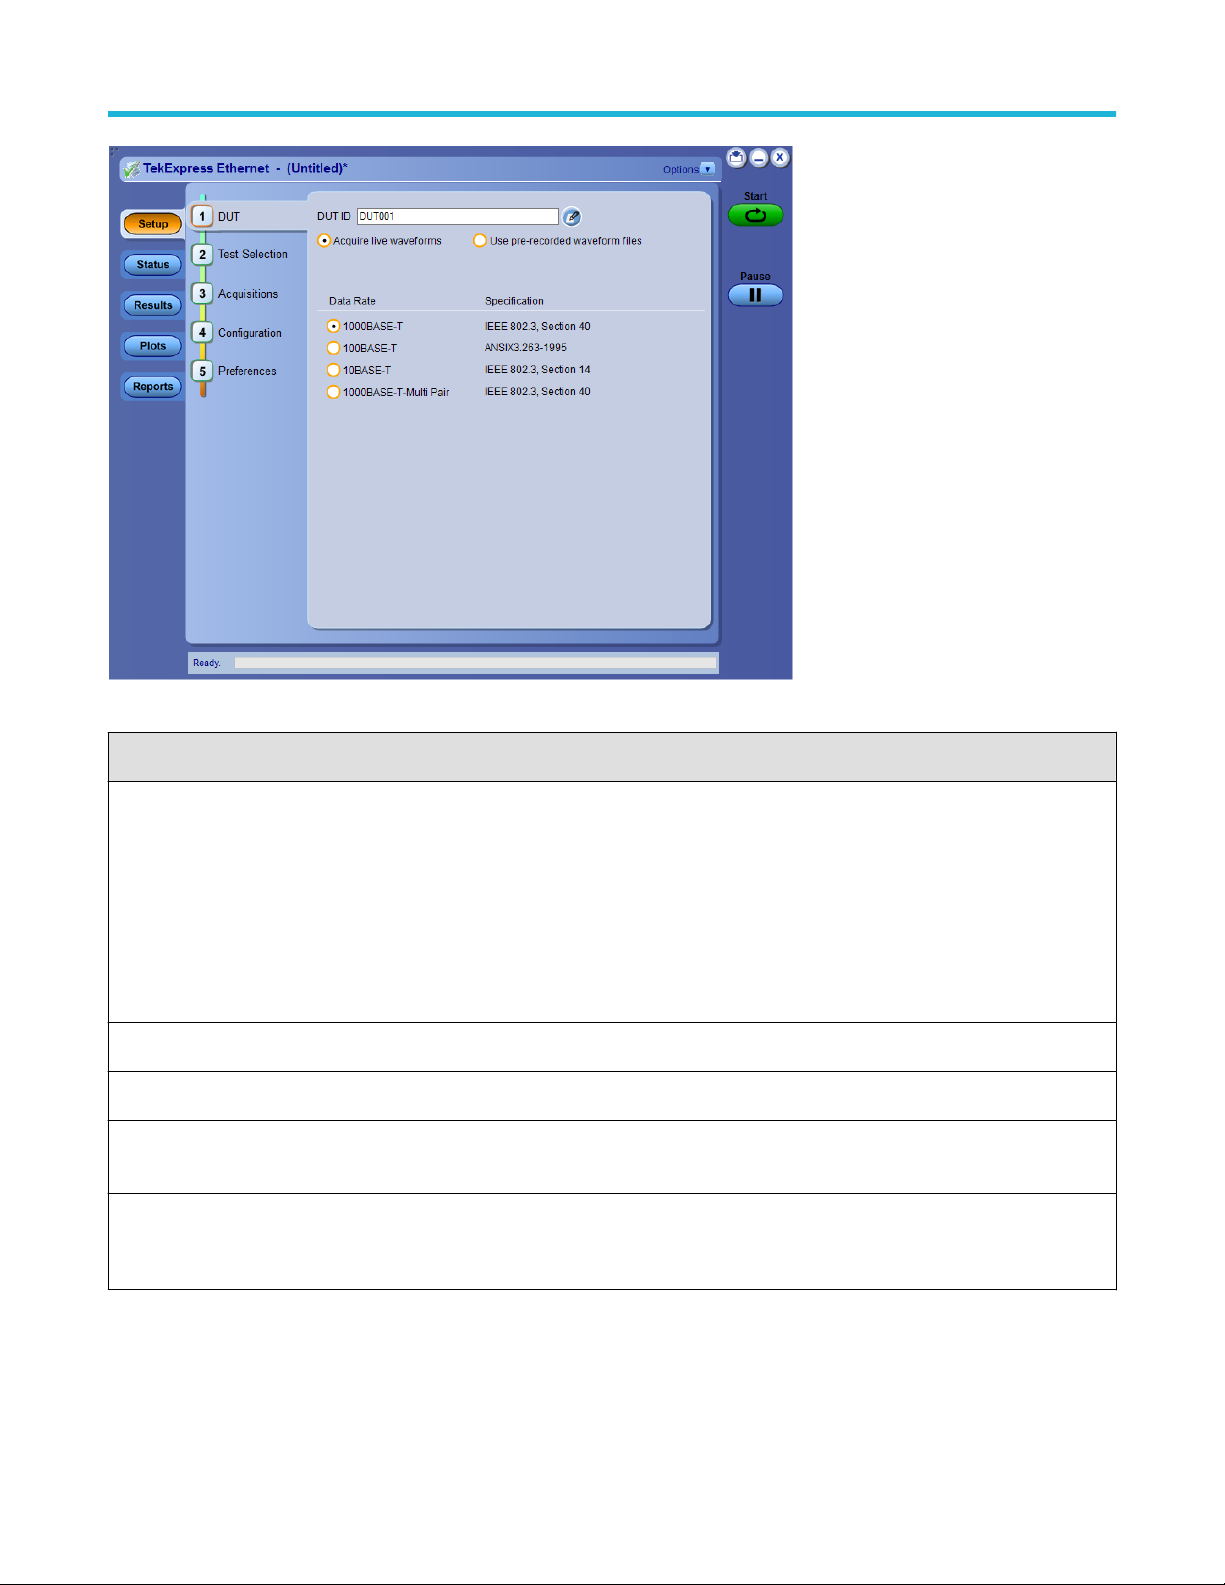
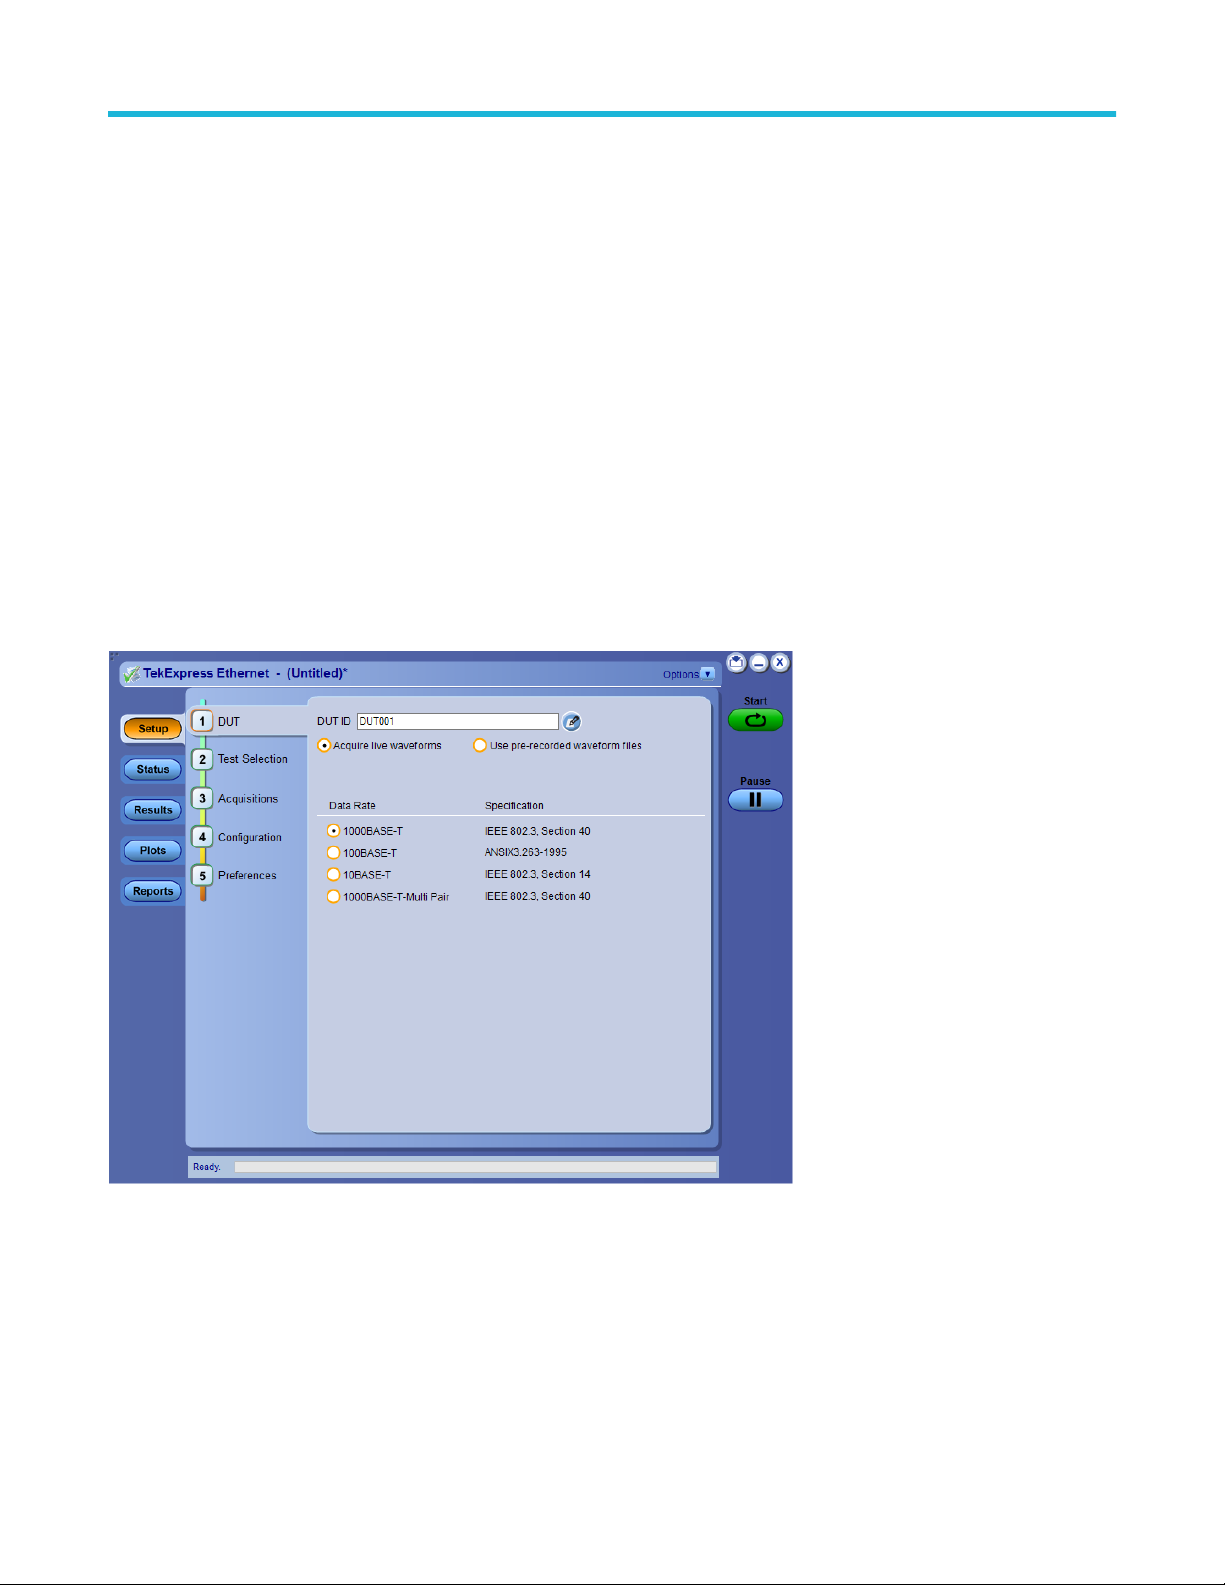
Setup panel overview
The Setup panel contains sequentially ordered tabs that help you guide through the test setup and execution process.
Set DUT parameters
Use the DUT tab to select parameters for the device under test. These settings are global and apply to all tests of current session. The
DUT settings also affect the list of available tests in the Test Selection tab.
26
Page 27
Operating basics
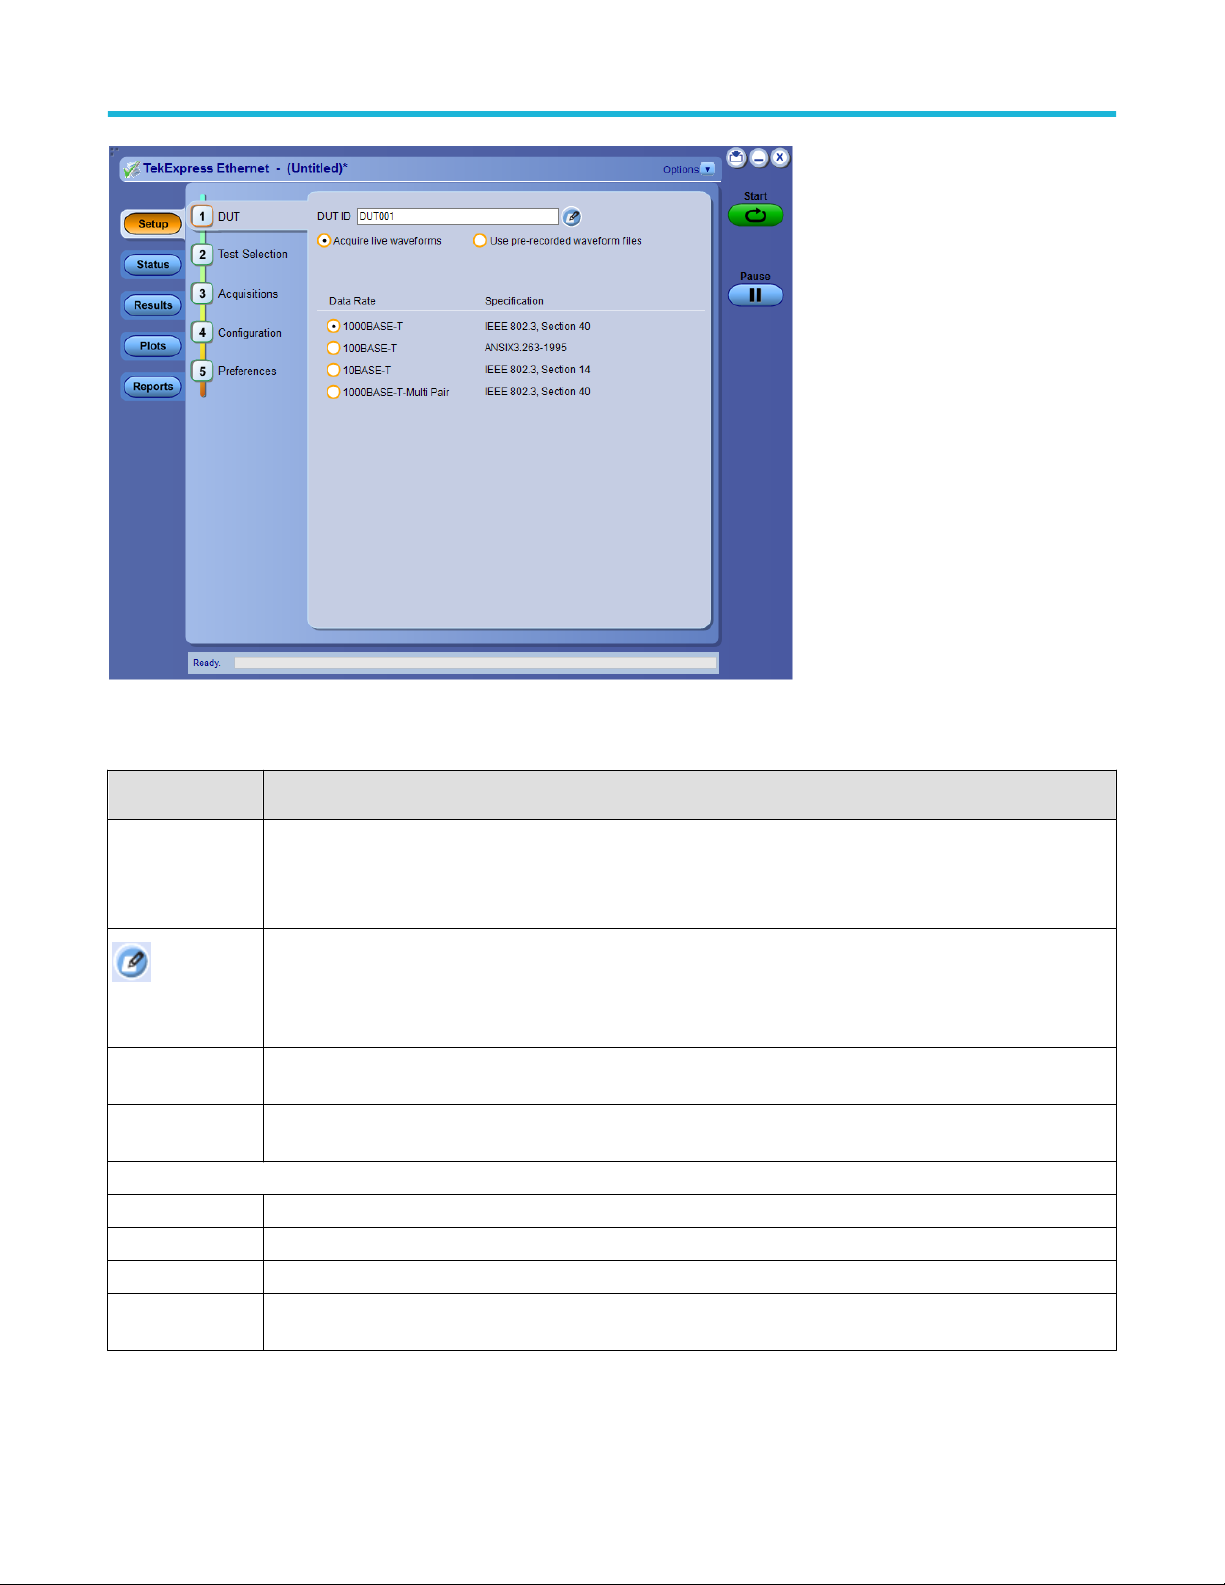
Click Setp > DUT to access the DUT parameters:
Table 7: DUT tab settings
Setting Description
DUT ID Adds an optional text label for the DUT to reports. The default value is DUT001. The maximum number of
characters is 32.
You cannot use the following characters in an ID name: (.,..,...,\,/:?”<>|*)
Opens Comments dialog box to enter text to add to the report. Maximum size is 256 characters. To enable or
Comments
icon (to the right of
the DUT ID field)
Acquire live
waveforms
Use pre-recorded
waveform files
Data Rate
1000BASE-T IEEE 802.3, Section 40
100BASE-T ANSIX 3.263-1995
10BASE-T IEEE 802.3, Section 14
1000BASE-T Multi
Pair
disable comments appearing on the test report, see Select report options.
Perform analysis on live waveforms.
Perform analysis on pre-recorded waveforms.
IEEE 802.3, Section 40
TekExpress® Ethernet Electrical Testing Application Application Help 27
Page 28
Operating basics
See also
Select tests
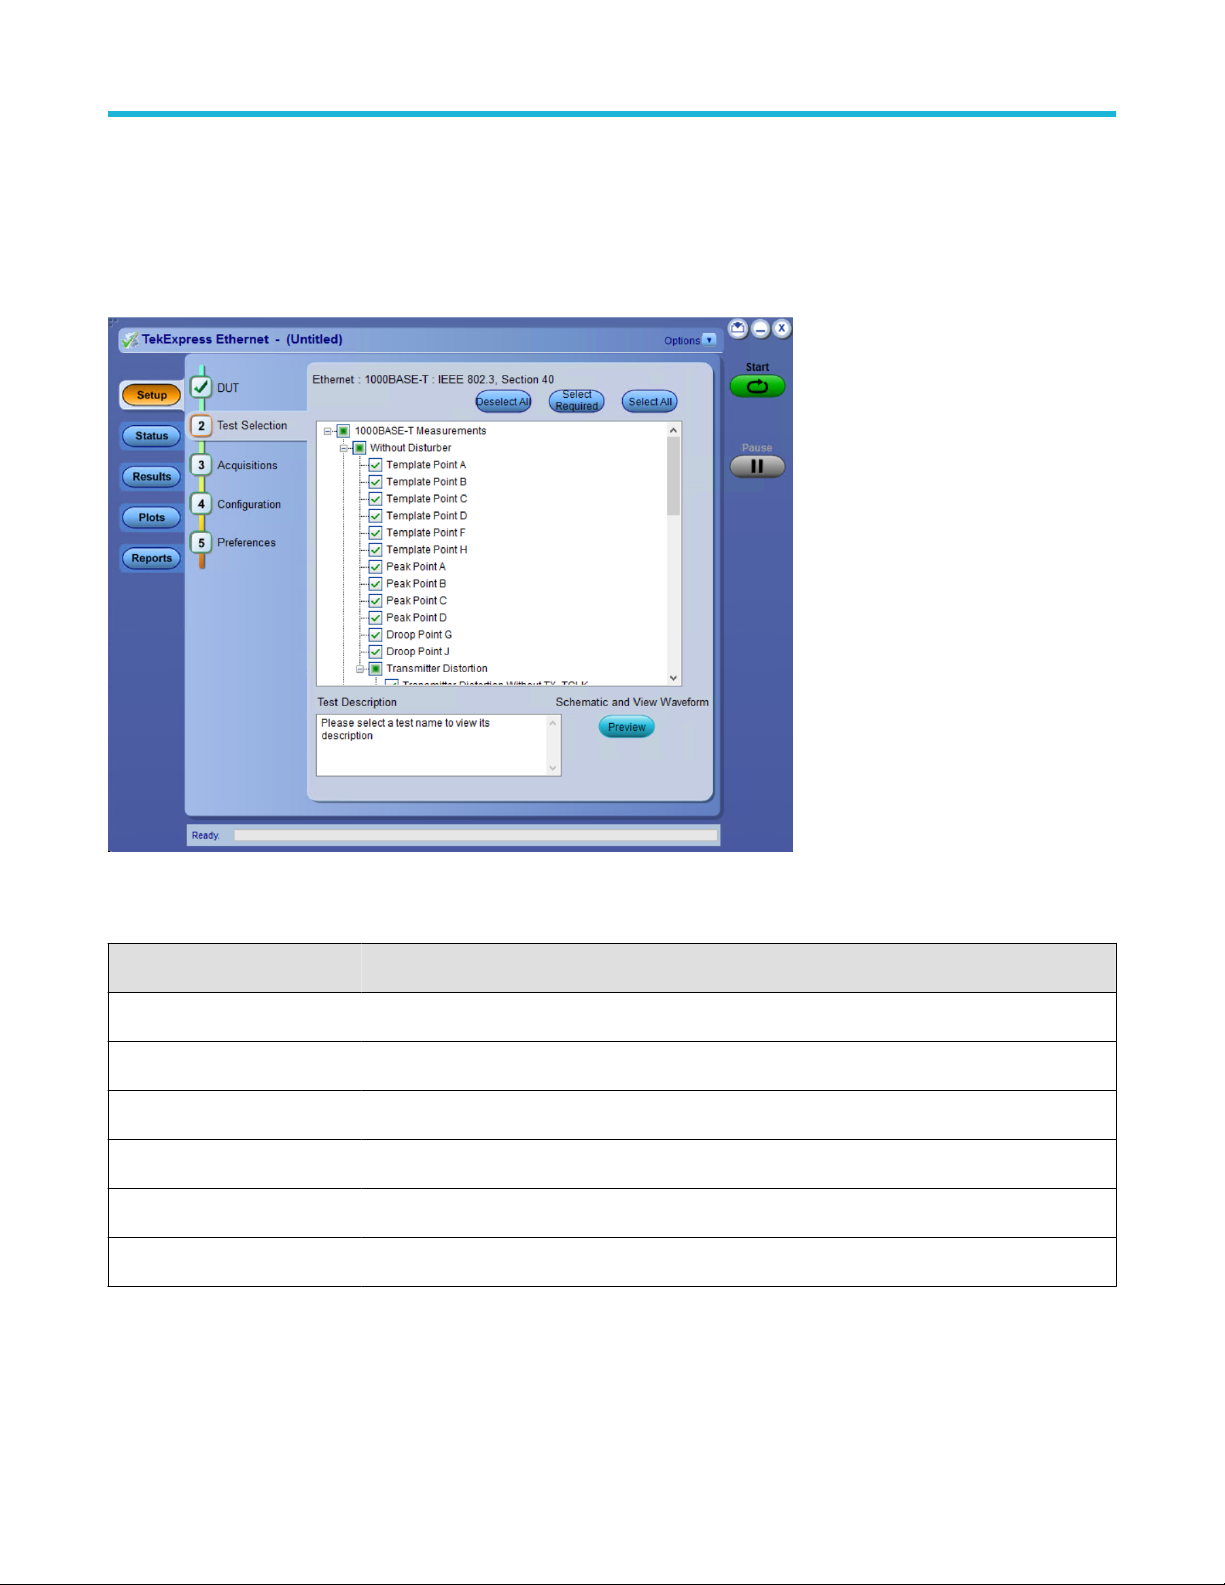
Select tests
Use the Test Selection tab to select the tests. The test measurements available depends on the standard selected in the DUT tab.
Figure 2: TekExpress Ethernet measurements
Table 8: Test Selection tab settings
Setting Description
Deselect All
Select Required
Select All
Tests Click on a test to select or unselect. Highlight a test to show details in the Test Description pane.
Test Description Shows brief description of the highlighted test in the Test field.
Preview Click to preview the schematic and the expected waveform example for the selected test.
Click to clear all tests.
Click to select all the tests required for compliance.
Click to select all tests. All tests are selected by default.
See also
Set acquisition tab parameters
28
Page 29

Operating basics
Set acquisition tab parameters
Use Acquisitions tab to view the test acquisition parameters. The contents displayed on this tab depends on the DUT type, Suite selected,
and the tests selected.
Note: TekExpress Ethernet application acquires all waveforms needed by each test group before performing analysis.
TekExpress® Ethernet Electrical Testing Application Application Help 29
Page 30
Operating basics
Table 9: Acquisitions tab settings
Setting Description
View Probes Click to view the detected probe configuration. Use the View Probes dialog box to enable or disable probe
signal source access in the application.
If probe connection is changed, user has to click on Refresh button to view updated probe information.
Source Select the signal source for Data, Master Clock and/or Slave Clock for the measurement. Ensure that no two
sources have the same channel selected.
Same set of channels can be used for Return Loss with a Data as positive input and Master Clock as
negative input and Slave Clock for sync input.
Aux Select to use oscilloscope's Aux channel.
Acquisition and Save
Options
• Save All Waveforms
• Delete All Waveforms
After Analysis
Show Acquire Parameters Select to view the acquisition parameters.
TekExpress Ethernet saves all acquisition waveforms to files by default. Waveforms are saved in a unique folder for
each session (a session is started when you click the Start button). The folder path is X:\Ethernet\Untitled
Session\<dutid>\<date>_<time>. Images created for each analysis, CSV files with result values, reports, and other
information specific to that particular execution are also saved in this folder.
Saving a session moves the session file contents from the Untitled Session folder to the specified folder name, and changes the session
name to the specified name.
• Saves all the waveforms after the analysis.
• Deletes all the waveforms after the analysis.
Set configuration tab parameters
Use Configuration tab to view and configure the Global Settings and the measurement configurations. The Global Settings and the
measurements with configurations available in this tab depends on the Standards selected in the DUT tab.
30
Page 31

Operating basics
Figure 3: Configuration tab: Global Settings
Figure 4: Configuration tab: Measurements Settings
TekExpress® Ethernet Electrical Testing Application Application Help 31
Page 32

Operating basics
Figure 5: Configuration tab: Bandwidth limiting
Table 10: Configuration tab settings
Setting Description
Compliance Mode Select to run test(s) in compliance mode. By default Compliance Mode is selected.
User Defined Mode Select to run test(s) in user defined mode.
Global Settings
Instruments Detected
JigMatch Calibration
Return Loss Calibration
Displays the instruments connected to this application. Click on the instrument name to
open a list of available (detected) instruments.
Select Options > Instrument Control Settings and click Refresh to update the instrument
list.
Note: Verify that the GPIB search criteria (default setting) in the Instrument
Control Settings is selected when using TekExpress Ethernet application.
Measures the Amplitude and the Frequency of the disturbing signals. The default values
can be set. The application measures and displays the values in the Measured Value fields.
You can validate the disturbing signal by comparing the Measured Value with the Expected
Value.
Displays the schematics for Return Loss Calibration. The Transmitter and Receiver Return
Loss calibration for OPEN, SHORT, and LOAD terminations can be performed.
Bandwidth Limiting
32
Bandwidth limit can be set from the drop down for the measurements to be run. The
Effective Bandwidth will be lesser of the Oscilloscope and the probe connected.
Page 33

Operating basics
Table 11: Return Loss test method configuration and bandwidth limiting
Method Description
Oscilloscope Based
VNA Data Import Perform Return Loss measurement using VNA and the data is
Calibration for the given setup and Return Loss Measurement are
made using the connected signal generator and the oscilloscope.
imported here.
Table 12: Measurements configuration for Analyze 1000BASE-T and 1000BASE-T-Multi Pair
Measurements Configuration Value
Template Point A
Template Point B
Template Point C
Template Point D
Template Point F
Template Point H
Analyze
External Filter
Include or Exclude
Template Point A (D)
Template Point B (D)
Template Point C (D)
Template Point D (D)
Template Point F (D)
Template Point H (D)
Peak Point A
Peak Point B
Peak Point C
Peak Point D
Peak Point A (D)
Peak Point B (D)
Peak Point C (D)
Peak Point D (D)
Transmitter Distortion Without TX_TCLK
Transmitter Distortion With TX_TCLK
Transmitter Distortion Without TX_TCLK (D)
Analyze
LP Filter Include or Exclude
Hi Resolution 16 to 64
Transmitter Distortion With TX_TCLK (D)
Master Filtered Without TX_TCLK
Master UnFiltered Without TX_TCLK
Table continued…
TekExpress® Ethernet Electrical Testing Application Application Help 33
Analyze
Clock Edge RISE, FALL
Page 34
Operating basics
Measurements Configuration Value
Slave Filtered Without TX_TCLK
Slave UnFiltered Without TX_TCLK
Master Filtered With TX_TCLK
Master UnFiltered With TX_TCLK
Slave Filtered With TX_TCLK
Slave UnFiltered With TX_TCLK
Transmitter Return Loss Analyze
CM Voltage Analyze Filter Type
Hysteresis 0% - 10 %
Smoothing Averages 1 to 10
Loads (Ohm) • 85, 100, 115
Table 13: Measurements configuration for Analyze 100BASE-T
• 100
• None
• 1 MHZ (High Pass)
• 100 MHz (Low Pass)
• (1-100)
MHz(Baseband)
Measurements Configuration Value
AOI Template
Fall Time (Pos)
Fall Time (Neg)
Rise Time (Pos)
Rise Time (Neg)
RF Symmetry (Pos)
RF Symmetry (Neg)
RF Symmetry (Max-Min)
Overshoot (Pos)
Overshoot (Neg)
Differential Output Voltage (Pos)
Differential Output Voltage (Neg)
Amplitude Symmetry
RF Symmetry (Max-Min)
Jitter Measurement Type • Tie
Analyze
Analyze
Fail Threshold 1 to 5000
• Histogram
Table continued…
34
Page 35

Measurements Configuration Value
Duty Cycle Distortion
Operating basics
Receiver Return Loss
Transmitter Return Loss
Analyze
Smoothing Averages
Loads (Ohm)
Table 14: Measurements configuration for Analyze 10BASE-T
Measurements Configuration Value
Link Pulse Load With TPM
Link Pulse Load Without TPM
Link Pulse Timing With TPM
Link Pulse Timing Without TPM
Differential Voltage
TP_IDL Load Without TPM
TP_IDL Load With TPM
Jitter Normal with TPM
Jitter Normal without TPM
Analyze
Analyze
Analyze
Analyze
Analyze
Mask Selection
Fail Threshold
Peak • Min
Mask Selection
Fail Threshold
MAU Type • Internal
Head, Tail, Both
1
• Min Max
Head, Tail, Both
1
• External
1 to 10
• 85, 100, 115
• 100
Jitter 8.0 with TPM
Jitter 8.0 without TPM
Jitter 8.5 with TPM
Jitter 8.5 without TPM
MAU Internal
MAU External
MAU Internal (Inverted)
MAU External (Inverted)
Transmitter Return Loss
Receiver Return Loss
Table continued…
Analyze
Fail Threshold
Mask Scale
Smoothing Averages 1 to 100
Loads (Ohm) • 85, 100, 115
1
Normal, 2. 0.9 and 3. 1.1
• 100
TekExpress® Ethernet Electrical Testing Application Application Help 35
Page 36

Operating basics
Measurements Configuration Value
CM Voltage Analyze Filter Type
• None
• 1 MHz (High Pass)
• 100 MHz (Low Pass)
• 1-100 MHz (Band pass)
Table 15: Measurements configuration for Acquire 1000BASE-T
Measurements Configuration Value
Template Point A
Template Point B
Template Point C
Template Point D
Template Point F
Template Point H
Template Point A (D)
Template Point B (D)
Template Point C (D)
Template Point D (D)
Template Point F (D)
Template Point H (D)
Transmitter Distortion Without TX_TCLK
Transmitter Distortion With TX_TCLK
Transmitter Distortion Without TX_TCLK (D)
Transmitter Distortion With TX_TCLK (D)
Acquire Acquisition Average 16 to 256
TriggerLevel (A) -5 V to 5 V
TriggerLevel (B) -5 V to 5 V
Acquire
Acquire
Acquisition Average 16 to 256
-1000 mV to 1000
mV
10 ns to 200 ns
Peak Point A
Peak Point B
Peak Point C
Peak Point D
Droop Point G
Droop Point J
Peak Point A (D)
Peak Point B (D)
Peak Point C (D)
Peak Point D (D)
Droop Point G (D)
Table continued…
36
Page 37
Measurements Configuration Value
Droop Point J (D)
Operating basics
Master Filtered Without TX_TCLK
Master UnFiltered Without TX_TCLK
Slave Filtered Without TX_TCLK
Slave UnFiltered Without TX_TCLK
Master Filtered With TX_TCLK
Master UnFiltered With TX_TCLK
Slave Filtered With TX_TCLK
Slave UnFiltered With TX_TCLK
Transmitter Return Loss Acquire Acquisition Average 100 to 10000
CM Voltage -
Acquire
Measurement
Duration
Number Of Clock
Edges
• 1 ms
• 10 ms
• 100 ms
• 1000 ms
• 100000
• 1000000
• 10000000
Table 16: Measurements configuration for Acquire 100BASE-T
Measurements Configuration Value
AOI Template
Fall Time (Pos)
Fall Time (Neg)
Rise Time (Pos)
Acquire Number of samples 5000 to 2147400000
Acquire
Acquisition Type Sample, Average
Number of
Waveforms
2 to 10000
Rise Time (Neg)
RF Symmetry (Pos)
RF Symmetry (Neg)
RF Symmetry (Max-Min)
Overshoot (Pos)
Overshoot (Neg)
Differential Output Voltage (Pos)
Differential Output Voltage (Neg)
Amplitude Symmetry
RF Symmetry (Max-Min)
Jitter
Duty Cycle Distortion
Receiver Return Loss
Transmitter Return Loss
-
Acquire
Acquire
Acquisition Type
Acquisition Average 100 to 10000
Sample, Average
TekExpress® Ethernet Electrical Testing Application Application Help 37
Page 38

Operating basics
Table 17: Measurements configuration for Acquire for 10BASE-T
Measurement Configuration Value
Link Pulse Timing Without TPM
Acquire
Number of Acquisitions
2 to 10000
Link Pulse Timing With TPM
Link Pulse Load Without TPM
Link Pulse Load With TPM
Differential Voltage
TP_IDL Load With TPM
TP_IDL Load Without TPM
Jitter Normal with TPM
Jitter Normal without TPM
Jitter 8.0 with TPM
Jitter 8.0 without TPM
Jitter 8.5 with TPM
Jitter 8.5 without TPM
Number of Waveforms
Acquire
Acquire
Acquire Number of Acquisitions
Acquisition Average 2 to 1000
Acquisition Delay 1 to 10000 (Micro-seconds)
Acquisition Type • Sample
Number of Acquisitions
Number of Waveforms
1 to 10000
• Average
2 to 10000
1 to 10000
2 to 10000
MAU Internal
MAU External
MAU Internal (Inverted)
MAU External (Inverted)
Harmonic
Transmitter Return Loss
Receiver Return Loss
CM Voltage
Acquire
Acquire Acquisition Average
Acquisition Delay 1 to 10000 (Micro-seconds)
Math Average 2 to 10000
1000 to 10000
100 to 10000
Return Loss Calibration steps
You can configure a DUT (Device Under Test) by adjusting it to conform to a dependable measure before running the Return Loss
measurement.
Complete OPEN, SHORT, and LOAD calibrations before running the Return Loss measurement.
To run the Return Loss calibration, follow the steps given below:
38
Page 39
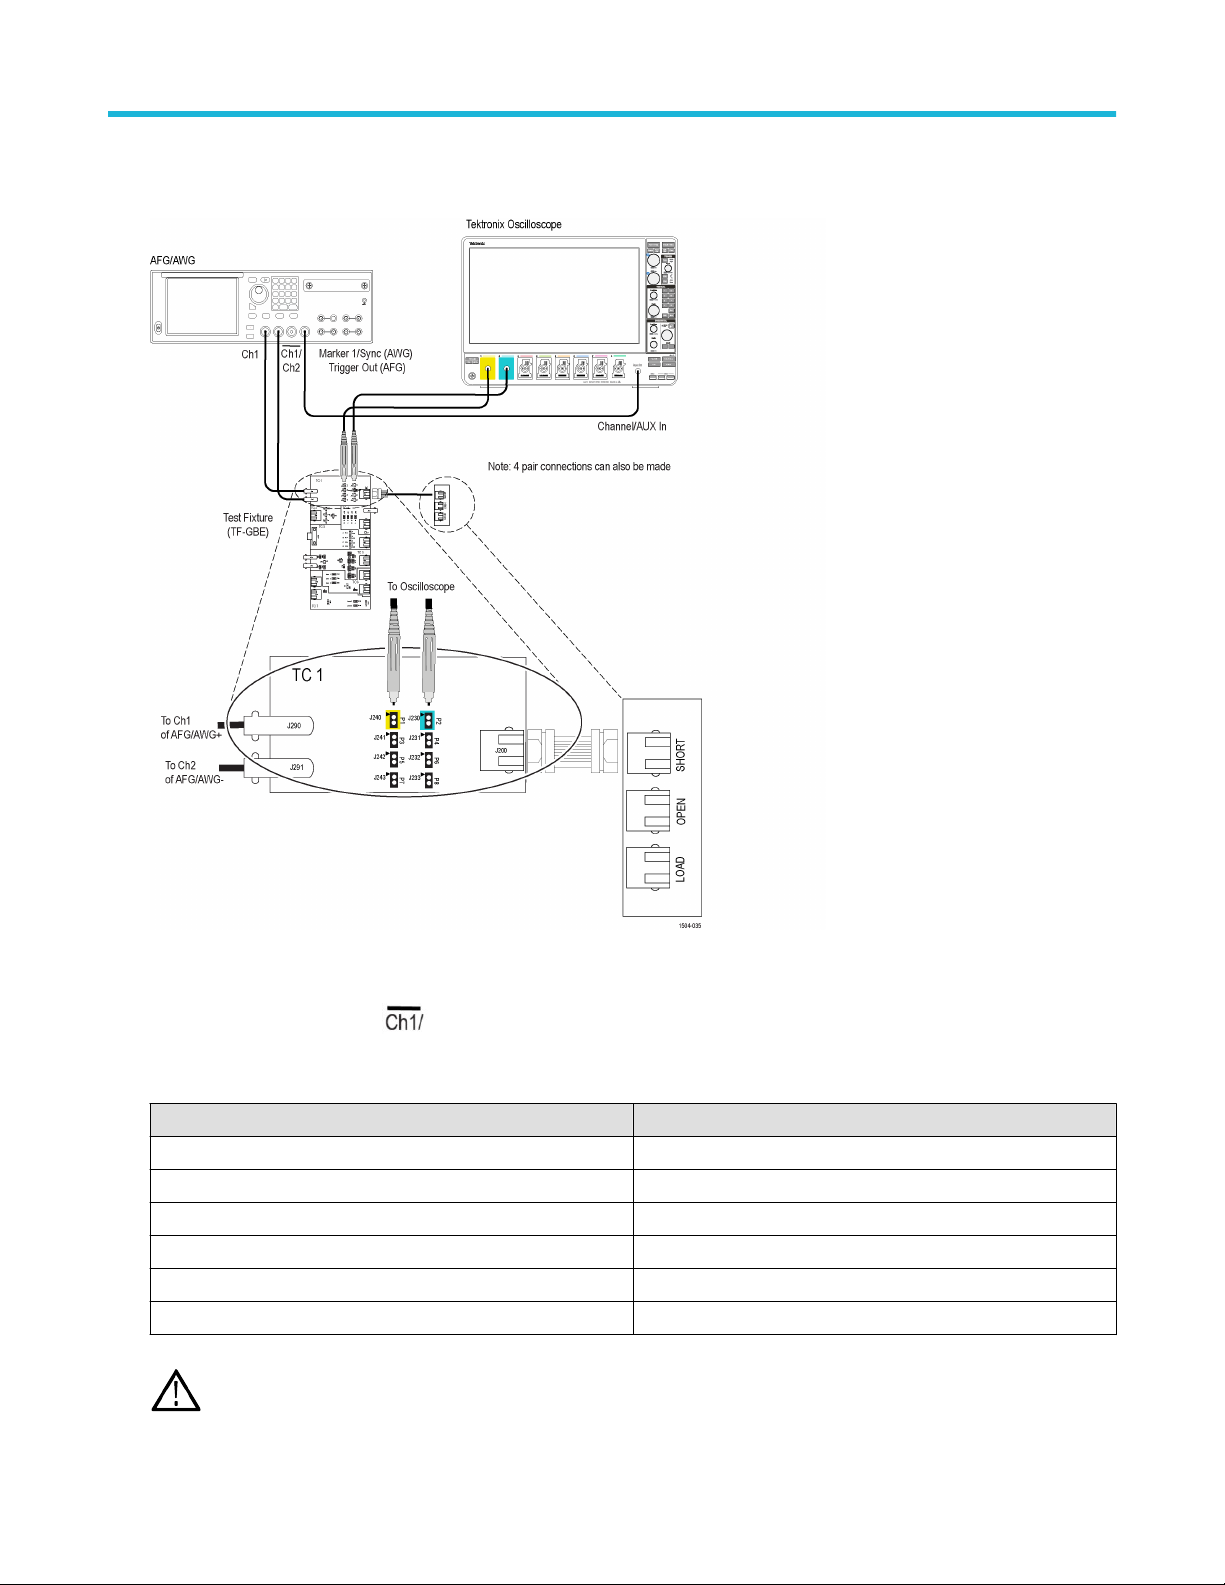
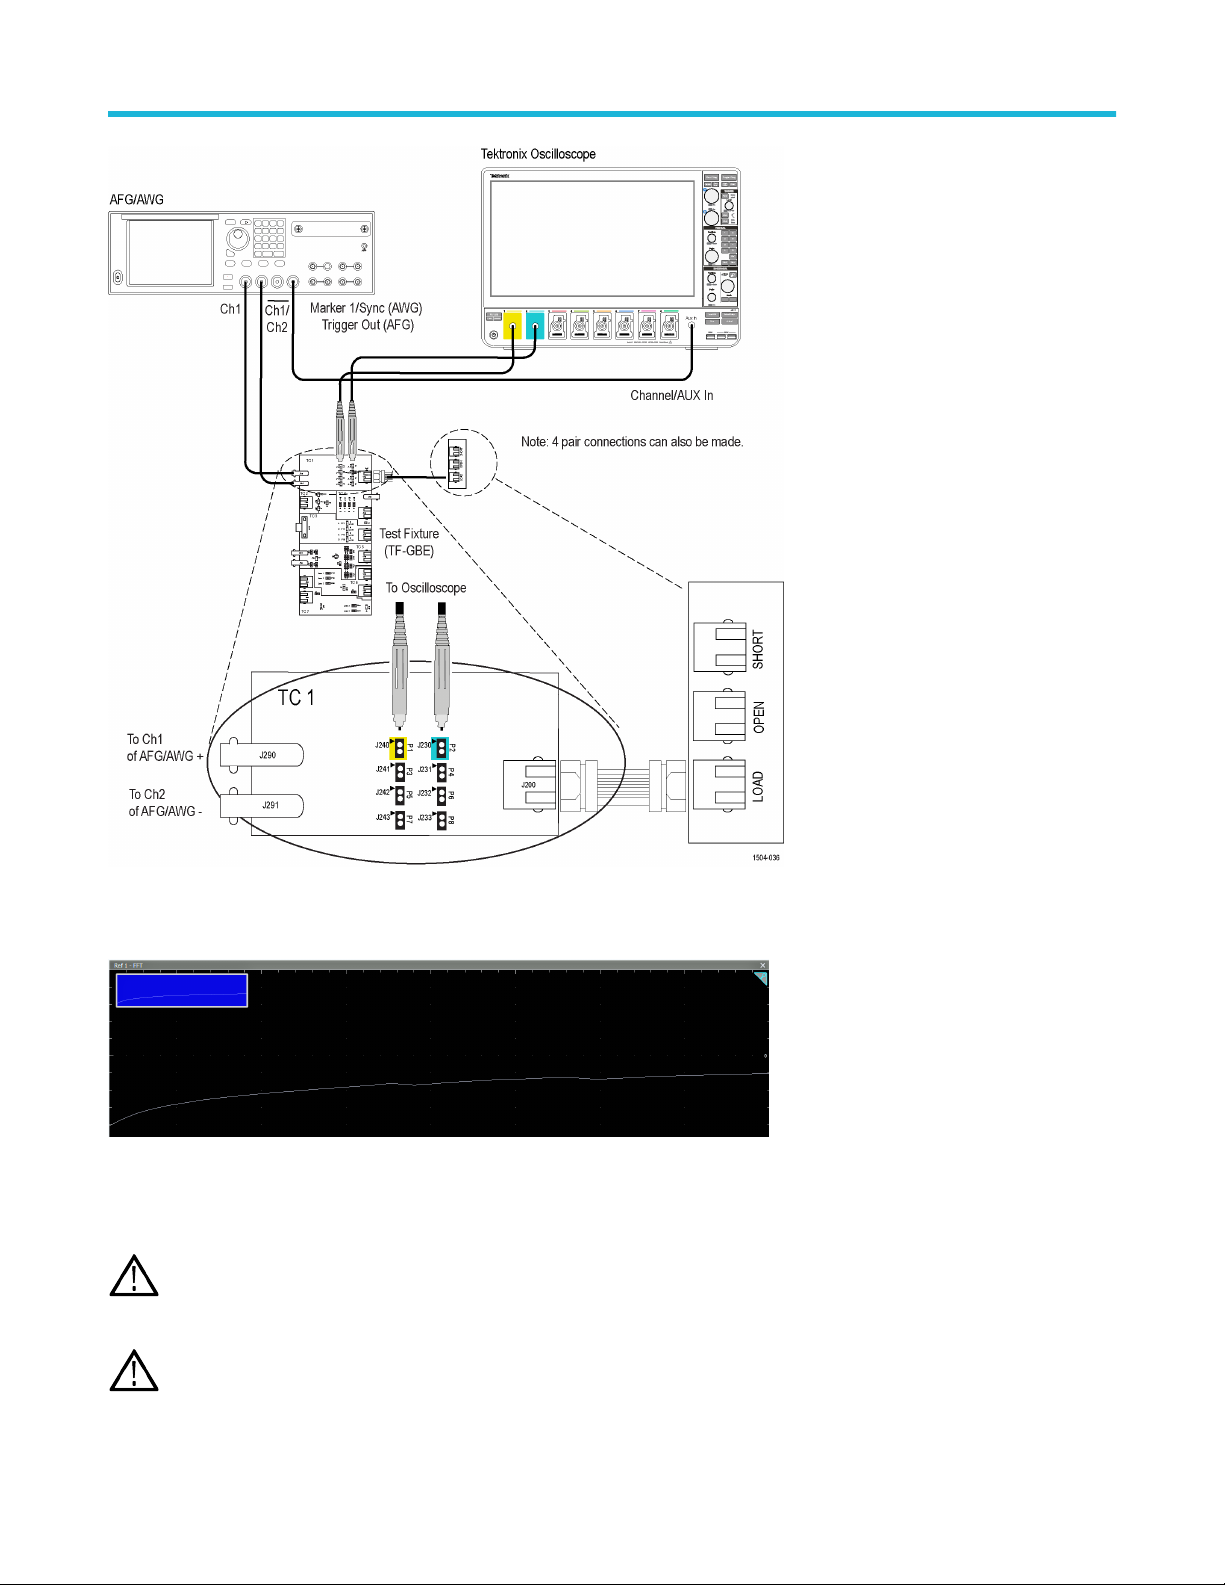
1. Use TC1 in the test fixture.
Make the connections as shown in the following figure.
Operating basics
Figure 6: Connection diagram for SHORT Calibration
2. Connect a BNC Cable between channel 1 of AWG/channel 1 of AFG and J290.
3. Connect a BNC Cable between
AWG/channel 2 of AFG and J291.
4. Connect Differential probes from configured channels of the oscilloscope to P1 and P2 for Transmitter Return Loss, P3 and P4 for
Receiver Return Loss.
Pair / Return Loss Type Pair to be used
Transmitter return loss P1 and P2
Receiver return loss P3 and P4
Pair BI-DA P1 and P2
Pair BI-DB P3 and P4
Pair BI-DC P5 and P6
Pair BI-DD P7 and P8
Note: All 4 pairs can be calibrated simultaneously for 1000Base-T-Multi Pair, by connecting all the pairs to Oscilloscope.
TekExpress® Ethernet Electrical Testing Application Application Help 39
Page 40

Operating basics
5. Connect the termination SHORT, LOAD, and OPEN to J200 one by one, for calibration.
6. In the TekExpress Ethernet application click the DUT panel and select the Suite of interest.
7. For 1000Base-T-Multi Pair: Click the Acquisitions panel and select the channels for calibration.
8. If Aux is selected as Source3 (Trigger Sync Input), select the checkbox.
Note: Aux channel is present only in "6 Series MSO" oscilloscopes.
9. In the Options > Instrument Control settings, refresh to view the connected AWG/AFG.
10. In the Configuration Panel, select the Signal source model (For Return Loss test: AWG/AFG).
11. Click Return Loss.
Figure 7: Configuration Panel to select Signal Source and to perform Return Loss Calibration
12. In the Calibration dialog, select Tx for Transmission or Rx for Receiver Return Loss Calibration.
13. For 1000Base-T-Multi Pair, make the connections for all the pairs selected in Acquisition panel. All the pairs will be calibrated
simultaneously.
14. Perform SHORT, OPEN, and LOAD Calibration one by one with connection changes (detailed below) and click Apply. This
completes the Return Loss Calibration.
40
Page 41
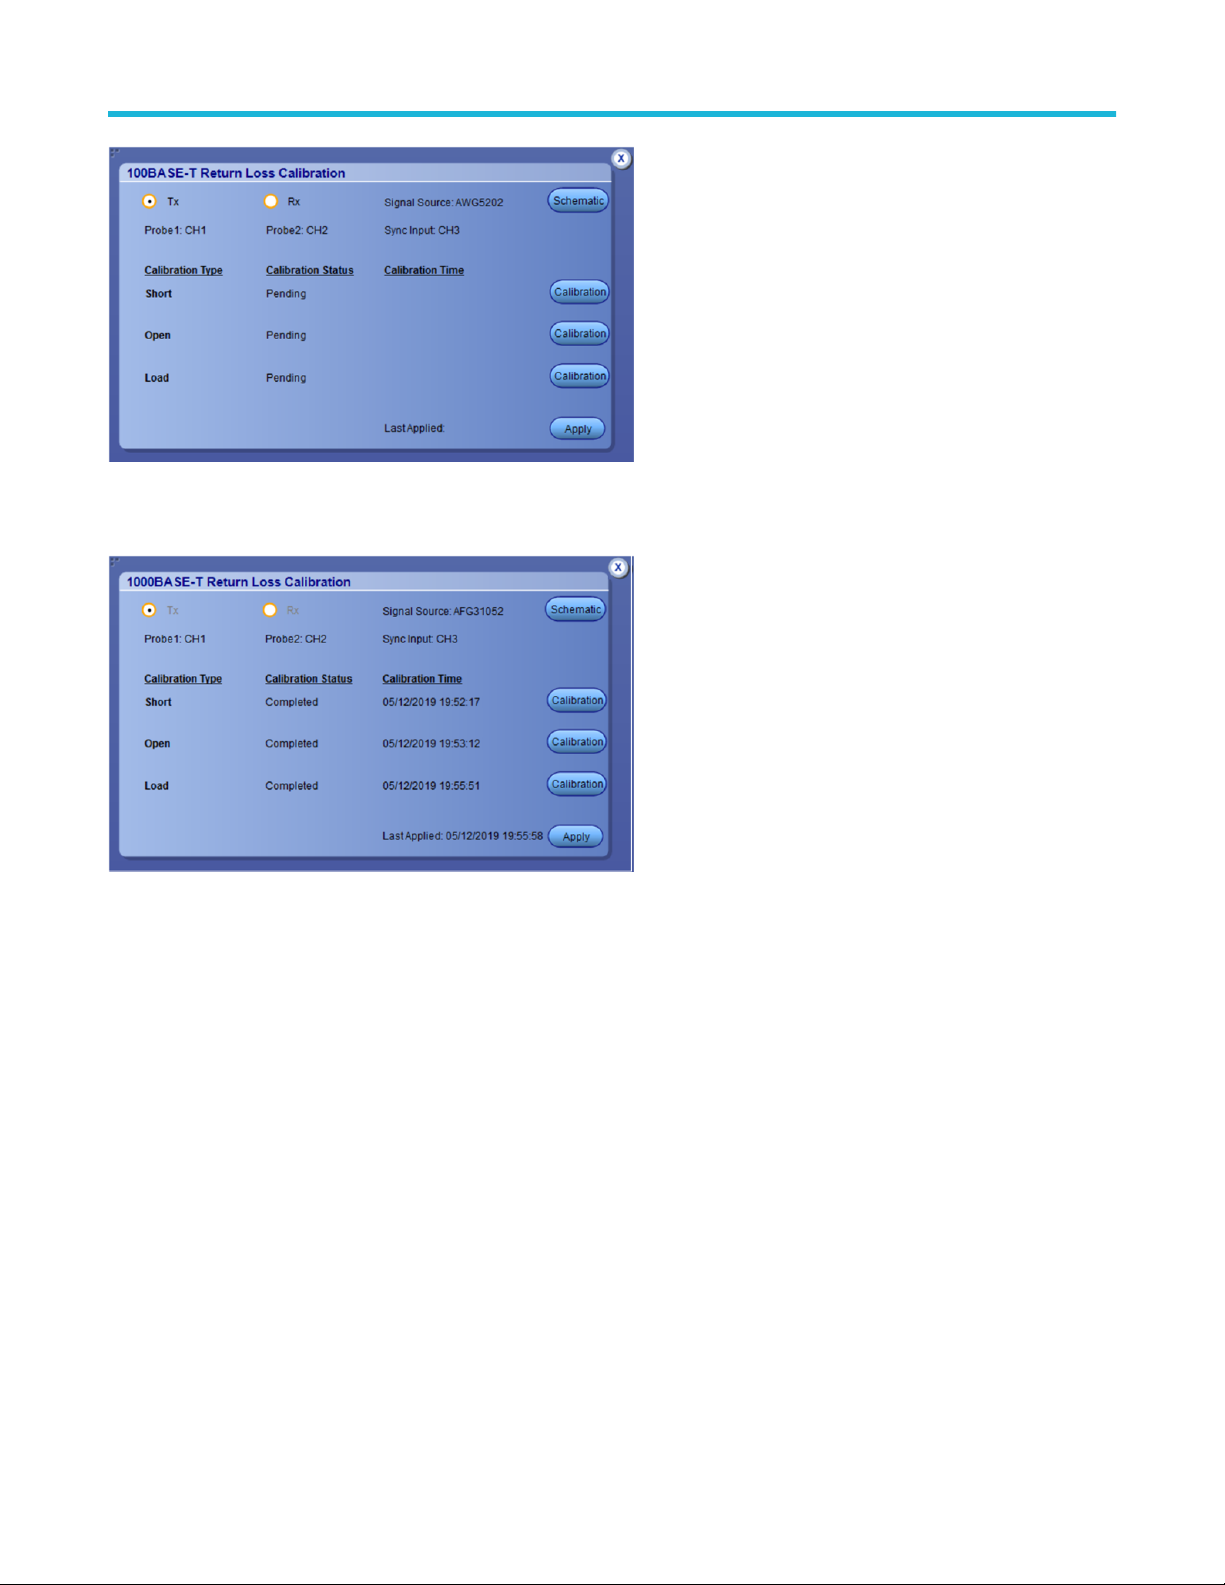
Figure 8: Calibration panel before performing calibration
The corresponding date and time for the latest successful Calibration and Apply are displayed.
Operating basics
Figure 9: Calibration panel after calibration is performed for OPEN, SHORT, and LOAD and then Apply
SHORT calibration:
Perform the above-mentioned steps with SHORT termination connected to J200 as shown below:
TekExpress® Ethernet Electrical Testing Application Application Help 41
Page 42
Operating basics
Figure 10: Connection diagram for SHORT Calibration
The following figure displays a typical waveform for Return Loss SHORT Calibration.
Figure 11: Calibration output for SHORT calibration
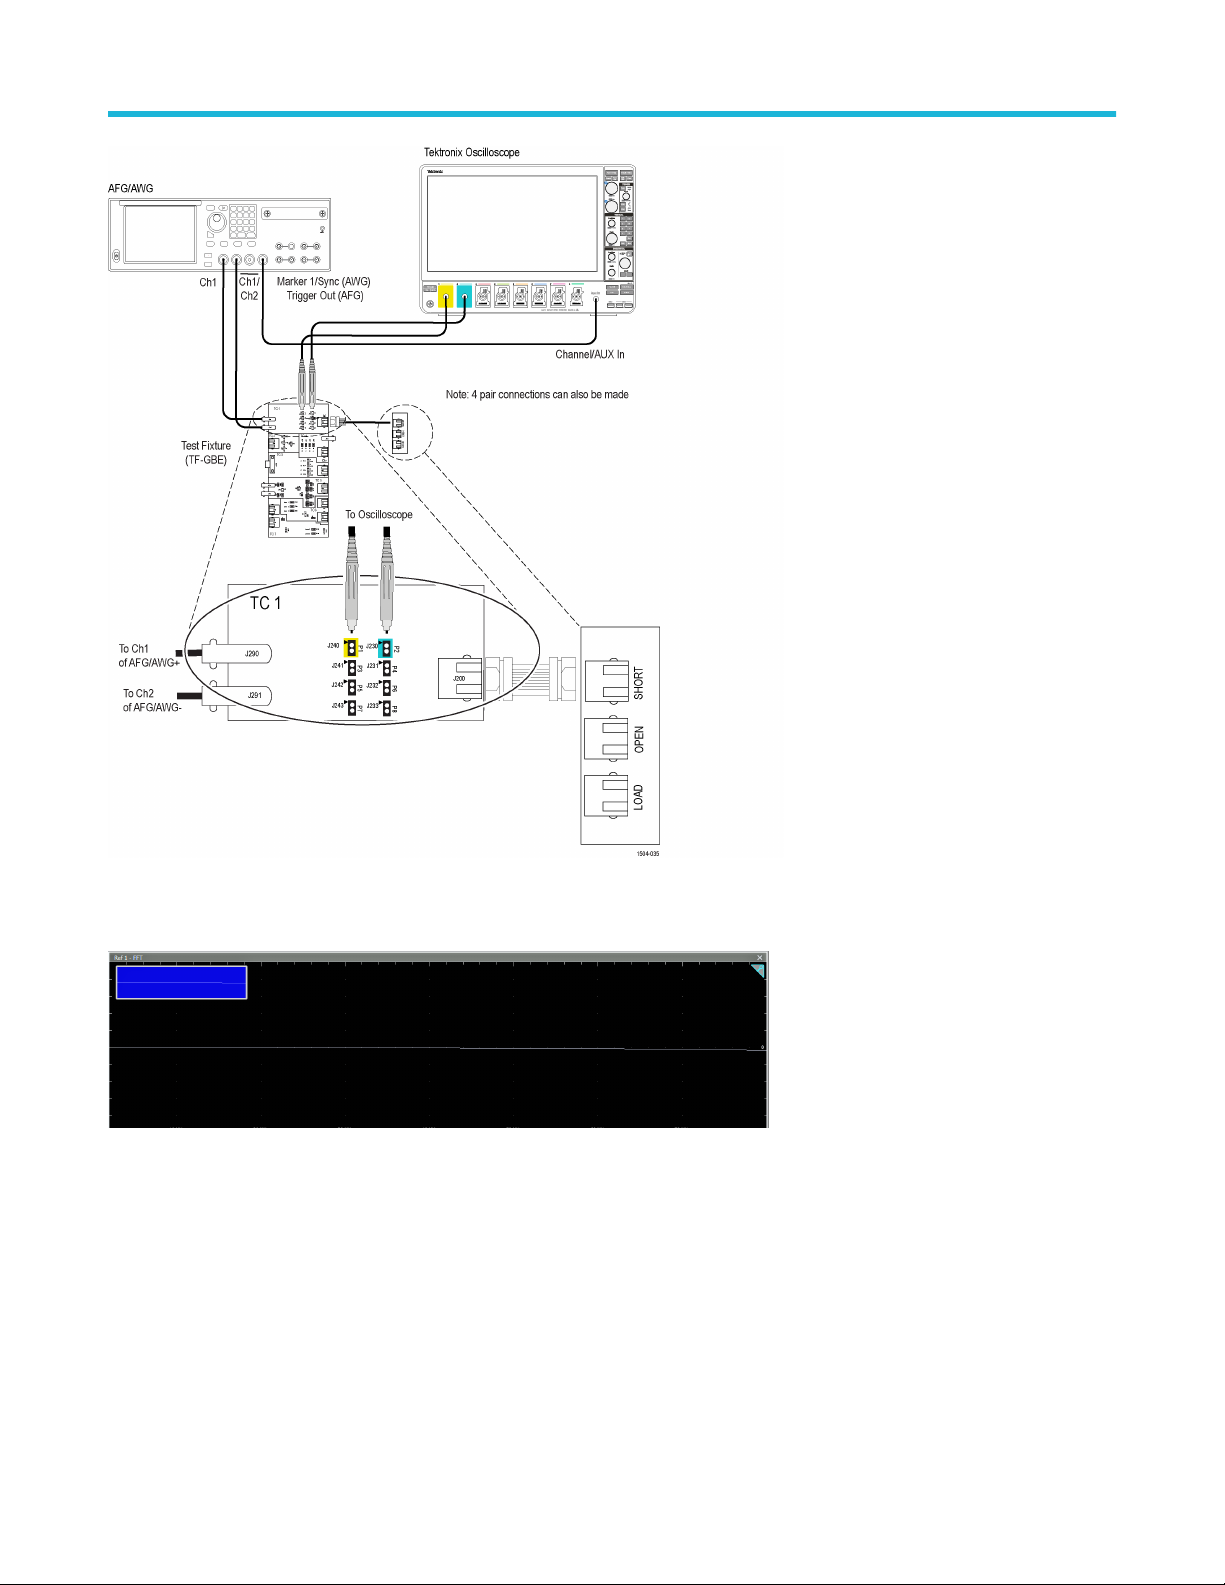
OPEN Calibration:
42
Page 43
Operating basics
Figure 12: Connection diagram for OPEN Calibration
The following figure shows a typical waveform for Return Loss OPEN Calibration.
Figure 13: Calibration output for OPEN calibration
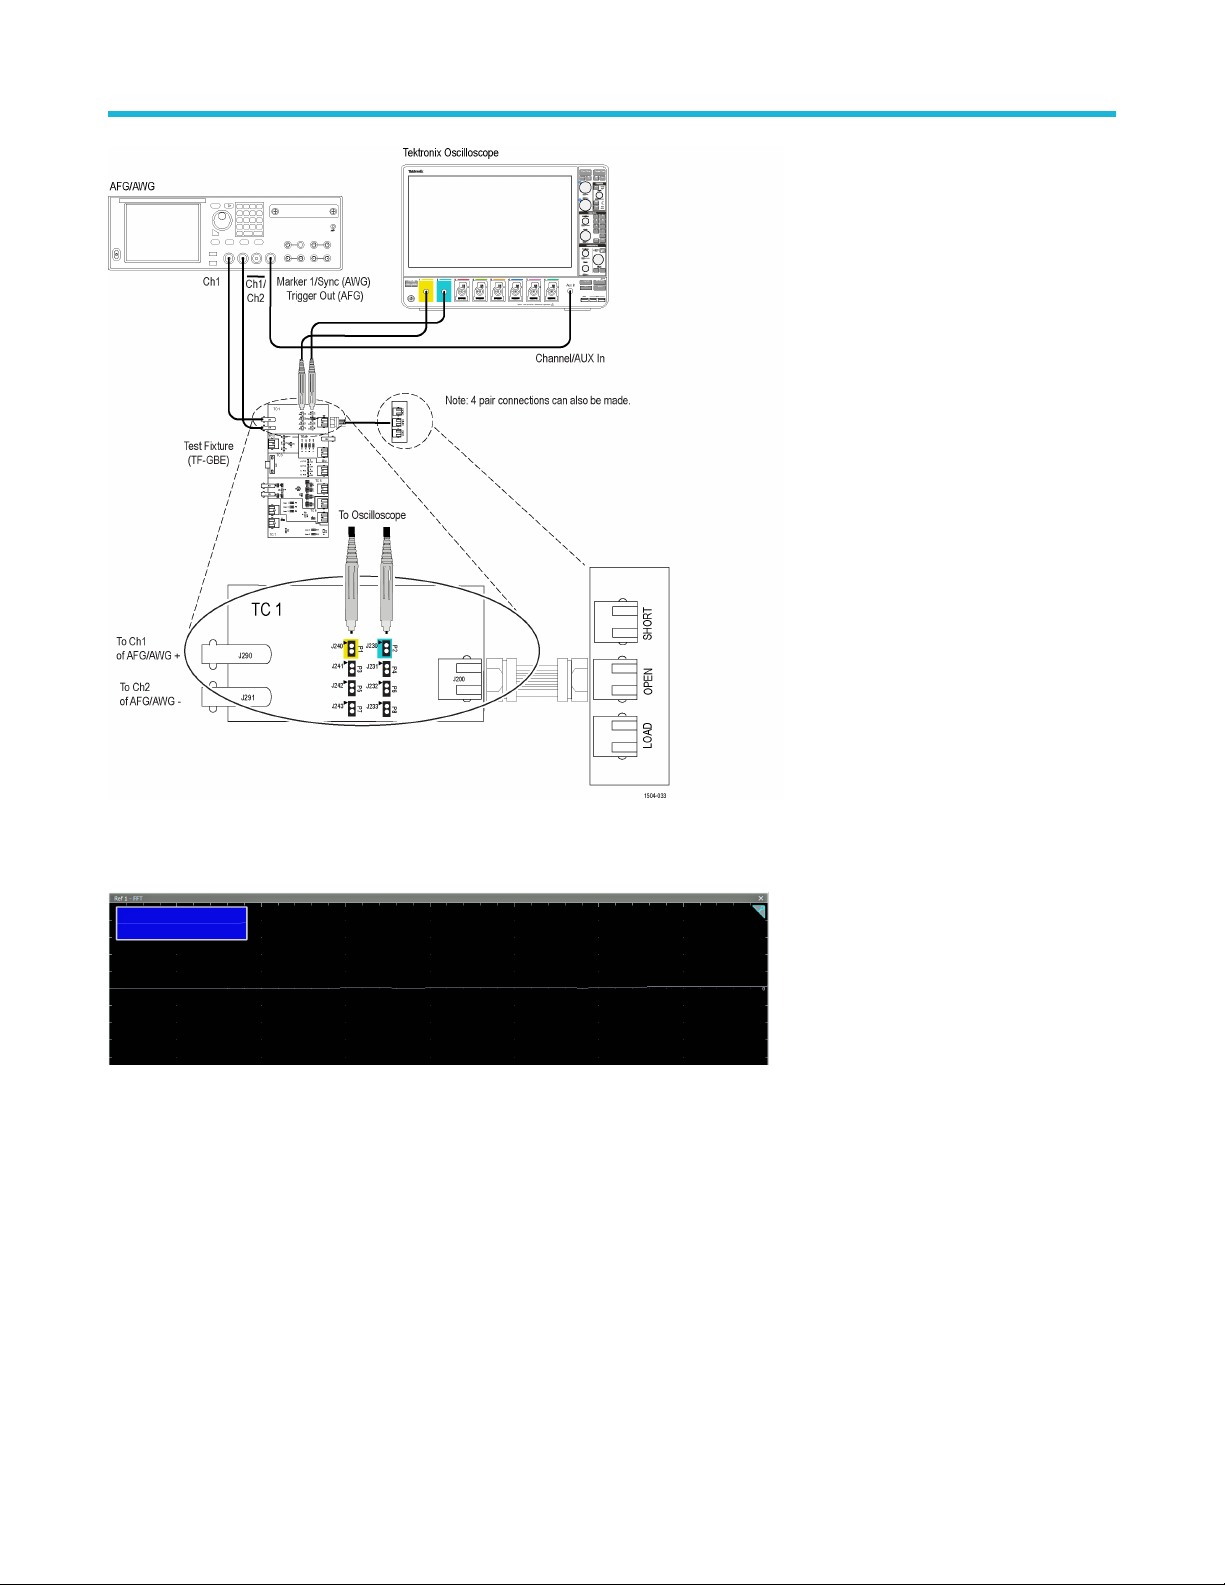
LOAD Calibration:
Perform the above mentioned steps with LOAD termination connected to J200 as shown below:
TekExpress® Ethernet Electrical Testing Application Application Help 43
Page 44
Operating basics
Figure 14: Calibration output for LOAD calibration
The following figure shows a typical waveform for Return Loss LOAD Calibration.
Figure 15: Calibration output for LOAD calibration
After OPEN, SHORT, and LOAD calibration, click Apply in Return Loss Calibration window which generates the Return Loss
measurements pre-requisite data by using calibration values.
Clicking Apply will not apply any setting on the oscilloscope nor does any acquisition.
Note:
Note: If you change any of the following configurations, calibration for Open, Short, and Load must be performed again before
running the return loss measurement:
• Channels and Trigger Sync input
• Signal Source selected
44
Page 45

Operating basics
• Return Loss type (Transmitter or Receiver)
Method to set up the Signal Source for Do not use configuration:
In Configuration Panel if the Signal source is selected as For Return Loss test: AWG/AFG is Do not use, then the waveform need to be
manually loaded in the Signal Source before running the Calibration or Return Loss measurement.
Figure 16: Return Loss Signal Source selection, with Do not use configuration
Method for loading the waveform on the supported AWG:
• Copy the waveform available at Oscilloscope at C:\Program Files\Tektronix\TekExpress\TekExpress Ethernet\AWG
Waveforms\10BaseT Return Loss\AWG Format\RL10_AWG.wfm, to the AWG using LAN or USB.
Example mentioned above is for 10BaseT, select the folder accordingly for 1000BaseT or 100BaseT. The above path is applicable for
all supported AWG models.
• Open the waveform for the corresponding speed and AWG series from Open File option, and when prompted, select option Max &
Preserve Offset settings.
• Set Amplitude to 1.5 Vpp. (Maximum supported Amplitude)
• Click Setup > Clock > set the Sample Rate to 250 MS/s.
• Click Setup > Channel > set the Resolution(bits) to (15 + 1 Mkr).
• Switch ON the channel and click Play.
Figure 17: AWG with Return Loss waveform loaded
Method for loading the waveforms on the supported AFG:
For AFG3000 series:
1. Copy the waveform available at Oscilloscope at C:\Program Files\Tektronix\TekExpress\TekExpress Ethernet\AWG
Waveforms\10BaseT Return Loss\AFG Format\RL10_AFG.tfw, to AFG using USB. Example mentioned above is for 10BaseT, select
the folder accordingly for 1000BaseT or 100BaseT. The above path is applicable for all supported AFG 3000 series models.
TekExpress® Ethernet Electrical Testing Application Application Help 45
Page 46
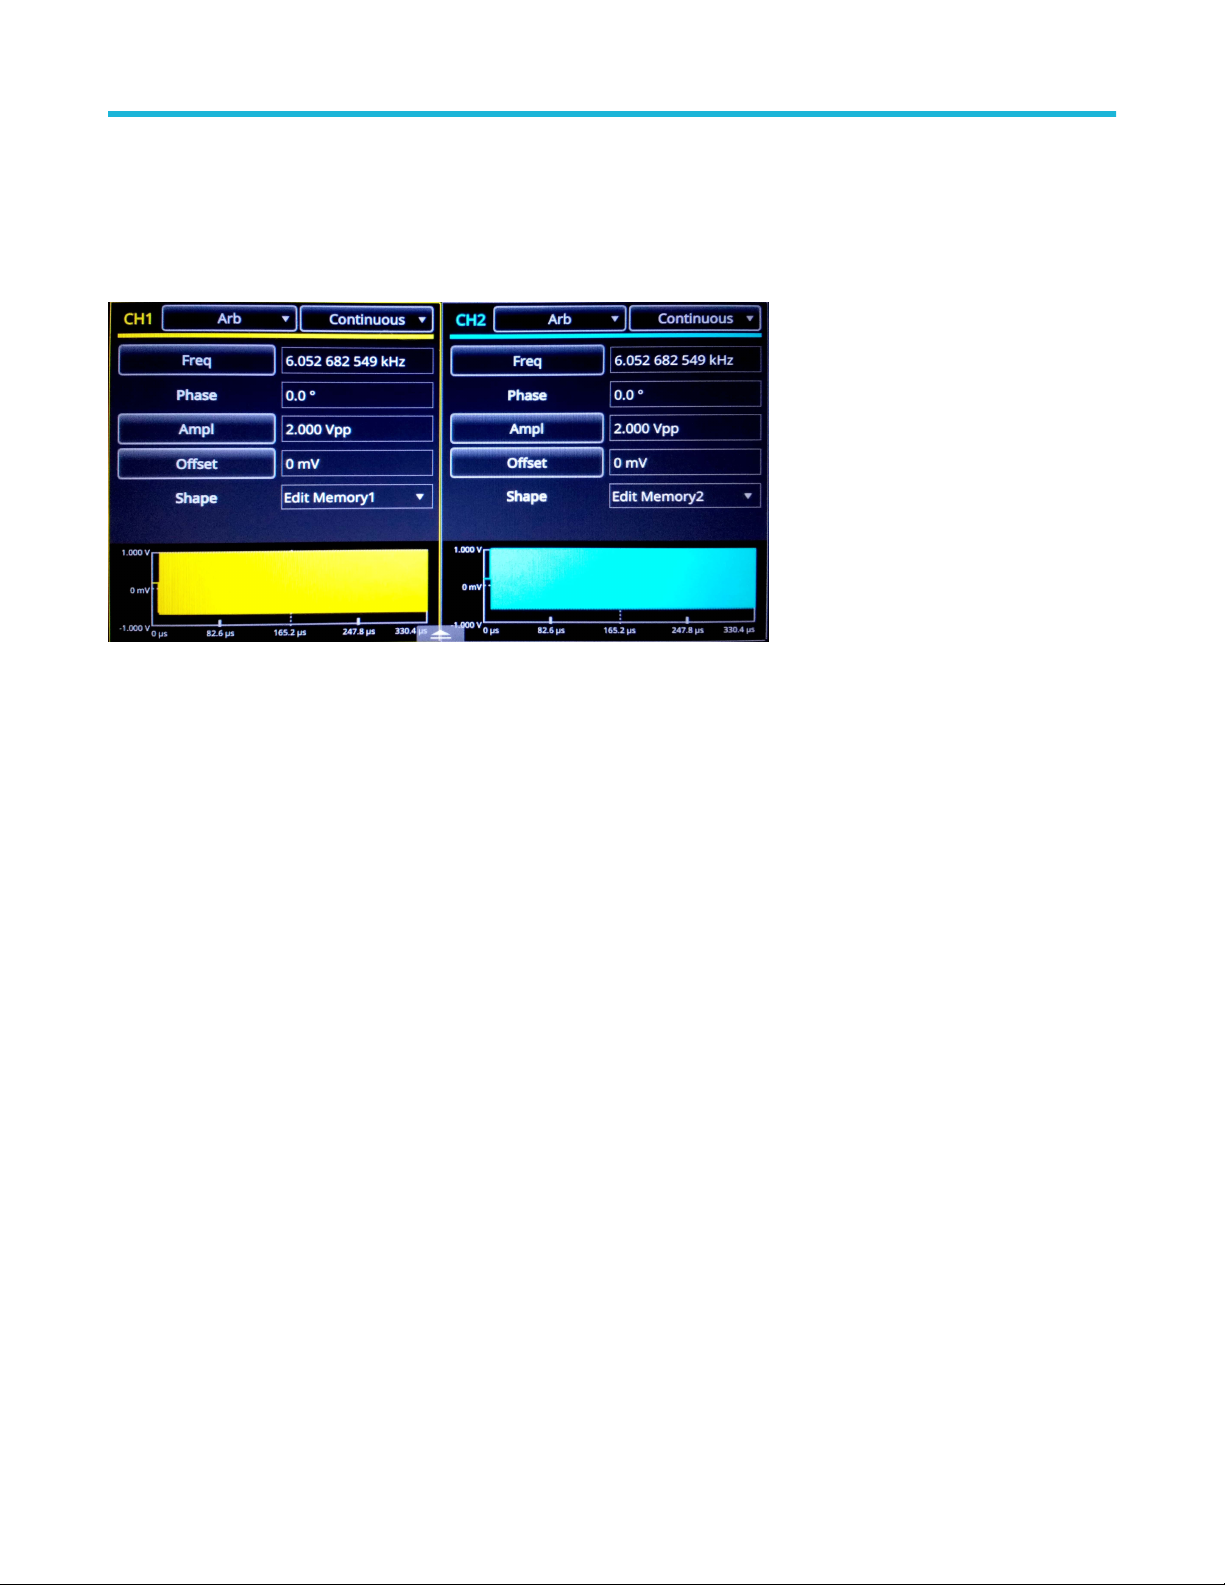
Operating basics
2. Click Arb > Arb Waveform menu > USB > select the waveforms (.tfw) on both the channels.
3. Set the Frequency to 6.052682549 kHz for 100BaseT and 1000BaseT and 6.097560976 kHz for 10BaseT, for both the channels.
4. Set the Amplitude to 2.0 Vpp, for both the channels.
5. Invert the waveforms on channel 2.
6. Switch ON both the channels.
Figure 18: AFG with Return Loss waveforms loaded
For AFG31000 series:
1. Copy the waveform available at Oscilloscope at C:\Program Files\Tektronix\TekExpress\TekExpress Ethernet\AWG
Waveforms\10BaseT Return Loss\AFG Format\RL10_AFG.tfw, to AFG using USB. Example mentioned above is for 10BaseT,
select the folder accordingly for 1000BaseT or 100BaseT. The above path is applicable for all the supported AFG models.
2. Click Home > ArbBuilder > Open > USB, select corresponding folder and file (.tfw) and click OK.
3. Click Save As and save the waveform on the Memory (.tfwx). Click OK.
4. Click Home > Basic > select Arb from drop down menu for the channel 1.
5. From Shape > File > USB > select the waveform file for the corresponding speeds from Memory(.tfwx).
6. Repeat steps 4 and 5 for channel 2.
7. Set the Frequency to 6.052682549 kHz for 100BaseT and 1000BaseT and 6.097560976 kHz for 10BaseT, for both the channels.
8. Set the Amplitude to 2.0 Vpp, for both the channels.
9. Invert the waveforms on channel 2.
10. Switch ON both the channels.
JigMatch calibration steps
You can measure the Amplitude and Frequency of the disturbing signal and set the default values. The application measures and displays
the values in the Measured Value fields. You can validate the disturbing signal by comparing the measured value with the expected value.
46
Page 47
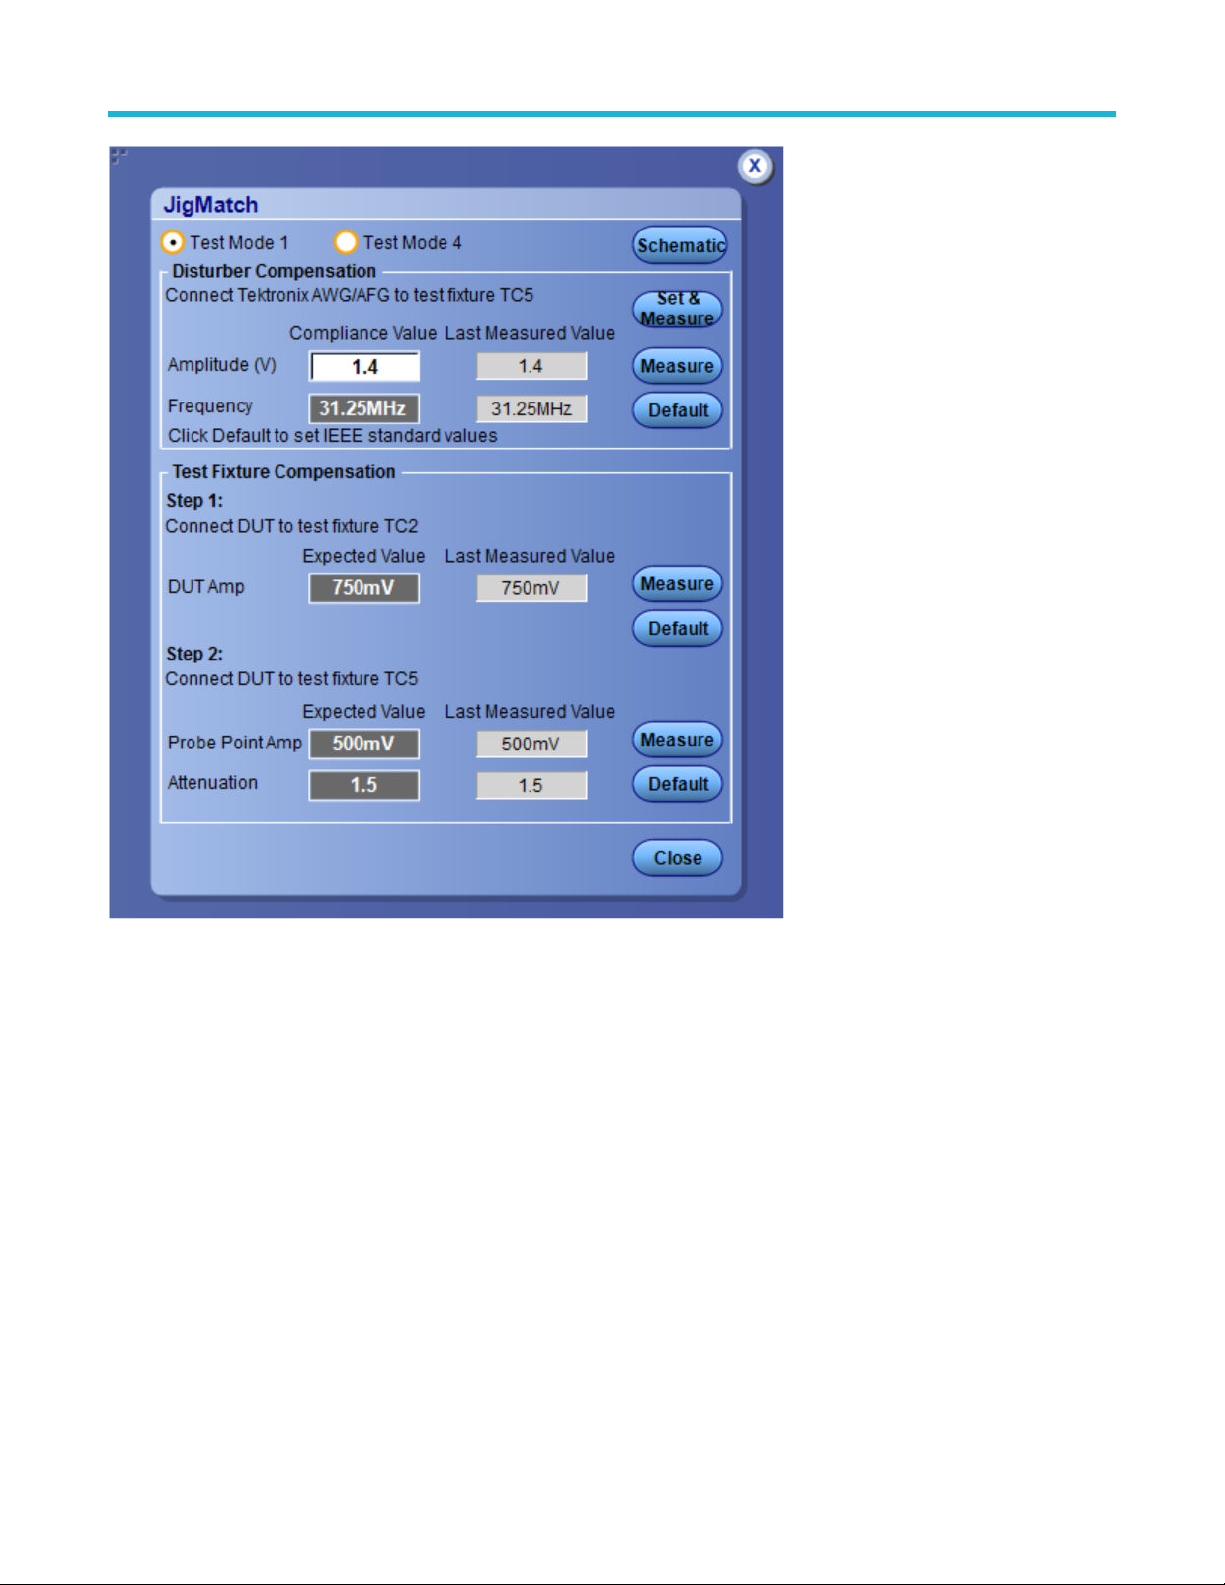
Operating basics
Figure 19: JigMatch calibration configuration panel
To do the JigMatch calibration in the TekExpress application follow the steps below:
1. In the DUT panel and select the Suite of interest.
2. In the Acquisitions panel and select the channel for measurement.
3. In the Instrument Control settings, refresh to view the connected AWG/AFG.
4. From the Configuration panel, select the Signal source model in For JigMatch test: AWG/AFG/Scope AFG.
5. Click JigMatch.
TekExpress® Ethernet Electrical Testing Application Application Help 47
Page 48
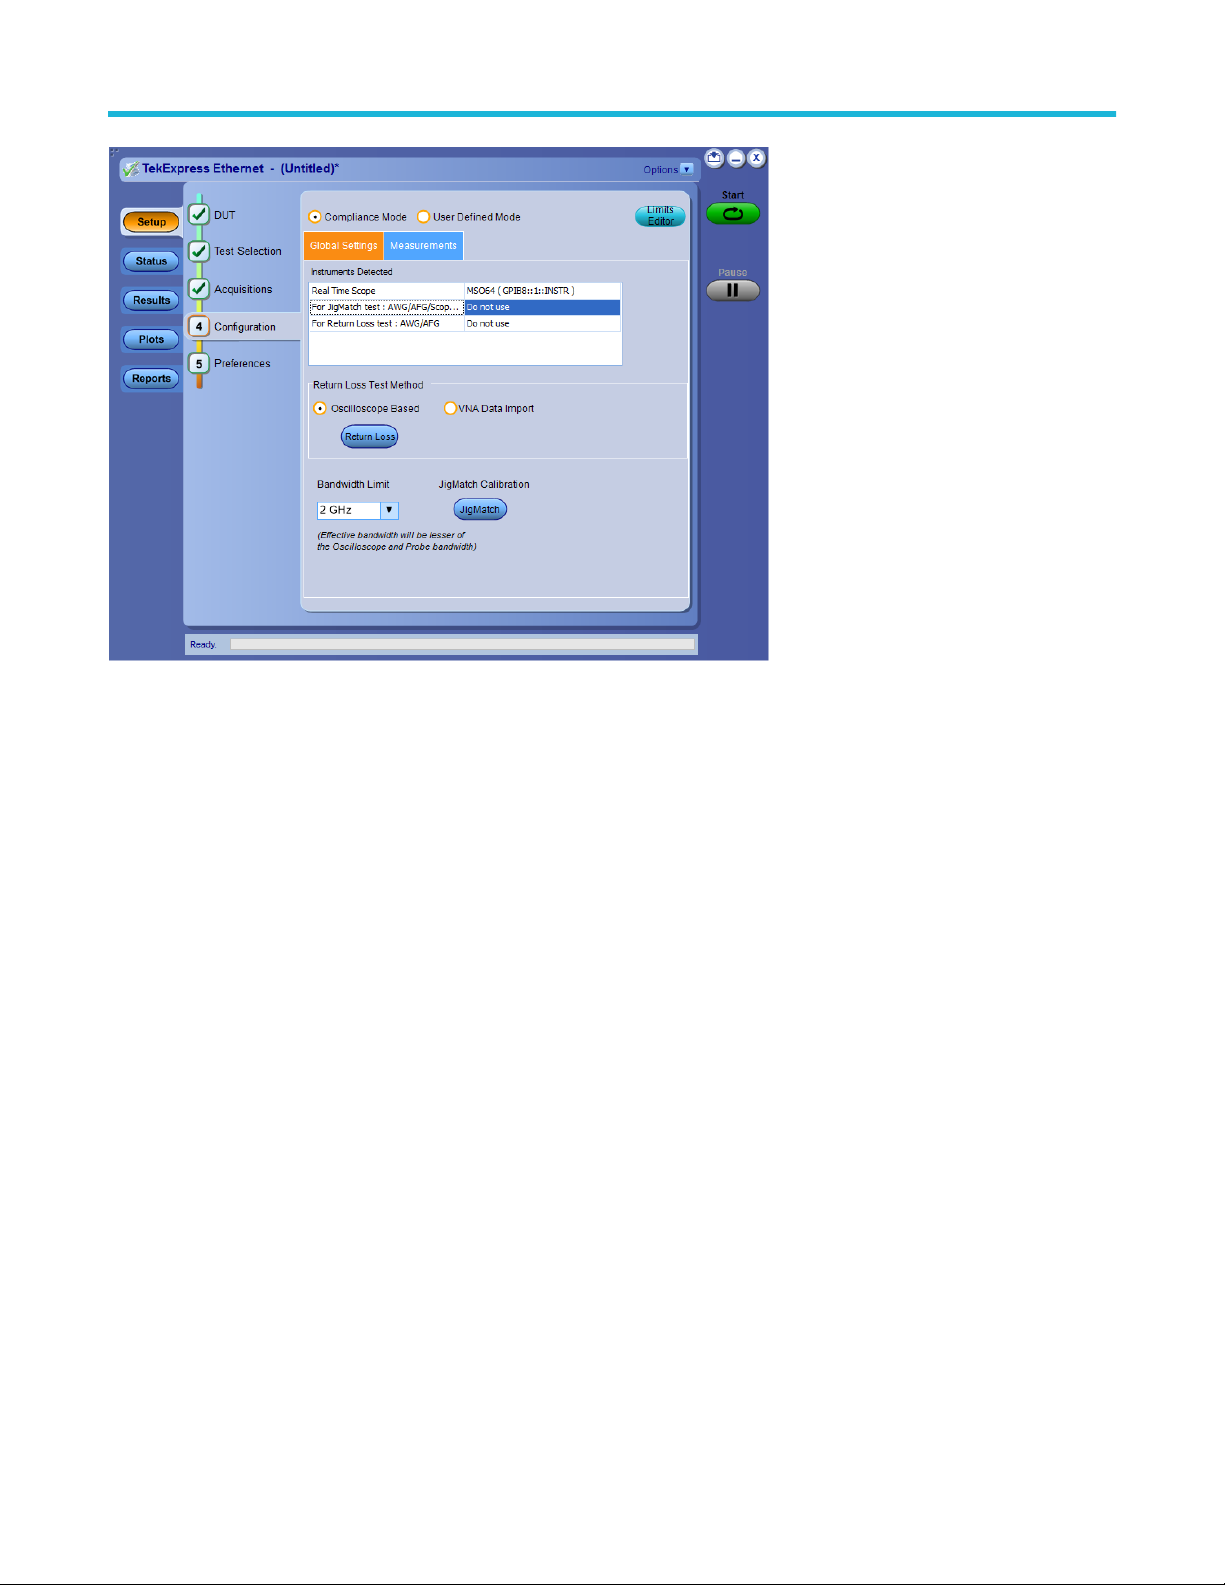
Operating basics
Figure 20: Configuration Panel for selecting Signal Source and to perform JigMatch Calibration
JigMatch calibration includes the following:
• Disturber Compensation
• Test Fixture Compensation Step 1
• Test Fixture Compensation Step 2
To measure the Disturbing Signal using JigMatch, follow the steps given below:
1. Use TC5 of the test fixture.
2. Make the connections as shown in the following figure:
48
Page 49
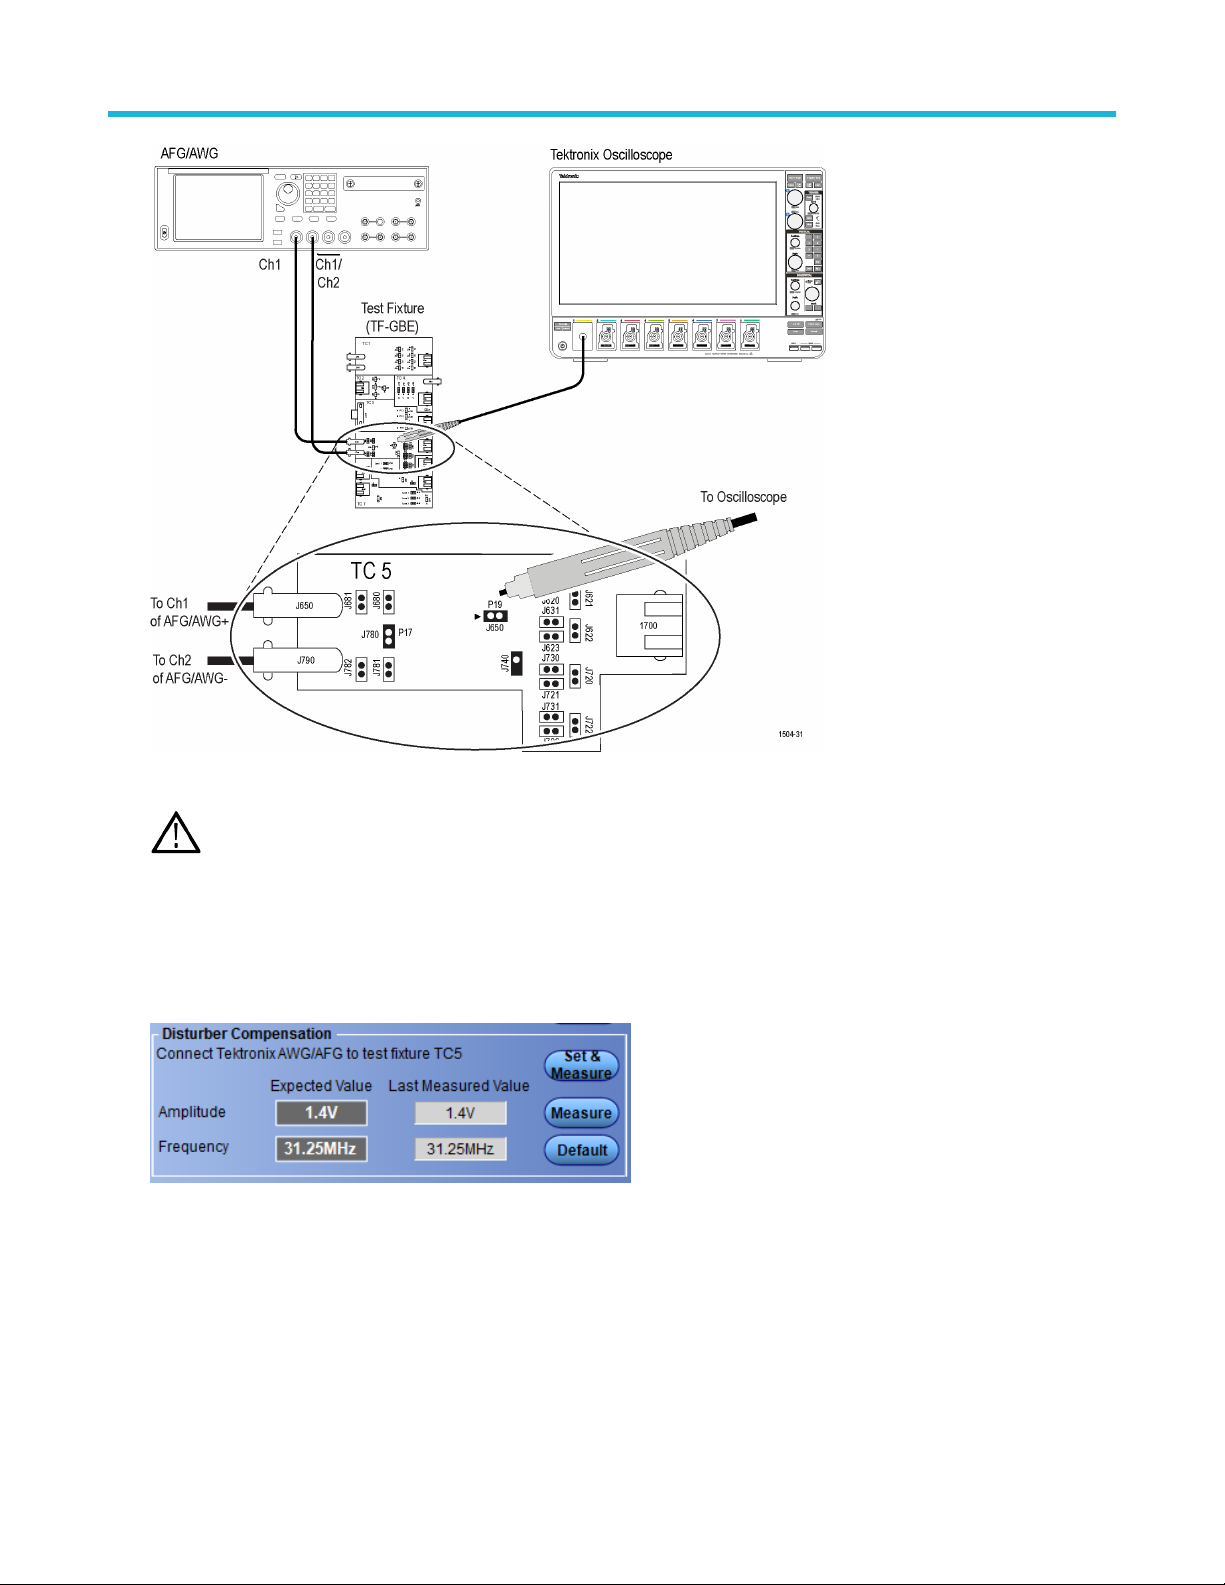
Operating basics
Figure 21: Connection diagram to measure Disturbing Signal using JigMatch
Do not connect the Ethernet cable to J700 and the test port of the DUT.
Note:
3. Connect a BNC cable between Channel 1 of AFG/AWG+ and J650.
4. Connect a BNC cable between Channel 2 of AFG/AWG- and J790.
5. Short the jumpers J621, J630, J620, J623, J721, J723, J680, and J781.
6. Connect the Differential probe to P19 and configured channel of the oscilloscope.
7. In the Jig Match dialog box, click Set&Measure/Measure in the Disturber Compensation group box.
Figure 22: Disturber Compensation in JigMatch
8. Click Default to set the IEEE standard values as Compliance values.
9. If Set & Measure is clicked, AFG/AWG will be configured to the Compliance Value and then value will be measured.
10. If Measure is clicked, value will be measured.
11. Compare the Compliance value and last measured value.
12. If the Measured Value is not approximately equal to the Expected Value, modify the amplitude and clock frequency settings of the
Arbitrary Waveform Generator/Arbitrary Function Generator. Then click Measure to compare the values to be approximately equal.
To compensate the linearities of Test Fixture (TC2) using JigMatch, follow the steps given below:
TekExpress® Ethernet Electrical Testing Application Application Help 49
Page 50
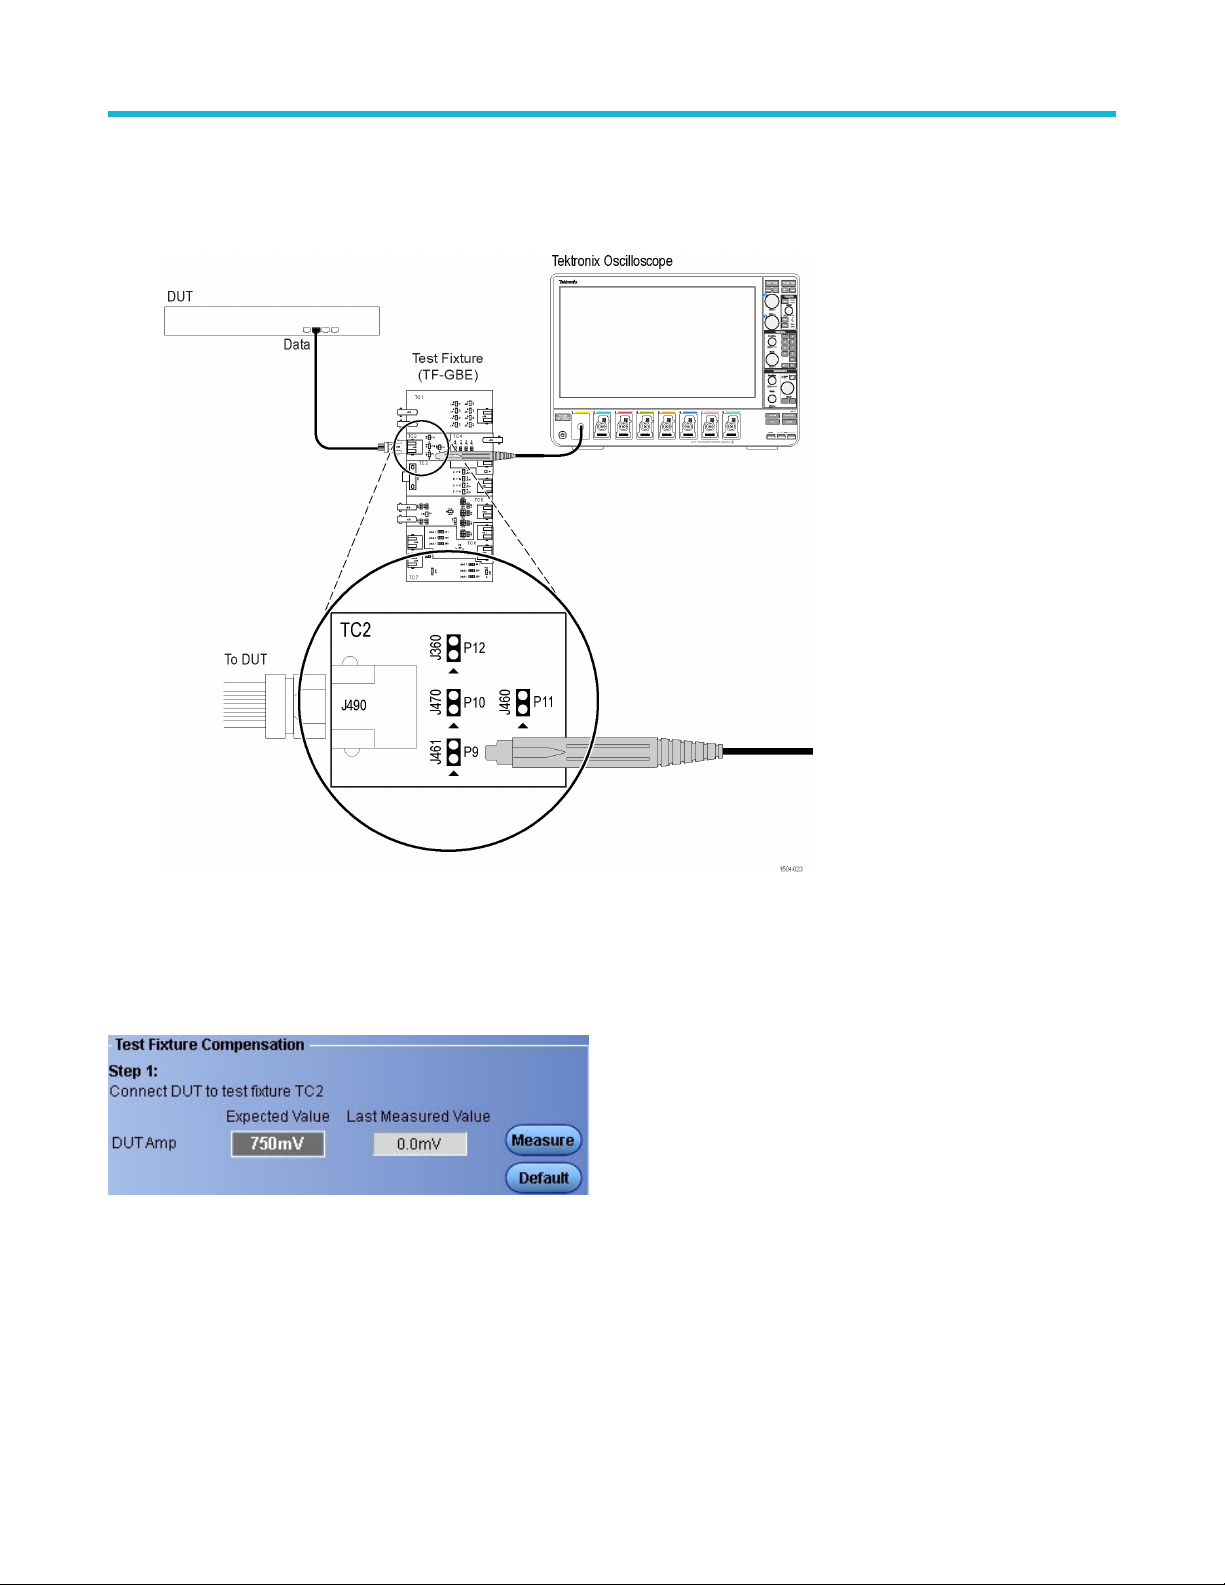
Operating basics
Test Fixture Compensation, Step 1:
1. Use TC2 of the test fixture.
a. Make the connections as shown in the following figure.
Figure 23: Connection diagram to measure linearities of Test Fixture using JigMatch
2. For Template, Droop, and Peak Voltage tests, set the DUT to generate Test Mode 1 signal. For Distortion test, set the DUT to generate
Test Mode 4 signal.
3. Connect the Ethernet cable to J490 and the test port of the DUT.
4. In the JigMatch dialog box >Test Fixture Compensation group box, selectMeasure.
Figure 24: Test Fixture Compensation in JigMatch
To compensate the linearities of Test Fixture (TC5) using JigMatch, follow the steps given below:
Test Fixture Compensation, Step 2:
1. Use TC5 of the test fixture.
2. Make the connections as shown in the following figure.
50
Page 51
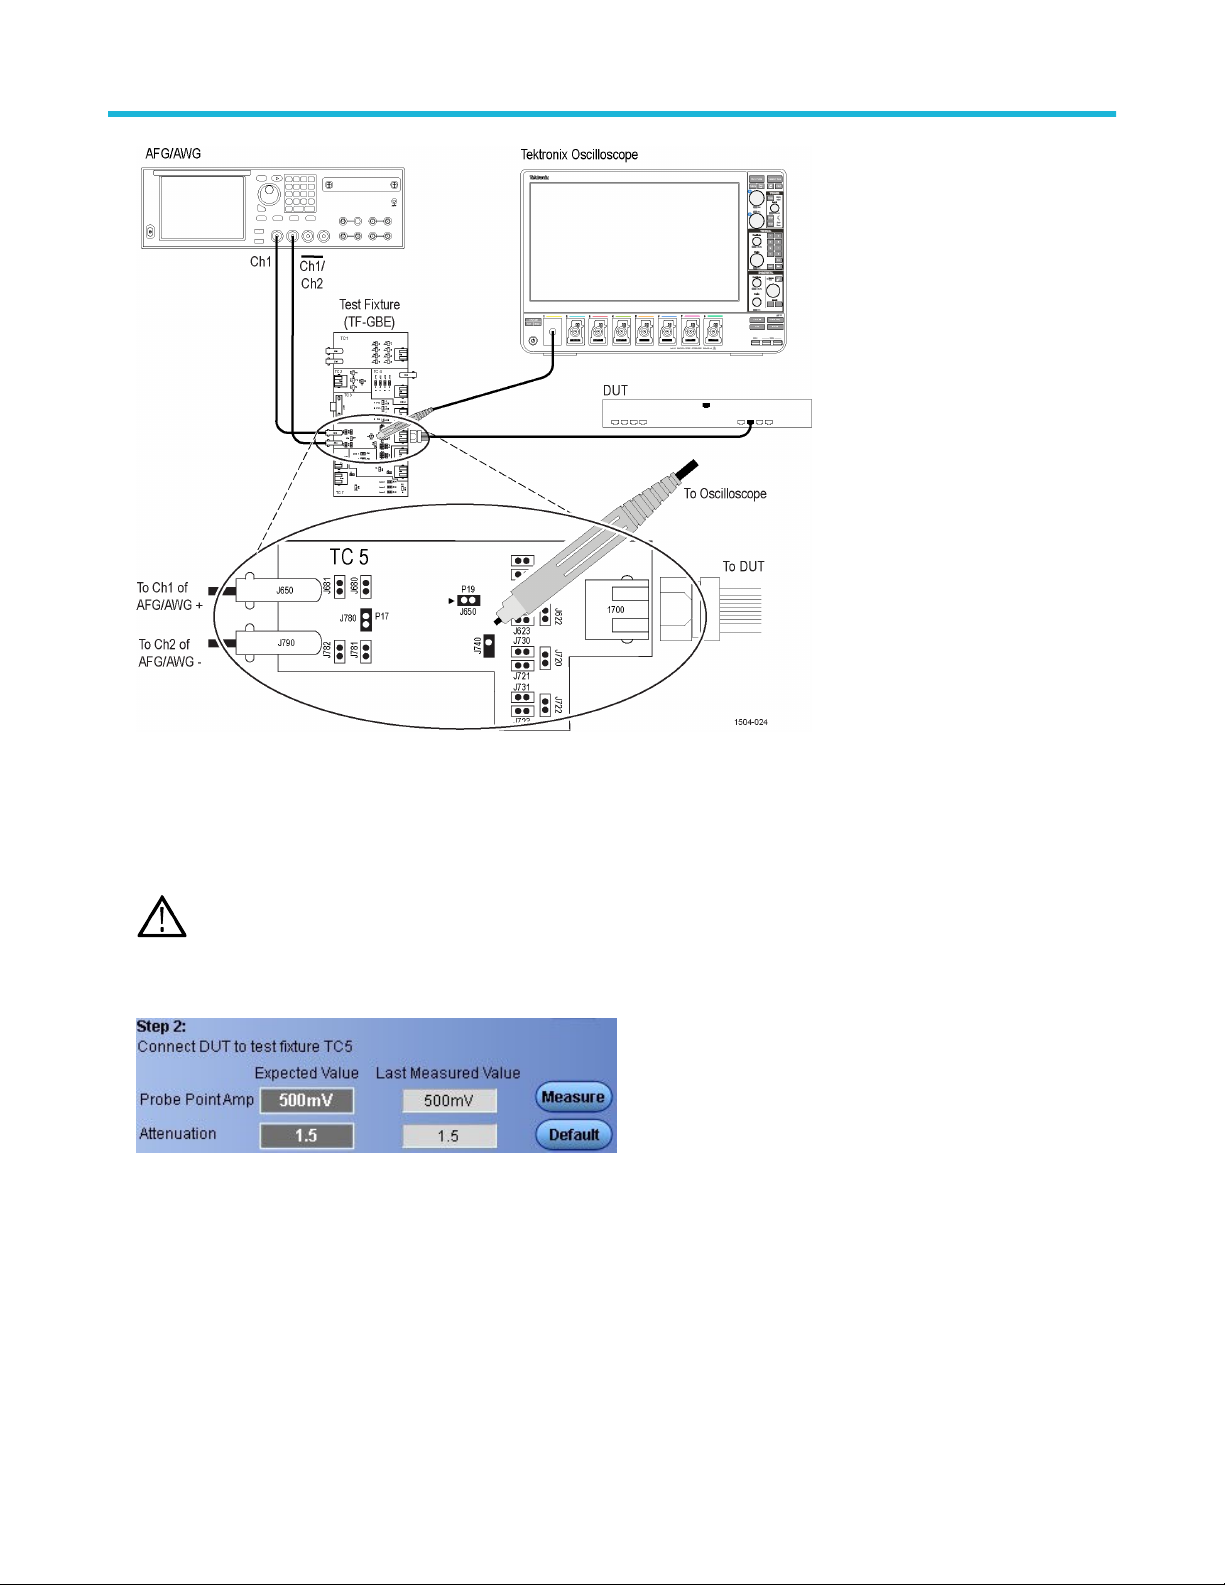
Operating basics
Figure 25: Connection diagram to measure linearities of the Test Fixture using JigMatch
3. For Template, Droop, and Peak Voltage tests, set the DUT to generate Test Mode 1 signal. For Distortion test, set the DUT to generate
Test Mode 4 signal.
4. Connect the Ethernet cable to J700 and test port of the DUT.
5. Switch OFF the Arbitrary Waveform Generator/Arbitrary Function Generator.
Short the jumpers J621, J630, J623, J721, J723, J680, and J781.
Note:
6. Connect the differential probe to P18 and configured channel of the oscilloscope.
7. In the Jig Match dialog box >under step 2 of Test Fixture Compensation group box, select Measure.
Figure 26: Test Fixture Compensation in JigMatch
Method to set up the Signal Source for Do not use configuration:
In Configuration Panel if the Signal source is selected as For JigMatch test: AWG/AFG/Scope AFG is Do not use, then the waveform need
to be manually loaded in the Signal Source before running the JigMatch Calibration.
TekExpress® Ethernet Electrical Testing Application Application Help 51
Page 52
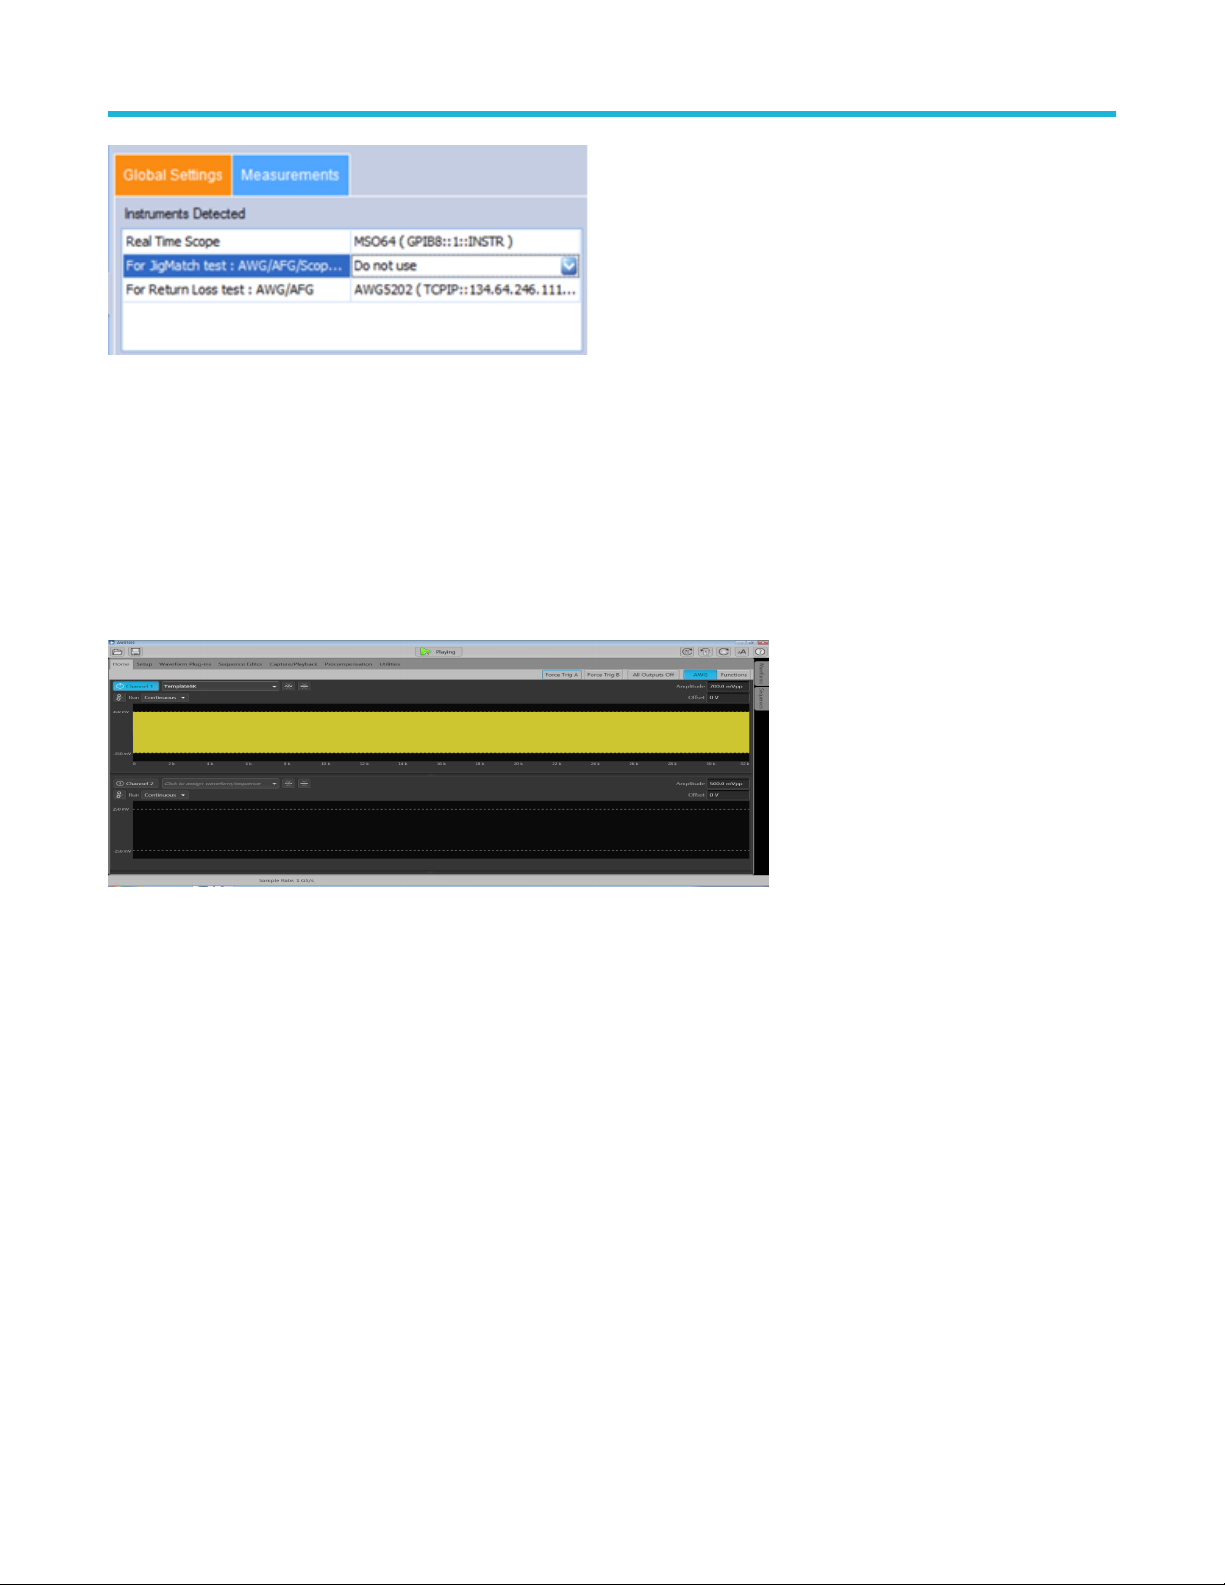
Operating basics
Figure 27: JigMatch Signal Source selection, with "Do not use" configuration
To load the waveform follow the steps below:
Method to setup the supported AWG For Test Mode 1:
1. Copy the waveform available in Oscilloscope located at C:\Program Files\Tektronix\TekExpress\TekExpress Ethernet\AWG
Waveforms\AWG_Automation_Files\Template5K.wfm, to the AWG using LAN or USB.
The above mentioned path is applicable for all supported AWG models.
2. Set Amplitude on the AWG to 700 mVpp.
3. Switch ON the channel and click Play.
Figure 28: AWG with Test Mode 1 waveform loaded
Method to setup the supported AWG For Test Mode 4:
1. Copy the waveform available in Oscilloscope located at C:\Program Files\Tektronix\TekExpress\TekExpress Ethernet\AWG
Waveforms\AWG_Automation_Files\Distortion5K.wfm, to the AWG using LAN or USB.
The above mentioned path is applicable for all supported AWG models.
2. Set Amplitude on AWG to 1.35 Vpp.
3. Switch ON the channel and click Play.
52
Page 53
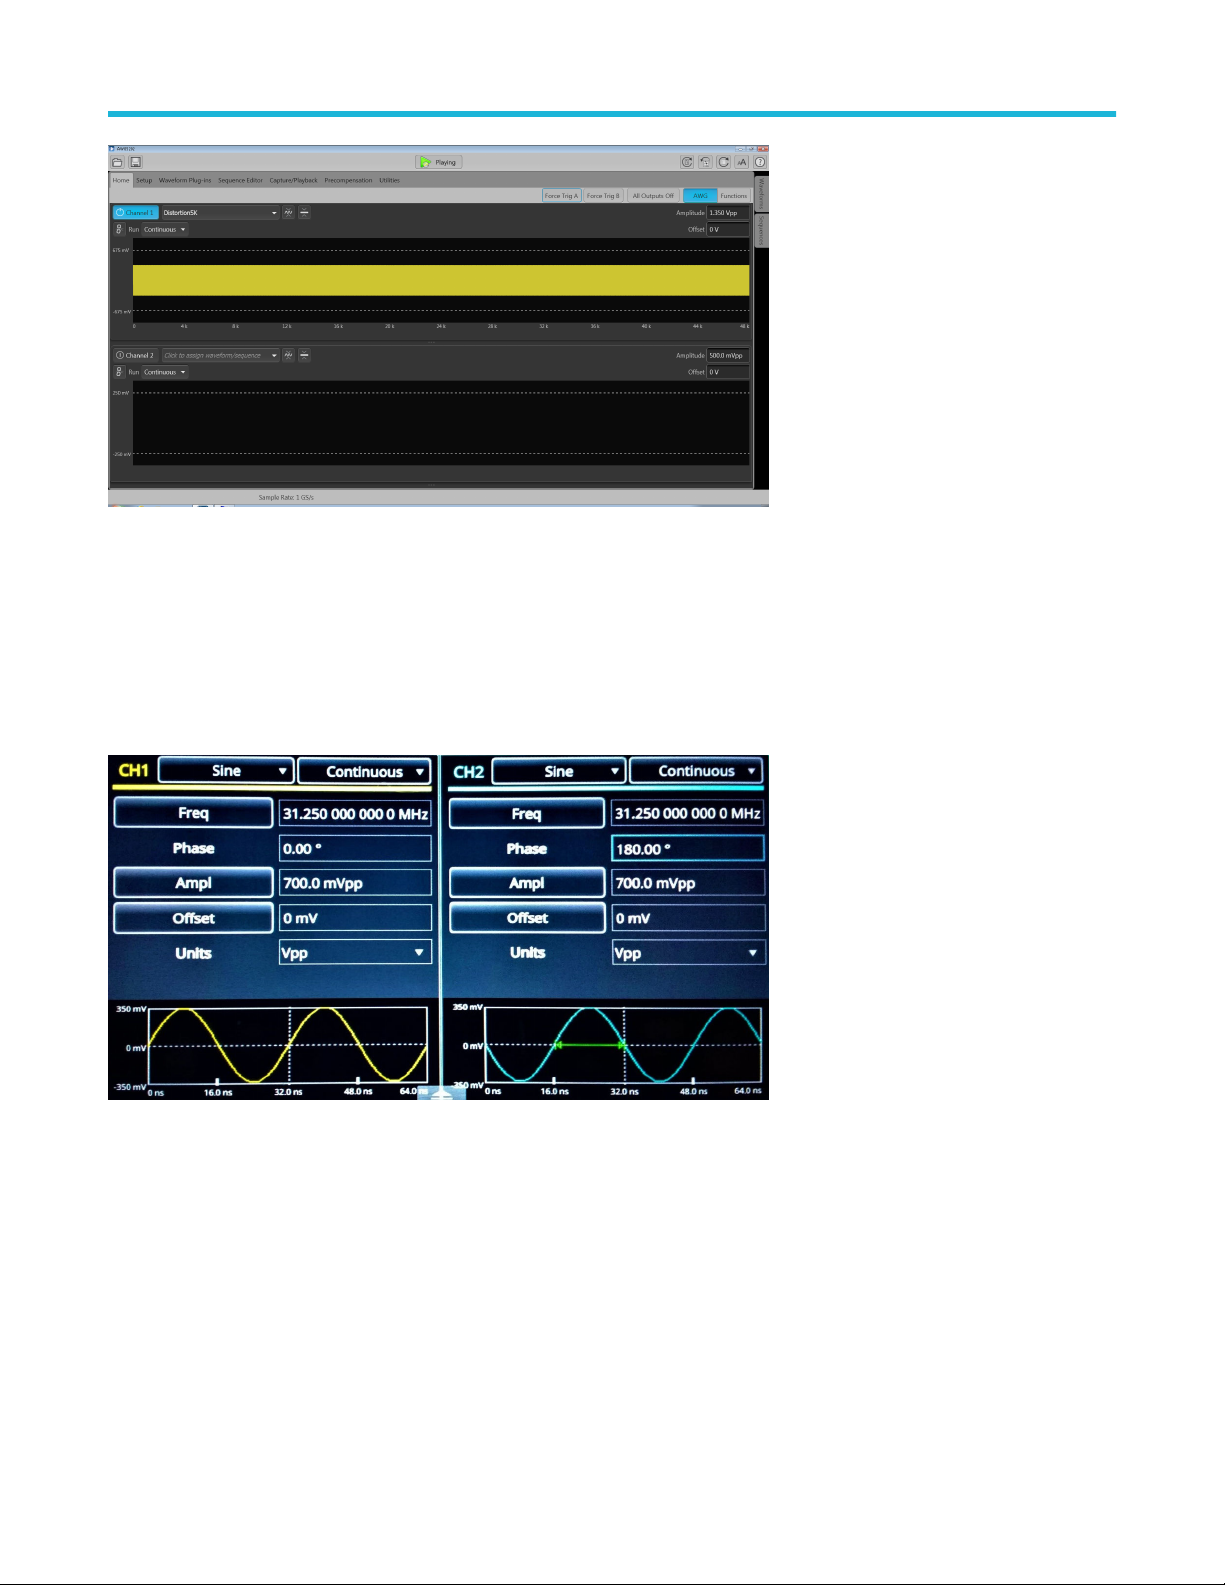
Figure 29: AWG with Test Mode 4 waveform loaded
Method to setup the supported AFG For Test Mode 1:
1. Set signal source on both the channels as Sine.
2. Set the Frequency on both the channels to 31.25 MHz.
3. Set the Amplitude on both the channels to 700 mVpp.
4. Set Phase of Channel 2 to 180 degrees
5. Switch ON both the channels.
Operating basics
Figure 30: AFG with Test Mode 1 waveform loaded
Method to setup the supported AWG For Test Mode 4:
1. Set signal source on both the channels as Sine.
2. Set the Frequency on both the channels to 20.833 MHz.
3. Set the Amplitude on both the channels to 1.35 mVpp.
4. Set Phase of channel 2 to 180 degrees.
5. Switch ON both the channels.
TekExpress® Ethernet Electrical Testing Application Application Help 53
Page 54

Operating basics
Figure 31: AFG with Test Mode 4 waveform loaded
Set preferences tab parameters
Use Preferences tab to set the application action on completion of a measurement.
Table 18: Preferences tab settings
Setting Description
Number of Runs
Acquire/Analyze each test <no>
times (not applicable to Custom
Tests)
Table continued…
54
Select to repeat the test run by setting the number of times. By default, it is selected with 1 run.
Page 55
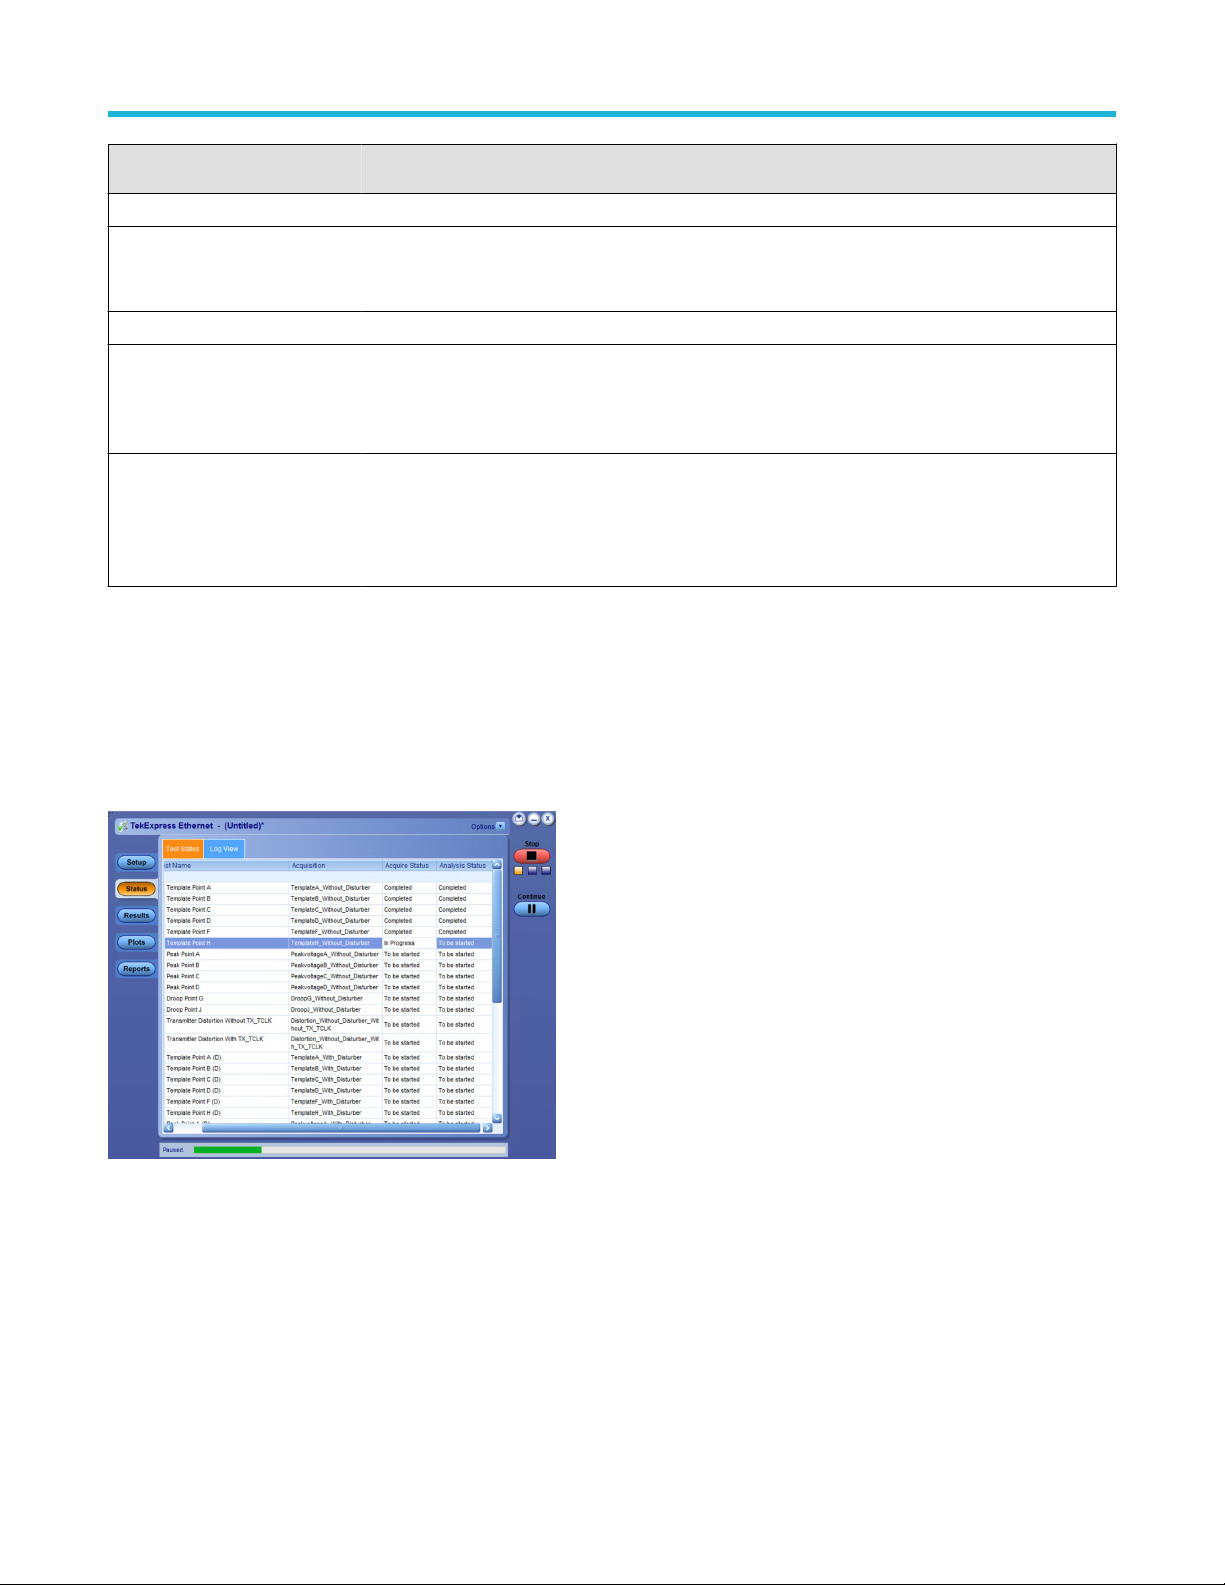
Setting Description
Actions on Test Measurement Failure
Operating basics
On Test Failure, stop and notify
me of the failure
Pop-up Settings
Auto close Warnings and
Informations during Sequencing
Auto close after <no> Seconds
Auto close Error Messages
during Sequencing. Show in
Reports
Auto close after <no> Seconds
Select to stop the test run on Test Failure, and to get notified via email. By default, it is unselected.
Click Email Settings to configure.
Select to auto close warnings/informations during sequencing. Set the Auto close time. By default it is
unselected.
Select to auto close Error Messages during Sequencing. Set the Auto close time. By default it is
unselected.
Status panel
Status panel overview
The Status panel accesses the Test Status and Log View tabs, which provide status on test acquisition and analysis (Test Status) and a
listing of test tasks performed (Log View tab). The application opens the Test Status tab when you start a test run. You can select the Test
Status or the Log View tab to view these items while tests are running.
Figure 32: Test status view
TekExpress® Ethernet Electrical Testing Application Application Help 55
Page 56
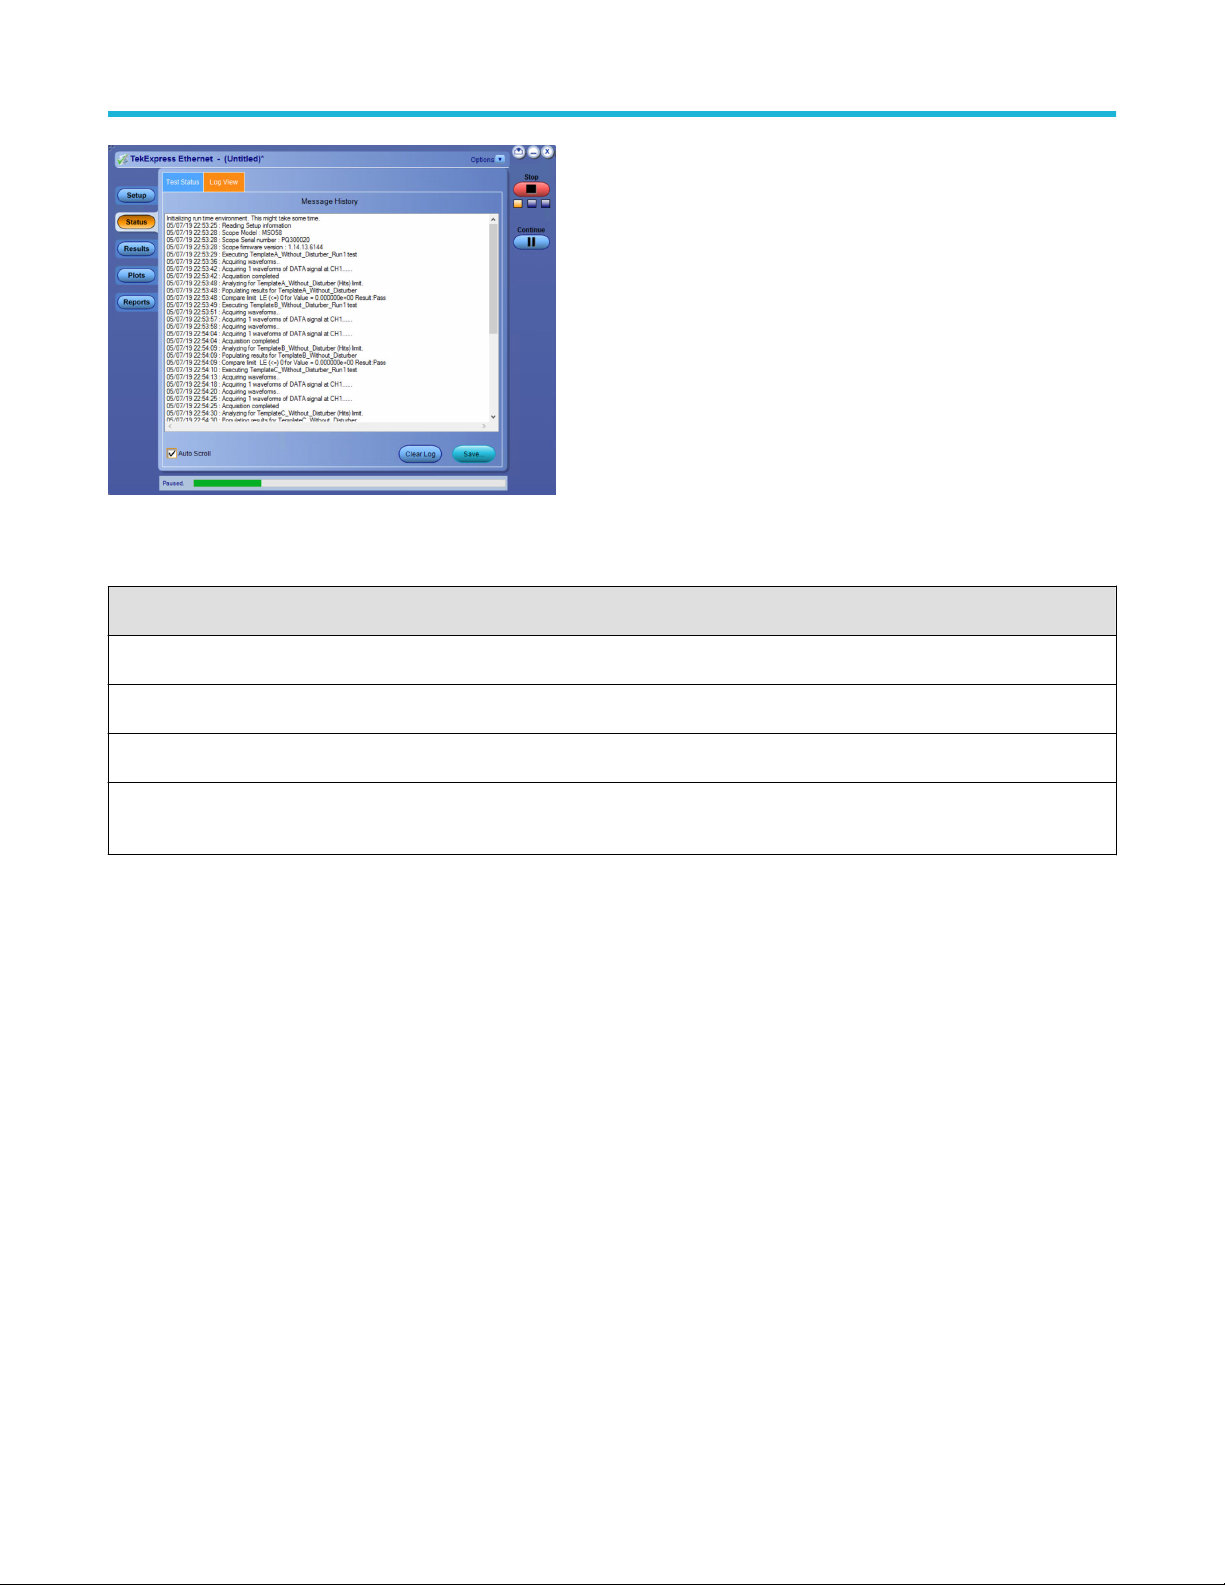
Operating basics
Figure 33: Log view
Table 19: Status panel Log View controls
Control Description
Message History Lists all executed test operations and timestamp information.
Auto Scroll Enables automatic scrolling of the log view as information is added to the log during the test.
Clear Log Clears all messages from the log view.
Save Saves the log file to a text file. Use the standard Save File window to navigate to and specify the folder and file name
to which to save the log text.
See also
Application panel overview
Results panel
Results panel overview
When a test execution is complete, the application automatically opens the Results panel to display a summary of test results.
56
Page 57

Operating basics
See also
View a report
Application panel overview
View test-related files
Files related to tests are stored in My TekExpress\Ethernet\ . Each test setup in this folder has both a test setup file and a test
setup folder, both with the test setup name.
The test setup file is preceded by the TekExpress icon and usually has no visible file name extension.
Inside the test setup folder is another folder named for the DUT ID used in the test sessions. The default is DUT001.
Inside the DUT001 folder are the session folders and files. Each session also has a folder and file pair, both named for the test session
using the naming convention (date)_(time). Each session file is stored outside its matching session folder:
Each session folder contains image files of any plots generated from running the test session. If you selected to save all waveforms or ran
tests using prerecorded waveform files, these are included here.
TekExpress® Ethernet Electrical Testing Application Application Help 57
Page 58
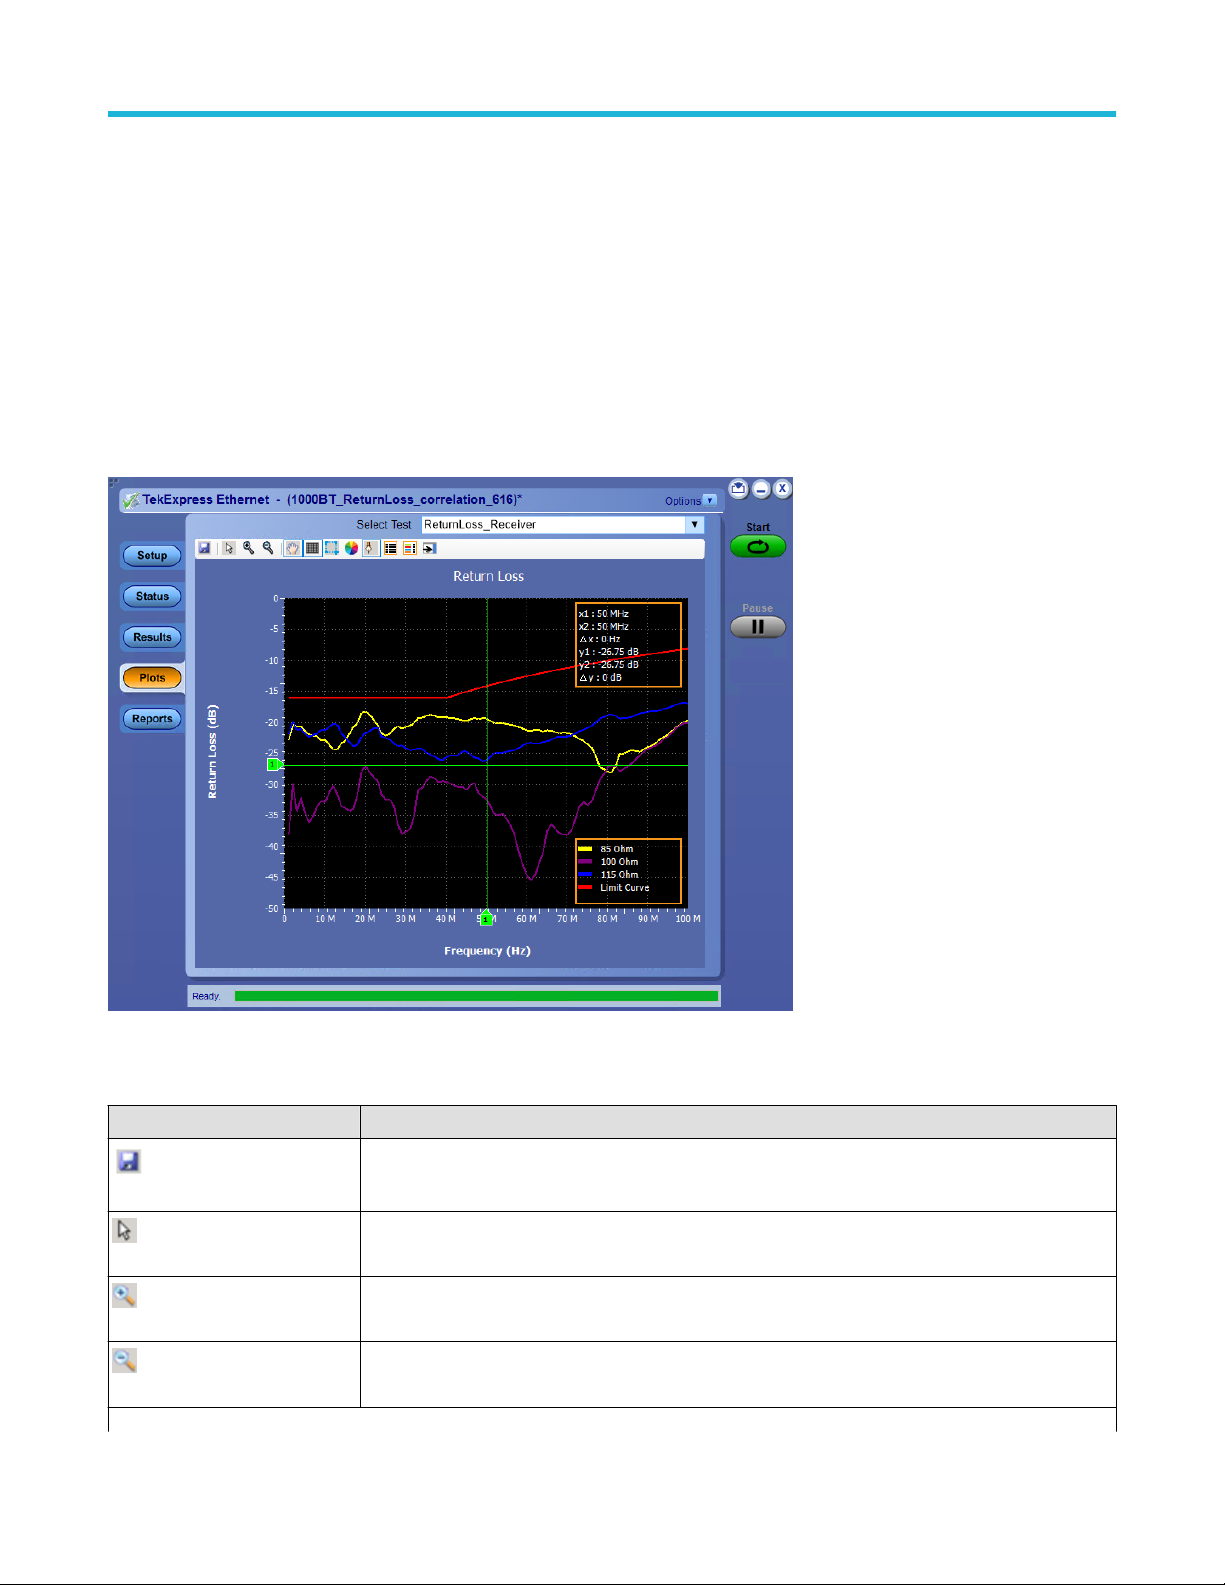
Operating basics
The first time you run a new, unsaved session, the session files are stored in the Untitled Session folder located at ..\My
TekExpress\Ethernet\. When you name and save the session, the files are placed in a folder with the name that you specify. A
copy of the test files stay in the Untitled Session folder until you run a new test or until you close the Ethernet application.
See also
File name extensions
Plots panel
Plots panel overview
The Plots panel displays the result as a two-dimensional plot for additional measurement analysis. The plots are displayed only for Return
Loss measurements.
Toolbar functions in plot windows
The Plot Toolbar window includes the following functions:
Icon Functions
Saves the plot.
Save
Expands the selected plot area. Left-click and drag the mouse to mark the region on the plot to zoom.
Select & Zoom
Expands part of the plot (Horizontal and Vertical); the data appears in more detail.
Zoom In
Contracts part of the plot (Horizontal and Vertical); the data appears in less detail.
Zoom Out
Table continued…
58
Page 59
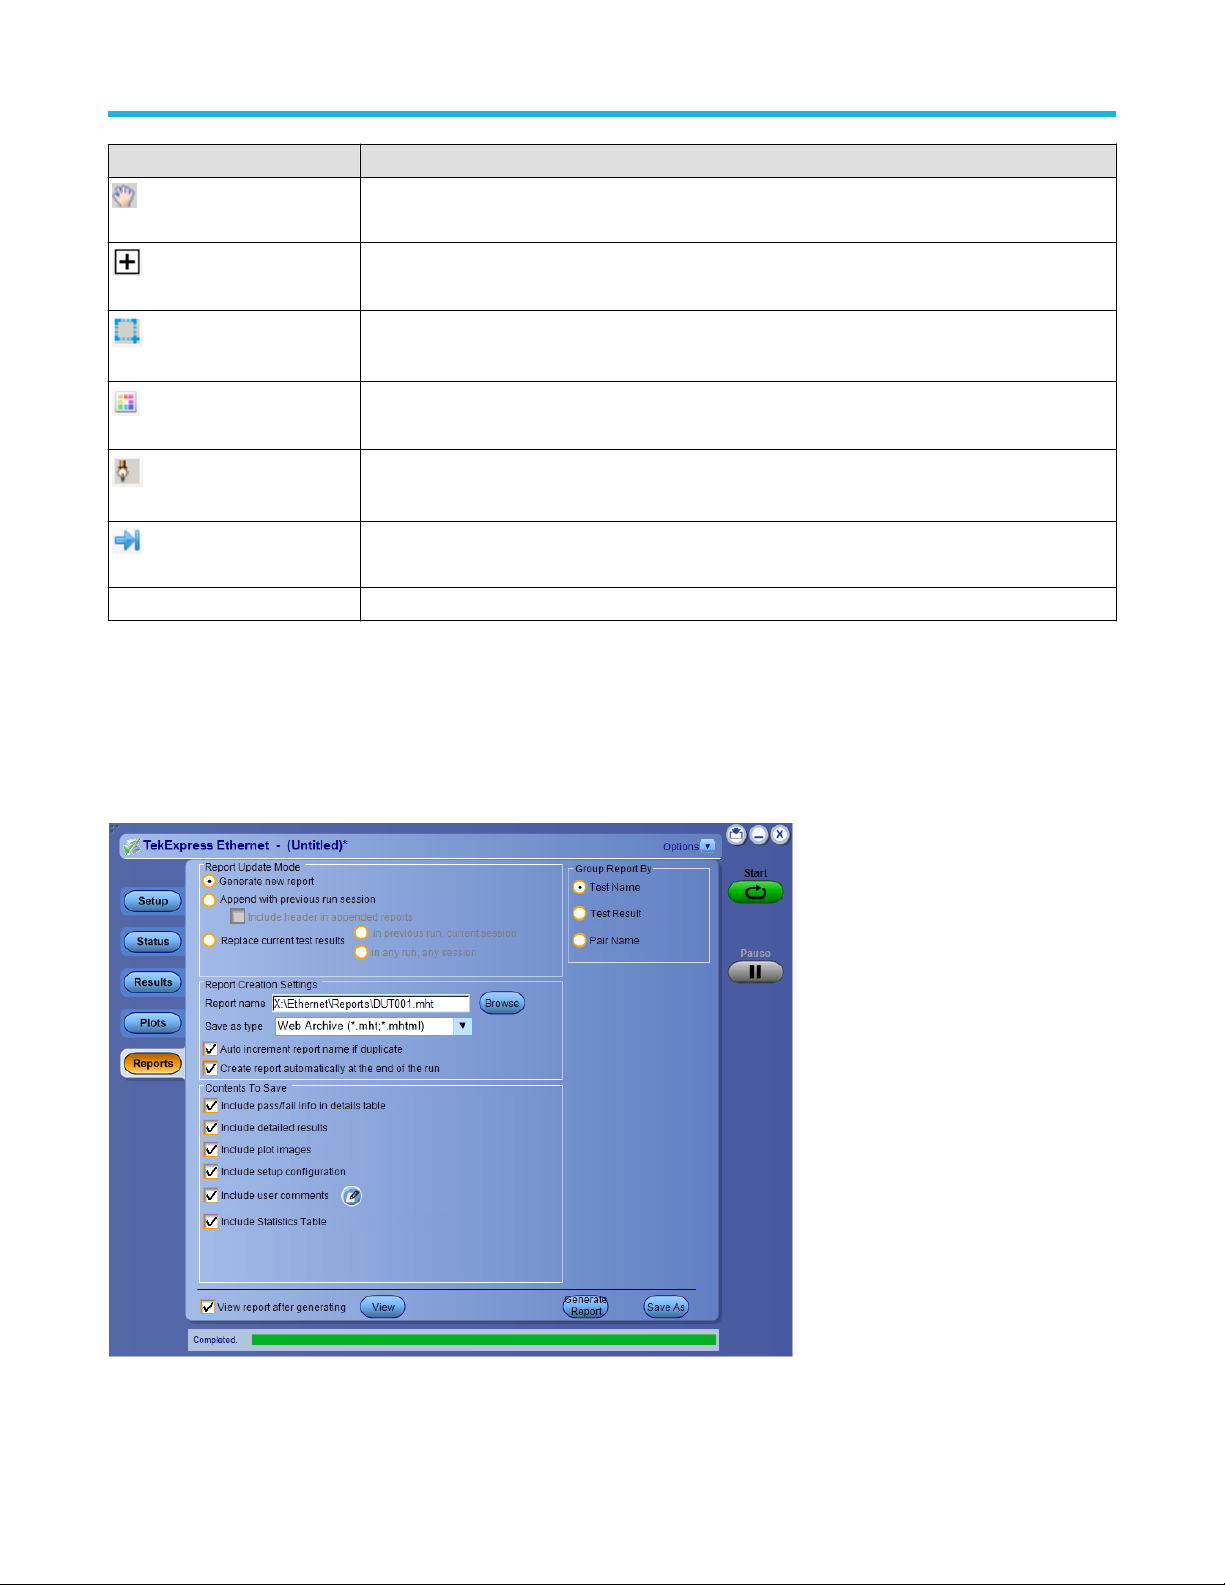
Icon Functions
Moves the plot anywhere within the scale.
Pan
Hides the gridlines.
Hide Gridlines
Resets the zoom to 100%.
Reset
Sets the plot color. Click and select the color in the Color window and click OK. Click in the plot area to
Choose Waveform Colors
Show/Hide Markers
UnDock/Dock
Select Test Select the measurement.
apply the color.
Displays or hides the markers
Click to undock/dock the plot window.
Operating basics
Reports panel
Reports panel overview
Use Reports panel to browse for reports, name and save reports, select test content to include in reports, and select report viewing
options.
For information on setting up reports, see Select report options. For information on viewing reports, see View a report.
TekExpress® Ethernet Electrical Testing Application Application Help 59
Page 60

Operating basics
See also
Application panel overview
Select report options
Click Reports panel and use the Reports panel controls to select which test result information to include in the report, and the naming
conventions to use for the report. For example, always give the report a unique name or select to have the same name increment each
time you run a particular test.
Select report options before running a test or when creating and saving test setups. Report settings are included in saved test setups.
In the Reports panel, select from the following report options:
Table 20: Report options
Setting Description
Report Update Mode
Generate new report Creates a new report. The report can be in either .mht or .pdf file formats.
Append with previous run session Appends the latest test results to the end of the current test results report.
Include header in appended reports
Replace current test in previous run session Replaces the previous test results with the latest test results. Results from newly added
Report Creation Settings
Report name Displays the name and location from which to open an Ethernet report. The default location
Select to include header in the appended reports.
tests are appended to the end of the report.
is at \My TekExpress\Ethernet\Untitled Session. The report file in this folder gets overwritten
each time you run a test unless you specify a unique name or select to auto increment the
report name.
Do one of the following:
• In the Report Path field, type over the current folder path and name.
• Double-click in the Report Path field and then make selections from the pop-up
keyboard and click the Enter button.
Be sure to include the entire folder path, the file name, and the file extension.
For example: C:\Documents and Settings\your user name\My Documents\My
TekExpress\Ethernet\DUT001.mht.
Note: You cannot set the file location using the Browse button.
Open an existing report.
Table continued…
60
Click Browse, locate and select the report file and then click View at the bottom of the
panel.
Page 61
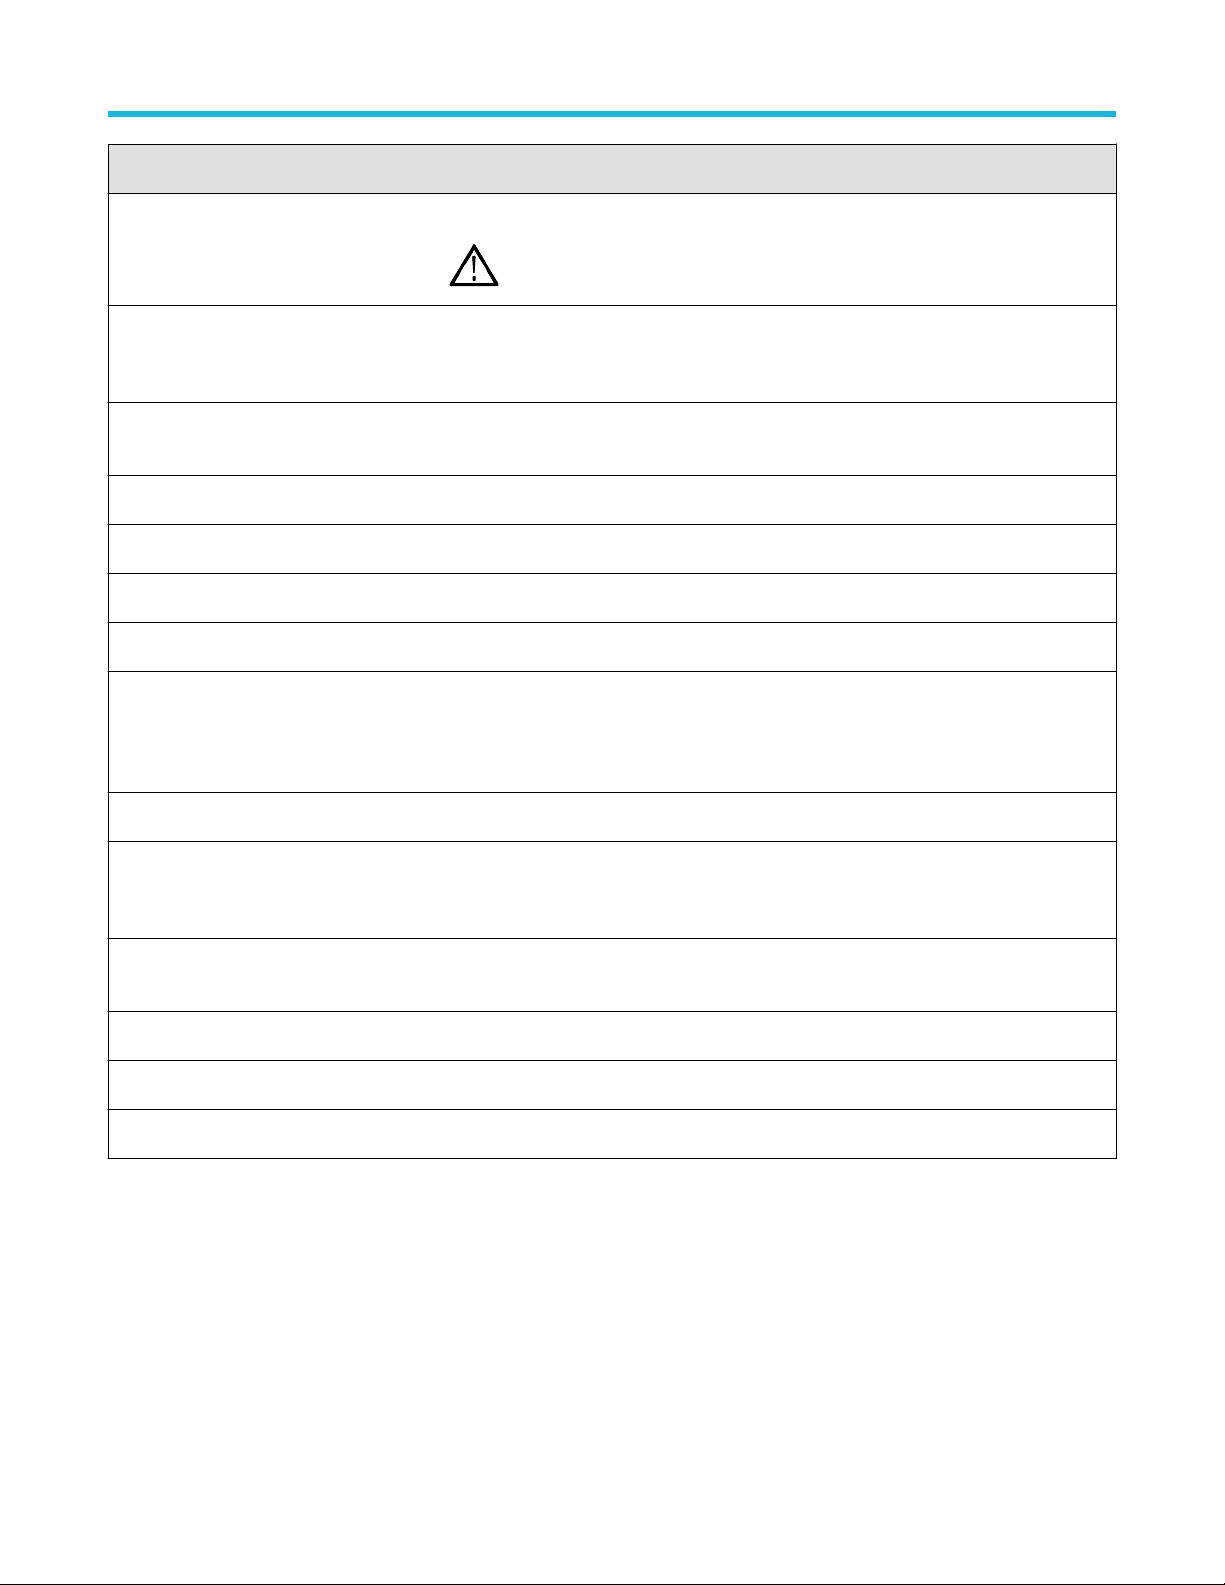
Operating basics
Setting Description
Save as type Saves a report in the specified file type, selected from the drop-down list.
Note: If you select a file type different from the default, be sure to change the
report file name extension in the Report Name field to match.
Auto increment report name if duplicate Sets the application to automatically increment the name of the report file if the application
finds a file with the same name as the one being generated. For example: DUT001,
DUT002, DUT003. This option is enabled by default.
Create report automatically at the end of the
run
Contents To Save
Include pass/fail info in details table Includes pass/fail info in the details table of the report.
Include detailed results Includes detailed results in the report.
Include plot images Includes plot images in the report.
Include setup configuration Sets the application to include hardware and software information in the summary box
Margin value in percentage Select to include the margin value in percentage in the report.
Include user comments Select to include any comments about the test that you or another user added in the DUT
View report after generating Automatically opens the report in a Web browser when the test completes. This option is
Creates report at the end of the run.
at the top of the report. Information includes: the oscilloscope model and serial number,
the oscilloscope firmware version, and software versions for applications used in the
measurements.
tab of the Setup panel. Comments appear in the Comments section, under the summary
box at the beginning of each report.
selected by default.
View Click to view the most current report.
Generate Report Generates a new report based on the current analysis results.
Save As Specify a name for the report.
View a report
The application automatically generates a report when test execution is complete and displays the report in your default Web browser
(unless you cleared the View Report After Generating check box in the Reports panel before running the test). If you cleared this check
box, or to view a different test report, do the following:
1. Click the Reports button.
2. Click the Browse button and locate and select the report file to view.
3. In the Reports panel, click View.
TekExpress® Ethernet Electrical Testing Application Application Help 61
Page 62
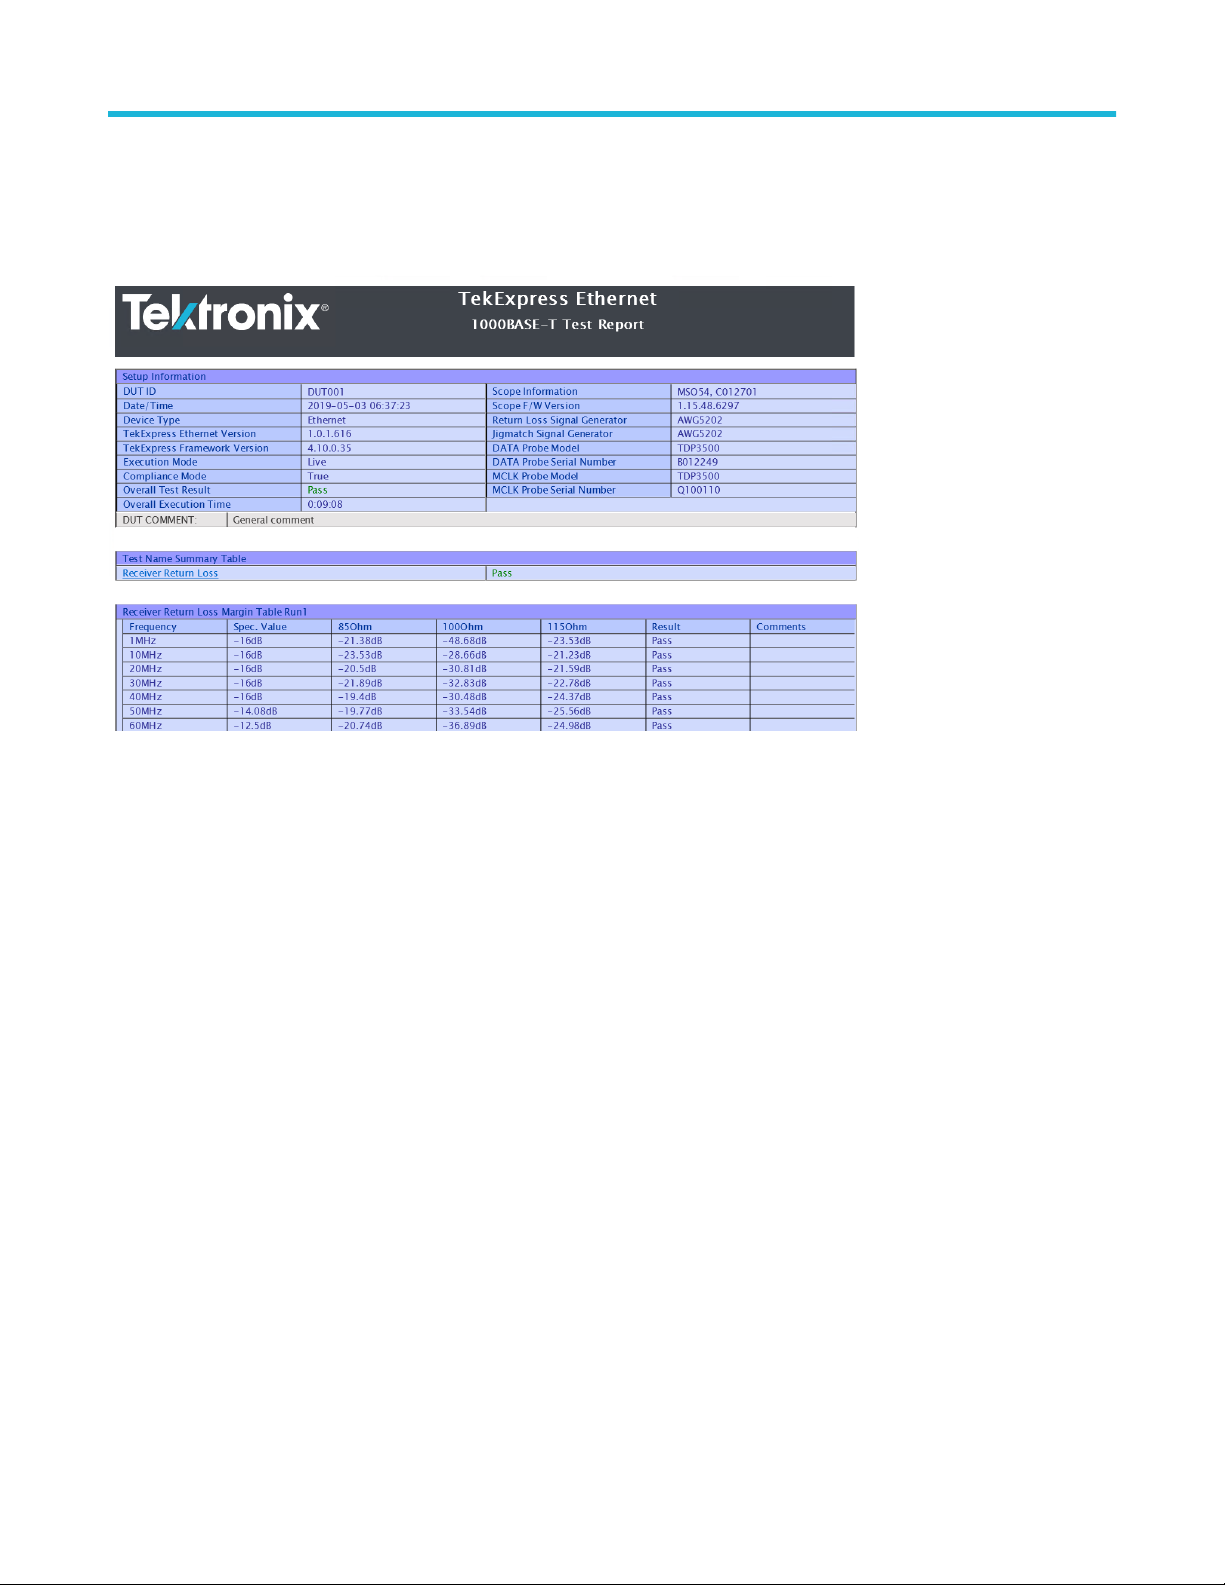
Operating basics
For information on changing the file type, file name, and other report options, see Select report options.
Report contents
A report shows detailed results and plots, as set in the Reports panel.
Setup configuration information
The summary box at the beginning of the report lists setup configuration information. This information includes the oscilloscope model and
serial number, optical module model and serial number, and software version numbers of all associated applications.
To exclude this information from a report, clear the Include Setup Configuration check box in the Reports panel before running the test.
User comments
If you selected to include comments in the test report, any comments you added in the DUT tab are shown at the top of the report.
See also
Results panel overview
View test-related files
62
Page 63
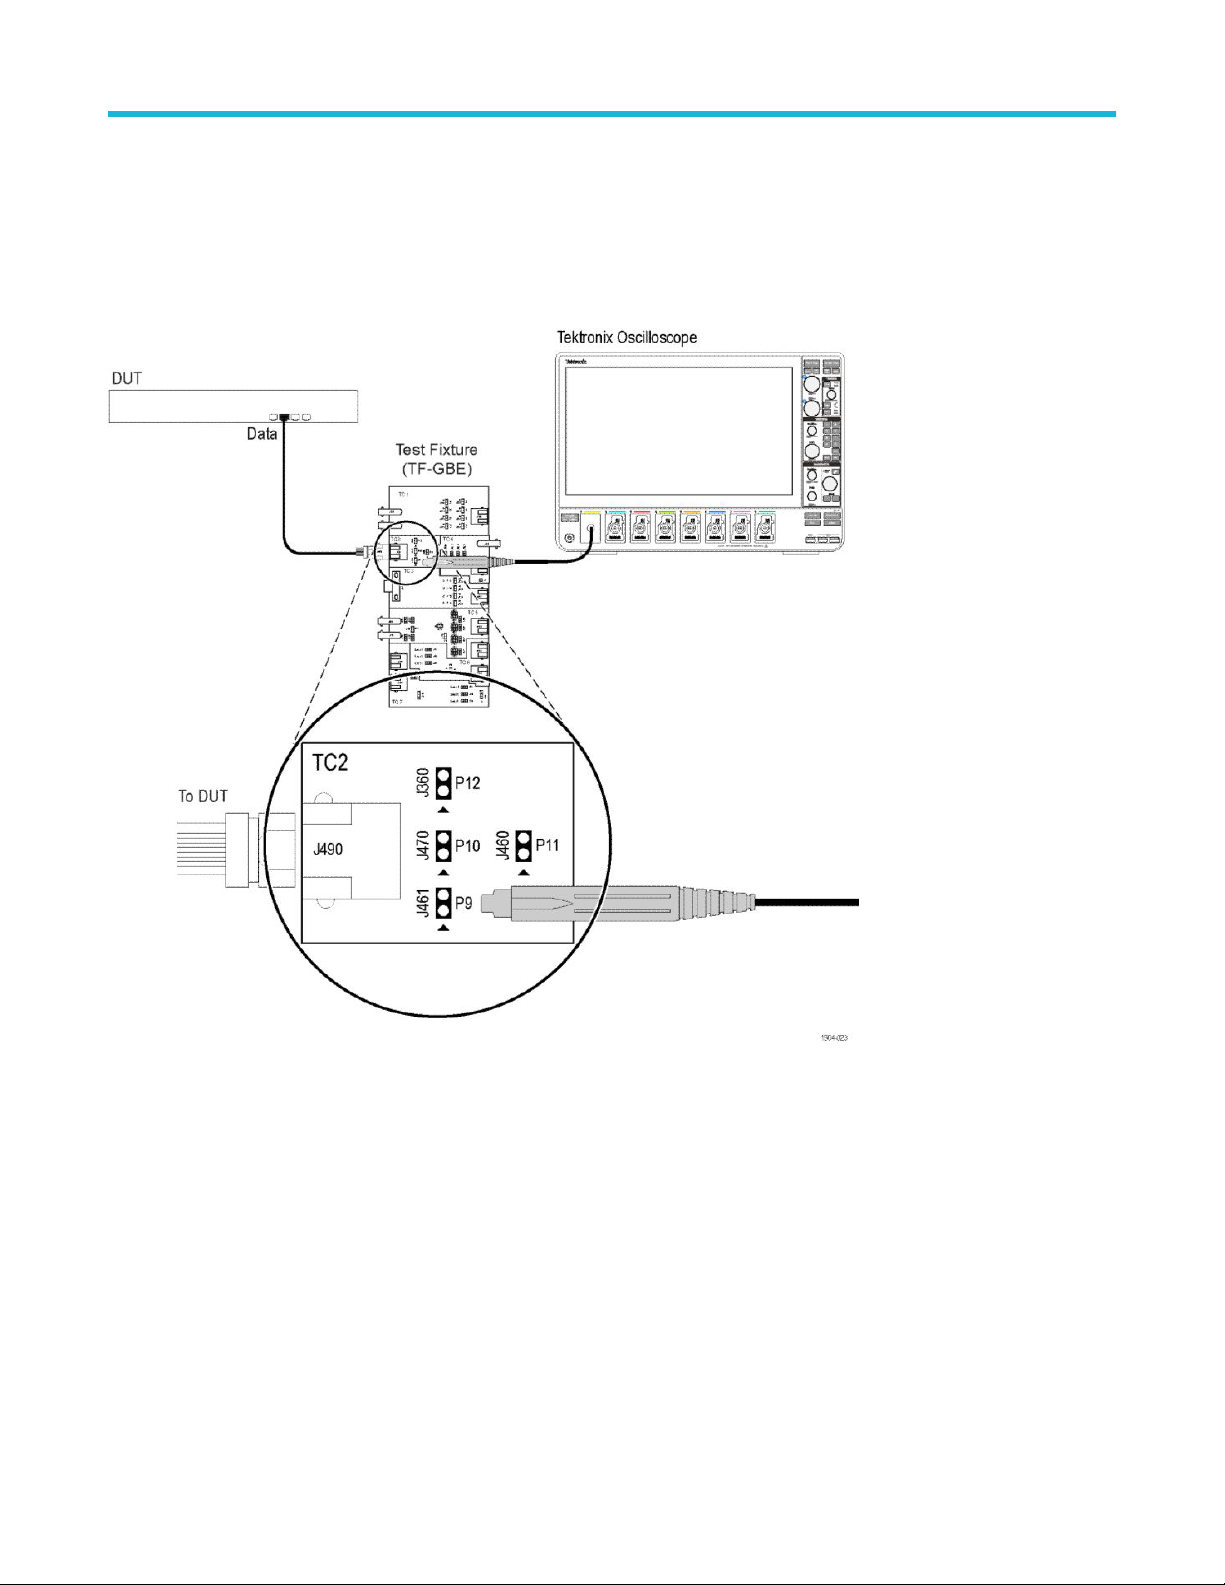
Running tests
1000BASE-T connection diagram
Click Setup > Test Selection > Preview to view the equipment setup diagram(s).
Running tests
Figure 34: 1000BASE-T Template, Peak Volt, and Droop (Without Disturber)
TekExpress® Ethernet Electrical Testing Application Application Help 63
Page 64

Running tests
Figure 35: 1000BASE-T Template, Peak Volt, and Droop (With Disturber)
64
Page 65
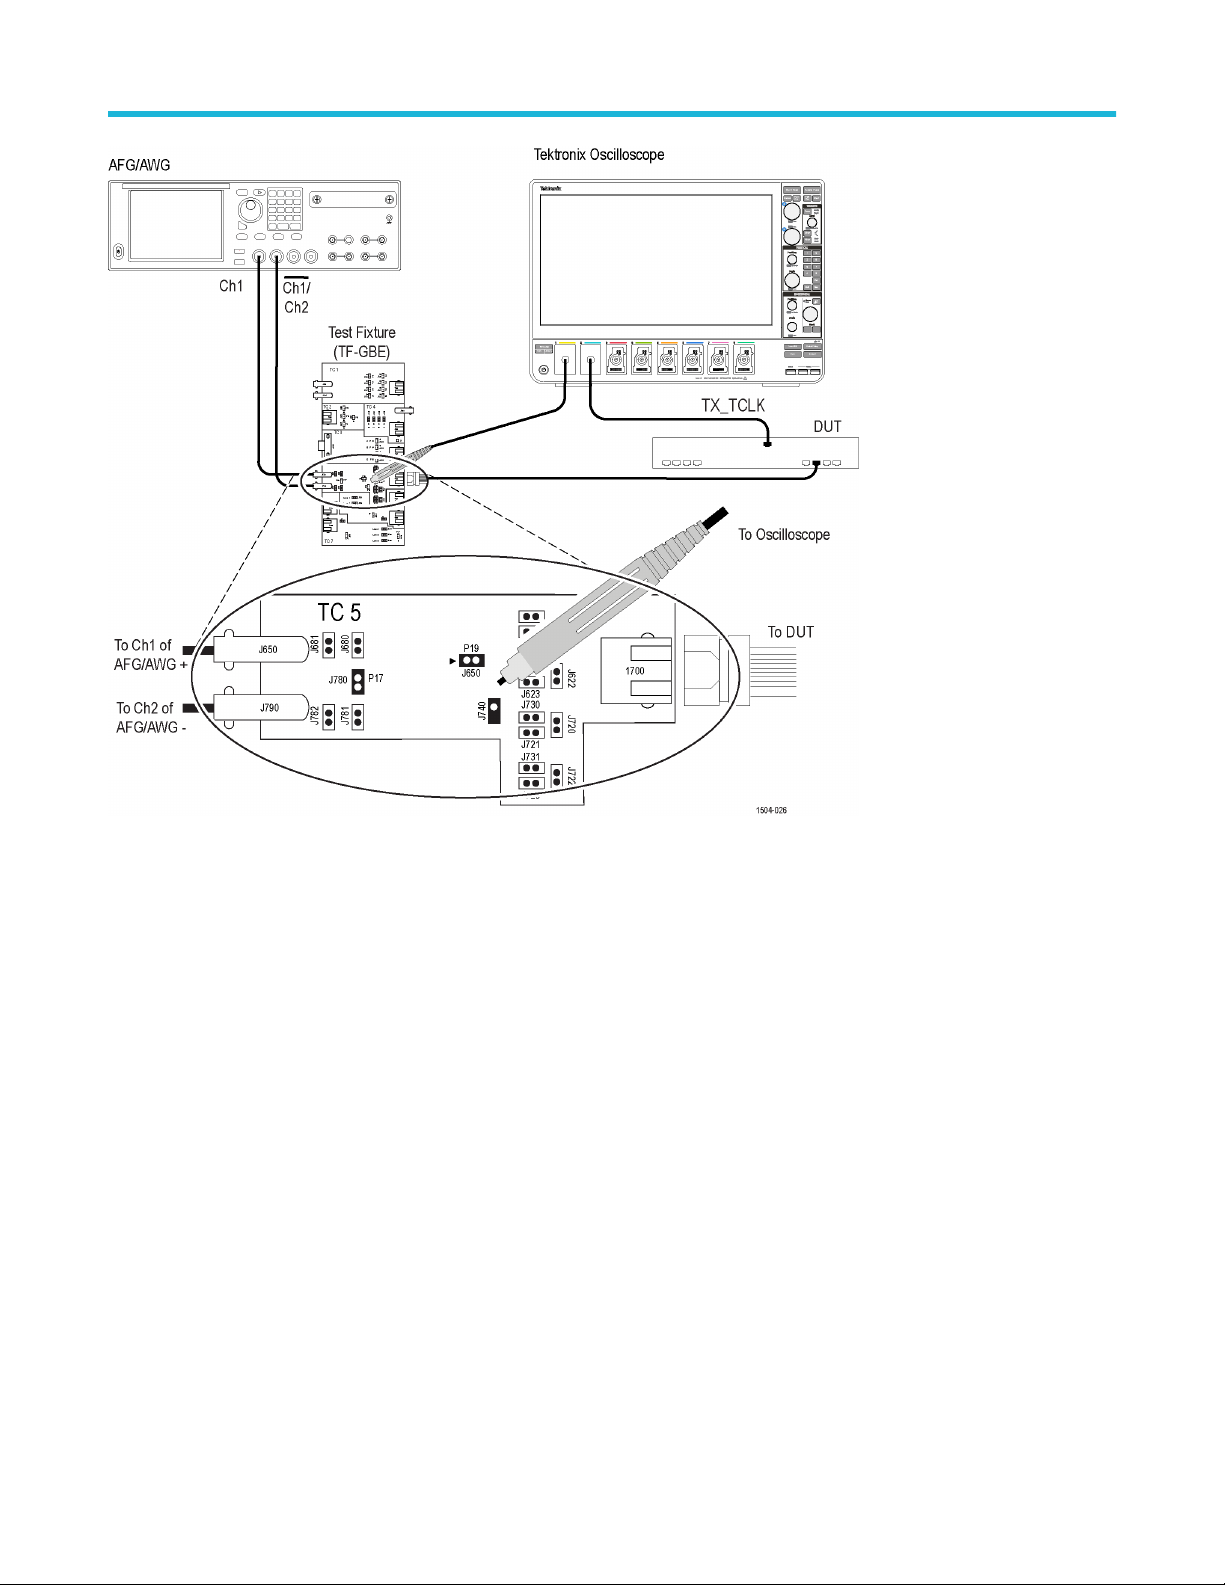
Running tests
Figure 36: Distortion with Disturber with Clock
TekExpress® Ethernet Electrical Testing Application Application Help 65
Page 66
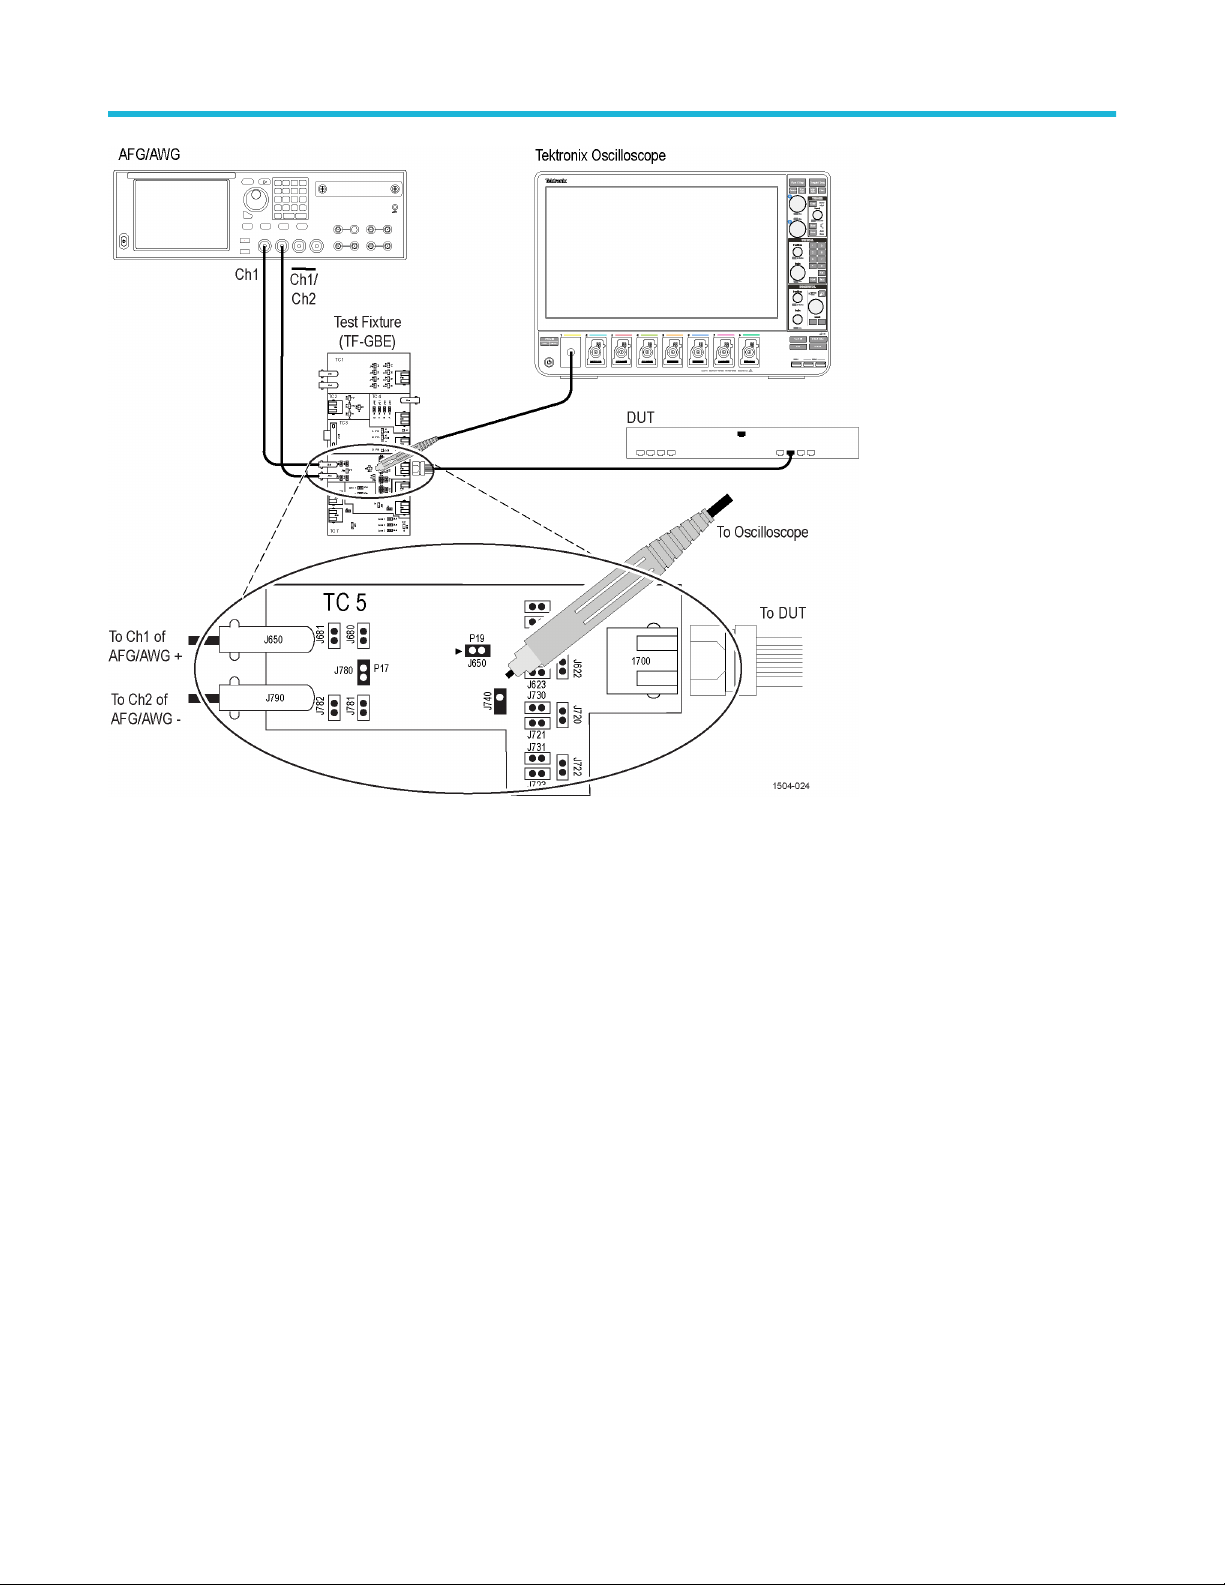
Running tests
Figure 37: Distortion with Disturber without Clock
66
Page 67
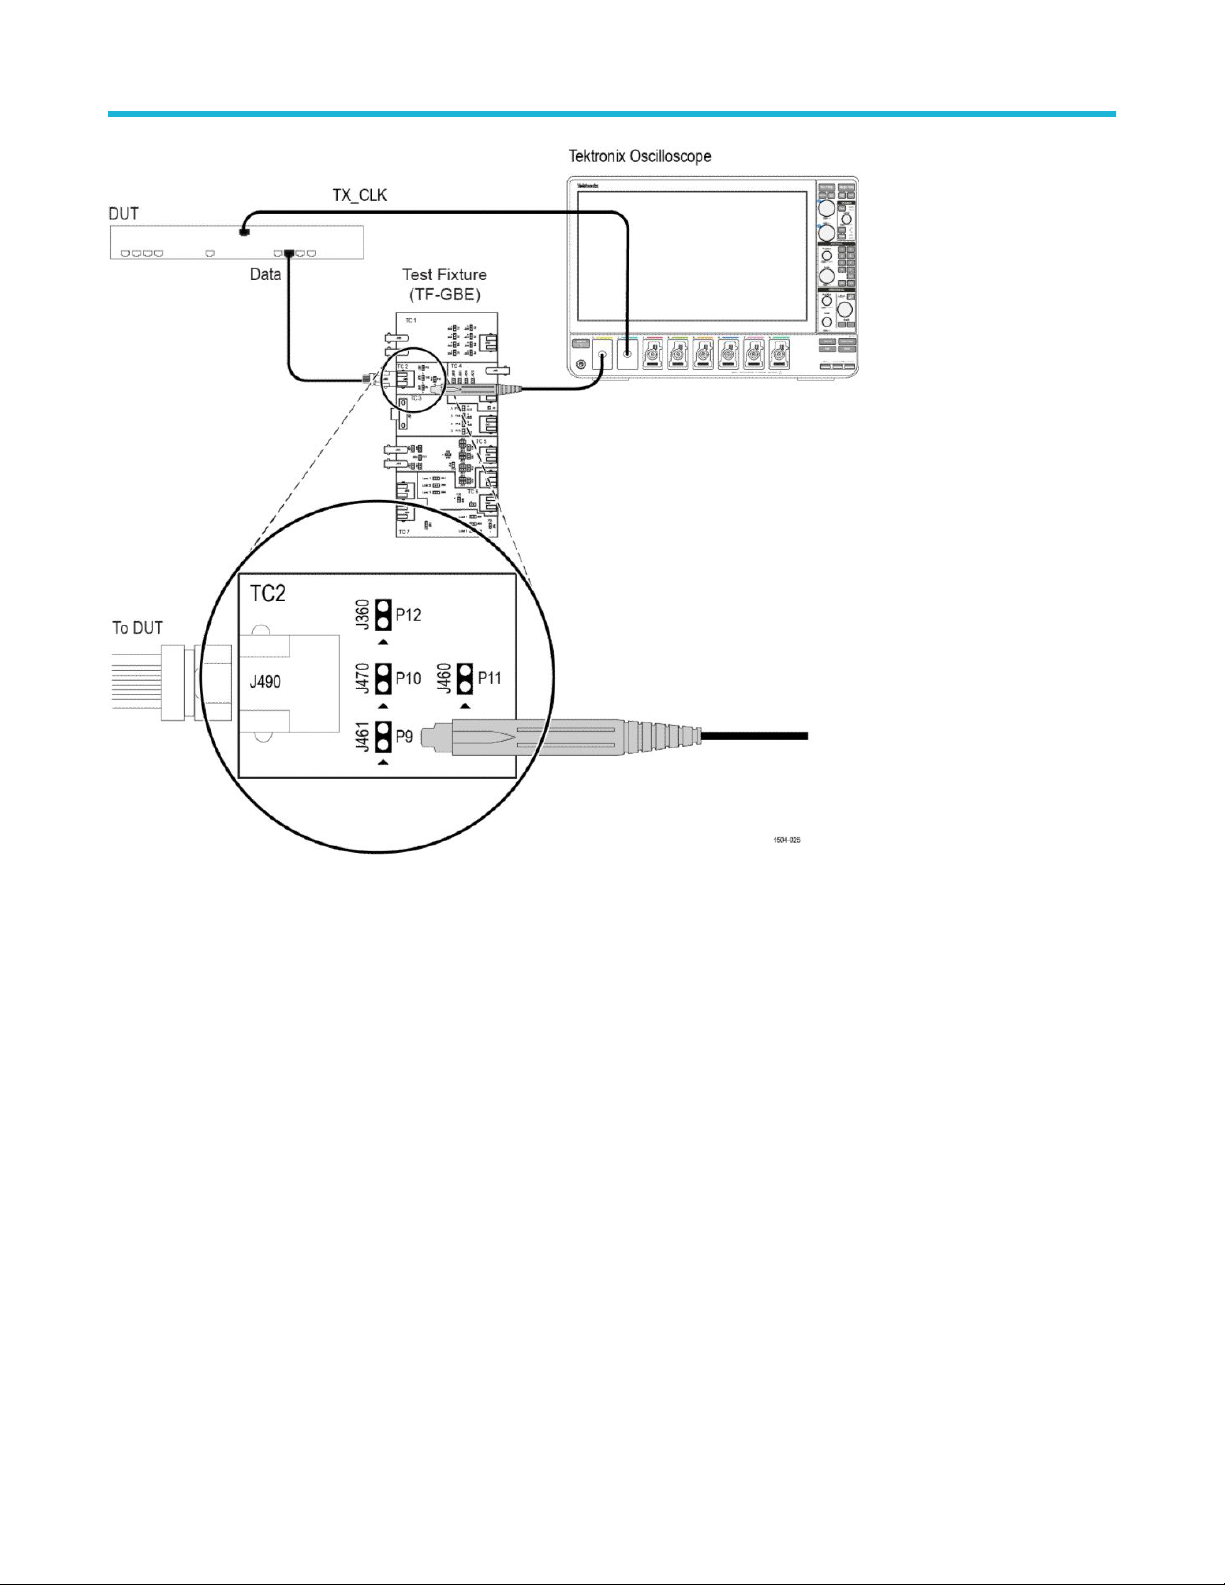
Running tests
Figure 38: Distortion without Disturber with Clock
TekExpress® Ethernet Electrical Testing Application Application Help 67
Page 68

Running tests
Figure 39: Distortion without Disturber without Clock
68
Page 69
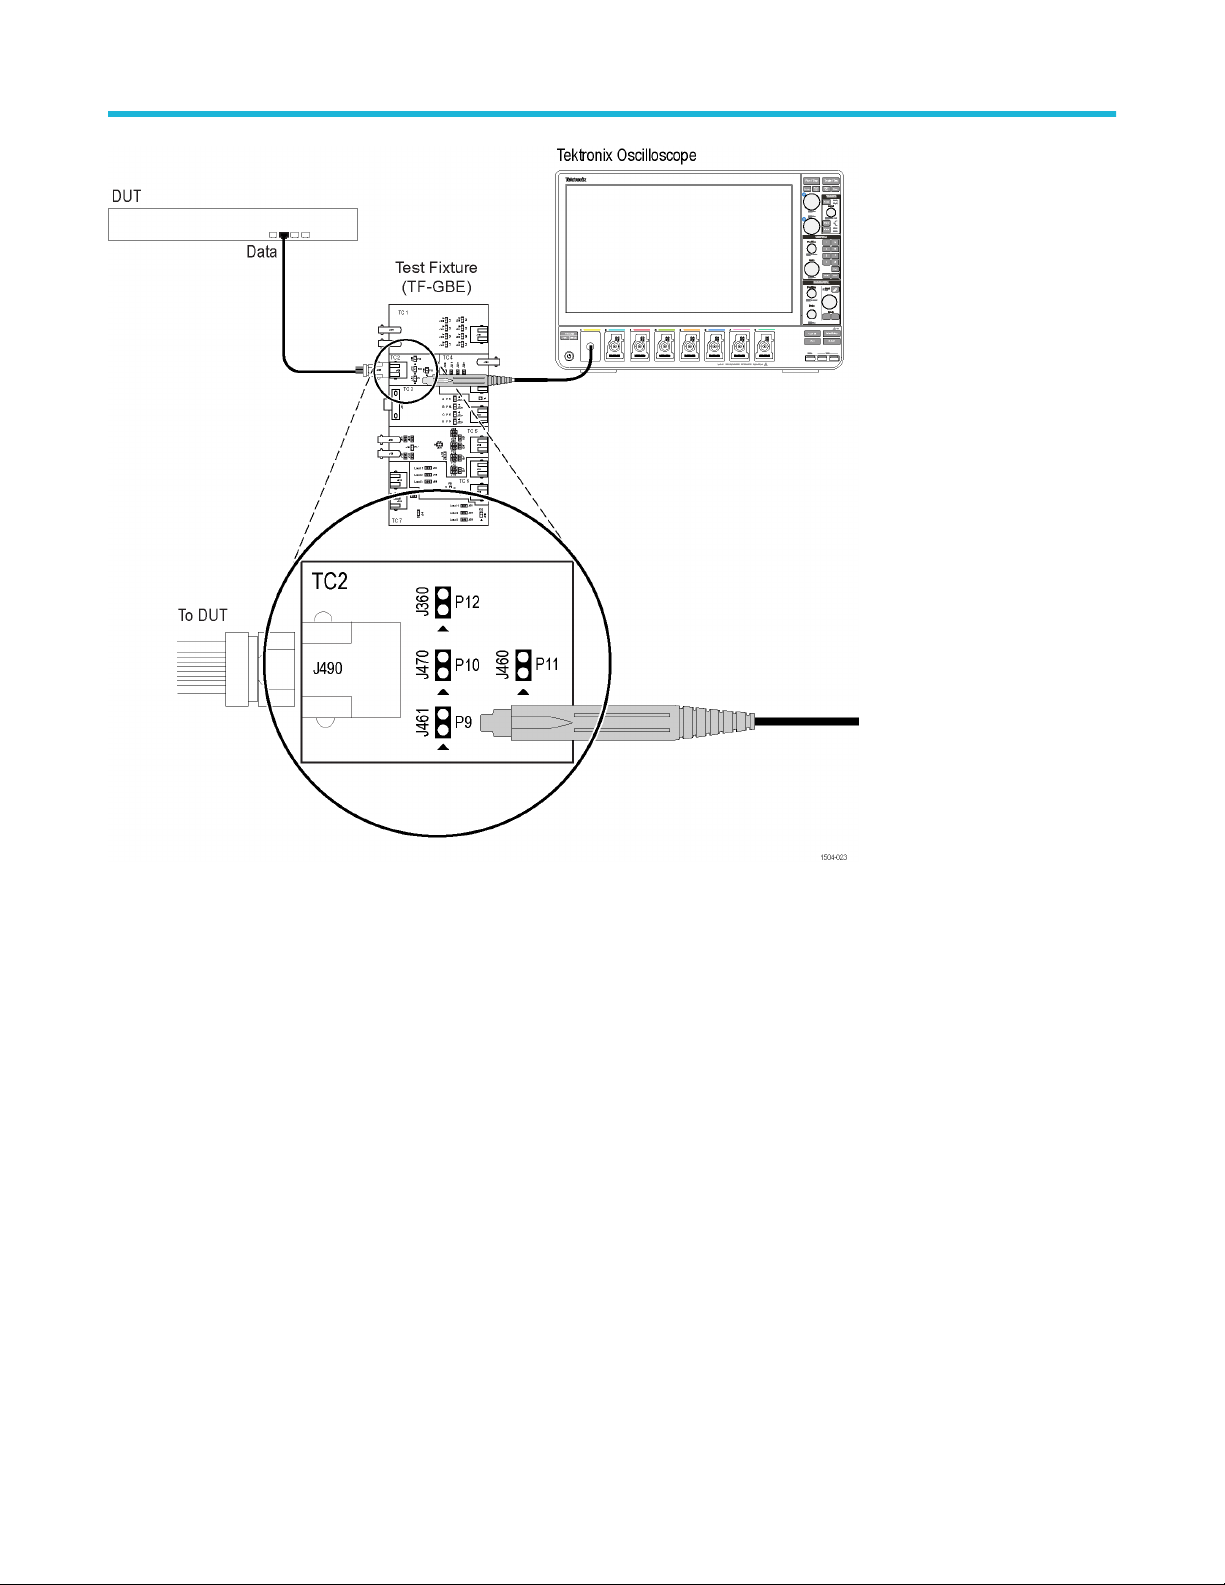
Running tests
Figure 40: Master and Slave Jitter without Clock
TekExpress® Ethernet Electrical Testing Application Application Help 69
Page 70

Running tests
Figure 41: Master Filtered Jitter with Clock - Connection 1
70
Page 71

Running tests
Figure 42: Master Filtered Jitter with Clock - Connection 2
TekExpress® Ethernet Electrical Testing Application Application Help 71
Page 72
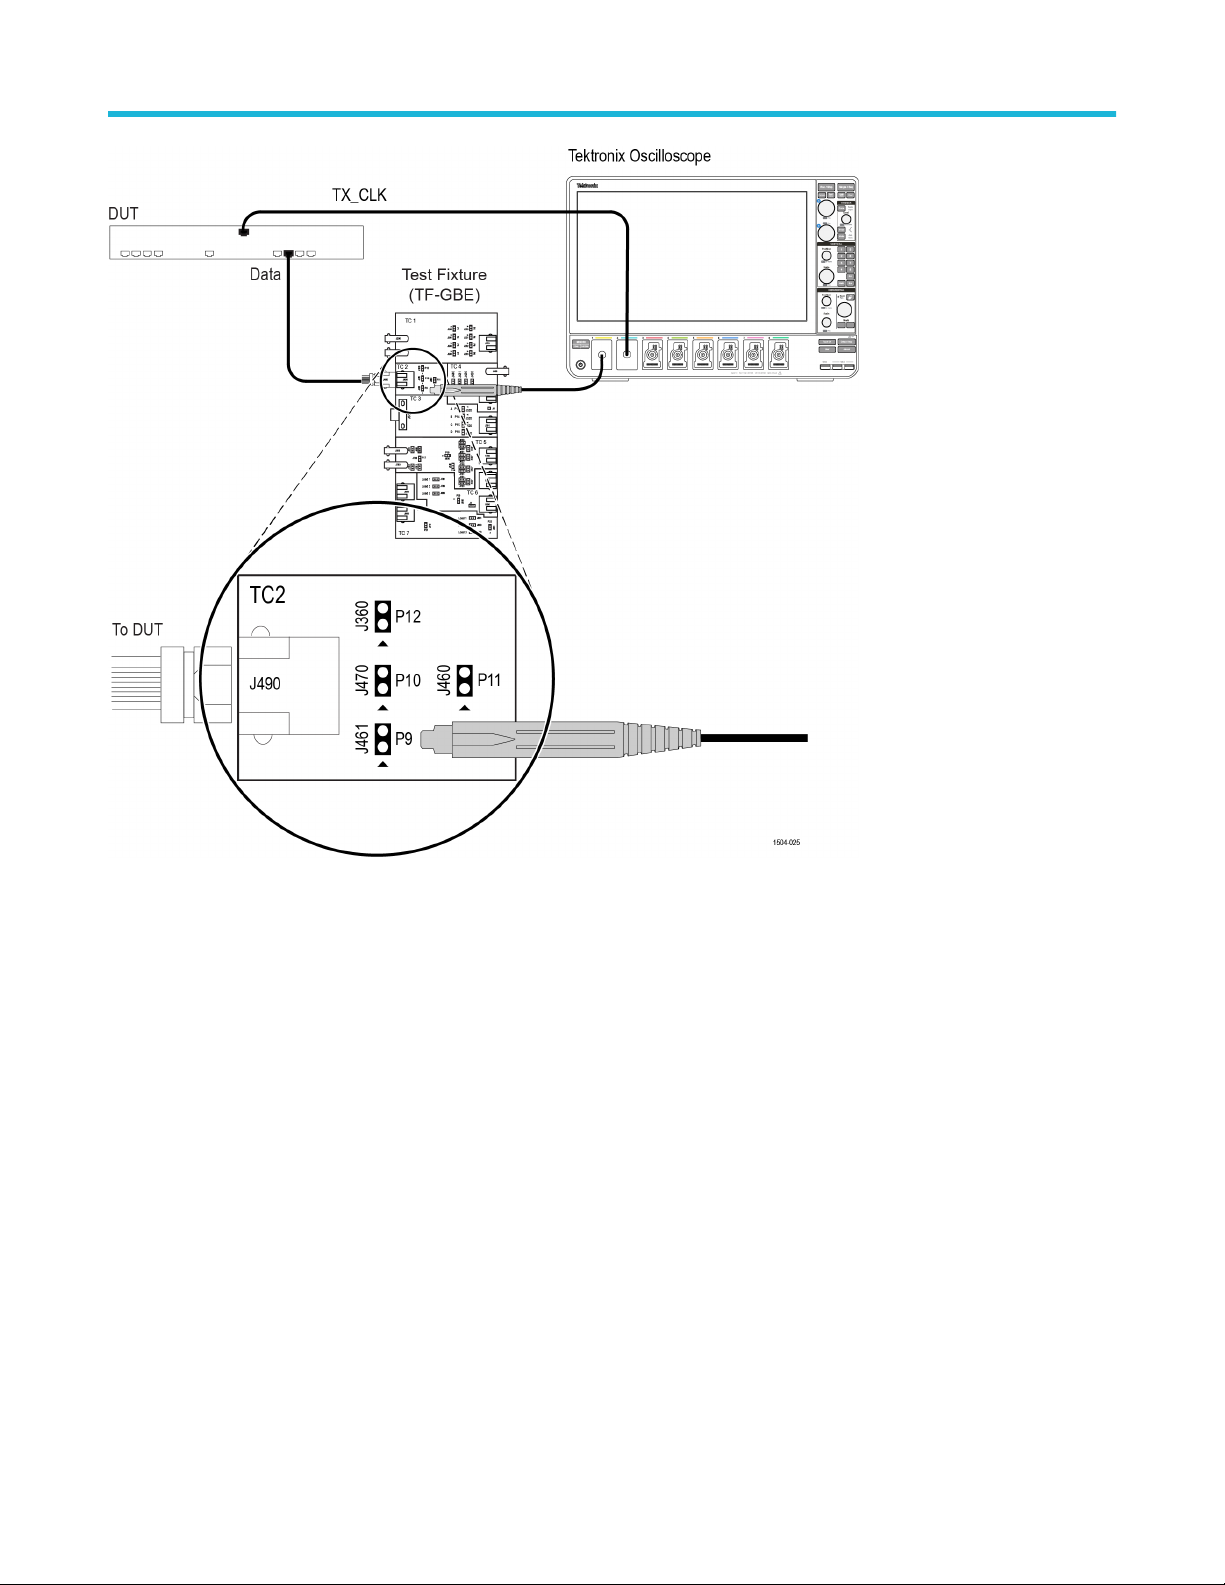
Running tests
Figure 43: Master Unfiltered Jitter with Clock
72
Page 73

Running tests
Figure 44: Slave Filtered Jitter with Clock - Connection 1
TekExpress® Ethernet Electrical Testing Application Application Help 73
Page 74

Running tests
Figure 45: Slave Filtered Jitter with Clock - Connection 2
74
Page 75
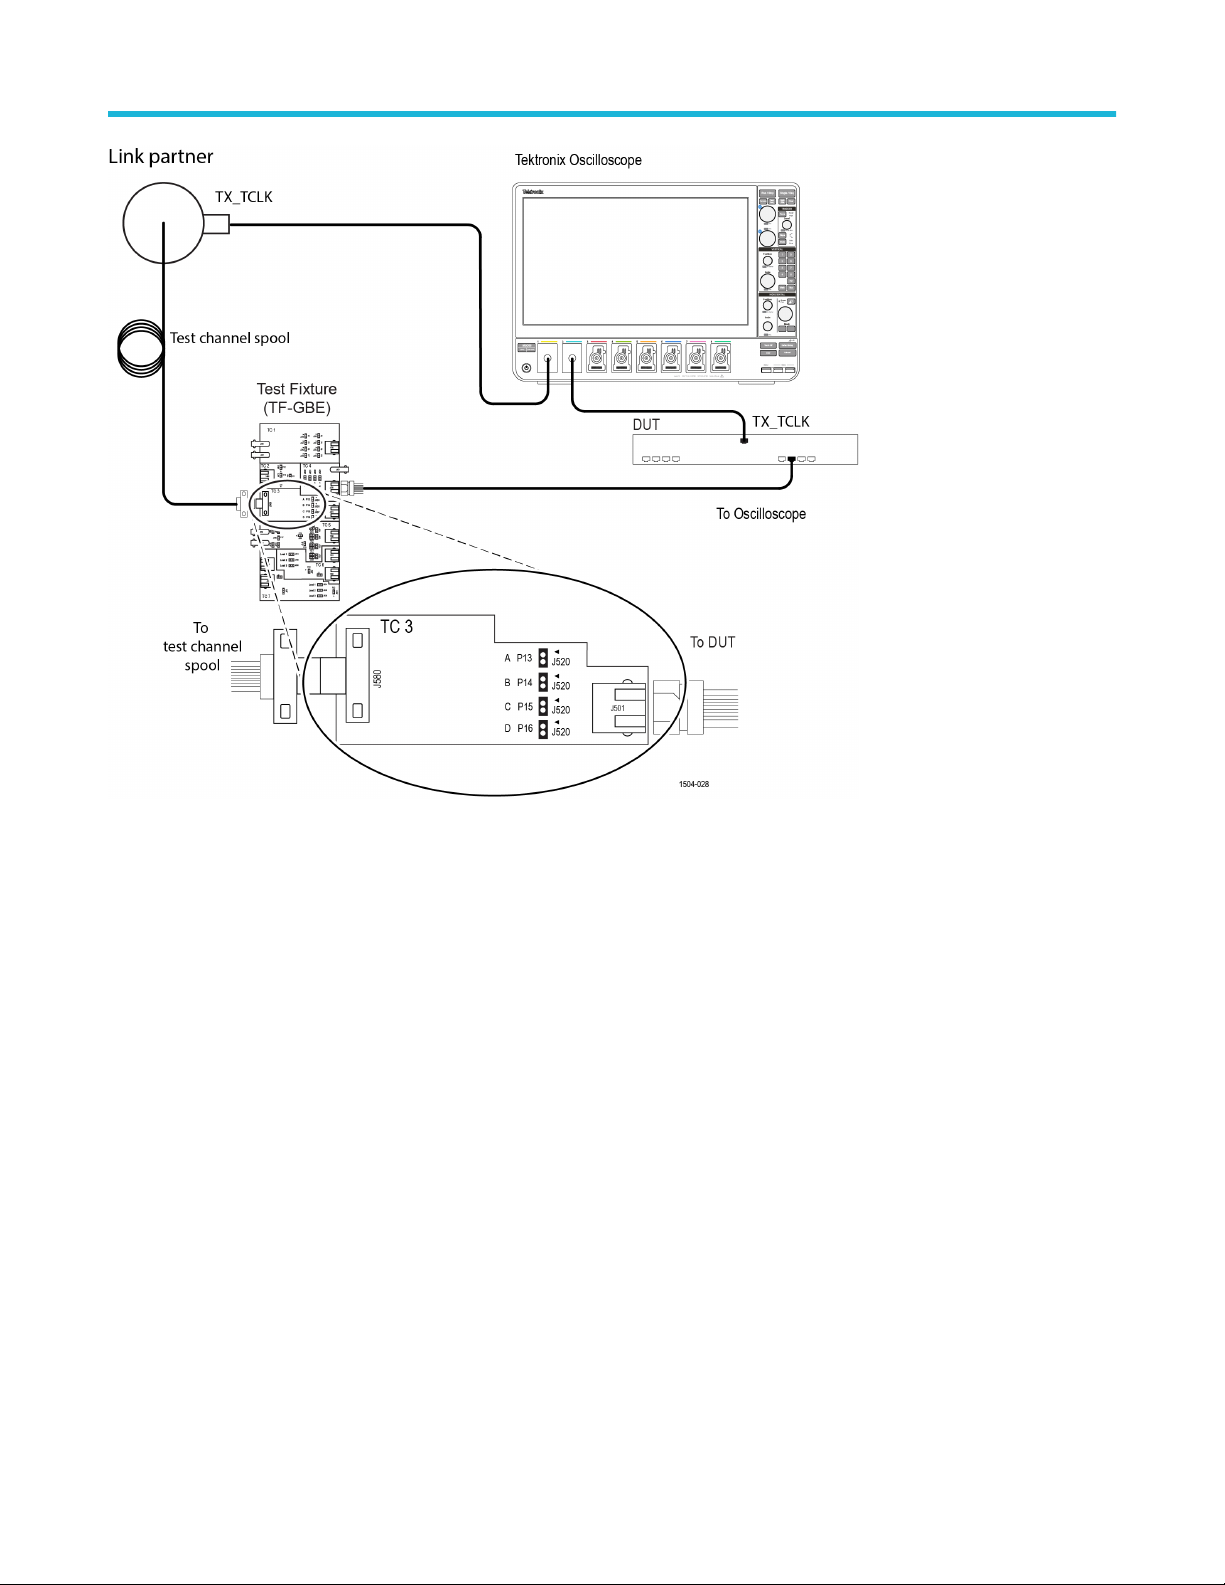
Running tests
Figure 46: Slave Unfiltered Jitter with Clock
TekExpress® Ethernet Electrical Testing Application Application Help 75
Page 76
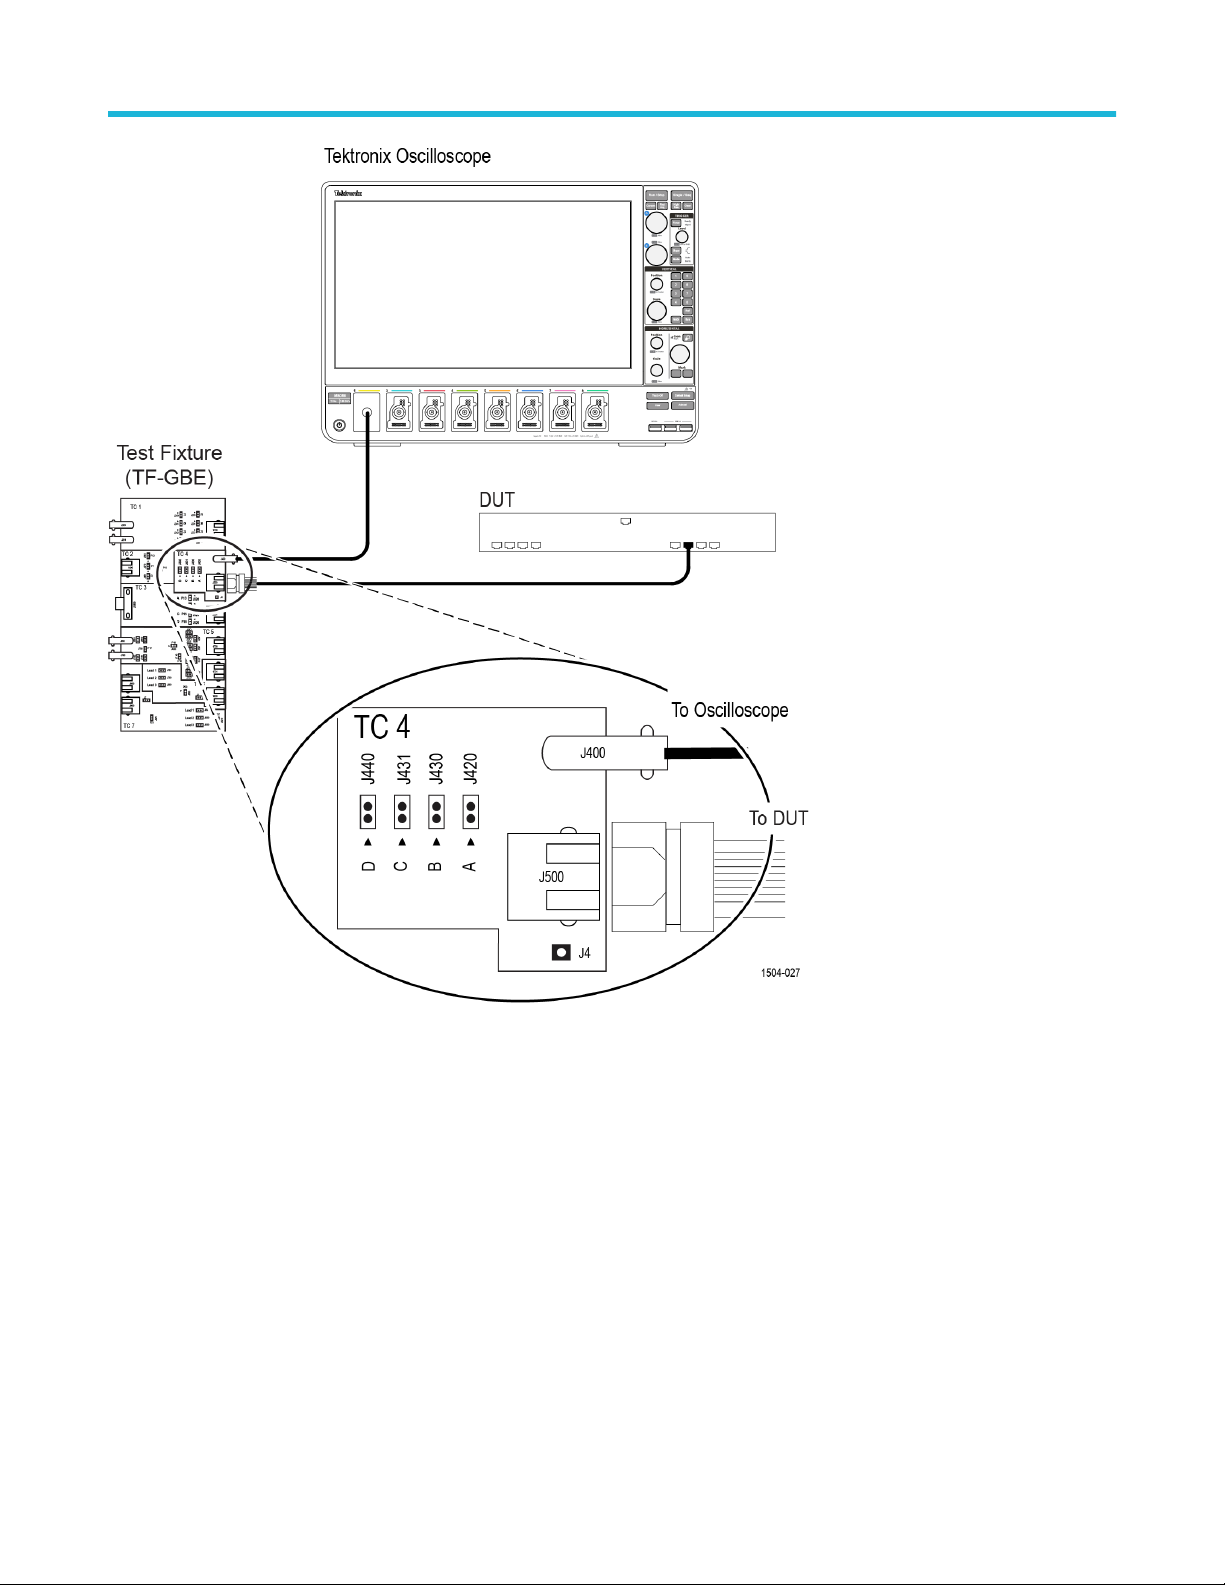
Running tests
Figure 47: 1000BASE-T CM Voltage
76
Page 77
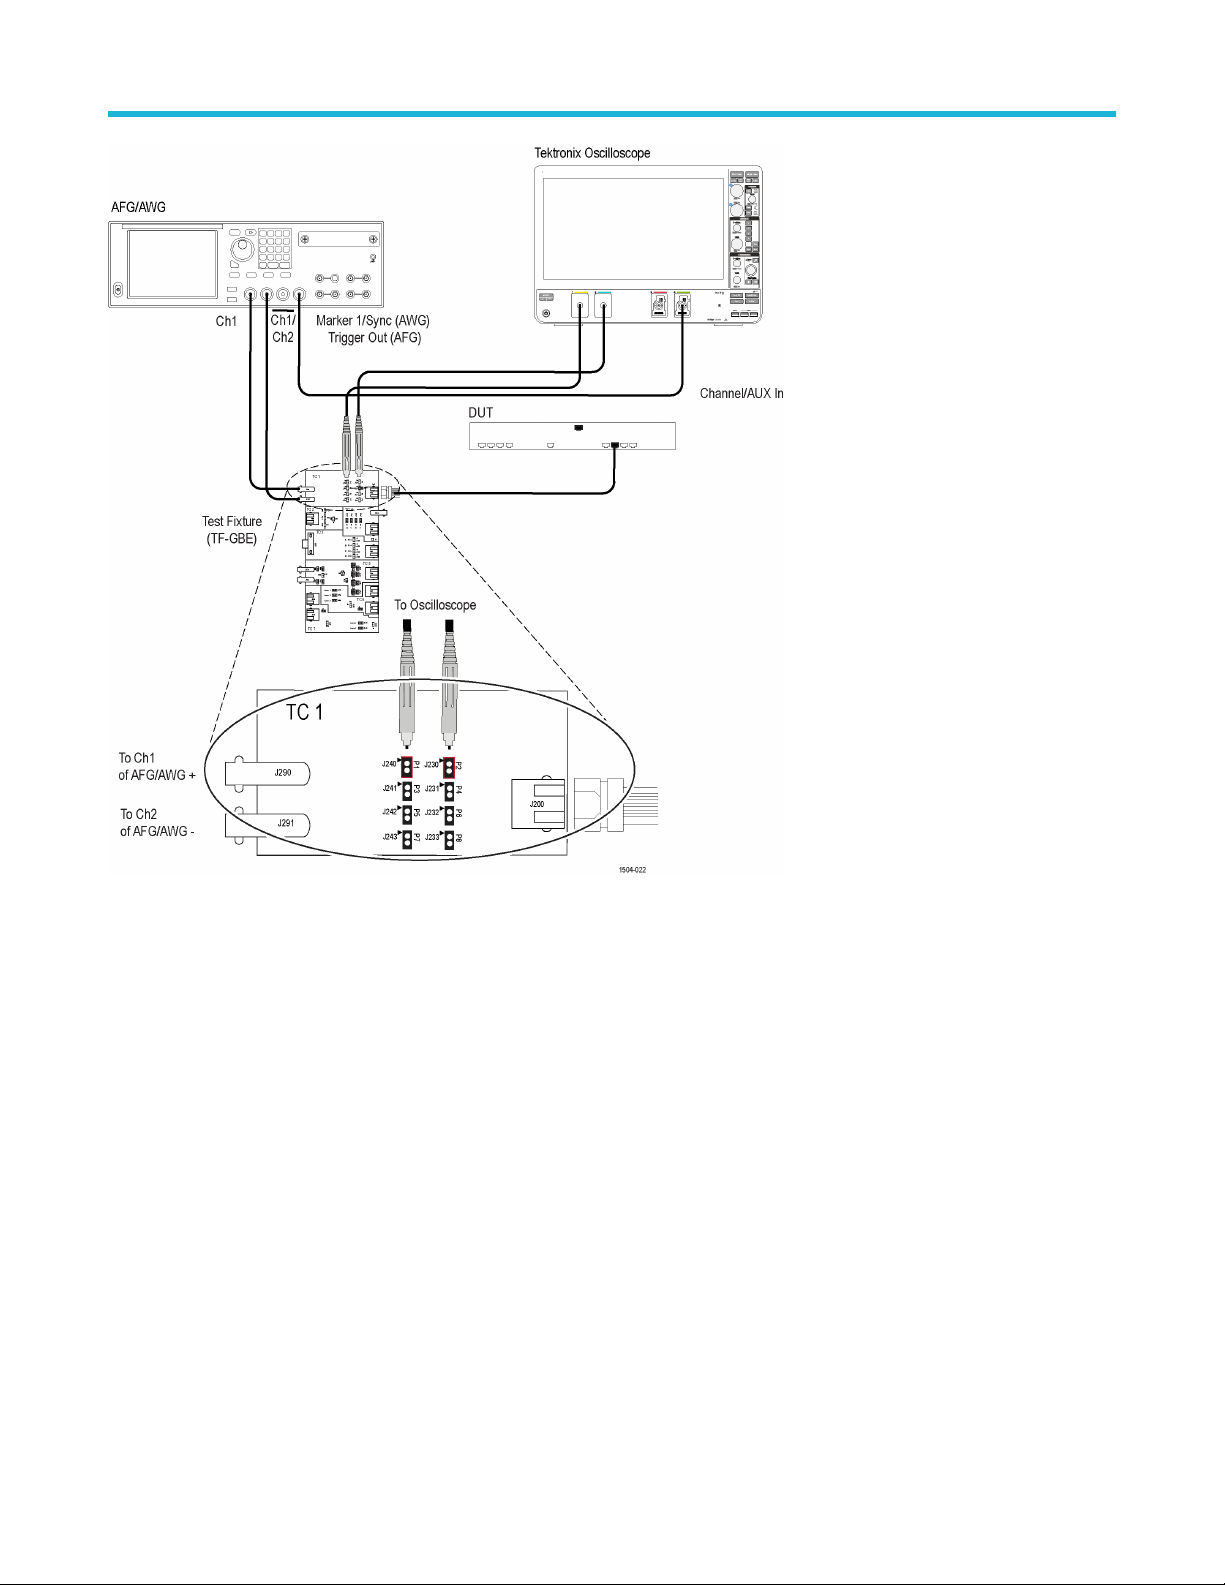
Running tests
Figure 48: 1000BASE-T Transmitter Return Loss
TekExpress® Ethernet Electrical Testing Application Application Help 77
Page 78

Running tests
Figure 49: 1000BASE-T Receiver Return Loss
100BASE-T connection diagram
Click Setup > Test Selection > Preview to view the equipment setup diagram(s).
78
Page 79

Running tests
Figure 50: 100BASE-T connection diagram for all tests except Return Loss
TekExpress® Ethernet Electrical Testing Application Application Help 79
Page 80

Running tests
Figure 51: 100BASE-T Transmitter Return Loss
80
Page 81
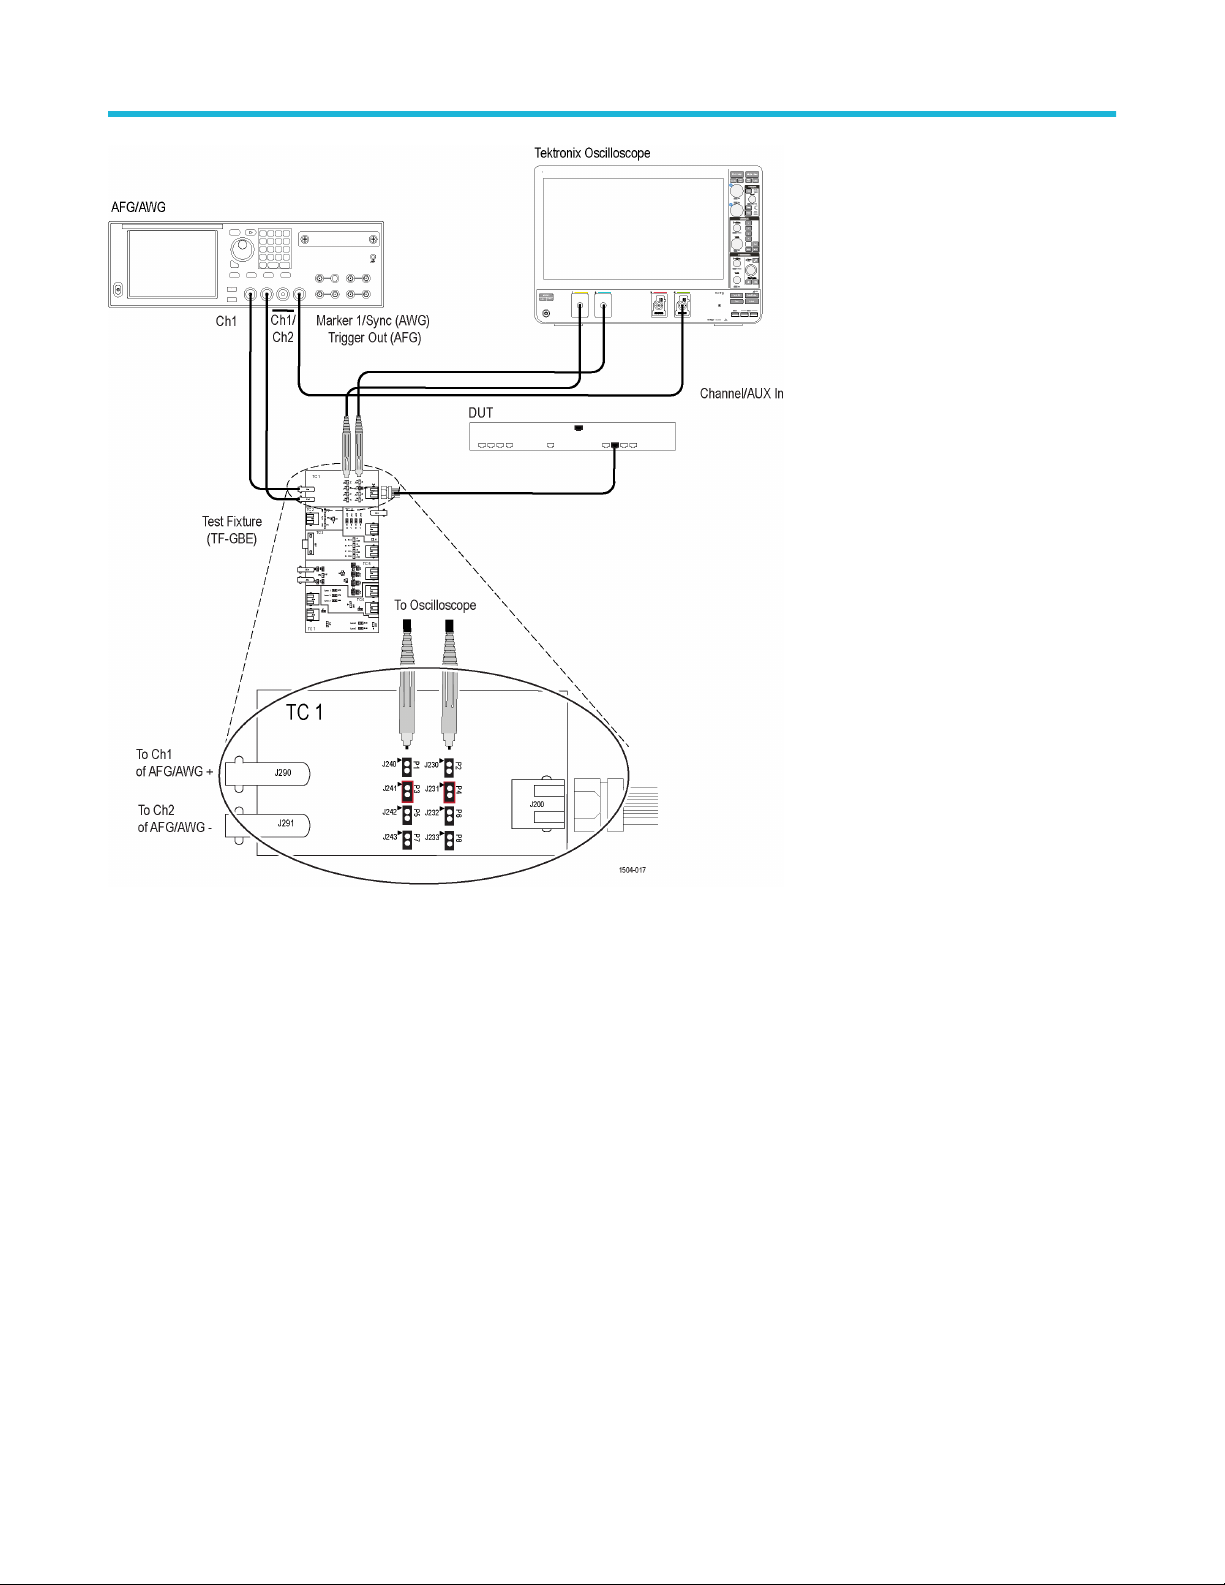
Running tests
Figure 52: 100BASE-T Receiver Return Loss
TekExpress® Ethernet Electrical Testing Application Application Help 81
Page 82

Running tests
10BASE-T connection diagram
Figure 53: 10BASE-T MAU, Jitter, TP_IDL Load With TPM, Link Pulse Timing With TPM, and Link Pulse Load With TPM
82
Page 83
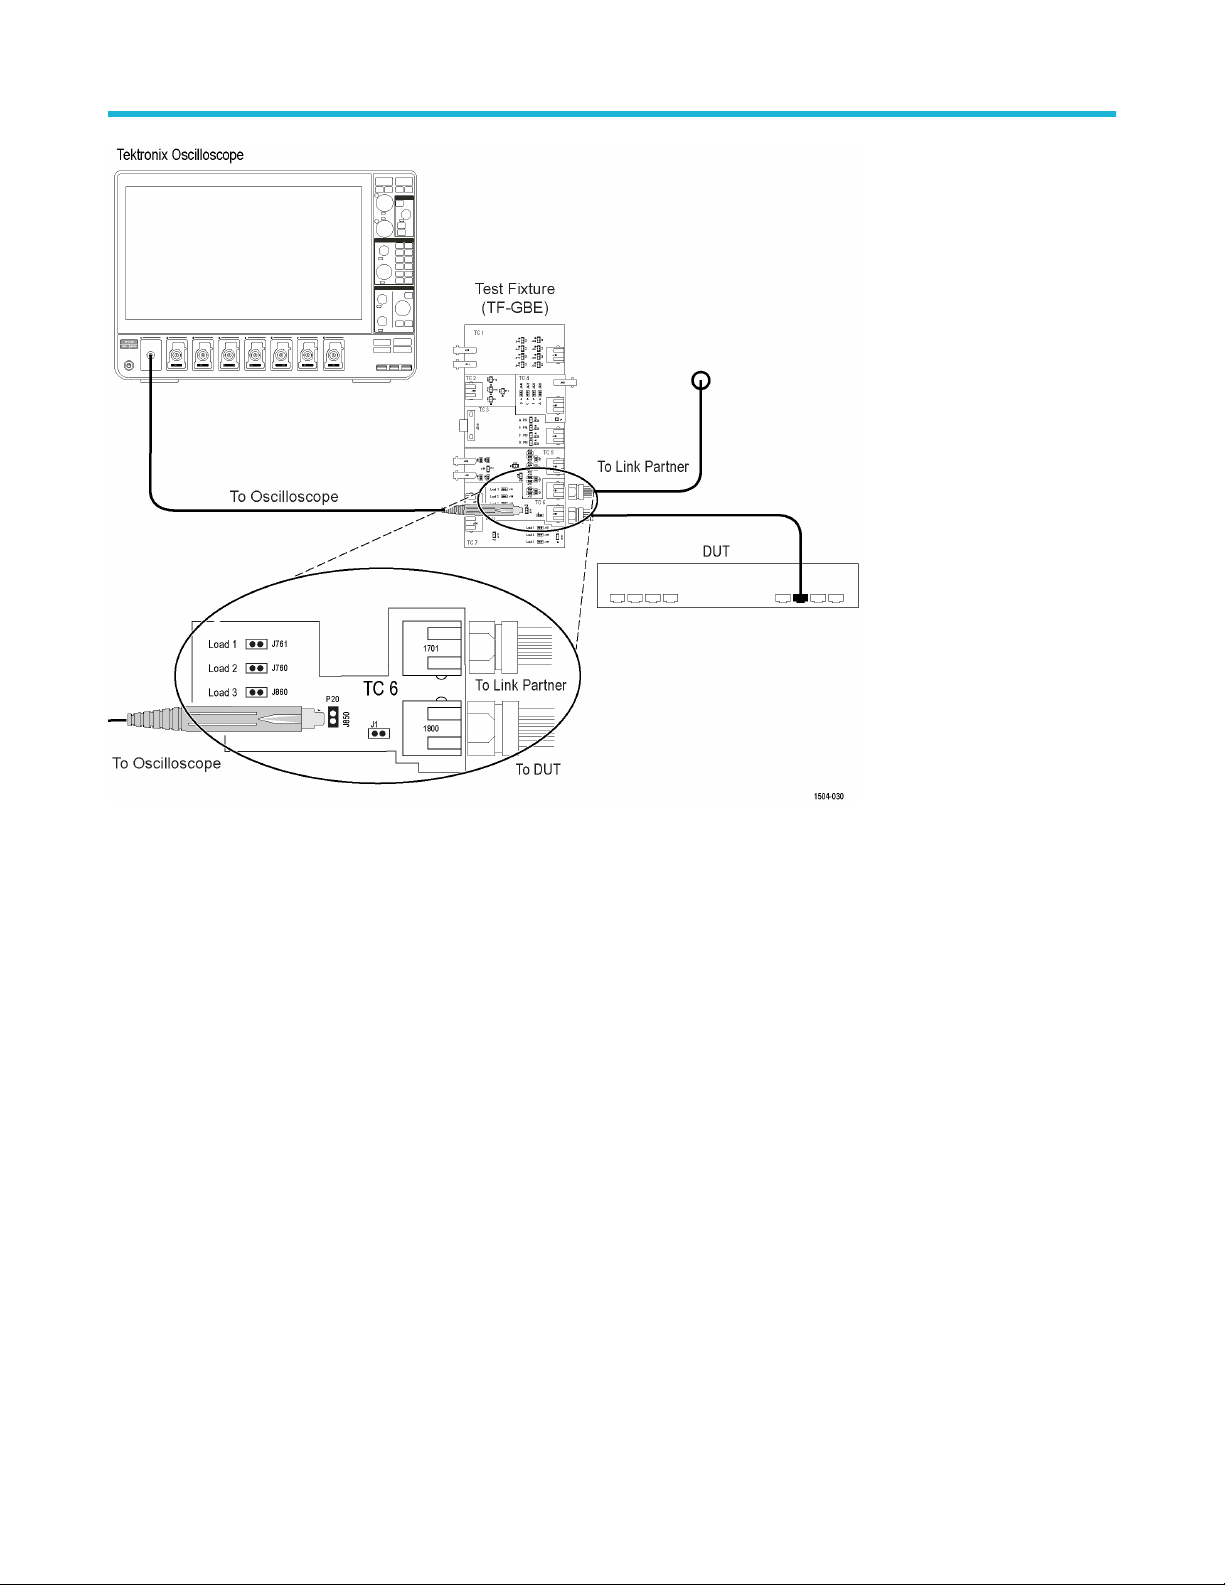
Running tests
Figure 54: 10BASE-T TP_IDL Load Without TPM, Jitter, Link Pulse Load Without TPM, Harmonic, and Link Pulse Timing Without TPM , and Differential Voltage
TekExpress® Ethernet Electrical Testing Application Application Help 83
Page 84

Running tests
Figure 55: 10BASE-T Transmitter Return Loss
84
Page 85

Running tests
Figure 56: 10BASE-T Receiver Return Loss
Refer Return Loss Calibration steps on page 38
Prerequisite
Compensate the signal path
Use the following procedure to compensate the internal signal acquisition path. Perform this procedure if the ambient temperature has
changed more than 5 °C (9 °F) since you performed the last signal path compensation. Perform the signal path compensation once a
week. Failure to do so may result in the instrument not meeting warranted performance levels.
1. Power on and wait for the instrument to complete its warm up period before continuing with this procedure.
2. Disconnect any probes you have connected to the input channels.
3. Set the instrument to Menu mode.
4. Select Instrument Calibration from the Utilities menu.
5. Note any instructions that appear in the resulting control window.
6. Click Run SPC to begin the procedure. The procedure may take several minutes to complete.
7. Verify that the Status changes to Pass after the procedure is complete. If the Calibration Status field indicates anything other than
Compensated, see Signal Path Compensation Status for information on the readout and recommended action.
TekExpress® Ethernet Electrical Testing Application Application Help 85
Page 86

Running tests
Note: When making measurements at vertical scale settings less than or equal to 5 mV, you should perform the signal path
compensation at least once a week. Failure to do so may result in the instrument not meeting warranted performance levels at
those volts/div settings.
Running tests
Select tests, set acquisition parameters, set configuration parameters, set preferences parameters, and click Start to run the tests. While
tests are running, you cannot access the Setup or Reports panels. To monitor the test progress, switch between the Status panel and the
Results panel.
While the tests are running, other applications may display windows in the background. The TekScope application takes precedence
over other applications, but you can switch to other applications by using Alt + Tab key combination. To keep the TekExpress Ethernet
application on top, select Keep On Top from the TekExpress Options menu.
The application displays report when the tests execution is complete.
Prerun checklist
1. Make sure that the instruments are warmed up (approximately 20 minutes) and stabilized.
2. Perform compensation: In the oscilloscope main menu, select Utilities > Instrument Compensation. Click Help in the compensation
window for steps to perform instrument compensation.
View test results
When a test completes, the application switches to the Results panel, which shows a summary of test results.
Each test result occupies a row in the Results table. By default, results are displayed in summary format, with the measurement details
collapsed. You can change the view in the following ways:
• To view the results grouped by pair or test, select the corresponding item from the Preferences menu.
• To expand all tests listed, select View Results Details from the Preferences menu.
• To expand and collapse tests, use the plus and minus buttons to the left of the test rows.
• To collapse all expanded tests, select Preferences > View Results Summary.
• To enable or disable the wordwrap feature, select Preferences > Enable Wordwrap.
• To expand the width of a column, place the cursor over the vertical line that separates the column from the one to the right. When the
cursor changes to a double-ended arrow, hold down the mouse button and drag the column to the desired width.
• To sort the test information by column, click the column head. When sorted in ascending order, a small up arrow is displayed. When
sorted in descending order, a small down arrow is displayed.
• To clear all test results displayed, click Clear ( ).
See Also
View a report
86
Page 87

Saving and recalling test setup
Saving and recalling test setup
Test setup files overview
Saved test setup information (such as the selected oscilloscope, general parameters, acquisition parameters, measurement limits,
waveforms (if applicable), and other configuration settings) are saved under the setup name at X:\Ethernet.
Use test setups to:
• Run a new session, acquiring live waveforms, using a saved test configuration.
• Create a new test setup using an existing one.
• View all the information associated with a saved test, including the log file, the history of the test status as it executed, and the results
summary.
• Run a saved test using saved waveforms.
See also
Save a test setup
Open (load) a saved test setup
Save a test setup
You can save a test setup before or after running a test. You can create a test setup from already created test setup, or using default test
setup. When you select the default test setup, the parameters are set to the application’s default value.
Select Options > Save Test Setup to save the opened setup.
Select Options > Save Test Setup As to save the setup with different name.
Open (load) a saved test setup
To Open (load) a saved test setup, do the following:
1. Select Options > Open Test Setup.
2. Select the setup from the list and click Open. Setup files are located at X:\Ethernet\.
See also
About test setups
Create a test setup using an existing one
Create a test setup from default settings
Create a test setup from default settings
To create a test setup using default settings, follow the steps:
1. Select Options > Default Test Setup. For default test setup, the parameters are set to the application’s default value.
2. Click application Setup and set the parameters.
3. Click application Reports and set the report options.
4. Optional: Click Start to run the test and verify that it runs correctly and captures the specified test information and reports. If it does not,
then edit the parameters and repeat this step until the test runs to your satisfaction.
TekExpress® Ethernet Electrical Testing Application Application Help 87
Page 88

Saving and recalling test setup
5. Select Options > Save Test Setup. Enter the file name and click Save. The application saves the file to X:\Ethernet\<session_name>.
Create a test setup using an existing one
To create a test setup using an existing one, follow the steps:
1. Select Options > Open Test Setup.
2. Select a setup from the list and then click Open.
3. Click application Setup and modify the parameters.
4. Click application Reports and modify the report options.
5. Select Options > Save Test Setup As.
6. Enter test setup name, and click Save.
88
Page 89
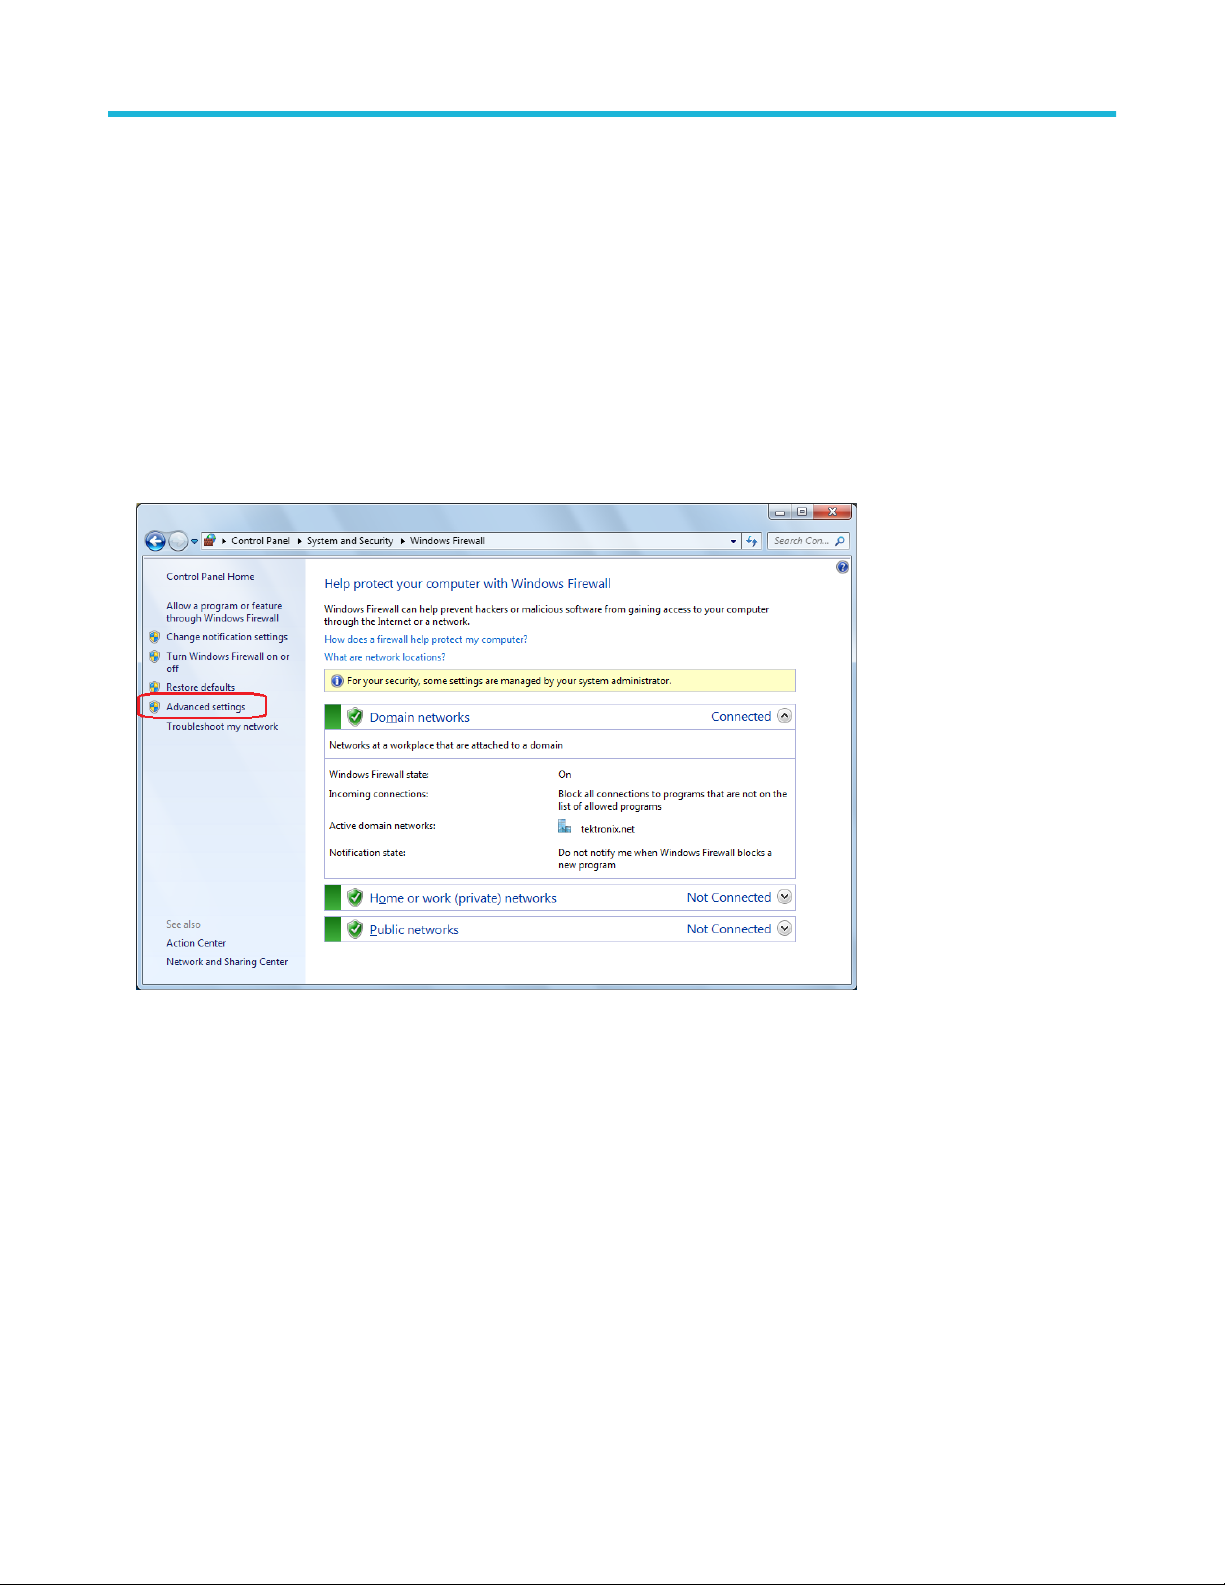
SCPI Commands
SCPI Commands
About SCPI command
You can use Standard Commands for Programmable Instruments (SCPI) to communicate with the TekExpress application.
Socket configuration for SCPI commands
This section describes the steps for TCP/IP socket configuration and TekVISA configuration to execute the SCPI commands.
TCP/IP socket configuration
1. Click Start > Control Panel > System and Security > Windows Firewall > Advanced settings.
2. In Windows Firewall with Advanced Security menu, select Windows Firewall with Advanced Security on Local Computer >
Inbound Rules and click New Rule…
TekExpress® Ethernet Electrical Testing Application Application Help 89
Page 90
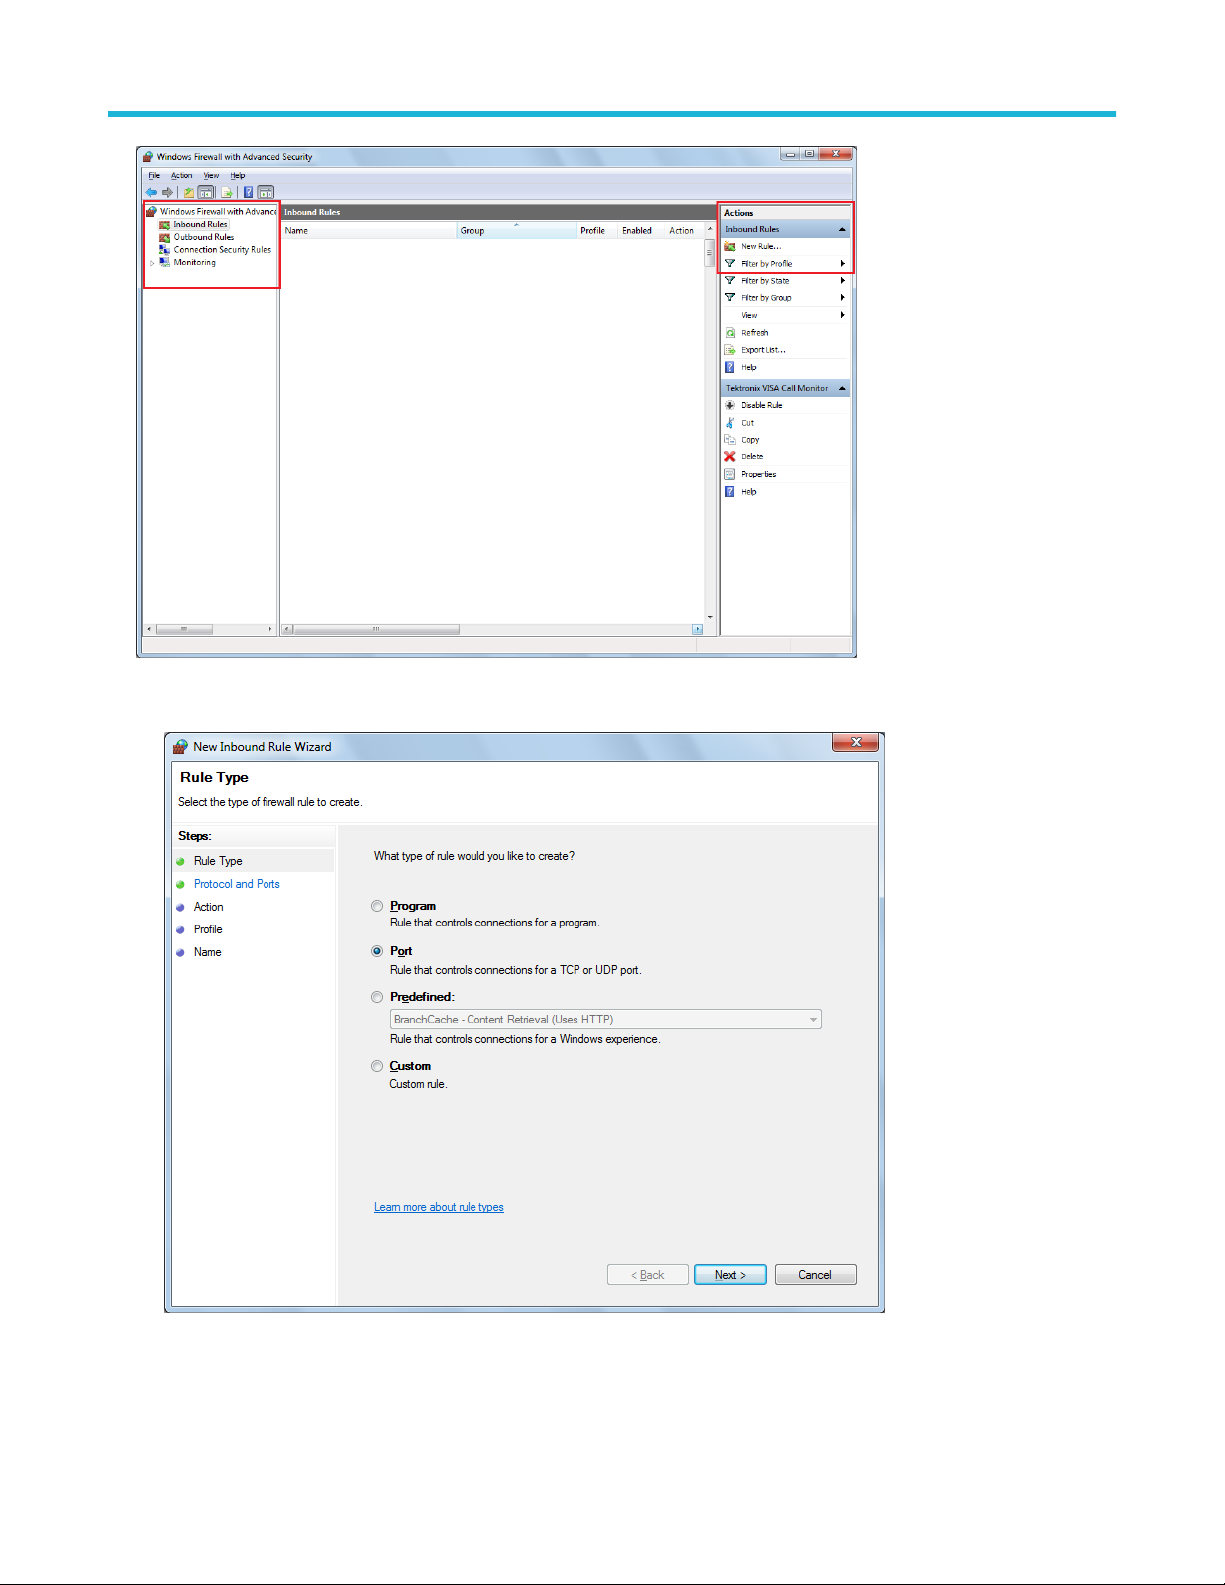
SCPI Commands
3. In New Inbound Rule Wizard menu
a. Select Port and click Next.
b. Select TCP as rule apply and enter 5000 for Specific local ports and click Next.
90
Page 91

SCPI Commands
c. Select Allow the connection and click Next.
d. Select Domain, Private, Public and click Next.
TekExpress® Ethernet Electrical Testing Application Application Help 91
Page 92

SCPI Commands
e. Enter Name, Description (optional), and click Finish.
4. Check whether the Rule name is displayed in Windows Firewall with Advanced Security menu > Inbound Rules.
92
Page 93
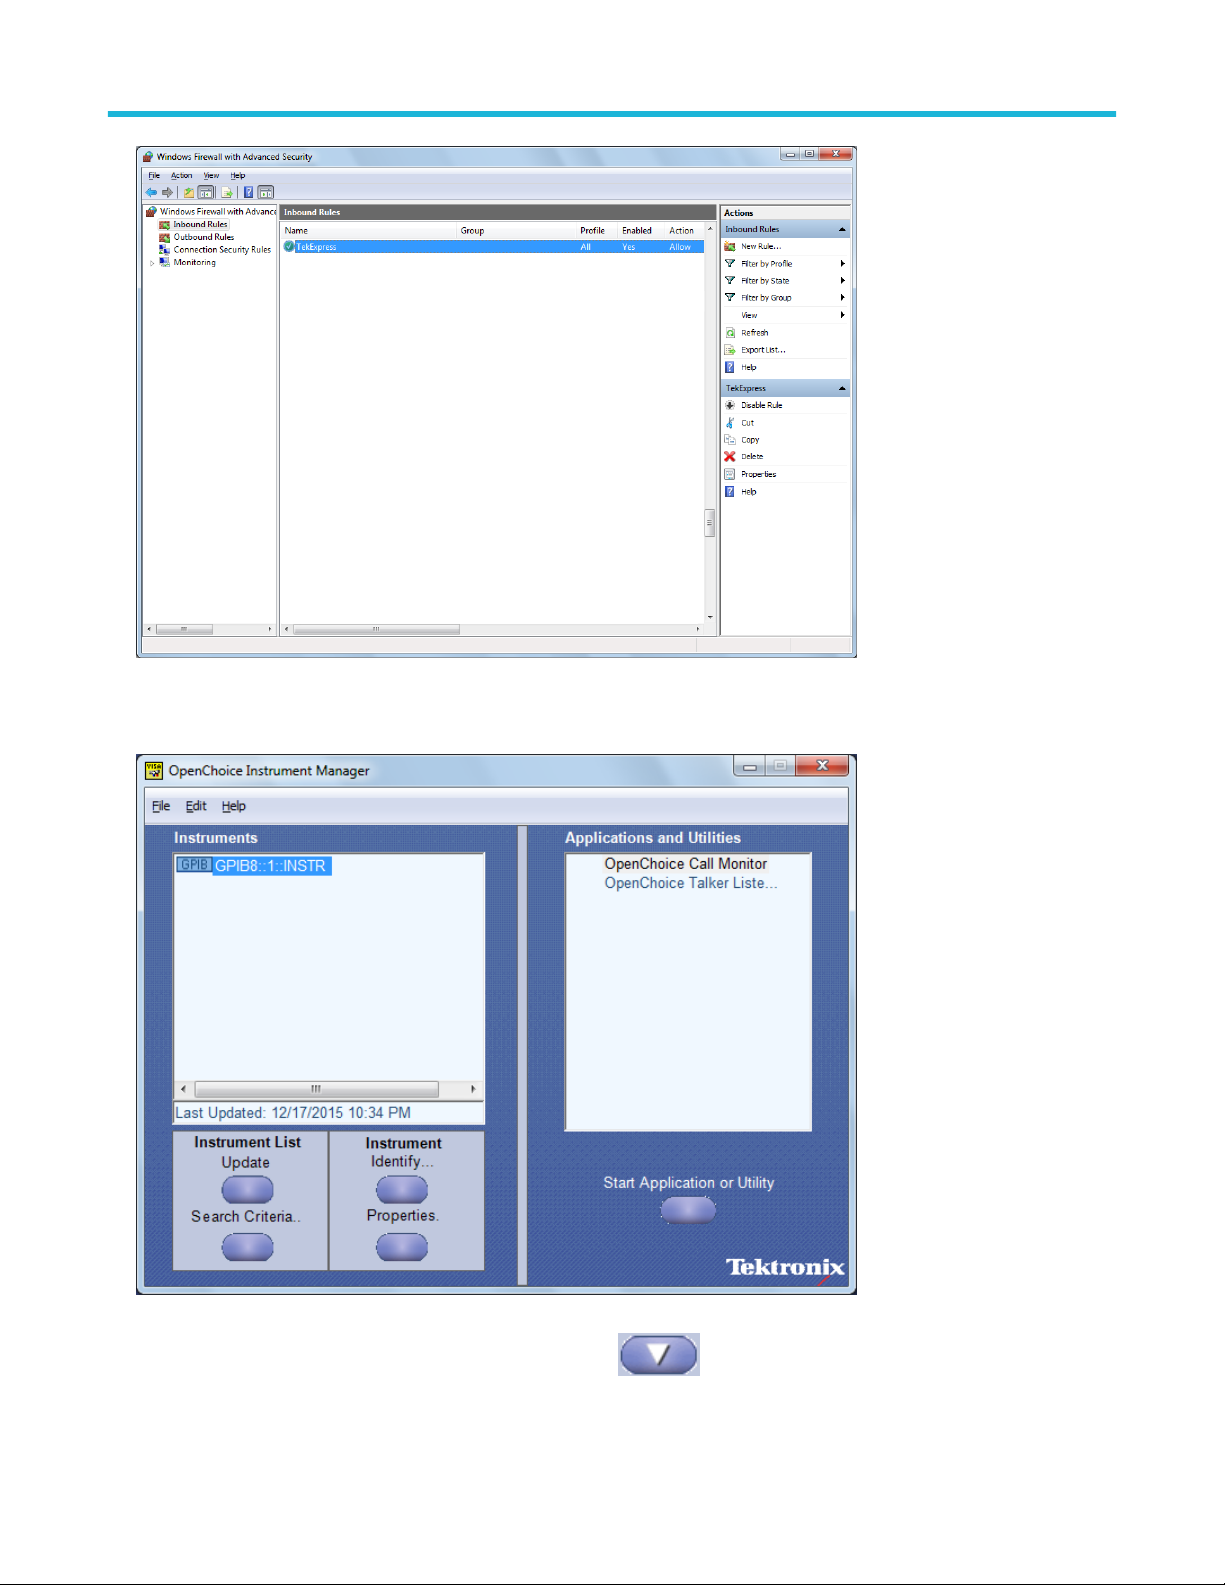
SCPI Commands
TekVISA configuration
1. Click Start > All Programs > TekVISA > OpenChoice Instrument Manager.
2. Click Search Criteria. In Search Criteria menu, click LAN to Turn-on. Select Socket from the drop-down list, enter the IP address of
the TekExpress device in Hostname and type Port as 5000. Click to configure the IP address with Port.
TekExpress® Ethernet Electrical Testing Application Application Help 93
Page 94

SCPI Commands
Enter the Hostname as 127.0.0.1 if the TekVISA and TekExpress application are in the same system, else enter the IP address of the
TekExpress application system.
3. Click Search to setup the TCPIP connection with the host. Check whether the TCPIP host name is displayed in OpenChoice
Instrument Manager > Instruments.
94
Page 95
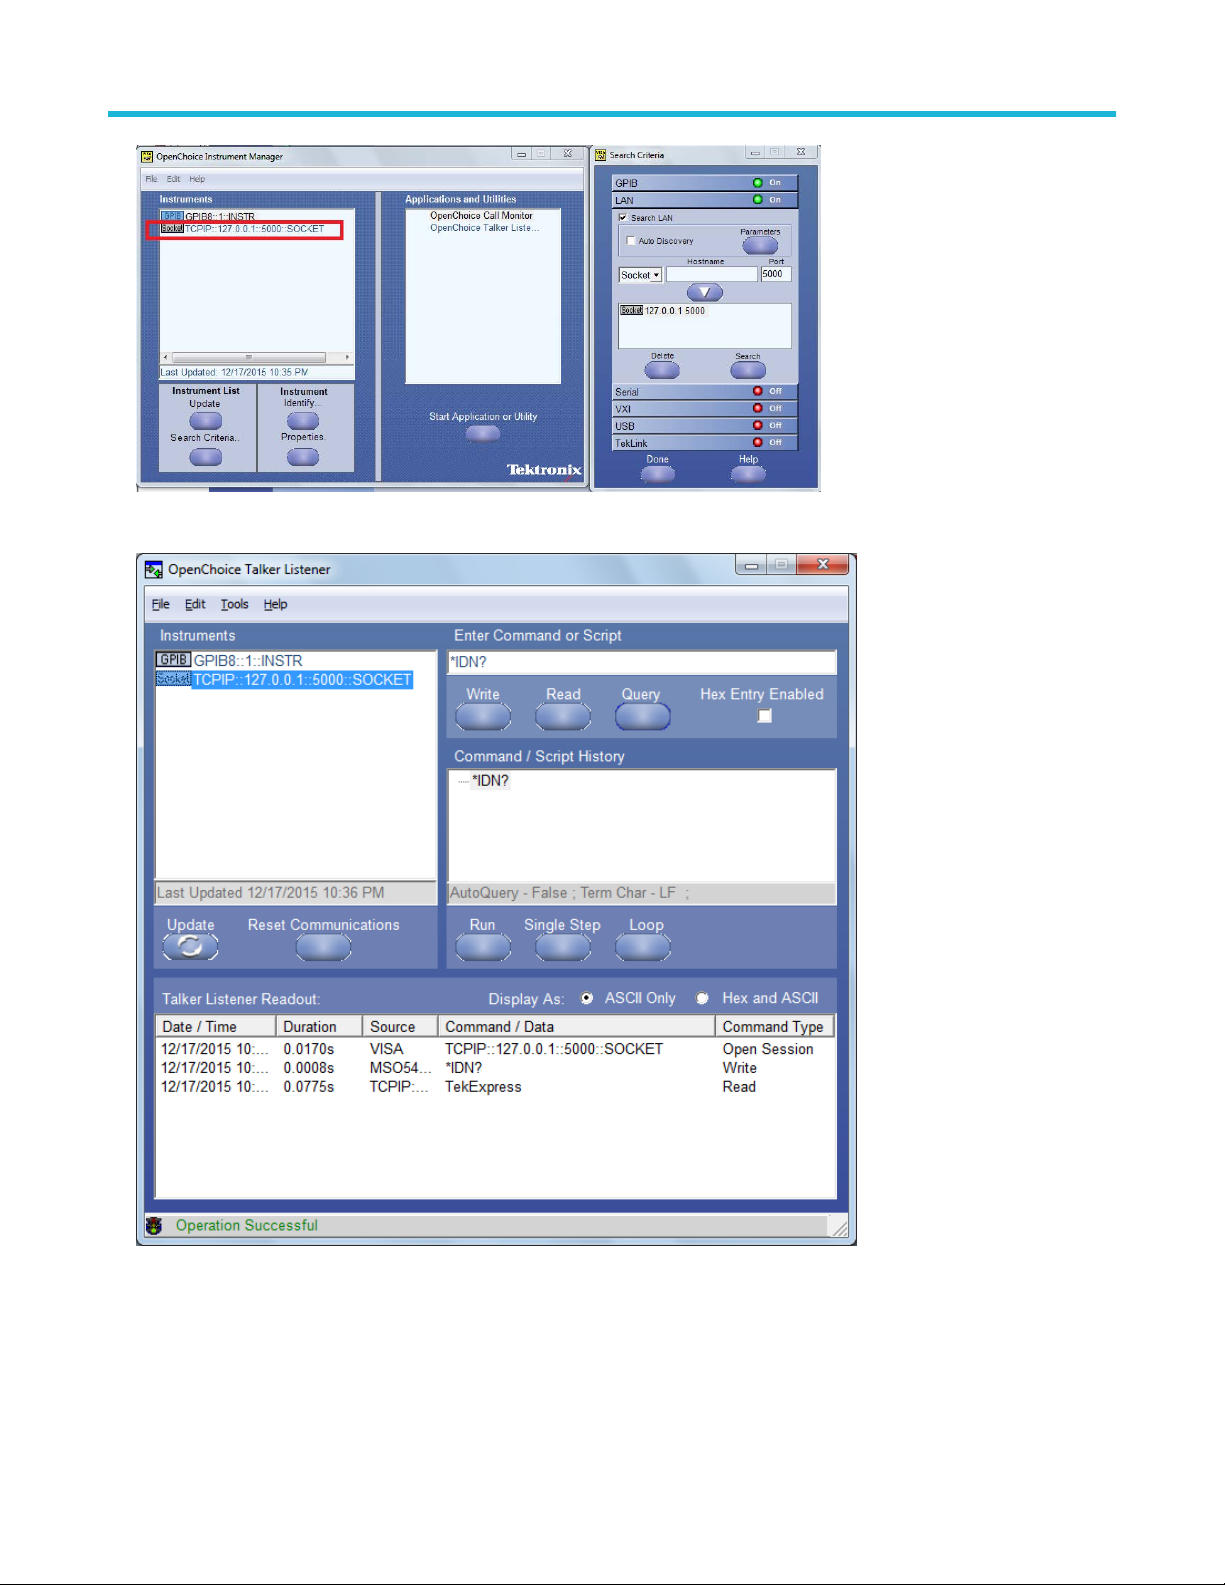
SCPI Commands
4. Double-click OpenChoice Talker Listener and enter the Command *IDN? in command entry field and click Query. Check that the
Operation is successful and Talker Listener Readout displays the Command / Data.
TEKEXP:*IDN?
This command queries the active TekExpress application name running on the oscilloscope.
Syntax
TEKEXP:*IDN?\n
TekExpress® Ethernet Electrical Testing Application Application Help 95
Page 96

SCPI Commands
Inputs
NA
Outputs
Returns active TekExpress application name running on the oscilloscope.
TEKEXP:*OPC?
This command queries the execution status of the last executed command.
Syntax
TEKEXP:*OPC?\n
Inputs
NA
Outputs
0 - last command execution is not complete
1 - last command execution is complete
TEKEXP:ACQUIRE_MODE
This command sets the acquire mode as live or pre-recorded.
Syntax
TEKEXP:ACQUIRE_MODE {LIVE | PRE-RECORDED}\n
Inputs
{LIVE | PRE-RECORDED}
Outputs
NA
TEKEXP:ACQUIRE_MODE?
This command queries the acquire mode type.
Syntax
TEKEXP:ACQUIRE_MODE?\n
Inputs
NA
Outputs
{LIVE | PRE-RECORDED}
TEKEXP:EXPORT
This command returns all the bytes of data to the specified file.
96
Page 97

Syntax Outputs
TEKEXP:EXPORT REPORT\n
TEKEXP:EXPORT WFM,"<FileName>"\n
TEKEXP:EXPORT IMAGE,"<FileName>"\n
Returns the report file in bytes
Returns the specified waveform file in bytes
Returns the specified image file in bytes
Inputs
FileName - Specifies the file name
TEKEXP:INFO?
This command queries the information about the file(s).
Syntax Outputs
TEKEXP:INFO?
REPORT\n
TEKEXP:INFO? WFM\n
TEKEXP:INFO? IMAGE\n
<ReportFileSize>,"<ReportFileName.mht>"
<WfmFile1Size>,"<WfmFileName1.wfm>";<WfmFile2Size>,"<WfmFileName2.wfm>";...
<Image1FileSize>,"<Image1FileName>";<Image2FileSize>,"<Image2FileName>" ;...
SCPI Commands
TEKEXP:INSTRUMENT
This command sets the value for the selected instrument type.
Syntax
TEKEXP:INSTRUMENT "<InstrumentType>",<Value>"\n
Inputs
InstrumentType
Value
Check Command parameters list section for InstrumentType and Value parameters.
Tip:
Outputs
NA
TEKEXP:INSTRUMENT?
This command queries the instrument selected for the specified instrument type.
Syntax
TEKEXP:INSTRUMENT? "<InstrumentType>"\n
Inputs
InstrumentType
Check Command parameters list section for InstrumentType parameters.
Tip:
TekExpress® Ethernet Electrical Testing Application Application Help 97
Page 98
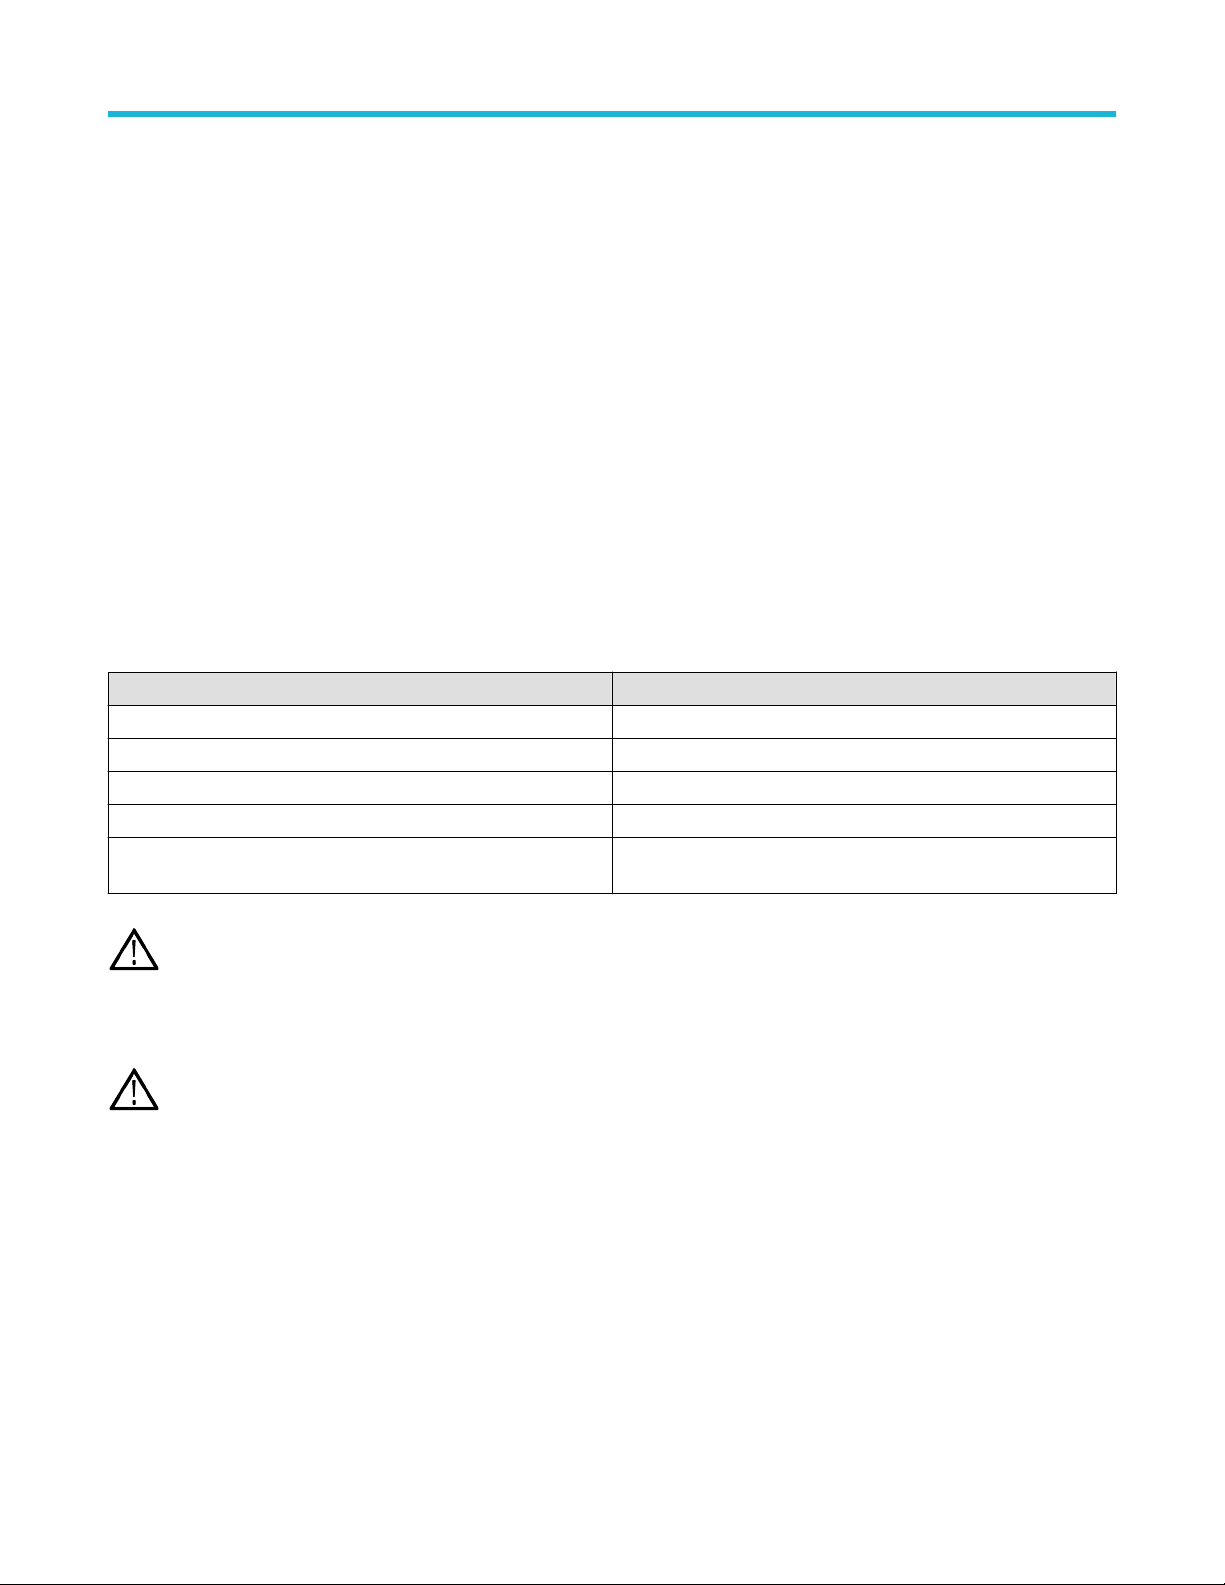
SCPI Commands
Outputs
Returns the instrument selected for the specified instrument type
TEKEXP:LASTERROR?
This command queries the last error string occurred for the current TCP session. If there are no errors since startup, or since the last call to
TEKEXP:LASTERROR?\n, this command returns an empty string.
Syntax
TEKEXP:LASTERROR?\n
Inputs
NA
Outputs
<string>
TEKEXP:LIST?
This command queries the list of available device, suite, test, version or instrument.
Syntax Outputs
TEKEXP:LIST? DEVICE\n
TEKEXP:LIST? SUITE\n
TEKEXP:LIST? TEST\n
TEKEXP:LIST? VERSION\n
TEKEXP:LIST?
INSTRUMENT,"<InstrumentType>"\n
Note: This command returns the list of items within double quotes (""). Iterate the receive procedure until the list ends with double
quotes otherwise the next query commands won’t work as expected.
Returns the list of available device(s) as comma separated values.
Returns the list of available suite(s) as comma separated values.
Returns the list of available test(s) as comma separated values.
Returns the list of available version(s) as comma separated values.
Returns the list of available instruments' for the given Instrument
type as comma separated values.
Inputs
InstrumentType
Check Command parameters list section for Instrument Type parameters.
Tip:
TEKEXP:MODE
This command sets the execution mode as compliance or user defined.
Syntax
TEKEXP:MODE {COMPLIANCE | USER-DEFINED}\n
Inputs
{COMPLIANCE | USER-DEFINED}
98
Page 99

Outputs
NA
TEKEXP:MODE?
This command queries the execution mode type.
Syntax
TEKEXP:MODE?\n
Inputs
NA
Outputs
{COMPLIANCE | USER-DEFINED}
TEKEXP:POPUP
This command sets the response to the active popup shown in the application.
Syntax
SCPI Commands
TEKEXP:POPUP “<PopupResponse>”\n
Inputs
PopupResponse
Outputs
NA
TEKEXP:POPUP?
This command queries the active popup information shown in the application.
Syntax
TEKEXP:POPUP?\n
Inputs
NA
Outputs
Returns the active popup information in the application.
TEKEXP:REPORT
This command generates the report for the current session.
Syntax
TEKEXP:REPORT GENERATE\n
TekExpress® Ethernet Electrical Testing Application Application Help 99
Page 100
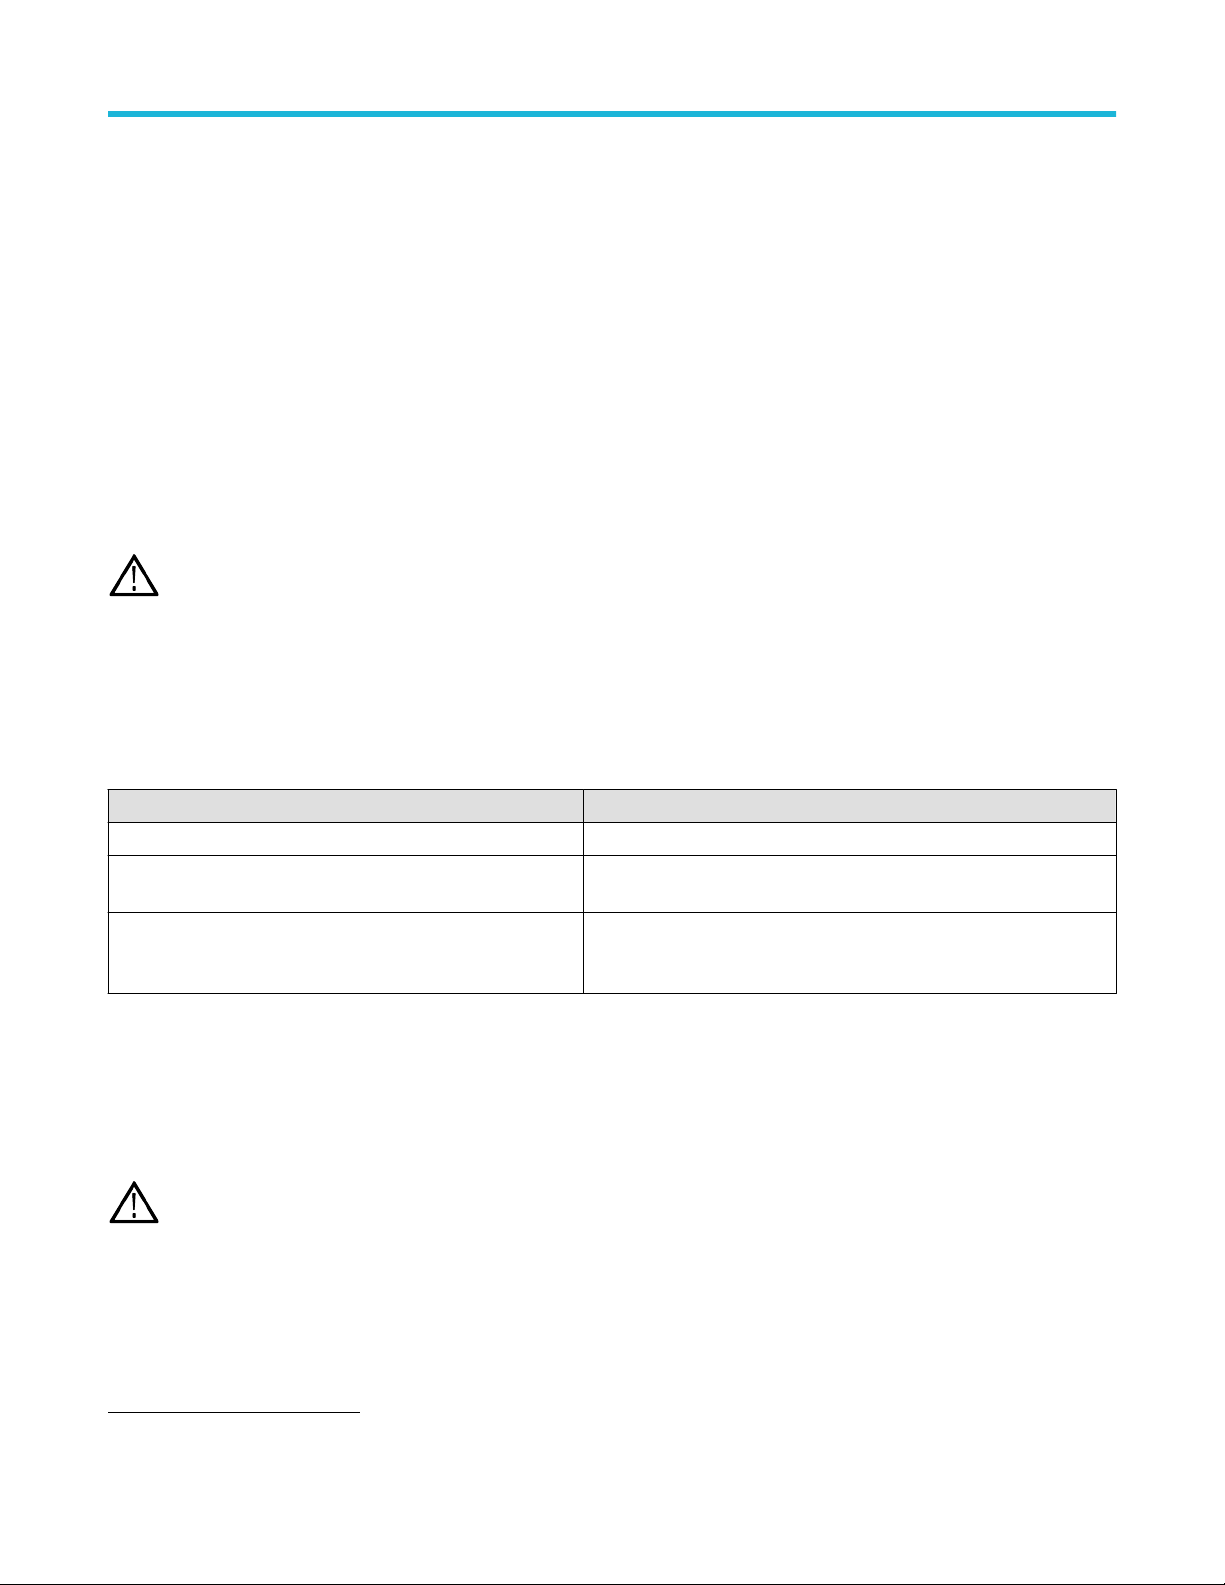
SCPI Commands
Inputs
GENERATE
Outputs
NA
TEKEXP:REPORT?
This command queries the queried header field value in the report.
Syntax
TEKEXP:REPORT? “<HeaderField>”\n
Inputs
HeaderField - Specifies to return the measured value for the indicated test.
Tip: Check Report for HeaderField parameters.
Outputs
Returns the queried header field value in the report
TEKEXP:RESULT?
This command queries the result available in report summary/details table.
Syntax Outputs
TEKEXP:RESULT? "<TestName>"\n
TEKEXP:RESULT?
"<TestName>","<ColumnName>"\n
TEKEXP:RESULT?
"<TestName>","<ColumnName>",<RowNumber
>\n
Inputs
TestName - Specifies the name of the test for which to obtain the test result value.
ColumnName - Specifies the column name for the measurement
RowNumber - Specifies the row number of the measurement
Check Results panel for TestName, ColumnName, and RowNumber parameters.
Tip:
Return Pass/Fail status of the test.
Returns all the row values of the specified column for the test.
Returns the column value for the specified row number
1
TEKEXP:SELECT
This command selects the device, suite, version, or test.
1
Row number starts from zero.
100
 Loading...