

Page 1

TekExpress® Automotive PAM3 Analysis Application
Printable Application Help
*P077160601*
077-1606-01
Page 2

Page 3

TekExpress® Automotive PAM3 Analysis Application
Printable Application Help
www.tek.com
077-1606-01
Page 4

Copyright © Tektronix. All rights reserved. Licensed software products are owned by Tektronix or its subsidiaries
or suppliers, and are protected by national copyright laws and international treaty provisions. Tektronix products
are covered by U.S. and foreign patents, issued and pending. Information in this publication supersedes that in all
previously published material. Specifications and price change privileges reserved.
TekExpress is a registered trademark of Tektronix, Inc.
TEKTRONIX and TEK are registered trademarks of Tektronix, Inc.
Contacting Tektronix
Tektronix, Inc.
14150 SW Karl Braun Drive
P.O. Box 500
Beaverton, OR 97077
USA
For product information, sales, service, and technical support:
■
In North America, call 1-800-833-9200.
■
Worldwide, visit www.tek.com to find contacts in your area.
Page 5

Table of Contents
Welcome .............................................................................................................................................. v
Getting help and support
Related documentation ................................................................................................................... 1
Conventions .................................................................................................................................... 2
Technical support ........................................................................................................................... 2
Getting started
Supported oscilloscopes ................................................................................................................. 5
Recommended probes ..................................................................................................................... 5
Downloading and installing the software ....................................................................................... 6
Activate the license ......................................................................................................................... 6
View software version .................................................................................................................... 7
Application directories ................................................................................................................... 7
File name extensions ...................................................................................................................... 8
Operating basics
Launch the application .................................................................................................................... 9
Exit the application ....................................................................................................................... 10
Application controls ..................................................................................................................... 11
Global application controls ........................................................................................................... 13
Options menu overview ........................................................................................................... 13
TekExpress instrument control settings .................................................................................. 14
View connected instruments ................................................................................................... 15
Configure email settings .......................................................................................................... 16
Application panels overview ........................................................................................................ 18
Setup panel ................................................................................................................................... 19
Setup panel overview .............................................................................................................. 20
Set DUT parameters ................................................................................................................ 20
Select tests ............................................................................................................................... 32
Set acquisition tab parameters ................................................................................................. 33
Set configuration tab parameters ............................................................................................. 34
Set preferences tab parameters ................................................................................................ 38
Status panel overview ................................................................................................................... 39
TekExpress® Automotive PAM3 Analysis Application i
Page 6

Table of Contents
Results panel ................................................................................................................................. 41
Results panel overview ............................................................................................................ 41
Preferences menu .................................................................................................................... 42
View test-related files .............................................................................................................. 42
Reports panel ................................................................................................................................ 43
Reports panel overview ........................................................................................................... 43
Select report options ................................................................................................................ 44
View a report ........................................................................................................................... 46
Report content ......................................................................................................................... 46
Running tests
Equipment connection diagram .................................................................................................... 49
Compensate the signal path .......................................................................................................... 61
Running tests ................................................................................................................................ 61
View test results ............................................................................................................................ 62
Saving and recalling test setup
Test setup files overview .............................................................................................................. 63
Save a test setup ............................................................................................................................ 63
Open load a saved test setup ......................................................................................................... 64
Create a test setup from default settings ....................................................................................... 64
Create a test setup using an existing one ...................................................................................... 64
SCPI commands
About SCPI command .................................................................................................................. 65
Socket configuration for SCPI commands ................................................................................... 65
TEKEXP:*IDN? ........................................................................................................................... 73
TEKEXP:*OPC? .......................................................................................................................... 73
TEKEXP:ACQUIRE_MODE ...................................................................................................... 74
TEKEXP:ACQUIRE_MODE? .................................................................................................... 74
TEKEXP:EXPORT ...................................................................................................................... 75
TEKEXP:INFO? ........................................................................................................................... 75
TEKEXP:INSTRUMENT ............................................................................................................ 76
TEKEXP:INSTRUMENT? .......................................................................................................... 76
TEKEXP:LASTERROR? ............................................................................................................. 77
TEKEXP:LIST? ............................................................................................................................ 77
TEKEXP:POPUP ......................................................................................................................... 78
TEKEXP:POPUP? ........................................................................................................................ 78
ii TekExpress® Automotive PAM3 Analysis Application
Page 7

Table of Contents
TEKEXP:REPORT ...................................................................................................................... 79
TEKEXP:REPORT? ..................................................................................................................... 79
TEKEXP:RESULT? ..................................................................................................................... 80
TEKEXP:SELECT ....................................................................................................................... 81
TEKEXP:SELECT? ..................................................................................................................... 81
TEKEXP:SETUP .......................................................................................................................... 82
TEKEXP:STATE ......................................................................................................................... 82
TEKEXP:STATE? ........................................................................................................................ 83
TEKEXP:VALUE ........................................................................................................................ 83
TEKEXP:VALUE? ...................................................................................................................... 84
Command parameters list ............................................................................................................. 85
Examples ...................................................................................................................................... 93
TekExpress® Automotive PAM3 Analysis Application iii
Page 8

Table of Contents
iv TekExpress® Automotive PAM3 Analysis Application
Page 9

Welcome
Welcome to TekExpress® Automotive PAM3 Analysis software application.
Automotive Ethernet operates as a full-duplex communication link over a
twisted-pair cable. The Full-Duplex communication, along with PAM3 signaling,
adds complexity in validating the Electronic Control Units (ECU) in real-world
conditions. The TekExpress Automotive PAM3 Analysis application includes
unique Signal Separation capability and Electrical analysis.
The application enables you to separate traffic from two ECUs in full-duplex
mode without having to cut cables or make hardware changes to the Ethernet
cable using unique Signal Separation feature. The application provides more
visibility into your Automotive PAM3 design with PAM3-based measurements
including Eye Diagram, Bathtub Plot, and Jitter tests.
Key features
■
Signal separation algorithm enables the analysis of a full duplex signal by
separating them into their respective half duplex signals. The separation can
be performed without affecting the ECU system or dissecting the Ethernet
cable to install a directional coupler.
■
Eye Diagram in noisy condition provides better insight compared to SQI
(Signal Quality Index) value.
■
The separated waveforms obtained from the signal separation algorithm
enables you to decode both Master and Slave ECU signals simultaneously.
■
Measurements like eye height and eye width can be used to measure the eyeopening of the signals. Additionally, an eye mask can be added to check the
TekExpress® Automotive PAM3 Analysis Application v
Page 10

Welcome
shape of the eye-diagrams. The jitter measurements include deterministic,
random and total jitter. The total jitter measurement can be calculated at a
particular Bit Error Rate (BER) to demonstrate the signal integrity of the
system. All the measurements can be performed on both master and slave
ECUs.
vi TekExpress® Automotive PAM3 Analysis Application
Page 11

Getting help and support
Related documentation
The following manuals are available as part of the TekExpress Automotive
PAM3 Analysis Solution documentation set.
Table 1: Product documentation
Item Purpose Location
Online Help Application operation and User
Interface help
PDF of the Online Help Printable version of the compiled
help
PDF file that ships with TekExpress Automotive PAM3 Analysis
solution (TekExpress-Automotive-PAM3-Solution-SoftwarePrintable-Help-ENUS.pdf).
You can download the PDF version of the manual from the Tektronix
website.
Part number: 077-1606-xx
http://www.tek.com
TekExpress® Automotive PAM3 Analysis Application 1
Page 12

Getting help and support
Conventions
Help uses the following conventions:
■
The term "Application," and "Software" refers to the TekExpress Automotive
PAM3 Analysis application.
■
The term “DUT” is an abbreviation for Device Under Test.
■
The term “select” is a generic term that applies to the two methods of
choosing a screen item (button control, list item): using a mouse or using the
touch screen.
■
A Note identifies important information.
Table 2: Icon descriptions
Icon Meaning
This icon identifies important information.
Technical support
General information
This icon identifies conditions or practices that could result in loss
of data.
This icon identifies additional information that will help you use
the application more efficiently.
Tektronix values your feedback on our products. To help us serve you better,
please send us your suggestions, ideas, or comments on your application or
oscilloscope. Contact Tektronix through mail, telephone, or the Web site, http://
www.tek.com.
When you contact Tektronix Technical Support, please include the following
information (be as specific as possible):
■
All instrument model numbers
■
Hardware options, if any
■
Modules used
■
Your name, company, mailing address, phone number, FAX number
■
Please indicate if you would like to be contacted by Tektronix about your
suggestion or comments.
2 TekExpress® Automotive PAM3 Analysis Application
Page 13

Getting help and support
■
Application specific
information
Software version number
■
Description of the problem such that technical support can duplicate the
problem
■
If possible, save the setup files for all the instruments used and the
application
■
If possible, save the TekExpress setup files, log.xml, *.TekX (session files
and folders), and status messages text file
■
If possible, save the waveform on which you are performing the
measurement as a .wfm file
TekExpress® Automotive PAM3 Analysis Application 3
Page 14

Getting help and support
4 TekExpress® Automotive PAM3 Analysis Application
Page 15

Getting started
Supported oscilloscopes
■
■
■
Recommended probes
5 Series Mixed Signal Oscilloscope (MSO54, MSO56, MSO58)
6 Series Mixed Signal Oscilloscope (MSO64) with bandwidth 4 GHz and
above
Firmware Version: 1.24.9.x or above
100BASE-T1
1000BASE-T1
Voltage probe
■
TDP1500
■
TDP3500
Current probe
■
TCP0030A
■
P6022
■
CT6
Voltage probe
■
TDP3500
Current probe
■
CT6
TekExpress® Automotive PAM3 Analysis Application 5
Page 16

Getting started
Downloading and installing the software
Complete the following steps to download and install the latest PAM3
application. See Supported oscilloscopes on page 5 for compatibility.
1. Go to www.tek.com.
2. Click Downloads. In the Downloads menu, select DOWNLOAD TYPE as
Software and enter PAM3 in the MODEL OR KEYWORD field and click
SEARCH.
Figure 1: Download Manuals, Datasheets, Software and more
3. Select the latest version of software and follow the instructions to download.
Copy the executable file to the oscilloscope.
Activate the license
4. Double-click the executable and follow the on-screen instructions. The
software is installed at C:\Program Files\Tektronix\TekExpress\TekExpress
Automotive PAM3 Analysis.
5. Select Application > TekExpress Automotive PAM3 Analysis from the
oscilloscope Menu bar to launch the application.
Activate the license from the oscilloscope:
1. From the Help tab, select About.
2. Click Install License.
Browse to select the license file.
6 TekExpress® Automotive PAM3 Analysis Application
Page 17

Getting started
View software version
Use the following instruction to view version information for the application.
Click Options > About TekExpress.
Application directories
The TekExpress Automotive PAM3 Analysis files are installed at the following
location:
C:\Program Files\Tektronix\TekExpress\TekExpress Automotive PAM3 Analysis
The application directory and associated files are organized as follows:
Figure 2: Application directory
The following table lists the default directory names and their usage:
Directory names Usage
ACP Contains application libraries
Bin Contains dll files
Compliance Suites Contains compliance specific files
Examples Contains examples for SCPI commands
ICP Contains instrument and application specific interface libraries
Images Contains images of the application
Lib Contains utility files specific to the application
Report Generator Contains style sheets for report generation
Tools Contains instrument and application specific files
TekExpress® Automotive PAM3 Analysis Application 7
Page 18

Getting started
File name extensions
The TekExpress Automotive PAM3 Analysis software uses the following file
name extensions:
Table 3: File name extension
File name extension Description
.TekX Application session files (the extensions may not be displayed)
.py Python sequence file
.xml Test-specific configuration information (encrypted) files
Application log files
.csv Test result reports
.mht Test result reports (default)
Test reports can also be saved in HTML format
.pdf Test result reports
Application help document
.xslt Style sheet used to generate reports
8 TekExpress® Automotive PAM3 Analysis Application
Page 19

Operating basics
Launch the application
To launch the TekExpress Automotive PAM3 Analysis application, select
Applications > TekExpress Automotive PAM3 Analysis from the oscilloscope
Menu bar.
Figure 3: TekExpress Automotive PAM3 Analysis
After first launch of the TekExpress Automotive PAM3 Analysis application, the
following changes take place on the oscilloscope.
During launch, a "My TekExpress" folder is created in the Documents folder of
the current user and gets mapped to "X" drive. When the application is closed
properly, the "X" drive will get unmapped.
NOTE. If a user with new login ID launches "TekExpress Automotive PAM3
Analysis.exe", the "My TekExpress" folder is created in the Documents folder of
the new user.
TekExpress® Automotive PAM3 Analysis Application 9
Page 20

Operating basics
When you first run the application after installation, the application checks for
Resources.xml located in the X:\ folder. The Resources.xml file gets created in
the X: drive. If the file is not found, then the application creates the file with
equipment details. Session files are then stored inside the X:\TekExpress
Automotive PAM3 Analysis folder. If this file is not found, the application runs
an instrument discovery program to detect connected instruments before
launching TekExpress Automotive PAM3 Analysis.
To keep the TekExpress Automotive PAM3 Analysis application window on top,
select Keep On Top from the Options menu. If the application goes behind the
oscilloscope application, click Application > TekExpress Automotive PAM3
Analysis to move the application to be in front.
NOTE. When Keep on Top is selected, you cannot access the combo boxes in the
application panels.
See also
Exit the application
Exit the application
To exit the application, click on the application title bar. Follow on-screen
prompts to save any unsaved session, save test setup files, or exit the application.
NOTE. Using other methods to exit the application can result in abnormal
termination of the application.
10 TekExpress® Automotive PAM3 Analysis Application
Page 21

Operating basics
Application controls
This section describes the application controls.
Table 4: Application control description
Item Description
Options menu
Test panel
Menu to display global application controls.
Controls that open tabs for configuring test settings and options.
Start / Stop button
Pause / Continue button
Clear button
Use the Start button to start the test run of the measurements in
the selected order. If prior acquired measurements are not
cleared, then new measurements are added to the existing set.
The button toggles to the Stop mode while tests are running. Use
the Stop button to abort the test.
Use the Pause button to pause the acquisition. When a test is
paused, this button changes as Continue.
Use the Clear button to clear all existing measurement results.
Adding or deleting a measurement, or changing a configuration
parameter of an existing measurement, also clears
measurements. This is to prevent the accumulation of
measurement statistics or sets of statistics that are not coherent.
This button is available only on the Results panel.
NOTE. This button is visible only when there are results data on
the panel.
TekExpress® Automotive PAM3 Analysis Application 11
Page 22

Operating basics
Item Description
Application window move icon
Minimize icon
Close icon
Mini view / Normal view
Place the cursor over the top of the application window to move
the application window to the desired location
Minimizes the application.
Close the application.
Toggles the application between mini view and normal view.
Mini view displays the run messages with the time stamp,
progress bar,
Start / Stop button, and Pause / Continue button.
The application moves to mini view when you click the Start
button.
12 TekExpress® Automotive PAM3 Analysis Application
Page 23

Operating basics
Global application controls
The menus and controls that appear outside the individual tabs are called “Global
Controls”. These are used to specify the devices to be tested.
Options menu overview
To access the Options menu, click in the upper-right corner of the application.
It has the following selections:
Options menu
Figure 4: Options
Menu Function
Default Test Setup Opens an untitled test setup with defaults selected
Open Test Setup Opens a saved test setup
Save Test Setup Saves the current test setup
Save Test Setup As Saves the current test setup with a different file name or file type
Open Recent Displays the recently opened test setups to open
Instrument Control
Settings
Keep On Top Keeps the TekExpress Automotive PAM3 Analysis application on top of
Detects, lists, and refreshes the connected instruments found on
specified connections (LAN, GPIB, USB, and so on)
all the application
NOTE. When Keep on Top is selected, you cannot access the combo
boxes in the application panels.
Email Settings Configures email options for test run and results notifications
MOI Displays the TekExpress Automotive PAM3 Analysis MOI (Method Of
Implementation) document
TekExpress® Automotive PAM3 Analysis Application 13
Page 24

Operating basics
Menu Function
Help Displays the TekExpress Automotive PAM3 Analysis help
About TekExpress
■
Displays application details such as software name, version number,
and copyright
■
Provides a link to the end-user license agreement
■
Provides a link to the Tektronix Web site
See also. Application controls
TekExpress instrument
control settings
Use the TekExpress Instrument Control Settings dialog box to search the instruments (resources) connected to the application. You can use the Search Criteria controls to search the connected instruments depending on the connection type. The details of the connected instrument is displayed in the Retrieved Instruments window.
To access, click Options > Instrument Control Settings.
Figure 5: TekExpress Instrument Control Settings
The connected instruments displayed here can be selected for use under Global
Settings in the test configuration section.
NOTE. Select GPIB (Default) and LAN when using TekExpress Automotive
PAM3 Analysis application on 5/6 Series MSO instruments.
See also. Options menu overview
14 TekExpress® Automotive PAM3 Analysis Application
Page 25

Operating basics
View connected
instruments
Use the TekExpress Instrument Control Settings dialog box to search the
instruments (resources) connected to the application. The application uses
TekVISA to discover the connected instruments.
NOTE. The instruments required for the test setup must be connected and be
recognized by the application before running the test.
To refresh the list of connected instruments:
1. From the Options menu, select Instrument Control Settings.
2. In the Search Criteria section of the Instrument Control Settings dialog box,
select the connection types of the instruments to search.
Instrument search is based on the VISA layer, but different connections
determine the resource type, such as LAN, GPIB, and USB. For example, if
you choose LAN, the search will include all the instruments supported by
TekExpress that are communicating over the LAN.
3. Click Refresh. TekExpress searches for connected instruments.
4. After searching, the dialog box lists the instrument-related details based on
the search criteria. For example, for the Search Criteria as LAN and GPIB,
the application displays all LAN and GPIB instruments connected to the
application.
TekExpress® Automotive PAM3 Analysis Application 15
Page 26

Operating basics
Figure 6: TekExpress Instrument Control Settings
Configure email settings
The details of the instruments are displayed in the Retrieved Instruments table.
The time and date of instrument refresh is displayed in the Last Updated field.
See also. Equipment connection diagram on page 49
Use the Email Settings utility to get notified by email when a measurement
completes, or produces any error condition. Follow the steps to configure email
settings:
16 TekExpress® Automotive PAM3 Analysis Application
Page 27

Operating basics
Email Settings
1. Select Options > Email Settings to open the Email Settings dialog box.
2. (Required) For Recipient email Address(es), enter one or more recipient
email addresses. To include multiple addresses, separate the addresses with
commas.
3. (Required) For Sender’s Address, enter the email address used by the
instrument. This address consists of the instrument name, followed by an
underscore, followed by the instrument serial number, then the @ symbol,
and the email server ID. For example: user@yourcompany.com.
4. (Required) In the Server Configuration section, type the SMTP Server
address of the Mail server configured at the client location, and the SMTP
Port number, in the corresponding fields.
If this server requires password authentication, enter a valid login name,
password, and host name in the corresponding fields.
NOTE. If any of the above required fields are left blank, the settings will not
be saved and email notifications will not be sent.
5. In the Email Attachments section, select from the following options:
■
Reports: Select to receive the test report with the notification email.
■
Status Log: Select to receive the test status log with the notification
email. If you select this option, then also select whether you want to
receive the full log or just the last 20 lines.
TekExpress® Automotive PAM3 Analysis Application 17
Page 28

Operating basics
6. In the Email Configuration section:
■
■
7. Select the Email Test Results When complete or on error check box. Use
this check box to quickly enable or disable email notifications.
8. To test your email settings, click Test Email.
9. To apply your settings, click Apply.
10. Click Close when finished.
Application panels overview
Enter a maximum file size for the email message. Messages with
attachments larger than this limit will not be sent. The default is 5 MB.
Enter the number in the Number of Attempts to Send field, to limit the
number of attempts that the system makes to send a notification. The
default is 1. You can also specify a timeout period.
The TekExpress Automotive PAM3 Analysis solution uses panels to group Test
Setup Configuration, Results, and Reports settings. Click any button to open the
associated panel. A panel may have one or more tabs that list the selections
available in that panel. Controls in a tab can change depending on settings made
in the same tab or another tab.
Figure 7: Application panels
18 TekExpress® Automotive PAM3 Analysis Application
Page 29

Operating basics
Table 5: Application panels overview
Panel Name Purpose
Setup panel The Setup panel shows the test setup controls. Click the Setup button to
open this panel.
Use this panel to:
■
Set DUT tab parameters
■
Select tests
■
Set acquisition tab parameters
■
Set configuration tab parameters
■
Set preferences tab parameters
Status panel View the progress and analysis status of the selected tests, and view test
logs.
Results panel View the summary of test results and select result viewing preferences.
Reports panel Browse for reports, save reports as specific file types, specify report
naming conventions, select report content to include (summary
information, detailed information, user comments, setup configuration,
application configuration, test point, signal mode, and eye sections etc.),
and select report viewing options.
Setup panel
See also
Application controls
TekExpress® Automotive PAM3 Analysis Application 19
Page 30

Operating basics
Setup panel overview
The Setup panel contains sequentially ordered tabs that help guide you through
the test setup and the execution process.
Set DUT parameters
Figure 8: Setup panel
Use the DUT tab to select parameters for the device under test. These settings are
global and apply to all tests of the current session.
20 TekExpress® Automotive PAM3 Analysis Application
Page 31

Operating basics
Figure 9: DUT tab
Click Setup > DUT to access the DUT parameters:
Table 6: DUT tab - DUT tab settings
Setting Description
DUT ID Adds an optional text label for the DUT to reports. The default value is DUT001. The
maximum number of characters is 32.
You cannot use the following characters in an ID name: (.,..,...,\,/:?”<>|*)
Opens the Comments dialog box to enter text to add to the report. Maximum size is
Comments icon (to the right of the
DUT ID field)
Acquire live waveforms Acquires active signals from the DUT for measurement and analysis.
Use pre-recorded waveform files Runs tests on a saved waveform. Open (load) a saved test setup.
Signal Debug Mode (Enables Ref, Math) Selects to enable the Ref and Math for Master and Slave source selection and skip the
Suite Selects the preferred suite from the drop-down option.
Device Profile
256 characters. To enable or disable comments appearing on the test report, see Select
report options.
acquisition. It will only analyze the waveforms.
■
100BASE-T1
■
1000BASE-T1
TekExpress® Automotive PAM3 Analysis Application 21
Page 32

Operating basics
Setting Description
Communication Mode Selects the preferred communication mode.
■
Full Duplex
■
Half Duplex
Test Point (ECU) Selects the preferred test point
■
Master
■
Slave
■
Both
Probes Configuration Selects the preferred probe configuration.
■
One Voltage and One Current
■
One Voltage and Two Current
Master Source Selection Selects the signal source for Voltage and Current signals from the drop-down option.
Slave Source Selection Selects the signal source for Voltage and Current signals from the drop-down option.
Schematic Displays the equipment connection setup based on the communication mode, test point,
and the probes configuration selected.
Signal Separation
Run Run button separates the waveform from voltage and current signals.
Validate Allows you to validate the signal separation before running all the tests.
Displays icon, which means that signal separation is In-Progress.
It also allows you to validate the signal separation and provide clock recovered waveform to
plot eye diagram.
Settings
Acquisition Displays the Acquisition setup pop-up window.
Allows you to set the horizontal and signal separation settings.
Signal Corrections Displays the Signal Correction setup pop-up window.
Allows you to set the skew and attenuation settings, and also allows you to apply the
correction files.
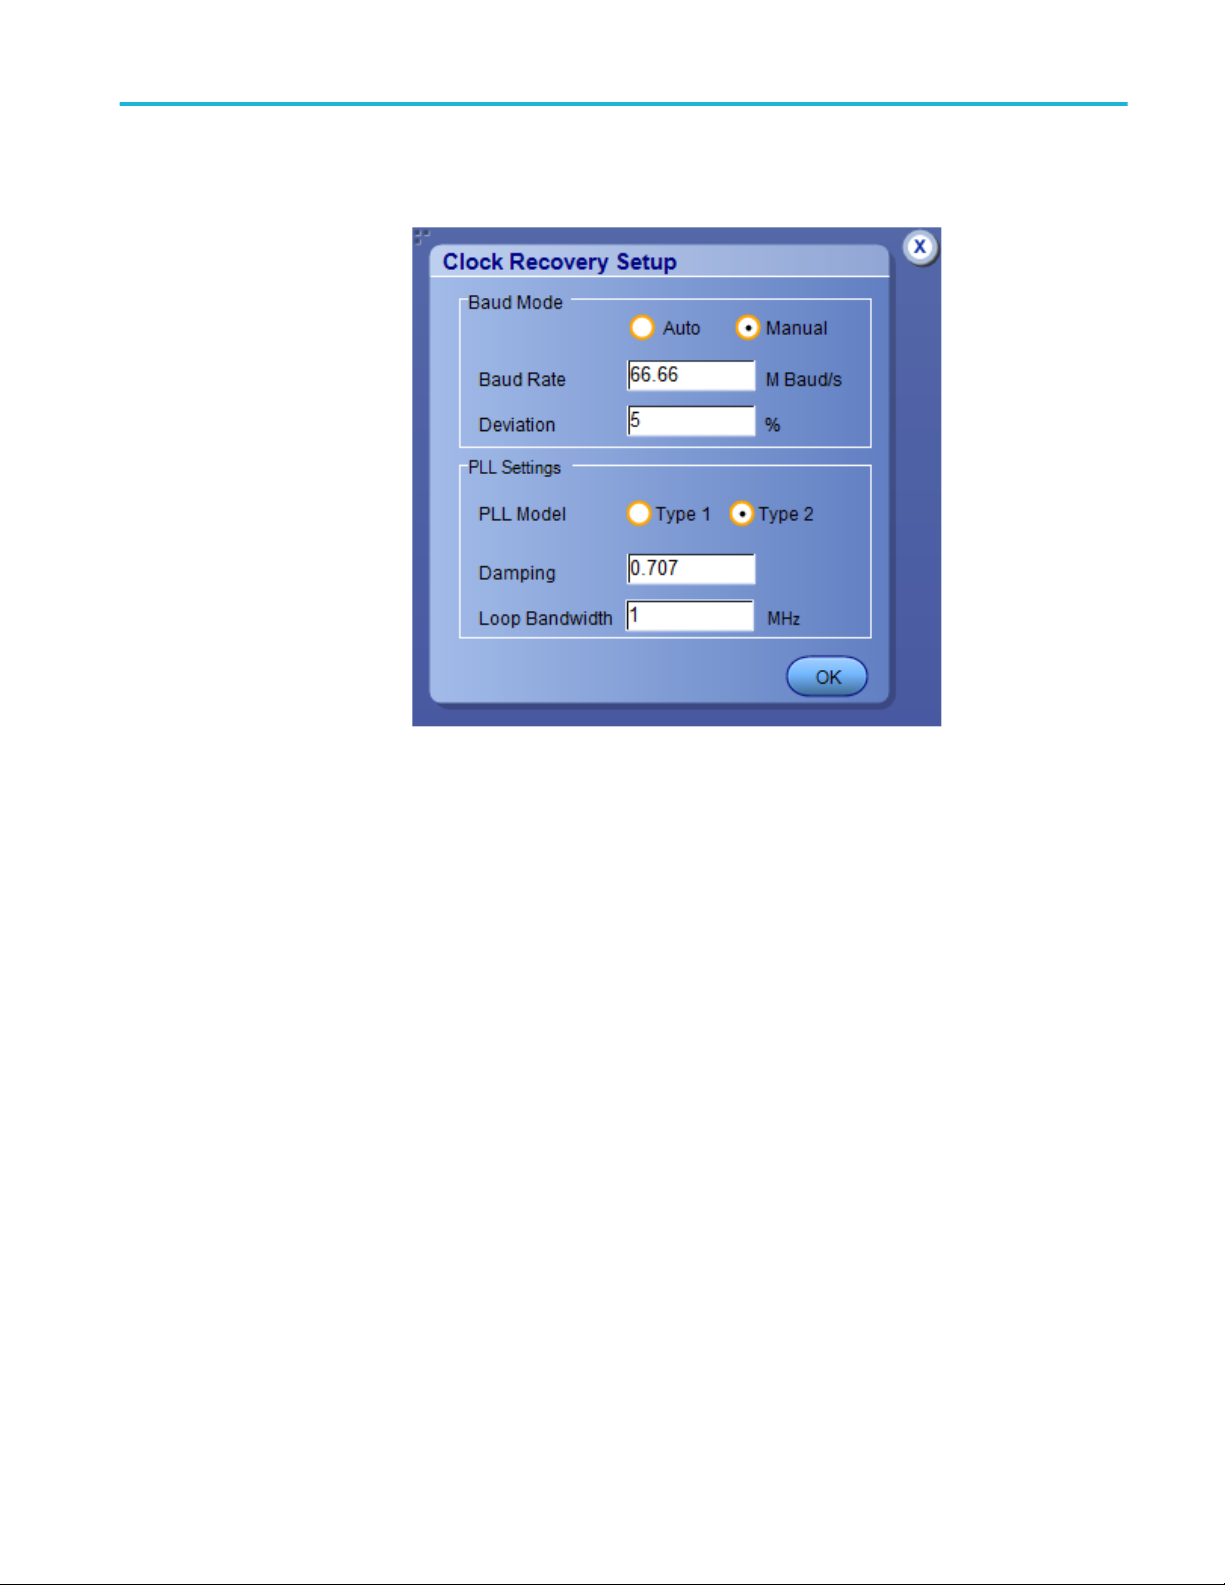
Clock Recovery Displays the Clock Recovery setup pop-up window.
Allows you to set the Baud Mode and PLL (Phase Locked Loop) settings.
De-Embed Filter Displays the De-Embed filter setup pop-up window.
Allows you to create and apply the CTLE Filter files and Inverse PR (Partial Response)
Shaping filter files.
NOTE. Inverse PR Shaping filter is applicable only for 1000BASE-T1.
22 TekExpress® Automotive PAM3 Analysis Application
Page 33

Operating basics
The following parameters are applicable for acquisition setup:
Figure 10: DUT tab - Acquisition Setup
Table 7: DUT tab - Acquisition Setup
Setting Description
Horizontal Settings
Sample Rate Selects the sample rate from the drop-down option.
100BASE-T1
■
0.625 GS/s
■
1.5625 GS/s
■
3.125 GS/s
■
6.25 GS/s
■
12.5 GS/s
■
25 GS/s
■
50 GS/s
1000BASE-T1
■
1.5625 GS/s
■
3.125 GS/s
■
6.25 GS/s
■
12.5 GS/s
TekExpress® Automotive PAM3 Analysis Application 23
Page 34

Operating basics
Setting Description
■
25 GS/s
■
50 GS/s
Record Length Enter the record length. Range is from 0.1 M to 20 M.
Signal Separation Setup
Ref Resistance Enter the reference resistance. Range is from 1 Ohm to 200 Ohms.
Current Loop Selects the current loop value from the drop-down option.
■
1
■
2
■
3
■
4
Search Time Enter the search time. Range is from 1 ns to 1000 ns.
24 TekExpress® Automotive PAM3 Analysis Application
Page 35

Operating basics
The following parameters are applicable for signal corrections setup:
Figure 11: DUT tab - Signal corrections
Table 8: DUT tab - Signal corrections
Setting Description
Probe Settings
Voltage Probe Select the preferred voltage probe from the drop-down option.
100BASE-T1
■
TDP1500
■
TDP3500
1000BASE-T1
■
TDP3500
TekExpress® Automotive PAM3 Analysis Application 25
Page 36

Operating basics
Setting Description
Current Probe Select the preferred current probe from the drop-down option.
100BASE-T1
■
TCP0030A
■
P6022
■
CT6
1000BASE-T1
■
CT6
Ratio Select the preferred ratio from the drop-down option.
■
1
■
10
NOTE. This is enabled only when the P6022 is selected as the current probe.
Apply Signal Correction Select to apply the signal correction to the signal.
Skew and Attenuation Settings
Apply Skew Settings Select to apply the skew settings.
Master/Slave Skew Configuration
Voltage Enter the voltage value in the text field. The unit is ns.
Current1 Enter the current1 value in the text field. The unit is ns.
Current2 Enter the curren2 value in the text field. The unit is ns.
Apply Attenuation Settings Select to apply the attenuation settings.
Master/Slave Attenuation Settings
Voltage Enter the voltage value in the text field. The unit is db.
Current1 Enter the current1 value in the text field. The unit is db.
Current2 Enter the curren2 value in the text field. The unit is db.
26 TekExpress® Automotive PAM3 Analysis Application
Page 37
Operating basics
The following parameters are applicable for clock recovery setup:
Figure 12: DUT tab - Clock Recovery
TekExpress® Automotive PAM3 Analysis Application 27
Page 38

Operating basics
Table 9: DUT tab - Clock Recovery
Setting Description
Baud Mode Selects the preferred baud mode
■
Auto
■
Manual
Baud Rate Enter the baud rate value in the text field. The unit is M Bauds/s.
NOTE. This is editable only when the manual mode is selected.
Deviation Enter the deviation value in the text field. The unit is %.
NOTE. This is editable only when the manual mode is selected.
PLL Settings
PLL Model Phase Locked Loop (PLL) simulates the behavior of the specified hardware. PLL clock
recovery circuit is used to derive the clock signal.
There are two types of PLL.
■
Type 1
■
Type 2
NOTE. This is editable only when the manual mode is selected.
Damping Enter the damping value in the text field.
NOTE. This is editable only when the manual mode is selected.
Loop Bandwidth Enter the loop bandwidth value in the text field. The unit is MHz.
NOTE. This is editable only when the manual mode is selected.
28 TekExpress® Automotive PAM3 Analysis Application
Page 39

Operating basics
The following parameters are applicable for De-Embed filter setup:
Figure 13: DUT tab - De-Embed Filter for 100BASE-T1
TekExpress® Automotive PAM3 Analysis Application 29
Page 40

Operating basics
Figure 14: DUT tab - De-Embed Filter for 1000BASE-T1
30 TekExpress® Automotive PAM3 Analysis Application
Page 41

Operating basics
Table 10: DUT tab - De-Embed Filter
Setting Description
CTLE Settings
Design Continuous Time Linear Equalizer (CTLE) boosts high frequency component of signal.
CTLE is implemented using two design methods. Select the design from the drop-down
option.
■
2 Poles + 1 Zero
■
3 Poles + 2 Zeros
Create CTLE Click to generate CTLE filter files as per the selected design and load the generated filter
files automatically on the respective browse buttons.
A
DC
FZ1 (MHz) Enter the first zero frequency value in the text filed.
FZ2 (MHz) Enter the second zero frequency value in the text filed.
Enter the DC gain value in the text filed.
NOTE. This is enabled when design is selected with 3 poles and 2 zeros.
Fp1 (MHz) Enter the first pole frequency value in the text filed.
Fp2 (MHz) Enter the second pole frequency value in the text filed.
Fp3 (MHz) Enter the third pole frequency value in the text filed.
NOTE. This is enabled when design is selected with 3 poles and 2 zeros.
Apply Filters Select to apply filters to the signal.
Filter Selections(s)
Master/Slave Near End Filter File Browse and select the preferred Master/Slave near end filter file.
Master/Slave Far End Filter File Browse and select the preferred Master/Slave far end filter file.
Apply Inverse PR Shaping Filter Partial Response (PR) shaping is a filtering method. This is achieved by introducing a
known ISI (Inter symbol interference) and it is applied to PAM-X symbol bursts to lower the
Power Spectral Density (PSD).
Select to apply the inverse PR Shaping filter to the signal.
NOTE. This is applicable only when the suite selected is 1000BASE-T1.
Inverse PR Shaping
Coeff1 Enter the first coefficient of the PR Shaping filter in the text field.
NOTE. This is applicable only when the suite selected is 1000BASE-T1.
Coeff2 The Coeff2 value is automatically taken based on the given Coeff1 value.
Coeff2 = Coeff1-1
NOTE. This is applicable only when the suite selected is 1000BASE-T1.
TekExpress® Automotive PAM3 Analysis Application 31
Page 42

Operating basics
Setting Description
No Of Taps Enter the number of taps for the Inverse PR Shaping filter in the text filed.
NOTE. This is applicable only when the suite selected is 1000BASE-T1.
See also. Select tests
Select tests
Use the Test Selection tab to select the tests.
Figure 15: TekExpress Automotive PAM3 measurements
Table 11: Test Selection tab settings
Setting Description
Deselect All
Select All
Tests Click on a test to select or unselect. Highlight a
Test Description Shows brief description of the highlighted test in
Deselect or select all tests in the list.
test to show details in the Test Description pane.
the test tree.
See also. Set acquisition tab parameters
32 TekExpress® Automotive PAM3 Analysis Application
Page 43

Operating basics
Set acquisition tab
parameters
Use the Acquisitions tab to view the tests.
Figure 16: Acquisitions tab
Table 12: Acquisitions tab settings
Settings Description
View Probes Displays the detected probe configuration. Use
the View Probes dialog box to view the
connected probes.
The TekExpress Automotive PAM3 Analysis application saves all acquisition
waveforms to files by default. Waveforms are saved in a unique folder for each
session (a session is started when you click the Start button). The folder path is
X:\TekExpress Automotive PAM3 Analysis\Untitled Session\<dutid>
\<date>_<time>. Images created for each analysis, XML files with result values,
reports, and other information specific to the session are also saved in this folder.
Saving a session moves the session file contents from the Untitled Session folder
to the specified folder name, and changes the session name to the specified name.
Signal Separation files are stored at X:\Automotive PAM3 Analysis
\SignalSeparationWaveforms .
TekExpress® Automotive PAM3 Analysis Application 33
Page 44

Operating basics
Set configuration tab
parameters
Use the Configuration tab to view and configure the Global Settings and the
measurement configurations. The measurement specific configurations available
in this tab depend on the selections made in the Test Selection panel.
Table 13: Configuration tab: Common parameters
Setting Description
Limits Editor Displays the upper and lower limits for the applicable
measurement using different types of comparisons. When
running tests in User Defined Mode, you can edit the limit
settings in the Limits Editor.
Figure 17: Configuration tab: Global Settings
34 TekExpress® Automotive PAM3 Analysis Application
Page 45

Operating basics
Table 14: Configuration tab: Global settings
Setting Description
Global Settings
Instruments Detected Displays the instruments connected to this application. Click on
the instrument name to open a list of available (detected)
instruments.
Select Options > Instrument Control Settings and click
Refresh to update the instrument list.
NOTE. Verify that the LAN and GPIB search criteria (default
setting) in the Instrument Control Settings is selected when using
the TekExpress Automotive PAM3 Analysis application.
Apply Limits Select to add limits for the measurements on report.
Figure 18: Configuration tab: Measurements
TekExpress® Automotive PAM3 Analysis Application 35
Page 46

Operating basics
Table 15: Configuration tab: Measurements settings
Setting Description
Measurements Displays the measurements that are selected in the Test
Selection tab. The tests are grouped with unique acquisition type
names.
NOTE.
■
When a parent test group is selected and any change is
made, the change will be applied to all the tests.
■
Individual test configuration is possible by selecting the test
and making the required changes.
Analyze
Apply Mask Enable the check box to apply the selected mask file.
Master/Slave Near End Mask
File
Master/Slave Far End Mask File Browse and select the master or slave far end mask file.
Pattern Detection Select the pattern from the drop-down option.
Browse and select the master or slave near end mask file.
■
Auto
■
Manual
Target BER Enter the target BER value in the text field.
Levels Select the level from the drop-down option.
■
10%-90%
■
20%-80%
36 TekExpress® Automotive PAM3 Analysis Application
Page 47

Operating basics
Table 16: Configuration tab: Measurement specific configuration
Measurements Configuration Value
Eye
■
■
Eye Height
Eye Width
Analyze
■
Apply Mask
■
Master Near End Mask
File
■
Slave Near End Mask File
■
Master Far End Mask File
■
Slave Far End Mask File
Jitter
■
Random Jitter(DD)
■
Deterministic Jitter(DD)
Pattern Detection
■
Auto
■
Manual
Pattern Detection - ManualPattern Type
■
Repeating - Pattern Length
(UI) ranging from 2 to
100000
■
Arbitrary - Window Length
(UI) range from 2 to 24
Jitter: Total Jitter @ BER Pattern Detection
■
Auto
■
Manual
Pattern Detection - ManualPattern Type
■
Repeating - Pattern Length
(UI) ranging from 2 to
100000
■
Arbitrary - Window Length
(UI) range from 2 to 24
Target BER. Range is from 2 -
9.
Timing
■
■
Rise Time
Fall Time
Levels
■
■
20% - 80%
10% - 80%
TekExpress® Automotive PAM3 Analysis Application 37
Page 48

Operating basics
Set preferences tab
parameters
Use Preferences tab to set the application action on completion of a
measurement.
Figure 19: Preferences tab
Table 17: Preferences tab settings
Setting Description
Number of Runs
Acquire/Analyze each test <n> times Select to repeat the test run by setting the
number of times. The default value is 1.
Actions on Test Measurement Failure
On Test Failure, pause the test and let me
investigate
On Test Failure, stop and notify me of the failure Select to stop the test run on Test Failure, and
Popup Settings
Auto close Warnings and Informations during
Sequencing
Auto close after <n> Seconds
Select to pause the test run on Test Failure, for
further investigations. By default, it is
unselected.
to get notified via email. By default, it is
unselected.
Click Email Settings to configure.
NOTE. Ensure that the email settings are
configured correctly. If the settings are not done
correctly, the test will be stopped and no other
notifications will be sent.
Select to auto close warnings/informations
during sequencing. Set the Auto close time. By
default it is unselected.
Range is from 1-60.
38 TekExpress® Automotive PAM3 Analysis Application
Page 49

Status panel overview
Operating basics
Setting Description
Auto close Error Messages during Sequencing.
Show in Reports
Auto close after <n> Seconds
Logging options
Enable Logging Select to enable logging.
Select to auto close Error Messages during
Sequencing. Set the Auto close time. By default
it is unselected.
Range is from 1-60.
The Status panel accesses the Test Status and Log View tabs, which provide
status on test acquisition and analysis (Test Status) and a listing of test tasks
performed (Log View tab). The application opens the Test Status tab when you
start a test run. You can select the Test Status or the Log View tab to view these
items while tests are running.
Test Status: It displays the tests along with the Acquisition type, Acquire, and
Analysis status of the tests. In pre-recorded mode, Acquire status is not valid.
Log View: It displays the detailed execution status of the tests.
Figure 20: Test status view in the Status panel
TekExpress® Automotive PAM3 Analysis Application 39
Page 50

Operating basics
Figure 21: Log view in the Status panel
Table 18: Status panel settings
Control Description
Message History Lists all executed test operations and timestamp
information.
Auto Scroll Enables automatic scrolling of the log view as
information is added to the log during the test
execution.
Clear Log Clears all messages from the log view.
Save Saves the log file to a text file. Use the standard
Save File window to navigate to and specify the
folder and file name to which to save the log
text.
40 TekExpress® Automotive PAM3 Analysis Application
Page 51

Operating basics
Results panel
Results panel overview
See also
Application panel overview
When a test execution is complete, the application automatically opens the
Results panel to display a summary of test results.
Figure 22: Results panel
Each test result occupies a row in the Results table. By default, results are
displayed in summary format with the measurement details collapsed and with
the Pass/Fail column visible. The displayed results data can be modified in the
following ways:
■
To remove or restore the Pass/Fail column, select Preferences > Show Pass/
Fail.
■
To collapse all expanded tests, select Preferences > View Results
Summary.
■
To expand all tests listed, select View Results Details from the Preferences
menu in the upper right corner.
■
To enable or disable the wordwrap feature, select Preferences > Enable
Wordwrap.
■
To view the results grouped by lane or test, select the corresponding item
from the Preferences menu.
■
To expand the width of a column, place the cursor over the vertical line that
separates the column from the column to the right. When the cursor changes
TekExpress® Automotive PAM3 Analysis Application 41
Page 52

Operating basics
to a double-ended arrow, hold down the mouse button and drag the column to
the desired width.
■
To clear all test results displayed, click Clear.
See also. View a report
Application panel overview
Preferences menu
View test-related files
The Preferences menu is part of the Results panel display. Use the Preferences
menu to change how some items display in the Results panel.
■
To include pass/fail details info in the details table, select Show Pass/Fail.
■
To view the results summary, select View Results Summary.
■
To expand all tests listed, select View Results Details
■
To enable or disable the wordwrap feature, select Enable Wordwrap.
See also. Results panel overview
Files related to tests are stored in X:\My TekExpress\Automotive PAM3 Analysis
\Untitled session folder. Each test setup in this folder has both a test setup file and
a test setup folder, both with the test setup name.
The test setup file is preceded by the TekExpress icon and usually has no visible
file name extension.
Inside the test setup folder is another folder named for the DUT ID used in the
test sessions. The default is DUT001.
Inside the DUT001 folder are the session folders and files. Each session also has
a folder and file pair, both named for the test session using the naming
convention (date)_(time). Each session file is stored outside its matching session
folder:
Figure 23: Test-related files
Each session folder contains image files of any plots generated from running the
test session. If you selected to save all waveforms or ran tests using prerecorded
waveform files, these are included here.
42 TekExpress® Automotive PAM3 Analysis Application
Page 53

Reports panel
Operating basics
The first time you run a new, unsaved session, the session files are stored in the
Untitled Session folder located at X:\Automotive PAM3 Analysis. When you
name and save the session, the files are placed in a folder with the name that you
specify. A copy of the test files stay in the Untitled Session folder until you run a
new test or until you close the TekExpress Automotive PAM3 Analysis
application.
See also. File name extensions
Reports panel overview
Use the Reports panel to configure report generation settings parameters, view
the report, generate the report, browse for reports, name and save reports, select
test content to include in reports, and select report viewing options.
Figure 24: Reports panel
For information on setting up reports, see Select report options. For information
on viewing reports, see View a report.
See also. View a report
Application panels overview
TekExpress® Automotive PAM3 Analysis Application 43
Page 54

Operating basics
Select report options
Click the Reports panel and use the Reports panel controls to select which test
result information to include in the report, and the naming conventions to use for
the report. For example, always give the report a unique name or select to have
the same name increment each time you run a particular test.
Select report options before running a test or when creating and saving test
setups. Report settings are included in saved test setups.
In the Reports panel, select from the following report options:
Table 19: Report options
Setting Description
Report Update Mode
Generate new report Creates a new report. The report can be in either .mht or .pdf file formats.
Append with previous run session Appends the latest test results to the end of the current test results report.
Include header in appended reports Select to include header in appended reports
Replace current test results Replaces the previous test results with the latest test results. Results from newly added
tests are appended to the end of the report.
In previous run, current session Select to replace current test results in the report with the test result(s) of previous run in
the current session.
In any run, any session Select to replace current test results in the report with the test result(s) in the selected run
session’s report.
Report Creation Settings
Report name Displays the name and location at which to store PAM3 report. The default location is at
\My TekExpress\PAM3 Analysis\Untitled Session. The report file in this folder gets
overwritten each time you run a test unless you specify a unique name or select to auto
increment the report name.
Change the report name or location.
Do one of the following:
■
In the Report Path field, type over the current folder path and name.
■
Double-click in the Report Path field and then make selections from the popup
keyboard and click the Enter button.
Be sure to include the entire folder path, the file name, and the file extension. For example:
C:\Documents and Settings\your user name\My Documents\My TekExpress\Automotive
PAM3 Analysis\DUT001.mht.
NOTE. You cannot set the file location using the Browse button.
Open an existing report.
Click Browse, locate and select the report file and then click View at the bottom of the
panel.
44 TekExpress® Automotive PAM3 Analysis Application
Page 55

Operating basics
Setting Description
Save as type Saves a report in the specified file type, selected from the drop-down list. The report are
saved in .csv, .pdf or .mht.
NOTE. If you select a file type different from the default, be sure to change the report file
name extension in the Report Name field to match.
Auto increment report name if duplicate Sets the application to automatically increment the name of the report file if the application
finds a file with the same name as the one being generated. For example: DUT001,
DUT002, DUT003. This option is enabled by default.
Create report automatically at the end of the
run
Contents To Save
Include pass/fail info in details table Includes pass/fail info in the details table of the report.
Include detailed results Includes detailed results in the report.
Include plot images Includes the plot images in the report.
Include setup configuration Sets the application to include hardware and software information in the summary box at
Include complete application configuration Select to complete application configuration.
Include user comments Select to include any comments about the test that you or another user added in the DUT
Group Report By
Test Name Select to group the tests in the report by test name.
Test Point Select to group the tests in the report by the test point.
Signal Type Select to group the tests in the report by the signal type.
Eye Selection Select to group the tests in the report by sections of the eye-diagram.
Test Result Select to group the tests in the report by test results
View report after generating Automatically opens the report in a Web browser when the test completes. This option is
View Click to view the most current report.
Report Generates a new report based on the current analysis results.
Save As Specify a name for the report.
Creates report at the end of the run.
the top of the report. Information includes the oscilloscope model and serial number, the
oscilloscope firmware version, and software versions for applications used in the
measurements.
tab of the Setup panel. Comments appear in the Comments section, under the summary
box at the beginning of each report.
selected by default.
TekExpress® Automotive PAM3 Analysis Application 45
Page 56

Operating basics
View a report
Report content
The application automatically generates a report when test execution is complete
and displays the report in your default Web browser (unless you cleared the View
Report After Generating check box in the Reports panel before running the
test). If you cleared this check box, or to view a different test report, do the
following:
1. Click the Reports button.
2. Click the Browse button and locate and select the report file to view.
3. In the Reports panel, click View.
NOTE. The Iteration column will be displayed only when more than one test run is
selected.
For information on changing the file type, file name, and other report options, see
Select report options.
A report shows detailed results and plots, as set in the Reports panel.
46 TekExpress® Automotive PAM3 Analysis Application
Page 57

Operating basics
Setup configuration information
The summary box at the beginning of the report lists setup configuration
information. This information includes the oscilloscope model and serial number,
optical module model and serial number, and software version numbers of all
associated applications.
To exclude this information from a report, clear the Include Setup
Configuration check box in the Reports panel before running the test.
User comments
If you selected to include comments in the test report, any comments you added
in the DUT tab are shown at the top of the report.
TekExpress® Automotive PAM3 Analysis Application 47
Page 58

Operating basics
See also. Results panel overview
View test-related files
48 TekExpress® Automotive PAM3 Analysis Application
Page 59

Running tests
Equipment connection diagram
Figure 25: Test setup for 100BASE-T1 Full Duplex mode using both Master and Slave for
One Voltage and Two Current
TekExpress® Automotive PAM3 Analysis Application 49
Page 60
Running tests
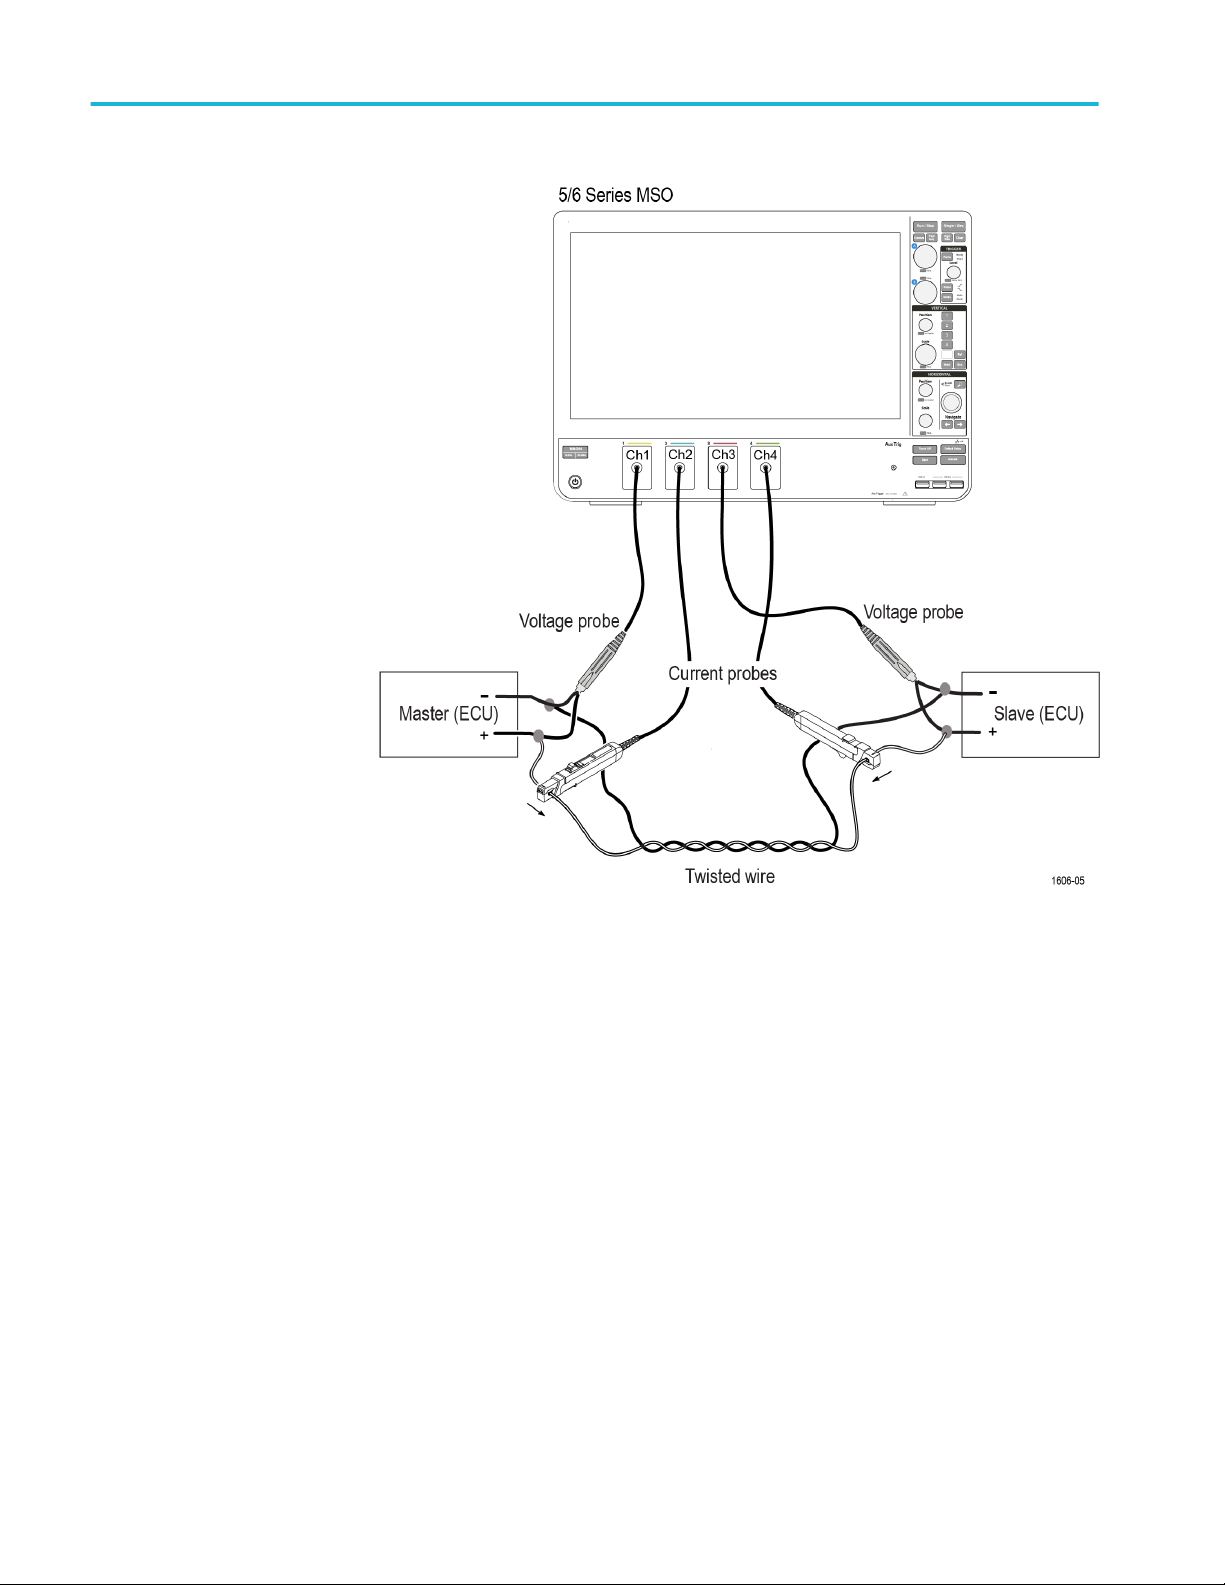
Figure 26: Test setup for 100BASE-T1 Full Duplex mode using both Master and Slave for
One Voltage and One Current
50 TekExpress® Automotive PAM3 Analysis Application
Page 61

Running tests
Figure 27: Test setup for 100BASE-T1 Full Duplex mode using Master for One Voltage and
Two Current
TekExpress® Automotive PAM3 Analysis Application 51
Page 62

Running tests
Figure 28: Test setup for 100BASE-T1 Full Duplex mode using Slave for One Voltage and
Two Current
52 TekExpress® Automotive PAM3 Analysis Application
Page 63

Running tests
Figure 29: Test setup for 100BASE-T1 Full Duplex mode using Master for One Voltage and
One Current
TekExpress® Automotive PAM3 Analysis Application 53
Page 64

Running tests
Figure 30: Test setup for 100BASE-T1 Full Duplex mode using Slave for One Voltage and
One Current
54 TekExpress® Automotive PAM3 Analysis Application
Page 65

Running tests
Figure 31: Test setup for 100BASE-T1 Half Duplex mode using Master for One Voltage
TekExpress® Automotive PAM3 Analysis Application 55
Page 66

Running tests
Figure 32: Test setup for 100BASE-T1 Half Duplex mode using Slave for One Voltage
56 TekExpress® Automotive PAM3 Analysis Application
Page 67
Running tests
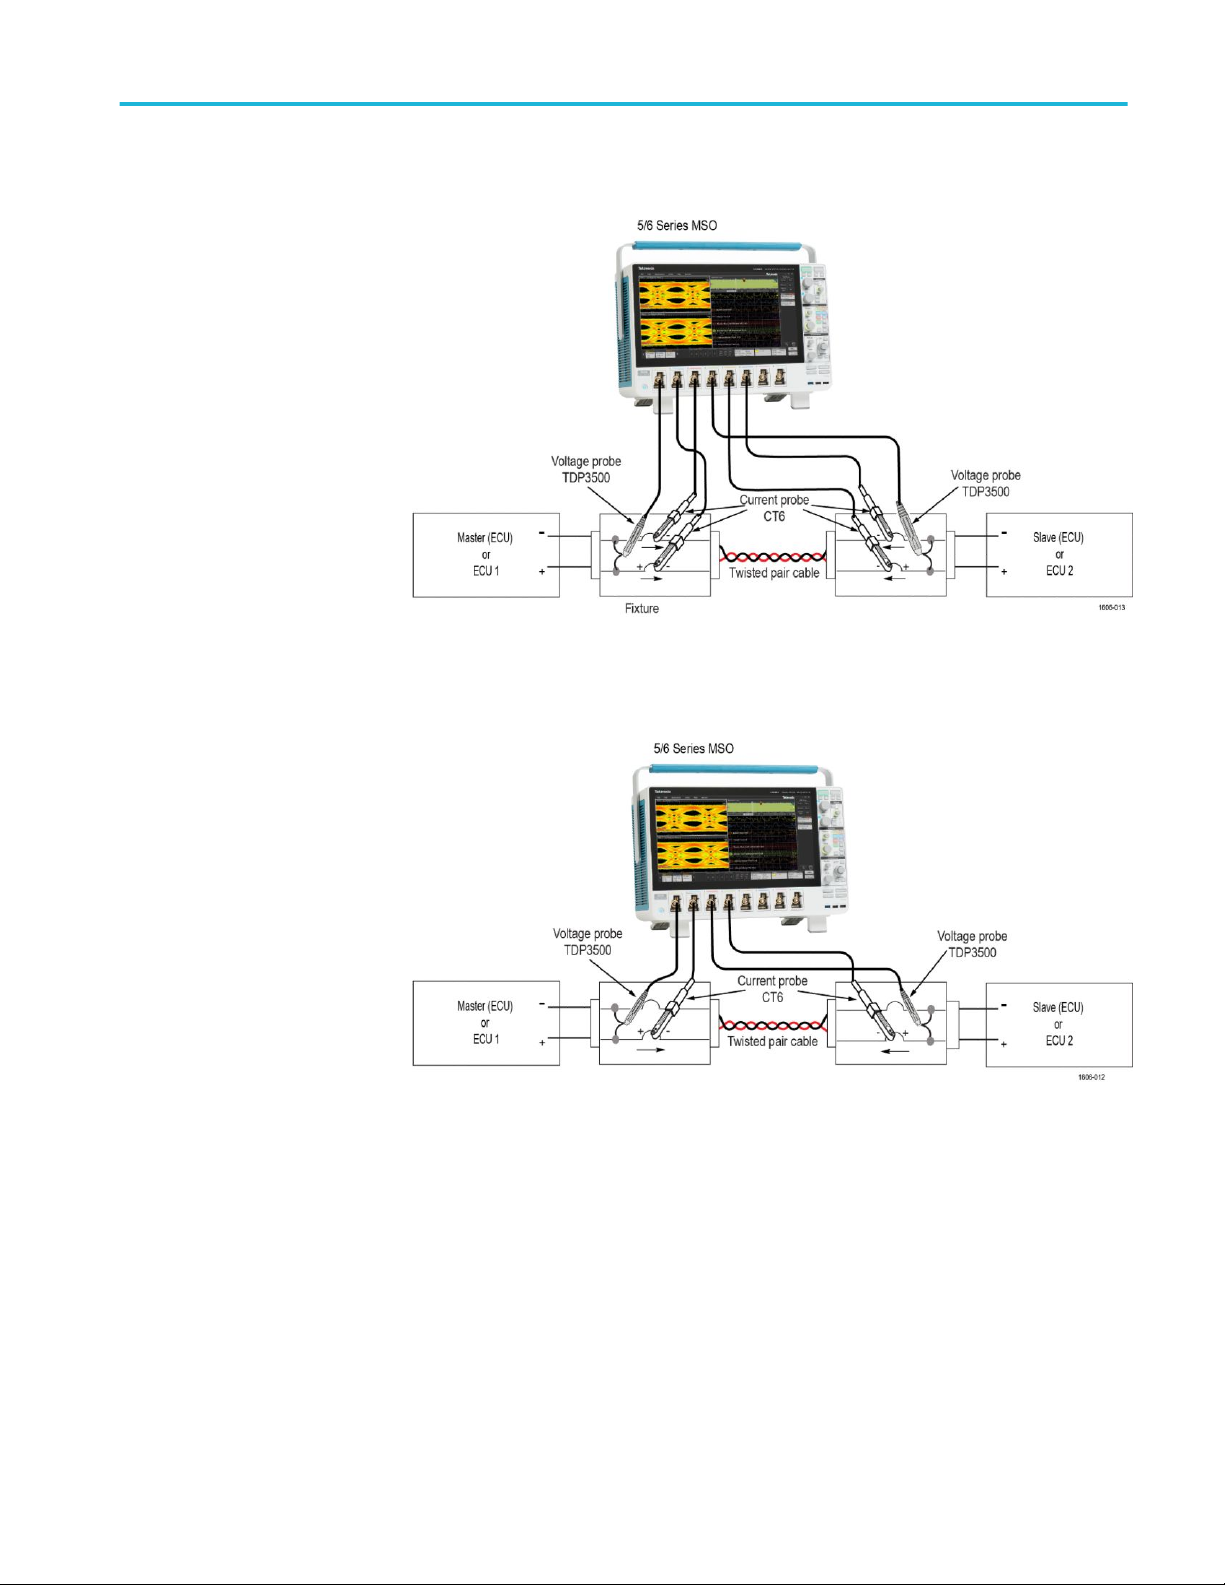
Figure 33: Test setup for 1000BASE-T1 Full Duplex mode using both Master and Slave for
One Voltage and Two Current
Figure 34: Test setup for 1000BASE-T1 Full Duplex mode using both Master and Slave for
One Voltage and One Current
TekExpress® Automotive PAM3 Analysis Application 57
Page 68

Running tests
Figure 35: Test setup for 1000BASE-T1 Full Duplex mode using Master for One Voltage and
Two Current
Figure 36: Test setup for 1000BASE-T1 Full Duplex mode using Slave for One Voltage and
Two Current
58 TekExpress® Automotive PAM3 Analysis Application
Page 69

Running tests
Figure 37: Test setup for 1000BASE-T1 Full Duplex mode using Master for One Voltage and
One Current
Figure 38: Test setup for 1000BASE-T1 Full Duplex mode using Slave for One Voltage and
One Current
TekExpress® Automotive PAM3 Analysis Application 59
Page 70

Running tests
Figure 39: Test setup for 1000BASE-T1 Half Duplex mode using Master for One Voltage
Figure 40: Test setup for 1000BASE-T1 Half Duplex mode using Slave for One Voltage
60 TekExpress® Automotive PAM3 Analysis Application
Page 71

Running tests
Compensate the signal path
Use the following procedure to compensate the internal signal acquisition path.
Perform this procedure if the ambient temperature has changed more than 5 °C
(9 °F) since you performed the last signal path compensation. Perform the signal
path compensation once a week. Failure to do so may result in the instrument not
meeting warranted performance levels.
1. Power on and wait for the instrument to complete its warm up period before
continuing with this procedure.
2. Disconnect any probes you have connected to the input channels.
3. Set the instrument to Menu mode.
4. Select Instrument Calibration from the Utilities menu.
5. Note any instructions that appear in the resulting control window.
6. Click Run SPC to begin the procedure. The procedure may take several
minutes to complete.
7. Verify that the Status changes to Compensated after the procedure is
complete. If the Calibration Status field indicates anything other than
Compensated, see Signal Path Compensation Status for information on the
readout and recommended action.
Running tests
NOTE. When making measurements at vertical scale settings less than or equal to
5 mV, you should perform the signal path compensation at least once a week.
Failure to do so may result in the instrument not meeting warranted performance
levels at those volts/div settings.
Use Set DUT parameters, select tests, set acquisition parameters, set
configuration parameters, set preferences parameters, and click Start to run the
tests. While tests are running, you cannot access the Setup or Reports panels. To
monitor the test progress, switch between the Status panel and the Results panel.
While tests are running, the other applications will be displayed at the
background. If you want the TekExpress Automotive PAM3 Analysis application
to run in the foreground select Keep On Top from the TekExpress Options
menu.
The application displays report when the tests execution is complete.
TekExpress® Automotive PAM3 Analysis Application 61
Page 72

Running tests
Prerun checklist
View test results
1. Make sure that the instruments are warmed up (approximately 20 minutes)
and stabilized.
2. Perform compensation: In the oscilloscope main menu, select Utilities >
Instrument Compensation. Click Help in the compensation window for
steps to perform instrument compensation.
When a test completes, the application switches to the Results panel, which
shows a summary of test results.
Each test result occupies a row in the Results table. By default, results are
displayed in summary format, with the measurement details collapsed. You can
change the view in the following ways:
■
To view the results grouped by lane, test, or data rate, select the
corresponding item from the Preferences menu.
■
To expand all tests listed, select View Results Details from the Preferences
menu.
■
To expand and collapse tests, use the plus and minus buttons to the left of the
test rows.
■
To collapse all expanded tests, select Preferences > View Results
Summary.
■
To enable or disable the wordwrap feature, select Preferences > Enable
Wordwrap.
■
To expand the width of a column, place the cursor over the vertical line that
separates the column from the one to the right. When the cursor changes to a
double-ended arrow, hold down the mouse button and drag the column to the
desired width.
■
To sort the test information by column, click the column head. When sorted
in ascending order, a small up arrow is displayed. When sorted in descending
order, a small down arrow is displayed.
■
To clear all test results displayed, click Clear ( ).
62 TekExpress® Automotive PAM3 Analysis Application
Page 73

Saving and recalling test setup
Test setup files overview
Saved test setup information (such as the selected oscilloscope, general
parameters, acquisition parameters, measurement limits, waveforms (if
applicable), and other configuration settings) are saved under the setup name at
X:\TekExpress Automotive PAM3 Analysis.
Use test setups to:
■
Run a new session, tp acquire live waveforms using a saved test
configuration.
■
Create a new test setup using an existing one.
■
View all the information associated with a saved test, including the log file,
the history of the test status as it executed, and the results summary.
■
Run a saved test using saved waveforms.
See also
Save a test setup
Save a test setup
Open (load) a saved test setup
You can save a test setup before or after running a test. You can create a test
setup from already created test setup, or using default test setup. When you
select the default test setup, the parameters are set to the application’s default
value.
Select Options > Save Test Setup to save the opened setup.
Select Options > Save Test Setup As to save the setup with different name.
TekExpress® Automotive PAM3 Analysis Application 63
Page 74

Saving and recalling test setup
Open load a saved test setup
To Open (load) a saved test setup, do the following:
1. Select Options > Open Test Setup.
2. Select the setup from the list and click Open. Setup files are located at X:
\TekExpress Automotive PAM3 Analysis.
See also
About test setups
Create a test setup using an existing one
Create a test setup from default settings
Create a test setup from default settings
To create a test setup using default settings, follow the steps:
1. Select Options > Default Test Setup. For default test setup, the parameters
are set to the application’s default value.
2. Click application Setup and set the parameters
3. Click application Reports and set the report options
4. Optional: Click Start to run the test and verify that it runs correctly and
captures the specified test information and reports. If it does not, then edit the
parameters and repeat this step until the test runs to your satisfaction
5. Select Options > Save Test Setup. Enter the file name and click Save. The
application saves the file to X:\Automotive PAM3 Analysis\<session_name>
Create a test setup using an existing one
To create a test setup using an existing one, follow the steps:
1. Select Options > Open Test Setup
2. Select a setup from the list and then click Open
3. Click application setup and modify the parameters
4. Click application reports and modify the report options
5. Select Options > Save Test Setup As
6. Enter test setup name and click Save.
64 TekExpress® Automotive PAM3 Analysis Application
Page 75

SCPI commands
About SCPI command
You can use Standard Commands for Programmable Instruments (SCPI) to
communicate with the TekExpress application.
Socket configuration for SCPI commands
This section describes the steps for TCPIP socket configuration and TekVISA
configuration to execute the SCPI commands.
TCPIP socket
configuration
1. Click Start > Control Panel > System and Security > Windows Firewall >
Advanced settings.
TekExpress® Automotive PAM3 Analysis Application 65
Page 76

SCPI commands
2. In Windows Firewall with Advanced Security menu, select Windows
Firewall with Advanced Security on Local Computer > Inbound Rules
and click New Rule…
3. In New Inbound Rule Wizard menu
a. Select Port and click Next.
66 TekExpress® Automotive PAM3 Analysis Application
Page 77

b. Select TCP as rule apply and enter 5000 for Specific local ports and
click Next.
SCPI commands
c. Select Allow the connection and click Next.
TekExpress® Automotive PAM3 Analysis Application 67
Page 78

SCPI commands
d. Select Domain, Private, Public and click Next.
e. Enter Name, Description (optional), and click Finish.
68 TekExpress® Automotive PAM3 Analysis Application
Page 79

SCPI commands
4. Check whether the Rule name is displayed in Windows Firewall with
Advanced Security menu > Inbound Rules.
TekExpress® Automotive PAM3 Analysis Application 69
Page 80
SCPI commands
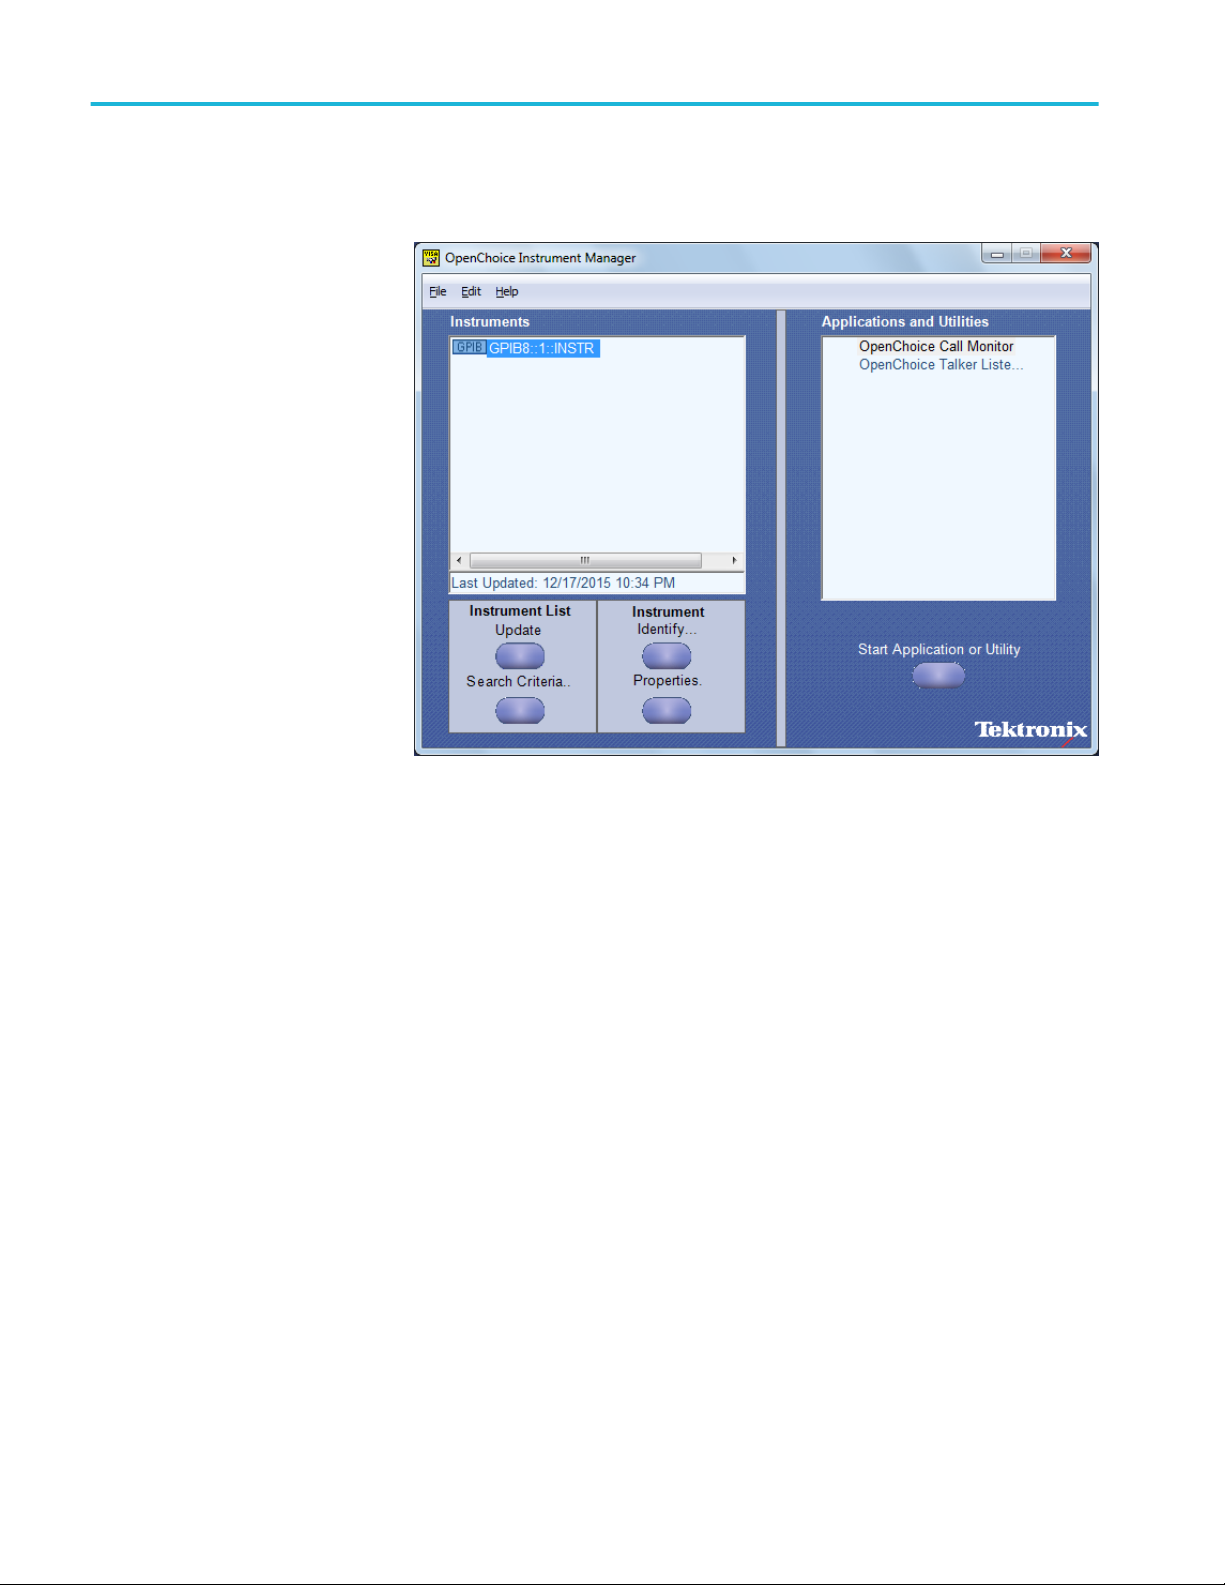
TekVISA configuration
1. Click Start > All Programs > TekVISA > OpenChoice Instrument
Manager.
70 TekExpress® Automotive PAM3 Analysis Application
Page 81

SCPI commands
2. Click Search Criteria. In Search Criteria menu, click LAN to Turn-on.
Select Socket from the drop-down list, enter the IP address of the
TekExpress device in Hostname and type Port as 5000. Click
configure the IP address with Port.
Enter the Hostname as 127.0.0.1 if the TekVISA and TekExpress application
are in the same system, else enter the IP address of the TekExpress
application system.
to
TekExpress® Automotive PAM3 Analysis Application 71
Page 82

SCPI commands
3. Click Search to setup the TCPIP connection with the host. Check whether
the TCPIP host name is displayed in OpenChoice Instrument Manager >
Instruments.
4. Double-click OpenChoice Talker Listener and enter the Command *IDN?
in command entry field and click Query. Check that the Operation is
successful and Talker Listener Readout displays the Command / Data.
72 TekExpress® Automotive PAM3 Analysis Application
Page 83

SCPI commands
TEKEXP:*IDN?
This command queries the active TekExpress application name running on the
oscilloscope.
Outputs
TEKEXP:*OPC?
Outputs
Syntax
Inputs
Syntax
Inputs
TEKEXP:*IDN?\n
NA
Returns active TekExpress application name running on the oscilloscope.
This command queries the execution status of the last executed command.
TEKEXP:*OPC?\n
NA
0 - last command execution is not complete
1 - last command execution is complete
TekExpress® Automotive PAM3 Analysis Application 73
Page 84

SCPI commands
TEKEXP:ACQUIRE_MODE
This command sets the acquire mode as live or pre-recorded.
Syntax
Inputs
Outputs
TEKEXP:ACQUIRE_MODE {LIVE | PRE-RECORDED}\n
{LIVE | PRE-RECORDED}
NA
TEKEXP:ACQUIRE_MODE?
This command queries the acquire mode type.
Syntax
Inputs
Outputs
TEKEXP:ACQUIRE_MODE?\n
NA
{LIVE | PRE-RECORDED}
74 TekExpress® Automotive PAM3 Analysis Application
Page 85

SCPI commands
TEKEXP:EXPORT
This command returns all the bytes of data to the specified file.
Syntax Outputs
TEKEXP:EXPORT REPORT\n Returns the report file in bytes
TEKEXP:EXPORT WFM,"<FileName>"\n Returns the specified waveform file in bytes
TEKEXP:EXPORT IMAGE,"<FileName>"\n Returns the specified image file in bytes
TEKEXP:INFO?
Inputs
FileName - Specifies the file name
This command queries the information about the file(s).
Syntax Outputs
TEKEXP:INFO?
REPORT\n
TEKEXP:INFO? WFM\n<WfmFile1Size>,"<WfmFileName1.wfm>";<WfmFile2Size>,"<WfmFileNa
TEKEXP:INFO?
IMAGE\n
<ReportFileSize>,"<ReportFileName.mht>"
me2.wfm>";...
<Image1FileSize>,"<Image1FileName>";<Image2FileSize>,"<Image2File
Name>" ;...
TekExpress® Automotive PAM3 Analysis Application 75
Page 86

SCPI commands
TEKEXP:INSTRUMENT
This command sets the value for the selected instrument type.
Syntax
Inputs
Outputs
TEKEXP:INSTRUMENT?
Syntax
TEKEXP:INSTRUMENT "<InstrumentType>",<Value>"\n
InstrumentType
Value
TIP. Check Command parameters list section for InstrumentType and Value
parameters.
NA
This command queries the instrument selected for the specified instrument type.
TEKEXP:INSTRUMENT? "<InstrumentType>"\n
Inputs
Outputs
InstrumentType
TIP. Check Command parameters list section for InstrumentType parameters.
Returns the instrument selected for the specified instrument type
76 TekExpress® Automotive PAM3 Analysis Application
Page 87

SCPI commands
TEKEXP:LASTERROR?
This command queries the last error string occurred for the current TCP session.
If there are no errors since startup, or since the last call to
TEKEXP:LASTERROR?\n, this command returns an empty string.
TEKEXP:LIST?
Syntax
Inputs
Outputs
TEKEXP:LASTERROR?\n
NA
<string>
This command queries the list of available device, suite, test, version or
instrument.
Syntax Outputs
TEKEXP:LIST? DEVICE\n Returns the list of available device(s) as comma
separated values.
TEKEXP:LIST? SUITE\n Returns the list of available suite(s) as comma
separated values.
TEKEXP:LIST? TEST\n Returns the list of available test(s) as comma
separated values.
TEKEXP:LIST? VERSION\n Returns the list of available version(s) as comma
separated values.
TEKEXP:LIST?
INSTRUMENT,"<InstrumentType>"\n
Returns the list of available instruments' for the
given Instrument type as comma separated
values.
NOTE. This command returns the list of items within double quotes (""). Iterate
the receive procedure until the list ends with double quotes otherwise the next
query commands won’t work as expected.
TekExpress® Automotive PAM3 Analysis Application 77
Page 88

SCPI commands
TEKEXP:POPUP
Syntax
Outputs
Inputs
Inputs
InstrumentType
TIP. Check Command parameters list section for InstrumentType parameters.
This command sets the response to the active popup shown in the application.
TEKEXP:POPUP “<PopupResponse>”\n
PopupResponse
NA
TEKEXP:POPUP?
Syntax
Inputs
Outputs
This command queries the active popup information shown in the application.
TEKEXP:POPUP?\n
NA
Returns the active popup information in the application.
78 TekExpress® Automotive PAM3 Analysis Application
Page 89

SCPI commands
TEKEXP:REPORT
This command generates the report for the current session.
Syntax
Inputs
Outputs
TEKEXP:REPORT?
Syntax
Inputs
TEKEXP:REPORT GENERATE\n
GENERATE
NA
This command queries the queried header field value in the report.
TEKEXP:REPORT? “<HeaderField>”\n
HeaderField - Specifies to return the measured value for the indicated test.
TIP. Check Report for HeaderField parameters.
Outputs
Returns the queried header field value in the report
TekExpress® Automotive PAM3 Analysis Application 79
Page 90

SCPI commands
TEKEXP:RESULT?
This command queries the result available in report summary/details table.
Syntax Outputs
TEKEXP:RESULT? "<TestName>"\n Return Pass/Fail status of the test.
TEKEXP:RESULT?
"<TestName>","<ColumnName>"\n
TEKEXP:RESULT?
"<TestName>","<ColumnName>",<RowNumber
>\n
Returns all the row values of the specified
column for the test.
Returns the column value for the specified row
number
1
Inputs
TestName - Specifies the name of the test for which to obtain the test result
value.
ColumnName - Specifies the column name for the measurement
RowNumber - Specifies the row number of the measurement
TIP. Check Results panel for TestName, ColumnName, and RowNumber
parameters.
1
Row number starts from zero.
80 TekExpress® Automotive PAM3 Analysis Application
Page 91

SCPI commands
TEKEXP:SELECT
This command selects the device, suite, version, or test.
Syntax
Inputs
Outputs
TEKEXP:SELECT?
TEKEXP:SELECT <string1>,<string2>,<string4>\n
TEKEXP:SELECT TEST,<string3>,<string4>\n
<string1> = {DEVICE | SUITE | VERSION}
<string2> = {DeviceName | SuiteName | VersionName}
<string3> = {“<TestName>"| ALL| REQUIRED }
<string4> = {TRUE | FALSE}
TIP. Check Command parameters list section for DeviceName, SuiteName,
VersionName, and TestName parameters.
NA
This command queries the name of the selected device, suite, version, or test.
Syntax
Inputs
TEKEXP:SELECT? {DEVICE | SUITE | TEST | VERSION}\n
{DEVICE | SUITE | TEST | VERSION}
TekExpress® Automotive PAM3 Analysis Application 81
Page 92

SCPI commands
Outputs
TEKEXP:SETUP
TEKEXP:STATE
Inputs
Returns the name of the selected device, suite, version, or test.
This command sets the value of the current setup.
Syntax Outputs
TEKEXP:SETUP DEFAULT\n Restore to default Setup
TEKEXP:SETUP OPEN,"<SessionName>"\n Open the session
TEKEXP:SETUP SAVE\n Saves the already existing modified session
TEKEXP:SETUP SAVE,"<SessionName>"\n Save the session
SessionName - The name of the session
This command sets the execution state of the application.
Syntax
Inputs
Outputs
TEKEXP:STATE {RUN | STOP | PAUSE | RESUME}\n
{RUN | STOP | PAUSE | RESUME}
NA
82 TekExpress® Automotive PAM3 Analysis Application
Page 93

SCPI commands
TEKEXP:STATE?
This command queries the current setup state.
Syntax Outputs
TEKEXP:STATE? RUNNING | PAUSED | WAIT | ERROR | READY
TEKEXP:STATE? SETUP SAVED | NOT_SAVED
TEKEXP:VALUE
This command sets the value of parameters of type General, Acquire, Analyze, or
DUTID.
Syntax
Inputs
TEKEXP:VALUE GENERAL,"<ParameterName>",“<Value>”\n
TEKEXP:VALUE ACQUIRE,“<TestName>","<AcquireType>",
"<ParameterName>",“<Value>”\n
TEKEXP:VALUE ANALYZE,“<TestName>","<ParameterName>".“<Value>”
\n
TEKEXP:VALUE DUTID,“<Value>”\n
TEKEXP:VALUE VERBOSE,{TRUE | FALSE}\n
TEKEXP:VALUE
WFMFILE,<Test_Name>,<Aquire_Type>,<FilesName1$FileName2>\n
ParameterName - Specifies the parameter name
TestName - Specifies the test name
AcquireType - Specifies the acquire type
Value - Specifes the value to set
FilesName1$FileName2 - Specifies the waveform file name
TRUE - Pop-ups are enabled
FALSE - Pop-ups are disabled
TIP. Check Command parameters list section for ParameterName, AcquireType,
and Value parameters.
TekExpress® Automotive PAM3 Analysis Application 83
Page 94

SCPI commands
Outputs
TEKEXP:VALUE?
NA
This command queries the value of the parameter for type General, Acquire,
Analyze, or DUTID.
Syntax Outputs
TEKEXP:VALUE?
GENERAL,"<ParameterName>"\n
TEKEXP:VALUE? ACQUIRE,“<TestName>",
"<AcquireType>","<ParameterName>"\n
TEKEXP:VALUE? ANALYZE,
“<TestName>","<ParameterName>"\n
TEKEXP:VALUE? DUTID\n Returns the DUTID value
TEKEXP:VALUE?
WFMFILE,<Test_Name>,<Aquire_Type>\n
TEKEXP:VALUE? VERBOSE Returns the verbose mode type
Returns the value of Parameter for type
GENERAL
Returns the value of Parameter for type
ACQUIRE
Returns the value of Parameter for type
ANALYZE
Returns the waveform file name
Inputs
Outputs
ParameterName - Specifies the parameter name
TestName - Specifies the test name
AcquireType - Specifies the acquire type
TRUE - Pop-ups are enabled
FALSE - Pop-ups are disabled
TIP. Check Command parameters list section for ParameterName and
AcquireType parameters.
Returns the value of Parameter for type GENERAL | ACQUIRE | ANALYZE |
DUTID.
84 TekExpress® Automotive PAM3 Analysis Application
Page 95

SCPI commands
Command parameters list
This section provides the parameters list for the SCPI commands.
Table 20: ParameterName and Value for DUT tab
Parameters Description Default value
DUT ID Specifies the value parameters
For DUTID, valid value is: Comment
Acquiremode Specifies the acquire mode parameters
■
Acquire live waveforms
■
Use pre-recorded waveform files
NA
Acquire live waveforms
Suite
Signal Debug Mode
Communication Mode
Test Point
Probes Configuration
Master Source Selection
■
100BASE-T1
■
1000BASE-T1
■
True
■
False
Enables Ref and Math.
Range for Ref: Ref1 to Ref6
Range for Math: Math1 to Math6
■
Full Duplex
■
Half Duplex
■
Master
■
Slave
■
Both
■
One voltage and one current
■
One voltage and two current
100BASE-T1
True
Full Duplex
Master
One voltage and one current
NOTE. Number of channels will be varied based on the oscilloscope model used. For example, MSO54/64 (4 channels), MSO56
(6 channels) or MSO58 (8 channels).
Voltage CH1-CH4 CH1
Current 1 CH1-CH4 CH2
Current 2 CH1-CH4 CH3
Slave Source Selection
Voltage CH1-CH4 CH1
Current 1 CH1-CH4 CH2
Current 2 CH1-CH4 CH3
TekExpress® Automotive PAM3 Analysis Application 85
Page 96

SCPI commands
Parameters Description Default value
Sample Rate 100BASE-T1
■
.625
■
1.5625
■
3.125
■
6.25
■
12.5
■
25
■
50
1000BASE-T1
■
1.5625
■
3.125
■
6.25
■
12.5
3.125 GS/s
■
25
■
50
Record Length 1 M to 20 M 1 M
Ref Resistance 1 Ohm to 200 Ohms 100 Ohms
Current Loop
■
1
■
2
■
3
■
4
1
Search Time 1 ns to 1000 ns 32 ns
Schematic Displays the schematic as per the
NA
communication mode, test point, and the
configured probes.
Signal Separation Signal Separation will be enabled based on
NA
the license. Signal debug mode enables Ref
and Math.
86 TekExpress® Automotive PAM3 Analysis Application
Page 97

SCPI commands
Table 21: ParameterName and Value for DUT tab-Signal Corrections
Parameter Description Default value
Probe settings 100BASE-T1 voltage probe
■
TDP1500
■
TDP3500
100BASE-T1 current probe
■
TCP0030A
■
P6022
■
CT6
1000BASE-T1 voltage probe
■
TDP3500
1000BASE-T1 current probe
■
CT6
■
For 100BASE-T1 voltage probe TDP1500
■
For 100BASE-T1 current probe TCP0030A
■
For 1000BASE-T1 voltage probe TDP3500
■
For 1000BASE-T1 current probe - CT6
Apply Skew Settings
Master Skew Configuration
■
Voltage
■
Current 1
■
Current 2
Slave Skew Configuration
■
Voltage
■
Current 1
■
Current 2
■
True
■
False
Range from -125 to +125 ns
True
■
100BASE-T1
■
■
■
■
1000BASE-T1
For TCP0030A:
■
Voltage - 0 ns
■
Current1 - 9.2 ns
■
Current2 - 9.2 ns
For P6022:
■
Voltage - 0 ns
■
Current1 - 5.2 ns
■
Current2 - 5.2 ns
For CT6:
■
Voltage - 0 ns
■
Current1 - 0 ns
■
Current2 - 0 ns
■
Voltage - 0 ns
■
Current1 - 0 ns
■
Current2 - 0 ns
Apply Attenuation Settings
■
True
■
False
False
TekExpress® Automotive PAM3 Analysis Application 87
Page 98

SCPI commands
Parameter Description Default value
Master Attenuation Settings
■
Voltage
■
Current 1
■
Current 2
Range from -200 dB to +200 dB 0
Slave Attenuation Settings
■
Voltage
■
Current 1
■
Current 2
Range from -200 dB to +200 dB 0
Ratio Range from 1 to 10 1
Apply Signal Correction
■
True
■
False
False
Table 22: ParameterName and Value for DUT tab-Clock Recovery and Filter Setup
Parameter Description Default value
Baud Mode
Manual
■
Baud Rate
■
Percentage of Deviation
■
Auto
■
Manual
■
Baud Rate - 6.66 M Baud/s to 666.66 M
Baud/s
■
Percentage of Deviation - 1 to 30
Auto
For 100BASE-T1:
■
Baud rate - 66.66M Baud/s
■
Percentage of Deviation - 5
For 1000BASE-T1:
■
Baud rate - 750 M Baud/s
■
Percentage of Deviation - 5
PLL Model
Type2
■
Damping
■
Loop Bandwidth
CTLE Design
A
DC
■
Type1
■
Type2
■
Damping - Range 0.45 to 2
■
Loop Bandwidth - Range 0.1 to 30 MHz
■
2 Poles + 1 Zero
■
3 Poles + 2 Zeros
Range from 0.01 to 1 1
Type1
■
Damping - 0.707
■
Loop Bandwidth - 1 MHz
2 Poles + 1 Zero
88 TekExpress® Automotive PAM3 Analysis Application
Page 99

SCPI commands
Parameter Description Default value
FZ1 (MHz) Range from 0.01 to 3000 For 100BASE-T1:
■
FZ1 (MHz) - 33.33 MHz
For 1000BASE-T1:
■
FZ1 (MHz) - 375 MHz
FZ2 (MHz) Range from 0.01 to 3000 For 100BASE-T1:
■
FZ1 (MHz) - 46.662 MHz
For 1000BASE-T1:
■
FZ1 (MHz) - 525 MHz
Fp1 (MHz) Range from 0.01 to 3000 For 100BASE-T1:
■
FZ1 (MHz) - 133.32 MHz
For 1000BASE-T1:
■
FZ1 (MHz) - 1500 MHz
Fp2 (MHz) Range from 0.01 to 3000 For 100BASE-T1:
■
FZ1 (MHz) - 199.98 MHz
For 1000BASE-T1:
■
FZ1 (MHz) - 2250 MHz
Fp3 (MHz) Range from 0.01 to 3000 For 100BASE-T1:
■
FZ1 (MHz) - 46.662 MHz
For 1000BASE-T1:
■
FZ1 (MHz) - 525 MHz
Apply Filters
■
True
■
False
Master/Slave Near End Filter File X:\ Automotive PAM3 Analysis\Filter Files
False
None
\CTLE
Master/Slave Far End Filter File X:\ Automotive PAM3 Analysis\Filter Files
None
\CTLE
Apply Inverse PR Shaping Filter
■
True
■
False
True
Coeff1 Range from 0.01 to 0.99 0.65
Coeff2 Coeff2 value is automatically taken based on the coeff1 value.
No Of Taps Range from 3 to 18 12
TekExpress® Automotive PAM3 Analysis Application 89
Page 100

SCPI commands
Table 23: ParameterName and Value for Preferences tab
Parameters Description Default value
Number of Runs 1 to 1000 1
Acquire /Analyze each test True or False True
On Test Failure pause the test and let me
investigate
On Test Failure stop and notify me of the
failure
Popup Settings
Enable Logging True or False True
True or False False
True or False False
■
Auto Close Warnings and Informations
False
during Sequencing. Auto Close after
(1 to 60) seconds
■
Auto Close Error Message during
Sequencing Show in Reports. Auto
Close after (1 to 60) seconds
■
Show Messages with a beep sound
Table 24: ParameterName and Value for Analyze
Test Name Acquisition Type Parameter Name Values Default value
Eye
■
Eye Height
■
Eye Width
Jitter
■
Random Jitter (DD)
■
Deterministic Jitter
(DD)
Jitter
■
Total Jitter @ BER
PAM3 Signals Apply Mask True or False False
Master Near End Mask
None
File
Master Far End Mask File
Slave Near End Mask File
Slave Far End Mask File
PAM3 Signals Pattern Detection
Pattern Detection>Manual
Pattern Type->Repeating Pattern Length (UI)
■
Auto
■
Manual
Pattern Type
■
Repeating
■
Arbitrary
Auto
Repeating
2
ranging from 2 to 100000
Pattern Type->Arbitrary Window Length (UI) range
10
from 2 to 24
PAM3 Signals Pattern Detection
■
■
Auto
Manual
Auto
90 TekExpress® Automotive PAM3 Analysis Application
 Loading...