

TekExpress 400G-TXE Electrical Compliance Solution for Real Time Oscilloscopes
Table of contents
 Loading...
Tektronix TekExpress 400G-TXE Electrical Compliance Solution for Real Time Oscilloscopes User manual

TekExpress® 400G-TXE
Electrical Compliance Solution for Real Time Oscilloscopes
Printable Application Help
*P077136602*
077-1366-02


TekExpress® 400G-TXE
Electrical Compliance Solution for Real Time Oscilloscopes
Printable Application Help
www.tek.com
077-1366-02

Copyright © Tektronix. All rights reserved. Licensed software products are owned by Tektronix or its subsidiaries
or suppliers, and are protected by national copyright laws and international treaty provisions. Tektronix products
are covered by U.S. and foreign patents, issued and pending. Information in this publication supersedes that in all
previously published material. Specifications and price change privileges reserved.
TEKTRONIX and TEK are registered trademarks of Tektronix, Inc.
Contacting Tektronix
Tektronix, Inc.
14150 SW Karl Braun Drive
P.O. Box 500
Beaverton, OR 97077
USA
For product information, sales, service, and technical support:
■
In North America, call 1-800-833-9200.
■
Worldwide, visit www.tek.com to find contacts in your area.

Table of Contents
Welcome .............................................................................................................................................. v
Getting help and support
Conventions .................................................................................................................................... 1
Related documentation ................................................................................................................... 2
Technical support ........................................................................................................................... 3
Getting started
Minimum system requirements ...................................................................................................... 5
Instruments and accessories required ............................................................................................. 6
Downloading and installing the software ....................................................................................... 7
View software version .................................................................................................................... 7
Application directories ................................................................................................................... 8
File name extensions ...................................................................................................................... 9
Operating basics
Launch the application .................................................................................................................. 11
Application panels overview ........................................................................................................ 12
Global application controls ........................................................................................................... 14
Application controls ................................................................................................................ 14
Options menu overview ........................................................................................................... 16
TekExpress instrument control settings .................................................................................. 17
View connected instruments ................................................................................................... 18
Configure email settings .......................................................................................................... 19
Setup panel ................................................................................................................................... 20
Setup panel overview .............................................................................................................. 20
Set DUT parameters ................................................................................................................ 21
Select tests ............................................................................................................................... 22
Set acquisition tab parameters ................................................................................................. 24
Set configuration tab parameters ............................................................................................. 25
Set preferences tab parameters ................................................................................................ 28
Status panel ................................................................................................................................... 29
Status panel overview .............................................................................................................. 29
Results panel ................................................................................................................................. 30
Results panel overview ............................................................................................................ 30
TekExpress® 400G-TXE Printable Application Help i

Table of Contents
View test-related files .............................................................................................................. 31
Reports panel ................................................................................................................................ 32
Reports panel overview ........................................................................................................... 32
Select report options ................................................................................................................ 32
View a report ........................................................................................................................... 35
Report contents ........................................................................................................................ 35
Running tests
Equipment connection setup ......................................................................................................... 37
Prerequisite ................................................................................................................................... 40
Compensate the signal path ..................................................................................................... 40
Deskew .................................................................................................................................... 40
Running tests ................................................................................................................................ 42
400G-TXE compliance measurements
DC common mode output voltage ................................................................................................ 43
AC Common Mode Output Voltage ............................................................................................. 44
Single-ended output voltage ......................................................................................................... 45
Diff peak to peak output voltage Tx enabled ............................................................................... 46
Diff peak to peak output voltage Tx disabled ............................................................................... 47
Transition time .............................................................................................................................. 48
Eye width, eye height, eye linearity, and eye symmetry mask width ........................................... 49
Signal-to-noise and distortion ratio .............................................................................................. 52
Pre-cursor and post-cursor equalization ratio ............................................................................... 54
Coefficient range (OIF) ................................................................................................................ 56
Coefficient range (IEEE) .............................................................................................................. 57
Far end pre-cursor ISI ratio .......................................................................................................... 58
Transmitter output residual ISI ..................................................................................................... 59
Normalized coefficients step size ................................................................................................. 60
Coefficient initialization ............................................................................................................... 62
Signaling rate ................................................................................................................................ 63
Level separation mismatch ratio ................................................................................................... 64
Linear fit pulse peak ..................................................................................................................... 65
Steady state voltage ...................................................................................................................... 66
Even odd jitter .............................................................................................................................. 67
Uncorrelated bounded high probability jitter & Uncorrelated unbounded gaussian jitter ........... 68
Uncorrelated jitter RMS and uncorrelated J4 jitter ...................................................................... 69
ii TekExpress® 400G-TXE Printable Application Help

SCPI commands
About SCPI command .................................................................................................................. 71
Socket configuration for SCPI commands ................................................................................... 71
TEKEXP:*IDN? ........................................................................................................................... 79
TEKEXP:*OPC? .......................................................................................................................... 79
TEKEXP:ACQUIRE_MODE ...................................................................................................... 80
TEKEXP:ACQUIRE_MODE? .................................................................................................... 80
TEKEXP:EXPORT ...................................................................................................................... 81
TEKEXP:INFO? ........................................................................................................................... 81
TEKEXP:INSTRUMENT ............................................................................................................ 82
TEKEXP:INSTRUMENT? .......................................................................................................... 82
TEKEXP:LASTERROR? ............................................................................................................. 83
TEKEXP:LIST? ............................................................................................................................ 83
TEKEXP:MODE .......................................................................................................................... 84
TEKEXP:MODE? ........................................................................................................................ 85
TEKEXP:POPUP ......................................................................................................................... 85
TEKEXP:POPUP? ........................................................................................................................ 86
TEKEXP:REPORT ...................................................................................................................... 86
TEKEXP:REPORT? ..................................................................................................................... 87
TEKEXP:RESULT? ..................................................................................................................... 87
TEKEXP:SELECT ....................................................................................................................... 88
TEKEXP:SELECT? ..................................................................................................................... 89
TEKEXP:SETUP .......................................................................................................................... 89
TEKEXP:STATE ......................................................................................................................... 90
TEKEXP:STATE? ........................................................................................................................ 90
TEKEXP:VALUE ........................................................................................................................ 91
TEKEXP:VALUE? ...................................................................................................................... 92
Command parameters list ............................................................................................................. 93
Examples ................................................................................................................................... 104
Table of Contents
References
Parameters .................................................................................................................................. 107
About application parameters ................................................................................................ 107
Setup panel configuration parameters ................................................................................... 107
Reports panel parameters ...................................................................................................... 117
TekExpress® 400G-TXE Printable Application Help iii

Table of Contents
iv TekExpress® 400G-TXE Printable Application Help

Welcome
Welcome to Tektronix Real Time Oscilloscope based 400G-TXE electrical
compliance test solution. The 400G-TXE is a TekExpress compliance software
which evaluates the electrical PAM4 signals to the specification-mandated limits.
The 400G-TXE Real-Time electrical compliance test solution provides turnkey
testing and debug of the TX electrical properties, key to OIF (CEI-VSR/CEI-MR/
CEI-LR) and IEEE (AUI4/CR4/KR4) PAM4 standards. It tests the OIF-PAM4
and IEEE-PAM4 specification levels in a simple, cost effective manner. It aligns
the best in class Real Time Oscilloscope performance with strong market demand
for 400G based electrical PAM4 analysis tools.
The 400G-TXE solution offers comprehensive test automation, results margining,
data logging, and results reporting in an advanced testing framework.
TekExpress® 400G-TXE Printable Application Help v

Welcome
Key features of TekExpress 400G-TXE include:
■
TekExpress 400G-TXE specifically targets the following sections:
■
OIF-CEI-56G-VSR at TP0a: oif2017.449.03, Sections 16.B, Table
16-10
■
OIF-CEI-56G-VSR at TP1a: oif2017.449.03, Sections 16.3.2, Table
16-1
■
OIF-CEI-56G-VSR at TP4: oif2017.449.03, Sections 16.3.3, Table 16-4
■
OIF-CEI-56G-MR at Test point T: oif2014.245.12, section 17.3, Table
17-2, 17-3
■
OIF-CEI-56G-LR at Test point T: oif2014.340.08, section 21.3, Table
21-2, 21-3
■
OIF-CEI-112G-VSR at TP0a: oif2017.346.04, Table 23-9, Section 23.B.
1.1
■
OIF-CEI-112G-VSR at TP1a: oif2017.346.04, Table 23-1, Section
23.3.2
■
OIF-CEI-112G-VSR at TP4: oif2017.346.04, Table 23-4, Section 23.3
■
AUI-4/8 at TP0a: IEEE 802.3bs, Draft 3.5, Annex 120D.3.1, Table
120D-1
■
AUI-4/8 at TP1a: IEEE 802.3bs, Draft 3.5, Annex 120E.3.1, Table
120E-1
■
AUI-4/8 at TP4: IEEE 802.3bs, Draft 3.5, Annex 120E.3.2, Table
120E-3
■
50GBASE-CR/100GBASE-CR2/200GBASE-CR4: IEEE802.3cd Draft
3.0 Section 136.9.3, Table 136-11
■
50GBASE-KR/100GBASE-KR2/200GBASE-KR4: IEEE802.3cd Draft
3.0 Section 137.9.2
■
Streamlined and fully automated transmitter characterization of OIF (CEIVSR/CEI-MR/CEI-LR) and IEEE (AUI4/CR4/KR4) PAM4 electrical
transmitter specifications (chip-to-chip and chip-to-module)
■
In-depth analysis and debug capabilities of electrical PAM4 signals in
combination with the PAM4 software package
vi TekExpress® 400G-TXE Printable Application Help

Getting help and support
Conventions
Help uses the following conventions:
■
The term "Application" and "Software" refers to the TekExpress 400G-TXE
Solution application.
■
The term “DUT” is an abbreviation for Device Under Test.
■
The term “select” is a generic term that applies to the different methods of
choosing a screen item (button, control, list item): using a mouse or using the
touch screen.
Table 1: Icon descriptions
Icon Meaning
This icon identifies important information.
This icon identifies conditions or practices that could result in loss
of data.
This icon identifies additional information that will help you use
the application more efficiently.
TekExpress® 400G-TXE Printable Application Help 1

Getting help and support
Related documentation
The following documentation is available as part of the TekExpress® 400G-TXE
Solution application.
Table 2: Product documentation
Item Purpose Location
Help Application operation
and User Interface help
PDF of the help Printable version of the
compiled help
PDF file that ships with 400G-TXE Solution
software distribution (TekExpress 400G-TXE-
Automated-Test-Solution-Software-PrintableHelp-EN-US.pdf).
You can download the PDF version of the
manual from the Tektronix website.
Part number: 077-1366-02
www.tek.com
See also:
Technical support
2 TekExpress® 400G-TXE Printable Application Help

Getting help and support
Technical support
Tektronix values your feedback on our products. To help us serve you better,
please send us your suggestions, ideas, or comments on your application or
oscilloscope. Contact Tektronix through mail, telephone, or the website. See
Contacting Tektronix for more information.
When you contact Tektronix Technical Support, please include the following
information (be as specific as possible):
■
General information
All instrument model numbers
■
Hardware options, if any
■
Probes used
■
Your name, company, mailing address, phone number, FAX number
■
Please indicate if you would like to be contacted by Tektronix about your
suggestion or comments.
Application specific
information
■
Software version number
■
Description of the problem such that technical support can duplicate the
problem
■
If possible, save the setup files for all the instruments used and the
application
■
If possible, save the TekExpress setup files, log.xml, *.TekX (session files
and folders), and status messages text file
■
If possible, save the waveform on which you are performing the
measurement as a .wfm file
TekExpress® 400G-TXE Printable Application Help 3

Getting help and support
4 TekExpress® 400G-TXE Printable Application Help

Getting started
Minimum system requirements
The following table shows the minimum system requirements to install and run
the TekExpress 400G-TXE solution.
Table 3: System requirements
Component Description
Oscilloscope
■
Tektronix DPO70K, DX / SX series oscilloscope
■
Firmware Version: 10.8 or above
■
Opt. DJA, DJAN, PAM4, and SDLA64
Software
■
PAM4 analysis 10.5.0.8 installed
■
IronPython 2.7.3 installed
■
PyVisa 1.0.0.25 installed
■
Microsoft .NET 4.0 Framework
■
Microsoft Internet Explorer 7.0 SP1 or greater, or other Web browser
for viewing reports
■
Adobe Reader software 7.0 or greater for viewing portable
document format (PDF) files
TekExpress® 400G-TXE Printable Application Help 5

Getting started
Instruments and accessories required
TekExpress 400G-TXE application is launched on DPO70K series oscilloscope.
The following table lists the instruments and accessories required for this
application.
Table 4: Instruments and accessories required for 400G-TXE application
Instrument/Accessory Model number Quantity
Oscilloscope DPO73304DX, MSO73304DX,
DPO73304SX, DPS73308SX,
DPO75002SX, DPS75004SX,
DPO77002SX, DPS77004SX,
DPO75902SX, DPS75904SX
Cables Compatible SMA cables with
bandwidth greater than 40 GHz
for connecting single ended
sources ATI channel.
Fixtures
■
Wilder Host compliance
board CEI-VSR/AUI-4 at
TP1a (HCB-P) (Wilder part
number: 640-0822-000)
2
2
1
■
Wilder Module compliance
board CEI-VSR/AUI-4 at
TP4 (MCB) (Wilder part
number: 640-0823-000)
■
Any compatible text fixture
for CEI-VSR/AUI-4 at
TP0a, CEI-MR, CEI-LR,
CR and KR
DC Blocks Compatible DC block with
bandwidth range 50 KHz to
65 GHz
Attenuator 3, 6, or 10 dB attenuators 2
2
6 TekExpress® 400G-TXE Printable Application Help

Downloading and installing the software
Complete the following steps to download and install the latest 400G-TXE
application. See Minimum system requirements for compatibility.
1. Go to www.tek.com.
2. Click Downloads. In the Downloads menu, select DOWNLOAD TYPE as
Software and enter 400G-TXE in the MODEL OR KEYWORD field and
click SEARCH.
3. Select the latest version of software and follow the instructions to download.
Copy the executable file to the oscilloscope.
Getting started
View software version
4. Double-click the executable and follow the on-screen instructions. The
software is installed at C:\Program Files\Tektronix\TekExpress\400G-TXE\.
5. Select Analyze > TekExpress 400G-TXE from the TekScope menu to
Launch the application.
Use the following instructions to view version information for the application and
for the application modules such as the Programmatic Interface and the
Programmatic Interface Client.
To view version information for 400G-TXE, click button in the TekExpress
application and select About TekExpress.
NOTE. This example shows a typical Version Details dialog box, and may not
reflect the actual values as shown when you open this item in the application.
TekExpress® 400G-TXE Printable Application Help 7

Getting started
Application directories
The TekExpress 400G-TXE application files are installed at the following
location:
C:\Program Files\Tektronix\TekExpress\TekExpress 400G-TXE
The following table lists the application directory names and their purpose.
Table 5: Application directories and usage
Directory names Usage
Bin Contains TekExpress 400G-TXE application libraries
Compliance Suites Contains compliance-specific files
Examples Contains various support files
ICP Contains instrument and TekExpress 400G-TXE application-
specific interface libraries
Images Contains images of the TekExpress 400G-TXE application
Lib Contains utility files specific to the TekExpress 400G-TXE
application
Report Generator Contains style sheets for report generation
Tools Contains instrument and TekExpress 400G-TXE application-
specific files
8 TekExpress® 400G-TXE Printable Application Help

Getting started
See also
File name extensions
View test-related files
File name extensions
The TekExpress 400G-TXE application uses the following file name extensions:
File name extension Description
.TekX Application session files (the extensions may not be displayed)
.py Python sequence file
.xml Test-specific configuration information (encrypted) files
Application log files
.csv Test result reports
Plot data
.mht Test result reports (default)
Test reports can also be saved in HTML format
.pdf Test result reports
Application help document
.xslt Style sheet used to generate reports
See also
View test-related files
Application directories
TekExpress® 400G-TXE Printable Application Help 9

Getting started
10 TekExpress® 400G-TXE Printable Application Help

Operating basics
Launch the application
To launch the TekExpress 400G-TXE solution, select Analyze > TekExpress
400G-TXE from the TekScope menu.
When you launch the application for the first time, the file C:\Users\<username>
\Documents\My TekExpress\400G-TXE\Resources.xml is mapped to drive X:.
This file contains information about available network-connected instruments.
The session files are stored in X:\400G-TXE\. If this file is not found, then the
application runs Instrument Discovery Program to detect the network-connected
instruments before launching 400G-TXE solution.
If the application is behind the oscilloscope application, click Analyze >
TekExpress 400G-TXE to bring it to the front. To keep the 400G-TXE
application window on top, select Keep On Top from the 400G-TXE Options
menu.
TekExpress® 400G-TXE Printable Application Help 11

Operating basics
See also:
Application controls
Application panel overview
Application panels overview
TekExpress 400G-TXE solution uses panels to group Configuration, Results, and
Reports settings. Click any button to open the associated panel. A panel may
have one or more tabs that list the selections available in that panel. Controls in a
tab can change depending on settings made in the same tab or another tab.
12 TekExpress® 400G-TXE Printable Application Help

Operating basics
Table 6: Application panels overview
Panel Name Purpose
Setup panel To select the test setup controls which are grouped in tabs. The controls
in a tab can change depending on settings made in the same tab or
another tab. Click the Setup button to open this panel.
Use this panel to:
■
Set the DUT parameters
■
Select the tests
■
Set the acquisition parameters
■
Set the configuration parameters
■
Set the preferences parameters
Status panel This panel displays the acquisition status and analysis status for the
selected tests in Test Status and logs in Log View.
Results panel This tab displays the summary of test results and select result viewing
preferences.
Reports panel Browse for reports, save reports as specific file types, specify report
naming conventions, replace current test results in the report with the test
result(s) of previous run in current session, select report content to
include (summary information, detailed information, user comments,
setup configuration, application configuration), and select report viewing
options.
See also:
Application controls
TekExpress® 400G-TXE Printable Application Help 13

Operating basics
Global application controls
Application controls
Table 7: Application controls descriptions
Item Description
Options menu
Panel buttons
Start/Stop button
Menu to display global application controls
Controls that open panels for configuring test settings and
options.
Use the Start button to start the test run of the measurements in
the selected order. If prior acquired measurements have not
been cleared, the new measurements are added to the existing
set.
The button toggles to the Stop mode while tests are running. Use
the Stop button to abort the test.
Pause \ Continue button
Use the Pause button to temporarily interrupt the current
acquisition. When a test is paused, the button name changes to
“Continue.”
14 TekExpress® 400G-TXE Printable Application Help

Operating basics
Item Description
Clear button
Minimize button
Close button
Application window move Place the cursor over the application window and drag it to the
Mini view / Normal view
Use the Clear button to clear all existing measurement results.
Adding or deleting a measurement, or changing a configuration
parameter of an existing measurement also clears
measurements. This is to prevent the accumulation of
measurement statistics or sets of statistics that are not coherent.
This button is available only on the Results panel.
Minimizes the application.
Exits the application.
desired location.
Toggles the application between mini view and normal view.
Mini view displays the run messages with the time stamp,
progress bar, Start / Stop button, and Pause / Continue button.
The application moves to mini view when you click the Start
button.
TekExpress® 400G-TXE Printable Application Help 15

Operating basics
Options menu overview
To access Options menu, click in the upper-right corner of the application. It
has the following:
Options menu
Menu Function
Default Test Setup Opens an untitled test setup with defaults selected
Acquire Live Waveforms
Mode: Compliance
Standard: OIF-PAM4
Specification: CEI-VSR
Test Point: TP0a
Specification: OIF-CEI-VSR, Section 16.B.1.1
DUT Type: 56G
Symbol rate: 28.1 GBd
Open Test Setup Opens a saved test setup
Save Test Setup Saves the current test setup
Save Test Setup As Saves the current test setup with a different file name or file type
Open Recent Displays the recently opened test setups to open
Instrument Control
Settings
Keep On Top Keeps the TekExpress 400G-TXE application on top of all the application
Email Settings Use to configure email options for test run and results notifications
Deskew Use to set deskew parameter and read the deskew/attenuation values of
Detects, lists, and refreshes the connected instruments found on
specified connections (LAN, GPIB, USB, and so on)
the instrument.
16 TekExpress® 400G-TXE Printable Application Help

Menu Function
Help Displays the TekExpress 400G-TXE help
About TekExpress
■
Displays application details such as software name, version number,
and copyright
■
Provides a link to the end-user license agreement
■
Provides a link to the Tektronix Web site
Operating basics
See also:. Application controls
TekExpress instrument
control settings
Use TekExpress Instrument Control Settings dialog box to search the instruments
(resources) connected to the application. You can use the Search Criteria to
search the connected instruments depending on the connection type. The details
of the connected instrument is displayed in the Retrieved Instruments window.
You can access this dialog box from the Options menu.
The connected instruments displayed here can be selected under global settings in
the configuration tab.
NOTE. Select GPIB (Default) when using TekExpress 400G-TXE application.
See also:. Options menu overview
TekExpress® 400G-TXE Printable Application Help 17

Operating basics
View connected
instruments
Use the Instrument Control Settings dialog box to view or search for connected
instruments required for the tests. This application uses TekVISA to discover the
connected instruments.
To refresh the list of connected instruments:
1. From the Options menu, select Instrument Control Settings.
2. In the Search Criteria section of the Instrument Control Settings dialog box,
select the connection types of the instruments for which to search.
Instrument search is based on the VISA layer, but different connections
determine the resource type, such as LAN, GPIB, and USB. For example, if
you choose LAN, the search will include all the instruments supported by
TekExpress that are communicating over the LAN. If the search does not find
any instruments that match a selected resource type, a message appears
telling you that no such instruments were found.
3. Click Refresh. TekExpress searches for connected instruments.
4. After discovery, the dialog box lists the instrument-related details based on
the search criteria you selected. For example, if you selected LAN and GPIB
as the search criteria, the application checks for the availability of
instruments over LAN, then GPIB.
The details of the instruments are displayed in the Retrieved Instruments table.
The time and date of instrument refresh is displayed in the Last Updated field.
18 TekExpress® 400G-TXE Printable Application Help

Operating basics
See also:. Configuration test parameters
Equipment connection DIAGRAM
Configure email settings
To be notified by email when a test completes, fails, or produces an error,
configure the email settings.
1. Click Options > Email Settings to open the Email Settings dialog box.
2. (Required) For Recipient email Address(es), enter one or more email
addresses to which to send the test notification. To include multiple
addresses, separate the addresses with commas.
3. (Required) For Sender’s Address, enter the email address used by the
instrument. This address consists of the instrument name followed by an
underscore followed by the instrument serial number, then the @ symbol and
the email server used. For example:
DPO72016C_B130099@yourcompany.com.
4. (Required) In the Server Configuration section, type the SMTP Server
address of the Mail server configured at the client location, and the SMTP
Port number, in the corresponding fields.
Enter a valid login name and password in the corresponding fields. Select
Enable SSL, if the server requires SSL/TLS technology.
NOTE. If any of the above required fields are left blank, the settings will not
be saved and email notifications will not be sent.
5. In the Email Attachments section, select from the following options:
■
Reports: Select to receive the test report with the notification email.
■
Status Log: Select to receive the test status log with the notification
email. If you select this option, then also select whether you want to
receive the full log or just the last 20 lines.
6. In the Email Configuration section:
■
Select the message file format to send: HTML (the default) or plain text.
■
Enter a maximum file size for the email message. Messages with
attachments larger than this limit will not be sent. The default is 5 MB.
■
Enter the number in the Number of Attempts to Send field, to limit the
number of attempts that the system makes to send a notification. The
default is 1. You can also specify a timeout period.
7. Select the Email Test Results When complete or on error check box. Use
this check box to quickly enable or disable email notifications.
8. To test your email settings, click Test Email.
9. To apply your settings, click Apply.
10. Click Close when finished.
TekExpress® 400G-TXE Printable Application Help 19

Operating basics
Setup panel
Email settings
Setup panel overview
The Setup panel contains sequentially ordered tabs that help you guide through
the test setup and execution process.
20 TekExpress® 400G-TXE Printable Application Help
Operating basics
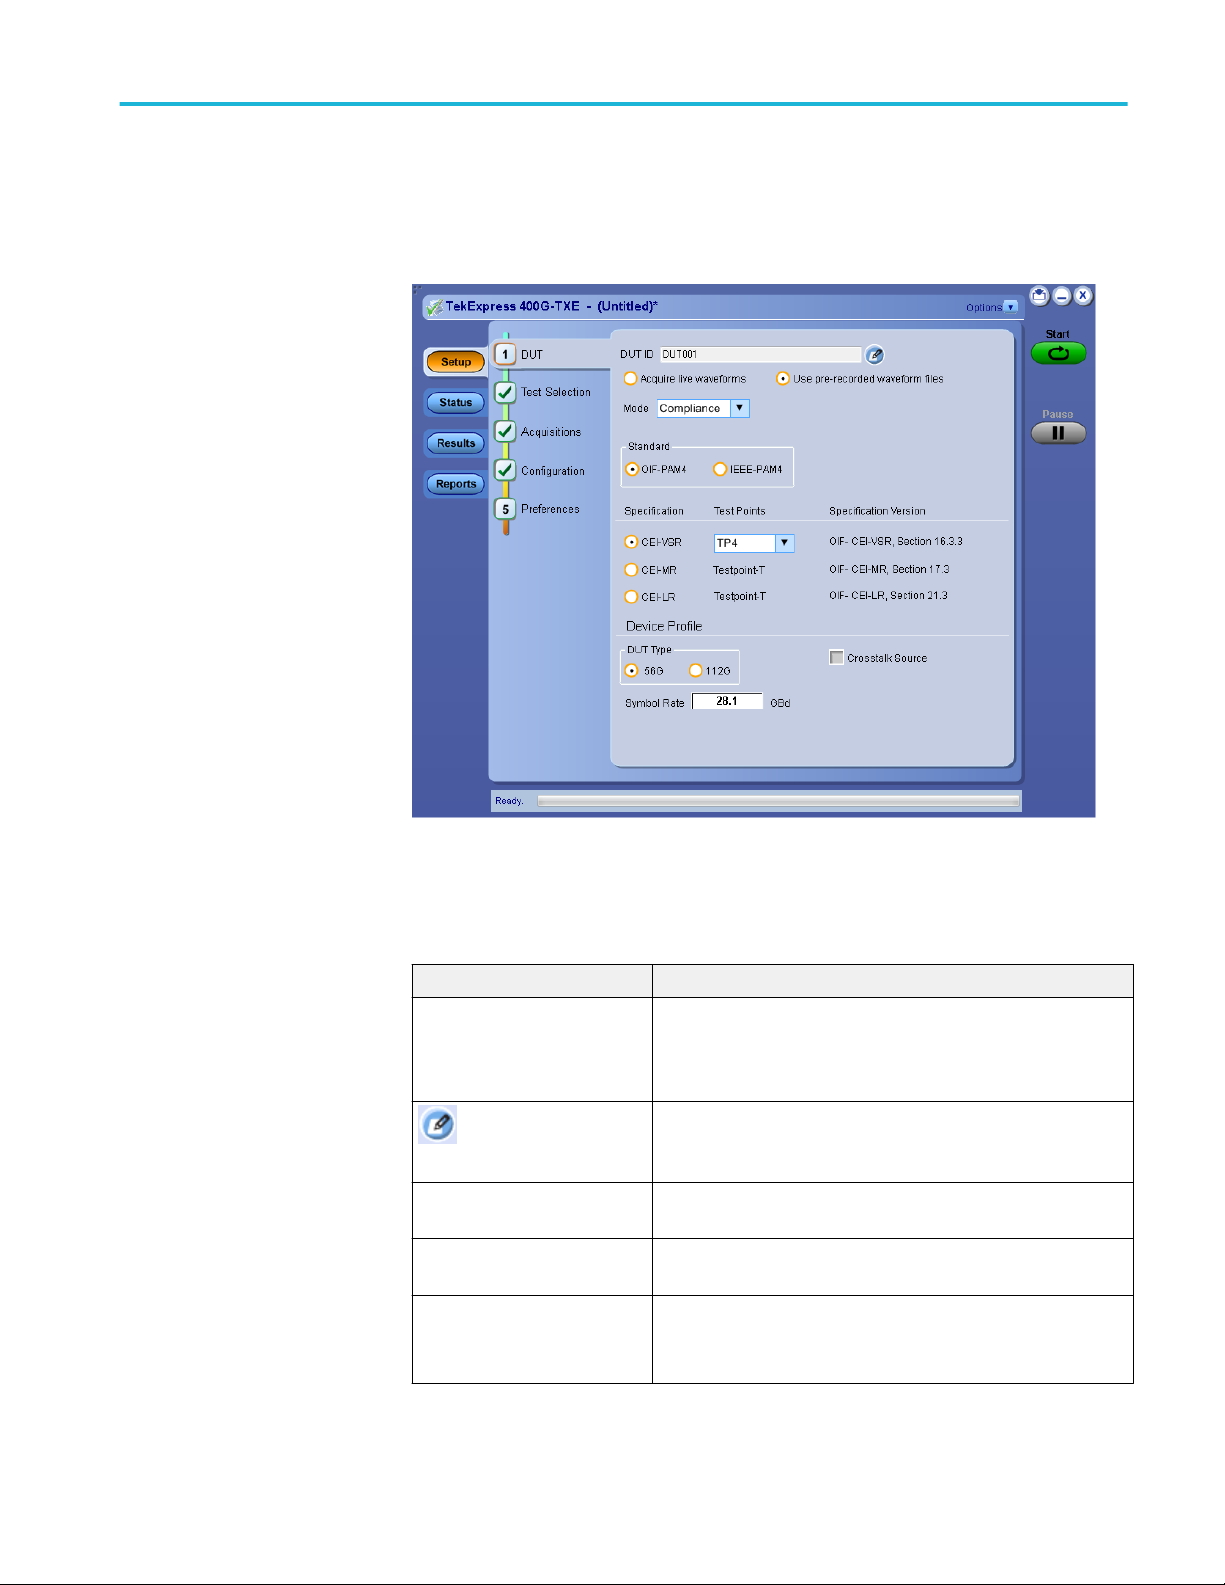
Set DUT parameters
Use the DUT tab to select parameters for the device under test. These settings are
global and apply to all tests of current session. DUT settings also affect the list of
available tests in the Test Selection tab.
Click Setup > DUT to access the DUT parameters:
Table 8: DUT tab settings
Setting Description
DUT ID Adds an optional text label for the DUT to reports. The default
value is DUT001. The maximum number of characters is 32.
You cannot use the following characters in an ID name: (.,..,...,
\,/:?”<>|*)
Opens Comments dialog box to enter text to add to the report.
Comments icon (to the
right of the DUT ID field)
Acquire live waveforms Acquire active signals from the DUT for measurement and
Use pre-recorded waveform
files
Mode
Maximum size is 256 characters. To enable or disable comments
appearing on the test report, see Select report options.
analysis.
Run tests on a saved waveform. Select Options > Open Test
Setup to recall a saved test setup.
■
Compliance
■
User Defined
TekExpress® 400G-TXE Printable Application Help 21

Operating basics
Setting Description
Standard
Specification For OIF-PAM4 standard
Test Points Select the test points from the drop-down list. The options
Specification Version Displays the specification version for the selected Specification
Device Profile
DUT Type Select the DUT type
Symbol Rate Set the symbol rate to be tested.
Crosstalk Source Select crosstalk source when a cross talk generator is
■
OIF-PAM4
■
IEEE-PAM4
■
CEI-VSR
■
CEI-MR
■
CEI-LR
For IEEE-PAM4 standard
■
AUI4
■
CR4
■
KR4
available depends on the Specification selected.
For CEI-VSR and AUI4, the test points are TP0a, TP1a, TP4.
For CEI-MR and CEI-LR, the test point is Testpoint-T.
For CR4, the test point is Testpoint-TP2.
For KR4, the test point is Testpoint-TP0a.
and Test Points.
connected. This is applicable for eye measurements only.
See also:. Select tests
Select tests
Use the Test Selection tab to select the tests. The test measurements available
depend on the standards selected in the DUT tab.
22 TekExpress® 400G-TXE Printable Application Help

Operating basics
Table 9: Test Selection tab settings
Setting Description
Tests Select or clear a test. Highlight a test to show details in the Test
Description pane.
Test Description Shows brief description of the highlighted test in the Test field.
Deselect All Click to clear all tests.
Select All Click to select all tests. All tests are selected by default.
Schematic Click to display the schematic diagram of the DUT test setup for
the selected test. Use the diagram to verify the test setup before
running the test.
See also:. Set acquisition tab parameters
TekExpress® 400G-TXE Printable Application Help 23

Operating basics
Set acquisition tab
parameters
Use the Acquisitions tab to view the test acquisition parameters. The contents
displayed on this tab depends on the DUT type and tests selected.
NOTE. 400G-TXE application acquires all waveforms needed by each test before
performing the analysis.
Table 10: Acquisitions tab settings
Setting Description
Connection Setup
Data +ve
Data -ve
1
1
Select the source channel for data positive.
Select the source channel for data negative.
TekExpress 400G-TXE saves all acquisition waveforms to files by default. The
waveforms are saved in a unique folder for each session (a session is started
when you click the Start button). The folder path is X:\400G-TXE\Untitled
Session\<dutid>\<date>_<time>. The images created for each analysis, CSV files
with result values, reports, and other information specific to that particular
execution are also saved in this folder.
1
The data sources must be either ATI or non-ATI channels.
24 TekExpress® 400G-TXE Printable Application Help

Operating basics
Saving a session moves the session file contents from the Untitled Session folder
to the specified folder name, and changes the session name to the specified name.
Set configuration tab
parameters
Use Configuration tab to configure the Global Settings and test measurement
configurations. The Global Settings and the measurements with configurations
available in this tab depend on the Standards selected in the DUT tab.
Table 11: Configuration tab settings
Setting Description
Compliance Mode Select compliance mode. By default, Compliance Mode is selected.
User Defined Mode Select user defined mode
TekExpress® 400G-TXE Printable Application Help 25

Operating basics
Setting Description
Limits Editor Shows the upper and lower limits for the applicable measurement using different types of comparisons.
Limit names for CEI-VSR 56G and 112G are appended with "_56G" and "_112G" respectively.
In Compliance Mode, use the Limits Editor to view the measurement high and low limits used for
selected tests.
In User Defined Mode, use the Limits Editor to edit the limit settings.
To edit a value, click that field and either select from the displayed list or enter a new value. Use the
bottom scroll bar to view all available fields.
Global Settings
Instruments Detected Displays the instruments connected to this application. Click the instrument name to open a list of
available (detected) instruments.
Select Options > Instrument Control Settings and click Refresh to update the instrument list.
NOTE. Verify that the GPIB search criteria (default) is selected in the Instrument Control Settings.
General Configuration
De-embedding Filter Select to apply the de-embedding filter file for Data Positive and Data Negative.
Phase Inverted Filter for Data(using SDLA with dual input
mode)
Data+ Click Browse and select the de-embedding filter file (.flt) for data positive signal.
Data- Click Browse and select the de-embedding filter file (.flt) for data negative signal.
Bandwidth Select the bandwidth limit for the oscilloscope.
Tx Output Waveform
Samples per Symbol (M) Select the number of samples per symbol for calculating the Tx out waveform parameters.
Linear Pulse Length (Np) Select the linear fit pulse curve length in Unit intervals (UI).
Linear Pulse Delay (Dp) Select the delay of the linear fit pulse.
Eye Configuration
Select this option if the filter is created from SDLA using Dual input option. The negative channel filter
must be phase inverted when you select this option.
If the acquired signal has less samples than specified, re-sampling is done to achieve the required
samples per symbol. By default it is 32.
It is recommended to use higher value for better accuracy. The analysis time is more when you select
higher value.
26 TekExpress® 400G-TXE Printable Application Help

Operating basics
Setting Description
CTLE Filter File Select the CTLE Filter File.
Compliance mode
■
All: Application will run through the CTLE filters.
■
For TP1a: CTLE filters from 1 dB - 9dB in steps of 0.5 dB
■
For TP4: For Near End, 1 dB, 1.5 dB, and 2 dB CTLE filters and for Far End, CTLE filters
from 1 dB - 9 dB in steps of 0.5 dB
■
Best CTLE: After the first run, if the eye measurements are passed, best CTLE filter option gets
enabled. User can run the measurement with the Best CLTE instead of looping through all CTLE
filters in the specification.
NOTE. For 112G, CTLE filters from 1 dB - 13 dB in steps of 1 dB
User Defined mode
■
User can run the measurement with any specified CTLE filter. The application provides CTLE
filters from 1 dB - 9 dB.
Select the CTLE filters from the drop-down list or Custom to browse and select the custom CTLE
filter files. Custom CTLE filters (CSV) must contain the following data, delimited by comma:
CTLE peaking (dB): 1 to 9
Gain: 0.05 to 2
Poles and Zeros: 0.5 to 80
Example:
//dB,gain,pole1,pole2,pole3,zero1,zero2
1,0.8913,18.6,14.1,1.2,8.359,1.2
Target BER (1e-) Select the Target BER (1e-). As per the compliance, Target BER should be set to 1e-5 and 1e-6 for
IEEE and OIF standards respectively.
If the Target BER is set to higher values, more time is required to analyse the data. You can select
BER of 1e-5 for quicker analysis.
Mask Width Select the mask width in Unit intervals (UI). This configuration is for Eye symmetry mask width
measurement only.
Measurements
AC Common Mode Voltage Analyze Scope Noise Enter the scope noise in μV.
Scope noise is the noise value
that is removed from the
measured AC common mode
voltage.
TekExpress® 400G-TXE Printable Application Help 27

Operating basics
Set preferences tab
parameters
Use the Preferences tab to set the application action on completion of a
measurement.
Table 12: Preferences tab settings
Setting Description
Number of Runs
Acquire/Analyze each test <n> times (not
applicable to Custom Tests)
Deskew
Show alert when new deskew values are
configured on TekScope
Popup Settings
Auto close Warnings and Informations during
Sequencing
Auto close after <n> Seconds
Auto close Error Messages during Sequencing.
Show in Reports
Auto close after <n> Seconds
Select to repeat the test run by setting the
number of times. By default, it is selected with
1 run.
Select to get notification when the deskew
values are modified in TekScope.
Select to auto close warnings/informations
during sequencing. Set the Auto close time. By
default it is not selected.
Select to auto close Error Messages during
Sequencing. Set the Auto close time. By default
it is not selected.
28 TekExpress® 400G-TXE Printable Application Help
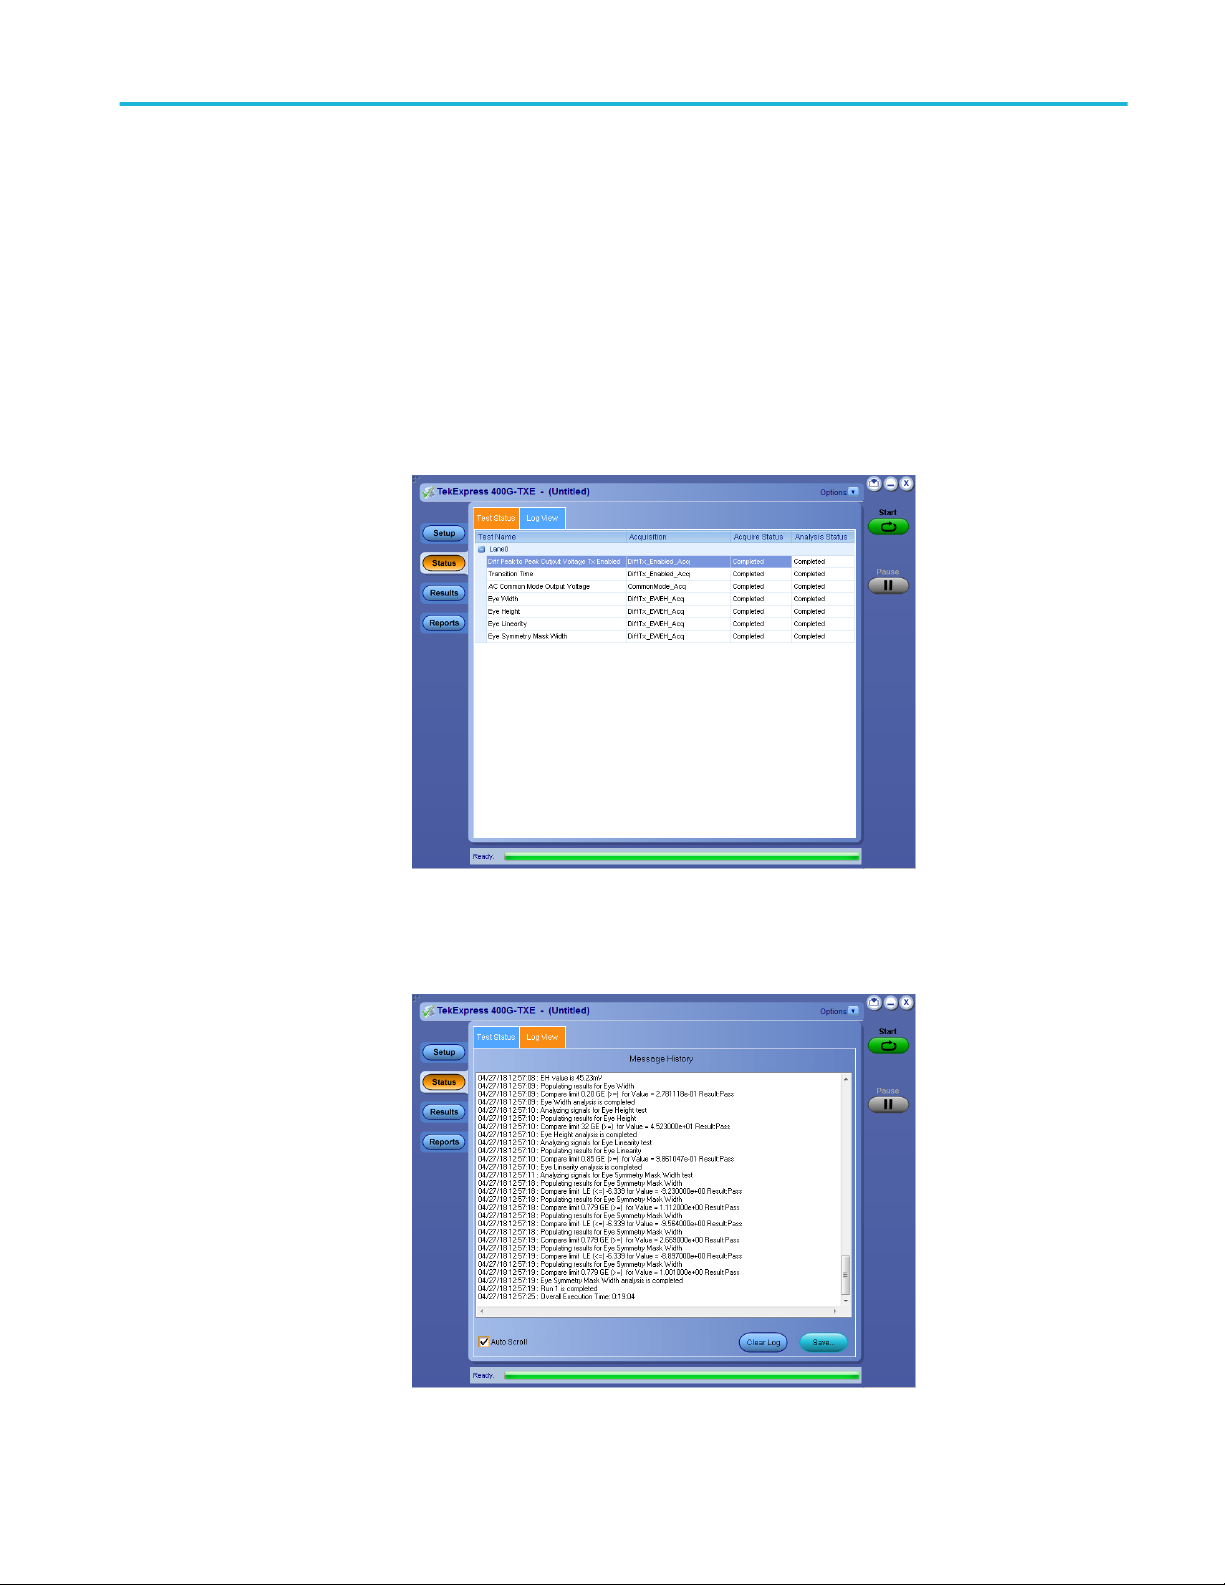
Status panel
Operating basics
Status panel overview
The Status panel accesses the Test Status and Log View tabs, which provide
status on test acquisition and analysis (Test Status tab) and a listing of test tasks
performed (Log View tab). The application opens the Test Status tab when you
start a test run. You can select the Test Status or the Log View tab to view these
items while the tests are running.
Test status view
Log view
TekExpress® 400G-TXE Printable Application Help 29

Operating basics
Results panel
Table 13: Status panel Log View controls
Control Description
Message History Lists all executed test operations and timestamp
information.
Auto Scroll Enables automatic scrolling of the log view as
information is added to the log during the test.
Clear Log Clears all messages from the log view.
Save Saves the log file to a text file. Use the standard
Save File window to navigate to and specify the
folder and file name to which to save the log
text.
See also:. Application panel overview
Results panel overview
When a test execution is complete, the application automatically opens the
Results panel to display a summary of test results.
30 TekExpress® 400G-TXE Printable Application Help

Operating basics
See also:. View a report
Application panels overview
View test-related files
Files related to tests are stored in C:\Users\<username>\Documents\My
TekExpress\400G-TXE\. Each test setup in this folder has a test setup file and a
test setup folder, both with the test setup name.
The test setup file is preceded by the TekExpress icon and usually has no visible
file name extension.
Inside the test setup folder is another folder named for the DUT ID used in the
test sessions. The default is DUT001.
Inside the DUT001 folder are the session folders and files. Each session also has
a folder and file pair, both named for the test session using the naming
convention (date)_(time). Each session file is stored outside its matching session
folder:
Each session folder contains image files of any plots generated from running the
test session. If you selected to save all waveforms or ran tests using prerecorded
waveform files, these are included here.
The first time you run a new, unsaved session, the session files are stored in the
Untitled Session folder located at ..\My TekExpress\400G-TXE\. When you
name and save the session, the files are placed in a folder with the name that you
specify. A copy of the test files stay in the Untitled Session folder until you run a
new test or until you close the 400G-TXE application.
See also:. File name extensions
TekExpress® 400G-TXE Printable Application Help 31
Operating basics
Reports panel
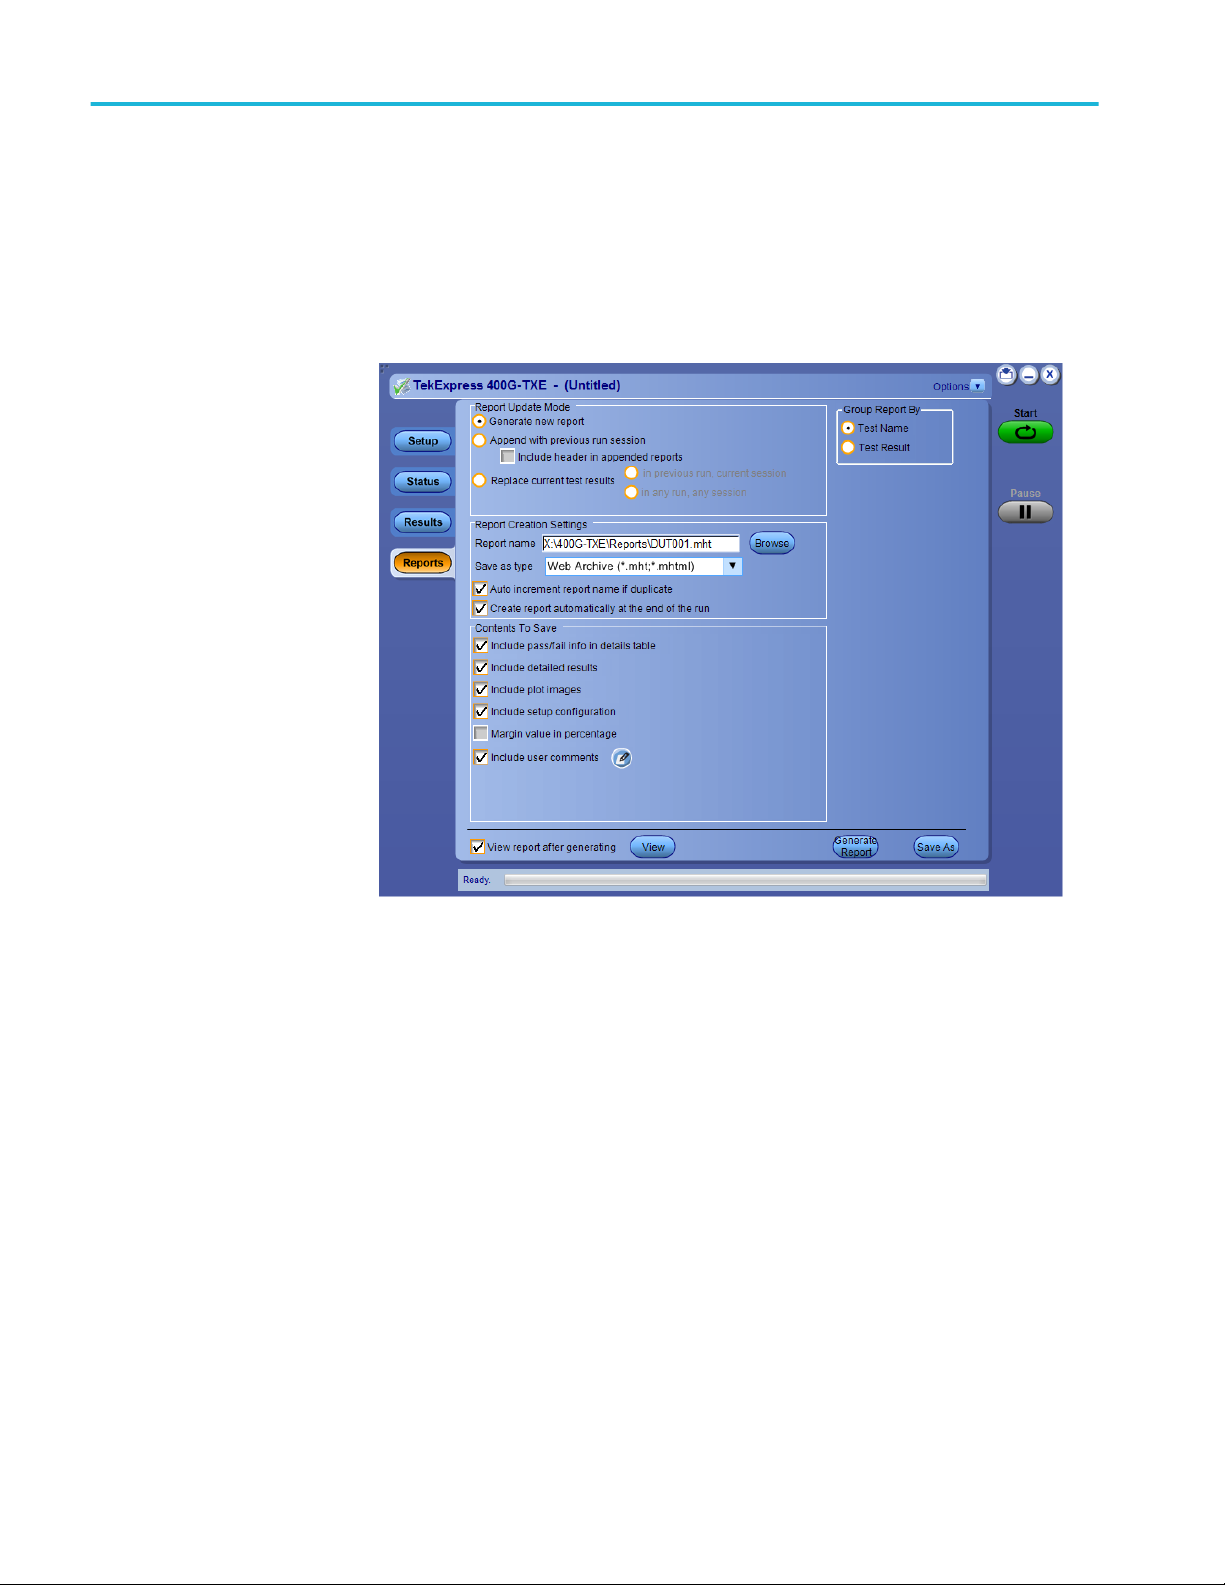
Reports panel overview
Use the Reports panel to browse for reports, to name and save reports, select test
content to include in reports, and to select report viewing options.
Select report options
For information on setting up reports, see Select report options. For information
on viewing reports, see View a report.
See also:. Applications panel overview
Click the Reports panel to select the test result information to be included in the
report, and the naming conventions to use for the report. For example, always
give the report a unique name or select to have the same name incremented each
time you run a particular test.
Select the report options before running a test or when creating and saving test
setups. Report settings are included in saved test setups.
In the Reports panel, select from the following report options:
32 TekExpress® 400G-TXE Printable Application Help
Operating basics
Table 14: Report options
Setting Description
Report Update Mode
Generate new report Creates a new report. The report can be in
either .mht, .pdf, or .csv file format.
Append with previous run session Appends the latest test results to the end of the
current test results report.
Include header in appended reports Select to include header in appended reports
Replace current test
results
Report Creation Settings
Report name Displays the name and location from which to
In previous run, current
session
In any run, any session Select to replace current test results in the report
Select to replace current test results in the report
with the test result(s) of previous run in current
session.
with the test result(s) in selected run session’s
report. Click and select the test result of
any other run session from another setup.
open a 400G-TXE report. The default location is
at \My TekExpress\400G-TXE\Untitled Session.
The report file in this folder gets overwritten
each time you run a test unless you specify a
unique name or select to auto increment the
report name.
Change the report name or location.
Do one of the following:
■
In the Report Path field, type over the
current folder path and name.
■
Double-click in the Report Path field and
then make selections from the pop-up
keyboard and click the Enter button.
Be sure to include the entire folder path, the file
name, and the file extension. For example: C:
\Users\<username>\Documents\My TekExpress
\400G-TXE\DUT001.mht.
NOTE. You cannot set the file location using the
Browse button.
Open an existing report.
Click Browse, locate and select the report file,
and then click View at the bottom of the panel.
TekExpress® 400G-TXE Printable Application Help 33

Operating basics
Setting Description
Save as type Saves a report in the specified file type, selected
from the drop-down list.
NOTE. If you select a file type different from the
default, be sure to change the report file name
extension in the Report Name field to match.
Auto increment report name if duplicate Sets the application to automatically increment
the name of the report file if the application finds
a file with the same name as the one being
generated. For example: DUT001, DUT002,
DUT003. This option is enabled by default.
Create report automatically at the end of the run Creates report at the end of the run.
Contents To Save
Include pass/fail info in details table Includes pass/fail info in the details table of the
report.
Include detailed results Includes detailed results in the report.
Include plot images Includes plot images in the report.
Include setup configuration Select to include hardware and software
information in the summary box, at the top of the
report. Information includes oscilloscope model
and serial number, oscilloscope firmware
version, and software versions for the
applications used in the measurements.
Margin value in percentage Select to include the margin value in percentage
in the report.
Include user comments Select to include any comments about the test
that you or another user added in the DUT tab of
the Setup panel. Comments appear in the
Comments section, under the summary box at
the beginning of each report.
Group Report By
Test Name Select to group the tests in the report by test
name.
Test Result Select to group the tests in the report by test
results.
View report after generating Automatically opens the report in default Web
browser, when the test execution is complete.
This option is selected by default.
View Click to view the most current report.
Generate Report Generates a new report based on the current
analysis results.
Save As Specify a name for the report.
34 TekExpress® 400G-TXE Printable Application Help

Operating basics
View a report
Report contents
The application automatically generates a report when the test execution is
complete and displays the report in your default Web browser (unless you had
cleared the View Report After Generating check box in the Reports panel
before running the test). If you cleared this check box, or to view a different test
report, do the following:
1. Click the Reports button.
2. Click the Browse button and locate and select the report file to view.
3. In the Reports panel, click View.
For information on changing the file type, file name, and other report options, see
Select report options.
A report shows detailed results and plots, as set in the Reports panel.
Setup configuration information
The summary box at the beginning of the report lists setup configuration
information. This information includes the oscilloscope model and serial number,
electrical module model, and software version numbers of all associated
applications.
To exclude this information from a report, clear the Include Setup
Configuration check box in the Reports panel before running the test.
User comments
If you selected to include comments in the test report, any comments you added
in the DUT tab are shown at the top of the report.
TekExpress® 400G-TXE Printable Application Help 35

Operating basics
See also:. Results panel overview
View test-related files
36 TekExpress® 400G-TXE Printable Application Help

Running tests
Equipment connection setup
Click Setup > Test Selection > Schematic to view the equipment setup
diagram(s).
Figure 1: Connection diagram for OIF (CEI-VSR at TP0a, CEI-MR, and CEI-LR) and IEEE
(AUI4 at TP0a, CR4, and KR4)
Figure 2: Connection diagram for OIF (CEI-VSR at TP1a) and IEEE (AUI4 at TP1a)
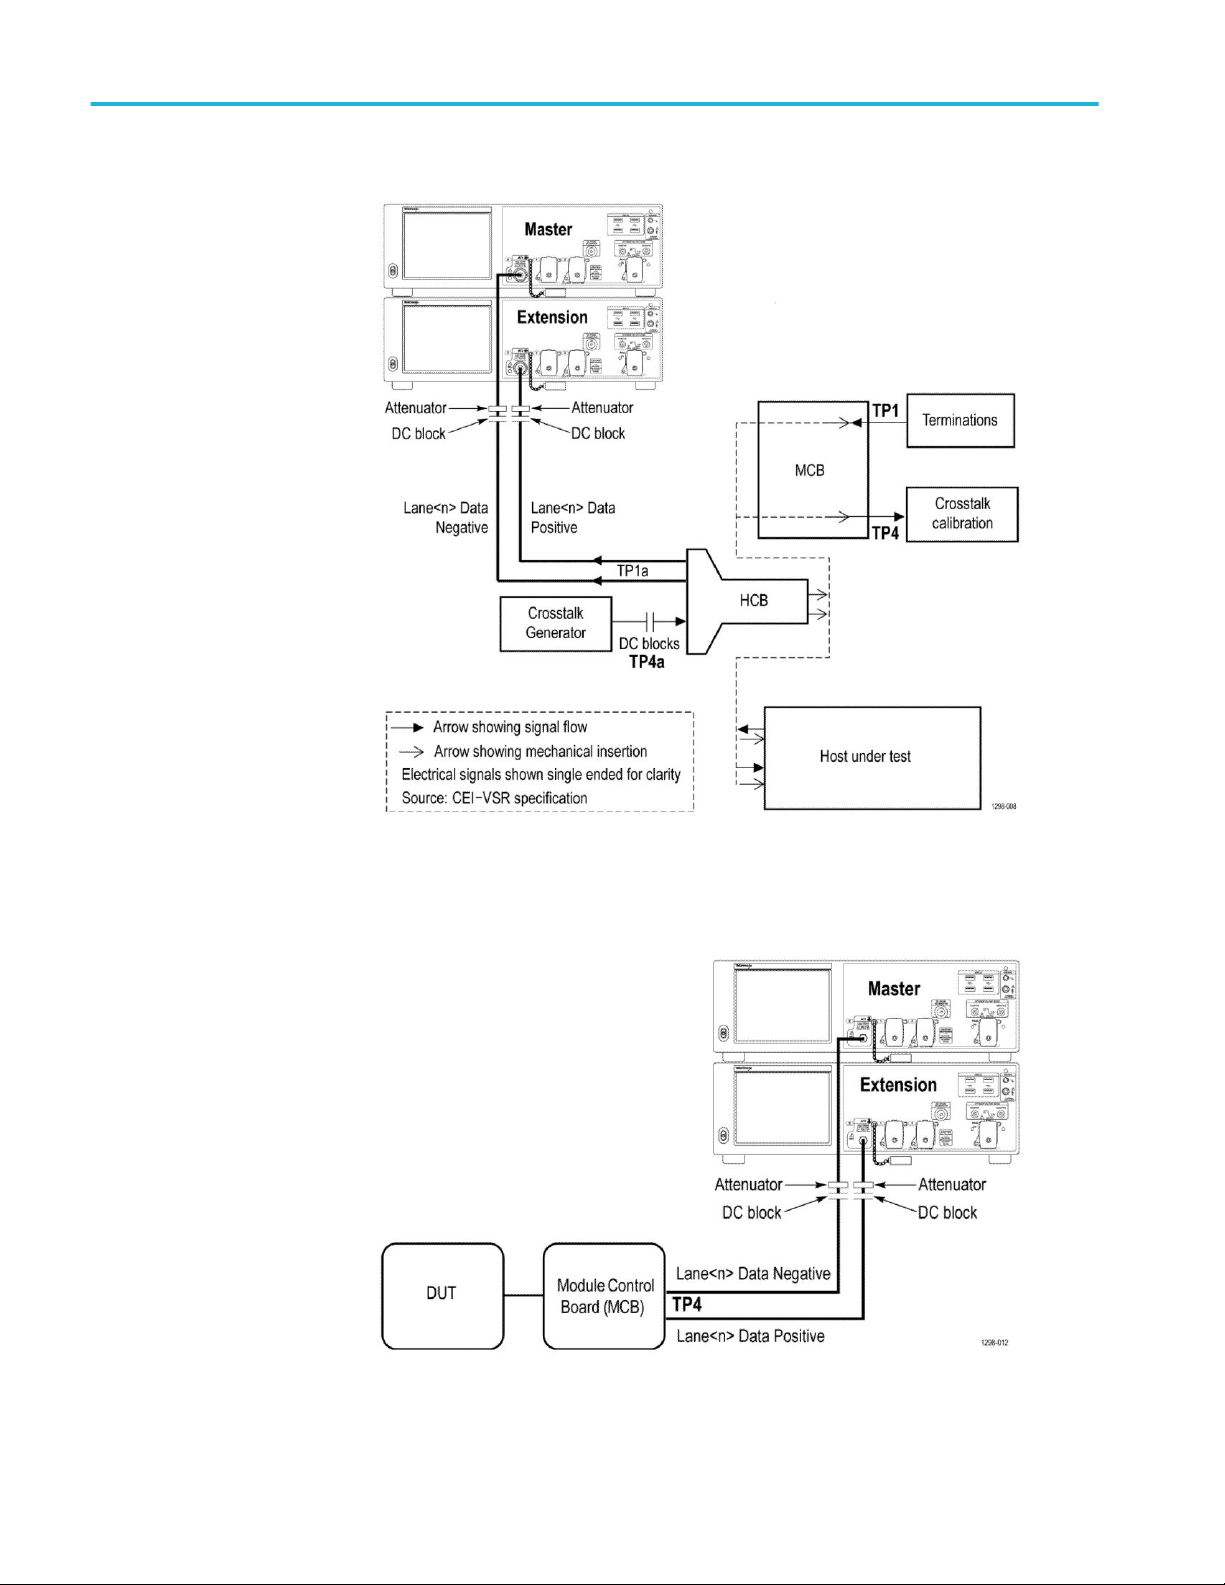
TekExpress® 400G-TXE Printable Application Help 37
Running tests
Figure 3: Connection diagram for OIF (CEI-VSR at TP1a) and IEEE (AUI4 at TP1a) for Eye
measurements
Figure 4: Connection diagram for OIF (CEI-VSR at TP4) and IEEE (AUI4 at TP4)
38 TekExpress® 400G-TXE Printable Application Help

Running tests
Figure 5: Connection diagram OIF (CEI-VSR at TP4) and IEEE (AUI4 at TP4) for Eye
measurements
TekExpress® 400G-TXE Printable Application Help 39

Running tests
Prerequisite
Compensate the signal
path
Use the following procedure to compensate the internal signal acquisition path.
Perform this procedure if the ambient temperature has changed more than 5 °C
(9 °F) since you performed the last signal path compensation. Perform the signal
path compensation once a week. Failure to do so may result in the instrument not
meeting warranted performance levels.
1. Power on and wait for the instrument to complete its warm up period before
continuing with this procedure.
2. Disconnect any probes you have connected to the input channels.
3. Set the instrument to Menu mode.
4. Select Instrument Calibration from the Utilities menu.
5. Note any instructions that appear in the resulting control window.
6. Click Run SPC to begin the procedure. The procedure may take several
minutes to complete.
7. Verify that the Status changes to Compensated after the procedure is
complete. If the Calibration Status field indicates anything other than
Compensated, see Signal Path Compensation Status for information on the
readout and recommended action.
NOTE. When making measurements at vertical scale settings less than or equal to
5 mV, you should perform the signal path compensation at least once a week.
Failure to do so may result in the instrument not meeting warranted performance
levels at those volts/div settings.
Deskew
40 TekExpress® 400G-TXE Printable Application Help
If skew is present between positive and negative channels, then the channels need
to be deskewed before being used for waveform measurements. TekExpress 10GKR provides support for channel deskew using the following method:
1. Determine what the skew is for each channel.
2. From the TekScope menu, select Vertical > Deskew.
3. In the Deskew/Attenuation window, click the channel (1 – 4) button for the
first channel to be deskewed.
4. Click in the Ch(x) Deskew Time entry field and enter the skew. The skew
can be +ve or –ve.
5. Click the channel button for the next channel and repeat step 4.
6. After entering the skew for all the channels that require it, from the Options
menu in TekExpress 10G-KR, select Deskew.

Running tests
7. In the Deskew and Attenuation dialog box, select the desired level:
■
Less than 100 mV signal amplitude: Select this if the signal amplitude is
such that the oscilloscope’s vertical setting is less than 100 mV/division.
■
100 mV or greater signal amplitude: Select this if the signal amplitude is
such that the oscilloscope’s vertical setting is greater than 100 mV/
division.
Figure 6: Deskew
8. Click Set on Scope to set the stored deskew and attenuation values on
oscilloscope.
9. Click Read from Scope to read the deskew and attenuation values from the
oscilloscope.
10. Click View values to view the deskew, attenuation, and bandwidth values.
11. When the status in the dialog box indicates the deskew is finished, click
Close.
Figure 7: Deskew-View values
TekExpress® 400G-TXE Printable Application Help 41

Running tests
Each input channel has its own deskew settings. Deskew compensates individual
channels for probes or cables of different lengths. The instrument applies the
delay values after each completed acquisition. The deskew values are saved as
part of the instrument setup. The deskew values for the selected channel are
retained until you change the probe, you restore a saved setup, or you recall the
factory setup.
NOTE. If you perform the de-embed settings, then performing the Deskew and
Attenuation settings are not required.
Running tests
Select tests, set acquisition parameters, set configuration parameters, set
preferences parameters, and click Start to run the tests. While tests are running,
you cannot access the Setup or Reports panels. To monitor the test progress,
switch between the Status panel and the Results panel.
Prerun checklist
While the tests are running, other applications may display windows in the
background. The TekScope application takes precedence over other applications,
but you can switch to other applications by using Alt + Tab key combination. To
keep the TekExpress 400G-TXE application on top, select Keep On Top from
the TekExpress Options menu.
The application displays report when the tests execution is complete.
1. Make sure that the instruments are warmed up (approximately 20 minutes)
and stabilized.
2. Perform compensation: In the oscilloscope main menu, select Utilities >
Instrument Compensation. Click Help in the compensation window for
steps to perform instrument compensation.
42 TekExpress® 400G-TXE Printable Application Help

400G-TXE compliance measurements
DC common mode output voltage
This section verifies that the DC common mode output voltage of the DUT is
within the conformable limits according to the specification.
Required test equipment
Minimum system requirements
Equipment connection diagram
Standard Specification Test Points Limits
OIF-PAM4 OIF-CEI-VSR,
Table 16-10
OIF-CEI-VSR,
Table 16-1
OIF-CEI-VSR,
Table 16-4
OIF-CEI-MR,
Table 17-2
OIF-CEI-LR, Table
21-2
IEEE-PAM4 AUI4-
IEEE802.3bs,
Draft 3.5, Annex
120D.3.1
CR4IEEE802.3cd,
Section 136.9.3
KR4-IEEE802.3cd,
Section 137.9.2
TP0a -0.3 V 2.8 V
TP1a -0.3 V 2.8 V
TP4 -0.35 V 2.85 V
Testpoint-T 0 V 1.9 V
Testpoint-T 0 V 1.9 V
TP0a -0.3 V 2.8 V
TP1a -0.35 V 2.85 V
TP4 0 V 1.9 V
TP2 0 V 1.9 V
TP0a 0 V 1.9 V
Min Max
Measurement procedure
Maximum input to be provided to the ATI channels is ≤ 300 mV peak-to-peak.
The DC common mode voltage of the signal cannot be measured using ATI
channels. Measure the voltage using an external digital multimeter and enter the
value in the application.
TekExpress® 400G-TXE Printable Application Help 43

400G-TXE compliance measurements
AC Common Mode Output Voltage
This section verifies that the common mode noise of the DUT is within the
conformable limits according to the specification.
Required test equipment
Minimum system requirements
Equipment connection diagram
Standard Specification Test Points Limits
Min Max
OIF-PAM4 OIF-CEI-VSR,
Table 16-10
OIF-CEI-VSR,
Table 16-1
OIF-CEI-VSR,
Table 16-4
OIF-CEI-MR,
Table 17-2
OIF-CEI-LR, Table
21-2
IEEE-PAM4 AUI4-
IEEE802.3bs,
Draft 3.5, Annex
120D.3.1
CR4IEEE802.3cd,
Section 136.9.3
KR4-IEEE802.3cd,
Section 137.9.2
TP0a NA 12 mV
TP1a NA 17.5 mV
TP4 NA 17.5 mV
Testpoint-T NA 30 mV
Testpoint-T NA 30 mV
TP0a NA 30 mV
TP1a NA 17.5 mV
TP4 NA 17.5 mV
TP2 NA 30 mV
TP0a NA 30 mV
Input
Positive and negative signals from the oscilloscope by setting the bandwidth to
40 GHz
Measurement procedure
The common mode voltage is a measure of the deviation of the common mode
signal around the mean value. Find the sum of the positive and negative signals
to create the common mode signal and create a vertical histogram on this signal.
The RMS value of the vertical histogram is the AC common mode output
voltage.
To find the effective common mode voltage after removing the instrumentation
noise, use the following formula:
44 TekExpress® 400G-TXE Printable Application Help
400G-TXE compliance measurements
Single-ended output voltage
This section verifies that the single-ended output voltage of the data positive and
data negative signals of the DUT is within the conformable limits according to
the specification.
Required test equipment
Minimum system requirements
Equipment connection diagram
Standard Specification Test Points Limits
Min Max
OIF-PAM4 OIF-CEI-MR,
Table 17-2
OIF-CEI-LR, Table
21-2
IEEE802.3bs AUI4-
IEEE802.3bs,
Draft 3.5, Annex
120D.3.1
Testpoint-T -0.3 V 1.9 V
Testpoint-T -0.3 V 1.9 V
TP1a -0.4 V 3.3 V
Input
Data positive and data negative signals
Measurement procedure
The single-ended output voltage is the measure of maximum and minimum
values of the single-ended signals. Since the voltage levels can go beyond the
300 mV peak-to-peak, this measurement cannot be done using the ATI channels
of the oscilloscope. Connect a DC block to eliminate the DC content present in
the signal and then measure the maximum and minimum values of the positive
and negative signals.
Effective Data Positive Max voltage = DC Common Mode + Data Positive Max
Effective Data Positive Max voltage = DC Common Mode + Data Positive Min
NOTE. DC Common Mode measurement is pre-requisite for this measurement
and you will be prompted to measure DC voltage using external multimeter.
TekExpress® 400G-TXE Printable Application Help 45

400G-TXE compliance measurements
Diff peak to peak output voltage Tx enabled
This section verifies that the differential peak-to-peak voltage of the DUT is
within the conformable limits according to the specification.
Required test equipment
Minimum system requirements
Equipment connection diagram
Standard Specification Test Points Limits
Min Max
OIF-PAM4 OIF-CEI-VSR,
Table 16-10
OIF-CEI-VSR,
Table 16-1
OIF-CEI-VSR,
Table 16-4
OIF-CEI-MR,
Table 17-2
OIF-CEI-LR, Table
21-2
IEEE-PAM4 AUI4-
IEEE802.3bs,
Draft 3.5, Annex
120D.3.1
CR4IEEE802.3cd,
Section 136.9.3
KR4-IEEE802.3cd,
Section 137.9.2
TP0a 750 mV NA
TP1a NA 880 mV
TP4 NA 900 mV
Testpoint-T NA 1200 mV
Testpoint-T NA 1200 mV
TP0a NA 1200 mV
TP1a NA 880 mV
TP4 NA 900 mV
TP2 NA 1200 mV
TP0a NA 1200 mV
Input
QPRBS13-CEI or any valid signal filtered through a fourth order Bessel
Thomson filter.
Measurement procedure
The differential peak-to-peak voltage is the peak-to-peak value of the signal
acquired using a base oscilloscope.
46 TekExpress® 400G-TXE Printable Application Help

400G-TXE compliance measurements
Diff peak to peak output voltage Tx disabled
This section verifies that the differential peak-to-peak voltage of the DUT is
within the conformable limits according to the specification.
Required test equipment
Minimum system requirements
Equipment connection diagram
Standard Specification Test Points Limits
Min Max
IEEE-PAM4 AUI4-
IEEE802.3bs,Draft
3.5, Annex 120D.
3.1
CR4IEEE802.3cd,
Section 136.9.3
KR4-IEEE802.3cd,
Section 137.9.2
TP1a NA 30 mV
TP0a NA 35 mV
TP2 NA 30 mV
TP0a NA 30 mV
Input
Noise signal captured when the DUT is disabled (without applying filters)
Measurement procedure
1. Capture the differential noise using Math1 as source (without applying
filters). Math1 = (Data positive – Data negative)
2. Select the oscilloscope free run mode option.
3. In oscilloscopes menu, select Measure > Amplitude and select peak-to-peak
measurement.
4. Value of Peak-Peak measurement is reported as the differential peak-to-peak
output voltage.
TekExpress® 400G-TXE Printable Application Help 47

400G-TXE compliance measurements
Transition time
This section verifies that the transition time of the DUT is within the conformable
limits according to the specification.
Required test equipment
Minimum system requirements
Equipment connection diagram
Standard Specification Test Points Limits
Min Max
OIF-PAM4 OIF-CEI-VSR,
Table 16-10
OIF-CEI-VSR,
Table 16-1
OIF-CEI-VSR,
Table 16-4
IEEE802.3bs AUI4-
IEEE802.3bs,
Draft 3.5, Annex
120D.3.1
AUI4IEEE802.3bs,
Draft 3.5, Annex
120D.3.1
TP0a 7.5 ps NA
TP1a 12 ps NA
TP4 9.5 ps NA
TP1a 10 ps NA
TP4 9.5 ps NA
Input
QPRBS13-CEI test pattern or any valid signal filtered through a fourth order
Bessel Thomson filter.
Measurement procedure
Transition time (rise and fall) are defined as the time between the 20% and 80%
times, or 80% and 20% times, respectively, of isolated -1 to +1 or +1 to -1 PAM4
edges. Using the QPRBS13-CEI test pattern, the transitions within sequences of
three -1s followed by three +1s, and three +1s followed by three -1s, respectively,
are measured. These are PAM4 symbols 1820 to 1825 and 2086 to 2091,
respectively, where symbols 1 to 7 are the run of seven +1’s. In this case, the 0%
level and 100% level may be estimated as the average signal within windows
from -1.5 UI to -1 UI and from 1.5 UI to 2 UI relative to the edge.
TekExpress 400G-TXE application captures sufficient record length and uses
PAM4 utility to perform this measurement.
48 TekExpress® 400G-TXE Printable Application Help
400G-TXE compliance measurements
Eye width, eye height, eye linearity, and eye symmetry mask width
This section verifies that the eye width, eye height, eye linearity, and eye
symmetry mask width of the DUT are within the conformable limits according to
the specification.
Required test equipment
Minimum system requirements
Equipment connection diagram
Standard Measurement Specification Test Points Limits
Min Max
OIF-PAM4 Eye Width OIF-CEI-VSR,
Eye Height 35 mV NA
Eye Linearity 0.85 NA
Eye Symmetry
Mask Width
Near End Eye
Width
Near End Eye
Height
Near End Eye
Linearity
Far End Eye
Width
Far End Eye
Height
Eye Symmetry
Mask Width
IEEE-PAM4 Eye Symmetry
Mask Width
Eye Height 32 mV NA
Near End Eye
Symmetry
Mask Width
Near End Eye
Height
Far End Eye
Symmetry
Mask Width
Far End Eye
Height
Table 16-1
OIF-CEI-VSR,
Table 16-4
AUI4IEEE802.3bs
AUI4IEEE802.3bs
TP1a 0.2 UI NA
EW6 NA
TP4 0.265 UI NA
70 mV NA
0.85 NA
0.2 UI NA
70 mV NA
EW6 NA
TP1a 0.2 UI NA
TP4 0.265 UI NA
70 mV NA
0.2 UI NA
30 mV NA
Input
TekExpress® 400G-TXE Printable Application Help 49

400G-TXE compliance measurements
Differential signal filtered through fourth order Bessel Thomson filter (with
appropriate bandwidth) in concatenation with a Continuous Time Linear
Equalizer (CTLE).
Cross talk calibration
Calibrate the co-propagating signals (signal on the other lanes) as per the
specification, before performing the eye measurements.
If you want to run with cross talk source, select Crosstalk Source from the DUT
panel. By default, this option is unselected and application will provide normal
connection diagram procedure.
Eye measurements are done after passing the signal through a reference receiver
which includes a fourth order Bessel Thomson filter with appropriate bandwidth
cutoff and a selectable continuous time linear equalizer (CTLE filter). It is
recommended to use PRBS13Q pattern for this measurement.
NOTE. For 112G-VSR eye measurements, signal will be passed through
additional five tap FFE equalizer after Bessel Thomson and CTLE filters
CTLE filters are selected as per the below table:
Table 15: CTLE filters selection table
Specification Test point CTLE filters
CEI-56G-VSR At Host output TP1a 1 dB - 9 dB
At Module output TP4 (Near
End)
At CEI-VSR Module output TP4
(Far End)
CEI-112G-VSR At Host output TP1a, TP4 1 dB - 13 dB
200/400GAUI-4/8 At Host output TP1a 1 dB - 9 dB
At Module output TP4 (Near
End)
At Module output TP4 (Near
End)
1 dB - 2 dB
1 dB - 9 dB
1 dB - 3 dB
1 dB - 9 dB
TekExpress uses PAM4 utility to perform this measurement. Details about
measuring eye width and eye height from the equalized signal is explained in
OIF-CEI-56G-VSR and IEEE802.3bs specifications.
At module output, the eye measurements is divided into 2 types:
1. Near End Eye measurements
2. Far End Eye measurements
Near end eye width and eye height are same as eye width and eye height
measurements. Whereas far end eye width and eye height measurements are done
with an emulated loss channel.
50 TekExpress® 400G-TXE Printable Application Help

400G-TXE compliance measurements
Steps to find the best CTLE filter:
1. Best CTLE filter is the one which gives maximum eye area (EW*EH) and it
passes corresponding eye parameters.
2. In case of OIF standard, best CTLE filter is the one which gives passing
result for Eye width, Eye height and Eye linearity.
3. In case of IEEE standard, best CTLE filter is the one which gives passing eye
width and ESMW tests.
Measurement procedure:
1. Acquire the signal (record length depends on the symbol rate).
2. Calculate eye measurements (Eye width, Eye height and Eye linearity if
required) for all CTLE filters at BER of 1e-5.
3. Calculate the Eye Area (EW*EH), select the CTLE with maximum Eye area
and passing Eye parameter limits of spec as reference CTLE filter for
analysis.
4. Use the reference filter and measure the eye parameters configured at BER as
per specification (By default for OIF:1e-6 and for IEEE:1e-5 BER is used).
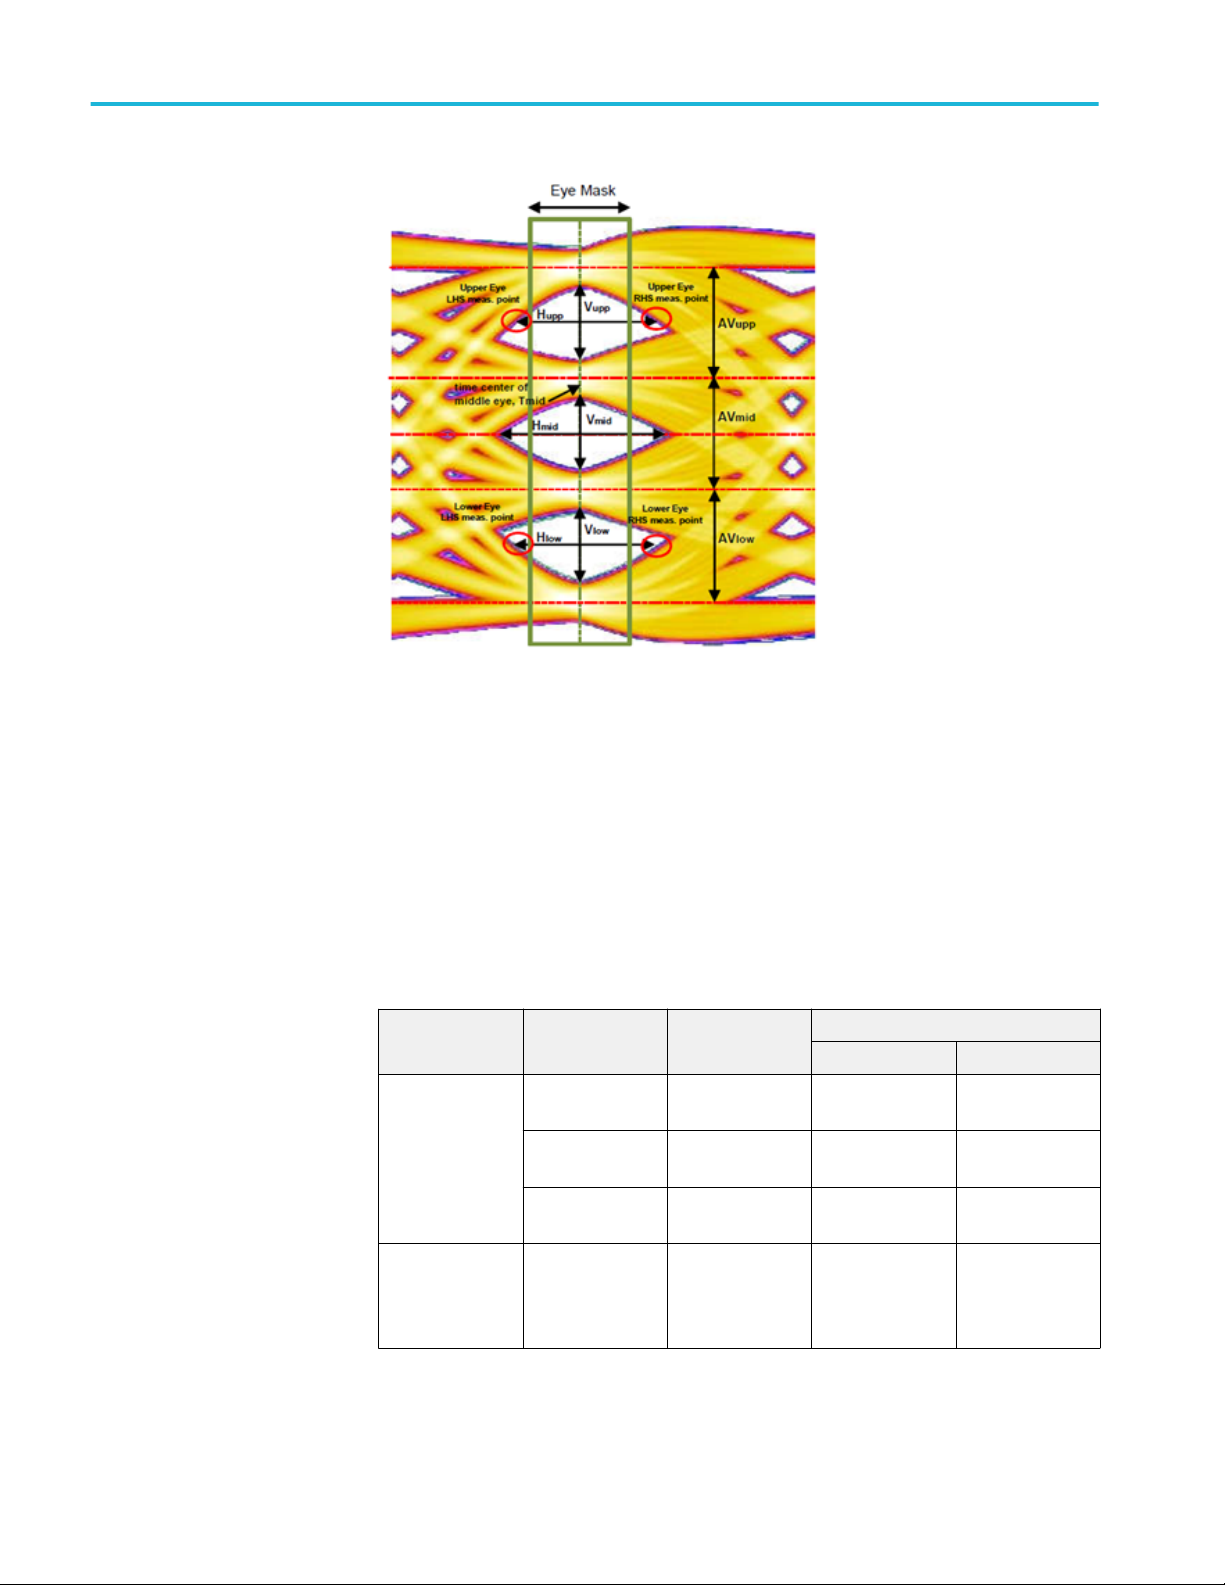
Eye symmetry mask width (ESMW)
An eye mask of width as per the specification is drawn on the top of eye diagram.
All the three eyes have to open beyond the mask drawn which will make the test
pass.
Procedure to perform ESMW:
1. Use the reference CTLE filter for analysis. Horizontal mid-point of eye
diagram (Tmid) is queried from the PAM4 utility.
2. Mask width has to be read from UI.
3. Mask_Left = Tmid - Mask_Width/2 and Mask_Right = Tmid + Mask_Width/
2
4. Test is pass if all 3 eyes extend beyond the Eye width mask, else test is fail.
5. Query Hupp_Left and Hupp_Right values from the PAM4 utility which
correspond to the left and right eye boundaries for upper eye.
6. If (Mask_left>=Hupp_Left and Mask_Right<=Hupp_Right) then pass,
otherwise fail
7. Repeat steps 5 and 6 for middle and lower eyes. For middle eye, query
Hmid_Left and Hmid_Right. Also for lower eye, query Hlow_left and
Hlow_right
TekExpress® 400G-TXE Printable Application Help 51
400G-TXE compliance measurements
Signal-to-noise and distortion ratio
This section verifies that the signal-to-noise and distortion ratio (SNDR) of the
DUT is within the conformable limits according to the specification.
Required test equipment
Minimum system requirements
Equipment connection diagram
Standard Specification Test Points Limits
OIF-PAM4 OIF-CEI-VSR,
IEEE-PAM4 AUI4-
Table 16-10
OIF-CEI-MR,
Table 17-2
OIF-CEI-LR, Table
21-2
IEEE802.3bs,
Draft 3.5, Annex
120D.3.1
Min Max
TP0a 31 dB NA
Testpoint-T 31 dB NA
Testpoint-T 31 dB NA
TP0a 31 dB NA
52 TekExpress® 400G-TXE Printable Application Help
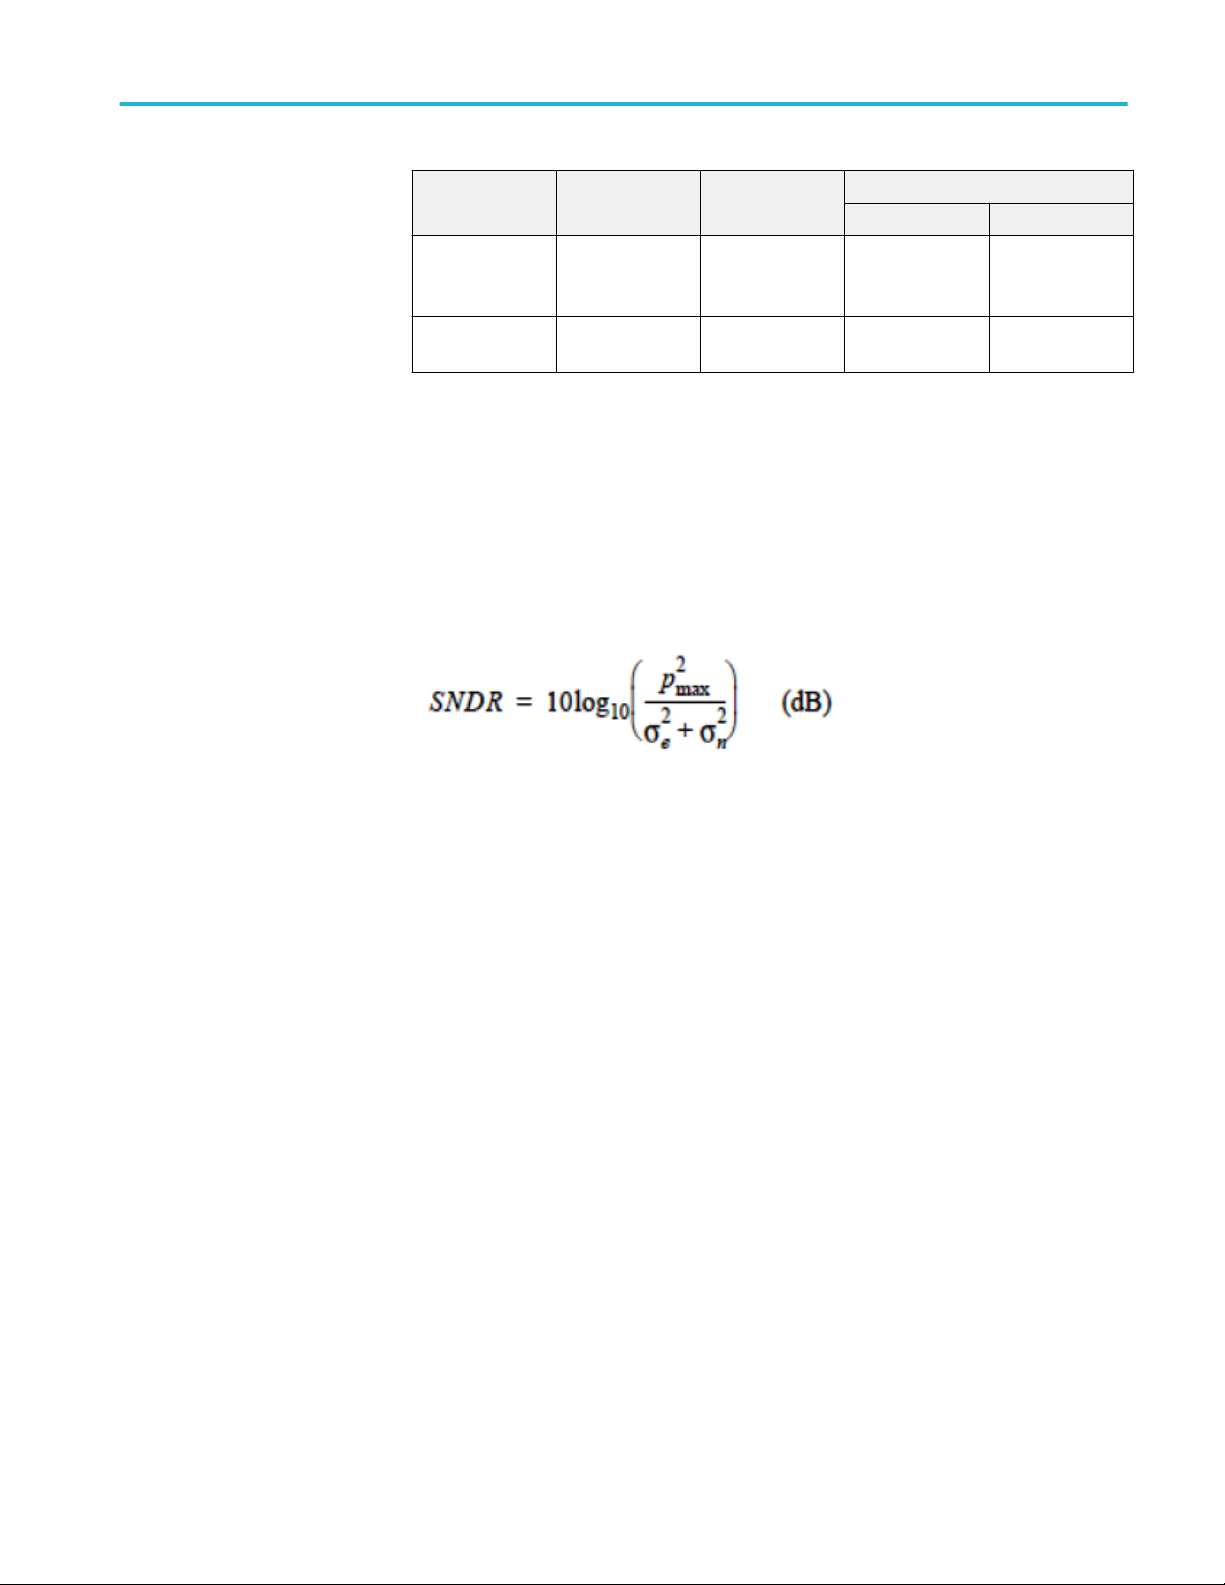
400G-TXE compliance measurements
Standard Specification Test Points Limits
Min Max
IEEE-PAM4 CR4-
IEEE802.3cd,
Section 136.9.3
IEEE-PAM4 KR4-IEEE802.3cd,
Section 137.9.2
TP2 33.3 dB NA
TP0a 32.5 dB NA
Input
Differential signal filtered through a fourth order Bessel Thomson filter with
appropriate bandwidth
Measurement procedure
Signal-to-noise and distortion ratio is measured using the following formula:
Where,
P
is the linear fit pulse peak
max
σe - RMS error
σn – Standard deviation of noise
TekExpress® 400G-TXE Printable Application Help 53
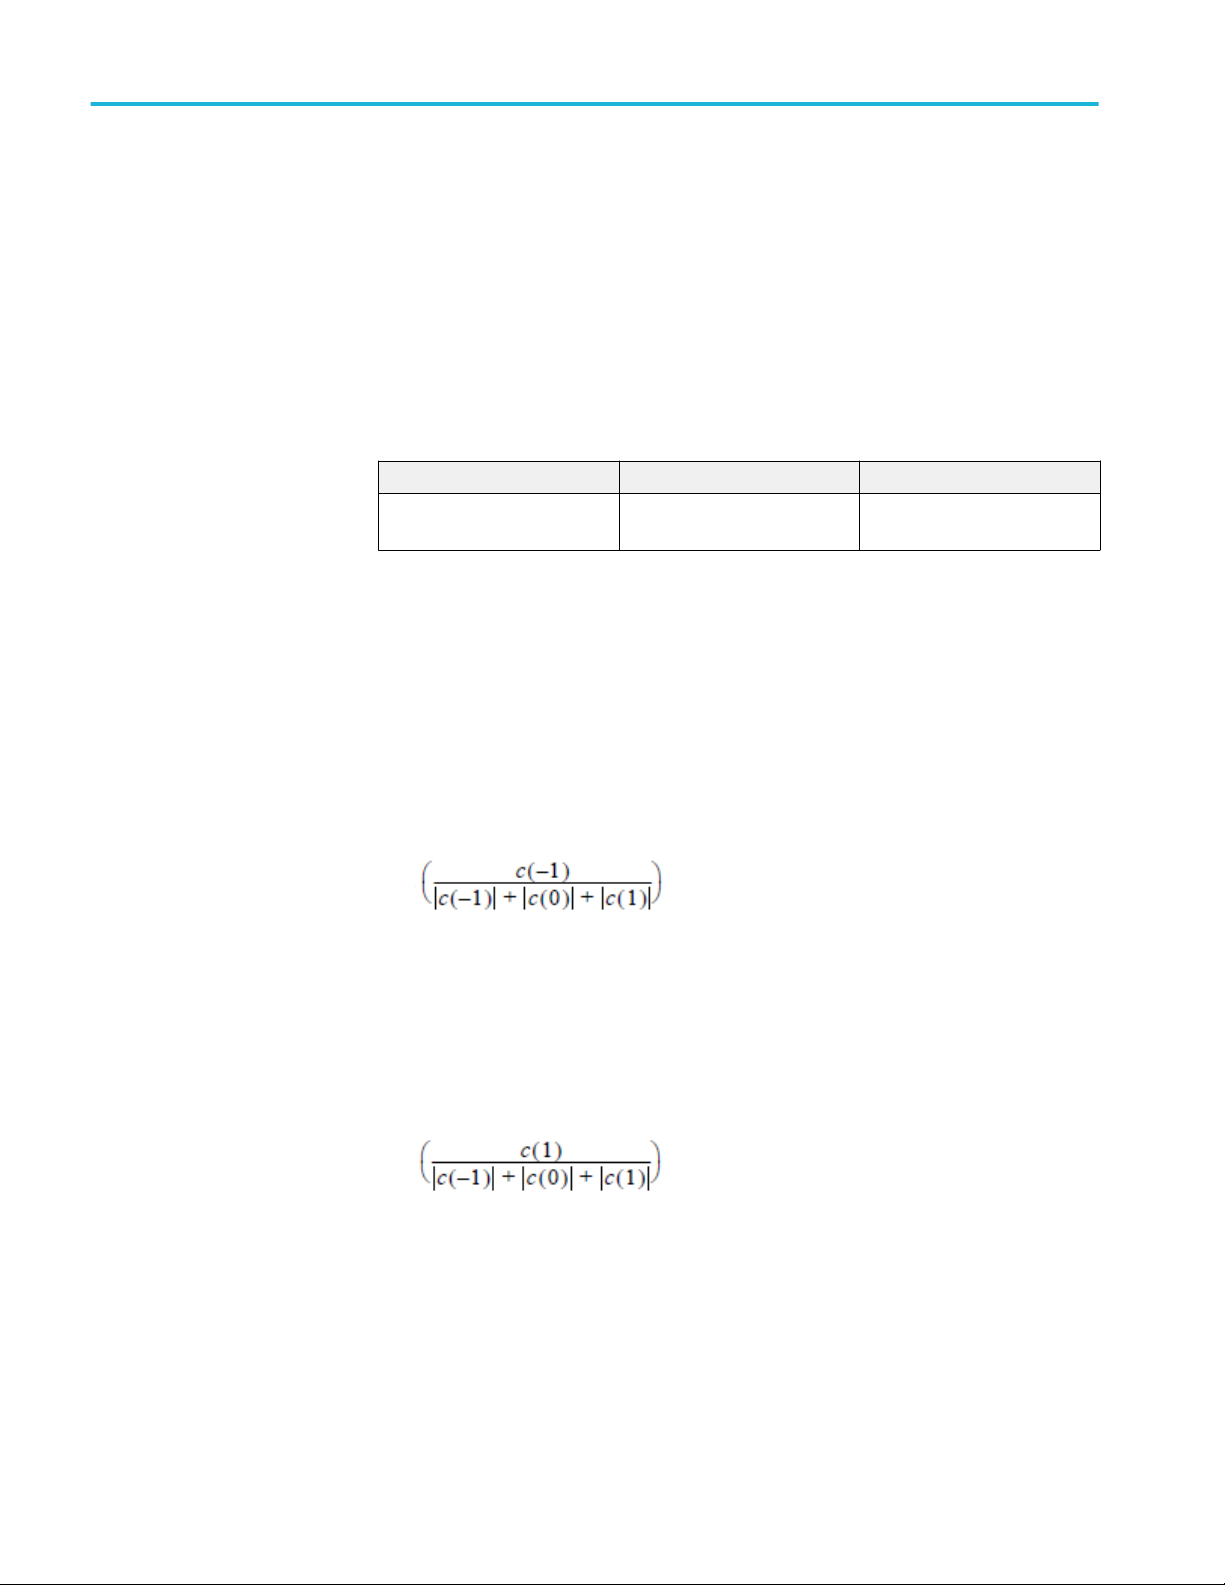
400G-TXE compliance measurements
Pre-cursor and post-cursor equalization ratio
This section verifies that the pre-cursor and post-cursor equalization ratio of the
Device Under Test (DUT) is within conformance limits as given in
IEEE802.3 200GAUI-4/400GAUI-8 specification at test point TP0a, Table
120D-1, Section 120D.3.1.5.
Required test equipment
Minimum system requirements
Equipment connection diagram
Standard Specification Test Points
IEEE-PAM4 AUI4-IEEE802.3bs, Draft 3.5,
Annex 120D.3.1
Measurement procedure
1. Set the DUT in PRESET state and find the Linear fit pulse response.
TP0a
2. For pre-cursor test, prompt the user to vary the Local_eq_cm1 value from
0 to 3 and each time find the equalizer coefficients C(-1), C(0) and C(1)
value using PRESET linear fit curve and linear fit of each state of
Local_eq_cm1.
3. Find the pre-cursor equalization ratio using below formula:
4. Vary the Local_eq_c1 value from 0 to 5 and each time find the equalizer
coefficients C(-1), C(0) and C(1) value using PRESET Linear fit curve and
Linear fit of each state of Local_eq_c1.
5. Find the Post-cursor equalization ratio using below formula:
Limits
Pre-cursor equalization ratio for each state of Local_eq_cm1 are the following:
54 TekExpress® 400G-TXE Printable Application Help
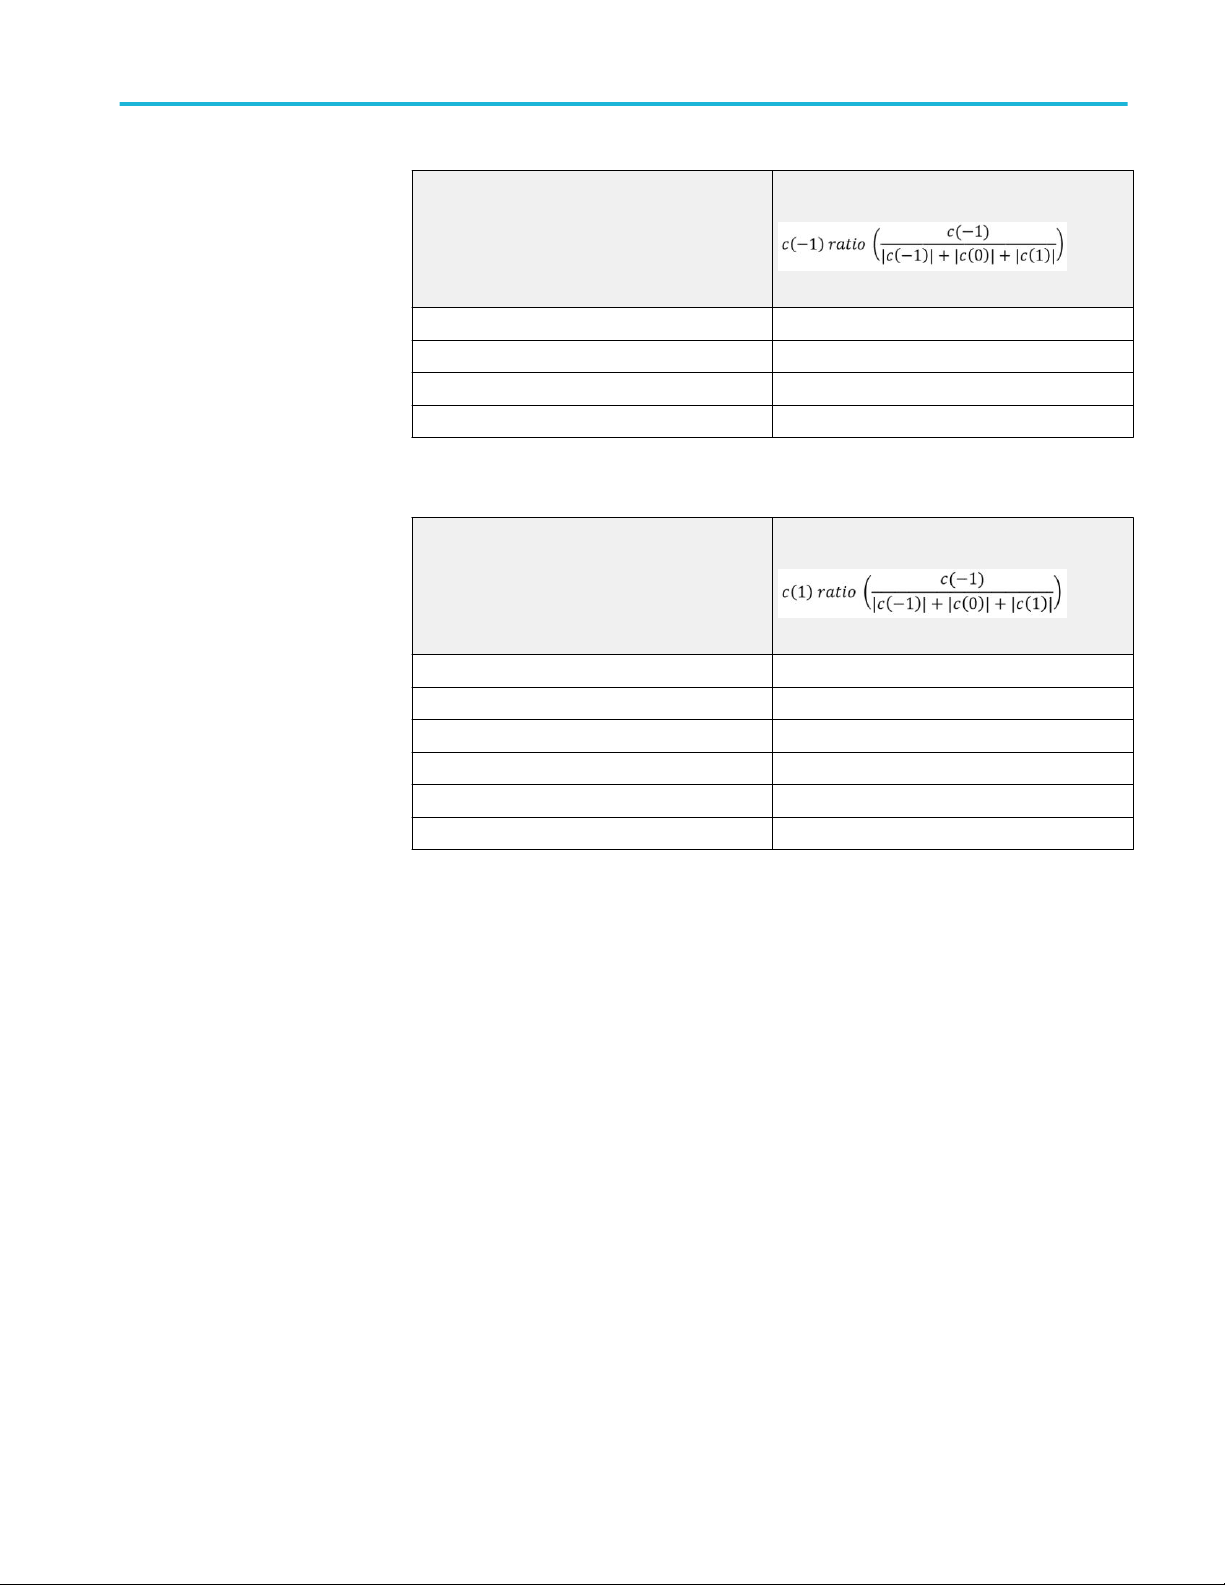
400G-TXE compliance measurements
Local_eq_cm1 value
0 0±0.04
1 -0.05±0.04
2 -0.1±0.04
3 -0.15±0.04
Pre-cursor equalization ratio for each state of Local_eq_c1 are the following:
Local_eq_c1 value
0 0±0.04
1 -0.05±0.04
2 -0.1±0.04
3 -0.15±0.04
4 -0.2±0.04
5 -0.25±0.04
TekExpress® 400G-TXE Printable Application Help 55
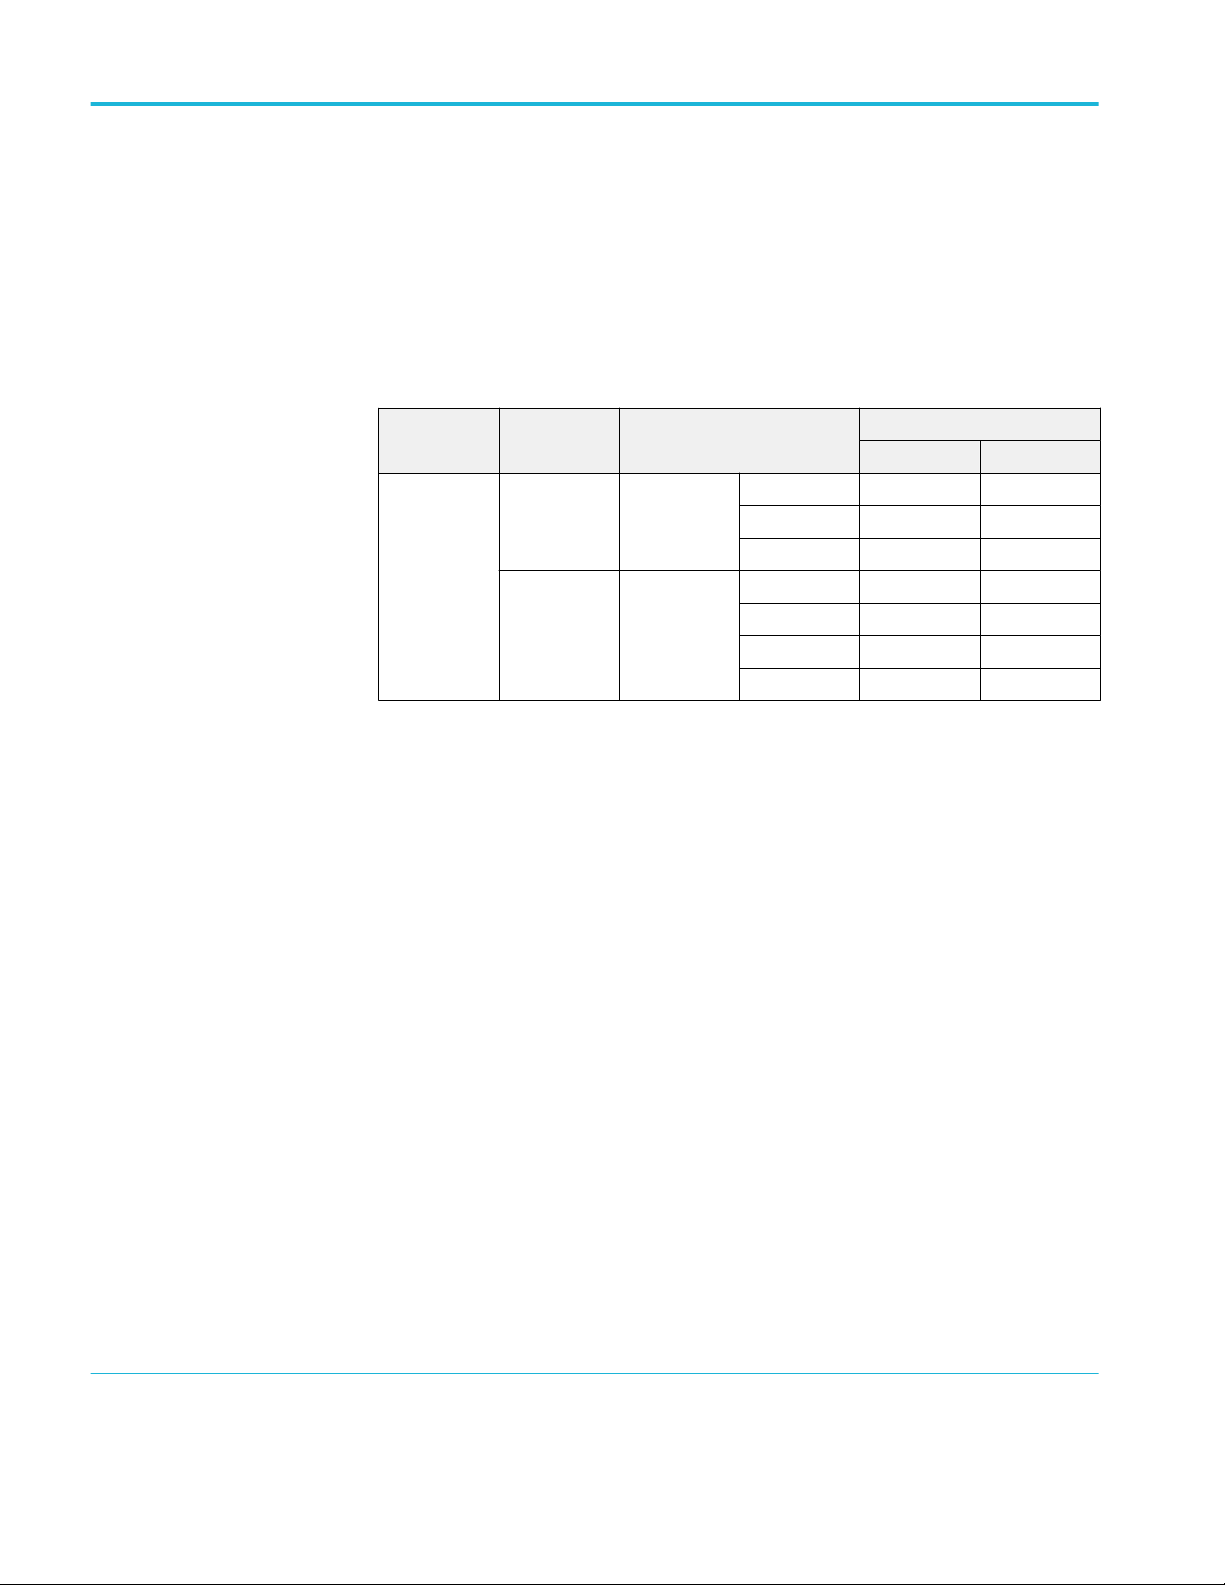
400G-TXE compliance measurements
Coefficient range (OIF)
This section verifies that the coefficient range of the DUT is within the
conformable limits according to the specification.
Required test equipment
Minimum system requirements
Equipment connection diagram
Standard Specification Test Points Limits
Min Max
OIF-PAM4 OIF-CEI-MR,
Table 17-2
OIF-CEI-LR,
Table 21-2
Testpoint-T C(-1) -15% 0%
C(0) 60% 100%
C(1) -25% 0%
Testpoint-T C(-2) 0% 10%
C(-1) -28% 0%
C(0) 60% 100%
C(1) -28% 0%
Measurement procedure
1. Acquire the PRESET signal. Export the linear fit impulse response curve
from PAM4 utility.
2. Increment a coefficient (C(-2), C(-1), C(0) or C(1)) such that it reaches its
maximum value and keep all other coefficients in hold state. Export the
Linear fit impulse response from PAM4 utility
1
.
3. Find the equalizer coefficients using PRESET and incremented linear fit
pulses.
4. Similarly ask the user to sufficiently decrement the equalizer coefficient
(C(-1), C(0) and C(1)) one by one such that it reaches its minimum value.
Capture the waveform and find the linear fit pulse from the PAM4 utility
2
5. Find the equalizer coefficients using PRESET and decremented linear fit
pulses.
6. Verify that each transmitter equalizer coefficient is within the minimum and
maximum range of specification.
.
1
Increment each coefficient individually to reach its maximum value. You must reconfigure the coefficient to its original value before incrementing
another coefficient.
2
Decrement each coefficient individually to reach its maximum value. You must reconfigure the coefficient to its original value before decrementing
another coefficient.
56 TekExpress® 400G-TXE Printable Application Help

400G-TXE compliance measurements
Coefficient range (IEEE)
This section verifies that the coefficient range of the DUT is within the
conformable limits according to the specification.
Required test equipment
Minimum system requirements
Equipment connection diagram
Standard Specification Test Points Limits
Min Max
IEEE-PAM4 CR4-
IEEE802.3cd,
Section
136.9.3
KR4IEEE802.3cd,
Section
137.9.2
TP2 C(-2) 0.1 NA
C(-1) NA -0.25
C(1) NA -0.25
TP0a C(-2) 0.1 NA
C(-1) NA -0.25
C(1) NA -0.25
Measurement procedure
1. Range for C(1) or value at minimum state for C(1): with c(−2) and c(−1) both
set to zero and both c(0) and c(1) having received sufficient “decrement”
requests so that they are at their respective minimum values, c(1) shall be less
than or equal to −0.25.
2. Range for C(-1) or value at minimum state for C(-1): with c(−2) and c(1) set
to zero and both c(−1) and c(0) having received sufficient “decrement”
requests so that they are at their respective minimum values, c(−1) shall be
less than or equal to −0.25.
3. Range for C(-2) or value at maximum state for C(-2): with c(−1) and c(1) set
to zero, c(0) having received sufficient “decrement” requests so that it is at its
minimum value, and c(−2) having received sufficient “increment” requests so
that it is at its maximum value, c(−2) shall be greater than or equal to 0.1.
TekExpress® 400G-TXE Printable Application Help 57

400G-TXE compliance measurements
Far end pre-cursor ISI ratio
This section verifies that the far end pre-cursor ISI ratio of the DUT is within the
conformable limits according to the specification.
Required test equipment
Minimum system requirements
Equipment connection diagram
Standard Specification Test Points Limits
Min Max
IEEE-PAM4 CR4-
IEEE802.3cd,
Section
136.9.3
KR4IEEE802.3cd,
Section
137.9.2
TP2 C(-2) 0.1 NA
C(-1) NA -0.25
C(1) NA -0.25
TP0a C(-2) 0.1 NA
C(-1) NA -0.25
C(1) NA -0.25
Measurement procedure
1. Apply the CTLE filter which produces the optimal eye opening and export
the linear fit pulse from the PAM4 utility.
2. Using linear fit impulse, measure the far end pre-cursor ratio:
Far End Pre-cursor ratio = Ppre/Pmax
Where,
Ppre is the value of linear fit pulse 1 UI prior to the time of the pulse peak
Pmax is the peak amplitude of the linear fit pulse
58 TekExpress® 400G-TXE Printable Application Help

400G-TXE compliance measurements
Transmitter output residual ISI
This section verifies that the maximum value of transmitter output residual ISI of
the DUT is within the conformable limits according to the specification.
Required test equipment
Minimum system requirements
Equipment connection diagram
Standard Specification Test Points Limits
Min Max
IEEE-PAM4 AUI4-
IEEE802.3bs,
Draft 3.5, Annex
120D.3.1
CR4IEEE802.3cd,
Section 136.9.3
KR4-IEEE802.3cd,
Section 137.9.2
TP0a 34.8 dB NA
TP2 36.8 dB NA
TP0a 43 dB NA
Measurement procedure
1. Acquire the signal and export the linear fit pulse using PAM4 utility.
2. Perform single sequence in PAM4 utility and export the linear fit pulse to a
file.
3. Using Linear fit pulse, calculate the SNR-ISI value using below equation:
ISI cursors are calculated using below equation:
Where,
tp is the index of the linear fit pulse where p(tp) = pmax
M is the oversampling ratio of the measured waveform and linear fit pulse
Np is the linear fit pulse length
Nb is given in Table 120D–8
TekExpress® 400G-TXE Printable Application Help 59

400G-TXE compliance measurements
For UAI-4 at TP0a, Equalization has to be performed on signal before running
measurement for SNR-ISI. For CR4 and KR4, measurement is done on
unequalized signal.
Equalization procedure
gDC gDC2 G ZLF Z1 PLF P1 P2
-15 to 0 -4 to 0 1 fb/40 fb/2.5 fb*2
1. Equalize the signal with equalization filters given above(varying gDC and
gDC2) ad measure the SNR-ISI in each case
2. Maximum value of SNR-ISI is reported out as result.
NOTE. The observed SNR
setup, for example, the reflections in cables and connectors. High-precision
measurement and careful calibration of the setup are recommended.
Normalized coefficients step size
This section verifies that the normalized coefficients step size of the DUT is
within the conformable limits according to the specification.
Required test equipment
Minimum system requirements
Equipment connection diagram
Standard Specification Test Points
OIF-PAM4 CEI-MR T
IEEE-PAM4 CR4-IEEE802.3cd, Section
can be significantly influenced by the measurement
ISI
CEI-LR T
TP2
136.9.3
KR4-IEEE802.3cd, Section
137.9.2
TP0a
Measurement procedure
Normalized coefficient step size is the measure of variation in the equalizer
coefficient when the increment or decrement operations were done.
1. Set the DUT in PRESET state. Export the linear fit pulse response from
PAM4 utility.
2. Set the DUT in INITIALIZE state. Export the Linear fit pulse response from
PAM4 utility.
3. Calculate all the equalizer coefficient C(x) before using these linear fit pulse
responses and denote it as C(x)_Before.
60 TekExpress® 400G-TXE Printable Application Help

400G-TXE compliance measurements
4. Increment or decrement the equalizer coefficient in DUT by giving an
increment or decrement command.
5. Measure the linear fit pulse response. Calculate the updated equalizer
coefficient C(x) in the signal using linear fit pulse response before and after
sending increment or decrement request and denote it as C(x)_After.
6. Find the Increment or decrement step size for equalizer coefficient C(x) using
below equation.
Increment or decrement step size = C(x)_After – C(x)_Before
Normalized coefficient step size for C(x) is calculated using below equation:
Normalized coefficient step size = Absolute value of ((Increment or
Decrement step size) / C(x)_Before)*100
7. Repeat the above method for all the coefficients to find the increment and
decrement step sizes.
Limits
Limits CEI-MR
(Normalized
limit) C(-1),
C(0) and C(1)
For coefficient
increment
For coefficient
decrement
Min 0.5% 0.5% 0.005 0.005
Max 5% 2% 0.025 0.05
Min -5% -2% -0.025 -0.05
Max -0.5% -0.5% -0.005 -0.005
CEI-LR
(Normalized
limit) C(-2),
C(-1), C(0) and
C(1)
CR4 at TP2 and KR4 at TP0a
(Absolute limit)
C(-2) C(-1), C(0) and
C(1)
NOTE. C(x) is an equalizer coefficient and the values can be C(-2), C(-1), C(0),
and C(1)
TekExpress® 400G-TXE Printable Application Help 61

400G-TXE compliance measurements
Coefficient initialization
This measurement measures the values of equalizer coefficient when the DUT is
in OUT_OF_SYNC and NEW_IC states (PRESET1, PRESET2 and PRESET3).
Required test equipment
Minimum system requirements
Equipment connection diagram
Coefficient
Update
state
OUT_OF_S
YNC
NEW_IC PRESET 1 Min -0.025 -0.05 0.95 -0.05
ic_reg Limits CR4 (TP2) and KR4 (TP0a)
C(-2) C(-1) C(0) C(1)
N/A Min -0.025 -0.05 0.95 -0.05
Max 0.025 0.05 1.05 +0.05
Max 0.025 0.05 1.05 0.05
PRESET 2 Min -0.025 -0.2 0.7 -0.15
Max 0.025 -0.1 0.8 -0.05
PRESET 3 Min -0.025 -0.3 0.7 -0.05
Max 0.025 -0.2 0.8 0.05
Measurement procedure
1. Configure the DUT in PRESET state, capture the signal and export the linear
fit pulse curve using PAM4 utility.
2. Configure the DUT into OUT_OF_SYNC state, capture the signal and export
the linear fit pulse using PAM4 utility. Find the values of Equalizer
coefficients in OUT_OF sync state using the linear fit curves of Preset state
and OUT_OF_SYNC state.
3. Configure DUT into NEW_IC state with PRESET1, PRESET2 and
PRESET3. Each time export the linear fit pulse using the PAM4 utility.
Measure the Equalizer coefficients for the each state (PRESET1, PRESET2
and PRESET3). All the time equalizer coefficients should be within the
specified limit as per the specification.
62 TekExpress® 400G-TXE Printable Application Help

400G-TXE compliance measurements
Signaling rate
This section verifies that the signaling speed of the DUT is within the
conformable limits according to the specification.
Required test equipment
Minimum system requirements
Equipment connection diagram
Standard Specification Test Points Limits
Min Max
IEEE-PAM4 AUI4-
IEEE802.3bs,
Draft 3.5, Annex
120D.3.1
IEEE-PAM4 CR4-
IEEE802.3cd,
Section 136.9.3
IEEE-PAM4 KR4-IEEE802.3cd,
Section 137.9.2
TP0a 26.5625 - 100ppm 26.5625 +100 rpm
TP1a 26.5625 - 100ppm 26.5625 +100 rpm
TP4 26.5625 - 100ppm 26.5625 +100 rpm
TP2 26.5625 - 100ppm 26.5625 +100 rpm
TP0a 26.5625 - 100ppm 26.5625 +100 rpm
Measurement procedure
1. Perform oscilloscope settings.
2. Capture the BT filtered differential signal using Math1 as source. Math1 =
BT_filter(Data positive – Data negative)
3. Configure signal source in PAM4 utility and perform single sequence.
4. Signaling rate is measured using PAM4 utility and the results are queried.
TekExpress® 400G-TXE Printable Application Help 63

400G-TXE compliance measurements
Level separation mismatch ratio
This section verifies that the level separation mismatch ratio of the DUT is within
the conformable limits according to the specification.
Required test equipment
Minimum system requirements
Equipment connection diagram
Standard Specification Test Points Limits
Min Max
OIF-PAM4 OIF-CEI-MR,
Table 17-2
OIF-CEI-LR, Table
21-2
IEEE802.3bs 200GAUI-4/
400GAUI-8
IEEE802.3cd 50GBase CR/
100GBase CR2/
200GBase CR4
IEEE802.3cd 50GBase KR/
100GBase KR2/
200GBase KR4
Testpoint-T 0.95 NA
Testpoint-T 0.95 NA
TP0a 0.95 NA
TP2 0.95 NA
TP0a 0.95 NA
Input
Differential signal filtered through a fourth order Bessel Thomson filter with
appropriate bandwidth.
Measurement procedure
The level separation mismatch ratio RLM is defined by the following equation:
RLM = min ( ( 3.ES1), (3.ES2), (2 - 3.ES1), (2-3.ES2))
Where,
ES1 = (V
ES2 = (V
V
= (V-1 + V+1) / 2
mid
V-1, V
-1/3
+1/3
-1/3
, V
- V
/ (V+1 - V
mid
- V
/ (V-1 - V
mid
, and V+1 are the mean signal levels for each symbol of -1, -1/3,
+1/3
mid
mid
)
)
+1/3, and +1 PAM4 symbols, respectively.
64 TekExpress® 400G-TXE Printable Application Help

400G-TXE compliance measurements
Linear fit pulse peak
This section verifies that the linear fit pulse peak voltage of the DUT is within the
conformable limits according to the specification.
Required test equipment
Minimum system requirements
Equipment connection diagram
Standard Specification Test Points Limits
Min Max
OIF-PAM4 OIF-CEI-MR,
Table 17-2
OIF-CEI-LR, Table
21-2
IEEE-PAM4 AUI4-
IEEE802.3bs,
Draft 3.5, Annex
120D.3.1
CR4IEEE802.3cd,
Section 136.9.3
KR4-IEEE802.3cd,
Section 137.9.2
Testpoint-T 0.83*Steady state
voltage
Testpoint-T 0.83*Steady state
voltage
TP0a 0.76*Steady state
voltage
TP2 0.49*Steady state
voltage
TP0a 0.75*Steady state
voltage
NA
NA
NA
NA
NA
Input
Differential signal filtered through a fourth order Bessel Thomson filter with
appropriate bandwidth.
Measurement procedure
The linear fit pulse peak is the peak value of linear fit pulse p(k).
TekExpress® 400G-TXE Printable Application Help 65

400G-TXE compliance measurements
Steady state voltage
This section verifies that the steady state voltage of the DUT is within the
conformable limits according to the specification.
Required test equipment
Minimum system requirements
Equipment connection diagram
Standard Specification Test Points Limits
Min Max
OIF-PAM4 OIF-CEI-MR,
Table 17-2
OIF-CEI-LR, Table
21-2
IEEE802.3bs AUI4-
IEEE802.3bs,
Draft 3.5, Annex
120D.3.1
IEEE802.3cd CR4-
IEEE802.3cd,
Section 136.9.3
IEEE802.3cd KR4-IEEE802.3cd,
Section 137.9.2
Testpoint-T 0.4 V 0.6 V
Testpoint-T 0.4 V 0.6 V
TP0a 0.4 V 0.6 V
TP2 0.34 V 0.6 V
TP0a 0.4 V 0.6 V
66 TekExpress® 400G-TXE Printable Application Help
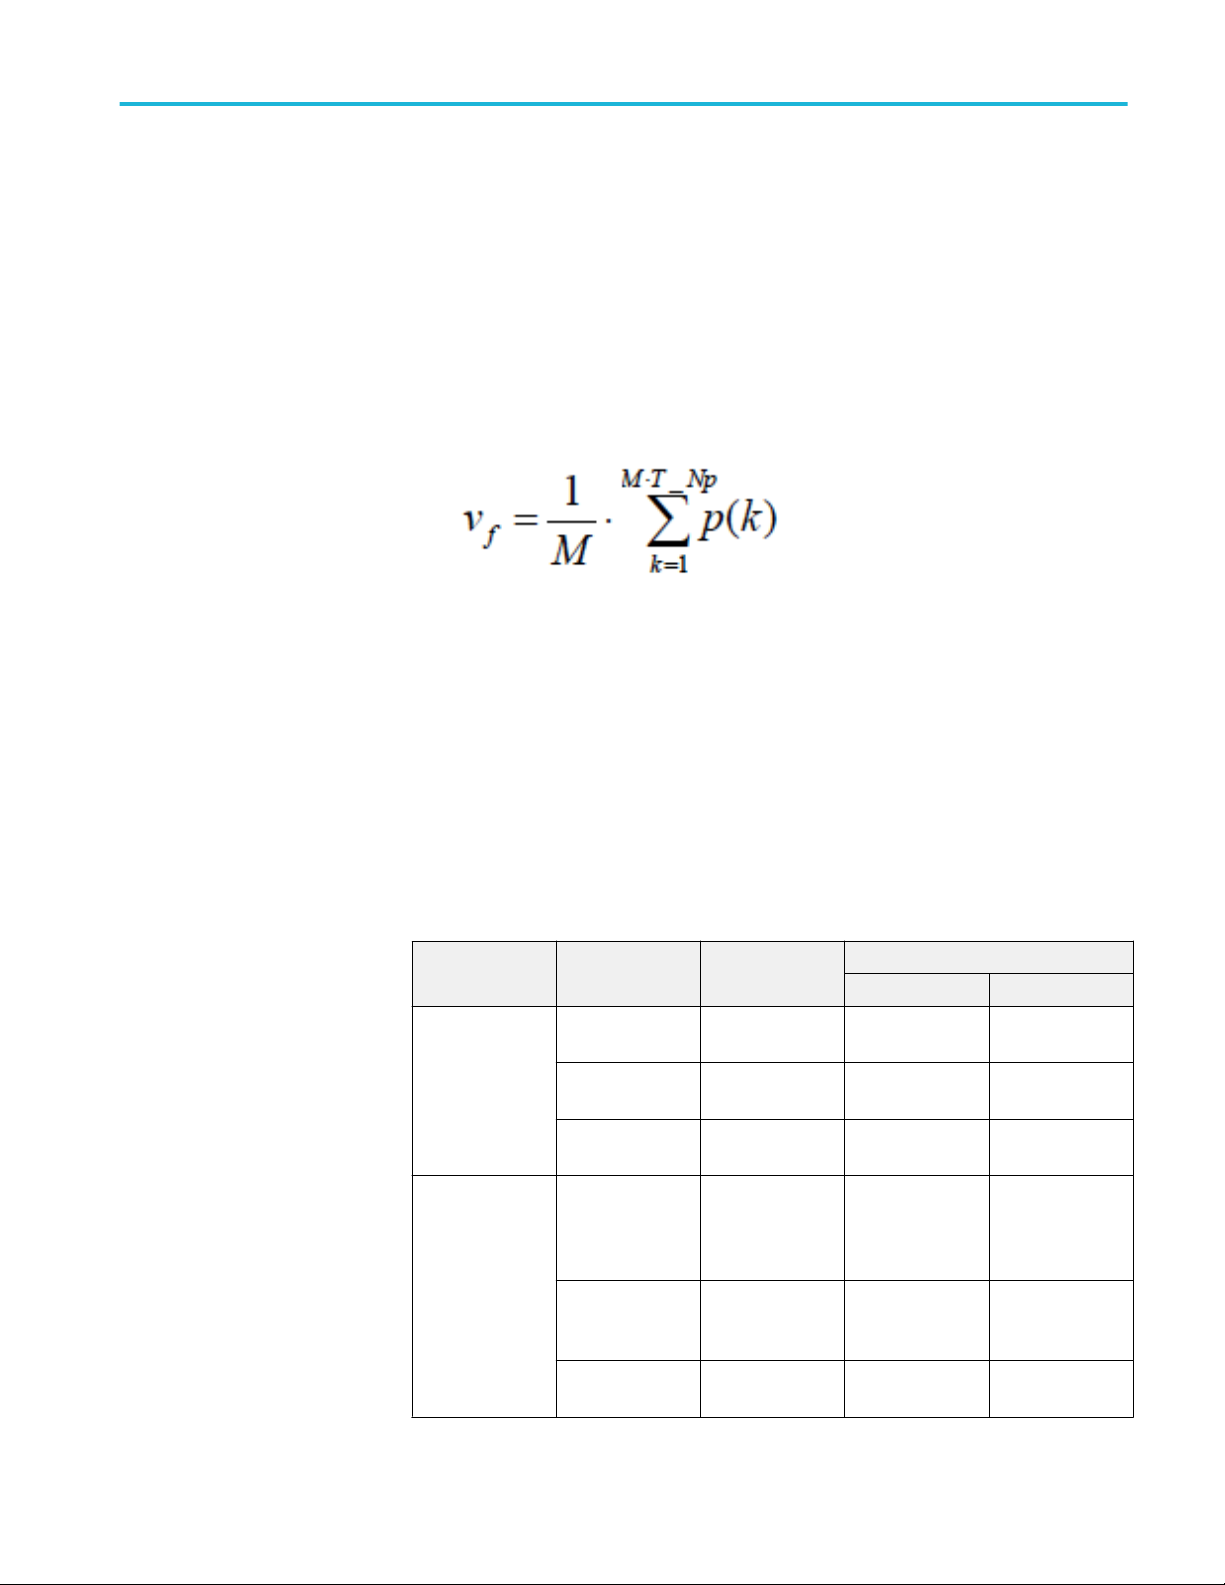
400G-TXE compliance measurements
Input
Differential signal filtered through a fourth order Bessel Thomson filter with
appropriate bandwidth.
Measurement procedure
The steady state voltage vf is defined as the sum of the linear fit pulse p(k),
divided by M, as shown in following equation:
Even odd jitter
This section verifies that the maximum value of the even odd jitter of the DUT is
within the conformable limits according to the specification.
Required test equipment
Minimum system requirements
Equipment connection diagram
Standard Specification Test Points Limits
Min Max
OIF-PAM4 OIF-CEI-VSR,
Table 16-10
OIF-CEI-MR,
Table 17-3
OIF-CEI-LR, Table
21-3
IEEE-PAM4 AUI4-
IEEE802.3bs,
Draft 3.5, Annex
120D.3.1
CR4IEEE802.3cd,
Section 136.9.3
KR4-IEEE802.3cd,
Section 137.9.2
TP0a NA 0.019 UI
Testpoint-T NA 0.019 UI
Testpoint-T NA 0.019 UI
TP0a NA 0.019 UI
TP2 NA 0.019 UI
TP0a NA 0.019 UI
Input
TekExpress® 400G-TXE Printable Application Help 67

400G-TXE compliance measurements
Differential signal filtered through a fourth order Bessel Thomson filter with the
bandwidth of 40 GHz.
Measurement procedure
Even odd jitter is the measure of two repetitions of a QPRBS13-CEI test pattern.
The deviation of the time of each transition from an ideal clock at the signaling
rate is measured.
Even odd jitter is defined as the magnitude of the difference between the average
deviation of all even-numbered transitions and the average deviation of all oddnumbered transitions. Determining if a transition is even or odd is based on the
possible transitions (only actual transitions are measured and averaged).
Uncorrelated bounded high probability jitter & Uncorrelated unbounded gaussian jitter
This section verifies that the maximum value of the uncorrelated bounded high
probability jitter (UBHPJ) and Uncorrelated unbounded gaussian jitter (UUGJ) is
within the conformable limits according to the specification.
Required test equipment
Minimum system requirements
Equipment connection diagram
Standard Specification Test Points UBHPJ limits UUGJ limits
Min Max Min Max
OIF-PAM4 OIF-CEI-VSR,
Table 16-10
TP0a NA 0.05 UI NA 0.01 UI
Input
Differential signal filtered through a fourth order Bessel Thomson filter with
appropriate bandwidth.
Measurement procedure
UBHPJ and UUGJ are measured using a QPRBS13-CEI test pattern. This
measurement requires at least 107 symbols.
This measurement finds all the zero crossings in the signal and then finds the
average pulse width. The difference of the edge time is the jitter value. The jitter
is filtered through a high pass filter. Find the CDF of the filtered jitter. The
UBHPJ and UUGJ are calculated by the following equation:
68 TekExpress® 400G-TXE Printable Application Help
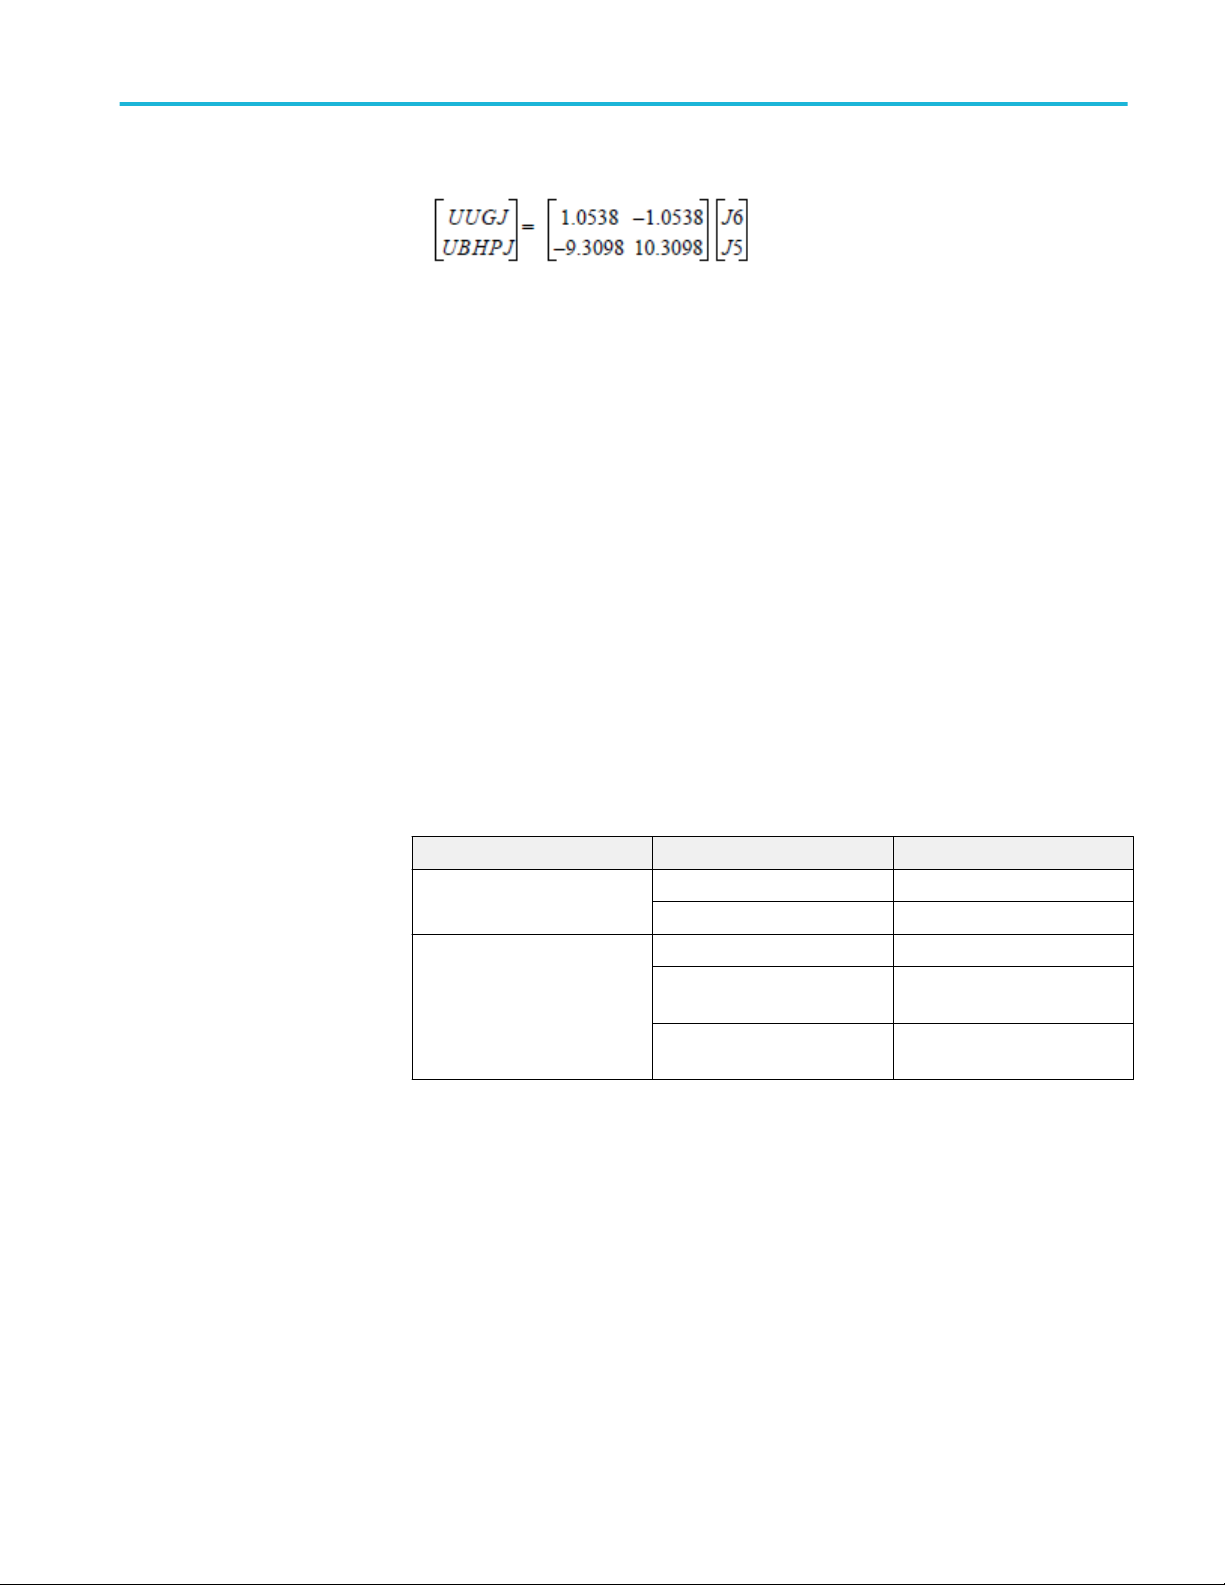
400G-TXE compliance measurements
Where,
J5 is the difference between the τHPF at the (1-0.5 × 10⁻⁵) and 0.5 × 10
-5
probabilities.
J6 as the difference between the τHPF at the (1-0.5 × 10⁻⁶) and 0.5 ×10
-6
probabilities.
Uncorrelated jitter RMS and uncorrelated J4 jitter
This section verifies that the maximum value of the uncorrelated J4 jitter (J4u)
and Uncorrelated Jitter RMS (Jrms) are within the conformable limits according
to the specification.
Required test equipment
Minimum system requirements
Equipment connection diagram
Standard Specification Test Points
OIF-PAM4 CEI-MR T
CEI-LR T
IEEE-PAM4 200GAUI-4/ 400GAUI-8 TP0a
50GBase CR/ 100GBase CR2/
200GBase CR4
50GBase KR/ 100GBase KR2/
200GBase KR4
TP2
TP0a
Input
Differential signal filtered through a fourth order Bessel Thomson filter with
appropriate bandwidth.
Measurement procedure
J4 and Jrms are defined by measurements of 12 specific transitions in a
PRBS13Q pattern to exclude correlated jitter. The 12 transitions represent all
possible combinations of four identical symbols followed by two different
identical symbols as shown in Table 120D–2. The sequences are located by the
symbol indices given in the table where symbols 1 to 7 are the run of seven 3s.
TekExpress® 400G-TXE Printable Application Help 69

400G-TXE compliance measurements
J4 is defined as the time interval that includes all but 10–4 of fJ(t), from the
0.005th to the 99.995th percentile of fJ(t). JRMS is defined as the standard
deviation of fJ(t).
This measurement requires minimum of 3500 specific transitions. Hence the
application will capture 10 waveforms each with 8M. It analyzes the waveforms
one by one using PAM4 utility until it accumulates the required number of
transitions (3500). Incase of noisy signals, more data is needed to get the required
number of transitions which application takes care internally.
Limits
Table 16: J4 jitter limits
Specification Test Points Min Max
CEI-MR T NA 0.118 UI
CEI-LR T NA 0.118 UI
200GAUI-4/
400GAUI-8
50GBase CR/
100GBase CR2/
200GBase CR4
50GBase KR/
100GBase KR2/
200GBase KR4
TP0a NA 0.118 UI
TP2 NA 0.118 UI
TP0a NA 0.118 UI
Table 17: Jrms limits
Specification Test Points Min Max
200GAUI-4/
400GAUI-8
50GBase CR/
100GBase CR2/
200GBase CR4
50GBase KR/
100GBase KR2/
200GBase KR4
TP0a NA 0.023 UI
TP2 NA 0.023 UI
TP0a NA 0.023 UI
70 TekExpress® 400G-TXE Printable Application Help
SCPI commands
About SCPI command
You can use Standard Commands for Programmable Instruments (SCPI) to
communicate with the TekExpress application.
Socket configuration for SCPI commands
This section describes the steps for TCPIP socket configuration and TekVISA
configuration to execute the SCPI commands.
TCPIP socket
configuration
1. Click Start > Control Panel > System and Security > Windows Firewall >
Advanced settings
TekExpress® 400G-TXE Printable Application Help 71

SCPI commands
2. In Windows Firewall with Advanced Security menu, select Windows
Firewall with Advanced Security on Local Computer > Inbound Rules
and click New Rule…
3. In New Inbound Rule Wizard menu
a. Select Port and click Next
72 TekExpress® 400G-TXE Printable Application Help

b. Select TCP as rule apply and enter 5000 for Specific local ports and
click Next
SCPI commands
c. Select Allow the connection and click Next
TekExpress® 400G-TXE Printable Application Help 73

SCPI commands
d. Select Domain, Private, Public and click Next
e. Enter Name, Description (optional), and click Finish
74 TekExpress® 400G-TXE Printable Application Help

SCPI commands
4. Check whether the Rule name is displayed in Windows Firewall with
Advanced Security menu > Inbound Rules
TekExpress® 400G-TXE Printable Application Help 75

SCPI commands
TekVISA configuration
1. Click Start > All Programs > TekVISA > OpenChoice Instrument
Manager
76 TekExpress® 400G-TXE Printable Application Help

SCPI commands
2. Click Search Criteria. In Search Criteria menu, click LAN to Turn-on.
Select Socket from the drop-down list, enter the IP address of the
TekExpress device in Hostname and type Port as 5000. Click
configure the IP address with Port.
Enter the Hostname as 127.0.0.1 if the TekVISA and TekExpress application
are in the same system, else enter the IP address of the TekExpress
application system.
to
TekExpress® 400G-TXE Printable Application Help 77

SCPI commands
3. Click Search to setup the TCPIP connection with the host. Check whether
the TCPIP host name is displayed in OpenChoice Instrument Manager >
Instruments
4. Double-click OpenChoice Talker Listener and enter the Command *IDN?
in command entry field and click Query. Check that the Operation is
successful and Talker Listener Readout displays the Command / Data.
78 TekExpress® 400G-TXE Printable Application Help

SCPI commands
TEKEXP:*IDN?
This command queries the active TekExpress application name running on the
oscilloscope.
Outputs
TEKEXP:*OPC?
Syntax
Inputs
Syntax
Inputs
TEKEXP:*IDN?\n
NA
Returns active TekExpress application name running on the oscilloscope.
TIP. Click here for examples.
This command queries the execution status of the last executed command.
TEKEXP:*OPC?\n
NA
Outputs
TekExpress® 400G-TXE Printable Application Help 79
0 - last command execution is not complete
1 - last command execution is complete
TIP. Click here for examples.

SCPI commands
TEKEXP:ACQUIRE_MODE
This command sets the acquire mode as live or pre-recorded.
Syntax
Inputs
Outputs
TEKEXP:ACQUIRE_MODE {LIVE | PRE-RECORDED}\n
{LIVE | PRE-RECORDED}
NA
TIP. Click here for examples.
TEKEXP:ACQUIRE_MODE?
This command queries the acquire mode type.
Syntax
Inputs
TEKEXP:ACQUIRE_MODE?\n
NA
Outputs
{LIVE | PRE-RECORDED}
TIP. Click here for examples.
80 TekExpress® 400G-TXE Printable Application Help
SCPI commands
TEKEXP:EXPORT
This command returns all the bytes of data to the specified file.
Syntax Outputs
TEKEXP:EXPORT REPORT\n Returns the report file in bytes
TEKEXP:EXPORT WFM,"<FileName>"\n Returns the specified waveform file in bytes
TEKEXP:EXPORT IMAGE,"<FileName>"\n Returns the specified image file in bytes
TEKEXP:INFO?
Inputs
FileName - Specifies the file name
TIP. Click here for examples.
This command queries the information about the file(s).
Syntax Outputs
TEKEXP:INFO? REPORT\n <ReportFileSize>,"<ReportFileName.mht>"
TEKEXP:INFO? WFM\n <WfmFile1Size>,"<WfmFileName1.wfm>";<Wfm
File2Size>,"<WfmFileName2.wfm>";...
TEKEXP:INFO? IMAGE\n <Image1FileSize>,"<Image1FileName>";<Image
2FileSize>,"<Image2FileName>" ;...
TIP. Click here for examples.
TekExpress® 400G-TXE Printable Application Help 81

SCPI commands
TEKEXP:INSTRUMENT
This command sets the value for the selected instrument type.
Syntax
Inputs
Outputs
TEKEXP:INSTRUMENT?
TEKEXP:INSTRUMENT "<InstrumentType>",<Value>"\n
InstrumentType
Value
TIP. Check Command parameters list for InstrumentType and Value parameters.
NA
TIP. Click here for examples.
This command queries the instrument selected for the specified instrument type.
Syntax
Inputs
TEKEXP:INSTRUMENT? "<InstrumentType>"\n
InstrumentType
TIP. Check Command parameters list for InstrumentType parameters.
82 TekExpress® 400G-TXE Printable Application Help
SCPI commands
Outputs
TEKEXP:LASTERROR?
Syntax
Inputs
Outputs
Returns the instrument selected for the specified instrument type
TIP. Click here for examples.
This command queries the last error string occurred for the current TCP session.
If there are no errors since startup, or since the last call to
TEKEXP:LASTERROR?\n, this command returns an empty string.
TEKEXP:LASTERROR?\n
NA
<string>
TEKEXP:LIST?
TIP. Click here for examples.
This command queries the list of available device, suite, test, version or
instrument.
Syntax Outputs
TEKEXP:LIST? DEVICE\n Returns the list of available device(s) as comma
separated values.
TEKEXP:LIST? SUITE\n Returns the list of available suite(s) as comma
separated values.
TEKEXP:LIST? TEST\n Returns the list of available test(s) as comma
separated values.
TEKEXP:LIST? VERSION\n Returns the list of available version(s) as comma
separated values.
TEKEXP:LIST?
INSTRUMENT,"<InstrumentType>"\n
Returns the list of available instruments' for the
given Instrument type as comma separated
values.
TekExpress® 400G-TXE Printable Application Help 83
SCPI commands
NOTE. This command returns the list of items within double quotes (""). Iterate
the receive procedure until the list ends with double quotes otherwise the next
query commands won’t work as expected.
TEKEXP:MODE
Inputs
Syntax
Inputs
Outputs
InstrumentType
TIP. Check Command parameters list for InstrumentType parameters.
TIP. Click here for examples.
This command sets the execution mode as compliance or user defined.
TEKEXP:MODE {COMPLIANCE | USER-DEFINED}\n
{COMPLIANCE | USER-DEFINED}
NA
TIP. Click here for examples.
84 TekExpress® 400G-TXE Printable Application Help

SCPI commands
TEKEXP:MODE?
This command queries the execution mode type.
Syntax
Outputs
TEKEXP:POPUP
Syntax
Inputs
Inputs
TEKEXP:MODE?\n
NA
{COMPLIANCE | USER-DEFINED}
TIP. Click here for examples.
This command sets the response to the active popup shown in the application.
TEKEXP:POPUP “<PopupResponse>”\n
PopupResponse
Outputs
NA
TIP. Click here for examples.
TekExpress® 400G-TXE Printable Application Help 85

SCPI commands
TEKEXP:POPUP?
This command queries the active popup information shown in the application.
Syntax
Inputs
Outputs
TEKEXP:REPORT
Syntax
Inputs
TEKEXP:POPUP?\n
NA
Returns the active popup information in the application.
TIP. Click here for examples.
This command generates the report for the current session.
TEKEXP:REPORT GENERATE\n
GENERATE
Outputs
NA
TIP. Click here for examples.
86 TekExpress® 400G-TXE Printable Application Help

SCPI commands
TEKEXP:REPORT?
This command queries the queried header field value in the report.
Syntax
Inputs
Outputs
TEKEXP:RESULT?
TEKEXP:REPORT? “<HeaderField>”\n
HeaderField - Specifies to return the measured value for the indicated test.
TIP. Check Report for HeaderField parameters.
Returns the queried header field value in the report
TIP. Click here for examples.
This command queries the result available in report summary/details table.
Syntax Outputs
TEKEXP:RESULT? "<TestName>"\n Return Pass/Fail status of the test.
TEKEXP:RESULT?
"<TestName>","<ColumnName>"\n
TEKEXP:RESULT?
"<TestName>","<ColumnName>",<RowNumber
>\n
Returns all the row values of the specified
column for the test.
Returns the column value for the specified row
number
1
1
Row number starts from zero.
TekExpress® 400G-TXE Printable Application Help 87

SCPI commands
Inputs
TEKEXP:SELECT
Syntax
TestName - Specifies the name of the test for which to obtain the test result
value.
ColumnName - Specifies the column name for the measurement
RowNumber - Specifies the row number of the measurement
TIP. Check Results panel for TestName, ColumnName, and RowNumber
parameters.
TIP. Click here for examples.
This command selects the device, suite, version, or test.
TEKEXP:SELECT <string1>,<string2>,<string4>\n
TEKEXP:SELECT TEST,<string3>,<string4>\n
Inputs
<string1> = {DEVICE | SUITE | VERSION}
<string2> = {DeviceName | SuiteName | VersionName}
<string3> = {“<TestName>"| ALL| REQUIRED }
<string4> = {TRUE | FALSE}
TIP. Check Command parameters list for DeviceName, SuiteName, VersionName,
and TestName parameters.
TIP. Click here for examples.
88 TekExpress® 400G-TXE Printable Application Help

SCPI commands
Outputs
TEKEXP:SELECT?
Syntax
Inputs
Outputs
NA
This command queries the name of the selected device, suite, version, or test.
TEKEXP:SELECT? {DEVICE | SUITE | TEST | VERSION}\n
{DEVICE | SUITE | TEST | VERSION}
Returns the name of the selected device, suite, version, or test.
TIP. Click here for examples.
TEKEXP:SETUP
Inputs
This command sets the value of the current setup.
Syntax Outputs
TEKEXP:SETUP DEFAULT\n Restore to default Setup
TEKEXP:SETUP OPEN,"<SessionName>"\n Open the session
TEKEXP:SETUP SAVE\n Save the session
TEKEXP:SETUP SAVE,"<SessionName>"\n Save the session
SessionName - The name of the session
TIP. Click here for examples.
TekExpress® 400G-TXE Printable Application Help 89
SCPI commands
TEKEXP:STATE
This command sets the execution state of the application.
Syntax
Inputs
Outputs
TEKEXP:STATE?
TEKEXP:STATE {RUN | STOP | PAUSE | RESUME}\n
{RUN | STOP | PAUSE | RESUME}
NA
TIP. Click here for examples.
This command queries the current setup state.
Syntax Outputs
TEKEXP:STATE? RUNNING | PAUSED | WAIT | ERROR | READY
| STOPPED
TEKEXP:STATE? SETUP SAVED | NOT_SAVED
TIP. Click here for examples.
90 TekExpress® 400G-TXE Printable Application Help
Loading...