

Page 1

User Manual
TDS 694C
Digital Real-Time Oscilloscope
071-0473-00
This document supports firmware version 1.0 and
above.
Page 2

Copyright © T ektronix, Inc. All rights reserved. Licensed software products are owned by Tektronix or its suppliers and
are protected by United States copyright laws and international treaty provisions.
Use, duplication, or disclosure by the Government is subject to restrictions as set forth in subparagraph (c)(1)(ii) of the
Rights in T echnical Data and Computer Software clause at DFARS 252.227-7013, or subparagraphs (c)(1) and (2) of the
Commercial Computer Software – Restricted Rights clause at F AR 52.227-19, as applicable.
T ektronix products are covered by U.S. and foreign patents, issued and pending. Information in this publication supercedes
that in all previously published material. Specifications and price change privileges reserved.
Printed in the U.S.A.
T ektronix, Inc., P.O. Box 1000, Wilsonville, OR 97070–1000
TEKTRONIX and TEK are registered trademarks of T ektronix, Inc.
Page 3

WARRANTY
T ektronix warrants that this product will be free from defects in materials and workmanship for a period of three (3) years
from the date of shipment. If any such product proves defective during this warranty period, T ektronix, at its option, either
will repair the defective product without charge for parts and labor, or will provide a replacement in exchange for the
defective product.
In order to obtain service under this warranty, Customer must notify Tektronix of the defect before the expiration of the
warranty period and make suitable arrangements for the performance of service. Customer shall be responsible for
packaging and shipping the defective product to the service center designated by T ektronix, with shipping charges prepaid.
T ektronix shall pay for the return of the product to Customer if the shipment is to a location within the country in which the
T ektronix service center is located. Customer shall be responsible for paying all shipping charges, duties, taxes, and any
other charges for products returned to any other locations.
This warranty shall not apply to any defect, failure or damage caused by improper use or improper or inadequate
maintenance and care. T ektronix shall not be obligated to furnish service under this warranty a) to repair damage resulting
from attempts by personnel other than T ektronix representatives to install, repair or service the product; b) to repair
damage resulting from improper use or connection to incompatible equipment; or c) to service a product that has been
modified or integrated with other products when the effect of such modification or integration increases the time or
difficulty of servicing the product.
THIS WARRANTY IS GIVEN BY TEKTRONIX WITH RESPECT TO THIS PRODUCT IN LIEU OF ANY
OTHER WARRANTIES, EXPRESSED OR IMPLIED. TEKTRONIX AND ITS VENDORS DISCLAIM ANY
IMPLIED WARRANTIES OF MERCHANTABILITY OR FITNESS FOR A PAR TICULAR PURPOSE.
TEKTRONIX’ RESPONSIBILITY TO REPAIR OR REPLACE DEFECTIVE PRODUCTS IS THE SOLE AND
EXCLUSIVE REMEDY PROVIDED TO THE CUST OMER FOR BREACH OF THIS WARRANTY. TEKTRONIX
AND ITS VENDORS WILL NOT BE LIABLE FOR ANY INDIRECT , SPECIAL, INCIDENTAL, OR
CONSEQUENTIAL DAMAGES IRRESPECTIVE OF WHETHER TEKTRONIX OR THE VENDOR HAS
ADVANCE NOTICE OF THE POSSIBILITY OF SUCH DAMAGES.
Page 4

Page 5

Table of Contents
Getting Started
Operating Basics
General Safety Summary ix. . . . . . . . . . . . . . . . . . . . . . . . . . . . . . . . . . . .
Preface xi. . . . . . . . . . . . . . . . . . . . . . . . . . . . . . . . . . . . . . . . . . . . . . . . . . .
Related Manuals xi. . . . . . . . . . . . . . . . . . . . . . . . . . . . . . . . . . . . . . . . . . . . . . . . . .
Conventions xi. . . . . . . . . . . . . . . . . . . . . . . . . . . . . . . . . . . . . . . . . . . . . . . . . . . . .
Product Description 1–1. . . . . . . . . . . . . . . . . . . . . . . . . . . . . . . . . . . . . . . . .
TDS 694C Features 1–3. . . . . . . . . . . . . . . . . . . . . . . . . . . . . . . . . . . . . . . . . . . . . . .
Product Specification 1–4. . . . . . . . . . . . . . . . . . . . . . . . . . . . . . . . . . . . . . . . . . . . . .
Start Up 1–5. . . . . . . . . . . . . . . . . . . . . . . . . . . . . . . . . . . . . . . . . . . . . . . . . .
Preparation 1–5. . . . . . . . . . . . . . . . . . . . . . . . . . . . . . . . . . . . . . . . . . . . . . . . . . . . . .
Putting into Service 1–5. . . . . . . . . . . . . . . . . . . . . . . . . . . . . . . . . . . . . . . . . . . . . . .
Overview 2–1. . . . . . . . . . . . . . . . . . . . . . . . . . . . . . . . . . . . . . . . . . . . . . . . . .
Operating Interface Maps 2–3. . . . . . . . . . . . . . . . . . . . . . . . . . . . . . . . . . .
Tutorial 2–9. . . . . . . . . . . . . . . . . . . . . . . . . . . . . . . . . . . . . . . . . . . . . . . . . . . . . . . . .
Example 1: Displaying a Waveform 2–13. . . . . . . . . . . . . . . . . . . . . . . . . . . . . . . . . .
Example 2: Displaying Multiple Waveforms 2–16. . . . . . . . . . . . . . . . . . . . . . . . . . . .
Example 3: T aking Automated Measurements 2–20. . . . . . . . . . . . . . . . . . . . . . . . . .
Example 4: Saving Setups 2–26. . . . . . . . . . . . . . . . . . . . . . . . . . . . . . . . . . . . . . . . . .
Reference
Overview 3–1. . . . . . . . . . . . . . . . . . . . . . . . . . . . . . . . . . . . . . . . . . . . . . . . . .
Acquiring and Displaying Waveforms 3–5. . . . . . . . . . . . . . . . . . . . . . . . .
Coupling Waveforms to the Oscilloscope 3–5. . . . . . . . . . . . . . . . . . . . . . . . . . . . . .
Setting up Automatically: Autoset and Reset 3–6. . . . . . . . . . . . . . . . . . . . . . . . . . .
Selecting Channels 3–8. . . . . . . . . . . . . . . . . . . . . . . . . . . . . . . . . . . . . . . . . . . . . . . .
Scaling and Positioning Waveforms 3–10. . . . . . . . . . . . . . . . . . . . . . . . . . . . . . . . . .
Choosing an Acquisition Mode 3–17. . . . . . . . . . . . . . . . . . . . . . . . . . . . . . . . . . . . . .
Customizing the Display 3–25. . . . . . . . . . . . . . . . . . . . . . . . . . . . . . . . . . . . . . . . . . .
Customizing the Display Color 3–30. . . . . . . . . . . . . . . . . . . . . . . . . . . . . . . . . . . . . .
Zooming on Waveforms 3–34. . . . . . . . . . . . . . . . . . . . . . . . . . . . . . . . . . . . . . . . . . . .
Triggering on Waveforms 3–41. . . . . . . . . . . . . . . . . . . . . . . . . . . . . . . . . . . .
Triggering Concepts 3–41. . . . . . . . . . . . . . . . . . . . . . . . . . . . . . . . . . . . . . . . . . . . . . .
Triggering from the Front Panel 3–46. . . . . . . . . . . . . . . . . . . . . . . . . . . . . . . . . . . . .
Triggering on a Waveform Edge 3–49. . . . . . . . . . . . . . . . . . . . . . . . . . . . . . . . . . . . .
Triggering Based on Logic 3–53. . . . . . . . . . . . . . . . . . . . . . . . . . . . . . . . . . . . . . . . . .
Triggering on Pulses 3–69. . . . . . . . . . . . . . . . . . . . . . . . . . . . . . . . . . . . . . . . . . . . . . .
Delayed Triggering 3–82. . . . . . . . . . . . . . . . . . . . . . . . . . . . . . . . . . . . . . . . . . . . . . .
Measuring Waveforms 3–89. . . . . . . . . . . . . . . . . . . . . . . . . . . . . . . . . . . . . .
T aking Automated Measurements 3–90. . . . . . . . . . . . . . . . . . . . . . . . . . . . . . . . . . . .
T aking Cursor Measurements 3–100. . . . . . . . . . . . . . . . . . . . . . . . . . . . . . . . . . . . . . .
TDS 694C User Manual
i
Page 6

Table of Contents
T aking Graticule Measurements 3–105. . . . . . . . . . . . . . . . . . . . . . . . . . . . . . . . . . . . .
Displaying Histograms 3–106. . . . . . . . . . . . . . . . . . . . . . . . . . . . . . . . . . . . . . . . . . . . .
Optimizing Measurement Accuracy: SPC and Probe Cal 3–110. . . . . . . . . . . . . . . . . .
Saving Waveforms and Setups 3–117. . . . . . . . . . . . . . . . . . . . . . . . . . . . . . . .
Saving and Recalling Setups 3–117. . . . . . . . . . . . . . . . . . . . . . . . . . . . . . . . . . . . . . . .
Saving and Recalling Waveforms and Acquisitions 3–120. . . . . . . . . . . . . . . . . . . . . .
Managing the File System 3–124. . . . . . . . . . . . . . . . . . . . . . . . . . . . . . . . . . . . . . . . . .
Printing a Hardcopy 3–129. . . . . . . . . . . . . . . . . . . . . . . . . . . . . . . . . . . . . . . . . . . . . . .
Communicating with Remote Instruments 3–139. . . . . . . . . . . . . . . . . . . . . . . . . . . . . .
Determining Status and Accessing Help 3–143. . . . . . . . . . . . . . . . . . . . . . . .
Displaying Status 3–143. . . . . . . . . . . . . . . . . . . . . . . . . . . . . . . . . . . . . . . . . . . . . . . . .
Displaying the Banner 3–145. . . . . . . . . . . . . . . . . . . . . . . . . . . . . . . . . . . . . . . . . . . . .
Displaying Help 3–145. . . . . . . . . . . . . . . . . . . . . . . . . . . . . . . . . . . . . . . . . . . . . . . . . .
Using Features for Advanced Applications 3–147. . . . . . . . . . . . . . . . . . . . . .
Limit Testing 3–147. . . . . . . . . . . . . . . . . . . . . . . . . . . . . . . . . . . . . . . . . . . . . . . . . . . .
Waveform Math 3–152. . . . . . . . . . . . . . . . . . . . . . . . . . . . . . . . . . . . . . . . . . . . . . . . . .
Fast Fourier Transforms 3–155. . . . . . . . . . . . . . . . . . . . . . . . . . . . . . . . . . . . . . . . . . . .
Waveform Differentiation 3–174. . . . . . . . . . . . . . . . . . . . . . . . . . . . . . . . . . . . . . . . . .
Waveform Integration 3–179. . . . . . . . . . . . . . . . . . . . . . . . . . . . . . . . . . . . . . . . . . . . .
Appendices
Glossary
Index
Appendix A: Options and Accessories A–1. . . . . . . . . . . . . . . . . . . . . . . . . .
Appendix B: Algorithms B–1. . . . . . . . . . . . . . . . . . . . . . . . . . . . . . . . . . . . .
Appendix C: Packaging for Shipment C–1. . . . . . . . . . . . . . . . . . . . . . . . . .
Appendix D: Probe Selection D–1. . . . . . . . . . . . . . . . . . . . . . . . . . . . . . . . .
Appendix E: Inspection and Cleaning E–1. . . . . . . . . . . . . . . . . . . . . . . . . .
Appendix F: Programmer Disk F–1. . . . . . . . . . . . . . . . . . . . . . . . . . . . . . .
TDS 694C User Manual
ii
Page 7

List of Figures
Table of Contents
Figure 1–1: Rear Panel Controls Used in Start Up 1–7. . . . . . . . . . . . . . .
Figure 1–2: ON/STBY Button 1–8. . . . . . . . . . . . . . . . . . . . . . . . . . . . . . . .
Figure 2–1: Deskew Fixture Connections
(two P6249 probes shown) 2–9. . . . . . . . . . . . . . . . . . . . . . . . . . . . . . . .
Figure 2–2: Connecting a Probe for the Examples
(P6249 shown) 2–10. . . . . . . . . . . . . . . . . . . . . . . . . . . . . . . . . . . . . . . . . .
Figure 2–3: SETUP Button Location 2–10. . . . . . . . . . . . . . . . . . . . . . . . . . .
Figure 2–4: The Setup Menu 2–11. . . . . . . . . . . . . . . . . . . . . . . . . . . . . . . . .
Figure 2–5: Trigger Controls 2–12. . . . . . . . . . . . . . . . . . . . . . . . . . . . . . . . .
Figure 2–6: The Display After Factory Initialization 2–13. . . . . . . . . . . . .
Figure 2–7: The VERTICAL and HORIZONTAL Controls 2–14. . . . . . .
Figure 2–8: TRIGGER Controls 2–15. . . . . . . . . . . . . . . . . . . . . . . . . . . . . .
Figure 2–9: AUTOSET Button Location 2–16. . . . . . . . . . . . . . . . . . . . . . . .
Figure 2–10: The Display After Pressing Autoset 2–16. . . . . . . . . . . . . . . .
Figure 2–11: The Channel Buttons and Lights 2–17. . . . . . . . . . . . . . . . . . .
Figure 2–12: The Vertical Main Menu and Coupling
Side Menu 2–19. . . . . . . . . . . . . . . . . . . . . . . . . . . . . . . . . . . . . . . . . . . . .
Figure 2–13: The Menus After Changing Channels 2–20. . . . . . . . . . . . . .
Figure 2–14: Measure Main Menu and Select Measurement
Side Menu 2–22. . . . . . . . . . . . . . . . . . . . . . . . . . . . . . . . . . . . . . . . . . . . .
Figure 2–15: Four Simultaneous Measurement Readouts 2–23. . . . . . . . .
Figure 2–16: General Purpose Knob Indicators 2–24. . . . . . . . . . . . . . . . .
Figure 2–17: Snapshot of Channel 1 2–26. . . . . . . . . . . . . . . . . . . . . . . . . . .
Figure 2–18: Save/Recall Setup Menu 2–27. . . . . . . . . . . . . . . . . . . . . . . . . .
TDS 694C User Manual
Figure 3–1: The Channel Readout 3–8. . . . . . . . . . . . . . . . . . . . . . . . . . . . .
Figure 3–2: Waveform Selection Priority 3–9. . . . . . . . . . . . . . . . . . . . . . .
Figure 3–3: Scaling and Positioning 3–11. . . . . . . . . . . . . . . . . . . . . . . . . . .
Figure 3–4: Vertical Readouts and Channel Menu 3–12. . . . . . . . . . . . . . .
Figure 3–5: Record View and Time Base Readouts 3–14. . . . . . . . . . . . . . .
Figure 3–6: Horizontal Controls 3–15. . . . . . . . . . . . . . . . . . . . . . . . . . . . . .
Figure 3–7: Acquisition: Input Analog Signal,
Sample, and Digitize 3–18. . . . . . . . . . . . . . . . . . . . . . . . . . . . . . . . . . . . .
Figure 3–8: Several Points May be Acquired for
Each Point Used 3–18. . . . . . . . . . . . . . . . . . . . . . . . . . . . . . . . . . . . . . . .
Figure 3–9: Real-Time Sampling 3–19. . . . . . . . . . . . . . . . . . . . . . . . . . . . . .
iii
Page 8

Table of Contents
Figure 3–10: How the Acquisition Modes Work 3–21. . . . . . . . . . . . . . . . .
Figure 3–11: Acquisition Menu and Readout 3–22. . . . . . . . . . . . . . . . . . . .
Figure 3–12: Acquire Menu — Stop After 3–23. . . . . . . . . . . . . . . . . . . . . .
Figure 3–13: Aliasing 3–24. . . . . . . . . . . . . . . . . . . . . . . . . . . . . . . . . . . . . . . .
Figure 3–14: Display Menu — Style 3–26. . . . . . . . . . . . . . . . . . . . . . . . . . .
Figure 3–15: Trigger Point and Level Indicators 3–27. . . . . . . . . . . . . . . . .
Figure 3–16: Display Menu — Setting 3–30. . . . . . . . . . . . . . . . . . . . . . . . .
Figure 3–17: Display Menu — Palette Colors 3–32. . . . . . . . . . . . . . . . . . .
Figure 3–18: Display Menu — Map Reference Colors 3–33. . . . . . . . . . . .
Figure 3–19: Display Menu — Restore Colors 3–34. . . . . . . . . . . . . . . . . . .
Figure 3–20: Zoom Mode with Horizontal Lock Set to None 3–37. . . . . . .
Figure 3–21: Dual Window (Preview) Mode 3–38. . . . . . . . . . . . . . . . . . . . .
Figure 3–22: Dual Zoom — Shown Dual Window
(Preview) Mode 3–40. . . . . . . . . . . . . . . . . . . . . . . . . . . . . . . . . . . . . . . . .
Figure 3–23: Triggered Versus Untriggered Displays 3–42. . . . . . . . . . . . .
Figure 3–24: Trigger Holdoff Time Ensures Valid Triggering 3–44. . . . . .
Figure 3–25: Slope and Level Controls Help Define the Trigger 3–45. . . .
Figure 3–26: TRIGGER Controls and Status Lights 3–46. . . . . . . . . . . . . .
Figure 3–27: Example Trigger Readouts — Edge
Trigger Selected 3–48. . . . . . . . . . . . . . . . . . . . . . . . . . . . . . . . . . . . . . . . .
Figure 3–28: Record View, Trigger Position, and Trigger Level Bar
Readouts 3–49. . . . . . . . . . . . . . . . . . . . . . . . . . . . . . . . . . . . . . . . . . . . . . .
Figure 3–29: Edge Trigger Readouts 3–50. . . . . . . . . . . . . . . . . . . . . . . . . . .
Figure 3–30: Main Trigger Menu — Edge Type 3–50. . . . . . . . . . . . . . . . .
Figure 3–31: Violation Zones for Setup/Hold Triggering 3–56. . . . . . . . . .
Figure 3–32: Logic Trigger Readouts — State Class Selected 3–57. . . . . .
Figure 3–33: Logic Trigger Menu 3–58. . . . . . . . . . . . . . . . . . . . . . . . . . . . .
Figure 3–34: Logic Trigger Menu — Time Qualified TRUE 3–60. . . . . . .
Figure 3–35: Triggering on a Setup/Hold Time Violation 3–64. . . . . . . . . .
Figure 3–36: TLA 714 to TDS 694C 3–66. . . . . . . . . . . . . . . . . . . . . . . . . . .
Figure 3–37: TLA 720 to TDS 694C 3–66. . . . . . . . . . . . . . . . . . . . . . . . . . .
Figure 3–38: Pulse Trigger Readouts 3–70. . . . . . . . . . . . . . . . . . . . . . . . . .
Figure 3–39: Main Trigger Menu — Glitch Class 3–72. . . . . . . . . . . . . . . .
Figure 3–40: Main Trigger Menu — Runt Class 3–75. . . . . . . . . . . . . . . . .
Figure 3–41: Main Trigger Menu — Slew Rate Class 3–80. . . . . . . . . . . . .
Figure 3–42: Delayed Runs After Main 3–83. . . . . . . . . . . . . . . . . . . . . . . . .
Figure 3–43: Delayed Triggerable 3–83. . . . . . . . . . . . . . . . . . . . . . . . . . . . .
Figure 3–44: How the Delayed Triggers Work 3–85. . . . . . . . . . . . . . . . . . .
Figure 3–45: Delayed Trigger Menu 3–87. . . . . . . . . . . . . . . . . . . . . . . . . . .
TDS 694C User Manual
iv
Page 9

Table of Contents
Figure 3–46: Histogram, Graticule, Cursor and
Automated Measurements 3–89. . . . . . . . . . . . . . . . . . . . . . . . . . . . . . . .
Figure 3–47: Measurement Readouts with Statistics 3–93. . . . . . . . . . . . . .
Figure 3–48: Measure Menu 3–94. . . . . . . . . . . . . . . . . . . . . . . . . . . . . . . . . .
Figure 3–49: Measure Menu — Gating 3–95. . . . . . . . . . . . . . . . . . . . . . . . .
Figure 3–50: Measure Menu — Reference Levels 3–97. . . . . . . . . . . . . . . .
Figure 3–51: Measure Delay Menu — Delay To 3–98. . . . . . . . . . . . . . . . . .
Figure 3–52: Snapshot Menu and Readout 3–99. . . . . . . . . . . . . . . . . . . . . .
Figure 3–53: Cursor Types 3–101. . . . . . . . . . . . . . . . . . . . . . . . . . . . . . . . . . .
Figure 3–54: Cursor Modes 3–102. . . . . . . . . . . . . . . . . . . . . . . . . . . . . . . . . .
Figure 3–55: H Bars Cursor Menu and Readouts 3–103. . . . . . . . . . . . . . . .
Figure 3–56: Paired Cursor Menu and Readouts 3–104. . . . . . . . . . . . . . . .
Figure 3–57: Histogram Menu and Vertical Histogram 3–107. . . . . . . . . . .
Figure 3–58: Performing a Signal Path Compensation 3–111. . . . . . . . . . . .
Figure 3–59: Probe Cal Menu and Gain Compensation Display 3–113. . . .
Figure 3–60: Re-use Probe Calibration Data Menu 3–115. . . . . . . . . . . . . . .
Figure 3–61: Save/Recall Setup Menu 3–118. . . . . . . . . . . . . . . . . . . . . . . . . .
Figure 3–62: Save Waveform Menu 3–121. . . . . . . . . . . . . . . . . . . . . . . . . . .
Figure 3–63: More Menu 3–123. . . . . . . . . . . . . . . . . . . . . . . . . . . . . . . . . . . .
Figure 3–64: File Utilities 3–125. . . . . . . . . . . . . . . . . . . . . . . . . . . . . . . . . . . .
Figure 3–65: File System — Labeling Menu 3–126. . . . . . . . . . . . . . . . . . . . .
Figure 3–66: Utility Menu — System I/O 3–131. . . . . . . . . . . . . . . . . . . . . . .
Figure 3–67: Hardcopy Formats 3–132. . . . . . . . . . . . . . . . . . . . . . . . . . . . . .
Figure 3–68: Date and Time Display 3–133. . . . . . . . . . . . . . . . . . . . . . . . . . .
Figure 3–69: Connecting the Oscilloscope Directly to the
Hardcopy Device 3–134. . . . . . . . . . . . . . . . . . . . . . . . . . . . . . . . . . . . . . . .
Figure 3–70: Connecting the Oscilloscope and Hardcopy
Device Via a PC 3–137. . . . . . . . . . . . . . . . . . . . . . . . . . . . . . . . . . . . . . . . .
Figure 3–71: Typical GPIB Network Configuration 3–140. . . . . . . . . . . . . .
Figure 3–72: Stacking GPIB Connectors 3–140. . . . . . . . . . . . . . . . . . . . . . .
Figure 3–73: Connecting the Oscilloscope to a Controller 3–141. . . . . . . . .
Figure 3–74: Utility Menu 3–142. . . . . . . . . . . . . . . . . . . . . . . . . . . . . . . . . . . .
Figure 3–75: Status Menu — System 3–144. . . . . . . . . . . . . . . . . . . . . . . . . .
Figure 3–76: Banner Display 3–145. . . . . . . . . . . . . . . . . . . . . . . . . . . . . . . . .
Figure 3–77: Initial Help Screen 3–146. . . . . . . . . . . . . . . . . . . . . . . . . . . . . .
Figure 3–78: Comparing a Waveform to a Limit Template 3–148. . . . . . . .
Figure 3–79: Acquire Menu — Create Limit Test Template 3–149. . . . . . . .
Figure 3–80: More Menu 3–153. . . . . . . . . . . . . . . . . . . . . . . . . . . . . . . . . . . .
Figure 3–81: Dual Waveform Math Main and Side Menus 3–154. . . . . . . .
TDS 694C User Manual
v
Page 10

Table of Contents
Figure 3–82: System Response to an Impulse 3–157. . . . . . . . . . . . . . . . . . . .
Figure 3–83: Define FFT Waveform Menu 3–158. . . . . . . . . . . . . . . . . . . . . .
Figure 3–84: FFT Math Waveform in Math1 3–160. . . . . . . . . . . . . . . . . . . .
Figure 3–85: Cursor Measurement of an FFT Waveform 3–161. . . . . . . . . .
Figure 3–86: Waveform Record vs. FFT Time Domain Record 3–163. . . . .
Figure 3–87: FFT Time Domain Record vs. FFT Frequency
Domain Record 3–164. . . . . . . . . . . . . . . . . . . . . . . . . . . . . . . . . . . . . . . . .
Figure 3–88: How Aliased Frequencies Appear in an FFT 3–168. . . . . . . . .
Figure 3–89: Windowing the FFT Time Domain Record 3–171. . . . . . . . . .
Figure 3–90: FFT Windows and Bandpass Characteristics 3–174. . . . . . . .
Figure 3–91: Derivative Math Waveform 3–176. . . . . . . . . . . . . . . . . . . . . . .
Figure 3–92: Peak-Peak Amplitude Measurement of a
Derivative Waveform 3–177. . . . . . . . . . . . . . . . . . . . . . . . . . . . . . . . . . . .
Figure 3–93: Integral Math Waveform 3–181. . . . . . . . . . . . . . . . . . . . . . . . .
Figure 3–94: H Bars Cursors Measure an Integral Math
Waveform 3–182. . . . . . . . . . . . . . . . . . . . . . . . . . . . . . . . . . . . . . . . . . . . . .
Figure B–1: MCross Calculations B–4. . . . . . . . . . . . . . . . . . . . . . . . . . . . .
Figure B–2: Fall Time B–9. . . . . . . . . . . . . . . . . . . . . . . . . . . . . . . . . . . . . . .
Figure B–3: Rise Time B–14. . . . . . . . . . . . . . . . . . . . . . . . . . . . . . . . . . . . . . .
Figure B–4: Choosing Minima or Maxima to Use for Envelope
Measurements B–16. . . . . . . . . . . . . . . . . . . . . . . . . . . . . . . . . . . . . . . . . .
Figure D–1: Typical High Voltage Probes D–3. . . . . . . . . . . . . . . . . . . . . . .
Figure D–2: A6303 Current Probe Used in the
AM 503S Opt. 03 D–5. . . . . . . . . . . . . . . . . . . . . . . . . . . . . . . . . . . . . . . .
Figure F–1: Equipment Needed to Run the Example Programs F–1. . . .
TDS 694C User Manual
vi
Page 11

List of Tables
Table of Contents
Table 1–1: Key Features of TDS 694C 1–3. . . . . . . . . . . . . . . . . . . . . . . . .
Table 1–2: Fuse and fuse cap part numbers 1–7. . . . . . . . . . . . . . . . . . . .
Table 3–1: Autoset defaults 3–7. . . . . . . . . . . . . . . . . . . . . . . . . . . . . . . . . .
Table 3–2: XY Format pairs 3–29. . . . . . . . . . . . . . . . . . . . . . . . . . . . . . . . .
Table 3–3: Pattern and State Logic 3–54. . . . . . . . . . . . . . . . . . . . . . . . . . . .
Table 3–4: Pulse trigger definitions 3–70. . . . . . . . . . . . . . . . . . . . . . . . . . .
Table 3–5: Measurement definitions 3–90. . . . . . . . . . . . . . . . . . . . . . . . . . .
Table 3–6: Measurement definitions 3–109. . . . . . . . . . . . . . . . . . . . . . . . . . .
Table 3–7: Probe cal status 3–116. . . . . . . . . . . . . . . . . . . . . . . . . . . . . . . . . .
Table A–1: Options A–1. . . . . . . . . . . . . . . . . . . . . . . . . . . . . . . . . . . . . . . . .
Table A–2: Standard accessories A–2. . . . . . . . . . . . . . . . . . . . . . . . . . . . . .
Table A–3: Optional accessories A–2. . . . . . . . . . . . . . . . . . . . . . . . . . . . . .
Table A–4: Recommended probe cross reference A–3. . . . . . . . . . . . . . . .
Table A–5: Accessory software A–5. . . . . . . . . . . . . . . . . . . . . . . . . . . . . . .
Table E–1: External inspection check list E–2. . . . . . . . . . . . . . . . . . . . . .
TDS 694C User Manual
vii
Page 12

Table of Contents
viii
TDS 694C User Manual
Page 13

General Safety Summary
Review the following safety precautions to avoid injury and prevent damage to
this product or any products connected to it. To avoid potential hazards, use this
product only as specified.
Only qualified personnel should perform service procedures.
To Avoid Fire or
Personal Injury
Use Proper Power Cord. Use only the power cord specified for this product and
certified for the country of use.
Use Proper V oltage Setting. Before applying power, ensure that the line selector is
in the proper position for the power source being used.
Connect and Disconnect Properly . Do not connect or disconnect probes or test
leads while they are connected to a voltage source.
Ground the Product. This product is grounded through the grounding conductor
of the power cord. To avoid electric shock, the grounding conductor must be
connected to earth ground. Before making connections to the input or output
terminals of the product, ensure that the product is properly grounded.
Observe All Terminal Ratings. To avoid fire or shock hazard, observe all ratings
and markings on the product. Consult the product manual for further ratings
information before making connections to the product.
Connect the ground lead of the probe to earth ground only.
Do not apply a potential to any terminal, including the common terminal, that
exceeds the maximum rating of that terminal.
Do Not Operate Without Covers. Do not operate this product with covers or panels
removed.
TDS 694C User Manual
Use Proper Fuse. Use only the fuse type and rating specified for this product.
Avoid Exposed Circuitry. Do not touch exposed connections and components
when power is present.
Do Not Operate With Suspected Failures. If you suspect there is damage to this
product, have it inspected by qualified service personnel.
Do Not Operate in Wet/Damp Conditions.
Do Not Operate in an Explosive Atmosphere.
Keep Product Surfaces Clean and Dry .
Provide Proper Ventilation. Refer to the manual’s installation instructions for
details on installing the product so it has proper ventilation.
ix
Page 14
General Safety Summary
Symbols and Terms
T erms in this Manual. These terms may appear in this manual:
WARNING. Warning statements identify conditions or practices that could result
in injury or loss of life.
CAUTION. Caution statements identify conditions or practices that could result in
damage to this product or other property.
T erms on the Product. These terms may appear on the product:
DANGER indicates an injury hazard immediately accessible as you read the
marking.
WARNING indicates an injury hazard not immediately accessible as you read the
marking.
CAUTION indicates a hazard to property including the product.
Symbols on the Product. The following symbols may appear on the product:
Electrostatic Discharge
CAUTION
Refer to Manual
WARNING
High Voltage
Double
Insulated
Protective Ground
(Earth) Terminal
Acquisition circuitry in the TDS 694C is very susceptible to damage from
electrostatic discharge and from overdrive signals.
To prevent electrostatic damage to the TDS 694C, be sure to operate the
oscilloscope only in a static-controlled environment. Be sure to discharge to
ground any electrostatic charge that may be present on cables and probes before
attaching them to the oscilloscope.
To prevent damage from electrostatic discharge, install short-circuit terminations
on unused input connectors. Always use a wrist strap with internal impedance
(provided with your instrument) when handling your oscilloscope or making
connections.
TDS 694C User Manual
x
Page 15

Preface
Related Manuals
This is the User Manual for the TDS 694C Oscilloscopes
The chapter Getting Started briefly describes the TDS 694C Oscilloscopes,
prepares you to install it, and tells you how to put it into service.
The chapter Operating Basics covers basic principles of the operation of the
oscilloscope. The operating interface illustrations and the tutorial examples
rapidly help you understand how your oscilloscope operates.
The chapter Reference teaches you how to perform specific tasks. See page 3–1
for a complete list of operating tasks covered in that chapter.
The Appendices provide an options listing, an accessories listing, and other
useful information.
The following documents are related to the use or service of the oscilloscope.
H The TDS Family Digitizing Oscilloscopes Programmer Manual (a diskette
that is included with the user manual) describes using a computer to control
the oscilloscope through the GPIB interface.
Conventions
TDS 694C User Manual
H The TDS 500D, TDS 600C & TDS 700D Digitizing Oscilloscopes Reference
(Quick Reference) gives you a quick overview of how to operate the
oscilloscope.
H The TDS 500D, TDS 600C, & TDS 700D Technical Reference (Performance
Verification and Specifications) tells how to verify the performance of the
oscilloscope and lists its specifications.
H The TDS 500B, TDS 600B, TDS 600B, & TDS 700A Service Manual
provides information for maintaining and servicing the oscilloscope to the
module level.
In this manual, you will find various procedures which contain steps of
instructions for you to perform. To keep those instructions clear and consistent,
this manual uses the following conventions:
H In procedures, names of front panel controls and menu labels appear in
boldface print.
xi
Page 16

Preface
H Names also appear in the same case (initial capitals or all uppercase) in the
manual as is used on the oscilloscope front panel and menus. Front panel names
are all upper case letters, for example, VERTICAL MENU and CH 1.
H Instruction steps are numbered. The number is omitted if there is only one step.
H When steps require that you make a sequence of selections using front panel
controls and menu buttons, an arrow ( ➞ ) marks each transition between a
front panel button and a menu, or between menus. Also, whether a name is a
main menu or side menu item is clearly indicated: Press VERTICAL
MENU ➞ Coupling (main) ➞ DC (side) ➞ Bandwidth (main) ➞
250 MHz (side).
Using the convention just described results in instructions that are graphically
intuitive and simplifies procedures. For example, the instruction just given
replaces these five steps:
1. Press the front-panel button VERTICAL MENU.
2. Press the main-menu button Coupling.
3. Press the side-menu button DC.
4. Press the main-menu button Bandwidth.
5. Press the side-menu button 250 MHz.
Sometimes you may have to make a selection from a pop-up menu: Press
TRIGGER MENU ➞ Type (main) ➞ Edge (pop-up). In this example, you
repeatedly press the main menu button Type until Edge is highlighted in the
pop-up menu.
xii
TDS 694C User Manual
Page 17
Product Description
The Tektronix TDS 694C Digital Real-Time Oscilloscope is a superb tool for
acquiring, displaying, and measuring waveforms. Its performance addresses the
needs of both benchtop lab and portable applications with the following key
features:
H An analog bandwidth of 3 GHz simultaneous on 4 channels
H A maximum sample rate of up to 10 GS/s simultaneous on 4 channels
H Records lengths up to 120 K
H Up to 29 automatic measurements and measurement statistics (see Taking
Automated Measurements on page 3–88)
H 1% DC vertical gain accuracy (see TDS 500D, TDS600B & TDS 700D
Technical Reference manual)
H Internal floppy disk storage and compatible with Iomega 100 Mbyte Zip
drive (see Saving Waveforms and Setups on page 3–115)
H Optional internal hard drive
H Trigger modes include edge, logic, pulse, delay, modes (see Triggering on
Waveforms on page 3–39)
H Java application support
H TLA 700 Logic Analyzer cross-triggering support
TDS 694C User Manual
1–1
Page 18

Product Description
H Advanced features include limit testing (see Limit Testing on page 3–145),
FFT (see Fast Fourier Transforms on page 3–153), waveform differentiation
and integrations (see Waveform Differentiation and Waveform Integration
starting on page 3–172), waveform histograms (see Displaying Histograms
on page 3–104)
H Adjustable channel deskew for increased measurement accuracy (see
Channel/Probe Deskew on page 3–109)
H Full GPIB programmability (see Communicating with Remote Instruments
on page 3–137 and the TDS Family Programmer Manual disk)
H Wide array of probing solutions (see Accessory Probes on page 0–3 and
Probe Selection on page 0–1)
H CE, FCC, UL, and CAN/CSE compliant (see TDS 500D, TDS600B &
TDS 700D Technical Reference manual)
H All 4 channels have 8-bit resolution. (See Table 1–1 on page 1–3.)
H Dual Window Zoom, which shows a waveform magnified and unmagnified
on the same display (see Using Dual Window Mode on page 3–35)
H Sample, envelope, average, and peak-detect modes (see Table 1–1,
on page 1–3.)
1–2
TDS 694C User Manual
Page 19

TDS 694C Features
Product Description
Table 1–1 lists some key TDS 694C features that are covered in this manual.
T able 1–1: Key Features of TDS 694C
Feature TDS 694C
No. of channels 4
Digitizing rate, max. 10 GS/s
No. of Channels. @ maximum rate 4
Analog Bandwidth 3 GHz
Record Lengths, max. To 120 K/Channel
Advanced DSP Math
1
Storage, Floppy Disk Std.
I/0 includes RS–232 and Centronics
3
iomega Zip Drive support Std.
Std.
Std.
2
2
2
2
Input Impedance 50 W only
1
Advanced digital signal processing provides FFT s, integrals, and derivatives of
waveforms. See Option 2F on page 0–2.
2
Std. denotes a standard product feature as opposed to a feature included as part of
an option.
3
GPIB I/O included with all models.
TDS 694C User Manual
1–3
Page 20

Product Description
Product Specification
The product specification is found in the technical reference TDS 500D,
TDS 600C, & TDS 700D Technical Reference (Performance Verification and
Specifications) that is shipped as a standard accessory with the TDS 694C Oscil-
loscopes.
1–4
TDS 694C User Manual
Page 21
Start Up
Preparation
Before you use the TDS 694C Oscilloscopes, ensure that it is properly installed
and powered on.
To ensure maximum accuracy for your most critical measurements, you should
know about signal path compensation and the proper use of the probe you choose
to use with your oscilloscope.
Signal Path Compensation
Recommended Probes
Probe Usage
Be sure you compensate your oscilloscope for the surrounding temperature. This
action, called Signal Path Compensation (SPC), ensures maximum possible
accuracy for your most critical measurements. See Signal Path Compensation on
page 3–108 for a description of and operating information on this feature.
The TDS 694C Oscilloscopes ships without probes. To take advantage of the
higher bandwidth of these oscilloscopes, order P6249 or P6158 probes.
For a list of recommended optional-accessory probes see Accessory Probes on
page A–3. Probes that require a 1 MW input, like the P6139A, will not work on
the TDS 694C.
Be sure you use the appropriate probe for the measurement. (See the User
manual for the probe for more information.)
CAUTION. Using the P6249 or P6245 Active Probe to measure signals greater
than ±40 volts may damage the probe. Using the P6158 Voltage Divider Probe to
measure signals greater than ±22 V
may damage the probe.
RMS
Putting into Service
TDS 694C User Manual
To learn how to install, access the front panel, power on, do a self test, and
power off the oscilloscope, do the following procedures:
1–5
Page 22
Start Up
Installation
To properly install and power on the oscilloscope, do the following steps:
1. Be sure you have the appropriate operating environment. Specifications for
temperature, relative humidity, altitude, vibrations, and emissions are
included in the TDS 500D, TDS 600C, & TDS 700D Technical Reference
(Performance Verification and Specifications)Technical Reference (Perfor-
mance Verification and Specifications) manual (Tektronix part number
071-0496-xx).
CAUTION. To prevent damage to the instrument caused by over heating, the
TDS 694C must have adequate airflow. Verify air intake and exhaust ventilation
in the cabinet as specified in Step 2.
2. Leave space for cooling for both rackmount and bench configurations. Do
this by verifying that the air intake and exhaust holes on the sides and
bottom of the cabinet are free of any airflow obstructions. Leave at least
5.1 cm (2 inches) free on both sides. Leave 2.5 cm (1.0 inch) minimum
space on the bottom of rackmount instruments, the height of the feet will
provide adequate space for bench configurations.
WARNING. To avoid electrical shock, be sure that the power cord is disconnected
before checking the fuse.
3. Check the fuse to be sure it is the proper type and rating (see Figure 1–1).
You can use either of two fuses. Each fuse requires its own cap (see
Table
1–2). The oscilloscope is shipped with the UL approved fuse installed.
4. Check that you have the proper electrical connections. The oscilloscope
requires 100 to 240 VAC
, continuous range, 45 Hz to 440 Hz, and may
RMS
require up to 450 W.
1–6
TDS 694C User Manual
Page 23
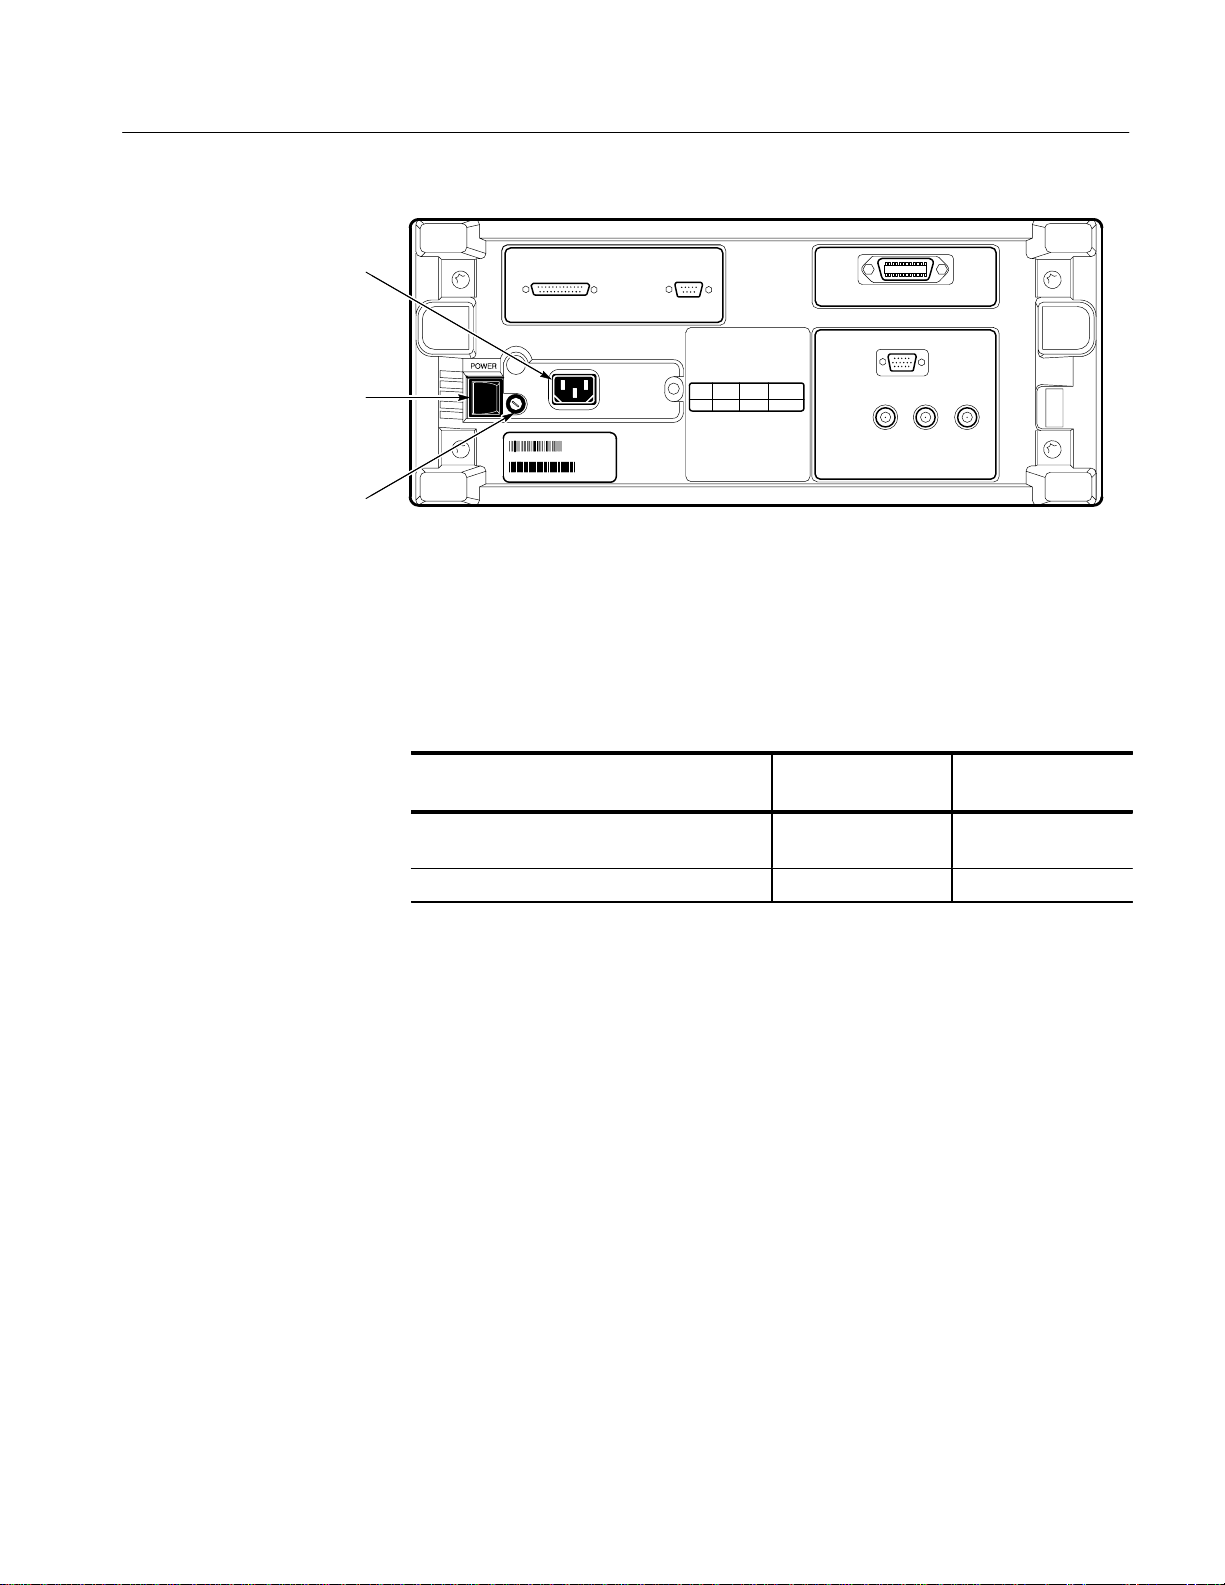
Power Connector
Principal Power Switch
Fuse
Start Up
Figure 1–1: Rear Panel Controls Used in Start Up
5. Connect the proper power cord from the rear-panel power connector (see
Figure 1–1) to the power system.
Front Cover Removal
Power On
T able 1–2: Fuse and fuse cap part numbers
Fuse cap part
Fuse Fuse part number
0.25 inch × 1.25 inch (UL 198.6, 3AG): 6 A
FAST, 250 V
5 mm × 20 mm (IEC 127): 5 A (T), 250 V 159-0210-00 200-2265-00
159-0013-00 200-2264-00
number
To remove the front cover, grasp the left and right edges and snap the cover off
of the front subpanel. (To reinstall the cover, align it to the front subpanel and
snap it back on.)
To power on the oscilloscope, do the following steps:
1. Check that the rear-panel principal power switch is on (see Figure 1–1). The
principal power switch controls all AC power to the instrument.
2. If the oscilloscope is not powered on (the screen is blank), push the
front-panel ON/STBY button to toggle it on (see Figure 1–2).
TDS 694C User Manual
1–7
Page 24
Start Up
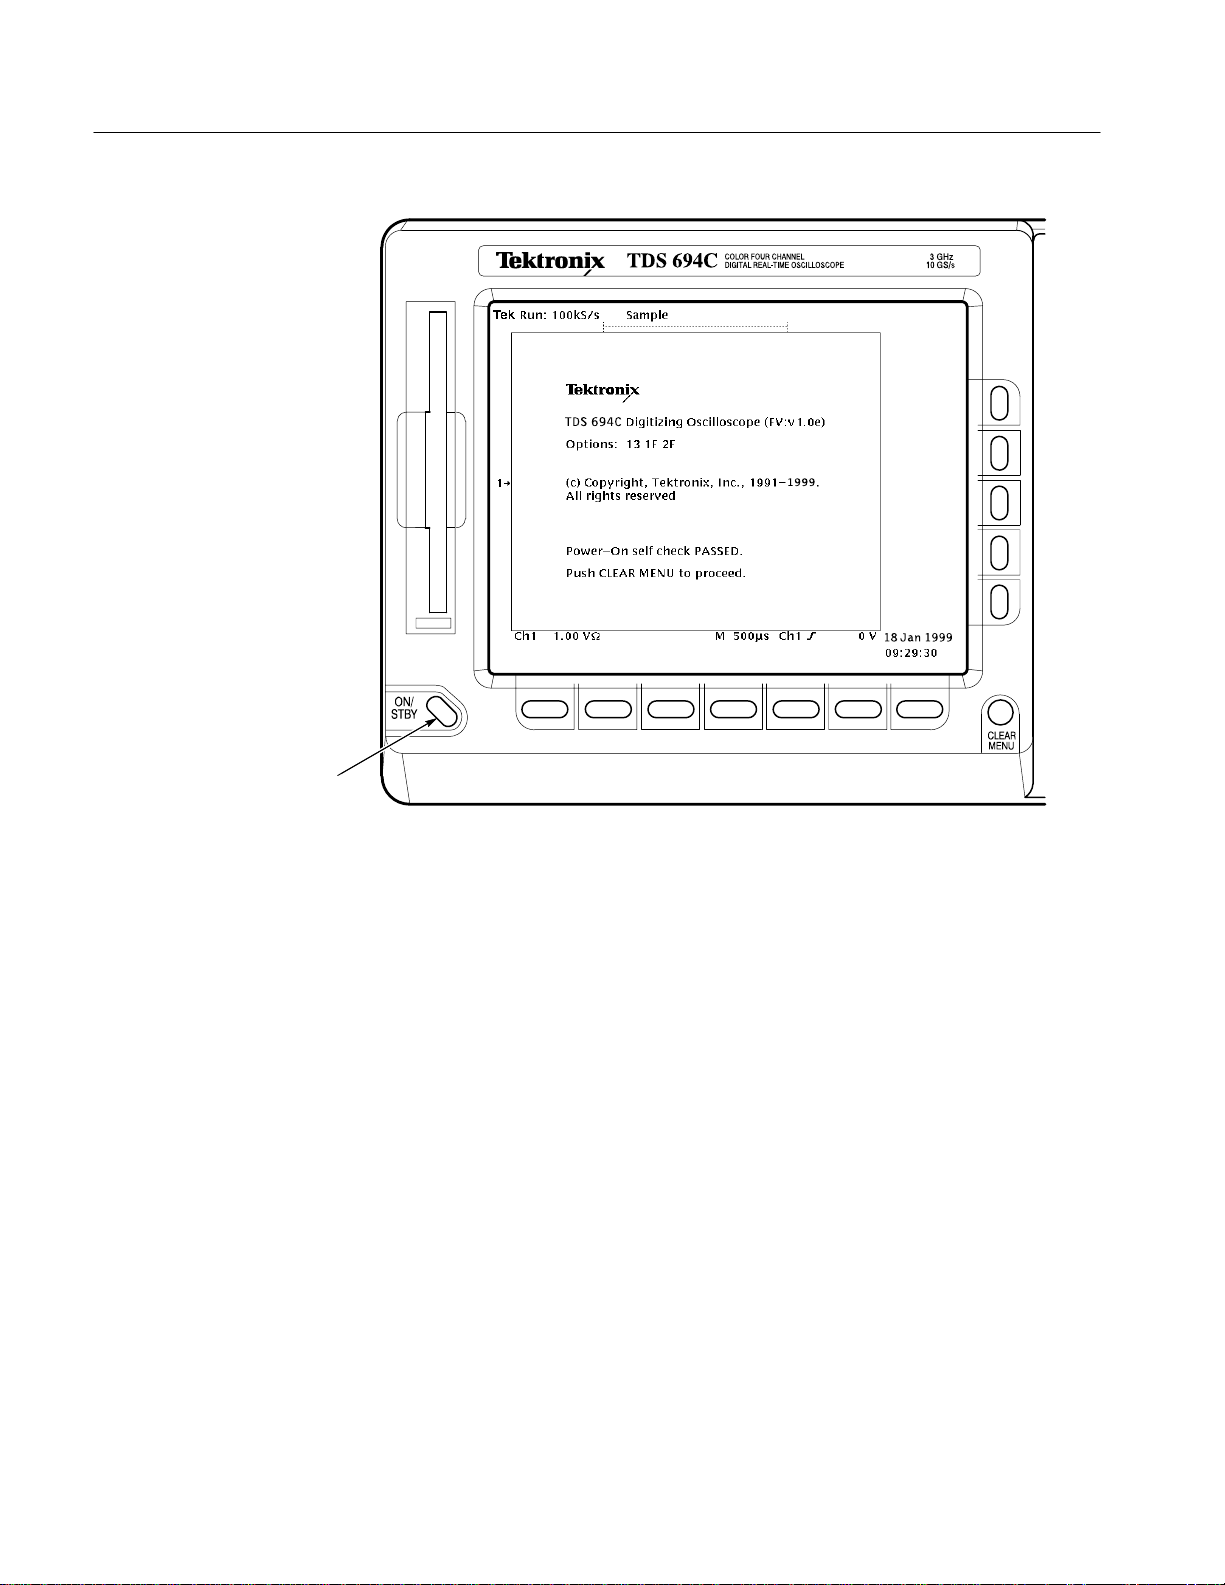
ON/STBY Button
Self Test
Power Off
Figure 1–2: ON/STBY Button
The ON/STBY button controls power to most of the instrument circuits. Power
continues to go to certain parts even when this switch is set to STBY.
Once the oscilloscope is installed, it is typical to leave the principal power
switch on and use the ON/STBY button instead of the power switch.
The oscilloscope automatically performs power-up tests each time it is turned on.
It will come up with a display screen that states whether or not it passed the self
test. To determine the self-test results, check the screen. (If the self test passed,
the status display screen will be removed after a few seconds.)
If the self test fails, call your local Tektronix Service Center. Depending on the
type of failure, you may still be able to use the oscilloscope before it is serviced.
To power off the oscilloscope, toggle the ON/STBY switch.
1–8
TDS 694C User Manual
Page 25

Overview
This chapter describes the basic concepts of operating the TDS 694C Digital
Real-Time Oscilloscope. Understanding the basic concepts of your oscilloscope
will help you use it much more effectively.
The first section, Operating Interface Maps, quickly shows you how the
oscilloscope controls are organized and where you can read about them. It also
illustrates the general procedures for operating the menu system. This section
includes the titles:
H Front Panel Map
H Rear Panel Map
H Display Map
H To Operate a Menu
H To Operate a Pop-Up Menu
The second section, Tutorial, contains example procedures that lead you through
the fundamental tasks needed to display a waveform measurement. It also
includes an example procedure that teaches you how to store a setup of the
oscilloscope controls for later use. This section includes the following tutorial examples:
TDS 694C User Manual
H Setting Up for the Examples
H Example 1: Displaying a Waveform
H Example 2: Displaying Multiple Waveforms
H Example 3: Taking Automated Measurements
H Example 4: Saving Setups
To explore these topics in more depth and to read about topics not covered in this
section, see Reference. A list of the topics covered begins on Page 3–1.
2–1
Page 26

Overview
2–2
TDS 694C User Manual
Page 27
Operating Interface Maps
This section contains illustrations, or maps, of the display, the front and rear
panels, and the menu system of the TDS 694C Oscilloscopes. These maps will
help you understand and operate the oscilloscope. This section also contains a
visual guide to using the menu system.
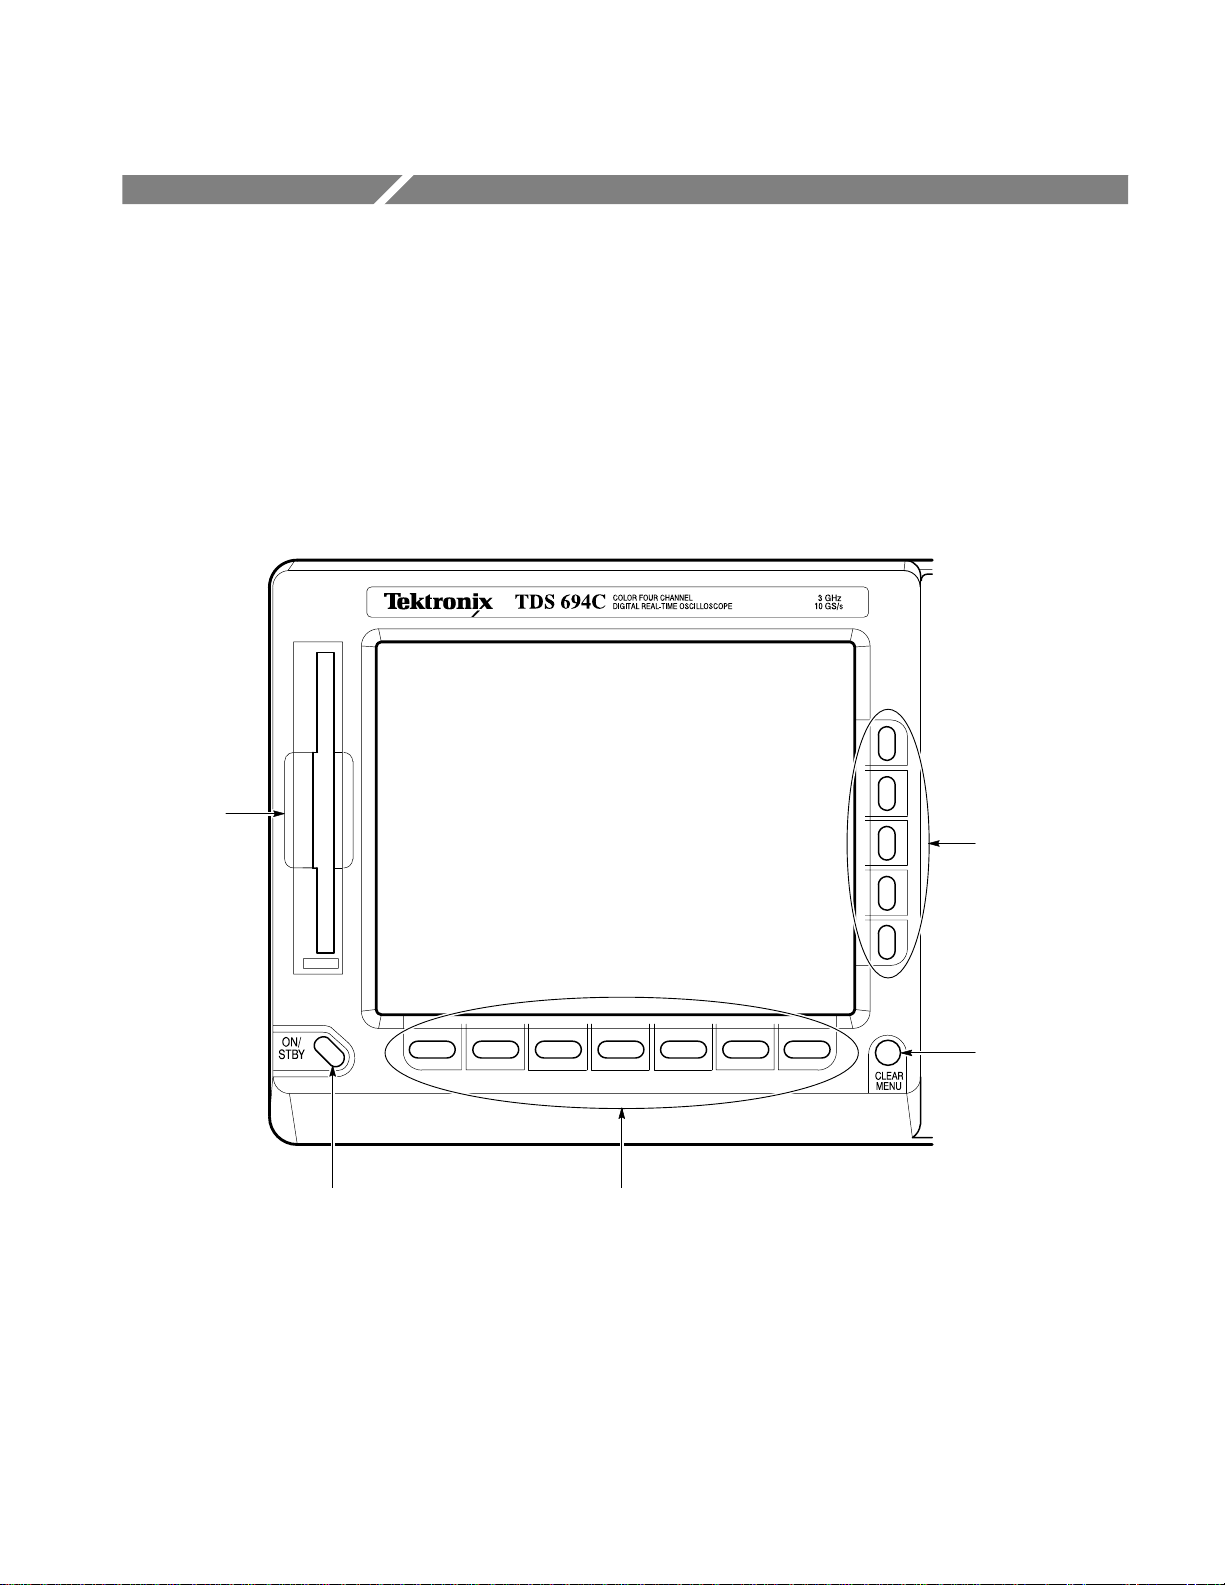
Front Panel Map — Left Side
File System,
page 3–122
Side Menu Buttons,
page 2–7
ON/STBY Switch,
page 1–7
TDS 694C User Manual
CLEAR MENU
Removes Menus
from the Display
Main Menu Buttons,
page 2–7
2–3
Page 28

Operating Interface Maps
Front Panel Map — Right Side
Measurement System, page 3–88
Cursor Measurements, page 3–98
Saving and Recalling
Waveforms, page 3–118
File System, page 3–122
Autoset, page 3–4
Help, page 3–143
Status, page 3–141
Saving and Recalling
Setups, page 3–115
Selecting Channels,
page 3–6
Waveform Math,
page 3–150
Hardcopy, page 3–127
File System, page 3–122
Acquisition Modes, page 3–17
Cursor
Measurements,
page 3–98
Color, page 3–28
Display Settings,
page 3–23
Remote
Communication,
page 3–137
Probe Calibration,
page 3–109
Vertical Controls,
page 3–9
2–4
Zoom, page 3–32
Horizontal Controls,
page 3–13
Ground
Triggering, page 3–39
Delay Triggering, page 3–80
Edge Triggering, page 3–47
Logic Triggering, page 3–51
Pulse Triggering, page 3–67
TDS 694C User Manual
Page 29
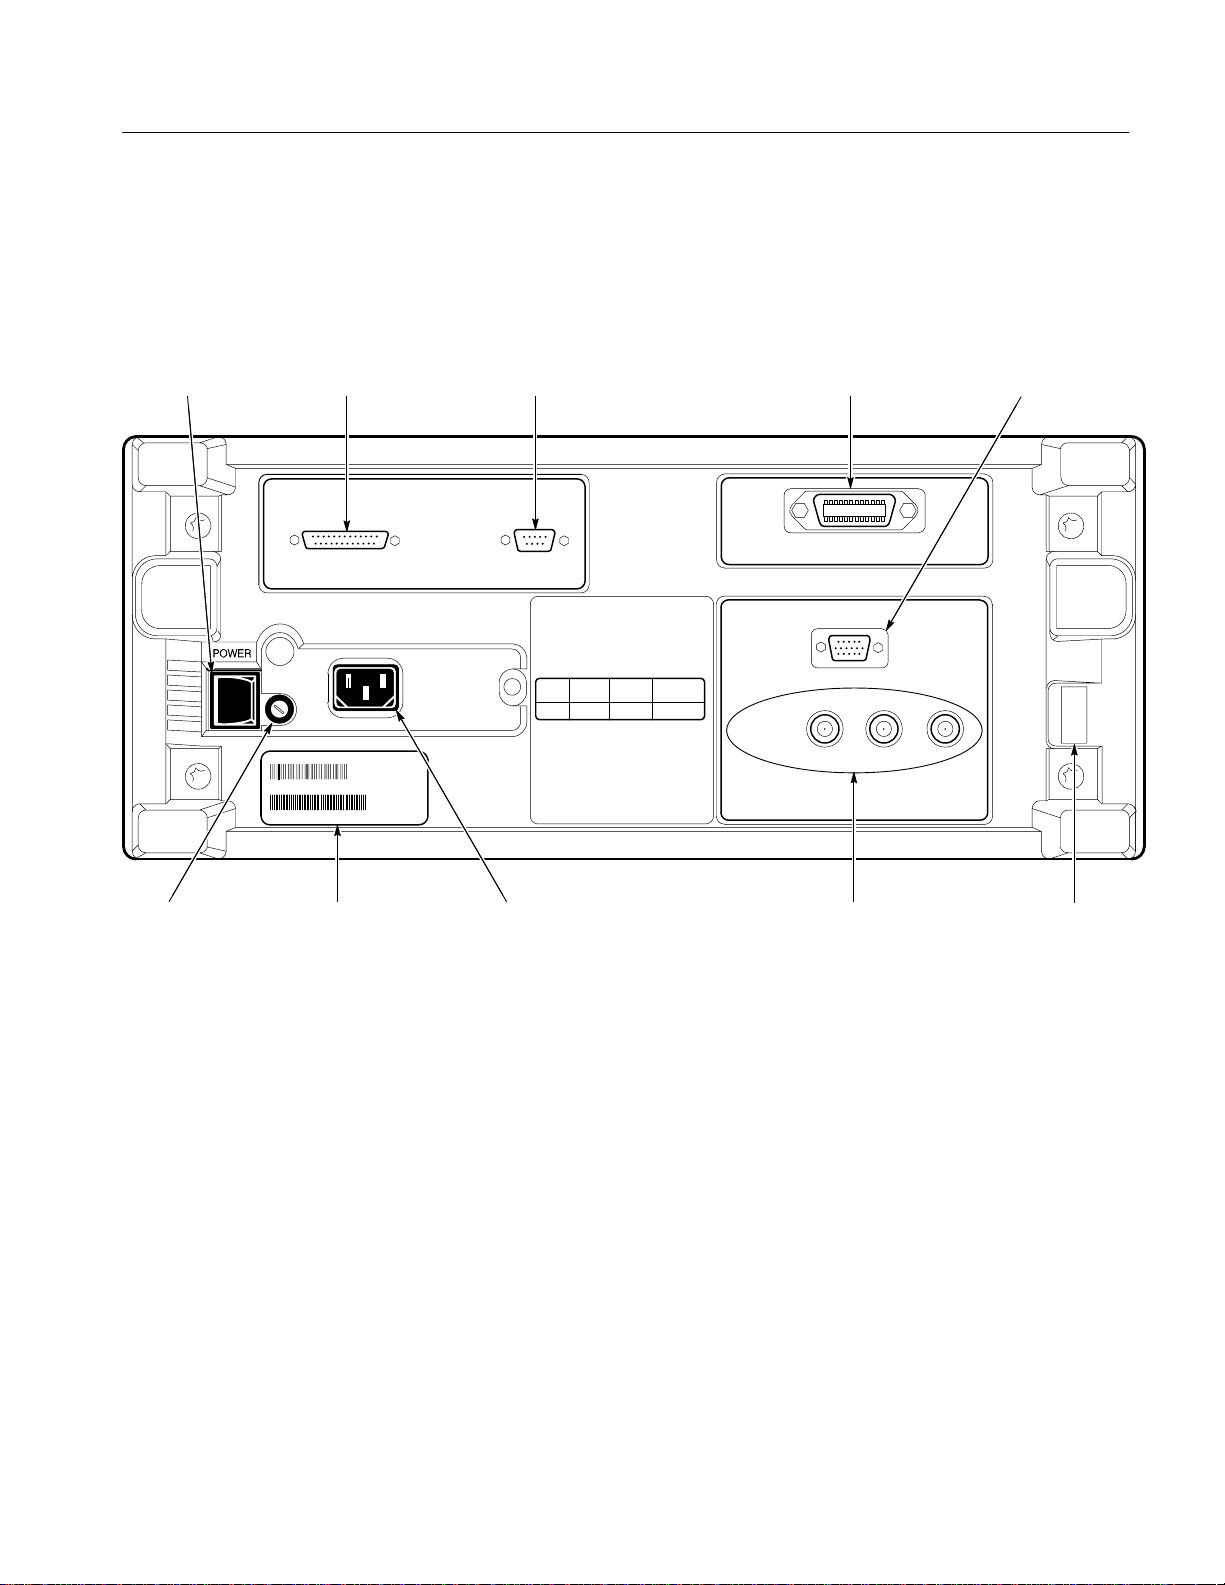
Rear Panel Map
Operating Interface Maps
Principal Power
Switch,
page 1–7
Fuse,
page 1–6
Centronics Connector, page 3–127
Zip Drive, page 3–126
Serial Number
RS-232 Connector,
page 3–127
Power Connector,
page 1–6
GPIB Connector,
page 3–137
Rear Panel Connectors Security Bracket
AUX TRIGGER INPUT –
(Provides Auxiliary Trigger Signal Input)
MAIN TRIGGER OUTPUT –
(Provides Main Trigger (TTL) Output)
DELAYED TRIGGER OUTPUT –
(Provides Delayed Trigger (TTL) Output)
VGA Output
TDS 694C User Manual
2–5
Page 30

Operating Interface Maps
Display Map
acquisition
page 3–20
Trigger level on
waveform (may be an
arrow at right side of
screen instead of a bar).
The
status,
Indicates position of
vertical bar cursors in the
waveform record,
page 3–102
Shows what part of the waveform
record is displayed, page 3–12
Trigger
position (T),
page 3–46
The value entered with
the general purpose
knob
or keypad.
The waveform
record icon
Shows what part of
waveform record
When present, the general
purpose knob makes coarse
adjustments; when absent,
fine adjustments.
the acquisition
record is in the
Cursor measurements,
page 3–98
Channel level and
waveform source.
2–6
Vertical scale,
page 3–9
The main menu with
choices of major actions
The side menu
with choices of
specific actions.
Trigger parameters,
page 3–46
Horizontal scale and time
base type, page 3–13
TDS 694C User Manual
Page 31

To Operate a Menu
1 Press front-panel menu button. (Press SHIFT first if button label is blue.)
Operating Interface Maps
2 Press one of these buttons to select from main menu.
3 Press one of these buttons to select from side menu (if displayed).
4 If side menu item has an adjustable value (shown in reverse video), adjust it with the general purpose knob or keypad.
TDS 694C User Manual
2–7
Page 32

Operating Interface Maps
To Operate a Pop-Up Menu
2–8
Press to display pop-up menus.
Press it again
to make selection.
Alternatively, press SHIFT first to make
selection in the opposite direction.
A pop-up selection changes the other
main menu titles.
Press here to
remove menus from
screen.
TDS 694C User Manual
Page 33

Tutorial
This section quickly makes you acquainted with some of the fundamental
operations required to use the TDS 694C Oscilloscopes to take measurements.
Start this tutorial by doing Setting Up for the Examples on this page.
Setting Up for the Examples
Perform the following tasks to connect input signals to the TDS 694C Oscilloscopes, to reset it, and to become acquainted with its display screen. Once
completed, these tasks ready the oscilloscope for use in the examples that follow.
Connect the Input Signal
Remove all probes and signal inputs from the input BNC connectors along the
lower right of the front panel. Then, using an appropriate probe (such as the
P6249), connect from the CH 1 connector of the oscilloscope to the PROBE
COMPENSATION connectors. (See Figure 2–2.)
NOTE. See Appendix A: Options and Accessories for optional probes you can
order and use with this product. Use the probe deskew fixture to ensure optimum
probe connections.
P6249
probes
GroundSignal
TDS 694C User Manual
Figure 2–1: Deskew Fixture Connections (two P6249 probes shown)
2–9
Page 34

Tutorial
B
Figure 2–2: Connecting a Probe for the Examples (P6249 shown)
Reset the Oscilloscope
Do the following steps to reset the oscilloscope to a known factory default state
before doing the examples. (You can reset the oscilloscope anytime you begin a
new task and need to “start fresh” with known default settings.)
1. Press the save/recall SETUP button to display the Setup menu. (See
Figure 2–3.)
SETUP Button
Deskew fixture
2–10
Figure 2–3: SETUP Button Location
TDS 694C User Manual
Page 35

OK Confirm Factory Init
Menu Item and Button
Recall Factory Setup
Menu Item and Button
Tutorial
The oscilloscope displays main menus along the bottom of the screen.
Figure 2–4 shows the Setup main menu.
Figure 2–4: The Setup Menu
2. Press the button directly below the Recall Factory Setup menu item.
The display shows side menus along the right side of the screen. The buttons
to select these side menu items are to the right of the side menu.
Because an accidental instrument reset could destroy a setup that took a long
time to create, the oscilloscope asks you to verify the Recall Factory Setup
selection. (See Figure 2–4.)
3. Press the button to the right of the OK Confirm Factory Init side menu item.
NOTE. This manual uses the following notation to represent the sequence of
selections you made in steps 1, 2 and 3: Press save/recall SETUP ➞ Recall
Factory Setup (main) ➞ OK Confirm Factory Init (side).
Note that a clock icon appears on screen. The oscilloscope displays this icon
when performing operations that take longer than several seconds.
4. Press SET LEVEL TO 50% (see Figure 2–5) to be sure the oscilloscope
triggers on the input signal.
TDS 694C User Manual
2–11
Page 36

Tutorial
SET LEVEL TO 50% Button
Figure 2–5: Trigger Controls
Examine the Display
Elements
Read the following information to become familiar with the oscilloscope display
before doing the examples.
Figure 2–6 shows the display that results from the oscilloscope reset. There are
several important points to observe:
H The trigger level bar shows that the waveform is triggered at a level near
50% of its amplitude (from step 4).
H The trigger position indicator shows that the trigger position of the
waveform is located at the horizontal center of the graticule.
H The channel reference indicator shows the vertical position of channel 1
with no input signal. This indicator points to the ground level for the channel
when its vertical offset is set to 0 V in the vertical menu; when vertical offset
is not set to 0 V, it points to the vertical offset level.
2–12
TDS 694C User Manual
Page 37

Trigger Level Bar
Trigger Position Indicator
Channel Reference Indicator
Trigger Readout
Time Base Readout
Channel Readout
Tutorial
H The trigger readout shows that the oscilloscope is triggering on channel 1
(Ch1) on a rising edge, and that the trigger level is about 200–300 mV.
H The time base readout shows that the main time base is set to a horizontal
scale of 500 ms/div.
H The channel readout indicates that channel 1 (Ch1) is displayed with DC
coupling. The oscilloscope always displays channel 1 at reset.
Figure 2–6: The Display After Factory Initialization
Right now, the channel, time base, and trigger readouts appear in the graticule
area because a menu is displayed. You can press the CLEAR MENU button at
any time to remove any menus and to move the readouts below the graticule.
Example 1: Displaying a Waveform
The TDS 694C Oscilloscopes provides front panel knobs for you to adjust a
waveform, or it can automatically set up its controls to display a waveform. Do
the following tasks to learn how to adjust a waveform and how to autoset the
TDS 694C Oscilloscopes.
TDS 694C User Manual
2–13
Page 38

Tutorial
Adjust the Waveform
Display
The display shows the probe compensation signal. It is a 1 kHz square wave of
approximately 0.5 V amplitude.
Figure 2–7 shows the main VERTICAL and HORIZONTAL sections of the front
panel. Each has SCALE and POSITION knobs. Do the following steps to adjust
the size and placement of the waveform using the front-panel knobs:
1. Turn the vertical SCALE knob clockwise. Observe the change in the
displayed waveform and the channel readout at the bottom of the display.
2–14
Figure 2–7: The VERTICAL and HORIZONTAL Controls
2. Turn the vertical POSITION knob first one direction, and then the other.
Observe the change in the displayed waveform. Then return the waveform to
the center of the graticule.
3. Turn the horizontal SCALE knob one click clockwise. Observe the time
base readout at the bottom of the display. The time base should be set to
200 ms/div now, and you should see two complete waveform cycles on the
display.
TDS 694C User Manual
Page 39

Tutorial
Autoset the Oscilloscope
MAIN LEVEL Knob
When you first connect a signal to a channel and display it, the signal displayed
may not be scaled and triggered correctly. Use the autoset function and you
should quickly get a meaningful display.
You should have a stable display of the probe compensation waveform from the
last step. Do the following steps to first create an unstable display and then to
autoset the display:
1. To create an unstable display, slowly turn the trigger MAIN LEVEL knob
(see Figure 2–8) first one direction, and then the other. Observe what
happens when you move the trigger level above the highest part of the
waveform. Leave the trigger level in that untriggered state.
Figure 2–8: TRIGGER Controls
2. Press AUTOSET (see Figure 2–9) and observe the stable waveform display.
NOTE. The oscilloscope triggers on the input signal. Sometimes the oscilloscope
triggers on high frequency signal components that are not visible using the
current setup. You may see these signal components at higher HORIZONTAL
SCALE settings. You can reduce these signal components using shorter probe
ground and signal leads.
TDS 694C User Manual
2–15
Page 40

Tutorial
AUTOSET Button
Figure 2–9: AUTOSET Button Location
Figure 2–10 shows the display after pressing AUTOSET. If necessary, you can
adjust the waveform now by using the knobs discussed earlier in this example.
Figure 2–10: The Display After Pressing Autoset
Example 2: Displaying Multiple Waveforms
The TDS 694C Oscilloscopes can display up to four channels, three math
waveforms, and four reference waveforms at one time. Do the following tasks to
learn how to display and control more than one waveform at a time.
2–16
TDS 694C User Manual
Page 41

Tutorial
Add a Waveform
The VERTICAL section of the front panel contains the channel selection
buttons. These buttons are CH 1, CH 2, CH 3, CH 4, and MORE. (See Figure 2–11.)
Figure 2–11: The Channel Buttons and Lights
Each of the channel (CH) buttons has a light behind its label. Right now, the
CH 1 light is on. That light indicates that the vertical controls are set to adjust
channel 1. Do the following steps to add a waveform to the display:
1. If you are not continuing from the previous example, follow the instructions
on page 2–9 under the heading Setting Up for the Examples.
2. Press SETUP ➞ Recall Factory Setup (main) ➞ OK Confirm Factory
Init (side).
3. Press AUTOSET.
4. Press CH 2.
The display shows a second waveform, which represents the signal on
channel 2. Since there is nothing connected to the CH 2 input connector, this
waveform is a flat line. There are several other important things to observe:
H The channel readout on the display now shows the settings for both Ch1
and Ch2.
H There are two channel indicators at the left edge of the graticule. Right
now, they overlap.
TDS 694C User Manual
2–17
Page 42

Tutorial
H The light above the CH 2 button is now on, and the CH 1 light is off.
Because the knobs control only one channel at a time, the vertical
controls are now set to adjust channel 2.
H The trigger readout still indicates that the trigger is detecting trigger
events on channel one. The trigger source is not changed simply by
adding a channel. (You can change the trigger source by using the
TRIGGER MENU button to display the trigger menu.)
5. Turn the vertical POSITION knob clockwise to move the channel 2
waveform up on the graticule. You will notice that the channel reference
indicator for channel 2 moves with the waveform.
6. Press VERTICAL MENU ➞ Coupling (main).
The VERTICAL MENU button displays a menu that gives you control over
many vertical channel parameters. (See Figure 2–12.) Although there can be
more than one channel displayed, the vertical menu and buttons only adjust
the selected channel.
Each menu item in the Vertical menu displays a side menu. Right now, the
Coupling item in the main menu is highlighted, which means that the side
menu shows the coupling choices. At the top of the side menu, the menu title
shows the channel affected by the menu choices. That channel always
matches the lighted channel button.
7. Press GND (side) to toggle the selection to ground (GND). That changes the
input coupling of channel 2 from DC to GND. The channel readout for
channel 2 (near the bottom of the graticule) now shows a ground indicator.
2–18
TDS 694C User Manual
Page 43

Ch2 Reference Indicator
Tutorial
Side Menu Title
Assign Controls to
Another Channel
Figure 2–12: The Vertical Main Menu and Coupling Side Menu
Pressing a channel (CH) button sets the vertical controls to that channel. It also
adds the channel to the display if that waveform is not already displayed. To
explore assigning controls to different channels, do the following steps:
1. Press CH 1.
Observe that now the side menu title shows Ch1 (see Figure 2–13) and that
the light above CH 1 is lighted. The highlighted menu item in the side menu
has changed from the GND channel 2 setting to the DC coupling setting of
channel 1.
2. Press CH 2 ➞ DC (side) to toggle the selection to DC. That returns the
input coupling of channel 2 to its initial state.
TDS 694C User Manual
2–19
Page 44

Tutorial
Side Menu Title
Figure 2–13: The Menus After Changing Channels
Remove a Waveform
Pressing the WAVEFORM OFF button removes the waveform for the currently
selected channel. If the waveform you want to remove is not already selected,
select that channel using the channel (CH) button.
1. Press WAVEFORM OFF (under the vertical SCALE knob).
Since the CH 2 light was on when you pressed the WAVEFORM OFF
button, the channel 2 waveform was removed.
The channel (CH) lights now indicate channel 1. Channel 1 has become the
selected channel. When you remove the last waveform, all the CH lights are
turned off.
2. Press WAVEFORM OFF again to remove the channel 1 waveform.
Example 3: Taking Automated Measurements
The TDS 694C Oscilloscopes can measure many waveform parameters
automatically and read out the results on screen. Do the following tasks to
discover how to set up the oscilloscope to measure waveforms automatically.
Display Measurements
Automatically
2–20
To use the automated measurement system, you must have a stable display of
your signal. Also, the waveform must have all the segments necessary for the
TDS 694C User Manual
Page 45

Tutorial
measurement you want. For example, a rise time measurement requires at least
one rising edge, and a frequency measurement needs at least one complete cycle.
To take automated measurements, do the following steps:
1. If you are not continuing from the previous example, follow the instructions
on page 2–9 under the heading Setting Up for the Examples.
2. Press SETUP ➞ Recall Factory Setup (main) ➞ OK Confirm Factory
Init (side).
3. Press AUTOSET.
4. Press MEASURE to display the Measure main menu. (See Figure 2–14.)
5. If it is not already selected, press Select Measrmnt (main). The readout for
that menu item indicates which channel the measurement will be taken from.
All automated measurements are made on the selected channel.
The Select Measurement side menu lists some of the measurements that can
be taken on waveforms. There are many different measurements available;
up to four can be taken and displayed at any one time. Pressing the button
next to the –more– menu item brings up the other measurement selections.
6. Press Frequency (side). If the Frequency menu item is not visible, press
–more– (side) repeatedly until the Frequency item appears. Then press
Frequency (side).
Observe that the frequency measurement appears within the right side of the
graticule area. The measurement readout includes the notation Ch1, meaning
that the measurement is taken on the channel 1 waveform. (To take a
measurement on another channel, select that channel, and then select the
measurement.)
TDS 694C User Manual
2–21
Page 46

Tutorial
Remove Measurement
Readouts
Figure 2–14: Measure Main Menu and Select Measurement Side Menu
7. Press Positive Width (side) ➞ –more– (side) ➞ Rise Time (side) ➞
Positive Duty Cycle (side).
All four measurements are displayed. Right now, they cover a part of the
graticule area, including the displayed waveforms.
8. To move the measurement readouts outside the graticule area, press CLEAR
MENU. (See Figure 2–15.)
Use the Measure menu to remove measurements you no longer want. To remove
a measurement individually (you can also remove them, as a group), do the
following step:
1. Press MEASURE ➞ Remove Measrmnt (main) ➞ Measurement 1,
Measurement 2, and Measurement 4 (side) to remove those measurements.
Leave the rise time measurement displayed.
2–22
TDS 694C User Manual
Page 47

Tutorial
Change the Measurement
Reference Levels
Press to Remove Menus From Screen
Figure 2–15: Four Simultaneous Measurement Readouts
By default, the measurement system will use the 10% and 90% levels of the
waveform for taking the rise time measurement. You can change these values to
other percentages or change them to absolute voltage levels.
To examine the current values, press Level Setup (main) ➞ High Ref (side).
The General Purpose Knob. The general purpose knob, the large knob, is now set
to adjust the high reference level (Figure 2–16.)
There are several important things to observe on the screen:
H The knob icon appears at the top of the screen. The knob icon indicates that
the general purpose knob has just been set to adjust a parameter.
H The upper right corner of the screen shows the readout High Ref: 90%.
H The High Ref side menu item is highlighted, and a box appears around the
90% readout in the High Ref menu item. The box indicates that the general
purpose knob is currently set to adjust that parameter.
TDS 694C User Manual
Turn the general purpose knob left and right, and then use it to adjust the high
level to 80%. That sets the high measurement reference to 80%.
2–23
Page 48

Tutorial
Hint: To make large changes quickly with the general purpose knob, press the
SHIFT button before turning the knob. When the light above the SHIFT button
is on and the display says Coarse Knobs in the upper-right corner, the general
purpose knob speeds up significantly.
General Purpose Knob
Setting and Readout
General
Purpose
Knob Icon
Highlighted
Menu Item
with Boxed
Readout
Value
2–24
Figure 2–16: General Purpose Knob Indicators
The Numeric Keypad. Any time the general purpose knob is set to adjust a
numeric parameter, you can enter the value as a number using the keypad instead
of using the knob. Always end the entry of a number by pressing ENTER (
).
The numeric keypad also provides multipliers for engineering exponents, such as
m for milli, M for mega, and m for micro. To enter these multiplier values, press
the SHIFT button, and then press the multiplier.
TDS 694C User Manual
Page 49

1. Press Low Ref (side).
Tutorial
Displaying a Snapshot of
Automated Measurements
2. On the numeric keypad, press the 2, the 0, and the ENTER (
which sets the low measurement reference to 20%. Observe that the rise-time
value has changed.
3. Press Remove Measrmnt (main) ➞ All Measurements (side). That returns
the display to its original state.
You have seen how to display up to four individual automated measurements on
screen. You can also pop up a display of almost all of the automated measurements available in the Select Measrmnts side menus. This snapshot of measurements is taken on the waveform currently selected using the channel selection
buttons.
As when displaying individual measurements, you must have a stable display of
your signal, and that signal must have all the segments necessary for the
measurement you want.
1. Press Snapshot (main) to pop up a snapshot of all available single waveform
measurements. (See Figure 2–17.)
The snapshot display includes the label Ch 1, meaning that the measure-
ments displayed are taken on the channel 1 waveform. You take a snapshot
of a waveform in another channel by first selecting that channel using the
channel selection buttons.
) buttons,
The snapshot measurements do not continuously update. Snapshot executes a
one-time capture of all measurements and does not update those measurements unless it is performed again.
2. Press Again (side) to do another snapshot and update the snapshot measure-
ments.
3. Press Remove Measrmnt (main) to remove the snapshot display. (You can
also press CLEAR MENU, but a new snapshot will be executed the next
time you display the Measure menu.)
TDS 694C User Manual
2–25
Page 50

Tutorial
Figure 2–17: Snapshot of Channel 1
Example 4: Saving Setups
The TDS 694C Oscilloscopes can save its controls settings and recall them later
to quickly re-establish a setup. It provides ten storage locations to store up to ten
setups. It also provides a file system, so that you can also save setups to a floppy
disk, an optional hard disk, or an external Zip drive. Do the following procedures
to learn how to save, and then recall, a setup.
NOTE. Besides being able to save several complete setups, the oscilloscope
remembers all the parameter settings when you power it off. That feature lets
you power on and continue where you left off without having to reconstruct the
setup in effect when you powered off the oscilloscope.
Save a Setup
First, you need to create an instrument setup you want to save. Perform the
following steps to create and save a setup that is complex enough that you might
prefer not to go through all these steps each time you want that display:
2–26
1. If you are not continuing from the previous example, follow the instructions
on page 2–9 under the heading Setting Up for the Examples.
TDS 694C User Manual
Page 51

Tutorial
2. Press SETUP ➞ Recall Factory Setup (main) ➞ OK Confirm Factory
Init (side).
3. Press AUTOSET.
4. Press MEASURE ➞ Select Measrmnt (main) ➞ Frequency (side). (Press
the –more– side menu item if the Frequency selection does not appear in
the side menu.)
5. Press CH 2 ➞ CLEAR MENU.
6. Press SAVE/RECALL SETUP ➞ Save Current Setup (main) to display
the Setup main menu. (See Figure 2–18.)
CAUTION. Setup locations in the side menu appear with the label user if they
contain a stored setup or with the label factory if they do not. To avoid overwriting (and losing forever) a saved setup, choose a setup location labeled factory.
(Setup locations labeled factory have the factory setup stored as a default and
can be used to store current setups without disturbing previously stored setups.)
TDS 694C User Manual
Figure 2–18: Save/Recall Setup Menu
2–27
Page 52

Tutorial
7. Press one of the To Setup side menu buttons to store the current instrument
settings into that setup location. Remember which setup location you
selected for use later.
There are more setup locations than can be listed at one time in the side
menu. The –more– side menu item gives you access to all the setup
locations.
Once you have saved a particular setup, you can change the settings as you
wish, knowing that you can come back to that setup at any time.
8. Press MEASURE ➞ Positive Width (side) to add that measurement to the
display.
Recall a Setup
To recall the setup, press SAVE/RECALL SETUP ➞ Recall Saved Setup (main) ➞ Recall Setup (side) for the setup location you used in the last
exercise. The positive width measurement is now removed from the display
because you selected it after you saved the setup.
The step just performed completes the examples. You can restore the default
settings by pressing SETUP ➞ Recall Factory Setup (main) ➞ OK Confirm
Factory Init (side).
2–28
TDS 694C User Manual
Page 53

Overview
This chapter describes in detail how to perform the operating tasks you must do
to measure, test, process, or save and document your waveforms. It leads with
three sections on the fundamental tasks of acquiring, stably displaying, and
taking measurements on waveforms:
H Acquiring and Displaying Waveforms
H Triggering on Waveforms
H Measuring Waveforms
Once you have acquired and measured waveforms, you may want to save and
restore them or the control setups used to acquire and measure them. Or you may
want to save the display screen, complete with waveform and setup information,
to include them with the documents you produce with your desk top publishing
system. You may even want to digitally process them (add, multiply, or divide
them; integrate, differentiate or take an FFT of them). The following two topics
cover these tasks:
H Saving Waveforms and Setups
H Using Features for Advanced Applications
When performing any operation task, you might want to display a comprehensive listing of its current control settings on screen. Or you may find it handy to
display operating information about front panel controls and menus instead of
looking them up in this manual. The following topic tells you how to do both:
H Determining Status and Accessing Help
The topics just listed contain steps that you perform to accomplish the task that
the topic defines. You should read Conventions on page xi of Preface before
reading about these tasks.
Each topic just listed comprises more basic operation tasks and topics. A list of
these tasks follows.
TDS 694C User Manual
3–1
Page 54

Overview
Acquiring and Displaying
Waveforms
Triggering on Waveforms
Measuring Waveforms
Coupling Waveforms to the Oscilloscope 3–5. . . . . . . . . . . . . . . . . . . . . . . . . . . . . .
Setting up Automatically: Autoset and Reset 3–6. . . . . . . . . . . . . . . . . . . . . . . . . . .
Selecting Channels 3–8. . . . . . . . . . . . . . . . . . . . . . . . . . . . . . . . . . . . . . . . . . . . . . . .
Scaling and Positioning Waveforms 3–10. . . . . . . . . . . . . . . . . . . . . . . . . . . . . . . . . .
Choosing an Acquisition Mode 3–17. . . . . . . . . . . . . . . . . . . . . . . . . . . . . . . . . . . . . .
Customizing the Display 3–25. . . . . . . . . . . . . . . . . . . . . . . . . . . . . . . . . . . . . . . . . . .
Customizing the Display Color 3–30. . . . . . . . . . . . . . . . . . . . . . . . . . . . . . . . . . . . . .
Zooming on Waveforms 3–35. . . . . . . . . . . . . . . . . . . . . . . . . . . . . . . . . . . . . . . . . . . .
Triggering Concepts 3–43. . . . . . . . . . . . . . . . . . . . . . . . . . . . . . . . . . . . . . . . . . . . . . .
Triggering from the Front Panel 3–48. . . . . . . . . . . . . . . . . . . . . . . . . . . . . . . . . . . . .
Triggering on a Waveform Edge 3–51. . . . . . . . . . . . . . . . . . . . . . . . . . . . . . . . . . . . .
Triggering Based on Logic 3–55. . . . . . . . . . . . . . . . . . . . . . . . . . . . . . . . . . . . . . . . . .
Triggering on Pulses 3–67. . . . . . . . . . . . . . . . . . . . . . . . . . . . . . . . . . . . . . . . . . . . . . .
Delayed Triggering 3–80. . . . . . . . . . . . . . . . . . . . . . . . . . . . . . . . . . . . . . . . . . . . . . .
T aking Automated Measurements 3–88. . . . . . . . . . . . . . . . . . . . . . . . . . . . . . . . . . . .
T aking Cursor Measurements 3–98. . . . . . . . . . . . . . . . . . . . . . . . . . . . . . . . . . . . . . .
T aking Graticule Measurements 3–103. . . . . . . . . . . . . . . . . . . . . . . . . . . . . . . . . . . . .
Displaying Histograms 3–104. . . . . . . . . . . . . . . . . . . . . . . . . . . . . . . . . . . . . . . . . . . . .
Optimizing Measurement Accuracy: SPC and Probe Cal 3–108. . . . . . . . . . . . . . . . . .
Saving Waveforms and
Setups
Determining Status and
Accessing Help
Using Features for
Advanced Applications
Saving and Recalling Setups 3–115. . . . . . . . . . . . . . . . . . . . . . . . . . . . . . . . . . . . . . . .
Saving and Recalling Waveforms and Acquisitions 3–118. . . . . . . . . . . . . . . . . . . . . .
Managing the File System 3–122. . . . . . . . . . . . . . . . . . . . . . . . . . . . . . . . . . . . . . . . . .
Printing a Hardcopy 3–127. . . . . . . . . . . . . . . . . . . . . . . . . . . . . . . . . . . . . . . . . . . . . . .
Communicating with Remote Instruments 3–137. . . . . . . . . . . . . . . . . . . . . . . . . . . . . .
Displaying Status 3–141. . . . . . . . . . . . . . . . . . . . . . . . . . . . . . . . . . . . . . . . . . . . . . . . .
Displaying the Banner 3–143. . . . . . . . . . . . . . . . . . . . . . . . . . . . . . . . . . . . . . . . . . . . .
Displaying Help 3–143. . . . . . . . . . . . . . . . . . . . . . . . . . . . . . . . . . . . . . . . . . . . . . . . . .
Limit Testing 3–145. . . . . . . . . . . . . . . . . . . . . . . . . . . . . . . . . . . . . . . . . . . . . . . . . . . .
Waveform Math 3–150. . . . . . . . . . . . . . . . . . . . . . . . . . . . . . . . . . . . . . . . . . . . . . . . . .
Fast Fourier Transforms 3–153. . . . . . . . . . . . . . . . . . . . . . . . . . . . . . . . . . . . . . . . . . . .
Waveform Differentiation 3–172. . . . . . . . . . . . . . . . . . . . . . . . . . . . . . . . . . . . . . . . . .
Waveform Integration 3–177. . . . . . . . . . . . . . . . . . . . . . . . . . . . . . . . . . . . . . . . . . . . .
3–2
TDS 694C User Manual
Page 55

Acquiring and Displaying Waveforms
To use the TDS 694C Oscilloscopes to measure or monitor waveforms, you need
to know how to acquire, select, and display those waveforms properly. To help
you do so, this section describes how to do the following tasks:
H How to couple waveforms to the oscilloscope channels
H How to select channels to turn on and off their display
H How to size and position the selected channel on screen
H How to use the menus to set vertical (coupling, offset, and bandwidth) and
horizontal (time base, record length, and so on) parameters
This section also describes how to choose the appropriate acquisition mode for
acquiring your waveform, how to customize the display (including selecting the
color of the display elements).
Coupling Waveforms to the Oscilloscope
Tektronix produces a variety of probes and cables suitable for connecting various
types of signals to the input channels of this product. This subsection covers two
topics important to coupling: Probe Compensation and Input Impedance
Considerations.
To Find More Information
TDS 694C User Manual
The TDS 694C Oscilloscopes ships without probes. Tektronix recommends you
order and use the P6249, P6339 or P6158 probes. These probes take advantage
of the higher bandwidth of these models.
Tektronix also offers a variety of optical probes, differential probes, adapters, and
BNC cabling and connectors to couple a variety of signal sources to the input
channels. See Options and Accessories on page A–1 or your Tektronix Sales
representative for the specific items offered for signal coupling.
To find a procedure for changing the coupling and input impedance settings, see
To Change Vertical Parameters on page 3–11.
To find a list of available probes, see Accessory Probes on page A–3.
To find a guide for selecting probes for a variety of applications, see Appen-
dix D: Probe Selection on page D–1.
3–3
Page 56

Acquiring and Displaying Waveforms
Setting up Automatically: Autoset and Reset
The TDS 694C Oscilloscopes can automatically obtain and display a stable
waveform of usable size. It can also be reset to its factory default settings. This
subsection describes how to execute Autoset and reset, and lists the default
settings in effect after an Autoset.
Autoset automatically sets up the front panel controls based on the characteristics
of the input signal. It is much faster and easier than a manual control-by-control
setup. Autoset adjusts controls in these categories: Acquisition, Display,
Horizontal, Trigger, and Vertical.
To Autoset the
Oscilloscope
Do the following steps to automatically set up the oscilloscope:
1. Press the channel selection button (such as CH 1) corresponding to your
input channel to make it active.
2. Press AUTOSET.
If you use Autoset when one or more channels are displayed, the oscilloscope
selects the lowest numbered channel for horizontal scaling and triggering.
Vertically, all channels in use are individually scaled. If you use Autoset when no
channels are displayed, the oscilloscope will turn on channel one (CH 1) and
scale it.
NOTE. Autoset may change vertical position in order to position the waveform
appropriately. If an offsetable level II probe is attached, AUTOSET will adjust
offset to center the signal in the dynamic range of the probe.
3–4
TDS 694C User Manual
Page 57

Acquiring and Displaying Waveforms
List of Autoset Defaults
Table 3–1 lists the autoset defaults.
T able 3–1: Autoset defaults
Control Changed by autoset to
Selected channel Numerically lowest of the displayed channels
Acquire Mode Sample
Acquire Stop After RUN/STOP button only
Deskew, Channel/Probe Unchanged
Display Style Vectors
Display Intensity — Overall If less than 50%, set to 75%
Display Format YT
Horizontal Position Centered within the graticule window
Horizontal Scale As determined by the signal frequency
Horizontal Time Base Main Only
Horizontal Record Length Unchanged
Horizontal Lock Unchanged
Horizontal Fit-to-Screen Unchanged
Limit Test Off
Trigger Position Unchanged
Trigger T ype Edge
Trigger Source Numerically lowest of the displayed channels (the selected
channel)
Trigger Level Midpoint of data for the trigger source
Trigger Slope Positive
Trigger Coupling DC
Trigger Holdoff Default Holdoff: Set equal to 5 horizontal divisions
Adjustable Holdoff: 250 ns
Selection in Mode and Holdoff menu determines whether the
default holdoff value or the adjustable hold value is used.
Vertical Scale As determined by the signal level
Vertical Coupling DC
Vertical Offset 0 volts, except offsetable probes, the offset will be set to the
mid point of the signal
Zoom Off
TDS 694C User Manual
3–5
Page 58

Acquiring and Displaying Waveforms
To Reset the
Oscilloscope
Selecting Channels
To Identify the
Selected Channel
Do the following steps to reset the oscilloscope to its factory default settings:
1. Press the Save/Recall SETUP button to display the Setup menu (see Fig-
ure 3–1). Press the button directly below the Recall Factory Setup menu item.
2. Press the button to the right of the OK Confirm Factory Init side menu item.
3. Press the SET LEVEL TO 50% button (front panel) to be sure the
oscilloscope triggers on the input signal.
The TDS 694C Oscilloscopes applies all actions based on a specific waveform,
such as taking measurements or applying any changes it receives to the vertical
control settings, to the selected waveform. You can select a channel waveform, a
math waveform, or a reference waveform. This subsection describes how to
select a waveform and how you can turn the display of a waveform off.
To determine which channel is currently selected, check the channel readout. It
shows the selected channel in inverse video in the lower left corner of the
display. The channel reference indicator for the selected channel also appears in
reverse video along the left side of the display. (See Figure 3–1.)
3–6
Channel Reference
Indicator
Channel Readout
Figure 3–1: The Channel Readout
TDS 694C User Manual
Page 59

Acquiring and Displaying Waveforms
To Select and
Remove Waveforms
To select a channel, use the channel selection buttons on the right of the display.
These buttons labeled CH 1, CH 2, CH 3, CH 4, and MORE select a channel
and display it if its off. (The MORE button allows you to select internally stored
Math and Ref waveforms for display and manipulation.) The selected channel is
indicated by the lighting the LED above the button of the selected channel.
Do the following steps to first display and then remove waveforms from the
display:
1. Press CH 1, CH 2, CH 3, or CH 4 to turn on as many of these channels as
desired. The one you select last (or first if you only select one) becomes the
selected channel. Selecting a channel turns it on if it is not already on.
You do not use the channel selection buttons to select the trigger source.
Instead you select the trigger source in the Main Trigger menu or Delayed
Trigger menu.
2. Press WAVEFORM OFF to turn OFF the display of the selected channel
waveform. It will also remove from the display any automated measurements
being made on that waveform.
3. To select a math waveform you have created or a reference waveform you
have stored, press MORE and select the waveform from the More menu.
Press WAVEFORM OFF while the MORE button is lit to remove the
display of the waveform selected in the More menu.
Waveform Priority
When you turn off a waveform, the oscilloscope automatically selects the next
highest priority waveform. Figure 3–2 shows the order of priority.
1. CH1
2. CH2
3. CH3
4. CH4
1. MATH1
2. MATH2
3. MATH3
4. REF1
5. REF2
6. REF3
7. REF4
Figure 3–2: Waveform Selection Priority
Note Figure 3–2 shows two orders of priority due to the following rules: If you
are turning off more than one waveform and you start by turning off a channel
waveform, all channels will be turned off before going to the MORE waveforms.
If you start by turning off the MORE waveforms, all the MORE waveforms will
be turned off before going to the channel waveforms.
If you turn off a channel that is a trigger source, it continues to be the trigger
source even though the waveform is not displayed.
TDS 694C User Manual
3–7
Page 60

Acquiring and Displaying Waveforms
To Find More Information
To read about selecting reference waveforms, see Saving and Recalling
Waveforms on page 3–118.
To read about selecting (and creating) math waveforms, see Waveform Math on
page 3–150.
Scaling and Positioning Waveforms
The TDS 694C Oscilloscopes allows you to scale (change the vertical or
horizontal size) and position (move up, down, left, or right) waveforms on screen
for best display. (Figure 3–3 shows the results of both vertical and horizontal
scaling and positioning.) This section first tells you how to quickly check and set
vertical and horizontal scales, positions, and other parameters, such as vertical
bandwidth and horizontal record length.
To Check Position
To quickly see the position of the waveform in the display, check the Channel
Reference, and Record icons. (See figures 3–3.)
The Channel Reference icon, at the left side of the display, points to ground on
the waveform record when offset is set to 0 V. The oscilloscope contracts or
expands the selected waveform around this point when you change the vertical
scale.
To Check the
Vertical Scale
The Record View, at the top of the display, indicates where the trigger occurs and
what part of the waveform record is displayed.
Check the Vertical Readout at the bottom-left part of the display to read the
volts/division setting for each displayed channel (the selected channel is in
inverse video). (See Figure 3–4.)
3–8
TDS 694C User Manual
Page 61

Channel Reference Icon
Acquiring and Displaying Waveforms
Original Position Positioned Vertically Positioned Horizontally
To Change Vertical Scale
and Position
Original Scale Scaled Horizontally
Scaled Vertically
Figure 3–3: Scaling and Positioning
The TDS 694C Oscilloscopes permits you to change vertical scale and position
quickly from the front panel using dedicated control knobs. To change the
vertical scale and position:
1. Turn the vertical SCALE knob. Note only the scale of the selected waveform changes.
As you turn the vertical SCALE knob clockwise, the value decreases
resulting in higher resolution because you see a smaller part of the waveform. As you turn it counterclockwise, the scale increases allowing you to
see more of the waveform but with lower resolution.
2. Turn the vertical POSITION knob. Again, note that only the selected
waveform changes position.
TDS 694C User Manual
3–9
Page 62

Acquiring and Displaying Waveforms
3. To make positioning faster, press the SHIFT button. When the light above
the SHIFT button is on and the display says Coarse Knobs in the upper
right corner, the POSITION knob positions waveforms more quickly.
The POSITION knob simply adds screen divisions to the reference point of
the selected waveform. Adding divisions moves the waveform up and
subtracting them moves the waveform down. You also can adjust the
waveform position using the offset option in the Vertical menu (discussed
later in this section).
Vertical Readout
Figure 3–4: Vertical Readouts and Channel Menu
By changing the vertical scale, you can focus on a particular portion of a
waveform. By adjusting the vertical position, you can move the waveform up or
down on the display. Adjustment of vertical position is particularly useful when
you are comparing two or more waveforms.
3–10
TDS 694C User Manual
Page 63

Acquiring and Displaying Waveforms
To Change
Vertical Parameters
To select the coupling, and offset for the selected waveform, use the Vertical
menu (Figure 3–4). This menu also lets you numerically change the position or
scale instead of using the vertical knobs. To make such changes, do the
following procedures:
NOTE. The TDS 694C requires a P6339 probe for AC coupling, 10 MW input
impedance, and bandwidth selections to appear in the menus.
Coupling. To choose the type of coupling for attaching the input signal to the
vertical attenuator for the selected channel and to set its input impedance:
Press VERTICAL MENU ➞ Coupling (main) ➞ DC, GND, or (side).
H DC coupling shows both the AC and DC components of an input signal.
H Ground (GND) coupling disconnects the input signal from the acquisition.
Fine Scale. To make fine adjustments to the vertical scale, press VERTICAL
MENU ➞ Fine Scale (main) and use the general purpose knob or the keypad.
To Set External
Attenuation
Position. To adjust the vertical position to a specific number of divisions, press
VERTICAL MENU ➞ Position (main) and use the general purpose knob or the
keypad to set the offset value. Press Set to 0 divs (side) if you want to reset the
reference point of the selected waveform to the center of the display.
Offset. Use offset to subtract DC bias before examining a waveform. For example,
you might want to display a small ripple (for example, 100 mV of ripple) on a
power supply output (for example, a +5 V output). Adjust offset to keep the ripple
on screen while setting the vertical scale sensitive enough to best display the ripple.
To adjust offset, press VERTICAL MENU ➞ Offset (main). Then use the
general purpose knob or keypad to set the vertical offset. Press Set to 0 V (side)
if you want to reset the offset to zero.
You can set an external attenuation (or gain) in addition to the attenuation
specified by the probe.
To set external attenuation, press VERTICAL MENU ➞ Probe Func-
tions (main) ➞ External Attenuation or External Attenuation in dB (side).
External Attenuation — Use the general purpose knob or the keypad to set the
external attenuation as a multiplier.
TDS 694C User Manual
3–11
Page 64

Acquiring and Displaying Waveforms
External Attenuation in dB — Use the general purpose knob or the keypad to
set the external attenuation in dB.
To Check the
Horizontal Status
Record View Readout
Time Base Readout
Check the Record View to determine the size and location of the waveform
record and the location of the trigger relative to the display. (See Figure 3–5.)
Check the Time Base readout at the lower right of the display to see the
time/division settings and the time base (main or delayed) being referred to. (See
Figure 3–5. Also see Figure 3–3 on page 3–9.) Since all live waveforms use the
same time base, the oscilloscope only displays one time base and time/division
setting for all the active channels.
3–12
Figure 3–5: Record View and Time Base Readouts
TDS 694C User Manual
Page 65

Acquiring and Displaying Waveforms
To Change Horizontal
Scale and Position
The TDS 694C Oscilloscopes provides control of horizontal position and scale
using the horizontal front panel knobs.
By changing the horizontal position, you can move the waveform right or left to
see different portions of the waveform. That is particularly useful when you are
using larger record sizes and cannot view the entire waveform on one screen.
To change the horizontal scale and position:
1. Turn the horizontal POSITION and horizontal SCALE knobs. (See
Figure 3–6.)
2. If you want the POSITION knob to move faster, press the SHIFT button.
When the light above the shift button is on and the display says Coarse Knobs
in the upper right corner, the POSITION knob positions waveforms more
quickly.
TDS 694C User Manual
Figure 3–6: Horizontal Controls
When you select a channel, the horizontal SCALE knob scales all channel
waveforms displayed at the same time. If you select a math or reference
waveform, the knob scales only the selected waveform.
3–13
Page 66

Acquiring and Displaying Waveforms
When you select a channel, the horizontal POSITION knob positions all channel,
reference, and math waveforms displayed at the same time when Horizontal Lock is
set to Lock in the Zoom menu. See Zoom a Waveform on page 3–33.
To Change Horizontal
Parameters
To select the waveform record length and the trigger position, use the Horizontal
menu. You can also use this menu to change the horizontal position or scale
instead of using the horizontal knobs. You can select the delayed time base (see
Delayed Triggering on page 3–80).
Trigger Position. The trigger point marks time zero in a waveform or acquisition
(in Extended Acquisition mode) record. All record points before the trigger event
make up the pretrigger portion of the record. Every record point after the trigger
event is part of the posttrigger portion. All timing measurements in the record are
made relative to the trigger event. To define the trigger point position:
Press HORIZONTAL MENU ➞ Trigger Position (main) ➞ Set to 10%, Set
to 50%, or Set to 90% (side), or use the general purpose knob or the keypad to
change the value.
Record Length. The number of points that make up the waveform record is
defined by the record length. To set the waveform record length:
1. Press HORIZONTAL MENU ➞ Record Length (main). Select the record
length desired from the side menu. Press –more– to see additional choices:
TDS 694C Oscilloscopes have standard record lengths up to 30,000 points.
Record lengths up to 120,000 with Option 1M.
3–14
2. To fit an acquired waveform (or with Extended Acquisition On, an acquisition) to the visible screen, regardless of record length, press HORIZONTAL
MENU ➞ Record Length (main). Then toggle Fit to Screen to ON from
the side menu. This feature fits the waveform automatically much like you
could do manually — by turning zoom mode on and changing the time/division
until the waveform fits the screen. To turn off this feature, toggle Fit to Screen
to OFF.
Horizontal Scale. To change the horizontal scale (time per division) numerically
in the menu instead of using the Horizontal SCALE knob:
Press HORIZONTAL MENU ➞ Horiz Scale (main) ➞ Main Scale or
Delayed Scale (side), and use the keypad or the general purpose knob to change
the scale values.
TDS 694C User Manual
Page 67

Acquiring and Displaying Waveforms
Horizontal Position. To set the horizontal position to specific values in the menu
instead of using the Horizontal POSITION knob:
Press HORIZONTAL MENU ➞ Horiz Pos (main) ➞ Set to 10%, Set to
50%, or Set to 90% (side) to choose how much of the waveform will be
displayed to the left of the display center.
You can also control whether changing the horizontal position setting affects all
displayed waveforms, just the live waveforms, or only the selected waveform.
See Zoom a Waveform, on page 3–33 for the steps to set the horizontal lock feature.
To Select the
Delayed Time Base
To Find More Information
You also can select Delayed Runs After Main or Delayed Triggerable. Use the
main time base for most applications. Use the delayed time base when you want
to delay an acquisition so it captures and displays events that follow other
events. See To Find More Information below.
To perform tutorials that teach selecting, scaling, and positioning of waveforms,
see Example 1: Displaying a Waveform on page 2–13 and Example 2: Displaying
Multiple Waveforms on page 2–16.
To learn how to use delay with waveforms, see Delayed Triggering on
page 3–80. To learn how to magnify waveforms, see Zooming on Waveforms, on
page 3–32.
Choosing an Acquisition Mode
The TDS Oscilloscopes are digital products that can acquire and process your
input signal in a variety of modes. To help you choose the best mode to use for
your signal measurement task, this section first describes:
H How the oscilloscope samples and digitizes an input signal
H How the different acquisition modes (such as interpolation) affect this process
TDS 694C User Manual
H How to select among these modes
Following these descriptions are procedures for selecting the sampling and
acquisition modes, beginning with Checking the Acquisition Readout on page 3–20.
3–15
Page 68
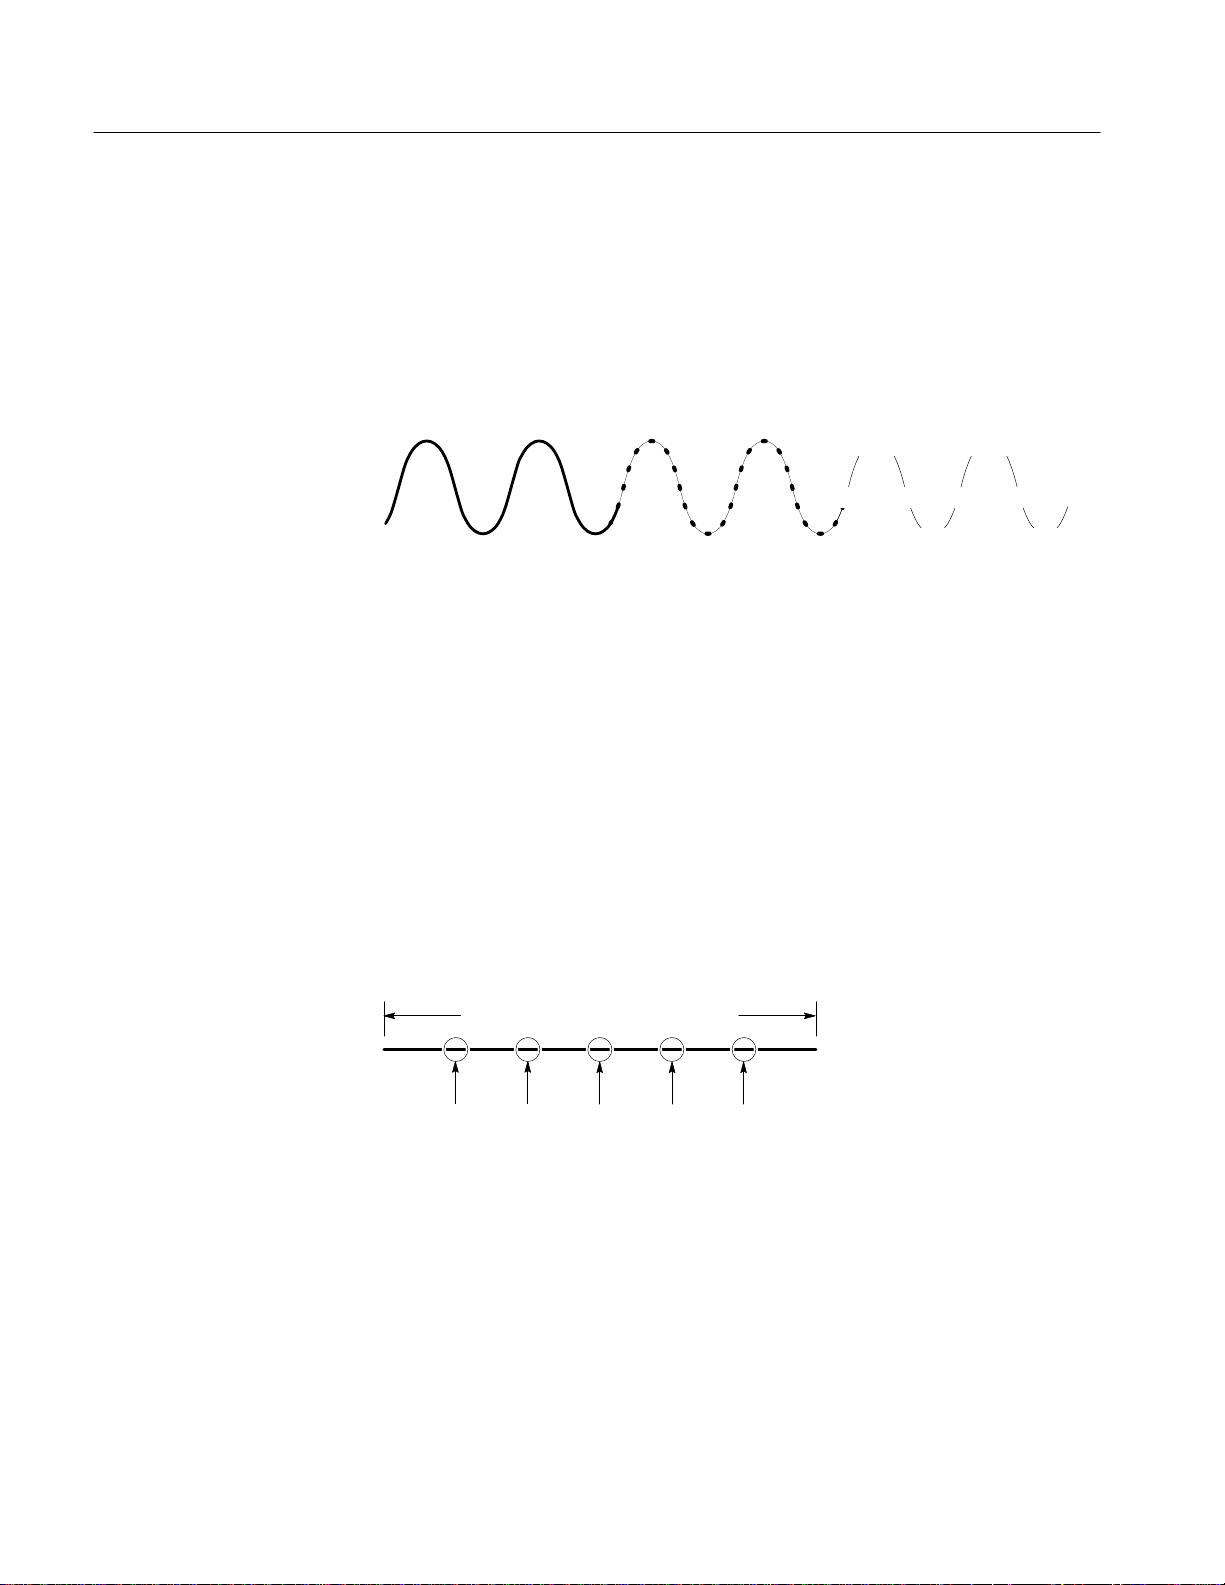
Acquiring and Displaying Waveforms
Sampling and Digitizing
Acquisition is the process of sampling the analog input signal, digitizing it to
convert it into digital data, and assembling it into a waveform record. (See
Figure 3–7.) The oscilloscope creates a digital representation of the input signal
by sampling the voltage level of the signal at regular time intervals. The sampled
and digitized points are stored in memory along with corresponding timing
information. You can use this digital representation of the signal for display,
measurements, or further processing.
+5.0 V
0 V 0 V 0 V 0 V
Input Signal Sampled Points Digital Values
–5.0 V
+5.0 V
–5.0 V
Figure 3–7: Acquisition: Input Analog Signal, Sample, and Digitize
The oscilloscope uses the samples it takes (see Figure 3–9) to create a waveform
record containing a user-specified number of data or record points. Each record
point represents a certain voltage level that occurs a determined amount of time
from the trigger event.
The oscilloscope may take more samples than the number of points in your
waveform record. In fact, the oscilloscope may take several samples for each record
point (see Figure 3–8). The digitizer can use any extra samples to perform
additional processing, such as looking for minimum and maximum values. The
methods of sampling and acquisition modes you choose determine how the
oscilloscope assembles the sample points it acquires into the waveform record.
Interval for one waveform record point.
Samples for a record point.
Figure 3–8: Several Points May be Acquired for Each Point Used
3–16
TDS 694C User Manual
Page 69

Acquiring and Displaying Waveforms
Real-time Sampling
Interpolation
The general method of sampling are real-time and equivalent-time. The TDS
694C Oscilloscopes use only real-time sampling.
In real-time sampling, the oscilloscope digitizes all the points it acquires after
one trigger event (see Figure 3–9). Always use real-time sampling to capture
single-shot or transient events.
Record Points
Sampling Rate
Figure 3–9: Real-Time Sampling
Your oscilloscope can interpolate between the samples it acquires. It does so only
when it cannot obtain all the real samples it needs to fill up its waveform record.
For instance, setting the horizontal SCALE to progressively faster acquisition
rates leaves progressively shorter time periods for the waveform record.
Therefore, the oscilloscope must sample faster to acquire the samples (record
points) needed to fill up the record. Eventually the time period established by
scale setting does not allow enough time to get all the real samples needed to fill
the record.
The Acquisition Modes
The situation just described occurs if you set the Horizontal SCALE knob to a
time base setting that is faster than 5 ns. The oscilloscope then interpolates to
create the intervening points in the waveform record. There are two options for
interpolation: linear or sin(x)/x.
Linear interpolation computes record points between actual acquired samples by
using a straight line fit. It assumes all the interpolated points fall in their
appropriate point in time on that straight line. Linear interpolation is useful for
many waveforms such as pulse trains.
Sin(x)/x interpolation computes record points using a curve fit between the actual
values acquired. It assumes all the interpolated points fall along that curve. That
is particularly useful when acquiring more rounded waveforms such as sine
waves. Actually, it is appropriate for general use, although it may introduce some
overshoot or undershoot in signals with fast rise times.
The TDS 694C oscilloscope supports the following four acquisition modes:
Sample, Envelope, Average, and Peak Detect.
Sample (the mode most commonly used), Peak Detect operate in real time on a
single trigger event, provided that the oscilloscope can acquire enough samples
for each trigger event. Envelope and Average modes operate on multiple
TDS 694C User Manual
3–17
Page 70

Acquiring and Displaying Waveforms
acquisitions; the oscilloscope averages or envelopes several waveforms on a
point-by-point basis.
Figure 3–10 illustrates the different modes and lists the benefits of each. It will
help you select the appropriate mode for your application. Refer to it as your
read the following descriptions of each mode.
Sample Mode. In Sample mode, the oscilloscope creates a record point by saving
the first sample (of perhaps many) during each acquisition interval. (An
acquisition interval is the time covered by the waveform record divided by the
record length.) Sample mode is the default mode.
Envelope Mode. In Envelope mode, the oscilloscope acquires and displays a
waveform record that shows the extremes in variation over several acquisitions
(you specify the number of acquisitions). The oscilloscope saves the highest and
lowest values in two adjacent intervals similar to the Peak Detect mode. But
Envelope mode, unlike Peak Detect, gathers peaks over many trigger events.
After each trigger event, the oscilloscope acquires data and then compares the
min/max values from the current acquisition with those stored from previous
acquisitions. The final display shows the most extreme values for all the
acquisitions for each point in the waveform record.
Average Mode. Average mode lets you acquire and display a waveform record
that is the averaged result of several acquisitions. This mode reduces random
noise. The oscilloscope acquires data after each trigger event using Sample
mode. It then averages the record point from the current acquisition with those
stored from previous acquisitions.
Peak Detect Mode. Peak Detect mode alternates between saving the highest
sample in one acquisition interval and lowest sample in the next acquisition
interval. Peak Detect mode only works with real-time, noninterpolated sampling.
If you set the time base so fast that it requires real-time interpolation, the mode
automatically changes from Peak Detect to Sample, although the menu selection
will not change.
NOTE. For record lengths of 30,000 points of less, the Peak Detect sample
interval will be 100ps. For record lengths of 50,000 points or greater, the Peak
Detect sample interval will be 400ps.
3–18
TDS 694C User Manual
Page 71

Single Waveform Acquisition
Acquiring and Displaying Waveforms
Samples Acquired in Four
Acquisition Intervals
Interval 1 2 3 4
Use for fastest acquisition rate. This is the default mode.
Uses highest and lowest samples in
Use to reveal aliasing and for glitch detection. Provides the benefits of enveloping with the speed of a single acquisition.
Acquisition
Mode
Interval 1 2 3 4
Sample
Uses first sample in
interval
Peak Detect
two intervals
Displayed
Record Points
Multiple Waveform Acquisitions
Three Acquisitions from One Source
Acquisition
Mode
Waveform Drawn
on CRT
Waveform Drawn
on CRT
Acquisition 1 2 3
Uses Peak Detect Mode for Each Acquisition
Use to reveal variations in the signal across time.
Uses Sample Mode for Each Acquisition
Use to reduce apparent noise in a repetitive signal.
Figure 3–10: How the Acquisition Modes Work
Envelope
Finds highest and
lowest record points over
many acquisitions
Average
Calculates average value for
each record point over
many acquisitions
TDS 694C User Manual
3–19
Page 72

Acquiring and Displaying Waveforms
Checking the
Acquisition Readout
Acquisition Readout
To determine the acquisition sampling rate, the acquisition state (running or
stopped), and the acquisition mode, check the Acquisition readout at the top of
the display. (See Figure 3–11.) The state “Run:” shows the sample rate and
acquisition mode. The state “Stop:”shows the number of acquisitions acquired
since the last stop or major change.
3–20
Selecting an
Acquisition Mode
Stop After
Figure 3–11: Acquisition Menu and Readout
The oscilloscope provides several modes (see The Acquisition Modes on
page 3–17) for acquiring and converting analog data into digital form. To choose
how the oscilloscope will create points in the waveform record:
1. Press SHIFT ACQUIRE MENU ➞ Mode (main). (See Figure 3–11.)
2. Press Sample, Envelope, Average, or Peak Detect (side) or ...
3. If you selected Envelope or Average, enter the number of waveform records
to be enveloped or averaged using the keypad or the general purpose knob.
To choose the event that stops the acquiring waveforms, do the following step:
Press SHIFT ACQUIRE MENU ➞ Stop After (main) ➞ RUN/STOP button
only, Single Acquisition Sequence, or Limit Test Condition Met (side). (See
Figure 3–12.)
TDS 694C User Manual
Page 73

Acquiring and Displaying Waveforms
Figure 3–12: Acquire Menu — Stop After
H Press RUN/STOP button only (side) to use the RUN/STOP button to start
or stop acquiring. Pressing the RUN/STOP button once will stop the
acquisitions. The upper left hand corner in the display will say “Stop” and
show the number of acquisitions. If you press the button again, the oscilloscope will resume taking acquisitions.
RUN/STOP Foot Switch performs the same function as the RUN/STOP
button only. The foot switch is recommended when both hands are needed
to probe two test points. To toggle the RUN/STOP function you can easily
step on the foot switch. The foot switch connects to the TDS 694C Oscilloscope’s RS–232 port located on the rear panel. See Appendix A: Table A–2,
for Standard accessories
Set Communications Parameters. To set up the communication parameters for
a foot switch attached directly to the oscilloscope RS-232 port:
Press SHIFT ➞ UTILITY ➞ System (main) ➞ I/O (pop-up) ➞ Config-
ure (main) ➞ Foot Switch RUN/STOP (side).
H Press Single Acquisition Sequence (side). That selection lets you run a
single sequence of acquisitions by pressing the RUN/STOP button. In
Sample, Peak Detect, the oscilloscope will acquire a waveform record with
the first valid trigger event and stop.
TDS 694C User Manual
In Envelope or Average mode, the oscilloscope will make the specified
number of acquisitions to complete the averaging or enveloping task.
3–21
Page 74

Acquiring and Displaying Waveforms
NOTE. To quickly select Single Acquisition Sequence without displaying the
Acquire and Stop After menus, press SHIFT FORCE TRIG. Now the RUN/STOP
button operates as just described. (You still must display the Acquire menu and
then the Stop After menu to leave Single Acquisition Sequence operation.)
H Press Limit Test Condition Met (side) to acquire waveforms until
NOTE. For the oscilloscope to stop an acquisition when limit test conditions have
been met, limit testing must be turned ON using the Limit Test Setup main menu.
waveform data exceeds the limits specified in the limit test. Then acquisition
stops. At that point, you can also specify other actions for the oscilloscope to
take, using the selections available in the Limit Test Setup main menu.
Setting up limit testing requires several more steps. See Limit Testing on
page 3–145.
Preventing Aliasing
Actual High-Frequency Waveform
Apparent Low-frequency
Waveform Due to Aliasing
Sampled Points
Under certain conditions, a waveform may be aliased on screen. Read the
following description about aliasing and the suggestions for preventing it.
About Aliasing. When a waveform aliases, it appears on screen with a frequency
lower than the actual waveform being input or it appears unstable even though
the light next to TRIG’D is lighted. Aliasing occurs because the oscilloscope
cannot sample the signal fast enough to construct an accurate waveform record.
(See Figure 3–13.)
Figure 3–13: Aliasing
3–22
Methods to Check and Eliminate. To quickly check for aliasing, slowly increase
the horizontal scale (time per division setting). If the shape of the displayed
waveform changes drastically or becomes stable at a faster time base setting,
your waveform was probably aliased.
TDS 694C User Manual
Page 75

To avoid aliasing, be sure to sample the input signal at a rate more than twice as
fast as the highest frequency component. For example, a signal with frequency
components of 500 MHz would need to be sampled at a rate faster than
1 Gigasamples/second to represent it accurately and to avoid aliasing. The
following tips may help you eliminate aliasing on a signal:
H Try adjusting the horizontal scale.
H Try pressing the AUTOSET button.
H Try switching the acquisition mode (in the acquisition menu) to Envelope or
Customizing the Display
The TDS 694C Oscilloscopes can display waveform records and other display
elements in different ways. This section describes how to adjust the oscilloscope
display style, intensity level, graticule, and format.
Acquiring and Displaying Waveforms
Peak Detect. Envelope searches for samples with the highest and lowest
values over multiple acquisitions; Peak Detect mode does the same but in a
single acquisition. Either can detect faster signal components over time.
Change Display Settings
Select the Display Style
To bring up the Display menu:
Press DISPLAY ➞ Settings (main) ➞ Display (pop-up).
The Display menu allows you to adjust the style, intensity level, graticule, and
format features described below. The Color menu allows you to alter color
settings for various display components such as waveforms and text. To find
more information on color, see Customizing the Display Color on page 3–28.
Press DISPLAY ➞ Settings (main) ➞ Display (pop-up) ➞ Style (main) ➞
Vectors, Dots, Intensified Samples, Infinite Persistence, or Variable
Persistence (side). (See Figure 3–14.)
Vectors style displays vectors (lines) between the record points.
Dots style displays waveform record points as dots.
Intensified Samples style also displays waveform record points as dots. However,
the points actually sampled are displayed in the color labeled “Zone” in the
Display Colors menus.
In addition to choosing Intensified Samples in the side menu, the oscilloscope
must be interpolating or Zoom must be on with its horizontal expansion greater
that 1X. See Interpolation on page 3–17; see Zooming on Waveforms on page
3–32.
TDS 694C User Manual
3–23
Page 76

Acquiring and Displaying Waveforms
Variable Persistence style accumulates the record points on screen and displays
them only for a specific time interval. In that mode, the display behaves like that
of an analog oscilloscope. You enter the time for that option with the keypad or
the general purpose knob. Record points are also displayed with colors that vary
depending on the persistence of the point. See Choose a Palette on page 3–29.
Infinite Persistence style accumulates the record points until you change some
control (such as scale factor) causing the display to be erased.
Adjust Intensity
Set Display Readout
3–24
Options
Figure 3–14: Display Menu — Style
Intensity lets you set text/graticule and waveform intensity (brightness) levels.
To set the intensity:
Press DISPLAY ➞ Settings (main) ➞ Display (pop-up) ➞ Intensity (main) ➞
Text/Grat or Waveform (side). Enter the intensity percentage values with the
keypad or the general purpose knob.
All intensity adjustments operate over a range from 20% (close to fully off) to
100% (fully bright).
Readout options control whether the trigger indicator, trigger level bar, and
current date and time appear on the display. The options also control what style
trigger level bar, long or short, is displayed.
TDS 694C User Manual
Page 77

Acquiring and Displaying Waveforms
1. Press DISPLAY ➞ Settings (main) ➞ Display (pop-up) ➞ Readout
Options (main).
2. Toggle Display ‘T’ @ Trigger Point (side) to select whether or not to
display ‘T’ indicating the trigger point. You can select ON or OFF. (The
trigger point indicates the position of the trigger in the waveform record.)
3. Press Trigger Bar Style (side) to select either the short or the long trigger
bar or to turn the trigger bar off. (See Figure 3–15. Note that both styles are
shown for illustrating purposes, but you can only display one style at a time.)
The trigger bar is only displayed if the trigger source is an active, displayed
waveform. Also, two trigger bars are displayed when delay triggerable
acquisitions are displayed — one for the main and one for the delayed time
base. The trigger bar is a visual indicator of the trigger level.
Trigger Point Indicator
Trigger Bar—Long Style
-or-
Trigger Bar—Short Style
Figure 3–15: Trigger Point and Level Indicators
TDS 694C User Manual
3–25
Page 78

Acquiring and Displaying Waveforms
4. Press Display Date/Time (side) to turn it on or off. Push Clear Menu to see
Sometimes, especially when using the hardcopy feature, you may want to
display the current date and time on screen. (To find more information
displaying and setting date and time, see Date/Time Stamp the Hardcopy on
page 3–130.)
the current date and time.
Select Interpolation Filter
Select the Graticule Type
The display filter types are sin(x)/x interpolation and linear interpolation. To
switch between interpolation filters:
DISPLAY ➞ Settings (main) ➞ Display (pop-up) ➞ Filter (main) ➞ Sin(x)/x
Interpolation or Linear Interpolation (side).
NOTE. When the horizontal scale is set to the faster rates (2 ns/div for the
TDS 694C) or when using the ZOOM feature to expand waveforms horizontally,
interpolation occurs. (The filter type, linear or sin(x)/(x), depends on which is set
in the Display menu.) Otherwise, interpolation is not used. See Interpolation on
page 3–17 for a discussion of interpolation.
To change the graticule:
Press DISPLAY ➞ Settings (main) ➞ Display (pop-up) ➞ Graticule (main) ➞
Full, Grid, Cross Hair, Frame, NTSC or PAL (side).
Full provides a grid, cross hairs and a frame.
Grid displays a frame and a grid.
Cross Hair provides cross hairs, and a frame.
3–26
Frame displays just a frame.
NTSC provides a grid useful for measuring NTSC-class waveforms.
PAL provides a grid useful for measuring PAL-class waveforms.
NOTE. Selecting either NTSC or PAL graticules automatically changes the
vertical scale, position settings, coupling, and sets to zero any vertical offset of
any channel displayed. These settings are not restored after switching to other
graticule types. Therefore, you might want to recall the factory setup or other
stored setup after selecting a different graticule.
TDS 694C User Manual
Page 79

Acquiring and Displaying Waveforms
Select the Format
The oscilloscope displays waveforms in either of two formats: YT and XY. To
set the display axis format:
Press DISPLAY ➞ Settings (main) ➞ Display (pop-up) ➞ Format (main) ➞
XY or YT (side).
YT is the conventional oscilloscope display format. It shows a signal voltage (the
vertical axis) as it varies over time (the horizontal axis).
XY format compares the voltage levels of two waveform records point by point.
That is, the oscilloscope displays a graph of the voltage of one waveform record
against the voltage of another waveform record. This mode is particularly useful
for studying phase relationships.
When you choose the XY format, any channel or reference displayed is assigned
to the axis indicated in Table 3–2 and displayed as part of an XY pair. If only one
source in an XY pair is displayed, the oscilloscope automatically turns on the
other source to complete the XY pair when you select XY. Moreover, once XY is
on, selecting either source in a pair turns the pair on; pressing WAVEFORM OFF
for either source in the pair removes both sources from the display.
T able 3–2: XY Format pairs
XY Pair X-Axis source Y-Axis source
Ch 1 and Ch 2 Ch 1 Ch 2
Ch 3 and Ch 4 Ch 3 Ch 4
Ref 1 and Ref 2 Ref 1 Ref 2
Ref 3 and Ref 4 Ref 3 Ref 4
Since selecting YT or XY affects only the display, the horizontal and vertical
scale and position knobs and menus control the same parameters regardless of
the mode selected. Specifically, in XY mode, the horizontal scale will continue
to control the time base and the horizontal position will continue to control
which portion of the waveforms are displayed.
XY format is a dot-only display, although it can have persistence. The Vector
style selection has no effect when you select XY format.
You cannot display Math waveforms in XY format. They will disappear from the
display when you select XY.
TDS 694C User Manual
3–27
Page 80

Acquiring and Displaying Waveforms
Customizing the Display Color
The TDS 694C Oscilloscopes can display information in different colors. This
section describes how to use the Color menu to choose the colors in which the
various display objects appear.
Change the Display Color
To bring up the Color menu:
1. Press DISPLAY to show the Display menu.
2. Press Settings in the main menu until you select Color from the pop-up
menu. (See Figure 3–16.)
The Color menu allows you to alter color settings for various display components such as waveforms and text. The Display menu allows you to adjust the
style, intensity level, graticule, and format features. To find more information on
display, see Change the Display Settings on page 3–23.
3–28
Figure 3–16: Display Menu — Setting
TDS 694C User Manual
Page 81

Acquiring and Displaying Waveforms
Choose a Palette
Change the Palette Colors
To choose a palette of 13 colors from a menu of preset palettes:
1. Choose the starting palette by selecting Palette from the main menu.
2. Select one of the available palettes in the side menu. Choose from Normal,
Bold, Hardcopy Preview or Monochrome.
3. If you are using a persistence display and want to vary the color of each
point depending on its persistence, choose Persistence Palettes. Then
choose Temperature, Spectral, or Gray Scale from the resulting side menu.
Choose View Palette to preview your selection on the display. Press
Persistence Palette to quit preview mode. Press Clear Menu to return to the
Palette menu.
NOTE. You can select the Hardcopy Preview palette when using certain color
hardcopy formats. The default colors in the this palette comprise a white background and fully saturated primary colors which generally produce the best result.
To change the color of the current palette, select a color and vary these attributes:
Hue, which is the wavelength of light reflected from the surface. It varies
continuously along the color spectrum as produced by a rainbow. Hue is not
available on monochrome oscilloscopes.
Lightness, which is the amount of light reflected from the surface. It varies from
black, to the nominal color, to white.
Saturation, which is the intensity of color. Completely desaturated color is gray.
Completely saturated color of any hue is that color at its most intense level.
Saturation is not available on monochrome oscilloscopes.
1. Color oscilloscopes: Select the main menu Change Colors item. (See
Figure 3–17.)
If changing the colors of a persistence palette: press Palette (main) ➞
Persistence Palettes (side) ➞ View Palette (main). Then select the palette
you want to change from the side menu and select the main menu Change
Colors for item.
2. Select one of the colors by pressing (repeatedly) Color (Color Index if
changing a persistence palette) in the side menu.
3. If you want to use the factory default for this color or color index, press the
side menu Reset to Factory Color.
4. Choose Hue from the side menu and use the general purpose knob or keypad
to select the desired hue. Values range from 0 to 359. Sample values are:
TDS 694C User Manual
3–29
Page 82

Acquiring and Displaying Waveforms
5. Choose Lightness from the side menu and use the general purpose knob or
6. Choose Saturation from the side menu and use the general purpose knob or
0 = blue, 60 = magenta, 120 = red, 180 = yellow, 240 = green, and
300 = cyan.
keypad to select the lightness you desire. A value of 0 results in black. A
value of 50 provides the nominal color. A value of 100 results in white.
keypad to select the saturation you desire. A value of 100 provides a pure
color. A value of 0 provides gray.
Set Math Waveform Color
ScrTxt
Figure 3–17: Display Menu — Palette Colors
To define math waveform colors:
1. Choose to define math waveform colors by selecting the main menu Map
Math item.
2. Select one of the three math waveforms by pressing Math in the side menu.
3. If you want to assign the selected math waveform to a specific color, press
Color and cycle through the choices.
4. If you want the selected math waveform to be the same color as the
waveform it is based on, select Color Matches Contents. If the math
waveform is based on dual waveforms, the math waveform will use the color
of the first constituent waveform.
3–30
TDS 694C User Manual
Page 83

Acquiring and Displaying Waveforms
To return to the factory defaults, select Reset to Factory Color.
Set Reference Waveform
Color
To define reference waveform colors:
1. Press Map Reference in the main menu. (See Figure 3–18.)
2. Select one of the four reference waveforms by pressing Ref in the side menu.
3. To assign the selected reference waveform to a specific color, press
(repeatedly) Color and choose the value.
4. To make the selected reference waveform the same color as the waveform it
is based on, select Color Matches Contents.
To return to the factory defaults, select Reset to Factory Color.
Select Options
Restore Colors
TDS 694C User Manual
Figure 3–18: Display Menu — Map Reference Colors
To define what color to show where a waveform crosses another waveform:
1. Press the Options main menu item.
2. Toggle Collision Contrast to ON in the side menu to mark collision zones
with a special color.
To restore colors to their factory default settings:
3–31
Page 84

Acquiring and Displaying Waveforms
1. Press the main menu Restore Colors item. (See Figure 3–19.)
2. Select the object(s) you want to restore by pressing Reset Current Palette
To Factory, Reset All Palettes To Factory (Reset Palette on monochrome
oscilloscopes), or Reset All Mappings To Factory in the side menu.
Zooming on Waveforms
Using with Waveforms
3–32
Figure 3–19: Display Menu — Restore Colors
The TDS 694C Oscilloscopes can expand or compress (zoom in or out) on a
waveform without changing the acquisition parameters (sample rate, record
length, and so on). This section describes how to use Zoom and how it interacts
with the selected waveform. It also describes how interpolation can affect Zoom.
Use Zoom (press the ZOOM button) when you want to temporarily expand a
waveform to inspect small feature(s) on that waveform. For example, to
temporarily expand the front corner of a pulse to inspect its aberrations, use
Zoom to expand it horizontally and vertically. After you are finished, you can
return to your original horizontal scale setting by pressing one menu button.
To help you use zoom effectively, consider how it operates on waveforms. When
zooming vertically, the oscilloscope expands or contracts the selected waveform
only. Also, the oscilloscope only positions the selected waveform when in Zoom.
TDS 694C User Manual
Page 85

Acquiring and Displaying Waveforms
When zooming horizontally, Zoom expands either the selected waveform, all live
waveforms, or all live and reference waveforms, depending on the setting for
Horizontal Lock in the Zoom menu.
When zooming horizontally or vertically, Zoom expands or contracts the
waveform by the zoom factor.
Interpolation and Zoom
Checking the Zoom Factor
To help you use Zoom effectively, consider how it is affected by interpolation.
When you zoom on a waveform, you expand a portion of it. If the expansion
requires the oscilloscope to show more points for that portion than it has
acquired, it interpolates.
The method the oscilloscope uses to interpolate, linear or sin(x)/x, can affect the
way Zoom displays your waveform. If you selected sin(x)/x (the default), it may
introduce some overshoot or undershoot to the waveform edges. If such is the
case, change the interpolation method to linear, following the instructions on
page 3–35.
To read about the two interpolation methods, see Interpolation on page 3–17. To
differentiate between the real and interpolated samples, set the display style to
Intensified Samples. (See Select the Display Style on page 3–23.)
To quickly determine the zoom factor of a zoomed waveform, select it and check
the Zoom readout. It shows the selected waveform by number, along with the
horizontal and vertical expansion factors.
The Zoom readout appears at the top of the display when zoom is on. (See
Figure 3–20 on page 3–35.) Dual-window (preview) mode does not display the
Zoom readout.
Zoom a Waveform
TDS 694C User Manual
To use Zoom, select a waveform, turn Zoom on, and magnify that waveform
using the vertical and horizontal scale knobs:
1. Press any of waveform selection buttons CH 1 through CH 4 on the right
side of the display. Or press MORE and select a math or reference waveform
from the More menu.
2. Press ZOOM.
Press ZOOM ➞ Mode (main) ➞ ON (side). The ZOOM front-panel button
should light up. Toggle Dual Zoom to OFF in the side menu.
3. Adjust the vertical zoom factor for the selected waveform using the vertical
SCALE knob. Adjust the vertical position of the zoomed waveform using
the vertical POSITION knob.
3–33
Page 86

Acquiring and Displaying Waveforms
4. Adjust the horizontal zoom factor using the horizontal SCALE knob. Adjust
5. Press ZOOM ➞ Lock (main) ➞ All, Live, or None (side).
the horizontal position of the zoomed waveform using the horizontal
POSITION knob.
Depending on the selection for Horizontal Lock in the side menu, Zoom
affects the displayed waveforms as follows:
None — only the waveform currently selected can be magnified and
positioned horizontally (Figure 3–20).
Live — all “live” (as opposed to reference) waveforms can be magnified and
positioned horizontally at the same time. If a reference or math waveform is
selected and Horizontal Lock set to Live, only the selected reference or math
waveform is magnified and positioned.
All — all waveforms displayed (live, math, and reference) can be magnified
and positioned horizontally at the same time.
NOTE. Although Zoom must be turned on to control which waveforms Zoom
affects, the setting for Horizontal Lock affects which waveforms the horizontal
control positions whether Zoom is on or off. The rules for the three settings are
listed in step 4 on page 3–34.
3–34
TDS 694C User Manual
Page 87

Only the selected
waveform (the top one)
changes size.
Acquiring and Displaying Waveforms
Set Interpolation
Reset Zoom
Using Dual Window Mode
Figure 3–20: Zoom Mode with Horizontal Lock Set to None
To change the interpolation method used, press DISPLAY ➞ Settings (main) ➞
Display (pop-up) ➞ Filter (main) ➞ Sin(x)/x Interpolation or Linear
Interpolation (side).
To reset all zoom factors to their defaults, do the following step:
Press ZOOM ➞ Reset (main) ➞ Reset Live Factors or Reset All Factors
(side). Reset Live Factors resets only for live waveforms, as opposed to reference
waveforms; Reset All Factors resets for all waveforms.
The oscilloscope can display and control a waveform that is both zoomed and
unzoomed (magnified and unmagnified). To do so, it creates two 1/2 height
graticules, or windows, and displays the magnified waveform in the upper, and
the unmagnified waveform in the lower graticule. To use Dual Window Zoom
(also called zoom preview mode), do the following steps:
1. Press Zoom ➞ Mode (main) ➞ Preview (side). Note that the oscilloscope
displays the box-enclosed area on the waveform as magnified in the top
graticule. (See Figure 3–21.)
TDS 694C User Manual
2. To scale or position the unmagnified waveform, press Selected Grati-
cule (main) ➞ Lower (side). Use the vertical and horizontal knobs to scale
and position the unmagnified waveform in the box.
3–35
Page 88

Acquiring and Displaying Waveforms
3. To scale or position the magnified waveform, press Selected Grati-
Note that as you scale or move the unmagnified waveform relative to the
box, the oscilloscope alters the magnified display accordingly to include
only the waveform portion within the box.
cule (main) ➞ Upper (side). Use the vertical and horizontal knobs to scale
and position the magnified waveform.
Note that as you scale or move the magnified waveform, the oscilloscope
scales or moves the box relative to the unmagnified waveform, so the box
encloses only the waveform portion magnified in the upper graticule.
In Dual Window Zoom mode, the oscilloscope does not display the zoom
magnification factors; however, it does display the scale factors (volts/division and time/division) for the zoomed waveform.
Zoomed (Magnified) Waveforms
Nonzoomed Waveforms, with Box
Indicators at Corners Denoting
the Selected Graticule
Dual Zoom a Waveform
Figure 3–21: Dual Window (Preview) Mode
To select Dual Zoom, press ZOOM ➞ Mode (main) ➞ Dual Zoom (side) to
toggle it to ON. (See Figure 3–22.)
Dual zoom displays a second zoomed view of the selected unzoomed waveform.
The second zoomed view is offset in time from the first zoomed view. Also,
zoom must be enabled (side menu set to On or Preview) to see the Dual Zoom
displays.
3–36
TDS 694C User Manual
Page 89

Acquiring and Displaying Waveforms
To Set Dual Zoom Offset
To set the offset in time of the second zoomed waveform from the first, press
ZOOM ➞ Mode (main) ➞ Dual Zoom Offset (side). Then turn the general
purpose knob or use the keypad to set the offset.
Dual Zoom offset is always positive. The oscilloscope sets the offset as close to
the requested value as possible. An offset request of 0.0 insures that the zoom
boxes are butted up against each other, regardless of the zoom factor.
The horizontal zoom and scale factors determine the minimum offset time
available. Both zoom boxes always enclose equal amounts of time with the
second box always offset from the first by a time equal to one box. Doubling the
zoom factor halves the time enclosed by either box and, therefore, halves the
minimum offset time.
The oscilloscope retains any value input that is less than the minimum time
available as a “request” if you enter that value using the keypad. Increasing the
zoom factor or decreasing the horizontal scale to a setting that allows the
requested value sets offset time to that value. You cannot set offset to less than
the minimum offset time available when using the general purpose knob.
NOTE. To make setting up Dual Zoom easier, turn on Preview in the side menu.
In this dual-window mode, the zoomed display appears in the top graticule,
while the lower graticule shows the two zoomed portions enclosed in two boxes
on the unzoomed waveform. Adjusting Dual Zoom offset moves the right box
relative to the left box, which remains stationary. The associated zoomed
waveform in the upper graticule moves to track the offset changes. You can also
adjust the waveform relative to the zoom boxes by selecting the lower graticule
and adjusting the vertical and horizontal control knobs. See Using Dual Window
Mode on page 3–35.
TDS 694C User Manual
3–37
Page 90

Acquiring and Displaying Waveforms
Selected Graticule
Zoomed Waveform Edges
Zoom Boxes
Unzoomed Waveform
Figure 3–22: Dual Zoom — Shown Dual Window (Preview) Mode
3–38
TDS 694C User Manual
Page 91

Triggering on Waveforms
To use the TDS 694C Oscilloscopes to measure or monitor waveforms, you need
to know how to trigger a stable display of those waveforms. Toward that end,
this section first covers the following topics:
H Trigger Concepts which details some basic principles of triggering and
describes triggering elements: type, source, coupling, holdoff, mode,
and so on.
H Triggering from the Front Panel which describes how to use the front-panel
triggering controls each of which is common to most, if not all, the trigger
types the oscilloscope provides.
Once these basics are covered, this section describes how to trigger using the
various trigger types provided by the Main trigger system: edge, logic, and pulse.
H To use the “general purpose” trigger type, edge, see Triggering on a
Waveform Edge on page 3–47.
H To logic trigger based on an input pattern, state, or setup/hold violation, see
Triggering Based on Logic on page 3–51.
Triggering Concepts
H To pulse trigger based on various pulse types (glitch, runt) or their parame-
ters (width, slew rate) see Triggering on Pulses on page 3–67.
This section concludes with details about and instructions for using the Delayed
time base and Delayed trigger system to delay the acquisition of a waveform
relative to a trigger event. (See Delayed Triggering on page 3–80.)
Triggers determine when the oscilloscope stops acquiring and displays a
waveform. They help create meaningful waveforms from unstable jumbles or
blank screens. (See Figure 3–23.) The oscilloscope has three types of triggers:
edge, logic, pulse.
TDS 694C User Manual
3–39
Page 92

Triggering on Waveforms
Triggered Waveform Untriggered Waveforms
Figure 3–23: Triggered Versus Untriggered Displays
The Trigger Event
Trigger Sources
The trigger event establishes the time-zero point in the waveform record. All
points in the record are located in time with respect to that point. The oscilloscope continuously acquires and retains enough sample points to fill the
pretrigger portion of the waveform record (that part of the waveform that is
displayed before, or to the left of, the triggering event on screen). When a trigger
event occurs, the oscilloscope starts acquiring samples to build the posttrigger
portion of the waveform record (displayed after, or to the right of, the trigger
event). Once a trigger is recognized, the digitizing oscilloscope will not accept
another trigger until the acquisition is complete.
You can derive your trigger from the following sources:
Input channels provide the most commonly used trigger source. You can select
any one of the four input channels. The channel you select as a trigger source
will function whether it is displayed or not.
AC Line Voltage is the trigger source most often used when you are looking at
signals related to the power line frequency. Examples include devices such as
lighting equipment and power supplies. Because the oscilloscope generates the
trigger, you do not have to input a signal to create the trigger.
Auxiliary Trigger is the trigger source most often used in doing digital design
and repair. For example, you might want to trigger with an external clock, a logic
analyzer or with a signal from another part of the circuit. To use the auxiliary
trigger, connect the external triggering signal to the Auxiliary Trigger input
connector on the oscilloscope rear panel.
3–40
TDS 694C User Manual
Page 93

Triggering on Waveforms
Trigger Types
Trigger Modes
The digitizing oscilloscope provides three standard triggers for the main trigger
system: edge, pulse, and logic. Option 05 provides a video trigger. The standard
triggers are described individually starting on page 3–47. A brief definition of
each type follows:
Edge is the “basic” trigger. You can use it with both analog and digital test
circuits. An edge trigger event occurs when the trigger source (the signal the
trigger circuit is monitoring) passes through a specified voltage level in the
specified direction (the trigger slope).
Pulse is a special-purpose trigger primarily used on digital circuits. The five
classes of pulse triggers are glitch, runt, width, slew rate and timeout. Pulse
triggering is available on the main trigger only.
Logic is a special-purpose trigger primarily used on digital logic circuits. Two of
the classes, pattern and state, trigger based on the Boolean operator you select
for the trigger sources. Triggering occurs when the Boolean conditions are
satisfied. A third class, setup/hold, triggers when data in one trigger source
changes state within the setup and hold times that you specify relative to a clock
in another trigger source. Logic triggers are available on the main trigger system
only.
The trigger mode determines how the oscilloscope behaves in the absence of a
trigger event. The oscilloscope provides two trigger modes, normal and automatic.
Normal trigger mode enables the oscilloscope to acquire a waveform only when
it is triggered. If no trigger occurs, the oscilloscope will not acquire a waveform.
(You can push FORCE TRIGGER to force the oscilloscope to make a single
acquisition.)
Automatic trigger mode (auto mode) enables the oscilloscope to acquire a
waveform even if a trigger does not occur. Auto mode uses a timer that starts
after a trigger event occurs. If another trigger event is not detected before the
timer times out, the oscilloscope forces a trigger anyway. The length of time it
waits for a trigger event depends on the time base setting.
Be aware that auto mode, when forcing triggers in the absence of valid triggering
events, does not sync the waveform on the display. In other words, successive
acquisitions will not be triggered at the same point on the waveform; therefore,
the waveform will appear to roll across the screen. Of course, if valid triggers
occur the display will become stable on screen.
Since auto mode will force a trigger in the absence of one, auto mode is useful in
observing signals where you are only concerned with monitoring amplitude
level. Although the unsynced waveform may “roll” across the display, it will not
freeze as it would in normal trigger mode. Monitoring of a power supply output
is an example of such an application.
TDS 694C User Manual
3–41
Page 94

Triggering on Waveforms
Trigger Holdoff
When the oscilloscope recognizes a trigger event, it disables the trigger system
until acquisition is complete. In addition, the trigger system remains disabled
during the holdoff period that follows each acquisition. You can set holdoff time
to help ensure a stable display.
For example, the trigger signal can be a complex waveform with many possible
trigger points on it. Though the waveform is repetitive, a simple trigger might
get you a series of patterns on the screen instead of the same pattern each time.
A digital pulse train is a good example of a complex waveform. (See Figure 3–24.) Each pulse looks like any other, so many possible trigger points exist.
Not all of these will result in the same display. The holdoff period allows the
oscilloscope to trigger on the correct edge, resulting in a stable display.
Holdoff is settable from 250 ns (minimum holdoff available) to 12 seconds
(maximum holdoff available). To see how to set holdoff, see To Set Mode &
Holdoff on page 3–49.
You can also set a default holdoff. The default hold is the “general purpose”
holdoff for most triggering signals and varies with the horizontal scale. It is
equal to 5 divisions times the current time/division settings.
Acquisition
Interval
Acquisition
Interval
3–42
Trigger Level
Indicates
Trigger Points
Trigger Coupling
Holdoff Holdoff
Triggers are not recognized during holdoff time.
Holdoff
Figure 3–24: Trigger Holdoff Time Ensures Valid Triggering
Trigger coupling determines what part of the signal is passed to the trigger
circuit. All trigger types except edge triggering use only DC coupling; edge
triggering can use all available coupling types: AC, DC, Low Frequency
Rejection, High Frequency Rejection, and Noise Rejection: See To Specify
Coupling on page 3–49 for a description of each coupling mode.
TDS 694C User Manual
Page 95

Triggering on Waveforms
Trigger Position
Slope and Level
The adjustable feature trigger position defines where on the waveform record the
trigger occurs. It lets you properly align and measure data within records. The
part of the record that occurs before the trigger is the pretrigger portion. The part
that occurs after the trigger is the posttrigger portion.
To help you visualize the trigger position setting, the top part of the display has
an icon indicating where the trigger occurs in the waveform record. You select in
the Horizontal menu what percentage of the waveform record will contain
pretrigger information.
Displaying pretrigger information can be valuable when troubleshooting. For
example, if you are trying to find the cause of an unwanted glitch in your test
circuit, it might trigger on the glitch and make the pretrigger period large enough
to capture data before the glitch. By analyzing what happened before the glitch,
you may uncover clues about its source.
The slope control determines whether the oscilloscope finds the trigger point on
the rising or the falling edge of a signal. (See Figure 3–25.)
You set trigger slope by first selecting Slope in the Main Trigger menu and then
selecting between the rising or falling slope icons in the side menu that appears.
The level control determines where on that edge the trigger point occurs. (See
Figure 3–25.) The oscilloscope lets you set the main trigger level with the trigger
MAIN LEVEL knob.
Delayed Trigger System
Positive-Going Edge Negative-Going Edge
Trigger level
can be adjusted
vertically.
Trigger slope can be positive or negative.
Figure 3–25: Slope and Level Controls Help Define the Trigger
The oscilloscope also has a delayed trigger system that provides an edge trigger
(no pulse or logic triggers). When using the delayed time base, you can also
delay the acquisition of a waveform for a user-specified time or a user-specified
number of delayed trigger events (or both) after a main trigger event. See
Delayed Triggering on page 3–80 to learn how to use delay.
TDS 694C User Manual
3–43
Page 96

Triggering on Waveforms
Triggering from the Front Panel
The trigger buttons and knob let you quickly adjust the trigger level or force a
trigger. (See Figure 3–26.) The trigger readout and status screen lets you quickly
determine the state of the trigger system. You use the following trigger controls
and readouts for all trigger types except where noted.
To set MAIN LEVEL
Trigger Status Lights
To manually change the trigger level when edge triggering (or certain threshold
levels when logic or pulse triggering), turn the MAIN LEVEL knob. It adjusts
the trigger level (or threshold level) instantaneously no matter what menu, if any,
is displayed.
Figure 3–26: TRIGGER Controls and Status Lights
3–44
To Set to 50%
To quickly obtain an edge trigger or a glitch or width pulse trigger, press SET
LEVEL TO 50%. The oscilloscope sets the trigger level to the halfway point
between the peaks of the trigger signal. Set Level to 50% has no effect when
trigger type is logic or video.
You can also set the level to 50% in the Trigger menu under the main menu item
Level if edge trigger or glitch or width pulse trigger is selected.
Note that the MAIN LEVEL knob and menu items apply only to the main trigger
level. To modify the delayed trigger level, use the Level item in the Delayed
Trigger menu.
TDS 694C User Manual
Page 97

Triggering on Waveforms
To Force a Trigger
To Single Trigger
To force the oscilloscope to immediately start acquiring a waveform record even
without a trigger event, press the FORCE TRIG front panel button.
Forcing a trigger is useful when in normal trigger mode and the input signal is
not supplying a valid trigger. By pressing FORCE TRIG, you can quickly
confirm that there is a signal present for the oscilloscope to acquire. Once that is
established, you can determine how to trigger on it (press SET LEVEL TO
50%, check trigger source setting, and so on).
The oscilloscope recognizes and acts upon FORCE TRIG even when you press it
before the end of pretrigger holdoff. However, the button has no effect if the
acquisition system is stopped.
To trigger on the next valid trigger event and then stop, press SHIFT FORCE
TRIG. Now press the RUN/STOP button each time you want to initiate the
single sequence of acquisitions.
To leave Single Trig mode, press SHIFT ACQUIRE MENU ➞ Stop Af-
ter (main) ➞RUN/STOP Button Only (side).
See the description under Stop After on page 3–20 for further discussion of
single sequence acquisitions.
To Check Trigger Status
To ascertain the state and setup of the triggering circuit, use the trigger status
lights, readout, and screen.
Trigger Status Lights. To quickly determine trigger status, check the three status
lights TRIG’D, READY, and ARM in the Trigger control area.
(See Figure 3–26.)
H When TRIG’D is lighted, it means the oscilloscope has recognized a valid
trigger and is filling the posttrigger portion of the waveform.
H When READY is lighted, it means the oscilloscope can accept a valid trigger
event and the oscilloscope is waiting for that event to occur.
H When ARM is lighted, it means the trigger circuitry is filling the pretrigger
portion of the waveform record.
H When both TRIG’D and READY are lighted, it means the oscilloscope has
recognized a valid main trigger and is waiting for a delayed trigger. When
the oscilloscope recognizes a delayed trigger, it will fill in the posttrigger
portion of the delayed waveform.
H When ARM, TRIG’D, and READY are all off, the digitizer is stopped.
TDS 694C User Manual
3–45
Page 98

Triggering on Waveforms
Trigger Readout. To quickly determine the settings of some key trigger parameters, check the Trigger readout at the bottom of the display. (See Figure 3–27.)
The readouts differ for edge, logic, and pulse triggers.
Main Time Base Time/Div
Main Time Base
Main Trigger
Source = Ch 1
Main Trigger
Slope = Rising Edge
Main Trigger
Level
Figure 3–27: Example Trigger Readouts — Edge Trigger Selected
Record View. To determine where the trigger point is located in the waveform
record and with respect to the display, check the record view at the top of the
display. (See Figure 3–28.)
Trigger Position and Level Indicators. To see the trigger point and level on the
waveform display, check the graphic indicators Trigger Position and T rigger Bar.
Figure 3–28 shows the trigger point indicator and trigger level bar.
3–46
Both the trigger point indicator and level bar are displayed from the Display
menu. See Set Display Readout Options on page 3–24 for more information.
The trigger point indicator shows position. It can be positioned horizontally off
screen, especially with long record length settings. The trigger level bar shows
only the trigger level. It remains on screen, regardless of the horizontal position,
as long as the channel providing the trigger source is displayed.
Trigger Status Screen. To see a more comprehensive status listing of the settings
for the main and delayed trigger systems, press SHIFT STATUS ➞ STA-
TUS (main) ➞Trigger (side).
TDS 694C User Manual
Page 99

Trigger Position Relative to the
Display and Waveform Record
Trigger Point Indicator
Indicating the Trigger Position
on the Waveform Record
Trigger Bar Indicating the Trigger
Level on the Waveform Record
Triggering on Waveforms
Figure 3–28: Record View, Trigger Position, and Trigger Level Bar Readouts
Trigger Menu
Each trigger type (edge, logic, and pulse) has its own main trigger menu, which
is described as each type is discussed in this section. To select the trigger type,
press TRIGGER MENU ➞ Type (main) ➞Edge, Logic, or Pulse (pop-up).
Triggering on a Waveform Edge
The TDS 694C Oscilloscopes can trigger on an edge of a waveform. An edge
trigger event occurs when the trigger source passes through a specified voltage
level in a specified direction (the trigger slope). You will likely use edge
triggering for most of your measurements. This subsection describes how to use
edge triggering — how to select edge type, source, coupling, slope, and level. It
also details how to select trigger mode, auto or normal, for all trigger types.
To Check Edge
Trigger Status
To quickly check if edge triggers are selected, check the Trigger readout. When
edge triggers are selected, the trigger readout displays the trigger source, as well
as the trigger slope and level. (See Figure 3–29.)
TDS 694C User Manual
3–47
Page 100

Triggering on Waveforms
To Select Edge Triggering
Main Time Base Time/Div
Main Time Base
Main Trigger
Source = Ch 1
Main Trigger
Slope = Rising Edge
Main Trigger
Level
Figure 3–29: Edge Trigger Readouts
Use the edge trigger menu to select edge triggering and to perform the procedures for source, coupling, slope, trigger level, mode, and holdoff that follow.
To bring up the Edge Trigger menu, press TRIGGER MENU ➞
Type (main) ➞Edge (pop-up). (See Figure 3–30.)
3–48
Figure 3–30: Main Trigger Menu — Edge Type
TDS 694C User Manual
 Loading...