

Page 1

Online Help
RT-Eye® Serial Compliance and Analysis
Application
077-0013-00
Adapted from the RT-Eye Online Help, Version 2.0.0
www.tektronix.com
Page 2

Copyright © Tektronix, Inc. All rights reserved. Licensed software products are owned by Tektronix or its
suppliers and are protected by United States copyright laws and international treaty provisions.
Use, duplication, or disclosure by the Government is subject to restrictions as set forth in subparagraph
(c)(1)(ii) of the Rights in Technical Data and Computer Software clause at DFARS 252.227-7013, or
subparagraphs (c)(1) and (2) of the Commercial Computer Software -- Restricted Rights clause at FAR 52.22719, as applicable.
Tektronix products are covered by U.S. and foreign patents, issued and pending. Information in this publication
supercedes that in all previously published material. Specifications and price change privileges reserved.
TEKTRONIX and TEK are registered trademarks of Tektronix, Inc.
RT-Eye Serial Data Compliance and Analysis Online Help, 076-0026-00, Version 2.0
Contacting Tektronix
Tektronix, Inc.
14200 SW Karl Braun Drive or P.O. Box 500
Beaverton, OR 97077 USA
For product information, sales, service, and technical support:
• In North America, call 1-800-833-9200.
• Worldwide, visit www.tektronix.com to find contacts in your area.
Page 3

General Safety Summary ...................................................................................................... xiv
Welcome to the RT-Eye® Serial Compliance and Analysis Application
xv
Five-Time Free Trial............................................................................................................. xvi
Related Documentation......................................................................................................... xvi
GPIB Information ................................................................................................................xvii
Relevant Web Sites .............................................................................................................. xvii
Application CD Contents .................................................................................................... xviii
Access to PDF Files .............................................................................................................. xix
Conventions ........................................................................................................................... xx
Types of Online Help Information........................................................................................ xxi
Using Online Help ...............................................................................................................xxii
Online Help for the Report Generator................................................................................. xxiii
Online Help for Compliance Modules ................................................................................ xxiii
Find Tab and Searches ........................................................................................................ xxiv
Feedback xxiv
General Information ................................................................................................ xxiv
Application-Specific Information............................................................................ xxiv
Getting Started..............................................................................1
Product Description.................................................................................................................. 1
Analysis and Compliance Modules.......................................................................................... 1
Compatibility ........................................................................................................................... 2
Requirements and Restrictions................................................................................................. 3
Minimum Required System Configuration.............................................................................. 4
Accessories .............................................................................................................................. 4
Installation 4
Connecting to a Device Under Test (DUT) ............................................................................. 5
Probe Information .................................................................................................................... 5
Power Spectrum of a 2.5 Gb/sec Signal Example.................................................................... 6
Two TCA-to-SMA Adaptors, Diagram A ............................................................................... 6
One P73XX SMA Differential Probe, Diagram B................................................................... 7
Two P72XX Single-Ended or P73XX Differential Probes, Diagram C .................................. 7
One P73XX Differential Probe, Diagram D ............................................................................ 8
®
RT-Eye
Serial Compliance and Analysis Application
i
Page 4

Table of Contents
Deskewing Probes and Channels ............................................................................................. 8
Operating Basics........................................................................... 9
About Basic Operations ........................................................................................................... 9
Starting the Application ......................................................................................................... 10
Oscilloscope Menu Bar and Selected Application................................................................. 11
Application Interface.............................................................................................................. 11
User Interface Definitions......................................................................................................12
Menu With Application User Interface Items........................................................................ 13
Application Menu Bar and Drop-Down Lists........................................................................ 14
Using Basic Oscilloscope Functions .......................................................................... 14
Returning to the Application ...................................................................................... 15
Hiding the Application ............................................................................................... 15
Minimizing and Maximizing the Application............................................................ 15
Exiting the Application .............................................................................................. 15
Docking the Application ............................................................................................ 16
Undocking the Application ........................................................................................ 16
Application Directories .............................................................................................. 17
Directory Structure for the Serial Analysis Application ............................................ 18
File Name Extensions................................................................................................. 19
How to Enter Alphanumerical Values........................................................................ 20
Virtual Keypad ........................................................................................................... 21
Virtual Keyboard........................................................................................................ 22
Using MyTest......................................................................................................................... 22
About My Test............................................................................................................ 22
Saving MyTest ........................................................................................................... 23
Running MyTest......................................................................................................... 23
Using Serial Data Wizard ...................................................................................................... 24
About the Serial Data Wizard .................................................................................... 24
Probe type................................................................................................................... 25
Measurement Sources ................................................................................................ 26
Standards Selection .................................................................................................... 27
Measurement Categories ............................................................................................ 28
Autoset Source Levels................................................................................................ 29
Autoset Source Reference Levels............................................................................... 30
ii RT-Eye
®
Serial Compliance and Analysis Application
Page 5

Plots............................................................................................................................ 30
File Menus 33
File Menu Definitions ................................................................................................ 33
About the File menus ................................................................................................. 34
Saving a Setup File..................................................................................................... 34
File: Save Browser ..................................................................................................... 35
Recalling a Saved Setup File...................................................................................... 36
File: Recall Browser................................................................................................... 37
Recalling the Default Setup........................................................................................ 38
Recalling a Recently Saved or Accessed Setup File .................................................. 38
Recall Recent Drop-Down List Example................................................................... 39
Defining Preferences .................................................................................................. 39
File Preferences Options ............................................................................................ 40
Table of Contents
File: Preferences Menu............................................................................................... 40
About Setting up the Application for Analysis .......................................................... 41
General Steps to Set Up the Application.................................................................... 42
Selecting an Analysis or Compliance Module ........................................................... 43
Selecting the Analysis Module................................................................................... 43
Selecting a Compliance Module................................................................................. 44
Choosing the Probe Configuration............................................................................. 44
Probe Type Definitions .............................................................................................. 45
Selecting a Measurement ........................................................................................... 45
Measurement Definitions ........................................................................................... 46
Measurements: Select Menu for Differential Probes ................................................. 47
Measurements: Select Menu for Single-Ended Probes .............................................. 47
Autoset Button in the Measurements Select Menu .................................................... 48
Autoset Summary Menu Options............................................................................... 48
Autoset Summary Menu Example ............................................................................. 49
Configuring a Measurement................................................................................................... 50
About Configuring a Measurement............................................................................ 50
Configure Menu Definitions ...................................................................................... 51
Sources……........................................................................................................................... 52
About Configuring the Sources.................................................................................. 52
Configure Source Menu Options for a Differential Probe ......................................... 53
Configure Source Menu for Differential Probes ........................................................ 54
®
RT-Eye
Serial Compliance and Analysis Application
iii
Page 6

Table of Contents
Configure Source from a File for Differential Probes................................................ 54
Configure Source Menu Options for Single-Ended Probes ....................................... 55
Configure Source Menu for Single-Ended Probes ..................................................... 56
Configure Source from Ref Waveform for Single-Ended Probes.............................. 56
Configure Source from File for Single-Ended Probes ............................................... 57
Autosetting Sources for Live (Channel) Waveforms ................................................. 58
Reference Voltage Levels ...................................................................................................... 59
About Reference Voltage Levels ............................................................................... 59
High, Mid, and Low Reference Voltage Levels......................................................... 59
Reference Voltage Levels Diagram ........................................................................... 59
Rising Versus Falling Thresholds .............................................................................. 60
Using the Hysteresis Option....................................................................................... 60
Example of Hysteresis on a Noisy Waveform ........................................................... 60
Cursor Gating and Reference Voltage Levels Autoset............................................... 61
Configuring Reference Voltage Level Autoset .......................................................... 61
Configuring Reference Voltage Autoset Percentages ................................................ 62
Steps to Set the Reference Voltage Levels................................................................. 63
Reference Level Autoset Setup Menu Options .......................................................... 64
Ref Level Autoset Setup Menu .................................................................................. 64
Manually Adjusting the Reference Voltage Levels.................................................... 64
Configure Ref Levels Menu Options ......................................................................... 65
Configure Ref Levels Menu....................................................................................... 66
Gating Measurements ............................................................................................................ 66
About Gated Measurements ....................................................................................... 66
Configure Smart Gating Menu Options ..................................................................... 67
Configure Smart Gating Menu with Gating Off ........................................................ 67
Configure Smart Gating Menu with Cursors Gating.................................................. 68
Configure Smart Gating Menu Options for Smart Gating ......................................... 69
Using Smart Gating.................................................................................................... 70
Configure Smart Gating Menu with Clock Recovery Window ................................. 71
Configure Smart Gating Menu with Analysis Window ............................................. 71
Smart Gating Diagram ............................................................................................... 72
Clock Recovery Measurements ............................................................................................. 72
Clock Recovery Methods ........................................................................................... 72
About Constant (Straight-Line) Clock Recovery....................................................... 73
®
iv RT-Eye
Serial Compliance and Analysis Application
Page 7

Table of Contents
About PLL-based Clock Recovery............................................................................. 74
PLL-based Clock Recovery Setup ............................................................................. 74
Clock Recovery Menu Options .................................................................................. 75
Configure Clock Recovery Menu............................................................................... 76
Jitter Measurements ............................................................................................................... 76
Jitter Measurement Methods ...................................................................................... 76
Rj/Dj Analysis of Repeating Patterns Using a Spectral Approach............................. 77
RjDj Analysis of Arbitrary Pattern............................................................................. 77
Configure Jitter Menu Options................................................................................... 78
Configure Jitter menu for Repeating patterns ............................................................ 79
Configure Jitter menu for Arbitrary patterns.............................................................. 79
Bathtub Curve: BER versus Decision Time............................................................... 80
Population for Measurements ................................................................................................ 80
Setting the Population for the Measurements............................................................. 80
Configure Population Menu Options ......................................................................... 81
Configure Population Menu ....................................................................................... 81
General Config....................................................................................................................... 82
Measurement Limits ..............................................................................................................83
About Using Measurements Limits File .................................................................... 83
Creating a Measurements Limits File ........................................................................ 83
Editing a Measurements Limits File .......................................................................... 84
Measurements Limits Menu Options ......................................................................... 84
Measurements: Limits Menu...................................................................................... 85
Measurements Limits Editor Toolbar Functions........................................................ 85
Measurements Limits Editor Menu Options .............................................................. 85
Measurements: Limits Editor Menu........................................................................... 86
Measurements Limits File Summary ......................................................................... 87
User Masks............................................................................................................................. 88
About Using Standard Masks..................................................................................... 88
RT-Eye
Using the User Mask File Editor................................................................................ 89
Import of User Mask .................................................................................................. 91
Manually Editing a Mask File.................................................................................... 92
User Mask File Opened in a Text Editor.................................................................... 93
Creating a New User Mask File ................................................................................. 94
Mask File Edited Using a Text Editor Example......................................................... 94
®
Serial Compliance and Analysis Application
v
Page 8

Table of Contents
Recalling a User Mask in the Plots Configure Menu................................................. 95
Taking Measurements............................................................................................................ 96
About Taking Measurements ..................................................................................... 96
Localizing Measurements .......................................................................................... 97
About Sequencing ...................................................................................................... 97
Acquiring Data ........................................................................................................... 98
Control Panel Functions ............................................................................................. 99
Sequence Mode Option Definitions ........................................................................... 99
Single shot, Scan mode off....................................................................................... 100
Single shot, Scan mode on ....................................................................................... 101
Free run, Scan mode off ........................................................................................... 101
Free run, Scan mode on............................................................................................ 101
Control Panel............................................................................................................ 102
About the Results ..................................................................................................... 102
Statistical Results ................................................................................................................. 103
About Viewing Statistics.......................................................................................... 103
Viewing Statistics..................................................................................................... 103
Results Summary Menu Options.............................................................................. 104
Results: Summary Menu .......................................................................................... 104
Results Details Menu Options.................................................................................. 105
Results: Details Menu .............................................................................................. 105
Saving Statistics to a .CSV File................................................................................ 106
Plotting the Results .............................................................................................................. 107
About Plotting .......................................................................................................... 107
Plot Type Definitions ............................................................................................... 108
Measurements and Available Plots .......................................................................... 108
Plot Window Layouts............................................................................................... 109
Eye Diagram Plot Usage .......................................................................................... 109
RT-Eye (Real Time) Rendering ............................................................................... 110
ET-Eye (Equivalent Time) Rendering ..................................................................... 111
Usage of Waveform with Bit Error Locator............................................................. 112
Histogram Plot Usage............................................................................................... 113
Spectrum Plot Usage ................................................................................................ 113
Bathtub Plot Usage................................................................................................... 114
Selecting and Configuring Plots .......................................................................................... 114
®
vi RT-Eye
Serial Compliance and Analysis Application
Page 9

Table of Contents
Selecting Plots for Configuration............................................................................. 114
Plots Select Menu Options ....................................................................................... 115
Plots: Select Menu.................................................................................................... 115
Configuring Plots ..................................................................................................... 116
Plots Configure Menu Options for an Eye Diagram ................................................ 117
Plots Configure Menu for an Eye Diagram.............................................................. 117
Plots Configure Menu Options for a Histogram ...................................................... 118
Plots Configure Menu for a Histogram .................................................................... 118
Plots Configure Menu Options for a Spectrum ........................................................ 119
Plots Configure Menu for a Spectrum...................................................................... 119
Plots Configure Menu Option for a Bathtub ............................................................ 120
Plots Configure Menu for a Bathtub ........................................................................ 120
Viewing Plots....................................................................................................................... 121
About Viewing Plots ................................................................................................ 121
Using a Separate Monitor to View Plots .................................................................. 122
Toolbar Functions in Plot Windows......................................................................... 122
Plot Summary Window Example............................................................................. 123
Plot Details Window Example ................................................................................. 124
Plot Summary and Details Window Example.......................................................... 125
Viewing a Plot in the Whole Display or in Half the Display ................................... 126
Returning to the Plot Summary Window ................................................................. 126
Using Zoom and Cursors in a Plot ........................................................................... 127
Removing Plots.................................................................................................................... 128
Using Zoom in a Plot ........................................................................................................... 128
About Using Zoom in a Plot .................................................................................... 128
Plot Zoom Definitions.............................................................................................. 128
Changing the Scale of Data in a Plot (Zoom) .......................................................... 129
Using Cursors in a Plot ........................................................................................................ 130
About Using Cursors in a Plot.................................................................................. 130
Plot Cursors Definitions ........................................................................................... 130
Using Cursors in a Plot............................................................................................. 130
Using Grid Points in a Plot....................................................................................... 131
Horizontal and Vertical Cursors in a Plot Example ................................................. 131
Saving Plots to Files............................................................................................................. 132
About Saving Plot Files............................................................................................ 132
®
RT-Eye
Serial Compliance and Analysis Application
vii
Page 10

Table of Contents
Save Plot Files Definitions....................................................................................... 132
Saving Plot Files....................................................................................................... 132
Printing Plots........................................................................................................................ 133
About Printing Plots................................................................................................. 133
Plot Print Preview Window...................................................................................... 134
Plot Page Setup Window.......................................................................................... 135
Logging Worst Case Waveforms......................................................................................... 135
Saving Worst Case Waveforms from a Live Source................................................ 135
Log Worst Case Configure Options ......................................................................... 136
Log: Worst Case Configure Menu ........................................................................... 137
File Names of Worst Case Waveforms .................................................................... 137
Log: Worst Case File Names Menu ......................................................................... 137
Generating a Report ............................................................................................................. 138
About Generating a Report ...................................................................................... 138
Report Generator File Directories ............................................................................ 138
Directory Structure for the Report Generator Utility ............................................... 139
Starting the Report Generator and Accessing the Online Help................................ 140
Setting Up a Test Template and Layout for a Report............................................... 141
Generating and Printing a Report............................................................................. 141
Creating a PDF File of the Compliance Report........................................................ 142
Test Template Menu................................................................................................. 143
Report Layout Menu ................................................................................................ 144
Report Generate Menu Options................................................................................ 144
Report Generate Menu ............................................................................................. 145
Report Generator Fields ........................................................................................... 145
Application Fields General Information List ........................................................... 146
Application Fields Configuration List and Ref Levels Example ............................. 147
Application Fields Results List and Specific Measurements Example .................... 148
Oscilloscope Fields and Native Fields Lists............................................................. 149
Tutorial...................................................................................... 151
Introduction to the Tutorial .................................................................................................. 151
Setting Up the Oscilloscope................................................................................................. 151
Starting the Application ....................................................................................................... 151
Waveform Files.................................................................................................................... 151
®
viii RT-Eye
Serial Compliance and Analysis Application
Page 11

Table of Contents
Recalling a Waveform File .................................................................................................. 152
Oscilloscope Reference Memory Setup Menu..................................................................... 153
Taking an Eye Width Measurement..................................................................................... 154
Setting Up an Eye Width Measurement ................................................................... 154
Ref1 Selected as the Source ................................................................................................. 155
Using Autoset for Reference Voltage Levels....................................................................... 155
Taking a Measurement and Viewing as an Eye Diagram .................................................... 156
Results Summary and Plots Summary Window Example ................................................... 157
Results Details and Plot Details Window Example ............................................................. 158
Ending a Tutorial Lesson ..................................................................................................... 158
Stopping the Tutorial................................................................................................ 159
Returning to the Tutorial .......................................................................................... 159
Quick Method Concept ........................................................................................................ 159
Quick Method to Take Measurements ..................................................................... 160
Taking a TIE Jitter Measurement......................................................................................... 161
Clearing Results ....................................................................................................... 161
Setting Up a TIE Jitter Measurement and Plots ....................................................... 162
TIE Jitter Results with Histogram Example............................................................. 163
TIE Jitter Histogram and Spectrum Plot Example ................................................... 164
Examples of Plot Details .......................................................................................... 165
Saving Statistical Results to a .CSV File ................................................................. 166
A .CSV File Viewed with Wordpad Example ......................................................... 167
A .CSV File Viewed in a Spreadsheet Example ...................................................... 167
Generating a Simple Report................................................................................................. 167
Simple Report Example Page 1................................................................................ 168
Simple Report Example Page 2................................................................................ 169
Serial Analysis Laboratory......................................................171
About the Serial Analysis Laboratory (Lab)........................................................................ 171
Recall Default Settings and Run RT-Eye SW...................................................................... 172
Reference Waveform File Setup .......................................................................................... 172
Training Board 2 - Live Signal Source ................................................................................ 174
Use P7380SMA with CH1 as the Differential Source for Analysis .................................... 175
Use TCA-SMA Adapters on CH1 and CH3 as Single-Ended Sources for Analysis ........... 177
Run the Analysis and View the Results ............................................................................... 180
®
RT-Eye
Serial Compliance and Analysis Application
ix
Page 12

Table of Contents
MJSQ Jitter Analysis ........................................................................................................... 181
Using MyTest....................................................................................................................... 184
Defining a Limits Module.................................................................................................... 184
Creating a Compliance Report............................................................................................. 186
PCI Express Compliance Tests ............................................................................................ 187
Results of PCI Express Add in Card Compliance Test ............................................ 188
Serial Analysis Lab Conclusion........................................................................................... 191
Parameters................................................................................. 193
About Application Parameters ............................................................................................. 193
File Menus Parameters......................................................................................................... 194
File Preferences Menu Parameters....................................................................................... 194
Control Panel Parameters..................................................................................................... 195
Measurements Select Menu Parameters............................................................................... 195
Autoset Summary Menu Parameters.................................................................................... 196
Measurements Configure Menus ......................................................................................... 196
Configure Source Menu Parameters for Differential Probes ............................................... 197
Configure Source Menu Parameters for Single-Ended Probes ............................................ 197
Configure Ref Levels Menu Parameters .............................................................................. 198
Configure Ref Level Autoset Setup Menu Parameters ........................................................ 198
Configure Smart Gating Menu Parameters.......................................................................... 199
Configure Smart Gating Menu with Smart Gating Parameters............................................ 199
Configure Clock Recovery Menu Parameters...................................................................... 199
Configure Jitter Menu Parameters ....................................................................................... 201
Configure Population Menu Parameters .............................................................................. 201
Configure General Config Parameters ................................................................................. 201
Measurements Limits Menu Parameters.............................................................................. 202
Results Menus...................................................................................................................... 202
Results Summary Menu Parameters .................................................................................... 202
Results Details Menu Parameters ........................................................................................ 203
Plots Select Menu Parameters.............................................................................................. 203
Eye Diagram Configure Menu Parameters .......................................................................... 204
Histogram Plot Configure Menu Parameters ....................................................................... 204
Spectrum Plot Configure Menu Parameters......................................................................... 205
Bathtub Plot Configure Menu Parameter............................................................................. 205
®
x RT-Eye
Serial Compliance and Analysis Application
Page 13

Table of Contents
Log Worst Case Configure Menu Parameters ..................................................................... 206
Utilities Report Generator Menus Parameters ..................................................................... 206
Help Menu 206
Algorithms.................................................................................207
About Measurement Algorithms.......................................................................................... 207
Oscilloscope Setup Guidelines............................................................................................. 207
Test Methodology ................................................................................................................ 208
Measurements ...................................................................................................................... 209
Notation in Algorithms ........................................................................................................ 210
About Notation in Algorithms.................................................................................. 210
Notational Rules....................................................................................................... 210
Summary Definitions of Fundamental Signals and Measurements ..................................... 211
Waveforms ............................................................................................................... 211
Edge Time Threshold Voltages................................................................................ 212
Crossing Times......................................................................................................... 212
Recovered Clock Times ........................................................................................... 213
Eye Center Voltages................................................................................................. 213
Timing Measurements...................................................................................................... 214
About Timing Measurements................................................................................... 214
Eye Width Measurement .......................................................................................... 214
Rise Time Measurement........................................................................................... 215
Rise Time Measurement........................................................................................... 215
Fall Time Measurement ........................................................................................... 216
Rising Edge Measurement ....................................................................................... 217
Falling Edge Measurement....................................................................................... 218
Unit Interval Measurement....................................................................................... 219
Bit Rate Measurement.............................................................................................. 220
Differential Skew Measurement............................................................................... 220
Amplitude Measurements .................................................................................................... 221
RT-Eye
About Amplitude Measurements.............................................................................. 221
Eye Height Measurement ......................................................................................... 221
Differential Amplitude Measurement ...................................................................... 223
Differential Peak Voltage Measurement .................................................................. 224
Differential Average Measurement .......................................................................... 224
®
Serial Compliance and Analysis Application
xi
Page 14

Table of Contents
High Amplitude Measurement ................................................................................. 224
Low Amplitude Measurement.................................................................................. 225
CM Voltage Measurement ....................................................................................... 225
AC CM Voltage Measurement................................................................................. 226
AC CM RMS Voltage Measurement ....................................................................... 226
De-Emphasis Measurement...................................................................................... 227
Jitter Measurements ............................................................................................................. 228
About Jitter Measurements....................................................................................... 228
Jitter @ BER Measurement...................................................................................... 229
Spectrum Analysis based Rj/Dj Separation on Repeating Pattern ........................... 230
Rj/Dj Separation based on Dual-Dirac Model.......................................................... 233
Jitter Measurements Field Notes .............................................................................. 234
TIE Jitter Measurement............................................................................................ 234
TIE Jitter Filtering Measurement ............................................................................. 235
Statistics 237
About Statistics ........................................................................................................ 237
Maximum Value....................................................................................................... 237
Minimum Value ....................................................................................................... 237
Mean Value .............................................................................................................. 237
Standard Deviation Value ........................................................................................ 238
Peak-to-Peak Value .................................................................................................. 238
Population Value ...................................................................................................... 238
GPIB...........................................................................................239
About the GPIB Program..................................................................................................... 239
Guidelines to GPIB Programming ....................................................................................... 240
Program Example................................................................................................................. 241
GPIB Commands ................................................................................................................. 242
Introduction to GPIB Command Syntax .................................................................. 242
GPIB Reference Materials ....................................................................................... 243
Starting and Setting Up the Application using GPIB............................................... 243
Variable: Value RT-Eye Command ..................................................................................... 244
Syntax....................................................................................................................... 244
Variable: Value RT-Eye Command Arguments and Queries (Part 1) ..................... 245
Variable:Value RT-Eye Command Arguments and Queries (Part 2) ...................... 246
®
xii RT-Eye
Serial Compliance and Analysis Application
Page 15

Table of Contents
Measurements Results Queries ............................................................................................ 247
Measurements Results Queries Variable Names (Part 1)......................................... 247
Measurements Results Queries Variable Names (Part 2)......................................... 248
Serial Analysis Measurement Names for the resultFor Variable......................................... 249
InfiniBand Driver Measurement Names for the resultFor Variable .................................... 250
InfiniBand Receiver Measurement Names for the resultFor Variable................................. 251
InfiniBand Cable Assembly Measurement Names for the resultsFor Variable ................... 251
PCI Express Measurement Names for the resultFor Variable for any Test point
except Reference clock ........................................................................................................ 252
PCI Express Reference Clock Measurement Names for the resultFor Variable.................. 253
FBDIMM Transmitter Measurement Names for the resultFor Variable ............................. 254
FBDIMM Receiver Measurement Names for the resultFor Variable.................................. 255
FBDIMM Reference Clock Measurement Names for the resultFor Variable ..................... 256
GPIB Commands Error Codes............................................................................................. 256
GPIB Commands Warning Codes ....................................................................................... 258
RT-Eye
®
Serial Compliance and Analysis Application
xiii
Page 16

General Safety Summary
Review the following safety precautions to avoid injury and prevent damage to
this product or any products connected to it. To avoid potential hazards, use this
product only as specified.
Only qualified personnel should perform service procedures.
While using this product, you may need to access other parts of the system. Read
the General Safety Summary in other system manuals for warnings and cautions
related to operating the system.
To Avoid Fire or Personal Injury:
Connect and Disconnect Properly: Do not connect or disconnect probes or test
leads while they are connected to a voltage source.
Observe All Terminal Ratings: To avoid fire or shock hazard, observe all
ratings and markings on the product. Consult the product manual for further
ratings information before making connections to the product.
Do Not Operate With Suspected Failures: If you suspect there is damage to
this product, have it inspected by qualified service personnel.
Symbols and Terms: The following terms and symbols may appear in the online
help.
WARNING: Warning statements identify conditions or practices that could
result in injury or loss of life.
CAUTION: Caution statements identify conditions or practices that could
result in damage to this product or other property.
Terms on the Product: The following terms may appear on the product:
DANGER indicates an injury hazard immediately accessible as you read the
marking.
WARNING indicates an injury hazard not immediately accessible as you read
the marking.
CAUTION indicates a hazard to property including the product.
Symbols on the Product: The following symbol may appear in the product:
CAUTION Refer to Help
xiv RT-Eye
®
Serial Compliance and Analysis Application
Page 17

Welcome to the RT-Eye® Serial Compliance and Analysis Application
The RT-Eye product is an application that enhances the basic capabilities of
some high-performance oscilloscopes from Tektronix. The application
incorporates MATLAB run-time and uses it to display real-time graphical
representations of the measurement results in plot windows.
The Real-Time Eye (RT-Eye) application provides general compliance
measurements and analysis capabilities for emerging serial data standards, and
includes the following features:
Selects and configures multiple measurements on one differential or two
single-ended probe inputs
Performs Timing, Amplitude, and Jitter measurements per industry standard
methods
Displays an RT-Eye rendering of the serial bit stream, and other plots such
as Waveform (with Bit Error Locator)
Jitter Eye Opening analysis
, Jitter Histogram, Jitter Spectrum, and
Specifies configurable Limits for Pass/Fail analysis on waveforms and
measurements when a Limits file is enabled
Performs "Plug-Fest" level compliance measurements defined by industry
working groups using optional Compliance Modules such as Fully Buffered
DIMM (FB-DIMM), InfiniBand, PCI Express, SAS, and Serial ATA.
Exports analysis results to a .csv file for further analysis
Tracks and saves the worst case waveforms to .wfm files
Creates, formats, and generates reports
Automates compliance tests for production
To return to the Table of Contents, select Help Topics from the Help menu
bar.
®
RT-Eye
Serial Compliance and Analysis Application
xv
Page 18

Welcome to RT-Eye® Serial Compliance and Analysis Application
Five-Time Free Trial
A five-time free trial is available for all applications in the "Applications on this
CD and Compatible Oscilloscope" table found in the Optional Applications
Software on a Windows-Based Oscilloscope Installation Manual. You can start
and exit an application up to five times to help you evaluate Tektronix software
solutions.
Note: To evaluate an application, first check that your TDS6000- or
TDS/CSA7000-series oscilloscope firmware version is consistent with the
version requirements mentioned in the application’s readme file. You can check
the firmware version number from the oscilloscope Help drop-down list (About
…). You can check the application’s firmware compatibility by referring to the
System Requirements section in the application’s readme.txt file.
If an application becomes available after you receive your oscilloscope, you can
download the application as described in the installation manual (Tektronix part
number 071-1078-xx) to obtain the free trial.
Related Documentation
In addition to the online help, the application includes a Reference guide. Refer
to the
RT-Eye™ Serial Compliance and Analysis Quick Start User Manual (071-1769xx) for the following information:
The manual provides task-oriented procedures to explain the basic
operations that cover the set up of the application.
Refer to the Optional Applications Software on a Windows-Based
Oscilloscope Installation Manual for the following information:
Software warranty
Software license agreement
List of all available applications, compatible oscilloscopes, and relevant
software and firmware version numbers
How to use the five-time free trial
Installation procedures
How to enable an application
How to download files from the Tektronix Web site
The Optional Applications Software on a Windows-Based Oscilloscope CD-ROM
includes many PDF files in the Documents directory that you can view and print.
xvi RT-Eye
®
Serial Compliance and Analysis Application
Page 19

Refer to Start> All Programs> Tek Applications for PDF documentation after
installation of the application.
GPIB Information
For information on how to operate the oscilloscope and use the applicationspecific GPIB commands, refer to the following documents:
This online help provides a sample RT-Eye program that illustrates how to
The user manual for your oscilloscope provides general information on how
The online help for your oscilloscope can provide details on how to use
The online help for Option SST Serial ATA and Serial Attached SCSI
Welcome to RT-Eye® Serial Compliance and Analysis Application
set up and use remote automation
to operate the oscilloscope
GPIB commands to control the oscilloscope if you install the GPIB
Programmer guide (and code examples) from the oscilloscope CD-ROM
Analysis module provides details on how to use GPIB commands for SAS
and SATA
Relevant Web Sites
You can also find useful information on serial data standards on the following
Web sites:
www.Infinibandta.org
www.pcisig.com
www.T11.org
www.tektronix.com/search RT-Eye.
RT-Eye
®
Serial Compliance and Analysis Application
xvii
Page 20

Welcome to RT-Eye® Serial Compliance and Analysis Application
Application CD Contents
The Optional Applications Software on a Windows-Based Oscilloscope CDROM includes files for the following types of documentation:
Printable file of the RT-Eye Serial Data Compliance and Analysis online
help formatted to resemble a user manual
Printable file of the Option SST online help formatted to resemble a user
manual
Printable file of the Report Generator online help formatted to resemble a
user manual
PDF files of the Methods of Implementation (MOI) for serial data standards
as they apply to the corresponding compliance modules
RT-Eye™ Serial Compliance and Analysis Quick Start User Manual (071-
1769-xx)
Optional Applications Installation manual
Figure 1-1: Application CD Contents
xviii RT-Eye
®
Serial Compliance and Analysis Application
Page 21

Access to PDF Files
You can use any of the following methods to view the various PDF files
associated with this application:
Access a file in the Documents directory on the Applications CD from any
PC.
Access documents on the CD from the Installation Browser.
Note: The documents are available on Application CD at
Documents\TDSRT-Eye. The CD Installation Browser page for TDSRTEye is accessed from "Serial Data Compliance and Analysis" and also
includes a link to "Browse the Documentation". This link opens a Microsoft
Explorer Window to the folder above.
Select a file from the Start menu in the oscilloscope task bar; you may need
to first
Welcome to RT-Eye® Serial Compliance and Analysis Application
minimize the RT-Eye application
Access a file from the Help drop-down list in the RT-Eye application
Note: If you do not have an Acrobat reader to view a PDF file, you can get a free
copy of the reader from the www.adobe.com/products/acrobat Web page.
RT-Eye
®
Serial Compliance and Analysis Application
xix
Page 22

Welcome to RT-Eye® Serial Compliance and Analysis Application
Conventions
Online help topics use the following conventions:
The terms "RT-Eye application" and "application" refer to the RT-Eye
Serial Compliance and Analysis Application.
The term "oscilloscope" refers to any product on which this application runs.
The term "select" is a generic term that applies to the two mechanical
methods of choosing an option: with a mouse or with the Touch Screen.
The term "Compliance Module" refers to optional "plug-in applications"
from Tektronix used for compliance testing to specific serial data standards.
The term "Limits Module" refers to a formatted text file used to specify user
limits on mask geometry and measurement boundary conditions for
Pass/Fail testing.
The term "channel" is context dependent. It can refer to the transmit channel
of the device under test or to an oscilloscope channel.
The term "DUT" is an abbreviation for Device Under Test.
There may be minor differences in the display of user interface screen
graphics on other types of oscilloscopes such as TDS6000 or TDS7000.
When steps require a sequence of selections using the application interface,
the ">" delimiter marks each transition between a menu and an option. For
example, one of the steps to recall a setup file would appear as File> Recall.
xx RT-Eye
®
Serial Compliance and Analysis Application
Page 23

Welcome to RT-Eye® Serial Compliance and Analysis Application
Types of Online Help Information
The online help contains the following types of information:
A Getting Started group of topics briefly describes the application, contains
connection procedures, and includes an optional deskew procedure.
An Operating Basics group of topics covers basic operating principles of the
application. The sequence of topics reflects the steps you perform to operate
the application and includes definitions for all menus and options.
A Tutorial group of topics teaches you how to set up the application to
acquire a waveform, take a measurement, view the results, view a plot, and
save data to a file.
A Serial Analysis Laboratory group of topics demonstrates how to use serial
analysis measurements to identify a problem with a serial data waveform
through the process of elimination. This should give you ideas on how to
solve your own measurement problems.
A Reference group of topics includes the parameters (range of values) for all
options and the default values.
A Measurement Algorithms group of topics includes information on
measurement guidelines and on how the application calculates each
measurement.
A GPIB Command Syntax group of topics contains a list of arguments and
values that you can use with the remote commands and their associated
parameters. The application includes a simple remote interface program to
show you how to operate the application using GPIB commands.
The application Help drop-down list includes a PDF Help menu item you can use
to access a PDF file of the help topics. The file is printable and is formatted to
resemble a user manual.
The Report Generator utility also has an independent online help system that you
can launch from the Report Generator window.
RT-Eye
®
Serial Compliance and Analysis Application
xxi
Page 24

Welcome to RT-Eye® Serial Compliance and Analysis Application
Using Online Help
Online help has many advantages over a printed manual because of advanced
search capabilities. You can select Help> Topics on the right side of the
application menu bar to display the Help file.
The main (opening) Help screen shows a series of book icons and three tabs
along the top menu, each of which offers a unique mode of assistance:
Table of Contents (TOC) tab - organizes the Help into book-like sections.
Select a book icon to open a section; select any of the topics listed under the
book.
Index tab - enables you to scroll a list of alphabetical keywords. Select the
topic of interest to display the corresponding help page.
Find tab - allows a text-based search. Follow these steps:
1. Type the word or phrase you want to find in the search box. If the word or
phrase is not found, try the Index tab.
2. Select some matching words in the next box to narrow your search.
3. Choose a topic in the lower box, and then select the Display button.
Note: The Find tab function does not include words found in graphics. Refer to
the Find Tab and Searches topic for more information.
To print a topic, select the Print button from the help topics menu bar.
Select Options from the menu bar for other commands, such as to annotate a
topic, to keep the help window on top, or to use system colors.
Select the Back button to return to the previous help window. Sometimes
you can jump from one topic to another through a hyperlink. If the Back
button is grayed out, or a jump is not available, choose the Help Topics
button to return to the originating help folder.
Browse buttons (Next >> and Previous <<) allow you to move forward and
backward through topics in the order of the Table of Contents (TOC).
A Note: in the topic text indicates important information.
Note: Green-underlined text indicates a Jump (hyperlink) to another topic. Select
the green text to jump to the related topic. For example, select the green text to
jump to the topic on
xxii RT-Eye
Feedback to contact Tektronix.
®
Serial Compliance and Analysis Application
Page 25

Welcome to RT-Eye® Serial Compliance and Analysis Application
You can tell when the cursor is over an active hyperlink (button, jump, or
popup), because the arrow cursor changes to a small pointing hand cursor.
The light bulb icon and word Tip indicate additional information to help
you operate the application more efficiently.
Online Help for the Report Generator
The Report Generator utility is a separate program that allows you to create a
new test template or report layout, or edit an existing one. The online help for the
Report Generator explains how to use the utility.
Online Help for Compliance Modules
Each compliance module has its own help documents: online help or PDF
documents called as MOIs (Methods Of Implementation). To view compliance
specific help topics, refer to the Help menu in the module of interest.
RT-Eye
®
Serial Compliance and Analysis Application
xxiii
Page 26

Welcome to RT-Eye® Serial Compliance and Analysis Application
Find Tab and Searches
Many online help topics contain only tables. To retain vertical and horizontal
lines, the tables are graphical objects. The Find tab in the online help does not
recognize words in these tables.
The online help is extensively indexed with the proper names of all menus and
options as they appear in the application and in the left column of graphical
tables.
Note: If you conduct a Find tab search with no results, try the Index tab instead.
Feedback
Tektronix values your feedback on our products. To help us serve you better,
please send us suggestions, ideas, or other comments you may have about your
application or oscilloscope.
You can send us your feedback by e-mail to techsupport@tektronix.com
FAX at (503) 627-5695 (North America), or by telephone (See
Tektronix) . Please be as specific as possible and include the following
information:
General Information
Contacting
, by
Oscilloscope model number and hardware options, if any
Probes used
Serial data standard
Signaling rate
Your name, company, mailing address, phone number, FAX number
Note: Please indicate if you would like to be contacted by Tektronix regarding
your suggestion or comments.
Application-Specific Information
Software version number
Description of the problem such that technical support can duplicate the
problem
If possible, save the oscilloscope waveform file as a .wfm file
xxiv RT-Eye
®
Serial Compliance and Analysis Application
Page 27

Welcome to RT-Eye® Serial Compliance and Analysis Application
If possible, save the oscilloscope and application setup files from the
application to obtain both the oscilloscope .set file and the application .ini
file. Refer to
Once you have gathered this information, you can contact technical support by
phone or through e-mail. If using e-mail, be sure to enter in the subject line "RTEye Problem," and attach the .set, .ini, and .wfm files.
To include screen shots, from the oscilloscope menu bar, select File>
Export. In the Export dialog box, enter a file name with a .bmp extension and
select Save. The file is saved in the C:\TekScope\Images directory. You can then
attach the file to your email (depending on the capabilities of your email editor)
Saving a Setup File.
RT-Eye
®
Serial Compliance and Analysis Application
xxv
Page 28

Getting Started
Product Description
The RT-Eye Serial Compliance and Analysis Application is a software product
that enhances basic capabilities of some high-performance oscilloscopes offered
by Tektronix. The RT-Eye application is a general analysis tool you can use to
test, debug, and verify serial-data based designs. The compliance applications are
specific tools you can use with device designs that must comply with serial data
standards, such as PCI Express, FB-DIMM, Serial ATA, Serial Attached SCSI,
or InfiniBand.
You can use this application to do the following tasks:
Select and configure many amplitude and timing measurements on a serial
data signal
Conduct RT-Eye rendering and mask testing, Time Interval Error analysis,
Rj/Dj (random jitter and deterministic jitter) analysis, and display results as
a Bathtub plot
Locate bit errors (mask violations) on the acquired waveform
Display the results as eye diagram, histogram, spectrum, or bathtub curve
plots
Perform Pass or Fail limits testing based on waveform masks and based on
measurements that use Limits Modules
Perform "plug-fest" level compliance tests for available compliance modules
that test against a specific standard
Save the statistical results to a file
Save the worst case waveforms to files
Generate reports
Note: There are no standard accessories for this product. Refer to
for a list of recommended probes.
Accessories
Analysis and Compliance Modules
You can use the RT-Eye (real-time eye) serial data analysis application and
industry specific compliance modules to characterize serial transmission signal
®
RT-Eye
Serial Compliance and Analysis Application
1
Page 29

Getting Started
Compatibility
integrity. The applications were developed to help you perform analysis on the
following types of designs:
General serial-data based designs
Device designs that need to comply with a specific serial-data standard
The RT-Eye application is the foundation for current and for future compliance
modules. Each enabled compliance application shows at least two choices in the
Modules drop-down list; one will always be for Serial Analysis.
For information on oscilloscope compatibility, refer to the Optional Application
Software on Microsoft Windows Based Oscilloscopes Installation Manual,
Tektronix part number 071-1078-xx. The manual is also available as a PDF file.
2 RT-Eye
®
Serial Compliance and Analysis Application
Page 30

Requirements and Restrictions
The Sun Java Run-Time Environment (JRE) and the Mathworks MATLAB RunTime Server are components of the RT-Eye application. When you install the
application, the InstallShield Wizard automatically installs the proper software
components.
MATLAB Server: The MATLAB server is dedicated to the RT-Eye application
and cannot be used for other purposes. Do not close the Matlab Server icon
in the oscilloscope task bar because this will disrupt the operation of the RT-Eye
application. The application will close the MATLAB sever when you exit the
application.
Oscilloscope: Maximum sampling rate of 20 GS/s with interpolation is often
necessary to ensure accurate results. Be sure to consider the following differences
in sampling rates before taking measurements:
The TDS6604 oscilloscopes sample at 20 GS/s on two channels and at 10
GS/s on four channels.
Getting Started
The TDS7404 oscilloscopes sample at 20 GS/s on one channel and at 10
GS/s on two channels.
The TDS6000C oscilloscopes sample at 40 GS/s on two channels and 20
GS/s on four channels.
The TDS6000B oscilloscopes sample at 20 GS/s on two and four channels.
The TDS7000B oscilloscopes sample at 20 GS/s on one channel, 10 GS/s on
two channels, and 5GS/s on four channels.
When the Record Length of the oscilloscope is set to 4M or less, the application
can take all measurements. When the Record Length is set to 4M or 20M, the
RT-Eye application can take one TIE measurement.
Keyboard: You may need to use a keyboard to enter new names for some file
save operations.
Distiller Software: To convert an RTF file from the Report Generator utility to a
PDF file, you require distiller software, such as Adobe Acrobat 6.0 or freeware
such as CutePDF.
RT-Eye
®
Serial Compliance and Analysis Application
3
Page 31

Getting Started
Minimum Required System Configuration
Before operating the RT-Eye application, check the readme.txt file to verify
whether the oscilloscope configuration meets the minimum requirements. If the
RT-Eye application is installed on the oscilloscope, select Start> Programs>
TekApplications> tdsRT-Eye> readme file. If the application is not installed, the
readme.txt file is in the same directory as the setup.exe file on the Optional
Applications CD.
Accessories
There are no standard accessories for this product. However, you can refer to the
product datasheet available on the Tektronix Web site for information on
optional accessories relevant to your application. For example, Tektronix
recommends that you use the following probes:
Table 2-1: Probes
*
Probe
P73XX (Includes P7350,
P7380, P7313)
P73XXSMA SMA Input Differential Acquisition System.
*Check the www.Tektronix.com web site for an up-to-date list of probes and
information on standard-specific test fixtures.
Description
Z-Active TM Differential Probe family.
Installation
Refer to the Optional Applications Software on a Windows-Based Oscilloscope
Installation Manual, Tektronix part number 071-1078-xx, for the following
information:
Available applications, compatible oscilloscopes, and relevant software and
firmware version numbers
Using the free trials
Applying a new authorized Option Installation key label
Installing the application
Enabling an application
Downloading updates from the Tektronix Web site
The manual is also available as a PDF file.
4 RT-Eye
®
Serial Compliance and Analysis Application
Page 32

Getting Started
Connecting to a Device Under Test (DUT)
You can use any compatible probes to connect your DUT (Device Under Test)
with your oscilloscope.
There are four typical probing configurations for serial data links: two for Pseudo
Differential Waveforms and two for True Differential Waveforms. The method
of setting up your measurement channel(s) is dependent on your application and
what you want to measure.
Warning: To avoid electric shock, you must ensure that power is removed from the DUT before attaching
probes to it. Do not touch exposed conductors except with the properly rated probe tips. Refer to the probe manual
for proper use. Refer to the
General Safety Summary in your oscilloscope manual.
Probe Information
Table 2-2: Probe Information
When you are deciding what oscilloscope and probe combination to use, the system bandwidth should be
greater than 1.5 times the bit rate. This provides adequate bandwidth for most of the measurements because most
of the energy in high-speed serial data signals is contained in the 1
time measurements, 2.5 times the bit rate (5th harmonic) is required.
®
RT-Eye
Serial Compliance and Analysis Application
st
and 3rd harmonic. To ensure accurate Rise
5
Page 33

Getting Started
Power Spectrum of a 2.5 Gb/sec Signal Example
Note: The 1st and 3rd harmonics are the two highest peaks.
Figure 2-1: Power Spectrum of a 2.5 Gb/sec signal
Two TCA-to-SMA Adaptors, Diagram A
Figure 2-2: Two TCA-to-SMA Adaptors, Diagram A
6 RT-Eye
®
Serial Compliance and Analysis Application
Page 34

One P73XX SMA Differential Probe, Diagram B
Figure 2-3: One P73XX SMA Differential Probe, Diagram B
Getting Started
Two P72XX Single-Ended or P73XX Differential Probes, Diagram C
Figure 2-4: Two P72XX Single-Ended or P73XX Differential Probes, Diagram C
RT-Eye
®
Serial Compliance and Analysis Application
7
Page 35

Getting Started
One P73XX Differential Probe, Diagram D
Figure 2-5: One P73XX Differential Probe, Diagram D
Deskewing Probes and Channels
When using two channels to perform pseudo-differential measurements, it is
important to deskew the probes. Be sure to use the proper deskew fixture and
procedure as described in the online help of your oscilloscope.
Note: The RT-Eye application relies on upsampled, deskewed data from the
oscilloscope to conduct math operations for differential and common mode
waveform measurements. Upsampling prior to deskew is required to ensure
accurate measurements.
Oscilloscope firmware V 2.4.0 and above implements sub-sampled deskew and is
required if you use the RT-Eye application for Single-Ended measurements.
8 RT-Eye
®
Serial Compliance and Analysis Application
Page 36

Operating Basics
About Basic Operations
The topics in the Operating Basics book cover the following definitions and
tasks:
Application user interface
Basic oscilloscope functions
Saving and recalling
Setting up the application
Using a Limits file
Using User Masks
Taking measurements
Saving the measurement results
Viewing the measurement results as plots
Using the plot window zoom and cursors
Saving plots
Logging the worst case waveforms
Creating and generating a custom compliance report
®
RT-Eye
Serial Compliance and Analysis Application
9
Page 37

Operating Basics
Starting the Application
On the oscilloscope menu bar, select File> Run Application> RT-Eye Serial
Compliance and Analysis. View
oscilloscopes, select App> RT-Eye Serial Compliance and Analysis from the
menu bar to run the application.
The application starts and displays the Measurements> Select menu.
After the application initializes, the Welcome dialog box, if enabled, will appear.
If it is disabled, you can use File> Preferences to configure it to appear the next
time the application is launched.
how to start the application. For B and C series
Figure 3-1: RT-Eye Welcome dialog box
You can perform the following functions in this dialog box as shown in the table:
Table 3-1:RT-Eye Welcome dialog box options
Click To
Run MyTest Recall the previously saved MyTest setup and automatically
start the sequencer. See also: Running MyTest.
Run Wizard Launch the RT-Eye Wizard. The application takes the
measurements and displays the results in the result
summary window. See also: About Serial dat a W izard.
Cancel Close the RT-Eye Welcome dialog box and work directly
with the application.
Show this dialog
at startup
Enable or disable display of the RT-Eye Welcome dialog the
next time when you launch the application .
10 RT-Eye
®
Serial Compliance and Analysis Application
Page 38

Operating Basics
Oscilloscope Menu Bar and Selected Application
For non-B series oscilloscopes, select File> Run Application> RT-Eye Serial
Compliance and Analysis to start the application.
Figure 3-2:Oscilloscope menu bar and selected application
For B/C series oscilloscopes, select App> RT-Eye Serial Compliance and
Analysis to start the application.
Figure 3-3: B/C series oscilloscope menu bar and selected application
Application Interface
The RT-Eye application uses a Microsoft Windows based interface. Display the
definitions of the application user interface items, or view a menu labeled with
the user interface items.
Note: The oscilloscope application shrinks to half size and appears in the top
half of the screen when the application is running.
RT-Eye
®
Serial Compliance and Analysis Application
11
Page 39

Operating Basics
User Interface Definitions
Table 3-2:User Interface Definitions
Item Description
Area Visual frame that encloses a set of related options.
Box
Browse
Button Use to define an option; not a command button.
Check box Use to select or clear an option.
Command button
Control panel
Keypad
List box Use to define an option from a list.
Menu
Menu bar
Option
Status bar
Tab
Virtual keyboard
Scroll bar
Use to define an option; enter a value with the Keypad or
turn the Multipurpose knob to select a value.
Displays a window where you can look through a list of
directories and files.
Initiates an immediate action, such as the Start command
button in the Control panel.
Located to the right of the application; contains command
buttons that you use often, such as to Start sequencing.
On-screen keypad that you can use to enter numeric
values.
All options in the application window (except the Control
panel) that display when you select a menu bar item.
Located at the top of the application display and contains
application menus.
Any named button (other than a command button) or any
named box that defines a control or task.
Line located at the bottom of the application display that
shows the name of the current menu (location) and the
next step that you might take (action).
Short cut to a menu in the menu bar or a category of
menu options; most tabs are short cuts.
On-screen keyboard that you can use to enter
alphanumeric strings, such as for file names.
Vertical or horizontal bar at the side or bottom of a
display area that you use to move around in that area.
12 RT-Eye
®
Serial Compliance and Analysis Application
Page 40

Operating Basics
Menu With Application User Interface Items
Figure 3-4: Menu with application user interface items
RT-Eye
®
Serial Compliance and Analysis Application
13
Page 41

Operating Basics
Application Menu Bar and Drop-Down Lists
Figure 3-5: Application menu bar and drop-down lists
Using Basic Oscilloscope Functions
You can use oscilloscope controls and functions while running the application.
To do so, select a menu from the oscilloscope Menu bar (or Toolbar) and access
menus, or use the front-panel knobs and buttons. You can also use the
oscilloscope Help menu to access information about the oscilloscope and how to
use it. When you access some oscilloscope controls, the oscilloscope fills the
display.
14 RT-Eye
®
Serial Compliance and Analysis Application
Page 42

Operating Basics
Returning to the Application
Figure 3-6: Returning to the application
For B and C series oscilloscopes, select App> Restore Application to return to
the RT-Eye application.
Hiding the Application
The Hide function minimizes the application and the oscilloscope fills the
display. To hide and return to the application, follow these steps:
1. Select the
command button in the application menu bar.
2. Use the oscilloscope.
Return to the application.
3.
Minimizing and Maximizing the Application
To minimize the RT-Eye application, select File> Minimize in the application
menu bar.
To maximize the application, select
in the task bar.
RT-Eye
Exiting the Application
To exit the RT-Eye application, select File> Exit or the
button in the application menu bar. When you exit the application, you can
choose to keep the oscilloscope setup currently in use with the application or to
restore the oscilloscope setup that was present before you started the application.
If you select the Save MyTest check box, the current setup of both the
oscilloscope and the application will be saved for convenient recall next time.
Refer to
®
Serial Compliance and Analysis Application
MyTest for more information.
(Exit) command
15
Page 43

Operating Basics
Figure 3-7: Exiting the application
Docking the Application
To Dock the RT-Eye application, select File> Dock in the application menu bar.
This positions the application at the default location.
Figure 3-8: Docking the application
Undocking the Application
To Undock the RT-Eye application, select File> Undock in the application menu
bar. After you undock the application, you can click and drag the application tool
bar to position the application anywhere on the screen.
16 RT-Eye
®
Serial Compliance and Analysis Application
Page 44

Operating Basics
Figure 3-9: Undocking the application
Application Directories
During installation, the application sets up directories for various functions, such as to save setup files, and uses
extensions appended to file names to identify the file types.
Table 3-3: Application directories
Default directory names
\modules\SerialAnalysis Serial Analysis appl ic ation home location.
\modules\SerialAnalysis\data Measurement results files.
\modules\SerialAnalysis\limits Limits files for Pass or Fail compliance
\modules\SerialAnalysis\masks Waveform mask files for plots and limits
\modules\SerialAnalysis\setup Setup files.
\modules\SerialAnalysis\waveforms Log worst case wavefor ms and recall
\Masks Mask files for various serial data
\Examples\RemoteCtrl Sample remote control program.
\Examples\WFMS Waveforms for learning.
\images Plot files.
\temp Temporary files.
\ReportGenerator\modules\Serial
Analysis\Reports
* All subdirectories are located in the C:\TekApplications\tdsrt-eye directory.
*
Directory use
tests.
testing.
waveform files.
standards.
Files created by the Report Generat or
utility.
RT-Eye
®
Serial Compliance and Analysis Application
17
Page 45

Operating Basics
Directory Structure for the Serial Analysis Application
Figure 3-10: Directory structure of serial analysis application
18 RT-Eye
®
Serial Compliance and Analysis Application
Page 46

Operating Basics
File Name Extensions
Table 3-4: File name extensions
Extension Description
.bmp File that uses a “bitmap” format.
.csv File that uses a "comma separated variable" format.
.dat File with bin ar y format; stores waveform vectors.
.fig Plot file with binary data.
.gif File that uses a “graphics interchange format”.
.ini RT-Eye application setup file.
.jpg File that uses a “joint photographic experts group” format; also
known as JPEG.
.lim Limits file used with Pass/Fail compliance tests.
.mat MATLAB waveform vector header saved to the hard disk.
.msk Waveform mask file used with plots.
.pdf File that uses a “portable data format”.
.png File that uses a “portable network graphics” format.
.rgt File that defines the report template.
.rpl File that defines the report layout.
.rpt Fi le crea ted by the Repor t Ge nerat or util it y.
.rtf File that uses a “rich text format”.
.set Oscilloscope setup file saved that is recalled with an application
.ini file; both files will have the same name.
.wfm Waveform file; can be recalled into Reference memory.
RT-Eye
®
Serial Compliance and Analysis Application
19
Page 47

Operating Basics
How to Enter Alphanumerical Values
Note: Press the FINE button on the oscilloscope to enter or select the smallest
values or units.
Note: Be sure to select the CLR button before you enter a value using the keypad.
Table 3-5:How to enter alphanumeric values
Method Description
Keypad
Multipurpose
knob*
Keyboard
Edit box*
* When selected twice, the Keypad appears.
When you s elect the keypad icon, the virtual keypad
appears (looks similar to a calculator); use to enter a
value.
When you selec t a knob icon, a line appe ars between the
upper icon and the option box. This activates the upper
multipurpose knob on the front panel of the oscilloscope;
turn the knob to select a value.
When you select the keyboard icon, the virtual keyboard
appears (looks similar to a phy sical keyboard); use it to
enter a file name.
Type in a value from the physic al keyboard and press the
Enter key.
20 RT-Eye
®
Serial Compliance and Analysis Application
Page 48

Operating Basics
Virtual Keypad
Note: Select the
icon, and then use the virtual keypad to enter information,
such as reference voltage levels.
Figure 3-11: Virtual Keypad
RT-Eye
®
Serial Compliance and Analysis Application
21
Page 49

Operating Basics
Virtual Keyboard
Note: Select the
information, such as file names.
Figure 3-12: Virtual Keyboard
Using MyTest
icon, and then use the virtual keyboard to enter
About My Test
The MyTest feature allows you to save a single measurement configuration so
that it can be recalled and run at any time with a single click. This is similar to
the save/recall feature (which allows as many named configurations as you
want), except that MyTest is designed to be easily accessible and runs
automatically when selected.
22 RT-Eye
®
Serial Compliance and Analysis Application
Page 50

Operating Basics
Saving MyTest
To save the current application and oscilloscope settings without closing the RTEye application, select Measurements> Save MyTest.
Figure 3-13: Save Mytest
You can also save your MyTest before exiting the RT-Eye application. When
you select File> Exit from the RT-Eye application, the application prompts you
to save the oscilloscope settings. If you select the Save MyTest check box, the
current setup will be saved as the new MyTest.
Running MyTest
Select Measurements> Run MyTest to run MyTest at any time.
Figure 3-14: Run Mytest
®
RT-Eye
Serial Compliance and Analysis Application
The application takes the measurements from the saved MyTest and displays the
results in the Result summary window. You can also run MyTest directly from
the RT-Eye Welcome dialog. Refer to Starting the Application.
23
Page 51

Operating Basics
Using Serial Data Wizard
About the Serial Data Wizard
The RT-Eye application Setup Wizard guides you through the process of setting
up, running, and displaying the results of a measurement using an intuitive
sequential process. The Wizard can be used for accurate measurements for a
single acquisition, or as a starting point for advanced configurations, or free-run
measurements.
Note: The statistical results for the Setup Wizard and RT-Eye application are
identical if the measurements and setups are the same.
Select Measurements> Wizard to open the Setup Wizard anytime. You can also
open the Setup Wizard during the launch of the RT-Eye application by clicking
Run Wizard in the RT-Eye Welcome dialog. Refer to Starting the Application for
more information.
The Setup Wizard takes you through the steps to configure the following
parameters:
Probe type
Measurement Sources
Standards
Measurement Categories
Autoset Source Levels
Autoset Source Reference Levels
Plots
Note: You can exit the Setup Wizard without affecting any settings in the Serial
Analysis application by clicking Cancel anytime before clicking the Run button.
24 RT-Eye
®
Serial Compliance and Analysis Application
Page 52

Operating Basics
Probe type
In this step, you can select the type of probe. The default probe type is Singleended. In the single-ended probe configuration, you connect two probes or two
SMA cables to the unit under test and the application forms a pseudo-differential
signal by subtracting them. See Probe Diagrams
A and C ". In the differential
probe configuration, you connect a single differential probe, as shown in Probe
Diagrams
B and D.
Note that the currently selected step is always highlighted in the left column of
the Wizard.
Click Next to accept your probe type and proceed to Measurement Sources.
Figure 3-15: Probe Type
®
RT-Eye
Serial Compliance and Analysis Application
25
Page 53

Operating Basics
Measurement Sources
In step 2, you can select the Measurement sources. The available sources depend
on which probe type you have selected in the previous step. The selection in the
previous step is displayed in yellow text as shown in the following figure.
Click Next to proceed to Standards. Click Back if you want to change the probe
type.
Figure 3-16: Measurement sources
26 RT-Eye
®
Serial Compliance and Analysis Application
Page 54

Operating Basics
Standards Selection
In step 3, you select the Serial Analysis standards that guide clock recovery by
establishing the bit rate. The default standard is PCI-E : 2.5 G.
Click Next to proceed to Measurement Categories.
Figure 3-17: Standards
®
RT-Eye
Serial Compliance and Analysis Application
27
Page 55

Operating Basics
Measurement Categories
In step 4, you select the Measurement that will be performed. Various
measurement parameters are grouped under these categories. You need to select
at least one measurement to advance to the next step. For more details, refer to
Selecting a Measurement.
If you select Jitter@BER measurement, you can set the pattern length by
selecting Repeating pattern and then entering the pattern length in the Pat Len
text box. The default value is 2500 unit intervals. If you have a non-repeating
waveform pattern or if the pattern length is unknown, select Arbitrary.
Note: The measurements that you select also determine which plot types will be
available in step 7.
Click Next to proceed to step 5, where you select whether to Autoset the source
scales.
Figure 3-18: Measurement categories
28 RT-Eye
®
Serial Compliance and Analysis Application
Page 56

Operating Basics
Autoset Source Levels
In step 5, you can choose to automatically adjust the horizontal and vertical
scaling before the measurement. This is similar to the Autoset feature of the
oscilloscope. The default of Yes is recommended unless you select a reference
source. If you select No, you will retain the current oscilloscope settings.
Click Next to proceed to Autoset the source reference levels.
Figure 3-19: Autoset source levels
®
RT-Eye
Serial Compliance and Analysis Application
29
Page 57

Operating Basics
Autoset Source Reference Levels
In step 6, you can choose to automatically adjust the reference levels before the
measurement. The reference levels are the voltage thresholds that are compared
to the waveform to determine when timing events occur. The default of Yes is
recommended.
Click Next to proceed to Plot selection.
Figure 3-20: Autoset source reference levels
Plots
In step 7, you can select the plot types that you want to display. Some plot types
may not be available depending on the measurements that you chose in the
Measurement Categories step. The default is to select all plot types. The types of
plots available are:
Eye Diagram—Default and is available for all measurements
Spectrum—if TIE Jitter is selected
Bathtub Curve—if Jitter@BER is selected
Jitter Histogram—if TIE Jitter is selected
30 RT-Eye
®
Serial Compliance and Analysis Application
Page 58

Operating Basics
Figure 3-21: Plots
Click Run to start a single acquisition sequence using the selected settings. The
Plot waveform diagrams are displayed in the chosen order, as shown in the
following figure.
RT-Eye
®
Serial Compliance and Analysis Application
31
Page 59

Operating Basics
Figure 3-22: Plot waveform diagrams
32 RT-Eye
®
Serial Compliance and Analysis Application
Page 60

Operating Basics
File Menus
File Menu Definitions
Table 3-6:File menu definitions
Menu/function Description or function
Recall Default Recalls most default (startup) parameters for the active module.
Recall*
Save*
Recall Recent Select from a list of the four most recently accessed setup files
Preferences Displays the Preferences menu; settings apply until you exit the
Dock Locks the RT-Eye user interface to its default position.
Undock Allows the RT-Eye user interface to be repositioned.
Minimize Minimizes the application.
Exit Exits the application; you can choose to retain the current
*Save or Recall functions also save or recall the associated oscilloscope setup file (.set);
an oscilloscope file is recalled if the application finds a .set file with a matching name.
Browse to select an application setup (.ini) file to recall the setup
file. Recall restores the application to the values saved in the setup.
Save the current application settings in a .ini file.
(saved or recalled) and recall that setup.
application; saved setup files include the settings.
oscilloscope settings or restore the oscilloscope to settings prior to
starting the application.
RT-Eye
®
Serial Compliance and Analysis Application
33
Page 61

Operating Basics
About the File menus
You can use the File menus to save and recall different application setups and
recently accessed files.
Display the definitions of the file menus.
Note: The File> Save function saves application settings in an .ini file and the
settings of the oscilloscope application in a .set file with a matching name.
If an oscilloscope .set file with a matching name is found when you recall an
application setup file, then the oscilloscope settings are also recalled. If the .set
file is missing or cannot be opened by the oscilloscope, then the application
recalls the application settings and displays a message that the Recall of the .set
file failed.
Do not edit a setup file or recall a file not generated by the application.
Saving a Setup File
To save the application and oscilloscope settings to a setup file, follow these
steps:
1. Select File> Save.
2. The Save dialog box appears. To view details about the file, such as size,
type, and modified date, select the Details tool.
3. In the file browser, select the directory in which to save the setup file or use
the current directory.
4. Select or use the keyboard to enter a new file name. The application appends
an ".ini" extension to the name of the application setup file.
5. Select the
command button.
Note: The application also saves the oscilloscope setup to a ".set" file when you
save an application setup. Both the application .ini file and oscilloscope .set file
have the same file name.
34 RT-Eye
®
Serial Compliance and Analysis Application
Page 62

Operating Basics
File: Save Browser
To view details, such as file size, type, and modified date, select the Details tool.
Figure 3-23: Save Browser
RT-Eye
®
Serial Compliance and Analysis Application
35
Page 63

Operating Basics
Recalling a Saved Setup File
To recall the application and oscilloscope settings from saved setup files, follow
these steps:
1. Select File> Recall.
2. The Recall dialog box appears. To view details about the file, such as size,
type, and date modified, select the Details tool.
3. In the Recall dialog box, select the directory from which to recall the setup
file.
4. Select a setup file name, and then select Open.
Note: The application recalls the .ini setup file and the associated oscilloscope
setup if the application can find a .set file with a matching name.
Do not edit setup files. If you try to recall a setup file that has been edited,
the recall operation fails.
If a matching .set file is not found or if the .set file does not recall correctly
to the oscilloscope, then a warning appears that says the oscilloscope recall failed
while the RT-Eye application recall succeeded.
36 RT-Eye
®
Serial Compliance and Analysis Application
Page 64

Operating Basics
File: Recall Browser
To view details, such as file size, type, and modified date, select the Details tool.
Figure 3-24: Recall browser
RT-Eye
®
Serial Compliance and Analysis Application
37
Page 65

Operating Basics
Recalling the Default Setup
To recall the default application settings, select File> Recall Default.
Note: Most of the settings for the active module are recalled to the default state.
Recalling a Recently Saved or Accessed Setup File
To recall a recently saved or accessed setup file, select File> Recall Recent and
then the file from the drop-down list of setup file names.
Note: The application also recalls the associated oscilloscope setup if the
application can find a .set file with a matching name.
Do not edit setup files. If you try to recall a setup file that has been edited,
the recall operation fails.
If a matching .set file is not found or if the .set file does not recall correctly
to the oscilloscope, then a warning appears that says that the RT-Eye application
recall succeeded but the oscilloscope recall failed.
38 RT-Eye
®
Serial Compliance and Analysis Application
Page 66

Operating Basics
Recall Recent Drop-Down List Example
Figure 3-25: Recall recent drop-down list
Defining Preferences
The application includes options that you can set, and these options remain
applied until you change them. The options can help you to operate the
application more efficiently.
The File Preferences menu contains several check box options that you can set
(enable) or clear (disable). Saved setup files include the File> Preferences
settings. View the File Preferences menu.
RT-Eye
®
Serial Compliance and Analysis Application
39
Page 67

Operating Basics
File Preferences Options
Table 3-7: File preferences options
Option Description
Show Welcome dialog at Start
up
Show Autoset Summ ar y when
Autoset is selected
Enable high-performance eye
rendering
Cancel Discards changes and closes.
OK Accepts changes and closes.
Determines whether welcome dialog box is
displayed whenever the application is launched.
Determines whether a summary table of autoset
values is displayed every time autoset is run.
When unchecked, all unit intervals (UI) in the
waveform(s) are included in the rendered eye.
This gives the highest fidelity eye rendering, but
can take considerable amount of time for long
records.
When checked, a statistically representative
subset of the UI is rendered, so that eye diagrams
for long waveforms can be displa yed in a
reasonable time.
The rules for high-performance rendering are as
follows:
1) If the waveform contains 15,000 or fewer UI, all
the UIs in the waveform are rendered.
2) If the waveform includes more than 15,000 UI,
it is subdivided into segments of 2000 UI each.
The entire waveform is scanned to find the UI,
which are the worst-case violators for six different
points around the eye. For each of these worstcase violators, the entire segment of 2000 UI in
which it lies is rendered. Depending on whether
multiple worst-cas e violators lie in the same
segment or not, as few as 2000 UI but typically
from 8000 to 12,000 UI will be rendered in the
final eye.
File: Preferences Menu
Figure 3-26: File preferences menu
40 RT-Eye
®
Serial Compliance and Analysis Application
Page 68

Operating Basics
Setting up the Application
About Setting up the Application for Analysis
You need to set up the RT-Eye application for serial data analysis or for serial
data standard compliance testing. To do so may require that you perform some or
all of the following tasks:
Choose the probe configuration: differential or single-ended
Select all desired measurements
Select the Autoset command button
This automatically sets the range of the vertical scale, sets the horizontal
resolution, and dynamically sets the waveform crossing thresholds based on
signal characteristics.
Configure measurement options manually in the Source, Ref Levels, Smart
Gating, Jitter, Population, and General Config menus.
Select and configure all desired plots (up to four at one time)
After setting up the application, you can select the Start command button to take
measurements. The application displays the results as statistics and as plots if you
set up the Plots menus and enabled the Plots Display option.
Note: You can enable and adjust
or Fail type of compliance test. You can also import industry standard masks and
modify or create your own masks files.
After taking measurements, you can do any of the following tasks:
Measurement Limits checking to create a Pass
View the results as statistics
Save statistics in a .csv file
View the results as a plot
Use the Zoom functions in a plot
Use the Cursors functions in a plot
Save a plot file
RT-Eye
Print a plot
Save the worst case waveforms as .wfm files
Generate a report file
®
Serial Compliance and Analysis Application
41
Page 69

Operating Basics
General Steps to Set Up the Application
Figure 3-27: Steps to set up the application
42 RT-Eye
®
Serial Compliance and Analysis Application
Page 70

Operating Basics
Selecting an Analysis or Compliance Module
The RT-Eye application supports dedicated, technology-specific compliance
modules.
The application accepts Tektronix compliance modules for industry-specified
testing. These modules are available as options and require the RT-Eye software.
If the application does not detect a compliance module, only "Serial Analysis"
appears in the Modules drop-down list. If the application detects other
compliance modules, then multiple selections appear in the list.
The RT-Eye online help only discusses the "Serial Analysis" module operation.
However, the application also includes separate PDF files with Methods of
Implementation (MOI) for the InfiniBand and the PCI Express serial data
standards specific to the corresponding compliance module.
The Control Panel shows which module is active.
Figure 3-28: Modules
Selecting the Analysis Module
View the default Measurements Select menu.
RT-Eye
®
Serial Compliance and Analysis Application
43
Page 71

Operating Basics
Selecting a Compliance Module
Note: The compliance module must be installed and enabled before you can
select it Compliance modules have static configurations and reporting formats
unique to a specific standard. In general, you can use these modules for design
verification and "Plug-Fest" testing.
Figure 3-29: Selecting a compliance module
Choosing the Probe Configuration
Two of the four typical probing configurations discussed in Connecting to a
Device Under Test use two channels to make up the differential serial data signal.
Additional measurements are also available with these probing configurations.
To set the probing configuration (or if you have two reference waveforms), select
Single-Ended as the Probe Type option. If the signal is probed differentially so
that the differential signal is delivered to the oscilloscope on a single channel,
select Differential as the Probe Type option.
44 RT-Eye
®
Serial Compliance and Analysis Application
Page 72

Operating Basics
Probe Type Definitions
Table 3-8: Probe type definitions
Probe type Description
Differential
Single-Ended Displays source selections and measurements suitable for
* The default Probe Type for the RT-Eye serial analysis application.
*
Displays source selections and measurements suitable for
true differential probing (single connection to scope).
pseudo-differential probing (two connections to scope, with
difference operation performed in software).
Selecting a Measurement
You can use the Measurements> Select menu to select measurements for the
application to take. The application takes all selected measurements.
This is the default menu when you start the application. You can also access the
menu by selecting Measurements> Select in the menu bar.
The measurements will vary depending on the type of probe selected as the Probe
Type option.
Use the
of the Sources and the corresponding reference voltage levels. Refer to
button to automatically set the Horizontal and Vertical scales
Autoset
Button in Measurements Select menu.
Use the button as a short cut to the Plots> Select menu.
Use the button as a short cut to the Measurements> Configure
menus.
Use the button as a short cut to turn on all the available
Measurements instead of selecting one measurement at a time.
RT-Eye
®
Serial Compliance and Analysis Application
45
Page 73

Operating Basics
Measurement Definitions
Table 3-9: Measurement definitions
Area Option Description Units
Timing*
Amplitude
* Use the Time Units o ption (Results menu) to convert and d isplay the results as Unit Interval.
** Use the File Preferences menu to restrict measurements to transition bits only.
† Added when Single Ended is the Probe Type option.
Eye Width/
Eye Height
Rise Time
Fall Time**
Unit Interval Cycle durat i on of the recovered clock. s
Bit Rate Inverse of Unit Interval. Gb/s
Differential
Skew†
Differential
Voltage**
High
Amplitude
Low Amplitude
CM Voltage† Statistics of the Common Mode voltage waveform. V
AC CM
Voltage†
De-Emphasis
Jitter @ BER Deterministic and random components of jitter. s Jitter*
TIE Jitter
Eye Width is the measured minimum horizontal eye
opening at the middle reference level as shown in the
eye diagram.
Eye Height is the measured minimum vertical eye
opening at the UI center as shown in the eye
diagram.
**
Time difference between when the Hi reference level
is crossed and the Lo reference level is crossed on
the rising edge of the waveform.
Time difference between when the Hi reference level
is crossed and the Lo reference level is crossed on
the falling edge of the waveform.
Time delay between two single ended waveform
sources.
Statistics for a differential waveform. V
Histogram mode of all differential waveform values
greater than zero.
Histogram mode of all differential waveform values
less than zero.
AC statistics of the Co mmon Mode voltage
waveform.
Ration of any non-transition eye-voltage to its nearest
preceding transition eye voltage.
Measured time difference between a data edge and a
recovered clock edge.
s or V
s
s
s
V
V
V
dB
s
46 RT-Eye
®
Serial Compliance and Analysis Application
Page 74

Operating Basics
Measurements: Select Menu for Differential Probes
Note: This is the default menu that appears when you start the RT-Eye
application.
Figure 3-30: Measurement selections for differential probe
Measurements: Select Menu for Single-Ended Probes
Note: The application adds measurements when Single-Ended is selected as the
Probe Type option: Differential Skew, CM Voltage, and AC CM Voltage.
Figure 3-31: Measurement selections for single-ended probe
®
RT-Eye
Serial Compliance and Analysis Application
47
Page 75

Operating Basics
Autoset Button in the Measurements Select Menu
Select the
button in the Measurements> Select menu to automatically
set the vertical scale, horizontal resolution, and reference voltage levels for all
active sources. Depending on the settings in the File> Preferences menu, either
the autoset operation will occur immediately or the application will display the
Autoset Summary menu and wait for you to choose the next action.
The Autoset Summary menu shows the current source autoset and reference level
autoset values and parameters in a brief outline view. No autoset operation is
performed until you select
the
command button.
Use the button as a short cut to the Measurements> Configure
menus.
Autoset Summary Menu Options
Table 3-10:Autoset summary menu options
Option/function Description
Autoset Performs the Source Autoset and the Ref Lev els Autoset
functions; values update accordingly.
Configure Accesses the Configure Ref Levels menu.
Close Discards changes and closes the menu.
Do not show this
menu again*
* If set, use the File Preferences menu to display the Autoset Summary menu.
Defines whether or not the application displays the Autoset
Summary menu every time you select the Autoset
command button in the Measurements>Select menu.
48 RT-Eye
®
Serial Compliance and Analysis Application
Page 76

Operating Basics
Autoset Summary Menu Example
Figure 3-32: Autoset Summary
RT-Eye
®
Serial Compliance and Analysis Application
49
Page 77
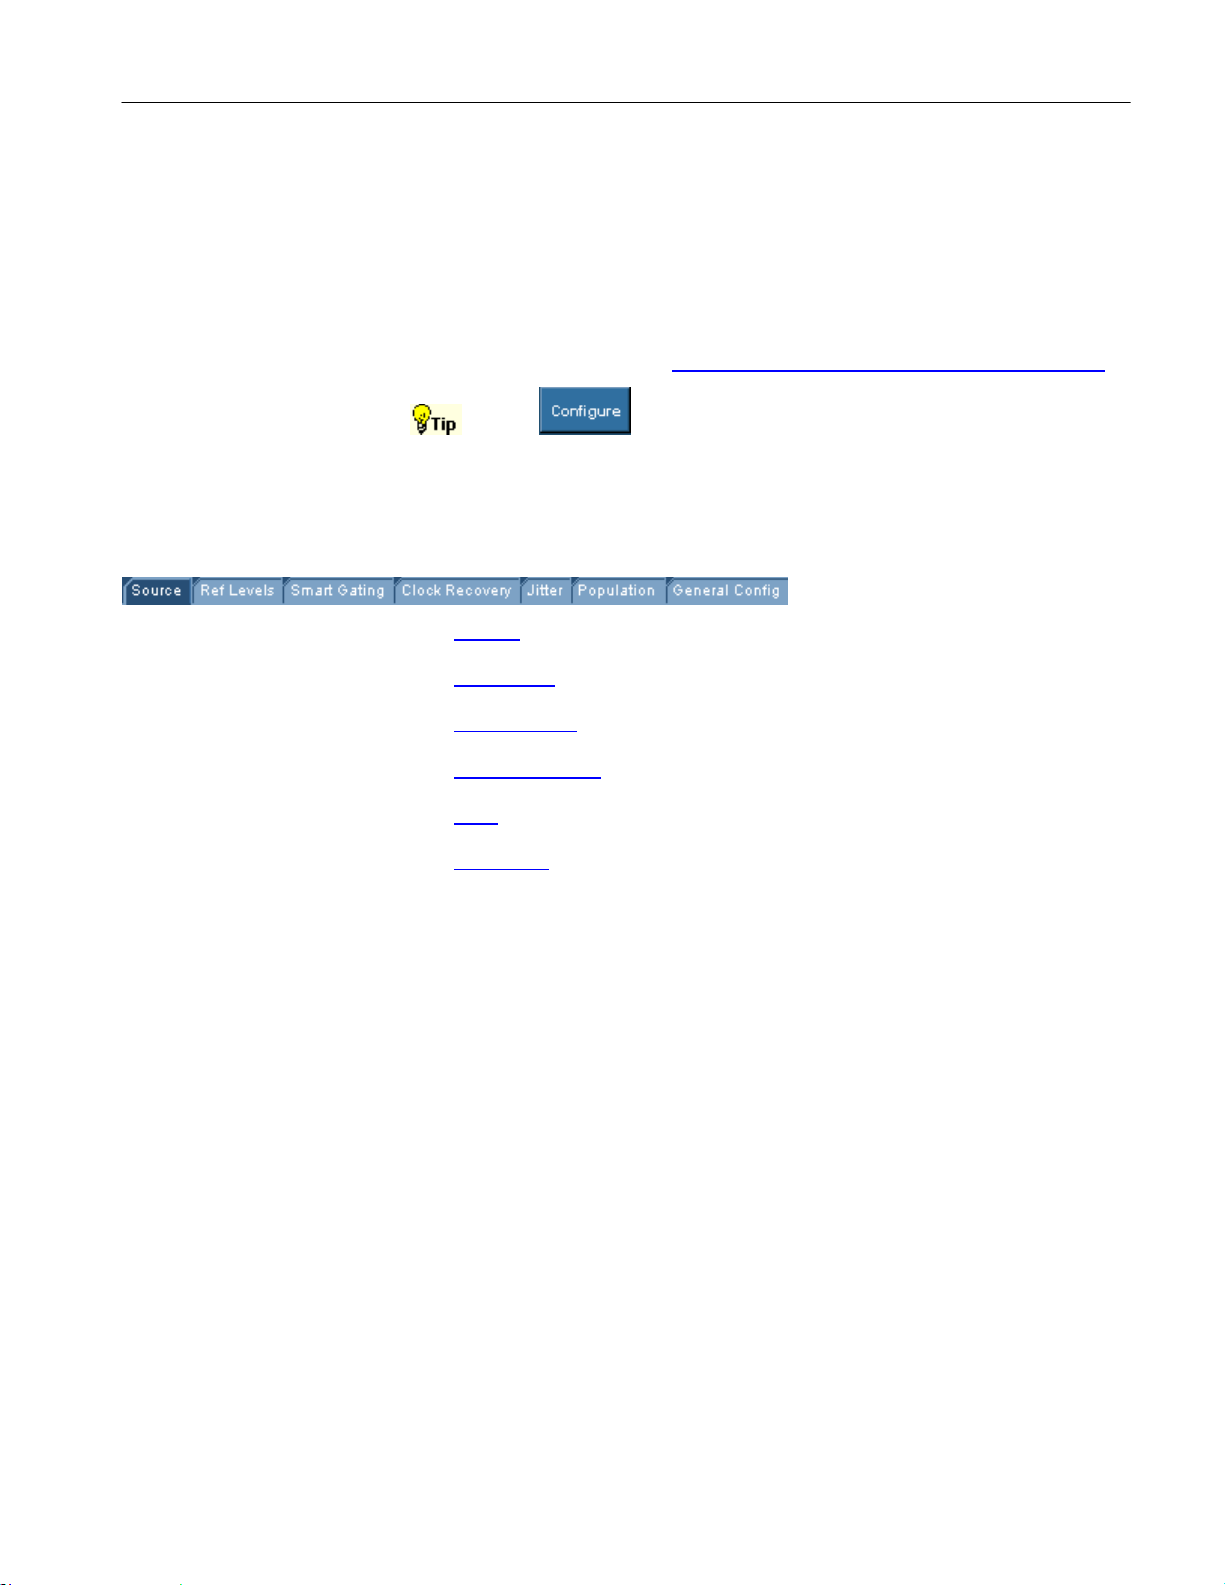
Operating Basics
Configuring a Measurement
About Configuring a Measurement
Measurements may or may not require configuration. A quick way to configure
measurements is to select the
Use the button from the Measurements> Select menu as a short
cut to the Configure menus.
The application includes the following Configure menus:
Source
Autoset button in the Measurements Select menu.
Ref Levels
Smart Gating
Clock Recovery
Jitter
Population
General Config
50 RT-Eye
®
Serial Compliance and Analysis Application
Page 78

Operating Basics
Configure Menu Definitions
Table 3-11: Configure Menu definitions
Menu name Description
Source
Ref Levels
Smart Gating Sets a gated region: Cursor gating, Smart Gating (Custom),
Clock
Recovery
Jitter Defines the analysis method, data pattern, and Bit Error Rate
Population
General
Config
* All sources must have the same Horizontal Sample Rate, Record Length, and
Position to assure that measurements function properly.
** In Free Run mode, sequencing stops when the population limit is met.
*
Specify the source of the measurement as a channel (live) or
reference waveform, or a File; you can use the Autoset
functions (only for live sources) to change the vertical scale
or horizontal resolution of the waveform.
The automatic Vertical Scale function ensures that the entire
waveform occupies the full vertical space available in the
graticule.
The automatic Horizontal Resolution function ensures that
there are enough samples for accurate results.
Set the reference voltage levels for the thresholds of the
rising and the falling edges as an absolute value
The automatic function sets the thresholds relative to the
minimum and maximum levels of the peak-to-peak values;
default percentages are 20% and 80%.
or no gating at all (Off).
Sets clock recovery to an industry standard method: PLL
Standard BW, PLL User BW, Constant Clock Mean, or
Constant Clock Median.
threshold for Jitter@BER measurements. These parameters
are not required for TIE Jitter measurements.
**
Sets the required population for each measurement or
specifies the number of acquisitions.
Sets whether Rise/Fall and Amplitude measurements are
limited to transition bits or performed for all bits. Enables
logging of worst case waveforms obtained during scan mode
in the waveform files directory.
RT-Eye
®
Serial Compliance and Analysis Application
51
Page 79

Operating Basics
Sources
About Configuring the Sources
The application takes measurements from waveforms or files specified as input
sources. You can select an oscilloscope channel input (live), a reference
waveform, or a saved waveform file as the source. The selections available for
Source Type depend on the Probe Type selected in the Measurements> Select
menu.
Use the button as a short cut to the Measurements Select menu.
View the Configure Source menu for Differential probes
View the Configure Source menu for Single-Ended probes
52 RT-Eye
®
Serial Compliance and Analysis Application
Page 80

Operating Basics
Configure Source Menu Options for a Differential Probe
Note: Differential probes do not provide common mode voltage components.
Table 3-12:Configure source menu for a differential probe
Area Option Descri p tion
Source Type
Select
Differential**
Autoset†
* Use the Browser to select a Differential File.
** U ses a differential mode waveform as the source when Differential is the Probe
Type option. You can use a Math waveform, such as for a C H1-CH3 operation, if
you save the resultant waveform, recall the waveform to a ref erence memory
location (Ref1 , Re f2, Ref3, or Re f4), and then use th e Ref wav efor m as a sour ce.
† Only available f or live (channel) waveforms.
Live/Ref Lists channel or reference waveforms
for the Select Differential option.
File* Recalls the input from a single .csv or
.wfm file; enables the Select File area.
Ch1, Ch2, Ch3, Ch4,
Ref1, Ref2, Ref3, Ref4
Vertical Scale Sets the display of the waveform to the
Horizontal Resolution Sets the time base parameters to the
Vertical & Horizontal Sets the ver tical scale and the
Use a channel or reference waveform
from which to take V
measurements.
full screen vertically based on the
amplitude of the source; the PeakPeak of the waveform is 80% of the
ADC full scale.
necessary horizontal resolution and
record length to ensure accurate
results.
horizontal resolution.
DIFF
RT-Eye
®
Serial Compliance and Analysis Application
53
Page 81

Operating Basics
Configure Source Menu for Differential Probes
Figure 3-33: Configure source menu for differential probes
Configure Source from a File for Differential Probes
Figure 3-34: Configure source from a file for differential probes
54 RT-Eye
®
Serial Compliance and Analysis Application
Page 82

Operating Basics
Configure Source Menu Options for Single-Ended Probes
Note: You must use single-ended probes for common mode voltage
measurements.
Table 3-13: Configure source menu options for single-ended probes
Area Option Description
Source Type
Select D+, D- Selections are based on a Live or Ref Source Type option.
Autoset*
Select Files** Browse Recalls single-ended inputs from two .csv or .wfm
* Only available for channel waveforms.
** Use the Browser to select the Differential File(s).
Live Uses one of the following channel combinations
for the D+ and D- waveforms:
CH1, CH3
CH1, CH4
CH2, CH3
CH2, CH4
Re f Uses any combination of reference waveforms for
the D+ and D- waveforms.
File Enables the Select File area.
Vertical
Scale
Horizontal
Re so lution
Vertical &
Horizontal
Sets the display of each waveform to the full
screen vertically based on the amplitude of the
source; the Peak-Peak of the waveform is 80% of
the ADC full scale.
Sets the time base parameters to the necessary
horizontal resolution and record length to ensure
accurate res ults.
Sets the vertical scale and the horizontal
resolution.
files, a D+ and D-.
RT-Eye
®
Serial Compliance and Analysis Application
55
Page 83

Operating Basics
Configure Source Menu for Single-Ended Probes
Figure 3-35:Configure source menu for single-ended probes
Configure Source from Ref Waveform for Single-Ended Probes
Figure 3-36: Configure Source from Ref Waveform for Single-Ended Probes
®
56 RT-Eye
Serial Compliance and Analysis Application
Page 84

Operating Basics
Configure Source from File for Single-Ended Probes
Figure 3-37: Configure source from file for single-ended probes
RT-Eye
®
Serial Compliance and Analysis Application
57
Page 85

Operating Basics
Autosetting Sources for Live (Channel) Waveforms
In most situations when you want to take measurements from a "live" (channel)
waveform, you can usually improve measurement accuracy by using the Autoset
options to optimize the vertical scale or horizontal resolution settings of the
oscilloscope.
To automatically define the vertical and horizontal settings for a source, follow
these steps:
1. Select Measurements> Configure> Source (or the tab).
2. For differential probes, select the
3. For single-ended probes, select the
button.
button.
4. In the Select area, choose the specific channel or channels that you are
using.
5. Select one of the Autoset area command buttons. Refer to the
Configure
Source Menu Options for Single-Ended Probes topic for a description of
each option.
Note: The horizontal autoset in RT-Eye places the instrument in the maximum
sample rate available. If the 20-80% rise time of the signal is faster than 2X the
sample interval, interpolation is recommended to increase accuracy of rise time
and jitter measurements.
58 RT-Eye
®
Serial Compliance and Analysis Application
Page 86

Operating Basics
Reference Voltage Levels
About Reference Voltage Levels
You need to set reference voltage levels so that the application can identify state
transitions on a waveform. Serial data timing measurements are based on state
transition times in waveforms. By definition, edges occur when a waveform
crosses specified reference voltage levels. There are two ways to set the reference
voltage levels: automatically and manually.
High, Mid, and Low Reference Voltage Levels
The application uses three reference voltage levels: High, Mid, and Low.
For most Time Interval and Jitter measurements, the application only uses
the Mid reference voltage level.
The Mid reference level defines when the waveform transition occurs at a given
threshold. For most NRZ AC coupled signals, you would set the Mid reference
level to Zero volts.
The Configure Ref Levels menu includes a "Mid = 0V" option which is set by
default. You can clear the check box to allow the Autoset function to calculate
the proper Mid reference level in the presence of common mode voltages
frequently encountered when using single-ended probes.
For Rise Time and Fall Time measurements, the High and Low reference
voltage levels define when the waveform is fully high or low.
Reference Voltage Levels Diagram
Figure 3-38: Reference voltage levels diagram
RT-Eye
®
Serial Compliance and Analysis Application
59
Page 87

Operating Basics
Rising Versus Falling Thresholds
The option to set separate thresholds for Rising edges vs Falling edges is
available in Ref Level Control panel, though the feature is not currently
implemented. The High, Mid and Low thresholds entered in the Rise column are
actually applied to both rising and falling edges. The values entered in the Fall
column are ignored.
Using the Hysteresis Option
The hysteresis option can prevent small amounts of noise in a waveform from
producing multiple threshold crossings. You can use a hysteresis when the rising
and falling thresholds for a given reference voltage level are set to the same
value.
The reference voltage level ± the hysteresis value defines a voltage range that
must be fully crossed by the waveform for an edge event to occur. If the decision
threshold is crossed more than once before the waveform exits the hysteresis
band, the mean value of the first and last crossing times is used as the edge event
time.
For example, if the waveform rises through the Threshold - Hysteresis, then rises
through the Threshold, then falls through the Threshold, and then rises through
both the Threshold and the Threshold + Hysteresis, a single edge event occurs at
the mean value of the two rising crossings.
Example of Hysteresis on a Noisy Waveform
Figure 3-39: Example of Hysteresis on a noisy waveform
®
60 RT-Eye
Serial Compliance and Analysis Application
Page 88

Operating Basics
Cursor Gating and Reference Voltage Levels Autoset
You can use cursor gating with the reference voltage levels Autoset function. If
you enable and set up Cursors in the Configure Smart Gating menu, the
application uses the data within the gated region to automatically calculate the
reference voltage levels.
Configuring Reference Voltage Level Autoset
The Autoset Run button on the Ref Levels tab sets all reference voltage
thresholds and the hysteresis value to percentages of the base-top voltage
amplitude for the waveform. The Ref Level Autoset Setup menu allows you to
configure the percentages to define each threshold.
RT-Eye
®
Serial Compliance and Analysis Application
61
Page 89

Operating Basics
=
=
Configuring Reference Voltage Autoset Percentages
The default Reference Level Autoset parameters should be appropriate for most
conditions, but you can adjust them for specific situations if you require different
behavior.
To configure the Ref Level Autoset Setup menu options, follow these steps:
1. Select Measurements> Configure> Ref Levels> Autoset Setup.
2. The Ref Level Autoset Setup menu appears.
View the Ref Level Autoset
Setup menu.
3. For each reference voltage level you want to adjust, select the keypad icon
or multipurpose knob icon, and enter the percentage of the base to top span
of the waveform. The settings are based on the following definitions:
TRANHIEYE −−
))((%0 nvmean
TRANLOEYE −−
))((%100 nvmean
4. Select the OK button to update the values and close the Ref Level Autoset
Setup menu.
5. Select the Run command button in the Configure Ref Levels menu.
6. The application calculates the reference voltage levels based on the
percentages set in the Ref Level Autoset Setup menu.
7. If desired, you can manually refine the calculated values in the Configure>
Ref Levels menu to suit your analysis situation.
®
62 RT-Eye
Serial Compliance and Analysis Application
Page 90
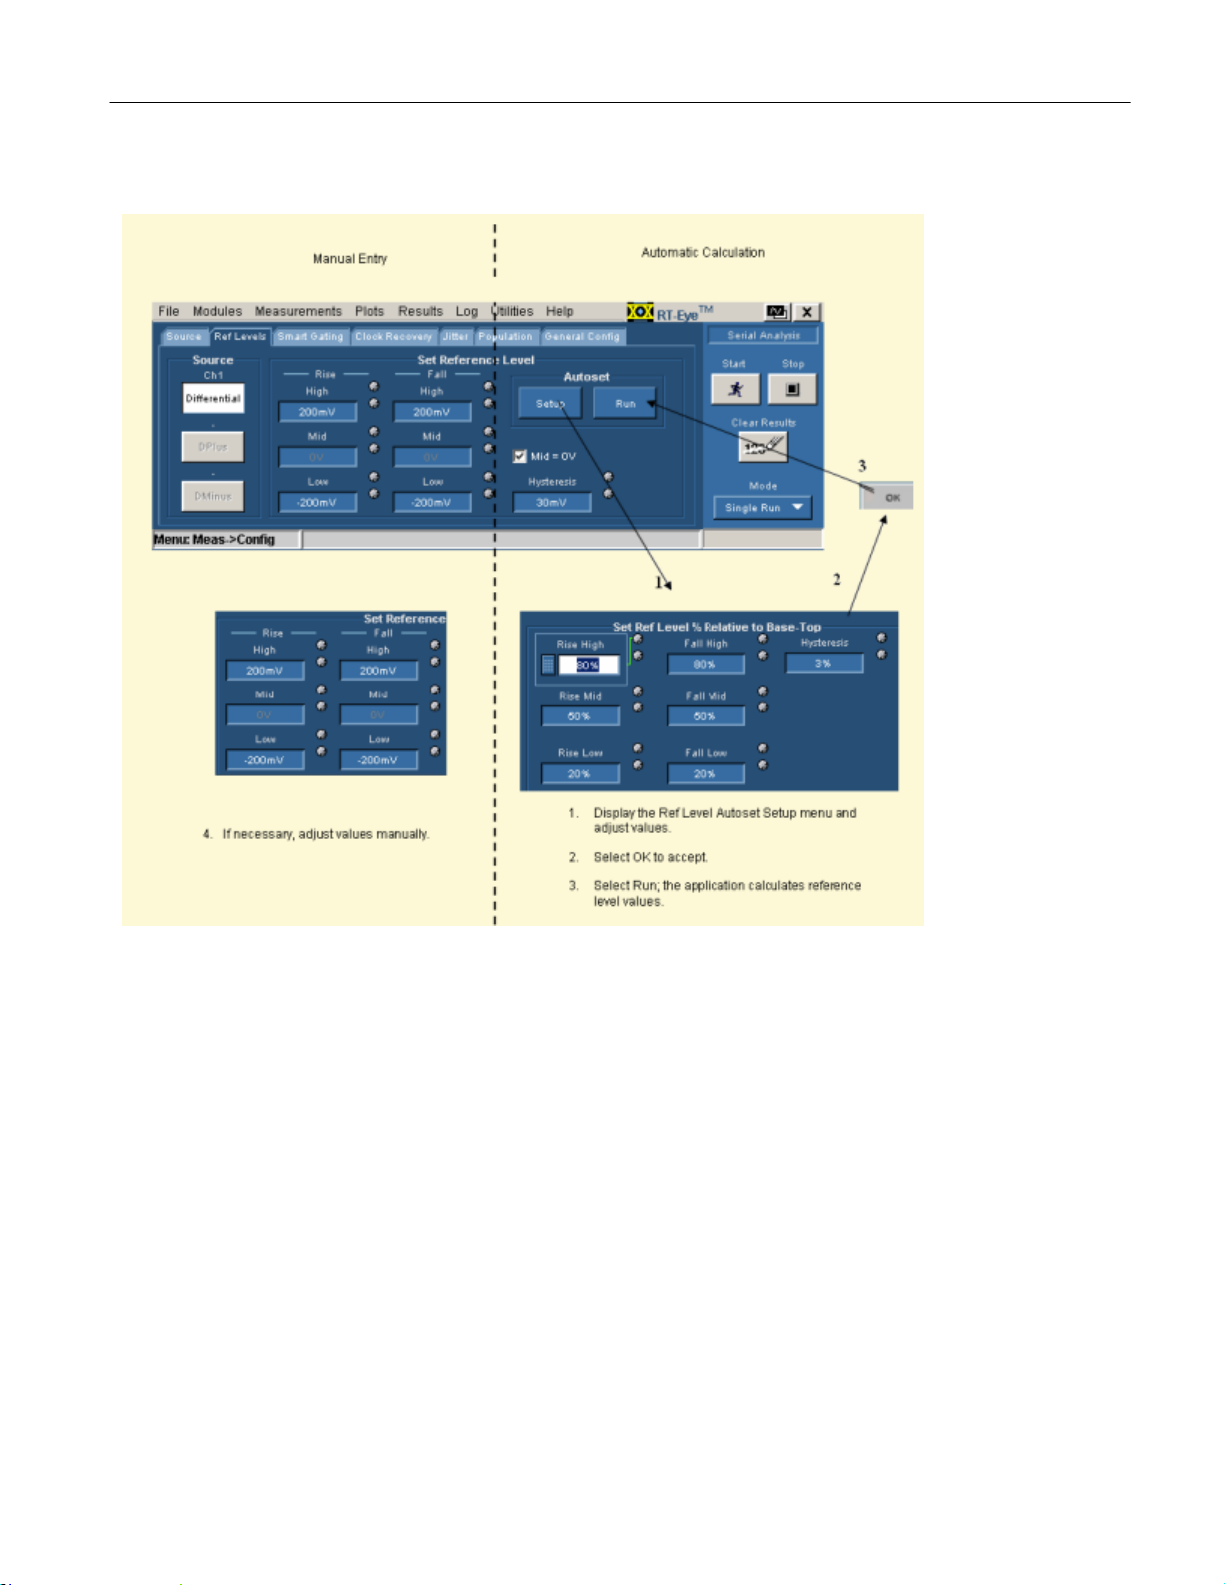
Operating Basics
Steps to Set the Reference Voltage Levels
Figure 3-40: Steps to set reference voltage levels
®
RT-Eye
Serial Compliance and Analysis Application
63
Page 91

Operating Basics
Reference Level Autoset Setup Menu Options
Table 3-14: Reference level autoset setup menu options
Option*
Rise, High Sets the high threshold level for the rising edge of the source.
Rise, Mid Sets the middle threshold level for the rising edge of the source.
Rise, Low Sets the low threshold level for the rising edge of the source.
Fall, High Sets the high threshold level for the falling edge of the source.
Fall, Mid Sets the middle threshold level for the falling edge of the source.
Fall, Low Sets the low threshold level for the falling edge of the source.
Hysteresis
* Default settings are 80% (High), 50% (Mid), 20% (Low), and 3% (Hysteresis)
** Where 0% = mean(v
Description**
Sets the threshold margin to the reference level which the
voltage must cross to be recognized as changing; the margin is
the relative reference level plus or minus half the hysteresis; use
to filter out spurious events.
EYE-HI-TRAN
(n)) and 100% = mean(v
EYE-LO-TRAN
(n)).
Ref Level Autoset Setup Menu
Figure 3-41: Reference level autoset set up menu
Manually Adjusting the Reference Voltage Levels
Whether or not you use the application to automatically calculate the reference
voltage levels, you may need to manually change the values. To set the reference
levels manually, follow these steps:
1. Select Measurements> Configure> Ref Levels> Source and choose a source
(channel or reference waveform) for which you want to set the reference
levels. If the Probe Type is differential, only one choice is available.
2. In the Set Reference Level area, adjust the values of the reference voltage
levels and the hysteresis. View the
64 RT-Eye
Configure Ref Levels menu.
®
Serial Compliance and Analysis Application
Page 92

Operating Basics
Configure Ref Levels Menu Options
Table 3-15: Configure reference levels menu options
Area Option Description
Source
Autoset
Set Reference
Level
Mid = 0V
* Only available when Single Ended is the Probe Type.
** Common mode voltages can be frequently found with single-ended probes.
Clear this option before you use the Reference Level Autoset function.
**
Differential Selects the reference levels for the Differential
waveform or file.
*
DPlus
DMinus*
Setup Displays the Ref Level Autoset Setup menu. Ref Level
Run Automatically calculates and sets the reference
Rise, High Sets the high threshold level, in volts, for both
Rise, Mid Sets the middle threshold level, in volts, for both
Rise, Low Sets the low threshold level, in volts, for the rising
Fall, High
Fall, Mid
Fall, Low
Hysteresis Sets the threshold margin, in volts, relative to the
Set or clear When checked, sets the middle threshold level to
Selects the reference levels for the DPlus
waveform or file.
Selects the reference levels for the DMinus
waveform or file.
levels according the settings in the Ref Level
Autoset Setup menu.
rising and falling edges of the source waveform.
rising and falling edges of the source waveform.
and falling edges of the source waveform.
Reserved for future use.
Reserved for future use.
Reserved for future use.
reference level which the voltage must cross to
be recognized as changing; the margin is the
reference voltage level plus or minus half the
hysteresis; use to filter out s purious ev ents .
0 Volts; when cleared (unchecked), sets the level
to the value calculated by the application.
RT-Eye
®
Serial Compliance and Analysis Application
65
Page 93

Operating Basics
Configure Ref Levels Menu
Note: The Source DPlus and DMinus options are only usable when you select
Single-Ended as the Probe Type option in the Measurements> Select menu.
Figure 3-42: Configure reference levels menu
Gating Measurements
About Gated Measurements
Gating allows you to focus the analysis on a specific area of the waveform bound
by a gated region, which is a way to filter unnecessary information. To access the
Smart Gating menu, select Measurements> Configure> Smart Gating.
You can set up a gated region in one of the following ways:
Vertical Cursors
Smart Gating
The application uses the Smart Gating function when you select Smart Gating as
the Gating option. With Smart Gating, the application establishes a Clock
Recovery Window, part of the waveform on which the selected clock recovery
method is applied. An Analysis Window is the part of the waveform on which
measurements are taken and it is defined relative to the clock recovery window.
If you enable scanning, the clock recovery window (with its contained analysis
window) is scanned across the acquired waveform according to the scanning
parameters. In this case, the results from each scan increment contribute to the
population of measurements.
The population of measurement appears in the results panel and the associated
plots.
66 RT-Eye
®
Serial Compliance and Analysis Application
Page 94

Operating Basics
Configure Smart Gating Menu Options
Table 3-16: Configure smart gating menu options
Area Option Description
Gating
Off No gating occurs ; application takes measurements over
the entire waveform.
Cursors Gates the waveform with Vertical cursors.
Smart
Gating
Enables the Smart Gating function; refer to the Configure
Gating Menu Options for Custom Gating topic.
Configure Smart Gating Menu with Gating Off
Figure 3-43: Configure smart gating menu with gating off
RT-Eye
®
Serial Compliance and Analysis Application
67
Page 95

Operating Basics
Configure Smart Gating Menu with Cursors Gating
Figure 3-44: Configure smart gating menu with cursors gating
®
68 RT-Eye
Serial Compliance and Analysis Application
Page 96

Operating Basics
Configure Smart Gating Menu Options for Smart Gating
Table 3-17:Configure smart gating menu options
Area Option Description
Unit Intervals Gates the waveform by Unit Intervals. Gating Units
Edges Gates the waveform by Edges.
Clock Recovery
Window
Scan Incr Amount by which the Start and Stop values are
#Scans Number of scans, if scanning is enabled and
Scan to End of
Enable Scan Enables scan mode for the measurements.
Analysis
Window
Length Number of Unit Intervals or Edges that defines
the size of the window over which the application
recovers the clock.
Start Specific Unit Interval or Edge within the record
where the application starts to recover the clock.
Stop Reports the Unit Interval or Edge on which the
application will stop the clock recovery.
incremented for each new scan, if scan is
enabled.
scan-to-end is disabled.
Causes scanning to repeat bas ed on sc an
Record
Same as
Clock
Recovery
Window
Alignment
Centered
User Defined
Length Number of Unit Intervals or Edges that defines
Start Specific Unit Interval or Edge where the window
Stop Reports the UI or Edge on which the window will
increment, until the end of the record.
Enables or disables reusing the same settings for
the Analysis Window as for the Clock Recovery
Window option.
Centers the Analysis Window within the Clock
Recovery Window.
Specifies the absolute position of the Analysis
Window within the Clock Recovery Window.
the size of the window.
starts.
stop.
RT-Eye
®
Serial Compliance and Analysis Application
69
Page 97

Operating Basics
Using Smart Gating
The Smart Gating control consists of a Clock Recovery (CR) window and an
Analysis window (Refer to the Smart Gating Diagram). The Clock Recovery and
Analysis window can be set to scan the waveform record. You can configure the
starting point and length of the CR window. The resulting Stop value (end point)
is calculated and displayed. You can also configure the scan increment. The
clock recovery method selected on the Clock Recovery tab will be applied to the
CR window to establish the reference clock edges for this portion of the
waveform.
The Analysis window is defined relative to the CR window using the Length and
Alignment controls. If the Alignment control is set to Custom, the Start control
defines where the Analysis window begins relative to the CR window. As a
convenience, you can select the "Same as Clock Recovery window" check box to
make the two windows coincide.
The following example shows how to apply a CR window of 3500 UI and an
analysis window of 250 UI, centered within the CR window:
In the CR window:
Start: 1, Length: 3.5k.
In the Analysis window:
Alignment: Centered
Length: 250
70 RT-Eye
®
Serial Compliance and Analysis Application
Page 98

Operating Basics
Configure Smart Gating Menu with Clock Recovery Window
Figure 3-45: Configure smart gating menu with clock recovery window
Configure Smart Gating Menu with Analysis Window
Figure 3-46: Configure smart gating menu with analysis window
®
RT-Eye
Serial Compliance and Analysis Application
71
Page 99
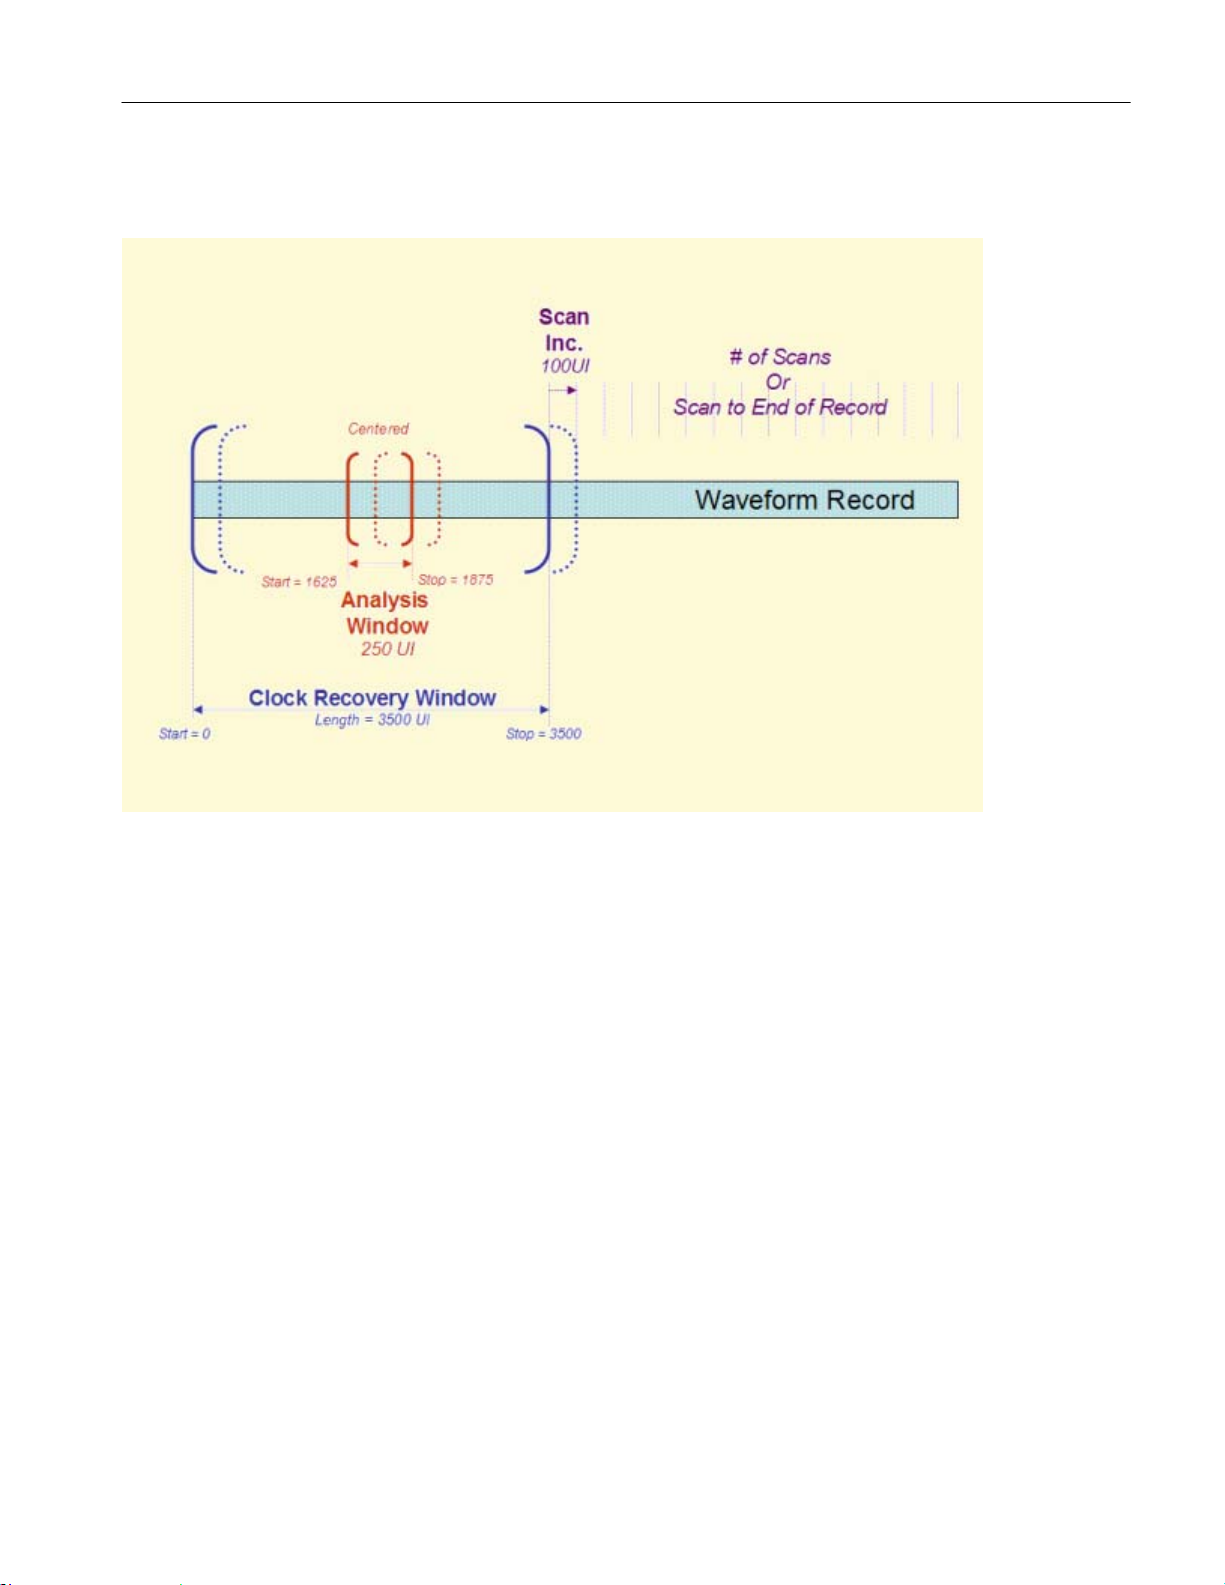
Operating Basics
Smart Gating Diagram
Figure 3-47: Smart gating diagram
Clock Recovery Measurements
Clock Recovery Methods
In serial data standards, jitter measurements are defined in several ways by
working standards groups. To make the Time Interval Error (TIE) measurement,
you need to first set the jitter reference clock (or ideal clock). All jitter
measurements are based on TIE. To comply with industry standards, the RT-Eye
application allows you to select various clock recovery methods, which can be
generally categorized as either Constant-Clock (mean-squared best fit straight
line) or PLL-based.
Whether the clock recovery method is PLL-based or not, you can specify a
nominal bit rate to help the clock recovery process. This is especially helpful, for
example, when the data pattern on the serial link can be interpreted as a different
pattern at a lower rate. A data pattern of 110011001100… at 5.0 Gb/s looks
exactly like a pattern of 101010… at 2.5 Gb/s. The application normally uses 2.5
Gb/s rate but you can also select the 5.0 Gb/s by enabling the Nominal data rate
control and setting the bit rate.
72 RT-Eye
®
Serial Compliance and Analysis Application
Page 100

Operating Basics
About Constant (Straight-Line) Clock Recovery
Constant (straight line) Clock Recovery can be applied to the measurements by
selecting a Constant Clock Mean or Median method in the Clock Recovery tab.
In Constant Clock Recovery, the clock is assumed to be of the form A*sin
(2πft+ø), where the frequency (f) and phase (ø) are treated as unknown constants.
Once a source waveform is acquired and the edges extracted, the clock frequency
is selected using linear regression, so that the recovered clock minimizes the
mean squared sum of the Time Interval Error (TIE) for that waveform.
If Constant Clock: Mean is selected as the clock recovery method, the phase ø is
also chosen to minimize the mean squared error. If Constant Clock: Median is
used, the phase is chosen so that the median error between the recovered and
measured edges is zero.
Figure 3-48:Constant clock recovery diagram
RT-Eye
®
Serial Compliance and Analysis Application
73
 Loading...